Embed Size (px)
Citation preview
© 2
017
Nat
ure
Am
eric
a, In
c., p
art
of
Sp
rin
ger
Nat
ure
. All
rig
hts
res
erve
d.
brief communications
nature methods | ADVANCE ONLINE PUBLICATION | �
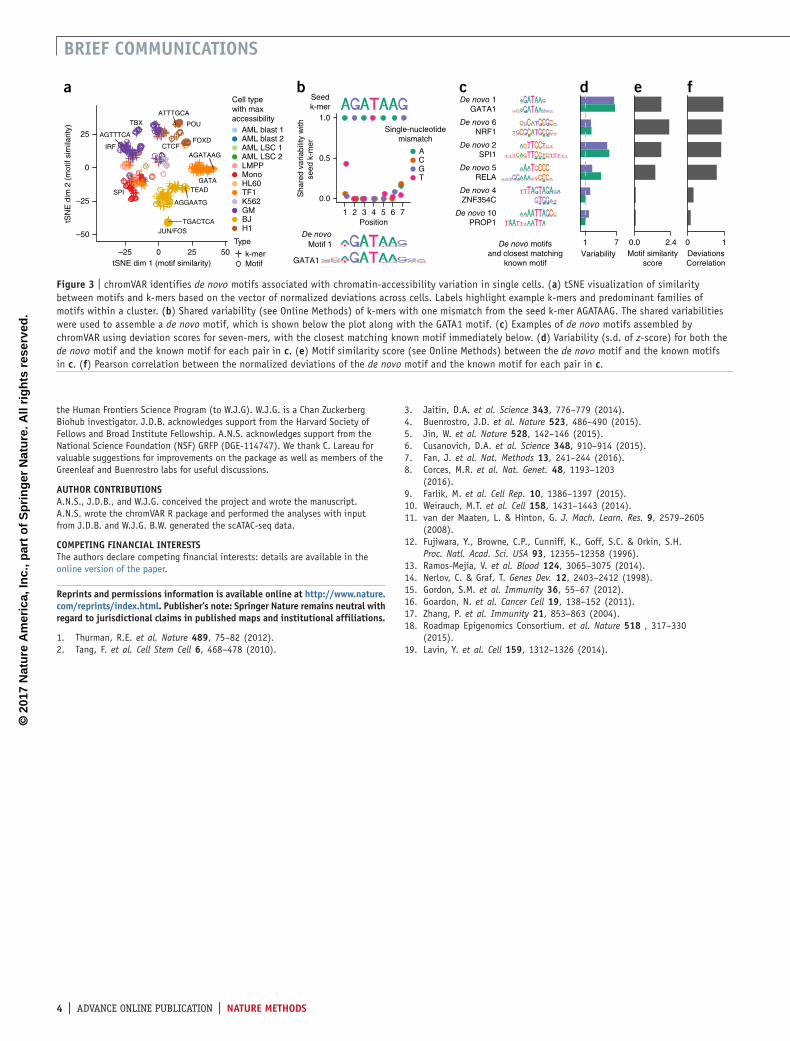
accessibility within sets of genomic features while controlling for known technical biases in epigenomic data (http://www.github.com/GreenleafLab/chromVAR and Supplementary Software). We show that chromVAR can be used to identify transcription factor (TF) motifs that characterize different cell types and vary within populations.
The chromVAR package takes as inputs (i) aligned sequenc-ing reads, (ii) chromatin-accessibility peaks (determined from either aggregate single-cell data or a bulk reference), and (iii) a set of chromatin features representing either motif position weight matrices (PWMs) or genomic annotations (Fig. 1a, Supplementary Fig. 1 and see Online Methods). As an input of chromatin features, we have curated a set of human and mouse PWMs from the cisBP database10. This set represents a diverse and comprehensive collection of known TF motifs. Alternately, user-provided TF motifs or other genomic annotations, such as enhancer modules, ChIP-seq peaks, or GWAS disease annota-tions, may be used. chromVAR can also be applied to a collec-tion of k-mers—short DNA sequences of a specific length k—in order to perform an unbiased analysis of DNA sequence features that correlate with chromatin-accessibility variation across cells or samples.
For each motif and cell, chromVAR first computes a ‘raw acces-sibility deviation’, the difference between the total number of frag-ments that map to peaks containing the motif and the expected number of fragments (based on the average of all cells). This aggregation across peaks yields a motif signal that is considerably less sparse than the signal within individual peaks. However, the aggregation can also amplify technical biases between cells that are caused by PCR amplification or variable Tn5 tagmentation conditions (Supplementary Note 1). These biases can lead to dif-ferences in the number of observed fragment counts between cells based on the GC content or mean accessibility of a given peak set (Supplementary Fig. 2). To account for these technical confound-ers, ‘background’ peak sets are created for each annotation; these sets comprise an equal number of peaks matched for GC content and average accessibility (Supplementary Figs. 2–5). The raw accessibility deviations for background peak sets are used to com-pute a bias-corrected deviation and z-score for each annotation and cell; this provides a differential measure of the gain or loss of accessibility of a given genomic annotation relative to the average cell profile (see Online Methods). This measure can be used for a number of downstream analyses, including de novo clustering of cells and identification of key regulators that vary within and between cell types. The chromVAR package contains a collec-tion of tools for such downstream analysis; these tools include an interactive web application for exploring the relationship
chromVar: inferring transcription-factor-associated accessibility from single-cell epigenomic dataAlicia N Schep1,2, Beijing Wu1,2, Jason D Buenrostro3,4 & William J Greenleaf1,2,5,6
single-cell atac-seq (scatac) yields sparse data that make conventional analysis challenging. We developed chromVar (http://www.github.com/GreenleafLab/chromVar), an r package for analyzing sparse chromatin-accessibility data by estimating gain or loss of accessibility within peaks sharing the same motif or annotation while controlling for technical biases. chromVar enables accurate clustering of scatac-seq profiles and characterization of known and de novo sequence motifs associated with variation in chromatin accessibility.
The binding of transcription factors to cis-regulatory DNA sequences controls gene expression programs that define cell phenotype. Chromatin-accessibility assays have enabled the discovery of cis-regulatory elements and trans-acting factors across cell states and cell types1, while single-cell sequencing methods have allowed the deconvolution of dynamic or diverse cellular populations2,3. Recently, it has become possible to probe chromatin accessibility within single cells4–6 and thus to poten-tially identify cis- and trans-regulators that bring about diverse cellular phenotypes.
However, the exceedingly sparse nature of single-cell epige-nomic data presents unique computational challenges. Sparsity is intrinsic to this data, since the signal at any genomic locus is fun-damentally limited by DNA copy number; only 0, 1 or 2 reads can be generated from elements within a diploid genome. Methods developed for single-cell RNA-seq have shown that measuring the dispersion of gene sets, such as Gene Ontology or coexpres-sion modules, rather than individual genes can be a powerful approach for analyzing sparse data7. In this vein, and building on previous work from our group and others4,8,9, we have developed chromVAR, a versatile R package for analyzing sparse chroma-tin-accessibility data by measuring the gain or loss of chromatin
1Department of Genetics, Stanford University School of Medicine, Stanford, California, USA. 2Center for Personal Dynamic Regulomes, Stanford University, Stanford, California, USA. 3Broad Institute of MIT and Harvard, Cambridge, Massachusetts, USA. 4Harvard Society of Fellows, Harvard University, Cambridge, Massachusetts, USA. 5Department of Applied Physics, Stanford University, Stanford, California, USA. 6Chan Zuckerberg Biohub, San Francisco, California, USA. Correspondence should be addressed to J.D.B. ([email protected]) or W.J.G. ([email protected]).Received 21 FebRuaRy; accepted 21 July; published online 21 auGust 2017; doi:10.1038/nmeth.4401
© 2
017
Nat
ure
Am
eric
a, In
c., p
art
of
Sp
rin
ger
Nat
ure
. All
rig
hts
res
erve
d.
� | ADVANCE ONLINE PUBLICATION | nature methods
brief communications
between key TF motifs and cell clusters (Supplementary Fig. 6). We have also incorporated tools for generating previously described analyses characterizing the correlation and potential cooperativity between two TF-binding sites within the same regu-latory element and for computing chromatin variability across regions in cis4.
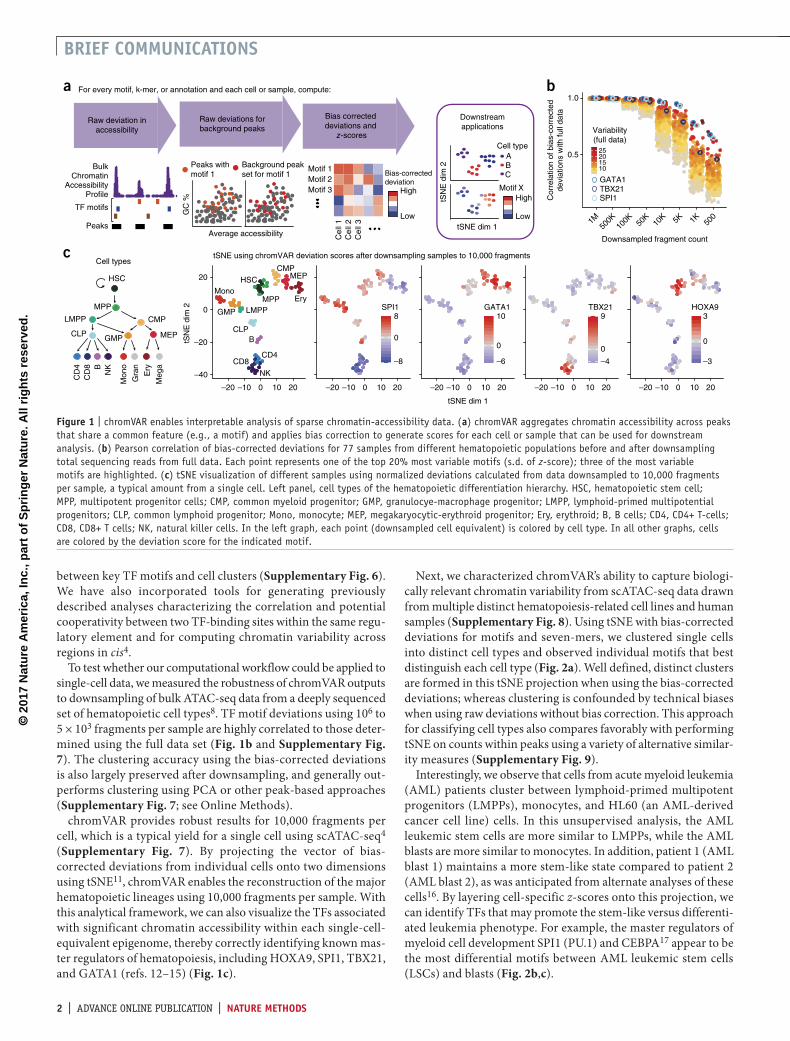
To test whether our computational workflow could be applied to single-cell data, we measured the robustness of chromVAR outputs to downsampling of bulk ATAC-seq data from a deeply sequenced set of hematopoietic cell types8. TF motif deviations using 106 to 5 × 10³ fragments per sample are highly correlated to those deter-mined using the full data set (Fig. 1b and Supplementary Fig. 7). The clustering accuracy using the bias-corrected deviations is also largely preserved after downsampling, and generally out-performs clustering using PCA or other peak-based approaches (Supplementary Fig. 7; see Online Methods).
chromVAR provides robust results for 10,000 fragments per cell, which is a typical yield for a single cell using scATAC-seq4 (Supplementary Fig. 7). By projecting the vector of bias- corrected deviations from individual cells onto two dimensions using tSNE11, chromVAR enables the reconstruction of the major hematopoietic lineages using 10,000 fragments per sample. With this analytical framework, we can also visualize the TFs associated with significant chromatin accessibility within each single-cell-equivalent epigenome, thereby correctly identifying known mas-ter regulators of hematopoiesis, including HOXA9, SPI1, TBX21, and GATA1 (refs. 12–15) (Fig. 1c).
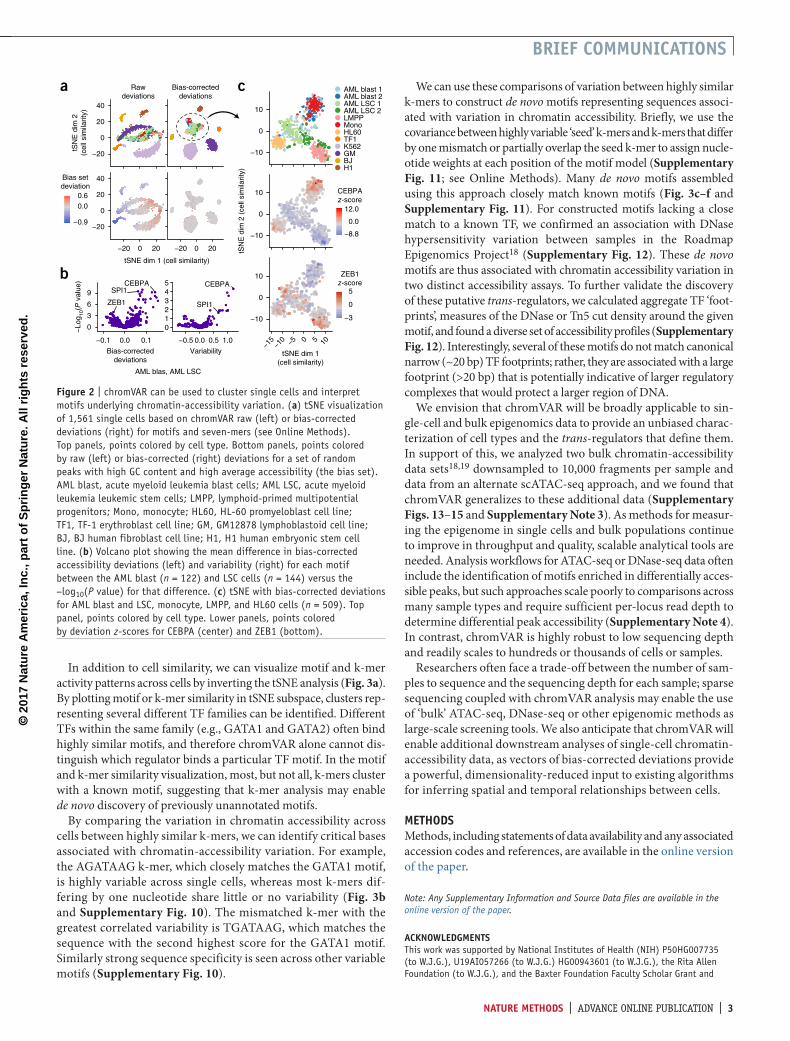
Next, we characterized chromVAR’s ability to capture biologi-cally relevant chromatin variability from scATAC-seq data drawn from multiple distinct hematopoiesis-related cell lines and human samples (Supplementary Fig. 8). Using tSNE with bias-corrected deviations for motifs and seven-mers, we clustered single cells into distinct cell types and observed individual motifs that best distinguish each cell type (Fig. 2a). Well defined, distinct clusters are formed in this tSNE projection when using the bias-corrected deviations; whereas clustering is confounded by technical biases when using raw deviations without bias correction. This approach for classifying cell types also compares favorably with performing tSNE on counts within peaks using a variety of alternative similar-ity measures (Supplementary Fig. 9).
Interestingly, we observe that cells from acute myeloid leukemia (AML) patients cluster between lymphoid-primed multipotent progenitors (LMPPs), monocytes, and HL60 (an AML-derived cancer cell line) cells. In this unsupervised analysis, the AML leukemic stem cells are more similar to LMPPs, while the AML blasts are more similar to monocytes. In addition, patient 1 (AML blast 1) maintains a more stem-like state compared to patient 2 (AML blast 2), as was anticipated from alternate analyses of these cells16. By layering cell-specific z-scores onto this projection, we can identify TFs that may promote the stem-like versus differenti-ated leukemia phenotype. For example, the master regulators of myeloid cell development SPI1 (PU.1) and CEBPA17 appear to be the most differential motifs between AML leukemic stem cells (LSCs) and blasts (Fig. 2b,c).
Cell types
HSC
MPP
LMPP
CLP GMP
CMP
MEP
CD
4C
D8 B
NK
Mon
o
Gra
n
Ery
Meg
a
c
ba
BulkChromatin
AccessibilityProfile
Peaks
TF motifs
High
Low
Cel
l 1C
ell 2
Cel
l 3
Motif 1Motif 2Motif 3
Bias-correcteddeviation
ABC
tSNE dim 1
tSN
E d
im 2
High
Low
Cell type
Motif X
Average accessibility
GC
%
Peaks with motif 1
Background peak set for motif 1
Raw deviation in accessibility
Raw deviations for background peaks
Bias corrected deviations and
z-scores
Downstreamapplications
GATA1TBX21SPI1
0.5
1.0
1M50
0K10
0K 50K
10K 5K 1K 50
0
Downsampled fragment count
Cor
rela
tion
of b
ias-
corr
ecte
dde
viat
ions
with
full
data
10152025
Variability(full data)
–40
–20
0
20
–20 –10 0 10 20–20 –10 0 10 20–20 –10 0 10 20–20 –10 0 10 20–20 –10 0 10 20
tSNE dim 1
tSN
E d
im 2
–8
0
8SPI1
–6
0
10GATA1
–4
0
9TBX21
–3
0
3HOXA9
tSNE using chromVAR deviation scores after downsampling samples to 10,000 fragments
For every motif, k-mer, or annotation and each cell or sample, compute:
CMPMEP
EryMPP
HSCMono
GMP LMPP
CLPB
CD8CD4
NK
figure � | chromVAR enables interpretable analysis of sparse chromatin-accessibility data. (a) chromVAR aggregates chromatin accessibility across peaks that share a common feature (e.g., a motif) and applies bias correction to generate scores for each cell or sample that can be used for downstream analysis. (b) Pearson correlation of bias-corrected deviations for 77 samples from different hematopoietic populations before and after downsampling total sequencing reads from full data. Each point represents one of the top 20% most variable motifs (s.d. of z-score); three of the most variable motifs are highlighted. (c) tSNE visualization of different samples using normalized deviations calculated from data downsampled to 10,000 fragments per sample, a typical amount from a single cell. Left panel, cell types of the hematopoietic differentiation hierarchy. HSC, hematopoietic stem cell; MPP, multipotent progenitor cells; CMP, common myeloid progenitor; GMP, granulocye-macrophage progenitor; LMPP, lymphoid-primed multipotential progenitors; CLP, common lymphoid progenitor; Mono, monocyte; MEP, megakaryocytic-erythroid progenitor; Ery, erythroid; B, B cells; CD4, CD4+ T-cells; CD8, CD8+ T cells; NK, natural killer cells. In the left graph, each point (downsampled cell equivalent) is colored by cell type. In all other graphs, cells are colored by the deviation score for the indicated motif.
© 2
017
Nat
ure
Am
eric
a, In
c., p
art
of
Sp
rin
ger
Nat
ure
. All
rig
hts
res
erve
d.
nature methods | ADVANCE ONLINE PUBLICATION | �
brief communications
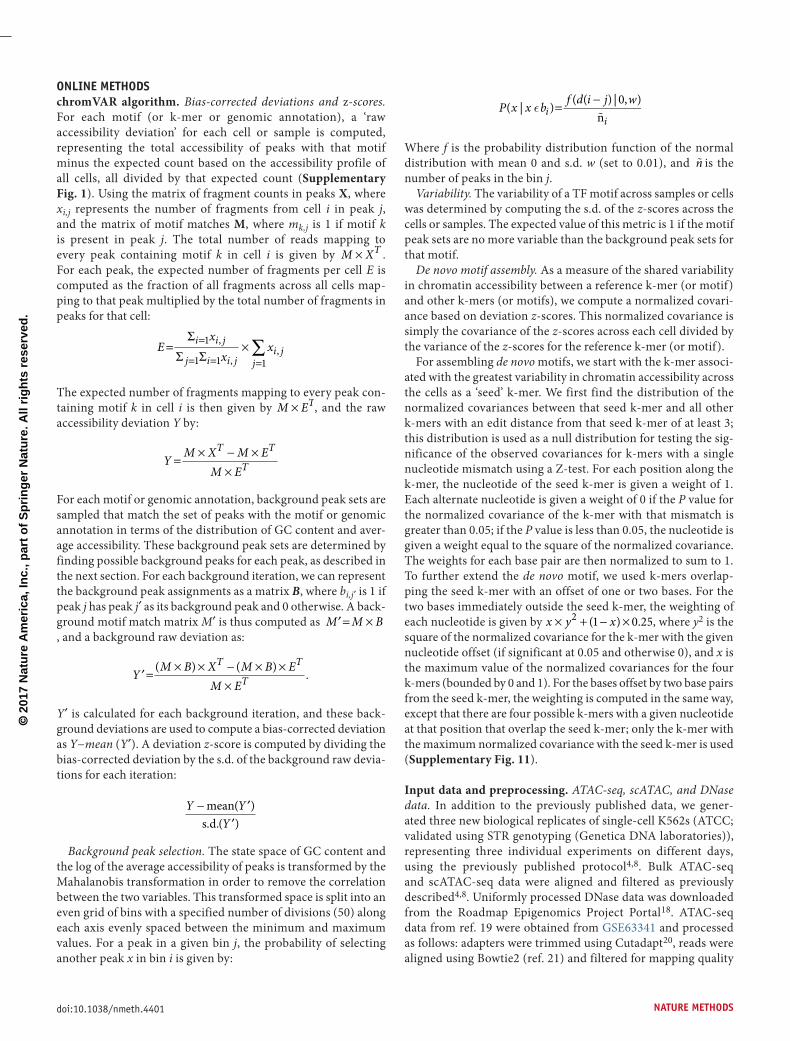
In addition to cell similarity, we can visualize motif and k-mer activity patterns across cells by inverting the tSNE analysis (Fig. 3a). By plotting motif or k-mer similarity in tSNE subspace, clusters rep-resenting several different TF families can be identified. Different TFs within the same family (e.g., GATA1 and GATA2) often bind highly similar motifs, and therefore chromVAR alone cannot dis-tinguish which regulator binds a particular TF motif. In the motif and k-mer similarity visualization, most, but not all, k-mers cluster with a known motif, suggesting that k-mer analysis may enable de novo discovery of previously unannotated motifs.
By comparing the variation in chromatin accessibility across cells between highly similar k-mers, we can identify critical bases associated with chromatin-accessibility variation. For example, the AGATAAG k-mer, which closely matches the GATA1 motif, is highly variable across single cells, whereas most k-mers dif-fering by one nucleotide share little or no variability (Fig. 3b and Supplementary Fig. 10). The mismatched k-mer with the greatest correlated variability is TGATAAG, which matches the sequence with the second highest score for the GATA1 motif. Similarly strong sequence specificity is seen across other variable motifs (Supplementary Fig. 10).
We can use these comparisons of variation between highly similar k-mers to construct de novo motifs representing sequences associ-ated with variation in chromatin accessibility. Briefly, we use the covariance between highly variable ‘seed’ k-mers and k-mers that differ by one mismatch or partially overlap the seed k-mer to assign nucle-otide weights at each position of the motif model (Supplementary Fig. 11; see Online Methods). Many de novo motifs assembled using this approach closely match known motifs (Fig. 3c–f and Supplementary Fig. 11). For constructed motifs lacking a close match to a known TF, we confirmed an association with DNase hypersensitivity variation between samples in the Roadmap Epigenomics Project18 (Supplementary Fig. 12). These de novo motifs are thus associated with chromatin accessibility variation in two distinct accessibility assays. To further validate the discovery of these putative trans-regulators, we calculated aggregate TF ‘foot-prints’, measures of the DNase or Tn5 cut density around the given motif, and found a diverse set of accessibility profiles (Supplementary Fig. 12). Interestingly, several of these motifs do not match canonical narrow (~20 bp) TF footprints; rather, they are associated with a large footprint (>20 bp) that is potentially indicative of larger regulatory complexes that would protect a larger region of DNA.
We envision that chromVAR will be broadly applicable to sin-gle-cell and bulk epigenomics data to provide an unbiased charac-terization of cell types and the trans-regulators that define them. In support of this, we analyzed two bulk chromatin-accessibility data sets18,19 downsampled to 10,000 fragments per sample and data from an alternate scATAC-seq approach, and we found that chromVAR generalizes to these additional data (Supplementary Figs. 13–15 and Supplementary Note 3). As methods for measur-ing the epigenome in single cells and bulk populations continue to improve in throughput and quality, scalable analytical tools are needed. Analysis workflows for ATAC-seq or DNase-seq data often include the identification of motifs enriched in differentially acces-sible peaks, but such approaches scale poorly to comparisons across many sample types and require sufficient per-locus read depth to determine differential peak accessibility (Supplementary Note 4). In contrast, chromVAR is highly robust to low sequencing depth and readily scales to hundreds or thousands of cells or samples.
Researchers often face a trade-off between the number of sam-ples to sequence and the sequencing depth for each sample; sparse sequencing coupled with chromVAR analysis may enable the use of ‘bulk’ ATAC-seq, DNase-seq or other epigenomic methods as large-scale screening tools. We also anticipate that chromVAR will enable additional downstream analyses of single-cell chromatin-accessibility data, as vectors of bias-corrected deviations provide a powerful, dimensionality-reduced input to existing algorithms for inferring spatial and temporal relationships between cells.
methodsMethods, including statements of data availability and any associated accession codes and references, are available in the online version of the paper.
Note: Any Supplementary Information and Source Data files are available in the online version of the paper.
acknoWLedGmentsThis work was supported by National Institutes of Health (NIH) P50HG007735 (to W.J.G.), U19AI057266 (to W.J.G.) HG00943601 (to W.J.G.), the Rita Allen Foundation (to W.J.G.), and the Baxter Foundation Faculty Scholar Grant and
−20
0
20
40
−20
0
20
40
−20 0 20 −20 0 20
tSNE dim 1 (cell similarity)
tSN
E d
im 2
(cel
l sim
ilarit
y)Raw
deviationsBias-corrected
deviations
−0.9
0.00.6
Bias setdeviation
SPI1CEBPA
ZEB1 SPI1
CEBPA
0
3
6
9
012345
−0.1 0.0 0.1 −0.5 0.0 0.5 1.0
Bias-correcteddeviations
Variability
−Lo
g 10(P
val
ue)
−10
0
10
−10
0
10
−10
0
10
−15
−10 −5 0 5 10
tSNE dim 1(cell similarity)
tSN
E d
im 2
(ce
ll si
mila
rity)
AML blast 1AML blast 2AML LSC 1AML LSC 2LMPPMonoHL60TF1K562GMBJH1
−8.8
0.0
12.0
CEBPAz-score
ZEB1z-score
−3
0
5
AML blas, AML LSC
a
b
c
figure � | chromVAR can be used to cluster single cells and interpret motifs underlying chromatin-accessibility variation. (a) tSNE visualization of 1,561 single cells based on chromVAR raw (left) or bias-corrected deviations (right) for motifs and seven-mers (see Online Methods). Top panels, points colored by cell type. Bottom panels, points colored by raw (left) or bias-corrected (right) deviations for a set of random peaks with high GC content and high average accessibility (the bias set). AML blast, acute myeloid leukemia blast cells; AML LSC, acute myeloid leukemia leukemic stem cells; LMPP, lymphoid-primed multipotential progenitors; Mono, monocyte; HL60, HL-60 promyeloblast cell line; TF1, TF-1 erythroblast cell line; GM, GM12878 lymphoblastoid cell line; BJ, BJ human fibroblast cell line; H1, H1 human embryonic stem cell line. (b) Volcano plot showing the mean difference in bias-corrected accessibility deviations (left) and variability (right) for each motif between the AML blast (n = 122) and LSC cells (n = 144) versus the −log10(P value) for that difference. (c) tSNE with bias-corrected deviations for AML blast and LSC, monocyte, LMPP, and HL60 cells (n = 509). Top panel, points colored by cell type. Lower panels, points colored by deviation z-scores for CEBPA (center) and ZEB1 (bottom).
© 2
017
Nat
ure
Am
eric
a, In
c., p
art
of
Sp
rin
ger
Nat
ure
. All
rig
hts
res
erve
d.
� | ADVANCE ONLINE PUBLICATION | nature methods
brief communications
the Human Frontiers Science Program (to W.J.G). W.J.G. is a Chan Zuckerberg Biohub investigator. J.D.B. acknowledges support from the Harvard Society of Fellows and Broad Institute Fellowship. A.N.S. acknowledges support from the National Science Foundation (NSF) GRFP (DGE-114747). We thank C. Lareau for valuable suggestions for improvements on the package as well as members of the Greenleaf and Buenrostro labs for useful discussions.
author contributionsA.N.S., J.D.B., and W.J.G. conceived the project and wrote the manuscript. A.N.S. wrote the chromVAR R package and performed the analyses with input from J.D.B. and W.J.G. B.W. generated the scATAC-seq data.
comPetinG financiaL interestsThe authors declare competing financial interests: details are available in the online version of the paper.
reprints and permissions information is available online at http://www.nature.com/reprints/index.html. Publisher’s note: springer nature remains neutral with regard to jurisdictional claims in published maps and institutional affiliations.
1. Thurman, R.E. et al. Nature �89, 75–82 (2012).2. Tang, F. et al. Cell Stem Cell 6, 468–478 (2010).
3. Jaitin, D.A. et al. Science ���, 776–779 (2014).4. Buenrostro, J.D. et al. Nature 5��, 486–490 (2015).5. Jin, W. et al. Nature 5�8, 142–146 (2015).6. Cusanovich, D.A. et al. Science ��8, 910–914 (2015).7. Fan, J. et al. Nat. Methods ��, 241–244 (2016).8. Corces, M.R. et al. Nat. Genet. �8, 1193–1203
(2016).9. Farlik, M. et al. Cell Rep. �0, 1386–1397 (2015).10. Weirauch, M.T. et al. Cell �58, 1431–1443 (2014).11. van der Maaten, L. & Hinton, G. J. Mach. Learn. Res. 9, 2579–2605
(2008).12. Fujiwara, Y., Browne, C.P., Cunniff, K., Goff, S.C. & Orkin, S.H.
Proc. Natl. Acad. Sci. USA 9�, 12355–12358 (1996).13. Ramos-Mejía, V. et al. Blood ���, 3065–3075 (2014).14. Nerlov, C. & Graf, T. Genes Dev. ��, 2403–2412 (1998).15. Gordon, S.M. et al. Immunity �6, 55–67 (2012).16. Goardon, N. et al. Cancer Cell �9, 138–152 (2011).17. Zhang, P. et al. Immunity ��, 853–863 (2004).18. Roadmap Epigenomics Consortium. et al. Nature 5�8 , 317–330
(2015).19. Lavin, Y. et al. Cell �59, 1312–1326 (2014).
JUN/FOS
GATA
POU
IRF CTCF
SPI TEAD
FOXD
TBX
TGACTCA
AGATAAG
ATTTGCA
AGTTTCA
AGGAATG
–50
–25
0
25
–25 0 25 50tSNE dim 1 (motif similarity)
tSN
E d
im 2
(m
otif
sim
ilarit
y)
Cell typewith maxaccessibility
AML blast 1AML blast 2AML LSC 1AML LSC 2LMPPMonoHL60TF1K562GMBJH1
Type
k-merMotif
a
GATA1
De novoMotif 1
Seedk-mer
0.0
0.5
1.0
1 2 3 4 5 6 7Position
Sha
red
varia
bilit
y w
ithse
ed k
-mer
ACGT
bDe novo 1
De novo 6
De novo 2
De novo 5
De novo 4
De novo 10
GATA1
NRF1
SPI1
RELA
ZNF354C
PROP1
De novo motifsand closest matching
known motif
c
1 7Variability
d
0.0 2.4Motif similarity
score
e
0 1DeviationsCorrelation
f
Single-nucleotidemismatch
figure � | chromVAR identifies de novo motifs associated with chromatin-accessibility variation in single cells. (a) tSNE visualization of similarity between motifs and k-mers based on the vector of normalized deviations across cells. Labels highlight example k-mers and predominant families of motifs within a cluster. (b) Shared variability (see Online Methods) of k-mers with one mismatch from the seed k-mer AGATAAG. The shared variabilities were used to assemble a de novo motif, which is shown below the plot along with the GATA1 motif. (c) Examples of de novo motifs assembled by chromVAR using deviation scores for seven-mers, with the closest matching known motif immediately below. (d) Variability (s.d. of z-score) for both the de novo motif and the known motif for each pair in c. (e) Motif similarity score (see Online Methods) between the de novo motif and the known motifs in c. (f) Pearson correlation between the normalized deviations of the de novo motif and the known motif for each pair in c.
© 2
017
Nat
ure
Am
eric
a, In
c., p
art
of
Sp
rin
ger
Nat
ure
. All
rig
hts
res
erve
d.
doi:10.1038/nmeth.4401 nature methods
onLine methodschromVAR algorithm. Bias-corrected deviations and z-scores. For each motif (or k-mer or genomic annotation), a ‘raw accessibility deviation’ for each cell or sample is computed, representing the total accessibility of peaks with that motif minus the expected count based on the accessibility profile of all cells, all divided by that expected count (Supplementary Fig. 1). Using the matrix of fragment counts in peaks X, where xi,j represents the number of fragments from cell i in peak j, and the matrix of motif matches M, where mk,j is 1 if motif k is present in peak j. The total number of reads mapping to every peak containing motif k in cell i is given by M XT× . For each peak, the expected number of fragments per cell E is computed as the fraction of all fragments across all cells map-ping to that peak multiplied by the total number of fragments in peaks for that cell:
Ex
xxi i j
j i i ji j
j= ×=
= = =∑
ΣΣ Σ
1
1 1 1
,
,,
The expected number of fragments mapping to every peak con-taining motif k in cell i is then given by M ET× , and the raw accessibility deviation Y by:
YM X M E
M E
T T
T= × − ××
For each motif or genomic annotation, background peak sets are sampled that match the set of peaks with the motif or genomic annotation in terms of the distribution of GC content and aver-age accessibility. These background peak sets are determined by finding possible background peaks for each peak, as described in the next section. For each background iteration, we can represent the background peak assignments as a matrix B, where bi,j′ is 1 if peak j has peak j′ as its background peak and 0 otherwise. A back-ground motif match matrix M′ is thus computed as ′ = ×M M B, and a background raw deviation as:
′ = × × − × ××
YM B X M B E
M E
T T
T( ) ( )
.
Y′ is calculated for each background iteration, and these back-ground deviations are used to compute a bias-corrected deviation as Y−mean (Y′). A deviation z-score is computed by dividing the bias-corrected deviation by the s.d. of the background raw devia-tions for each iteration:
Y YY
− ′′
means.d.
( )( )
Background peak selection. The state space of GC content and the log of the average accessibility of peaks is transformed by the Mahalanobis transformation in order to remove the correlation between the two variables. This transformed space is split into an even grid of bins with a specified number of divisions (50) along each axis evenly spaced between the minimum and maximum values. For a peak in a given bin j, the probability of selecting another peak x in bin i is given by:
P x x bf d i j w
ii
( | )( ( ) | , )
ε = − 0n
Where f is the probability distribution function of the normal distribution with mean 0 and s.d. w (set to 0.01), and n is the number of peaks in the bin j.
Variability. The variability of a TF motif across samples or cells was determined by computing the s.d. of the z-scores across the cells or samples. The expected value of this metric is 1 if the motif peak sets are no more variable than the background peak sets for that motif.
De novo motif assembly. As a measure of the shared variability in chromatin accessibility between a reference k-mer (or motif) and other k-mers (or motifs), we compute a normalized covari-ance based on deviation z-scores. This normalized covariance is simply the covariance of the z-scores across each cell divided by the variance of the z-scores for the reference k-mer (or motif).
For assembling de novo motifs, we start with the k-mer associ-ated with the greatest variability in chromatin accessibility across the cells as a ‘seed’ k-mer. We first find the distribution of the normalized covariances between that seed k-mer and all other k-mers with an edit distance from that seed k-mer of at least 3; this distribution is used as a null distribution for testing the sig-nificance of the observed covariances for k-mers with a single nucleotide mismatch using a Z-test. For each position along the k-mer, the nucleotide of the seed k-mer is given a weight of 1. Each alternate nucleotide is given a weight of 0 if the P value for the normalized covariance of the k-mer with that mismatch is greater than 0.05; if the P value is less than 0.05, the nucleotide is given a weight equal to the square of the normalized covariance. The weights for each base pair are then normalized to sum to 1. To further extend the de novo motif, we used k-mers overlap-ping the seed k-mer with an offset of one or two bases. For the two bases immediately outside the seed k-mer, the weighting of each nucleotide is given by x y x× + − ×2 1 0 25( ) . , where y2 is the square of the normalized covariance for the k-mer with the given nucleotide offset (if significant at 0.05 and otherwise 0), and x is the maximum value of the normalized covariances for the four k-mers (bounded by 0 and 1). For the bases offset by two base pairs from the seed k-mer, the weighting is computed in the same way, except that there are four possible k-mers with a given nucleotide at that position that overlap the seed k-mer; only the k-mer with the maximum normalized covariance with the seed k-mer is used (Supplementary Fig. 11).
Input data and preprocessing. ATAC-seq, scATAC, and DNase data. In addition to the previously published data, we gener-ated three new biological replicates of single-cell K562s (ATCC; validated using STR genotyping (Genetica DNA laboratories)), representing three individual experiments on different days, using the previously published protocol4,8. Bulk ATAC-seq and scATAC-seq data were aligned and filtered as previously described4,8. Uniformly processed DNase data was downloaded from the Roadmap Epigenomics Project Portal18. ATAC-seq data from ref. 19 were obtained from GSE63341 and processed as follows: adapters were trimmed using Cutadapt20, reads were aligned using Bowtie2 (ref. 21) and filtered for mapping quality
© 2
017
Nat
ure
Am
eric
a, In
c., p
art
of
Sp
rin
ger
Nat
ure
. All
rig
hts
res
erve
d.
doi:10.1038/nmeth.4401nature methods
(mapq > 30). For the scATAC-seq data from the GM12878 and HEK293T mixture from the combinatorial indexing approach, a count matrix was obtained from GSM1647122.
Peaks. For the bulk data analysis, we obtained DNase hypersen-sitivity peaks from the Roadmap Epigenomics Project. MACS2 (ref. 22) peaks for blood cells (primary monocytes from periph-eral blood, primary B cells from peripheral blood, primary T cells from peripheral blood, primary natural killer cells from periph-eral blood, primary hematopoietic stem cells G-CSF-mobilized female, primary hematopoietic stem cells G-CSF-mobilized male, and monocytes-CD14+ RO01746 Cell line) were down-loaded from the Epigenomics Roadmap Portal18. For the single-cell ATAC-seq data, peaks were called for each cell line or type using MACS2 applied to the merged single-cell ATAC-seq data. All peaks were resized to a uniform width of 500 bp, centered at the summit. For both the set of peak calls from the blood cells in Roadmap and the set of peak calls from the scATAC-seq data, peaks were combined by removing any peaks overlapping with a peak with greater signal. Peak width was chosen based on typical sizes of ATAC-seq peaks across a wide collection of experiments, although chromVAR is fairly robust to the exact size of the peaks used (Supplementary Fig. 5 and Supplementary Note 2).
Motif collection. From cisBP, we curated position frequency matrices that represented a total of 15,389 human motifs and 14,367 mouse motifs. To filter motifs to a representative subset, we first categorized motifs as high, medium or low quality, as designated in the cisBP database. We then grouped all 870 unique human or 850 unique mouse TF regulators represented in the database and assigned these regulators to their most representa-tive TF motif(s). To do this, we first iterated through each TF regulator to find all motifs associated with that regulator from the high-quality motif list. For these associated high-quality motifs, we first computed a similarity matrix using the Pearson correla-tion of the motifs. To calculate the Pearson correlation between pairwise motifs, the shorter motif was padded with an equal dis-tribution of A,C,G,T. Then the Pearson correlation was calculated at every possible offset, and the maximum correlation of all offset comparisons was recorded. To select a representative subset of motifs for each TF regulator, we first found the motif correlated with the most other motifs at R > 0.9. Treating that motif and all of the correlated motifs (R > 0.9) as a group, we next found the motif with the greatest mean correlation to the other members of the group, and we kept that motif as a representative motif for the TF. Motifs highly correlated with that chosen motif (R > 0.9) were then discarded from further analysis, and the process was iterated until no motifs remained. We repeated the process using the medium- and low-quality databases for TF regulators with no associated motifs in the high-quality database. The final curated motif database contains 1,764 human motifs and 1,346 mouse motifs representing 870 human and 850 mouse regulators. The resulting names are formatted as follows: “ensemble ID”_”unique line number”_”common TF name”_”direct (D) or inferred (I)”_” number of similar motifs grouped”. These position frequency matrices were then converted into position weight matrices (PWMS) by taking the log of the frequency after adding a 0.008 pseudocount and dividing by 0.25.
These PWMs were used for all analyses in main text fig-ures. For Supplementary Figures 2–5 and 13, a smaller set of motifs from the JASPAR CORE database 2016 were used23.
For Supplementary Figure 14, motifs downloaded from http://homer.ucsd.edu/homer/custom.motifs were used24; and for Supplementary Figure 15 motifs downloaded from http://comp-bio.mit.edu/encode-motifs/ were used25 in order to use the same motifs as the original publication for those data sets.
Motif matching. The MOODS26 C++ library (Version 1.9.3) was used for identifying peaks containing a motif match, using a P value cutoff of 5 × 10⁻⁵. As background frequencies we used the nucleotide frequencies across all peaks. We wrapped the MOODS library into an R package, motifmatchr, which enables fast deter-mination of motif presence or positions within genomic regions. The package is available at http://www.github.com/GreenleafLab/motifmatchr and https://bioconductor.org/packages/devel/bioc/html/motifmatchr.html.
Analysis. Downsampling analysis. To downsample a sample with X total fragments to a depth of Y total fragments, we use the fragment count matrix; and for each fragment within a peak we retained each fragment with probability Y/X. Thus the downsampled sam-ples are equivalent to having approximately Y total fragments.
The set of peaks used for the analysis remained the same for each downsampled data set, as the peaks used were from an exter-nal data source (Roadmap Epigenomics Project).
For clustering samples using chromVAR results, highly corre-lated motifs were first removed, and then one minus the Pearson correlation of the bias-corrected deviations was used as the dis-tance matrix for input into hierarchical clustering. For cluster-ing samples using PCA, PCA was performed on the log of the fragment counts for all peaks after normalization for the total number of reads in peaks, and clustering was performed on the Euclidean distance between the first five principal components. Hierarchical clustering was performed with complete linkage, and the resulting dendrogram was cut into 13 groups (the number of cell types). Clustering accuracy was measured using normalized mutual information27.
Differential accessibility and variability. For determining dif-ferentially accessible motifs between AML LSC and blast cells, an unequal variances t-test (two sided) was used on the bias-corrected deviations. For determining differential variability, a Brown–Forsythe test was used on the deviation z-scores.
Sample similarity tSNE. For performing sample similarity tSNE, highly correlated motifs or k-mers as well as motifs or k-mers with variability below a certain threshold (1.5) were first removed from the bias-corrected deviations matrix. The transpose of that matrix was then used as input to the Rtsne package (http://CRAN.R-project.org/package=Rtsne), with a perplexity parameter of 8 used for the downsampled bulk hematopoiesis data and a param-eter of 25 for the single-cell ATAC-seq data.
Motif and k-mer similarity tSNE. For performing motif sim-ilarity tSNE, motifs or k-mers with variability below a certain threshold (1.5) were first removed from the bias corrected devia-tions matrix, which was then used as input to the Rtsne package (http://CRAN.R-project.org/package=Rtsne) with perplexity parameter set to 15.
Motif similarity scores. To score the similarity between a de novo motif and the most similar known motif, we first computed the normalized Euclidean distance between the de novo motif and all the known motifs in our collection using the optimal local alignment with at least five overlapping bases. We then selected the known motif
© 2
017
Nat
ure
Am
eric
a, In
c., p
art
of
Sp
rin
ger
Nat
ure
. All
rig
hts
res
erve
d.
doi:10.1038/nmeth.4401 nature methods
with the lowest distance as the closest match. The similarity score was computed as the negative of the z-score for this distance using the distribution of distances for all the motifs in the collection.
Software availability. The chromVAR R package is freely available under the MIT license at http://www.github.com/GreenleafLab/chromVAR and as Supplementary Software. The motifmatchr R package is freely available under a GPL-3 license is available at http://www.github.com/GreenleafLab/motifmatchr and as Supplementary Software.
Data availability statement. The additional K562 scATAC-seq data have been deposited at GEO with accession number GSE99172. Previously published single-cell ATAC-seq data are available from GSE74310 and GSE65360. Bulk hematopeisis
ATAC-seq data are available at GSE74912. Macrophage bulk ATAC-seq data was obtained from GSE63341, combinatorial scATAC-seq from GSM1647122, and Roadmap Epigenomics data from the Roadmap Epigenomics Portal (http://egg2.wustl.edu/roadmap/web_portal/).
A Life Sciences Reporting Summary is available.
20. Martin, M. EMBnet.journal �7, 10–12 (2011).21. Langmead, B. & Salzberg, S.L. Nat. Methods 9, 357–359 (2012).22. Zhang, Y. et al. Genome Biol. 9, R137 (2008).23. Mathelier, A. et al. Nucleic Acids Res. ��, D110–D115 (2015).24. Heinz, S. et al. Mol. Cell �8, 576–589 (2010).25. Kheradpour, P. & Kellis, M. Nucleic Acids Res. ��, 2976–2987 (2014).26. Korhonen, J., Martinmäki, P., Pizzi, C., Rastas, P. & Ukkonen, E.
Bioinformatics �5, 3181–3182 (2009).27. Danon, L., Díaz-Guilera, A., Duch, J. & Arenas, A. J. Stat. Mech. �005,
P09008 (2005).