Embed Size (px)
Citation preview
W a k e C o u n t y
H u m a n S e r v i c e s
P u b l i c H e a l t h R e p o r t
D e c e m b e r , 2 0 1 5
C h r o n i c D i s e a s e
Regina Petteway, Human Services DirectorRegina Petteway, Human Services Director
Sue Lynn Ledford, Public Health Division DirectorSue Lynn Ledford, Public Health Division Director EditorEditor--in chief: in chief: Edie AlfanoEdie Alfano––Sobsey, Public Health EpidemiologistSobsey, Public Health Epidemiologist
Editorial Staff: Editorial Staff: Ramsay Hoke, Human Services Program Specialist and Ramsay Hoke, Human Services Program Specialist and Carla Piedrahita, Public Health EducatorCarla Piedrahita, Public Health Educator
Design and Layout: Design and Layout: Michelle Ricci, Public Health EducatorMichelle Ricci, Public Health Educator
2
Table of Contents
Introduction 3
1.0 Leading Causes of All Deaths in Wake County 3
2.0 Cancer 4
2.1 Trachea, Bronchus and Lung Cancer 6
2.2 Prostate Cancer 9
2.3 Breast and Cervical Cancer 9
3.0 Diseases of the Heart 11
4.0 Obesity 14
4.1 Youth 15
5.0 Diabetes 18
6.0 Asthma 19
7.0 Physical Activity 21
8.0 References 23
9.0 Acknowledgements 25
Cover photo : Movin’ and Groovin’ program participants enjoy Zumba as part of the walking program (page 21).
3
1.0 Leading Causes of Death in Wake County
Introduction
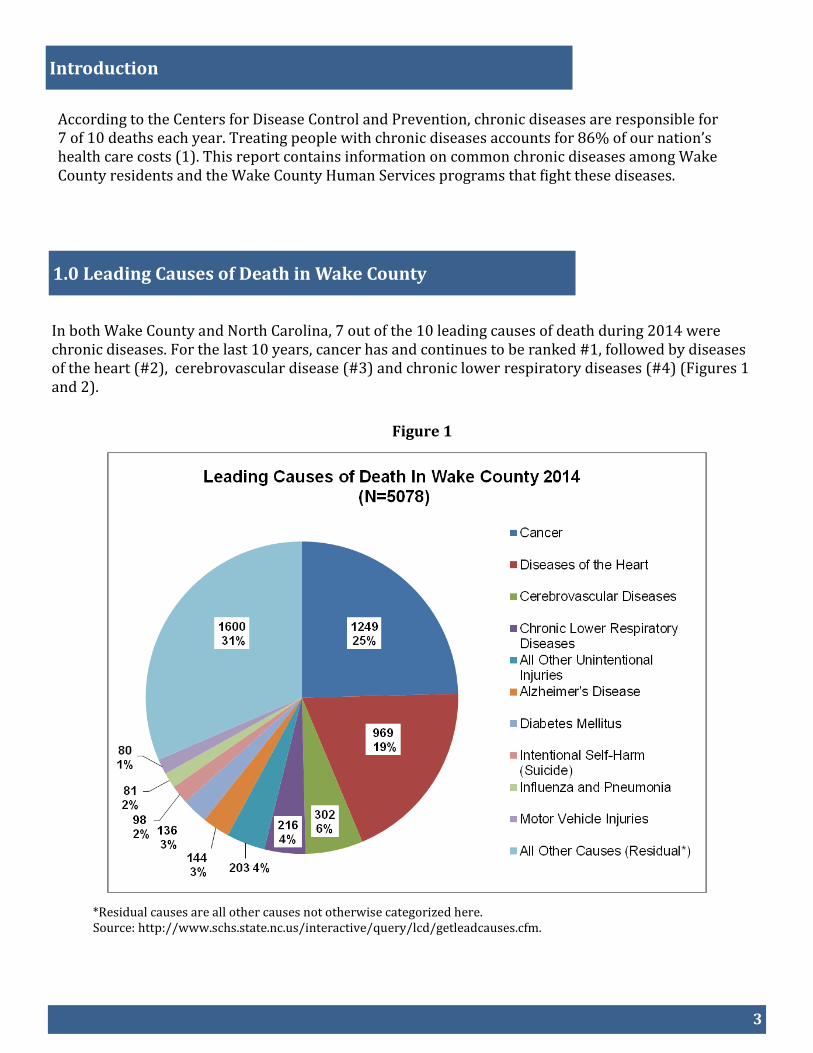
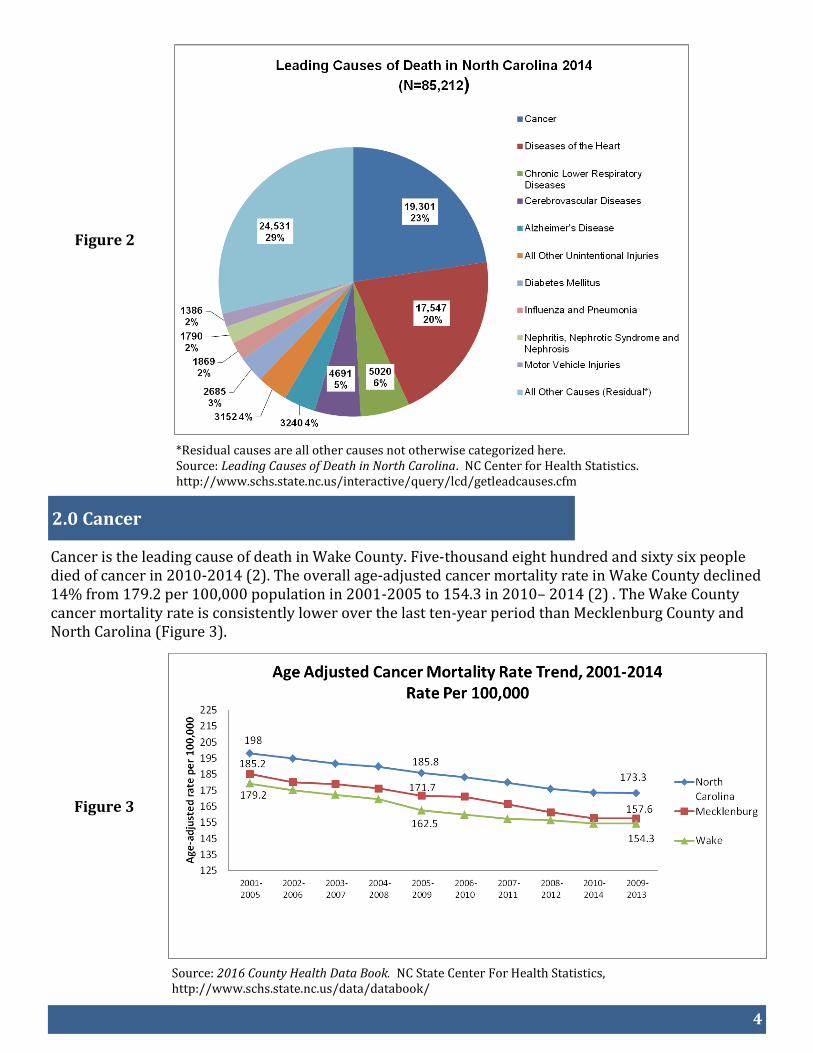
In both Wake County and North Carolina, 7 out of the 10 leading causes of death during 2014 were chronic diseases. For the last 10 years, cancer has and continues to be ranked #1, followed by diseases of the heart (#2), cerebrovascular disease (#3) and chronic lower respiratory diseases (#4) (Figures 1 and 2).
*Residual causes are all other causes not otherwise categorized here. Source: http://www.schs.state.nc.us/interactive/query/lcd/getleadcauses.cfm.
Figure 1
According to the Centers for Disease Control and Prevention, chronic diseases are responsible for 7 of 10 deaths each year. Treating people with chronic diseases accounts for 86% of our nation’s health care costs (1). This report contains information on common chronic diseases among Wake County residents and the Wake County Human Services programs that fight these diseases.
4
Figure 2
*Residual causes are all other causes not otherwise categorized here. Source: Leading Causes of Death in North Carolina. NC Center for Health Statistics. http://www.schs.state.nc.us/interactive/query/lcd/getleadcauses.cfm
2.0 Cancer
Cancer is the leading cause of death in Wake County. Five-thousand eight hundred and sixty six people died of cancer in 2010-2014 (2). The overall age-adjusted cancer mortality rate in Wake County declined 14% from 179.2 per 100,000 population in 2001-2005 to 154.3 in 2010– 2014 (2) . The Wake County cancer mortality rate is consistently lower over the last ten-year period than Mecklenburg County and North Carolina (Figure 3).
Source: 2016 County Health Data Book. NC State Center For Health Statistics, http://www.schs.state.nc.us/data/databook/
Figure 3
5
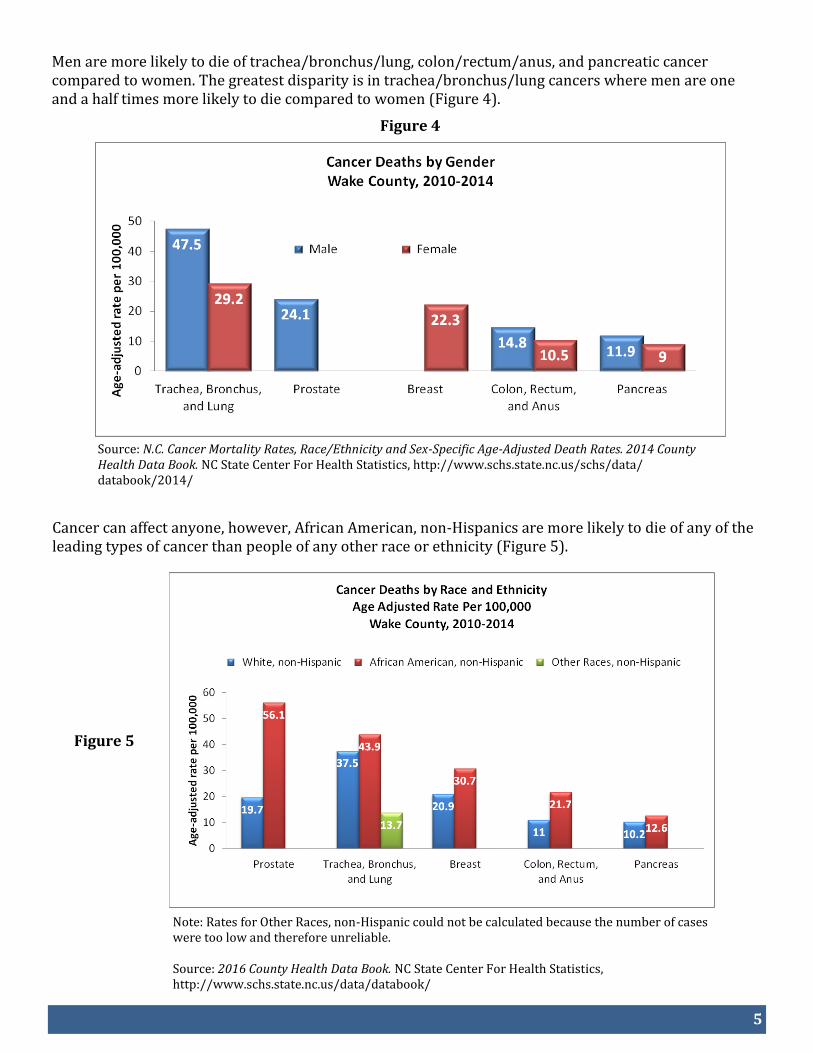
Men are more likely to die of trachea/bronchus/lung, colon/rectum/anus, and pancreatic cancer compared to women. The greatest disparity is in trachea/bronchus/lung cancers where men are one and a half times more likely to die compared to women (Figure 4).
Figure 4
Source: N.C. Cancer Mortality Rates, Race/Ethnicity and Sex-Specific Age-Adjusted Death Rates. 2014 County Health Data Book. NC State Center For Health Statistics, http://www.schs.state.nc.us/schs/data/databook/2014/
Cancer can affect anyone, however, African American, non-Hispanics are more likely to die of any of the leading types of cancer than people of any other race or ethnicity (Figure 5).
Figure 5
Note: Rates for Other Races, non-Hispanic could not be calculated because the number of cases were too low and therefore unreliable. Source: 2016 County Health Data Book. NC State Center For Health Statistics, http://www.schs.state.nc.us/data/databook/
6
Figure 6
Figure 7
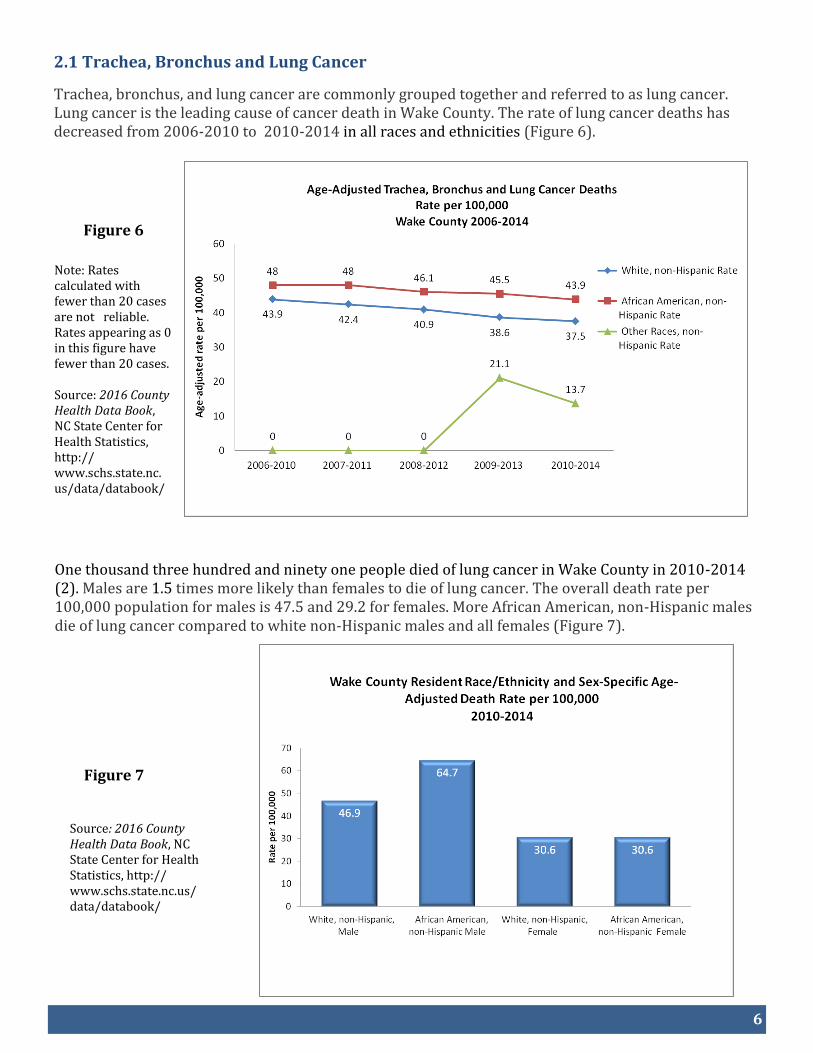
2.1 Trachea, Bronchus and Lung Cancer
Trachea, bronchus, and lung cancer are commonly grouped together and referred to as lung cancer. Lung cancer is the leading cause of cancer death in Wake County. The rate of lung cancer deaths has decreased from 2006-2010 to 2010-2014 in all races and ethnicities (Figure 6).
Note: Rates calculated with fewer than 20 cases are not reliable. Rates appearing as 0 in this figure have fewer than 20 cases. Source: 2016 County Health Data Book, NC State Center for Health Statistics, http://www.schs.state.nc. us/data/databook/
One thousand three hundred and ninety one people died of lung cancer in Wake County in 2010-2014(2). Males are 1.5 times more likely than females to die of lung cancer. The overall death rate per 100,000 population for males is 47.5 and 29.2 for females. More African American, non-Hispanic males die of lung cancer compared to white non-Hispanic males and all females (Figure 7).
Source: 2016 County Health Data Book, NC State Center for Health Statistics, http://www.schs.state.nc.us/data/databook/
7
Smoking contributes to 80% - 90% of lung cancer deaths in men and women (3). Approximately 3,000 lung cancer deaths occur each year among adult non-smokers in the US as a result of exposure to secondhand smoke (4). While smoking rates across the U.S. have dropped to a record low of 16.8% among adults in 2014 (5), the increase in the use of electronic cigarettes is troubling. Electronic cigarettes (e-cigarettes)
E-cigarettes are part of a class of products also referred to as electronic nicotine delivery systems (ENDS), which are battery-powered devices that provide doses of nicotine and other additives to the user in an aerosol. E-cigarettes simulate the experience and sensation of smoking, however, e-cigarettes are not currently being regulated by the FDA and the long term health effects are unknown.
Public Health concerns about e-cigarettes include:
Their appeal to youth (flavorings and use of social media to promote them)
Exposure to unregulated nicotine and other toxic chemicals
Child poisonings from e-liquid containing nicotine
Unknown long term risks
Smoking (Creating the image that smoking is socially acceptable again)
Delay of quitting smoking or dual use of cigarettes and e-cigarettes
According the Centers for Disease Control, from September 2010– February 2014 more than half (51.1 percent) of calls to poison centers in the U.S. about e-cigarettes involved children under age 5, while about 42% of the e-cigarette calls involved people age 20 and older (6). From 2011 through 2014 in NC, 59% of calls to the Carolinas Poison Center were around traditional cigarette poisonings. E-cigarette poisoning caused by the nicotine containing liquid used in these devices can occur in three ways: by ingestion, inhalation or absorption through the skin or eyes while poisoning from conventional cigarettes is generally through ingestion by young children (6).
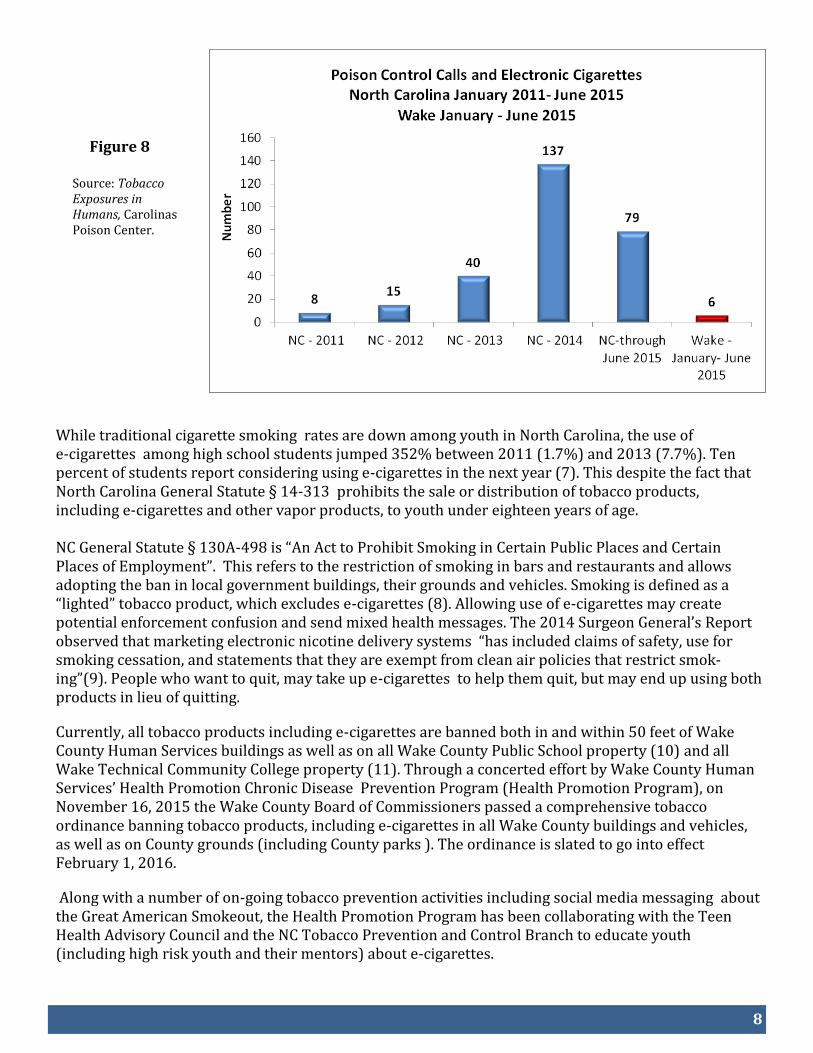
There was a dramatic increase in calls to the Carolinas Poison Control Center for exposures to e-cigarettes containing nicotine or nicotine liquid in NC from 8 calls in 2011 to 137 in 2014. In Wake County, from January 1– June 20, 2015, six of the sixteen tobacco exposures were from e-cigarettes (Figure 8).
8
Figure 8
Source: Tobacco Exposures in Humans, Carolinas Poison Center.
While traditional cigarette smoking rates are down among youth in North Carolina, the use of e-cigarettes among high school students jumped 352% between 2011 (1.7%) and 2013 (7.7%). Ten percent of students report considering using e-cigarettes in the next year (7). This despite the fact that North Carolina General Statute § 14-313 prohibits the sale or distribution of tobacco products, including e-cigarettes and other vapor products, to youth under eighteen years of age. NC General Statute § 130A-498 is “An Act to Prohibit Smoking in Certain Public Places and Certain Places of Employment”. This refers to the restriction of smoking in bars and restaurants and allows adopting the ban in local government buildings, their grounds and vehicles. Smoking is defined as a “lighted” tobacco product, which excludes e-cigarettes (8). Allowing use of e-cigarettes may create potential enforcement confusion and send mixed health messages. The 2014 Surgeon General’s Report observed that marketing electronic nicotine delivery systems “has included claims of safety, use for smoking cessation, and statements that they are exempt from clean air policies that restrict smok-ing”(9). People who want to quit, may take up e-cigarettes to help them quit, but may end up using both products in lieu of quitting.
Currently, all tobacco products including e-cigarettes are banned both in and within 50 feet of Wake County Human Services buildings as well as on all Wake County Public School property (10) and all Wake Technical Community College property (11). Through a concerted effort by Wake County Human Services’ Health Promotion Chronic Disease Prevention Program (Health Promotion Program), on November 16, 2015 the Wake County Board of Commissioners passed a comprehensive tobacco ordinance banning tobacco products, including e-cigarettes in all Wake County buildings and vehicles, as well as on County grounds (including County parks ). The ordinance is slated to go into effect February 1, 2016.
Along with a number of on-going tobacco prevention activities including social media messaging about the Great American Smokeout, the Health Promotion Program has been collaborating with the Teen Health Advisory Council and the NC Tobacco Prevention and Control Branch to educate youth (including high risk youth and their mentors) about e-cigarettes.
9
Figure 9
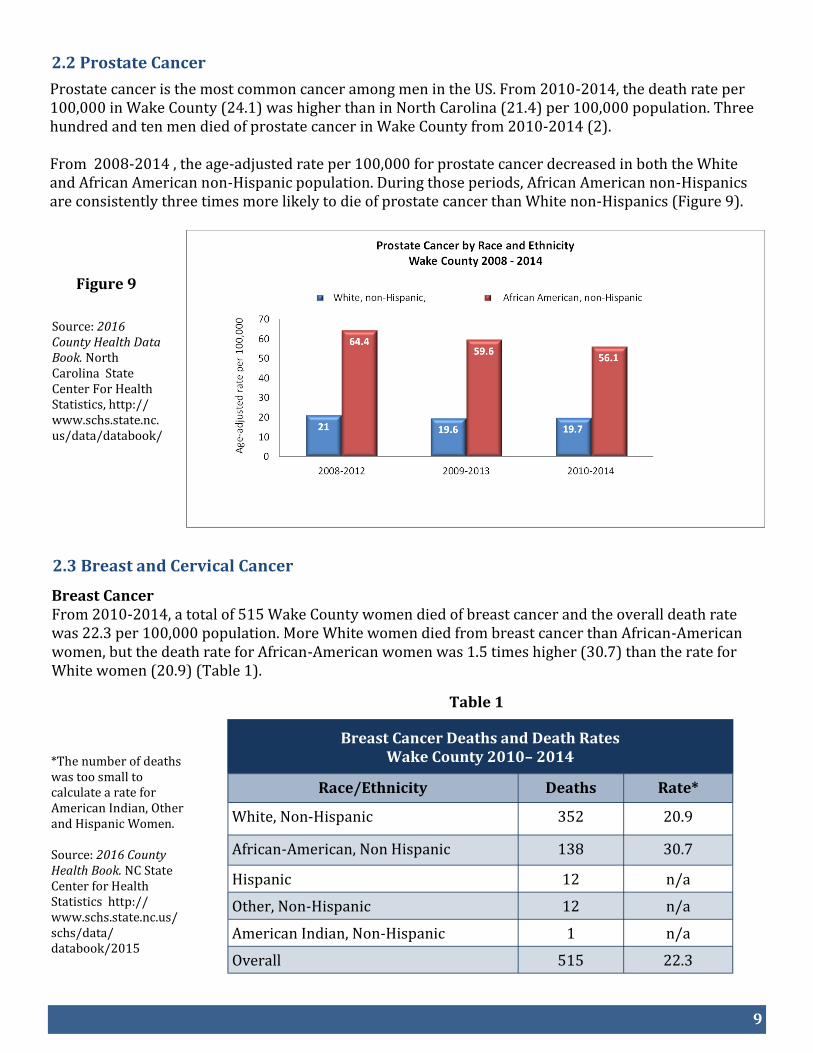
2.2 Prostate Cancer
Prostate cancer is the most common cancer among men in the US. From 2010-2014, the death rate per 100,000 in Wake County (24.1) was higher than in North Carolina (21.4) per 100,000 population. Three hundred and ten men died of prostate cancer in Wake County from 2010-2014 (2). From 2008-2014 , the age-adjusted rate per 100,000 for prostate cancer decreased in both the White and African American non-Hispanic population. During those periods, African American non-Hispanics are consistently three times more likely to die of prostate cancer than White non-Hispanics (Figure 9).
Source: 2016 County Health Data Book. North Carolina State Center For Health Statistics, http://www.schs.state.nc.us/data/databook/
2.3 Breast and Cervical Cancer
Breast Cancer From 2010-2014, a total of 515 Wake County women died of breast cancer and the overall death rate was 22.3 per 100,000 population. More White women died from breast cancer than African-American women, but the death rate for African-American women was 1.5 times higher (30.7) than the rate for White women (20.9) (Table 1).
Table 1
*The number of deaths was too small to calculate a rate for American Indian, Other and Hispanic Women. Source: 2016 County Health Book. NC State Center for Health Statistics http://www.schs.state.nc.us/schs/data/databook/2015
Breast Cancer Deaths and Death Rates Wake County 2010– 2014
Race/Ethnicity Deaths Rate*
White, Non-Hispanic 352 20.9
African-American, Non Hispanic 138 30.7
Hispanic 12 n/a
Other, Non-Hispanic 12 n/a
American Indian, Non-Hispanic 1 n/a
Overall 515 22.3
10
Table 2
From 2009-2013, a total of 46 Wake County women died of cervical cancer, and the overall death rate was 2.0 per 100,000 population. An equal number of White women and African-American women died from cervical cancer, but the death rate for African-American women was quadruple the rate for White women (Table 2).
*The number of deaths was too small to calculate a rate for American Indian, Other and Hispanic women. Source: Central Cancer Registry Special Report 9/30/2015. NC State Center for Health Statistics
Screening for Breast and Cervical Cancer Early detection and treatment of breast cancer through mammography screening can reduce deaths. The Health Promotion Program facilitates breast and cervical cancer screenings through the North Carolina Breast and Cervical Cancer Control Program (BCCCP). NC BCCCP provides free or low-cost breast and cervical cancer screenings and follow-up to eligible women in North Carolina. NC BCCCP provides services to women who are uninsured or underinsured; are between ages 40 - 64 for breast screening services and 21 - 64 for cervical screening services; and have a household income at or below 250% of the federal poverty level. During fiscal year 2014-2015, Health Promotion Program staff provided a total of 316 mammography services (including mammograms, diagnostics and surgical evaluations) through BCCCP and 40 cervical screening services. Four cases of breast cancer and 3 cases of cervical cancer were detected.
Mammogram through the Breast and Cervical Cancer Control Program.
Cervical Cancer Deaths and Death Rates Wake County 2010– 2013
Race/Ethnicity Deaths Rate*
White, Non-Hispanic 21 1.3
African-American, Non Hispanic 21 5.1
Hispanic 3 n/a
Other, Non-Hispanic 1 n/a
American Indian, Non-Hispanic 0 n/a
Overall 46 2.0
11
Pink Ribbon Campaign October 2014 and 2015 During October, Breast Cancer Awareness Month, Health Promotion Program staff sponsored a Pink Ribbon campaign that included a wide variety of breast health awareness activities. In October 2014, employees formed the shape of a pink ribbon which was used for the County website along with a video clip highlighting the month-long awareness campaign. As a result of employee awareness fundraising events, $800 was presented to the Pretty in Pink Foundation in 2014 and $1350 in 2015. The Pretty in Pink Foundation is a North Carolina based, non-profit organization that provides financial assistance for uninsured and underinsured North Carolinians diagnosed with breast cancer. Other awareness initiatives during Breast Cancer Awareness Month included breast health educational trainings and information distributed to community partners, churches and parks.
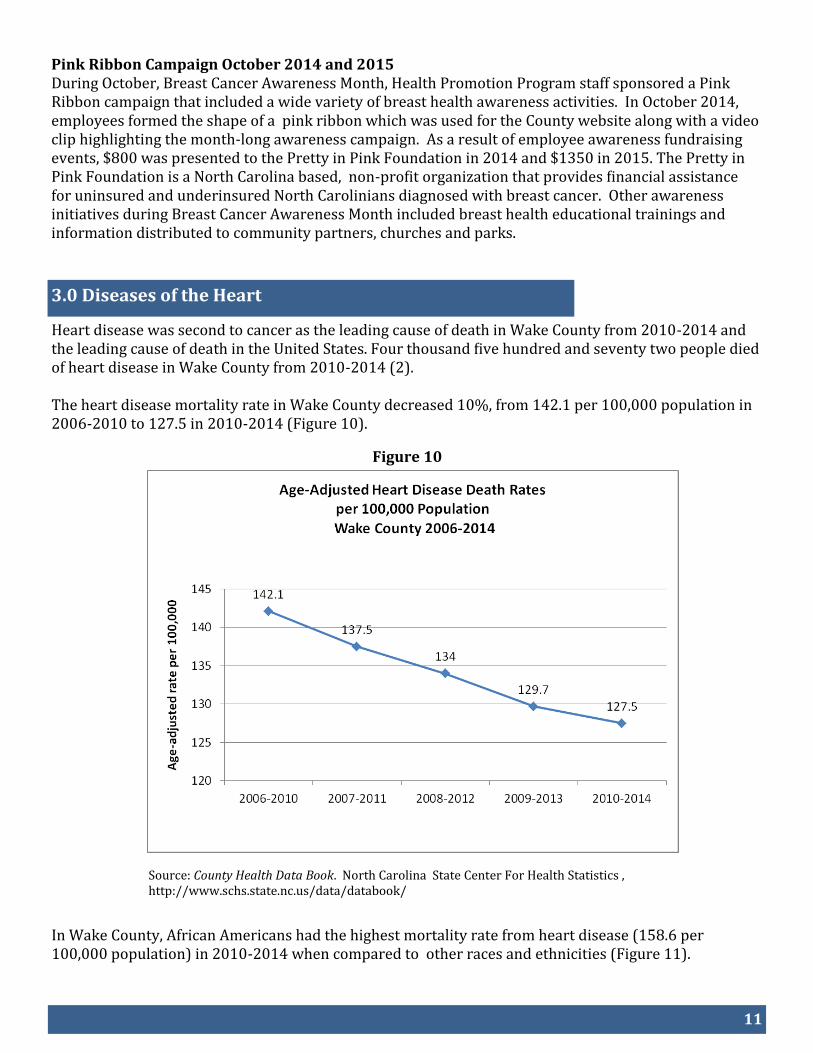
3.0 Diseases of the Heart
Figure 10
Heart disease was second to cancer as the leading cause of death in Wake County from 2010-2014 and the leading cause of death in the United States. Four thousand five hundred and seventy two people died of heart disease in Wake County from 2010-2014 (2). The heart disease mortality rate in Wake County decreased 10%, from 142.1 per 100,000 population in 2006-2010 to 127.5 in 2010-2014 (Figure 10).
Source: County Health Data Book. North Carolina State Center For Health Statistics , http://www.schs.state.nc.us/data/databook/
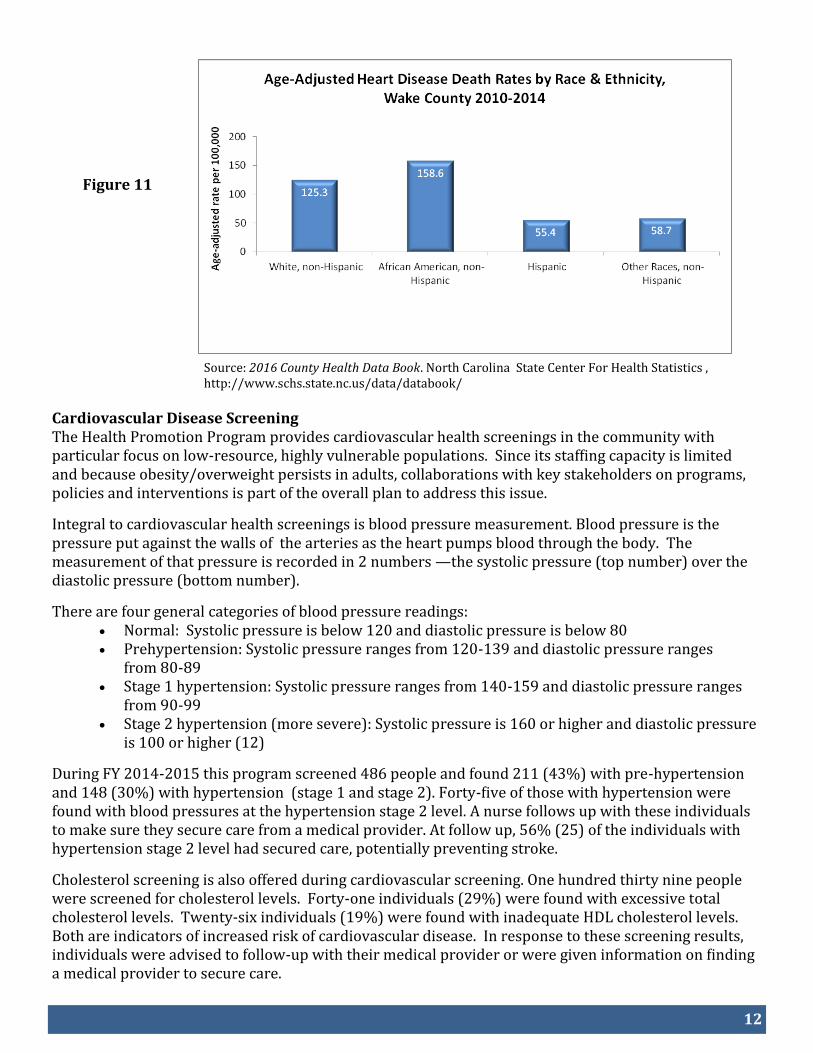
In Wake County, African Americans had the highest mortality rate from heart disease (158.6 per 100,000 population) in 2010-2014 when compared to other races and ethnicities (Figure 11).
12
Figure 11
Source: 2016 County Health Data Book. North Carolina State Center For Health Statistics , http://www.schs.state.nc.us/data/databook/
Cardiovascular Disease Screening The Health Promotion Program provides cardiovascular health screenings in the community with particular focus on low-resource, highly vulnerable populations. Since its staffing capacity is limited and because obesity/overweight persists in adults, collaborations with key stakeholders on programs, policies and interventions is part of the overall plan to address this issue. Integral to cardiovascular health screenings is blood pressure measurement. Blood pressure is the pressure put against the walls of the arteries as the heart pumps blood through the body. The measurement of that pressure is recorded in 2 numbers —the systolic pressure (top number) over the diastolic pressure (bottom number).
There are four general categories of blood pressure readings: Normal: Systolic pressure is below 120 and diastolic pressure is below 80 Prehypertension: Systolic pressure ranges from 120-139 and diastolic pressure ranges
from 80-89 Stage 1 hypertension: Systolic pressure ranges from 140-159 and diastolic pressure ranges
from 90-99 Stage 2 hypertension (more severe): Systolic pressure is 160 or higher and diastolic pressure
is 100 or higher (12)
During FY 2014-2015 this program screened 486 people and found 211 (43%) with pre-hypertension and 148 (30%) with hypertension (stage 1 and stage 2). Forty-five of those with hypertension were found with blood pressures at the hypertension stage 2 level. A nurse follows up with these individuals to make sure they secure care from a medical provider. At follow up, 56% (25) of the individuals with hypertension stage 2 level had secured care, potentially preventing stroke.
Cholesterol screening is also offered during cardiovascular screening. One hundred thirty nine people were screened for cholesterol levels. Forty-one individuals (29%) were found with excessive total cholesterol levels. Twenty-six individuals (19%) were found with inadequate HDL cholesterol levels. Both are indicators of increased risk of cardiovascular disease. In response to these screening results, individuals were advised to follow-up with their medical provider or were given information on finding a medical provider to secure care.
13
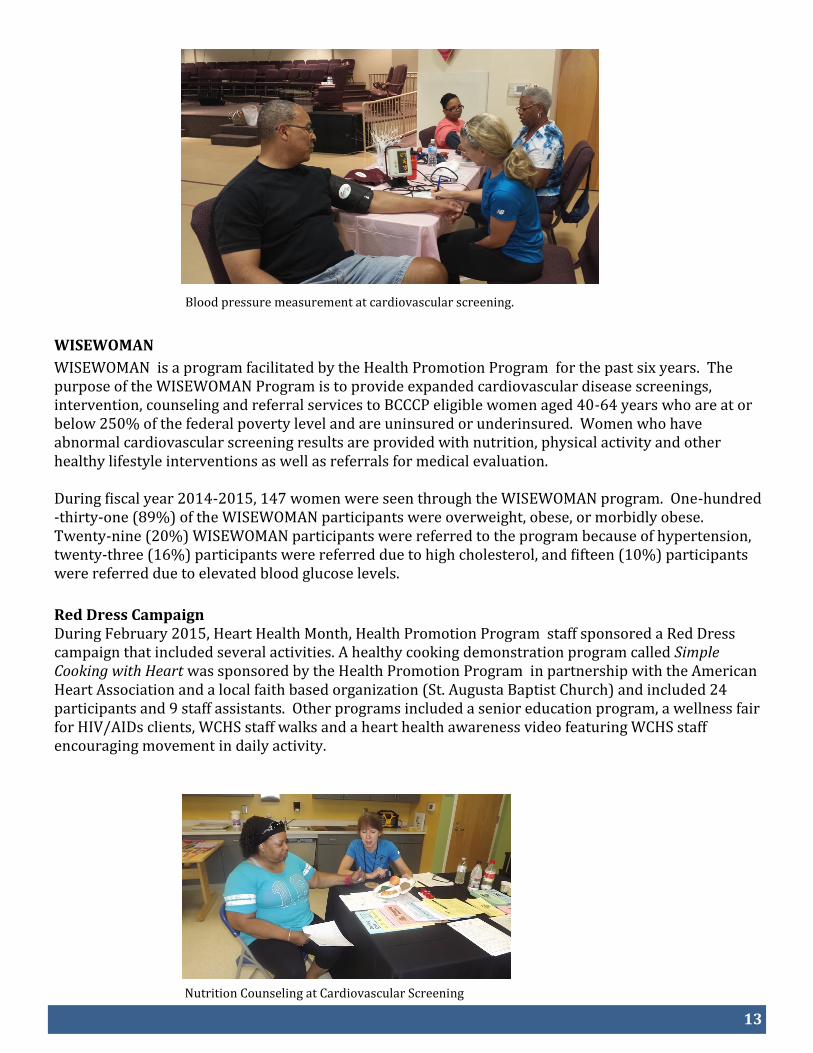
Blood pressure measurement at cardiovascular screening.
WISEWOMAN
WISEWOMAN is a program facilitated by the Health Promotion Program for the past six years. The purpose of the WISEWOMAN Program is to provide expanded cardiovascular disease screenings, intervention, counseling and referral services to BCCCP eligible women aged 40-64 years who are at or below 250% of the federal poverty level and are uninsured or underinsured. Women who have abnormal cardiovascular screening results are provided with nutrition, physical activity and other healthy lifestyle interventions as well as referrals for medical evaluation. During fiscal year 2014-2015, 147 women were seen through the WISEWOMAN program. One-hundred-thirty-one (89%) of the WISEWOMAN participants were overweight, obese, or morbidly obese. Twenty-nine (20%) WISEWOMAN participants were referred to the program because of hypertension, twenty-three (16%) participants were referred due to high cholesterol, and fifteen (10%) participants were referred due to elevated blood glucose levels.
Red Dress Campaign During February 2015, Heart Health Month, Health Promotion Program staff sponsored a Red Dress campaign that included several activities. A healthy cooking demonstration program called Simple Cooking with Heart was sponsored by the Health Promotion Program in partnership with the American Heart Association and a local faith based organization (St. Augusta Baptist Church) and included 24 participants and 9 staff assistants. Other programs included a senior education program, a wellness fair for HIV/AIDs clients, WCHS staff walks and a heart health awareness video featuring WCHS staff encouraging movement in daily activity.
Nutrition Counseling at Cardiovascular Screening
14
4.0 Obesity
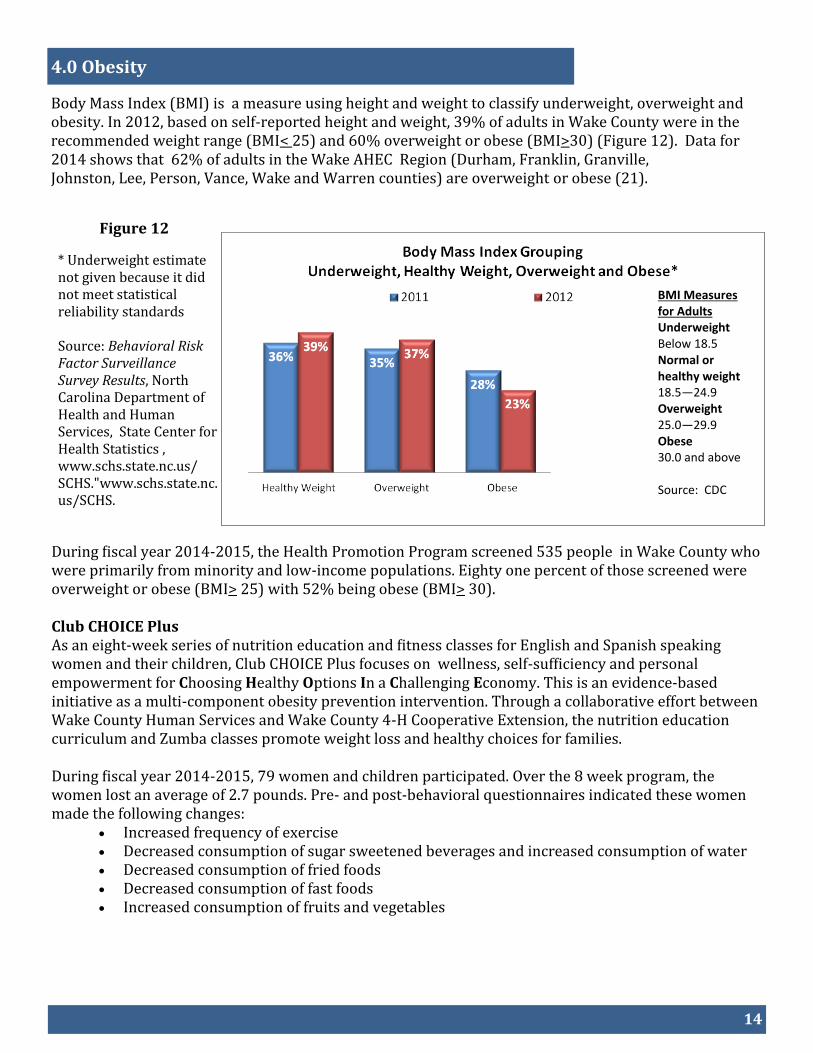
Body Mass Index (BMI) is a measure using height and weight to classify underweight, overweight and obesity. In 2012, based on self-reported height and weight, 39% of adults in Wake County were in the recommended weight range (BMI< 25) and 60% overweight or obese (BMI>30) (Figure 12). Data for 2014 shows that 62% of adults in the Wake AHEC Region (Durham, Franklin, Granville, Johnston, Lee, Person, Vance, Wake and Warren counties) are overweight or obese (21).
Figure 12
* Underweight estimate not given because it did not meet statistical reliability standards
Source: Behavioral Risk Factor Surveillance Survey Results, North Carolina Department of Health and Human Services, State Center for Health Statistics , www.schs.state.nc.us/SCHS."www.schs.state.nc.us/SCHS.
During fiscal year 2014-2015, the Health Promotion Program screened 535 people in Wake County who were primarily from minority and low-income populations. Eighty one percent of those screened were overweight or obese (BMI> 25) with 52% being obese (BMI> 30). Club CHOICE Plus As an eight-week series of nutrition education and fitness classes for English and Spanish speaking women and their children, Club CHOICE Plus focuses on wellness, self-sufficiency and personal empowerment for Choosing Healthy Options In a Challenging Economy. This is an evidence-based initiative as a multi-component obesity prevention intervention. Through a collaborative effort between Wake County Human Services and Wake County 4-H Cooperative Extension, the nutrition education curriculum and Zumba classes promote weight loss and healthy choices for families. During fiscal year 2014-2015, 79 women and children participated. Over the 8 week program, the women lost an average of 2.7 pounds. Pre- and post-behavioral questionnaires indicated these women made the following changes:
Increased frequency of exercise Decreased consumption of sugar sweetened beverages and increased consumption of water Decreased consumption of fried foods Decreased consumption of fast foods Increased consumption of fruits and vegetables
BMI Measures for Adults Underweight Below 18.5 Normal or healthy weight 18.5—24.9 Overweight 25.0—29.9 Obese 30.0 and above Source: CDC
15
Figure 13
Figure 14
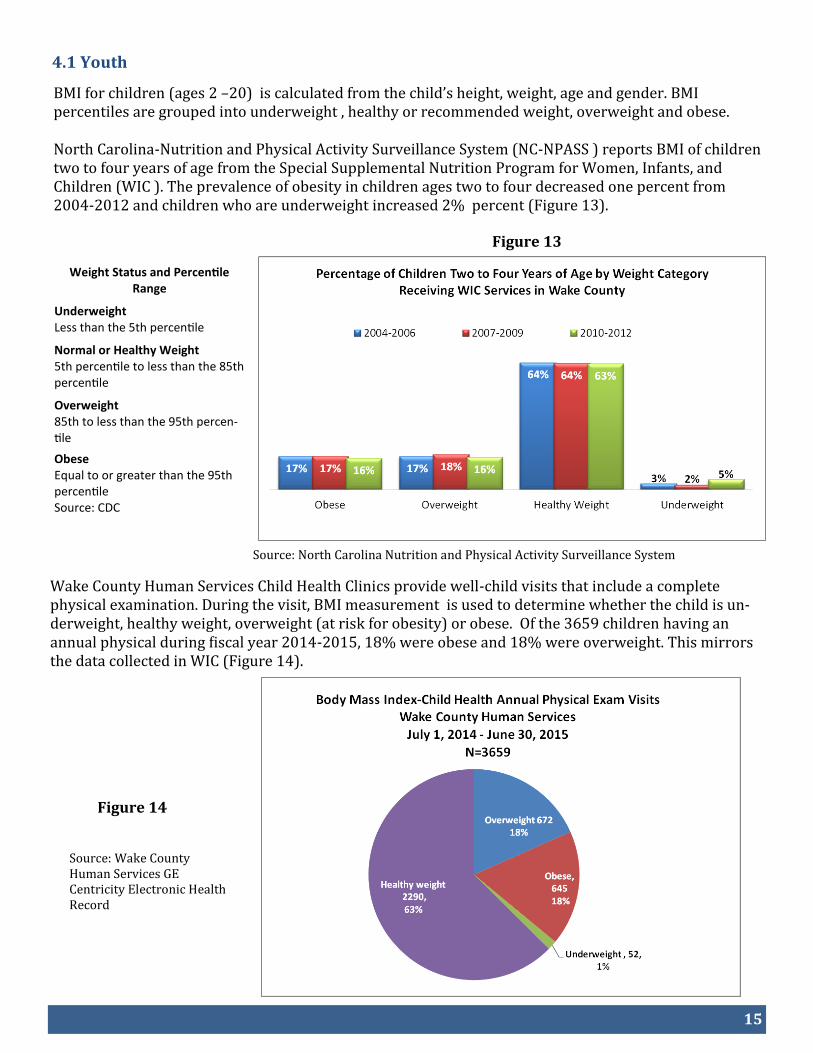
BMI for children (ages 2 –20) is calculated from the child’s height, weight, age and gender. BMI percentiles are grouped into underweight , healthy or recommended weight, overweight and obese. North Carolina-Nutrition and Physical Activity Surveillance System (NC-NPASS ) reports BMI of children two to four years of age from the Special Supplemental Nutrition Program for Women, Infants, and Children (WIC ). The prevalence of obesity in children ages two to four decreased one percent from 2004-2012 and children who are underweight increased 2% percent (Figure 13).
Source: North Carolina Nutrition and Physical Activity Surveillance System
Wake County Human Services Child Health Clinics provide well-child visits that include a complete physical examination. During the visit, BMI measurement is used to determine whether the child is un-derweight, healthy weight, overweight (at risk for obesity) or obese. Of the 3659 children having an annual physical during fiscal year 2014-2015, 18% were obese and 18% were overweight. This mirrors the data collected in WIC (Figure 14).
Source: Wake County Human Services GE Centricity Electronic Health Record
4.1 Youth
Weight Status and Percentile Range
Underweight Less than the 5th percentile
Normal or Healthy Weight 5th percentile to less than the 85th percentile
Overweight 85th to less than the 95th percen-tile
Obese Equal to or greater than the 95th percentile Source: CDC
16
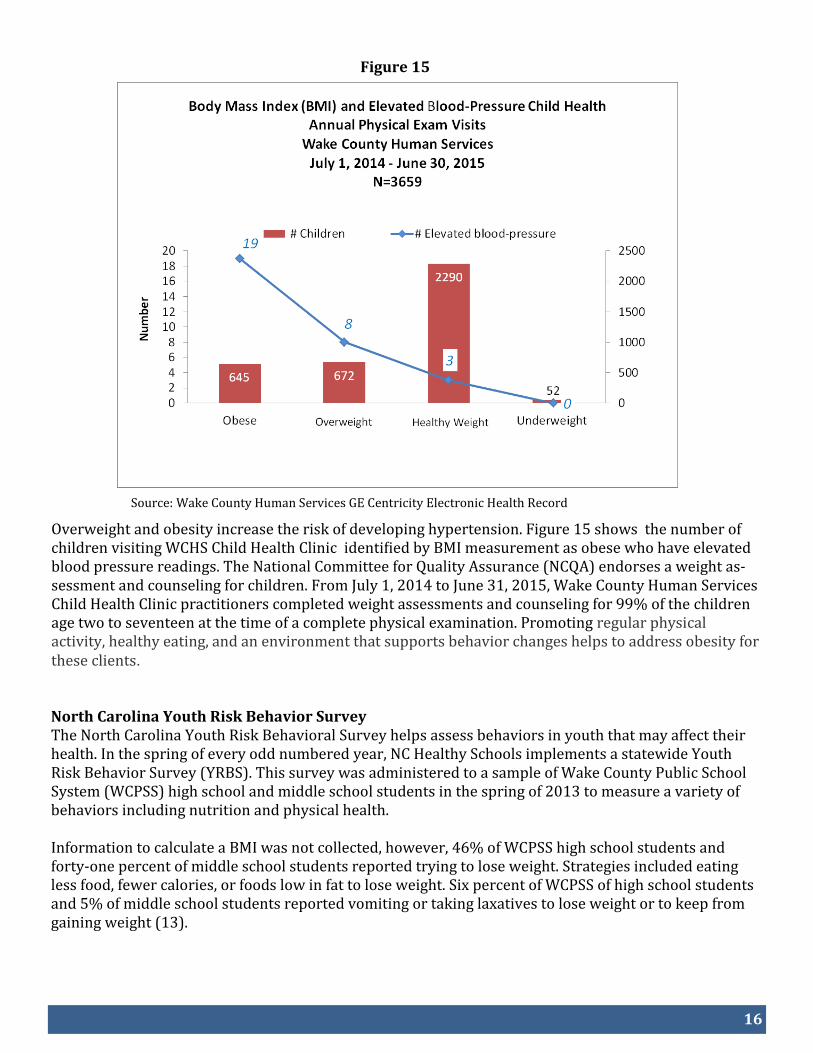
Figure 15
Source: Wake County Human Services GE Centricity Electronic Health Record
Overweight and obesity increase the risk of developing hypertension. Figure 15 shows the number of children visiting WCHS Child Health Clinic identified by BMI measurement as obese who have elevated blood pressure readings. The National Committee for Quality Assurance (NCQA) endorses a weight as-sessment and counseling for children. From July 1, 2014 to June 31, 2015, Wake County Human Services Child Health Clinic practitioners completed weight assessments and counseling for 99% of the children age two to seventeen at the time of a complete physical examination. Promoting regular physical activity, healthy eating, and an environment that supports behavior changes helps to address obesity for these clients.
North Carolina Youth Risk Behavior Survey The North Carolina Youth Risk Behavioral Survey helps assess behaviors in youth that may affect their health. In the spring of every odd numbered year, NC Healthy Schools implements a statewide Youth Risk Behavior Survey (YRBS). This survey was administered to a sample of Wake County Public School System (WCPSS) high school and middle school students in the spring of 2013 to measure a variety of behaviors including nutrition and physical health. Information to calculate a BMI was not collected, however, 46% of WCPSS high school students and forty-one percent of middle school students reported trying to lose weight. Strategies included eating less food, fewer calories, or foods low in fat to lose weight. Six percent of WCPSS of high school students and 5% of middle school students reported vomiting or taking laxatives to lose weight or to keep from gaining weight (13).
17
Figure 16
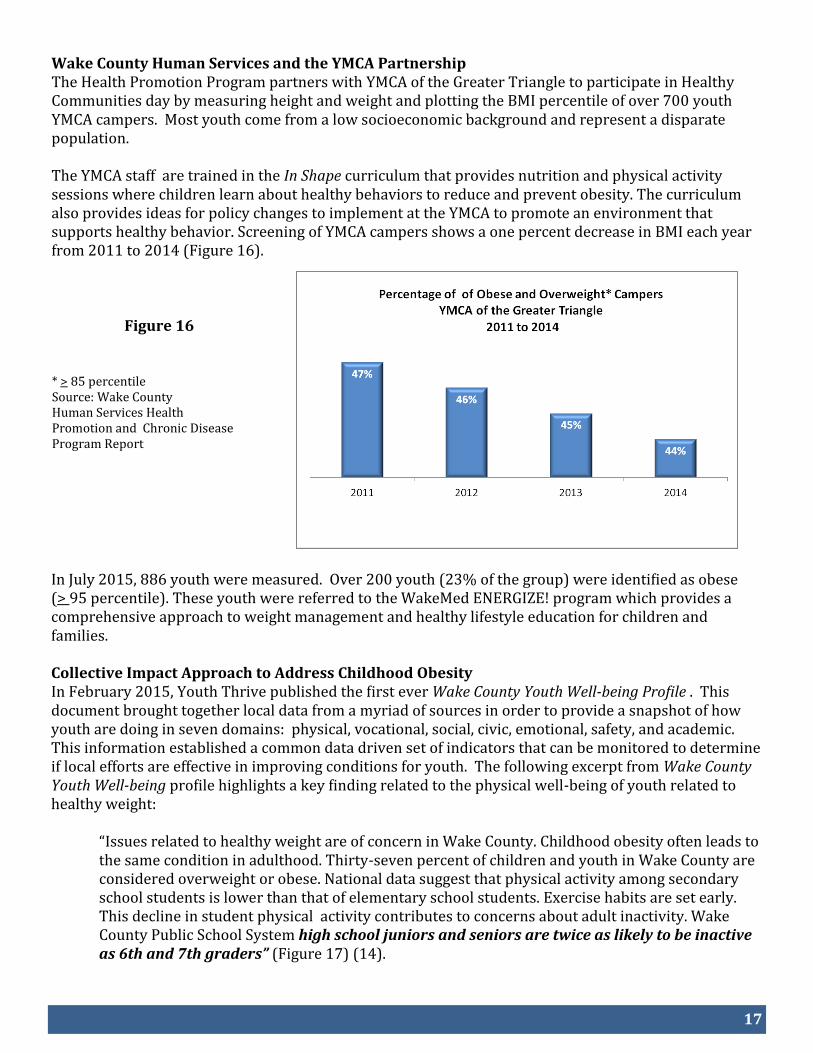
Wake County Human Services and the YMCA Partnership The Health Promotion Program partners with YMCA of the Greater Triangle to participate in Healthy Communities day by measuring height and weight and plotting the BMI percentile of over 700 youth YMCA campers. Most youth come from a low socioeconomic background and represent a disparate population. The YMCA staff are trained in the In Shape curriculum that provides nutrition and physical activity sessions where children learn about healthy behaviors to reduce and prevent obesity. The curriculum also provides ideas for policy changes to implement at the YMCA to promote an environment that supports healthy behavior. Screening of YMCA campers shows a one percent decrease in BMI each year from 2011 to 2014 (Figure 16).
* > 85 percentile Source: Wake County Human Services Health Promotion and Chronic Disease Program Report
In July 2015, 886 youth were measured. Over 200 youth (23% of the group) were identified as obese (> 95 percentile). These youth were referred to the WakeMed ENERGIZE! program which provides a comprehensive approach to weight management and healthy lifestyle education for children and families. Collective Impact Approach to Address Childhood Obesity In February 2015, Youth Thrive published the first ever Wake County Youth Well-being Profile . This document brought together local data from a myriad of sources in order to provide a snapshot of how youth are doing in seven domains: physical, vocational, social, civic, emotional, safety, and academic. This information established a common data driven set of indicators that can be monitored to determine if local efforts are effective in improving conditions for youth. The following excerpt from Wake County Youth Well-being profile highlights a key finding related to the physical well-being of youth related to healthy weight:
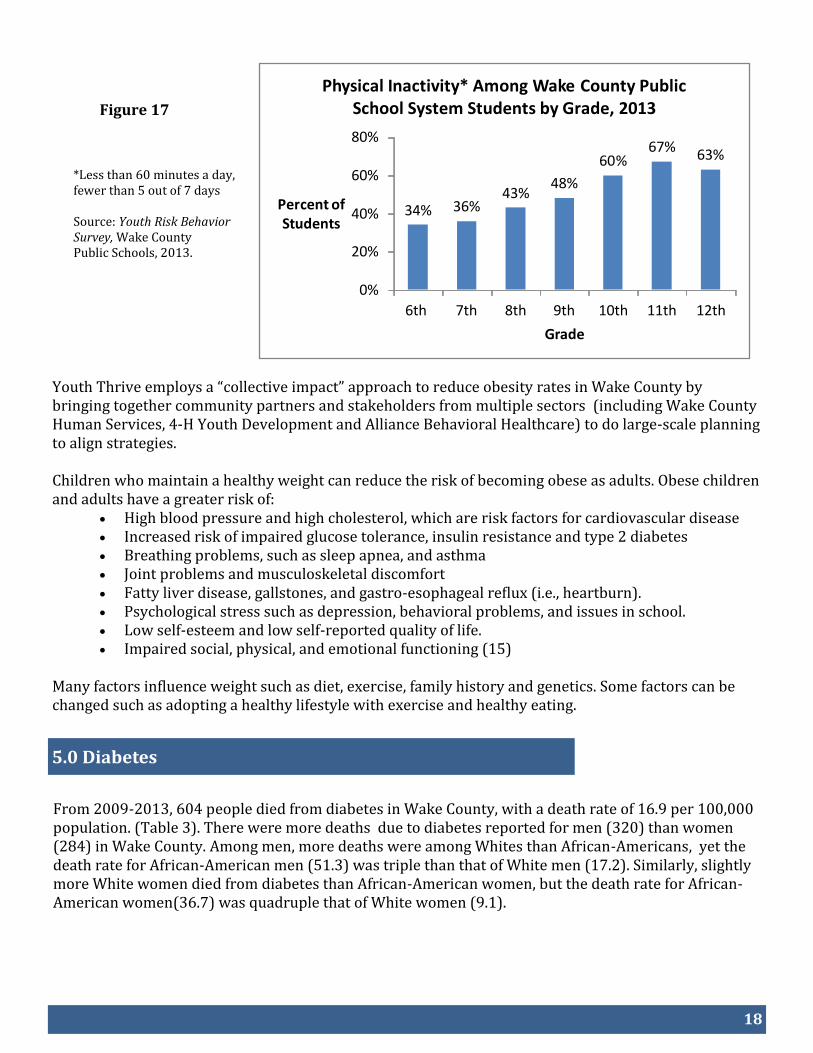
“Issues related to healthy weight are of concern in Wake County. Childhood obesity often leads to the same condition in adulthood. Thirty-seven percent of children and youth in Wake County are considered overweight or obese. National data suggest that physical activity among secondary school students is lower than that of elementary school students. Exercise habits are set early. This decline in student physical activity contributes to concerns about adult inactivity. Wake County Public School System high school juniors and seniors are twice as likely to be inactive as 6th and 7th graders” (Figure 17) (14).
18
5.0 Diabetes
Figure 17
*Less than 60 minutes a day, fewer than 5 out of 7 days Source: Youth Risk Behavior Survey, Wake County Public Schools, 2013.
Youth Thrive employs a “collective impact” approach to reduce obesity rates in Wake County by bringing together community partners and stakeholders from multiple sectors (including Wake County Human Services, 4-H Youth Development and Alliance Behavioral Healthcare) to do large-scale planning to align strategies. Children who maintain a healthy weight can reduce the risk of becoming obese as adults. Obese children and adults have a greater risk of:
High blood pressure and high cholesterol, which are risk factors for cardiovascular disease Increased risk of impaired glucose tolerance, insulin resistance and type 2 diabetes Breathing problems, such as sleep apnea, and asthma Joint problems and musculoskeletal discomfort Fatty liver disease, gallstones, and gastro-esophageal reflux (i.e., heartburn). Psychological stress such as depression, behavioral problems, and issues in school. Low self-esteem and low self-reported quality of life. Impaired social, physical, and emotional functioning (15)
Many factors influence weight such as diet, exercise, family history and genetics. Some factors can be changed such as adopting a healthy lifestyle with exercise and healthy eating.
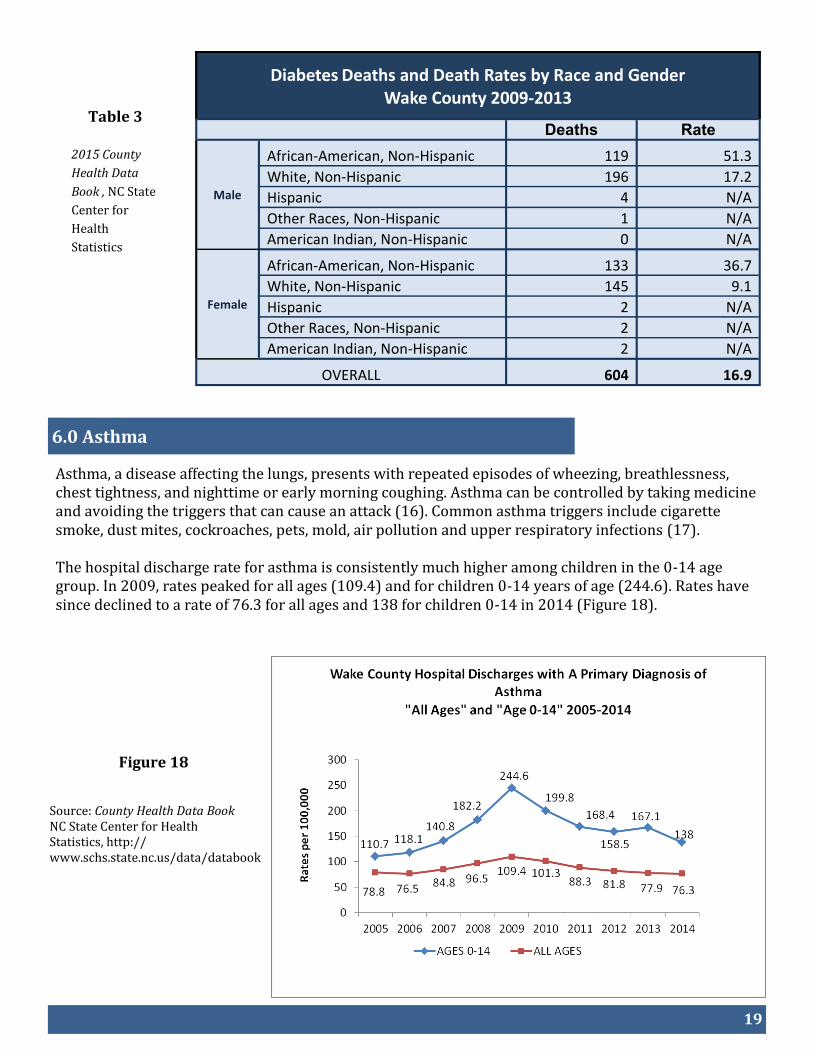
From 2009-2013, 604 people died from diabetes in Wake County, with a death rate of 16.9 per 100,000 population. (Table 3). There were more deaths due to diabetes reported for men (320) than women (284) in Wake County. Among men, more deaths were among Whites than African-Americans, yet the death rate for African-American men (51.3) was triple than that of White men (17.2). Similarly, slightly more White women died from diabetes than African-American women, but the death rate for African-American women(36.7) was quadruple that of White women (9.1).
34% 36%43%
48%
60%67%
63%
0%
20%
40%
60%
80%
6th 7th 8th 9th 10th 11th 12th
Percent of Students
Grade
Physical Inactivity* Among Wake County Public School System Students by Grade, 2013
19
Table 3
6.0 Asthma
Figure 18
Diabetes Deaths and Death Rates by Race and Gender Wake County 2009-2013
Deaths Rate
Male
African-American, Non-Hispanic 119 51.3
White, Non-Hispanic 196 17.2
Hispanic 4 N/A
Other Races, Non-Hispanic 1 N/A
American Indian, Non-Hispanic 0 N/A
Female
African-American, Non-Hispanic 133 36.7
White, Non-Hispanic 145 9.1
Hispanic 2 N/A
Other Races, Non-Hispanic 2 N/A
American Indian, Non-Hispanic 2 N/A
OVERALL 604 16.9
2015 County
Health Data
Book , NC State
Center for
Health
Statistics
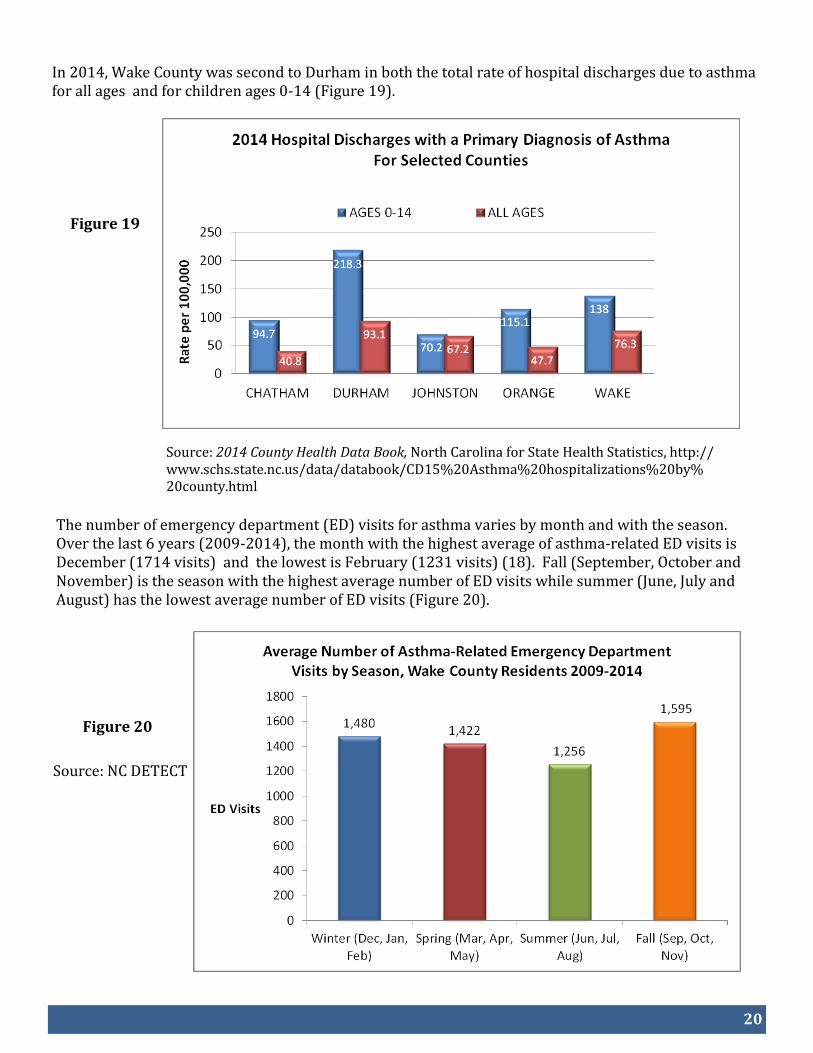
Asthma, a disease affecting the lungs, presents with repeated episodes of wheezing, breathlessness, chest tightness, and nighttime or early morning coughing. Asthma can be controlled by taking medicine and avoiding the triggers that can cause an attack (16). Common asthma triggers include cigarette smoke, dust mites, cockroaches, pets, mold, air pollution and upper respiratory infections (17). The hospital discharge rate for asthma is consistently much higher among children in the 0-14 age group. In 2009, rates peaked for all ages (109.4) and for children 0-14 years of age (244.6). Rates have since declined to a rate of 76.3 for all ages and 138 for children 0-14 in 2014 (Figure 18).
Source: County Health Data Book NC State Center for Health Statistics, http://www.schs.state.nc.us/data/databook
20
Figure 19
In 2014, Wake County was second to Durham in both the total rate of hospital discharges due to asthma for all ages and for children ages 0-14 (Figure 19).
Source: 2014 County Health Data Book, North Carolina for State Health Statistics, http://www.schs.state.nc.us/data/databook/CD15%20Asthma%20hospitalizations%20by%20county.html
The number of emergency department (ED) visits for asthma varies by month and with the season. Over the last 6 years (2009-2014), the month with the highest average of asthma-related ED visits is December (1714 visits) and the lowest is February (1231 visits) (18). Fall (September, October and November) is the season with the highest average number of ED visits while summer (June, July and August) has the lowest average number of ED visits (Figure 20).
Figure 20
Source: NC DETECT
21
7.0 Physical Activity
Using the prescribed medication and educating families about triggers is important for treating asthma. The Wake County Human Services Child Health Clinic practitioners assesses children with mild, moderate, or severe persistent asthma and 98% of these children are prescribed the preferred long-term control medication (19). Community Care of Wake and Johnston Counties and the Wake County Human Services School Health Program are community-based programs that work to improve asthma related outcomes. In the future, Community Care of North Carolina Informatics Center will have an asthma registry that Wake County Human Services can use to evaluate patient outcomes. Community Care also received a Practice Transformation Network grant from the federal government to support continuing quality improvement for asthma in health care practices. Through these efforts, treating asthma with the proper medication, family education and evaluating patient outcomes may help keep the symptoms of asthma under control and prevent hospital admissions.
Physical activity is important for overall fitness and health. According to the 2013 Behavioral Risk Factor Surveillance System data, 77.1% of Wake County and 81.3% of North Carolina residents did not meet the CDC’s aerobic and strength training guidelines. (20). Community Physical Activity Programs The Health Promotion Program works to increase access to physical activity in the community by partnering with other organizations to host fitness programs for populations with limited resources. Health Promotion only has 3. 5 FTEs dedicated to service county-wide community requests; therefore, establishing and maintaining partnerships with key stakeholders is essential.
Movin' & Groovin' During the spring of 2011, the Health Promotion Program and 4H Youth Development staff specifically planned the Movin’ & Groovin’ series to encourage families living in the North Central and Eastern regions of Wake County to increase their physical activity in a free, fun and safe way. Designed to help fight the overweight/obesity epidemic, mini physical activity sessions as well as organized walking are facilitated weekly by Health Promotion Program staff. 4-H Youth Development staff engage participating children by implementing an evidenced based physical activity module, Operation Fit Kids. Movin’ and Groovin’ was the recipient of a NCPHA Award in 2013 and 2015 as well as the Wake County Council on Fitness and Health’s Certificate of Excellence Award. During fiscal year 2014-2015, the program expanded to reach additional underserved areas of the county. There were 6 walking programs, with locations in Northeast Raleigh, Knightdale, Rolesville and Wake Forest with a total of 288 participants. Results of a survey completed by 55 Movin’ and Groovin’ participants demonstrated that:
93% increased other physical activity habits 95% improved nutrition habits 66% improved their weight 53% improved their blood pressure, blood cholesterol and/or blood sugar levels
(if applicable)
22
The Health Promotion Program partners with Grocers on Wheels, a mobile market, to bring fresh fruits and vegetables to Movin’ & Groovin’ participants in an effort to improve access to fresh produce within the community. Over $520 worth of “Healthy Bucks” were distributed to participants (adults and children) to purchase produce at the mobile market. More than 55 indi-viduals participated and 530 pounds of food were purchased with the “Healthy Bucks”. Participants earned "Healthy Bucks" throughout the Movin’ and Groovin’ series by attending weekly sessions and submitting weekly activity and healthy behavior logs. Use of Mobile Markets is an evidence based initiative.
Couch to 5K Program Couch to 5K is a free 9-week fitness and wellness program designed for inexperienced runners interested in working towards running a 5K (or 30 minutes). Participants receive a step by step plan preparing them to walk, jog and then run. Weekly running meetings allow for continued motivation, support and inspiration. An added bonus to this program is family involvement. Wake County 4-H and Raleigh Parks Recreation and Cultural Resources engage children, ages 7+, in physical activities preparing them to complete a 5K with their parent(s). At the end of the 9 weeks, families and participants can sign up for a local 5K to show off their newly developed running ability. In Spring 2015, 16 adults and 4 youth participated in the 9 week fitness series. Participants reported healthy behavior changes and improved weight as a result of participating in the Couch to 5K program.
Walking programs were also held at several faith based and community based organizations that have a partnership with the Health Promotion Program.
23
8.0 References
1. Chronic Disease Prevention and Health Promotion. Centers for Disease Control and Prevention, http://www.cdc.gov/chronicdisease/index.htm. Accessed 11/22/2015. 2. 2016 County Health Data Book. North Carolina Center for Health Statistics http://www.schs.state.nc.us/data/databook/. Accessed 11/30/2015. 3. Health Effects of Cigarette Smoking. Centers for Disease Control and Prevention, http://www.cdc.gov/tobacco/data_statistics/fact_sheets/health_effects/effects_cig_smoking/index.htm. Accessed 11/23/2015). 4. Cancer Progress Report 2003. National Cancer Institute. U.S. Department of Health and Human Services, Public Health Service, National Institutes of Health, 2004. 5. Current Cigarette Smoking Among Adults—United States, 2005—2014. Morbidity and Mortality Weekly Report (MMWR), November 13, 2015. Centers for Disease Control and Prevention, http://www.cdc.gov/mmwr/preview/mmwrhtml/mm6444a2.htm. Accessed 11/30/2015. 6. New CDC study finds dramatic increase in e-cigarette-related calls to poison centers. Centers for Disease Control, Newsroom Release, April 3, 2014, http://www.cdc.gov/media/releases/2014/p0403-e-cigarette-poison.html. Accessed 11/24/2015. 7. Youth Tobacco Survey Shows Less Smoking, More E-cigarette Use Among N.C. Teens. North Carolina Health and Human Services, Press Release, Youth Tobacco Survey, September 19, 2014. http://www.ncdhhs.gov/news/press-releases/youth-tobacco-survey-shows-less-smoking-more-e-cigarette-use-among-nc-teens. Accessed 11/24/2015. 8. Article 23. Smoking Prohibited in Public Places and Places of Employment. Part 1A. Findings and Intent. NC General Assembly, http://www.ncleg.net/EnactedLegislation/Statutes/HTML/ByArticle/Chapter_130A/Article_23.html. Accessed 11/24/2015. 9. The Health Consequences of Smoking-50 Years of Progress: A Report of the Surgeon General. U.S. De-partment of Health and Human Services, Centers for Disease Control and Prevention, National Center for Chronic Disease Prevention and Health Promotion, Office on Smoking and Health, 2014. 10. 2015 Employee Handbook. Wake County Public School System, http://myworkplace.wcpss.net/emp-handbk.pdf . Accessed 11/25/2015. 11. Campus Policies and Procedures. Wake Tech Community College, http://www.waketech.edu/student-services/catalog/campus-policies-and-procedures. Accessed 11/25/2014. 12. High Blood Pressure (hypertension). Mayo Clinic, http://www.mayoclinic.org/diseases-conditions/high-blood-pressure/basics/tests-diagnosis/CON-20019580). Accessed 11/25/2015 13. North Carolina Youth Risk Behavior Survey: 2013. Wake County Public Schools: High School Results, http://webarchive.wcpss.net/results/reports/2014/hs_nc_yrbs.pdf Middle School Results, https://webarchive.wcpss.net/results/reports/2014/ms_nc_yrbs.pdf. Accessed 11/25/2015.
24
14. Wake County Youth Well-being Profile. February 2015. YouthThrive, http://youth-thrive.org/wp-content/uploads/2015/02/Wake-County-Well-Being-Report_FINAL-.pdf. Accessed 11/30/2015. 15. Childhood Obesity Causes & Consequences. Centers for Disease Control and Prevention, Division of Nutrition, Physical Activity, and Obesity, http://www.cdc.gov/obesity/childhood/causes.html. Accessed 11/25/2015. 16. Asthma. Centers for Disease Control and Prevention, http://www.cdc.gov/asthma/default.htm. Accessed 11/25/2015. 17. Common Asthma Triggers. Centers for Disease Control and Prevention, http://www.cdc.gov/asthma/triggers.html. Accessed 11/30/2015. 18. NC DETECT (Disease Event Tracking and Epidemiological Collection Tool). 19. Wake County Human Services, GE Centricity Electronic Health Record. 20. 2013 Behavioral Risk Factor Surveillance Survey. North Carolina State Center for Health Statistics, http://www.schs.state.nc.us/data/brfss/2013/nc/nccr/_PASTAE1.html). Accessed 11/20/15. 21. 2014 Behavioral Risk Factor Surveillance Survey. North Carolina Center for Health Statistics, http://www.schs.state.nc.us/data/brfss/2014/nc/nccr/rf2.html. Accessed 12/4/2015.

25
We would like to acknowledge the following for their contributions to this report:
Roxanne Deter
Ramsay Hoke
Meghan Malka
Michelle Mulvihill
Sonya Reid
9.0 Acknowledgements