Embed Size (px)
Citation preview
1521-0111/89/1/27–41$25.00 http://dx.doi.org/10.1124/mol.115.100206MOLECULAR PHARMACOLOGY Mol Pharmacol 89:27–41, January 2016Copyright ª 2015 by The American Society for Pharmacology and Experimental Therapeutics
Chronic Oxidative Stress Increases Resistance toDoxorubicin-Induced Cytotoxicity in Renal CarcinomaCells Potentially Through Epigenetic Mechanism s
Logeswari Ponnusamy, Prathap Kumar S. Mahalingaiah, and Kamaleshwar P. SinghDepartment of Environmental Toxicology, The Institute of Environmental and Human Health (TIEHH), Texas Tech University,Lubbock, Texas
Received June 3, 2015; accepted October 29, 2015
ABSTRACTRenal cell carcinoma is the most common form of kidney cancerand is highly resistant to chemotherapy. Although the role ofoxidative stress in kidney cancer is known, the chemotherapeuticresponse of cancer cells adapted to chronic oxidative stress isnot clear. Hence, the effect of oxidative stress on sensitivity todoxorubicin-induced cytotoxicity was evaluated using an in vitromodel of human kidney cancer cells adapted to chronic oxidativestress. Results ofMTT- andanchorage-independent growth assaysand cell cycle analysis revealed significant decrease in sensitivity todoxorubicin in Caki-1 cells adapted to oxidative stress. Changes inthe expression of genes involved in drug transport, cell survival, andDNA repair–dependent apoptosis further confirmed increasedresistance to doxorubicin-induced cytotoxicity in these cells. De-creased expression of mismatch repair (MMR) gene MSH2 in cells
exposed to oxidative stress suggests that loss of MMR-dependentapoptosis could be a potential mechanism for increased resistanceto doxorubicin-induced cytotoxicity. Additionally, downregulationof HDAC1, an increase in the level of histone H3 acetylation, andhypermethylation of MSH2 promoter were also observed in Caki-1cells adapted to chronic oxidative stress.DNA-demethylating agent5-Aza-2dC significantly restored the expression of MSH2 anddoxorubicin-induced cytotoxicity in Caki-1 cells adapted to chronicoxidative stress, suggesting the role of DNA hypermethylationin inactivation of MSH2 expression and consequently MMR-dependent apoptosis in these cells. In summary, this study forthe first time provides direct evidence for the role of oxidative stressin chemotherapeutic resistance in renal carcinoma cells potentiallythrough epigenetic mechanism.
IntroductionRenal cell carcinoma (RCC) represents the most common
form of kidney cancer and its incidence has been increasing(Ho et al., 2013; Wang et al., 2013; Araújo et al., 2015).Additionally, kidney cancer is highly refractory to chemother-apy. Though the reasons are not completely understood, thepresence of ametastatic form during initial diagnosis and highresistance to conventional therapeutic strategies have beenconsidered as main factors for the poor prognosis of RCC(Kojima et al., 2009; Li et al., 2014a). Even though improvedclinical response has been achieved with a new class of drugs,the low response rate, resistance development, and adverseeffects associated with new therapeutics restrict their clinicaluse (Mahalingam et al., 2009; Sankhala et al., 2009). Hence,understanding acquired resistance to therapy is of immenseimportance to improving clinical outcomes.Multiplemechanisms, such as increased expression of efflux
transporters (Gottesman et al., 2002; Huang et al., 2004), an
increase in detoxification mechanisms (Stordal and Davey,2007; Raguz and Yagüe, 2008), alteration in key cellulartargets (Stavrovskaya, 2000; Singh et al., 2006; Housmanet al., 2014), and evasion of apoptotic death (Scheltema et al.,2001; Igney and Krammer, 2002; Indran et al., 2011), havebeen suggested for acquired resistance development. Inaddition, changes in cellular microenvironment, such as in-creased reactive oxygen species (ROS) leading to oxidativestress, may play an important role not only in kidney cancerdevelopment and increased metastatic potential but also indevelopment of resistance against chemotherapeutic drugs(Spitz et al., 1993; Pelicano et al., 2004; Hwang et al., 2007).ROS-induced biochemical and molecular lesions might facili-tate the development of a heterogeneous cancer cell popula-tion with drug-resistant clones. Thus, the induction of drugresistance depends on both the inherent genetic make-up ofcells and the chemotherapeutic targeted action (Pelicano et al.,2004).Extensive studies over the years have implicated alter-
ations in various pathways for oxidative stress–induced drugresistance. For example, activation of redox-sensitive tran-scription factor Nrf2 can induce antioxidant defense system,
dx.doi.org/10.1124/mol.115.100206.s This article has supplemental material available at molpharm.
aspetjournals.org.
ABBREVIATIONS: 5-Aza-2dC, 5-aza-2’-deoxycytidine; Caki-1LA, Caki-1 cells adapted to low (25-mM) concentration of hydrogen peroxide;Caki-1HA cells, Caki-1 cells adapted to high (200-mM) concentration of hydrogen peroxide; DCFH-DA, 29,79-dichlorofluorescein diacetate;DMSO, dimethyl sulfoxide; HDAC1, histone deacetylase 1; MTT, 3-(4, 5-dimethylthiazol-2-yl)-2, 5-diphenyltetrazolium bromide; PBS,phosphate-buffered saline; PCR, polymerase chain reaction; RCC, renal cell carcinoma; ROS, reactive oxygen species; RIPA lysis buffer,radioimmunoprecipitation assay buffer.
27
http://molpharm.aspetjournals.org/content/suppl/2015/10/30/mol.115.100206.DC1Supplemental material to this article can be found at:
at ASPE
T Journals on M
arch 1, 2019m
olpharm.aspetjournals.org
Dow
nloaded from
including MnSOD, thioredoxin, peroxiredoxins, catalase, andglutathione peroxidase (Osburn and Kensler, 2008), andconsequently this can confer resistance to both oxidativestress and anticancer drugs by inhibiting apoptosis andoffering cell survival mechanisms (Landriscina et al., 2009).Likewise, activation of nuclear factor kB has also been shownto be involved in chemotherapeutic resistance through variousmechanisms, such as through upregulation of multidrugresistance (MDR) genes (Thévenod et al., 2000), increasedexpression of Bcl-2 (Viatour et al., 2003), and increasedangiogenic vascular endothelial growth factor (Morais et al.,2009). Adaptation to chronic oxidative stress has been shownnot only to increase the growth of cancer cells but also to affectdirectly the response to chemotherapy, as many anticancerdrugs exert their cytotoxicity by generating ROS (Spitz et al.,1993; Scheltema et al., 2001; Mahalingaiah and Singh, 2014).In addition to genetic changes, ROS-induced epigenetic
changes may also play a role in development of resistance tochemotherapeutic drugs. For example, increased effects ofanticancer drugs (Hagiwara et al., 2008; Iwata et al., 2011;Ricketts et al., 2013) and suppression of cell growth inxenograft model of RCC (Hagiwara et al., 2008) followingreversal of DNA hypermethylation by inhibition of DNAmethyl transferases (DNMT) have been reported. An abnor-mally high level of DNMT1 activity in tumor tissues and itscorrelation with poor prognosis in RCC patients furthersupport the role of an epigenetic mechanism in resistance tochemotherapy (Li et al., 2014b).Therefore, the objective of this study was to identify the
mechanism through which the exposure to chronic oxidativestress can lead to acquired drug resistance in renal cancercells. To address this question, an RCC cell model of chronicexposure to oxidative stress was developed in which Caki-1renal carcinoma cells were exposed to hydrogen peroxide–induced oxidative stress for a chronic period. The role ofoxidative stress in sensitivity to the anticancer drug doxoru-bicin was evaluated by various parameters. To furtherevaluate the possible role of oxidative stress–induced epige-netic changes in cellular response to doxorubicin, these cellswere first pretreated with demethylating agent (5-aza-29-deoxycytidine) and then sensitivity to doxorubicin wasmeasured.
Materials and MethodsReagents. Doxorubicin HCl, cis-diamineplatinum (II) dichloride
(cisplatin), 5-aza-29-deoxycytidine (5-Aza-2dC), hydrogen peroxide(H2O2) 30% solution (w/v), 29, 79 dichlorodihydrofluorescein diacetate(DCFH-DA), and 3-(4, 5-dimethylthiazol-2-yl)-2, 5-diphenyltetrazo-lium bromide (MTT) were procured from Sigma-Aldrich (St. Louis,MO). Cell cycle reagent, radioimmunoprecipitation assay (RIPA) lysisbuffer (1�), and polymerase chain reaction (PCR) reagents wereobtained fromEMDMillipore (Billerica,MA), SantaCruzBiotechnology,Inc. (Dallas, TX), and Bio-Rad (Hercules, CA), respectively. McCoy’s5A modified medium was purchased from Lonza (Walkersville, MD).Fetal bovine serum and antibiotic/antimycotic solution wereobtained from Life Technologies (Grand Island, NY), and trypsin/EDTA and Trizol reagent were purchased from Invitrogen (LifeTechnologies).
Cell Line and Culture Conditions. Human renal cell carcinomacell line (Caki-1) was obtained fromAmerican Type Culture Collection(ATCC). After an initial procurement, subsequent in vitro expansionwas followed and cell lines were maintained in McCoy’s 5A medium
supplemented with 10% fetal bovine serum and 1% antibiotic andantimycotic solution at 37°C in a humidified atmosphere containing5% CO2.
Exposure to Chronic Oxidative Stress. Exponentially growingCaki-1 cells were seeded in 25-cm2 flasks and at 60–70% confluence,treated with 25 mM (low-dose) and 200 mM (high-dose) concentrationsof H2O2 in fresh culture media. H2O2 concentration of 25 mM as low,noncytotoxic concentration and 200mMas high, significantly cytotoxicconcentration were selected from an initial study with a range ofconcentration of 10–500 mM.
Caki-1 cells were chronically exposed to low- and high-doseH2O2 for6 months. Briefly, Caki-1 cells were treated with H2O2 and allowed togrow up to 70–80% confluence and then subcultured and reseeded forH2O2 treatment. This process of treatment and subculture wasrepeated for 6 months continuously. All the treatment groups weremaintained and treated in triplicate. Untreated parental cultureswere grown and maintained as passage matched parallel controls.Before any further experiment and sample collection, chronicallyexposedCaki-1 cellsweremaintained inH2O2-freemedium for at leastone passage.
Treatment of Cells with Doxorubicin, Cisplatin, and 5-Aza-29 -Deoxycytidine (Demethylation). Stock solutions of doxorubi-cin and 5-Aza-2dC were prepared in dimethyl sulfoxide (DMSO) andstored at 280°C for further use. On the basis of the initial pilot studyusing different concentrations (10 nM to 1 mM) of doxorubicin, 600 nMwas found to be the IC50 concentration for Caki-1 cells, hence thisconcentration was selected for further study. Concentration of 5-Aza-2dC (2 mM) was selected on the basis of the commonly usedconcentration for demethylation effects in cancer cells (Singh et al.,2012). After exposure to chronic oxidative stress, sensitivity of Caki-1cells to doxorubicin was evaluated. To evaluate the effect of demeth-ylation on doxorubicin sensitivity, Caki-1 cells were pretreatedwith 5-Aza-2dC for 24 hours and then cotreated with doxorubicinand 5-Aza-2dC for an additional 48 hours. Corresponding untreatedparental control Caki-1 cells were treated with 0.001%DMSO vehicle.
To test the sensitivity of these cells to another class of chemother-apeutic agent, cisplatin was also used in this study. On the basis of theprevious study on cisplatin cytotoxicity in Caki-1 cells (Hueber et al.,2006), a range of cisplatin concentrations (10, 40, and 80 mM) wereused in this study for treatment of cells along with the vehicle-treated(0.9% NaCl solution) control cells.
Measurement of Intracellular ROS Production. To confirmH2O2-induced increase in intracellular ROS level in Caki-1 cells, 29,79-dichlorofluorescein diacetate (DCFH-DA) assay was performed. Caki-1 cells were seeded in 96-well plates at a concentration of 1 � 104 cellsper well, and after overnight attachment, cells were washed with 1�phosphate-buffered saline (PBS) and incubated with DCFH-DA in a10 mM final concentration for 30 minutes. Cells were then rinsed with1� PBS and treated with different concentrations of H2O2 solution inPBS for another 30 minutes. Intensity of DCF fluorescence wasdetected using a microplate reader at maximum excitation andemission wavelength of 495 nm and 535 nm, respectively.
MTT Assay for Evaluation of Cellular Sensitivity to Che-motherapeutic Drug (Doxorubicin and Cisplatin)–InducedCytotoxicity. The effects of chronic oxidative stress on cell viabilityas well as the sensitivity of Caki-1 cells to doxorubicin and cisplatinfollowing exposure to chronic oxidative stress were determined byMTT assay. Briefly, Caki-1 cells exposed to chronic oxidative stresswere seeded into 96-well plates at cell density of 4000 cells per welland allowed to attach and grow for 24 hours. To evaluate thesensitivity to doxorubicin with and without 5-Aza-2dC pre- and co-treatment, a treatment protocol was followed as mentioned above.Likewise, to test the sensitivity to another class of chemotherapeuticagent, these cells were also treatedwith cisplatin alone. After 48 hoursof treatment, media was removed for all treated and untreated controlcells and replaced with fresh media containing MTT (1 mg/ml) andincubated for 3 hours at 37°C. This was followed by the removal ofMTT solution and then addition of 150 ml of DMSO to dissolve
28 Ponnusamy et al.
at ASPE
T Journals on M
arch 1, 2019m
olpharm.aspetjournals.org
Dow
nloaded from
insoluble formazan crystals formed within mitochondria of viablecells. The plate was incubated with DMSO for 5 minutes with gentleshaking, and intensity of color formed was quantified using a platereader at optical density wavelength of 570 nm and 630 nm. Theexperiment was performed in triplicate and was repeated twice. Theabsorbance value (after subtracting the reference background) wasconverted into percentage growth to estimate the change in cellviability for different treatment groups.
Cell Cycle Analysis by Flow Cytometry. To determine theeffect of chronic oxidative exposure on Caki-1 cell cycle in response todoxorubicin treatment, cell cycle analysis was performed using flowcytometry. Ethanol (70%)-fixed cells from different treatment groupsas stated earlier and untreated control group were collected bycentrifugation, washed with 1� ice-cold PBS, stained with Guava CellCycle Reagent (Millipore), and then analyzed in Guava Easy-Cyte HTflow cytometer (Millipore). Cell cycle analysis was accomplished withtotal count of 5000 events, and data were acquired using Guavasoftware (Millipore). All samples were evaluated in triplicate andexperiment was repeated twice.
Soft Agar Assay for Anchorage-Independent Growth. Toevaluate the effect of chronic oxidative stress on in vitro tumorigenicpotential of Caki-1 cells, colony formation assay on soft agar wascarried out. For this anchorage-independent growth assay, Caki-1cells exposed to chronic oxidative stress were treated with doxorubicinand 5-Aza-2dC, as in the treatment protocol described for thecytotoxicity assay, then used for seeding on soft agar. The base layerof soft agar (0.5%) and the top layer of agar (0.35%) mixed with cells(5000 cells) in McCoy’s medium were prepared as reported previouslyby us (Mahalingaiah et al., 2015). Plates were incubated at 37°C in anincubator with 5% CO2 and observed daily for colony formation bymicroscopic observation until the soft agar colonies reach clearlyvisible size. The soft agar–grown colonies were counted, and repre-sentative photomicrographs were taken on day 14. The number ofcolonies in each treatment groups were expressed as a percentagevalue compared with untreated control by considering control as100%. The size of colonieswas also determined using Image J softwareand values were expressed as percentage of control.
Wound Healing Cell Migration Assay. Scratch wound healingassay was performed to determine the impact of chronic oxidativestress on migration potential of Caki-1 cells. Actively growing cellswere seeded into six-well cell culture plates. After cells were fullyattached, two parallel scratch wounds per well were created. Aftercreating wounds, cell culture media was replaced with fresh media (toremove the floating cells) containing various drugs or vehicle only asmentioned earlier. The plates were then incubated at 37°C with 5%CO2 in humidified incubator and observed daily for cell migration intowounded area, and representative imageswere taken at different timepoints. Area of unoccupied wound gaps were quantified by usingImage J software with MRI wound-migration quantification plug-intool. Percentage of wound closure was calculated by subtractingunoccupied wound area at different time points from total woundgap on day 0 for each treatment group as reported earlier (Yue et al.,2010).
Isolation of RNA and Real Time Quantitative PCR. Geneexpression was analyzed using total RNA from treatment and controlgroups of cells. Genes of interest were amplified by one-step RT-PCRkit with SYBR green (Bio-Rad) using 75 ng of total RNA. PCRamplifications were performed in MyiQ2 real-time PCR detectionsystem (Bio-Rad) programmed for reverse transcription at 50°C for 15minutes, denaturation and reverse transcription enzyme inactivationat 95°C for 5 minutes, followed by 40 cycles, each containing 10seconds for denaturation at 95°C and 30 seconds for annealing andextension at 60°C. Specificity of PCR products was confirmed by meltcurve analysis. Cycle threshold (Ct) values of each gene werenormalized to the Ct of GAPDH from each sample and the fold-changes in gene expression were computed by following delta-delta Ctmethod (Livak and Schmittgen, 2001). Primer sequences used for geneexpression analysis are listed in Table 1.
Western Blot Analysis. To evaluate the changes in the levels ofproteins and epigenetic modifications in histone H3, total cellularprotein lysates from treated and untreated parental control Caki-1cells were harvested by disrupting the cells using RIPA lysis buffer.Protein samples (30 mg) were subjected to electrophoresis separationon a 10% SDS-PAGE gel and transferred onto nitrocellulose mem-brane. After incubation in blocking buffer (5% nonfat dried milk in 1�PBS), membranes were probed with primary antibody overnight at4°C. Considering the reaction efficiency of antibodies, a dilution of 1:5000 of a-tubulin (cat. no. 5063; Cell Signaling Technology, Danvers,MA), 1:500 of MDR1 (cat. no. 12683S; Cell Signaling Technology), 1:1000 of Survivin (cat. no. 2808; Cell Signaling Technology), 1:100 ofMSH2 (cat. no. SC-494; Santa Cruz Biotechnology), 1:200 of MBD4(cat. no. SC-10753; Santa Cruz Biotechnology), 1:1000 of HDAC1 (cat.no. SC-6298; Santa Cruz Biotechnology), 1:1000 of acetyl HistoneH3Lys9 (cat. no. 9649P; Cell Signaling Technology), and 1:1000 ofacetyl Histone H3Lys9/14 (cat. no. 06-599; Upstate Biotechnology,Lake Placid, NY) were used. Following incubation, membranes werewashed thrice (eachwash last for 10minutes) with washing buffer (1�PBS with 0.05% Tween 20) and then incubated with suitablesecondary antibody conjugated with horseradish peroxidase at adilution of 1:1000 for an hour at room temperature. Membranes werethrice washed again using washing buffer and the signal was sensedby an enhanced chemiluminescence detection system (Amersham/GEHealthcare Life Sciences, Piscataway, NJ). Intensity of protein bandswere measured using Image J software and normalized to a-tubulin.
Analysis of MSH2 Promoter DNA Methylation by Pyrose-quencing. Methylation status of CpG sites in the promoter region ofMSH2 was determined by the pyrosequencing method previouslyreported by us (Treas et al., 2013). Briefly, bisulfite conversion of DNA(500 ng) and its purification was performed using EpiTect bisulfiteconversion kit (Qiagen, Valencia, CA). PCR amplification was per-formed with bisulfite-treated and purified DNA as template and thePyroMark CpG assay primer set (cat. no. PM00007784; Qiagen) toamplify the 261-bp region containing six CpG sites from promoterregion of MSH2 gene. To generate biotinylated single-strand templatefor pyrosequencing, the PCR products were first immobilized ontoSepharose beads coated with streptavidin and then passed throughdenaturation and washing buffer using PyroMark vacuum prepara-tion workstation (Qiagen). Biotinylated single-stranded templateswere then mixed with sequencing primer in a pyrosequencing plateand incubated at 80°C for 2 minutes followed by cooling at roomtemperature for 5 minutes to allow the annealing of template with thesequencing primer. PyroMark Q24 Pyrosequencer (Qiagen) was usedfor pyrosequencing and the percentage of methylation (C/T ratio) foreach CpG site was obtained by analyzing the pyrogram using thePyroMark CpG software (Version 1).
Statistical Analysis. To define the statistical significance of thedifferences observed in different parameters, a two-tailed paired t testfor means with hypothesized difference of 0 was carried out. Ananalysis of variance (ANOVA) was accomplished to estimate if thesource of variation in the data were between or within treatmentgroups. A value of 0.05 was set as alpha level for all statistical tests,and data with value of P , 0.05 were considered as statisticallysignificant.
ResultsDevelopment of Caki-1 Cells Adapted to Chronic
Oxidative Stress. To develop the cell model adapted tochronic oxidative stress, Caki-1 cells were treated with H2O2
and allowed to grow up to 70–80% confluence and thensubcultured and reseeded for H2O2 treatment. The result ofDCFH-DA assay confirmed the H2O2-induced intracellularreactive oxygen species (Supplemental Fig. 1A). This processof treatment and subculture was repeated for 6 months as
Oxidative Stress–Induced Chemoresistance in Kidney Cancer 29
at ASPE
T Journals on M
arch 1, 2019m
olpharm.aspetjournals.org
Dow
nloaded from
mentioned in Materials and Methods. The result of cellviability by MTT assay revealed an increase by 36% in thegrowth of cells after chronic exposure to low-dose (25 mM)H2O2, and adaptive response to high-dose (200 mM) H2O2-induced cytotoxicity compared with the passage matcheduntreated control (Supplemental Fig. 1B). However, in acuteexposure (48 hours) study, the same low dose of H2O2 had nosignificant effect on cell viability, whereas the high dose–induced a significant cytotoxicity. The comparison of cellularresponse to acute exposure to H2O2 with that of chronicexposure confirmed the adaptation of these cells to oxidativestress. From now onward the low-dose H2O2–adapted cells arereferred as Caki-1LA and high-dose H2O2–adapted cells asCaki-1HA.Doxorubicin Sensitivity in Caki-1 Cells Adapted to
Chronic Oxidative Stress. Doxorubicin sensitivity of Caki-1cells adapted to chronic oxidative stress was evaluated byvarious parameters, such as analysis of cytotoxicity, cell cycle,and tumorigenic and migration potential. The results fromthese parameters were further confirmed at the molecularlevel by gene and protein expression. Results of each param-eter follow.Chronic Oxidative Stress Causes Increased Resis-
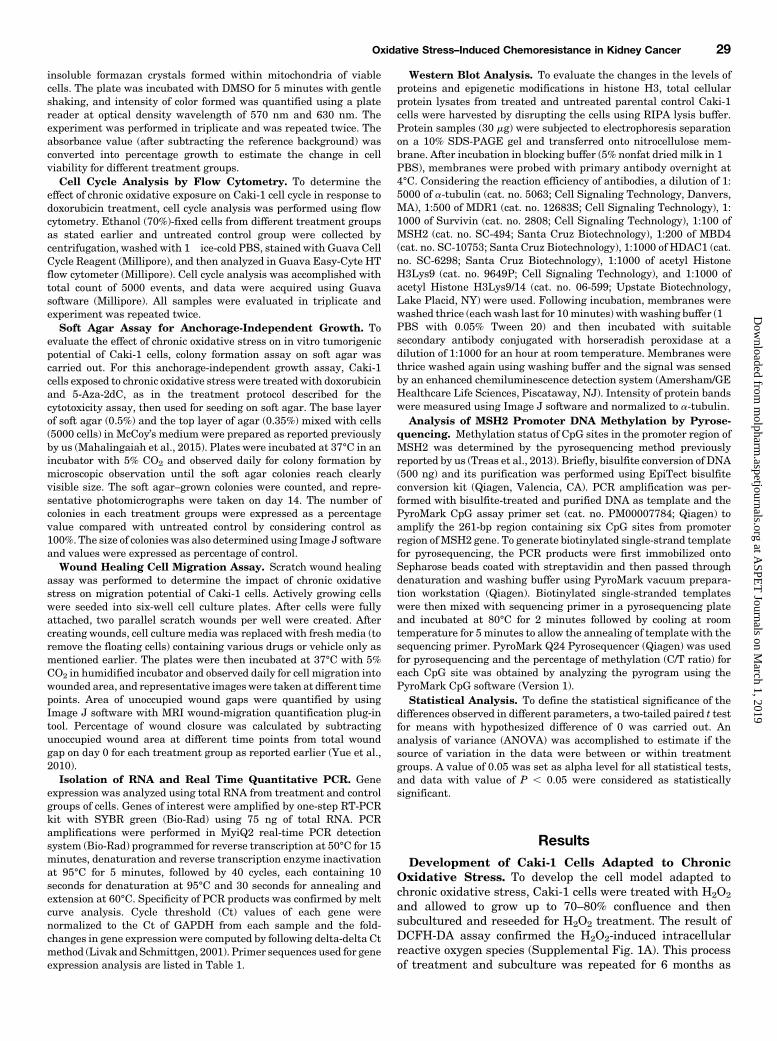
tance to Doxorubicin-Induced Cytotoxicity. To evaluatethe sensitivity of doxorubicin in cells adapted to chronicoxidative stress, both Caki-1LA and Caki-1HA cells weretreated with 600 nM doxorubicin for 48 hours and thecytotoxicity was measured by MTT assay. The result revealedthat doxorubicin-induced cytotoxicity was significantly higher(35%) in Caki-1 cells, whereas only 16 and 25% in Caki-1LA
and Caki-1HA cells, respectively, compared with their un-treated controls (Fig. 1A). The comparison of cell viability afterdoxorubicin treatment revealed a decreased sensitivity todoxorubicin-induced cytotoxicity in Caki-1LA and Caki-1HA
cells by 20.48 and 10%, respectively, compared withdoxorubicin-induced cytotoxicity in Caki-1 cells (Fig. 1A).Therefore, the results of MTT assay suggest that kidneycancer cells adapted to chronic oxidative stress were lesssensitive to doxorubicin-induced cytotoxicity. Moreover, thecells adapted to lower levels of oxidative stress (Caki-1LA)were more resistant to doxorubicin cytotoxicity than thecells adapted to relatively higher levels of oxidative stress(Caki-1HA).Chronic Oxidative Stress Causes Increased Resis-
tance to Cisplatin-Induced Cytotoxicity. To test whetherthe decreased sensitivity to chemotherapeutic drug-inducedcytotoxicity as a result of adaptation to chronic oxidativestress is doxorubicin-specific or applicable to other class of
chemotherapeutic drugs as well, cells were also treated withcisplatin. Interestingly, as with the results of doxorubicintreatment, a significant decrease in the sensitivity to cisplatinwas also observed in Caki-1LA cells compared with Caki-1cells. For example, 10 mM cisplatin treatment resulted in 51%cytotoxicity in Caki-1 cells, whereas the same concentration ofcisplatin caused only 17% cytotoxicity in Caki-1LA cells (Fig.1B). Likewise, a significant decrease in sensitivity to higherconcentrations (40 and 80 mM) of cisplatin in Caki-1LA cellscompared with Caki-1 cells was also observed (Fig. 1B).Chronic Oxidative Stress Abrogates Doxorubicin-
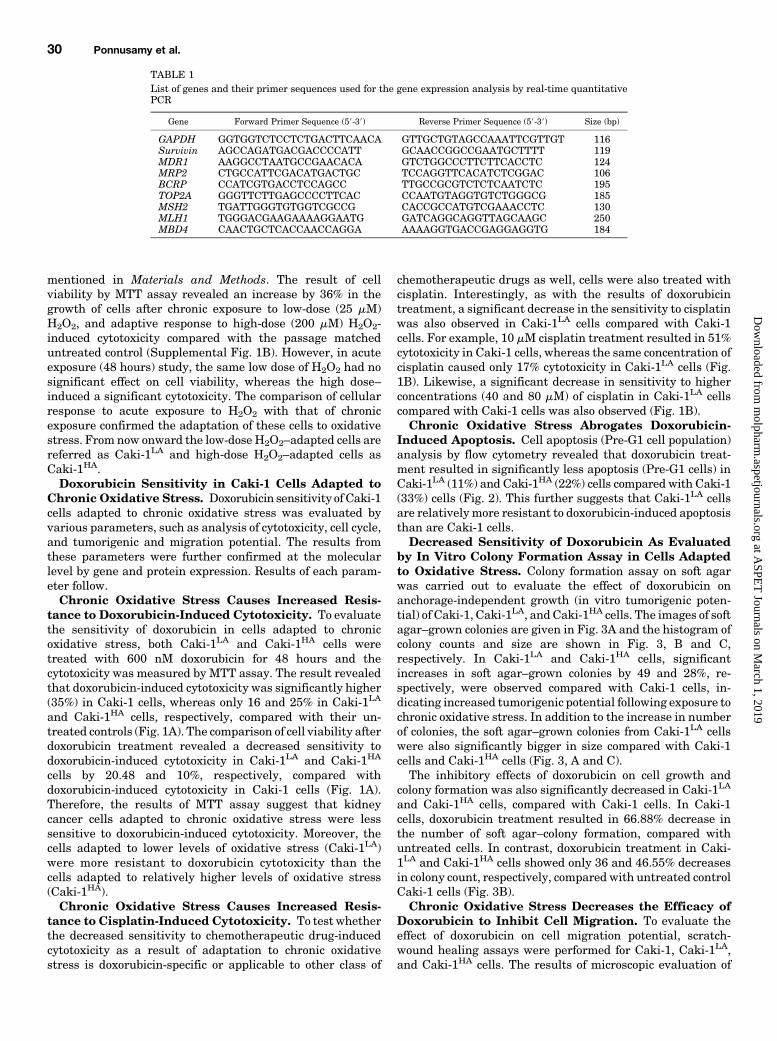
Induced Apoptosis. Cell apoptosis (Pre-G1 cell population)analysis by flow cytometry revealed that doxorubicin treat-ment resulted in significantly less apoptosis (Pre-G1 cells) inCaki-1LA (11%) and Caki-1HA (22%) cells compared with Caki-1(33%) cells (Fig. 2). This further suggests that Caki-1LA cellsare relatively more resistant to doxorubicin-induced apoptosisthan are Caki-1 cells.Decreased Sensitivity of Doxorubicin As Evaluated
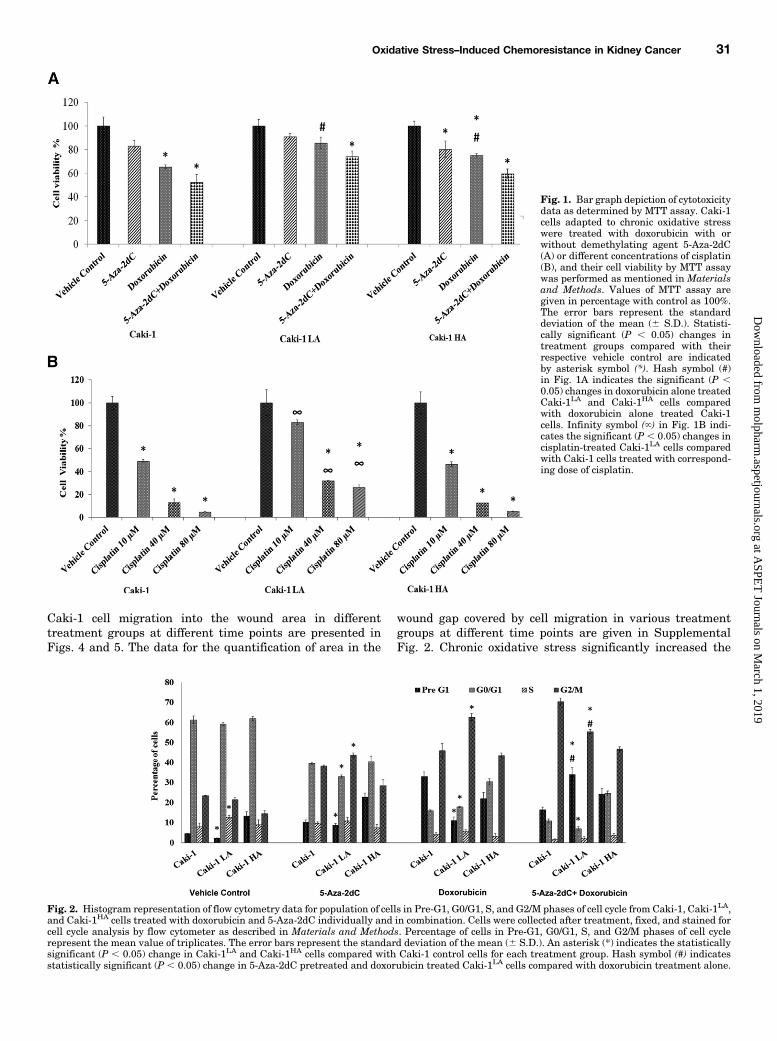
by In Vitro Colony Formation Assay in Cells Adaptedto Oxidative Stress. Colony formation assay on soft agarwas carried out to evaluate the effect of doxorubicin onanchorage-independent growth (in vitro tumorigenic poten-tial) of Caki-1, Caki-1LA, and Caki-1HA cells. The images of softagar–grown colonies are given in Fig. 3A and the histogram ofcolony counts and size are shown in Fig. 3, B and C,respectively. In Caki-1LA and Caki-1HA cells, significantincreases in soft agar–grown colonies by 49 and 28%, re-spectively, were observed compared with Caki-1 cells, in-dicating increased tumorigenic potential following exposure tochronic oxidative stress. In addition to the increase in numberof colonies, the soft agar–grown colonies from Caki-1LA cellswere also significantly bigger in size compared with Caki-1cells and Caki-1HA cells (Fig. 3, A and C).The inhibitory effects of doxorubicin on cell growth and
colony formation was also significantly decreased in Caki-1LA
and Caki-1HA cells, compared with Caki-1 cells. In Caki-1cells, doxorubicin treatment resulted in 66.88% decrease inthe number of soft agar–colony formation, compared withuntreated cells. In contrast, doxorubicin treatment in Caki-1LA and Caki-1HA cells showed only 36 and 46.55% decreasesin colony count, respectively, compared with untreated controlCaki-1 cells (Fig. 3B).Chronic Oxidative Stress Decreases the Efficacy of
Doxorubicin to Inhibit Cell Migration. To evaluate theeffect of doxorubicin on cell migration potential, scratch-wound healing assays were performed for Caki-1, Caki-1LA,and Caki-1HA cells. The results of microscopic evaluation of
TABLE 1List of genes and their primer sequences used for the gene expression analysis by real-time quantitativePCR
Gene Forward Primer Sequence (59-39) Reverse Primer Sequence (59-39) Size (bp)
GAPDH GGTGGTCTCCTCTGACTTCAACA GTTGCTGTAGCCAAATTCGTTGT 116Survivin AGCCAGATGACGACCCCATT GCAACCGGCCGAATGCTTTT 119MDR1 AAGGCCTAATGCCGAACACA GTCTGGCCCTTCTTCACCTC 124MRP2 CTGCCATTCGACATGACTGC TCCAGGTTCACATCTCGGAC 106BCRP CCATCGTGACCTCCAGCC TTGCCGCGTCTCTCAATCTC 195TOP2A GGGTTCTTGAGCCCCTTCAC CCAATGTAGGTGTCTGGGCG 185MSH2 TGATTGGGTGTGGTCGCCG CACCGCCATGTCGAAACCTC 130MLH1 TGGGACGAAGAAAAGGAATG GATCAGGCAGGTTAGCAAGC 250MBD4 CAACTGCTCACCAACCAGGA AAAAGGTGACCGAGGAGGTG 184
30 Ponnusamy et al.
at ASPE
T Journals on M
arch 1, 2019m
olpharm.aspetjournals.org
Dow
nloaded from
Caki-1 cell migration into the wound area in differenttreatment groups at different time points are presented inFigs. 4 and 5. The data for the quantification of area in the
wound gap covered by cell migration in various treatmentgroups at different time points are given in SupplementalFig. 2. Chronic oxidative stress significantly increased the
Fig. 2. Histogram representation of flow cytometry data for population of cells in Pre-G1, G0/G1, S, and G2/M phases of cell cycle from Caki-1, Caki-1LA,and Caki-1HA cells treated with doxorubicin and 5-Aza-2dC individually and in combination. Cells were collected after treatment, fixed, and stained forcell cycle analysis by flow cytometer as described in Materials and Methods. Percentage of cells in Pre-G1, G0/G1, S, and G2/M phases of cell cyclerepresent the mean value of triplicates. The error bars represent the standard deviation of the mean (6 S.D.). An asterisk (*) indicates the statisticallysignificant (P , 0.05) change in Caki-1LA and Caki-1HA cells compared with Caki-1 control cells for each treatment group. Hash symbol (#) indicatesstatistically significant (P , 0.05) change in 5-Aza-2dC pretreated and doxorubicin treated Caki-1LA cells compared with doxorubicin treatment alone.
Fig. 1. Bar graph depiction of cytotoxicitydata as determined by MTT assay. Caki-1cells adapted to chronic oxidative stresswere treated with doxorubicin with orwithout demethylating agent 5-Aza-2dC(A) or different concentrations of cisplatin(B), and their cell viability by MTT assaywas performed as mentioned in Materialsand Methods. Values of MTT assay aregiven in percentage with control as 100%.The error bars represent the standarddeviation of the mean (6 S.D.). Statisti-cally significant (P , 0.05) changes intreatment groups compared with theirrespective vehicle control are indicatedby asterisk symbol (*). Hash symbol (#)in Fig. 1A indicates the significant (P ,0.05) changes in doxorubicin alone treatedCaki-1LA and Caki-1HA cells comparedwith doxorubicin alone treated Caki-1cells. Infinity symbol (‘) in Fig. 1B indi-cates the significant (P , 0.05) changes incisplatin-treated Caki-1LA cells comparedwith Caki-1 cells treated with correspond-ing dose of cisplatin.
Oxidative Stress–Induced Chemoresistance in Kidney Cancer 31
at ASPE
T Journals on M
arch 1, 2019m
olpharm.aspetjournals.org
Dow
nloaded from
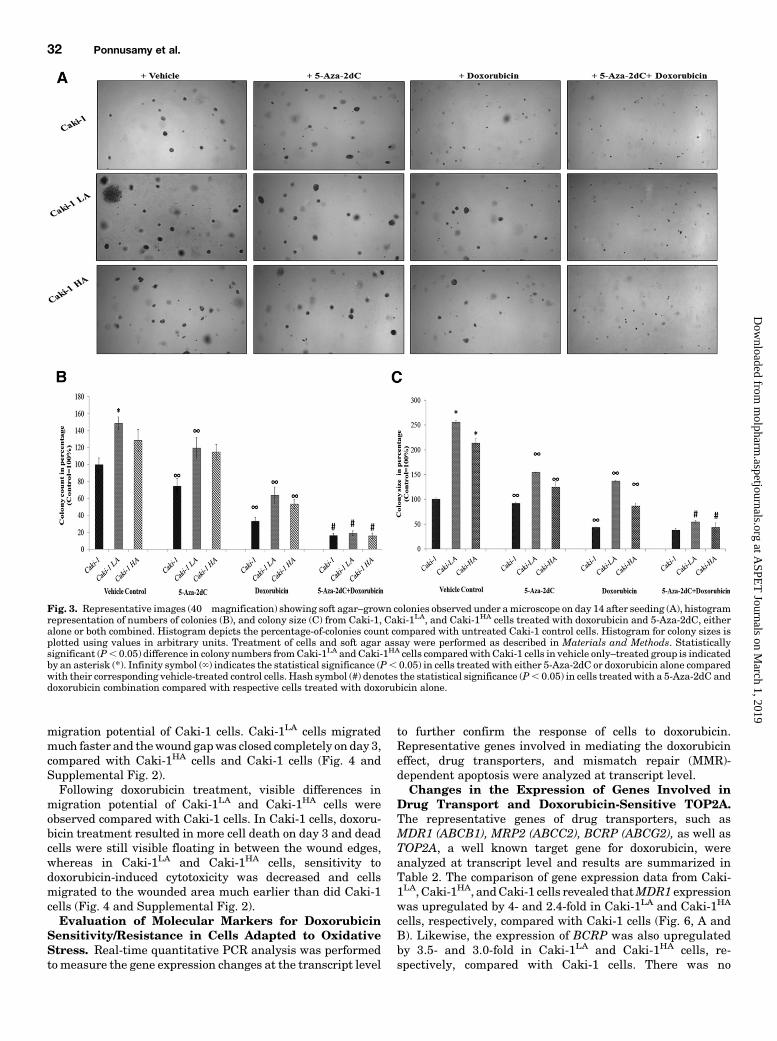
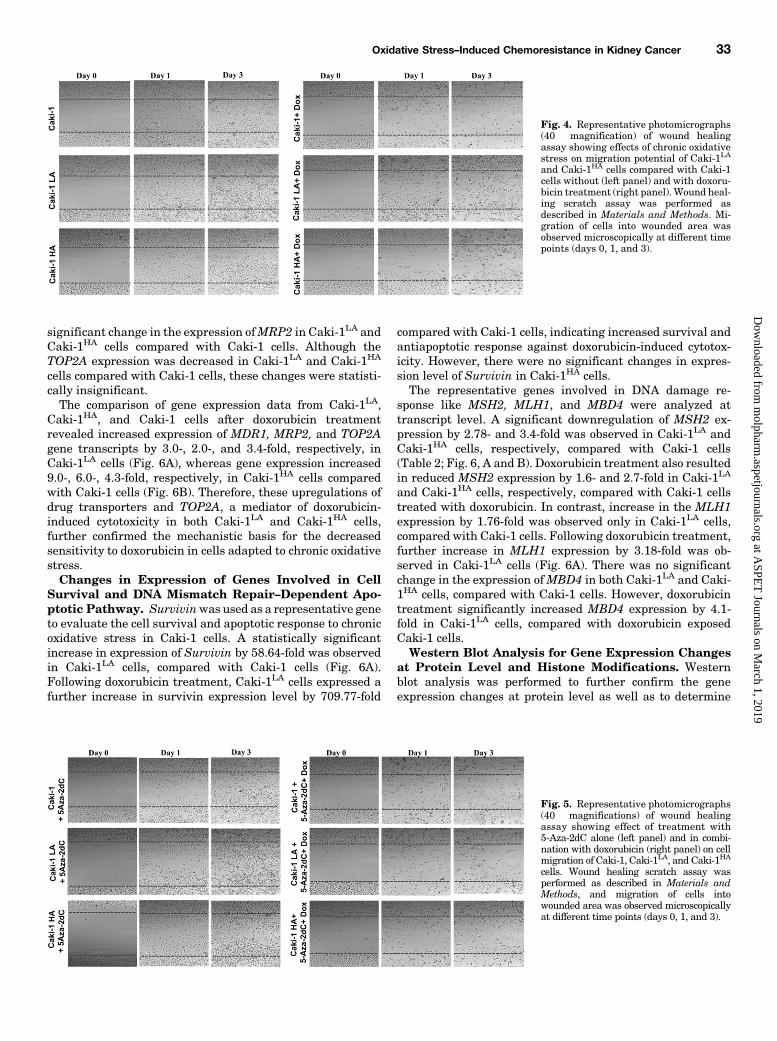
migration potential of Caki-1 cells. Caki-1LA cells migratedmuch faster and thewound gapwas closed completely on day 3,compared with Caki-1HA cells and Caki-1 cells (Fig. 4 andSupplemental Fig. 2).Following doxorubicin treatment, visible differences in
migration potential of Caki-1LA and Caki-1HA cells wereobserved compared with Caki-1 cells. In Caki-1 cells, doxoru-bicin treatment resulted in more cell death on day 3 and deadcells were still visible floating in between the wound edges,whereas in Caki-1LA and Caki-1HA cells, sensitivity todoxorubicin-induced cytotoxicity was decreased and cellsmigrated to the wounded area much earlier than did Caki-1cells (Fig. 4 and Supplemental Fig. 2).Evaluation of Molecular Markers for Doxorubicin
Sensitivity/Resistance in Cells Adapted to OxidativeStress. Real-time quantitative PCR analysis was performedtomeasure the gene expression changes at the transcript level
to further confirm the response of cells to doxorubicin.Representative genes involved in mediating the doxorubicineffect, drug transporters, and mismatch repair (MMR)-dependent apoptosis were analyzed at transcript level.Changes in the Expression of Genes Involved in
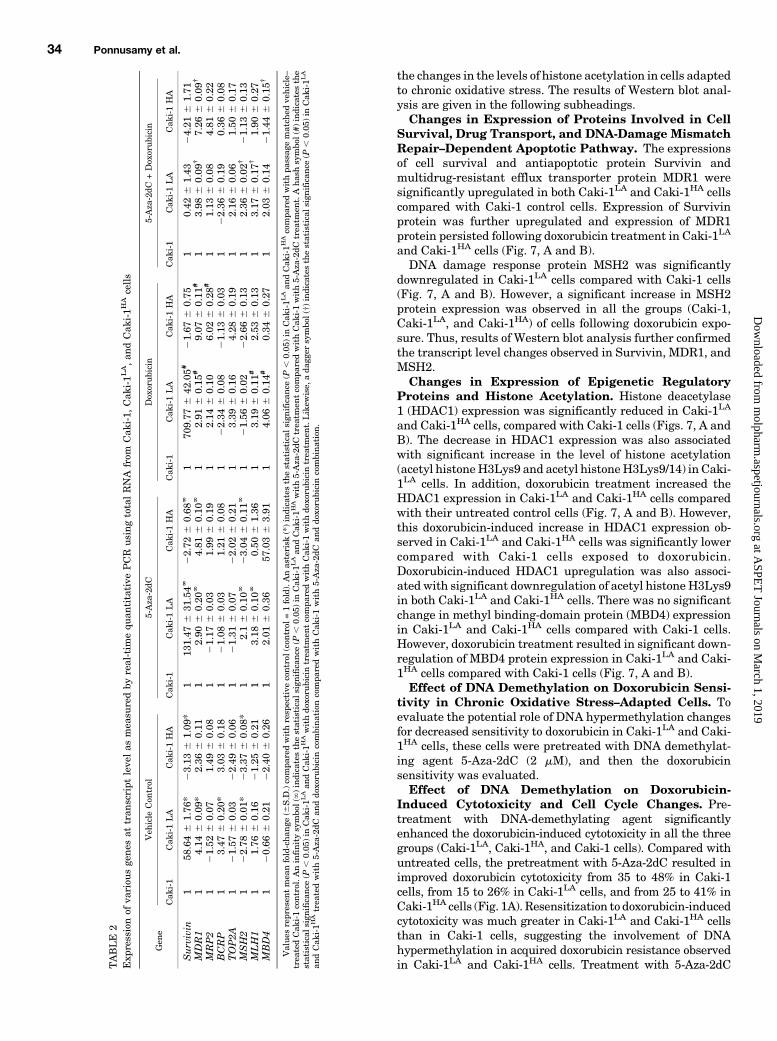
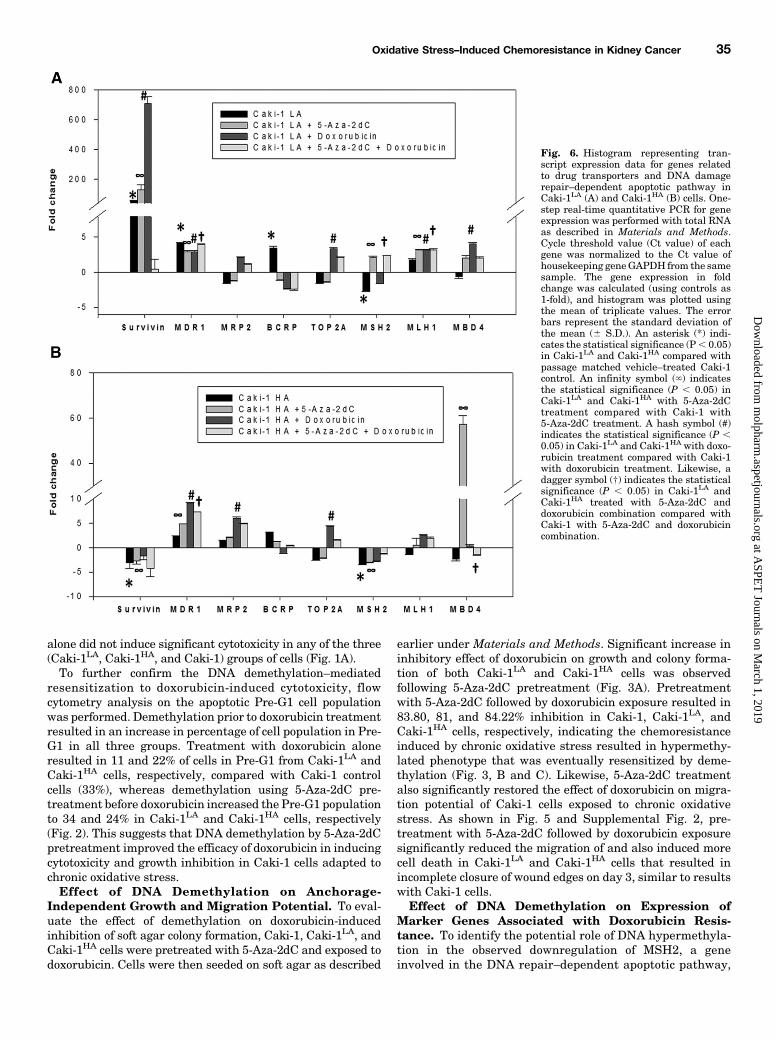
Drug Transport and Doxorubicin-Sensitive TOP2A.The representative genes of drug transporters, such asMDR1 (ABCB1), MRP2 (ABCC2), BCRP (ABCG2), as well asTOP2A, a well known target gene for doxorubicin, wereanalyzed at transcript level and results are summarized inTable 2. The comparison of gene expression data from Caki-1LA, Caki-1HA, andCaki-1 cells revealed thatMDR1 expressionwas upregulated by 4- and 2.4-fold in Caki-1LA and Caki-1HA
cells, respectively, compared with Caki-1 cells (Fig. 6, A andB). Likewise, the expression of BCRP was also upregulatedby 3.5- and 3.0-fold in Caki-1LA and Caki-1HA cells, re-spectively, compared with Caki-1 cells. There was no
Fig. 3. Representative images (40�magnification) showing soft agar–grown colonies observed under amicroscope on day 14 after seeding (A), histogramrepresentation of numbers of colonies (B), and colony size (C) from Caki-1, Caki-1LA, and Caki-1HA cells treated with doxorubicin and 5-Aza-2dC, eitheralone or both combined. Histogram depicts the percentage-of-colonies count compared with untreated Caki-1 control cells. Histogram for colony sizes isplotted using values in arbitrary units. Treatment of cells and soft agar assay were performed as described in Materials and Methods. Statisticallysignificant (P, 0.05) difference in colony numbers fromCaki-1LA andCaki-1HA cells comparedwith Caki-1 cells in vehicle only–treated group is indicatedby an asterisk (*). Infinity symbol (‘) indicates the statistical significance (P, 0.05) in cells treated with either 5-Aza-2dC or doxorubicin alone comparedwith their corresponding vehicle-treated control cells. Hash symbol (#) denotes the statistical significance (P, 0.05) in cells treated with a 5-Aza-2dC anddoxorubicin combination compared with respective cells treated with doxorubicin alone.
32 Ponnusamy et al.
at ASPE
T Journals on M
arch 1, 2019m
olpharm.aspetjournals.org
Dow
nloaded from
significant change in the expression ofMRP2 in Caki-1LA andCaki-1HA cells compared with Caki-1 cells. Although theTOP2A expression was decreased in Caki-1LA and Caki-1HA
cells compared with Caki-1 cells, these changes were statisti-cally insignificant.The comparison of gene expression data from Caki-1LA,
Caki-1HA, and Caki-1 cells after doxorubicin treatmentrevealed increased expression of MDR1, MRP2, and TOP2Agene transcripts by 3.0-, 2.0-, and 3.4-fold, respectively, inCaki-1LA cells (Fig. 6A), whereas gene expression increased9.0-, 6.0-, 4.3-fold, respectively, in Caki-1HA cells comparedwith Caki-1 cells (Fig. 6B). Therefore, these upregulations ofdrug transporters and TOP2A, a mediator of doxorubicin-induced cytotoxicity in both Caki-1LA and Caki-1HA cells,further confirmed the mechanistic basis for the decreasedsensitivity to doxorubicin in cells adapted to chronic oxidativestress.Changes in Expression of Genes Involved in Cell
Survival and DNA Mismatch Repair–Dependent Apo-ptotic Pathway. Survivinwas used as a representative geneto evaluate the cell survival and apoptotic response to chronicoxidative stress in Caki-1 cells. A statistically significantincrease in expression of Survivin by 58.64-fold was observedin Caki-1LA cells, compared with Caki-1 cells (Fig. 6A).Following doxorubicin treatment, Caki-1LA cells expressed afurther increase in survivin expression level by 709.77-fold
compared with Caki-1 cells, indicating increased survival andantiapoptotic response against doxorubicin-induced cytotox-icity. However, there were no significant changes in expres-sion level of Survivin in Caki-1HA cells.The representative genes involved in DNA damage re-
sponse like MSH2, MLH1, and MBD4 were analyzed attranscript level. A significant downregulation of MSH2 ex-pression by 2.78- and 3.4-fold was observed in Caki-1LA andCaki-1HA cells, respectively, compared with Caki-1 cells(Table 2; Fig. 6, A and B). Doxorubicin treatment also resultedin reduced MSH2 expression by 1.6- and 2.7-fold in Caki-1LA
and Caki-1HA cells, respectively, compared with Caki-1 cellstreated with doxorubicin. In contrast, increase in the MLH1expression by 1.76-fold was observed only in Caki-1LA cells,compared with Caki-1 cells. Following doxorubicin treatment,further increase in MLH1 expression by 3.18-fold was ob-served in Caki-1LA cells (Fig. 6A). There was no significantchange in the expression ofMBD4 in both Caki-1LA and Caki-1HA cells, compared with Caki-1 cells. However, doxorubicintreatment significantly increased MBD4 expression by 4.1-fold in Caki-1LA cells, compared with doxorubicin exposedCaki-1 cells.Western Blot Analysis for Gene Expression Changes
at Protein Level and Histone Modifications. Westernblot analysis was performed to further confirm the geneexpression changes at protein level as well as to determine
Fig. 5. Representative photomicrographs(40� magnifications) of wound healingassay showing effect of treatment with5-Aza-2dC alone (left panel) and in combi-nation with doxorubicin (right panel) on cellmigration of Caki-1, Caki-1LA, and Caki-1HA
cells. Wound healing scratch assay wasperformed as described in Materials andMethods, and migration of cells intowounded area was observed microscopicallyat different time points (days 0, 1, and 3).
Fig. 4. Representative photomicrographs(40� magnification) of wound healingassay showing effects of chronic oxidativestress on migration potential of Caki-1LA
and Caki-1HA cells compared with Caki-1cells without (left panel) and with doxoru-bicin treatment (right panel). Wound heal-ing scratch assay was performed asdescribed in Materials and Methods. Mi-gration of cells into wounded area wasobserved microscopically at different timepoints (days 0, 1, and 3).
Oxidative Stress–Induced Chemoresistance in Kidney Cancer 33
at ASPE
T Journals on M
arch 1, 2019m
olpharm.aspetjournals.org
Dow
nloaded from
the changes in the levels of histone acetylation in cells adaptedto chronic oxidative stress. The results of Western blot anal-ysis are given in the following subheadings.Changes in Expression of Proteins Involved in Cell
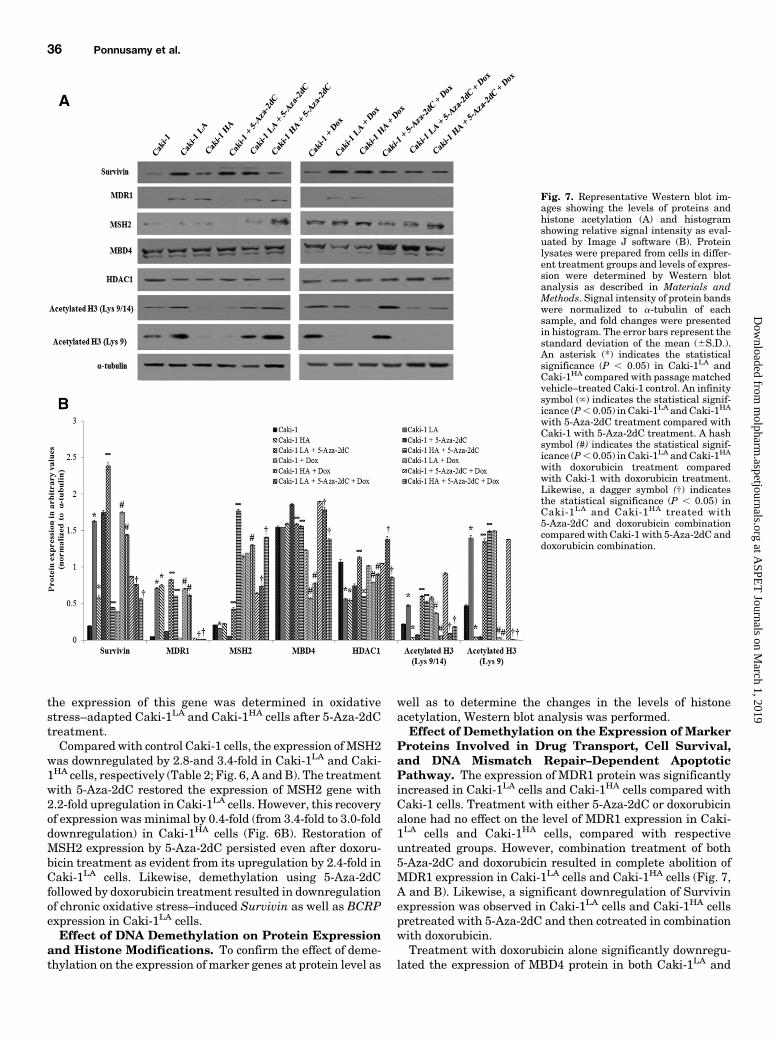
Survival, Drug Transport, and DNA-Damage MismatchRepair–Dependent Apoptotic Pathway. The expressionsof cell survival and antiapoptotic protein Survivin andmultidrug-resistant efflux transporter protein MDR1 weresignificantly upregulated in both Caki-1LA and Caki-1HA cellscompared with Caki-1 control cells. Expression of Survivinprotein was further upregulated and expression of MDR1protein persisted following doxorubicin treatment in Caki-1LA
and Caki-1HA cells (Fig. 7, A and B).DNA damage response protein MSH2 was significantly
downregulated in Caki-1LA cells compared with Caki-1 cells(Fig. 7, A and B). However, a significant increase in MSH2protein expression was observed in all the groups (Caki-1,Caki-1LA, and Caki-1HA) of cells following doxorubicin expo-sure. Thus, results of Western blot analysis further confirmedthe transcript level changes observed in Survivin, MDR1, andMSH2.Changes in Expression of Epigenetic Regulatory
Proteins and Histone Acetylation. Histone deacetylase1 (HDAC1) expression was significantly reduced in Caki-1LA
and Caki-1HA cells, compared with Caki-1 cells (Figs. 7, A andB). The decrease in HDAC1 expression was also associatedwith significant increase in the level of histone acetylation(acetyl histoneH3Lys9 and acetyl histoneH3Lys9/14) in Caki-1LA cells. In addition, doxorubicin treatment increased theHDAC1 expression in Caki-1LA and Caki-1HA cells comparedwith their untreated control cells (Fig. 7, A and B). However,this doxorubicin-induced increase in HDAC1 expression ob-served in Caki-1LA and Caki-1HA cells was significantly lowercompared with Caki-1 cells exposed to doxorubicin.Doxorubicin-induced HDAC1 upregulation was also associ-ated with significant downregulation of acetyl histone H3Lys9in both Caki-1LA and Caki-1HA cells. There was no significantchange in methyl binding-domain protein (MBD4) expressionin Caki-1LA and Caki-1HA cells compared with Caki-1 cells.However, doxorubicin treatment resulted in significant down-regulation of MBD4 protein expression in Caki-1LA and Caki-1HA cells compared with Caki-1 cells (Fig. 7, A and B).Effect of DNA Demethylation on Doxorubicin Sensi-
tivity in Chronic Oxidative Stress–Adapted Cells. Toevaluate the potential role of DNA hypermethylation changesfor decreased sensitivity to doxorubicin in Caki-1LA and Caki-1HA cells, these cells were pretreated with DNA demethylat-ing agent 5-Aza-2dC (2 mM), and then the doxorubicinsensitivity was evaluated.Effect of DNA Demethylation on Doxorubicin-
Induced Cytotoxicity and Cell Cycle Changes. Pre-treatment with DNA-demethylating agent significantlyenhanced the doxorubicin-induced cytotoxicity in all the threegroups (Caki-1LA, Caki-1HA, and Caki-1 cells). Compared withuntreated cells, the pretreatment with 5-Aza-2dC resulted inimproved doxorubicin cytotoxicity from 35 to 48% in Caki-1cells, from 15 to 26% in Caki-1LA cells, and from 25 to 41% inCaki-1HA cells (Fig. 1A). Resensitization to doxorubicin-inducedcytotoxicity was much greater in Caki-1LA and Caki-1HA cellsthan in Caki-1 cells, suggesting the involvement of DNAhypermethylation in acquired doxorubicin resistance observedin Caki-1LA and Caki-1HA cells. Treatment with 5-Aza-2dCT
ABLE
2Exp
ressionof
variou
sge
nes
attran
script
leve
las
mea
suredby
real-tim
equ
antitative
PCR
usingtotalRNA
from
Cak
i-1,
Cak
i-1L
A,an
dCak
i-1H
Acells
Gen
eVeh
icle
Con
trol
5-Aza
-2dC
Dox
orubicin
5-Aza
-2dC
+Dox
orubicin
Cak
i-1
Cak
i-1LA
Cak
i-1HA
Cak
i-1
Cak
i-1LA
Cak
i-1HA
Cak
i-1
Cak
i-1LA
Cak
i-1HA
Cak
i-1
Cak
i-1LA
Cak
i-1HA
Survivin
158
.646
1.76
*23.13
61.09
*1
131.47
631
.54‘
22.72
60.68
‘1
709.77
642
.05#
21.67
60.75
10.42
61.43
24.21
61.71
MDR1
14.14
60.09
*2.36
60.11
12.90
60.20
‘4.81
60.10
‘1
2.91
60.15
#9.07
60.11
#1
3.98
60.09
†7.26
60.09
†
MRP2
121.52
60.07
1.49
60.08
121.17
60.03
1.99
60.19
12.14
60.10
6.02
60.28
#1
1.13
60.08
4.81
60.22
BCRP
13.47
60.20
*3.03
60.18
121.08
60.03
1.21
60.08
122.34
60.08
21.13
60.03
122.36
60.19
0.36
60.08
TOP2A
121.57
60.03
22.49
60.06
121.31
60.07
22.02
60.21
13.39
60.16
4.28
60.19
12.16
60.06
1.50
60.17
MSH2
122.78
60.01
*23.37
60.08
*1
2.16
0.10
‘23.04
60.11
‘1
21.56
60.02
22.66
60.13
12.36
60.02
†21.13
60.13
MLH1
11.76
60.16
21.25
60.21
13.18
60.10
‘0.50
61.36
13.19
60.11
#2.53
60.13
13.17
60.17
†1.90
60.27
MBD4
120.66
60.21
22.40
60.26
12.01
60.36
57.036
3.91
14.06
60.14
#0.34
60.27
12.03
60.14
21.44
60.15
†
Values
repr
esen
tmea
nfold-chan
ge(6
S.D
.)compa
redwithresp
ective
control
(con
trol
=1fold).Anas
terisk
(*)ind
icates
thestatisticals
ignificanc
e(P
,0.05
)inCak
i-1L
Aan
dCak
i-1H
Acompa
redwithpa
ssag
ematch
edve
hicle–
trea
tedCak
i-1control.A
ninfinitysymbo
l(‘)indicatesthestatisticals
ignificanc
e(P
,0.05
)in
Cak
i-1L
Aan
dCak
i-1H
Awith5-Aza
-2dC
trea
tmen
tcompa
redwithCak
i-1with5-Aza
-2dC
trea
tmen
t.Ahas
hsymbo
l(#)
indicatesthe
statisticals
ignificanc
e(P
,0.05
)inCak
i-1L
Aan
dCak
i-1H
Awithdo
xoru
bicintrea
tmen
tcompa
redwithCak
i-1withdo
xoru
bicintrea
tmen
t.Likew
ise,
ada
gger
symbo
l(†)indicatesthestatisticals
ignifican
ce(P
,0.05
)inCak
i-1L
A
andCak
i-1H
Atrea
tedwith5-Aza
-2dC
anddo
xoru
bicincombinationcompa
redwithCak
i-1with5-Aza
-2dC
anddo
xoru
bicincombination.
34 Ponnusamy et al.
at ASPE
T Journals on M
arch 1, 2019m
olpharm.aspetjournals.org
Dow
nloaded from
alone did not induce significant cytotoxicity in any of the three(Caki-1LA, Caki-1HA, and Caki-1) groups of cells (Fig. 1A).To further confirm the DNA demethylation–mediated
resensitization to doxorubicin-induced cytotoxicity, flowcytometry analysis on the apoptotic Pre-G1 cell populationwas performed. Demethylation prior to doxorubicin treatmentresulted in an increase in percentage of cell population in Pre-G1 in all three groups. Treatment with doxorubicin aloneresulted in 11 and 22% of cells in Pre-G1 from Caki-1LA andCaki-1HA cells, respectively, compared with Caki-1 controlcells (33%), whereas demethylation using 5-Aza-2dC pre-treatment before doxorubicin increased the Pre-G1 populationto 34 and 24% in Caki-1LA and Caki-1HA cells, respectively(Fig. 2). This suggests that DNA demethylation by 5-Aza-2dCpretreatment improved the efficacy of doxorubicin in inducingcytotoxicity and growth inhibition in Caki-1 cells adapted tochronic oxidative stress.Effect of DNA Demethylation on Anchorage-
Independent Growth and Migration Potential. To eval-uate the effect of demethylation on doxorubicin-inducedinhibition of soft agar colony formation, Caki-1, Caki-1LA, andCaki-1HA cells were pretreated with 5-Aza-2dC and exposed todoxorubicin. Cells were then seeded on soft agar as described
earlier under Materials and Methods. Significant increase ininhibitory effect of doxorubicin on growth and colony forma-tion of both Caki-1LA and Caki-1HA cells was observedfollowing 5-Aza-2dC pretreatment (Fig. 3A). Pretreatmentwith 5-Aza-2dC followed by doxorubicin exposure resulted in83.80, 81, and 84.22% inhibition in Caki-1, Caki-1LA, andCaki-1HA cells, respectively, indicating the chemoresistanceinduced by chronic oxidative stress resulted in hypermethy-lated phenotype that was eventually resensitized by deme-thylation (Fig. 3, B and C). Likewise, 5-Aza-2dC treatmentalso significantly restored the effect of doxorubicin on migra-tion potential of Caki-1 cells exposed to chronic oxidativestress. As shown in Fig. 5 and Supplemental Fig. 2, pre-treatment with 5-Aza-2dC followed by doxorubicin exposuresignificantly reduced the migration of and also induced morecell death in Caki-1LA and Caki-1HA cells that resulted inincomplete closure of wound edges on day 3, similar to resultswith Caki-1 cells.Effect of DNA Demethylation on Expression of
Marker Genes Associated with Doxorubicin Resis-tance. To identify the potential role of DNA hypermethyla-tion in the observed downregulation of MSH2, a geneinvolved in the DNA repair–dependent apoptotic pathway,
Fig. 6. Histogram representing tran-script expression data for genes relatedto drug transporters and DNA damagerepair–dependent apoptotic pathway inCaki-1LA (A) and Caki-1HA (B) cells. One-step real-time quantitative PCR for geneexpression was performed with total RNAas described in Materials and Methods.Cycle threshold value (Ct value) of eachgene was normalized to the Ct value ofhousekeeping geneGAPDH from the samesample. The gene expression in foldchange was calculated (using controls as1-fold), and histogram was plotted usingthe mean of triplicate values. The errorbars represent the standard deviation ofthe mean (6 S.D.). An asterisk (*) indi-cates the statistical significance (P, 0.05)in Caki-1LA and Caki-1HA compared withpassage matched vehicle–treated Caki-1control. An infinity symbol (‘) indicatesthe statistical significance (P , 0.05) inCaki-1LA and Caki-1HA with 5-Aza-2dCtreatment compared with Caki-1 with5-Aza-2dC treatment. A hash symbol (#)indicates the statistical significance (P ,0.05) in Caki-1LA and Caki-1HA with doxo-rubicin treatment compared with Caki-1with doxorubicin treatment. Likewise, adagger symbol (†) indicates the statisticalsignificance (P , 0.05) in Caki-1LA andCaki-1HA treated with 5-Aza-2dC anddoxorubicin combination compared withCaki-1 with 5-Aza-2dC and doxorubicincombination.
Oxidative Stress–Induced Chemoresistance in Kidney Cancer 35
at ASPE
T Journals on M
arch 1, 2019m
olpharm.aspetjournals.org
Dow
nloaded from
the expression of this gene was determined in oxidativestress–adapted Caki-1LA and Caki-1HA cells after 5-Aza-2dCtreatment.Comparedwith control Caki-1 cells, the expression ofMSH2
was downregulated by 2.8-and 3.4-fold in Caki-1LA and Caki-1HA cells, respectively (Table 2; Fig. 6, A andB). The treatmentwith 5-Aza-2dC restored the expression of MSH2 gene with2.2-fold upregulation in Caki-1LA cells. However, this recoveryof expression was minimal by 0.4-fold (from 3.4-fold to 3.0-folddownregulation) in Caki-1HA cells (Fig. 6B). Restoration ofMSH2 expression by 5-Aza-2dC persisted even after doxoru-bicin treatment as evident from its upregulation by 2.4-fold inCaki-1LA cells. Likewise, demethylation using 5-Aza-2dCfollowed by doxorubicin treatment resulted in downregulationof chronic oxidative stress–induced Survivin as well as BCRPexpression in Caki-1LA cells.Effect of DNA Demethylation on Protein Expression
and Histone Modifications. To confirm the effect of deme-thylation on the expression of marker genes at protein level as
well as to determine the changes in the levels of histoneacetylation, Western blot analysis was performed.Effect of Demethylation on the Expression of Marker
Proteins Involved in Drug Transport, Cell Survival,and DNA Mismatch Repair–Dependent ApoptoticPathway. The expression of MDR1 protein was significantlyincreased in Caki-1LA cells and Caki-1HA cells compared withCaki-1 cells. Treatment with either 5-Aza-2dC or doxorubicinalone had no effect on the level of MDR1 expression in Caki-1LA cells and Caki-1HA cells, compared with respectiveuntreated groups. However, combination treatment of both5-Aza-2dC and doxorubicin resulted in complete abolition ofMDR1 expression in Caki-1LA cells and Caki-1HA cells (Fig. 7,A and B). Likewise, a significant downregulation of Survivinexpression was observed in Caki-1LA cells and Caki-1HA cellspretreated with 5-Aza-2dC and then cotreated in combinationwith doxorubicin.Treatment with doxorubicin alone significantly downregu-
lated the expression of MBD4 protein in both Caki-1LA and
Fig. 7. Representative Western blot im-ages showing the levels of proteins andhistone acetylation (A) and histogramshowing relative signal intensity as eval-uated by Image J software (B). Proteinlysates were prepared from cells in differ-ent treatment groups and levels of expres-sion were determined by Western blotanalysis as described in Materials andMethods. Signal intensity of protein bandswere normalized to a-tubulin of eachsample, and fold changes were presentedin histogram. The error bars represent thestandard deviation of the mean (6S.D.).An asterisk (*) indicates the statisticalsignificance (P , 0.05) in Caki-1LA andCaki-1HA compared with passagematchedvehicle–treated Caki-1 control. An infinitysymbol (‘) indicates the statistical signif-icance (P, 0.05) inCaki-1LA andCaki-1HA
with 5-Aza-2dC treatment compared withCaki-1 with 5-Aza-2dC treatment. A hashsymbol (#) indicates the statistical signif-icance (P, 0.05) inCaki-1LA andCaki-1HA
with doxorubicin treatment comparedwith Caki-1 with doxorubicin treatment.Likewise, a dagger symbol (†) indicatesthe statistical significance (P , 0.05) inCaki-1LA and Caki-1HA treated with5-Aza-2dC and doxorubicin combinationcomparedwith Caki-1 with 5-Aza-2dC anddoxorubicin combination.
36 Ponnusamy et al.
at ASPE
T Journals on M
arch 1, 2019m
olpharm.aspetjournals.org
Dow
nloaded from
Caki-1HA cells. Interestingly, this decrease in MBD4 expres-sion by doxorubicin-alone treatment was restored when thesecells were first pretreatedwith 5-Aza-2dC and subsequently incombination with doxorubicin (Fig. 7, A and B).The expression of MSH2, a MMR-related protein that also
plays a role in MMR-dependent apoptosis, was significantlydownregulated in Caki-1LA cells, compared with Caki-1 cells.Treatment with demethylating agent 5-Aza-2dC alone signif-icantly restored the MSH2 expression in Caki-1LA cells (Fig.7A). This suggests that development of doxorubicin resistanceand loss of apoptotic potential in Caki-1LA cells could poten-tially result from DNA hypermethylation–mediated loss ofMSH2 expression.Effect of DNA Demethylation on Epigenetic
Regulatory-Protein Expression and Histone Acetyla-tion. A significant decrease in HDAC1 expression was ob-served in Caki-1LA and Caki-1HA cells compared with theircontrol Caki-1 cells. This decrease in HDAC1 expression waspartially restored by treatment with 5-Aza-2dC alone as wellas with a combination of both 5-Aza-2dC and doxorubicin inCaki-1LA cells (Fig. 7, A and B).Likewise, a significant increase in histone H3 lysine
acetylation (H3K9 and H3K9/14) was observed in Caki-1LA
cells. However, these increases in H3 acetylation were re-versed when Caki-1LA cells were first pretreated with 5-Aza-2dC and subsequently with doxorubicin treatment (Fig. 7A).Treatment with 5-Aza-2dC alone did not significantly alteracetylation levels of H3 in Caki-1LA cells.Chronic Oxidative Stress–Induced Hypermethyla-
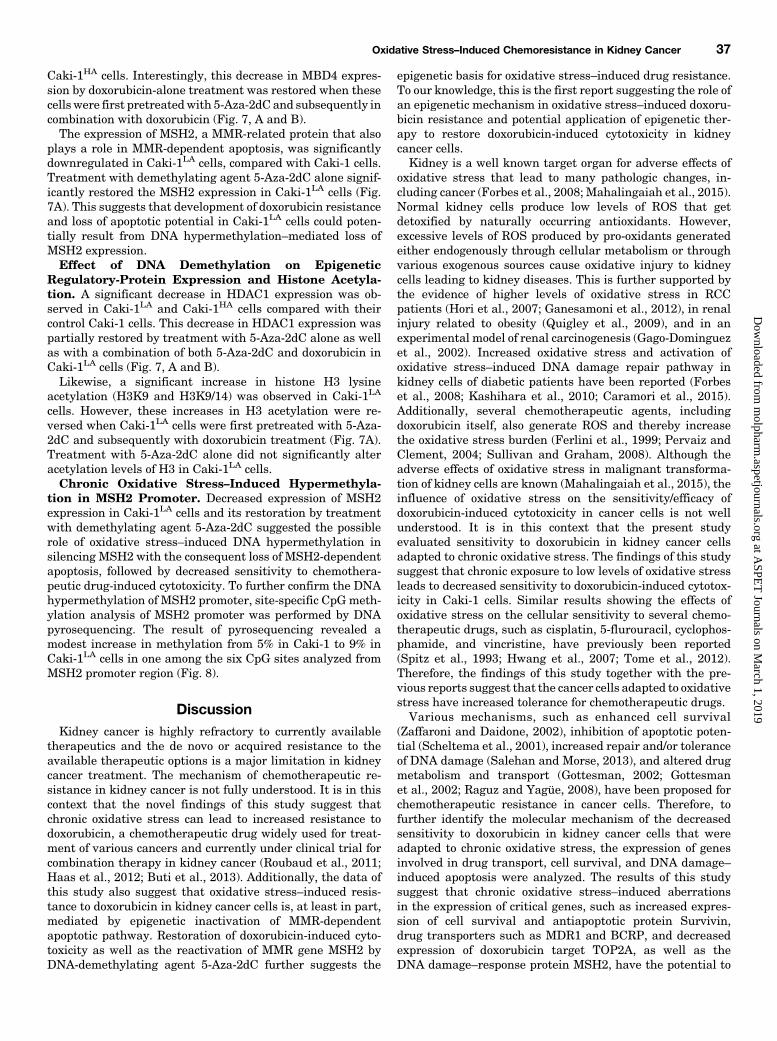
tion in MSH2 Promoter. Decreased expression of MSH2expression in Caki-1LA cells and its restoration by treatmentwith demethylating agent 5-Aza-2dC suggested the possiblerole of oxidative stress–induced DNA hypermethylation insilencing MSH2 with the consequent loss of MSH2-dependentapoptosis, followed by decreased sensitivity to chemothera-peutic drug-induced cytotoxicity. To further confirm the DNAhypermethylation of MSH2 promoter, site-specific CpG meth-ylation analysis of MSH2 promoter was performed by DNApyrosequencing. The result of pyrosequencing revealed amodest increase in methylation from 5% in Caki-1 to 9% inCaki-1LA cells in one among the six CpG sites analyzed fromMSH2 promoter region (Fig. 8).
DiscussionKidney cancer is highly refractory to currently available
therapeutics and the de novo or acquired resistance to theavailable therapeutic options is a major limitation in kidneycancer treatment. The mechanism of chemotherapeutic re-sistance in kidney cancer is not fully understood. It is in thiscontext that the novel findings of this study suggest thatchronic oxidative stress can lead to increased resistance todoxorubicin, a chemotherapeutic drug widely used for treat-ment of various cancers and currently under clinical trial forcombination therapy in kidney cancer (Roubaud et al., 2011;Haas et al., 2012; Buti et al., 2013). Additionally, the data ofthis study also suggest that oxidative stress–induced resis-tance to doxorubicin in kidney cancer cells is, at least in part,mediated by epigenetic inactivation of MMR-dependentapoptotic pathway. Restoration of doxorubicin-induced cyto-toxicity as well as the reactivation of MMR gene MSH2 byDNA-demethylating agent 5-Aza-2dC further suggests the
epigenetic basis for oxidative stress–induced drug resistance.To our knowledge, this is the first report suggesting the role ofan epigenetic mechanism in oxidative stress–induced doxoru-bicin resistance and potential application of epigenetic ther-apy to restore doxorubicin-induced cytotoxicity in kidneycancer cells.Kidney is a well known target organ for adverse effects of
oxidative stress that lead to many pathologic changes, in-cluding cancer (Forbes et al., 2008; Mahalingaiah et al., 2015).Normal kidney cells produce low levels of ROS that getdetoxified by naturally occurring antioxidants. However,excessive levels of ROS produced by pro-oxidants generatedeither endogenously through cellular metabolism or throughvarious exogenous sources cause oxidative injury to kidneycells leading to kidney diseases. This is further supported bythe evidence of higher levels of oxidative stress in RCCpatients (Hori et al., 2007; Ganesamoni et al., 2012), in renalinjury related to obesity (Quigley et al., 2009), and in anexperimental model of renal carcinogenesis (Gago-Dominguezet al., 2002). Increased oxidative stress and activation ofoxidative stress–induced DNA damage repair pathway inkidney cells of diabetic patients have been reported (Forbeset al., 2008; Kashihara et al., 2010; Caramori et al., 2015).Additionally, several chemotherapeutic agents, includingdoxorubicin itself, also generate ROS and thereby increasethe oxidative stress burden (Ferlini et al., 1999; Pervaiz andClement, 2004; Sullivan and Graham, 2008). Although theadverse effects of oxidative stress in malignant transforma-tion of kidney cells are known (Mahalingaiah et al., 2015), theinfluence of oxidative stress on the sensitivity/efficacy ofdoxorubicin-induced cytotoxicity in cancer cells is not wellunderstood. It is in this context that the present studyevaluated sensitivity to doxorubicin in kidney cancer cellsadapted to chronic oxidative stress. The findings of this studysuggest that chronic exposure to low levels of oxidative stressleads to decreased sensitivity to doxorubicin-induced cytotox-icity in Caki-1 cells. Similar results showing the effects ofoxidative stress on the cellular sensitivity to several chemo-therapeutic drugs, such as cisplatin, 5-flurouracil, cyclophos-phamide, and vincristine, have previously been reported(Spitz et al., 1993; Hwang et al., 2007; Tome et al., 2012).Therefore, the findings of this study together with the pre-vious reports suggest that the cancer cells adapted to oxidativestress have increased tolerance for chemotherapeutic drugs.Various mechanisms, such as enhanced cell survival
(Zaffaroni and Daidone, 2002), inhibition of apoptotic poten-tial (Scheltema et al., 2001), increased repair and/or toleranceof DNA damage (Salehan and Morse, 2013), and altered drugmetabolism and transport (Gottesman, 2002; Gottesmanet al., 2002; Raguz and Yagüe, 2008), have been proposed forchemotherapeutic resistance in cancer cells. Therefore, tofurther identify the molecular mechanism of the decreasedsensitivity to doxorubicin in kidney cancer cells that wereadapted to chronic oxidative stress, the expression of genesinvolved in drug transport, cell survival, and DNA damage–induced apoptosis were analyzed. The results of this studysuggest that chronic oxidative stress–induced aberrationsin the expression of critical genes, such as increased expres-sion of cell survival and antiapoptotic protein Survivin,drug transporters such as MDR1 and BCRP, and decreasedexpression of doxorubicin target TOP2A, as well as theDNA damage–response protein MSH2, have the potential to
Oxidative Stress–Induced Chemoresistance in Kidney Cancer 37
at ASPE
T Journals on M
arch 1, 2019m
olpharm.aspetjournals.org
Dow
nloaded from
contribute in decrease sensitivity to doxorubicin in kidneycancer cells. Similar findings showing reduced sensitivity tochemotherapeutic agents associated with the decreased ex-pression of TOP2A and MSH2, and increased expression ofanti-apoptotic genes, drug efflux transporter, and antioxidantgenes have been reported in various cancers (Konopleva et al.,2002; Burgess et al., 2008; Kaplan and Gunduz, 2012;AbuHammad and Zihlif, 2013).Persistent exposure to ROS (chronic oxidative stress)
renders cancer cells physiologically adapted to ROS, thusfacilitating increased survival (Mahalingaiah and Singh,2014) through upregulation of Survivin, which abolishes theG2/M checkpoint and allows cells to progress through mitosis(Li et al., 1998). Owing to its antiapoptotic function, Survivininhibits radiotherapy- and chemotherapy-induced cell death,thus resulting in tumor progression and drug resistance(Zaffaroni and Daidone, 2002; Schlette et al., 2004; Rödelet al., 2005; Fuessel et al., 2006). These previous reports andpresent findings suggest that cancer cells adapted to amicroenvironment of oxidative stress can develop intrinsicresistance to chemotherapeutic drugs, possibly through alter-ations in genes involved in cell survival and drug transport.Additionally, the data of this study from cell cycle analysisrevealed that comparedwith control Caki-1 cells, the Caki-1LA
cells with low-dose chronic oxidative stress exposure not onlyhad increased S-phase population but also had decreasedapoptotic Pre-G1 population. It is well documented that ROS-induced cellular effects depend on the concentration andduration of exposure (Valko et al., 2006; Okoh et al., 2013).
In contrast to high-dose ROS-induced apoptosis, the low-doseROS acts as a mitogenic signaling molecule (Felty et al., 2005)and this could be the explanation for the observed increase inS-phase population in Caki-1LA cells along with the decrease inapoptotic Pre-G1 population. Therefore, the acquisition ofincreased proliferative potential resulting from low-dose oxi-dative stress could also be a factor contributing to decreasedsensitivity to doxorubicin and cisplatin in Caki-1LA cells.Loss of apoptotic potential is another mechanism for the
drug resistance and MMR-mediated apoptosis, which is animportant pathway among the various mechanisms for apo-ptosis. Several genes involved in the MMR pathway have dualroles in apoptosis as well as DNA repair. For example,mismatch repair protein MSH2 is involved in DNA damage–induced apoptosis by recruiting ataxia telangiectasia- andRad3-related protein (ATR) to DNA damage sites for itsactivities in apoptosis (Pabla et al., 2011). Experimentalevidence from MSH2-deficient mice also suggest that theMMR system has dual functions of avoiding mutagenesis andinducing apoptosis to inhibit oxidative stress–induced tumor-igenesis (Piao et al., 2013). The data of this study revealed thatchronic oxidative stress causes loss of MSH2 expression inkidney cancer cells and, interestingly, these cells were alsoresistant to doxorubicin-induced cytotoxicity. Furthermore,the data from this study supports the necessity of the MMRsystem not only for repair of oxidative DNA damage but alsofor DNA-damage-dependent apoptotic signaling. Additionally,an increased tolerance to doxorubicin-induced cytotoxicity incells with decreased expression of MSH2 during adaption to
Fig. 8. Representative pyrogram of MSH2 promoter sequence from Caki-1 (upper panel) and Caki-1 LA (lower panel) cells. Pyrosequencing wasperformed as described inMaterials andMethods. The sequence analyzed and dispensation orders of nucleotides are given at the top and bottom (x-axis)of the pyrograms respectively. Percentage methylation of each CpG site within the analyzed sequence is indicated above the corresponding sites.
38 Ponnusamy et al.
at ASPE
T Journals on M
arch 1, 2019m
olpharm.aspetjournals.org
Dow
nloaded from
oxidative stress was observed in this study. In line with thisfinding, a recent study also suggests that treatment of MSH2-deficient cells with cisplatin, a chemotherapeutic agent, didnot activate the ATR pathway and downstream signaling forDNA damage response and apoptosis (Pabla et al., 2011). Lossof MMR pathway in developing apoptotic resistance against avariety of chemotherapeutic and methylating agents has beenreported (Fink et al., 1998; Stojic et al., 2004; O’Brien andBrown, 2006; Hewish et al., 2010; Guillotin andMartin, 2014).Cisplatin is another class of chemotherapeutic drug, and lossof MMR has also been known to reduce the sensitivity tocisplatin-induced cytotoxicity (Drummond et al., 1996). There-fore, in this study, to further confirm the loss of MMR as acausal factor of reduced sensitivity to chemotherapeutic drug,Caki-1LA cells were also treated with cisplatin. Interestingly,the result of reduced sensitivity to cisplatin in Caki-1LA cellsprovided additional evidence for the loss of MMR as a causalfactor of reduced sensitivity to chemotherapeutic drug inCaki-1LA cells. Therefore, these previous reports and thefindings of this study together suggest that the MMR systemis needed for chemotherapeutic drug–induced DNA damageresponse and apoptosis.The next logical question that we answered in this study
was, “How does the oxidative stress alter genes that conferincreased resistance to cell death, as well as the increasedresistance to doxorubicin-induced cytotoxicity?” Though thegenetic mechanism is well established for regulation of geneexpression, recent study overwhelmingly implicates epige-netic mechanisms in gene-expression changes (Dawson andKouzarides, 2012). Therefore to further understand the role ofepigeneticmechanisms in decreased expression ofMMRgenesin oxidative stress–adapted kidney cancer cells and conse-quently the inactivation of MMR-dependent apoptotic poten-tial, the cells were first pretreated with DNA-demethylatingagent 5-Aza-2dC and then cotreated with doxorubicin. Theresult of this study revealed that 5-Aza-2dC treatment re-stored not only the expression of MMR genes but also thesensitivity to doxorubicin-induced cytotoxicity in kidney can-cer cells. This suggests that oxidative stress causes DNAhypermethylation–mediated silencing of MMR genes, whichultimately contributes to the loss of MMR-dependent apopto-tic potential and leads to resistance to doxorubicin cytotoxic-ity. The result of pyrosequencing analysis further confirmedDNA hypermethylation of one among six CpG sites fromMSH2 promoter region in Caki-1LA cells compared withCaki-1. Since we evaluated only a small part of the MSH2promoter region, hypermethylation of more CpG sites fromremaining regions of MSH2 promoter cannot be ruled out. Inaddition, it is also possible that decreased MSH2 observed inour studymay be a result of DNAhypermethylation–mediatedsilencing of transcription factors that regulate MSH2 expres-sion. Further studies are needed to investigate these addi-tional causes for decreased expression of MSH2 in cellsexposed to chronic oxidative stress.Previous studies have shown that genome-wide demethyla-
tion resensitizes the tumor cells, such as lung cancer cells(Gomyo et al., 2004), melanoma cells (Kaminski et al., 2004),and breast cancer cells (Hurtubise and Momparler, 2004), tothe cytotoxic effects of chemotherapeutics (Missiaglia et al.,2005). DNA-demethylating agent 5-Aza-2dC has shown addi-tive effect with doxorubicin, as well as synergistic effect withpaclitaxel, in various cancer cells, including Caki-1 kidney
cancer cells (Shang et al., 2007). However, the target genes fordemethylation and their involvement, as well as the mecha-nistic basis for demethylation-mediated resensitization tochemotherapy, were not clear in these previous reports.Therefore, the present study has not only confirmed thatdemethylation sensitizes cancer cells to chemotherapy but hasalso provided a mechanistic basis for resensitization to chemo-therapy through reactivation of MMR- mediated apoptosis.The data of Western blot analysis in this study revealed
downregulation of HDAC1 and increase in the level of histone3 acetylation (acetyl H3Lys9 and acetyl H3Lys9/14) in cellsadapted to chronic oxidative stress. The gene expression dataalso revealed 4- and 2.4-fold increases in the expression ofdrug transporter MDR1 gene in Caki-1LA and Caki-1HA cells,respectively. Likewise, a previous report showed increasedexpression of MDR1, and increased levels of lysine 9-acetylatedhistone H3, both globally at genome-wide as well as locally atthe promoter of MDR1 in doxorubicin-resistant MCF-7 breastcancer cells (Toth et al., 2012). Therefore, on the basis of thisprevious report and the finding of this study, it is logical toconclude that chronic oxidative stress–induced aberrations inhistone acetylation also play an important role in acquisitionof resistance to doxorubicin in cells adapted to oxidativestress.In summary, the findings of this study for the first time
revealed that kidney cancer cells adapted to chronic oxidativestress can develop chemotherapeutic resistance, at least inpart, through the epigenetic inactivation of MMR-dependentapoptotic potential and through increased expression of drugtransporter MDR1, which may cause increased drug efflux.
Authorship Contributions
Participated in research design: Ponnusamy, Mahalingaiah, Singh.Conducted experiments: Ponnusamy, Mahalingaiah.Performed data analysis: Ponnusamy, Mahalingaiah, Singh.Contributed new reagents or analytic tools: Singh.Wrote or contributed to the writing of the manuscript: Ponnusamy,
Mahalingaiah, Singh.
References
AbuHammad S and Zihlif M (2013) Gene expression alterations in doxorubicin re-sistant MCF7 breast cancer cell line. Genomics 101:213–220.
Araújo WF, Naves MA, Ravanini JN, Schor N, and Teixeira VP (2015) Renin-angiotensin system (RAS) blockade attenuates growth and metastatic potential ofrenal cell carcinoma in mice. Urol Oncol 33:389.e1–389.e7.
Burgess DJ, Doles J, Zender L, Xue W, Ma B, McCombie WR, Hannon GJ, Lowe SW,and Hemann MT (2008) Topoisomerase levels determine chemotherapy responsein vitro and in vivo. Proc Natl Acad Sci USA 105:9053–9058.
Buti S, Bersanelli M, Sikokis A, Maines F, Facchinetti F, Bria E, Ardizzoni A, TortoraG, and Massari F (2013) Chemotherapy in metastatic renal cell carcinoma today? Asystematic review. Anticancer Drugs 24:535–554.
Caramori ML, Kim Y, Goldfine AB, Moore JH, Rich SS, Mychaleckyj JC, KirkpatrickD, Nickerson H, Krolewski AS, and Mauer M (2015) Differential Gene Expressionin Diabetic Nephropathy in Individuals With Type 1 Diabetes. J Clin EndocrinolMetab 100:E876–E882.
DawsonMA and Kouzarides T (2012) Cancer epigenetics:frommechanism to therapy.Cell 150:12–27.
Drummond JT, Anthoney A, Brown R, and Modrich P (1996) Cisplatin and adria-mycin resistance are associated with MutLalpha and mismatch repair deficiency inan ovarian tumor cell line. J Biol Chem 271:19645–19648.
Felty Q, Xiong WC, Sun D, Sarkar S, Singh KP, Parkash J, and Roy D (2005)Estrogen-induced mitochondrial reactive oxygen species as signal-transducingmessengers. Biochemistry 44:6900–6909.
Ferlini C, Scambia G, Marone M, Distefano M, Gaggini C, Ferrandina G, FattorossiA, Isola G, Benedetti Panici P, and Mancuso S (1999) Tamoxifen induces oxidativestress and apoptosis in oestrogen receptor-negative human cancer cell lines. Br JCancer 79:257–263.
Fink D, Aebi S, and Howell SB (1998) The role of DNA mismatch repair in drugresistance. Clin Cancer Res 4:1–6.
Forbes JM, Coughlan MT, and Cooper ME (2008) Oxidative stress as a major culpritin kidney disease in diabetes. Diabetes 57:1446–1454.
Fuessel S, Herrmann J, Ning S, Kotzsch M, Kraemer K, Schmidt U, Hakenberg OW,Wirth MP, and Meye A (2006) Chemosensitization of bladder cancer cells by
Oxidative Stress–Induced Chemoresistance in Kidney Cancer 39
at ASPE
T Journals on M
arch 1, 2019m
olpharm.aspetjournals.org
Dow
nloaded from
survivin-directed antisense oligodeoxynucleotides and siRNA. Cancer Lett 232:243–254.
Gago-Dominguez M, Castelao JE, Yuan JM, Ross RK, and Yu MC (2002) Lipidperoxidation: a novel and unifying concept of the etiology of renal cell carcinoma(United States). Cancer Causes Control 13:287–293.
Ganesamoni R, Bhattacharyya S, Kumar S, Chauhan A, Mete UK, Agarwal MM,Mavuduru R, Kaushik G, Mandal AK, and Singh SK (2012) Status of oxidativestress in patients with renal cell carcinoma. J Urol 187:1172–1176.
Gomyo Y, Sasaki J, Branch C, Roth JA, and Mukhopadhyay T (2004) 5-aza-29-deoxycytidine upregulates caspase-9 expression cooperating with p53-induced ap-optosis in human lung cancer cells. Oncogene 23:6779–6787.
Gottesman MM (2002) Mechanisms of cancer drug resistance. Annu Rev Med 53:615–627.
Gottesman MM, Fojo T, and Bates SE (2002) Multidrug resistance in cancer: role ofATP-dependent transporters. Nat Rev Cancer 2:48–58.
Guillotin D and Martin SA (2014) Exploiting DNA mismatch repair deficiency as atherapeutic strategy. Exp Cell Res 329:110–115.
Haas NB, Lin X, Manola J, Pins M, Liu G, McDermott D, Nanus D, Heath E, WildingG, and Dutcher J (2012) A phase II trial of doxorubicin and gemcitabine in renalcell carcinoma with sarcomatoid features: ECOG 8802. Med Oncol 29:761–767.
Hagiwara H, Sato H, Ohde Y, Takano Y, Seki T, Ariga T, Hokaiwado N, Asamoto M,Shirai T, and Nagashima Y et al. (2008) 5-Aza-29-deoxycytidine suppresses humanrenal carcinoma cell growth in a xenograft model via up-regulation of the connexin32 gene. Br J Pharmacol 153:1373–1381.
Hewish M, Lord CJ, Martin SA, Cunningham D, and Ashworth A (2010) Mismatchrepair deficient colorectal cancer in the era of personalized treatment.Nat Rev ClinOncol 7:197–208.
Ho JY, Hsu RJ, Wu CL, Chang WL, Cha TL, Yu DS, and Yu CP (2013) OvatodiolideTargets b -Catenin Signaling in Suppressing Tumorigenesis and Overcoming DrugResistance in Renal Cell Carcinoma. Evid Based Complement Alternat Med 2013:161628.
Hori Y, Oda Y, Kiyoshima K, Yamada Y, Nakashima Y, Naito S, and Tsuneyoshi M(2007) Oxidative stress and DNA hypermethylation status in renal cell carcinomaarising in patients on dialysis. J Pathol 212:218–226.
Housman G, Byler S, Heerboth S, Lapinska K, Longacre M, Snyder N, and Sarkar S(2014) Drug resistance in cancer: an overview. Cancers (Basel) 6:1769–1792.
Huang Y, Anderle P, Bussey KJ, Barbacioru C, Shankavaram U, Dai Z, Reinhold WC,Papp A, Weinstein JN, and Sadée W (2004) Membrane transporters and channels:role of the transportome in cancer chemosensitivity and chemoresistance. CancerRes 64:4294–4301.
Hueber PA, Waters P, Clark P, Eccles M, and Goodyer P (2006) PAX2 inactivationenhances cisplatin-induced apoptosis in renal carcinoma cells. Kidney Int 69:1139–1145.
Hurtubise A and Momparler RL (2004) Evaluation of antineoplastic action of 5-aza-29-deoxycytidine (Dacogen) and docetaxel (Taxotere) on human breast, lung andprostate carcinoma cell lines. Anticancer Drugs 15:161–167.
Hwang IT, Chung YM, Kim JJ, Chung JS, Kim BS, Kim HJ, Kim JS, and Yoo YD(2007) Drug resistance to 5-FU linked to reactive oxygen species modulator 1.Biochem Biophys Res Commun 359:304–310.
Igney FH and Krammer PH (2002) Death and anti-death: tumour resistance to ap-optosis. Nat Rev Cancer 2:277–288.
Indran IR, Tufo G, Pervaiz S, and Brenner C (2011) Recent advances in apoptosis,mitochondria and drug resistance in cancer cells. Biochim Biophys Acta 1807:735–745.
Iwata H, Sato H, Suzuki R, Yamada R, Ichinomiya S, Yanagihara M, Okabe H,Sekine Y, Yano T, and Ueno K (2011) A demethylating agent enhances chemo-sensitivity to vinblastine in a xenograft model of renal cell carcinoma. Int J Oncol38:1653–1661.
Kaminski R, Kozar K, Niderla J, Grzela T, Wilczynski G, Skierski JS, KoronkiewiczM, Jakobisiak M, and Golab J (2004) Demethylating agent 5-aza-29-deoxycytidineenhances expression of TNFRI and promotes TNF-mediated apoptosis in vitro andin vivo. Oncol Rep 12:509–516.
Kaplan E and Gündüz U (2012) Expression analysis of TOP2A, MSH2 and MLH1genes in MCF7 cells at different levels of etoposide resistance. Biomed Pharmac-other 66:29–35.
Kashihara N, Haruna Y, Kondeti VK, and Kanwar YS (2010) Oxidative stress indiabetic nephropathy. Curr Med Chem 17:4256–4269.
Kojima T, Shimazui T, Hinotsu S, Joraku A, Oikawa T, Kawai K, Horie R, Suzuki H,Nagashima R, and Yoshikawa K et al. (2009) Decreased expression of CXXC4promotes a malignant phenotype in renal cell carcinoma by activating Wnt sig-naling. Oncogene 28:297–305.
Konopleva M, Zhao S, Hu W, Jiang S, Snell V, Weidner D, Jackson CE, Zhang X,Champlin R, and Estey E et al. (2002) The anti-apoptotic genes Bcl-X(L) and Bcl-2are over-expressed and contribute to chemoresistance of non-proliferating leu-kaemic CD341 cells. Br J Haematol 118:521–534.
Landriscina M, Maddalena F, Laudiero G, and Esposito F (2009) Adaptation to ox-idative stress, chemoresistance, and cell survival. Antioxid Redox Signal 11:2701–2716.
Li F, Ambrosini G, Chu EY, Plescia J, Tognin S, Marchisio PC, and Altieri DC (1998)Control of apoptosis and mitotic spindle checkpoint by survivin. Nature 396:580–584.
Li G, Ci W, Karmakar S, Chen K, Dhar R, Fan Z, Guo Z, Zhang J, Ke Y, and Wang Let al. (2014a) SPOP promotes tumorigenesis by acting as a key regulatory hub inkidney cancer. Cancer Cell 25:455–468.
Li M, Wang Y, Song Y, Bu R, Yin B, Fei X, Guo Q, and Wu B (2014b) Aberrant DNAmethyltransferase 1 expression in clear cell renal cell carcinoma development andprogression. Chin J Cancer Res 26:371–381.
Livak KJ and Schmittgen TD (2001) Analysis of relative gene expression data usingreal-time quantitative PCR and the 2(-Delta Delta C(T)) Method. Methods 25:402–408.
Mahalingaiah PK, Ponnusamy L, and Singh KP (2015) Chronic oxidative stress leadsto malignant transformation along with acquisition of stem cell characteristics, andepithelial to mesenchymal transition in human renal epithelial cells. J Cell Physiol230:1916–1928.
Mahalingaiah PK and Singh KP (2014) Chronic oxidative stress increases growthand tumorigenic potential of MCF-7 breast cancer cells. PLoS One 9:e87371.
Mahalingam D, Sankhala K, Mita A, Giles FJ, and Mita MM (2009) Targetingthe mTOR pathway using deforolimus in cancer therapy. Future Oncol 5:291–303.
Missiaglia E, Donadelli M, Palmieri M, Crnogorac-Jurcevic T, Scarpa A, and LemoineNR (2005) Growth delay of human pancreatic cancer cells by methylase inhibitor5-aza-29-deoxycytidine treatment is associated with activation of the interferonsignalling pathway. Oncogene 24:199–211.
Morais C, Gobe G, Johnson DW, and Healy H (2009) Anti-angiogenic actions ofpyrrolidine dithiocarbamate, a nuclear factor kappa B inhibitor. Angiogenesis 12:365–379.
O’Brien V and Brown R (2006) Signalling cell cycle arrest and cell death through theMMR System. Carcinogenesis 27:682–692.
Okoh VO, Felty Q, Parkash J, Poppiti R, and Roy D (2013) Reactive oxygen speciesvia redox signaling to PI3K/AKT pathway contribute to the malignant growth of4-hydroxy estradiol-transformed mammary epithelial cells. PLoS One 8:e54206.
Osburn WO and Kensler TW (2008) Nrf2 signaling: an adaptive response pathway forprotection against environmental toxic insults. Mutat Res 659:31–39.
Pabla N, Ma Z, McIlhatton MA, Fishel R, and Dong Z (2011) hMSH2 recruits ATR toDNA damage sites for activation during DNA damage-induced apoptosis. J BiolChem 286:10411–10418.
Pelicano H, Carney D, and Huang P (2004) ROS stress in cancer cells and therapeuticimplications. Drug Resist Updat 7:97–110.
Pervaiz S and Clement MV (2004) Tumor intracellular redox status and drug re-sistance–serendipity or a causal relationship? Curr Pharm Des 10:1969–1977.
Piao J, Nakatsu Y, Ohno M, Taguchi K, and Tsuzuki T (2013) Mismatch repairdeficient mice show susceptibility to oxidative stress-induced intestinal carcino-genesis. Int J Biol Sci 10:73–79.
Quigley JE, Elmarakby AA, Knight SF, Manhiani MM, Stepp DW, Olearzcyk JJ,and Imig JD (2009) Obesity induced renal oxidative stress contributes to renalinjury in salt-sensitive hypertension. Clin Exp Pharmacol Physiol 36:724–728.
Raguz S and Yagüe E (2008) Resistance to chemotherapy: new treatments and novelinsights into an old problem. Br J Cancer 99:387–391.
Ricketts CJ, Morris MR, Gentle D, Shuib S, Brown M, Clarke N, Wei W, Nathan P,Latif F, and Maher ER (2013) Methylation profiling and evaluation of demethy-lating therapy in renal cell carcinoma. Clin Epigenetics 5:16.
Rödel F, Hoffmann J, Distel L, Herrmann M, Noisternig T, Papadopoulos T, Sauer R,and Rödel C (2005) Survivin as a radioresistance factor, and prognostic and ther-apeutic target for radiotherapy in rectal cancer. Cancer Res 65:4881–4887.
Roubaud G, Gross-Goupil M, Wallerand H, de Clermont H, Dilhuydy MS,and Ravaud A (2011) Combination of gemcitabine and doxorubicin in rapidlyprogressive metastatic renal cell carcinoma and/or sarcomatoid renal cell carci-noma. Oncology 80:214–218.
Salehan MR and Morse HR (2013) DNA damage repair and tolerance: a role inchemotherapeutic drug resistance. Br J Biomed Sci 70:31–40.
Sankhala K, Mita A, Kelly K, Mahalingam D, Giles F, and Mita M (2009) Theemerging safety profile of mTOR inhibitors, a novel class of anticancer agents.Target Oncol 4:135–142.
Scheltema JM, Romijn JC, van Steenbrugge GJ, Schröder FH, and Mickisch GH(2001) Inhibition of apoptotic proteins causes multidrug resistance in renal carci-noma cells. Anticancer Res 21:3161–3166.
Schlette EJ, Medeiros LJ, Goy A, Lai R, and Rassidakis GZ (2004) Survivin ex-pression predicts poorer prognosis in anaplastic large-cell lymphoma. J Clin Oncol22:1682–1688.
Shang D, Ito N, Kamoto T, and Ogawa O (2007) Demethylating agent 5-aza-29-deoxycytidine enhances susceptibility of renal cell carcinoma to paclitaxel. Urology69:1007–1012.
Singh A, Misra V, Thimmulappa RK, Lee H, Ames S, Hoque MO, Herman JG, BaylinSB, Sidransky D, and Gabrielson E et al. (2006) Dysfunctional KEAP1-NRF2 in-teraction in non-small-cell lung cancer. PLoS Med 3:e420.
Singh KP, Treas J, Tyagi T, and Gao W (2012) DNA demethylation by 5-aza-2-deoxycytidine treatment abrogates 17 beta-estradiol-induced cell growth and re-stores expression of DNA repair genes in human breast cancer cells. Cancer Lett316:62–69.
Spitz DR, Phillips JW, Adams DT, Sherman CM, Deen DF, and Li GC (1993) Cellularresistance to oxidative stress is accompanied by resistance to cisplatin: the sig-nificance of increased catalase activity and total glutathione in hydrogen peroxide-resistant fibroblasts. J Cell Physiol 156:72–79.
Stavrovskaya AA (2000) Cellular mechanisms of multidrug resistance of tumor cells.Biochemistry (Mosc) 65:95–106.
Stojic L, Brun R, and Jiricny J (2004) Mismatch repair and DNA damage signalling.DNA Repair (Amst) 3:1091–1101.
Stordal B and Davey M (2007) Understanding cisplatin resistance using cellularmodels. IUBMB Life 59:696–699.
Sullivan R and Graham CH (2008) Chemosensitization of cancer by nitric oxide. CurrPharm Des 14:1113–1123.
Thévenod F, Friedmann JM, Katsen AD, and Hauser IA (2000) Up-regulation ofmultidrug resistance P-glycoprotein via nuclear factor-kappaB activation protectskidney proximal tubule cells from cadmium- and reactive oxygen species-inducedapoptosis. J Biol Chem 275:1887–1896.
Tome ME, Frye JB, Coyle DL, Jacobson EL, Samulitis BK, Dvorak K, Dorr RT,and Briehl MM (2012) Lymphoma cells with increased anti-oxidant defenses ac-quire chemoresistance. Exp Ther Med 3:845–852.
Toth M, Boros IM, and Balint E (2012) Elevated level of lysine 9-acetylated histoneH3 at the MDR1 promoter in multidrug-resistant cells. Cancer Sci 103:659–669.
40 Ponnusamy et al.
at ASPE
T Journals on M
arch 1, 2019m
olpharm.aspetjournals.org
Dow
nloaded from
Treas J, Tyagi T, and Singh KP (2013) Chronic exposure to arsenic, estrogen, andtheir combination causes increased growth and transformation in human prostateepithelial cells potentially by hypermethylation-mediated silencing of MLH1.Prostate 73:1660–1672.
Valko M, Rhodes CJ, Moncol J, Izakovic M, and Mazur M (2006) Free radicals, metalsand antioxidants in oxidative stress-induced cancer. Chem Biol Interact 160:1–40.
Viatour P, Bentires-Alj M, Chariot A, Deregowski V, de Leval L, Merville MP,and Bours V (2003) NF- kappa B2/p100 induces Bcl-2 expression. Leukemia 17:1349–1356.
Wang K, Chen X, Zhan Y, Jiang W, Liu X, Wang X, and Wu B (2013) Increasedexpression of ALDH1A1 protein is associated with poor prognosis in clear cell renalcell carcinoma. Med Oncol 30:574.
Yue PY, Leung EP, Mak NK, and Wong RN (2010) A simplified method for quanti-fying cell migration/wound healing in 96-well plates. J Biomol Screen 15:427–433.
Zaffaroni N and Daidone MG (2002) Survivin expression and resistance to anticancertreatments: perspectives for new therapeutic interventions. Drug Resist Updat 5:65–72.
Address correspondence to: Dr. Kamaleshwar P. Singh, Department ofEnvironmental Toxicology, The Institute of Environmental and Human Health(TIEHH), Texas Tech University, Lubbock, TX 79409. E-mail: [email protected]
Oxidative Stress–Induced Chemoresistance in Kidney Cancer 41
at ASPE
T Journals on M
arch 1, 2019m
olpharm.aspetjournals.org
Dow
nloaded from