Embed Size (px)
Citation preview

7/28/2019 Chronic Radiation Sickness Among Techa Riverside Residents
http://slidepdf.com/reader/full/chronic-radiation-sickness-among-techa-riverside-residents 1/54
Chronic Radiation SicknessAmong Techa Riverside Residents
Urals Research Center for Radiation MedicineChelyabinsk, Russia

7/28/2019 Chronic Radiation Sickness Among Techa Riverside Residents
http://slidepdf.com/reader/full/chronic-radiation-sickness-among-techa-riverside-residents 2/54
7/28/2019 Chronic Radiation Sickness Among Techa Riverside Residents
http://slidepdf.com/reader/full/chronic-radiation-sickness-among-techa-riverside-residents 3/54
Chronic Radiation SicknessAmong Techa Riverside Residents
Urals Research Center for Radiation MedicineChelyabinsk, Russia
Principal Investigator and Executive Editor
Mira M. Kossenko, M.D., Head, Epidemiology Laboratory
Investigators and Coauthors
Lidiya A. Nikolayenko, Database ManagerSvetlana B. Yepifanova, Engineer-Programmer
Yevghenya V. Ostroumova, Researcher, Epidemiology Laboratory
TranslatorCatherine M. Zhidkova, Head, International Collaboration Division
Published by
Armed Forces Radiobiology Research InstituteBethesda, Maryland, USA
Editor and NIS Initiatives Coordinator
Glen I. Reeves, M.D.

7/28/2019 Chronic Radiation Sickness Among Techa Riverside Residents
http://slidepdf.com/reader/full/chronic-radiation-sickness-among-techa-riverside-residents 4/54
This and other AFRRI publications are available to qualified users from the DefenseTechnical Information Center, Attention: OCP, 8725 John J. Kingman Road, Suite0944, Fort Belvoir, VA 22060-6218; telephone (703) 767-8274. Others may contactthe National Technical Information Service, 5285 Port Royal Road, Springfield, VA22161; telephone (703) 487-4650. AFRRI publications are also available from uni-versity libraries and other libraries associated with the U.S. Government’s Deposi-
For information about this publication, write Armed Forces Radiobiology Research
Institute, 8901 Wisconsin Avenue, Bethesda, MD 20889-5603, USA, or telephone
011-301-295-0377, or send electronic mail to [email protected]. Find
more information about AFRRI on the Internet’s World Wide Web at http://www.
afrri.usuhs.mil.
AFRRI Contract Report 98-1Printed February 1998
Defense Nuclear Agency Contract DNA001-95-C-0156
Cleared for public release; distribution unlimited.
7/28/2019 Chronic Radiation Sickness Among Techa Riverside Residents
http://slidepdf.com/reader/full/chronic-radiation-sickness-among-techa-riverside-residents 5/54
PREFACE
Until recently there were relatively few studies inhumans on the effects of chronic whole body radia-tion exposure on tissues where the radiation re-sponse is considered to be deterministic. Acute ra-diation syndrome and its component subsyndromeshave been well studied, from human experiencewith the casualties in Japan and the firefighters atChernobyl. A large database existsfrom clinical ex-
perience related to treatment of widespread neo-
plastic disease and supporting laboratory studies incellular and animal models. Cataracts and other chronic or late changes related to damage of a spe-cific organ system are also well known as a result of radiation therapy clinical experience. Stochastic ef-fects, primarily neoplastic, dominate current atten-tion to the late effects of chronic radiation exposure.When Dr. A.K. Guskova and Dr. G.D. Baysogolovfirst described chronic radiation sickness (CRS) inseveral hundred workers at the Mayak ProductionAssociation (the USSR’s first plant for process-ing plutonium for weapons, located near Chelyab-
insk, Russia), much of the scientific world wasskeptical.No such syndrome hadbeen, or has since been, described in the West, in large part becausechronic exposures of one gray or more had not beenexperienced.
The most frequent complaints in villagers along theTecha river, where liquid radioactive wastes lessthan one millicurie per liter were initially dumpeddirectly into the river, were headache, dizziness,easy fatigability, disturbances of mood, appetite,and sleep, decreased memory, and bone and joint
pain. Physical findings included increased vascular
permeability, weight loss, apical systolic murmurs,and abnormal peripheral reflexes and ataxia. De-creased blood pressure was often noted initially;with time there has been an increased prevalence of hypertension in persons who have had CRS. Pa-thognomonic symptoms or findings for this dis-ease have not been described. Laboratory studiesroutinely demonstrated pancytopenia, gastric hy-
posecretion, asthenia, and micronecrotic changes in
the myelin membranes at the higher ranges of ex- posure. In general the disease fell into two mainsubsyndromes: a hematologic type of illness (themost common) manifested by peripheral pancy-topenia, confirmed on occasion by bone marrow
biopsy, and a neurologic type with four main symp-toms: asthenization, disturbances of vascular regu-lation, vertebrogenic disorders, and organicchanges in the nervous system manifested by dif-
fuse micronecrotic changes in the myelin accompa-nied by glial proliferation and circulatorydisturbances. A third of the patients had both.
In 1994 the Armed Forces Radiobiology ResearchInstitute published a contract report entitled “Ana-lysis of Chronic Radiation Sickness Cases in thePopulation of the Southern Urals.” The principalauthor of both reports was Dr. Mira M. Kossenko of the Urals Research Center for Radiation Medicine(URCRM, formerly Branch 4 of the Institute of Biophysics of the Ministry of Health of the USSR).
The first report documented the extent of radiationexposure along the Techa river and gave an over-view of the health effects of this exposure on the
population. There were 940 individuals diagnosedwith CRS; of this large group, 66 met the criteria of a dose of at least one gray received over three years,no concurrent disease with symptoms similar toCRS, and signs and symptoms as described byGuskova and Baysogolov.
In this report the dynamics of CRS, its clinicalcourse, and the long-term outcomes for patientswith this disease are described in much greater
detail. Once the patient was removed from expo-sure, the course of CRS stabilized. Most patientseventually recovered, with the time to recovery
being inversely related to the total dose received.Severity of symptoms was directly related todose. A significantly increased percentage of
pat ients died from leukemia or oth er blood dy-scrasias and solid tissue neoplastic diseases com-
pared to a control group. However, except for early
iii

7/28/2019 Chronic Radiation Sickness Among Techa Riverside Residents
http://slidepdf.com/reader/full/chronic-radiation-sickness-among-techa-riverside-residents 6/54
deaths resulting from malignancies, there was nolife span shortening. Today there are no patientswho have CRS; all have either recovered com-
pletely (the majority), at least stabilized, or havedied.
The Techa river villagers, from whom the groupsin this study were taken, represent the largestgroup of people ever exposed to relatively highdosesof chronic radiationover a very long period.Their experience affords a unique opportunity to
contribute to our understanding of injury/repair processes in humans related to tissue or organdamage and carcinogenic effects of high radiationdoses protracted over one or more years. Com-
parisons with the early and late effects of acuteexposures will be illuminating.
Grateful acknowledgment is given to ModesteGreenville for editorial advice, to Carolyn Woodenfor publication layout, and to Mark Behme and GuyBateman for graphics support.
Glen I. Reeves, M.D. NIS Initiatives Coordinator Armed Forces Radiobiology Research Institute
iv

7/28/2019 Chronic Radiation Sickness Among Techa Riverside Residents
http://slidepdf.com/reader/full/chronic-radiation-sickness-among-techa-riverside-residents 7/54
CONTENTS
PREFACE. . . . . . . . . . . . . . . . . . . . . . . . . . . . . . . . . . . . iii
INTRODUCTION . . . . . . . . . . . . . . . . . . . . . . . . . . . . . . . 1
CHAPTER 1. Scope of Pathologic Injury and Clinical Stages of CRS . . . . 3
CHAPTER 2. Dynamics of Disease Course . . . . . . . . . . . . . . . . . . 5
Diagnostic Mistakes and Rejection of CRS Diagnosis . . . . . . . . . 6
Mortality Shortly after CRS Diagnosis . . . . . . . . . . . . . . . . 6
Duration of CRS . . . . . . . . . . . . . . . . . . . . . . . . . . . . 8
CHAPTER 3. Clinical Symptoms at Different Stages of the Disease . . . . . 11
Dynamics of CRS Symptoms . . . . . . . . . . . . . . . . . . . . . 12
CHAPTER 4. Mortality of Patients with Diagnosed CRS . . . . . . . . . . . 19
Mortality from All Causes Based on Death Certificates . . . . . . . . 20
Age-Specific Mortality Characteristics . . . . . . . . . . . . . . . . . . 21
Dependence of Mortality Rates on Dose. . . . . . . . . . . . . . . . . . 21
Mortality Structure . . . . . . . . . . . . . . . . . . . . . . . . . . . 22
Mortality from Leukemia and Solid Cancers . . . . . . . . . . . . . 22
Analysis of Mortality Rates for Patients withVerified Diagnoses of CRS . . . . . . . . . . . . . . . . . . . . . 27
CHAPTER 5. Life Span in Patients with Diagnosed CRS . . . . . . . . . . . 29
CHAPTER 6. Consequences of CRS . . . . . . . . . . . . . . . . . . . . . . 31
REFERENCES. . . . . . . . . . . . . . . . . . . . . . . . . . . . . . . . . 33
APPENDIX
v

7/28/2019 Chronic Radiation Sickness Among Techa Riverside Residents
http://slidepdf.com/reader/full/chronic-radiation-sickness-among-techa-riverside-residents 8/54

7/28/2019 Chronic Radiation Sickness Among Techa Riverside Residents
http://slidepdf.com/reader/full/chronic-radiation-sickness-among-techa-riverside-residents 9/54
INTRODUCTION
Chronic radiation sickness (CRS) in the populationexposed to radiation in the Urals was analyzed in1993 at the Urals Research Center for RadiationMedicine (URCRM). Thestudy wasinitiated by theDefense Nuclear Agency (DNA) and published bythe Armed Forces Radiobiology Research Institute(AFRRI). The extensive report [1] contains infor-mation on population exposure sources, accumula-tion and assessment of doses, characterization of
the exposed population, sources of basic informa-tion on the disease and its clinical course, status of organs and systems, and the different diagnoses of CRS.
The report contains a critical analysis of the validityof a CRS diagnosis based on then current conceptsof the development of radiation pathology. Theresults of the analysis enabled the authors to con-clude that the diagnosis of CRS in a number of cases had been wrong: the symptoms of general so-matic diseases were erroneously taken for CRS
manifestations.
The two principal causes of an incorrect CRS diag-nosis were (1) lack of information on individual
body burdens for exposed people and (2) underesti-mationof the general somatic conditions that devel-oped in the Techa riverside residents and imitatedconditions associated with radiation exposure buthad developed before actual onset of exposure. Atthe same time, it was established by the authors that66 of the 940 cases were considered adequately as-certained. Consequently, the conditions of radia-tion exposure that existed in the Techa riverside
villages could lead and in some cases did lead to thedevelopment of CRS.
The latter assumption is not shared by all foreignreaders of the report. A certain skepticism aboutCRS has been shown at international conferences inthe course of discussions addressing deterministiceffects. Actually, CRS as a clinical entity has never
been described anywhere in the world except in
the southern Ural s of Russia in the vici nity of the Mayak Production Association, a military in-dustrial complex that produced plutonium for weapons.
In our opinion, there are several reasons for such a prudent attitude. First, nowhere else did such a spe-cificradiation condition exist: chronic irradiation of humans for decades at doses approaching 0.5–1.0
Gy/year. Such unique exposures were observed inMayak nuclear workers [2] who began working atthe plant in the first years of its operation(1949–1954) when γ -radiation doses amounted to30–120 mSv per working day, and average annualdoses were estimated to be 1 Sv. High dose rates tored bone marrow were also recorded in residents of the upper Techa into which radioactive wastes fromthe Mayak radiochemical facility were dumpedfrom 1949 through 1956. People were exposed tosuch dose rates for long periods of time. Second, alldata on radiation exposure and the resulting patho-
logic injury among Mayak’s workers and the off-site population in the Southern Urals remained clas-sified for decades (up to 1990). Specialists in thefield of radiobiology and radiation medicine had noknowledge of this specific pathology.
Questionsabout the occurrence of CRS among peo- ple in the Southern Urals can now be raised and dis-cussed openly. Is it true that doses of about 1Sv/year to thewhole body or redbone marrowaccu-mulating over decades are reasonably safe for thehuman organism and do not cause any illness? Or does chronic radiation exposure give rise to an ac-
tual radiationpathology that has a clear-cutsympto-matology and can be designated by the term chronicradiation sickness?
The report of 1994, cited above, analyzes manyaspects of this pathologic condition that wereobserved in 940 residents of the Techa riversidevillages. However, the report does not address thequestions of dynamics of the course of CRS, recovery
1

7/28/2019 Chronic Radiation Sickness Among Techa Riverside Residents
http://slidepdf.com/reader/full/chronic-radiation-sickness-among-techa-riverside-residents 10/54
times, and most importantly, the outcomes of CRS. Our effort is aimed at compensating for thislimitation, and it should be regarded as a logicalcontinuation of the previous work. We willaddress the following issues: extent of injury and
the stage of CRS at the time of diagnosis, dynamicsof the disease course, clinical symptoms at differentstages of CRS, outcomes of the disease (recovery,death), death rate and structure, and average age of the deceased.
2
Introduction
7/28/2019 Chronic Radiation Sickness Among Techa Riverside Residents
http://slidepdf.com/reader/full/chronic-radiation-sickness-among-techa-riverside-residents 11/54
CHAPTER 1
Scope of Pathologic Injury and ClinicalStages of CRS
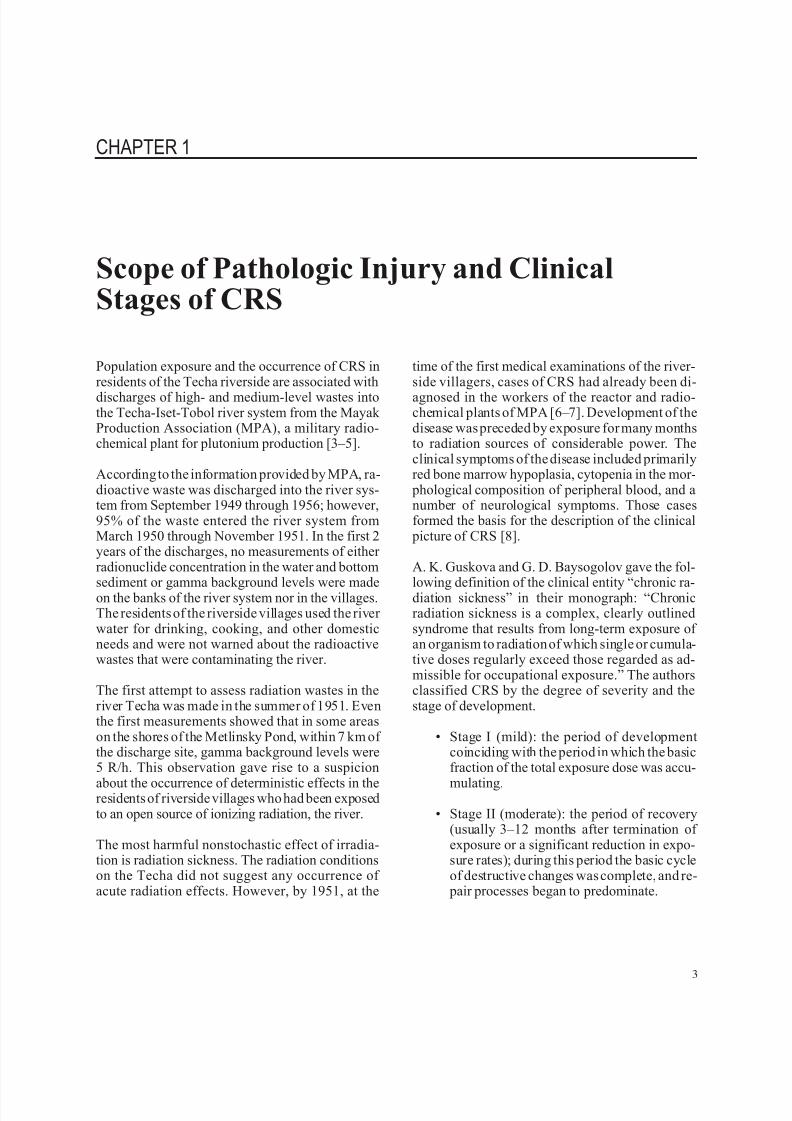
Population exposure and the occurrence of CRS inresidents of the Techa riverside are associated with
discharges of high- and medium-level wastes intothe Techa-Iset-Tobol river system from the Mayak Production Association (MPA), a military radio-chemical plant for plutonium production [3–5].
According to the information provided by MPA, ra-dioactive waste was discharged into the river sys-tem from September 1949 through 1956; however,95% of the waste entered the river system fromMarch 1950 through November 1951. In the first 2years of the discharges, no measurements of either radionuclide concentration in the water and bottom
sediment or gamma background levels were madeon the banks of the river system nor in the villages.The residents of the riverside villages used the river water for drinking, cooking, and other domesticneeds and were not warned about the radioactivewastes that were contaminating the river.
The first attempt to assess radiation wastes in theriver Techa was made in the summer of 1951. Eventhe first measurements showed that in some areason the shores of the Metlinsky Pond, within 7 km of the discharge site, gamma background levels were5 R/h. This observation gave rise to a suspicion
about the occurrence of deterministic effects in theresidents of riverside villages who had been exposedto an open source of ionizing radiation, the river.
The most harmful nonstochastic effect of irradia-tion is radiation sickness. The radiation conditionson the Techa did not suggest any occurrence of acute radiation effects. However, by 1951, at the
time of the first medical examinations of the river-side villagers, cases of CRS had already been di-
agnosed in the workers of the reactor and radio-chemical plants of MPA [6–7]. Development of thedisease was preceded by exposure for many monthsto radiation sources of considerable power. Theclinical symptoms of the disease included primarilyred bone marrow hypoplasia, cytopenia in the mor-
phological composition of peripheral blood, and anumber of neurological symptoms. Those casesformed the basis for the description of the clinical
picture of CRS [8].
A. K. Guskova and G. D. Baysogolov gave the fol-
lowing definition of the clinical entity “chronic ra-diation sickness” in their monograph: “Chronicradiation sickness is a complex, clearly outlinedsyndrome that results from long-term exposure of an organism to radiation of which single or cumula-tive doses regularly exceed those regarded as ad-missible for occupational exposure.” The authorsclassified CRS by the degree of severity and thestage of development.
• Stage I (mild): the period of developmentcoinciding with the period in which the basicfraction of the total exposure dose was accu-
mulating.
• Stage II (moderate): the period of recovery(usually 3–12 months after termination of exposure or a significant reduction in expo-sure rates); during this period the basic cycleof destructive changes was complete, and re-
pair processes began to predominate.
3

7/28/2019 Chronic Radiation Sickness Among Techa Riverside Residents
http://slidepdf.com/reader/full/chronic-radiation-sickness-among-techa-riverside-residents 12/54
• Stage III (severe): the period of possibleCRS outcomes and sequelae—complete re-covery, incomplete recovery, or progressionto leukemia, other-site cancer, or hypoplas-tic anemia.
The first medical examinations of the residents of the Techa riverside villages were organized in thesummer of 1951, and the first cases of CRS were di-agnosed in 1952. The patients complained of head-ach e, d i zzi n es s , eas y fat i g ab i l i t y , g en eralweakness, excessive sweat, irritability, insomnia,decreased memory, decreased appetite, and pains inthe epigastric area, bones, or joints. The basic ob-
jective symptoms included leukopenia, neutro- penia, thrombocytopenia, increased permeabilityof the vessels, weight loss, decreased arterial pres-sure, systolic murmur over the heart apex, de-creased secretory function of the stomach, asthenia,
nonuniform tendon and periosteal reflexes, staticataxia, and nystagmus.
The highest incidence of the disease (540 of the 940cases diagnosed in different years) was observed in1955–1956. By that time, access to the river had
been officially banned, and further contributionsto the external radiation dose had stopped. The
assessment of dose accumulation dynamics for theexposed residents shows that, by 1957, the totaldose of external radiation had been accumulated,the deposition of radionuclides in human bodieshad ceased, and the annual internal radiation rateshad decreased significantly. Thus, at the time when
most CRS diagnoses were established, the accumu-lation of the bulk of the total exposure dose hadeither been completed or was reaching its end.
It is evident that at that time (1953–1956) no casesof CRS at a stage of development could be diag-nosed. The degree of severity(stage I or II) was usu-ally indicatedin the description of thediagnosis, butthe stage of the disease course was not specified.Data on such cases were entered into the computer for analysis by a convention designated as a first-diagnosed condition at an unidentified stage.
Of the total 940 cases of CRS, 899 were identified atthe time of diagnosis as cases of stage I severitycharacterized by the presence of functional disor-ders in the organism’s physiological systems thatcould readily become reversible following termina-tion of exposure. Stage II severity was diagnosed in41 cases in which persistent organic disorders alongwith functional disturbances were diagnosed.
4
Chapter 1
7/28/2019 Chronic Radiation Sickness Among Techa Riverside Residents
http://slidepdf.com/reader/full/chronic-radiation-sickness-among-techa-riverside-residents 13/54
CHAPTER 2
Dynamics of Disease Course
In a number of cases it was impossible to tracethe course of CRS due to the lack of data on thedynamic follow-up of patients.
An assessment of radiation conditions that ex-isted in the summer of 1951, two years after the
beginning of discharges of radioactive wastesinto the Techa, showed both the likelihood of deterministic radiation-related injuries in theresidents and the need to take steps to provide ra-diation protection. One such measure was toevacuate the residents of the riverside villages to“clean” territories. However, this measure wasconsiderably delayed, and doses were again accu-mulated by the people before they were evacu-ated. The first resettlements involving a few
families from the village of Metlino were carriedout in 1953; the entire village population wasfinally moved in 1956. People residing in villagesin the lower reaches of the river were resettled ateven later times. Some of the villages of themiddle reaches (Krasnoarmeysky District) wereevacuated as late as 1961.
Although evacuation of select villages was in-tended to move the population to certain speci-fied clean villages, a number of families moved
by themselves to other villages or nearby townswhere they had relatives. These individuals were
as a rule lost to the medical follow-up conducted by the medical staff of the specialized clinic, theInstitute of Biophysics, Branch 4 (FIB 4; cur-rently URCRM) due primarily to the remotenessof their new residences from FIB 4. The residentsof Metlino were evacuated for the first time to asmall settlement in which Mayak's ExperimentalResearch Laboratory was based. However, after the accident of 1957 and the formation of the
East-Urals Radiation Trace (EURT) quite close tothe settlement, Metlino residents had to resettle for the second time. Many of them moved to the townof Chelyabinsk-65 (currently Ozyorsk) and started
working at the Mayak facility. They were then fol-lowed up by the physicians of Mayak's medicalinstitutions.
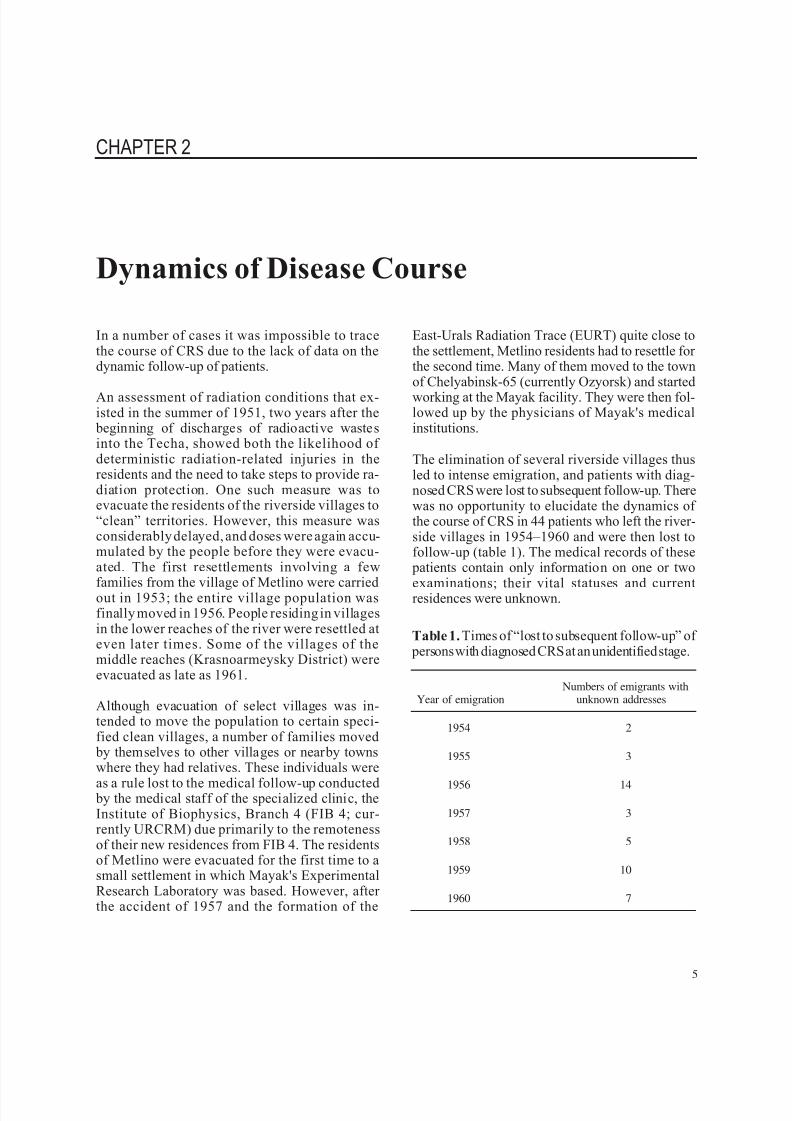
The elimination of several riverside villages thusled to intense emigration, and patients with diag-nosed CRS were lost to subsequent follow-up. Therewas no opportunity to elucidate the dynamics of the course of CRS in 44 patients who left the river-side villages in 1954–1960 and were then lost tofollow-up (table 1). The medical records of these
patients contain only information on one or two
examinations; their vital statuses and currentresidences were unknown.
5
Table 1. Times of “lost to subsequent follow-up” of personswith diagnosed CRSat an unidentified stage.
Year of emigrationNumbers of emigrants with
unknown addresses
1954 2
1955 3
1956 14
1957 3
1958 5
1959 10
1960 7

7/28/2019 Chronic Radiation Sickness Among Techa Riverside Residents
http://slidepdf.com/reader/full/chronic-radiation-sickness-among-techa-riverside-residents 14/54
Diagnostic Mistakes andRejection of CRS Diagnosis
It has been stated above that lack of information ona patient's exposure dose and the general somatic
diseases that developed before radiation exposuremade it difficult to correctly diagnose CRS. It isclear from the description of the clinical picture of CRS [8] that it has no single symptom that can beregarded as an exclusive characteristic of CRS.Therefore, in cases when patients had symptomssuggestive of CRS for the first time, their medicalrecords indicated that the examinationfindings sug-gested CRS, but the actual diagnosis was estab-lished only on the basis of dynamic follow-up data.However, in a number of cases such an approachcould not guarantee a correct diagnosis either, be-cause there was no certainty that the symptoms ob-
served had been induced by radiation. Diagnoses of CRS have often been revised, indicating that a CRSdiagnosis is not an easy one to make.
In 1964, a commission of medical experts was setup to verify the diagnosis of CRS. Patients with thediagnosis were invited to submit to expert clinicalexaminations; all relevant records, including do-simetric and anamnestic data, findings of labora-tory investigations, and functional tests in dy-namics were reviewed. From 1965 through 1967the commission discarded 199 of the 940 diagno-ses of CRS as inadequately substantiated low-doseexposures; some patients had somatic diseases thatimitated radiation injury. The conclusions of thecommission of experts include statements about
both incorrect CRS diagnoses and diseases errone-ously attributed to CRS; table 2 lists the mostcommon of them.
The conditions cited occurred in the patients be-fore radiation exposure or at the time of exposureand were commonly manifested by symptomstypical of radiation injury—leukopenia, anemia,asthenia, impaired blood vessel regulation, osteal-
gia, arthralgia, etc. All199 cases of erroneousCRSdiagnosis were excluded from the analysis of clinical course dynamics and outcomes of chronicradiation injury.
It should be noted that the diag nosis of CRS wasrevised more than once to ensure the most effi-cient verification of the diagnosis of a radiation-induced condition. The results of the latest of such
revisions, based on the data of long-term follow-updynamics and the most exact estimates of individ-ual doses, were presented in the previous report[1]. The revision, based on more rigid criteria, vali-dated 66 of the 940CRS cases diagnosed earlier.
Mortality Shortly after CRSDiagnosis
It was also considered impossible to evaluate thedynamics of the course of CRS in cases whendeaths occurred from different causes shortly after CRS was diagnosed. By the time of death, the di-agnosis of CRS of indefinite stage had not been re-
jected, but in all likelihood the causes of deathwere unrelated to radiation exposure.
6
Chapter 2
Table 2. General somatic diseases simulatingradiation injury and mistaken for CRS.
Clinical diagnoses Number of cases
Infectious diseasesTuberculosisBrucellosis
1466
Helminth infestation 5
Malignant growth 2
Thyroid gland pathology 7
Chronic alcoholism 2
Postcontusion syndrome 6
Focal infection (tonsillitis, otitis,pyodermia, salpingitis, oophoritis,etc.) 12
Rheumatism with involvement of the heart 7
Ischemic heart disease 5
Atherosclerosis 8
Chronic bronchitis, chronic
pneumonia 8
Chronic hepatitis 20
Ulcer of the duodenum 5
Metrorrhagia 5
Pregnancy 4
Other 23

7/28/2019 Chronic Radiation Sickness Among Techa Riverside Residents
http://slidepdf.com/reader/full/chronic-radiation-sickness-among-techa-riverside-residents 15/54
Data are listed in table 3 on 23 individuals whosedeaths occurred within 5 years of CRS diagnosis. Inone case, a woman’s CRS (degree of severity I,
unidentified stage) had been diagnosed 5 years before she died of an unknown cause at age 71. In 6cases, death occurred due to violent causes: suicide,
7
Dynamics of Disease Course
Table 3. Causes of death for patients who died shortly after diagnosis of CRS.
Systemicnumber Sex
Yearof
diagnosis
Internal andexternaldose to
RBM, Gy
Differencebetween
diagnosis anddeath, year
Yearof
death Age Class Group Subgroup
Causeof
death
5007 F 1953 2.091198 1 1954 19 2 208 9 Acuteleukemia
11175 F 1953 2.104477 5 1958 22 6 340 Menyngo-encephalitis,disseminatedsclerosis
42902 F 1955 0.7886477 2 1957 60 17 959 9 Multiple traumas
43106 F 1955 0.7971345 5 1960 46 2 150 9 Cancer of theesophagus
62309 F 1955 0.5119344 2 1957 67 17 797 Senile asthenia
67530 M 1955 0.6031555 2 1957 54 2 151 9 Gastric cancer
68408 M 1955 0.6262668 5 1960 39 9 567 9 Acute abdomen
68416 F 1955 0.6031555 5 1960 71 Unknown cause
148220 F 1954 0.3748812 0 1954 40 9 571 4 Hepatitis,achylicgastritis
164125 M 1956 0.454779 5 1961 59 7 414 0 Cardiosclerosis,pneumofibrosis
193531 M 1955 0.2560158 2 1957 69 2 188 9 Cancer of the
bladder
206007 M 1955 0.3852318 2 1957 23 17 850 0 Concussion of the brain
207185 M 1956 0.282203 1 1957 56 2 151 9 Gastric cancer
212088 F 1955 0.377623 3 1958 17 17 959 9 Multiple traumas
216087 F 1955 0.2560158 5 1960 70 1 38 9 Sepsis
226885 M 1955 0.2451282 1 1956 63 8 492 Pulmonaryemphysema
232158 M 1955 0.3451516 3 1958 32 17 959 9 Multiple traumas
308513 M 1957 0.4771494 2 1959 21 17 994 7 Suicide
339486 M 1955 0.1543645 5 1960 71 16 785 4 Gangrene
362497 M 1955 0.06277061 4 1959 30 17 980 9 Alcoholicintoxication
389813 M 1955 0.1949964 5 1960 58 7 394 2 Mitral defect
512698 F 1956 0.2343817 1 1957 24 7 394 2 Mitral defect
524620 F 1956 0.2316606 5 1961 78 7 440 9 Atherosclerosis

7/28/2019 Chronic Radiation Sickness Among Techa Riverside Residents
http://slidepdf.com/reader/full/chronic-radiation-sickness-among-techa-riverside-residents 16/54
alcoholic intoxication, and car/railway accidents.Only one of the subjects was over 60 (67 years old);in the remainder of cases, death occurred at agesunder 33.
Five of the 23 patients (22%) discussed in this sec-
tion of the report died of malignant neoplasms.One of the patients (G.N., systemic number 5007)was described in detail in the first report on CRS[1]. CRS was diagnosed in this 18-year-old pa-tient, a resident of Metlino, in 1953. By that timethe dose had accumulated in red bone marrowdue to external and internal radiation thatamounted to over 2 Gy. A year later, the patientdeveloped acute nondifferentiated leukemia anddied. Four other patients with CRS died at ages46–69 of cancer of the stomach, esophagus, and
bladder.
In three cases the causes of death were acute inflam-matory processes that were not clearly enough de-fined in the death certificates (gangrene, acuteabdomen, sepsis, meningoencephalitis). It may besuggested that chronic exposure manifested by in-hibition of bone marrow hematopoiesis aggravatedthe inflammatory processes.
Duration of CRS
We were thus only able to analyze the dynamics of the CRS course and recovery times for 674 pa-tients—for those whose diagnoses were verified atthe FIB 4 clinic and who were followed up for long
periods of time.
The dynamic follow-up enabled us to diagnoseCRS at the stage of stabilization in a number of
patients whose condition and laboratory findingsshowed improvement. CRS at the stage of repair or recovery was diagnosed when the patient's condi-tion was considered to be normalized, and thesymptoms of radiation injury were absent. In the
majority of cases, the stabilization stage was by- passed, and the stage of recovery was reached.Figure 1 demonstrates the time of diagnosis andrecovery from CRS.
Most CRS cases (80%) were diagnosed before1958. The first cases in the stabilization stage
wereregistered about the same time, 1955–1957,as the first cases in the recovery stage. By thattime, 6 to 8 years had elapsed since the beginningof exposure, and residents had stopped using theriver as a source of water. Annual dose rateshad decreased considerably by that time, and long-
lived radionuclides of strontium and cesium,which had accumulated in the bodies of exposedresidents, remained the only contributors to thedose. However, in most CRS patients, the recovery
process began much later. About half the CRS pa-tients who recovered had done so by 1960, and90% had recovered by 1970.
A conclusion may be made that all patients diag-nosed with CRS in the 1950s did reach the stage of recovery, but the times at which that stage wasreached differed. A very crude calculation of themean duration of the course of the disease yields thevalue of 9–11 years (90% of all CRS cases were di-agnosed by 1959, and recovery stages were regis-tered for 90% of patients by 1970). However, amore accurate calculation made with theactual timeof CRS diagnosis and recovery for each patientshows that the average disease course was 7.35years.
Compared to stage 1 CRS, recovery occurred in pa-tients with stage 2 CRS by 1976, about 4–5 yearslater.
Analysis of Recovery Time's Dependence onDose. The calculation of the dose to a patient's red
bone marrow (RBM) has identified several “dose”groups and assessed the duration of the disease with
8
Chapter 2
1000
800
600
400
200
0
c a s e s
52 55 58 61 64 67 70 73 76 79 82 85 88 91year
2
1
F i g . 1 . T i m e o f C R S d i a g n o s i s ( 1 ) a n d r e c o v e r y ( 2 ) , 1 9 5 2
1 9 8 8 .

7/28/2019 Chronic Radiation Sickness Among Techa Riverside Residents
http://slidepdf.com/reader/full/chronic-radiation-sickness-among-techa-riverside-residents 17/54
relation to the dose. The results of the analysis arelisted in table 4 and figure 2.
The dependence of recovery time on dose accu-mulated in the RBM can be traced by the durationof CRS increases with dose. This dependence can
be descri bed by the linear equation I = a + bD,where D represents the dose value in Gy, and thecoefficient b is estimated to be 4.17 years per Gy.
It may well be that the processes of radiation in- jury repair d epend not o nly on t he l evel of rad ia-tion exposure but also on the age at which a
patient developed CRS. Patients' calculated meanages by 1950, the beginning of radiation exposurefor different dose groups, are presented in table 4.Mean ages in groups with doses from 0.03 to 1.4Gy do not differ significantly, ranging from 22.1
to 31.1 years. Much lower mean ages, 19 and 12years, are observed in high-dose groups (morethan 1.4 Gy to the RBM). A specific feature of ra-diation conditions in the Techa riverside area isthe close dependence of exposure dose on age. Ascited in chapter 3 of AFRRI Contract Report,CR94-1 [1], the highest doses were received by
residents who were adolescents when exposure began. This analysis of the dependence of thelength of the course of CRS on age was thusundertaken.
9
Dynamics of Disease Course
Table 4. Dependence of CRS duration on absorbed dose in RBM.
Dose toRBM, Gy
Mean dose toRBM, Gy
Patients withCRS
Mean doseby 1950
Duration of CRS: years(confidence intervals)
0.03–0.1 0.05 53 22.7 4.57 (3.42–5.99)
0.1–0.2 0.16 103 27.2 4.22 (3.44–5.13)
0.2–0.3 0.25 116 31.1 5.33 (4.38–6.29)
0.3–0.4 0.34 79 23.8 6.89 (5.46–8.58)
0.4–0.5 0.45 69 24.7 7.68 (5.97–9.59)
0.5–0.7 0.59 63 22.1 7.97 (6.34–10.20)
0.7–1.0 0.83 63 24.1 9.24 (7.11–11.80)
1.0–1.2 1.07 39 28.3 11.08 (7.88–15.14)
1.2–1.4 1.3 38 29.5 9.37 (6.63–12.86)
1.4–2.0 1.62 35 19.1 14.66 (10.2–20.38)
>2.0 2.34 16 12.3 12.5 (7.15–20.25)
16
14
12
10
8
6
4
20.0 0.5 1.0 1.5 2.0 2.5
C R S d u r a t i o n ( y e a r s )
dose to RBM (Gy)
F i g . 2 . D e p e n d e n c e o f d u r a t i o n o f C R S o n a c c u m u l a t e d d o s e :
y e a r s o f d u r a t i o n ( ) ; a p p r o x i m a t e f i t ( - - - ) .
7/28/2019 Chronic Radiation Sickness Among Techa Riverside Residents
http://slidepdf.com/reader/full/chronic-radiation-sickness-among-techa-riverside-residents 18/54
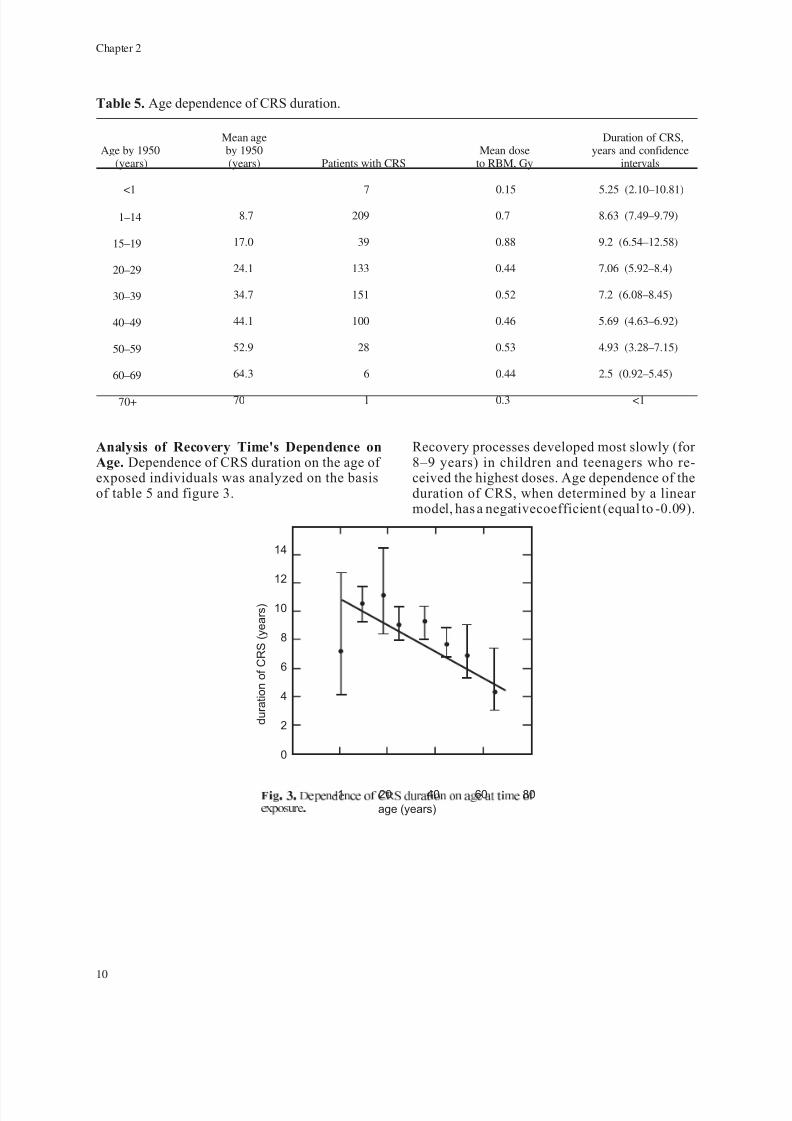
Analysis of Recovery Time's Dependence onAge. Dependence of CRS duration on the age of exposed individuals was analyzed on the basisof table 5 and figure 3.
Recovery processes developed most slowly (for 8–9 years) in children and teenagers who re-ceived the highest doses. Age dependence of theduration of CRS, when determined by a linear model, has a negativecoefficient (equal to -0.09).
10
Chapter 2
14
12
10
8
6
4
2
0
-1 20 40 60 80
age (years)
d u r a t i o n o f C R S ( y e a r s )
F i g . 3 . D e p e n d e n c e o f C R S d u r a t i o n o n a g e a t t i m e o f
e x p o s u r e .
Table 5. Age dependence of CRS duration.
Age by 1950(years)
Mean ageby 1950(years) Patients with CRS
Mean doseto RBM, Gy
Duration of CRS,years and confidence
intervals
<1 7 0.15 5.25 (2.10–10.81)
1–14 8.7 209 0.7 8.63 (7.49–9.79)
15–19 17.0 39 0.88 9.2 (6.54–12.58)
20–29 24.1 133 0.44 7.06 (5.92–8.4)
30–39 34.7 151 0.52 7.2 (6.08–8.45)
40–49 44.1 100 0.46 5.69 (4.63–6.92)
50–59 52.9 28 0.53 4.93 (3.28–7.15)
60–69 64.3 6 0.44 2.5 (0.92–5.45)
70+ 70 1 0.3 <1
7/28/2019 Chronic Radiation Sickness Among Techa Riverside Residents
http://slidepdf.com/reader/full/chronic-radiation-sickness-among-techa-riverside-residents 19/54
CHAPTER 3
Clinical Symptoms at Different Stages of theDisease
According to the definition by Guskova andBaysogolov [8], there are two variants of
CRS—the developed clinical syndrome result-ingfrom effects of external radiationor intakesof isotopes that are uniformly distributed in the
body and the clinical syndrome manifested bythe predominance of injury to individual or-gans and systems as a result of internal or ex-ternal exposure. To analyze the prevailing typeof injury in cases of CRS in residents of the Te-cha riverside area, the incidence of injuries toindividual organ systems or a combination of systems was studied. The results are shown intable 6. However, the table does not specifyother symptoms regarded as consequences of radiation exposure—for example, reduced im-mune resistance, hypoacidic state of gastricsecretion, or manifestations of hepatitis of non-viral etiology. These symptoms were not re-garded as key pathological signs, and their
presence alone could not serve as the basisfor making the diagnosis of CRS. Immune in-competence revealed in laboratory investiga-tions was often associated with leukopenia,neutropenia, and monocytopenia.
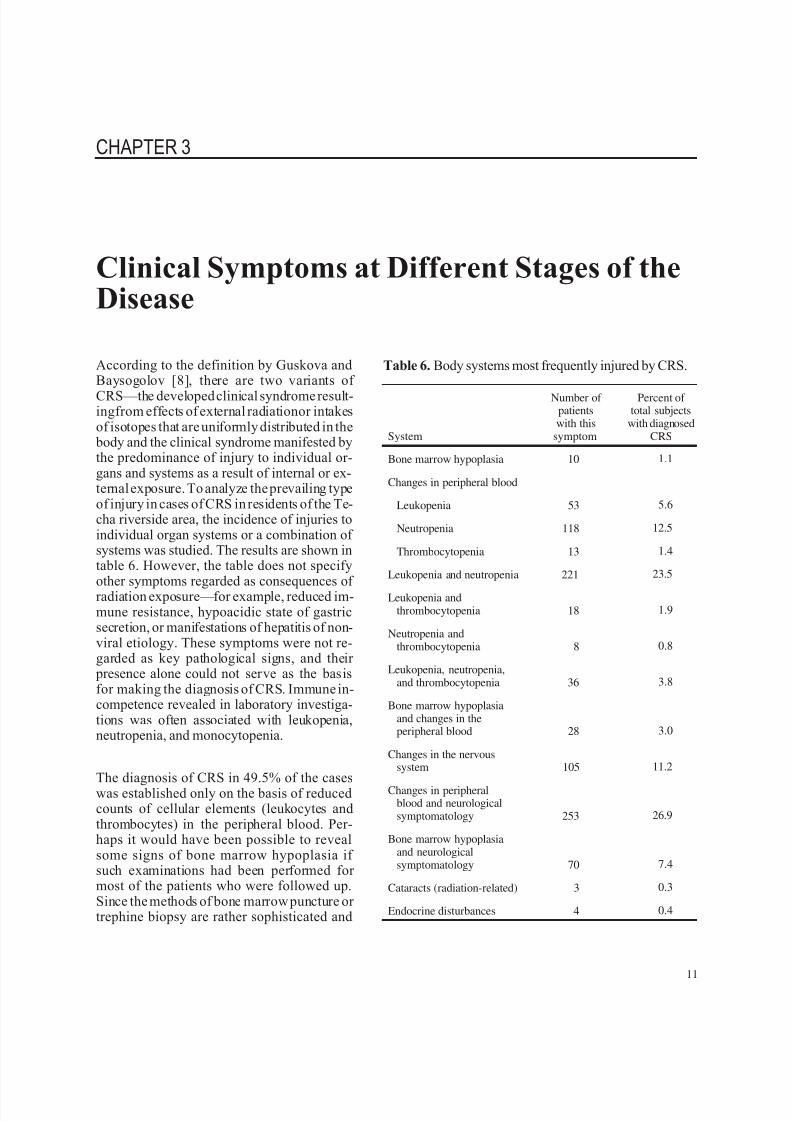
The diagnosis of CRS in 49.5% of the caseswas established only on the basis of reducedcounts of cellular elements (leukocytes andthrombocytes) in the peripheral blood. Per-haps it would have been possible to revealsome signs of bone marrow hypoplasia if such examinations had been performed for most of the patients who were followed up.Since the methods of bone marrow puncture or trephine biopsy are rather sophisticated and
11
Table 6. Body systems most frequently injured by CRS.
System
Number of patientswith this
symptom
Percent of total subjects
with diagnosedCRS
Bone marrow hypoplasia 10 1.1
Changes in peripheral blood
Leukopenia 53 5.6
Neutropenia 118 12.5
Thrombocytopenia 13 1.4
Leukopenia and neutropenia 221 23.5
Leukopenia andthrombocytopenia 18 1.9
Neutropenia andthrombocytopenia 8 0.8
Leukopenia, neutropenia,and thrombocytopenia 36 3.8
Bone marrow hypoplasiaand changes in theperipheral blood 28 3.0
Changes in the nervoussystem 105 11.2
Changes in peripheralblood and neurologicalsymptomatology 253 26.9
Bone marrow hypoplasiaand neurologicalsymptomatology 70 7.4
Cataracts (radiation-related) 3 0.3
Endocrine disturbances 4 0.4

7/28/2019 Chronic Radiation Sickness Among Techa Riverside Residents
http://slidepdf.com/reader/full/chronic-radiation-sickness-among-techa-riverside-residents 20/54
traumatizing, they were only applied in a few pa-tients for diagnosticpurposes. It wasshown in thefirst report on CRS [1] that bone marrow exami-nations were performed for 278 CRS patients.Among the 82 cases examined in 1951–1955 therewere 38 cases with changes in bone marrow com-
position manifested by slight reductions in mye-lokaryocyte counts, increased rates of neutrophilmaturation, and increased plasma cell counts.
Thus, the hematologic syndrome in 53.6% of pa-tients was of primary significance in the diagnosisof CRS. This correlates with data cited in the publi-cation by the International Commission on Radio-logical Protection [9] that the hematopoietic sys-tem is a highly radiosensitive one, and that thethreshold of occupational exposure that inhibitshematopoiesis is 0.4 Sv.
The neurologic syndrome is next in the order of di-agnostic significance. It can be described as a complexof four leading symptoms: asthenization, vegeto-vascular dysfunction (most commonly manifested
by disturbances of vascular regulation), vertebro-genic disorders, and manifestations of organic af-fections of the nervous system (diffuse micronecroticchanges in the myelinic membrane of the nerve con-ductors accompanied by disseminated glial prolifera-tion and circulatory disturbances). The presence of the neurological syndrome alone in 105 patients(11.2%) was regarded as sufficient basis for thediagnosis.
In a considerable number of patients (232, 34.3%)theimpairmentof hematopoiesis was combined witha neurological symptom, and this combination rep-resented the most typical symptomatology of CRS.
Radiation-related cataracts were only registered inthree residents who received significant doses of external exposure in a comparatively short time.Endocrine disorders were found in patients whohad
been exposed in childhood; these disorders weremanifested by sex organ hypoplasia.
Dynamics of CRS Symptoms
The symptoms listed above were most often ob-served at the time of establishing the diagnosisof CRS, i.e., during the periods of exposure to ex-ternal radiation, radionuclide incorporation, and
substantial annual dose rates. After access to theriver, the open radiation source, was restricted, ex-ternal irradiation ceased, and dose rates diminishedsignificantly. After 1956, dose rates were only cal-culated for long-lived radionuclides incorporatedin the organism.
By that time the clinical picture was characterized by a regression of pathological symptoms and grad-ual development of repair processes. Only in asmall number of patients exposed perinatally or inearly childhood was it possible to observe maxi-mum manifestations of certain pathological signslater, particularly in the pubertal period.
Since the hematological syndrome was the keymanifestation of CRS, it is logical at this point todiscuss the results of dynamic peripheral bloodstudies with a more detailed presentation of the pe-
riods with the highest dose rates. The previous re- port focused on blood count findings only in patientswithout somatic conditions (table 7.2 in reference[1]). This report presents data on all blood countsmade for patients with diagnosed CRS (3,146counts made from 1952 through 1956) regardless of the purpose of laboratory blood tests, whether aim-ing at the study of radiation effects on the patient’shealth or because of some somatic disease suffered
by the patient. This approach is based on the pointof view that radiation exposure may lead to in-creased incidence and a more severe course of gen-eral somatic diseases, e.g., infectious diseases with-out adequate reactions of the peripheral blood.
This analysis of blood count dynamics is based onactual results of each peripheral blood test made for each patient not on averaged values. Figure 4 showsdata on leukocyte count dynamics between 1952
12
Chapter 3
20
18
16
14
12
10
8
6
4
2
0
l e u k o c y t e s
x
1 0
/ l 9
1952 1953 1954 1955 1956
year
F i g . 4 . D y n a m i c s o f l e u k o c y t e c o u n t s , 1 9 5 2 1 9 5 6 .

7/28/2019 Chronic Radiation Sickness Among Techa Riverside Residents
http://slidepdf.com/reader/full/chronic-radiation-sickness-among-techa-riverside-residents 21/54
and 1956. The lowest values (1.9 x 10⁹ /L) were reg-istered in 1953. In 1954–1956, leukocyte counts insome patients were as low as 2.1 x 10 9 /L. The low-est variability of blood count values was noted for the early years of exposure (1952–1953), which re-sulted particularly in the lower average leukocyte
counts registered in that period. No substantialnormalization of leukocyte counts occurred in the
period 1952–1956.
The dynamics of segmented neutrophil counts wereapproximately the same (figure 5). The lowest val-ues, such as (0.2–0.3) x 109 /L, were noted amongCRS patients in 1956. However, during all preced-ing years the lowest neutrophil counts did not ex-ceed 1.0 x 10 9 /L. The variability of both neutrophiland overall leukocyte counts was increasing from1952 to 1956.
Figure 6 presents data on peripheral blood thrombo-cyte counts for individual patients with diagnosedCRS. The characteristic features in 1952, the year of the highest dose rates for all analyzed years, were(a) very lowvariability of values, (b) highest throm-
bocyte counts not beyond the value X + 1.5σ, whereX was the mean thrombocyte count for normal sub-
jects and equaled 247 x 10 9 /L, and X + 1.5σ equaled315 x 10 9 /L, and (c) the lowest values of thrombo-cyte counts were 90 x 10 9 /L. Thus the thrombocytevariability curve for CRS patients shifted significantlyto the left in 1952 in comparison to the distributionof normal values, and the average values werelower than the normal values. The values selectedfrom 11 of the most correct and substantiated stud-ies listed in ICRP Publication 41 [9] were assumedto represent normal values of hematological parame-ters. These values based on probability theory andvariational statistics are used for comparison
purposes in solving the tasks of radiation medicine.
In the period 1953–1956, thrombocyte count vari-ability increased. However, the lowest values wereeven lower than in 1952: 54 x 109 /L in 1954, and 30x 109 /L in 1955 (in one patient). In a considerable
number of cases, thrombocyte counts of patientswith CRS were below the reference value of X- 2σ,i.e., lower than 157 x 10 9 /L.
During the period of highest annual dose rates andlowest values of peripheral blood parameters(1952–1955), the dependence of leukocyte, seg-mented neutrophil, and thrombocyte counts on thedose accumulated in the RBM was assessed (fig-ures 7–9). Decreased leukocyte counts were notedin patients with substantial doses to the RBM incomparison to patients with lower doses (figure 7).Approximation of this dependence by linear regres-sion ( I = a ± bD) yields the value of the constantterm “a” to 5.58. The dose slope is negative andequal to (-0.47).
13
Clinical Symptoms at Different Stages of the Disease
20
18
16
14
12
10
8
6
4
2
0
n e u t r o p h i l s
x
1 0
/ l 9
1952 1953 1954 1955 1956
year
F i g . 5 . D y n a m i c s o f n e u t r o p h i l c o u n t s , 1 9 5 2 1 9 5 6 .
600
500
400
300
200
100
0
t h r o m b o
c y t e s x 1 0 / l 9
1952 1953 1954 1955 1956
year
F i g . 6 . D y n a m i c s o f t h r o m b o c y t e c o u n t s , 1 9 5 2 1 9 5 6 .
25
20
15
10
5
0
l e u k o
c y t e s x 1 0 / l 9
0.0 0.5 1.0 1.5 2.0 2.5 3.0 3 .5
dose to RBM (Gy)
F i g . 7 . D o s e d e p e n d e n c e o f l e u k o c y t e c o u n t s , 1 9 5 2
1 9 5 5 .
7/28/2019 Chronic Radiation Sickness Among Techa Riverside Residents
http://slidepdf.com/reader/full/chronic-radiation-sickness-among-techa-riverside-residents 22/54
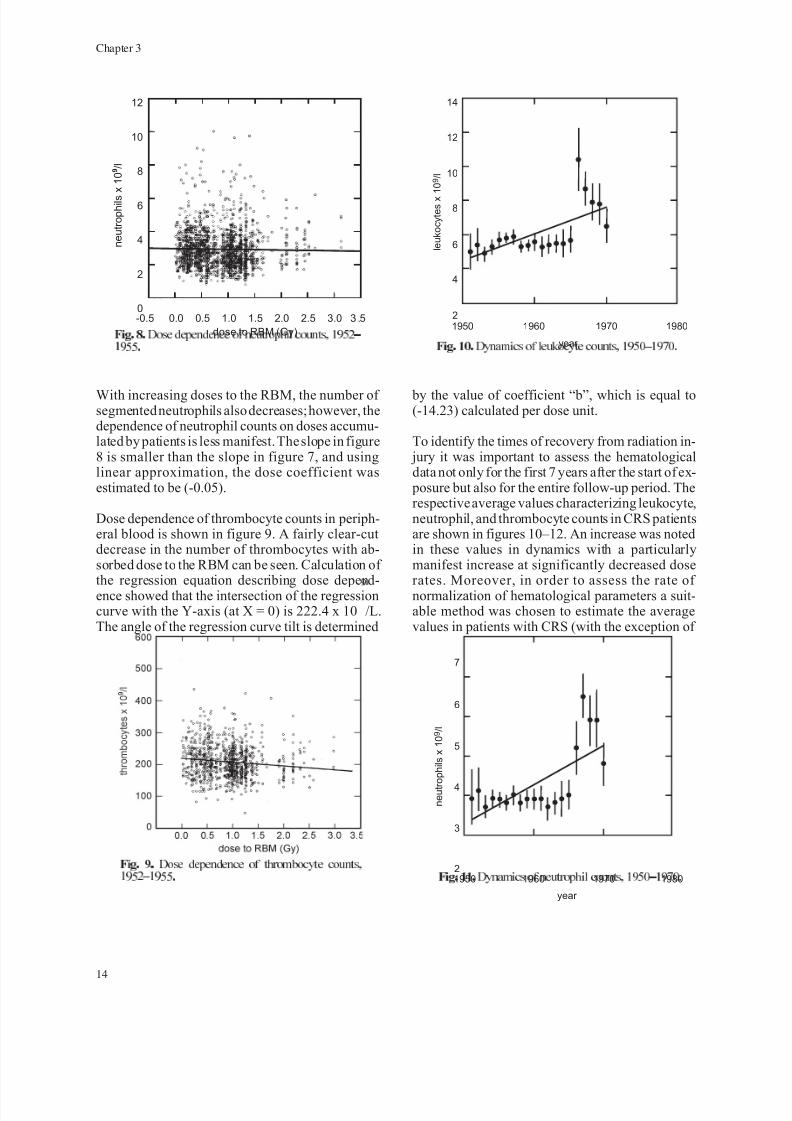
With increasing doses to the RBM, the number of segmented neutrophils also decreases; however, thedependence of neutrophil counts on doses accumu-lated by patients is less manifest. The slope in figure8 is smaller than the slope in figure 7, and usinglinear approximation, the dose coefficient wasestimated to be (-0.05).
Dose dependence of thrombocyte counts in periph-eral blood is shown in figure 9. A fairly clear-cutdecrease in the number of thrombocytes with ab-sorbed dose to the RBM can be seen. Calculation of the regression equation describing dose depend-ence showed that the intersection of the regressioncurve with the Y-axis (at X = 0) is 222.4 x 10 9 /L.The angle of the regression curve tilt is determined
by the value of coefficient “b”, which is equal to(-14.23) calculated per dose unit.
To identify the times of recovery from radiation in- jury it was important to assess the hematologicaldata not only for the first 7 years after the start of ex-
posure but also for the entire follow-up period. Therespective average values characterizing leukocyte,neutrophil, and thrombocyte counts in CRS patientsare shown in figures 10–12. An increase was notedin these values in dynamics with a particularlymanifest increase at significantly decreased doserates. Moreover, in order to assess the rate of normalization of hematological parameters a suit-able method was chosen to estimate the averagevalues in patients with CRS (with the exception of
14
Chapter 3
1950
n e u t r
o p
h i l s
x 1
0 / l 9
1960 1970 1980
year
3
2
4
5
6
7
F i g . 1 1 . D y n a m i c s o f n e u t r o p h i l c o u n t s , 1 9 5 0 1 9 7 0 .
1950
l e u k o c y t e s x
1 0 / l 9
1960 1970 1980
year
4
2
6
8
12
10
14
F i g . 1 0 . D y n a m i c s o f l e u k o c y t e c o u n t s , 1 9 5 0 1 9 7 0 .
F i g . 9 . D o s e d e p e n d e n c e o f t h r o m b o c y t e c o u n t s ,
1 9 5 2 1 9 5 5 .
12
10
8
6
4
2
0
n e u t r o p h i l s
x 1 0 / l 9
-0.5 0.0 0.5 1.0 1.5 2.0 2.5 3.0 3 .5
dose to RBM (Gy)
F i g . 8 . D o s e d e p e n d e n c e o f n e u t r o p h i l c o u n t s , 1 9 5 2
1 9 5 5 .

7/28/2019 Chronic Radiation Sickness Among Techa Riverside Residents
http://slidepdf.com/reader/full/chronic-radiation-sickness-among-techa-riverside-residents 23/54
pathological conditions affecting blood parameters)in dynamics for periods 1951–1955, 1956–1959,1960–1969, and after 1969. The values obtainedwere compared with reference values. Data are
provided in figures 13–16.
The average leukocyte counts for CRS patients per-sisted at lower than 90% confidence intervals of thereference value for three decades after the begin-ning of exposure. Only after 1970 did the differ-ences in leukocyte counts between followed-up
patients and reference values disappear (figure 13).
The dynamics of segmented neutrophils correlatedwith leukocyte dynamics (figure 14A), indirectlycorroborating the decrease in leukocyte counts in CRS patients as associated mainly with the de-
creased number of granulocytes. At the same time,a substantial increase in the number of stab neutro-
phils was noted, particularly during the first twodecades after the beginning of exposure (figure14B). An increased percentage of stab neutrophils,in comparison with normal values, was typical of CRS patients over all periods of follow-up.
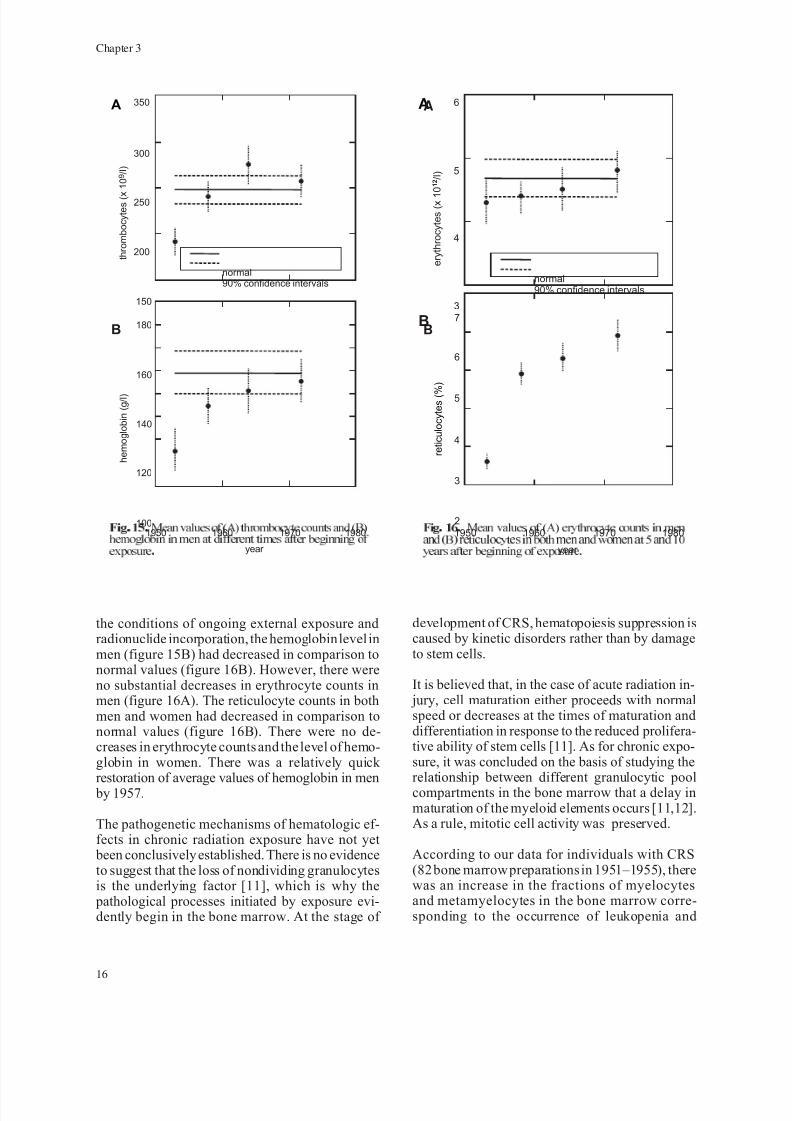
The normalization of thrombocyte counts occurredmuch earlier (figure 15A). Average values of
thrombocytes below 200 x 109
/L were only regis-tered during the first 5 years after exposure. By1958, the average thrombocyte values were re-stored to their normal values and did not changethroughout further follow-up periods.
The values characterizing the erythrocyte serieswere also analyzed on the basis of the data on pe-ripheral blood counts. During the first 5 years under
15
Clinical Symptoms at Different Stages of the Disease
1950
t h r o m b o c y t e s
x 1
0 / l 9
1955 1970 197519651960
year
150
100
200
250
300
350
F i g . 1 2 . D y n a m i c s o f t h r o m b o c y t e c o u n t s , 1 9 5 0 1 9 7 0 .
1950
l e u
k o c y t e s
x 1
0 / l 9
1960 1970 1980
year
4
normal90% confidence intervals
5
6
7
F i g . 1 3 . M e a n l e u k o c y t e c o u n t s a t d i f f e r e n t t i m e s
a f t e r b e g i n n i n g o f e x p o s u r e .
1950
s e g m e n t e d n e u t r o p h i l s
x 1
0 / l 9
s t a b n e u t r o p h i l s
x 1
0 / l 9
1960 1970 1980
year
2.0
2
normal90% confidence intervals
2.5
4
3.0
6
4.0
3.5
8
10
A
B
F i g . 1 4 . M e a n n e u t r o p h i l c o u n t s a t d i f f e r e n t t i m e s
a f t e r b e g i n n i n g o f e x p o s u r e .
7/28/2019 Chronic Radiation Sickness Among Techa Riverside Residents
http://slidepdf.com/reader/full/chronic-radiation-sickness-among-techa-riverside-residents 24/54
the conditions of ongoing external exposure andradionuclide incorporation, the hemoglobin level inmen (figure 15B) had decreased in comparison tonormal values (figure 16B). However, there wereno substantial decreases in erythrocyte counts inmen (figure 16A). The reticulocyte counts in bothmen and women had decreased in comparison tonormal values (figure 16B). There were no de-creases in erythrocyte counts and the level of hemo-globin in women. There was a relatively quick restoration of average values of hemoglobin in men
by 1957.
The pathogenetic mechanisms of hematologic ef-fects in chronic radiation exposure have not yet
been conclusively established. There is no evidenceto suggest that the loss of nondividing granulocytesis the underlying factor [11], which is why the
pathological processes initiated by exposure evi-dently begin in the bone marrow. At the stage of
development of CRS, hematopoiesis suppression iscaused by kinetic disorders rather than by damageto stem cells.
It is believed that, in the case of acute radiation in- jury, cell maturation either proceeds with normalspeed or decreases at the times of maturation anddifferentiation in response to the reduced prolifera-tive ability of stem cells [11]. As for chronic expo-sure, it was concluded on the basis of studying therelationship between different granulocytic poolcompartments in the bone marrow that a delay inmaturation of the myeloid elements occurs [11,12].As a rule, mitotic cell activity was preserved.
According to our data for individuals with CRS(82 bone marrow preparations in 1951–1955), therewas an increase in the fractions of myelocytesand metamyelocytes in the bone marrow corre-sponding to the occurrence of leukopenia and
16
Chapter 3
1950
t h r o m b o c y t e s ( x
1 0 / l ) 9
h e m o g l o b i n ( g / l )
1960 1970 1980
year
150
100
normal90% confidence intervals
200
120
250
140
300
350
160
180
A
B
F i g . 1 5 . M e a n v a l u e s o f ( A ) t h r o m b o c y t e c o u n t s a n d ( B )
h e m o g l o b i n i n m e n a t d i f f e r e n t t i m e s a f t e r b e g i n n i n g o f
e x p o s u r e .
1950
e r y
t h r o c y
t e s
( x 1
0
/ l )
1 2
r e t i c u
l o c y
t e s
( %
)
1960 1970 1980
year
3
2
normal90% confidence intervals
4
3
5
4
6
5
6
7
A
B
F i g . 1 6 . M e a n v a l u e s o f ( A ) e r y t h r o c y t e c o u n t s i n m e n
a n d ( B ) r e t i c u l o c y t e s i n b o t h m e n a n d w o m e n a t 5 a n d 1 0
y e a r s a f t e r b e g i n n i n g o f e x p o s u r e .
A
B
7/28/2019 Chronic Radiation Sickness Among Techa Riverside Residents
http://slidepdf.com/reader/full/chronic-radiation-sickness-among-techa-riverside-residents 25/54
granulocytopenia in peripheral blood. Such find-ings can be interpreted as delayed maturation anddifferentiation of granulocytes at the final stageof cell development.
As for the effects of long-term exposure on the
megakaryocytic-thrombocytic system, it is consid-ered that “mature megakaryocytes are insensitiveto radiation, their processes of maturation andthrombocyte production go on unaffected” [11].Therefore, the cause of peripheral blood thrombocy-topenia may lie in radiation injury to precursor cells. Unfortunately, data are unavailable on thenumber of megakaryocytes in the bone marrowof patients with CRS during the period of itsdevelopment.
Recovery of the hematopoietic system after radia-tion injury proceeded slowly in patients with CRS.
Even after cessation of external exposure and radio-nuclide body intakes, leukopenia and neutropenia
persisted for a long time and may have been due to
incorporation of long-lived strontium that contributedto irradiation and maintained a certain dose rate.
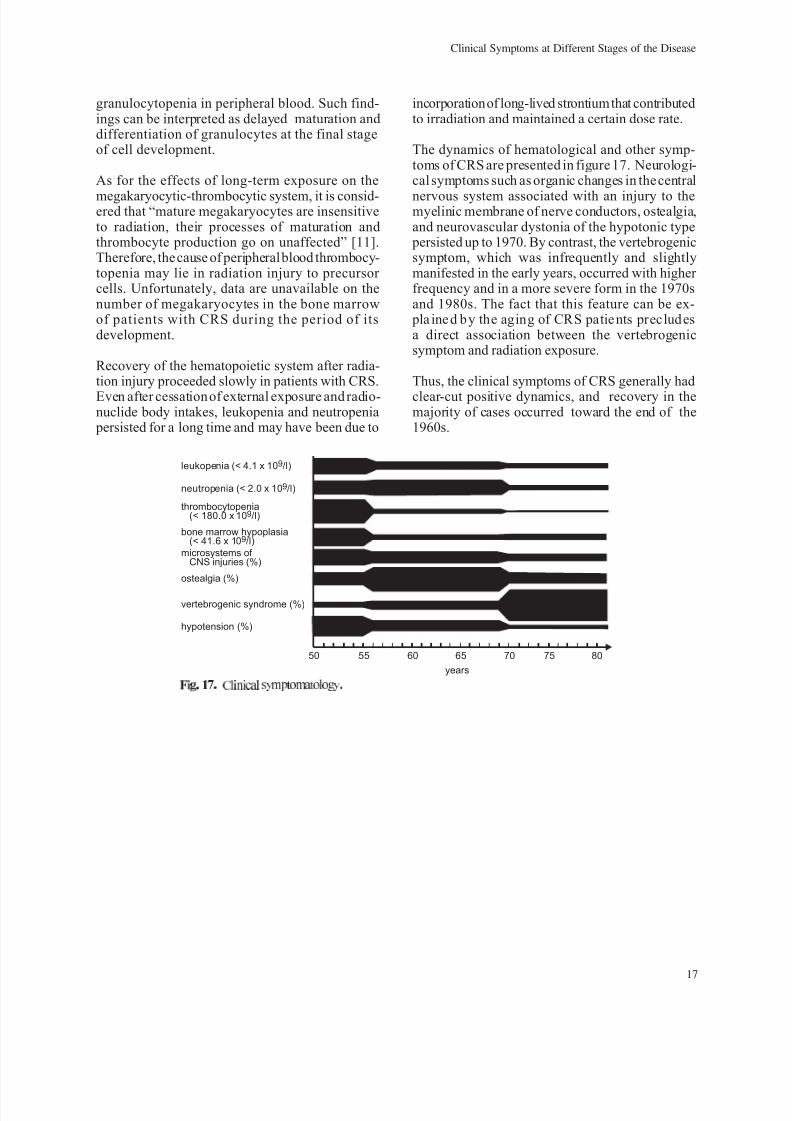
The dynamics of hematological and other symp-toms of CRS are presented in figure 17. Neurologi-cal symptoms such as organic changes in the central
nervous system associated with an injury to themyelinic membrane of nerve conductors, ostealgia,and neurovascular dystonia of the hypotonic type
persisted up to 1970. By contrast, the vertebrogenicsymptom, which was infrequently and slightlymanifested in the early years, occurred with higher frequency and in a more severe form in the 1970sand 1980s. The fact that this feature can be ex-
pla ine d b y the aging of CRS patie nts preclud esa direct association between the vertebrogenicsymptom and radiation exposure.
Thus, the clinical symptoms of CRS generally had
clear-cut positive dynamics, and recovery in themajority of cases occurred toward the end of the1960s.
17
Clinical Symptoms at Different Stages of the Disease
50
leukopenia (< 4.1 x 10 /l)9
neutropenia (< 2.0 x 10 /l)9
ostealgia (%)
vertebrogenic syndrome (%)
hypotension (%)
bone marrow hypoplasia(< 41.6 x 10 /l)9
thrombocytopenia(< 180.0 x 10 /l)9
microsystems of CNS injuries (%)
55 60 65 70
years
8075
F i g . 1 7 . C l i n i c a l s y m p t o m a t o l o g y .

7/28/2019 Chronic Radiation Sickness Among Techa Riverside Residents
http://slidepdf.com/reader/full/chronic-radiation-sickness-among-techa-riverside-residents 26/54
7/28/2019 Chronic Radiation Sickness Among Techa Riverside Residents
http://slidepdf.com/reader/full/chronic-radiation-sickness-among-techa-riverside-residents 27/54
CHAPTER 4
Mortality of Patients with Diagnosed CRS
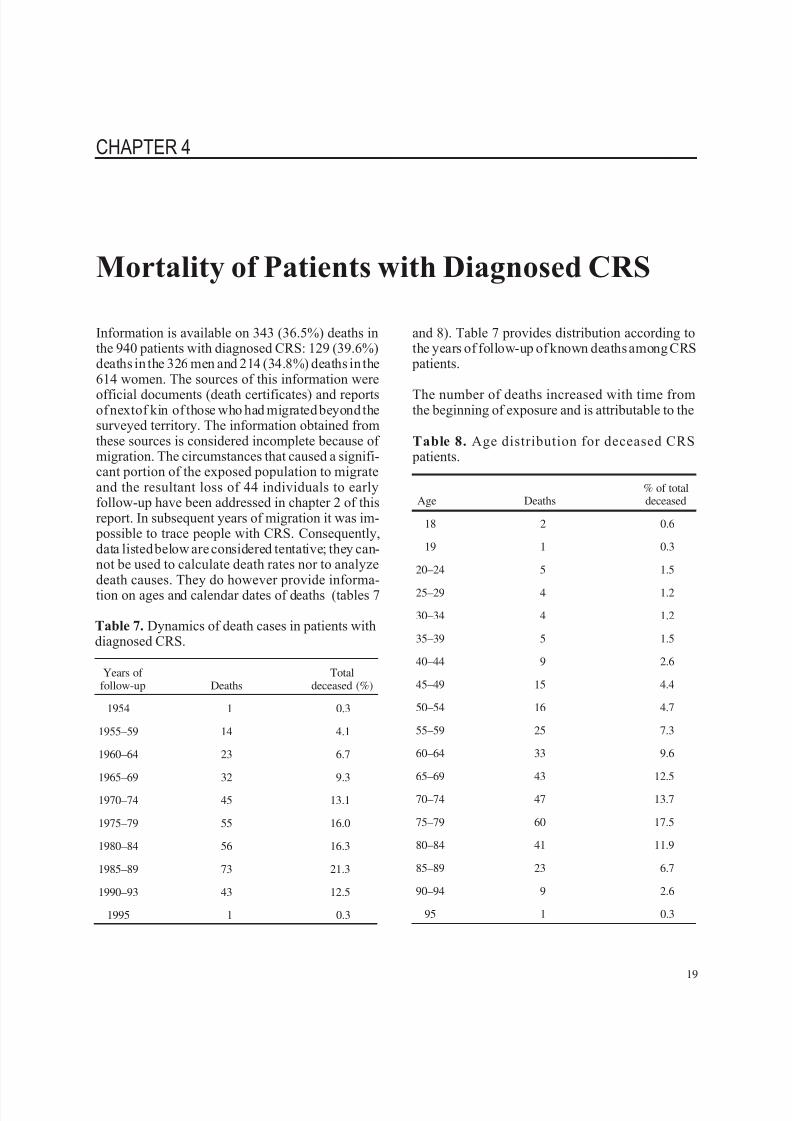
Information is available on 343 (36.5%) deaths inthe 940 patients with diagnosed CRS: 129 (39.6%)deaths in the 326 men and 214 (34.8%) deaths in the614 women. The sources of this information were
official documents (death certificates) and reportsof nextof kin of those who had migrated beyond thesurveyed territory. The information obtained fromthese sources is considered incomplete because of migration. The circumstances that caused a signifi-cant portion of the exposed population to migrateand the resultant loss of 44 individuals to earlyfollow-up have been addressed in chapter 2 of thisreport. In subsequent years of migration it was im-
possible to trace people with CRS. Consequently,data listed below are considered tentative; they can-not be used to calculate death rates nor to analyzedeath causes. They do however provide informa-tion on ages and calendar dates of deaths (tables 7
and 8). Table 7 provides distribution according tothe years of follow-up of known deaths among CRS
patients.
The number of deaths increased with time fromthe beginning of exposure and is attributable to the
19
Table 7. Dynamics of death cases in patients withdiagnosed CRS.
Years of follow-up Deaths
Totaldeceased (%)
1954 1 0.3
1955–59 14 4.1
1960–64 23 6.7
1965–69 32 9.3
1970–74 45 13.1
1975–79 55 16.0
1980–84 56 16.3
1985–89 73 21.3
1990–93 43 12.5
1995 1 0.3
Table 8. Age distribution for deceased CRS patients.
Age Deaths% of totaldeceased
18 2 0.6
19 1 0.3
20–24 5 1.5
25–29 4 1.2
30–34 4 1.2
35–39 5 1.5
40–44 9 2.6
45–49 15 4.4
50–54 16 4.7
55–59 25 7.3
60–64 33 9.6
65–69 43 12.5
70–74 47 13.7
75–79 60 17.5
80–84 41 11.9
85–89 23 6.7
90–94 9 2.6
95 1 0.3
7/28/2019 Chronic Radiation Sickness Among Techa Riverside Residents
http://slidepdf.com/reader/full/chronic-radiation-sickness-among-techa-riverside-residents 28/54
aging population. The small number of deaths in re-cent years (after 1990) is due to inadequate infor-mationand to theunavailabilityof death certificatesthat have not yet been retrieved from the offices of the civil registrars for these years. Increases in thenumber of deaths are naturally due to aging and can
be seen in the data on age distribution of death cases(table 8).
Data in table 8 show that 13.3% of CRS patientsdied at ages under 50, and 52.7% of patients died atages 70 and over.
Mortality from All Causes Based onDeath Certificates
Death rates for patients with diagnosed CRS werestudied by the cohort method in comparison tomatched controls. Death certificates stored in thearchives of the civil registrars confirmed the deaths.Copies were made of the death certificates for de-ceased residents of the surveyed territories throughwhich the Techa flows and the clean villages towhich exposed residents moved. Death certificateswere made for both the deceased residents of theTecha riverside area and for the unexposed peoplewho had lived in the same administrative districts
but far from the Techa. Death certificates on de-ceased residents of the Kunashaksky, Krasnoar-
meysky, Kaslinsky, Argayashsky, and Sosnovskydistricts of the Chelyabinsk Region are availablefor 1950–1993 and on deceased residents of theKataysky and Dalmatovsky districts of the KurganRegion for 1950–1982.
Death certificates include coded information on places of residence and principal causes of death asdefined in ICD-9 [13]. Information from paper documents was entered into a computer bank inwhich the death registry was compared with theregistry of the exposed population and, for the pur-
poses of this study, with the registry of CRS pa-tients. Comparisons were made with family name,given name, patronymic, birth date, and place of
birth. If all these parameters coincided, the deathcertificate was assigned the same systemic number as the CRS patient. When there was a deviation inthe data, the death certificate was included in thecontrol cohort.
The unexposed residents of the same surveyedterritories of the same administrative districtswere the control or comparison cohort. Such “re-gional” control met the requirements for compati-
bility with the study cohort. The members of thetwo cohorts lived in the same administrative dis-
tricts, same geographic and climate zones, wereinvolved in the same type of agricultural produc-tion, were in similar social conditions, and hadsimilar ethnic structures. Data on age and sexcomposition of the control cohort were derivedfrom records of regional statistical offices. Infor-mation on deaths in the control cohort wasindividualized.
It should be noted that the analysis presented belowis based on so-called crude (nonstandard) esti-mates. Age-specific compatibility of the cohortswas ensured by excluding the age cohort 0–14 years
from the control group; the same age cohort is ab-sent in the CRS study group. Each of the report sec-tions that addresses mortality contains age-specificdeath rates.
The use of the cohort method allowed estimation of death rates for CRS patients who lived in the sur-veyed territory until death—570 of the 940 CRScases met these requirements. Death certificatesconfirmed 221 deaths.
Coefficients of all causes of death for the CRScohort and the controls are provided in table 9.
20
Chapter 4
Table 9. Death rates from all causes.
Characteristics Patients with CRS Controls
Years of follow-up 1950–1989 1950–1990 1950–1982
Age cohorts(years) 18–90 18–90 15–90
Person-years 19,192 20,011 994,125
Death cases 194 221 11,674
Mortalitycoefficientx10
-3 10.11 11.04 11.74
90%confidenceintervals 8.76–11.59 9.60–12.56 11.50–11.97

7/28/2019 Chronic Radiation Sickness Among Techa Riverside Residents
http://slidepdf.com/reader/full/chronic-radiation-sickness-among-techa-riverside-residents 29/54
It is evident that the general mortalityrate is slightlylower (statistically insignificant) in CRS patientsin the period 1950–1989 when compared to theunexposed group. However, an increase of a year inthe follow-up time results in an increased death ratefor CRS patients and draws this rate closer to the
respective estimate for controls.
Age-Specific Mortality Characteristics
Age-specific mortality characteristics of patientswith diagnosed CRS were calculated for the period1950–1993 and of control cohorts in 1950–1982(table 10).
Death rates for all causes in patients aged 15–49
were lower for patients with CRS versus controls,and a statistically significant decrease in death rateswas noted in age groups 15–19 and 30–39. Deathrates for CRS patients (50 years and older) weresubstantially higher than for matched controls.
Dependence of Mortality Rates on Dose
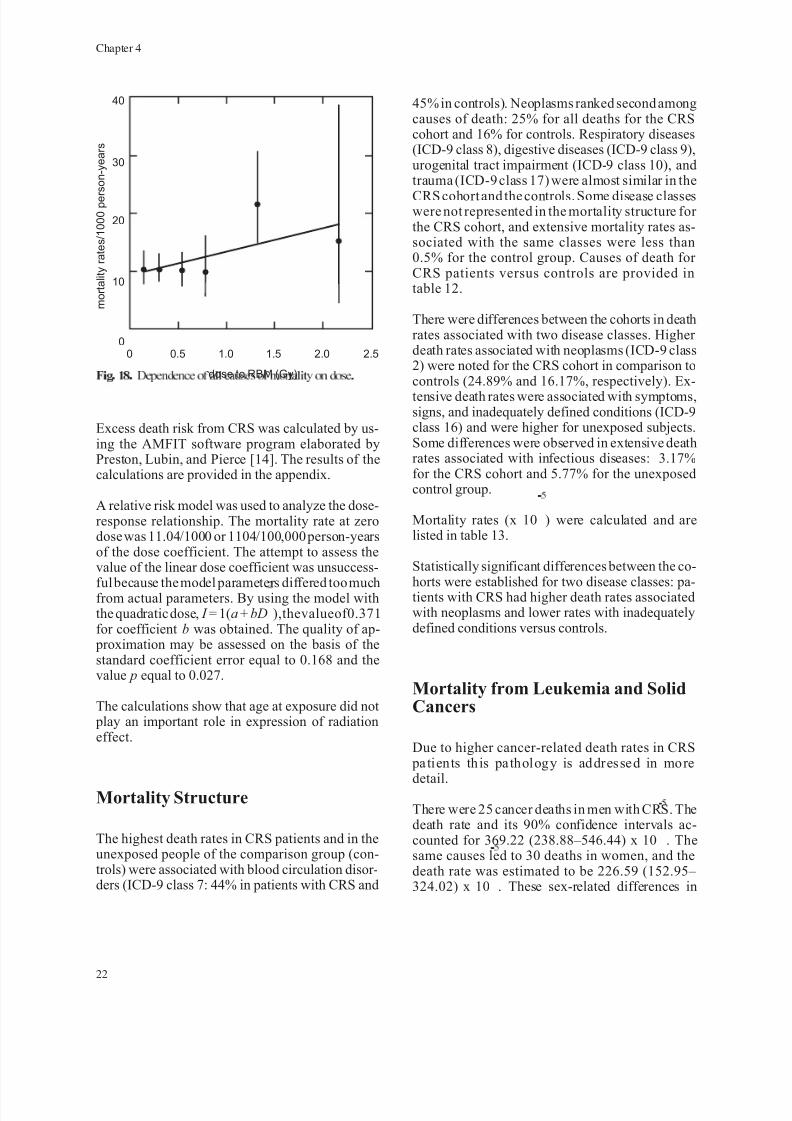
Mortality rates from all causes in different dosegroups are presented in table 11 and figure 18. Thehighest death rate was in the group with the
average dose to the RBM of 1.32 Gy, and it proved to be much higher than in the group withthe lowest dose. Calculation of linear regressionshowed a positive value of the dose coefficient to
be equal to 3.9 7 per 1000 per 1 Gy. The deathrate of CRS patients therefore does increase withdose.
21
Mortality of Patients with Diagnosed CRS
Table 10. Age-specific mortality parameters.
Mortality rates x 10-3
and 90%confidence intervals
Age groups(years)
Subjects withCRS Controls
15–19 0.34(0.04–1.23)
1.60(1.34–1.98)
20–29 1.63
(0.65–3.36)
2.64(2.40–2.90)
30–39 0.79(0.21–2.02)
4.07(3.79–4.36)
40–49 5.58(3.36–8.70)
6.39(6.04–6.76)
50–59 33.10(22.77–46.47)
10.47(9.95–11.00)
>60 480.00(408.48–560.64) 39.25(38.34–40.19)
All ages 11.04(9.63–12.56)
11.74(11.50–11.97)
Table 11. Dose dependences of mortality rates.
Dose groups,Gy to RBM
Average dose,Gy to RBM
Number of cases
Number of person-years
Mortality coefficient x10-3
(90% confidence intervals)
<0.2 0.14 52 5,045 10.31
(7.69–13.50)
0.2–0.4 0.3 73 7,075 10.32
(8.05–12.98)
0.4–0.7 0.53 48 4,778 10.05
(7.40–13.32)
0.7–1.0 0.78 14 1,449 9.66
(5.27–16.23)
1.0–1.5 1.32 30 1,398 21.46
(14.48–30.69)
>1.5 2.16 4 265 15.09
(4.11–38.64)
7/28/2019 Chronic Radiation Sickness Among Techa Riverside Residents
http://slidepdf.com/reader/full/chronic-radiation-sickness-among-techa-riverside-residents 30/54
Excess death risk from CRS was calculated by us-ing the AMFIT software program elaborated byPreston, Lubin, and Pierce [14]. The results of thecalculations are provided in the appendix.
A relative risk model was used to analyze the dose-response relationship. The mortality rate at zerodose was 11.04/1000 or 1104/100,000 person-yearsof the dose coefficient. The attempt to assess thevalue of the linear dose coefficient was unsuccess-
ful because the model parameters differed too muchfrom actual parameters. By using the model withthe quadratic dose, I = 1(a + bD2 ),thevalueof0.371for coefficient b was obtained. The quality of ap-
proximation may be assessed on the basis of thestandard coefficient error equal to 0.168 and thevalue p equal to 0.027.
The calculations show that age at exposure did not play an important role in expression of radiationeffect.
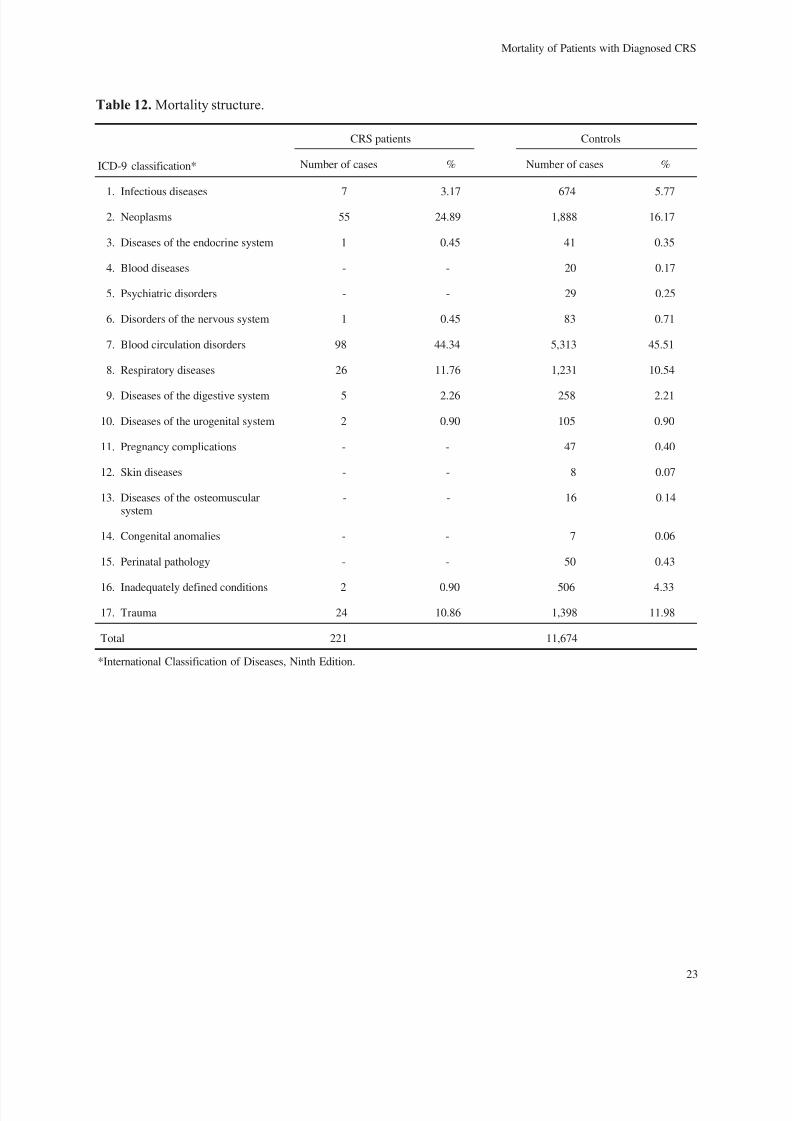
Mortality Structure
The highest death rates in CRS patients and in theunexposed people of the comparison group (con-trols) were associated with blood circulation disor-ders (ICD-9 class 7: 44% in patients with CRS and
45% in controls). Neoplasms ranked second amongcauses of death: 25% for all deaths for the CRScohort and 16% for controls. Respiratory diseases(ICD-9 class 8), digestive diseases (ICD-9 class 9),urogenital tract impairment (ICD-9 class 10), andtrauma (ICD-9 class 17) were almost similar in the
CRS cohort and the controls. Some disease classeswere not represented in the mortality structure for the CRS cohort, and extensive mortality rates as-sociated with the same classes were less than0.5% for the control group. Causes of death for CRS patients versus controls are provided intable 12.
There were differences between the cohorts in deathrates associated with two disease classes. Higher death rates associated with neoplasms (ICD-9 class2) were noted for the CRS cohort in comparison tocontrols (24.89% and 16.17%, respectively). Ex-
tensive death rates were associated with symptoms,signs, and inadequately defined conditions (ICD-9class 16) and were higher for unexposed subjects.Some differences were observed in extensive deathrates associated with infectious diseases: 3.17%for the CRS cohort and 5.77% for the unexposedcontrol group.
Mortality rates (x 10- 5 ) were calculated and arelisted in table 13.
Statistically significant differences between the co-horts were established for two disease classes: pa-tients with CRS had higher death rates associatedwith neoplasms and lower rates with inadequatelydefined conditions versus controls.
Mortality from Leukemia and SolidCancers
Due to higher cancer-related death rates in CRS pa ti en ts th is pa th ol og y is ad dres se d in mo re
detail.
There were 25 cancer deaths in men with CRS. Thedeath rate and its 90% confidence intervals ac-counted for 369.22 (238.88–546.44) x 10 - 5 . Thesame causes led to 30 deaths in women, and thedeath rate was estimated to be 226.59 (152.95– 324.02) x 10 - 5 . These sex-related differences in
22
Chapter 4
0
m o r t a l i t y r a t e s / 1 0 0 0 p e r s o n - y e a r s
0.5 1.51.0 2.0 2.5
dose to RBM (Gy)
0
10
20
30
40
F i g . 1 8 . D e p e n d e n c e o f a l l c a u s e s o f m o r t a l i t y o n d o s e .
7/28/2019 Chronic Radiation Sickness Among Techa Riverside Residents
http://slidepdf.com/reader/full/chronic-radiation-sickness-among-techa-riverside-residents 31/54
23
Mortality of Patients with Diagnosed CRS
Table 12. Mortality structure.
CRS patients Controls
ICD-9 classification* Number of cases % Number of cases %
1. Infectious diseases 7 3.17 674 5.77
2. Neoplasms 55 24.89 1,888 16.17
3. Diseases of the endocrine system 1 0.45 41 0.35
4. Blood diseases - - 20 0.17
5. Psychiatric disorders - - 29 0.25
6. Disorders of the nervous system 1 0.45 83 0.71
7. Blood circulation disorders 98 44.34 5,313 45.51
8. Respiratory diseases 26 11.76 1,231 10.54
9. Diseases of the digestive system 5 2.26 258 2.21
10. Diseases of the urogenital system 2 0.90 105 0.90
11. Pregnancy complications - - 47 0.40
12. Skin diseases - - 8 0.07
13. Diseases of the osteomuscularsystem
- - 16 0.14
14. Congenital anomalies - - 7 0.06
15. Perinatal pathology - - 50 0.43
16. Inadequately defined conditions 2 0.90 506 4.33
17. Trauma 24 10.86 1,398 11.98
Total 221 11,674
*International Classification of Diseases, Ninth Edition.

7/28/2019 Chronic Radiation Sickness Among Techa Riverside Residents
http://slidepdf.com/reader/full/chronic-radiation-sickness-among-techa-riverside-residents 32/54
24
Chapter 4
Table 13. Mortality rates for CRS patients and control group.
CRS Controls
ICD-9 classification* Cases Mortality rate** Cases Mortality rate
1. Infectious diseases 7 5.0
(14.03–72.10)
674 67.8
(62.71–73.16)
2. Neoplasms 55 274.8
(206.92–357.79)
1,888 189.9(181.16–198.82)
3. Diseases of the endocrinesystem
1 5.0(0.13–27.85)
41 4.1(2.94–5.56)
4. Blood diseases - - 20 2.0(1.22–3.08)
5. Psychiatric disorders - - 29 2.9(1.94–4.18)
6. Disorders of the nervous
system
1 5.0
(0.13–27.85)
83 8.3
(6.61–10.29)
7. Blood circulationdiseases
98 489.7(398.13–595.96)
5,313 534.4(519.44–549.36)
8. Respiratory diseases 26 129.9(84.82–190.95)
1,231 123.8(116.99–130.98)
9. Diseases of thedigestive organs
5 25.0(8.10–58.25)
258 25.9(22.79–29.01)
10. Diseases of theuro-genital system
2 10.0(1.21–36.10)
105 10.6(8.64–12.90)
11. Pregnancy complications - - 47 4.7(3.45–6.35)
12. Skin diseases - - 8 0.8(0.34–1.58)
13. Diseases of theosteomuscular system
- - 16 1.6(0.91–2.59)
14. Congenital anomalies - - 7 0.7(0.28–1.44)
15. Perinatal pathology - - 50 5.0(3.70–6.59)
16. Inadequately definedconditions
- 10.0(2.21–36.10)
506 50.9(46.57–55.48)
17. Trauma 24 119.9(76.86–178.65)
1,398 140.6(132.87–148.61)
Total 221 1104.3(962.69–1257.46)
11,674 1174.0(1150.0–1197.48)
*International Classification of Diseases, Ninth Edition.**Mortality rates per 100,000 person-years, and 90% confidence intervals in parentheses.
7/28/2019 Chronic Radiation Sickness Among Techa Riverside Residents
http://slidepdf.com/reader/full/chronic-radiation-sickness-among-techa-riverside-residents 33/54
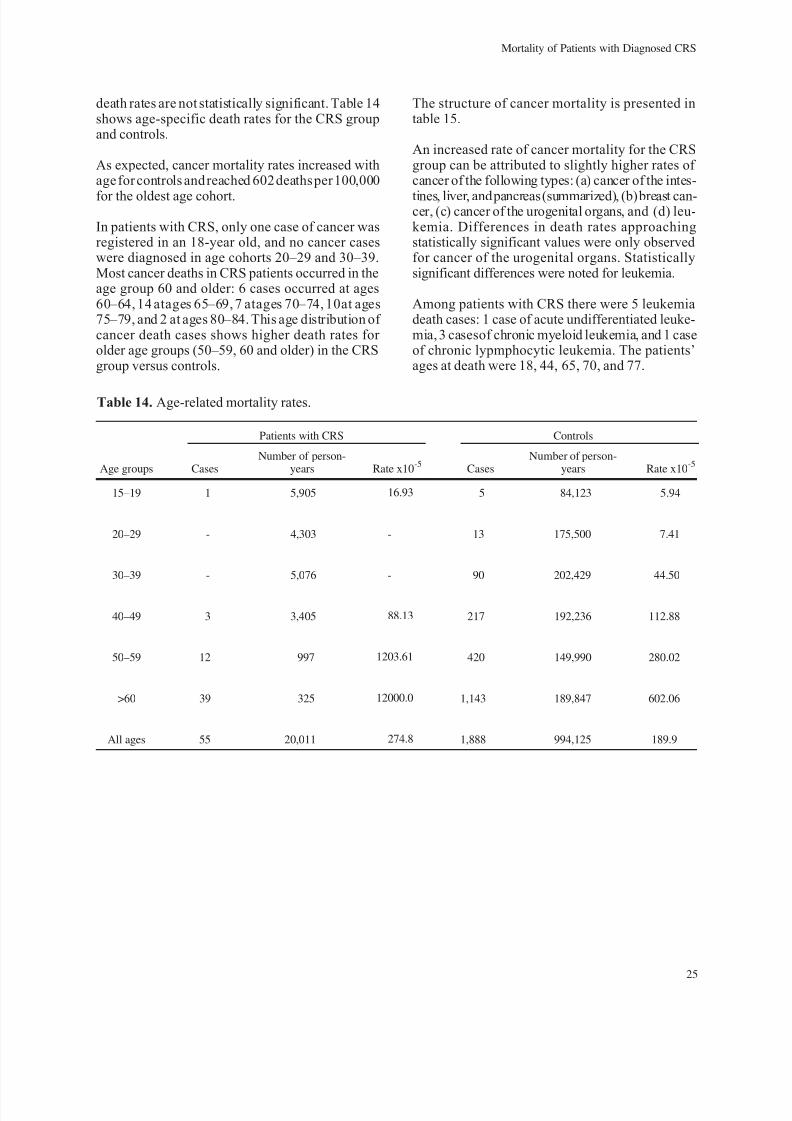
death rates are not statistically significant. Table 14shows age-specific death rates for the CRS groupand controls.
As expected, cancer mortality rates increased withage for controls and reached 602 deaths per 100,000
for the oldest age cohort.
In patients with CRS, only one case of cancer wasregistered in an 18-year old, and no cancer caseswere diagnosed in age cohorts 20–29 and 30–39.Most cancer deaths in CRS patients occurred in theage group 60 and older: 6 cases occurred at ages60–64, 14 atages 65–69, 7 atages 70–74, 10at ages75–79, and 2 at ages 80–84. This age distribution of cancer death cases shows higher death rates for older age groups (50–59, 60 and older) in the CRSgroup versus controls.
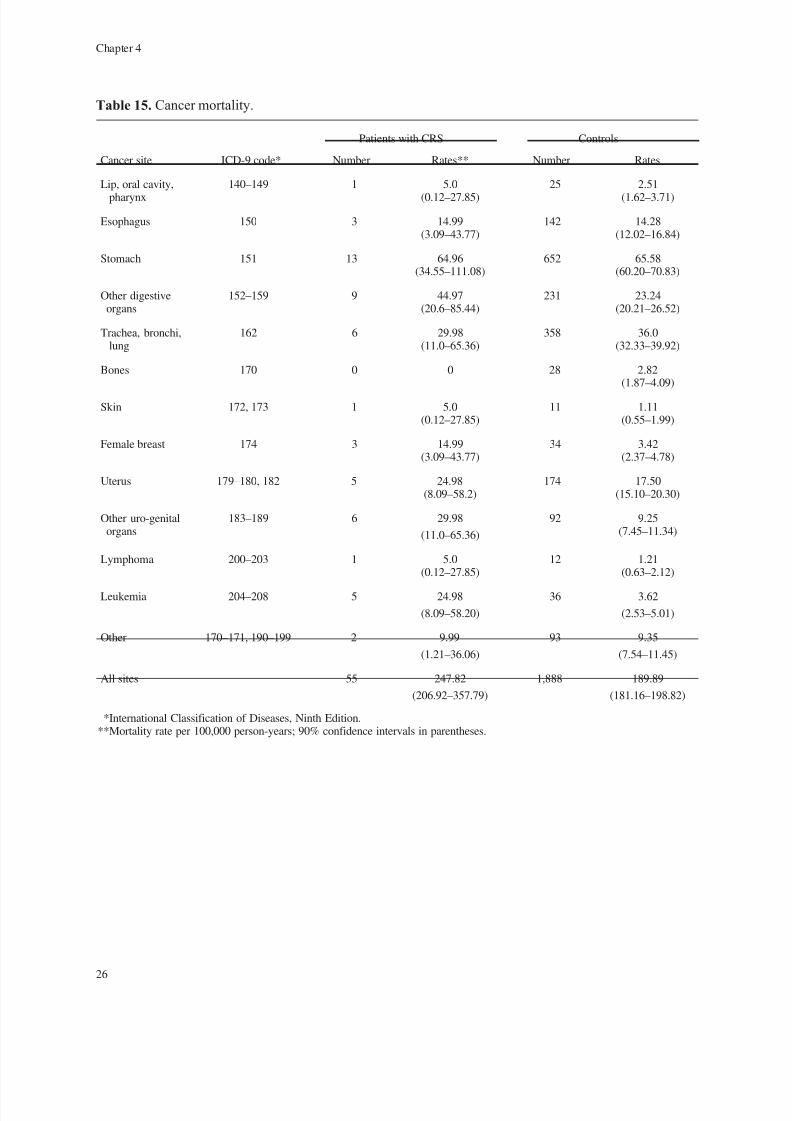
The structure of cancer mortality is presented intable 15.
An increased rate of cancer mortality for the CRSgroup can be attributed to slightly higher rates of cancer of the following types: (a) cancer of the intes-
tines, liver, and pancreas (summarized), (b)breast can-cer, (c) cancer of the urogenital organs, and (d) leu-kemia. Differences in death rates approachingstatistically significant values were only observedfor cancer of the urogenital organs. Statisticallysignificant differences were noted for leukemia.
Among patients with CRS there were 5 leukemiadeath cases: 1 case of acute undifferentiated leuke-mia, 3 casesof chronic myeloid leukemia, and 1 caseof chronic lypmphocytic leukemia. The patients’ages at death were 18, 44, 65, 70, and 77.
25
Mortality of Patients with Diagnosed CRS
Table 14. Age-related mortality rates.
Patients with CRS Controls
Age groups CasesNumber of person-
years Rate x10-5
CasesNumber of person-
years Rate x10-5
15–19 1 5,905 16.93 5 84,123 5.94
20–29 - 4,303 - 13 175,500 7.41
30–39 - 5,076 - 90 202,429 44.50
40–49 3 3,405 88.13 217 192,236 112.88
50–59 12 997 1203.61 420 149,990 280.02
>60 39 325 12000.0 1,143 189,847 602.06
All ages 55 20,011 274.8 1,888 994,125 189.9
7/28/2019 Chronic Radiation Sickness Among Techa Riverside Residents
http://slidepdf.com/reader/full/chronic-radiation-sickness-among-techa-riverside-residents 34/54
26
Chapter 4
Table 15. Cancer mortality.
Patients with CRS Controls
Cancer site ICD-9 code* Number Rates** Number Rates
Lip, oral cavity,
pharynx
140–149 1 5.0
(0.12–27.85)
25 2.51
(1.62–3.71)
Esophagus 150 3 14.99(3.09–43.77)
142 14.28(12.02–16.84)
Stomach 151 13 64.96(34.55–111.08)
652 65.58(60.20–70.83)
Other digestiveorgans
152–159 9 44.97(20.6–85.44)
231 23.24(20.21–26.52)
Trachea, bronchi,lung
162 6 29.98(11.0–65.36)
358 36.0(32.33–39.92)
Bones 170 0 0 28 2.82(1.87–4.09)
Skin 172, 173 1 5.0(0.12–27.85)
11 1.11(0.55–1.99)
Female breast 174 3 14.99(3.09–43.77)
34 3.42(2.37–4.78)
Uterus 179–180, 182 5 24.98(8.09–58.2)
174 17.50(15.10–20.30)
Other uro-genitalorgans
183–189 6 29.98
(11.0–65.36)
92 9.25(7.45–11.34)
Lymphoma 200–203 1 5.0(0.12–27.85)
12 1.21(0.63–2.12)
Leukemia 204–208 5 24.98
(8.09–58.20)
36 3.62
(2.53–5.01)
Other 170–171, 190–199 2 9.99
(1.21–36.06)
93 9.35
(7.54–11.45)
All sites 55 247.82
(206.92–357.79)
1,888 189.89
(181.16–198.82)
*International Classification of Diseases, Ninth Edition.**Mortality rate per 100,000 person-years; 90% confidence intervals in parentheses.

7/28/2019 Chronic Radiation Sickness Among Techa Riverside Residents
http://slidepdf.com/reader/full/chronic-radiation-sickness-among-techa-riverside-residents 35/54
Dose dependences of cancer mortality are shown intable 16 and figure 19.
It was impossible to trace a clear-cut dose depend-ence. The lowest coefficient value was found in thegroup with an average dose to the RBM of 0.78 Gy;the highest cancer mortality rate was registered inthe cohort group with an average dose of 1.32 Gy.The small number of analyzed cases resulted in a
very wide range of confidence intervals and conse-quently in considerable uncertainty of mortalitycoefficient values. However, approximating themortality rate dependence on absorbed dose using alinear regression equation produces the followingvalues: I = 211 + 86.03D, i.e.,a positive but not highinclination angle of the approximating curve.
Analysis of Mortality Rates forPatients with Verified Diagnoses of CRS
Chapter 9 of the first report [1] provides an analysisof the cases ofCRS inexposed residents inthe Uralsand the clinical picture of CRS in patients whose di-agnoses had been verified. Of the 940 cases initiallydiagnosed as CRS, 66 cases were validated withsufficient certainty. The dose rate to the RBM inthese patients was approximately 1 Gy, and typical
clinical manifestations that diminished with doserate were present. The age composition of thisgroup indicates that many were exposed in child-hood or adolescence. Thus, among the 66 verifiedcases, there were 46 patients (69.7%) whose ages atexposure were 19 and under, 18 patients (27.3%)were 20–39 years old, and only 2 patients (3%)were over 40.
27
Mortality of Patients with Diagnosed CRS
0
m o r t a l i t y
r a t e s / 1 0 0 , 0
0 0 p e r s o n - y e a r s
0.5 1.51.0 2.0 2.5
dose to RBM (Gy)
-500
0
500
1500
2000
1000
2500
F i g . 1 9 . D e p e n d e n c e o f c a n c e r m o r t a l i t y o n d o s e .
Table 16. Dependence of cancer mortality on dose.
Dose groupsGy to RBM
Average doseGy to RBM Number of cases
Number of person-years
Mortality rate x10-3
(90% confidence intervals)
<0.2 0.14 10 5,045 198.22
(95.15–364.72)
0.2–0.4 0.30 19 7,075 268.55
(161.67–418.94)
0.4–0.7 0.53 18 4,778 376.73
(223.40–595.23)
0.7–1.0 0.78 1 1,449 69.01
(1.73–384.39)
1.0–1.5 1.32 6 1,398 429.18
(111.59–935.61)
>1.5 2.16 1 265 377.36
(9.43–2101.9)

7/28/2019 Chronic Radiation Sickness Among Techa Riverside Residents
http://slidepdf.com/reader/full/chronic-radiation-sickness-among-techa-riverside-residents 36/54
Deaths in these 66 cases were analyzed for the period 1950 to 1992. The 16 deaths (24.2% of the66 cases) during this period occurred during thefollowing years:
1954–1959, 2 deaths,
1960–1969, 1 death,
1970–1979, 3 deaths,
1980–1989, 7 deaths, and
1990–1992, 3 deaths.
Number and percentage of deceased patients by agewere as follows:
one patient 19 years old (6.25%),
one patient 22 years old (6.25%),
one patient 30–39 years old (6.25%),
four patients 40–49 years old (25%),
one patient 50–59 years old (6.25%),
one patient 60–69 years old (6.25%), and
sevenpatients70yearsoldand older (43.75%).
Causes of death for confirmed cases of CRS are presented in table 17. Deaths were reported by thenext of kin in 5 cases but the exact causes of deathcannot be provided because the death certificateswere not available.
Six of the 16 deaths (37.5%) were due to neo- plasms—a higher percentage than the percentagesfor the total CRS group and for controls.
28
Chapter 4
Table 17. Causes of death for verified CRS cases.
Causes of death Number of deaths Percentage
Infectious diseasesTularemia 1 6.25
NeoplasmsLymphomaCancer of facial skin (with metastasis)Malignant tumor of the brainChronic myeloleukemiaAcute leukemia
611121
37.5
Diseases of the nervous systemDisseminated sclerosis 1 6.25
Respiratory diseasesBronchial asthma, cardiopulmonary
insufficiency1 6.25
Trauma and poisoningOverexposure to coldSuicide
211
12.50
Unknown causes 5 31.25
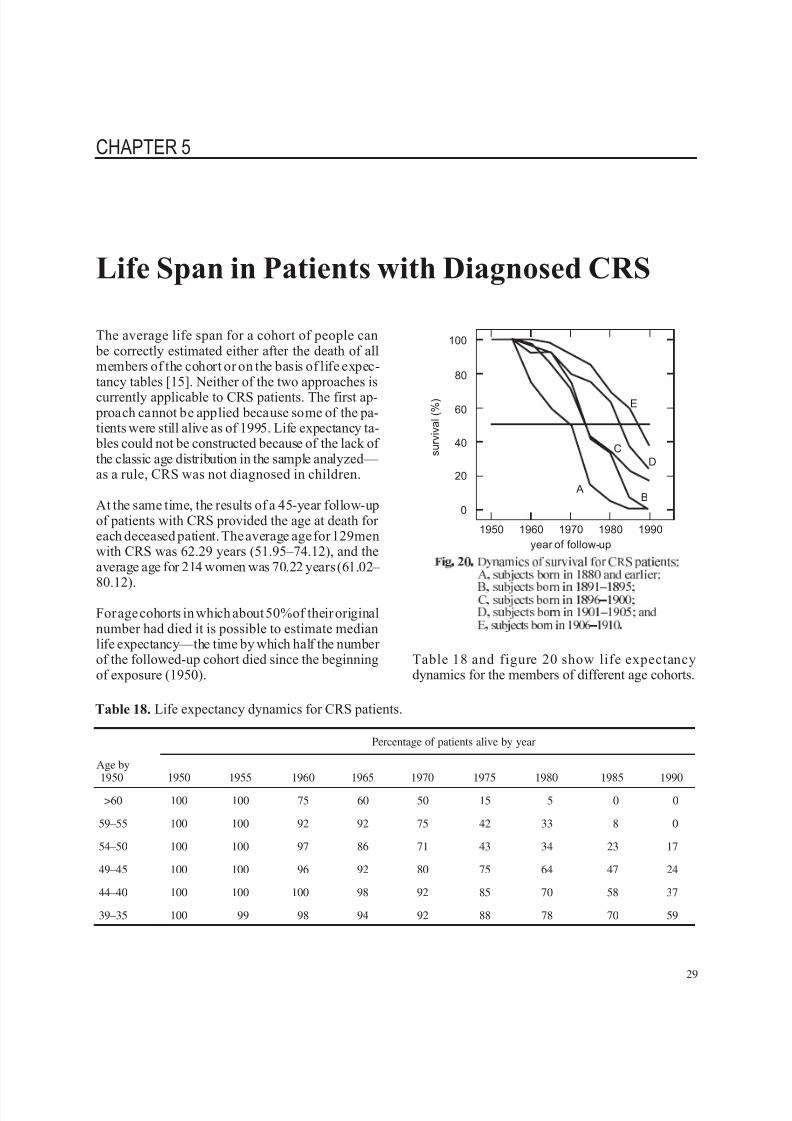
7/28/2019 Chronic Radiation Sickness Among Techa Riverside Residents
http://slidepdf.com/reader/full/chronic-radiation-sickness-among-techa-riverside-residents 37/54
CHAPTER 5
Life Span in Patients with Diagnosed CRS
The average life span for a cohort of people can be correctly estimated either after the death of allmembers of the cohort or on the basis of life expec-tancy tables [15]. Neither of the two approaches is
currently applicable to CRS patients. The first ap- proach cannot be applied because some of the pa-tients were still alive as of 1995. Life expectancy ta-
bles could not be constructed because of the lack of the classic age distribution in the sample analyzed— as a rule, CRS was not diagnosed in children.
At the same time, the results of a 45-year follow-upof patients with CRS provided the age at death for each deceased patient. The average age for 129menwith CRS was 62.29 years (51.95–74.12), and theaverage age for 214 women was 70.22 years (61.02–
80.12).
For age cohorts in which about 50%of their originalnumber had died it is possible to estimate medianlife expectancy—the time by which half the number of the followed-up cohort died since the beginningof exposure (1950).
Table 18 and figure 20 show life expectancydynamics for the members of different age cohorts.
29
Table 18. Life expectancy dynamics for CRS patients.
Percentage of patients alive by year
Age by1950 1950 1955 1960 1965 1970 1975 1980 1985 1990
>60 100 100 75 60 50 15 5 0 0
59–55 100 100 92 92 75 42 33 8 0
54–50 100 100 97 86 71 43 34 23 17
49–45 100 100 96 92 80 75 64 47 24
44–40 100 100 100 98 92 85 70 58 37
39–35 100 99 98 94 92 88 78 70 59
s u r v i v a l ( % )
1950 19701960 1980 1990
year of follow-up
0
E
C
A
D
B
20
60
80
40
100
F i g . 2 0 . D y n a m i c s o f s u r v i v a l f o r C R S p a t i e n t s :
A , s u b j e c t s b o r n i n 1 8 8 0 a n d e a r l i e r ;
B , s u b j e c t s b o r n i n 1 8 9 1 1 8 9 5 ;
C , s u b j e c t s b o r n i n 1 8 9 6 1 9 0 0 ;
D , s u b j e c t s b o r n i n 1 9 0 1 1 9 0 5 ; a n d
E , s u b j e c t s b o r n i n 1 9 0 6 1 9 1 0 .

7/28/2019 Chronic Radiation Sickness Among Techa Riverside Residents
http://slidepdf.com/reader/full/chronic-radiation-sickness-among-techa-riverside-residents 38/54
Time periods from the beginning of exposure (1950)to the year by which 50% of a given age cohort haddied were as follows:
20 years for subjects born in 1890 and earlier(aged 60 or older in 1950),
24 years for subjects born in 1891–1895(59–55),
24.4 years for subjects born in 1896–1900(54–50),
33.5 years for subjects born in 1901–1905(49–45), and
37.3 years for subjects born in 1906–1910(44–40).
Life expectancy estimates for patients with CRScorrelate with the calculated average life spanestimates obtained by M. M. Saurov et al. [16]
on the basis of mortality data for the entire ex- posed population. According to the dat a of this publicati on, the averag e life expect ancy was 16years for patients over 60, 25 years for patientsaged 50–59, and 35 years for patients aged40–49.
30
Chapter 5

7/28/2019 Chronic Radiation Sickness Among Techa Riverside Residents
http://slidepdf.com/reader/full/chronic-radiation-sickness-among-techa-riverside-residents 39/54
CHAPTER 6
Consequences of CRS
This report and the report of 1994 (1) on the deter-ministic effects of protracted radiation exposurewere prepared and published under the sponsorshipof AFRRI. The term “chronic radiation sickness”
was designated by Russian researchers. The symp-tom complex that formed the basis for a CRS diag-nosis was observed in workers at the Mayak plantthat produced weapon-grade plutonium and also inresidents of nearby villages who were exposed todischarges of radioactive wastes into the river Techa.
CRS was induced by chronic radiation exposure tosufficiently high doses, generally more than 1 Gy
per year, for many months or years. The most typi-cal manifestation of the disease was the disturbance
of hemopoiesis, represented in some patients byRBM hypoplasia, leukopenia, neutropenia, andthrombocytopenia in the peripheral blood and, insome instances, by later development of leukemia.Hemopoietic disturbances developed almost at thesame time as the signs of immune insufficiency.
Other symptoms of CRS were organic injury to thenervous system manifested by micronecroticchanges in the myelinic membrane of the nerveconductors at significant exposure doses as wellas by disturbed vascular and cardiac regulation,inhibited secretion of gastric glands, and asthenia.
In cases where dose accumulation occurred as a re-sult of exposure to a combination of external gammaradiation and incorporation of long-lived Sr-89 andSr-90 isotopes, key symptoms were ostealgia andmetabolic disorders of osteogenesis, accompaniedin some instances by the development of osteomye-lofibrosis. These deterministic symptoms werecharacterized by fairly distinct dynamics, and their
intensity diminished, as a rule, following cessationof exposure or significant reduction in dose rates.
The diagnosis of CRS was made in 1,268 nuclear
workers of the Mayak facility and in 940 residentsof the Techa riverside area.
As stated above, the diagnosis of CRS was errone-ous in a number of cases. Diagnoses were made at atime when even approximate estimates of individ-ual exposure doses were nonexistent. In the courseof dynamic follow-up of CRS patients, physicianswho made the diagnoses in the past had to admit todiagnostic mistakes in 199cases.Most mistakes oc-curred because CRS was confused with a generalsomatic disease simulating CRS or with a singular
transitive response to radiation exposure and not asa clear-cutsymptom complex of a specific disease.
It should be noted that no algorithm exists for diag-nosing CRS. Some researchers who have studiedCRS [17] maintain that the CRS symptom complexmay sometimes be represented by only a few of itssigns, and that the symptoms may be manifestedwith different intensity and may be transitive or long-standing.
Today, 45 years later, data that have accumulatedfrom the follow-up of CRS patients over the years
have helped describe in this report the dynamicsof the principal symptoms of the disease and itsoutcomes.
The key symptom of the condition was impairmentof the hemopoietic system. The existence of hema-tological problems in the followed-up CRS patientsis confirmed by the following observations: (a) de-
pendence of the number of cellular elements in the
31
7/28/2019 Chronic Radiation Sickness Among Techa Riverside Residents
http://slidepdf.com/reader/full/chronic-radiation-sickness-among-techa-riverside-residents 40/54
peripheral blood on dose accumulated in the RBM(decrease in leukocyte, neutrophil, and thrombo-cyte counts with dose), and (b) distinct dynamics of
blood parameters—clearly manifested reduction inthe number of cellular elements at the highest doserates and a subsequent normalization with decrease
in dose rate.
Currently there are no patients with clinical symp-toms of CRS. If we assume that the diagnoses of CRS were adequately substantiated, we have toconclude that the 674 cases that were traced by usdid end in recovery.
The average duration of the disease was 7.35 years,and the recovery time was directly dependent on theexposure dose. At doses in excess of 700 mSvto theRBM, repair processes lasted for more than 9 years.The duration of the disease was presumably de-
pendent on the patient’s age at exposure. Accordingto data cited in this report, the longest courses of CRS were noted in patients born in 1935–1939. Itmust be emphasized that individuals who were ado-lescents at the beginning of exposure absorbed thehighest doses to the RBM.
Data on the 343 deceased of the total 940 CRS pa-tients are available. The mortality rate for CRS pa-tients calculated according to the methods of epidemiological analysis was found to be withinthesame range as the rate for unexposed controls(11.04 and 11.74 per 1,000, respectively).
Although a certain increase in death rate propor-tionalto dose squared wasnoted, patients with diag-nosed CRS were dying at more advanced agescompared to matched unexposed controls.
The most common death causes for both exposed patients and control subjects were diseases associ-ated with disorders of blood circulation. Among pa-tients with CRS diagnosed earlier, neoplasmsaccounted for 55 deaths. The cancer death rate for
CRS patients was 274.8 (206.9–357.8), which washigher than the respective rate of 189.9 (181.2– 198.8) for the comparison group.
A statistically significant increase in leukemia inci-dence was noted in patients with diagnosed CRS:
one case of acute nondifferentiated leukemia, threecases of chronic myeloid leukemia, and one case of chronic lymphoid leukemia. The cases of acutenondifferentiated leukemia and chronic myeloidleukemia should obviously be regarded as outcomesof chronic exposure in patients who received sig-nificant doses to the RBM and developed hemo-
poietic hypoplasia shortly after the beginning of exposure.
However, it should be noted that theincreased can-cer mortality rate for patients with CRS did not re-sult in life span shortening. As a rule, such patients
developed tumors at advanced ages: 11% of casesat ages 60–64, and 60% of cases at ages over 65.The average age at death of 129 male patients whohad CRS was 62.29, and the average age for 214women was 70.22, which was not much lower thanthe respective values for unexposed members of thematched age cohorts.
Data on A-bomb survivors [18,19] also point tothe fact that life span shortening unrelated tocancer occurrence is highly questionable.Calcu-lations of life expectancy, if they involve elimi-nating cancer as the cause of death, increase lifeexpectancy by only 2 years. The conclusionabout an increased incidence of cancer that doesnot entail life span shortening correlates with thedata cited above in spite of the fact that it wasmade by us in a relatively small-sized CRSgroup.
Thus, CRS diagnosed in a number of Techa river-side residents was found to be associated withhigher cancer and leukemia death rates in particular
but did not cause significant life span shortening.
32
Chapter 6

7/28/2019 Chronic Radiation Sickness Among Techa Riverside Residents
http://slidepdf.com/reader/full/chronic-radiation-sickness-among-techa-riverside-residents 41/54
REFERENCES
1. Analysis of chronic radiation sickness cases inthe population of the Southern Urals (1994)Urals Research Center for Radiation Medicine,Chelyabinsk, Russia. AFRRI Contract Report94-1
2. Nikipelov BV, Lyzlov AF, Koshurnikova NA(1990) Experience of the first nuclear facility(irradiation level vs personnel health). Priroda
2:30-38 (in Russian)
3. Akleyev AV, Lyubchansky ER (1994) Envi-ronmental and medical effects of nuclear weapon production in the Southern Urals. TheScience of the Total Environment 142:1-8
4. Soyfer VN, Degteva MO, Kossenko MM,Akleyev AV, et al. (1992) Radiation accidentsin the Southern Urals (1949-1976) and their consequences. In: Problems of Eastern Europe,
No. 33-34:226-265,Washington (in Russian)
5. Cochran TB, Norris RS (1990) Soviet nuclear warhead production. In: Nuclear WeaponsDatabook. Natural Resources Defense Council,1350 New York Avenue, N.W., Washington,DC, No. 3:9-28
6. Okladnikova ND, Pesternikova VS, SuminaMV, Doshchenko VN (1994) Occupationaldiseases from radiation exposure at the firstnuclear plant in the USSR. The Science of theTotal Environment 142:9-17
7. Okladnikova ND, Pesternikova VS, SuminaMV, Kabasheva Nya, Azizova TV (1991) Hu-man chronic radiation sickness caused by ex-ternal gamma-irradiation, long-term stage.Bulletin of the Academy of Medical Sciences2:22-26 (in Russian)
8. Guskova AK, Baysogolov GD (1971) Radia-tion diseases in humans. Moscow
9. Nonstochastic effects of ionizing radiation(1984) ICRP Publication 41. Oxford: Perga-mon Press
10. Ilyin LA (ed) (1985) A guide to organization of medical services for persons exposed to ioniz-ing radiation. Moscow
11. Manual on Radiation Hematology (1974)
Technical Reports Series No. 123, Vienna
12. Kurshakov NA (1965) Chronic radiation sick-ness. Bulletin of Radiation Medicine 4:3-20
13. International Statistical Classification of Dis-eases, Injuries, and Causes of Death. NinthRevision. Vol. 1, World Health Organization,Geneva, 1977
14. Preston DL, Lubin JH, Pierce DA (1986-1993)Hirosoft International Corp., Seattle, Washing-
ton, USA
15. Gavrilov LA, Gavrilova NS (1986) Life span biology. Nauka, Moscow
16. Saurov MM, Gneusheva GI, Kossenko MM(1987) Demographic research in radiation hy-giene. L.A. Buldakov, Editor. Moscow
17. KurshakovNA, Kirillov CA (1967) Chronic ra-diation sickness as a consequence of externalirradiation. Bulletin of Radiation Medicine3:3-12 (for the year 1966)
18. Anderson RE (1973) Longevity in radiated hu-man populations, with peculiar reference to theatomic bomb survivors. American Journal of Medicine 55:643-656
19. Ionizing radiation: Sources and biological ef-fects. UNSCEAR. Report to the 1982 GeneralAssembly. Vol. 2, New York, 1982
33

7/28/2019 Chronic Radiation Sickness Among Techa Riverside Residents
http://slidepdf.com/reader/full/chronic-radiation-sickness-among-techa-riverside-residents 42/54

7/28/2019 Chronic Radiation Sickness Among Techa Riverside Residents
http://slidepdf.com/reader/full/chronic-radiation-sickness-among-techa-riverside-residents 43/54
Appendix

7/28/2019 Chronic Radiation Sickness Among Techa Riverside Residents
http://slidepdf.com/reader/full/chronic-radiation-sickness-among-techa-riverside-residents 44/54

7/28/2019 Chronic Radiation Sickness Among Techa Riverside Residents
http://slidepdf.com/reader/full/chronic-radiation-sickness-among-techa-riverside-residents 45/54
1
AMFIT Version 1.9a Dec 1993 April 28, 1996
Copyright (C) HiroSoft International 1986-93
Written by Dale L. Preston and Donald A. Pierce
DOS Protected Mode 80387 version
Single precision workspace size - 500000
use rez input @
BSF file created by DATAB on 4/28/1996 13:41
Input from rez.bsf
1004 records read 1004 records used
0 records rejected
Workspace for 300 variables. 13 are currently defined.
Up to 287 new variables can be created
fit @
Iter Step Deviance
0
1
2
3
4
5
6
7
0
3
2
0
0
0
0
0
3376.454
2426.953
852.1215
797.4037
724.3001
720.9407
720.9298
720.9298
Piece-wise exponential regression model
Product additive excess model {TO*(l + Tl + T2 +...)}
CASES is used for cases
PYR is used for person years
Parameter Summary Table
# Name Estimate Std. Error Test Stat. P value
Log-linear term 0
1 %CON...............
Deviance =
Pearson Chi2 =
7.007
720.930
2560.37
0.06727
df = 1003
104.2 < 0.001
ci@
95.00% Confidence Bounds
# Name Estimate Std. Error Lower Upper
Log-linear term 0
1 %CON ..............
EXP (estimate)
7.007
1104.
0.6727E-01
1.070
6.875
968.0
7.139
1260.

7/28/2019 Chronic Radiation Sickness Among Techa Riverside Residents
http://slidepdf.com/reader/full/chronic-radiation-sickness-among-techa-riverside-residents 46/54
2
line 1 dose*dose @
fit@
Iter Step Deviance
0
1
2
3
4
0
0
0
0
0
720.9298
713.5369
713.2260
713.2236
713.2235
Piece-wise exponential regression model
Product additive excess model {TO*(1 + T1 + T2 +...)}
CASES is used for cases
PYR is used for person years
Parameter Summary Table
# Name Estimate Std. Error Test Stat. P value
Log-linear term 0
1 %CON.............. 6.890 0.08378 82.24 < 0.001
Linear term 1
2 DOSE * DOSE.......
Deviance =
Pearson Chi2 =
0.3710
713.224
2177.85
0.1679
df = 1002
2.209 0.027
line 1 +dose @
fit @
Iter Step Deviance
0
1
2
0
0
0
713.2235
713.2202
713.2201
Piece-wise exponential regression model
Product additive excess model {TO*(l + Tl + T2 +...)}
CASES is used for cases
PYR is used for person years
Parameter Summary Table
# Name Estimate Std. Error Test Stat. P value
Log-linear term 0
1 %CON................ 6.880 0.1870 36.79 < 0.001
Linear term 1
2 DOSE * DOSE.......
3 DOSE..............
Deviance =
Pearson Chi2 =
0.3511
0.03935
713.220
2179.54
0.3492
0.6522
df = 1001
1.005
0.06034
0.315
> 0.5

7/28/2019 Chronic Radiation Sickness Among Techa Riverside Residents
http://slidepdf.com/reader/full/chronic-radiation-sickness-among-techa-riverside-residents 47/54
3
line 1 -dose @
line 1 +dose*dose*dose @
fit @
Iter Step Deviance
0
1
2
3
4
0
0
0
0
0
724.3283
713.3280
713.2242
713.2235
713.2235
Piece-wise exponential regression model
Product additive excess model {TO*(l + Tl + T2 +...)}
CASES is used for cases
PYR is used for person years
Parameter Summary Table# Name Estimate Std. Error Test Stat. P value
Log-linear term 0
1 %CON............... 6.890 0.08378 82.24 < 0.001
Linear term 1
2 DOSE * DOSE......
Deviance =
Pearson Chi2 =
0.3711
713.224
2177.84
0.1679
df = 1002
2.209 0.027
ci@
95.00% Confidence Bounds
# Name Estimate Std. Error Lower Upper
Log-linear term 0
1 %CON..............
EXP (estimate)
6.890
982.5
0.8378E-01
1.087
6.726
833.7
7.054
1158.
Linear term 1
2 DOSE * DOSE....... 0.3711 0.1679 0.4190E-01 0.7002
line 1 +age@
fit@
Iter Step Deviance
0
1
2
3
4
5
0
1
0
0
0
0
713.2235
713.1075
713.0699
713.0240
713.0222
713.0221

7/28/2019 Chronic Radiation Sickness Among Techa Riverside Residents
http://slidepdf.com/reader/full/chronic-radiation-sickness-among-techa-riverside-residents 48/54
4
Piece-wise exponential regression model
Product additive excess model {TO*(1 + T1 + T2 +...)}
CASES is used for cases
PYR is used for person years
Parameter Summary Table
# Name Estimate Std. Error Test Stat. P value
Log-linear term 0
1 %CON.............. 7.049 0.3916 18.00 < 0.001
Linear term 1
2 DOSE * DOSE.......
3 AGE...............
Deviance =
Pearson Chi2 =
0.3167
-0.002237
713.022
2085.92
0.1907
0.004933
df = 1001
1.660
-0.4535
0.097
> 0.5
end

7/28/2019 Chronic Radiation Sickness Among Techa Riverside Residents
http://slidepdf.com/reader/full/chronic-radiation-sickness-among-techa-riverside-residents 49/54
DISTRIBUTION LIST
DEPARTMENT OF DEFENSE
ARMED FORCES RADIOBIOLOGY RESEARCH INSTITUTEATTN: PUBLICATIONS BRANCH
ATTN: LIBRARY
ARMY/AIR FORCE JOINT MEDICAL LIBRARYATTN: DASG-AAFJML
ASSISTANT TO THE SECRETARY OF DEFENSEATTN: AEATTN: HA(IA)
DEFENSE SPECIAL WEAPONS AGENCYATTN: TITLATTN: DDIRATTN: RAEMATTN: MID
DEFENSE TECHNICAL INFORMATION CENTERATTN: ACQUISITIONATTN: ADMINISTRATOR
FIELD COMMAND DEFENSE SPECIAL WEAPONS AGENCYATTN: DASIACATTN: FCIEO
INTERSERVICE NUCLEAR WEAPONS SCHOOLATTN: DIRECTOR
LAWRENCE LIVERMORE NATIONAL LABORATORYATTN: LIBRARY
UNDER SECRETARY OF DEFENSE (ACQUISITION)ATTN: OUSD(A)/R&E
UNIFORMED SERVICES UNIVERSITY OF THE HEALTH SCIENCESATTN: LIBRARY
DEPARTMENT OF THE ARMY
HARRY DIAMOND LABORATORIESATTN: SLCSM-SE
OFFICE OF THE SURGEON GENERALATTN: MEDDH-N
U.S. ARMY AEROMEDICAL RESEARCH LABORATORYATTN: SCIENCE SUPPORT CENTER
U.S. ARMY CHEMICAL RESEARCH, DEVELOPMENT, &ENGINEERING CENTER
ATTN: SMCCR-RST
U.S. ARMY INSTITUTE OF SURGICAL RESEARCHATTN: COMMANDER
U.S. ARMY MEDICAL DEPARTMENT CENTER AND SCHOOLATTN: MCCS-FCM
U.S. ARMY MEDICAL RESEARCH AND MATERIEL COMMANDATTN: COMMANDER
U.S. ARMY MEDICAL RESEARCH INSTITUTE OF CHEMICALDEFENSE
ATTN: MCMR-UV-R
U.S. ARMY NUCLEAR AND CHEMICAL AGENCYATTN: MONA-NU
U.S. ARMY RESEARCH INSTITUTE OF ENVIRONMENTALMEDICINE
ATTN: DIRECTOR OF RESEARCH
U.S. ARMY RESEARCH LABORATORYATTN: DIRECTOR
WALTER REED ARMY INSTITUTE OF RESEARCHATTN: DIVISION OF EXPERIMENTAL THERAPEUTICS
DEPARTMENT OF THE NAVY
BUREAU OF MEDICINE & SURGERYATTN: CHIEF
NAVAL AEROSPACE MEDICAL RESEARCH LABORATORYATTN: COMMANDING OFFICER
NAVAL MEDICAL RESEARCH AND DEVELOPMENT COMMANDATTN: CODE 42
NAVAL MEDICAL RESEARCH INSTITUTE
ATTN: LIBRARY
NAVAL RESEARCH LABORATORYATTN: LIBRARY
OFFICE OF NAVAL RESEARCHATTN: BIOLOGICAL & BIOMEDICAL S&T
DEPARTMENT OF THE AIR FORCE
BROOKS AIR FORCE BASEATTN: AL/OEBZATTN: OEHL/RZATTN: USAFSAM/RZB
OFFICE OF AEROSPACE STUDIESATTN: OAS/XRS
OFFICE OF THE SURGEON GENERALATTN: HQ AFMOA/SGPTATTN: HQ USAF/SGES
U.S. AIR FORCE ACADEMYATTN: HQ USAFA/DFBL
U.S. AIR FORCE OFFICE OF SCIENTIFIC RESEARCHATTN: DIRECTOR OF CHEMISTRY & LIFE SCIENCES
OTHER FEDERAL GOVERNMENT
ARGONNE NATIONAL LABORATORYATTN: ACQUISITIONS
BROOKHAVEN NATIONAL LABORATORYATTN: RESEARCH LIBRARY, REPORTS SECTION
CENTER FOR DEVICES AND RADIOLOGICAL HEALTHATTN: DIRECTOR
GOVERNMENT PRINTING OFFICEATTN: DEPOSITORY ADMINISTRATION BRANCHATTN: CONSIGNED BRANCH
LIBRARY OF CONGRESSATTN: UNIT X

7/28/2019 Chronic Radiation Sickness Among Techa Riverside Residents
http://slidepdf.com/reader/full/chronic-radiation-sickness-among-techa-riverside-residents 50/54
LOS ALAMOS NATIONAL LABORATORYATTN: REPORT LIBRARY
NATIONAL AERONAUTICS AND SPACE ADMINISTRATIONATTN: RADLAB
NATIONAL AERONAUTICS AND SPACE ADMINISTRATIONGODDARD SPACE FLIGHT CENTER
ATTN: LIBRARY
NATIONAL CANCER INSTITUTEATTN: RADIATION RESEARCH PROGRAM
NATIONAL DEFENSE UNIVERSITYATTN: LIBRARY TECHNICAL SERVICES
U.S. DEPARTMENT OF ENERGYATTN: LIBRARY
U.S. EMBASSY, MOSCOWATTN: DEPARTMENT OF ENVIRONMENT, HEALTH,
OCEANS, AND FISHERIES
U.S. FOOD AND DRUG ADMINISTRATIONATTN: WINCHESTER ENGINEERING AND
ANALYTICAL CENTER
U.S. NUCLEAR REGULATORY COMMISSIONATTN: LIBRARY
RESEARCH AND OTHER ORGANIZATIONS
AUSTRALIAN DEFENCE FORCEATTN: SURGEON GENERAL
AUTRE, INC.ATTN: PRESIDENT
BRITISH LIBRARYATTN: ACQUISITIONS UNIT
CENTRE DE RECHERCHES DU SERVICE DE SANTE DES ARMEESATTN: DIRECTOR
FEDERAL ARMED FORCES DEFENSE SCIENCE AGENCY FOR NBCPROTECTION
ATTN: LIBRARY
FOA NBC DEFENCEATTN: LIBRARY
INHALATION TOXICOLOGY RESEARCH INSTITUTEATTN: LIBRARY
INSTITUTE OF NUCLEAR MEDICINE AND ALLIED SCIENCESATTN: DIRECTOR
INSTITUTE OF RADIOBIOLOGY, ARMED FORCESMEDICAL ACADEMY
ATTN: DIRECTOR
OAK RIDGE ASSOCIATED UNIVERSITIESATTN: MEDICAL LIBRARY
RESEARCH CENTER OF SPACECRAFT RADIATION SAFETYATTN: DIRECTOR
RUTGERS UNIVERSITYATTN: LIBRARY OF SCIENCE AND MEDICINE
UNIVERSITY OF CALIFORNIAATTN: DIRECTOR, INSTITUTE OF TOXICOLOGY &
ENVIRONMENTAL HEALTHATTN: LIBRARY,LAWRENCE BERKELEYLABORATORY
UNIVERSITY OF CINCINNATIATTN: UNIVERSITY HOSPITAL, RADIOISOTOPE
LABORATORY
URALS RESEARCH CENTER FOR RADIATION MEDICINEATTN: HEAD, EPIDEMIOLOGY LABORATORY
XAVIER UNIVERSITY OF LOUISIANAATTN: COLLEGE OF PHARMACY
2

7/28/2019 Chronic Radiation Sickness Among Techa Riverside Residents
http://slidepdf.com/reader/full/chronic-radiation-sickness-among-techa-riverside-residents 51/54
REPORT DOCUMENTATION PAGE F o r m A p p r o v e d
O M B N o . 0 7 0 4 - 0 1 8 8
P u b l i c r e p o r t i n g b u r d e n f o r t h i s c o l l e c t i o n o f i n f o r m a t i o n i s e s t i m a t e d t o a v e r a g e 1 h o u r p e r r e s p o n s e , i n c l u d i n g t h e t i m e f o r r e v i e w i n g i n s t r u c t i o n s , s e a r c h i n g e x i s t i n g d a t a s o u r c e s g a t h e r i n g a n d
m a i n t a i n i n g t h e d a t a n e e d e d , a n d c o m p l e t i n g a n d r e v i e w i n g t h e c o l l e c t i o n o f i n f o r m a t i o n . S e n d c o m m e n t s r e g a r d i n g t h i s b u r d e n e s t i m a t e o r a n y o t h e r a s p e c t o f t h i s c o l l e c t i o n o f i n f o r m a t i o n ,
i n c l u d i n g s u g g e s t i o n s f o r r e d u c i n g t h e b u r d e n , t o W a s h i n g t o n H e a d q u a r t e r s S e r v i c e s . D i r e c t o r a t e f o r I n f o r m a t i o n O p e r a t i o n s a n d R e p o r t s , 1 2 1 5 J e f f e r s o n D a v i s H i g h w a y , S u i t e 1 2 0 4 , A r l i n g t o n , V A
2 2 2 0 2 - 4 3 0 2 , a n d t o t h e O f f i c e o f M a n a g e m e n t a n d B u d g e t , P a p e r w o r k R e d u c t i o n P r o j e c t ( 0 7 0 4 - 0 1 8 8 ) , W a s h i n g t o n , D C 2 0 5 0 3 .
1 . A G E N C Y U S E O N L Y ( L e a v e b l a n k ) 2 . R E P O R T D A T E
February 1998
3 . R E P O R T T Y P E A N D D A T E S C O V E R E D
Contract Report
4 . T I T L E A N D S U B T I T L E
Chronic Radiation Sickness Among Techa Riverside Residents
5 . F U N D I N G N U M B E R S
6 . A U T H O R ( S )
Kossenko, M.M., Nikolayenko, L.A.,Yepifanova, S.B., Ostroumova, Y.V.
7 . P E R F O R M I N G O R G A N I Z A T I O N N A M E ( S ) A N D A D D R E S S ( E S )
Armed Forces Radiobiology Research Institute8901 Wisconsin Avenue
Bethesda, MD 20889-5603
8 . P E R F O R M I N G O R G A N I Z A T I O N
R E P O R T N U M B E R
CR98-1
9 . S P O N S O R I N G / M O N I T O R I N G A G E N C Y N A M E ( S ) A N D A D D R E S S ( E S ) 1 0 . S P O N S O R I N G / M O N I T O R I N G
A G E N C Y R E P O R T N U M B E R
1 1 . S U P P L E M E N T A R Y N O T E S
1 2 a . D I S T R I B U T I O N / A V A I L A B I L I T Y S T A T E M E N T
Approved for public release; distribution unlimited.
1 2 b . D I S T R I B U T I O N C O D E
1 3 . A B S T R A C T ( M a x i m u m 2 0 0 w o r d s )
This report was prepared at the Urals Research Center for Radiation Medicine, Chelyabinsk, Russia, under a con-tractual agreement with the Defense Nuclear Agency (DNA001-95-C-0156) and presents a further summary of re-search data on the deterministic effects in the population exposed to radiation from discharges of radioactivewastes by the Mayak radiochemical facility into the river Techa in the Urals. The first report, “Analysis of ChronicRadiationSickness Cases in the Population of theSouthern Urals,” was publishedby the Armed Forces Radiobiol-ogy Research Institute, Bethesda, Maryland (Contract Report 94-1) and provided the exposure conditions, expo-sure dose assessment, clinical picture of chronic radiation sickness diagnosed in 940 exposed residents, and
differential diagnoses of the disease.
This report summarizes the data on the dynamics of chronic radiation sickness, analyzes the processes of restora-tion of disrupted functions, and describes the outcomes of long-term effects.
1 4 . S U B J E C T T E R M S 1 5 . N U M B E R O F P A G E S
56
1 6 . P R I C E C O D E
1 7 . S E C U R I T Y C L A S S I F I C A T I O N
O F R E P O R T
UNCLASSIFIED
1 8 . S E C U R I T Y C L A S S I F I C A T I O N
O F T H I S P A G E
UNCLASSIFIED
1 9 . S E C U R I T Y C L A S S I F I C A T I O N
O F A B S T R A C T
UNCLASSIFIED
2 0 . L I M I T A T I O N O F
A B S T R A C T
UL
N S N 7 5 4 0 - 0 1 - 2 8 0 - 5 5 0 0 S t a n d a r d F o r m 2 9 8 ( R e v . 2 - 8 9 )
P r e s c r i b e d B y A N S I S t a 2 3 9 - 1 8

7/28/2019 Chronic Radiation Sickness Among Techa Riverside Residents
http://slidepdf.com/reader/full/chronic-radiation-sickness-among-techa-riverside-residents 52/54
C L A S S I F I E D B Y :
D E C L A S S I F Y O N :
S E C U R I T Y C L A S S I F I C A T I O N O F T H I S P A G E
SECURITY CLASSIFICATION OF THIS PAGE

7/28/2019 Chronic Radiation Sickness Among Techa Riverside Residents
http://slidepdf.com/reader/full/chronic-radiation-sickness-among-techa-riverside-residents 53/54
This publication is a product of the AFRRI Information Services Division.
Editor: Modeste Greenville. Graphic illustrators: Mark Behme and Guy
Bateman. Desktop publisher: Carolyn Wooden.

7/28/2019 Chronic Radiation Sickness Among Techa Riverside Residents
http://slidepdf.com/reader/full/chronic-radiation-sickness-among-techa-riverside-residents 54/54