Embed Size (px)
Citation preview

Church Planting Church Planting
Survivability Survivability
and and
Health Study Health Study
20072007
Ed Stetzer Ed Stetzer Phillip ConnorPhillip Connor

Church Planting Survivability and Health Study 2007
Compiled by the Center for Missional Research, NAMB, Alpharetta, Ga.
METHODOLOGYMETHODOLOGY
• A sample of 2266 church plants were selected among 12 A sample of 2266 church plants were selected among 12 denominations or church planting networks of which 2080 were denominations or church planting networks of which 2080 were determined to still exist or not.determined to still exist or not.
• Church plants who received denominational funding between Church plants who received denominational funding between 2000 and 2005 were included in the sample.2000 and 2005 were included in the sample.
• Over 1000 church plants were contacted by phone to determine Over 1000 church plants were contacted by phone to determine their survival, of which 500 completed the telephone surveytheir survival, of which 500 completed the telephone survey
• Among Southern Baptists, we attempted to contact all Nehemiah Among Southern Baptists, we attempted to contact all Nehemiah church planters appointed since 2000. church planters appointed since 2000.
• Over 100 factors were tested for higher attendance and baptisms Over 100 factors were tested for higher attendance and baptisms as well as church plant survivability. as well as church plant survivability.

DENOMINATIONS/NETWORKSDENOMINATIONS/NETWORKS Southern BaptistSouthern Baptist
Sovereign Grace MinistriesSovereign Grace Ministries
Baptist General ConferenceBaptist General Conference
Leadership NetworkLeadership Network
General BaptistsGeneral Baptists
WesleyanWesleyan
New Thing NetworkNew Thing Network
Assemblies of GodAssemblies of God
Evangelical FreeEvangelical Free
FoursquareFoursquare
Christian ChurchChristian Church
Lutheran Church Missouri SynodLutheran Church Missouri Synod

Church Planting Survivability and Health Study 2007
Compiled by the Center for Missional Research, NAMB, Alpharetta, Ga.
Figure 1 - Mean Annual Church Plant Attendance - All Denominations
0
10
20
30
40
50
60
70
80
90
1 2 3 4
Church Plant Year

Church Planting Survivability and Health Study 2007
Compiled by the Center for Missional Research, NAMB, Alpharetta, Ga.
Factors for higher attendanceFactors for higher attendance• meeting in a school in the first year meeting in a school in the first year • meeting in a theater in subsequent years meeting in a theater in subsequent years • meeting in a school in subsequent years meeting in a school in subsequent years • conducting a special children’s event (i.e., Fall Festival)conducting a special children’s event (i.e., Fall Festival)• mailing invitations to services, programs, events mailing invitations to services, programs, events • conducting new member classesconducting new member classes• using a church covenant signed by new members using a church covenant signed by new members • starting at least one daughter church within three years of the starting at least one daughter church within three years of the church plant church plant • having a proactive stewardship development plan enabling the having a proactive stewardship development plan enabling the church to be financially self-sufficientchurch to be financially self-sufficient• having multiple staff members rather than a single staff members having multiple staff members rather than a single staff members at the beginning of the church plantat the beginning of the church plant

Church Planting Survivability and Health Study 2007
Compiled by the Center for Missional Research, NAMB, Alpharetta, Ga.
Factors for higher attendanceFactors for higher attendance
• being financially compensated as the church planterbeing financially compensated as the church planter• receiving health insurance as the church planter whereby the receiving health insurance as the church planter whereby the majority of the premiums were paid for by the church plant, majority of the premiums were paid for by the church plant, sponsoring church, or denominationsponsoring church, or denomination• conducting a block party as an outreach eventconducting a block party as an outreach event• delegating leadership roles to church membersdelegating leadership roles to church members• conducting leadership training to church membersconducting leadership training to church members• working full-time over part- or half-time as the church planterworking full-time over part- or half-time as the church planter• being assessed prior to planting the church as the church planterbeing assessed prior to planting the church as the church planter• having the church planter’s expectations realizedhaving the church planter’s expectations realized

Church Planting Survivability and Health Study 2007
Compiled by the Center for Missional Research, NAMB, Alpharetta, Ga.
Figure 2 - Mean Annual Church Plant Baptisms - All Denominations
0
2
4
6
8
10
12
14
16
1 2 3 4
Church Plant Year
Mea
n B
apti
sm C
ou
nt
per
Yea
r

Church Planting Survivability and Health Study 2007
Compiled by the Center for Missional Research, NAMB, Alpharetta, Ga.
Factors for higher baptismsFactors for higher baptisms
• engaging in ministry evangelism (i.e., food banks, shelter, engaging in ministry evangelism (i.e., food banks, shelter, drug/alcohol recovery) drug/alcohol recovery) • starting at least one daughter church within three years of the starting at least one daughter church within three years of the church plant church plant • having a proactive stewardship development plan enabling the having a proactive stewardship development plan enabling the church to be financially self-sufficientchurch to be financially self-sufficient• conducting a mid-week children’s programconducting a mid-week children’s program• conducting a children’s special event (i.e., Fall Festival)conducting a children’s special event (i.e., Fall Festival)• sending out mailers for invitation to services and church eventssending out mailers for invitation to services and church events
Church Planting Survivability and Health Study 2007
Compiled by the Center for Missional Research, NAMB, Alpharetta, Ga.
Factors for higher baptismsFactors for higher baptisms
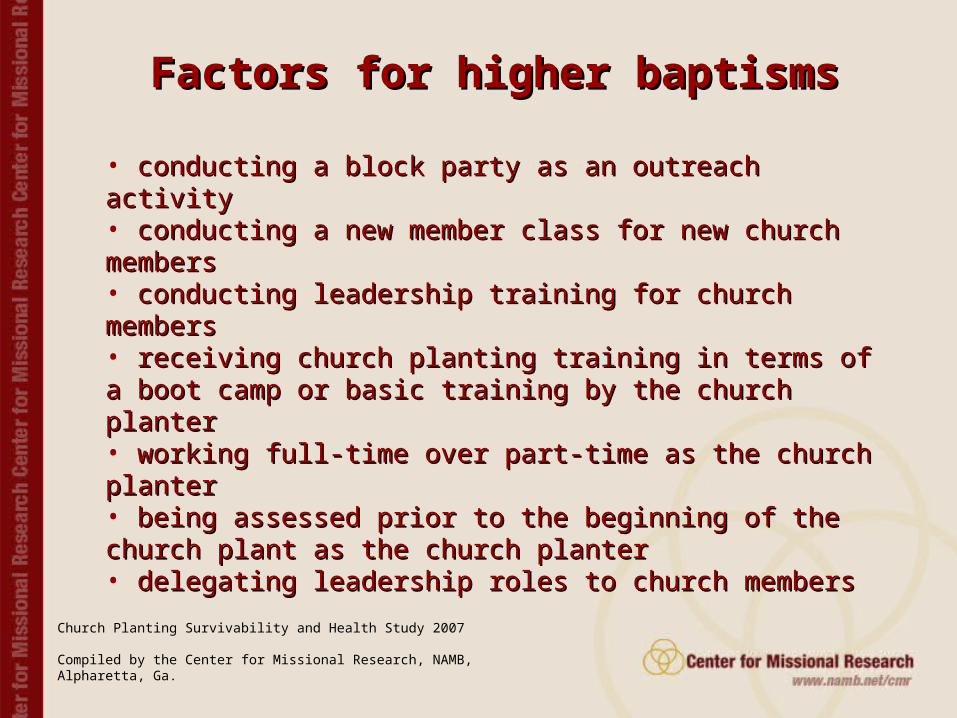
• conducting a block party as an outreach activityconducting a block party as an outreach activity• conducting a new member class for new church membersconducting a new member class for new church members• conducting leadership training for church membersconducting leadership training for church members• receiving church planting training in terms of a boot camp or basic receiving church planting training in terms of a boot camp or basic training by the church plantertraining by the church planter• working full-time over part-time as the church planterworking full-time over part-time as the church planter• being assessed prior to the beginning of the church plant as the being assessed prior to the beginning of the church plant as the church planter church planter • delegating leadership roles to church membersdelegating leadership roles to church members

Church Planting Survivability and Health Study 2007
Compiled by the Center for Missional Research, NAMB, Alpharetta, Ga.
Figure 3 - Mean Annual Church Plant Funding - All Denominations
0
5000
10000
15000
20000
25000
30000
35000
40000
1 2 3 4
Church Plant Year
Do
llar
s

Church Planting Survivability and Health Study 2007
Compiled by the Center for Missional Research, NAMB, Alpharetta, Ga.
Figure 4 - Mean Annual Church Plant Receipts - All Denominations
0
10000
20000
30000
40000
50000
60000
70000
80000
90000
100000
1 2 3 4
Church Plant Year
Do
llar
s

Church Planting Survivability and Health Study 2007
Compiled by the Center for Missional Research, NAMB, Alpharetta, Ga.
Figure 5. Church Planter Work Level by Financial Compensation Received
0
10
20
30
40
50
60
70
80
90
100
40+ hours per week 20-39 hours per week Less than 20 hours perweek
Perc
ent of churc
h p
lante
rs
ReceivedCompensation
Did NotReceiveCompensation

Church Planting Survivability and Health Study 2007
Compiled by the Center for Missional Research, NAMB, Alpharetta, Ga.
Figure 6 - Percent self-sufficient by year
0
10
20
30
40
50
60
70
80
1 2 3 4 5
Church Plant Year
Per
cen
t S
lef-
Su
ffic
ien
t

Church Planting Survivability and Health Study 2007
Compiled by the Center for Missional Research, NAMB, Alpharetta, Ga.
Figure 7 - Percent Church Plants Survived By Year All Denominations
99%92%
81%
68%
0%
10%
20%
30%
40%
50%
60%
70%
80%
90%
100%
1 2 3 4
Church Plant Year
Per
cen
t S
urv
ived

Church Planting Survivability and Health Study 2007
Compiled by the Center for Missional Research, NAMB, Alpharetta, Ga.
Factors Associated with SurvivabilityFactors Associated with Survivability
• Church Planter ExpectationsChurch Planter ExpectationsIncreases survivability by 400%Increases survivability by 400%
• Church Member Leadership DevelopmentChurch Member Leadership DevelopmentIncreases survivability by 250%Increases survivability by 250%
• Church Planter Peer GroupChurch Planter Peer GroupIncreases survivability by 135%Increases survivability by 135%
• Stewardship PlanStewardship PlanIncreases survivability by 178%Increases survivability by 178%

Church Planting Survivability and Health Study 2007
Compiled by the Center for Missional Research, NAMB, Alpharetta, Ga.
Figure 8 - Mean Annual Growth Rate for Worship Attendance
0
10
20
30
40
50
60
70
80
90
1 2 3 4
Church Plant Year
Per
cen
tag
e g
row
th

Church Planting Survivability and Health Study 2007
Compiled by the Center for Missional Research, NAMB, Alpharetta, Ga.
Figure 9 - Mean Annual Baptism Rate
0
5
10
15
20
25
30
35
1 2 3 4
Church Plant Year
Bap
tism
s p
er 1
00 M
emb
ers

Church Planting Survivability and Health Study 2007
Compiled by the Center for Missional Research, NAMB, Alpharetta, Ga.
Figure 10 - Mean Attendance by Year and New Member Class
0
10
20
30
40
50
60
70
80
90
100
Yr 1 Yr 2 Yr 3 Yr 4
Did NOT have a new member class Did have a member class

Church Planting Survivability and Health Study 2007
Compiled by the Center for Missional Research, NAMB, Alpharetta, Ga.
Figure 11 - Mean Attendance by Year and Church Covenant
0
10
20
30
40
50
60
70
80
90
100
Yr 1 Yr 2 Yr 3 Yr 4
Did NOT use a church covenant Did use a church covenant

Church Planting Survivability and Health Study 2007
Compiled by the Center for Missional Research, NAMB, Alpharetta, Ga.
Figure 12 - Mean Attendance by Year and Church Reproduction
0
20
40
60
80
100
120
140
Yr 1 Yr 2 Yr 3 Yr 4
Did NOT plant a daughter church within 3 years Did plant a daughter church within 3 years

Church Planting Survivability and Health Study 2007
Compiled by the Center for Missional Research, NAMB, Alpharetta, Ga.
Figure 13 - Mean Attendance by Year and Medical Insurance
0
20
40
60
80
100
120
Yr 1 Yr 2 Yr 3 Yr 4
Did NOT have medical insurance provided by denomination or sponsoring church
Did have medical insurance provided by denomination or sponsoring church

Church Planting Survivability and Health Study 2007
Compiled by the Center for Missional Research, NAMB, Alpharetta, Ga.
Figure 14 - Mean Baptism Count by Year and Church Reproduction
0
5
10
15
20
25
Yr 1 Yr 2 Yr 3 Yr 4
Did NOT plant a daughter church within 3 years Did plant a daughter church within 3 years

Church Planting Survivability and Health Study 2007
Compiled by the Center for Missional Research, NAMB, Alpharetta, Ga.
Figure 15 - Mean Baptism Count by Year and Stewardship Plan
0
2
4
6
8
10
12
14
16
18
20
Yr 1 Yr 2 Yr 3 Yr 4
Did NOT have a stewardship plan for self-sufficiency Did have a stewardship plan for self-sufficiency

Church Planting Survivability and Health Study 2007
Compiled by the Center for Missional Research, NAMB, Alpharetta, Ga.
Figure 16 - Mean Baptism Count by Church Planter Assessment and Year
0
2
4
6
8
10
12
14
16
Yr 1 Yr 2 Yr 3 Yr 4
Church Planter NOT assessed Church Planter assessed