Embed Size (px)
Citation preview

Churchgoing in the UK
A research report from Tearfundon church attendance in the UK
Christian Faith Media Booklet Cover:Layout 1 13/2/07 16:09 Page 1

Churchgoing in the UKA research report from Tearfund on church attendance in the UK
Authors: Jacinta Ashworth, Research Matters & Ian Farthing, Tearfund
April 2007
Forewords by Matthew Frost, Tearfund & Stephen Croft, Fresh ExpressionsIntroduction by Lynda Barley, Church of England
Tearfund, 100 Church Road, Teddington, Middlesex, TW11 8QE, UKTel: +44 (0)20 8977 9144www.tearfund.org
Tearfund is one of the UK’s leading relief and development agencies, working inpartnership with Christian churches around the world to tackle the causes andeffects of poverty. Tearfund works with churches in over 60 countries and hasnearly 40 years experience of working with church-based partners in responseto poverty and injustice.
Contact: Ian Farthing Market Research [email protected]
Photo credits: Jim Loring, Richard Hanson, Peter Caton & Marcus Perkins
Christian Faith Media Booklet Cover:Layout 1 13/2/07 16:09 Page 2
Forewords
By Matthew Frost Tearfund Chief Executive
Tearfund was founded nearly 40 years ago when local churches in the UK responded to disaster in Africa. In the decades since, Christians of all denominations from across the UK and Ireland have entrusted millions of pounds to Tearfund in order that we may tackle poverty and injustice in partnership with churches in some of the poorest communities in the world. In the face of global poverty I understand why people talk of losing hope. I have seen first hand the results of conflict, famine and flood on poor people in the developing world. And yet there is immense hope, even in remote communities decimated by poverty and overlooked by the rest of humanity. Much of that hope lies in the hands of local churches, whether in Africa, Asia, Latin America or here in the UK. It is local churches who are on the front line of care in a crisis. Whether in Lagos or London, faith is not abstract for these people; it is something practical and powerful. A recent Tearfund report on HIV & AIDS, Faith Untapped, concluded that local churches in Africa are part of a strong and hidden force on the frontline of tackling a pandemic which claims 8,000 lives every day. Unheralded, under funded, but making a huge difference. UK churches are very much part of a global picture. In Sunday schools across the UK and Ireland children learn from an early age that they have a responsibility to ‘love their neighbour’, whether that is a homeless person in their local community or a refugee family across the other side of the world displaced by war. We know from previous Tearfund research that over 50% of regular churchgoers say they hear about such critical local and international issues in their churches. And as a result many people wish to engage further through prayer, volunteering and donating money to Tearfund and other charities. These survey results are also a source of encouragement to us at Tearfund. For there are millions of Christians in the UK who will continue to play a role in a global network of churches with the presence, influence and resources to tackle material and spiritual poverty. Matthew Frost Chief Executive Tearfund

By Revd. Dr. Steven Croft Archbishops’ Missioner and Team Leader of Fresh Expressions This report is essential reading for all concerned with the place and future of the Christian church in contemporary Britain. The relationship between the Christian churches and the society around us is shifting rapidly. In order to understand these changes we need a range of different tools. Membership and attendance figures collected by denominations give us part of the picture. For many years, Christian Research has also published regular and valuable Church Census information, taking a snapshot of the number of people who attend church on a particular Sunday. This new research needs to be set alongside those figures. It offers a different perspective in that it surveys in detail those who don’t attend church as well as recording those who do. The results give us a detailed “map” of the population. There is significant encouragement here for the churches. A very substantial part of the population in the United Kingdom still attend church regularly or occasionally during the year. Christians are not (as yet) the tiny minority that some would suggest. This statistic alone has major implications not only for the churches but for public debate and public policy. However, there is other vital information in the survey. A third of the adult population now have no church background (in addition to those who belong to other faiths). They have never attended church apart from baptisms, weddings and funerals. This proportion is higher among younger people and is rising steadily over time. For the Christian faith to connect with this part of the population we need to begin again and begin with demonstrating Christian faith in practical service and care. The research underlines very deeply the need to grow new communities: fresh expressions of church alongside traditional congregations. These fresh expressions of church are beginning in different places as Christians do as Jesus did: going to where people are, listening to their culture, offering loving service, forming new communities, making disciples and beginning church in a different way. There is much encouragement in these new beginnings but also much to learn and a great challenge before us. Christian relief and development agency Tearfund has done an immense service in sharing the results of their research in these ways and I commend this report for careful study. With other relief and development agencies, Tearfund also has much to teach about the way to respond to the picture the research presents: the ancient-future lessons of love for our neighbour and seeking change and justice in God’s world. The Revd. Dr. Steven Croft Archbishops’ Missioner and Team Leader of Fresh Expressions
Contents
Executive Summary
1. Introduction: The context for churches today .......................................................................................1
2. Christianity and church experiences ......................................................................................................4
2.1 Religion ..............................................................................................................................................4
2.2 Church attendance and experience in the UK................................................................................5
2.3 Demographic variations ...................................................................................................................8
3. Profile and frequency of regular attendees ..........................................................................................13
3.1 Frequency of church attendance...................................................................................................13
3.2 Comparisons with other surveys ..................................................................................................14
3.3 Demographic variations in frequency of churchgoing................................................................14
3.4 Profile of regular churchgoers.......................................................................................................15
4. Reasons for churchgoing ......................................................................................................................19
4.1 Annual churchgoers’ reasons for attending ................................................................................19
4.2 Demographic variations in annual churchgoers’ reasons for churchgoing .............................20
4.3 Drawing infrequent and non-churchgoers into church...............................................................23
Appendix 1 Supplementary data...................................................................................................................28
Appendix 2 Research methods.....................................................................................................................40
Appendix 3 Comparison with other surveys..................................................................................................41

Key: Closed de-churched: former churchgoers unlikely to return. Open de-churched: former churchgoers who may return. Closed non-
churched: never been to church and unlikely to do so. Open non-churched: those who have never been church but are likely to in future.
Executive summary
This new report provides an authoritative insight into churchgoing in the UK. It is based on a representative poll of 7,000 adults. It highlights potential new audiences for churches and how Christianity is still a spiritual driving force for over half the population. It has been commissioned by Christian relief and development agency Tearfund, which for the past 40 years has been supported by local churches across the UK to help churches in the poorest communities of the world tackle poverty and injustice.
More than half the UK is Christian
Christianity is still the predominant faith in the UK with over half (53%) or 26.2 million adults claiming to be Christian; while other faiths account for 6%. So, three out of five people in the population are affiliated with faith and the remainder claim to have no religion (39%). (Section 2.1)
7.6 million attend church monthly (including 4.9 million weekly)
Given the competing demands for time it is reasonable to equate monthly attendance with a commitment to regular churchgoing. 7.6 million UK adults (15%) attend at least monthly. The majority of these, 4.9 million (10% of UK adults) attend at least weekly. Adding in fringe and occasional churchgoers (5 million) means that one in four UK adults (26%) or 12.6 million attend church at least once a year. (Section 2.2, 3.1)
Nearly 3 million likely to go in future
There is a clear opportunity for churches to attract new members by tapping into the 2.9 million people (6% of UK adults) who are likely to go to church in future. The personal touch is a major trigger. A personal invite, family or a friend attending or difficult personal circumstances, are most likely to encourage people into church. (Section 2.2, 4.3)
Two thirds are out of touch with church
Two thirds of UK adults (66%) or 32.2 million people have no connection with church at present (nor with another religion). These people are evenly divided between those who have been in the past but have since left (16 million) and those who have never been in their lives (16.2 million). This secular majority presents a major challenge to churches. Most of them - 29.3 million - are unreceptive and closed to attending church; churchgoing is simply not on their agenda. (Section 2.2)

Key: Closed de-churched: former churchgoers unlikely to return. Open de-churched: former churchgoers who may return. Closed non-
churched: never been to church and unlikely to do so. Open non-churched: those who have never been church but are likely to in future.
Nearly 1 million adults attend ethnic majority churches
This is composed of 9% black majority, 1% Asian majority and 2% Chinese or other ethnic majority. The largest denomination groupings among ethnic majority churches overall are Pentecostal (23%), Roman Catholic (23%) and Church of England/Anglican (19%). Regular churchgoing is particularly high among adults of black ethnic origin at 48% - over three times the proportion among white adults (15%). (Sections 2.3, 3.4)
22% of London goes to church
Despite being a multi-cultural city with more people of other faiths (20%) than anywhere else in the UK, Greater London also has one of the highest numbers of regular churchgoers (22%), second only to Northern Ireland. (Section 2.3)
45% go to church in Northern Ireland
There are significantly more regular churchgoers than average in Northern Ireland (the highest at 45%). Scotland has slightly above average regular churchgoers (18%), followed by England (14%) and Wales marginally below average (12%). In Scotland and Wales those with a tradition of churchgoing at some point in their life outweigh those with no experience of church at all, whilst the reverse is true in England. (Section 2.3)
The devoted core
The following are all more likely than average to be regular churchgoers:
• Women (19% attend at least monthly)
• ABs (21%)
• Over 55 year olds (22%)
• Those of black ethnic origin (48%)

1
Key: Closed de-churched: former churchgoers unlikely to return. Open de-churched: former churchgoers who may return. Closed non-
churched: never been to church and unlikely to do so. Open non-churched: those who have never been church but are likely to in future.
1. Introduction: The context for churches today By Revd Lynda Barley Head of Research & Statistics Church of England
Britain at the beginning of the twenty first century is a nation seeking identity. At first glance the past has been left behind to wholeheartedly embrace individual choice and secular consumerism prominently among its modern day gods. But research is beginning to show that there is more, far more going on out of apparent sight in everyday life in Britain today. At times of national and individual crisis, for example, we see faith bubbling out from under the surface. Our churches and cathedrals become places of pilgrimage. People create impromptu shrines to remember the passing of those of special meaning to them. Perhaps our religious past is beginning to catch up with us again as Britain re-evaluates the relevance of its inherited Christianity to the increasingly pluralistic future. In some ways we see the pendulum swinging back in favour of faith being acceptable in public life as well as in the lives of individuals but the context for churches is now even more complex than before. The global market place of religion and belief presents churches with huge challenges across vastly differing neighbourhoods in Britain. Consider for a moment these well substantiated modern day descriptions of faith in Britain today:
• Britain is still a predominantly Christian country. When people are asked what their religion is more than 7 in 10 consider themselves to be Christian1 although closer questioning will reduce that number as this Tearfund research reveals.
• Britain is still a country that believes in God whereas belief in a personal God has declined markedly. More than 2 in 3 (67%) of people in Britain today believe in God while 1 in 4 (26%) believe in a personal God2.
• Britain remains a country that prays. About 2 in 3 people (66%) pray as individuals, a third (38%) pray every month and a quarter (25%) every week3. Even among those who never attend church, 41% pray4.
And yet week-by-week in modern day Britain this personal belief does not play out into any obvious religious practise. We do not see people worshipping in our churches to any significant extent and growing numbers have lost touch with church in any shape or form. The limited research that has been carried out assumes varying definitions of regular, occasional and lapsed churchgoing but the picture emerging confirms that a growing proportion of people have had little, if any, contact with the church (or Sunday school) across their lives while church attendance among those that have is becoming less frequent. Mission opportunities are very different when to step over the church threshold is an unknown experience compared with attitudes when there is a known church to which they
1 2001 UK Government Census and ORB national polls in 2001/2003/2005.
2 Gallup/ORB/ICM national surveys 1968 to 2004.
3 British Social Attitudes Survey, 1998
4 Opinion Research Business national poll, 2001

2 Key: Closed de-churched: former churchgoers unlikely to return. Open de-churched: former churchgoers who may return. Closed non-
churched: never been to church and unlikely to do so. Open non-churched: those who have never been church but are likely to in future.
can return. This Tearfund research helps us to understand that the further people are from the church (in terms of churchgoing), the less likely they are to attend in the future. Alongside this is the growing realisation that most people today see themselves as ‘spiritual’ rather than in any sense ‘religious’ 5. There has been a rise in awareness of all things spiritual including a Godless spirituality with many adopting a ‘pick ‘n mix’ approach to their spiritual lives.
Yet amidst all this social change churches continue to have a unique and valued role in community life. More than 6 in 10 people (63%) would be concerned if their local church or chapel was not there and 86% have been inside for some reason in the last year6. Churches often continue to have important roles in our neighbourhoods and to enjoy links with local communities that are the envy of many. At Christmas we see large congregations in our churches and sometimes on other key occasions too but generally this does not transfer to attendance at normal week by week church services. Modern day popular opinion expects churches to accommodate people at their request, it welcomes churches’ involvement in community life but it resists involvement in church life. Modern day lifestyles also count against regular church attendance and post-modern antipathy to commitment deters church membership. So churches have to consider afresh the pressures and priorities of their mission in today’s world.
Much has been written about the decline in churchgoing in modern day Britain and not all of it helpful7. What is increasingly clear is that people are not agreed as to what it is to be a ‘churchgoer’. Is it traditional weekly Sunday attendance at services or is this often prevented by churches embracing a monthly cycle of different services of worship? With changing lifestyles and Sunday observance becoming more difficult for many, is attendance at church services during the week adequate? Do we consider church attendance on several occasions (beyond weddings, baptisms and funerals) during the year sufficient to be called a churchgoer? Just how different are our criteria for churchgoing than, say, cinema-going? Only about half the population say that they never attend church. This Tearfund research adopts a middle ground of at least monthly attendance as indicative of a commitment to ‘regular churchgoing’.
This research also helps us to understand more fully the different ways in which people attach themselves to church so churches can relate better to those with whom they come into contact. The importance of personal invitation is affirmed but what is becoming clear is that there are a wealth of means by which churches can reach out to an increasingly pluralistic nation that has become more open to God than we have supposed. Christendom may no longer be a reality in the west but our Christian roots are under close scrutiny.
Revd Lynda Barley Head of Research & Statistics Church of England
5 Research reported in ‘Christian Roots, Contemporary Spirituality’, Lynda Barley (Church House Publishing, 2006)
6 Research reported in ‘Community value’, Lynda Barley (Church House Publishing, 2007)
7 Discussed further in ‘Churchgoing today’, Lynda Barley (Church House Publishing, 2006)

3 Key: Closed de-churched: former churchgoers unlikely to return. Open de-churched: former churchgoers who may return. Closed non-
churched: never been to church and unlikely to do so. Open non-churched: those who have never been church but are likely to in future.
This research
This report represents the main findings that emerge from research conducted by TNS on behalf of Christian relief and development agency Tearfund among a representative poll of 7,000 adults in the UK, aged 16 or over, between 8th February to 5th March 2006. A sample of this magnitude provides robust evidence on churchgoing behaviour.
As well as documenting the proportions who attend church on a regular or occasional basis, the research also looks beyond this core to the whole of UK society – including those who have experienced church in the past (‘de-churched’), those who have never been to church (‘non-churched’) and those of other faiths. The report also explores variations in churchgoing behaviour by demographics, reasons for churchgoing and triggers to attendance.
The Technical Appendix is included in the electronic version of this report which is available to download from the Tearfund website www.tearfund.org. The Technical Appendix provides supporting tables and charts that are referenced within the main body of the report. (Appendix 1), full details of the research methods (Appendix 2) and discussion of how this research sits within the context of other research on churchgoing (Appendix 3).
4 Key: Closed de-churched: former churchgoers unlikely to return. Open de-churched: former churchgoers who may return. Closed non-
churched: never been to church and unlikely to do so. Open non-churched: those who have never been church but are likely to in future.
2. Christianity and church experiences
2.1 Religion
Tearfund asked UK adults, “Do you regard yourself as belonging to any particular religion?”
Just over half (53%) of UK adults belong to the Christian religion, which is equivalent to 26.2 million adults in the population. 6% or 3.2 million adults belong to other faiths, meaning that three out of five UK adults have a religious affiliation. The remaining two fifths (39%), 19 million adults, say they have no religion.
An identical question has been asked on the Government’s British Social Attitudes Survey for many years. The latest results from 2004 were very similar, indicating 53% Christian, 3% other faiths, 43% no religion8. However affiliation to Christianity is higher on the Census. On the 2001 Census, 72% of the UK population said they were Christian, 5% other religions, 16% no religion and 7% declined to answer. However the Census in England and Wales asked a softer question “What is your religion?”.9
These comparisons suggest a difference between nominal affiliation on a Census form and being truly committed to a particular faith. In England and Wales around one in four of those adults who would describe themselves nominally as Christian on the Census form do not consider that they actually ‘belong’ to the Christian religion. Similarly around one in six of people classifying themselves as other religions on the Census do not consider they ‘belong’ to that religion.
Religious affiliation varies by gender, age and region as shown in Figure 1 in Appendix 1. Key variations are described below.
Faith or no faith
• Men are less interested in Christianity than women. Among women, there are close to twice as many Christians (60%) than those with no religion (33%). However men are less likely to affiliate to the Christian faith (47%), with just as many who are non-religious (45%).
• Older people are more likely to belong to the Christian faith. Three quarters of 65 -74 year olds and 82% of over 75 year olds, compared with an average 53%. At the other end of the age spectrum only a third of 16-34 year olds are Christian, and among under 45 year olds the non-religious outnumber Christians.
So the proportion of Christians increases with increasing age. This may be due to a cohort effect - that is older generations have greater affiliation to Christianity and younger people will not age into religion, to any greater extent.
8 Among a sample of 3,200 adults in Great Britain, aged 18 or over.
9 In Scotland and Northern Ireland the question included ‘belonging’ in the wording.

5 Key: Closed de-churched: former churchgoers unlikely to return. Open de-churched: former churchgoers who may return. Closed non-
churched: never been to church and unlikely to do so. Open non-churched: those who have never been church but are likely to in future.
Christianity or other faiths
• Significantly, 11% of 16-34 year olds belong to religions other than Christianity compared with an average of 6%. This is related to the younger age profile of ethnic minorities in the UK.
• Greater London is a multi-faith city with one in five adults (20%) belonging to a religion other than Christianity, half of adults are Christian (49%) and only a quarter of Londoners (just 27%) have no religion (compared to a national average of 39%).
• Northern Ireland is very different from the rest of the UK in that 81% are Christians and only 0.4% belong to other religions.
2.2 Church attendance and experience in the UK
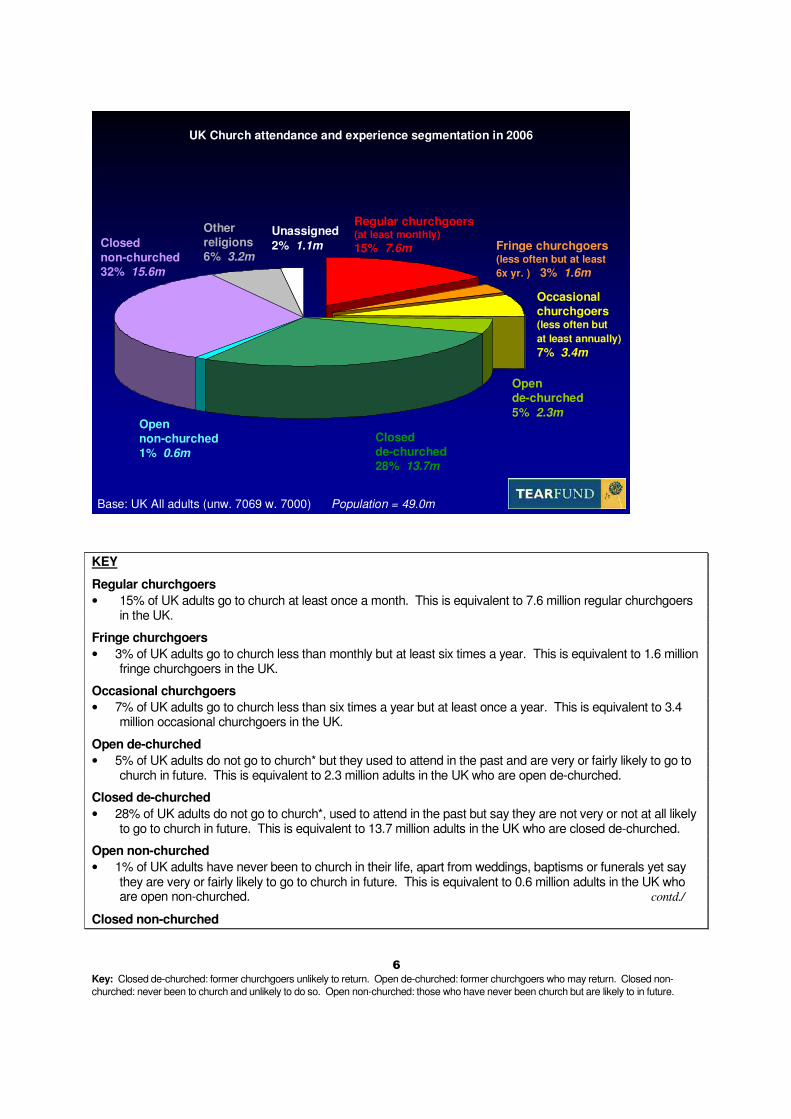
To help paint as comprehensive a picture as possible of churchgoing habits and experiences, Tearfund created a segmentation model, adapted from one developed by Philip Richter and Leslie Francis (1998)10. The Tearfund research asked all adults except those of other religions their frequency of church attendance. Current churchgoers were classified as either regular, fringe or occasional attendees. People who had not attended church in the last year were categorised according to their past and anticipated future attendance at church:
� Had they been to church in the past - “de-churched” � Had they never attended church, apart from weddings, baptisms or funerals - “non-
churched” � Were they fairly/very likely to go to church in the future - “open” to attending � Were they unlikely/not at all likely to go to church in the future - “closed” to attending
in future). The precise questioning used is available upon request. The resulting model which provides a comprehensive picture of church experience in the UK is shown in Figure 1a.
Figure 1a Model of church attendance and experience in the UK
10
‘Gone but not forgotten’, Philip Richter & Leslie Francis. (Darton, Longman and Todd, 1998)
6 Key: Closed de-churched: former churchgoers unlikely to return. Open de-churched: former churchgoers who may return. Closed non-
churched: never been to church and unlikely to do so. Open non-churched: those who have never been church but are likely to in future.
Fringe churchgoers(less often but at least
6x yr. ) 3% 1.6m
Open de-churched
5% 2.3m
Closedde-churched 28% 13.7m
Opennon-churched
1% 0.6m
Closed
non-churched 32% 15.6m
Unassigned
2% 1.1m
Other religions 6% 3.2m
Regular churchgoers(at least monthly)
15% 7.6m
Occasionalchurchgoers(less often but
at least annually)
7% 3.4m
Base: UK All adults (unw. 7069 w. 7000) Population = 49.0m
UK Church attendance and experience segmentation in 2006
KEY
Regular churchgoers
• 15% of UK adults go to church at least once a month. This is equivalent to 7.6 million regular churchgoers in the UK.
Fringe churchgoers
• 3% of UK adults go to church less than monthly but at least six times a year. This is equivalent to 1.6 million fringe churchgoers in the UK.
Occasional churchgoers
• 7% of UK adults go to church less than six times a year but at least once a year. This is equivalent to 3.4 million occasional churchgoers in the UK.
Open de-churched
• 5% of UK adults do not go to church* but they used to attend in the past and are very or fairly likely to go to church in future. This is equivalent to 2.3 million adults in the UK who are open de-churched.
Closed de-churched
• 28% of UK adults do not go to church*, used to attend in the past but say they are not very or not at all likely to go to church in future. This is equivalent to 13.7 million adults in the UK who are closed de-churched.
Open non-churched
• 1% of UK adults have never been to church in their life, apart from weddings, baptisms or funerals yet say they are very or fairly likely to go to church in future. This is equivalent to 0.6 million adults in the UK who are open non-churched. contd./
Closed non-churched

7 Key: Closed de-churched: former churchgoers unlikely to return. Open de-churched: former churchgoers who may return. Closed non-
churched: never been to church and unlikely to do so. Open non-churched: those who have never been church but are likely to in future.
• 32% of UK adults have never been to church in their life, apart from weddings, baptisms or funerals and are not very or not at all likely to go to church in future. This is equivalent to 15.6 million adults in the UK who are open closed non-churched.
Other religions
• 6% of UK adults, equivalent to 3.2 million people, belong to religions other than Christianity.
Unassigned
• Only 162 respondents (2%) were “unassigned” because they did not answer the question on prior church
attendance, although none of these had been to church in the last 12 months. A third of them attended
church less than once a year or never, whilst two thirds declined to state their frequency of attendance.
* never attend or go less than once a year.
If we consider that attending church at least once a month is indicative of a commitment to regular churchgoing, then there are 15% of UK adults who are regular churchgoers, which projects to around 7.6 million people. However there are just as many adults in the UK - 7.3 million or 15% - who are either fringe churchgoers, occasional churchgoers or open de-churched. These people have some sympathy or connection with church through infrequent or sporadic attendance, or they have attended in the past and are open to returning. Outside of current regular churchgoers, these are potentially the most receptive people to approaches aimed at encouraging greater or renewed commitment to churchgoing. There are a further 600,000 adults who have no experience of church at all yet are open to going in future - the open non-churched. This small group of receptive people are likely to need different approaches to attract them into church because of their secular background and unfamiliarity with churchgoing (see Section 4.3) but they may also have less pre-conceptions about what to expect. Adding together the open de-churched (2.3 million) and the open non-churched (0.6 million) gives 2.9 million people (6% of UK adults) who say they are likely to go to church in future. Put another way, one in every seventeen UK adults are open to churchgoing, if only churches reach out to them. A third (33%) of UK adults are de-churched (16 million people) and a third (33%) are non-churched (16.2 million). Therefore 32.2 million or two thirds (66%) of UK adults are secular in that they have no connection with church at present. The vast majority of these – 29.3 million – are ‘closed’ to attending church in future (equivalent to 60% of all adults). This highlights the ongoing challenge facing churches today in attracting new members from a secular audience, for most of whom churchgoing is simply not on their agenda.

8 Key: Closed de-churched: former churchgoers unlikely to return. Open de-churched: former churchgoers who may return. Closed non-
churched: never been to church and unlikely to do so. Open non-churched: those who have never been church but are likely to in future.
Demographic variations
The size of each of the segments in this model varies by religion, ethnicity, gender, age, region and social status. Variations by these demographics are described below with supporting data in tables and charts at Appendix 1 of the Technical Appendix (available on Tearfund’s website www.tearfund.org).
Christian but not churchgoers?
Among the 53% of UK adults who say they belong to the Christian religion, three in ten (28%) are regular churchgoers – nearly twice the national average - and a further 17% attend at least annually. This raises the question, ‘what is being a Christian?’ and how much is it about attending church. This also highlights the opportunity for churches to consider ways to engage with and include Christian followers to become more active churchgoers. Christians who are not attending church at present tend to be closed de-churched (29%) rather than closed non-churched (18%); although this balance may shift in future. Adults who say they have ‘no religion’ are predominantly closed non-churched (57%); only 5% have attended church in the last year. (Figure 2 in Appendix 1).
Men less open to church Women are more regular churchgoers than men (19% vs. 11%) and also more likely to be infrequent attendees or open de-churched (18% vs. 12% men). Men are much more likely to be closed non-churched i.e. with no prior experience of church and unlikely to change their ways (Figure 2 in Appendix 1).
Churchgoing in black culture Regular churchgoing is particularly high among adults of black ethnic origin at 48% - over three times the proportion among white adults (15%). Asians are predominantly of other religions (85%) and half as likely to be regular churchgoers (7%) as white adults. (Figure 3 in Appendix 1).
Churchgoing a waning tradition? There are substantial variations in the balance of difference segments by age (see Figure 1b). Our research cannot confirm whether people will adopt the current churchgoing habits of their elders as they progress through life or retain their existing behaviour. They may not necessarily retain all the characteristics of their cohort - they may also make some changes in behaviour as they move into different life stages. Young adults, who are predominantly

9 Key: Closed de-churched: former churchgoers unlikely to return. Open de-churched: former churchgoers who may return. Closed non-
churched: never been to church and unlikely to do so. Open non-churched: those who have never been church but are likely to in future.
closed non-churched are likely to remain characterised as such, as they age, although they may exhibit some increased churchgoing as they start families and enter middle age. The relative balance is likely to be towards cohort effects outweighing life stage effects, since trend data11 suggest that churchgoing is in decline and UK society is becoming increasingly secular. Regular churchgoing is more prevalent among older people, rising from only 10% of 16-24 year olds to 26% of over 75 year olds. The proportions of fringe and occasional churchgoers hold broadly steady by age. The proportion who are open non-churched is marginally (but significantly) higher among adults aged 16-34, at 2%, compared with 1% among all adults. In other words despite their lack of experience of church, young adults are less likely to have ruled it out completely.
Figure 1b Church attendance and experience in the UK, by age
All 16-24 25-34 35-44 45-54 55-64 65-74 75+
Unweighted base: (7069) (937) (1122) (1308) (1077) (1033) (972) (620)
% % % % % % % %
Regular churchgoer 15 10 11 12 15 18 25 26
Fringe churchgoer 3 3 2 3 3 4 4 4
Occasional churchgoer 7 3 7 8 7 8 8 6
Open de-churched 5 6 4 6 4 6 3 2
Closed de-churched 28 18 21 25 30 32 36 41
Open non-churched 1 2 2 1 1 1 1 1
Closed non-churched 32 45 39 34 31 26 19 16
Other religions 6 11 11 7 5 4 3 3
Unassigned 2 2 2 3 3 1 2 1
Base: UK All adults (unw. 7069 w. 7000)
Younger people: more non-churched & other religions.
Older people: more regular churchgoers & de-churched.
= significantly above average Underline = significantly below average
On considering the secular segments of society, an interesting pattern emerges by age. The proportion that are closed de-churched increases from 18% of 16-24s to 41% of over 75s; whilst the opposite is true for closed non-churched, decreasing from 45% of 16-24s to 16% of over 75s.
11
“Pulling Out of the Nosedive: A Contemporary picture of churchgoing. What the 2005 English Church Census reveals”
Dr. Peter Brierly, Christian Research (2006)

10 Key: Closed de-churched: former churchgoers unlikely to return. Open de-churched: former churchgoers who may return. Closed non-
churched: never been to church and unlikely to do so. Open non-churched: those who have never been church but are likely to in future.
Among over 55s the proportions that are closed de-churched outweigh the proportions that are closed non-churched. Among middle aged adults aged 45-54 the proportions who are closed de-churched and closed non-churched are equivalent (30% and 31% respectively). Among 16-44 year olds the proportion who are closed non-churched outweighs the proportion who are closed de-churched. In other words, younger adults are more likely to have grown up with no experience of church and be closed to the possibility of attending, whereas older people are more likely to have experienced church at some point in their life and rejected it. Logically, younger adults who are non-churched now, cannot become de-churched as they age, unless they first become churchgoers; so it is likely that the proportion of middle-aged and older people who are non-churched will gradually increase in future. Concomitantly, the proportion that is de-churched is anticipated to decline in future, as the elderly who have greatest history of churchgoing gradually pass away.
Figure 4 in Appendix 1 projects the actual number of people in each segment for different age bands.
National and regional variations
Patterns of church attendance and experience are by no means constant throughout the UK. There are variations reflecting the differing heritages of the four component parts of the UK and across the English regions. Figure 5 in the Appendix projects the actual number of people in each segment for each of the constituent countries, as well as for Great Britain12.
• Northern Ireland has the highest percentage of regular churchgoers at 45% and only 44% either de-churched or non-churched (Figure 1c).
• Wales is arguably the most secular nation, in the sense that over three quarters (78%) are either de-churched or non-churched and only 12% are regular churchgoers.
• Wales and Scotland have the highest proportions who are closed de-churched (46% and 34% respectively). In these nations, those with a tradition of churchgoing at some point in their life outweigh those with no experience of church at all.
• In England the reverse is true: those with no experience of churchgoing (34%) marginally outnumber those who have been to church at some time in their life (31%). England has the highest proportion of the four nations who are closed non-churched (33%). England is the most multi-cultural of the four nations with 7% of other religions.
12
Great Britain has an almost identical church attendance profile to the whole of the UK since Northern Ireland accounts for
less than 3% of the UK population, so despite Northern Ireland having much higher church attendance than elsewhere this
has only a very small impact on the UK profile.
11 Key: Closed de-churched: former churchgoers unlikely to return. Open de-churched: former churchgoers who may return. Closed non-
churched: never been to church and unlikely to do so. Open non-churched: those who have never been church but are likely to in future.
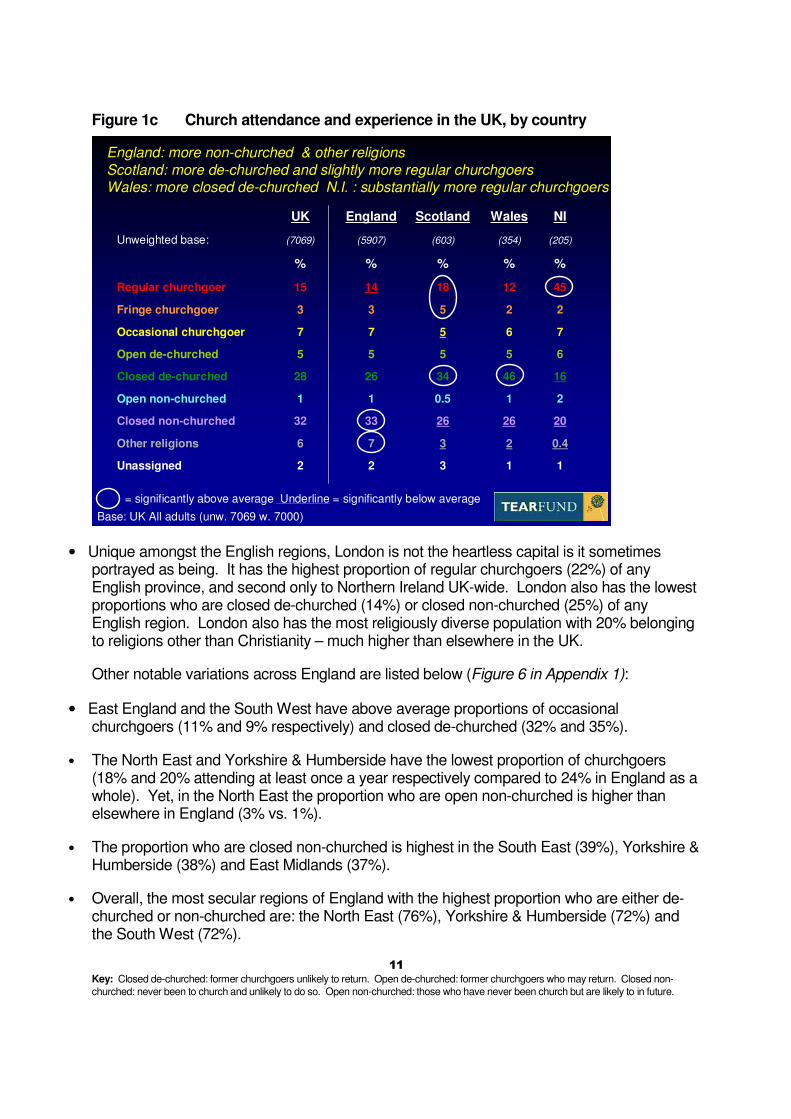
Figure 1c Church attendance and experience in the UK, by country
UK England Scotland Wales NI
Unweighted base: (7069) (5907) (603) (354) (205)
% % % % %
Regular churchgoer 15 14 18 12 45
Fringe churchgoer 3 3 5 2 2
Occasional churchgoer 7 7 5 6 7
Open de-churched 5 5 5 5 6
Closed de-churched 28 26 34 46 16
Open non-churched 1 1 0.5 1 2
Closed non-churched 32 33 26 26 20
Other religions 6 7 3 2 0.4
Unassigned 2 2 3 1 1
Base: UK All adults (unw. 7069 w. 7000)
England: more non-churched & other religions
Scotland: more de-churched and slightly more regular churchgoersWales: more closed de-churched N.I. : substantially more regular churchgoers
= significantly above average Underline = significantly below average
• Unique amongst the English regions, London is not the heartless capital is it sometimes portrayed as being. It has the highest proportion of regular churchgoers (22%) of any English province, and second only to Northern Ireland UK-wide. London also has the lowest proportions who are closed de-churched (14%) or closed non-churched (25%) of any English region. London also has the most religiously diverse population with 20% belonging to religions other than Christianity – much higher than elsewhere in the UK.
Other notable variations across England are listed below (Figure 6 in Appendix 1):
• East England and the South West have above average proportions of occasional churchgoers (11% and 9% respectively) and closed de-churched (32% and 35%).
• The North East and Yorkshire & Humberside have the lowest proportion of churchgoers (18% and 20% attending at least once a year respectively compared to 24% in England as a whole). Yet, in the North East the proportion who are open non-churched is higher than elsewhere in England (3% vs. 1%).
• The proportion who are closed non-churched is highest in the South East (39%), Yorkshire & Humberside (38%) and East Midlands (37%).
• Overall, the most secular regions of England with the highest proportion who are either de-churched or non-churched are: the North East (76%), Yorkshire & Humberside (72%) and the South West (72%).

12 Key: Closed de-churched: former churchgoers unlikely to return. Open de-churched: former churchgoers who may return. Closed non-
churched: never been to church and unlikely to do so. Open non-churched: those who have never been church but are likely to in future.
Churchgoing a middle class pursuit
The research confirms the belief that churchgoing is associated with those of higher social grade. Adults in social grades AB (professionals, senior and middle management) have above average prevalence of regular churchgoers (22% and 21% respectively), as well above average proportions of fringe or occasional churchgoers.
Adults of social grade C2, D (skilled, semi-skilled and unskilled manual) have the lowest proportion of regular churchgoers (12%) and the highest proportion who are closed non-church (37% and 40% respectively).
Adults in social grade E, which includes those entirely dependent on the State long-term, through sickness, unemployment or old age etc., have the highest proportion who are not currently attending church and yet open to attending in future (8%). (Figure 7 in Appendix 1).
Unemployed job seekers are less likely to be regular churchgoers (7% vs. 15% national average) or to be fringe/occasional attendees (6% vs. 10%). Almost half (48%) of unemployed people are closed non-churched compared with a national average of a third (32%). However unemployed people with past experience of churchgoing are more open to returning than the national average (open de-churched 8% vs. 5%) and less closed to the possibility (closed de-churched 21% vs. 28%).

13 Key: Closed de-churched: former churchgoers unlikely to return. Open de-churched: former churchgoers who may return. Closed non-
churched: never been to church and unlikely to do so. Open non-churched: those who have never been church but are likely to in future.
3. Profile and frequency of regular attendees
3.1 Frequency of church attendance
The Tearfund research asked all UK adults except those belonging to other religions13 their frequency of church attendance as follows:
“Apart from special occasions such as weddings, baptisms and funerals, how often nowadays do you go to Church? PROMPT IF NECESSARY: This might be to a traditional Church building on a Sunday, but it could be in another location, and could be midweek.”
Figure 3a below gives the full range of responses, with projections to the UK adult population. (Figure 9 in Appendix 1 gives the equivalent data for each of the four nations, and for GB).
One in four of the UK adult population say they go to church at least once a year. Among UK adults:
• 4.9 million go to church at least weekly (10% of the UK adult population).
• 7.6 million attend church at least monthly (15%).
• 12.6 million attend church at least annually (26%).
• 28.8 million (59%) never or practically never go to church.
Figure 3a Frequency of church attendance among UK adults (February 2006)
Base: UK adults aged 16+
Unweighted base (7069) 49.0 49.0
Weighted base (7000) Population projection Population projection
% (millions) Cumulative % (millions)
Go to church at least:
Once a week or more 10.0% 4.9 10.0% 4.9
Less often but at least once in two weeks 2.2% 1.1 12.3% 6.0
Less often but at least once a month 3.2% 1.6 15.4% 7.6
Less often but at least six times a year 3.4% 1.6 18.8% 9.2
Less often but at least twice a year 4.1% 2.0 22.9% 11.2
Less often but at least once a year 2.8% 1.4 25.7% 12.6
Less often than once a year 5.0% 2.4 30.7% 15.0
Varies too much to say 1.4% 0.7 32.1% 15.7
Never or practically never 58.7% 28.8
Refused/ don’t know 2.8% 1.4
Adults belonging to other religions 6.4% 3.2
Population projections are calculated on latest (2004-based) population projections for year 2006 from the Government Actuary's Department. Where figures do not sum exactly this is due rounding and weighted data.
13
It was felt to be inappropriate to ask people who had just stated their religion as other than Christianity, to ask how often they
went to church.

14 Key: Closed de-churched: former churchgoers unlikely to return. Open de-churched: former churchgoers who may return. Closed non-
churched: never been to church and unlikely to do so. Open non-churched: those who have never been church but are likely to in future.
3.2 Comparisons with other surveys
Comparing the Tearfund’s survey with the British Social Attitudes survey the results are very similar, but trying to compare with the English Church Census is not straightforward because a different methodology was used.
Figure 3b Frequency of churchgoing among GB adults aged 18+, who are Christian or of no religion
At least: Tearfund research
(2006) British Social Attitudes Survey
(2004)
Weekly 10.1% 9.5%
Monthly 15.3% 16.4%
Twice a year 22.4% 24.4%
Annually 24.9% 28.6%
Whereas the English Church Census took a snapshot of a particular week from congregations across 50% of all churches in England, the Tearfund research asks people to state their typical frequency of attendance. It is likely that the different methodologies resulted in the variation between Tearfund’s 9.1% of adults in England attending at least once a week and the English Church Census’ 6.1% - put another way, around a third of the adults saying they attend at least weekly were not in church on the Census weekend in 2005.
Looking to the international context, the UK has considerably lower attendance at religious services than many other European countries. The European Social Survey (2002) found 18.6% of UK adults aged 15+ attending religious services at least monthly. This was broadly similar to Germany, the Netherlands, Belgium and Hungary, and higher than in France (14%) or Denmark (9%) but it was lower than in the following nations, ranked in increasing attendance: Spain (29%), Slovenia, Austria, Italy, Portugal, Greece, the Republic of Ireland or Poland (76%).
See Appendix 3 for more on how Tearfund’s data fits within the context of these other surveys.
3.3 Demographic variations in frequency of churchgoing
Variations in monthly and annual attendance by demographics have already been reported in the previous chapter (Section 2.3), within the context of overall church attendance patterns. Figure 10 in Appendix 1 shows demographic variations in monthly and weekly attendance. The prevalence of both monthly and weekly churchgoing is higher among women, older people, those of black ethnic origin, in London, Scotland and Northern Ireland, and in denominations other than the Church of England. Two thirds of adults who attend church at least monthly (regular churchgoers) say they go to church every week. This varies somewhat by age – the proportion of monthly churchgoers who attend weekly is below average among 25-44 year olds and above average among over 65 year olds. It will be interesting to see in future whether frequency of churchgoing is

15 Key: Closed de-churched: former churchgoers unlikely to return. Open de-churched: former churchgoers who may return. Closed non-
churched: never been to church and unlikely to do so. Open non-churched: those who have never been church but are likely to in future.
influenced by peers or whether it is a life stage effect. Will regular churchgoers currently aged 25-44 increase their frequency of churchgoing as they get older? Or will they continue to attend at the same frequency which would lead to further erosion of weekly churchgoing? By region, regular (monthly) churchgoers in the North West, Wales, Yorkshire & Humberside and Scotland have the highest proportion of weekly attendees (70% or over); whilst regular churchgoers in London and the East of England have the lowest proportion attending weekly (under 60%). Only just over half (53%) of regular churchgoers in the Church of England attend every week; in this respect the level of commitment is higher among the smaller denominations such as Pentecostal/new churches (85%), Baptists (75%) and Methodists (74%) and other smaller denominations (77%).
3.4 Profile of regular churchgoers
15% of the UK adult population are regular churchgoers (attending at least monthly). The demographic profile of these 7.6 million people is described here, including comparisons to the general population where appropriate.
Compared with all UK adults (Figure 3c), regular churchgoers are more likely to be:
• Women (65% compared with 52% of UK adults);
• Aged over 65 (30% compared with 18% of UK adults); • AB social grade (25% compared to 19% of UK adults).
Figure 3c Profile of Regular churchgoers by gender, age and social grade
Base: Regular churchgoers (unw. 1126 w. 1082)
Base: All adults (unw. 7069 w. 7000
14% 19%
35%48%
11%
16%
29%29%
15%
19%
16%20%17%
30% 32%18%
11%
7%
65%
9%
52%
25%
16%
16%
18%
12%
Reg Chchgr All adults Reg Chchgr All adults Reg Chchgr All adults
Fe-male
Male
C1
C2
DE
AB
45-54
75+
25-34
16-24
35-44
55-64
65-74
Regular churchgoers are skewed towards women, over 65s and ABs.
SEX AGE SOCIAL GRADE

16 Key: Closed de-churched: former churchgoers unlikely to return. Open de-churched: former churchgoers who may return. Closed non-
churched: never been to church and unlikely to do so. Open non-churched: those who have never been church but are likely to in future.
Regular churchgoers are less likely than all UK adults to be aged 16-44 (35% vs. 49% UK) or social grade C2 (16% vs. 20%).
Regular churchgoers are more ethnically diverse than the general population:
• 86% of regular churchgoers are white (vs. 91% of UK adults).
• The proportion of black ethnic origin is higher among regular churchgoers (10%) than among all UK adults (3%).
• The proportion of Asians is lower among regular churchgoers (1%) than among all UK adults (4%).
• The proportion of regular churchgoers of mixed race is in line with the national average (1%), as is the proportion of Chinese/Other ethnic groups (0.3%).
The profile of regular churchgoers is significantly skewed towards Northern Ireland (9% vs. 3% of all UK adults) and Scotland (11% vs. 9%), by virtue of the heightened prevalence of churchgoing in these countries. England is significantly under-represented among regular churchgoers (76% vs. 82% of all UK adults) and Wales marginally so (Figure 11 in Appendix 1).
The denominational profile of regular churchgoers is quite different from that of all Christian adults (Figure 11 in Appendix 1). The proportion of regular churchgoers whose denomination is Church of England is substantially lower (31%) than among all Christian adults (55%); presumably due to nominal affiliation to Church of England. The proportion affiliating to the Church of Scotland is no different among regular churchgoers and all Christians. In contrast, Roman Catholics account for 29% of regular churchgoers, which is significantly higher than the proportion of Roman Catholics among all Christians (19%). All the other denominations also account for a significantly higher proportion of regular churchgoers than of all Christian adults.
Just over a quarter (27%) of regular churchgoers surveyed self-identified as evangelical, equivalent to around 2.0 million evangelicals in the UK adult population. Two thirds (66%), or 5.0 million regular churchgoers self-identified as non-evangelical, whilst the remaining 0.6 million (7%) were unsure. Among evangelicals, conservative evangelicals are the largest grouping, followed by charismatics then others (Figure 12 in Appendix 1).
The denominational profiles of regular churchgoers self-identifying as evangelical and non-evangelical are considerably different. Non-evangelicals are predominantly Roman Catholic and Church of England whilst evangelicals have a more diverse denominational mix (Figure 3d).

17 Key: Closed de-churched: former churchgoers unlikely to return. Open de-churched: former churchgoers who may return. Closed non-
churched: never been to church and unlikely to do so. Open non-churched: those who have never been church but are likely to in future.
Figure 3d Denominational profile of Regular churchgoers, by evangelicalism
11%
36%
9%
3%7%
6%
27%31%
9%
7%
6%
8%
14%
1%3%2% 1%2%
3%3%
6% 5%2%
Evangelicals Non-Evangelicals
URC/Congregational
Church of England
Pentecostal
Roman Catholic
Methodist
Independent
Church of Scotland/ Presbyterian
New
Other *
Church in Wales
Base: Evangelical Regular churchgoers (unw. 299 w. 289) Base: Non-evangelical Regular churchgoers (unw. 743 w. 714)
Baptist
Church of Ireland
None/DK/Ref
Non-evangelicals
are two thirds Roman Catholic
or C of E.
Evangelicals have a more
diverse spread of
denominations. C of E is the
largest grouping.
Non-Trinitarian^
* Other = Orthodox, Salvation Army, Brethren, Episcopal, Quaker, Other small denominations. ^ Non-Trinitarian = Seventh Day Adventists, Jehovah’s witnesses, Mormons and other non-Trinitarian groups.
Two thirds of non-evangelical regular churchgoers are either Roman Catholic (36%) or Church of England (31%); the next largest grouping is Church of Scotland/ Presbyterian at 9%. Among evangelicals, the proportion of Roman Catholics is just 11%, which is less than a third of its level among non-evangelicals. The proportion in each of the following denominations is significantly higher among evangelicals than among non-evangelicals: Pentecostal (14% vs. 1%), Baptist (9% vs. 3%), New Church (7% vs. 0.3%), Independent (3% vs. 0.6%) and URC/Congregational (2% vs. 0.3%). The proportion in each of the following denominations is not significantly different among evangelicals and non-evangelicals: Church of England, Church of Scotland/Presbyterian, Church in Wales, Church of Ireland and Methodist.
The average length of time regular churchgoers’ have been attending their current church is 21 years. This is age-related, such that older people have been at their current church longer than younger people. The lowest average is among 25-34 year olds who have typically been attending their current church for 7 years. At the other end of the spectrum, over 75 years olds have typically been at their church for 40 years. It is worth noting that 7% of regular churchgoers have been in their current church for less than 12 months and a further 8% more than 12 months but less than 2 years; these people have a younger age profile than all regular churchgoers: over a third of them are aged 16-34, as compared with only a fifth of all regular churchgoers.

18 Key: Closed de-churched: former churchgoers unlikely to return. Open de-churched: former churchgoers who may return. Closed non-
churched: never been to church and unlikely to do so. Open non-churched: those who have never been church but are likely to in future.
Regular churchgoers typically attend churches of between 51-200 members (44%), with 25% belonging to small churches of 50 or fewer members and 23% attending large churches with over 200 members. 2% of regular churchgoers attend ‘mega’ churches with over 1,000 attending across all services – this proportion rises to 5% among Roman Catholics and 9% among Pentecostals (Figure 13 in Appendix 1).
Despite the downward trend in church attendance reported in the literature, only one in six (16%) regular churchgoers perceive that the church they attend is declining in numbers. They are more likely to see their church as stable in numbers (39%) rather than declining. Two fifths (40%) of regular churchgoers perceive that their church is growing in numbers, either a little (27%) or significantly (13%). Obviously these are the subjective assessments of members of the congregation. The proportion saying their church is declining in numbers was greatest among Church of Scotland/Presbyterian (26%), Methodist (23%) and Roman Catholic (22%). The proportion saying their church is growing significantly is highest among Pentecostals (51%) and new churches (25%)14.
13% of regular churchgoers, equivalent to just under 1 million adults, attend an ethnic majority church. This is composed of 9% black majority, 1% Asian majority and 2% Chinese or other ethnic majority. The largest denomination groupings within ethnic majority churches are Pentecostal (23%), Roman Catholic (23%) and Church of England/Anglican (19%). The Pentecostal representation was nearly all amongst the black majority churches. Among black majority churchgoers Pentecostal is the largest denomination (33%), followed by Roman Catholic (16%) and Church of England/Anglican (16%). 5% of ethnic majority churchgoers say their church has over 1,000 members and 71% say their church is growing in numbers, either significantly (38%) or a little (33%). This perceived growth is considerably higher than the national average.
14
Appendix 1 provides commentary, following Figure 13, on how this compares with findings from the English Church
Census.

19 Key: Closed de-churched: former churchgoers unlikely to return. Open de-churched: former churchgoers who may return. Closed non-
churched: never been to church and unlikely to do so. Open non-churched: those who have never been church but are likely to in future.
4. Reasons for churchgoing
This chapter explores the different reasons why people go to church and what might motivate non-churchgoers to attend in the future.
4.1 Annual churchgoers’ reasons for attending
Adults attending church at least once in the last year were asked by Tearfund, “For which of these reasons have you gone to church in the last 12 months? Which others?” with a prompted answer list. The main reasons that people had attended church in the last 12 months are:
• Attending worship, mass or communion (71%);
• Christmas services (45%) or for weddings, baptisms or funerals (44%);
• Easter or Harvest services (31%).
Other lesser reasons included church gatherings apart from worship such as prayer, fellowship or Bible study; involvement in local community groups; private confession, prayer or reflection; or to find out more about Christianity (Figure 4a).
Figure 4a Annual churchgoers’ reasons for attending church in the last 12 months
Base: Annual churchgoers* in the UK aged 16+
Unweighted base (1850)
Weighted base (1798)
Population projection (millions)
% 12.6
To attend church worship (including mass or communion) 71 8.9
Christmas services, carol concerts, midnight mass, Christingle etc. 45 5.7
Weddings, baptisms or funerals 44 5.5
Easter or Harvest services 31 3.9
Other church gatherings (e.g. for prayer, fellowship, Bible study etc.), in a church building, in homes or elsewhere
18 2.3
To go to a local community group, activity or event taking place in a church building 14 1.8
For private confession, prayer or reflection 9 1.1
To find out more about Christianity (e.g. “Alpha” or similar) 5 0.6
Other reasons 1 0.1
ANY OF: church worship; other church gatherings; private confession/ prayer/ reflection; to find out more about Christianity
77 9.7
BOTH church worship AND other church gatherings 14 1.8
ONLY FOR: Christmas OR Easter/Harvest 8 1.0
* These are people who answered that they had gone to church at least once in the last 12 months, (apart from special occasions such as weddings, baptisms and funerals); this could have been to a traditional church building on a Sunday, or in another location and could have been midweek.

20 Key: Closed de-churched: former churchgoers unlikely to return. Open de-churched: former churchgoers who may return. Closed non-
churched: never been to church and unlikely to do so. Open non-churched: those who have never been church but are likely to in future.
Apart from key points in the Christian calendar such as Christmas, Easter and Harvest, three quarters (77%) of annual churchgoers, equivalent to 9.7 million adults, had attended for at least one of the following reasons which encompass ‘personal spirituality’: worship, other church gatherings, private confession/ prayer/ reflection, or to find out more about Christianity.
8% attended only for traditional celebrations in the Christian calendar, namely Christmas, Easter or Harvest. This is cause for hope, in that a residual commitment to Christian festivals remains.
4.2 Demographic variations in annual churchgoers’ reasons for churchgoing
The reasons cited by annual churchgoers for going to church varied by age, frequency of attendance, denomination and evangelicalism.
Age
• Worship, mass or communion is the most popular reason for attending across all age groups but peaks among over 65 year olds at 79%. (Figure 14 in Appendix 1)
• Young adults aged 16-34 are less likely than over 35 year olds to attend for major events in the Christian calendar .
• 25-34s and 65-74s are slightly more likely (7%) than others be seeking to find out about Christianity.
• 35-44s are the age band most likely to attend for private confession, prayer or reflection (12%).
• Attendance at church gatherings other than worship and at local community activities peaks among 55-74s.
21 Key: Closed de-churched: former churchgoers unlikely to return. Open de-churched: former churchgoers who may return. Closed non-
churched: never been to church and unlikely to do so. Open non-churched: those who have never been church but are likely to in future.
Frequency of attendance
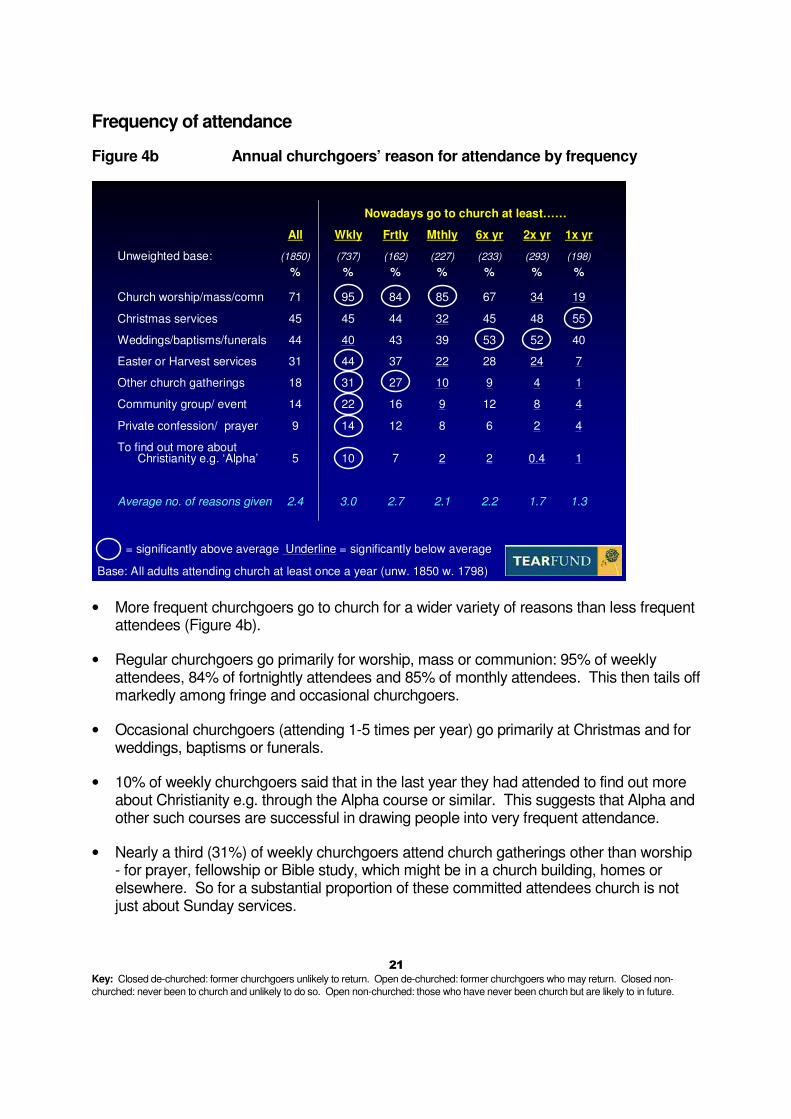
Figure 4b Annual churchgoers’ reason for attendance by frequency
Nowadays go to church at least……
All Wkly Frtly Mthly 6x yr 2x yr 1x yr
Unweighted base: (1850) (737) (162) (227) (233) (293) (198)
% % % % % % %
Church worship/mass/comn 71 95 84 85 67 34 19
Christmas services 45 45 44 32 45 48 55
Weddings/baptisms/funerals 44 40 43 39 53 52 40
Easter or Harvest services 31 44 37 22 28 24 7
Other church gatherings 18 31 27 10 9 4 1
Community group/ event 14 22 16 9 12 8 4
Private confession/ prayer 9 14 12 8 6 2 4
To find out more aboutChristianity e.g. ‘Alpha’ 5 10 7 2 2 0.4 1
Average no. of reasons given 2.4 3.0 2.7 2.1 2.2 1.7 1.3
Base: All adults attending church at least once a year (unw. 1850 w. 1798)
= significantly above average Underline = significantly below average
• More frequent churchgoers go to church for a wider variety of reasons than less frequent attendees (Figure 4b).
• Regular churchgoers go primarily for worship, mass or communion: 95% of weekly attendees, 84% of fortnightly attendees and 85% of monthly attendees. This then tails off markedly among fringe and occasional churchgoers.
• Occasional churchgoers (attending 1-5 times per year) go primarily at Christmas and for weddings, baptisms or funerals.
• 10% of weekly churchgoers said that in the last year they had attended to find out more about Christianity e.g. through the Alpha course or similar. This suggests that Alpha and other such courses are successful in drawing people into very frequent attendance.
• Nearly a third (31%) of weekly churchgoers attend church gatherings other than worship - for prayer, fellowship or Bible study, which might be in a church building, homes or elsewhere. So for a substantial proportion of these committed attendees church is not just about Sunday services.
22 Key: Closed de-churched: former churchgoers unlikely to return. Open de-churched: former churchgoers who may return. Closed non-
churched: never been to church and unlikely to do so. Open non-churched: those who have never been church but are likely to in future.
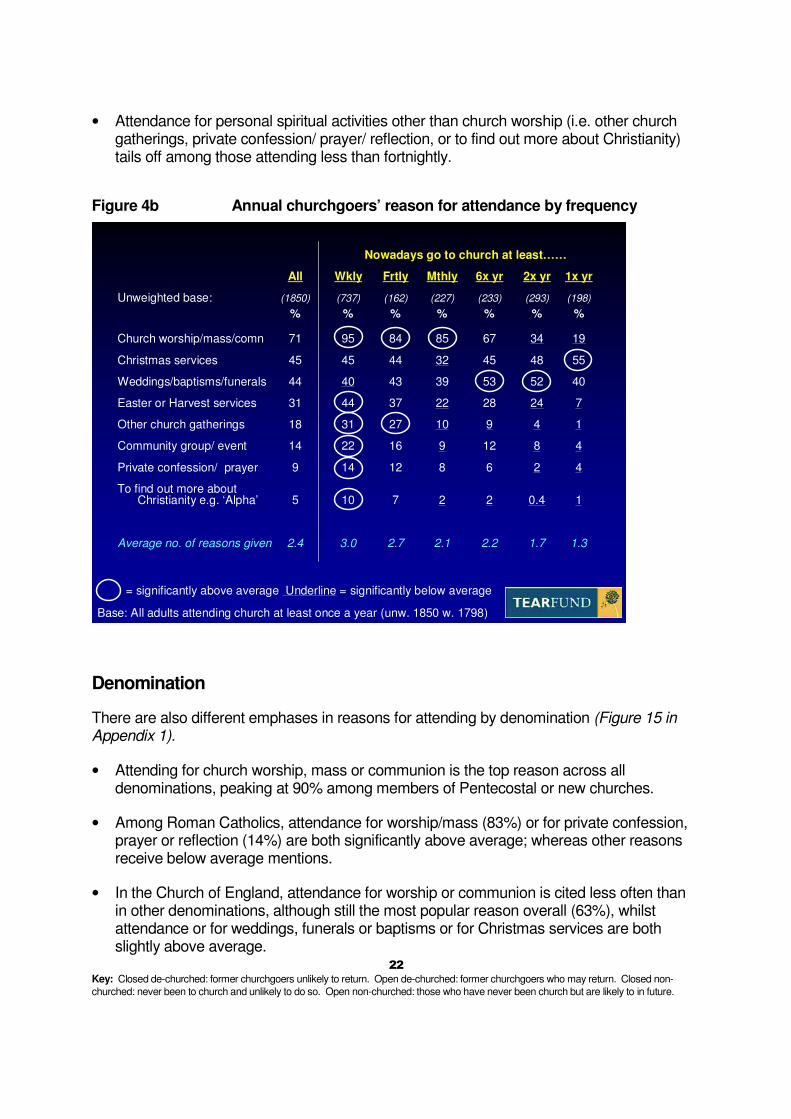
• Attendance for personal spiritual activities other than church worship (i.e. other church gatherings, private confession/ prayer/ reflection, or to find out more about Christianity) tails off among those attending less than fortnightly.
Figure 4b Annual churchgoers’ reason for attendance by frequency
Nowadays go to church at least……
All Wkly Frtly Mthly 6x yr 2x yr 1x yr
Unweighted base: (1850) (737) (162) (227) (233) (293) (198)
% % % % % % %
Church worship/mass/comn 71 95 84 85 67 34 19
Christmas services 45 45 44 32 45 48 55
Weddings/baptisms/funerals 44 40 43 39 53 52 40
Easter or Harvest services 31 44 37 22 28 24 7
Other church gatherings 18 31 27 10 9 4 1
Community group/ event 14 22 16 9 12 8 4
Private confession/ prayer 9 14 12 8 6 2 4
To find out more aboutChristianity e.g. ‘Alpha’ 5 10 7 2 2 0.4 1
Average no. of reasons given 2.4 3.0 2.7 2.1 2.2 1.7 1.3
Base: All adults attending church at least once a year (unw. 1850 w. 1798)
= significantly above average Underline = significantly below average
Denomination
There are also different emphases in reasons for attending by denomination (Figure 15 in Appendix 1).
• Attending for church worship, mass or communion is the top reason across all denominations, peaking at 90% among members of Pentecostal or new churches.
• Among Roman Catholics, attendance for worship/mass (83%) or for private confession, prayer or reflection (14%) are both significantly above average; whereas other reasons receive below average mentions.
• In the Church of England, attendance for worship or communion is cited less often than in other denominations, although still the most popular reason overall (63%), whilst attendance or for weddings, funerals or baptisms or for Christmas services are both slightly above average.
23 Key: Closed de-churched: former churchgoers unlikely to return. Open de-churched: former churchgoers who may return. Closed non-
churched: never been to church and unlikely to do so. Open non-churched: those who have never been church but are likely to in future.
• Attendance at other church gatherings apart from worship (prayer, fellowship or Bible study), is significantly above average among Pentecostals/New churches (50%), Baptists (34%) and other15 smaller denominations (32%).
• Attendance to find out more about Christianity e.g. “Alpha” or similar is significantly above average among Pentecostal/ new churches (18%), Methodists (12%) and other smaller denominations (11%).
Evangelicalism
Evangelicals are more likely than non-evangelicals to say they attend for each of the reasons explored, apart from Christmas services and weddings/baptisms/funerals, where there is no difference (Figure 16 in Appendix 1). In particular,
• Evangelicals are over three times as likely as non-evangelicals to attend church gatherings additional to worship/communion (40% vs. 12%)
• Evangelicals are more than four times as likely as non-evangelicals to go to church to find out about Christianity (13% vs. 3%).
4.3 Drawing infrequent and non-churchgoers into church
The research sought to explore the likelihood of infrequent or non-churchgoers attending church in future and what factors might encourage them to do so16.
Only one in eight (12%) adults who are infrequent (less than monthly) or non-churchgoers are likely to go to church (more often) in future; 10% are fairly likely and 2% very likely. The vast majority (85%) of infrequent or non-churchgoers are unlikely to attend (more often) in future: a third (32%) are not very likely and half (53%) are not at all likely.
15
Church in Wales, URC/Congregational, Independent, Orthodox, Church of Ireland, Salvation Army, Brethren, Episcopal,
Quaker, Other small denominations. 16
Those of other faiths were not asked these questions, to avoid causing offence.

24 Key: Closed de-churched: former churchgoers unlikely to return. Open de-churched: former churchgoers who may return. Closed non-
churched: never been to church and unlikely to do so. Open non-churched: those who have never been church but are likely to in future.
Figure 4c Likelihood of going (back) to church (more often) in future
12%6%
30%
40%
12%
4%2%
12%
37%
45%
2%
0.3%
3%
23%
72%
Fringe churchgoers (1.6m) Occasional churchgoers (3.4m)
Non-churched (16.2m)
Not at all likely Very likely Fairly likely DK/ NSNot very likely
Base: Fringe (unw. 233 w. 235) Base: Occasional (unw. 491 w. 481) Base: De-churched (unw. 2312 w. 2281) Base: Non-churched (unw. 2293 w. 2309)
12%4%
19%
47%
20%
De-churched (16.0m)
The challenge of drawing infrequent or non-churchgoers into church becomes increasingly difficult the further they are from attending at present (Figure 4c):
• 36% of fringe churchgoers (i.e. attending less than monthly but at least 6 times per year) say they are likely to go to church more often in future
• 24% of occasional churchgoers (i.e. attending 1-5 times per year) say they are likely to go to church more often in future;
• 14% of adults who are de-churched say they are likely to go in future, although nearly half are not at all likely;
• 3% of adults who are non-churched say they are likely to go in future; and nearly three quarters (72%) are not at all likely.
Half of the 7.3m fringe, occasional attendees and open de-churched say they are likely to go to church (more often) in future; 43% are fairly likely and 7% very likely. 30% are not very likely and 12% are not at all likely17.
17
The remaining 8% were unsure or did not answer.

25 Key: Closed de-churched: former churchgoers unlikely to return. Open de-churched: former churchgoers who may return. Closed non-
churched: never been to church and unlikely to do so. Open non-churched: those who have never been church but are likely to in future.
In summary, people with no experience at all of churchgoing are very unlikely to give it a try, whereas those who have done so in the past are somewhat more receptive.
What can Churches do?
So what can churches do to attract in infrequent and non-churchgoers? There is no simple answer but this research reveals that a personal invitation or encouragement from a family member or friend is much more powerful than anything that the church can do.
The further removed people are from churchgoing at present, they less likely they are to voice any factors that would increase their likelihood of doing so (more) in future. As many as two thirds of closed de-churched adults and three quarters of closed non-churched say that ‘nothing’ would encourage their future attendance at church. The exception to this pattern is the open non-churched: whilst they have no experience of churchgoing only 16% of them said ‘nothing’ would trigger them to give it a try; in contrast to fringe churchgoers, occasional churchgoers or open de-churched of whom 32% say nothing would encourage them to any greater attendance. People who go to church only sporadically at present are not necessarily easily persuaded to increase their commitment to more regular attendance.
Among those with past experience of churchgoing, the factor most likely to encourage future attendance is if a family member started going or wanted to go. The more personal the influence, the more influential it is likely to be. In terms of positive contributory factors, accompanying a family member is more influential than accompanying a friend. A personal invite from someone is more powerful than an invite from the church as an organisation, or the offer of an Alpha course or similar. The advantage of personal over church invites is small among people who already go infrequently (fringe and occasional churchgoers), and the open de-churched, who have past experience of attending. However among the open non-churched, the advantage of a personal invite over a church invite is marked (28% vs. 3%); among this small segment of receptive unchurched people, a personal invite is by far the most important trigger to attending, even ahead of family factors.
In terms of negative factors, difficult personal circumstances such as redundancy, illness, bereavement or depression are more influential than negative external events such as disasters, war or death of a celebrity (Figure 4d). However, this difference wanes, the further removed people are from church, such that among closed de-churched people difficult personal circumstances are only slightly more important than negative external events, whilst among the closed non-churched these two factors are equivalent.
Figure 4d Factors that would increase likelihood of future church attendance (prompted)
Base: Infrequent (less than monthly) and non-churchgoers in the UK, aged 16+

26 Key: Closed de-churched: former churchgoers unlikely to return. Open de-churched: former churchgoers who may return. Closed non-
churched: never been to church and unlikely to do so. Open non-churched: those who have never been church but are likely to in future.
All in
freq
uen
t
& n
on
-ch
urc
hg
oers
Fri
ng
e, O
ccasio
nal
or
Op
en
d
e-c
hu
rch
ed
Fri
ng
e
Occasio
nal
Op
en
d
e-c
hu
rch
ed
Op
en
n
on
-ch
urc
hed
Clo
se
d
d
e-c
hu
rch
ed
Clo
se
d
no
n-c
hu
rch
ed
Population projection
37.2m 7.3m 1.6m 3.4m 2.3m 0.6m 13.7m 15.6m
Unweighted base (5482) (1059) (233) (491) (335) (79) (1977) (2214) Weighted base (5467) (1047) (235) (481) (331) (79) (1950) (2230)
% % % % % % % %
Nothing 63 32 32 40 20 16 66 78
If a family member started going, or wanted to go
9 20 23 18 23 15 9 4
If someone personally invited me
8 12 12 13 12 28 7 6
Difficult personal circumstances (e.g. illness, redundancy, bereavement, marital problems, depression etc.)
7 14 14 13 15 14 7 3
If a friend started going, or wanted to go
5 11 12 9 13 8 5 2
An external event (e.g. disaster, war, death of a well-known person etc.)
4 6 4 7 5 8 4 3
Invite from the church
3 8 9 7 8 3 3 1
If the church was running a course to find out more about Christianity (e.g. “Alpha” or similar)
1 3 4 2 4 2 1 *
27 Key: Closed de-churched: former churchgoers unlikely to return. Open de-churched: former churchgoers who may return. Closed non-
churched: never been to church and unlikely to do so. Open non-churched: those who have never been church but are likely to in future.
The Technical Appendix is included in the electronic version of this report which is available to download from the Tearfund website www.tearfund.org.
The Technical Appendix provides supporting tables and charts that are referenced within the main body of the report.
• Appendix 1: Supplementary Data
• Appendix 2: Full details of the research methods
• Appendix 3: Discussion of how this research sits within the context of other research on churchgoing

28 Key: Closed de-churched: former churchgoers unlikely to return. Open de-churched: former churchgoers who may return. Closed non-
churched: never been to church and unlikely to do so. Open non-churched: those who have never been church but are likely to in future.
Appendix 1 Supplementary data
This appendix presents in tabular and graphical form key data from the Tearfund research that has been
referenced in the main body of the report.
Figure 1 Religion of UK adults by gender, age and region
Row percentages
Christian
No religion
Other Religions
Weighted base
Unweighted base
All adults UK aged 16+ 53% 39% 6% (7000) (7069)
Men 47% *45% *7% (3367) (3186)
Women *60% 33% 6% (3633) (3883)
16-24 33% *55% *11% (978) (937)
25-34 38% *50% *11% (1134) (1122)
35-44 48% *44% 7% (1351) (1308)
45-54 55% 39% 5% (1156) (1077)
55-64 *65% 30% 4% (1086) (1033)
65-74 *74% 22% 3% (786) (972)
75 or over *82% 14% 3% (511) (620)
Yorks & Humber 48% *46% 4% (659) (625)
London 49% 27% *20% (759) (832)
East Midlands 49% *44% 7% (526) (502)
North East 50% *47% 2% (350) (332)
Scotland 50% *45% 3% (629) (603)
South East 52% 42% 5% (952) (857)
East of England 54% 40% 6% (654) (688)
West Midlands 55% 36% 7% (675) (631)
North West 56% 34% *8% (779) (746)
Wales 56% 42% 2% (374) (354)
South West *59% 38% 2% (514) (599)
Northern Ireland *81% 16% 0.4% (223) (205)
ENGLAND 53% 39% *7% (5774) (5907)
GREAT BRITAIN 52% *40% *7% (6777) (6864)
* = significantly above UK average and underline = significantly below UK average (at 95% confidence level). Where rows do not sum to 100% the remaining 1-2% either refused to answer or said ‘Don’t know’.

29 Key: Closed de-churched: former churchgoers unlikely to return. Open de-churched: former churchgoers who may return. Closed non-
churched: never been to church and unlikely to do so. Open non-churched: those who have never been church but are likely to in future.
Figure 2 Church attendance and experience in the UK, by gender
All Men Women Christian No religion
Unweighted base: (7069) (3186) (3883) (3736) (2719)
% % % % %
Regular churchgoer 15 11 19 28 1
Fringe churchgoer 3 3 4 6 1
Occasional churchgoer 7 6 8 11 3
Open de-churched 5 3 6 7 2
Closed de-churched 28 28 27 29 31
Open non-churched 1 1 1 1 1
Closed non-churched 32 38 27 18 57
Other religions 6 7 6 0 0
Unassigned 2 3 2 1 3
Base: UK All adults (unw. 7069 w. 7000)
Men are less likely than women to be attending church regularly, or infrequently or to be open de-churched. Conversely men are more likely to be closed non-
churched. Those with no religion are unlikely to be churchgoers and are typically closed non-churched.
= significantly above average Underline = significantly below average
Figure 3 Church attendance and experience in the UK, by ethnic group
All White Mixed Asian Black Chinese/race Other
Unweighted base: (7069) (6433) (73) (270) (238) (36)
% % % % % %
Regular churchgoer 15 15 15 7 48 11
Fringe churchgoer 3 4 3 0.4 4 0
Occasional churchgoer 7 7 3 0.4 4 2
Open de-churched 5 5 11 2 7 2
Closed de-churched 28 30 19 2 7 10
Open non-churched 1 1 5 0 1 2
Closed non-churched 32 34 19 3 9 35
Other religions 6 2 22 85 18 37
Unassigned 2 2 5 1 2 0
Base: UK All adults (unw. 7069 w. 7000)
Regular church-going high among black ethnic minorities. Asians are predominantly of other religions.
Regular churchgoing among those of mixed race is same as among whites.
= significantly above average Underline = significantly below average

30
Key: Closed de-churched: former churchgoers unlikely to return. Open de-churched: former churchgoers who may return. Closed non-churched: never been to church and unlikely to do so. Open non-
churched: those who have never been church but are likely to in future.
Figure 4 Church attendance and experience among UK adults, by age, including population projections
All UK adults 16-24s 25-34s 35-44s 45-54s 55-64s 65-74s 75+
%
Popu-lation ‘000s %
Popu-lation ‘000s %
Popu-lation ‘000s %
Popu-lation ‘000s %
Popu-lation ‘000s %
Popu-lation ‘000s %
Popu-lation ‘000s %
Popu-lation ‘000s
Regular 15.5% 7,576 10.2% 731 10.7% 839 12.2% 1,133 15.2% 1,194 17.7% 1,266 24.7% 1,247 26.2% 1,221
(at least once a month)
Fringe 3.4% 1,645 3.0% 213 2.5% 194 3.1% 289 3.3% 258 4.3% 310 3.9% 199 4.1% 191 (at least 6 times a year)
Occasional 6.9% 3,367 3.5% 249 7.2% 568 7.5% 693 7.4% 583 7.7% 553 8.1% 411 5.9% 273
(at least once a year)
Open ex-church 4.7% 2,318 5.5% 395 4.2% 333 6.1% 570 3.8% 299 5.8% 415 3.4% 173 2.5% 118
Closed ex-church 27.9% 13,653 18.3% 1,309 21.5% 1,692 25.3% 2,348 30.1% 2,360 32.0% 2,294 35.6% 1,800 41.1% 1,913
Open non-church 1.1% 554 1.6% 117 1.8% 138 1.3% 117 1.0% 74 0.7% 53 0.6% 32 0.6% 27
Closed non-church 31.9% 15,613 45.4% 3,248 39.4% 3,099 34.5% 3200 31.2% 2,449 26.2% 1,879 18.8% 951 15.7% 729
Other religions 6.4% 3,157 10.5% 753 10.7% 839 7.0% 652 4.7% 366 4.0% 284 2.7% 135 2.5% 118
Unassigned 2.3% 1,127 1.9% 139 2.0% 160 3.0% 281 3.3% 258 1.5% 105 2.2% 109 1.6% 73
Weighted base: (7000) 49,004 (978) 7,155 (1134) 7,861 (1351) 9,278 (1156) 7,842 (1086) 7,160 (786) 5,052 (511) 4,656
Unweighted base: (7069) (937) (1122) (1308) (1077) (1033) (972) (620)
Population projections are calculated from latest 2004-based population projections for year 2006 from the Government Actuary's Department. Where figures do not sum exactly to the total this is due rounding and weighted data.

31
Figure 5 Church attendance and experience among UK adults, by country, including population projections
All UK adults England Scotland Wales Great Britain Northern Ireland
%
Popu-lation ‘000s %
Popu-lation ‘000s %
Popu-lation ‘000s %
Popu-lation ‘000s %
Popu-lation ‘000s %
Popu-lation ‘000s
Regular 15.5% 7,576 14.3% 5,850 18.1% 759 11.8% 284 14.5% 6,897 45.3% 615
(at least once a month)
Fringe 3.4% 1,645 3.4% 1,379 4.6% 193 1.9% 45 3.4% 1,617 2.2% 30
(at least 6 times a year)
Occasional 6.9% 3,367 7.1% 2,914 5.4% 226 5.9% 142 6.9% 3,276 6.7% 91
(at least once a year)
Open ex-church 4.7% 2,318 4.7% 1,912 4.8% 200 4.8% 116 4.7% 2,229 6.3% 85
Closed ex-church 27.9% 13,653 26.4% 10,847 34.2% 1,432 46.3% 1,117 28.2% 13,457 16.1% 219
Open non-church 1.1% 554 1.2% 498 0.5% 20 0.5% 13 1.1% 527 1.8% 24
Closed non-church 31.9% 15,613 33.3% 13,655 26.4% 1,106 26.2% 633 32.2% 15,362 20.2% 274
Other religions 6.4% 3,157 7.4% 3,021 3.0% 127 1.6% 39 6.6% 3,164 0.4% 6
Unassigned 2.3% 1,127 2.4% 974 3.0% 127 1.1% 26 2.4% 1,125 0.9% 12
Weighted base: (7000) 49,004 (5774) 41,043 (629) 4,189 (374) 2,415 (6777) 47,647 (223) 1,357
Unweighted base: (7069) (5907) (603) (354) (6864) (205)
Population projections are calculated from latest 2004-based population projections for year 2006 from the Government Actuary's Department. Where figures do not sum exactly to the total this is due rounding and weighted data.

32
Figure 6 Church attendance and experience in the UK, by English government region
ENGLAND Gtr. London NW W Mids E Mids
Unweighted base: (5907) (832) (746) (631) (502)
% % % % %
Regular churchgoer 14 22 15 15 14
Fringe churchgoer 3 4 3 4 3
Occasional churchgoer 7 6 6 6 8
Open de-churched 5 3 8 6 4
Closed de-churched 26 14 26 27 28
Open non-churched 1 2 1 2 0.2
Closed non-churched 33 25 31 32 37
Other religions 7 20 8 7 7
Unassigned 2 4 2 0.1 0.2
Base: UK All adults (unw. 7069 w. 7000)
Greater London: more regular churchgoers & other religions,
fewer de-churched or non-churched
= significantly above average Underline = significantly below average
ENGL East SW SE Y & H NE
Unweighted base: (5907) (688) (599) (952) (625) (332)
% % % % % %
Regular churchgoer 14 12 12 12 12 11
Fringe churchgoer 3 4 4 3 2 2
Occasional churchgoer 7 11 9 8 6 5
Open de-churched 5 4 3 4 4 5
Closed de-churched 26 32 35 24 29 33
Open non-churched 1 1 * 1 1 3
Closed non-churched 33 30 34 39 38 35
Other religions 7 6 2 5 4 2
Unassigned 2 2 2 3 4 4
Base: UK All adults (unw. 7069 w. 7000)
Among the English regions, Yorks & Humber and the North East have the lowest church-going.
= significantly above average Underline = significantly below average

33
Figure 7 Church attendance and experience in the UK, by social grade
All A B C1 C2 D E
Unweighted base: (7069) (191) (1019) (1856) (1421) (1071) (1511)
% % % % % % %
Regular churchgoer 15 22 21 15 12 12 16
Fringe churchgoer 3 5 6 3 2 3 3
Occasional churchgoer 7 10 9 8 6 5 5
Open de-churched 5 2 4 4 4 5 6
Closed de-churched 28 31 28 27 28 26 29
Open non-churched 1 1 1 1 1 1 2
Closed non-churched 32 22 23 32 37 40 29
Other religions 6 5 5 6 5 8 8
Unassigned 2 4 2 3 2 2 2
Base: UK All adults (unw. 7069 w. 7000)
ABs: more churchgoers. C2Ds: more closed non-churched.Church-going declines with social class from A to D, then up slightly in E.
= significantly above average Underline = significantly below average
Respondents were assigned a social grade based on the job details of the Chief Income Earner in the household. The table below describes who falls into each of the social grading categories.
Figure 8 Social Grade Classification
UK adult population
Unweighted base: (7069) Weighted base: (7000) % A: Professionals, very senior managers in business, top civil servants. Retired people, previously grade A, and their widows.
3
B: Middle management executives in large organisations, with appropriate qualifications.
Retired people, previously grade B, and their widows. 16
C1: Junior management, owners of small establishments, and all other non-manual positions.C1, and their widows.
29
C2: Skilled manual workers and manual workers with responsibility for other people. Retired people, previously grade C2, with pensions from their job. Widows, if receiving pensions from their late husband’s job.
20
D: Semi-skilled and un-skilled manual workers and apprentices/trainees to skilled workers. Retired people, previously grade D, with pensions from their job. Widows, if receiving pensions from their late husband’s job.
14
E: All those entirely dependent on the State long-term, through sickness, unemployment, old age etc. Those unemployed for a period exceeding 6 months (otherwise classified on previous occupation). Casual workers with no regular income.
19

34
Figure 9 Frequency of church attendance among UK adults, by country, including population projections (February 2006)
All UK adults England Scotland Wales Great Britain Northern Ireland
%
Popu-lation ‘000s %
Popu-lation ‘000s %
Popu-lation ‘000s %
Popu-lation ‘000s %
Popu-lation ‘000s %
Popu-lation ‘000s
Go to church at least:
Once a week or more 10.0% 4,914 9.1% 3,718 12.7% 533 8.6% 207 9.4% 4,464 30.0% 408
Less often but at least once in two weeks 2.2% 1,099 2.1% 867 2.1% 87 1.9% 45 2.1% 998 6.7% 91
Less often but at least once a month 3.2% 1,568 3.1% 1,272 3.3% 140 1.3% 32 3.0% 1,441 8.5% 116
AT LEAST MONTHLY 15.4% 7,576 14.3% 5,850 18.1% 759 11.8% 284 14.5% 6,897 45.3% 615
Less often but at least six times a year 3.4% 1,645 3.4% 1,379 4.6% 193 1.9% 45 3.4% 1,617 2.2% 30
Less often but at least twice a year 4.1% 1,988 4.1% 1,699 3.2% 133 4.3% 103 4.1% 1,933 4.0% 55
Less often but at least once a year 2.8% 1,379 3.0% 1,216 2.1% 87 1.6% 39 2.8% 1,336 3.1% 43
AT LEAST ANNUALLY 25.7% 12,589 24.7% 10,143 28.1% 1,179 19.5% 471 24.8% 11,790 54.3% 736
Less often than once a year 5.0% 2,429 5.2% 2,140 3.8% 160 3.7% 90 5.0% 2,383 3.6% 49
Varies too much to say 1.4% 686 1.6% 661 0.3% 13 0.5% 13 1.4% 682 0.5% 6
Never or practically never 58.7% 28,786 58.2% 23,869 62.2% 2,604 72.7% 1,756 59.3% 28,270 40.8% 554
Refused 1.6% 777 1.7% 711 0.6% 27 1.6% 39 1.6% 773 0.5% 6
Don't know 1.2% 581 1.2% 505 1.9% 80 0.0% 0 1.2% 584 0.0% 0
Adults belonging to other religions 6.4% 3,157 7.4% 3,021 3.0% 127 1.6% 39 6.6% 3,164 0.5% 6
Weighted base: (7000) 49,004 (5774) 41,043 (629) 4,189 (374) 2,415 (6777) 47,647 (223) 1,357
Unweighted base: (7069) (5907) (603) (354) (6864) (205)
Population projections are calculated from latest 2004-based population projections for year 2006 from the Government Actuary's Department. Where figures do not sum exactly to the total this is due rounding and weighted data.

35
Figure 10 Prevalence of weekly and monthly churchgoing among UK adults (February 2006) by gender, age, ethnic group, government region and denomination
Go to church at least…
Row percentages (cumulative)
Weekly
Monthly (regular)
Proportion of regular churchgoers attending weekly~
Weighted base
Unweighted base
All adults UK aged 16+ 10% 15% 65% (7000) (7069)
Men 7% 11% 61% (3367) (3186)
Women *13% *19% 67% (3633) (3883)
16-24 6% 10% 61% (978) (937)
25-34 6% 11% 56% (1134) (1122)
35-44 7% 12% 57% (1351) (1308)
45-54 9% 15% 61% (1156) (1077)
55-64 *12% *18% 69% (1086) (1033)
65-74 *18% *25% *72% (786) (972)
75 or over *19% *26% *74% (511) (620)
Asian 5% 7% 75% (282) (270)
Mixed race 9% 15% 63% (72) (73)
White 9% 15% 64% (6365) (6433)
Black *32% *48% 66% (230) (238)
North East 7% 11% 63% (350) (332)
South West 7% 12% 61% (514) (599)
East of England 7% 12% 59% (654) (688)
Wales 8% 12% 72% (374) (354)
South East 8% 12% 65% (952) (857)
Yorks & Humber 9% 12% 71% (659) (625)
East Midlands 9% 14% 65% (526) (502)
West Midlands 8% 15% 55% (675) (631)
North West 11% 15% 73% (779) (746)
Scotland *13% *18% 70% (629) (603)
London *13% *22% 59% (759) (832)
Northern Ireland *30% *45% 66% (223) (205)
ENGLAND 9% 14% 64% (5774) (5907)
GREAT BRITAIN 9% 15% 65% (6777) (6864)
Church of England 8% 16% 53% (2077) (2181)
Church of Scotland/ Presbyterian *21% *33% 63% (290) (292)
Methodist *29% *40% 74% (165) (172)
Other denominations^ *32% *41% *77% (197) (202)
Roman Catholic *30% *44% 70% (716) (717)
Baptist *38% *51% 75% (86) (91)
Pentecostal/ New churches *63% *75% *85% (94) (93)
* = significantly above UK average and underline = significantly below UK average (at 95% confidence level). ~ Calculated as % weekly divided by % monthly (using percentages to 1 decimal place). ^ Includes Church in Wales, URC/Congregational, Independent, Orthodox, Church of Ireland, Salvation Army, Brethren, Episcopal, Quaker, Other small denominations.

36
Figure 11 Profile of Regular churchgoers by country and denomination
55%
4%
5%
29%
19%
11%
9%
9%
8%
9%
7%
76%
31%
82%
4%
6%
3%2%
4%
3%5%7%
3% 1%
Reg Chchgr All adults Reg Chchgr All adults
Wales
Scotland
NI
England
Other *
Church of
England
Ch Scot/
Presbyt
Roman
Catholic
Methodist
Baptist
Pentl/New
Base: Regular churchgoers (unw. 1126 w. 1082) Base: All Christian adults (unw. 3853 w. 3736)
Base: All adults (unw. 7069 w. 7000)
of Christian religion
Non-Trinitarian^
Regular churchgoers are skewed towards Northern Ireland, Roman Catholics & the lesser denominations (and away from England & C of E).
COUNTRY DENOMINATION
* Other = Church in Wales, URC/Congregational, Independent, Orthodox, Church of Ireland, Salvation Army, Brethren, Episcopal, Quaker, Other small denominations.
^ Non-Trinitarian = Seventh Day Adventists18
, Jehovah’s witnesses, Mormons and other non-Trinitarian groups.
Figure 12 Evangelicalism among regular churchgoers (self-identification)
Base: Regular (at least monthly) churchgoers in the UK aged 16+
Unweighted base (1126) Population projection (thousands)
Weighted base (1082) 7,576
%
Non-Evangelical 66.0% 4,999
Evangelical 26.7% 2,024
Don’t know/ refused* 7.4% 560
Type of evangelicalism:
Conservative evangelical 9.5% 721
Charismatic evangelical 7.8% 588
Other evangelical 5.5% 413
Don’t know/ refused* 4.0% 301
* Nearly all of these said ‘Don’t know’ rather than refusing to answer.
18
Seventh Day Adventists are considered as Non-Trinitarian for the purposes of this research, according to the Evangelical
Alliance’s Position Statement: “We are aware that some evangelicals are recognising certain Seventh Day Adventist
congregations as denominational rather than sectarian or cultic. At this point, however, the EA does not recognise Seventh
Day Adventism to be an orthodox denominational expression of the Christian Church.”

37
Figure 13 Churchmanship of Regular churchgoers
84%
16%
13%
14%
16%
27%
18%
13%
23%
12%
15%16%
10%2%
9%
5%
3%
39%
21%
17%
8%
8%1% 3%5%
Years attended Size Growth Ethnic majority
6 - 10
2 or less
> 1000
25 or less
Growing a little
Stable
Dec-lining
Growing
signif-
icantly
Asian/oth
Black
White
31- 50
50+
21- 30
11- 20
3 - 5
501 - 1000
201 - 500
101 - 200
51 - 100
26 - 50
DKDK DKDK
Base: Regular churchgoers (unw. 1126 w. 1082)
Regular churchgoers typically attend churches with 51-200 members, and (despite recently reported trends) few perceive that their church
is declining in numbers. 12% attend ethnic majority churches.
The English Church Census provides objective trends in churchgoing and between 1998-2005 reports19
growth
in three denominational groups Pentecostals (+34%), the Smaller Denominations20
(+9%) and the Orthodox
churches (+2%). The main reason for this growth is the large number of ethnic diversity churches being started ,
partly as a result of immigration. Within the New Church stream, where attendance is down 8% over the period,
there has been considerable growth among New Frontiers (+70%) and Vineyard (+78%) churches, mostly
because they continue to plant new churches. Independent church attendance was down 1%, although there
was growth in some English regions21
.
Overall the Tearfund data on church growth from the perspective of regular churchgoers, is not wholly
inconsistent with the more reliable evidence from the English Church Census. On the Tearfund survey the
proportion saying their church is growing significantly is highest among Pentecostals (51%) and New churches
(25%)22
. The proportion saying their church is declining in numbers is greatest among Church of
Scotland/Presbyterian (26%), Methodist (23%) and Roman Catholic (22%).
19
“Pulling Out of the Nosedive: A Contemporary picture of church goingchurch going. What the 2005 English Church Census
reveals”
Dr. Peter Brierly, Christian Research (2006). 20
Which includes Overseas National churches, where 110% growth has been experienced between 1998-2005. 21
Table 2.13 in “UK Christian Handbook – Religious Trends No. 6 (2006/07). Analyses form the 2005 English Church
Census” Edited by Dr. Peter Brierly, Christian Research (2006) 22
The next highest ranked denominations on this measure were Orthodox – 25% growing significantly and Independent –
18% - although these were based on very small numbers of respondents so should be treated with caution.

38
Figure 14 Annual churchgoers’ reasons for going to church, by age
All 16-24 25-34 35-44 45-54 55-64 65-74 75+
Unweighted base: (1850) (157) (231) (298) (282) (311) (344) (227)
% % % % % % % %
Church worship/mass/comn 71 70 66 66 70 71 78 81
Christmas services 45 39 39 43 51 50 47 38
Weddings/baptisms/funerals 44 37 45 39 47 48 46 42
Easter or Harvest services 31 22 25 30 29 33 39 35
Other church gatherings 18 12 14 15 20 21 21 18
Community group/ event 14 7 8 13 14 19 19 15
Private confession/ prayer 9 8 8 12 10 7 9 8
To find out more aboutChristianity e.g. ‘Alpha’ 5 5 7 4 4 4 7 4
Average no. of reasons given 2.4 2.0 2.1 2.2 2.5 2.5 2.7 2.4
Base: All adults attending church at least once a year (unw. 1850 w. 1798)
= significantly above average Underline = significantly below average
Figure 15 Annual churchgoers’ reasons for going to church, by denomination
All CofE RC Ch Sct Meth Pentl/ Bapt Other*Prsb new
Unweighted base: (1850) (733) (438) (147) (93) (78) (61) (114)
% % % % % % % %
Church worship/mass/comn 71 63 83 83 77 90 76 84
Christmas services 45 50 40 43 51 49 36 51
Weddings/baptisms/funerals 44 47 38 50 53 36 43 47
Easter or Harvest services 31 32 27 39 38 40 41 47
Other church gatherings 18 16 10 20 25 50 34 32
Community group/ event 14 15 8 17 26 21 19 22
Private confession/ prayer 9 7 14 7 7 14 12 9
To find out more aboutChristianity e.g. ‘Alpha’ 5 3 3 3 12 18 9 11
Average no. of reasons given 2.4 2.3 2.2 2.6 2.9 3.2 2.7 3.1
Base: All adults attending church at least once a year (unw. 1850 w. 1798)
= significantly above average Underline = significantly below average
* Other = Church in Wales, URC/Congregational, Independent, Orthodox, Church of Ireland, Salvation Army, Brethren, Episcopal, Quaker, Other small denominations.

39
Figure 16 Annual churchgoers’ reasons for going to church, by evangelicalism
Evangelical type:
All No Yes Conser- Charis- Othervative matic
Unweighted base: (1850) (1321) (339) (119) (90) (71)
% % % % % %
Church worship/mass/comn 71 69 85 86 88 93
Christmas services 45 44 48 45 57 49
Weddings/baptisms/funerals 44 44 43 46 45 37
Easter or Harvest services 31 28 42 41 46 46
Other church gatherings 18 12 40 40 55 38
Community group/ event 14 12 25 29 25 29
Private confession/ prayer 9 7 15 14 18 19
To find out more aboutChristianity e.g. ‘Alpha’ 5 3 13 7 20 18
Average no. of reasons given 2.4 2.2 3.1 3.1 3.6 3.3
Base: All adults attending church at least once a year (unw. 1850 w. 1798)
= significantly above average Underline = significantly below average

40
Appendix 2 Research methods
The research was carried out using the weekly face-to-face omnibus survey conducted by RSGB, part of Taylor Nelson Sofres (TNS). A representative sample of 7,000 UK adults aged 16 or over was interviewed over 3 and
a half weeks between 8th February to 5
th March 2006.
Sampling
The omnibus used Random Location Sampling, from a master sampling frame developed by TNS utilizing Census small area statistics and the Postcode Address File (PAF) . Further details of the sampling process are
available upon request. 139 separate geographical sampling points were used in each of the first 3 weeks of fieldwork and 39 in the last half week. Each week interviewers were issued with two blocks of 70 addresses so they have tightly defined geographical area in which to work. To ensure a balanced sample of adults within
effective contacted addresses, quotas were set on sex (male, female housewife, female non-housewife); and within female housewife, presence of children and working status, and within men, working status.
Fieldwork
Respondents were interviewed face-to-face, in their own homes, using Computer Assisted Personal Interviewing
(CAPI). Interviewers were provided with detailed instructions about the survey and administration procedures. The back-checking procedures meet the requirements of the Market Research Society Interviewer Quality Control Scheme (IQCS).
The questionnaire was designed by Tearfund, in conjunction with Jacinta Ashworth, an Independent research consultant of Research Matters. and remains the property of Tearfund. The questions, from which data reported
here arise, are available upon request.
Data processing
After coding and editing the data, weighting was applied to correct for any minor imbalances in the achieved sample profile. The weighting matrix incorporated sex, age, social grade, and region.
Cross tabulations were produced for each question against key demographic variables. These data remain confidential to Tearfund.
Repeating the research in future
This research is part of ongoing tracking by Tearfund, which continues to measure prevalence of weekly, monthly and annual churchgoing on a bi-annual basis. The full set of questions which were asked in order to derive the church attendance model described in chapter 2 could be asked again in future to determine whether
there is any change in the balance of the different segments over time.
41
Appendix 3 Comparison with other surveys
It is possible to make some comparisons between the Tearfund results with two other reliable surveys measuring frequency of church attendance, namely British Social Attitudes and the English Church Census.
The Government survey, British Social Attitudes, asks adults in Great Britain aged 18+ a very similar question
to the Tearfund survey. It is possible to compare the two surveys, after some modifications to obtain directly
equivalent data23
for GB adults aged 18 or over, who are “Christian or of no religion”. Among this sub-set, who make up the vast majority of the population, British Social Attitudes recorded the followed levels of attendance at religious services in 2004:
• 9.5% at least weekly
• 16.4% at least monthly
• 24.4% at least twice a year and
• 28.6% at least annually24
The Tearfund research in February 2006 reports:
• 10.1% attending church at least weekly
• 15.3% at least monthly
• 22.4% at least twice a year and
• 24.9% at least annually.
Overall, there is a close correspondence between results from the two surveys, which is not surprising given their similar methodologies
Another notable piece of research on frequency of church attendance is the English Church Census,
conducted by Christian Research25
. This research finds a lower frequency of churchgoing than the Tearfund survey. The difference may be attributable to the different methodologies of the two surveys. The English
Church Census takes a snapshot of a particular week whereas the Tearfund research asks people to state their typical frequency of attendance. The 2005 English Church Census was an attempted census of all 37,500 churches in England, of whom 50% responded. The survey took a given Sunday 8
th May 2005 and recorded
accurately the number of people in England attending church that week for worship. On this week there were 3.2 million adults and children in church, 6.3% of the English population
26. This was composed of 2.5 million
23
British Social Attitudes (BSA) is conducted annually, face-to-face, in-home, with adults aged 18+ in Great Britain. In 2004
BSA asked “Apart from special occasions such as weddings, funerals and baptisms, how often nowadays do you attend
services or meetings connected with your religion”? with an almost scale to the Tearfund question . Note that those of faiths
other than Christianity were asked the question, but those of no religion were not asked and thereby assumed to be non-
attendees. It is possible to compare frequency of church attendance from the two surveys on a directly equivalent basis, by
leaving aside the minority of ‘other faiths’ and focusing on those who are ‘Christian or of no religion’. The Tearfund data are
adjusted such that all of ‘no religion’ are assumed to be non-attendees (whereas in fact 5% of adults with no religion said they
attended church at least once a year). These are the results which are presented in the commentary above and are based on
3,077 weighted respondents on BSA (2004) and 6,022 weighted respondents in the Tearfund research. 24
British Social Attitudes survey website http://www.britsocat.com 25
“Pulling Out of the Nosedive: A Contemporary picture of churchgoing. What the 2005 English Church Census reveals”
Dr. Peter Brierly, Christian Research (2006) 26
The addition of midweek worship such as services, cell groups etc. was estimated to increase the weekly attendance to
6.6% of the population.

42
adults aged 15+ (6.1% of adults in England) and 0.6 million children aged 0-14 (6.9% of children in England)27
. However some people who typically attend every week may not have been at church that particular week due to personal circumstances. The Tearfund research reports 9.1% of adults aged 16+ in England attending church
at least once a week nowadays in February 2006; equivalent to 3.7 million adults in England – this is 46% higher than the 2.5 million (6.1%) recorded on the English Church Census. Or put another way, around third of the adults saying they attend at least weekly were not in church on the weekend of the 2005 Census.
The European Social Survey compares attendance at religious services across different European countries. The chart below shows the percentage of adults aged 15 or over who replied ‘at least once a month’ to the
question “How often do you attend religious services apart from special occasions?” The Tearfund research in 2006 finds 15.4% of UK adults attending church at least once a month; the slightly lower percentage may reflect a downward trend in churchgoing but it should also be borne in mind that the 6% of other religions were not
asked about their religious attendance.
Figure 18 Attendance at religious services among adults aged 15+, European Social Survey (2002)
14.2%
18.2%
18.6%
18.9%
20.1%
20.9%
28.9%
30.0%
35.3%
44.1%
46.9%
54.6%
67.2%
75.5%
9.3%
0.0% 20.0% 40.0% 60.0% 80.0% 100.0%
Denmark
France
Hungary
UK
Belgium
Germany
Netherlands
Spain
Slovenia
Austria
Italy
Portugal
Greece
Ireland
Poland
27 UK Christian Handbook – Religious Trends No. 6 (2006/07). Analyses form the 2005 English Church Census” Edited by
Dr. Peter Brierly, Christian Research (2006)

www.tearfund.org100 Church Road, Teddington, Middlesex TW11 8QEChallenge House, 29 Canal Street, Glasgow G4 OADUned 6, Parc Gwyddoniaeth, Aberystwyth SY23 3AHRose House, 2 Derryvolgie Avenue, Belfast BT9 6FL
Overseas House, 3 Belgrave Road, Rathmines, Dublin [email protected] 0845 355 8355 (ROI: 00 44 845 355 8355)
Registered Charity No. 265464
17925-(0207)
Christian Faith Media Booklet Cover:Layout 1 13/2/07 16:09 Page 3