Embed Size (px)
Citation preview
CIERACommunity Initiative for Emissions Research and Applications
1
Claire Granier Université Pierre et Marie Curie/LATMOS, Paris, France and
NOAA/ESRL & Univ. Colorado/CIRES, Boulder, Colorado
Gregory J. Frost, NOAA/ESRL & Univ. Colorado/CIRES, Boulder, ColoradoJean-François Lamarque, NCAR/ACD & CGD, Boulder, Colorado
Stefan Falke, Northrop Grumman & Washington Univ., St. Louis, MissouriTerry Keating, EPA/OAR, Washington, DC
Paulette Middleton, Panorama Pathways, Boulder, ColoradoGabrielle Pétron, NOAA/ESRL & Univ. Colorado/CIRES, Boulder, Colorado
Steven J. Smith, DOE/PNNL & Univ. Maryland/JGCRI, College Park, MarylandMegan L. Melamed, AAAS Fellow, EPA/NCER, Washington, D.C.
Species considered: CO2, CH4, CO, NOx, SO2, NMVOCs, particles
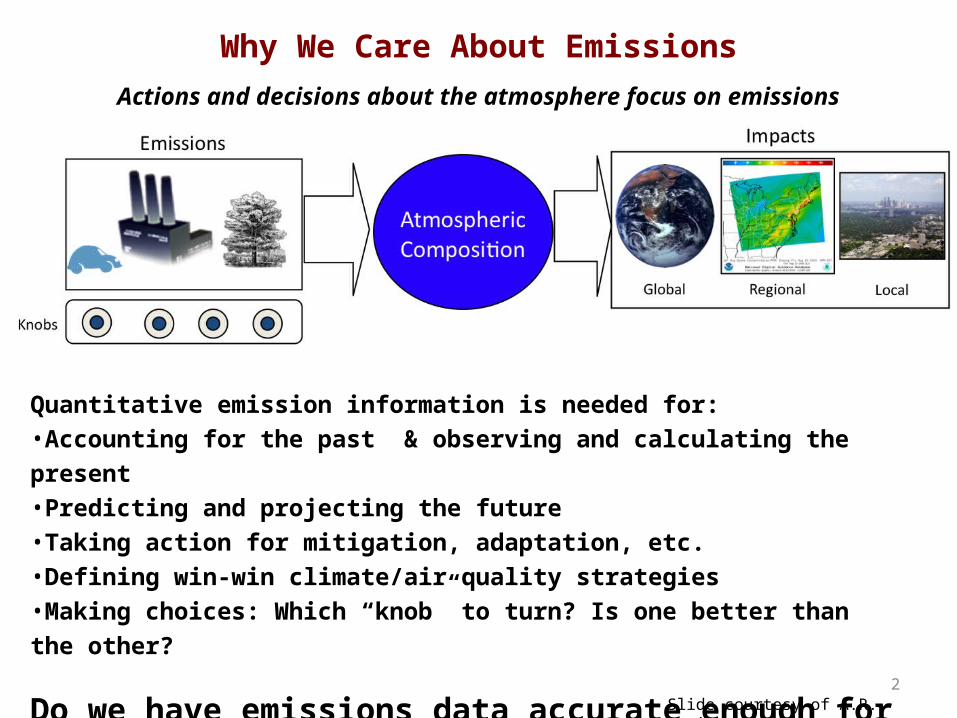
Why We Care About Emissions
Quantitative emission information is needed for:•Accounting for the past & observing and calculating the present•Predicting and projecting the future•Taking action for mitigation, adaptation, etc.•Defining win-win climate/air quality strategies•Making choices: Which “knob” to turn? Is one better than the other?
Do we have emissions data accurate enough for our modeling/analysis work?
Actions and decisions about the atmosphere focus on emissions
Slide courtesy of A.R. Ravishankara2
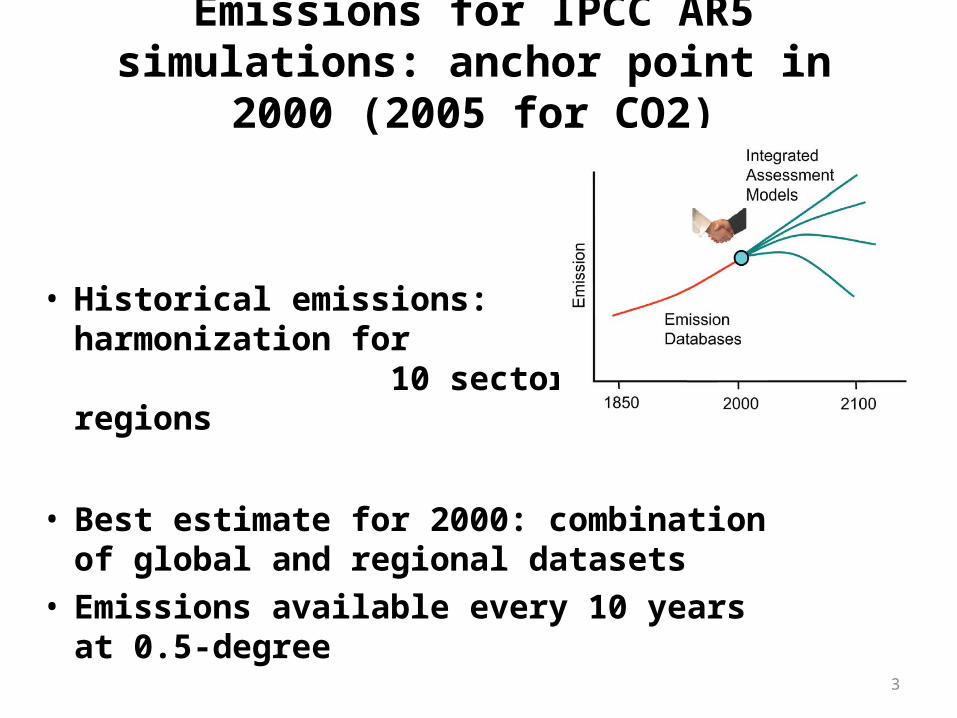
Emissions for IPCC AR5 simulations: anchor point in 2000 (2005 for CO2)
• Historical emissions: harmonization for 10 sectors and 40 regions
• Best estimate for 2000: combination of global and regional datasets
• Emissions available every 10 years at 0.5-degree
3
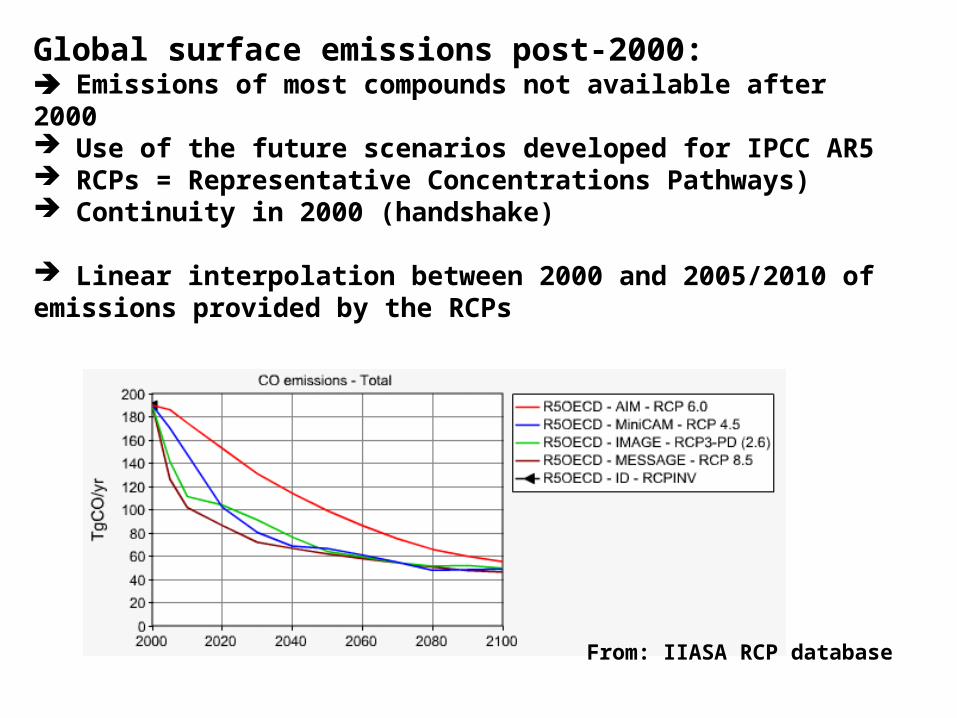
Global surface emissions post-2000: Emissions of most compounds not available after 2000 Use of the future scenarios developed for IPCC AR5 RCPs = Representative Concentrations Pathways) Continuity in 2000 (handshake)
Linear interpolation between 2000 and 2005/2010 of emissions provided by the RCPs
From: IIASA RCP database
Are any of these emissions accurate?
A systematic evaluation of surface emissions has started within GEIA (Global Emissions Inventory Activity), a sub-project of AIMES
Open to all people willing to propose new data / analyze results
Start with the 1980-2010 period
Only publicly available gridded inventories considered so far
Focus on: CO, NOx, SO2 and BC
Assess whether one of the 2000-2010 scenarios is closer than the others to regional emissions available after 2000, assuming regional emissions are more accurate
6
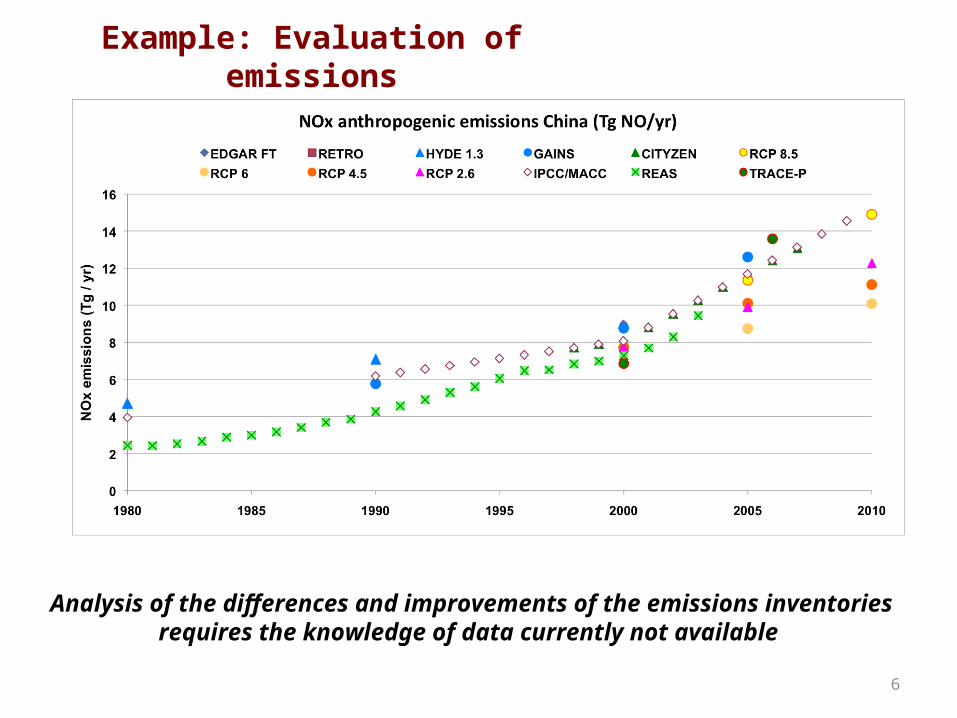
Example: Evaluation of emissions
Analysis of the differences and improvements of the emissions inventories requires the knowledge of data currently not available
7
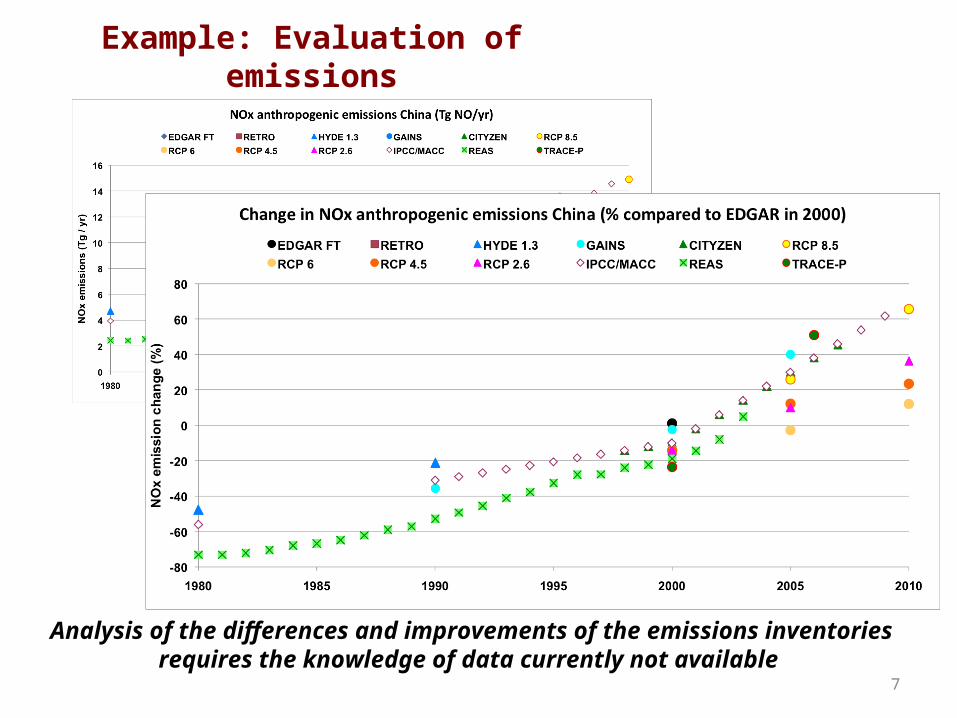
Example: Evaluation of emissions
Analysis of the differences and improvements of the emissions inventories requires the knowledge of data currently not available
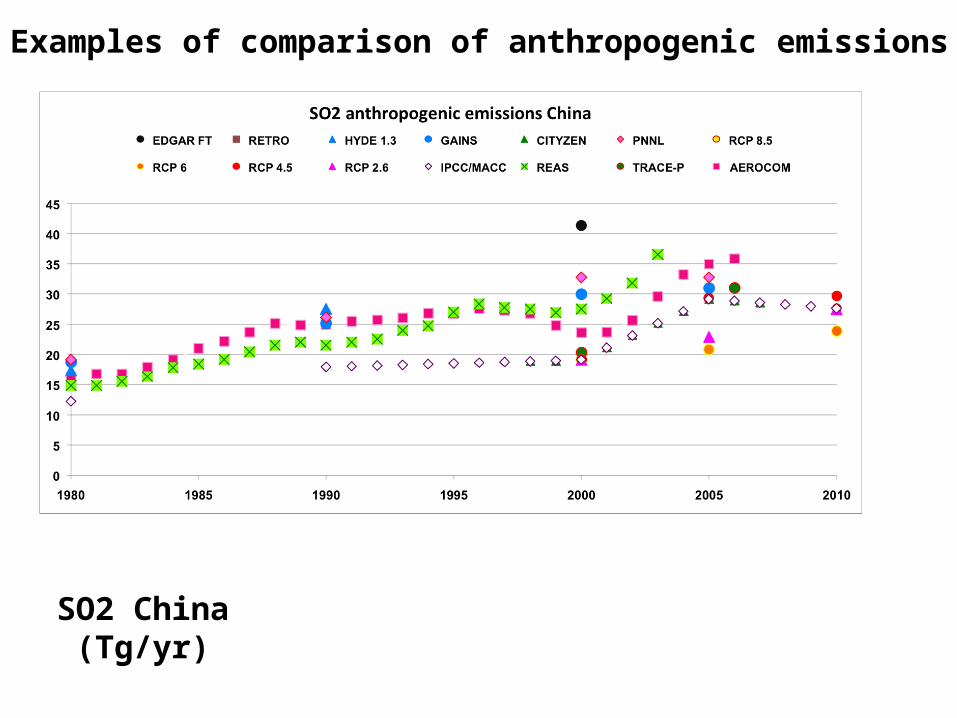
Examples of comparison of anthropogenic emissions
SO2 China(Tg/yr)
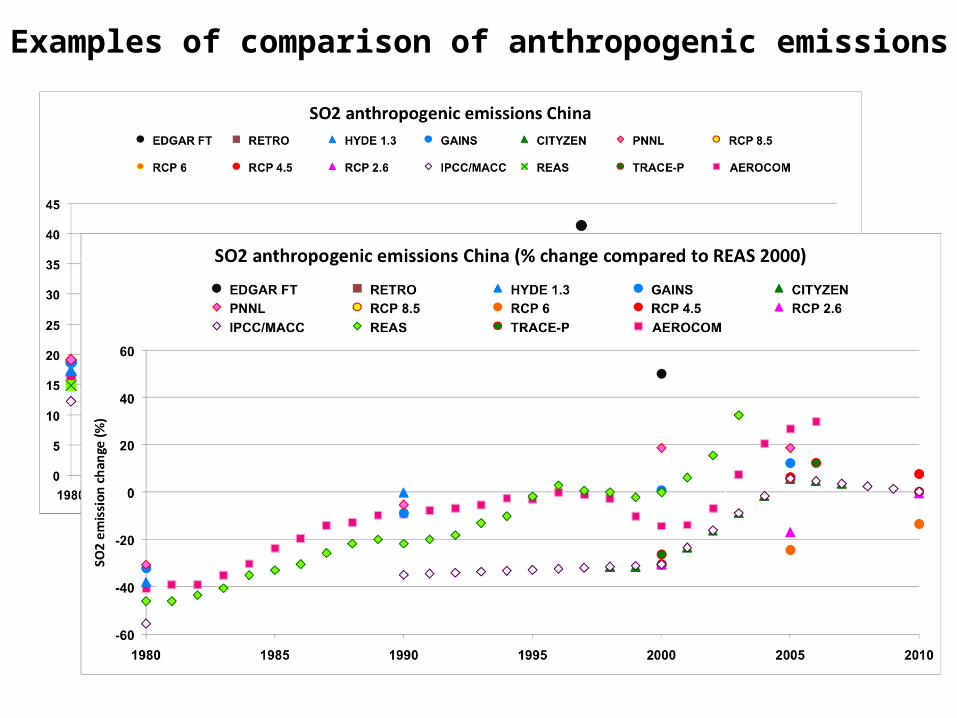
Examples of comparison of anthropogenic emissions
SO2 China (Tg/yr)
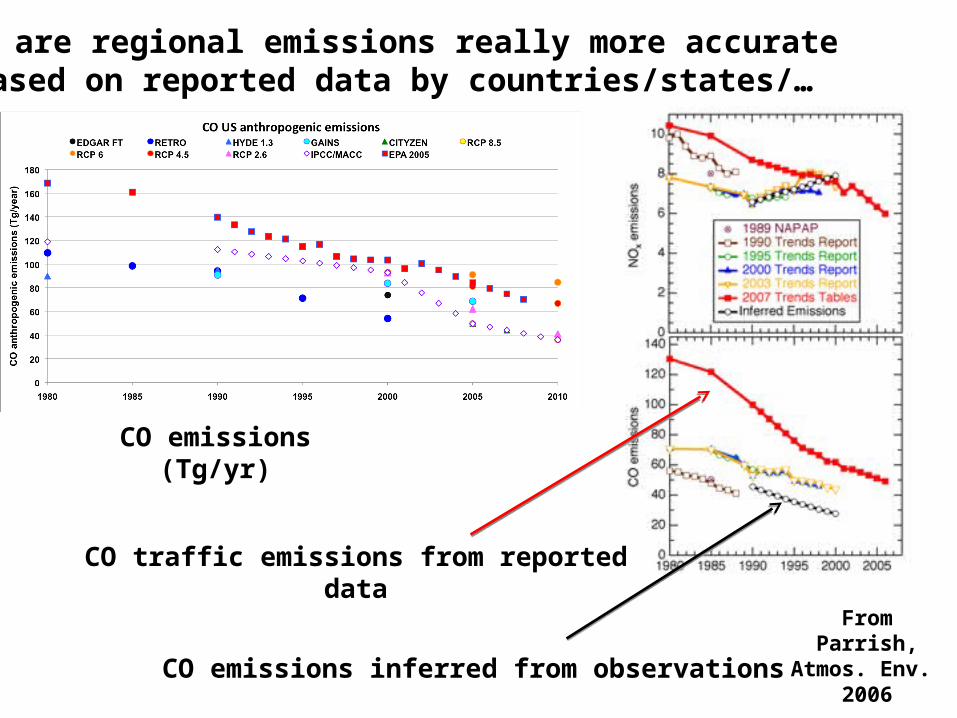
But, are regional emissions really more accurate Based on reported data by countries/states/…
CO emissions (Tg/yr)
CO traffic emissions from reported data
CO emissions inferred from observations
From Parrish, Atmos. Env.
2006
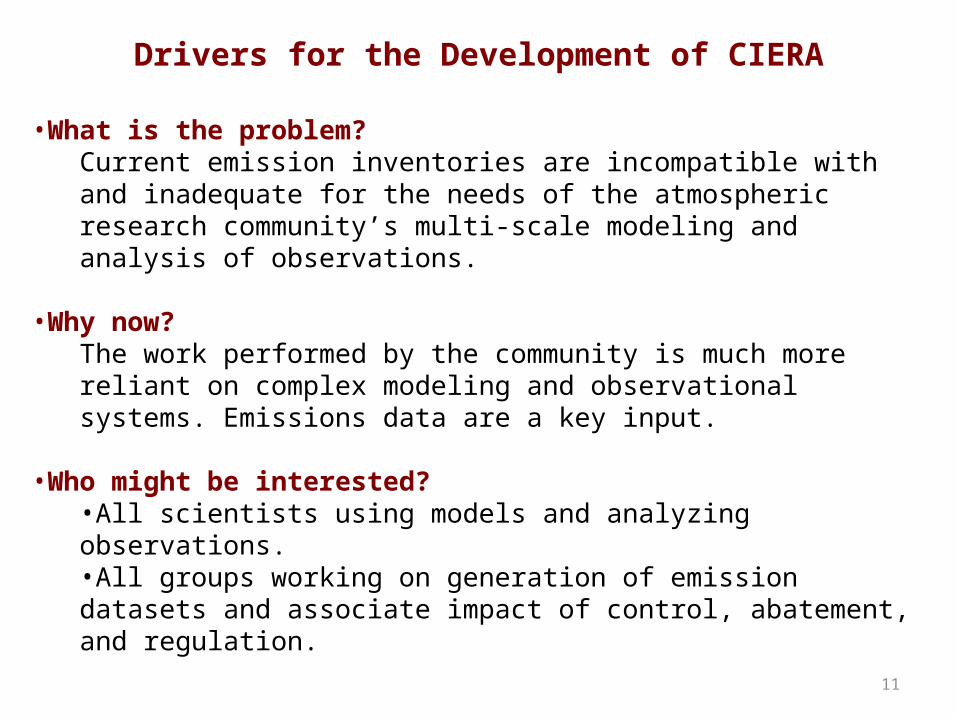
Drivers for the Development of CIERA
11
•What is the problem?Current emission inventories are incompatible with and inadequate for the needs of the atmospheric research community’s multi-scale modeling and analysis of observations.
•Why now? The work performed by the community is much more reliant on complex modeling and observational systems. Emissions data are a key input.
•Who might be interested? •All scientists using models and analyzing observations.•All groups working on generation of emission datasets and associate impact of control, abatement, and regulation.
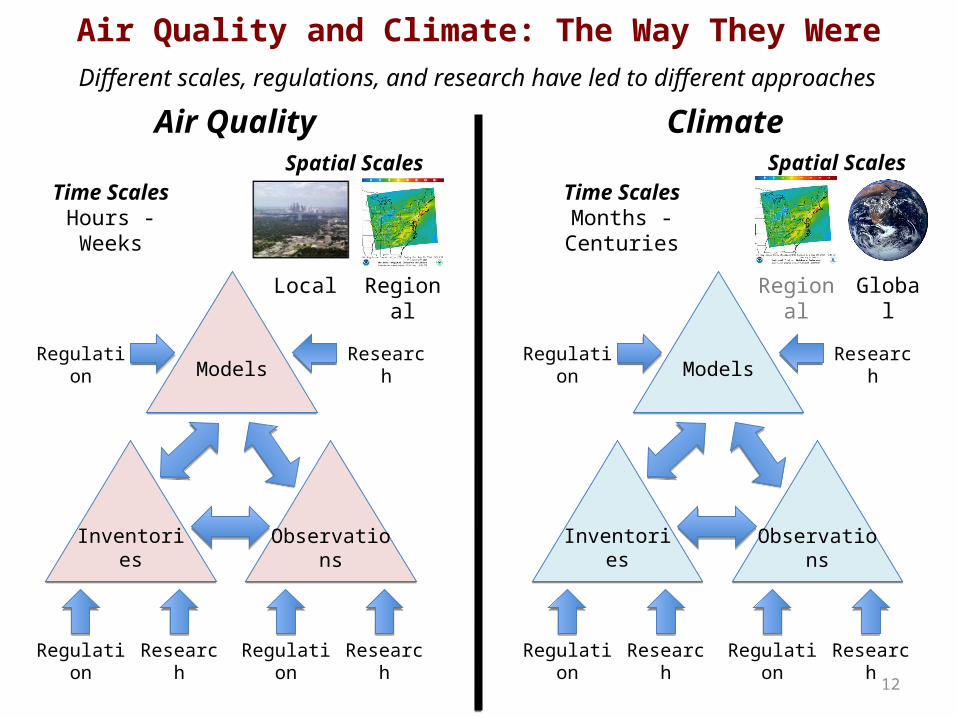
Air Quality and Climate: The Way They Were
Different scales, regulations, and research have led to different approaches
Air Quality Climate
12
Regulation Research
Inventories Observations
ModelsRegulation Research
Regulation Research Regulation Research
Inventories Observations
ModelsRegulation Research
Regulation Research
Time ScalesHours - Weeks
RegionalLocal
Spatial ScalesTime Scales
Months - Centuries
Global
Spatial Scales
Regional
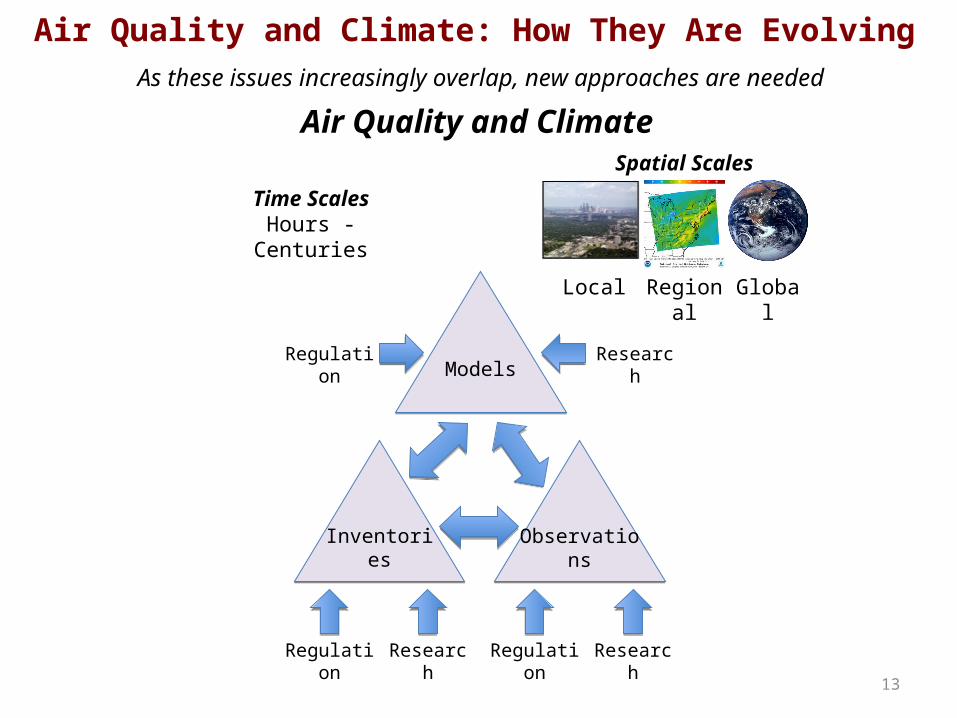
Air Quality and Climate: How They Are Evolving
As these issues increasingly overlap, new approaches are needed
Air Quality and Climate
13
Regulation Research
Inventories Observations
ModelsRegulation Research
Regulation Research
Time ScalesHours - Centuries
RegionalLocal
Spatial Scales
Global
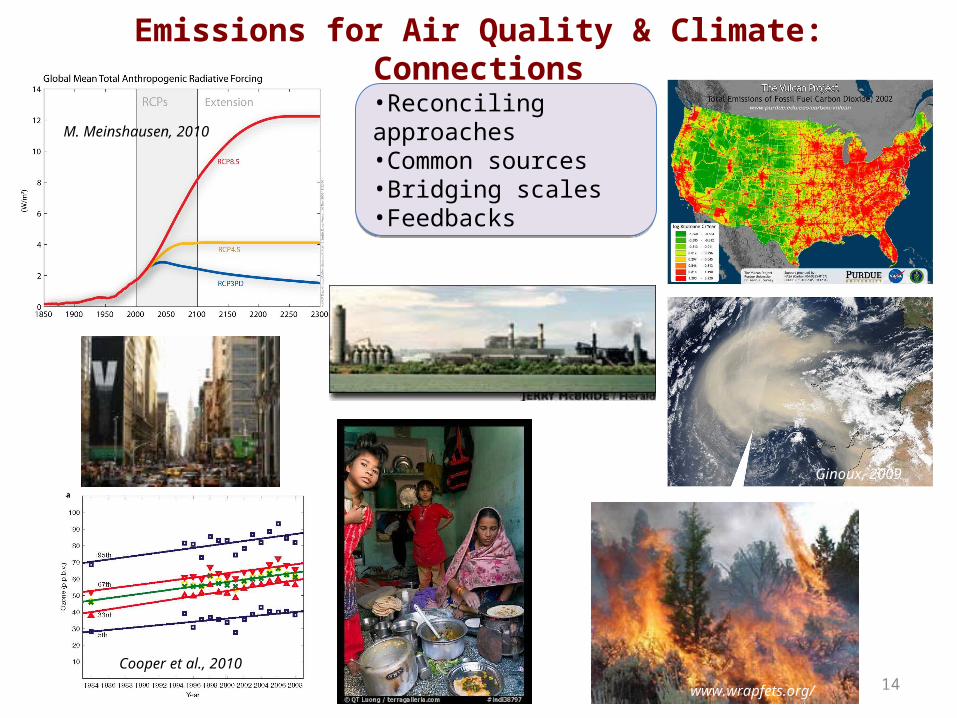
•Reconciling approaches•Common sources•Bridging scales•Feedbacks
•Reconciling approaches•Common sources•Bridging scales•Feedbacks
Emissions for Air Quality & Climate: Connections
www.wrapfets.org/ 14
Cooper et al., 2010
Ginoux, 2009
M. Meinshausen, 2010
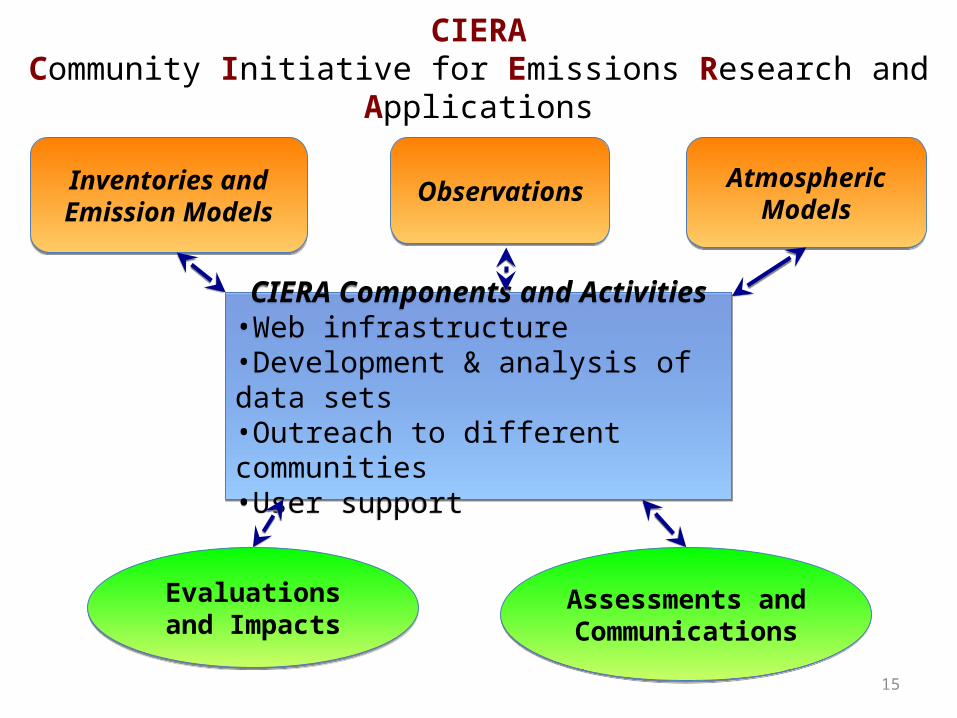
CIERACommunity Initiative for Emissions Research and Applications
Evaluations and Impacts
Evaluations and Impacts
Assessments and CommunicationsAssessments and Communications
15
Inventories andEmission ModelsInventories and
Emission ModelsObservationsObservations Atmospheric
ModelsAtmospheric
Models
CIERA Components and Activities•Web infrastructure•Development & analysis of data sets•Outreach to different communities•User support
CIERA Components and Activities•Web infrastructure•Development & analysis of data sets•Outreach to different communities•User support
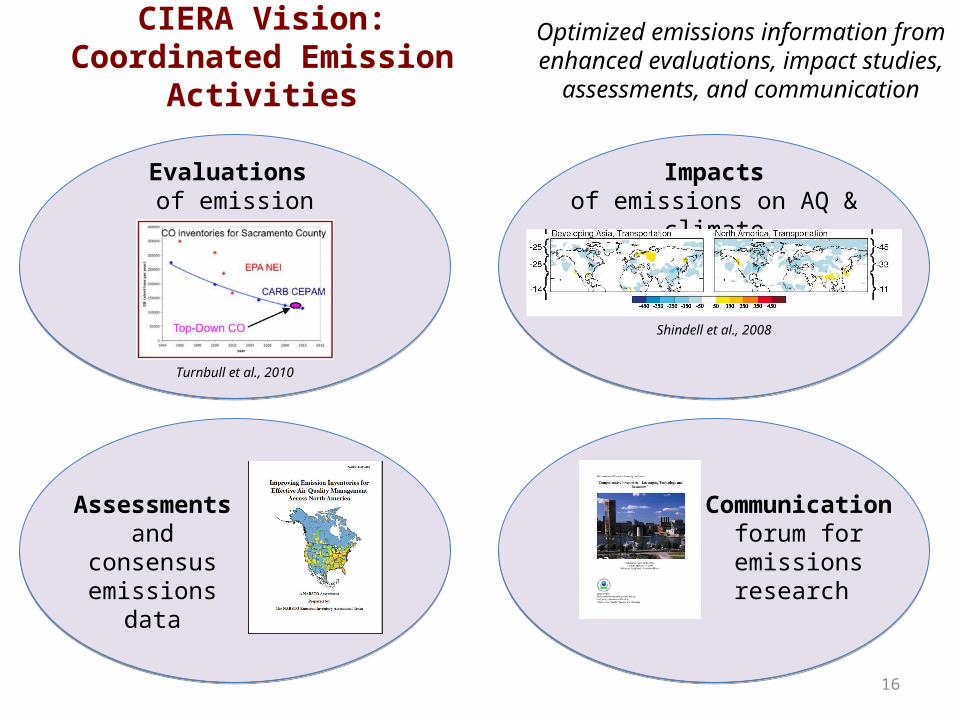
CIERA Vision:Coordinated Emission Activities
Optimized emissions information from enhanced evaluations, impact studies,
assessments, and communication
16
Assessmentsand consensus emissions data
Evaluations of emission data
Turnbull et al., 2010
Impactsof emissions on AQ & climate
Shindell et al., 2008
Communicationforum for emissions research
Observations
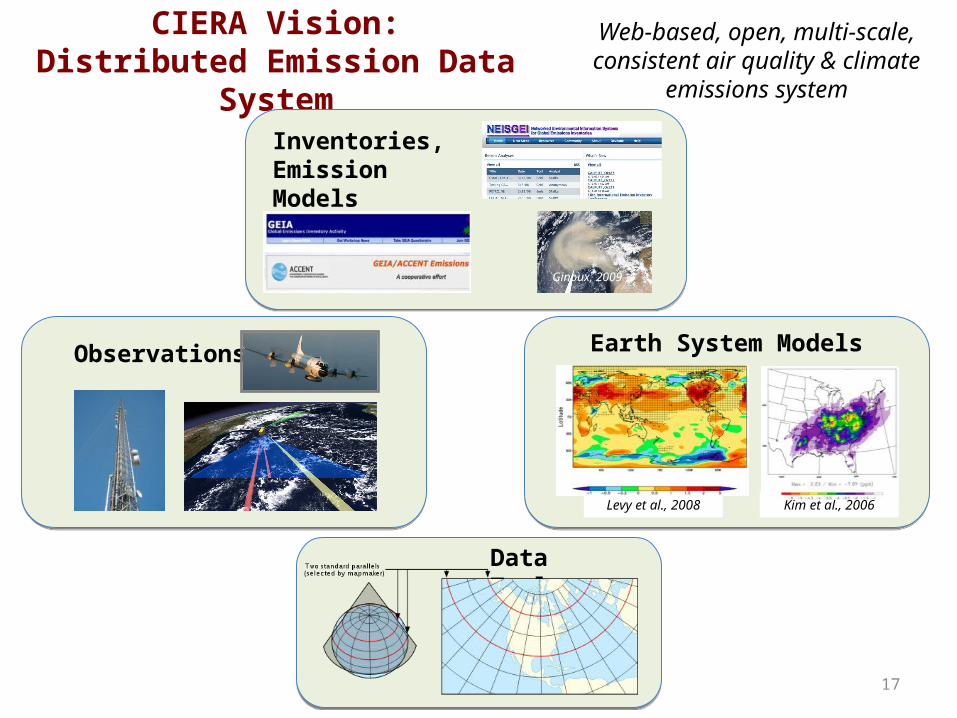
CIERA Vision:Distributed Emission Data System
Data Tools
Inventories,Emission Models
Web-based, open, multi-scale, consistent air quality & climate
emissions system
17
Earth System Models
Kim et al., 2006Levy et al., 2008
Ginoux, 2009
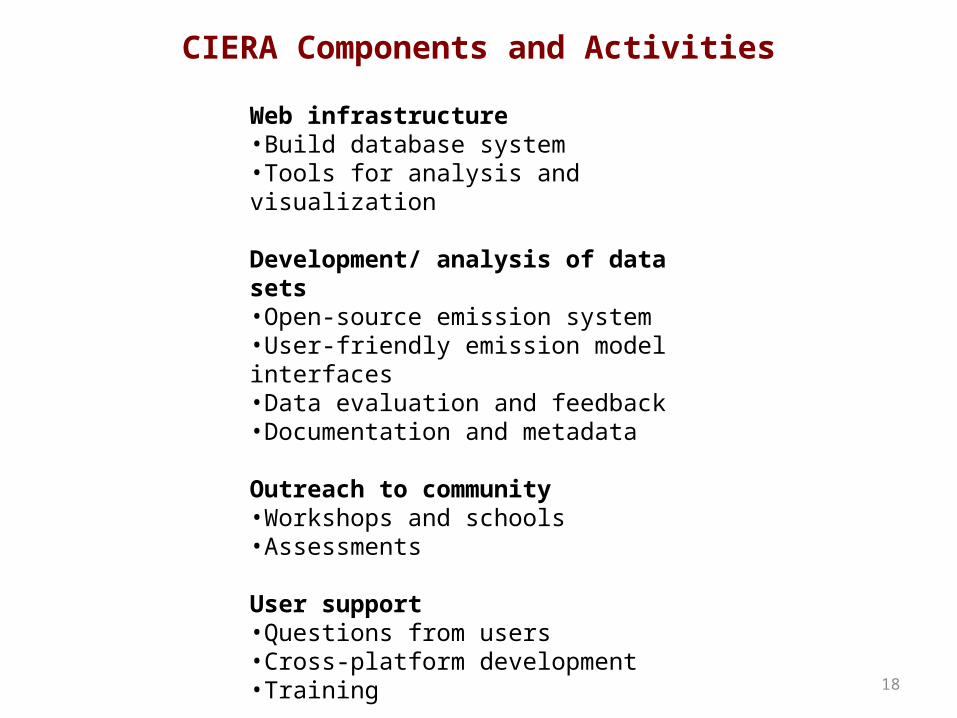
CIERA Components and Activities
18
Web infrastructure•Build database system•Tools for analysis and visualization
Development/ analysis of data sets•Open-source emission system•User-friendly emission model interfaces•Data evaluation and feedback•Documentation and metadata
Outreach to community•Workshops and schools•Assessments
User support•Questions from users•Cross-platform development•Training
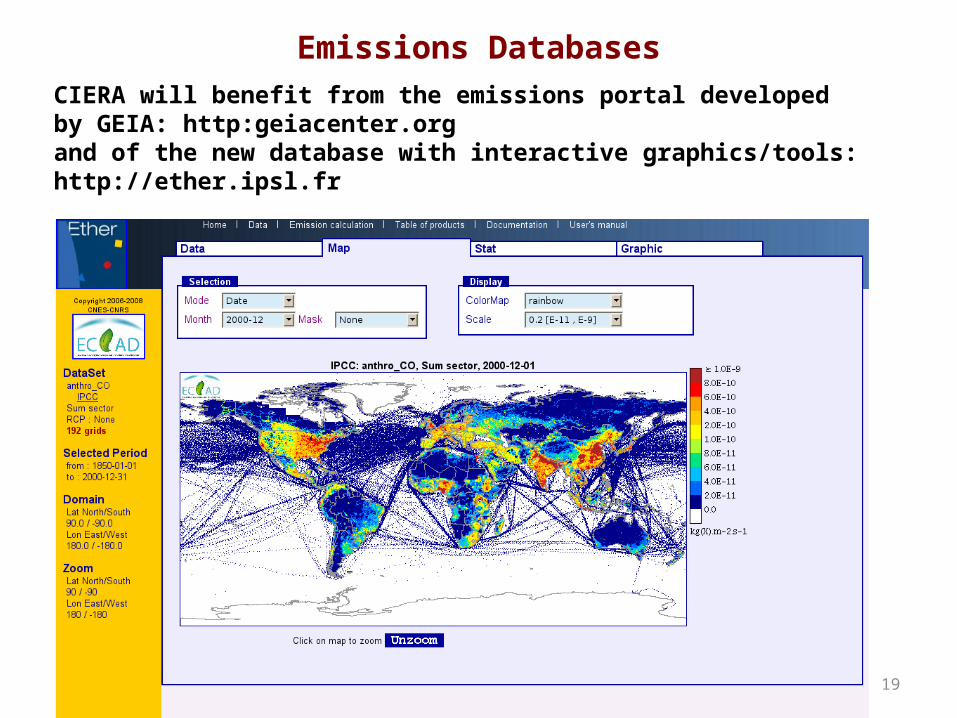
Emissions Databases
19
CIERA will benefit from the emissions portal developed by GEIA: http:geiacenter.organd of the new database with interactive graphics/tools:http://ether.ipsl.fr
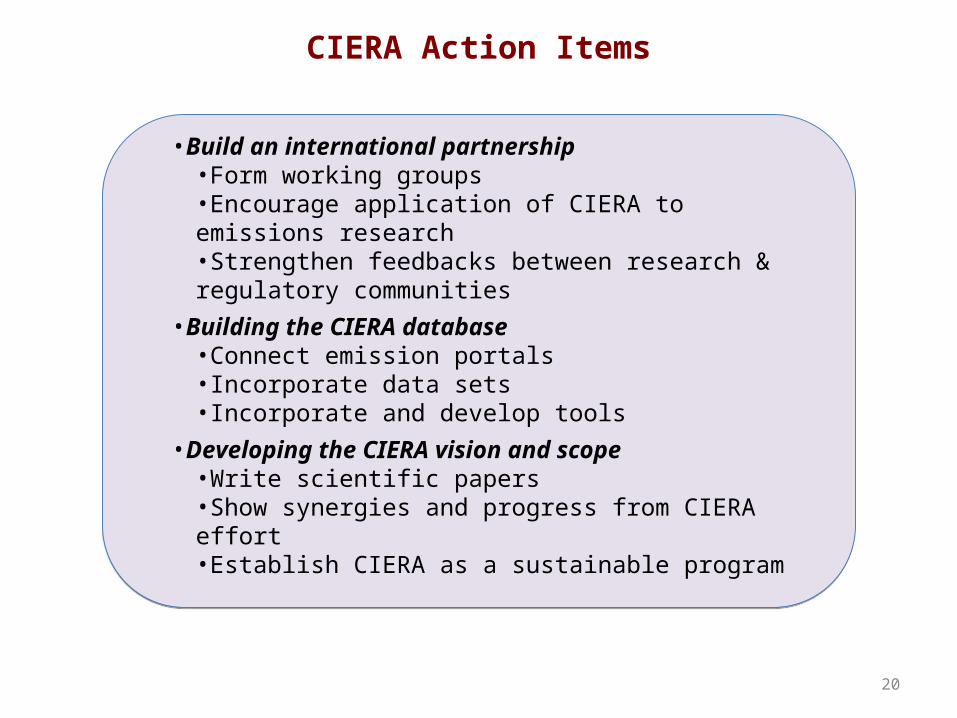
CIERA Action Items
•Build an international partnership•Form working groups•Encourage application of CIERA to emissions research•Strengthen feedbacks between research & regulatory communities
•Building the CIERA database•Connect emission portals•Incorporate data sets•Incorporate and develop tools
•Developing the CIERA vision and scope•Write scientific papers•Show synergies and progress from CIERA effort•Establish CIERA as a sustainable program
20
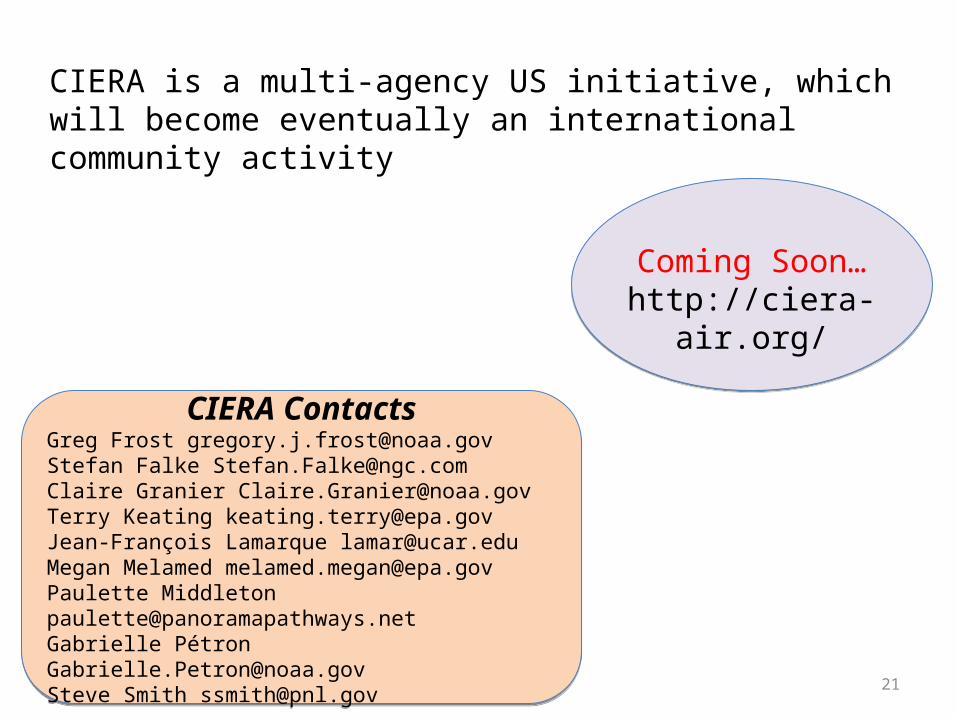
CIERA ContactsGreg Frost [email protected] Falke [email protected] Claire Granier [email protected] Terry Keating [email protected] Jean-François Lamarque [email protected] Megan Melamed [email protected] Paulette Middleton [email protected] Gabrielle Pétron [email protected] Steve Smith [email protected]
CIERA ContactsGreg Frost [email protected] Falke [email protected] Claire Granier [email protected] Terry Keating [email protected] Jean-François Lamarque [email protected] Megan Melamed [email protected] Paulette Middleton [email protected] Gabrielle Pétron [email protected] Steve Smith [email protected]
Coming Soon…http://ciera-air.org/
21
CIERA is a multi-agency US initiative, which will become eventually an international community activity