Embed Size (px)
Citation preview

Cimifrigines A-G, Cytotoxic Triterpenes with an Oxime Group
from the Flowers of Cimicifuga frigida
Yin Nian, Hui Yan, Xiao-Nian Li, Lin Zhou, Ming-Hua Qiu
State Key Laboratory of Phytochemistry and Plant Resources in West China,
Kunming Institute of Botany, Chinese Academy of Sciences, Kunming 650201,
People’s Republic of China
Supporting Information List
Characterization Data of New Compounds
Page 2-8, 1H, 13C, HSQC, HMBC, COSY and ROESY NMR spectra and HREIMS experiment of compound 1.
Page 9-15, 1H, 13C, HSQC, HMBC, COSY and ROESY NMR spectra and HREIMS experiment of compound 2.
Page 16-22, 1H, 13C, HSQC, HMBC, COSY and ROESY NMR spectra and HREIMS experiment of compound 3.
Page 23-29, 1H, 13C, HSQC, HMBC, COSY and ROESY NMR spectra and HREIMS experiment of compound 4.
Page 30-36, 1H, 13C, HSQC, HMBC, COSY and ROESY NMR spectra and HREIMS experiment of compound 5.
Page 37-43, 1H, 13C, HSQC, HMBC, COSY and ROESY NMR spectra and HREIMS experiment of compound 6.
Page 44-50, 1H, 13C, HSQC, HMBC, COSY and ROESY NMR spectra and HREIMS experiment of compound 7.
Page 51, Table S1: Cytotoxicity of compounds isolated from the flowers of C. frigida
1
Electronic Supplementary Material (ESI) for RSC Advances.This journal is © The Royal Society of Chemistry 2017
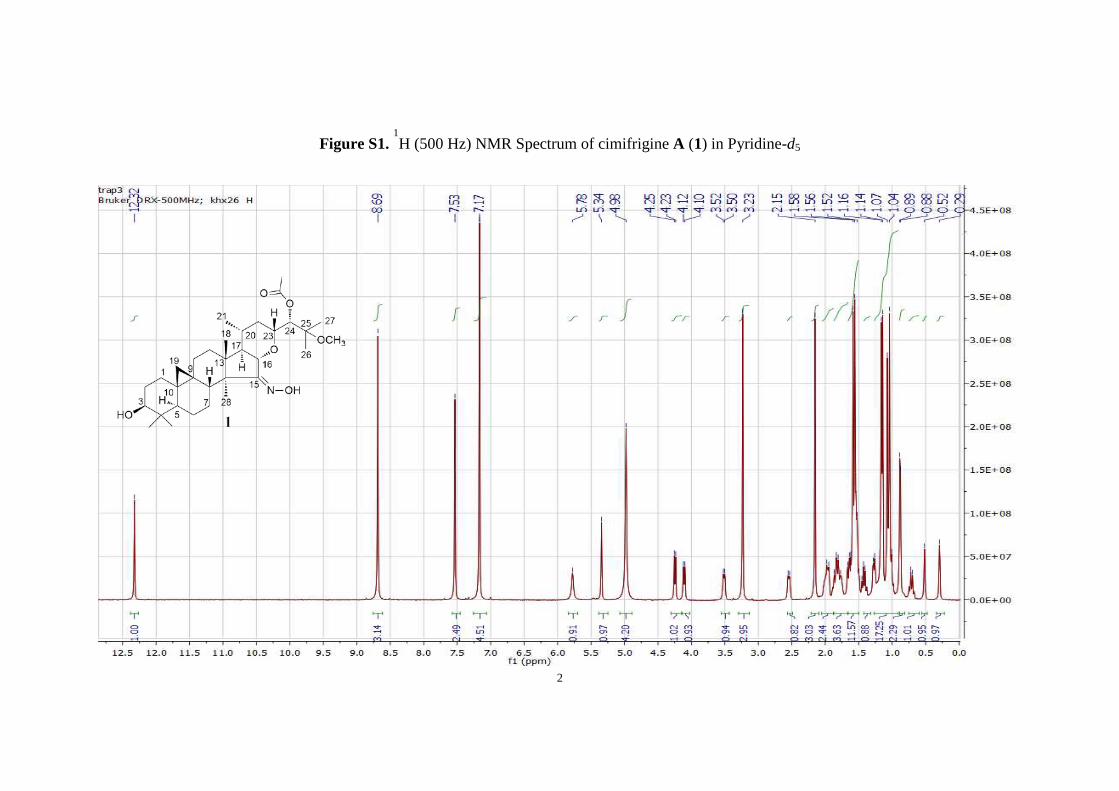
Figure S1. 1H (500 Hz) NMR Spectrum of cimifrigine A (1) in Pyridine-d5
2

Figure S2. 13C (150 Hz) NMR Spectrum of cimifrigine A (1) in Pyridine-d5
3

Figure S3. HSQC (600 Hz) Spectrum of cimifrigine A (1) in Pyridine-d5
4

Figure S4. HMBC (600 Hz) Spectrum of cimifrigine A (1) in Pyridine-d5
5

Figure S5. 1H-1H COSY (600 Hz) Spectrum of cimifrigine A (1) in Pyridine-d5
6
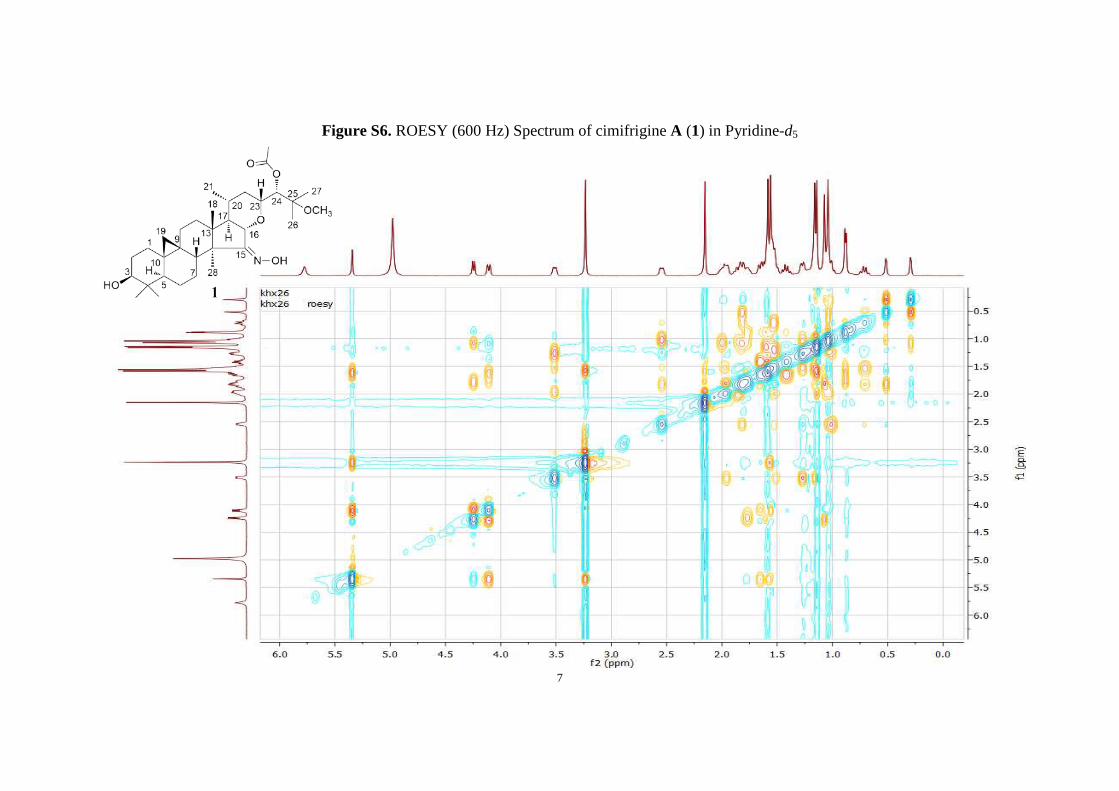
Figure S6. ROESY (600 Hz) Spectrum of cimifrigine A (1) in Pyridine-d5
7

Figure S7. HREIMS of cimifrigine A (1)
8

Figure S8. 1H (500 Hz) NMR Spectrum of cimifrigine B (2) in Pyridine-d5
9
Figure S9. 13C (150 Hz) NMR Spectrum of cimifrigine B (2) in Pyridine-d5
10
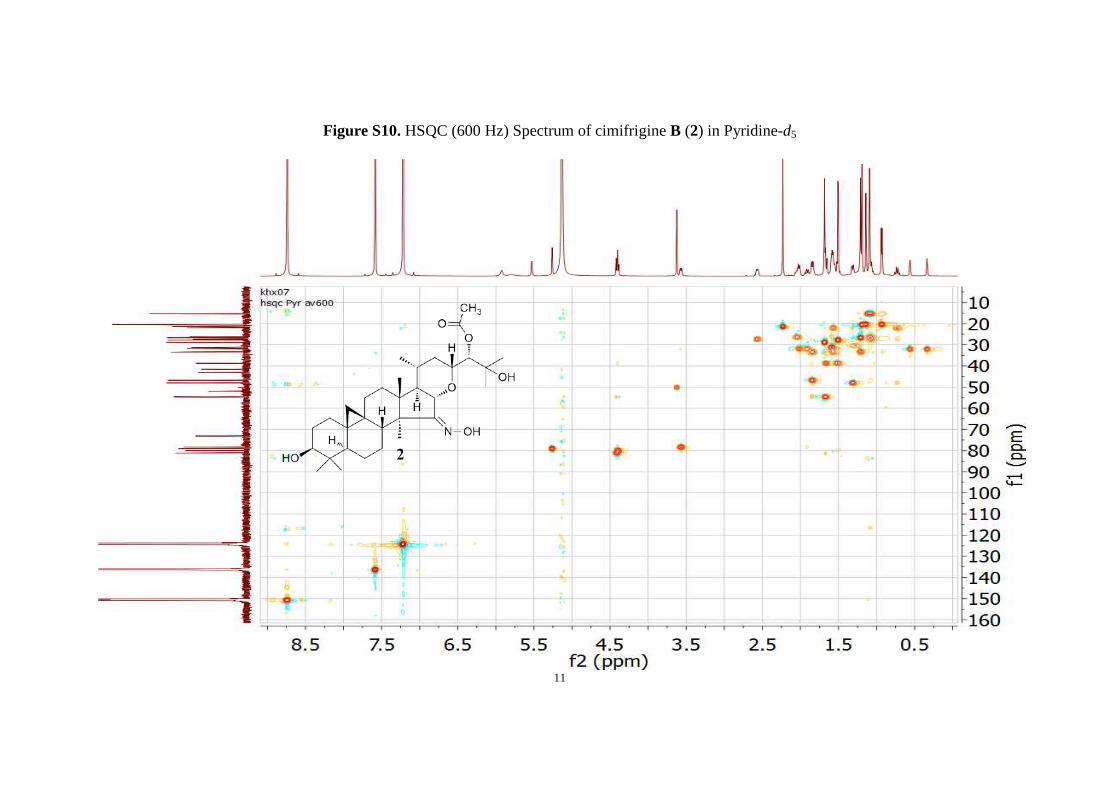
Figure S10. HSQC (600 Hz) Spectrum of cimifrigine B (2) in Pyridine-d5
11

Figure S11. HMBC (600 Hz) Spectrum of cimifrigine B (2) in Pyridine-d5
12

Figure S12. 1H-1H COSY (600 Hz) Spectrum of cimifrigine B (2) in Pyridine-d5
13

Figure S13. ROESY (600 Hz) Spectrum of cimifrigine B (2) in Pyridine-d5
14

Figure S14. HREIMS of cimifrigine B (2)
15

Figure S15. 1H (500 Hz) NMR Spectrum of cimifrigine C (3) in Pyridine-d5
16

Figure S16. 13C (150 Hz) NMR Spectrum of cimifrigine C (3) in Pyridine-d5
17

Figure S17. HSQC (600 Hz) Spectrum of cimifrigine C (3) in Pyridine-d5
18
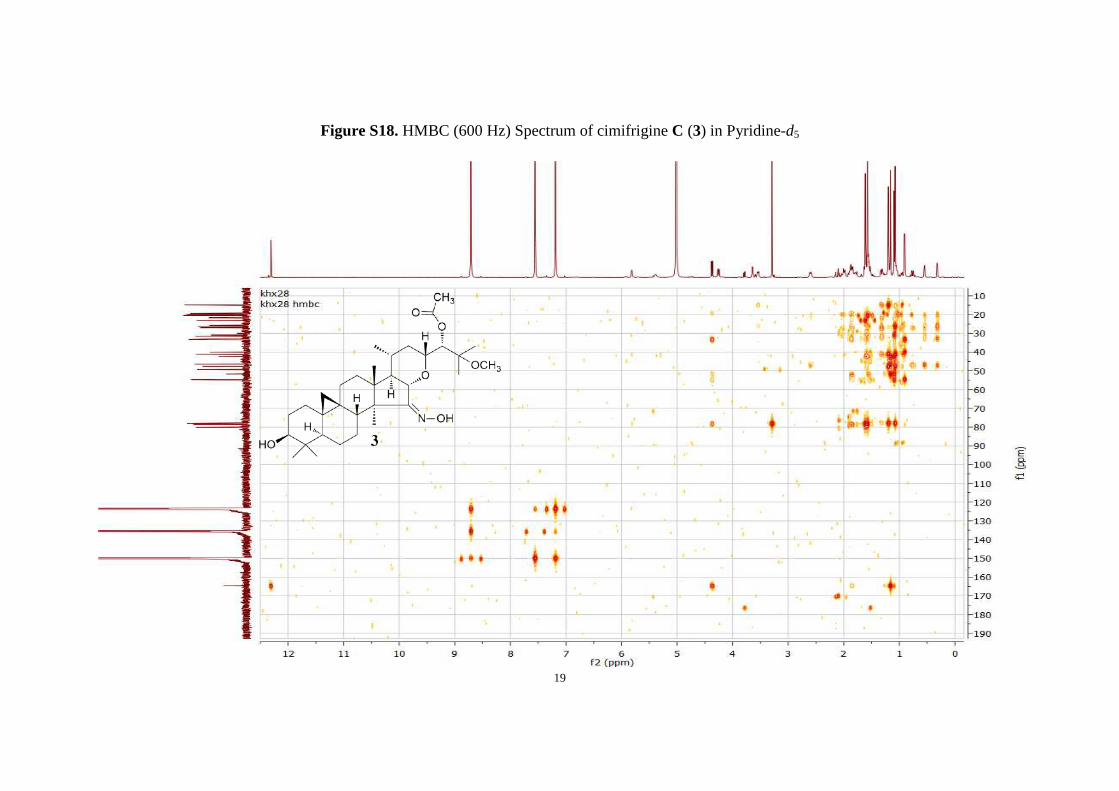
Figure S18. HMBC (600 Hz) Spectrum of cimifrigine C (3) in Pyridine-d5
19

Figure S19. 1H-1H COSY (600 Hz) Spectrum of cimifrigine C (3) in Pyridine-d5
20

Figure S20. ROESY (600 Hz) Spectrum of cimifrigine C (3) in Pyridine-d5
21

Figure S21. HREIMS of cimifrigine C (3)
22

Figure S22. 1H (500 Hz) NMR Spectrum of cimifrigine D (4) in Pyridine-d5
23

Figure S23. 13C (150 Hz) NMR Spectrum of cimifrigine D (4) in Pyridine-d5
24

Figure S24. HSQC (600 Hz) Spectrum of cimifrigine D (4) in Pyridine-d5
25

Figure S25. HMBC (600 Hz) Spectrum of cimifrigine D (4) in Pyridine-d5
26
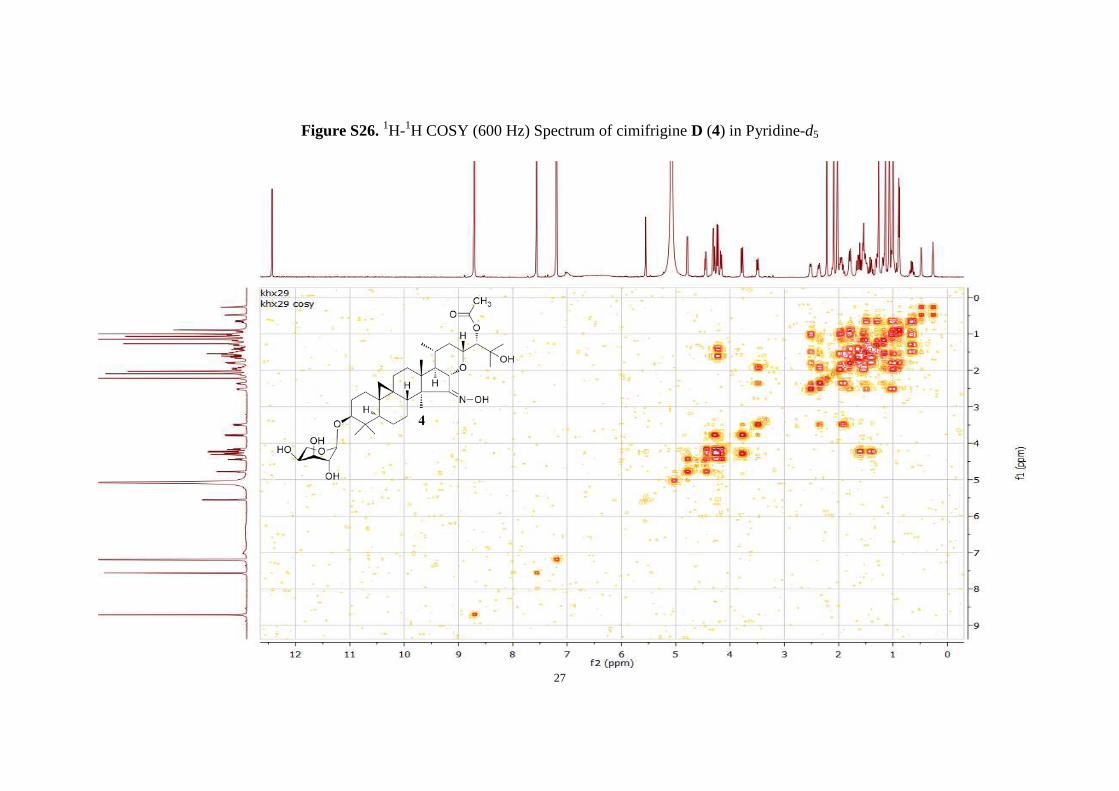
Figure S26. 1H-1H COSY (600 Hz) Spectrum of cimifrigine D (4) in Pyridine-d5
27

Figure S27. ROESY (600 Hz) Spectrum of cimifrigine D (4) in Pyridine-d5
28

Figure S28. HREIMS of cimifrigine D (4)
29

Figure S29. 1H (500 Hz) NMR Spectrum of cimifrigine E (5) in Pyridine-d5
30

Figure S30. 13C (150 Hz) NMR Spectrum of cimifrigine E (5) in Pyridine-d5
31

Figure S31. HSQC (600 Hz) Spectrum of cimifrigine E (5) in Pyridine-d5
32

Figure S32. HMBC (600 Hz) Spectrum of cimifrigine E (5) in Pyridine-d5
33

Figure S33. 1H-1H COSY (600 Hz) Spectrum of cimifrigine E (5) in Pyridine-d5
34

Figure S34. ROESY (600 Hz) Spectrum of cimifrigine E (5) in Pyridine-d5
35

Figure S35. HREIMS of cimifrigine E (5)
36

Figure S36. 1H (500 Hz) NMR Spectrum of cimifrigine F (6) in Pyridine-d5
37

Figure S37. 13C (150 Hz) NMR Spectrum of cimifrigine F (6) in Pyridine-d5
38

Figure S38 HSQC (600 Hz) Spectrum of cimifrigine F (6) in Pyridine-d5
39

Figure S39 HMBC (600 Hz) Spectrum of cimifrigine F (6) in Pyridine-d5
40

Figure S40. 1H-1H COSY (600 Hz) Spectrum of cimifrigine F (6) in Pyridine-d5
41

Figure S41 ROESY (600 Hz) Spectrum of cimifrigine F (6) in Pyridine-d5
42

Figure S42. HREIMS of cimifrigine F (6)
43

Figure S43. 1H (500 Hz) NMR Spectrum of cimifrigine G (7) in Pyridine-d5
44
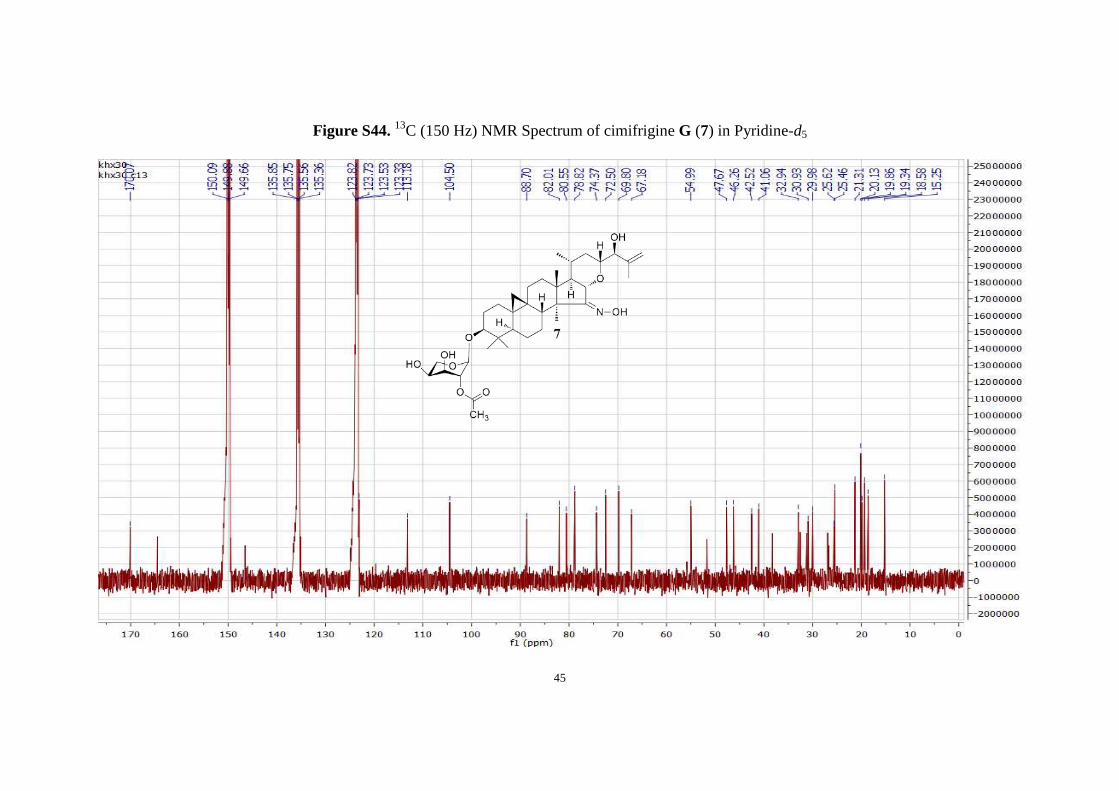
Figure S44. 13C (150 Hz) NMR Spectrum of cimifrigine G (7) in Pyridine-d5
45

Figure S45 HSQC (600 Hz) Spectrum of cimifrigine G (7) in Pyridine-d5
46

Figure S46 HMBC (600 Hz) Spectrum of cimifrigine G (7) in Pyridine-d5
47

Figure S47. 1H-1H COSY (600 Hz) Spectrum of cimifrigine G (7) in Pyridine-d5
48

Figure S48 ROESY (600 Hz) Spectrum of cimifrigine G (7) in Pyridine-d5
49

Figure S49. HREIMS of cimifrigine G (7)
50

Table S1 Cytotoxicity of compounds isolated from the flowers of C. frigidaa,b
Compounds HL-60 SMMC-7721 A549 MCF-7 SW480
1 19.3 ± 1.3 25.7 ± 0.7 24.1 ± 1.4 > 30 > 30
2 18.4 ± 0.7 23.8 ± 1.2 25.3 ± 2.0 > 30 > 30
3 25.9 ± 1.1 > 30 > 30 > 30 > 30
4 10.4 ± 0.8 11.2 ± 1.0 9.3 ± 0.6 12.7 ± 0.7 13.2 ± 0.8
5 1.2 ± 0.1 4.5 ± 0.2 4.0 ± 0.3 5.8 ± 0.6 6.3 ± 0.3
6 12.5 ± 1.3 14.3 ± 1.2 9.8 ± 1.0 11.4 ± 0.8 8.9 ± 0.9
7 0.8 ± 0.09 2.6 ± 0.1 1.4 ± 0.08 3.7 ± 0.07 4.3 ± 0.4
Cisplatinc 0.5 ± 0.03 3.3 ± 0.2 2.3 ± 0.1 5.4 ± 0.3 4.4 ± 0.2
aResults are expressed as the average (n = 3) of IC50 values (μM). b0.1% DMSO as the solvent control and did not show any cytotoxicity to those cell lines. cUsed as a positive control substance for the cytotoxicity assay.
51


![Manual de...PDF Xime[1]](https://img.pdfslide.net/doc/110x75/5571fd1e4979599169987a17/manual-depdf-xime1.jpg)


![Xime y alexis [130887]](https://img.pdfslide.net/doc/110x75/589dcd691a28abf45d8b568d/xime-y-alexis-130887.jpg)