Embed Size (px)
Citation preview
January 9, 2017
CIO UpdatePerformance Report
2
Legal Disclaimer
The information in this document is for EDUCATIONAL and NON-COMMERCIAL use only and is not
intended to constitute specific legal, accounting, financial or tax advice for any individual. In no event will
QUIC, its members or directors, or Queen’s University be liable to you or anyone else for any loss or
damages whatsoever (including direct, indirect, special, incidental, consequential, exemplary or punitive
damages) resulting from the use of this document, or reliance on the information or content found
within this document. The information may not be reproduced or republished in any part without the
prior written consent of QUIC and Queen’s University.
QUIC is not in the business of advising or holding themselves out as being in the business of advising.
Many factors may affect the applicability of any statement or comment that appear in our documents to
an individual's particular circumstances.
© Queen’s University 2017

January 9, 2017
CIO UpdatePerformance Report – Consolidated Fund

Portfolio Management Statistics
As at January 6, 2017
Canadian Fund U.S. Fund
Asset Value: February 26, 2016 $659,044 Asset Value: February 26, 2016 $148,746
Additional Contributions $500 Additional Contributions $95,512
Less: Cost of Capital ($26,302)
Proceeds from: Proceeds from: $0
Dividends $16,395 Dividends $3,027
Interest $0 Interest $0
Capital Gains Capital Gains
Realized $35,132 Realized ($2,644)
Unrealized $110,462 Unrealized $33,673
Less: Brokerage Fees ($4,361) Less: Brokerage Fees ($1,268)
Less: Operating Expenses $0 Less: Operating Expenses $0
Current Asset Value - $CAD $790,870 Current Asset Value - $US $277,046
Current Asset Value - $CAD (1) $366,028
Combined - Current Asset Value - $CAD $1,156,898
Combined - Absolute Return (2) 19.7%
(1) Exchange Rate - CAD/USD: 1.321
(2) Absolute Return is net of additional contributions,
and excl. FX gains
(Note) CAD/USD appreciation since February 26, 2016: (2.5%)
Sources: Capital IQ. 4
Portfolio Overview – 2016/2017 Fiscal Year (Consolidated)
The QUIC Fund currently has consolidated total assets of $1,156,898 (CAD) implying a total return for
the fiscal year of 19.7%

January 9, 2017
CIO UpdatePerformance Report – Canadian Fund

Portfolio Management Statistics
As at January 6, 2017
Asset Value: February 26, 2016 $659,044 Fund Cost of Capital (to date) 4% annually 3.44%
Additional Contributions $500 Portfolio Yield 1.91%
Less: Cost of Capital ($26,302)
Proceeds from:
Dividends (1) $16,395 Portfolio Beta (3) 0.91
Interest (1) $0 Sharpe Ratio (4)(5) 3.35
Capital Gains
Realized $35,132 Market Return (6) 24.29%
Unrealized $110,462 Fund Outperformance (7) 0.14%
Less: Brokerage Fees ($4,361) Portfolio Alpha (4)(8) 2.22%
Less: Operating Expenses $0 Information Ratio (9) 0.04
Current Asset Value (2) $790,870 Portfolio Return 24.44%
(1) Dividends and interest are recognized on a cash basis (3) Covariance of daily returns with the TSX divided by the TSX daily variance
(2) Does not reflect the accrual of the fund's cost of capital to date (4) Uses 1-year Canadian Treasury rate (rf) of 0.50%
(5) Our returns above rf divided by the standard deviation of returns
(6) TSX Total Return Index
(7) Our returns less the market returns
(8) Our excess returns (above rf) less our beta times the market's excess return
(9) Annualized outperformance divided by the fund's tracking error relative to the TSX
Sources: Capital IQ. 6
Portfolio Overview – 2016/2017 Fiscal Year
The QUIC Fund currently has total assets of $790,870 implying a total return for the fiscal year of 24.4%,
with a portfolio alpha of 2.2%

24.3%
0.0%
5.0%
10.0%
15.0%
20.0%
25.0%
30.0%
29-Feb-16 30-Mar-16 29-Apr-16 29-May-16 28-Jun-16 28-Jul-16 27-Aug-16 26-Sep-16 26-Oct-16 25-Nov-16 25-Dec-16
QUIC Fund TSX Benchmark QUIC Fund TSX Benchmark
24.4%
Sources: Capital IQ. 7
Portfolio Overview – 2016/2017 Fiscal Year
The QUIC Fund currently has total assets of $790,870 implying a total return for the fiscal year of 24.4%,
with a portfolio alpha of 2.2%

Portfolio Management Statistics
As at January 6, 2017
Asset Value: September 17, 2010 $500,000 Fund Cost of Capital (to date) 4.00%
Additional Contributions $135,494 Portfolio Yield 1.91%
Less: Cost of Capital ($144,736)
Proceeds from:
Dividends (1) $112,766 Portfolio Beta (3) 0.81
Interest (1) $3,542 Sharpe Ratio (4)(5) 4.03
Capital Gains
Realized $118,662 Market Return (6) 53.22%
Unrealized $98,034 Fund Outperformance (7) 8.22%
Less: Brokerage Fees ($27,993) Portfolio Alpha (4)(8) 18.02%
Less: Operating Expenses ($4,898) Information Ratio (9) 0.19
Current Asset Value (2) $790,870 Portfolio Return 61.44%
(1) Dividends and interest are recognized on a cash basis
(3) Covariance of daily returns with the TSX divided by the TSX daily
variance
(2) Does not reflect the accrual of the fund's cost of capital to date (4) Uses 1-year Canadian Treasury rate (rf) of 0.50%
(5) Our returns above rf divided by the standard deviation of returns
(6) TSX Total Return Index
(7) Our returns less the market returns
(8) Our excess returns (above rf) less our beta times the market's excess return
(9) Annualized outperformance divided by the fund's tracking error relative to the TSX
Sources: Capital IQ. 8
Portfolio Overview – Since Inception
The QUIC Fund currently has total assets of $790,870 implying a total return since inception of 61.4%,
with a portfolio alpha of 18.0%

Sources: Capital IQ. 9
Portfolio Overview – Since Inception
The QUIC Fund currently has total assets of $790,870 implying a total return since inception of 61.4%,
with a portfolio alpha of 18.0%
61.4%
53.2%
(20.0%)
0.0%
20.0%
40.0%
60.0%
80.0%
17-Sep-10 17-Feb-12 17-Jul-13 17-Dec-14 17-May-16
QUIC Return TSX Return

Company Name Symbol Share Average Market Percent Stop-Loss Target Market Portfolio TSX Active
Units Cost Price Return Hard Soft Price Value Weighting Weighting Weighting
Royal Bank of Canada RY 800 $60.75 $92.72 52.6% $60.00 $65.00 $83.00 $74,176 9.4% 5.9% 3.5%
The Toronto-Dominion Bank TD 1,030 44.45 67.35 51.5% 40.00 42.00 59.00 69,371 8.8% 5.3% 3.4%
Canadian Natural Resources Limited CNQ 1,502 37.50 43.14 15.0% 30.00 32.00 47.00 64,796 8.2% 2.0% 6.2%
Manulife Financial MFC 1,900 19.84 24.34 22.7% 18.00 19.00 24.00 46,246 5.8% 2.0% 3.8%
Seven Generations Energy VII 1,328 28.75 29.76 3.5% 23.30 24.75 34.89 39,521 5.0% 0.4% 4.6%
ONEX Corporation ONEX 400 86.18 88.80 3.0% 40.00 42.50 64.00 35,520 4.5% 0.4% 4.1%
Canadian Energy Services CEU 4,233 4.86 7.79 60.4% 3.00 3.50 7.00 32,975 4.2% 0.1% 4.1%
Loblaw Companies L 459 57.77 70.51 22.1% 45.00 50.00 63.00 32,364 4.1% 1.2% 2.9%
The Bank Of Nova Scotia BNS 421 57.17 76.59 34.0% 53.00 55.00 74.00 32,244 4.1% 3.9% 0.1%
Tourmaline Oil TOU 891 39.94 33.85 (15.2%) 40.00 48.00 67.00 30,160 3.8% 0.4% 3.4%
Canadian National Railway CNR 272 86.44 91.45 5.8% 69.70 73.80 90.50 24,874 3.1% 3.0% 0.2%
Enercare ECI 1,265 15.59 17.90 14.8% 13.10 13.80 19.00 22,644 2.9% 0.1% 2.8%
Franco Nevada Corporation FNV 257 55.17 81.08 47.0% 48.00 50.00 110.00 20,838 2.6% 0.6% 2.0%
TELUS Corporation T 452 33.68 44.08 30.9% 34.00 35.00 42.00 19,924 2.5% 1.1% 1.4%
Metro MRU 453 40.54 39.63 (2.2%) 32.00 34.00 47.00 17,952 2.3% 0.4% 1.9%
ProMetic Life Sciences PLI 7,905 2.29 2.15 (6.0%) 1.50 2.00 3.00 16,996 2.1% 0.1% 2.1%
Bell Canada Enterprises BCE 259 52.87 58.56 10.8% 39.50 42.00 60.00 15,167 1.9% 2.2% (0.3%)
K-Bro Linen KBL 350 37.60 42.37 12.7% 32.00 34.00 47.00 14,830 1.9% ‐ 1.9%
Teck Resources Limited TECK.B 521 31.13 27.84 (10.6%) 20.00 23.00 32.20 14,505 1.8% 0.7% 1.1%
BlackBerry Limited BB 1,195 9.52 9.47 (0.5%) 8.08 7.61 10.70 11,317 1.4% 0.2% 1.2%
CCL Industries CCL.B 40 216.01 256.94 19.0% 140.00 150.00 250.00 10,278 1.3% 0.4% 0.9%
Silver Wheaton Corp. SLW 374 26.08 26.85 3.0% 19.00 22.00 30.70 10,042 1.3% 0.5% 0.8%
Tahoe Resources THO 653 16.40 12.73 (22.4%) 8.00 9.50 24.00 8,313 1.1% 0.2% 0.9%
Lundin Mining LUN 979 5.21 7.08 35.9% 3.50 4.00 7.00 6,931 0.9% 0.2% 0.7%
Goldcorp Inc. G 311 24.64 19.33 (21.6%) 17.00 19.00 38.50 6,012 0.8% 0.7% 0.1%
Riocan REIT REI.UN 186 24.86 27.08 8.9% 19.00 22.00 28.50 5,037 0.6% 0.4% 0.3%
Killam Properties REIT KMP.UN 417 11.97 12.03 0.5% 10.18 10.78 15.00 5,017 0.6% ‐ 0.6%
DH Corporation DH 214 35.68 22.44 (37.1%) 27.50 29.50 36.00 4,802 0.6% 0.1% 0.5%
Allied Properties REIT AP.UN 113 33.66 35.64 5.9% 25.00 28.00 37.00 4,027 0.5% 0.1% 0.4%
Pure Industrial REIT AAR.UN 642 5.09 5.60 10.1% 8.08 7.61 10.70 3,595 0.5% 0.1% 0.4%
Canadian REIT REF.UN 66 41.86 47.29 13.0% 34.00 36.00 49.50 3,121 0.4% 0.1% 0.2%
Total $703,594 89.0%
Sources: Capital IQ. As at January 6, 2017. 10
Current Positions

11
Recent Trades
Trades executed since last update:
Energy & Utilities
Dividend: CNQ
Financials
None
TMT
Dividend: DH, T
Cash Yield
None
Metals & Mining
Dividend: TECK.B
Industrials
Dividend: CNR
Consumers & Healthcare
Dividend: L, ECI

January 9, 2017
CIO UpdatePerformance Report – U.S. Fund

Portfolio Management Statistics
As at January 6, 2017
Asset Value: February 26, 2016 $148,746 Fund Cost of Capital (to date) 0.00%
Additional Contributions - Current FY $95,512 Portfolio Yield 0.60%
Proceeds from:
Dividends (1) $3,027 Portfolio Beta (3) 0.94
Interest (1) $0 Sharpe Ratio (4)(5) 4.16
Capital Gains
Realized ($2,644) Market Return (6) 17.91%
Unrealized $33,673 Fund Outperformance (7) (2.37%)
Less: Brokerage Fees ($1,268) Portfolio Alpha (4)(8) (1.40%)
Less: Operating Expenses $0 Information Ratio (9) (1.32)
Current Asset Value (2) $277,046 Portfolio Return 15.54%
(1) Dividends and interest are recognized on a cash basis (3) Covariance of daily returns with the S&P 100 divided by the S&P 100 daily variance
(2) Does not reflect the accrual of the fund's cost of capital to date (4) Uses risk-free rate (rf) of 1-year US T-bill yield: 0.62%
(5) Our returns above rf divided by the standard deviation of returns
(6) S&P 100 Total Return Index
(7) Our returns less the market returns
(8) Our excess returns (above rf) less our beta times the market's excess return
(9) Annualized outperformance divided by the fund's tracking error relative to the S&P100
Sources: Capital IQ. All figures are in USD. 13
Portfolio Overview – 2016/2017 Fiscal Year
The QUIC U.S. Fund currently has total assets of $277,046 implying a total return for the fiscal year of
15.5%, with a portfolio alpha of (1.4%)

15.5%
17.9%
(5.0%)
0.0%
5.0%
10.0%
15.0%
20.0%
29-Feb-16 30-Mar-16 29-Apr-16 29-May-16 28-Jun-16 28-Jul-16 27-Aug-16 26-Sep-16 26-Oct-16 25-Nov-16 25-Dec-16
QUIC Return S&P 100 Return
Sources: Capital IQ. All figures are in USD. 14
Portfolio Overview – 2016/2017 Fiscal Year
The QUIC U.S. Fund currently has total assets of $277,046 implying a total return for the fiscal year of
15.5%, with a portfolio alpha of (1.4%)
Portfolio Management Statistics
As at January 6, 2017
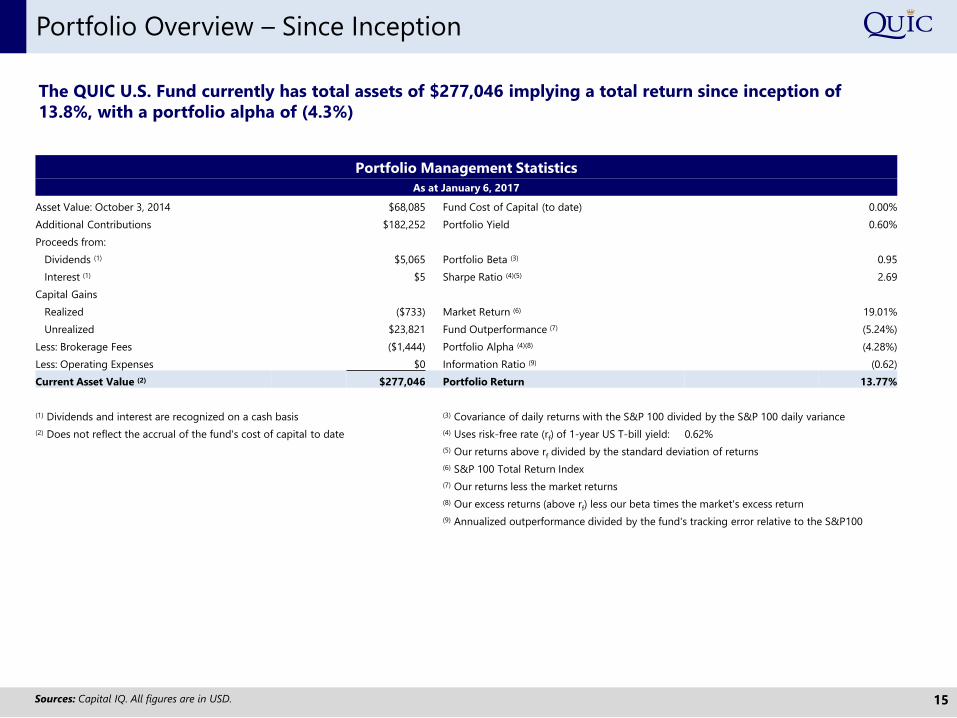
Asset Value: October 3, 2014 $68,085 Fund Cost of Capital (to date) 0.00%
Additional Contributions $182,252 Portfolio Yield 0.60%
Proceeds from:
Dividends (1) $5,065 Portfolio Beta (3) 0.95
Interest (1) $5 Sharpe Ratio (4)(5) 2.69
Capital Gains
Realized ($733) Market Return (6) 19.01%
Unrealized $23,821 Fund Outperformance (7) (5.24%)
Less: Brokerage Fees ($1,444) Portfolio Alpha (4)(8) (4.28%)
Less: Operating Expenses $0 Information Ratio (9) (0.62)
Current Asset Value (2) $277,046 Portfolio Return 13.77%
(1) Dividends and interest are recognized on a cash basis (3) Covariance of daily returns with the S&P 100 divided by the S&P 100 daily variance
(2) Does not reflect the accrual of the fund's cost of capital to date (4) Uses risk-free rate (rf) of 1-year US T-bill yield: 0.62%
(5) Our returns above rf divided by the standard deviation of returns
(6) S&P 100 Total Return Index
(7) Our returns less the market returns
(8) Our excess returns (above rf) less our beta times the market's excess return
(9) Annualized outperformance divided by the fund's tracking error relative to the S&P100
Sources: Capital IQ. All figures are in USD. 15
Portfolio Overview – Since Inception
The QUIC U.S. Fund currently has total assets of $277,046 implying a total return since inception of
13.8%, with a portfolio alpha of (4.3%)

13.8%
19.0%
(8.0%)
0.0%
8.0%
16.0%
24.0%
3-Oct-14 3-Mar-15 3-Aug-15 3-Jan-16 3-Jun-16 3-Nov-16
QUIC Return S&P 100 Return
Sources: Capital IQ. All figures are in USD. 16
Portfolio Overview – Since Inception
The QUIC U.S. Fund currently has total assets of $277,046 implying a total return since inception of
13.8%, with a portfolio alpha of (4.3%)

Company Name Symbol Share Average Market Percent Dividend Stop-Loss Target Market Portfolio
Units Cost Price Return Yield Hard Soft Price Value Weight
Schlumberger Limited SLB 232 $79.09 $86.48 9.3% 2.3% $62.00 $66.00 $96.00 $20,063 7.2%
The Home Depot, Inc. HD 133 $132.43 $133.53 0.8% 2.1% $114.00 $120.00 $145.00 $17,759 6.4%
Merck & Co., Inc. MRK 285 $55.21 $60.27 9.2% 3.1% $43.50 $45.00 $62.00 $17,177 6.2%
Mondelez International, Inc. MDLZ 380 $42.72 $45.06 5.5% 1.7% $35.00 $37.00 $53.00 $17,123 6.2%
The Walt Disney Company DIS 156 $100.51 $108.98 8.4% 2.9% $77.00 $82.00 $99.00 $17,001 6.1%
Union Pacific Corporation UNP 151 $98.35 $103.19 4.9% 2.1% $90.00 $100.00 $145.00 $15,582 5.6%
JPMorgan Chase & Co. JPM 173 $64.13 $86.12 34.3% 2.2% $50.00 $55.00 $71.50 $14,899 5.4%
Google Inc. GOOGL 18 $724.82 $825.21 13.9% 0.0% $640.00 $675.00 $811.00 $14,854 5.4%
Facebook, Inc. FB 115 $90.01 $123.41 37.1% 0.0% $75.00 $80.00 $99.00 $14,192 5.1%
Microsoft Corporation MSFT 210 $47.31 $62.84 32.8% 2.5% $39.00 $42.00 $52.00 $13,196 4.8%
McDonald's Corporation MCD 108 $125.83 $120.76 (4.0%) 2.9% $107.00 $113.00 $139.00 $13,042 4.7%
Starbucks Corporation SBUX 224 $55.49 $57.13 3.0% 1.8% $45.00 $50.00 $62.00 $12,797 4.6%
Amazon.com, Inc. AMZN 16 $767.31 $795.99 3.7% 0.0% $614.00 $652.00 $883.00 $12,736 4.6%
Visa Inc. V 141 $79.54 $82.21 3.4% 0.8% $67.50 $70.00 $90.00 $11,592 4.2%
Celgene Corporation CELG 91 $113.13 $119.64 5.8% 0.0% $125.00 $130.00 $174.00 $10,887 3.9%
Citigroup Inc. C 176 $53.57 $60.55 13.0% 1.1% $45.00 $50.00 $62.50 $10,657 3.8%
MetLife, Inc. MET 127 $48.37 $54.18 12.0% 3.0% $42.50 $45.00 $60.00 $6,881 2.5%
3M Company MMM 37 $151.81 $178.23 17.4% 2.5% $125.00 $130.00 $174.33 $6,595 2.4%
Morgan Stanley MS 128 $32.34 $43.85 35.6% 1.8% $30.00 $33.00 $41.00 $5,613 2.0%
Monsanto Company MON 26 $111.91 $108.13 (3.4%) 2.0% $95.00 $100.00 $126.50 $2,811 1.0%
Total $255,457 92.2%
Sources: Capital IQ. As at January 6, 2017. 17
Current Positions
18
Recent Trades
Trades executed since last update:
Energy & Utilities
None
Financials
None
TMT
None
Cash Yield
None
Metals & Mining
None
Industrials
None
Consumers & Healthcare
None


![THE LEGAL SERVICES AUTHORITIES ACT, 1987 · PDF fileTHE LEGAL SERVICES AUTHORITIES ACT, 1987 (Act No. 39 OF 1987) [11th October 1987] An Act to constitute legal services authorities](https://img.pdfslide.net/doc/110x75/5aa7d2fd7f8b9a50528cde18/the-legal-services-authorities-act-1987-legal-services-authorities-act-1987-act.jpg)