Embed Size (px)
Citation preview
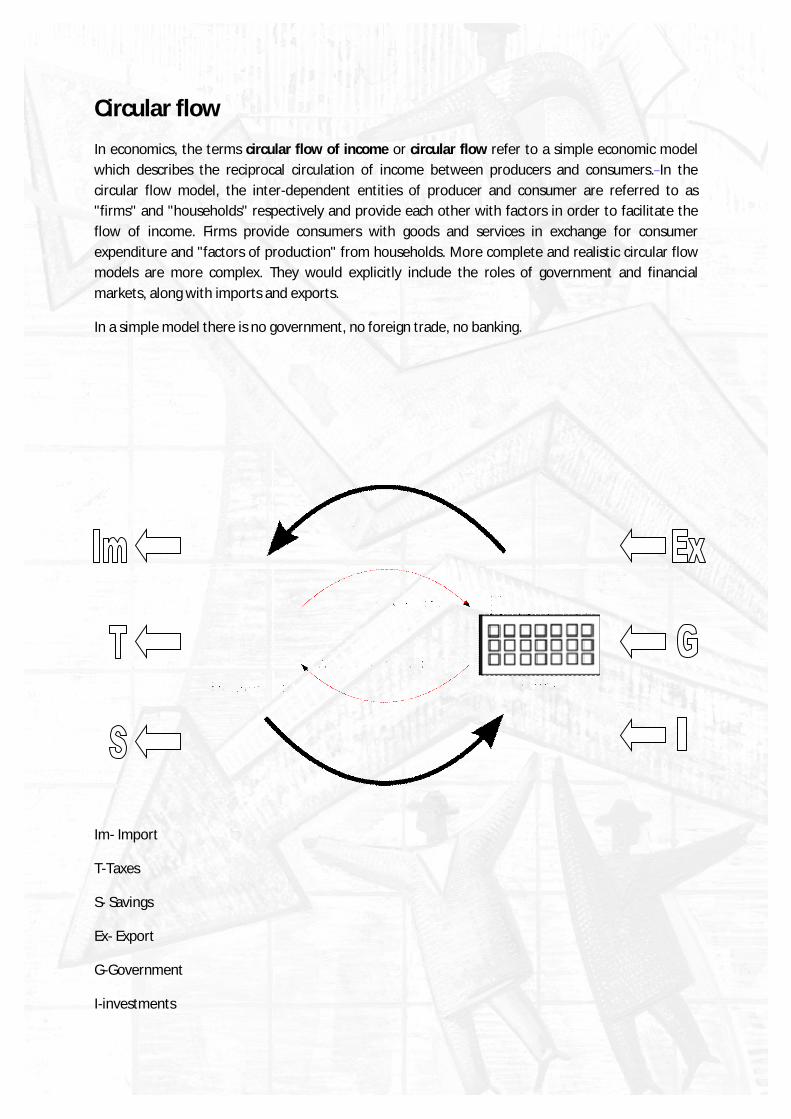
Circular flow In economics, the terms circular flow of income or circular flow refer to a simple economic model which describes the reciprocal circulation of income between producers and consumers. In the circular flow model, the inter-dependent entities of producer and consumer are referred to as "firms" and "households" respectively and provide each other with factors in order to facilitate the flow of income. Firms provide consumers with goods and services in exchange for consumer expenditure and "factors of production" from households. More complete and realistic circular flow models are more complex. They would explicitly include the roles of government and financial markets, along with imports and exports.
In a simple model there is no government, no foreign trade, no banking.
Im- Import
T-Taxes
S- Savings
Ex- Export
G-Government
I-investments
National Income -is a general term we use to describe the total wealth produced, distributed and consumed in an economy over a period of time
GDP
The monetary value of all the finished goods and services produced within a country's borders in a specific time period, though GDP is usually calculated on an annual basis. It includes all of private and public consumption, government outlays, investments and exports less imports that occur within a defined territory.
Nominal GDP indicates the present-time prices of the types of services available, and the goods produced, whereas, Real GDP indicates costs according to various base years. Growth Domestic Product is the rate of services and final goods, therefore, if there is a growth in the GDP, it does not necessarily mean that there is also a growth in the services and goods provided. The GDP fails to measure or express changes in a nation's:
• Quality of life • Unpaid labour • Intangible valuables (e.g. feeling secure) • Real Savings • Standard of Living • Uneven inflationary price changes (e.g. a housing bubble) • Grey&black economy • Transfer payments • Selling 2nd hand product • Stocks
Methods of measuring GDP
Income method
GDP=Rent+Wages+Interest+profit+indirect taxes
Expenditure method
GDP=Consumption+Investments+Government expenditures+Net Export(EX-IM)
Output method
GDP= Σ .P.Q(price x quantity of all G&S produced)

GNP
An economic statistic that includes GDP, plus any income earned by residents from overseas investments, minus income earned within the domestic economy by overseas residents.
GNP=GDP+net property income from abroad
NDP
An annual measure of the economic output of a nation that is adjusted to account for depreciation, calculated by subtracting depreciation from the gross domestic product (GDP).
NDP = GDP – depreciation
NNP
The monetary value of finished goods and services produced by a country's citizens, whether overseas or resident, in the time period being measured (i.e., the gross national product, or GNP) minus the amount of GNP required to purchase new goods to maintain existing stock (i.e., depreciation)
NNP =GNP – depreciation
Depreciation – represents the lost value of worn out capital
HDI The Human Development Index (HDI) is a composite statistic used to rank countries by level of "human development" and separate "very high human development", "high human development", "medium human development", and "low human development" countries. The statistic is composed from data on life expectancy, education and per-capita, standard of living... There are also HDI for states, cities, villages, etc. by local organizations or companies.

Net Economic Welfare Gross national product adjusted by subtracting the cost of problems such as pollution and adding the value of beneficial, non‐market activities such as leisure and recreation.
Net economic welfare=GDP+black&grey ec. + non-market domestic prod. + value of leisure time – costs on enviromental production – costs on healthcare
All plus&minus items are only estimated
Difference between GDP at market price and GDP at factor cost There is one important difference that arises when calculating the level of GDP from the spending side of the economy rather than summing the values added in production. This difference arises because the price paid by consumers for many goods and services is not the same as the sales revenue received by the producer. There are taxes that have to be paid, which place a wedge between what consumers pay and producers receive. Taxes attached to the transactions are known as indirect taxes. Thus, if a consumer pays $100 for a meal in a restaurant the owner may receive only $85.10, the remaining $14.90 will go to the government in the form of VAT. The term factor cost or basic price is used in the national accounts to refer to the prices of products as received by producers . Market prices are the prices as paid by consumers. Thus, factor cost or basic prices are equal to market prices minus taxes on products plus subsidies on products. GDP at market price =GDP at factor cost – Subsidies + Indirect Taxes
GDP at factor cost =GDP at market price + Subsidies -Indirect Taxes
Tasks and questions

1. Draw a picture of circular flow and describe it.
2. What is GDP of Slovakia?
3. What is the basic diference between GDP&GNP?
4. For the economy is important to keep a) Export higher that import b) Import higher than export c) Do not trade
5. Which country has got higher net economic welfare Slovakia or Switzerland? 6. Which coutry has got the highest HDI index nowadays?
7. What is depreciation?
8. What is the role of government in the open economy according to the circular flow model?
Aggregate Supply
Is the total supply of all goods and services in the economy.
We distinguish the short run and long run aggregate supply:
Short run Aggregate Supply (SRAS)
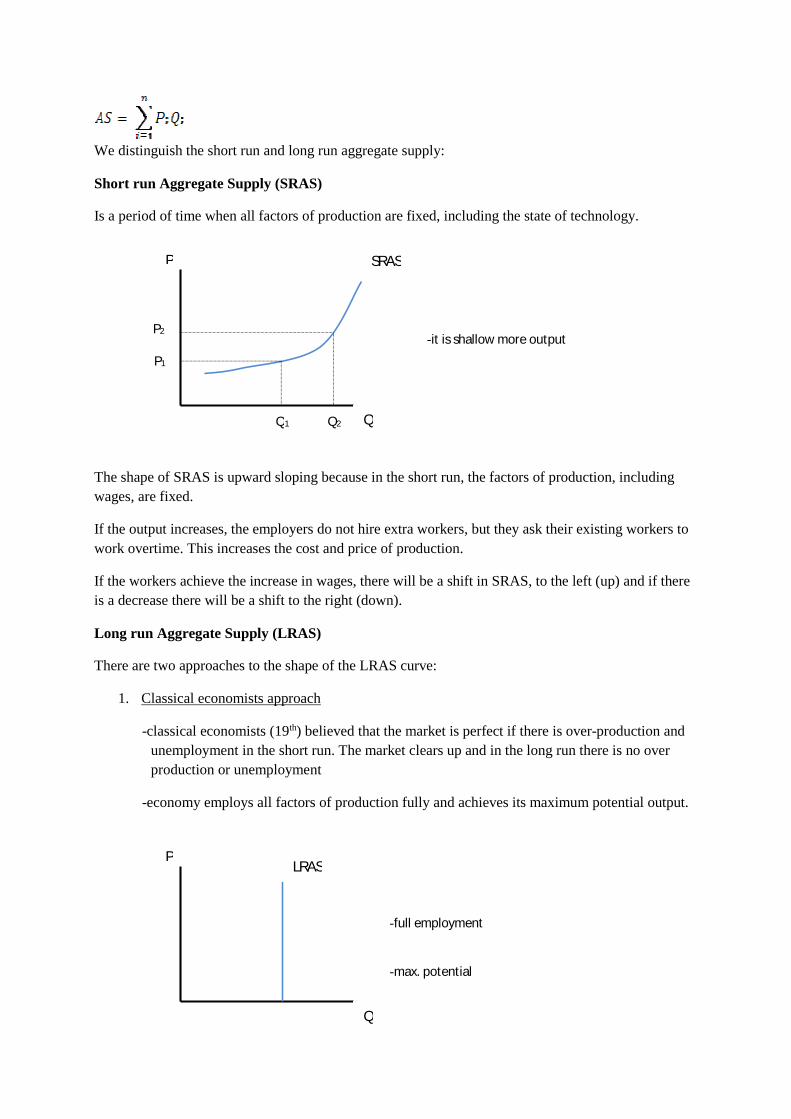
Is a period of time when all factors of production are fixed, including the state of technology.
The shape of SRAS is upward sloping because in the short run, the factors of production, including wages, are fixed.
If the output increases, the employers do not hire extra workers, but they ask their existing workers to work overtime. This increases the cost and price of production.
If the workers achieve the increase in wages, there will be a shift in SRAS, to the left (up) and if there is a decrease there will be a shift to the right (down).
Long run Aggregate Supply (LRAS)
There are two approaches to the shape of the LRAS curve:
1. Classical economists approach
-classical economists (19th) believed that the market is perfect if there is over-production and unemployment in the short run. The market clears up and in the long run there is no over production or unemployment
-economy employs all factors of production fully and achieves its maximum potential output.
-full employment
-max. potential
-it is shallow more output
SRAS P
Q
P1
Q1
P2
Q2
P
Q
LRAS
2. Keynesian approach
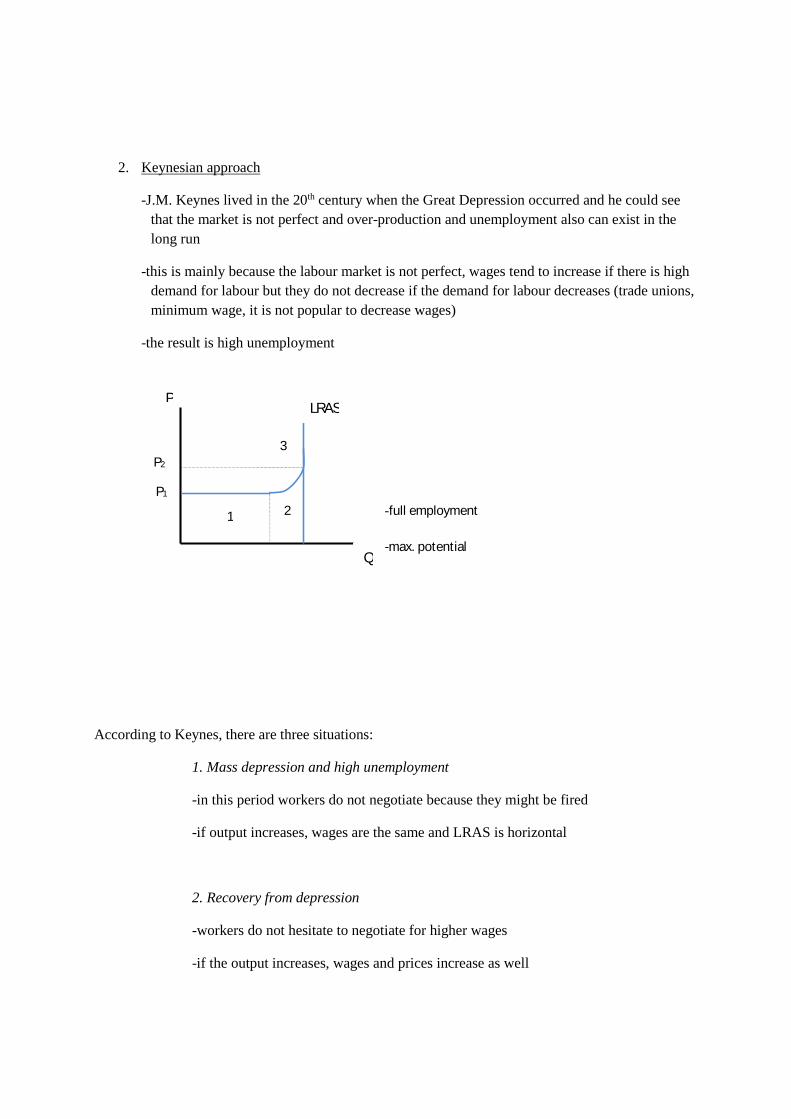
-J.M. Keynes lived in the 20th century when the Great Depression occurred and he could see that the market is not perfect and over-production and unemployment also can exist in the long run
-this is mainly because the labour market is not perfect, wages tend to increase if there is high demand for labour but they do not decrease if the demand for labour decreases (trade unions, minimum wage, it is not popular to decrease wages)
-the result is high unemployment
According to Keynes, there are three situations:
1. Mass depression and high unemployment
-in this period workers do not negotiate because they might be fired
-if output increases, wages are the same and LRAS is horizontal
2. Recovery from depression
-workers do not hesitate to negotiate for higher wages
-if the output increases, wages and prices increase as well
-full employment
-max. potential
P
Q
LRAS
P1
1 2
3 P2

3. Expansion
-the economy achieves maximum potential output and full employment
-the economy is not able to increase the output so the prices of the product increase
Aggregate Demand
It is a demand for all goods and services in the economy.
If the income increases, there will be a shift to the right, and if income decreases there will be a shift to the left. If taxes increase, there will be a shift in aggregate demand to the left and vice versa. And if investment increases, there will be a shift in aggregate demand to the left and vice versa.
Equilibrium between aggregate supply and aggregate demand
1. Short run equilibrium
2. Long run equilibrium
P
Q
SRAS AD
PE
QE
E
P
Q
AD
P1
Q1
P2
Q2
-max. potential output Deflationary gap
Inflationary gap
P SRAS LRAS
AD
E
P1
P
E1
E
-full employment

3. Keynesian approach
The main disagreement between classical and Keynesians approach is the position of the equilibrium output:
- According to the classical economists change in aggregate demand influences only price level, but the economy achieves maximal potential output all the time.
- According to the Keynesians change in the aggregate demand can influence both quantity of output at price level.
Questions
1. What is a shape of curve of SRAS?
2. When for example workers achieve the increase in wages, what happen with curve of SRAS?
3. What is the shape of LRAS according to the classical economists and why?
4. How many stages we can see in graph of LRAS according to the Keynesian approach?
5. List these stages and briefly describe them.
6. What is the shape of LRAS in the first stage according to the Keynesians and why?
7. What is the aggregate demand?
8. Draw and describe the graph of aggregate demand.
QE= Q max
AD2
AD1
AD LRAS P
Q
PE
P1
E2 QE
-max. potential output

9. Draw the graph of the Long run equilibrium and mark there deflationary and inflationary gap.
10. What is the main disagreement between Keynesians and classical economists about the equilibrium output?