Embed Size (px)
Citation preview
CIRPThe Freshman Survey
2010
First-time Full-time Freshmen who entered College in 2010First-time Full-time Freshmen who entered College in 2010
Houghton CollegeHoughton CollegeN=229N=229
andandOther Religious 4yr Colleges-high selectivityOther Religious 4yr Colleges-high selectivity
N=15,588N=15,588
Higher Education Research Institute, University of California at Los Angeles
The Freshman Survey
Higher Education Research Institute, University of California at Los Angeles
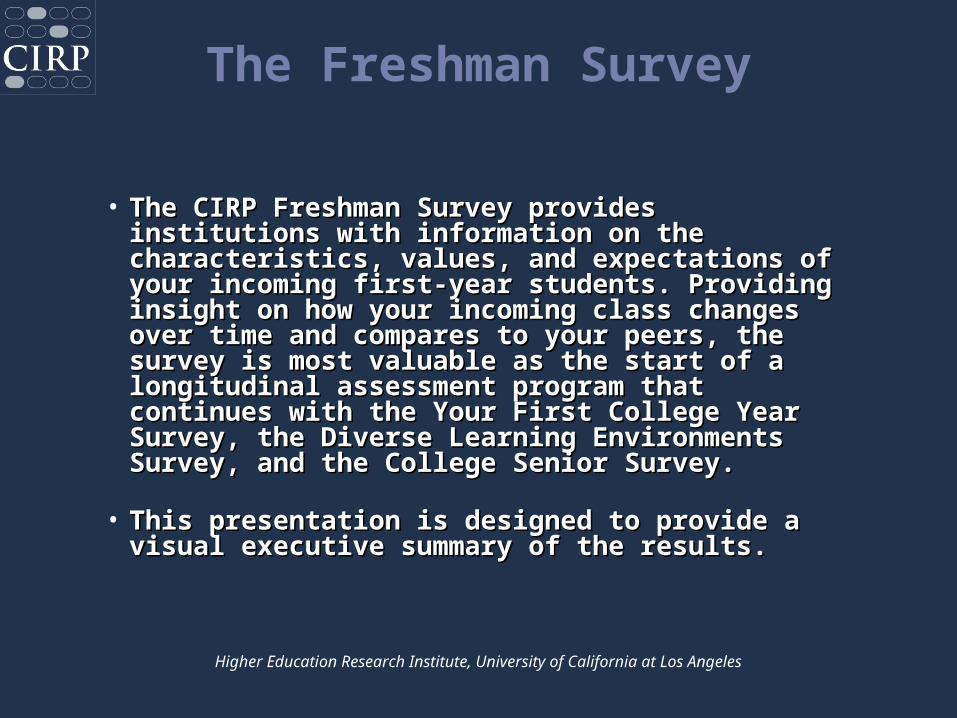
• The CIRP Freshman Survey provides The CIRP Freshman Survey provides institutions with information on the institutions with information on the characteristics, values, and expectations of your characteristics, values, and expectations of your incoming first-year students. Providing insight incoming first-year students. Providing insight on how your incoming class changes over time on how your incoming class changes over time and compares to your peers, the survey is most and compares to your peers, the survey is most valuable as the start of a longitudinal valuable as the start of a longitudinal assessment program that continues with the assessment program that continues with the Your First College Year Survey, the Diverse Your First College Year Survey, the Diverse Learning Environments Survey, and the College Learning Environments Survey, and the College Senior Survey.Senior Survey.
• This presentation is designed to provide a This presentation is designed to provide a visual executive summary of the results. visual executive summary of the results.
Return to contents 3
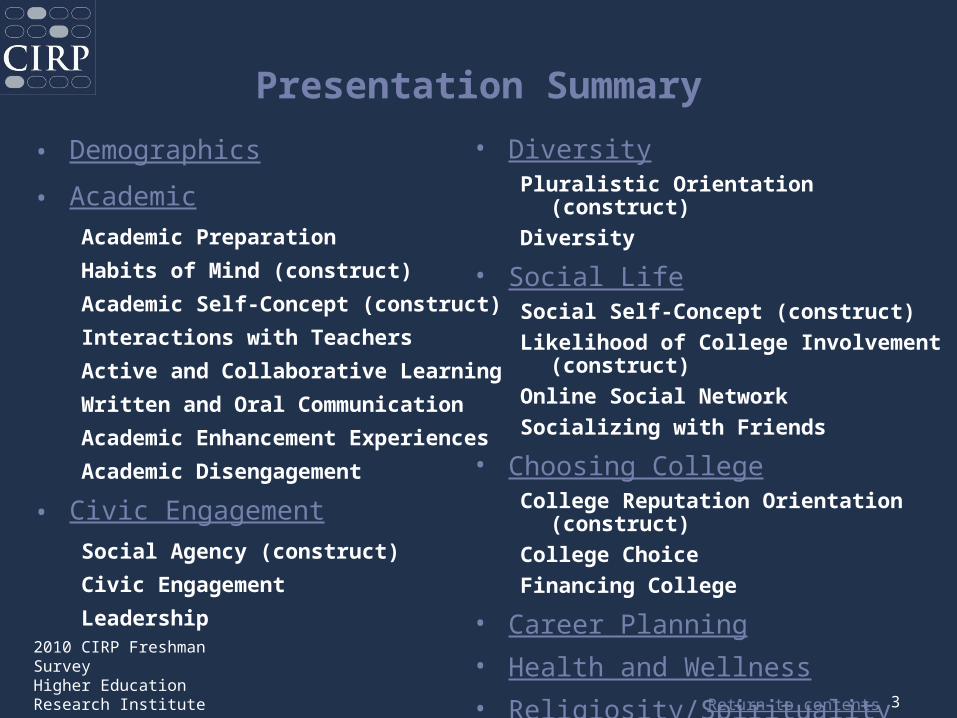
Presentation Summary
2010 CIRP Freshman SurveyHigher Education Research Institute
• Demographics
• AcademicAcademic Preparation
Habits of Mind (construct)
Academic Self-Concept (construct)
Interactions with Teachers
Active and Collaborative Learning
Written and Oral Communication
Academic Enhancement Experiences
Academic Disengagement
• Civic EngagementSocial Agency (construct)
Civic Engagement
Leadership
• DiversityPluralistic Orientation (construct)Diversity
• Social LifeSocial Self-Concept (construct)Likelihood of College Involvement
(construct)Online Social NetworkSocializing with Friends
• Choosing CollegeCollege Reputation Orientation
(construct)College ChoiceFinancing College
• Career Planning• Health and Wellness• Religiosity/Spirituality
Return to contents 4
Demographics
2010 CIRP Freshman SurveyHigher Education Research Institute
Return to contents
2010 CIRP Freshman SurveyHigher Education Research Institute 5
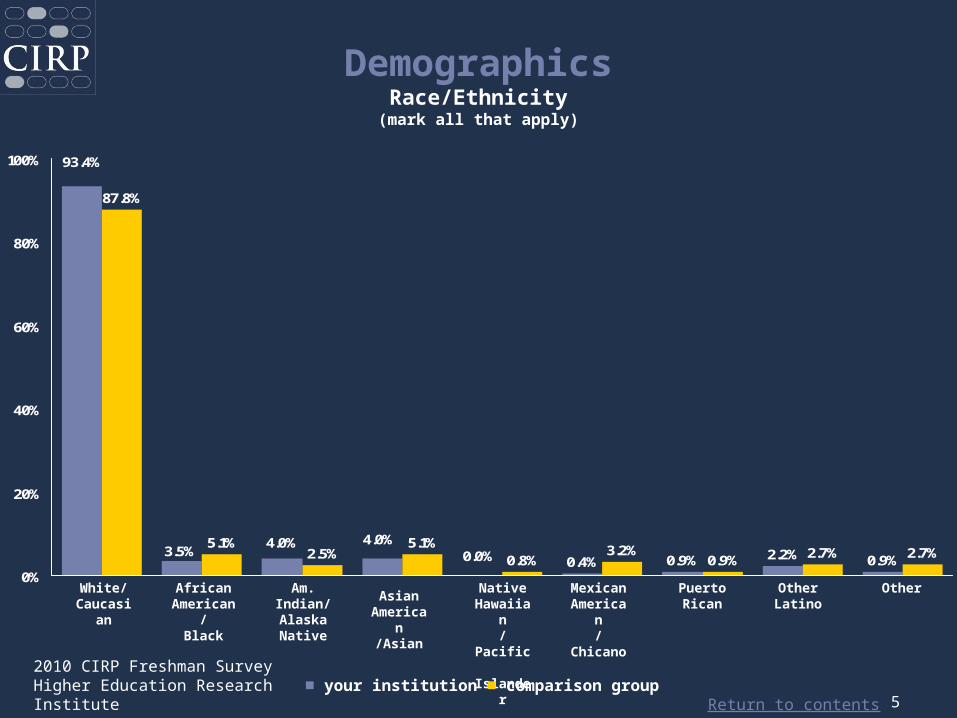
DemographicsRace/Ethnicity
(mark all that apply)
0.4% 0.9% 2.2% 0.9%
87.8%
5.1%2.5%
5.1%0.8%
3.2%0.9% 2.7% 2.7%3.5%
93.4%
4.0%0.0%
4.0%
0%
20%
40%
60%
80%
100%
AfricanAmerica
n/Black
Mexican
American/
Chicano
Am. Indian/AlaskaNative
NativeHawaiia
n/Pacific
Islande
r
AsianAmeric
an/Asian
PuertoRican
OtherOtherLatino
White/Caucasi
an
■ your institution ■ comparison group
Return to contents
2010 CIRP Freshman SurveyHigher Education Research Institute 6
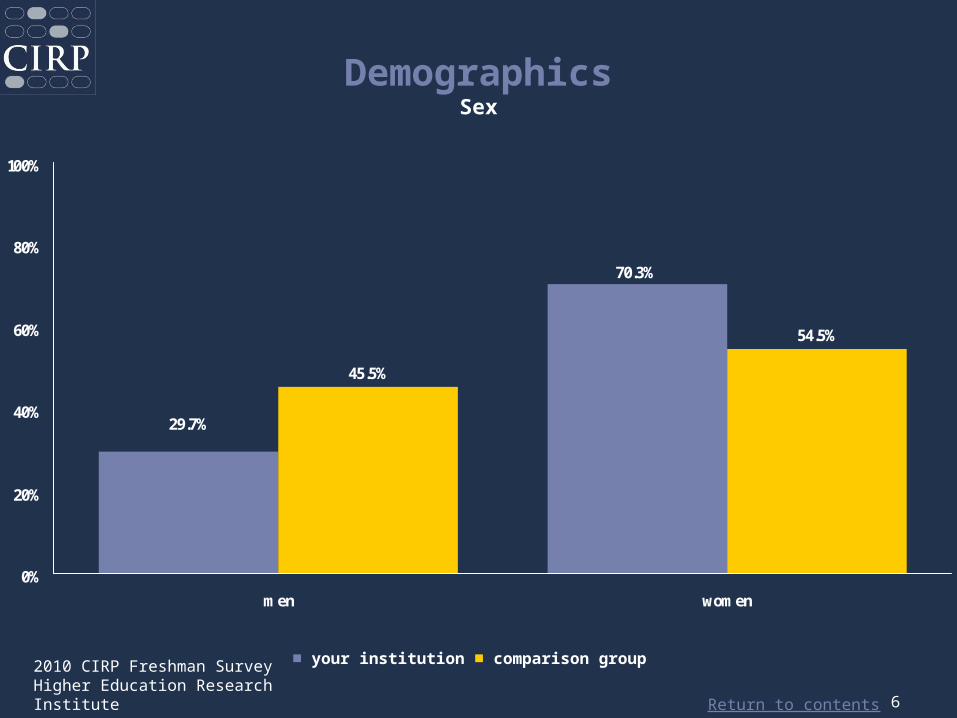
DemographicsSex
■ your institution ■ comparison group
45.5%
54.5%
29.7%
70.3%
0%
20%
40%
60%
80%
100%
men women
Return to contents
2010 CIRP Freshman SurveyHigher Education Research Institute 7
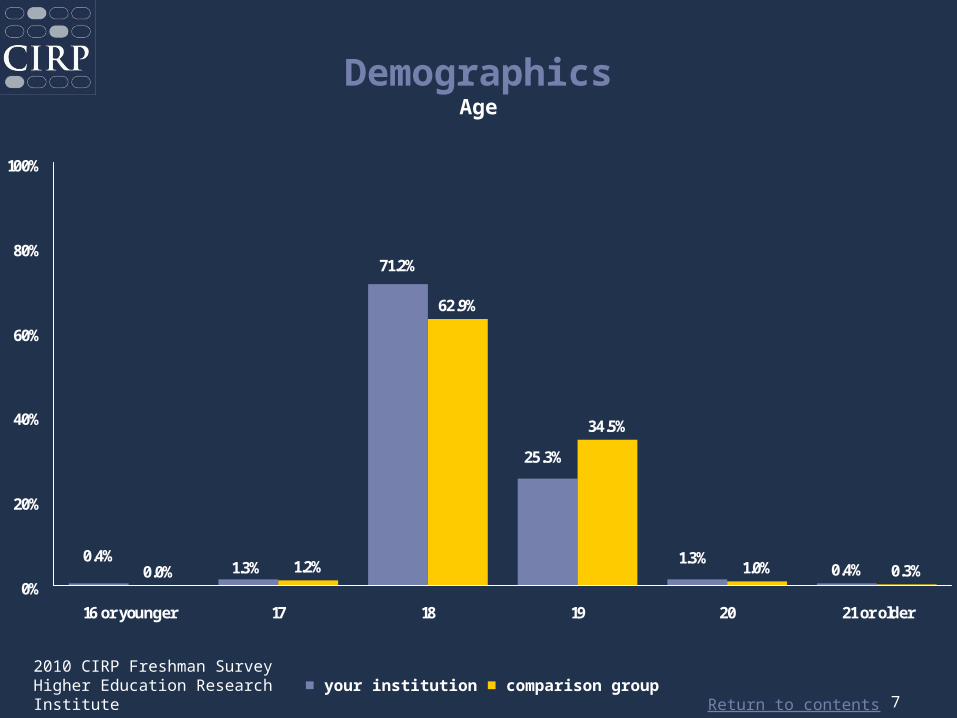
DemographicsAge
■ your institution ■ comparison group
0.4%0.0% 1.2%
62.9%
34.5%
1.0% 0.3%
25.3%
1.3%
71.2%
0.4%1.3%
0%
20%
40%
60%
80%
100%
16 or younger 17 18 19 20 21 or older
Return to contents
2010 CIRP Freshman SurveyHigher Education Research Institute 8
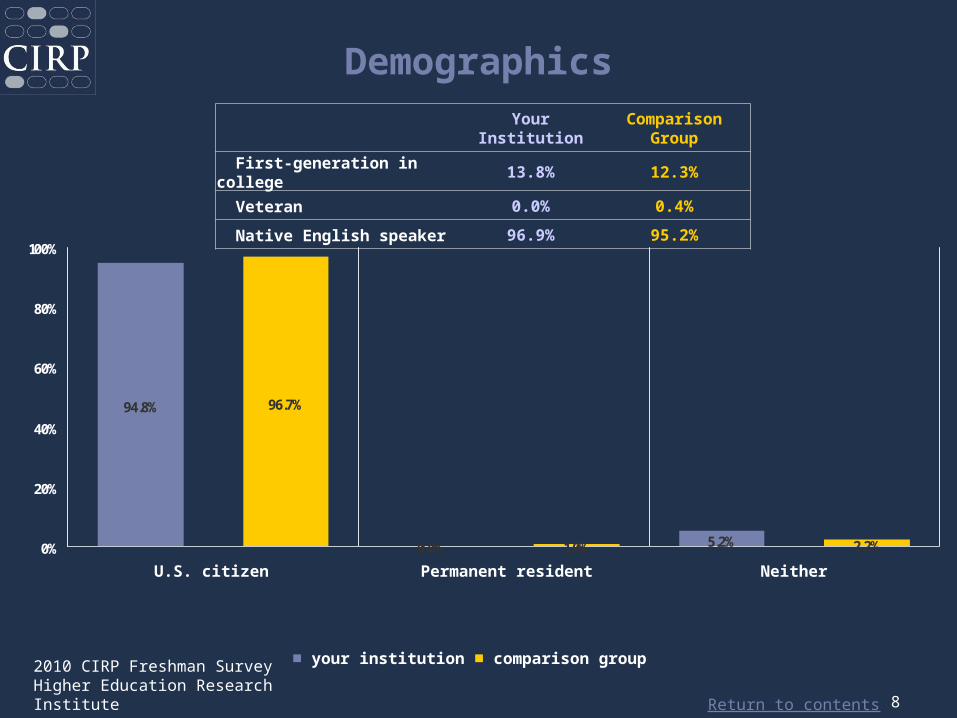
DemographicsYour
InstitutionComparison
Group
First-generation in college
13.8% 12.3%
Veteran 0.0% 0.4%
Native English speaker 96.9% 95.2%
94.8% 96.7%
1.0% 5.2% 2.2%0.0%0%
20%
40%
60%
80%
100%
U.S. citizen Permanent resident Neither
■ your institution ■ comparison group

Return to contents
2010 CIRP Freshman SurveyHigher Education Research Institute 9
DemographicsAverage Grade in High School
0.0%
0.0%
0.0%
2.2%
8.0%
10.3%
29.5%
50.0%
0.0%
0.4%
1.1%
3.7%
15.3%
20.2%
29.7%
29.4%
0% 20% 40% 60% 80% 100%
D
C
C+
B-
B
B+
A-
A or A+
■ your institution ■ comparison group
Return to contents
2010 CIRP Freshman SurveyHigher Education Research Institute 10
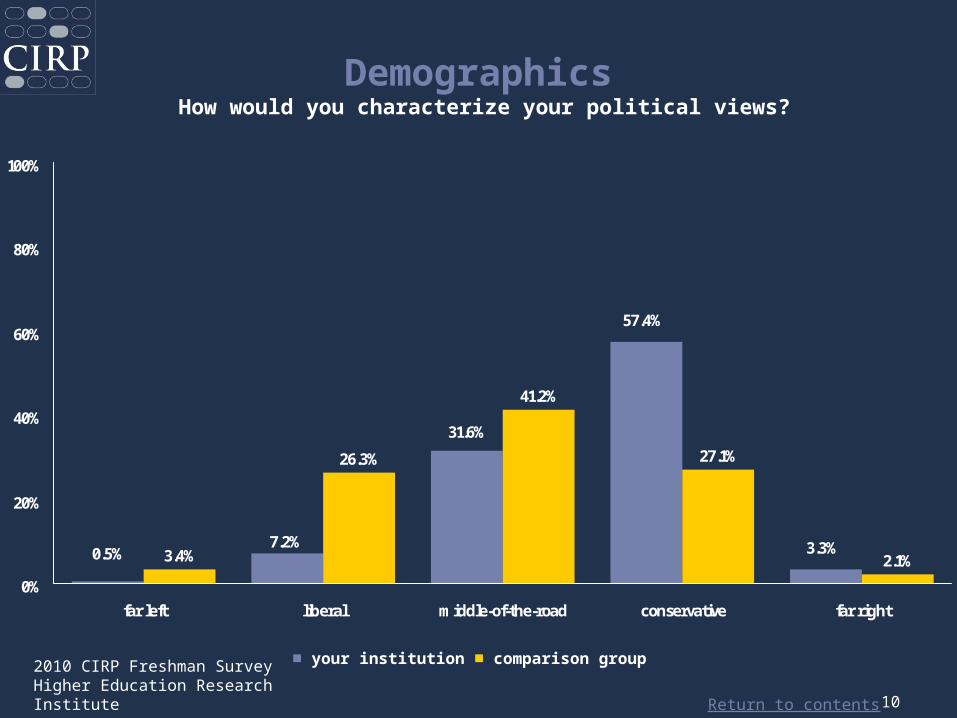
Demographics How would you characterize your political views?
3.4%
26.3%
41.2%
27.1%
2.1%7.2%
0.5%
31.6%
3.3%
57.4%
0%
20%
40%
60%
80%
100%
far left liberal middle-of-the-road conservative far right
■ your institution ■ comparison group
Return to contents
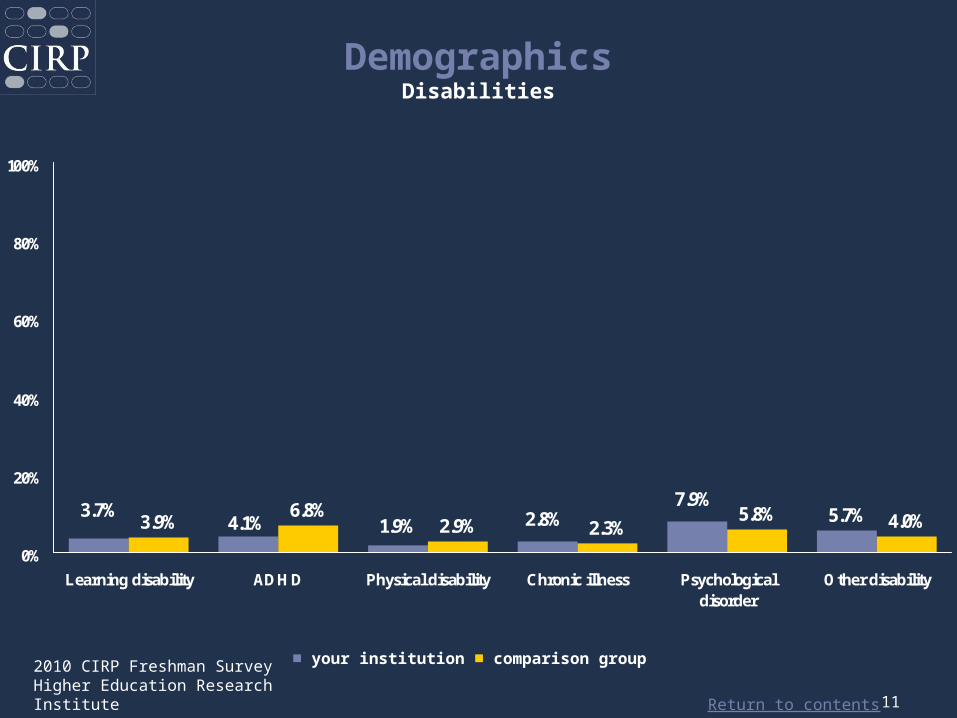
2010 CIRP Freshman SurveyHigher Education Research Institute 11
■ your institution ■ comparison group
5.7%3.9%6.8%
2.9% 2.3%5.8% 4.0%2.8%
7.9%1.9%
3.7%4.1%
0%
20%
40%
60%
80%
100%
Learning disability ADHD Physical disability Chronic illness Psychologicaldisorder
Other disability
DemographicsDisabilities
Return to contents
2010 CIRP Freshman SurveyHigher Education Research Institute 12
Academic

Return to contents
2010 CIRP Freshman SurveyHigher Education Research Institute 13
CIRP Theme
Academic PreparationYour Institution
Comparison Group
mean median mean median
SAT Verbal 633 630 615 610
SAT Math 615 610 616 620
SAT Writing 621 620 615 620
ACT Composite 28 28 26 26
4.8% 4.2%11.5%14.1%
0%
20%
40%
60%
80%
100%
Prior to this term, have taken coursesfor credit at this institution
Since leaving high school, have taken courses, whether for credit or not for credit, at any other
institution
■ your institution ■ comparison group
Return to contents
2010 CIRP Freshman SurveyHigher Education Research Institute 14
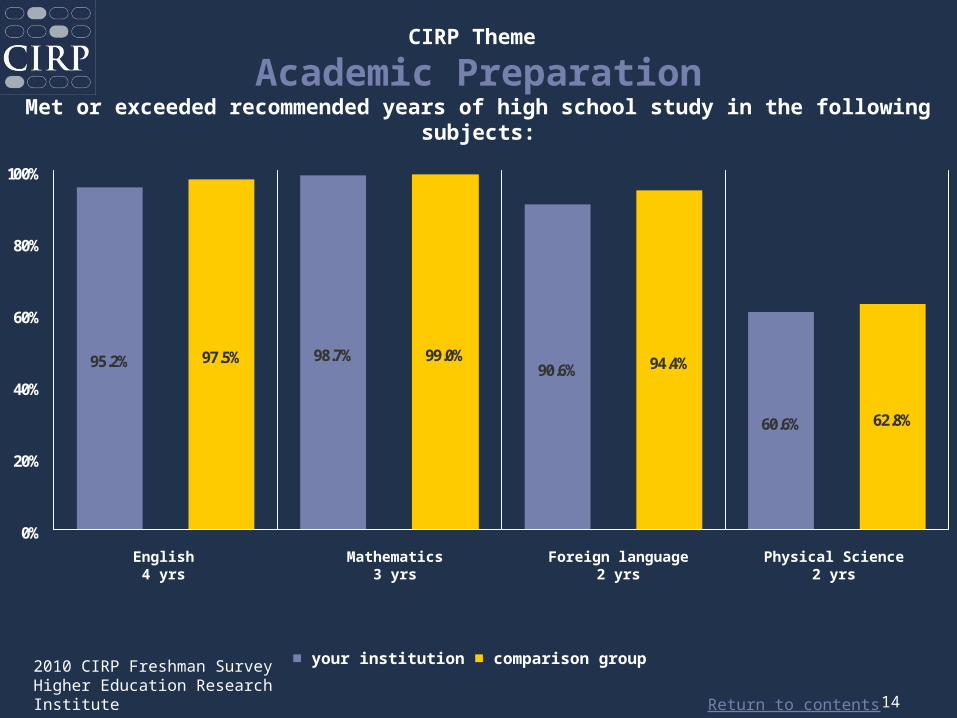
95.2% 97.5% 99.0%90.6% 94.4%
60.6% 62.8%
98.7%
0%
20%
40%
60%
80%
100%
CIRP Theme
Academic PreparationMet or exceeded recommended years of high school study in the following
subjects:
English4 yrs
Mathematics3 yrs
Foreign language2 yrs
Physical Science2 yrs
■ your institution ■ comparison group
Return to contents
2010 CIRP Freshman SurveyHigher Education Research Institute 15
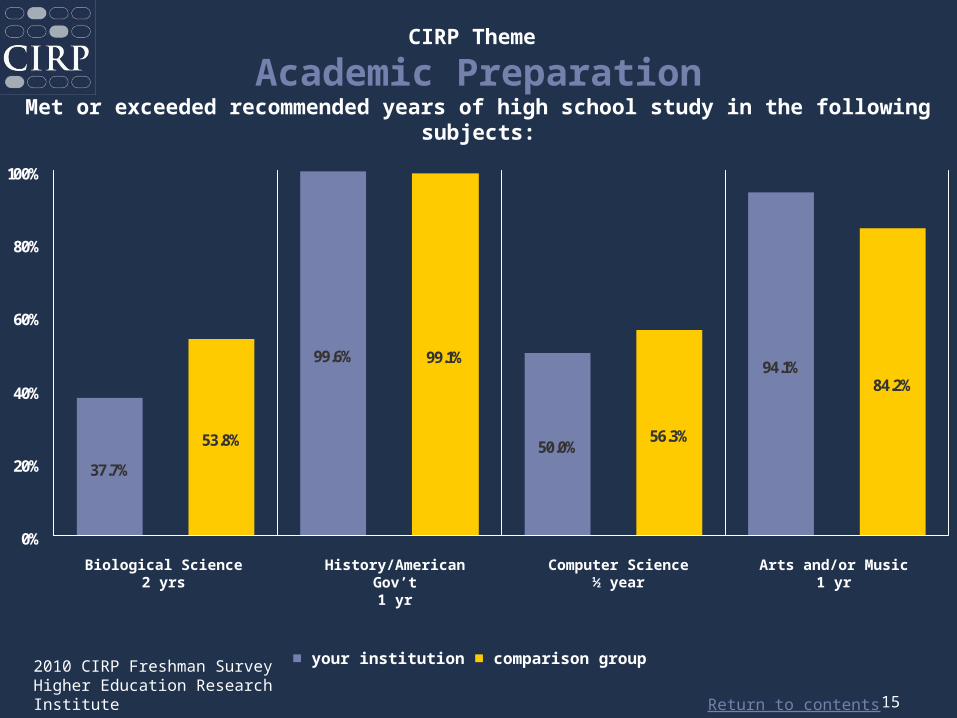
37.7%
53.8%
99.1%
50.0%56.3%
94.1%84.2%
99.6%
0%
20%
40%
60%
80%
100%
CIRP Theme
Academic PreparationMet or exceeded recommended years of high school study in the following
subjects:
■ your institution ■ comparison group
Biological Science2 yrs
History/American Gov’t1 yr
Computer Science½ year
Arts and/or Music1 yr
Return to contents
2010 CIRP Freshman SurveyHigher Education Research Institute 16
■ your institution ■ comparison group
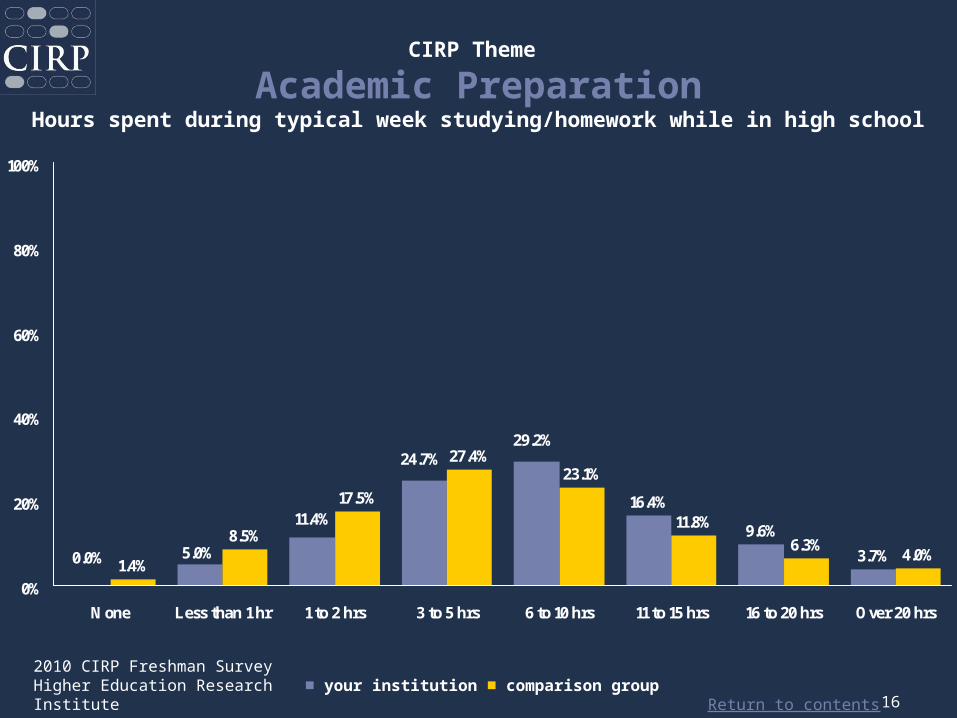
16.4%
9.6%
3.7%1.4%
8.5%
17.5%
27.4%23.1%
11.8%6.3%
4.0%
24.7%29.2%
11.4%
0.0% 5.0%
0%
20%
40%
60%
80%
100%
None Less than 1 hr 1 to 2 hrs 3 to 5 hrs 6 to 10 hrs 11 to 15 hrs 16 to 20 hrs Over 20 hrs
CIRP Theme
Academic PreparationHours spent during typical week studying/homework while in high school

Return to contents
2010 CIRP Freshman SurveyHigher Education Research Institute 17
CIRP Construct
Habits of MindHabits of Mind is a unified measure of the behaviors and traits associated
with academic success. These learning behaviors are seen as the foundation for lifelong learning
“High” represents students who scored one-half standard deviation or more above the mean (i.e., higher than 55).
■ your institution ■ comparison group
High Habits of Mind
18.0%
23.1%
19.5%
27.2%
27.2%
27.2%
0% 20% 40% 60% 80% 100%
Women
Men
All Students
Return to contents
2010 CIRP Freshman SurveyHigher Education Research Institute 18
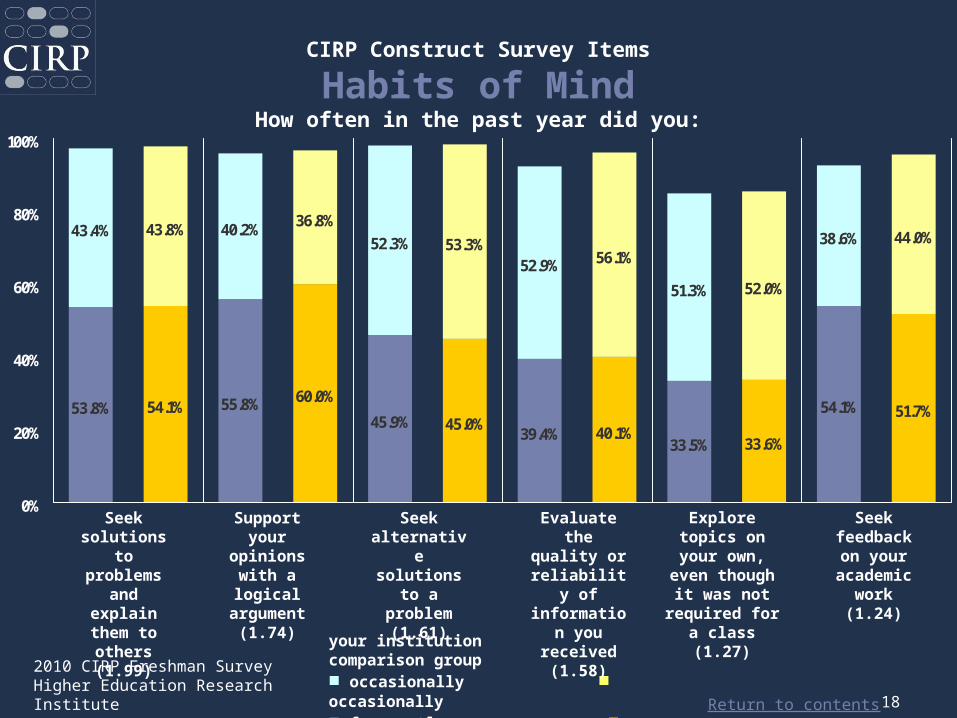
CIRP Construct Survey Items
Habits of MindHow often in the past year did you:
53.8% 54.1%60.0%
45.9% 45.0%39.4% 40.1%
33.5% 33.6%
54.1% 51.7%
43.8% 40.2% 36.8%52.3% 53.3%
52.9% 56.1%
51.3% 52.0%
38.6% 44.0%
55.8%
43.4%
0%
20%
40%
60%
80%
100%
your institution comparison group■ occasionally ■ occasionally■ frequently ■ frequently
Seek solutions
to problems
and explain them to others (1.99)
Seek alternative solutions
to a problem (1.61)
Support your
opinions with a logical
argument (1.74)
Evaluate the quality
or reliability
of informatio
n you received (1.58)
Seek feedback on your
academic work (1.24)
Explore topics on your own,
even though it was not
required for a class (1.27)

Return to contents
2010 CIRP Freshman SurveyHigher Education Research Institute 19
CIRP Construct Survey Items
Habits of MindHow often in the past year did you:
53.4% 58.2%
23.6%
50.0% 52.4%
28.3%38.6%
45.7%51.6%
39.4%
53.4%
54.9%
44.6% 42.2%
62.6%
56.4%51.1%
46.1%
15.7%
42.6%
0%
20%
40%
60%
80%
100%
your institution comparison group■ occasionally ■ occasionally■ frequently ■ frequently
Ask questions in class (1.20)
Revise your papers to
improve your writing (1.04)
Accept mistakes as part of the learning
process (0.95)
Look up scientific research
articles and resources
(1.05)
Take a risk because you felt you had more to gain
(1.03)
Return to contents
2010 CIRP Freshman SurveyHigher Education Research Institute 20
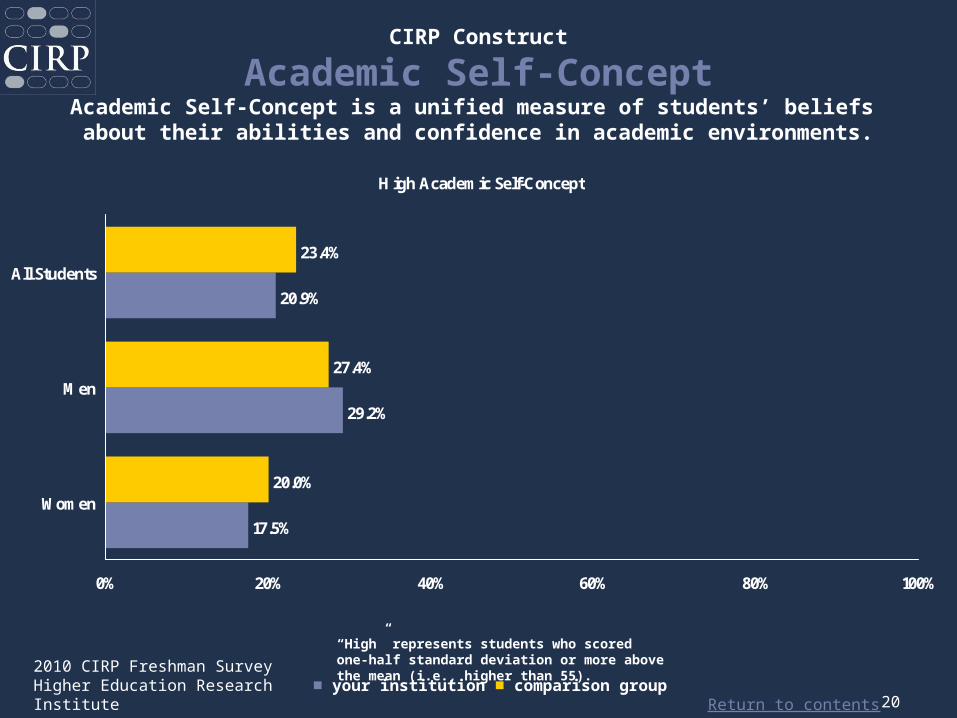
CIRP Construct
Academic Self-ConceptAcademic Self-Concept is a unified measure of students’ beliefs about their abilities and confidence in academic environments.
“High” represents students who scored one-half standard deviation or more above the mean (i.e., higher than 55).
■ your institution ■ comparison group
High Academic Self-Concept
17.5%
29.2%
20.9%
20.0%
27.4%
23.4%
0% 20% 40% 60% 80% 100%
Women
Men
All Students
Return to contents
2010 CIRP Freshman SurveyHigher Education Research Institute 21
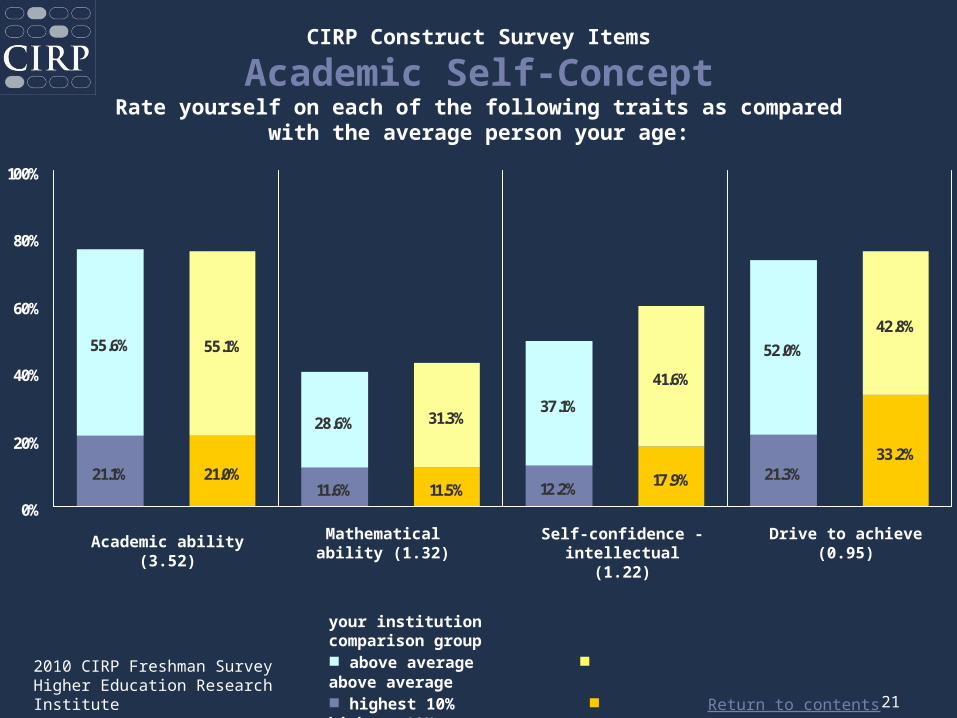
CIRP Construct Survey Items
Academic Self-ConceptRate yourself on each of the following traits as compared
with the average person your age:
21.1% 21.0%11.5% 12.2% 17.9% 21.3%
33.2%
55.1%
28.6% 31.3%37.1%
41.6%
52.0%
42.8%
11.6%
55.6%
0%
20%
40%
60%
80%
100%
your institution comparison group■ above average ■ above average■ highest 10% ■ highest 10%
Academic ability (3.52)
Self-confidence - intellectual (1.22)
Drive to achieve (0.95)
Mathematical ability (1.32)

Return to contents
2010 CIRP Freshman SurveyHigher Education Research Institute 22
CIRP Theme
Interaction with TeachersFrequency of Activity During the Past Year as High School Senior
your institution comparison group■ occasionally ■ occasionally■ frequently ■ frequently
4.9% 4.4%
33.8%24.5%
58.0% 56.3%
32.1%30.0%
0%
20%
40%
60%
80%
100%
Was a guest in a teacher's home
Asked a teacher for advice after class
Return to contents
2010 CIRP Freshman SurveyHigher Education Research Institute 23
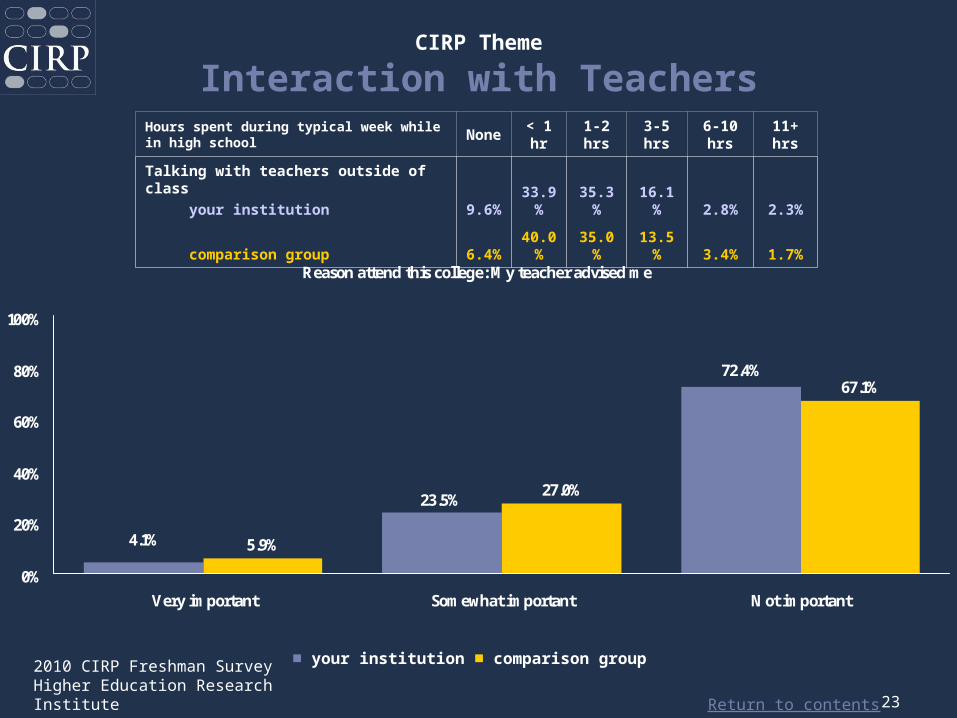
Hours spent during typical week while in high school
None
< 1 hr
1-2 hrs
3-5 hrs
6-10 hrs
11+ hrs
Talking with teachers outside of class your institution
9.6%
33.9%
35.3%
16.1% 2.8% 2.3%
comparison group6.4%
40.0%
35.0%
13.5% 3.4% 1.7%
CIRP Theme
Interaction with Teachers
■ your institution ■ comparison group
Reason attend this college: My teacher advised me
5.9%
27.0%
67.1%72.4%
4.1%
23.5%
0%
20%
40%
60%
80%
100%
Very important Somewhat important Not important
Return to contents
2010 CIRP Freshman SurveyHigher Education Research Institute 24
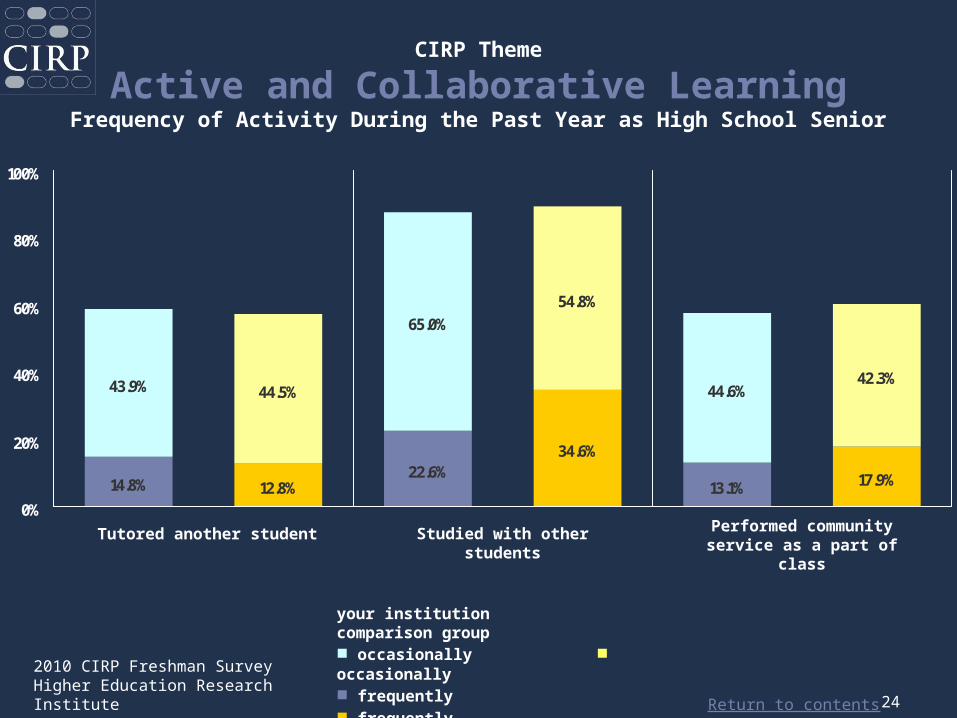
14.8% 12.8%
34.6%
13.1% 17.9%
44.5%
65.0%54.8%
44.6%42.3%
22.6%
43.9%
0%
20%
40%
60%
80%
100%
Tutored another student
Performed community service as a part of
class
Studied with other students
CIRP Theme
Active and Collaborative LearningFrequency of Activity During the Past Year as High School Senior
your institution comparison group■ occasionally ■ occasionally■ frequently ■ frequently
Return to contents
2010 CIRP Freshman SurveyHigher Education Research Institute 25
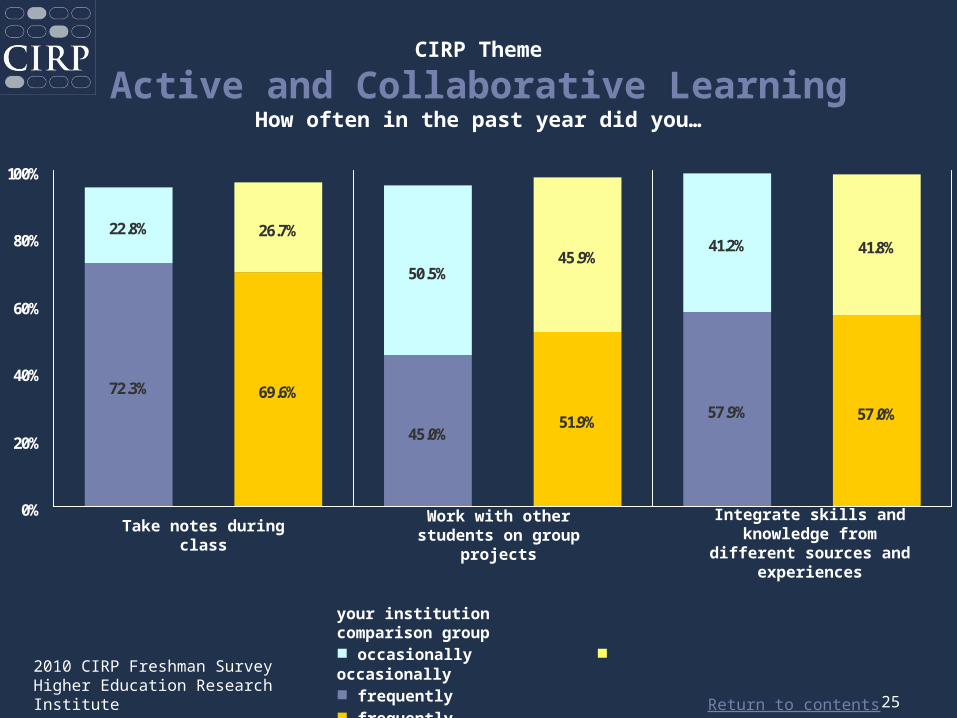
72.3% 69.6%
51.9%57.9% 57.0%
26.7%
50.5%45.9%
41.2% 41.8%
45.0%
22.8%
0%
20%
40%
60%
80%
100%
your institution comparison group■ occasionally ■ occasionally■ frequently ■ frequently
CIRP Theme
Active and Collaborative LearningHow often in the past year did you…
Take notes during class
Work with other students on group
projects
Integrate skills and knowledge from
different sources and experiences

Return to contents
2010 CIRP Freshman SurveyHigher Education Research Institute 26
your institution comparison group■ some chance ■ some chance■ very good chance ■ very good chance
59.1%52.2%
26.4%
38.3%
42.2%
49.2%
17.0%
37.3%
0%
20%
40%
60%
80%
100%
CIRP Theme
Active and Collaborative LearningWhat is your best guess as to the chances that you will…
Discuss course content with students outside of class
Get tutoring help in specific courses
Return to contents
2010 CIRP Freshman SurveyHigher Education Research Institute 27
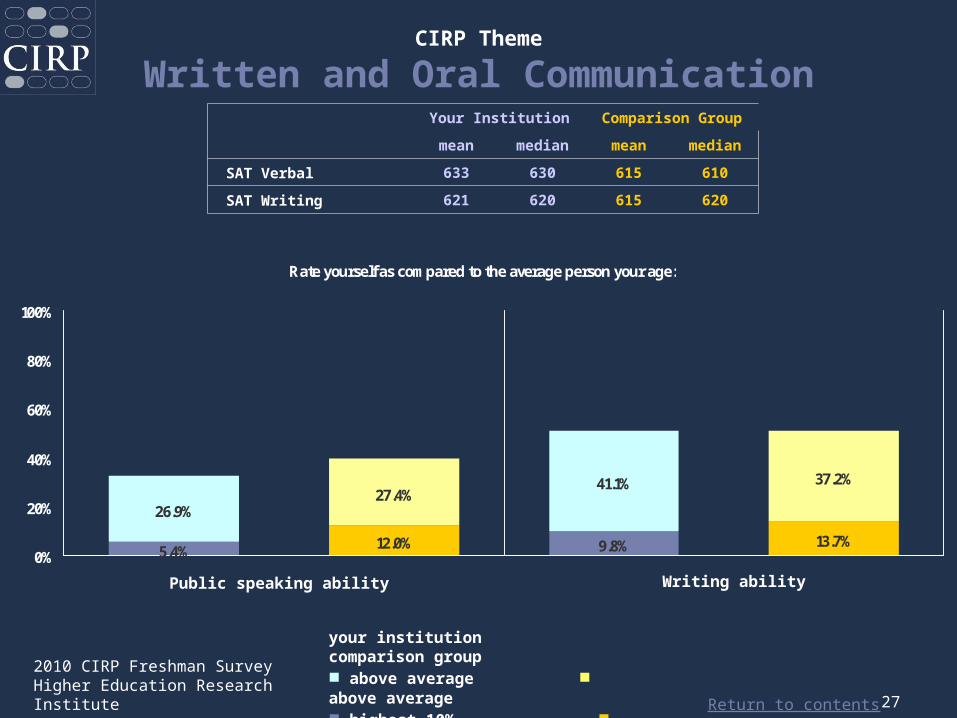
Your InstitutionComparison
Group
mean median mean median
SAT Verbal 633 630 615 610
SAT Writing 621 620 615 620
Rate yourself as compared to the average person your age:
5.4% 12.0% 13.7%
27.4%41.1% 37.2%
9.8%
26.9%
0%
20%
40%
60%
80%
100%
CIRP Theme
Written and Oral Communication
your institution comparison group■ above average ■ above average■ highest 10% ■ highest 10%
Public speaking ability Writing ability
Return to contents
2010 CIRP Freshman SurveyHigher Education Research Institute 28
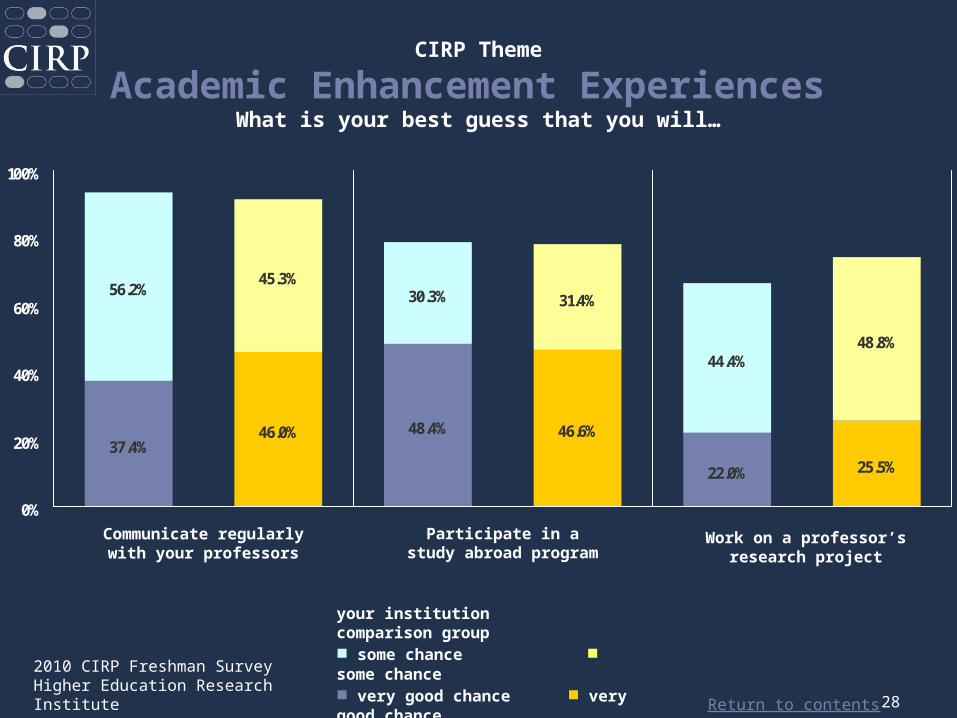
37.4%46.0% 46.6%
22.0% 25.5%
45.3%30.3% 31.4%
44.4%48.8%
48.4%
56.2%
0%
20%
40%
60%
80%
100%
CIRP Theme
Academic Enhancement Experiences What is your best guess that you will…
your institution comparison group■ some chance ■ some chance■ very good chance ■ very good chance
Communicate regularly with your professors
Participate in astudy abroad program
Work on a professor’sresearch project

Return to contents
2010 CIRP Freshman SurveyHigher Education Research Institute 29
28.3%39.1%
7.4%0.4% 2.1% 4.9% 6.4% 4.5% 5.0%
57.2%
54.8% 47.5%
21.5%25.4%
30.9%39.2%
50.2% 49.8%
5.0%
67.3%
0%
20%
40%
60%
80%
100%
your institution comparison group■ occasionally ■ occasionally■ frequently ■ frequently
CIRP Theme
Academic DisengagementFrequency of Activity During the Past Year as High School Senior
Was bored
in class
Came lateto class
Skippedschool/class
Fell asleepin class
Failed to complete
homework in time

Return to contents
2010 CIRP Freshman SurveyHigher Education Research Institute 30
Civic Engagement
Return to contents
2010 CIRP Freshman SurveyHigher Education Research Institute 31
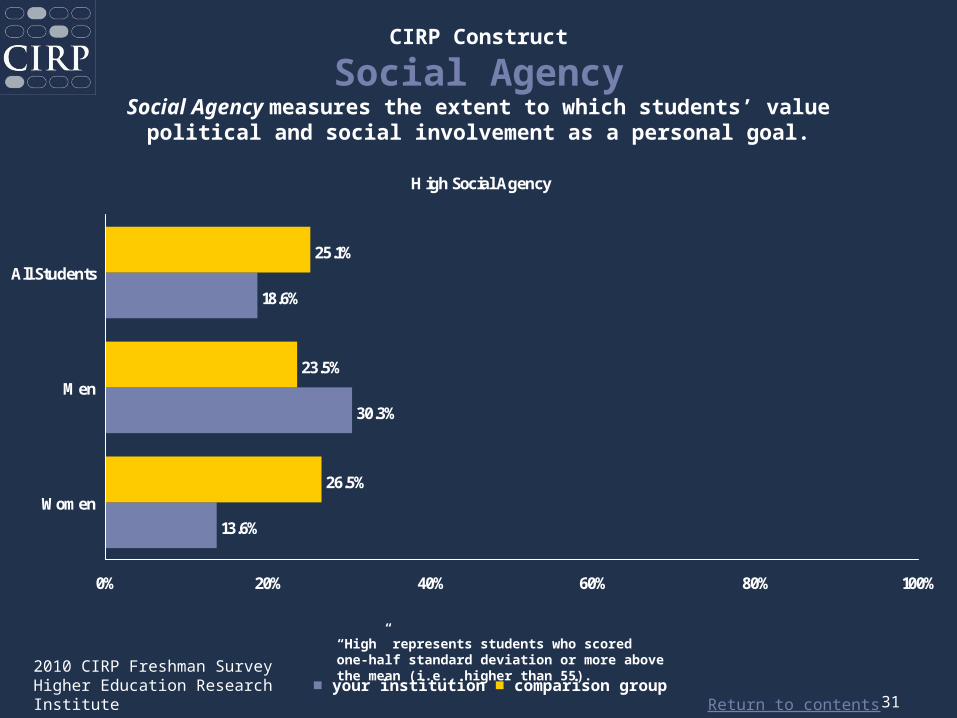
CIRP Construct
Social AgencySocial Agency measures the extent to which students’ value
political and social involvement as a personal goal.
“High” represents students who scored one-half standard deviation or more above the mean (i.e., higher than 55).
■ your institution ■ comparison group
High Social Agency
13.6%
30.3%
18.6%
26.5%
23.5%
25.1%
0% 20% 40% 60% 80% 100%
Women
Men
All Students
Return to contents
2010 CIRP Freshman SurveyHigher Education Research Institute 32
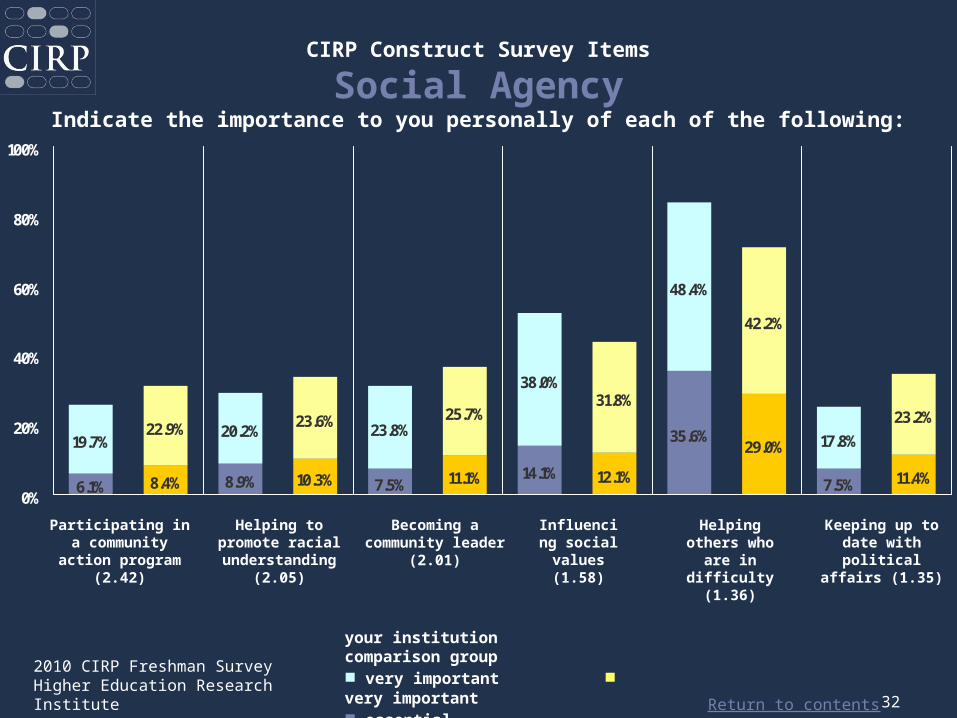
CIRP Construct Survey Items
Social AgencyIndicate the importance to you personally of each of the following:
your institution comparison group■ very important ■ very important■ essential ■ essential
6.1% 8.4% 10.3% 7.5% 11.1% 14.1% 12.1%
35.6%29.0%
7.5% 11.4%
22.9% 20.2%23.6% 23.8%
25.7%
38.0%31.8%
48.4%
42.2%
17.8%
23.2%
8.9%
19.7%
0%
20%
40%
60%
80%
100%
Participating in a community
action program (2.42)
Helping to promote racial understanding
(2.05)
Becoming a community leader
(2.01)
Influencing social values (1.58)
Keeping up to date with
political affairs (1.35)
Helping others who
are in difficulty
(1.36)

Return to contents
2010 CIRP Freshman SurveyHigher Education Research Institute 33
9.6% 14.1%
34.8%
17.9%24.0%
13.1% 17.9%
48.9%
54.9%55.6%
52.2%48.7%
44.6%42.3%
39.3%
42.5%
0%
20%
40%
60%
80%
100%
CIRP Theme
Civic EngagementFrequency of Activity During the Past Year as High School Senior
your institution comparison group■ occasionally ■ occasionally■ frequently ■ frequently
Demonstrated for/against
a cause
Performedvolunteer work
Voted in a student election
Performed community service as a part of a class
Return to contents
2010 CIRP Freshman SurveyHigher Education Research Institute 34
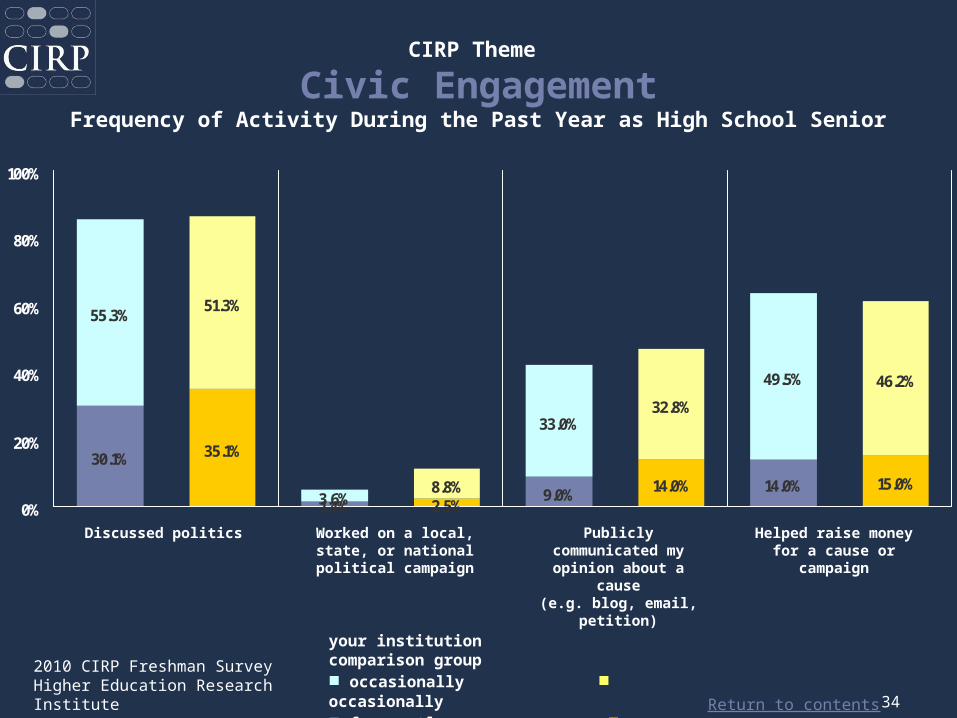
30.1% 35.1%
2.5%9.0% 14.0% 14.0% 15.0%
51.3%
3.6%8.8%
33.0%32.8%
49.5% 46.2%
1.4%
55.3%
0%
20%
40%
60%
80%
100%
CIRP Theme
Civic EngagementFrequency of Activity During the Past Year as High School Senior
your institution comparison group■ occasionally ■ occasionally■ frequently ■ frequently
Discussed politics Worked on a local, state, or national
political campaign
Publicly communicated my
opinion about a cause
(e.g. blog, email, petition)
Helped raise money for a cause or
campaign
Return to contents
2010 CIRP Freshman SurveyHigher Education Research Institute 35
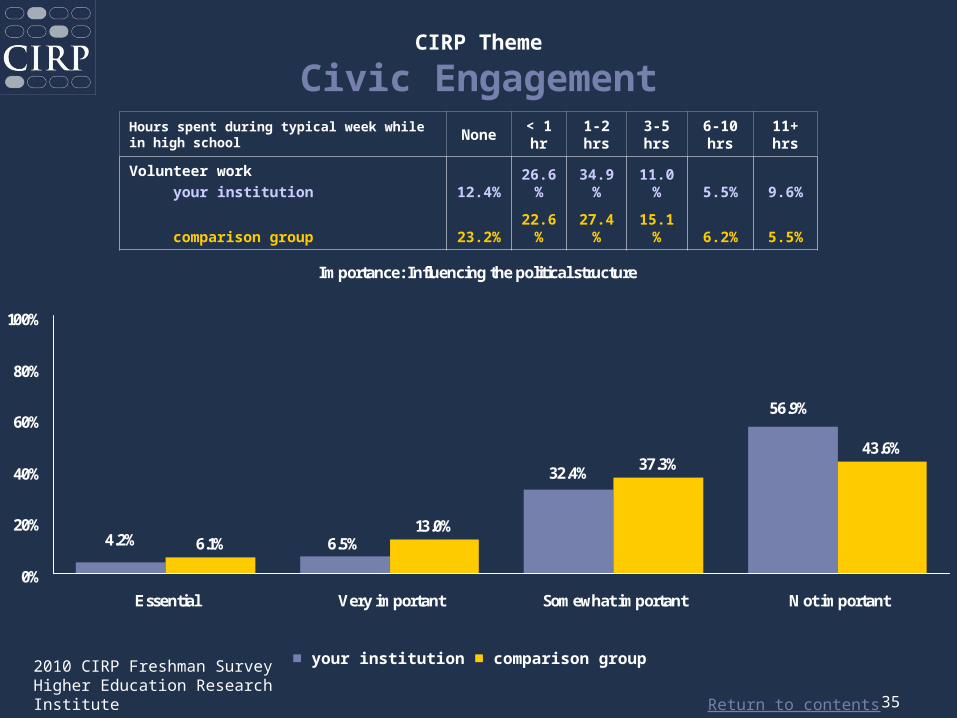
Hours spent during typical week while in high school None
< 1 hr
1-2 hrs
3-5 hrs
6-10 hrs
11+ hrs
Volunteer work your institution
12.4%
26.6%
34.9%
11.0% 5.5% 9.6%
comparison group23.2
%22.6
%27.4
%15.1
% 6.2% 5.5%
■ your institution ■ comparison group
Importance: Influencing the political structure
6.1%13.0%
37.3%43.6%
56.9%
32.4%
4.2% 6.5%
0%
20%
40%
60%
80%
100%
Essential Very important Somewhat important Not important
CIRP Theme
Civic Engagement
Return to contents
2010 CIRP Freshman SurveyHigher Education Research Institute 36
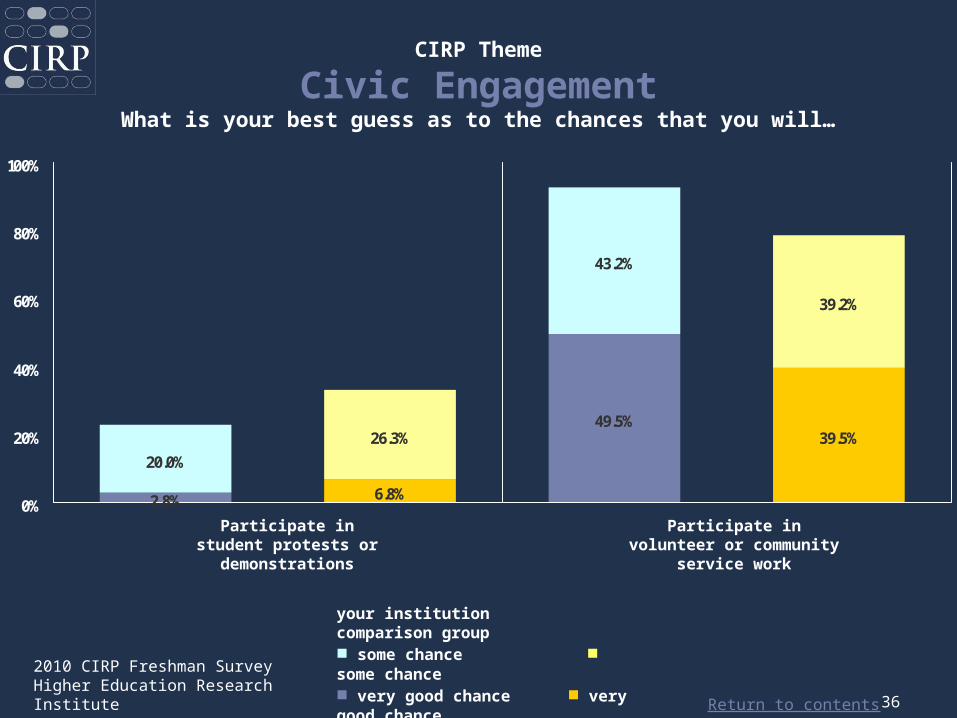
your institution comparison group■ some chance ■ some chance■ very good chance ■ very good chance
2.8% 6.8%
39.5%26.3%
43.2%
39.2%
49.5%
20.0%
0%
20%
40%
60%
80%
100%
CIRP Theme
Civic EngagementWhat is your best guess as to the chances that you will…
Participate instudent protests or
demonstrations
Participate involunteer or community
service work
Return to contents
2010 CIRP Freshman SurveyHigher Education Research Institute 37
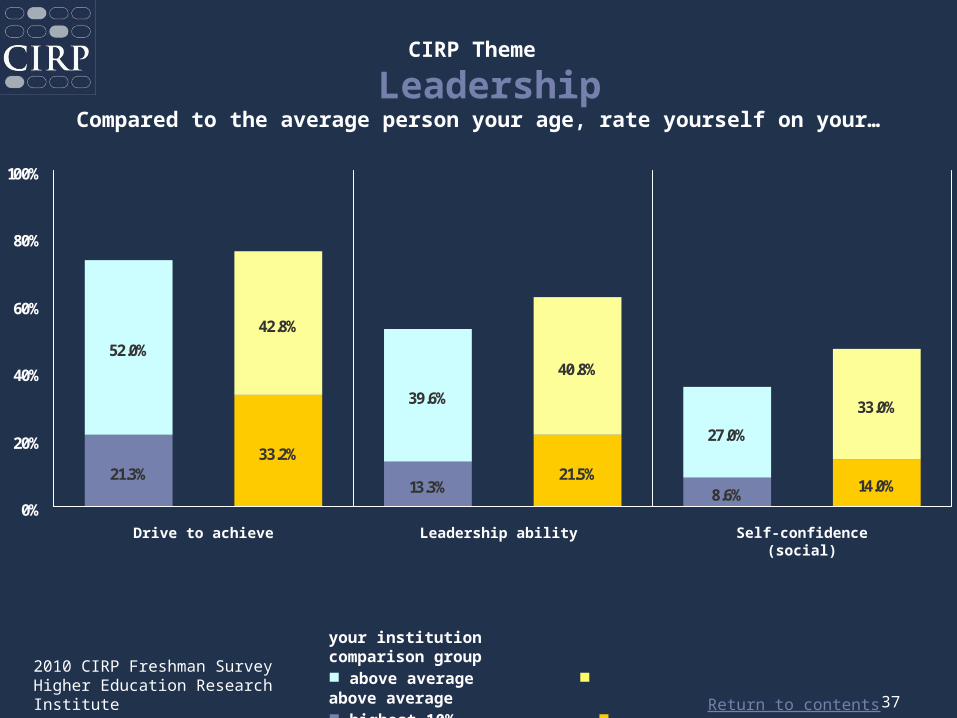
21.3%33.2%
21.5%8.6% 14.0%
42.8%
39.6%
40.8%
27.0%
33.0%
13.3%
52.0%
0%
20%
40%
60%
80%
100%
your institution comparison group■ above average ■ above average■ highest 10% ■ highest 10%
CIRP Theme
LeadershipCompared to the average person your age, rate yourself on your…
Drive to achieve Leadership ability Self-confidence (social)
Return to contents
2010 CIRP Freshman SurveyHigher Education Research Institute 38
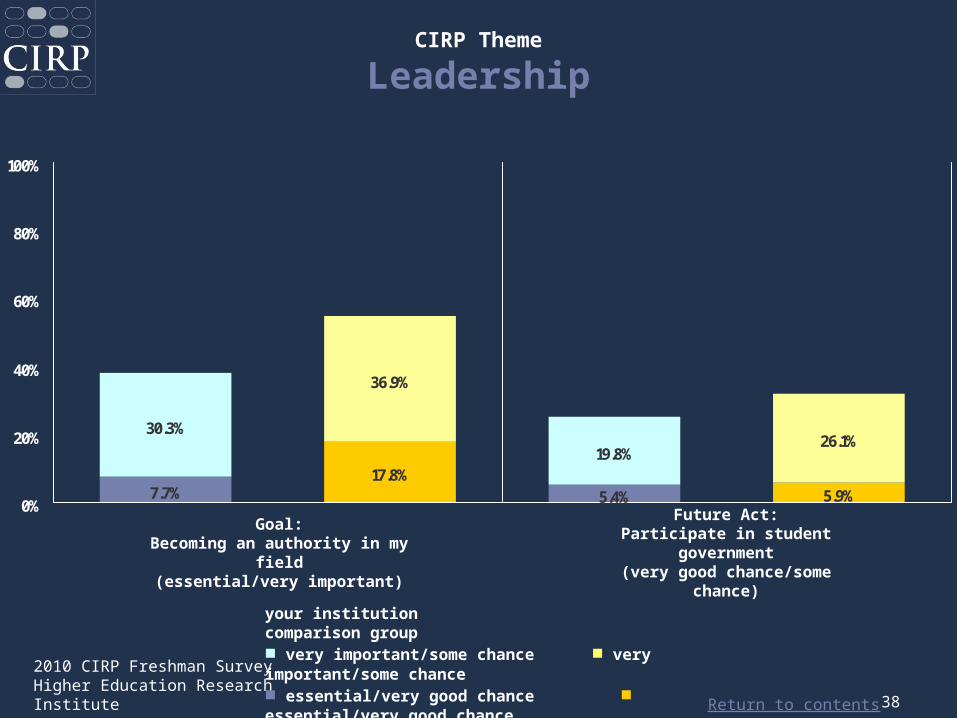
your institution comparison group■ very important/some chance ■ very important/some chance■ essential/very good chance ■ essential/very good chance
7.7%17.8%
5.9%
36.9%
19.8%26.1%
5.4%
30.3%
0%
20%
40%
60%
80%
100%
CIRP Theme
Leadership
Goal:Becoming an authority in my
field(essential/very important)
Future Act:Participate in student
government(very good chance/some
chance)
Return to contents
2010 CIRP Freshman SurveyHigher Education Research Institute 39
Diversity
Return to contents
2010 CIRP Freshman SurveyHigher Education Research Institute 40
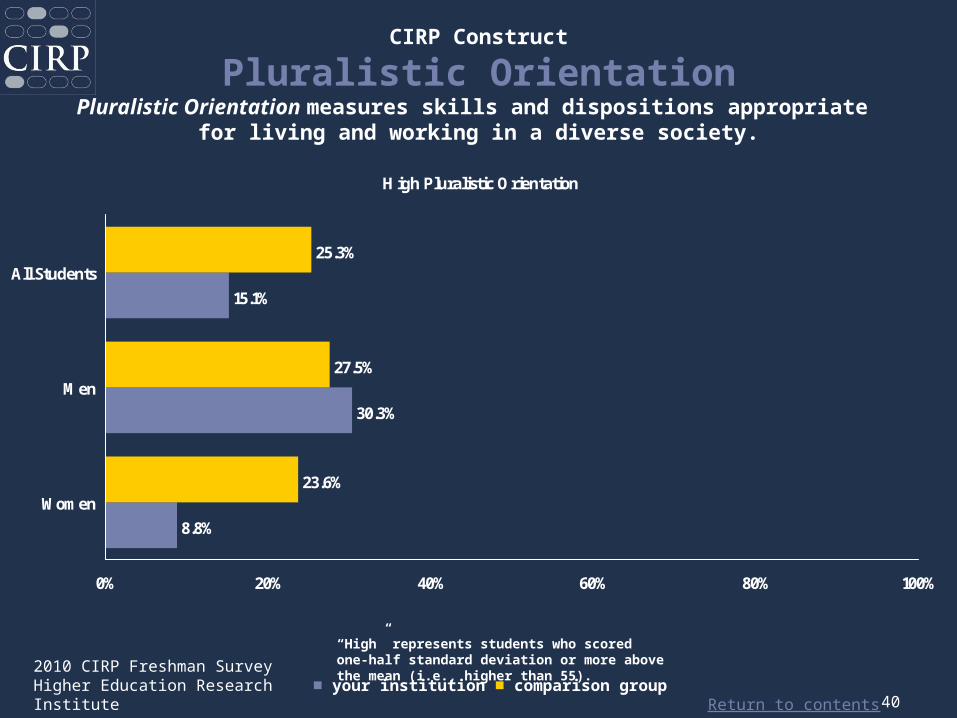
CIRP Construct
Pluralistic OrientationPluralistic Orientation measures skills and dispositions appropriate
for living and working in a diverse society.
“High” represents students who scored one-half standard deviation or more above the mean (i.e., higher than 55).
■ your institution ■ comparison group
High Pluralistic Orientation
8.8%
30.3%
15.1%
23.6%
27.5%
25.3%
0% 20% 40% 60% 80% 100%
Women
Men
All Students
Return to contents
2010 CIRP Freshman SurveyHigher Education Research Institute 41
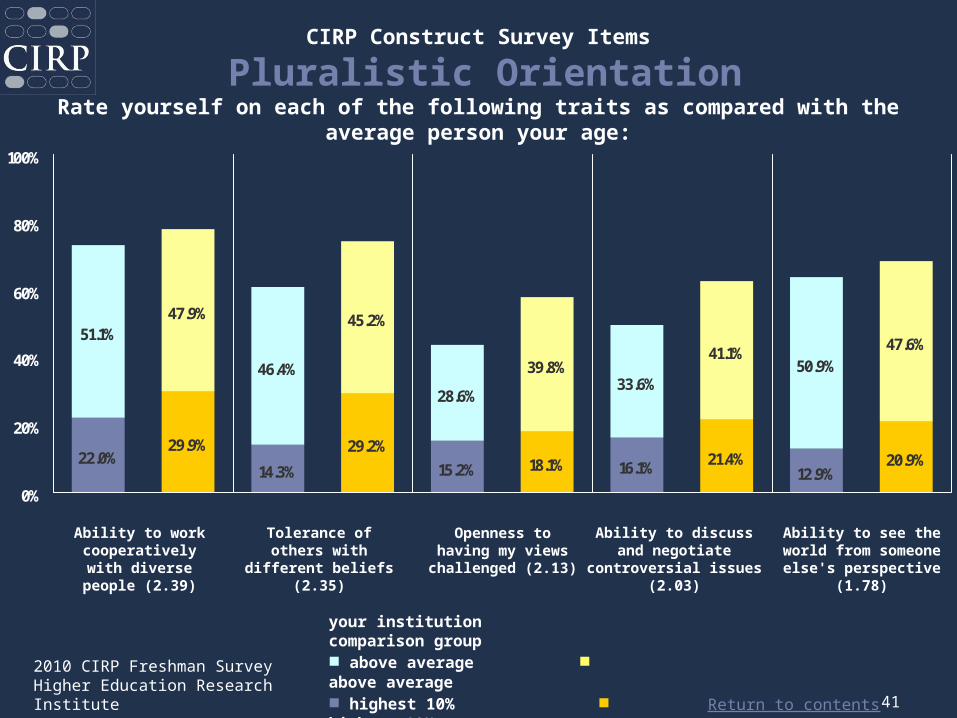
CIRP Construct Survey Items
Pluralistic OrientationRate yourself on each of the following traits as compared with the average
person your age:
Ability to work cooperatively with diverse people (2.39)
Tolerance of others with
different beliefs (2.35)
Openness to having my views
challenged (2.13)
Ability to discuss and negotiate
controversial issues (2.03)
Ability to see the world from someone
else's perspective (1.78)
22.0%29.9% 29.2%
15.2% 18.1% 16.1% 21.4%12.9%
20.9%
47.9%
46.4%
45.2%
28.6%
39.8%33.6%
41.1%50.9%
47.6%
14.3%
51.1%
0%
20%
40%
60%
80%
100%
your institution comparison group■ above average ■ above average■ highest 10% ■ highest 10%
Return to contents
2010 CIRP Freshman SurveyHigher Education Research Institute 42
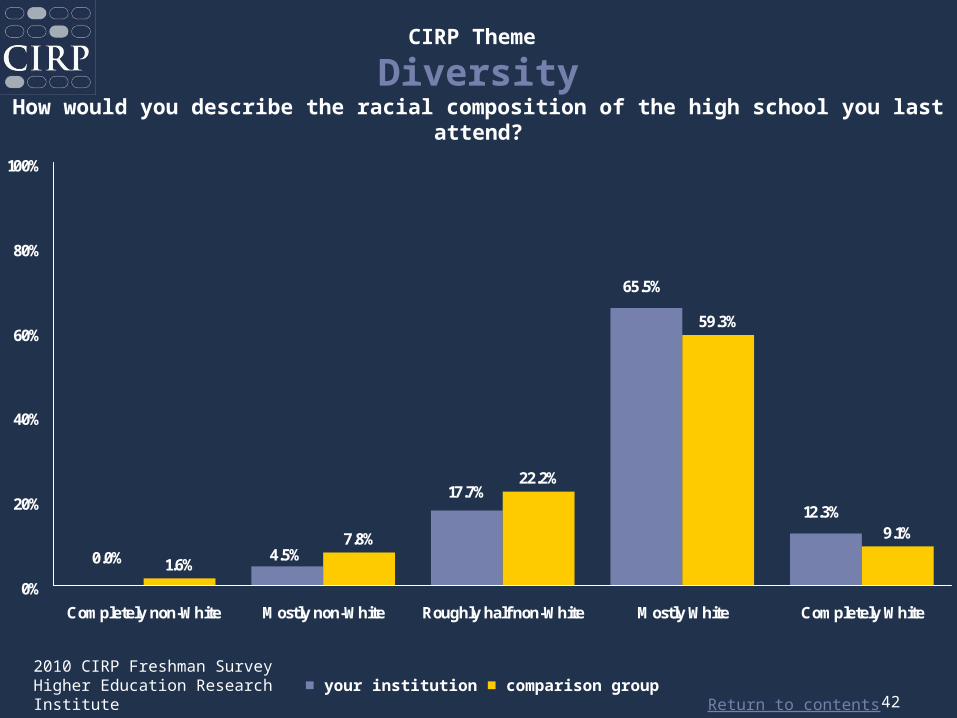
■ your institution ■ comparison group
1.6%
7.8%
22.2%
59.3%
9.1%
65.5%
12.3%17.7%
0.0% 4.5%
0%
20%
40%
60%
80%
100%
Completely non-White Mostly non-White Roughly half non-White Mostly White Completely White
CIRP Theme
DiversityHow would you describe the racial composition of the high school you last
attend?
Return to contents
2010 CIRP Freshman SurveyHigher Education Research Institute 43
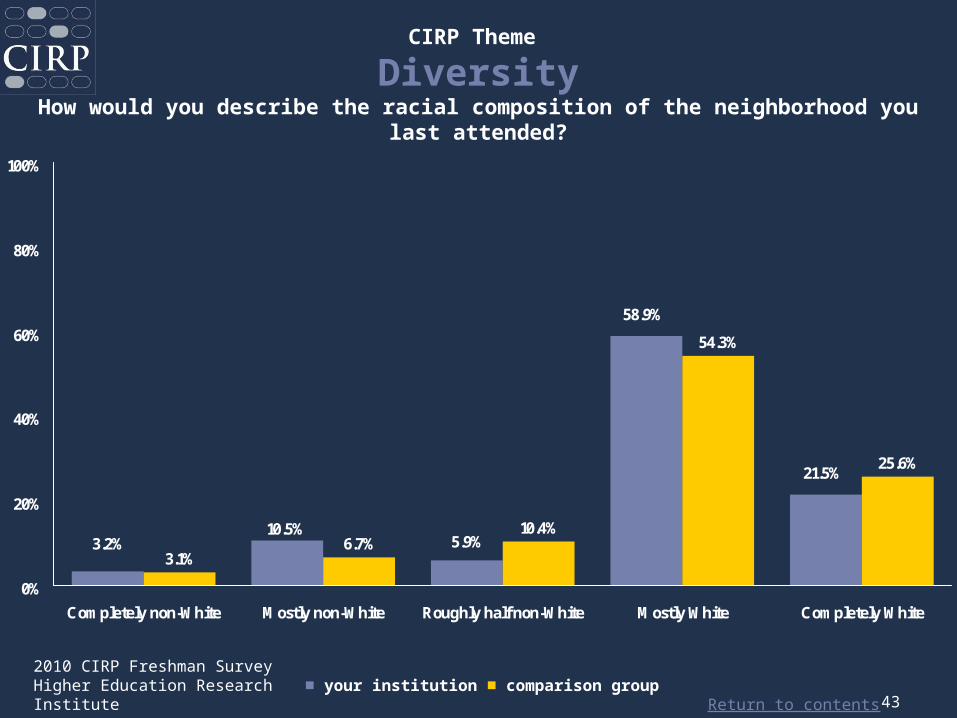
■ your institution ■ comparison group
3.1%6.7%
10.4%
54.3%
25.6%
58.9%
21.5%
5.9%3.2%10.5%
0%
20%
40%
60%
80%
100%
Completely non-White Mostly non-White Roughly half non-White Mostly White Completely White
CIRP Theme
DiversityHow would you describe the racial composition of the neighborhood you last
attended?
Return to contents
2010 CIRP Freshman SurveyHigher Education Research Institute 44
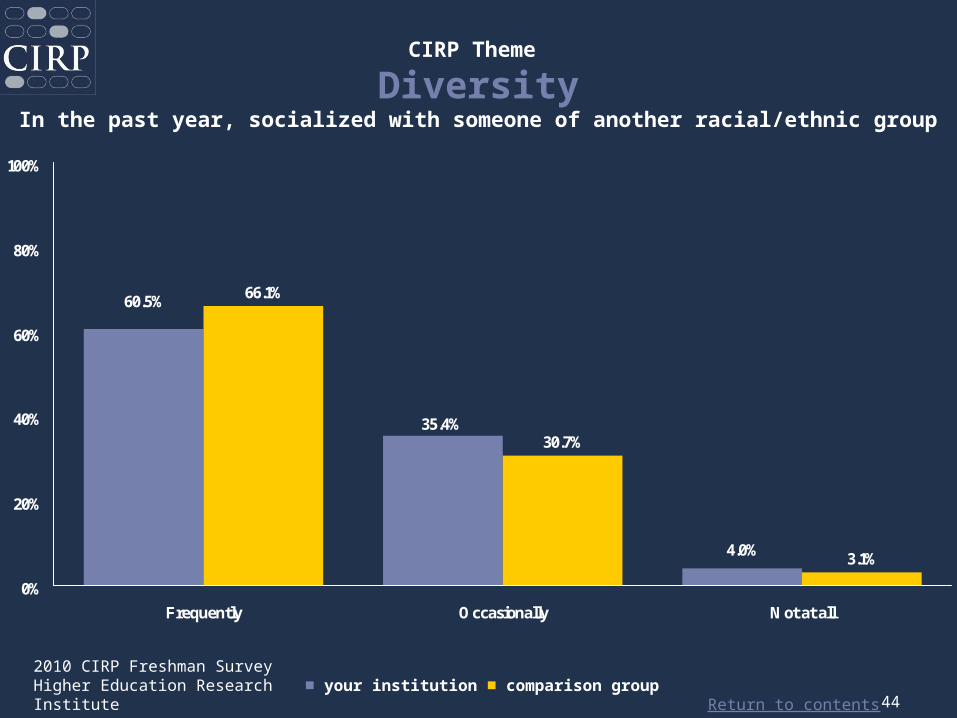
■ your institution ■ comparison group
66.1%
30.7%
3.1%4.0%
60.5%
35.4%
0%
20%
40%
60%
80%
100%
Frequently Occasionally Not at all
CIRP Theme
DiversityIn the past year, socialized with someone of another racial/ethnic group
Return to contents
2010 CIRP Freshman SurveyHigher Education Research Institute 45
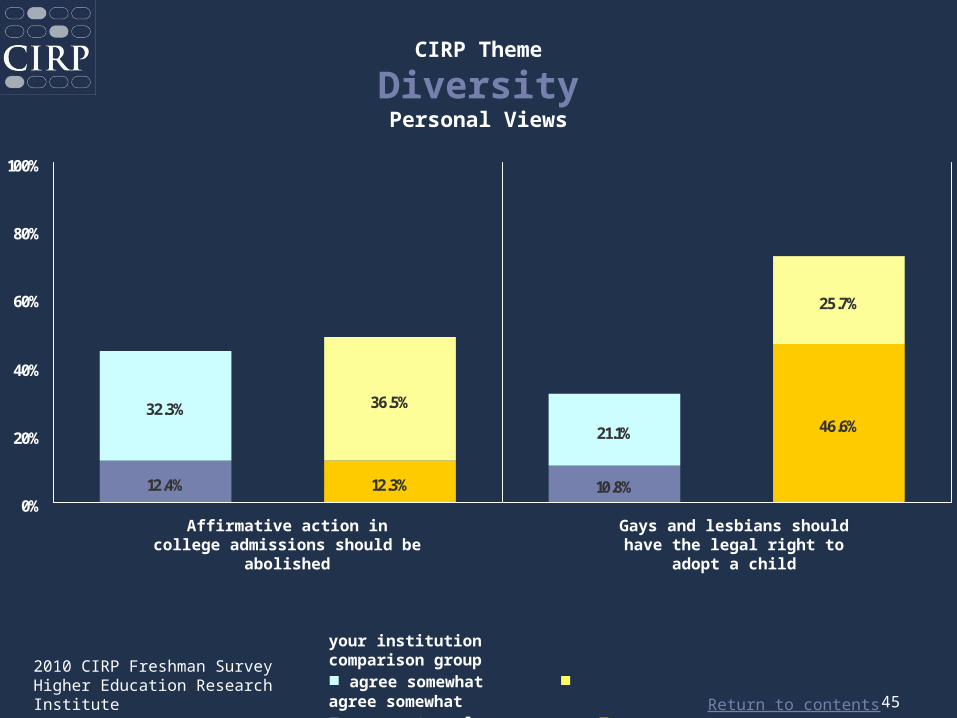
12.4% 12.3%
46.6%
36.5%
21.1%
25.7%
10.8%
32.3%
0%
20%
40%
60%
80%
100%
CIRP Theme
DiversityPersonal Views
Affirmative action in college admissions should be
abolished
Gays and lesbians should have the legal right to adopt
a child
your institution comparison group■ agree somewhat ■ agree somewhat■ agree strongly ■ agree strongly
Return to contents
2010 CIRP Freshman SurveyHigher Education Research Institute 46
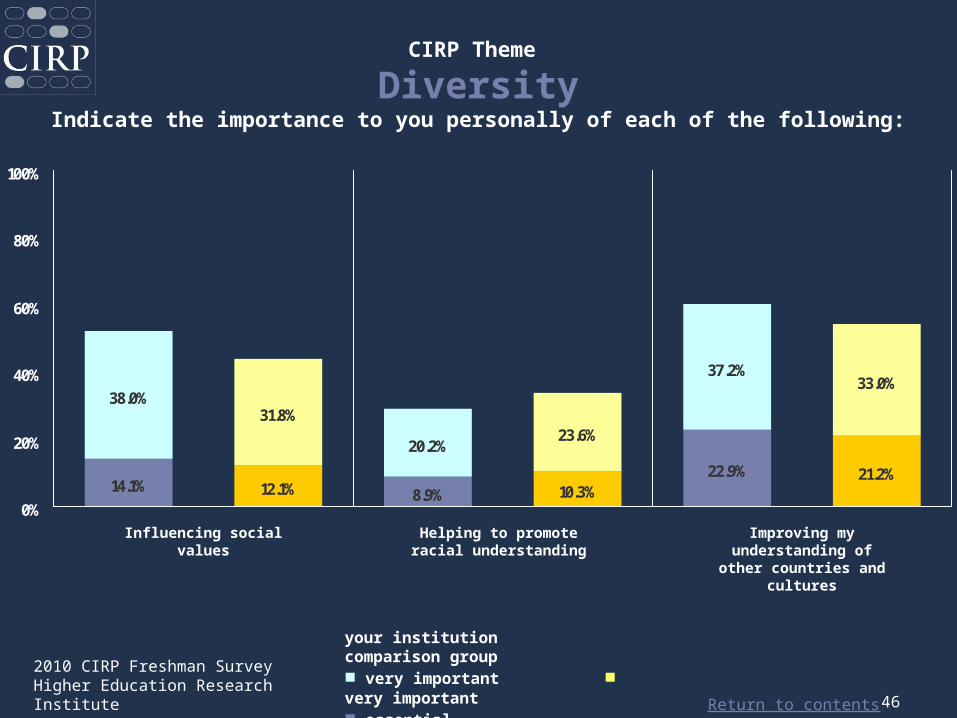
14.1% 12.1% 10.3%22.9% 21.2%
31.8%
20.2%23.6%
37.2%33.0%
8.9%
38.0%
0%
20%
40%
60%
80%
100%
CIRP Theme
DiversityIndicate the importance to you personally of each of the following:
Influencing social values
Helping to promote racial understanding
Improving my understanding of
other countries and cultures
your institution comparison group■ very important ■ very important■ essential ■ essential
Return to contents
2010 CIRP Freshman SurveyHigher Education Research Institute 47
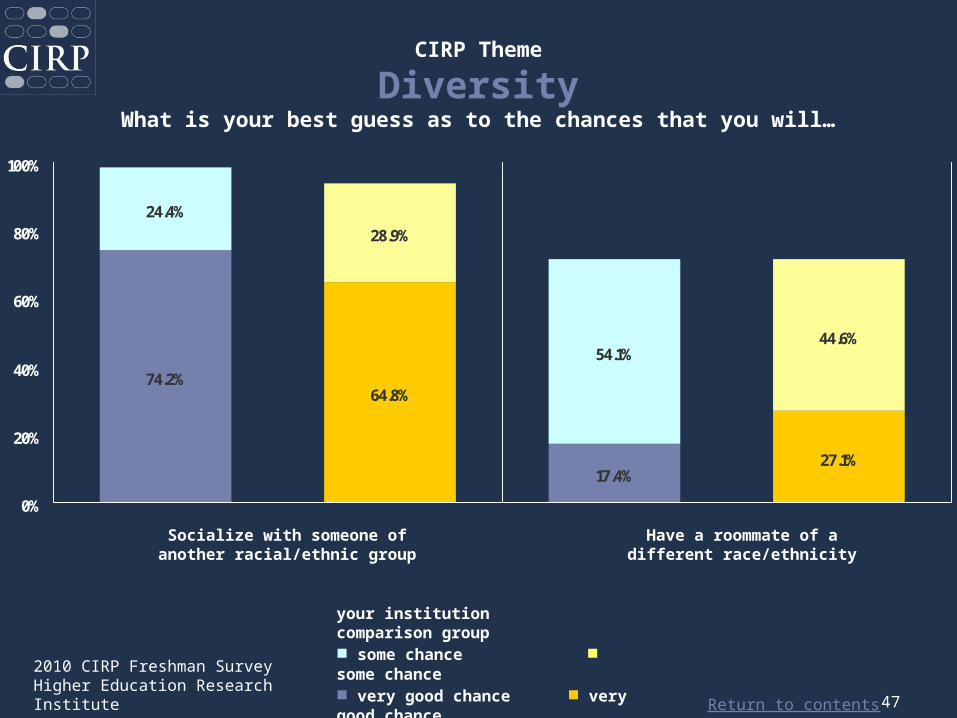
your institution comparison group■ some chance ■ some chance■ very good chance ■ very good chance
74.2%64.8%
27.1%
28.9%
54.1%44.6%
17.4%
24.4%
0%
20%
40%
60%
80%
100%
CIRP Theme
DiversityWhat is your best guess as to the chances that you will…
Socialize with someone of another racial/ethnic group
Have a roommate of a different race/ethnicity

Return to contents
2010 CIRP Freshman SurveyHigher Education Research Institute 48
Social Life
Return to contents
2010 CIRP Freshman SurveyHigher Education Research Institute 49
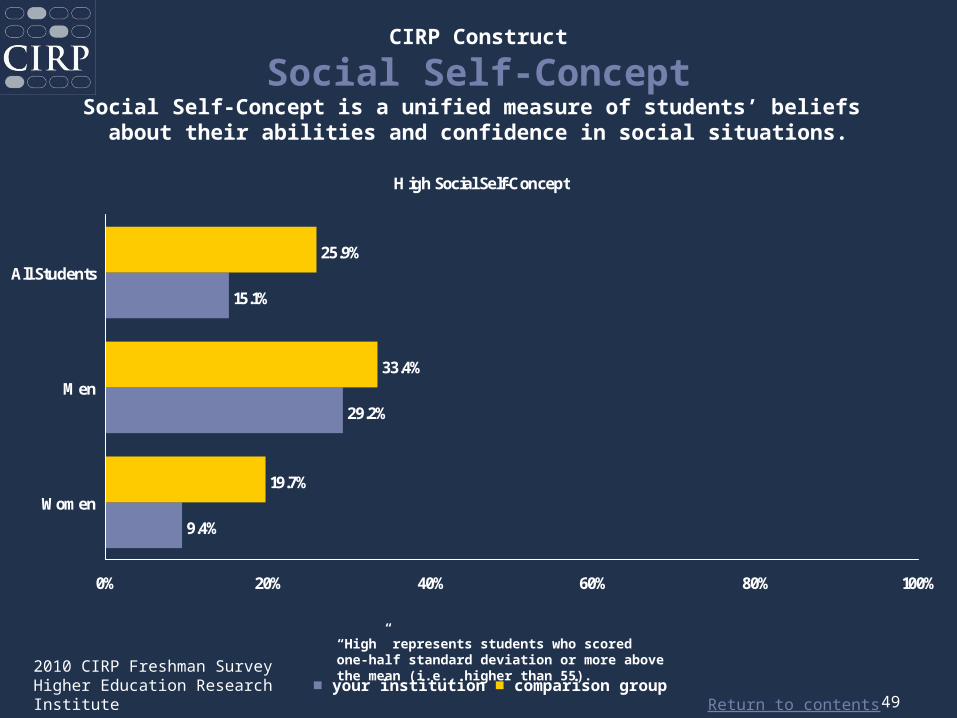
CIRP Construct
Social Self-ConceptSocial Self-Concept is a unified measure of students’ beliefs
about their abilities and confidence in social situations.
“High” represents students who scored one-half standard deviation or more above the mean (i.e., higher than 55).
■ your institution ■ comparison group
High Social Self-Concept
9.4%
29.2%
15.1%
19.7%
33.4%
25.9%
0% 20% 40% 60% 80% 100%
Women
Men
All Students
Return to contents
2010 CIRP Freshman SurveyHigher Education Research Institute 50
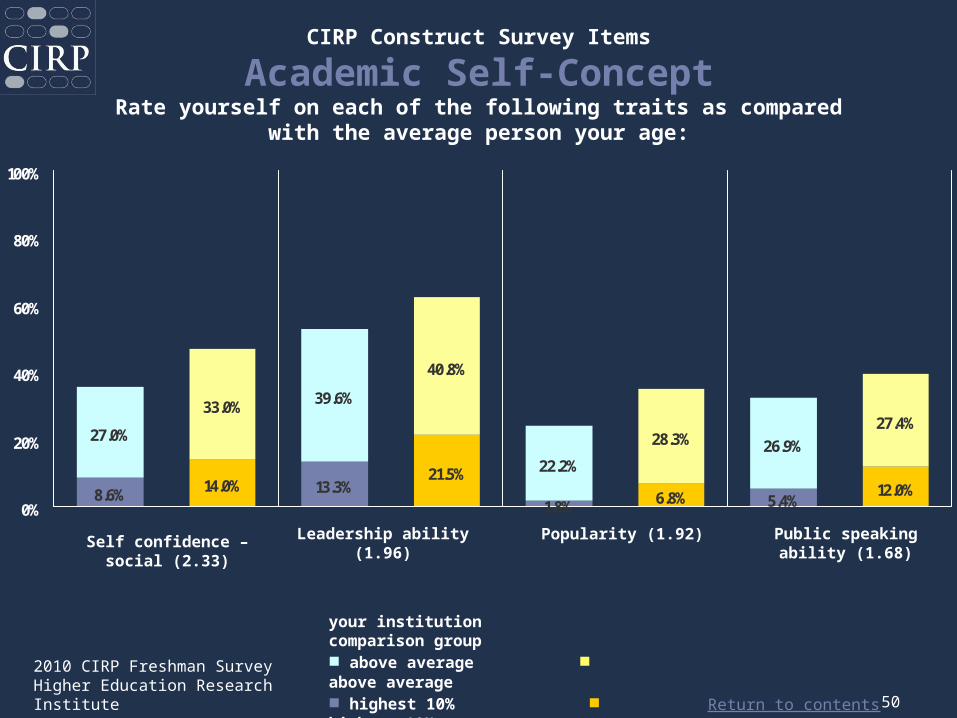
CIRP Construct Survey Items
Academic Self-ConceptRate yourself on each of the following traits as compared
with the average person your age:
8.6% 14.0%21.5%
1.8% 6.8% 5.4%12.0%
33.0% 39.6%
40.8%
22.2%
28.3% 26.9%27.4%
13.3%
27.0%
0%
20%
40%
60%
80%
100%
your institution comparison group■ above average ■ above average■ highest 10% ■ highest 10%
Self confidence – social (2.33)
Popularity (1.92) Public speaking ability (1.68)
Leadership ability (1.96)
Return to contents
2010 CIRP Freshman SurveyHigher Education Research Institute 51
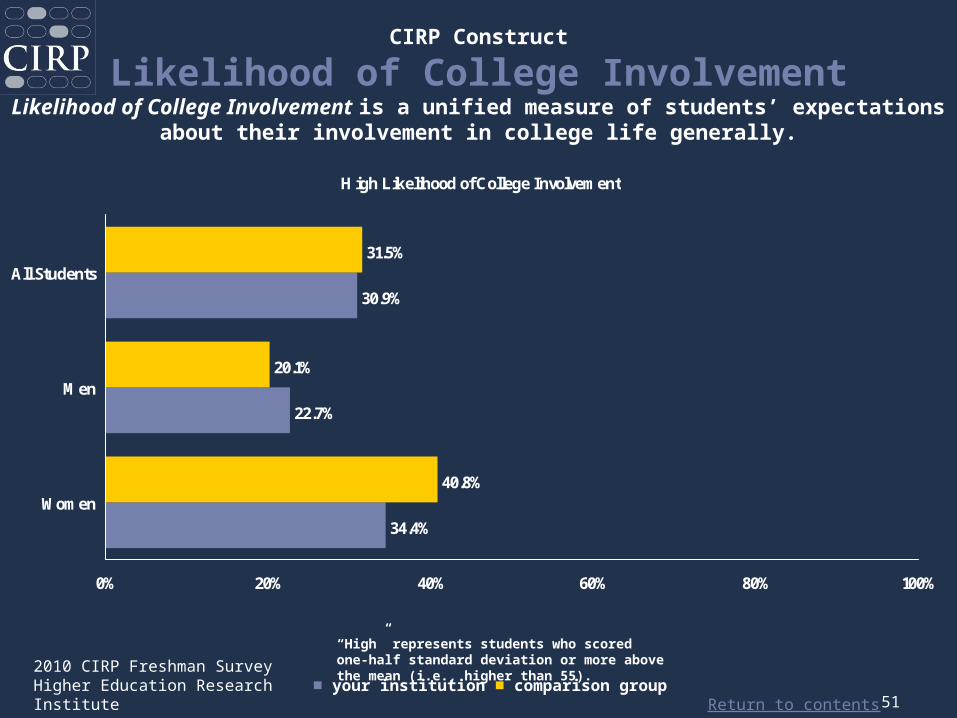
“High” represents students who scored one-half standard deviation or more above the mean (i.e., higher than 55).
■ your institution ■ comparison group
High Likelihood of College Involvement
34.4%
22.7%
30.9%
40.8%
20.1%
31.5%
0% 20% 40% 60% 80% 100%
Women
Men
All Students
CIRP Construct
Likelihood of College InvolvementLikelihood of College Involvement is a unified measure of students’
expectationsabout their involvement in college life generally.
Return to contents
2010 CIRP Freshman SurveyHigher Education Research Institute 52
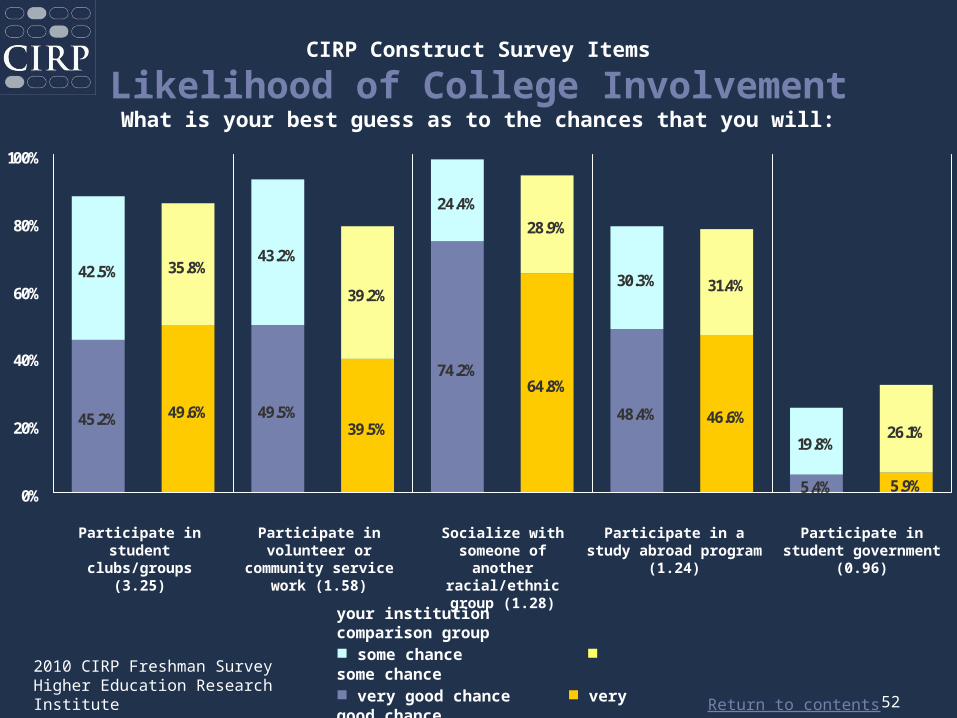
Participate in student
clubs/groups (3.25)
Participate in volunteer or
community service work (1.58)
Socialize with someone of
another racial/ethnic group (1.28)
Participate in a study abroad program
(1.24)
Participate in student government
(0.96)
45.2% 49.6%39.5%
74.2%64.8%
48.4% 46.6%
5.4% 5.9%
35.8%43.2%
39.2%
24.4%
28.9%
30.3% 31.4%
19.8%26.1%
49.5%
42.5%
0%
20%
40%
60%
80%
100%
CIRP Construct Survey Items
Likelihood of College InvolvementWhat is your best guess as to the chances that you will:
your institution comparison group■ some chance ■ some chance■ very good chance ■ very good chance
Return to contents
2010 CIRP Freshman SurveyHigher Education Research Institute 53
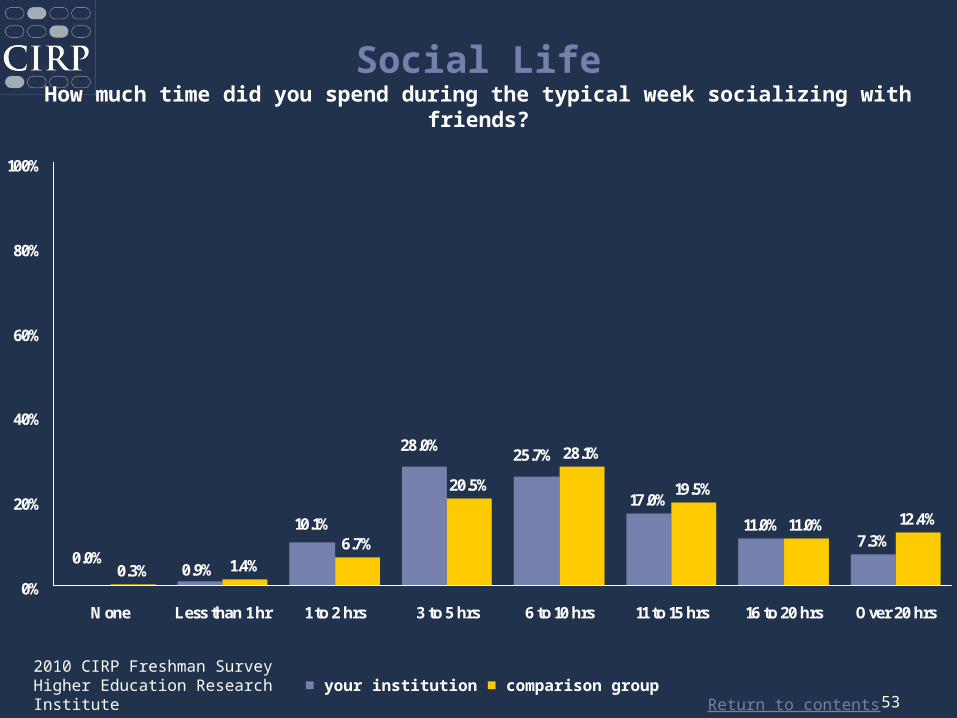
■ your institution ■ comparison group
17.0%
11.0%7.3%
0.3% 1.4%6.7%
20.5%
28.1%
19.5%
11.0% 12.4%
28.0%25.7%
10.1%
0.0%0.9%
0%
20%
40%
60%
80%
100%
None Less than 1 hr 1 to 2 hrs 3 to 5 hrs 6 to 10 hrs 11 to 15 hrs 16 to 20 hrs Over 20 hrs
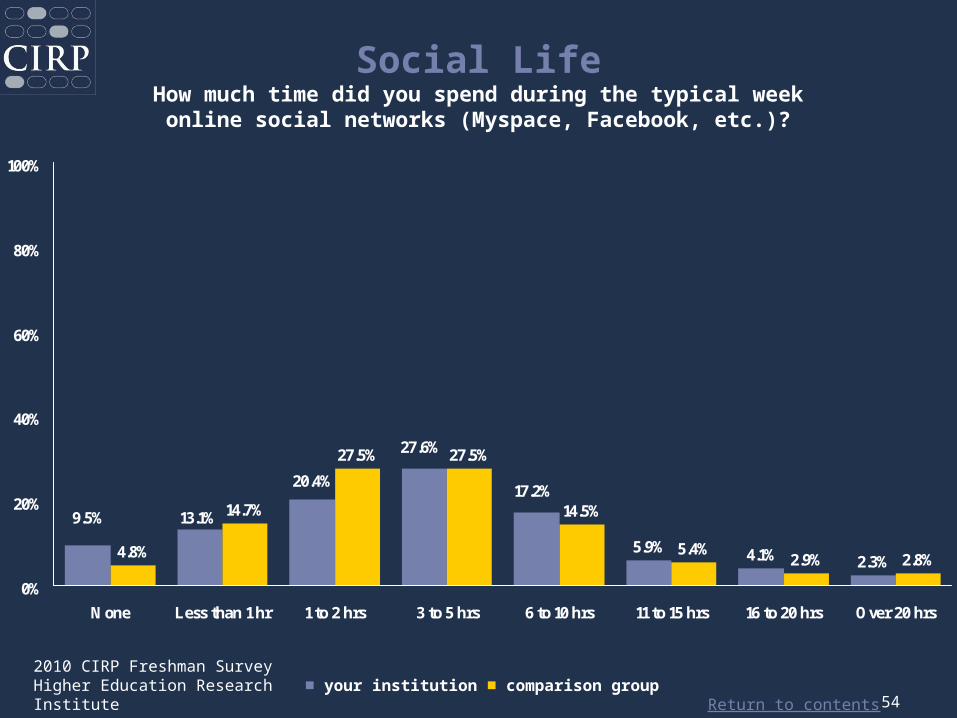
Social LifeHow much time did you spend during the typical week socializing with
friends?
Return to contents
2010 CIRP Freshman SurveyHigher Education Research Institute 54
■ your institution ■ comparison group
5.9% 4.1% 2.3%4.8%
14.7%
27.5% 27.5%
14.5%
5.4%2.9% 2.8%
27.6%
17.2%20.4%
9.5% 13.1%
0%
20%
40%
60%
80%
100%
None Less than 1 hr 1 to 2 hrs 3 to 5 hrs 6 to 10 hrs 11 to 15 hrs 16 to 20 hrs Over 20 hrs
Social LifeHow much time did you spend during the typical week
online social networks (Myspace, Facebook, etc.)?
Return to contents
2010 CIRP Freshman SurveyHigher Education Research Institute 55
Choosing College

Return to contents
2010 CIRP Freshman SurveyHigher Education Research Institute 56
“High” represents students who scored one-half standard deviation or more above the mean (i.e., higher than 55).
■ your institution ■ comparison group
High College Repuation Orientation
14.5%
15.4%
14.7%
32.9%
26.8%
30.1%
0% 20% 40% 60% 80% 100%
Women
Men
All Students
CIRP Construct
College Reputation OrientationCollege Reputation Orientation measures the degree to which students valueacademic reputation and future career potential as a reason for choosing this
college.
Return to contents
2010 CIRP Freshman SurveyHigher Education Research Institute 57
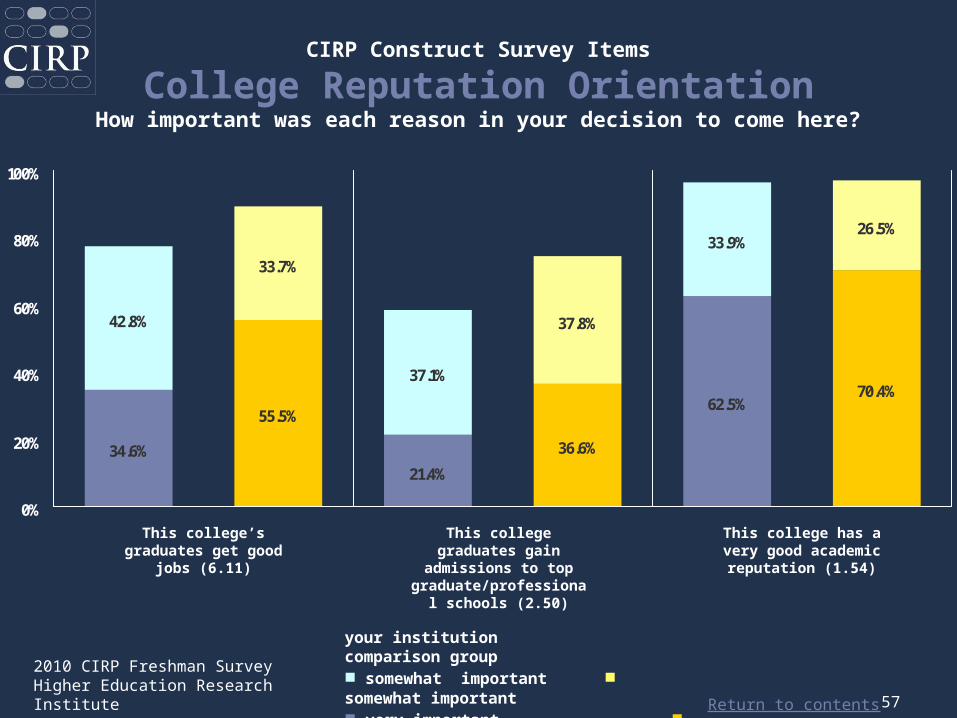
34.6%
55.5%
36.6%
62.5%70.4%
33.7%
37.1%
37.8%
33.9%26.5%
21.4%
42.8%
0%
20%
40%
60%
80%
100%
This college’s graduates get good
jobs (6.11)
This college graduates gain
admissions to top graduate/professional
schools (2.50)
This college has a very good academic reputation (1.54)
your institution comparison group■ somewhat important ■ somewhat important■ very important ■ very important
CIRP Construct Survey Items
College Reputation OrientationHow important was each reason in your decision to come here?
Return to contents
2010 CIRP Freshman SurveyHigher Education Research Institute 58
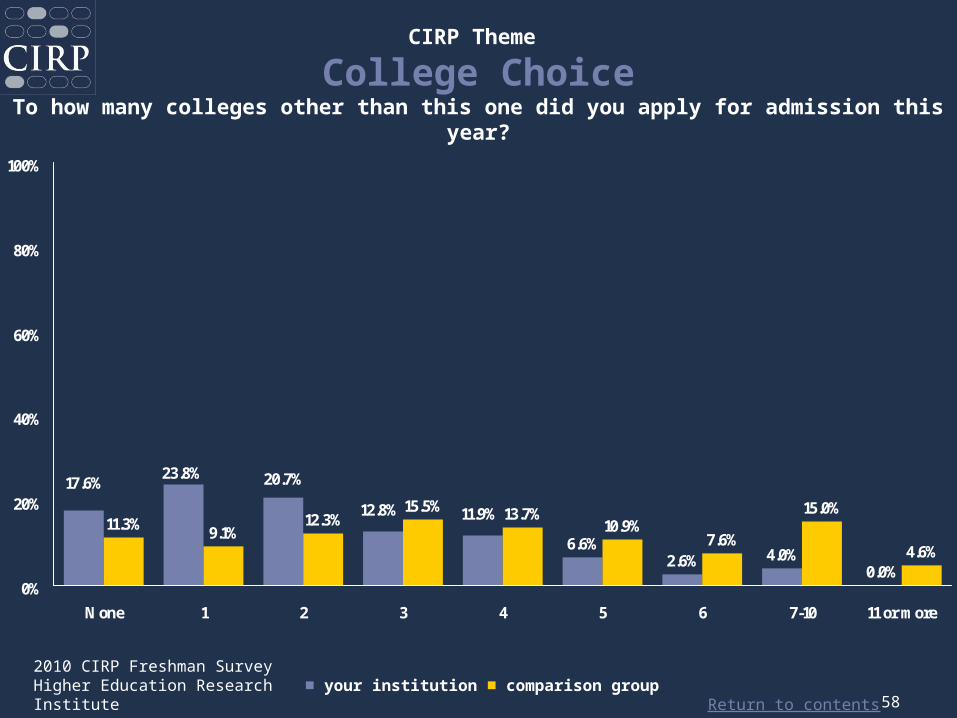
■ your institution ■ comparison group
6.6%2.6% 4.0%
0.0%
11.3% 9.1%12.3%
15.5% 13.7%10.9%
7.6%
15.0%
4.6%
12.8% 11.9%
20.7%17.6%23.8%
0%
20%
40%
60%
80%
100%
None 1 2 3 4 5 6 7-10 11 or more
CIRP Theme
College ChoiceTo how many colleges other than this one did you apply for admission this
year?
Return to contents
2010 CIRP Freshman SurveyHigher Education Research Institute 59
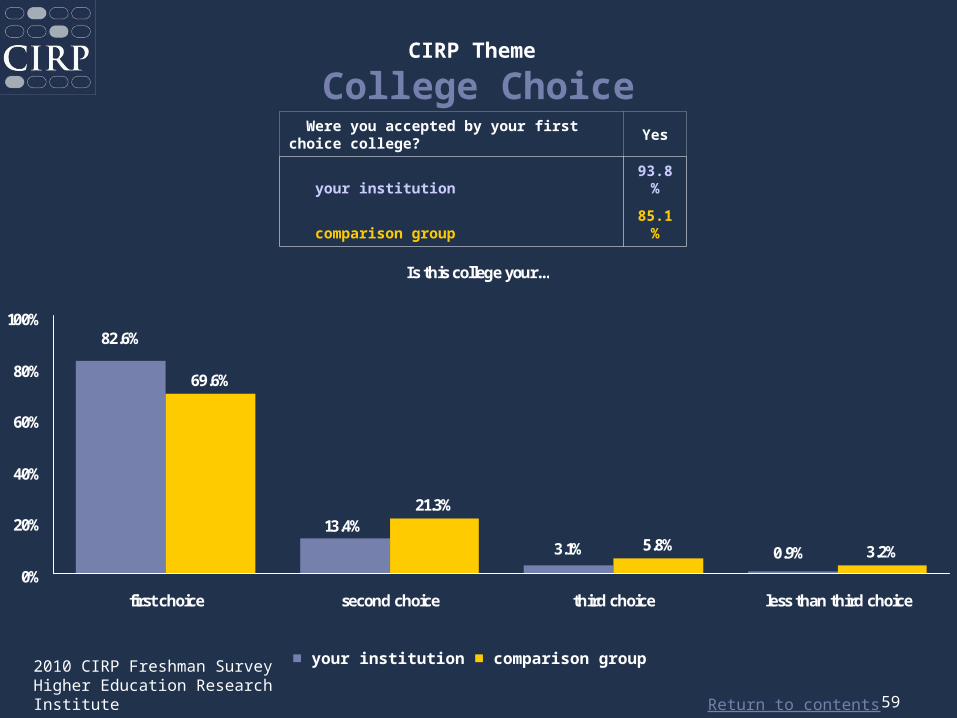
Were you accepted by your first choice college?
Yes
your institution93.8
%
comparison group85.1
%
■ your institution ■ comparison group
Is this college your...
69.6%
21.3%
5.8% 3.2%0.9%3.1%
82.6%
13.4%
0%
20%
40%
60%
80%
100%
first choice second choice third choice less than third choice
CIRP Theme
College Choice
Return to contents
2010 CIRP Freshman SurveyHigher Education Research Institute 60
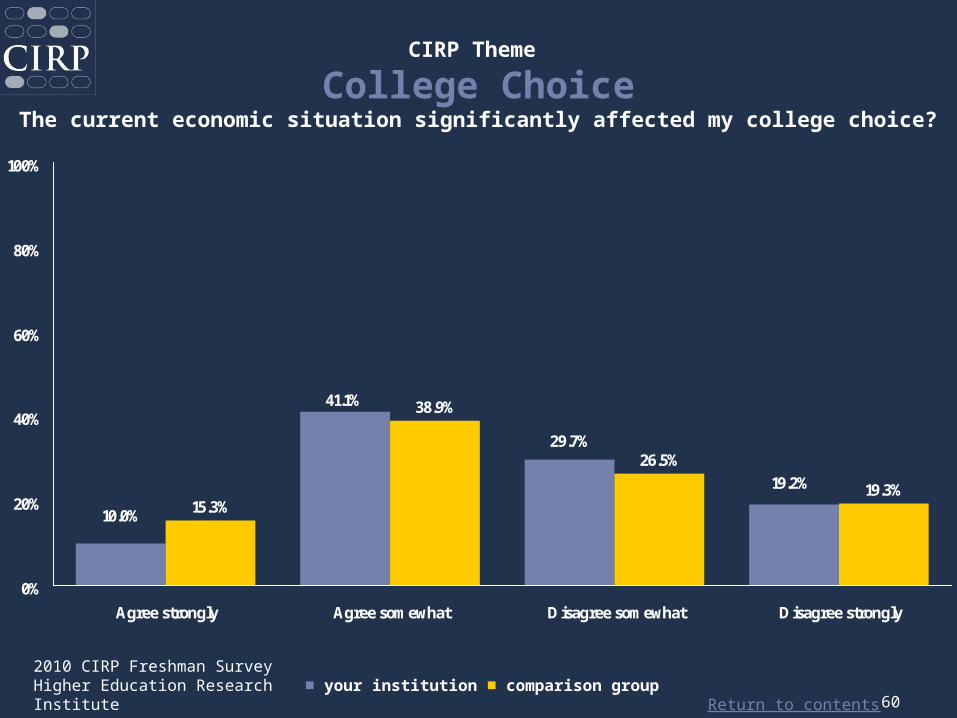
■ your institution ■ comparison group
15.3%
38.9%
26.5%
19.3%19.2%
29.7%
10.0%
41.1%
0%
20%
40%
60%
80%
100%
Agree strongly Agree somewhat Disagree somewhat Disagree strongly
CIRP Theme
College ChoiceThe current economic situation significantly affected my college choice?
Return to contents
2010 CIRP Freshman SurveyHigher Education Research Institute 61
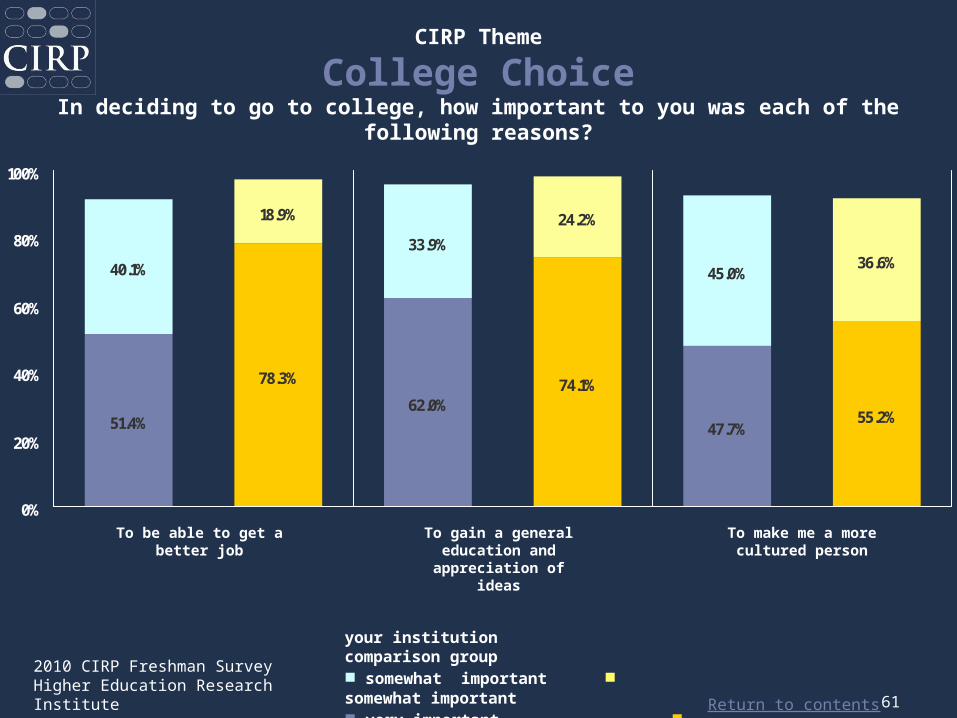
51.4%
78.3% 74.1%
47.7%55.2%
18.9%
33.9%
24.2%
45.0%36.6%
62.0%
40.1%
0%
20%
40%
60%
80%
100%
your institution comparison group■ somewhat important ■ somewhat important■ very important ■ very important
To be able to get a better job
To gain a general education and
appreciation of ideas
To make me a morecultured person
CIRP Theme
College ChoiceIn deciding to go to college, how important to you was each of the following
reasons?
Return to contents
2010 CIRP Freshman SurveyHigher Education Research Institute 62
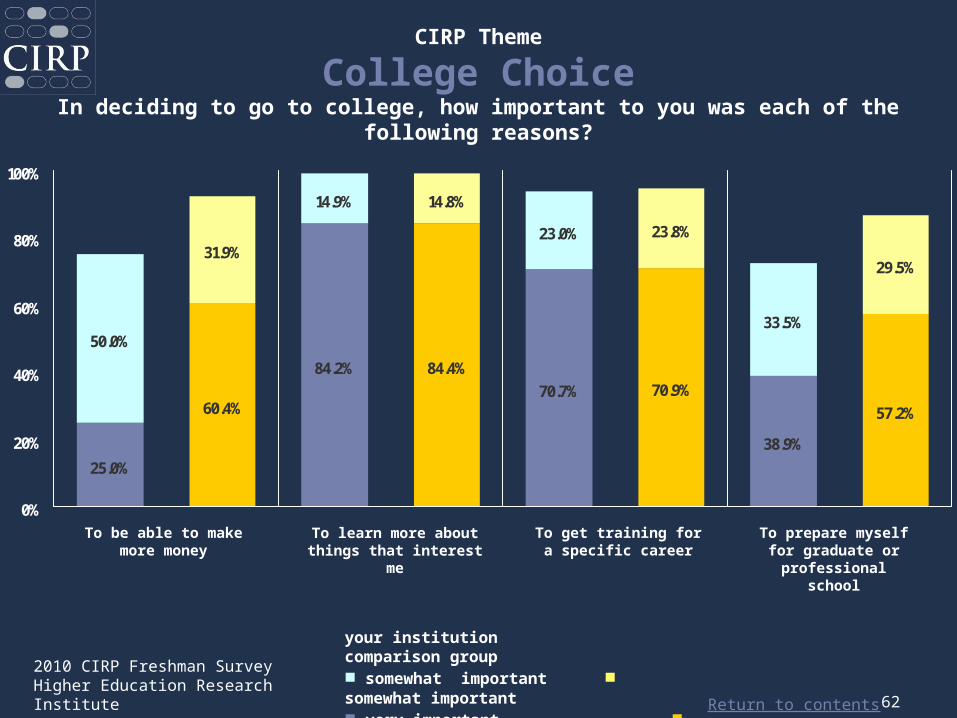
25.0%
60.4%
84.4%70.7% 70.9%
38.9%
57.2%
31.9%
14.9% 14.8%
23.0% 23.8%
33.5%
29.5%
84.2%
50.0%
0%
20%
40%
60%
80%
100%
CIRP Theme
College ChoiceIn deciding to go to college, how important to you was each of the following
reasons?
To be able to make more money
To learn more about things that interest
me
To get training for a specific career
To prepare myself for graduate or
professional school
your institution comparison group■ somewhat important ■ somewhat important■ very important ■ very important

Return to contents
2010 CIRP Freshman SurveyHigher Education Research Institute 63
16.7% 11.8%4.8% 4.1% 5.9%
62.5%70.4%
30.5%40.7%
62.2% 62.8%40.8%
20.0% 21.5% 23.5%27.0%
33.9%26.5%
52.7%44.4%
30.2%22.3%
5.9%
44.8%
0%
20%
40%
60%
80%
100%
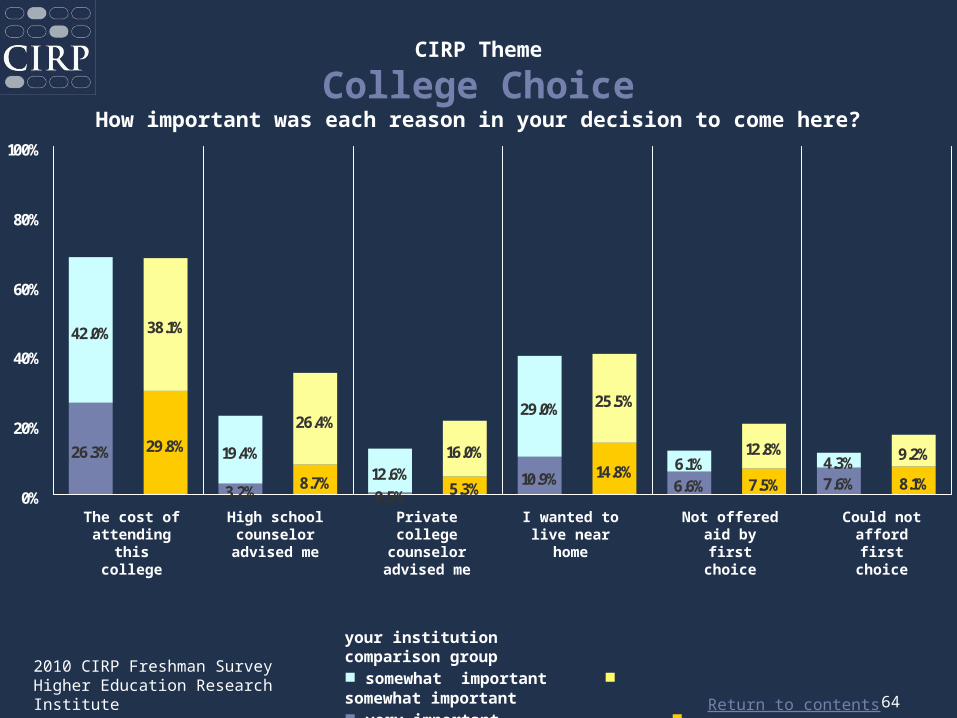
CIRP Theme
College ChoiceHow important was each reason in your decision to come here?
My parents wanted me
to come here
My relatives wanted me
to come here
My teacher advised me
This college has a very
good academic reputation
This college has a good reputation
for its social
activities
I was offered
financial assistance
your institution comparison group■ somewhat important ■ somewhat important■ very important ■ very important
Return to contents
2010 CIRP Freshman SurveyHigher Education Research Institute 64
26.3% 29.8%
8.7%0.5% 5.3%
10.9% 14.8%6.6% 7.5% 7.6% 8.1%
38.1%
19.4%
26.4%
12.6%16.0%
29.0% 25.5%
6.1%12.8%
4.3% 9.2%
3.2%
42.0%
0%
20%
40%
60%
80%
100%
CIRP Theme
College ChoiceHow important was each reason in your decision to come here?
your institution comparison group■ somewhat important ■ somewhat important■ very important ■ very important
The cost of attending
this college
High school counselor
advised me
Private college
counselor advised me
I wanted to live near
home
Not offered aid by first
choice
Could not afford first
choice

Return to contents
2010 CIRP Freshman SurveyHigher Education Research Institute 65
21.4%
36.6%
55.5%
74.9%
17.1%
59.0% 58.1%
12.0%18.9%
37.8% 42.8%
33.7%
19.3%
24.2%
30.2% 30.8%
31.9%
39.9%
34.6%
37.1%
0%
20%
40%
60%
80%
100%
CIRP Theme
College ChoiceHow important was each reason in your decision to come here?
your institution comparison group■ somewhat important ■ somewhat important■ very important ■ very important
This college's graduates gain
admission to top graduate/professi
onal schools
This college's graduates get
good jobs
I was attracted by the religious affiliation/orient
ation of the college
I wanted to go to a school
about the size of this college
Rankings in national
magazines
Return to contents
2010 CIRP Freshman SurveyHigher Education Research Institute 66
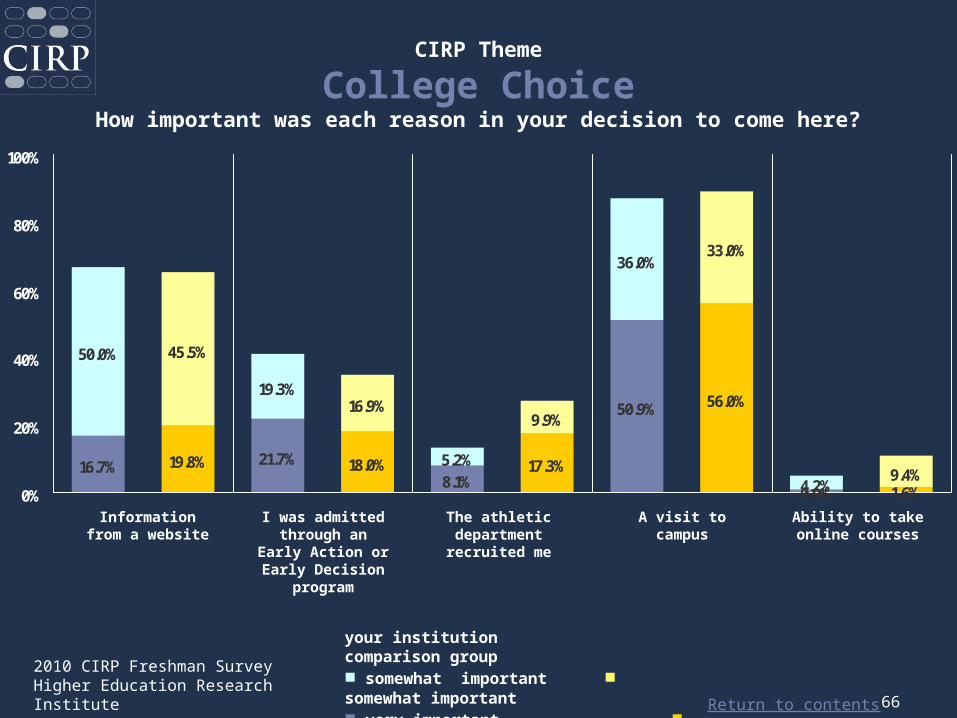
16.7% 19.8% 18.0%8.1%
17.3%
50.9% 56.0%
0.9% 1.6%
45.5%
19.3%16.9%
5.2%
9.9%
36.0%33.0%
4.2%9.4%
21.7%
50.0%
0%
20%
40%
60%
80%
100%
CIRP Theme
College ChoiceHow important was each reason in your decision to come here?
your institution comparison group■ somewhat important ■ somewhat important■ very important ■ very important
Information from a website
I was admitted through an
Early Action or Early Decision
program
The athletic department recruited me
A visit to campus
Ability to take online courses

Return to contents
2010 CIRP Freshman SurveyHigher Education Research Institute 67
None
Less than
$1,000
$1,000 to
$2,999
$3,000 to
$5,999
$6,000 to
$9,999
$10,000+
Family resources (parents, relatives, spouse, etc.) your institution
26.6% 11.4% 13.1% 10.9% 15.7% 22.3%
comparison group14.3
% 8.6% 10.1% 11.8% 12.1% 43.2%
My own resources (savings from work, work-study, other income) your institution
29.7% 23.6% 28.8% 11.8% 3.1% 3.1%
comparison group32.7
% 25.0% 25.4% 9.8% 3.7% 3.4%
Aid which need not be repaid (grants, scholarships, military funding, etc.) your institution
20.5% 1.7% 5.2% 8.3% 16.6% 47.6%
comparison group17.6
% 2.4% 5.9% 8.7% 10.0% 55.4%
Aid which must be repaid (loans, etc.) your institution
38.9% 2.2% 9.2% 17.5% 17.5% 14.8%
comparison group40.9
% 2.7% 9.4% 18.6% 12.7% 15.8%
Other than above your institution
93.9% 3.1% 0.9% 0.9% 1.3% 0.0%
comparison group93.0
% 2.4% 1.6% 1.0% 0.7% 1.4%
CIRP Theme
Financing CollegeHow much of your first year’s educational expenses do you expect to cover
from each of the sources listed below?
Return to contents
2010 CIRP Freshman SurveyHigher Education Research Institute 68
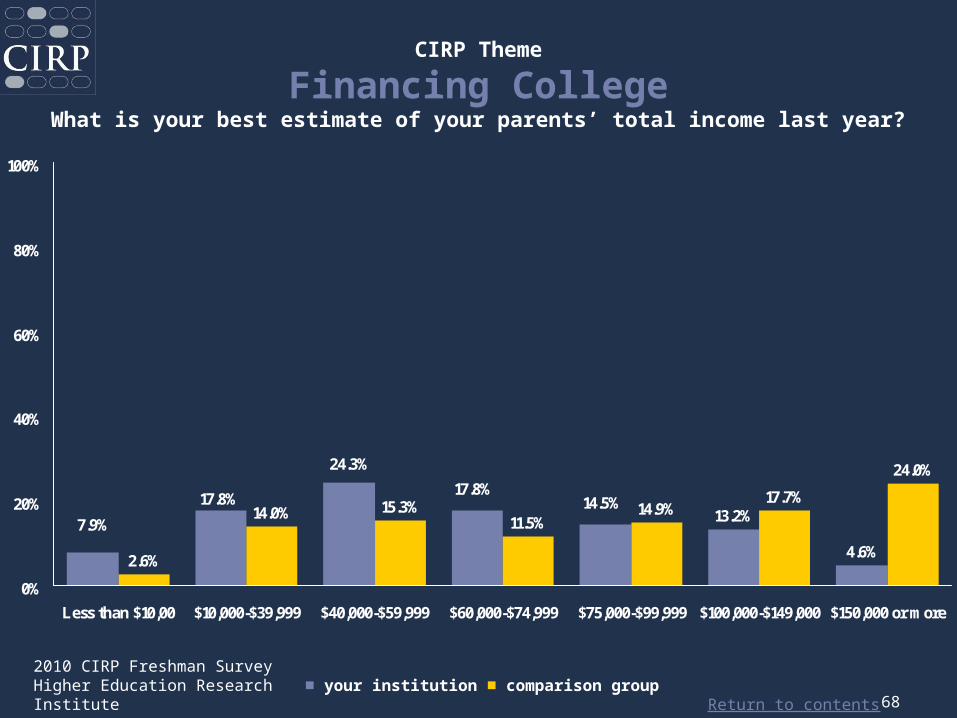
■ your institution ■ comparison group
13.2%
4.6%2.6%
14.0% 15.3%11.5%
14.9%17.7%
24.0%17.8%
14.5%
24.3%
7.9%
17.8%
0%
20%
40%
60%
80%
100%
Less than $10,00 $10,000-$39,999 $40,000-$59,999 $60,000-$74,999 $75,000-$99,999 $100,000-$149,000 $150,000 or more
CIRP Theme
Financing CollegeWhat is your best estimate of your parents’ total income last year?

Return to contents
2010 CIRP Freshman SurveyHigher Education Research Institute 69
■ your institution ■ comparison group
9.8%
55.0%
35.1%
20.6%
10.3%
69.1%
0%
20%
40%
60%
80%
100%
Major Some None
CIRP Theme
Financing CollegeLevel of Concern About Ability to Finance College Education
Return to contents
2010 CIRP Freshman SurveyHigher Education Research Institute 70
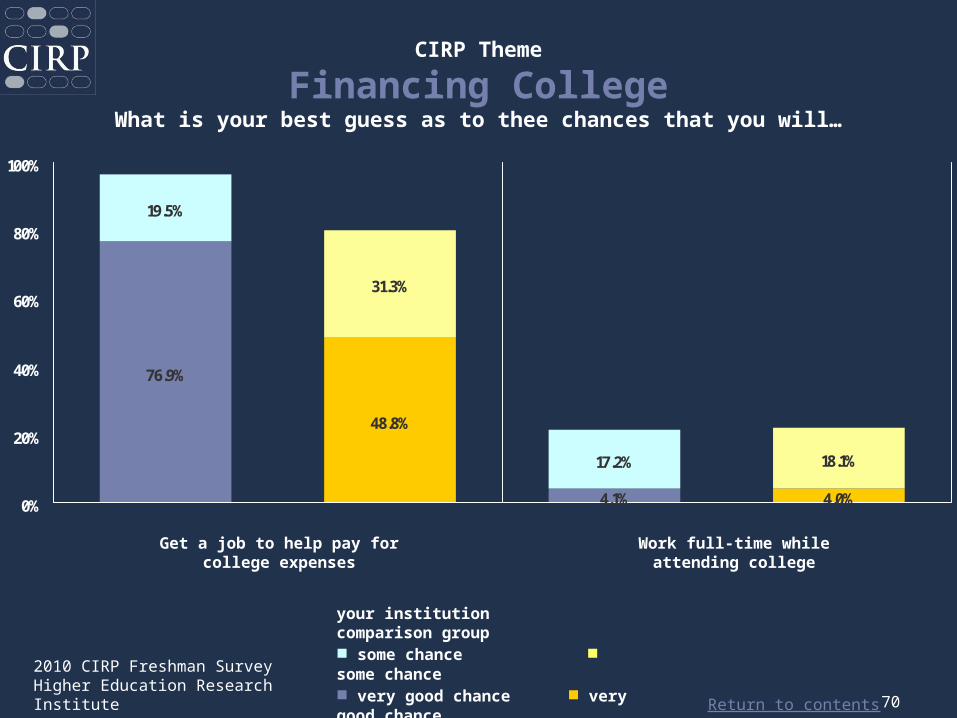
your institution comparison group■ some chance ■ some chance■ very good chance ■ very good chance
76.9%
48.8%
4.0%
31.3%
17.2% 18.1%
4.1%
19.5%
0%
20%
40%
60%
80%
100%
Get a job to help pay for college expenses
Work full-time while attending college
CIRP Theme
Financing CollegeWhat is your best guess as to thee chances that you will…
Return to contents
2010 CIRP Freshman SurveyHigher Education Research Institute 71
Career Planning

Return to contents
2010 CIRP Freshman SurveyHigher Education Research Institute 72
Your Institution
Comparison Group
None 0.6% 0.9%
Vocational certificate 0.0% 0.1%
Associate (A.A. or equivalent)
1.1% 0.4%
Bachelor's degree (B.A., B.S., etc.)
23.0% 18.4%
Master's degree (M.A., M.S., etc.)
48.3% 41.1%
Ph.D. or Ed.D. 19.5% 20.9%
M.D., D.O., D.D.S., D.V.M. 5.7% 10.6%
J.D. (Law) 1.1% 5.1%
B.D. or M.DIV. (Divinity) 0.0% 0.5%
Other 0.6% 2.0%
CIRP Theme
Career PlanningHighest Degree Planned to Obtain
Return to contents
2010 The Freshman SurveyHigher Education Research Institute 73
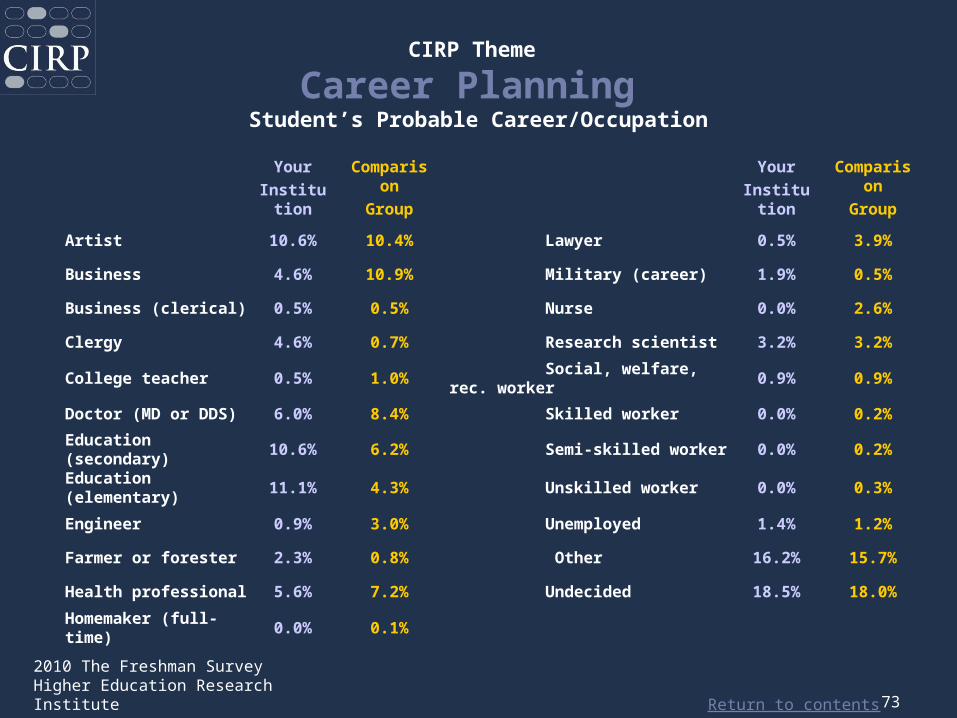
CIRP Theme
Career Planning Student’s Probable Career/Occupation
YourInstitut
ion
Comparison
Group
YourInstitut
ion
Comparison
Group
Artist 10.6% 10.4% Lawyer 0.5% 3.9%
Business 4.6% 10.9% Military (career) 1.9% 0.5%
Business (clerical) 0.5% 0.5% Nurse 0.0% 2.6%
Clergy 4.6% 0.7% Research scientist 3.2% 3.2%
College teacher 0.5% 1.0% Social, welfare, rec. worker
0.9% 0.9%
Doctor (MD or DDS)
6.0% 8.4% Skilled worker 0.0% 0.2%
Education (secondary)
10.6% 6.2% Semi-skilled worker 0.0% 0.2%
Education (elementary)
11.1% 4.3% Unskilled worker 0.0% 0.3%
Engineer 0.9% 3.0% Unemployed 1.4% 1.2%
Farmer or forester 2.3% 0.8% Other 16.2% 15.7%
Health professional 5.6% 7.2% Undecided 18.5% 18.0%
Homemaker (full-time)
0.0% 0.1%
Return to contents
2010 The Freshman SurveyHigher Education Research Institute 74
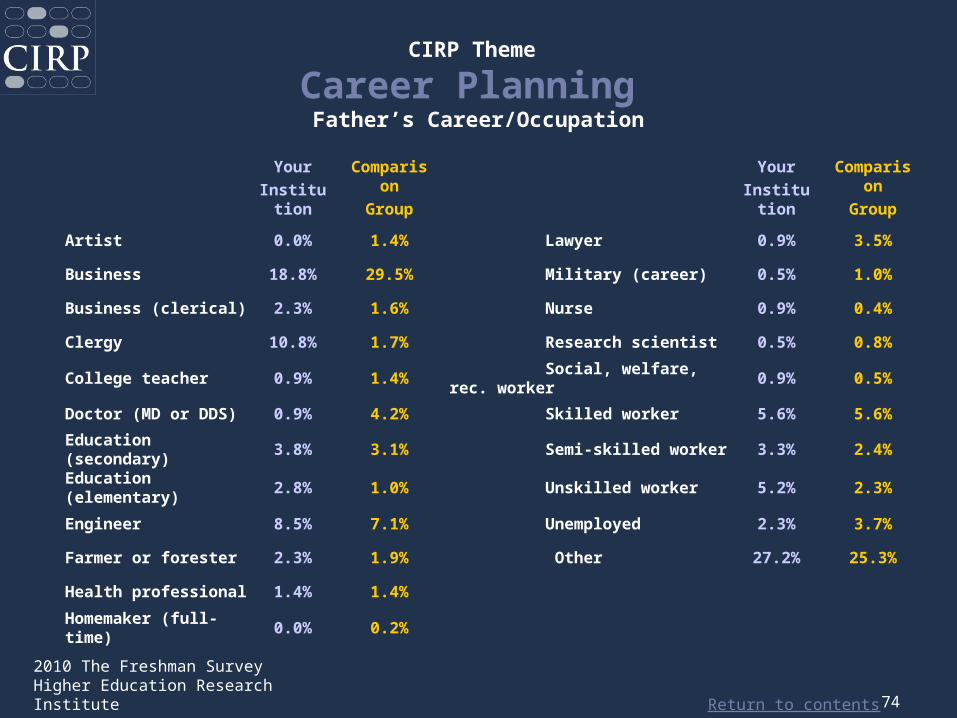
CIRP Theme
Career Planning Father’s Career/Occupation
YourInstitut
ion
Comparison
Group
YourInstitut
ion
Comparison
Group
Artist 0.0% 1.4% Lawyer 0.9% 3.5%
Business 18.8% 29.5% Military (career) 0.5% 1.0%
Business (clerical) 2.3% 1.6% Nurse 0.9% 0.4%
Clergy 10.8% 1.7% Research scientist 0.5% 0.8%
College teacher 0.9% 1.4% Social, welfare, rec. worker
0.9% 0.5%
Doctor (MD or DDS)
0.9% 4.2% Skilled worker 5.6% 5.6%
Education (secondary)
3.8% 3.1% Semi-skilled worker 3.3% 2.4%
Education (elementary)
2.8% 1.0% Unskilled worker 5.2% 2.3%
Engineer 8.5% 7.1% Unemployed 2.3% 3.7%
Farmer or forester 2.3% 1.9% Other 27.2% 25.3%
Health professional 1.4% 1.4%
Homemaker (full-time)
0.0% 0.2%
Return to contents
2010 The Freshman SurveyHigher Education Research Institute 75
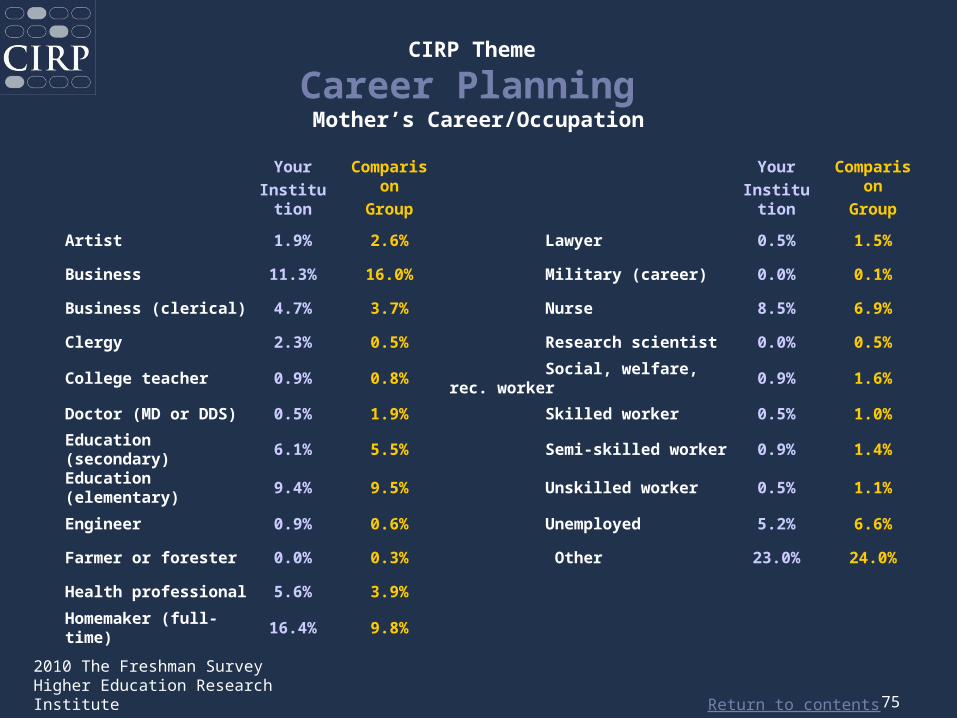
CIRP Theme
Career Planning Mother’s Career/Occupation
YourInstitut
ion
Comparison
Group
YourInstitut
ion
Comparison
Group
Artist 1.9% 2.6% Lawyer 0.5% 1.5%
Business 11.3% 16.0% Military (career) 0.0% 0.1%
Business (clerical) 4.7% 3.7% Nurse 8.5% 6.9%
Clergy 2.3% 0.5% Research scientist 0.0% 0.5%
College teacher 0.9% 0.8% Social, welfare, rec. worker
0.9% 1.6%
Doctor (MD or DDS)
0.5% 1.9% Skilled worker 0.5% 1.0%
Education (secondary)
6.1% 5.5% Semi-skilled worker 0.9% 1.4%
Education (elementary)
9.4% 9.5% Unskilled worker 0.5% 1.1%
Engineer 0.9% 0.6% Unemployed 5.2% 6.6%
Farmer or forester 0.0% 0.3% Other 23.0% 24.0%
Health professional 5.6% 3.9%
Homemaker (full-time)
16.4% 9.8%
Return to contents
2010 CIRP Freshman SurveyHigher Education Research Institute 76
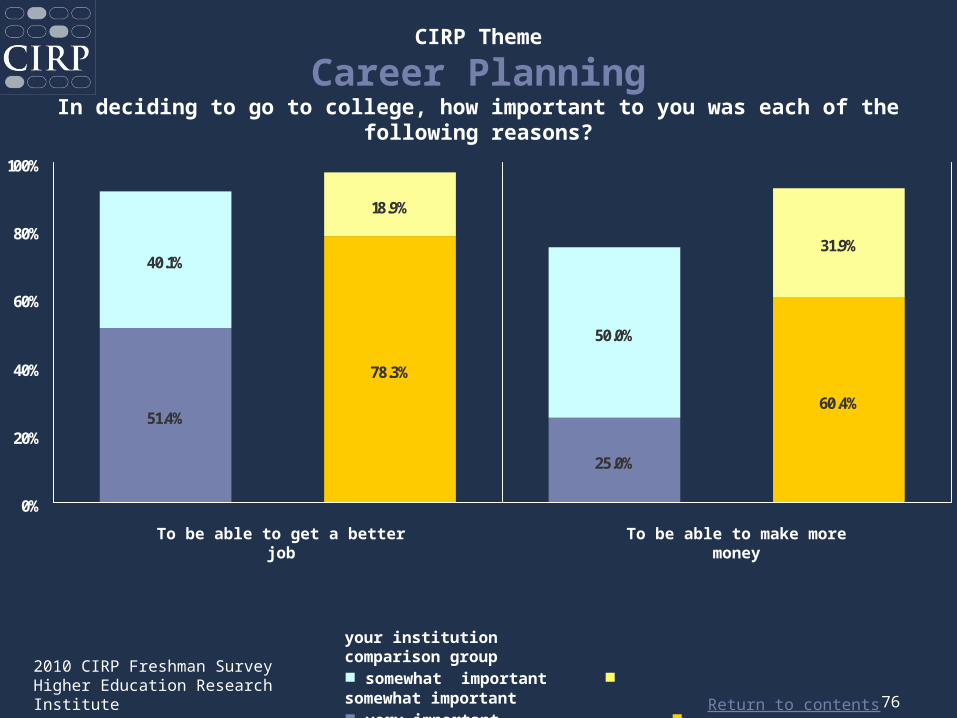
51.4%
78.3%
60.4%
18.9%
50.0%
31.9%
25.0%
40.1%
0%
20%
40%
60%
80%
100%
To be able to get a better job
To be able to make more money
CIRP Theme
Career PlanningIn deciding to go to college, how important to you was each of the following
reasons?
your institution comparison group■ somewhat important ■ somewhat important■ very important ■ very important
Return to contents
2010 CIRP Freshman SurveyHigher Education Research Institute 77
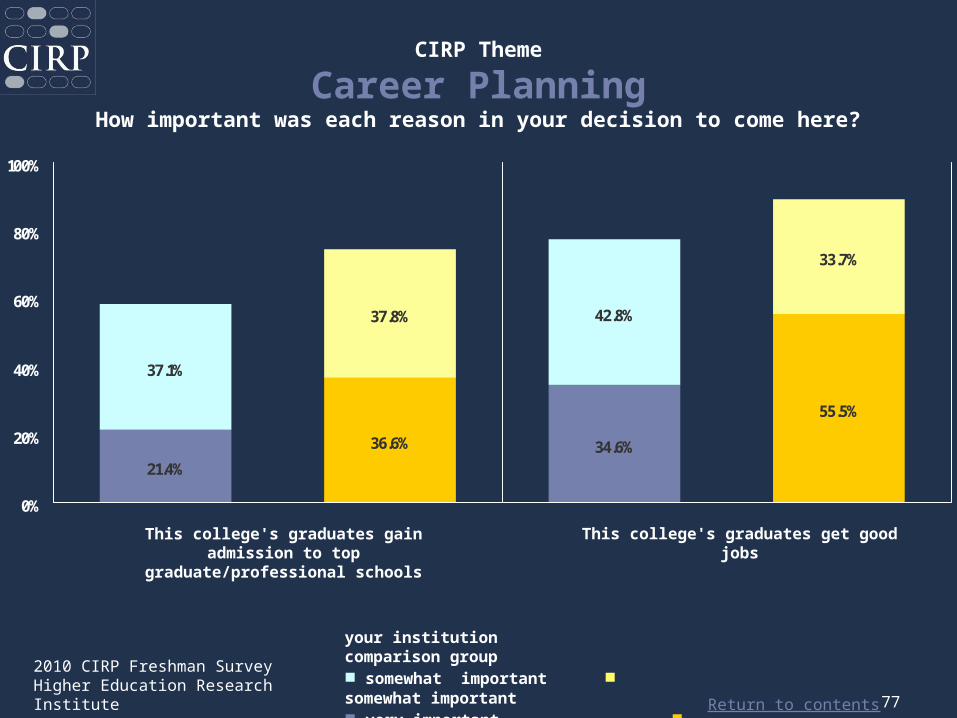
21.4%
36.6%
55.5%
37.8% 42.8%
33.7%
34.6%
37.1%
0%
20%
40%
60%
80%
100%
your institution comparison group■ somewhat important ■ somewhat important■ very important ■ very important
This college's graduates gain admission to top
graduate/professional schools
This college's graduates get good jobs
CIRP Theme
Career PlanningHow important was each reason in your decision to come here?
Return to contents
2010 CIRP Freshman SurveyHigher Education Research Institute 78
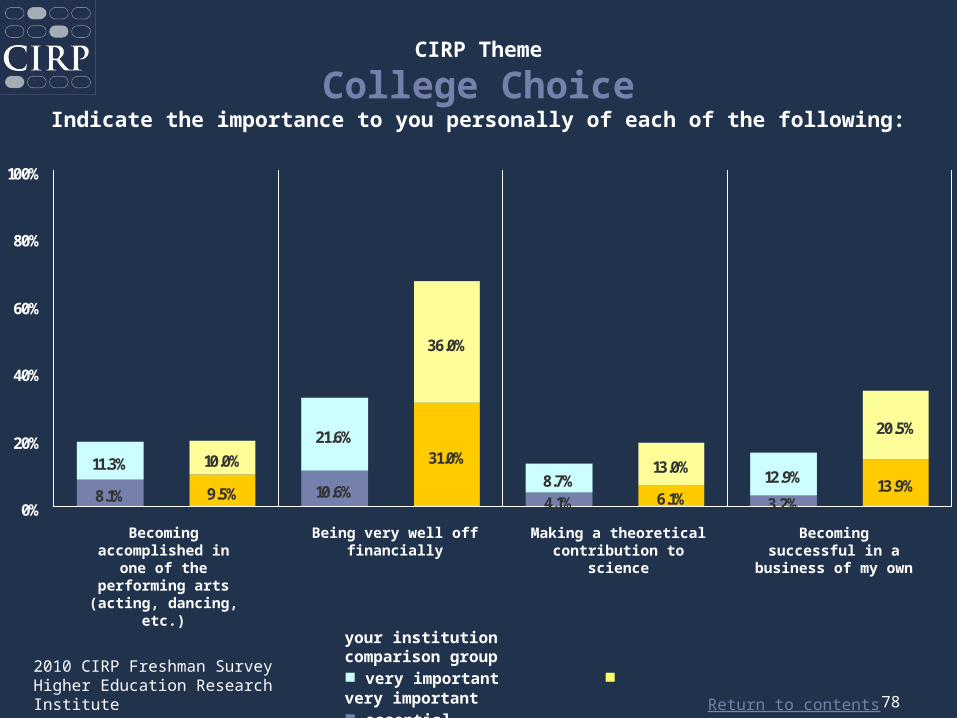
8.1% 9.5%
31.0%
4.1% 6.1% 3.2%13.9%
10.0%
21.6%
36.0%
8.7%13.0%
12.9%
20.5%
10.6%
11.3%
0%
20%
40%
60%
80%
100%
CIRP Theme
College ChoiceIndicate the importance to you personally of each of the following:
Becoming accomplished in
one of the performing arts (acting, dancing,
etc.)
Being very well off financially
Making a theoretical contribution to
science
Becoming successful in a
business of my own
your institution comparison group■ very important ■ very important■ essential ■ essential
Return to contents
2010 CIRP Freshman SurveyHigher Education Research Institute 79
■ your institution ■ comparison group
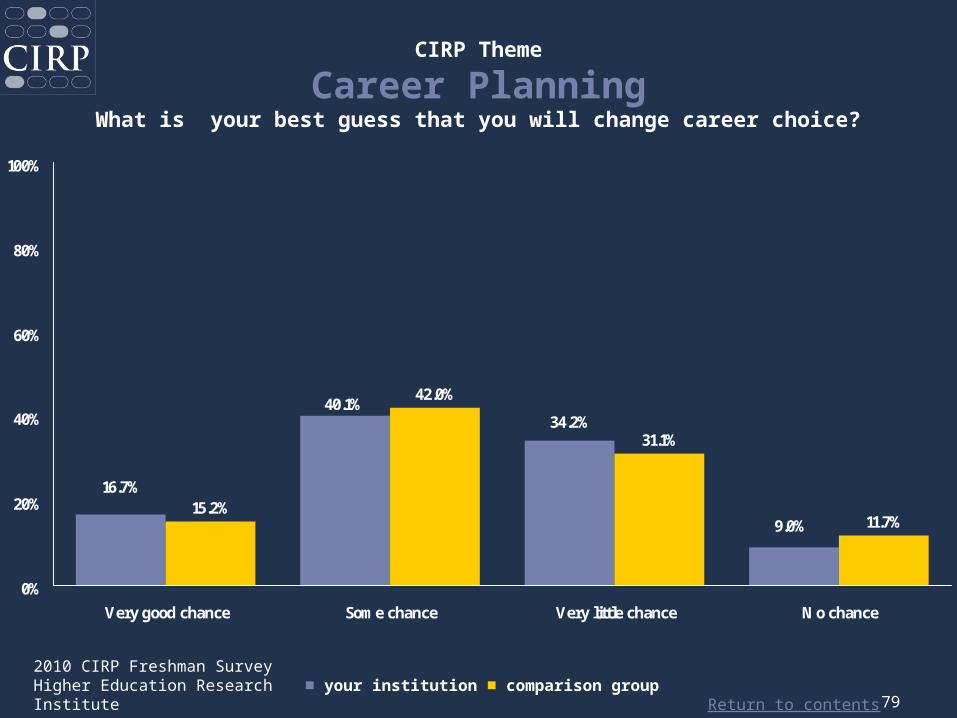
15.2%
42.0%
31.1%
11.7%9.0%
34.2%
16.7%
40.1%
0%
20%
40%
60%
80%
100%
Very good chance Some chance Very little chance No chance
CIRP Theme
Career PlanningWhat is your best guess that you will change career choice?
Return to contents
2010 CIRP Freshman SurveyHigher Education Research Institute 80
Health and Wellness
Return to contents
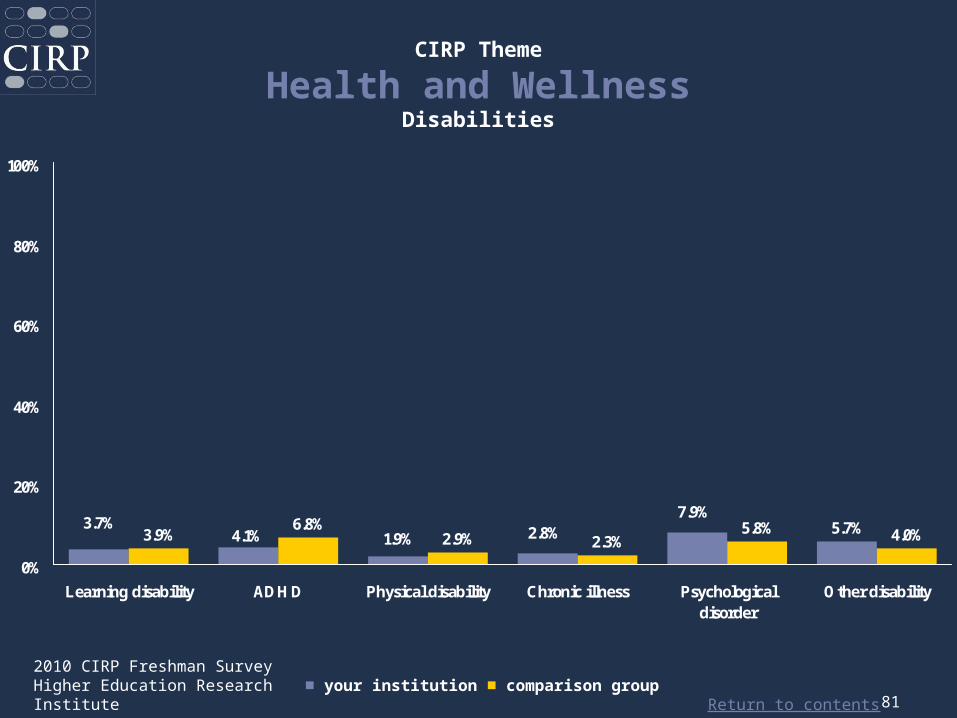
2010 CIRP Freshman SurveyHigher Education Research Institute 81
■ your institution ■ comparison group
5.7%3.9%6.8%
2.9% 2.3%5.8% 4.0%2.8%
7.9%
1.9%3.7%
4.1%
0%
20%
40%
60%
80%
100%
Learning disability ADHD Physical disability Chronic illness Psychologicaldisorder
Other disability
CIRP Theme
Health and WellnessDisabilities
Return to contents
2010 CIRP Freshman SurveyHigher Education Research Institute 82
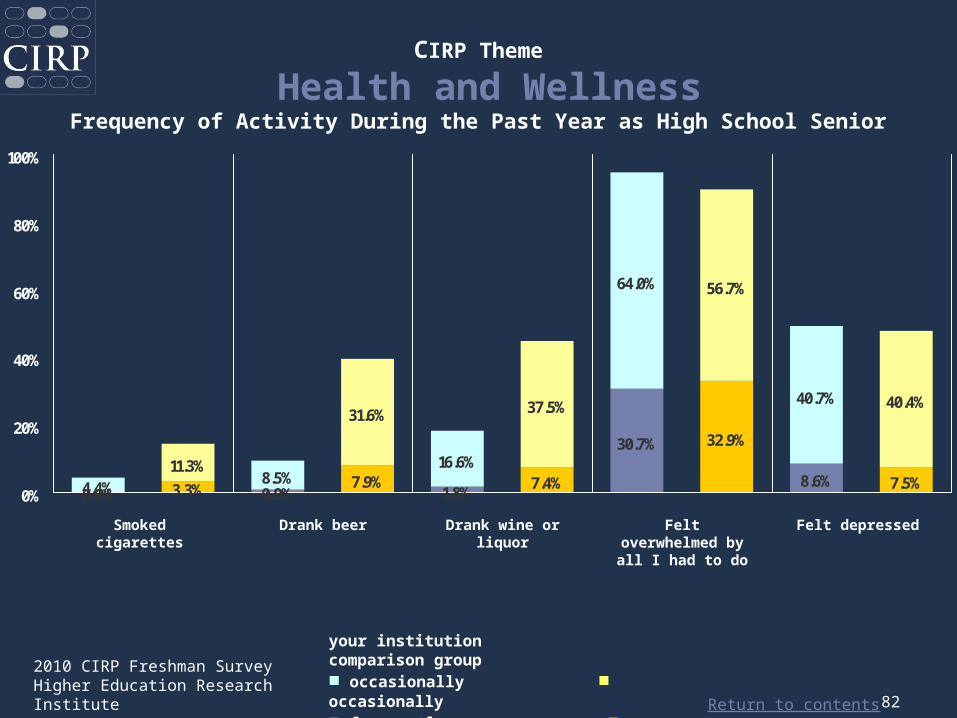
0.0% 3.3% 7.9%1.8%
7.4%
30.7% 32.9%
8.6% 7.5%11.3%
8.5%
31.6%
16.6%
37.5%
64.0% 56.7%
40.7% 40.4%
0.9%4.4%0%
20%
40%
60%
80%
100%
Smoked cigarettes
Drank beer Drank wine or liquor
Felt overwhelmed by all I had to do
Felt depressed
CIRP Theme
Health and WellnessFrequency of Activity During the Past Year as High School Senior
your institution comparison group■ occasionally ■ occasionally■ frequently ■ frequently
Return to contents
2010 CIRP Freshman SurveyHigher Education Research Institute 83
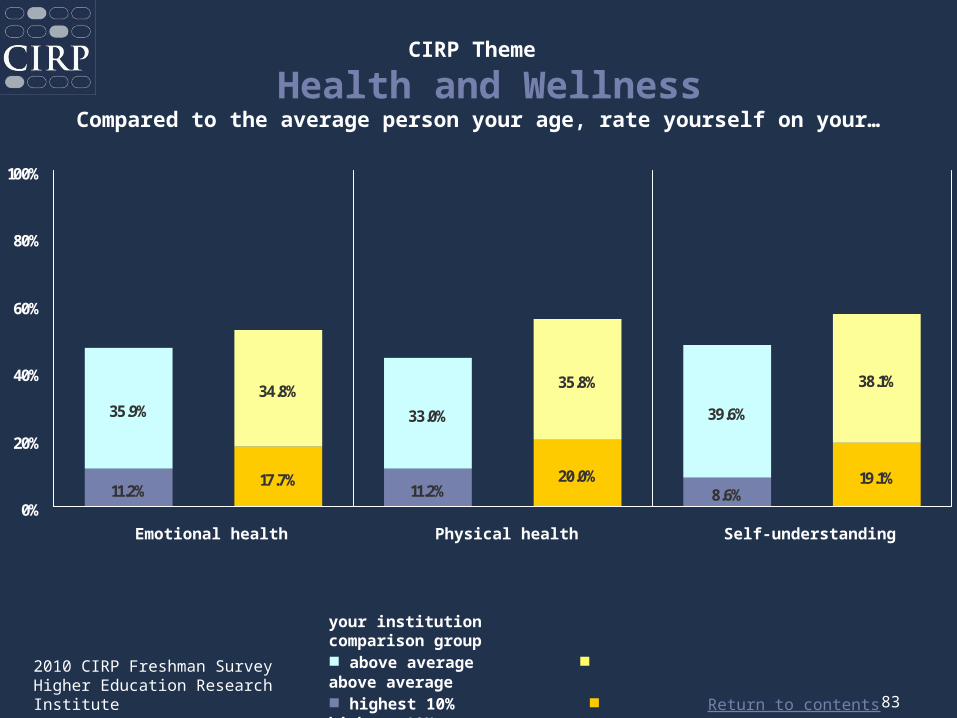
11.2%17.7% 20.0%
8.6%19.1%
34.8%
33.0%
35.8%
39.6%
38.1%
11.2%
35.9%
0%
20%
40%
60%
80%
100%
CIRP Theme
Health and WellnessCompared to the average person your age, rate yourself on your…
Emotional health Physical health Self-understanding
your institution comparison group■ above average ■ above average■ highest 10% ■ highest 10%
Return to contents
2010 CIRP Freshman SurveyHigher Education Research Institute 84
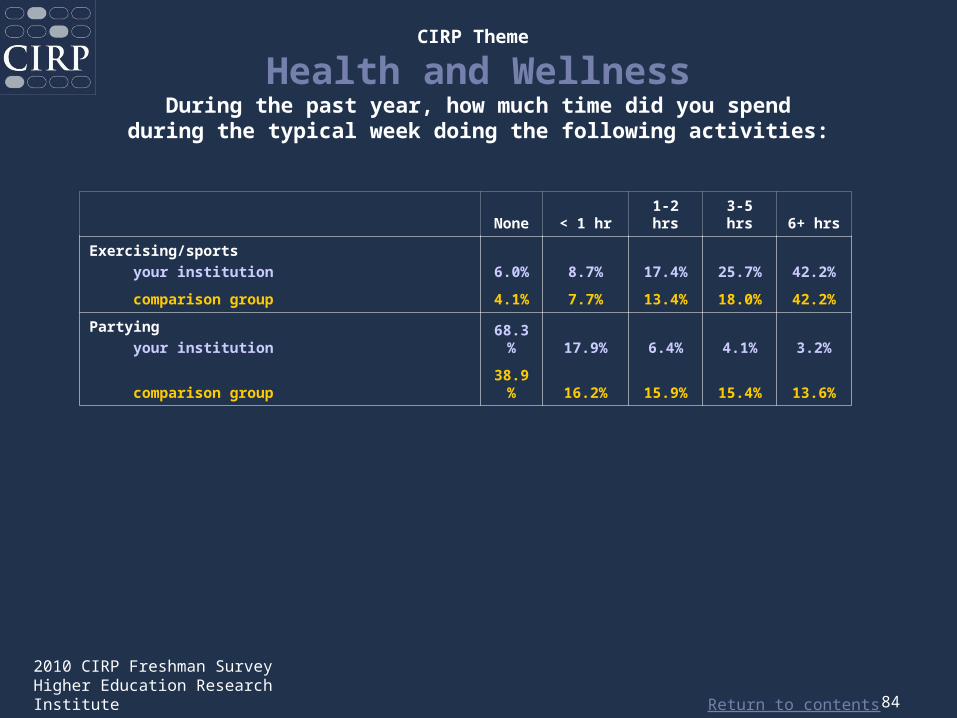
None < 1 hr1-2 hrs
3-5 hrs 6+ hrs
Exercising/sports your institution 6.0% 8.7% 17.4% 25.7% 42.2%
comparison group 4.1% 7.7% 13.4% 18.0% 42.2%
Partying your institution
68.3% 17.9% 6.4% 4.1% 3.2%
comparison group38.9
% 16.2% 15.9% 15.4% 13.6%
CIRP Theme
Health and WellnessDuring the past year, how much time did you spend
during the typical week doing the following activities:
Return to contents
2010 CIRP Freshman SurveyHigher Education Research Institute 85
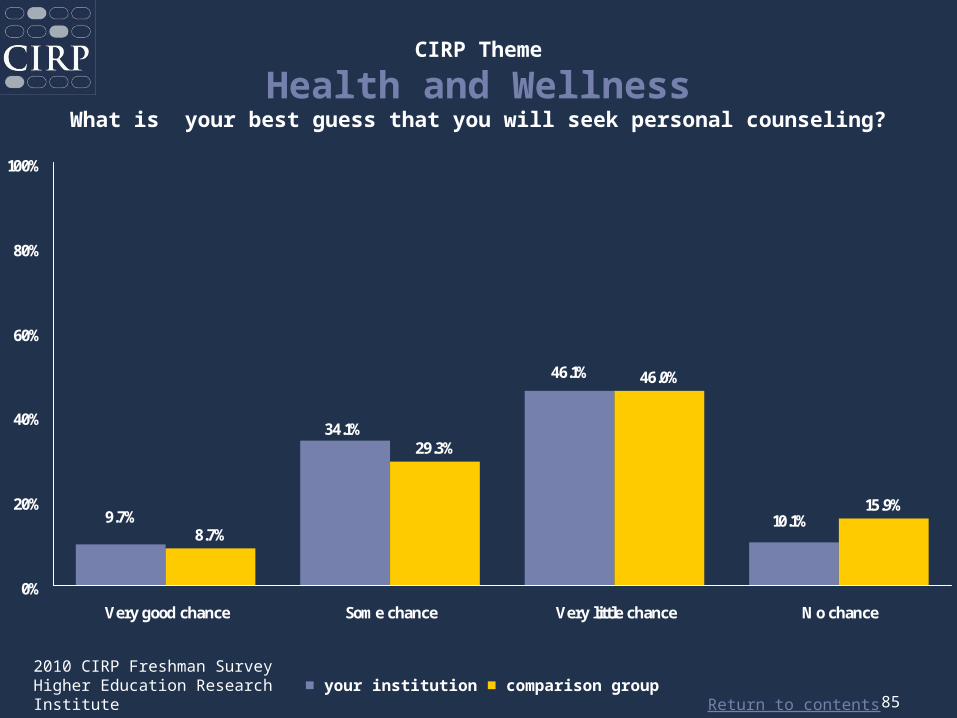
■ your institution ■ comparison group
8.7%
29.3%
46.0%
15.9%10.1%
46.1%
9.7%
34.1%
0%
20%
40%
60%
80%
100%
Very good chance Some chance Very little chance No chance
CIRP Theme
Health and WellnessWhat is your best guess that you will seek personal counseling?
Return to contents
2010 CIRP Freshman SurveyHigher Education Research Institute 86
Religiosity / Spirituality

Return to contents
2010 The Freshman SurveyHigher Education Research Institute 87
YourInstitut
ion
Comparison
Group
YourInstitut
ion
Comparison
Group
Baptist 20.3% 9.6% Muslim 0.0% 0.6%
Buddhist 0.0% 0.7% Presbyterian 5.4% 5.4%
Church of Christ 1.8% 3.3% Quaker 0.0% 0.4%
Eastern Orthodox 0.0% 0.5% Roman Catholic 1.8% 18.2%
Episcopalian 1.8% 2.7% Seventh Day Adventist 0.0% 0.2%
Hindu 0.0% 0.3% United Church of Christ/Congregational
1.4% 1.1%
Jewish 0.0% 2.3% Other Christian 53.2% 17.4%
LDS (Mormon) 0.0% 0.2% Other Religion 1.4% 3.2%
Lutheran 2.3% 8.4% None 3.2% 19.7%
Methodist 7.7% 5.9%
CIRP Theme
Religiosity/Spirituality Student’s current religious preference:
Return to contents
2010 The Freshman SurveyHigher Education Research Institute 88
YourInstitut
ion
Comparison
Group
YourInstitut
ion
Comparison
Group
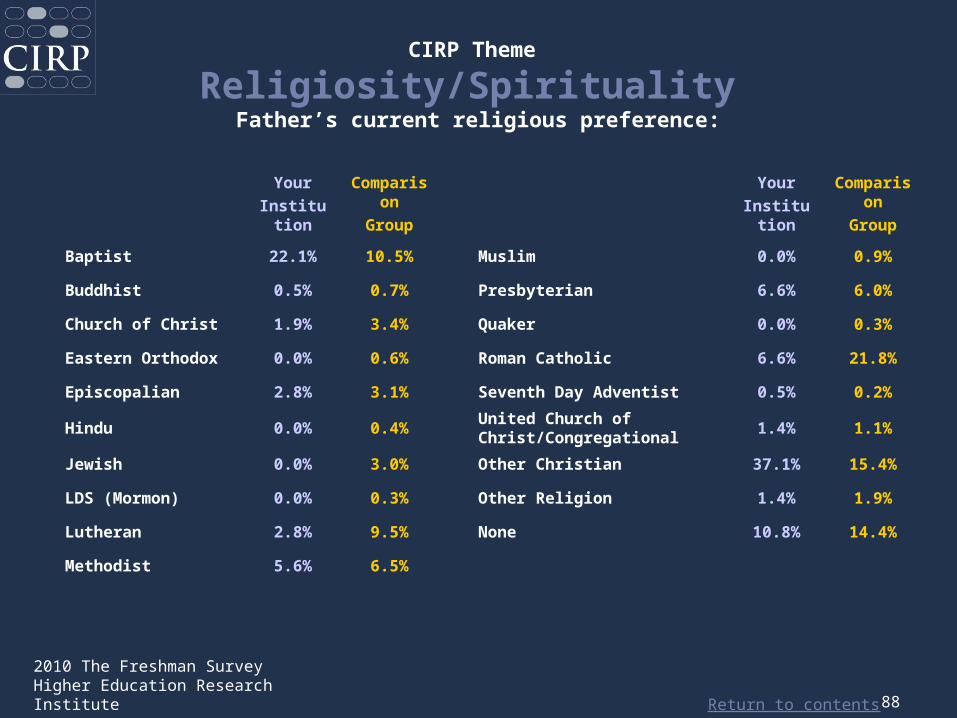
Baptist 22.1% 10.5% Muslim 0.0% 0.9%
Buddhist 0.5% 0.7% Presbyterian 6.6% 6.0%
Church of Christ 1.9% 3.4% Quaker 0.0% 0.3%
Eastern Orthodox 0.0% 0.6% Roman Catholic 6.6% 21.8%
Episcopalian 2.8% 3.1% Seventh Day Adventist 0.5% 0.2%
Hindu 0.0% 0.4% United Church of Christ/Congregational
1.4% 1.1%
Jewish 0.0% 3.0% Other Christian 37.1% 15.4%
LDS (Mormon) 0.0% 0.3% Other Religion 1.4% 1.9%
Lutheran 2.8% 9.5% None 10.8% 14.4%
Methodist 5.6% 6.5%
CIRP Theme
Religiosity/Spirituality Father’s current religious preference:
Return to contents
2010 The Freshman SurveyHigher Education Research Institute 89
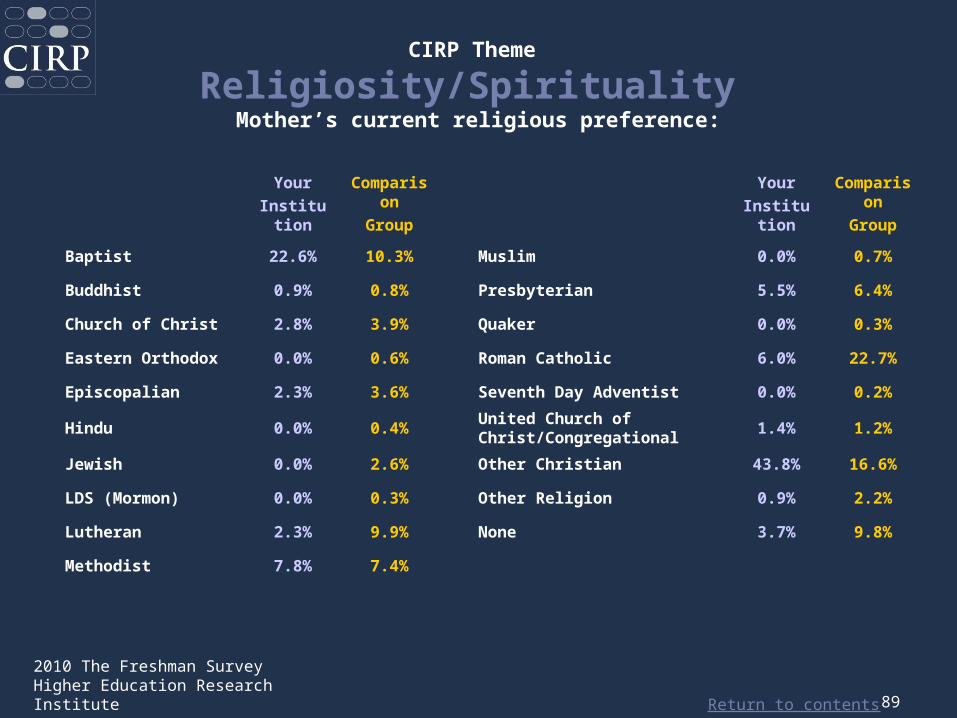
YourInstitut
ion
Comparison
Group
YourInstitut
ion
Comparison
Group
Baptist 22.6% 10.3% Muslim 0.0% 0.7%
Buddhist 0.9% 0.8% Presbyterian 5.5% 6.4%
Church of Christ 2.8% 3.9% Quaker 0.0% 0.3%
Eastern Orthodox 0.0% 0.6% Roman Catholic 6.0% 22.7%
Episcopalian 2.3% 3.6% Seventh Day Adventist 0.0% 0.2%
Hindu 0.0% 0.4% United Church of Christ/Congregational
1.4% 1.2%
Jewish 0.0% 2.6% Other Christian 43.8% 16.6%
LDS (Mormon) 0.0% 0.3% Other Religion 0.9% 2.2%
Lutheran 2.3% 9.9% None 3.7% 9.8%
Methodist 7.8% 7.4%
CIRP Theme
Religiosity/Spirituality Mother’s current religious preference:
Return to contents
2010 CIRP Freshman SurveyHigher Education Research Institute 90
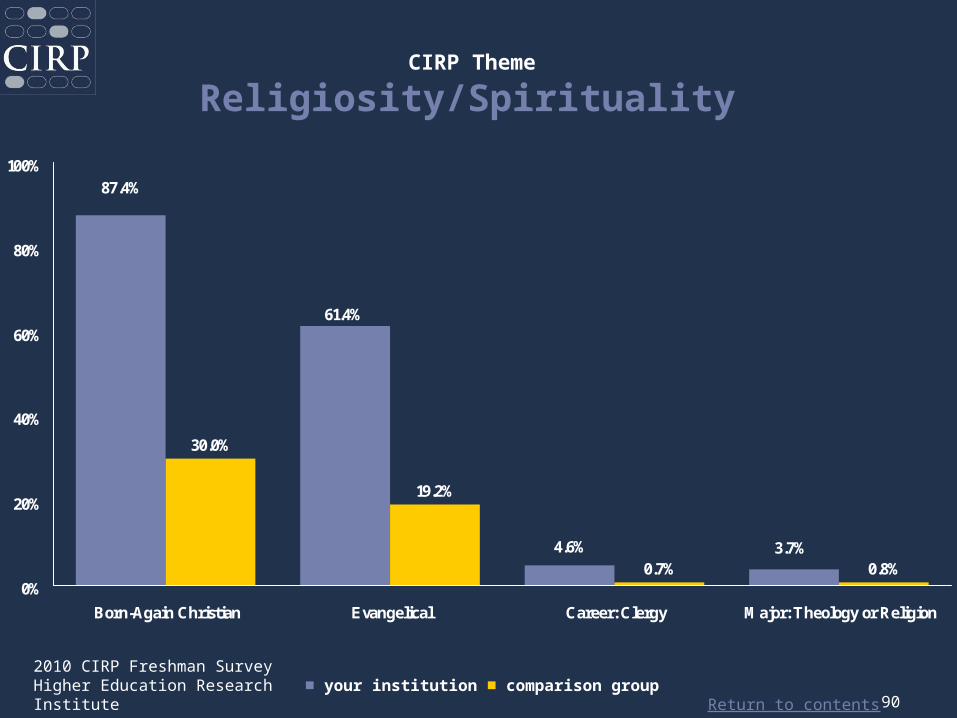
■ your institution ■ comparison group
30.0%
19.2%
0.7% 0.8%3.7%4.6%
87.4%
61.4%
0%
20%
40%
60%
80%
100%
Born-Again Christian Evangelical Career: Clergy Major: Theology or Religion
CIRP Theme
Religiosity/Spirituality
Return to contents
2010 CIRP Freshman SurveyHigher Education Research Institute 91
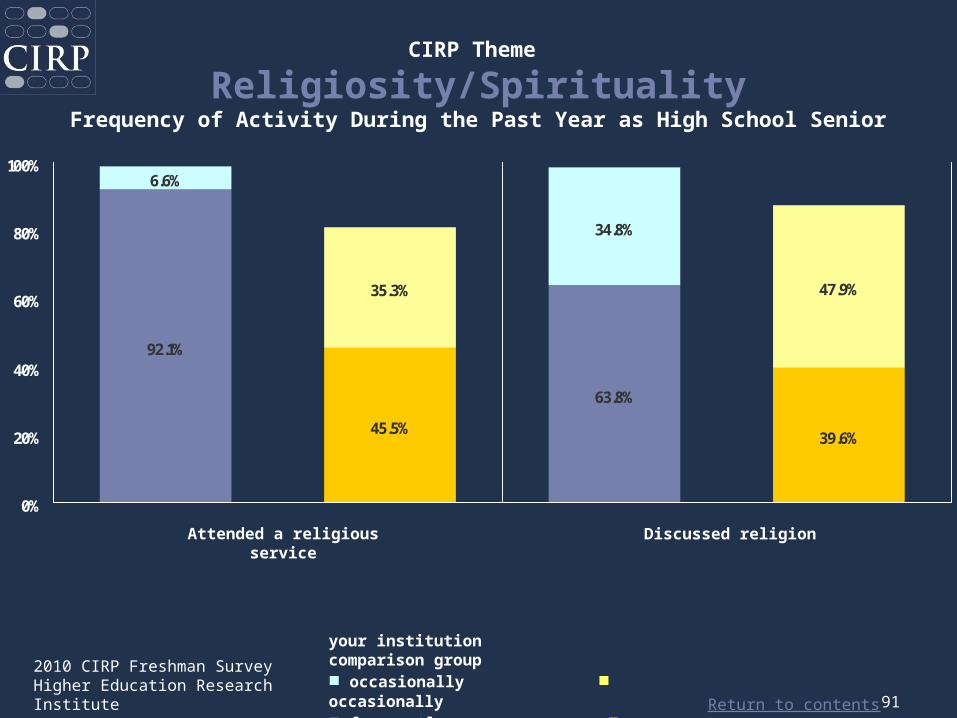
92.1%
45.5%39.6%
35.3%
34.8%
47.9%
63.8%
6.6%
0%
20%
40%
60%
80%
100%
Attended a religious service
Discussed religion
CIRP Theme
Religiosity/SpiritualityFrequency of Activity During the Past Year as High School Senior
your institution comparison group■ occasionally ■ occasionally■ frequently ■ frequently

Return to contents
2010 CIRP Freshman SurveyHigher Education Research Institute 92
■ your institution ■ comparison group
13.8%
27.6%
35.1%
15.3%
8.1%4.1%0.9%
31.1%
21.2%
42.8%
0%
20%
40%
60%
80%
100%
Highest 10% Above Average Average Below Average Lowest 10%
CIRP Theme
Religiosity/SpiritualitySelf-Rating – “Spirituality”
Return to contents
2010 CIRP Freshman SurveyHigher Education Research Institute 93
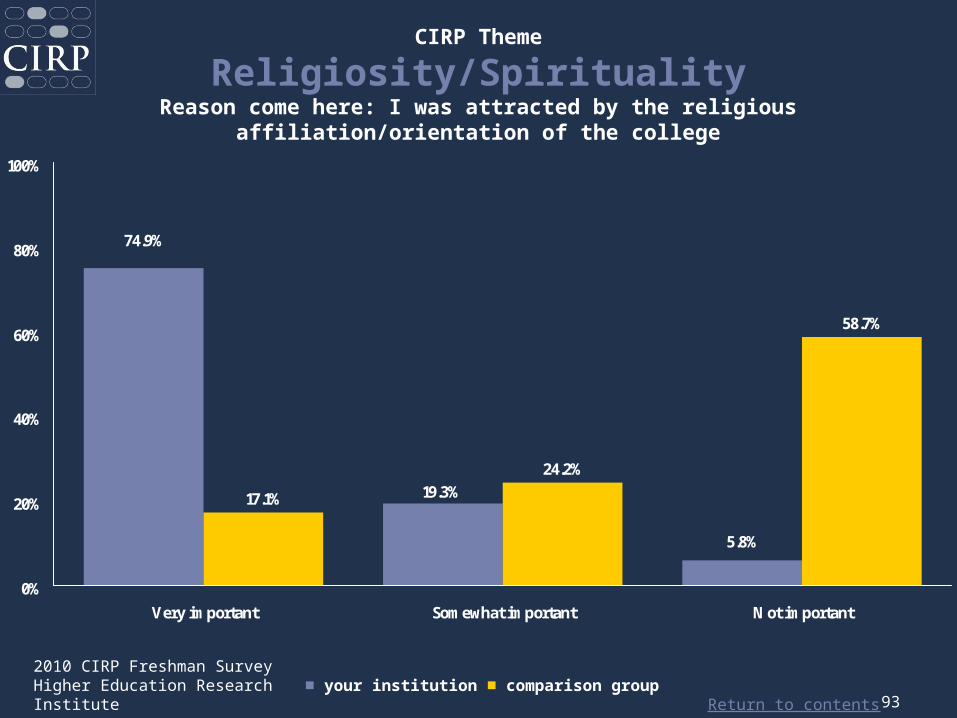
■ your institution ■ comparison group
17.1%
24.2%
58.7%
5.8%
74.9%
19.3%
0%
20%
40%
60%
80%
100%
Very important Somewhat important Not important
CIRP Theme
Religiosity/SpiritualityReason come here: I was attracted by the religious affiliation/orientation of
the college

Return to contents
2010 CIRP Freshman SurveyHigher Education Research Institute 94
■ your institution ■ comparison group
21.0%
29.4% 31.6%
18.0%
22.9%
29.9%
21.5% 25.7%
0%
20%
40%
60%
80%
100%
Essential Very important Somewhat important Not important
CIRP Theme
Religiosity/SpiritualityHow important is it to you to develop a meaningful philosophy of life?

Return to contents
2010 CIRP Freshman SurveyHigher Education Research Institute 95
For more information about HERI/CIRP Surveys
The Freshmen SurveyYour First College Year Survey
Diverse Learning Environments Survey (new Spring 2011)
College Senior SurveyThe Faculty Survey
[email protected](310) 825-1925
www.heri.ucla.edu