Embed Size (px)
Citation preview

CANADIAN ICE SERVICE DIGITAL ARCHIVE – REGIONAL CHARTS:
HISTORY, ACCURACY, AND CAVEATS
CIS Archive Documentation Series No. 1
September 2006

CISDA – Regional Charts: History, Accuracy, and Caveats
PAGE LEFT INTENTIONALLY BLANK
ii
CISDA – Regional Charts: History, Accuracy, and Caveats
REVISION HISTORY
March 2000 • Original document (English only) “Documentation for the Canadian
Ice Service Digital Sea Ice Database” written by Ballicater Consulting Ltd..
June 2005 • Section 3.6 “Items to Keep in Mind when Performing Statistical Ice
Analysis of Ice Charts” added as well as other minor edits and updates by CIS.
• Title changed to “The Canadian Ice Service Digital Charts Database - History of Data and Procedures Used in The Preparation of Regional Ice Charts”.
• Document was also translated in French. September 2006 • Minor changes to reflect new dataset name “CISDA – Regional
Charts” and formatted for CIS Digital Archive Series. • CIS URL updated in Bibliography section.
iii

CISDA – Regional Charts: History, Accuracy, and Caveats
PAGE LEFT INTENTIONALLY BLANK
iv

CISDA – Regional Charts: History, Accuracy, and Caveats
ACKNOWLEDGEMENTS
The original document titled “Documentation for the Canadian Ice Service Digital Sea Ice Database” was prepared as a contract report by Greg Crocker of Ballicater Consulting Ltd. for the Canadian Ice Service under the scientific authority of Tom Carrieres (Canadian Ice Service). The original document has been cited elsewhere as “Crocker and Carrieres, 2001”. Acknowledgment must be given to Greg Crocker of Ballicater Consulting Ltd. for the entirety of the research and subsequent document. The current document would not exist were it not for the focussed efforts of Mr. Crocker. In addition to this document, three companion documents were also prepared by Ballicater Consulting Ltd. for the Canadian Ice Service and include:
Crocker, G. 2000. The Canadian Ice Service digital sea ice database: assessment of trends in the Gulf of St. Lawrence and Beaufort Sea regions. Contract report for Canadian Ice Service, Environment Canada, Ballicater Consulting Ltd. Report Number 00-04, 145 pp.
Crocker, G. 2001. Factors influencing ice climate trends in the CIS database. Contract
report for Canadian Ice Service, Environment Canada, Ballicater Consulting Ltd. Report Number 01-02, 55 pp.
Crocker, G. 2002. Analysis of sea ice climate trends in Canadian waters. Contract report
for Canadian Ice Service, Environment Canada, Ballicater Consulting Ltd Report Number 01-04, 119 pp.
Credit must also be given to Katherine Wilson and Steve McCourt of CIS for the changes required to bring this document in its final state. Canadian Ice Service, September 2006.
v

CISDA – Regional Charts: History, Accuracy, and Caveats
PAGE LEFT INTENTIONALLY BLANK
vi

CISDA – Regional Charts: History, Accuracy, and Caveats
EXECUTIVE SUMMARY
The Canadian Ice Service, Environment Canada, has developed a digital database of sea ice information from its weekly regional ice charts. The digital database contains regional charts for the East Coast (1968 – 1998), Hudson Bay (1971 – 1998), Eastern Arctic (1968 – 1998), and Western Arctic (1968 – 1998). The charts incorporate information from many different sources and do not rely exclusively on a single sensor. They are very detailed and have a higher spatial resolution than many other sources of ice information. The knowledge and experience of the ice forecasters also plays an important in producing a high quality product. This experience is applied to the interpretation of remote and surface observations, bridging information gaps, identifying any problems or errors, and interpreting the available information in a geophysical context. The procedures used to produce the regional charts and the ice information available, have changed considerably over this period. It is believed that the charts produced in recent years are more reliable and more accurate than those produced in the 1960’s and 1970’s. The purpose of this report is to document the data and procedures used to develop the regional ice charts for the different regions, and for the time period covered in the digital database. In a subsequent CIS report, ice regime systems have been delineated and quality indices for each region have been assessed. Please see the documentation, CISADS No. 3 “CISDA – Regional Charts: Canadian Ice Service Ice Regime Regions (CISIRR) and Sub-regions with Associated Data Quality Indices”. A limitation of the dataset is its relatively short length. While 30-years is typical for many climate parameterizations, the decadal-scale cycles present in the ice signal, and the relatively high natural variability, make it difficult to extract patterns and trends. It should be noted that any comments or conclusions in this report do not constitute an unqualified endorsement of the CIS database for ice climate studies. The applicability of the database to a specific problem, and the quality of the results, will depend on the specific parameters used, the geographic location, the scale (both spatial and temporal), and the methodology used. If due care is taken to assess the reliability of the selected ice parameters and regions, then the Canadian Ice Service Digital Archive will be a valuable source of information for climate change studies. This report, the CISIRR report and discussions with CIS personnel can serve as valuable information sources in the assessment process. The database is currently updated in near-real-time and efforts being made to extend it by adding digitizing CIS Historical Charts (and other historical chart information). The database is maintained by the Canadian Ice Service and is available free of charge on CD or from the web to the scientific community. The data is stored as GIS polygon files or 0.25 degree Gridded data (see report CISADS No. 2: “CISDA – Regional Charts: Working With the Gridded Data, in NetCDF and Text Formats”).
vii

CISDA – Regional Charts: History, Accuracy, and Caveats
PAGE LEFT INTENTIONALLY BLANK
viii

CISDA – Regional Charts: History, Accuracy, and Caveats
TABLE OF CONTENTS
REVISION HISTORY............................................................................................................................................. III
ACKNOWLEDGEMENTS .......................................................................................................................................V
EXECUTIVE SUMMARY .....................................................................................................................................VII
1. INTRODUCTION..............................................................................................................................................1
2. DATABASE DOCUMENTATION ..................................................................................................................2 2.1 REGIONAL ICE CHARTS 1968 – PRESENT.....................................................................................................2 2.2 BRIEF CHRONOLOGY OF DATA ACQUISITION AND CHART PREPARATION PROCEDURES .............................2 2.3 SURFACE OBSERVATIONS............................................................................................................................8 2.4 AERIAL RECONNAISSANCE..........................................................................................................................8 2.5 SATELLITE RECONNAISSANCE...................................................................................................................12 2.6 CHART PREPARATION ...............................................................................................................................16 2.7 DATA AVAILABILITY AND NOW-CASTING REQUIREMENTS .......................................................................19
3. ACCURACY ....................................................................................................................................................24 3.1 OVERVIEW ................................................................................................................................................24 3.2 OBSERVATION ACCURACY........................................................................................................................25 3.3 MAPPING ACCURACY................................................................................................................................29 3.4 NOW-CASTING ACCURACY........................................................................................................................30 3.5 ICE CHARACTERISTICS ..............................................................................................................................32
3.5.1 Introduction .........................................................................................................................................32 3.5.2 Position................................................................................................................................................33 3.5.3 Concentration ......................................................................................................................................35 3.5.4 Stage of Development ..........................................................................................................................36 3.5.5 Floe Size ..............................................................................................................................................38
3.6 ITEMS TO KEEP IN MIND WHEN PERFORMING STATISTICAL ICE ANALYSIS OF ICE CHARTS...............................39 REFERENCES AND BIBLIOGRAPHY ................................................................................................................43
APPENDIX A: KEY DIFFERENCES BETWEEN THE RATIO AND EGG CODES
APPENDIX B: AVAILABILITY OF PRINCIPAL DATA SOURCES
APPENDIX C: SPECIFICATIONS OF PRINCIPAL SENSORS
ix

CISDA – Regional Charts: History, Accuracy, and Caveats
PAGE LEFT INTENTIONALLY BLANK
x

CISDA – Regional Charts: History, Accuracy, and Caveats
1. INTRODUCTION
The Canadian Ice Service, Environment Canada, has developed a digital database of sea ice
information from its weekly regional ice charts. The data is originally contained in a Geographic
Information System (GIS). The digital data base contains regional charts for the East Coast
(1968 – 1998), Hudson Bay (1971 – 1998), Eastern Arctic (1968 – 1998), and Western Arctic
(1968 – 1998). The hard copy charts are at 1:4 million scale and were produced from the daily
ice charts which contain slightly more detailed information (1:2 million scale). The maps are in
the Lambert projection, based on the Clarke 1866 spheroid and NAD27 datum. The central
meridian is 100° W, and the latitude of the projection origin is 40° N. More detailed information
on the map projection is contained in the database.
Each digital chart contains all of the information contained in the ‘egg code’, split into individual
fields for each egg attribute. The database also contains grid-point data, and pre-calculated
statistics derived from the ice charts. These include minimum, maximum and median ice
frequencies on three different grid spacings.
The database has many applications. These include: studies of global change where information
on temporal variations in ice conditions is required, and engineering studies requiring statistical
information on ice conditions. In order to properly assess the significance of any such analyses, it
is important that the user be able to assess the accuracy of the ice information. Accuracy is a
difficult parameter to quantify, particularly when such a wide variety of data sources have been
used and much of the chart information is based on the judgement and experience of the
forecaster. These issues are discussed in sections 2 and 3. The accuracy of the information is
dependant on the region, and the specific location on the chart. It has also changed significantly
over the 30-year period covered by the database. For these reasons it was important to document
the chart preparation procedures. This required a review of available literature on operational
procedures, and interviews with key personnel presently, or formerly, involved in chart
preparation. This information is presented in Section 2. Additional information on the day-today
preparation of the ice charts in contained in the Ice Operations Handbook. This information has
1

CISDA – Regional Charts: History, Accuracy, and Caveats
not been repeated here, but can provide insights into the operational limitations of the charts, and
should be referenced when making accuracy assessments.
2. DATABASE DOCUMENTATION
2.1 Regional Ice Charts 1968 – Present The digital regional ice charts for the East Coast, Eastern Arctic, and Western Arctic cover the
period 1968 – Present. The database for Hudson Bay includes the 1971 – present seasons only.
The regional charts are 1:4 million scale, and cover sea surface areas of between 1.2 and 2.2
million km2. Monthly winter charts in the Eastern and Western Arctic did not begin until 1980.
These were based on available Infrared satellite imagery and information collected during the
Arctic ‘round robin’ reconnaissance flights. Prior to 1980 there are no winter charts for the
Arctic. Annual ‘round-robin’ flights were made from 1968 (and earlier) until RADARSAT data
became available in 1996. These flights were designed to generate a single snapshot of
conditions across the Arctic, with emphasis on the presence of multi-year ice. The round-robins
were conducted in May until about 1978 when the advent of aerial SLAR permitted
reconnaissance in darkness. Subsequent round-robins were usually conducted in February.
Until 1983, ice information was recorded using the ‘Ratio Code’. This differed slightly from the
‘Egg Code’ used from 1983 to the present. In the database, the ratio code information has been
converted to egg code format. The significant differences between the ratio and egg codes are
described in Appendix A.
2.2 Brief Chronology of Data Acquisition and Chart Preparation Procedures Figures 2.1a, b, and c illustrate the key changes in chart preparation procedures, and
observational information that have occurred over the period 1968 – present. This figure is meant
to provide a quick reference for changes that may affect chart accuracy. More detailed
descriptions of the changes noted in the figure are provided in Sections 2.3 through 2.6. Ice
2

CISDA – Regional Charts: History, Accuracy, and Caveats
operations moved from Halifax to Ottawa in 1971, but this is not expected to have had any
immediate impact on procedures or chart reliability.
The first significant advancement over the original manual chart drawing process occurred in
about 1975 when photo-facsimile technology was introduced for the first time. This allowed the
field maps drawn by ice observers to be directly transmitted to the Ice Centre as images. Prior to
this the maps were coded, and sent by telex. Once they were received at the Ice Centre they were
decoded and the information was plotted manually on the daily chart. Around 1979, the
epidiascope was first used for overlaying maps and imagery. This was a projection device that
allowed imagery from one source to be projected onto a hard copy chart. Scale adjustments could
be made to match the two images, but there was no ‘stretch’ capability to account for different
map projections. In 1989 the IDIAS (Ice Data Integration and Analysis System) system was
installed. This allowed digital data assimilation and mapping, and eliminated many of the
uncertainties introduced by manual chart preparation. The ISIS system, installed in 1995, was
significantly better for operational map preparation than the earlier IDIAS system.
Surface observation techniques have not changed in the past 30 years, but the number of ice
reports received at CIS declined significantly over that period.
Aerial reconnaissance capabilities benefited from two types of technological innovations. The
first was improvements to navigation systems, first with the introduction of GPS systems in the
mid-1980’s. The second technology to revolutionize aerial reconnaissance was airborne SLAR
and SAR. These systems allowed ice information to be obtained day or night (of particular
benefit in the Arctic in winter) and in poor visibility. This greatly increased the daily coverage
areas, and reduced the requirements for now-casting.
Satellite information was available as far back as 1968, but was generally not used in operations
because of its poor quality and the fact that images had to be sent by mail. This delay of several
days made the imagery useful only in cases where there were no other information sources. The
introduction of facsimile technology allowed satellite images to be received the same day, but
the quality of the faxed images was initially very poor. When digital image transmission became
3
CISDA – Regional Charts: History, Accuracy, and Caveats
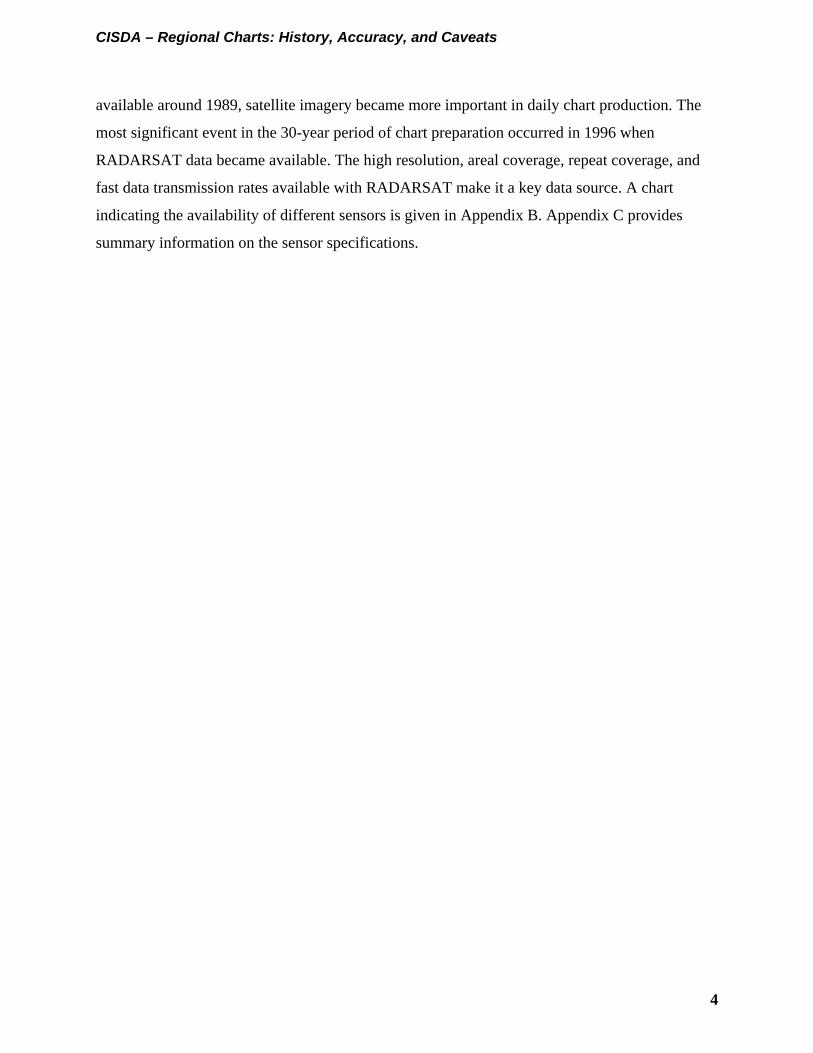
available around 1989, satellite imagery became more important in daily chart production. The
most significant event in the 30-year period of chart preparation occurred in 1996 when
RADARSAT data became available. The high resolution, areal coverage, repeat coverage, and
fast data transmission rates available with RADARSAT make it a key data source. A chart
indicating the availability of different sensors is given in Appendix B. Appendix C provides
summary information on the sensor specifications.
4

CISDA – Regional Charts: History, Accuracy, and Caveats
Figure 2.1a. Regional Ice Chart Chronology: 1968 - 1977 Chart Preparation: manual chart preparation (ratio code), fax technology reconnaissance information replaces Telex coded and sent by Telex
1968 1969 1970 1971 1972 1973 1974 1975 1976 1977 Surface Observations: vessel & shore stations Aerial Reconnaissance: DC-4’s Electras replace DC-4’s Arctic round robins Flown in May Satellite Reconnaissance: low quality ACVS NOAA APT & SR NOAA VHRR available, 1st attempt at near real-time reception of satellite data available but not used available but not used limited operational use Landsat MSS available operationally operationally
5

CISDA – Regional Charts: History, Accuracy, and Caveats
Figure 2.1b. Regional Ice Chart Chronology: 1978 - 1987 Chart Preparation: ‘RAC’ epidiascope used for overlaying Egg code replaces ratio code ice models computer information (MCRIM) installed first used
1978 1979 1980 1981 1982 1983 1984 1985 1986 1987 Surface Observations: Aerial Reconnaissance: SLAR installed on one Electra, second CFR replaces one Arctic round Robins moved to February Electra Electra SLAR Satellite equipped Reconnaissance: NOAA AVHRR available, SSM/I imagery used operationally Nimbus-7 SMMR available
6

CISDA – Regional Charts: History, Accuracy, and Caveats
Figure 2.1c. Regional Ice Chart Chronology: 1988 - 1998
Chart Preparation: IDIAS IRDNET installed ISIS installed installed
1988 1989 1990 1991 1992 1993 1994 1995 1996 1997 1998 Surface Observations: Aerial Reconnaissance: second Electra Replaced by SAR equipped Challenger, Arctic SLAR imagery down-linked to CIS from aircraft round- robins end Satellite Reconnaissance: ERS-1 SAR imagery ERS-2 SAR RADARSAT DMSP
available imagery SAR imagery OLS available available available
7

CISDA – Regional Charts: History, Accuracy, and Caveats
2.3 Surface Observations
1968
Numerous reports were received from shore stations (eg. lighthouses) and Coast Guard and other
vessels. Landfast ice thickness and snow cover was reported at several coastal weather stations
on a weekly basis.
1969 – 1994
A gradual reduction in the number of reporting shore stations occurred over this period. Many of
the early shore reports came from lighthouse keepers, who were gradually phased out. Other
information came from meteorological stations where weekly landfast ice thickness were made.
This information was particularly useful in estimating the stage of development.
1995 – 1998
The rate closures increased rapidly after a program review in 1995. The number of manned
stations and the number of remaining stations reporting ice thickness was reduced to near zero.
2.4 Aerial Reconnaissance
1968
Visual aerial Reconnaissance with performed with two Kenting DC-4s (CF-KAC and CF- KAE).
One aircraft was normally based in Summerside, PEI, from late December to early January until
break-up (normally April), and covered the Gulf of St. Lawrence region. This aircraft then
returned to Montreal for maintenance and was subsequently stationed in the western Arctic
(Inuvik) for the northern ice season (June to October). The second aircraft was based in Gander
and covered the east coast region from late December or early January until June (typically). It
was then moved to Iqaluit (Frobisher Bay) to cover the eastern Arctic region from July until
October. Ice observations along the Labrador coast were made en route.
In addition, one aircraft performed the Arctic ‘round robin’ observations in the high Arctic every
May. A complete map of ice conditions along the main summer shipping routes was produced.
8

CISDA – Regional Charts: History, Accuracy, and Caveats
At this time both aircraft were flying approximately 1100 hours per year and, weather permitting,
were flying approximately two out of three days. The maximum flying altitude was 3500 to 4000
feet, which permitted visual observations approximately 15 miles out each side of the aircraft.
With an average speed of about 200kts (365 km/hr), this corresponded to a potential coverage
area (not accounting for visibility) of approximately 2.2 million square kilometres per aircraft per
year. The flights out of Gander focussed on ice edge position. The flights out of Summerside
focussed on the main shipping routes. The Arctic flights focussed on the presence and location of
multi-year ice along shipping routes.
The DC-4’s were equipped with standard aviation weather radars that allowed some estimation
of the range to significant ice features such as ice edges in front of the aircraft.
Vessel-based CCG helicopters also assisted in ice reconnaissance but were restricted to close
range because of VFR limitations and lack of any navigation system. As a result these
observations were most often limited to the main shipping routes.
1969 - 1971
No significant changes.
1972
The two DC-4’s were replaced by two Lockheed (L-188C) Electras (CF-NAY and CF-NAZ).
The Electras could use their Bendix aviation weather radars to detect the position of ice edges in
poor visibility. They were also equipped with ‘Brutus’ submarine detection radar systems with a
360° field of view. These radars were effective for detecting ice edges at closer range.
1973 - 1977
No significant changes.
1978
A Motorola AN/APS-94DX Side Looking Airborne radar (SLAR) was installed on one of the
Lockheed Electra aircraft (CF-NAZ renamed CF-NDZ). During the period from 1978 until 1984,
9

CISDA – Regional Charts: History, Accuracy, and Caveats
when the second aircraft was equipped with a SLAR, the Electras were regularly switched
between regions so that no specific region received significantly more SLAR coverage than
another. The SLAR equipped aircraft was also used for occasional flights outside its designated
region. For example, if the SLAR equipped aircraft was based in Summerside (covering the Gulf
region), it would occasionally perform surveys in the east coast region.
The introduction of SLAR was a major advance in reconnaissance technology. It allowed
surveillance of regions in darkness and under a cloud cover. It also allowed much larger areas to
be surveyed because of the large (100km) swath width. The increased swath width resulted in a 6
fold increase in the nominal areal coverage. The real increase in coverage area was even larger
than this because the survey areas were not limited by poor visibility. Although the SLAR
imagery was distorted and often difficult to interpret, its introduction led to an immediate
improvement in information on ice edges and concentration. This is likely to have improved the
quality of the charts.
1979 - 1983
No significant changes.
1984
The second Electra (CF-NAY) was equipped with a Motorola AN/APS-94DX SLAR. With both
aircraft SLAR-equipped weather and darkness limitations were greatly reduced.
1985
No significant changes.
1986
One Lockheed Electra (CF-NAY) was replaced by the deHavilland Series 150 DHC-7 (Dash-7,
call sign C-GCFR). This aircraft was equipped with a CAL Corp. SLAR-100. This was later
upgraded to a SLAR-200. The SLAR was normally operated with a 100km swath width out each
side of the aircraft. In this mode the ground resolutions was approximately 25m at near range and
300m at far range.
10

CISDA – Regional Charts: History, Accuracy, and Caveats
The Dash-7 was equipped with a GPS navigation system.
1987 – 1988
No significant changes.
1989
CCG helicopters were equipped with GPS navigation at about this time.
1990
The remaining Lockheed Electra (CF-NDZ) was replaced by the Intera Challenger. This aircraft
was equipped with an X-band Synthetic Aperture Radar (SAR). The ground resolution of this
system under normal operation was 30m, and it had a swath width of 50 km. SAR and SLAR
data were received in near-real time at CIS through IRDNET. The data was block averaged and
transmitted to CIS at a 100m resolution. The ground resolution of the SAR was constant with
range from the flight path. This was an advantage over the SLAR systems where the resolution
decreased significantly with range.
1991 - 1994
No significant changes.
1995
Flights with the SAR-equipped Challenger ended in the winter of 1995. Some additional flights
were contracted out to Aries Aviation who flew a Cessna Conquest equipped with a single-sided
SAR with a 100km swath width. These flights filled the gap that occurred when the Challenger
SAR contract ended before RADARSAT data became available. The Arctic round robins ended
in February, 1995.
1996 - 1998
No significant changes.
11

CISDA – Regional Charts: History, Accuracy, and Caveats
2.5 Satellite Reconnaissance
1968
Low quality visual camera systems such as AVCS (Advance Vidicon Camera System) and APT
(Advanced Picture Transmission) imagery was received at Ice Forecasting Central in Halifax.
The poor quality of the imagery limited its use for the operational program. Higher quality
images were received via mail, but the delayed arrival meant it was used primarily for
climatological purposes and the historical charts.
1969
No significant changes.
1970
The NOAA-1 satellite was launched in 1970. This platform contained an APT (Automatic
Picture Transmission) system which operated in the visible spectrum, and a Scanning
Radiometer (SR) with visible and thermal IR channels. Initially this information was received by
mail, limiting its usefulness to areas for which there was no other information.
1971
No significant changes.
1972
LANDSAT 1 was launched with a 4 channel multi-spectral scanner (MSS). This was an
excellent source of more detailed info, but the imagery was available only by mail. The
LANDSAT MSS had a swath width of 185km and resolution of 79m. The first NOAA VHRR
was available from NOAA-2. This provided much better resolution than earlier sensors, but was
also received by mail, and was (and still is) severely limited by cloud cover. VHRR had a swath
width of about 2600 km and resolution of about 1.1 to 1.9km.
12

CISDA – Regional Charts: History, Accuracy, and Caveats
Higher resolution satellite imagery helped to define the regional ice coverage. However, the
delay in reception meant that its primary uses were for climatology (for example the historicals),
and for updating ice conditions in regions for which there was no other information.
1973
No significant changes.
1974
The first attempt at near real-time reception of satellite imagery was made in the summer of
1974. Selected LANDSAT MSS and NOAA VHRR images were relayed from Prince Albert
Saskatchewan over the telephone line. Most of the facsimile copies were of poor quality and the
amount of imagery that could be transmitted was limited.
The facsimile technology at this time was relatively primitive and probably did not result in
significant improvements to the quality of the charts.
1975
Photo-facsimile was used on a routine basis for acquiring satellite data. This improved the
quality of data substantially, but there were frequent equipment problems.
At this time the introduction and steady improvement in the quality and reliability of photo-
facsimile technology began to increase the timeliness and overall usefulness of satellite imagery.
As a result, the overall quality of the charts probably began to improve, particularly with respect
to the regional ice extent.
1976 - 1978
No significant changes.
13
CISDA – Regional Charts: History, Accuracy, and Caveats
1978
NIMBUS-7 Scanning Multi-channel Microwave Radiometer (SMMR) became available. This
sensor had a resolution of 20 – 80km and swath width of 783 km and was used primarily for ice
edge detection.
NOAA AVHRR imagery became available. The AVHRR sensor had typical ground resolutions
of 1.1 to 2.5km.
1979 - 1984
No significant changes.
1985
LANDSAT-4 was used for accurate ice edge detection. NOAA-5 and NOAA-7 AVHRR data
was acquired from Toronto within 1 to 2 hours after satellite pass. NIMBUS-7 was used for ice
edge detection.
Special Sensor Microwave Imager (SSM/I) imagery was first used on a regular basis for daily
chart production. The 19 and 37 GHz data was used, and had a nominal resolution of 25km.
1987 - 1989
No significant changes.
1990
ERS-1 C-band SAR became available. The data was averaged to 100m x 100m resolution and
received 4 to 6 hours after a satellite pass.
1991
No significant changes.
14

CISDA – Regional Charts: History, Accuracy, and Caveats
1992
The ‘Special Sensor Microwave Imager’ (SSM/I) was used for identifying old ice, but had a very
coarse (25km) resolution.
1993 - 1994
No significant changes.
1995
ERS-2 C-band SAR data became available.
1996
RADARSAT C-band SAR became available. RADARSAT images are received daily, with
repeat coverage every 2 to 3 days on the east coast and almost daily in the high Arctic. Most
images are obtained in ScanSAR Wide mode and have a swath width of 500km, a pixel spacing
of 50m, and ground resolution of 100 × 100m. The data is then 2x2 block averaged to reduce
speckle in visual interpretation methods. Approximately 3500 frames are received per year. The
repeat coverage depends on latitude. For the high latitudes (east and west Arctic) repeat coverage
is obtained every one to two days. Further south (Gulf and east coast) repeat coverage is
typically three days.
RADARSAT SAR imagery provides relatively high resolution, all weather, day or night
information on ice extent and concentration, and some indication of stage of development.
RADARSAT imagery resulted in a significant increase in confidence in the ice charts.
1997
No significant changes.
1998
DMSP (Defence Meteorological Satellite Program) Operational Linescan System (OLS) became
available. This visible and IR sensor has a 3000km swath width and 2.7km resolution (0.55km in
fine mode).
15

CISDA – Regional Charts: History, Accuracy, and Caveats
2.6 Chart Preparation Since 1968 (and earlier) the Canadian Ice Service has produced daily sea ice charts for ice
covered waters in Canada. These charts cover several geographic regions at a scale of 1:2
million. The daily charts are produced with all information available at the time, which may
include satellite imagery, aerial reconnaissance, and surface observations. This information is
augmented with information from previous charts, now-casting, and the general knowledge of
ice conditions and moments possessed by the ice forecasters. The daily charts must be completed
and disseminated on a strict schedule. These deadlines are not always compatible with the timing
of reconnaissance information or the workload of the forecasters.
The regional ice charts contained in the digital database are produced once per week from the
daily ice charts. The regional charts cover larger geographic areas (East Coast, Hudson Bay,
Eastern Arctic, Western Arctic) and are at a 1:4 million scale. Because the deadline for
completion of regional ice charts is less restrictive than for the daily charts, all information
sources can normally be included. However, the larger scale of the regional charts means that
some of the detail available on the daily charts cannot be included. Prior to 1974 both regional
and ‘historical’ ice charts were produced. The historical ice charts were produced at the end of
the ice season and benefited from the availability of reconnaissance information gather shortly
after the chart date. The historical charts are believed to be more accurate than the regional ice
charts, but to date have not been included in the database.
1968
In addition to the daily ice charts that were used to produce the regional charts, weekly
‘historical’ charts were produced on set 7 day (or occasionally 8 day) intervals. They were
produced at the end of the season specifically for climatological purposes. This allowed for
additional data and continuity checking, increased satellite use (because the time delay was not
important). The ‘northern historicals’ were produced for the summer months only. The ‘southern
historicals’ were produced all year round. Both historical and regional ice charts were produced
until 1974 when the historicals were discontinued. The historical charts contain better
16

CISDA – Regional Charts: History, Accuracy, and Caveats
information on the start and end of the ice season than the regionals because the latter were often
not produced until the ice season was underway. To date the information contained in the
historical charts has not been directly incorporated into the database.
The regional charts have always been at a scale of 1:4 million. The daily charts from which they
were derived were at 1:2 million scale.
1969 – 1978
No significant changes.
1979
The epidiascope was used to overlay maps and imagery of different scales. The epidiascope was
a projection system that allowed one image to be projected onto another. The projected image
could be magnified to match the hard copy but could not be stretched to correct for different map
projections. As a result, images in the wrong projection could have significant errors. These
errors were particularly difficult to correct away from land. The epidiascope also resulted in
some degradation of image quality. The projected images could become blurred and some of the
dynamic range was lost. Overall, the epidiascope allowed slightly more accurate transfer of ice
information than the strictly manual techniques used previously.
1980 – 1982
No significant Changes.
1983
The switch to the egg code allowed for more detailed reporting of ice conditions. This did not
necessarily lead to an immediate improvement in the charts because the accuracy was limited by
the quality of the input data. More likely, it allowed for the accuracy of the charts to improve
gradually over time as the reconnaissance technology improved. The significant differences
between the ratio and egg codes are described in Appendix A.
1984 – 1988
17
CISDA – Regional Charts: History, Accuracy, and Caveats
No significant changes.
1987
Dynamic ice forecasting models (eg. MCRIM) were introduced. These could be used as tools for
assisting with now-casting.
1988
No significant changes.
1989
The introduction of IDIAS allowed folly digital data presentation and chart preparation. This was
a significant advancement over earlier techniques because it allowed all data to be superimposed
on the same chart projection. This eliminated errors resulting from transcribing information from
one projection or scale to another. It was particularly good for determining ice edge positions and
boundaries between polygons. However, the IDIAS system was slow and somewhat difficult to
work with, and it was used primarily as a tool for viewing data, rather than producing the charts.
1990
The IRDNET (Ice Reconnaissance Data Network) was installed. This allowed the digital data
collected during reconnaissance flights to be transmitted in near real time to the Ice Centre.
1991- 1994
No significant change.
1995
ISIS (Ice Service Integrated System) was installed. This fully integrated GIS-based system
replaced the older IDIAS system. ISIS has a better and easier to use operation interface and is
much less prone to breakdowns. These qualities lead to a general improvement in the quality of
the charts.
18
CISDA – Regional Charts: History, Accuracy, and Caveats
2.7 Data Availability and Now-casting Requirements
Interpreting the reliability of the regional chart information requires some knowledge of the
relative proportions of the charts that were compiled from the different information sources. For,
example, a chart that was based largely on a three day now-cast will be less reliable than one that
was produced from a recent (same day) RADARSAT image. Data availability changes from
region to region, year to year, and chart to chart. General regional and annual trends are
described in Tables 2.1 (East Coast) and 2.2 (Arctic). These tables indicate the proportion of the
chart covered by various data sources, and the proportion that needed to be now-cast on the day
the regional charts were produced. They also provide an estimate of the typical now-cast
duration for those areas requiring now-casting. The East Coast charts include the Gulf of St.
Lawrence, northern Grand Banks, north east Newfoundland coast, and Labrador Sea. The
estimates provided are averages for the entire chart, but it is expected that the now-casting
requirements for the Gulf of St. Lawrence were less than in other areas due to more surface
observations and more aerial coverage per unit area.
The Arctic regions (Eastern Arctic, Western Arctic, Hudson Bay) are grouped together in Table
2.2. The eastern and western Arctic are virtually identical, while Hudson Bay received very little
aerial reconnaissance during the winter season.
Solid arrows indicate that the quantity was relatively stable in intervening years. Dashed arrows
indicate that values increased or decreased in an approximately linear manner. In many cases the
coverage sums exceed 100%, indicating that some areas on the charts were covered by more than
one data source.
Surface observations have played a small role in overall chart production in all regions. The
number of observations and therefore the proportion of the charts covered by surface
observations has decreased steadily over the 30 year period. It should be noted, however, that
surface observations are still an important source of verification for the remote observations.
Their importance in overall chart preparation is therefore greater than might be inferred merely
from the coverage area indicated here.
19
CISDA – Regional Charts: History, Accuracy, and Caveats
Aerial reconnaissance increased as navigation and radar systems became available, then
decreased in the mid-1990’s when the availability of RADARSAT data reduced the reliance on
aerial observations. Aerial coverage over the Arctic regions is less than on the east coast because
the same resources were spread out over a much larger geographic area. Table 2.3 summarizes
the area of sea surface, and the maximum and minimum ice extents in each region. For
comparison, one 6-hour reconnaissance flight with SLAR would cover approximately 0.44
million km2. Prior to the introduction of SLAR, the visual coverage for the same 6-hour flight
would be approximately 0.06 million km2 (assuming good visibility throughout).
Satellite observations were available as early as 1968, but were of limited use operationally until
the introduction of facsimile technology in the mid-1970’s. The next significant event in terms of
satellite coverage occurred in 1996 when RADARSAT became operational. Satellite coverage in
the Arctic regions tends to be greater than on the east coast because of the polar orbits, and less
cloud cover.
The now-cast requirements have undergone a very significant decline over the 30-year period. In
1968 between 85% and 95% of a regional chart was filled in through now-casting. By 1996, this
had reduced to approximately 20%. The now-cast duration decreased in a similar fashion as
more observational data became available. In the Arctic, the typical now-cast period was reduced
from 14 days to 1 day. On the east coast the reduction was from about 7 days to about 1 day.
These reductions may represent the most significant increase in the accuracy of the regional chart
information through time.
20

CISDA – Regional Charts: History, Accuracy, and Caveats
Table 2.1 Proportion of Regional charts covered by observational information and now-casts: East Coast Region.
YEAR SURFACE
(%) AERIAL
(%) SATELLITE
(%) NOW-CAST1
(%) NOW-CAST
PERIOD2 (days) 1968 5 15 5 85 7 1969 1970 1971 1972 1973 1974 1975 10 1976 1977 1978 30 40 50 4 1979 1980 1981 1982 1983 1984 40 3 1985 1986 1987 1988 1989 1990 45 40 2 1991 1992 1993 1994 1995 1996 20 75 20 1 1997 1998 2
1. For now-casts > 1 day. 2. Typical now-cast duration.
21

CISDA – Regional Charts: History, Accuracy, and Caveats
Table 2.2 Proportion of Regional charts covered by observational information and now-casts: Arctic Regions.
YEAR SURFACE
(%) AERIAL
(%) SATELLITE
(%) NOW-CAST1
(%) NOW-CAST
PERIOD2 (days) 1968 2 5 5 95 14 1969 1970 1971 1972 1973 1974 1975 15 85 1976 1977 1978 10 50 60 7 1979 1980 1981 1982 1983 1984 15 1985 1986 1987 1988 1989 1990 55 50 5 1991 1992 1993 1994 1995 1996 5 80 20 1 1997 1998 1
3. For now-casts > 1 day. 4. Typical now-cast duration.
22

CISDA – Regional Charts: History, Accuracy, and Caveats
Table 2.3. Approximate sea surface areas and ice extents on the regional ice charts.
Region Sea Surface Area
(million km2)
Maximum Sea Ice
Extent (million km2)
Minimum Sea Ice
Extent (million km2)
East Coast 2.2 0.6† 0.0
Hudson Bay 1.8 1.8 0.7♦
Eastern Arctic 1.4 1.4 0.7*
Western Arctic 1.2 1.2 0.9*
† February 26th. ♦ July 15th.
* August 15th.
23

CISDA – Regional Charts: History, Accuracy, and Caveats
3. ACCURACY
3.1 Overview
Accuracy can be defined as the degree of correspondence between information on a chart and the
actual conditions on the surface.
The ice charts are thematic maps, and the accuracy of the information at any specific point in
space (and time) is a function of the positional accuracy, attribute accuracy (the accuracy of the
interpreted ice characteristics), and temporal accuracy. Errors can be introduced at all stages of
the chart preparation process. Both positional and thematic information are subject to three main
types of errors:
•
•
•
Observational errors,
Mapping errors, and
Now-casting errors.
Observation errors are associated with sensor performance, platform stability, and viewing
conditions. Personal errors can be introduced by the limitations of human observers who must
estimate distances and lengths, and mentally integrate varied ice characteristics over large areas
in relatively little time. Instrument errors can result from sensor system limitations and
calibration.
Mapping errors are more varied and in many cases more difficult to quantify. Thapa and Bossler
(1992) described many of the errors that can be introduced in the mapping process. Those most
relevant to ice chart preparation are:
- Compilation and drawing error,
- Error due to generalization,
- Error due to deformation of materials,
- Errors in digitization, and
- Data transmission errors.
24

CISDA – Regional Charts: History, Accuracy, and Caveats
These error sources are described in detail in Section 3.3.
In addition to the mapping error sources described above, there are a number of non-quantitative
errors that affect chart accuracy. These include errors due to mislabelling, misclassification, and
erroneous feature coding. These types of ‘gross’ errors are virtually impossible to quantify.
Now-casting errors can have a significant influence on chart accuracy. Because ice is dynamic,
information collected many hours or days in the past cannot be expected to represent present
conditions. To fill in areas of the charts for which there is no up-to-date information, the
forecaster must use past ice and meteorological conditions, along with her/his judgement and
experience, to predict present ice position and characteristics. Regardless of the forecaster’s skill,
and the availability of predictive tools such as computer models, this process will introduce an
error in chart information.
Total error is very difficult if not impossible to assess because the functional relationships among
the various errors are not known (Thapa and Bossler, 1992). If the error sources are independent
and a linear relationship exists between total error and the individual component errors, then total
error (Etotal) can be computed as the square root of the sum of the squares of the individual errors,
[ ]21223
22
21 ntotal eeeeE ++++= L ,
where e1, e2, … are the ‘n’ individual errors contributing to the total.
3.2 Observation Accuracy
The many sources of ice information used to compile the charts have varying accuracy
limitations. In many cases the accuracy of the information coming from a specific sensor varies
considerably with distance from the target, or with the nature of the ice feature being observed.
This makes it very difficult to make general statements about observation accuracy, but in view
of the importance of accuracy to proper use and interpretation of the database, some
25

CISDA – Regional Charts: History, Accuracy, and Caveats
approximate, quantitative estimates have been developed. These are compiled in Table 3.1.
These quasi-quantitative accuracy estimates were developed during group discussions among
CIS personnel who are (or have in the past) been using the observation sources for chart
preparation.
The first column in Table 3.1 lists the primary sources of operational ice information. In some
cases the specifications of the sensors or the data formats changed with time, so several different
accuracy estimates are provided for a single data source. The second column contains the
positional accuracy estimates in units of kilometres. These values represent ‘typical’ accuracy
ranges. That is, the accuracy under normal operation, when observing typical ice conditions at
typical distances from the sensor platform. The reported position is typically within the listed
values. For example, a positional accuracy value of 4km indicates the true position is likely to be
within 4km (± 2km).
It is clear from the wide variations in positional accuracy that the overall accuracy of the
resulting chart will be highly dependent on the proportion of the chart derived from each data
source. Changes in data coverage through time for satellite, aircraft and surface observations are
described in Section 2.7.
The third column in Table 3.1 contains ‘typical’ accuracy estimates for total ice concentration.
Again the estimates vary considerably, and the overall accuracy of the chart will depend on the
relative usage of the different data sources.
The stage of development information (column 4) is much more difficult to quantify. The stage
of development classifications used in the egg code cover widely ranging thickness bins. For
example, grey-white ice ranges in thickness from 15 to 30cm, while first year ice (the next higher
thickness category) includes ice between 30 and 200cm thick. As a result it is not meaningful to
estimate accuracy in terms of a fixed thickness range. Instead, the accuracy estimates indicate a
level of confidence with respect to the reported stage of development code. For example, a value
of 75% indicates that using a specific sensor, the stage of development could be correctly
26

CISDA – Regional Charts: History, Accuracy, and Caveats
identified 3 out of 4 times. These values are very broad averages, again representing typical
operating conditions, and averaged over all regions.
Stage of development becomes more difficult to determine with increasing distance. Surface
observations tend to be more reliable than aerial, which are turn more reliable than satellite data.
Also, some stages of development are much easier to identify than others. In general, sub-
categories of ‘first-year’ ice are almost impossible to distinguish from the remote sensing data.
This is why the first-year ice stage of development category is so large. Thin ice types, and
multi-year versus first-year distinctions are more reliable. The values quoted in column 4
represent averaged estimates over all stage of development classifications. It should be noted that
the ice information reported on the charts is for level ice, deformed ice such and ridges and rafted
ice are ignored.
The final column in Table 3.1 gives the confidence in the floe size categories. As noted, these
values indicate confidence in the ability to correctly classify floe size above the sensor floe size
resolution. These values are also averages over all conditions and all regions.
27

CISDA – Regional Charts: History, Accuracy, and Caveats
Table 3.1 Typical estimated observation accuracy for the principal sources of ice information1.
SOURCE POSITION (km)
TOTAL CONC.4(tenths)
STAGE OF DEVEL.
(% confidence)
FLOE SIZE5
(% confidence)
RADARSAT 1 0.5 75 90 ERS-1 / ERS-2 0.5 1 65 90 NOAA AVHRR (digital) 4 2 55 75 NOAA AVHRR (pre-digital) 40 4 55 75 NOAA VHRR 40 2 55 75 SSM/I 25 4 NA 75 LANDSAT 1 1 75 90 Aircraft SLAR (GPS nav.) 1 1 50 90 Aircraft SLAR (INS nav.) 4 1 50 90 Aircraft SAR 0.5 0.5 80 95 Aircraft Visual2 (GPS nav.) 1 1 85 95 Aircraft Visual (INS nav.) 4 1 85 95 Helicopter Visual (GPS) 1 1 85 95 Helicopter Visual (pre-GPS) 2 1 85 95 Shore2 1 4 85 80 Ship (GPS) 1 2 85 90 Ship3 (pre-GPS) 4 2 85 90
1. All estimates indicate the range of values or confidence. For example, a positional
accuracy of 4 km indicates the position is typically within 4 km (± 2 km).
2. Visual observations are strongly influenced by range. Near to the flight path or shore
station, observations are more accurate than at large distances from the observer.
3. The positional accuracy of ship reports decreases with increasing distance from the coast.
4. The accuracy of total concentration estimates made from satellite data is highly
dependent on the concentration. Many sensors, including RADARSAT are poor at
showing low ice concentrations. Concentration data from SSM/I imagery has been shown
to systematically miss low concentrations of ice (< 3/10ths).
5. The accuracy of floe size information is highly dependent on the floe sizes. Small floes
cannot be resolved on satellite imagery. Therefore the estimates in this column indicate
“ability to determine floe size above the sensor resolution”.
28

CISDA – Regional Charts: History, Accuracy, and Caveats
3.3 Mapping Accuracy
Inaccuracies in chart information can also occur during the chart production process. In this
discussion, ‘gross errors’ arising from mistakes in decoding or transferring data are ignored.
Examples of gross errors might include reading 5 tenths concentration from a satellite image but
inadvertently writing 8 tenths on the egg, or reading stage of development 7 (thin first-year ice)
from the aerial reconnaissance chart, but writing 7. (old ice) on the egg. Gross errors are often
extremely difficult to detect. In the absence of gross errors, errors in the mapping process are
limited to positional information.
Estimates of positional errors associated with different components of the mapping process are
given in Table 3.2. Compilation and drawing errors are those associated with combining
graphical information from different sources and at different scales, and physically drawing
feature boundaries on a common base map. After the introduction of the IDIAS system in 1989,
and ISIS in 1995 most of these errors were greatly reduced. However, they can never be
completely eliminated because all mapping systems have inherent resolution limitations.
Error due to generalization occurs in both the data acquisition and data analysis stages of the
chart preparation process. Thickness, concentration, and floe size vary on different spatial scales.
The need to define predominant characteristics over relatively large regions introduces a
potential error in the information at any point within the larger polygon (even if the predominant
characteristics are correctly identified).
Deformation of materials refers to the stretch of the paper sheets on which the charts were
prepared prior to the introduction of digital systems. This error is a function of changes in the
temperature and humidity in the office at the time the chart was being prepared. Paper can
deform by up to 1.6% over normal ranges of temperature and humidity (Maling, 1989). At a
scale of 1:4 million, this can result in a positional error of several kilometres. This source of error
should not be a factor for digital maps.
29

CISDA – Regional Charts: History, Accuracy, and Caveats
Digitization or scanning of imagery can introduce errors. The magnitude of the error is
dependent on the size of the feature, the skill of the operator, the complexity of the feature, the
resolution of the scanner/digitizer, and the density of features (Thapa and Bossler, 1992).
Significant errors could also be introduced in data transmission. Again these errors were virtually
eliminated once the completely digital mapping and chart preparation software systems were
installed. When field charts and satellite images were faxed to the Ice Centre, significant
positional inaccuracies resulted from image distortion and loss of resolution. Before fax
technology was used, accuracy limitations arose from the requirement for coding of the field
charts. Each position along an ice edge or polygon had to be measured, coded, typed onto a tape,
and sent by telex to the Ice Centre where they were decoded and plotted. This process limited the
number of points that could be used to define a polygon, and therefore the accuracy of the
boundaries. Early fax systems were poor quality and introduced gross errors whereby numbers
were illegible or easily misread.
TABLE 3.2 Estimated positional errors associated with various
components of the chart preparation process. SOURCE POSITION
(km) Compilation & Drawing (digital) 2 Compilation & Drawing (epidiascope) 10 Compilation & Drawing (manual) 15 Generalization 2 Deformation of materials (paper) 3 Digitization 2 Data transmission (digital) 0 Data transmission (fax) 10 Data transmission (code) 10
3.4 Now-casting Accuracy Areas of a chart for which there was no current ice information were filled in using ‘now-
casting’. This involved using measured or forecast meteorological and oceanographic conditions,
model predictions (where available), and the experience and judgement of the forecaster, to
move and change ice conditions from the previous day’s chart (some of which may have been
30

CISDA – Regional Charts: History, Accuracy, and Caveats
now-cast from earlier charts). Clearly, the longer the now-cast period, the larger the error is
likely to be. Now-casting requirements have typically been greatest in the Eastern and Western
Arctic because the reconnaissance efforts have been spread out over these very large geographic
areas. Ice charts for Hudson Bay also contain a large amount of now-cast information.
Fortunately, ice conditions in these regions are relatively easy to now-cast during much of the
winter (see below). Now-casting requirements in these regions were greatly reduced when
RADARSAT imagery became available. The polar orbit of this satellite gives the smallest repeat
coverage intervals at high latitudes.
The Gulf of St. Lawrence region contains the least amount of now-cast information because it is
a relatively small (it can be almost completely covered in one day by aerial reconnaissance), and
there is frequently supplemental information available from Coast Guard helicopters and
merchant shipping.
Some geographical regions are more difficult to now-cast than others. For example, the ice
conditions in Hudson Bay are very stable once a first-year ice cover has developed. Because
there is very little change from one day to the next, now-casting is relatively easy. Portions of the
central Arctic also have stable ice conditions during the late winter. Ice on the east coast is much
more difficult to now-cast because it is unconfined and very dynamic.
Table 3.3 provides estimates of now-cast accuracy for each ice characteristic as a function of
now-cast period. These are again rough estimates representing typical conditions, averaged over
all regions, and were developed during group discussions with ice forecast personnel. In all cases
the accuracy is expected to decrease with increasing duration. The stage of development
accuracy is listed as being constant because this characteristic changes very slowly once the ice
has reached the first-year stage (about 30cm). The accuracy of all other ice characteristics is
expected to decrease approximately linearly with time, with the positional information being
subject to the greatest relative error.
31

CISDA – Regional Charts: History, Accuracy, and Caveats
Table 3.3 Typical estimated now-cast accuracy for a range of now-cast duration. SOURCE POSITION
(km) TOTAL CONC.
(tenths) STAGE OF
DEVEL. (% confidence) 1
FLOE SIZE (% confidence) 1
6-12 hour (temporal adjustment)
5 1 95 95
24 hour (no data for 1 day)
10 2 95 90
> 48 hour (no data for 2+ days)
25 3 95 85
1. The accuracy estimates indicate the level of confidence with respect to the reported stage
of development and floe size codes associated with the now-cast (ie. assuming the initial values were correct). For example, a value of 95% indicates that changes in the stage of development are correct 19 times out of 20 over the now-cast period.
3.5 Ice Characteristics
3.5.1 Introduction
The sources of error discussed above can affect all of the ice characteristics on the charts. The ice
charts contain information on sea ice:
•
•
•
•
Position (ice edges and polygon boundaries),
Concentration,
Stage of development, and
Floe sizes.
The accuracy of each ice characteristic is controlled by several factors and has changed through
time as reconnaissance, reporting, and chart preparation techniques have evolved. The main
factors limiting the accuracy of each ice characteristic are discussed below.
32

CISDA – Regional Charts: History, Accuracy, and Caveats
3.5.2 Position
The accuracy of the ice edges and polygon boundaries on the ice charts is limited by many
factors. The first limiting factor is the accuracy of the positioning system on the vessel, aircraft
or satellite platform. Current platforms have highly accurate GPS systems and can determine
their position at any time to within about 100m or less. However, the DC-4 and Electra aircraft
used in earlier reconnaissance efforts were equipped with much less accurate inertial and beacon-
based (Omega) systems. These were typically accurate to within a few kilometres. Positional
errors will be smaller where there is more information, such as near to shore (which can be used
for reference) and in the main shipping lanes in the Gulf of St. Lawrence.
In addition to these limitations, the ice observer must make judgements as to the spatial position
of ice features. This error is difficult to quantify, and would increase with distance from the flight
track. In the absence of radar information these errors were likely to be ± 10% (1 to 2km at long
range). This would be very much a function of the experience of the observer. Once airborne
SLAR was available this source of error was greatly reduced, and was probably comparable to
the range resolution of the SLAR or SAR system (∼300m). Helicopter observations are still
made without the benefit of SLAR, and therefore are subject to the judgement of the ice
observers.
Another source of positional inaccuracy results from the fact that most ice is dynamic and
changes position continuously through time. The regional ice charts represent a ‘snap-shot’ of ice
conditions at 1800 UTC on specific day. Since not all of the data used to produce a chart is
collected at the same time, changes in position between ‘data takes’ will limit positional
accuracy. For example, if the sea ice is drifting at a rate of 10km/day, data collected 6 hours
before the time specified on the ice chart would be offset by 2.5km. Even during a long aerial
reconnaissance flight the ice can move several kilometres. Forecasters attempt to compensate for
temporal differences by adjusting positions slightly, knowing the conditions and the time the data
were acquired. This is a type of short-term now-casting. The magnitude of this error will be a
function of the data collection schedule and the rate of ice movement. Landfast ice (and possibly
33

CISDA – Regional Charts: History, Accuracy, and Caveats
high ice concentrations in constricted channels) would not be a strongly influenced by these
limitations.
Coding and decoding ice messages can limit the positional accuracy of the charts by limiting
resolution of the information that can reasonably be coded and decoded. This is not a factor in
the current chart production procedure, but probably played a role in the late 1960’s and early
1970’s when flight messages were coded and sent by Telex. Since the latitude and longitude of
each ice edge and polygon had to be coded and put onto a teletype tape, the number of points that
could be transmitted was limited. This in turn limited the resolution of the ice edge and polygon
boundary positions on the resulting ice charts.
Similarly, the graphical scale of the ice charts limits their positional accuracy. The regional
charts used to create the database are at 1:4 million scale. At this scale the width of the lines
defining the ice edges and polygon boundaries is approximately 1km. Since the accuracy cannot
be greater than the resolution, this introduces a limit on the positional accuracy of the ice
information to ± 0.5km.
One of the most significant limitations to positional accuracy results from the requirement to
‘now-cast’ ice conditions in regions where current observations are not available. Now-casting
involves taking all relevant ice and meteorological information and using judgement and
experience to extrapolate conditions into regions where recent observations are unavailable.
Now-casting is aided by numerical ice growth and decay models (which can indicate changes in
stage of development), and ice drift models (which indicate movements). However, an
experienced forecaster can often outperform numerical models. As the length of time for which
there is no data increases, the accuracy of the now-cast decreases. This was a much more
significant problem before satellite and airborne radars because darkness and cloud cover could
obscure the ice cover for many days a time. The finite number of flying hours available also
meant that even in good weather some areas would not be surveyed for several days. Since the
availability of RADARSAT imagery, the now-casting requirements have been greatly reduced.
34

CISDA – Regional Charts: History, Accuracy, and Caveats
The position and extent of landfast ice is more accurate than drift ice because it is relatively
stable through time. This reduces the effects of data gaps. However, it is subject to the same
resolution limitations. Also, the positional accuracy of the polygon boundaries is subject to more
uncertainty than the ice edges. Although ice edges can be diffuse, it is generally simpler to select
representative position when the distinction is between ice and no ice, than it is when a boundary
between different ice types must be defined.
The net effect of these accuracy limitations may be a function of the how the data is used. For
general ice climatology the effect of random errors will be small. It is believed that all of the
factors contributing to uncertainty in the ice position are random.
3.5.3 Concentration
Total ice concentration and partial concentrations of each ice type are provided for each polygon.
Both the ratio code and egg code allow concentrations to be reported in tenths. Concentrations
are relatively easy to observe visually, and a number of the remote sensing tools have been
shown to provide accurate total concentration data. In general the coarser the resolution of the
imagery, the poorer the partial concentration data will be. An important systematic error can be
introduced in the data when satellite sensors are used to estimate concentration. Some sensors,
including RADARSAT do not show low concentrations. Areas of small floes of 3 tenths or less
can appear as open water. If supporting information is not available, this will lead to
underestimates of ice at low concentrations. Since the recent charts rely more heavily on satellite
imagery, it is possible that the accuracy of the ice concentration data has decreased.
The accuracy of the partial concentration estimates is also a function of the ability of the
observer/forecaster to distinguish between different ice types (see below). If the stage of
development is not correct, then the concentration for that ice type will not be correct. Since
concentration is so dependant on image interpretation, the accuracy of the concentration
information on the charts is likely to vary between observer/forecasters and it is possible that
35

CISDA – Regional Charts: History, Accuracy, and Caveats
some systematic errors exist. This is difficult to quantify, but it is likely to be small because any
systematic bias introduced by a single observer/forecasted will tend to be offset by others.
Now-casting introduces an additional uncertainty in the concentration data. Where observations
are not available the forecaster must project past conditions into the present. On a large scale
these now-casts are probably quite accurate because the total surface coverage of ice in a region
does not change rapidly. Exceptions to this are in conditions of extreme ridge-building and
rafting, rapid decay, or when new ice is forming. However, even if the total surface area covered
by ice does not change significantly, the local distribution of floes and therefore the local
concentrations, can change dramatically in short periods of time. This is more likely to occur on
the east coast where the ice largely unconfined. The effect of these changes on the accuracy of
the concentration information is dependant on the scale of the charts. The daily charts, which are
at a smaller scale, are more prone to now-casting errors than the larger scale regional charts
contained in the database. At 1:4 million scale, the regional charts describe average conditions in
polygons that are typically larger than 3000km2. At this scale local variations in concentration
can not be reported, and the average conditions in each polygon are relatively insensitive to such
variations. As the length of the now-cast increases the accuracy will decay. Again this suggests
that the concentration data from the early ice charts is less accurate that the charts being
produced today, since there were longer periods without observations.
3.5.4 Stage of Development
The stage of development is one of the most difficult parameters to observe. There are currently
no sensors in operational use that can distinguish ice thickness to the resolution contained in the
egg code. It is usually possible to distinguish multi-year ice from first year ice, and thinner forms
of first-year ice (less than about 30cm in thickness) from thicker first-year ice. Beyond these
broad classifications, the accuracy of the thickness information is heavily reliant on the aerial
and surface observations. When there is no snowcover, the different forms of thin ice (less than
about 30cm in thickness) can be readily distinguished by the trained observer. Thicker first year
ice can also be identified, but becomes more difficult to classify as the thickness increases due to
36

CISDA – Regional Charts: History, Accuracy, and Caveats
the presence of snow and the less pronounced colour changes. Multi-year ice is also readily
identified visually by its roughness and the presence of snow free, bluish ice. Ship-based
observations are probably the most accurate in terms if stage of development because the
observer is close to the ice, and can often observe the ice floes on edge as the vessel transits
through the ice. This suggests that the thickness information might be more accurate near to the
main shipping lanes.
A general result of these interpretation limitations is that the greatest uncertainty lies in the ‘first-
year ice’ classifications (30 – 200cm). In this range, peripheral information must be relied upon
to improve the thickness estimates. Ice growth is one of the more easily predicted characteristics
and both historical information and simple freezing-degree-day growth models can be employed.
In regions where the ice is very dynamic these models become less effective because the ice can
move between areas with different growth conditions.
The most significant effect of now-casting on the stage of development data occurs when the ice
is first forming. In the absence of observations it is difficult to predict formation, and now-casts
are subject to considerable error. Once the ice has formed, but is still thin, its growth is
predictable using freezing-degree-day data and errors should be small. Once the ice has
thickened, it is more difficult to predict its stage of development, but the growth is slow and the
errors introduced by now-casting should again be small.
Prior to 1983 the ice information was presented using the ratio code. This coding system allowed
less detail in the stage of development information than the egg code that has been used since
1983. For example, the ratio code contains a single category for first-year ice (30 – 200cm),
whereas the egg code contains four different first-year ice sub-categories. In situations where
there is detailed thickness information available, the ratio code data (pre-1983) would be less
accurate. This probably did not result in an immediate increase in accuracy in 1983, but
permitted a gradual improvement as detection technology improved.
Stage of development information is more susceptible to systematic error because it is much
more difficult to observe, and there is much less surface verification.
37

CISDA – Regional Charts: History, Accuracy, and Caveats
3.5.5 Floe Size
Floe size, like concentration, is relatively easy to estimate if sufficiently detailed imagery or
visual observations are available. Visual observations made from aircraft can resolve objects
down to several metres in length, and floe size estimates from these sources are probably quite
accurate. Airborne SLAR is also a useful tool for measuring floe sizes, and can supplement or
replace (in cases of poor visibility) visual observations. The resolution of the SLAR systems
ranges from 25m at near range to 300m at far range. The usefulness of satellite sensors for
measuring floe size depends on the resolution of the sensor. High-resolution sensors such as
LANDSAT MMS, ERS-1, ERS-2 and RADARSAT SAR are much more valuable than low-
resolution sensors such as AVHRR.
Since only one representative floe size can be given for any single ice type, an attempt is made to
provide the ‘predominant’ floe size value. This requires further skill on the part of the
observer/forecaster, particularly if the floe size distribution is highly skewed. Because of the
resolution limitations on the various information sources, floe sizes in the egg code are normally
reported as medium (100 – 500m) or larger. This produces compatibility between the egg code
and ratio code in that there was no provision in the ratio code to report floe sizes if they were less
than 100m. However, it could lead to some interpretation problems since floes reported as
‘medium’ are actually ‘medium or less’.
Now-casting does not have a significant effect on the floe size information unless the now-cast
period is quite large. This is because floe sizes generally do not change quickly. Exceptions to
this rule are near to ice edges where wave action can rapidly reduce the size of floes within
several kilometres of the open ocean, and during cold calm spells when floes can bond together
to make larger conglomerates.
Chart scale is also less important to the accuracy of the floe size information than it is for other
ice characteristics. Average floe size is a relatively stable parameter both spatially and
temporally. Therefore positional errors and scale limitations will not have a significant effect on
the accuracy of the information.
38

CISDA – Regional Charts: History, Accuracy, and Caveats
The floe size information, like ice concentration, is probably free of systematic errors with one
exception. As mentioned above, floe sizes are only reported if they are medium or larger (this is
a specified characteristic of the ratio code, and the accepted operational practice with the egg
code). Therefore, there is a bias in the data toward large floes.
3.6 Items to Keep in Mind when Performing Statistical Ice Analysis of Ice Charts
In addition to the general statements about data quality made above, some specific characteristics
of the database are important for assessing its potential for statistical analyses. Quality-assurance
has taken place at various stages through time from chart production to post chart review and
finally to chart digitization which increased the overall quality by correcting human errors found
on the original ice charts.
The chart database has been used successfully for numerous ice statistics such as sea ice atlases
and can be applied to climatological studies in Canadian waters. (A Bibliography of atlases,
reports and papers which have used the database is available on request). During such
endeavors, the following considerations should be kept in mind when performing any analysis
using the dataset.
• The dataset for the most part consists of weekly observations through an active ice season,
but missing charts do exist and increase in frequency towards both the beginning and end of
the active season.
• Monthly ice charts in the winter for the East Arctic, West Arctic, and Hudson Bay began
regular production in 1980.
39

CISDA – Regional Charts: History, Accuracy, and Caveats
• Trace amounts of ice have been reported throughout the dataset, but a decrease in the number
of traces per polygon is seen in 1982 as the “ratio code,” which allowed for multiple traces
per polygon was replaced with the “egg code,” which allows for only 1 trace of “thick” ice
and 1 trace of “thin” ice.
• The encoding of areas of “fast ice” has not always been consistent for the East Arctic and
West Arctic particularly during the “ratio code” years and makes it difficult to differentiate
between “fast ice” and “drift ice.”
• Up to and including 1996, charts in adjacent regions were not produced on the same day and
this can result in differences in areas where charts of different regions overlap
• Some inconsistencies have been noted in the continuity of amounts of old ice (multi-
year/second-year/old) from the end of a summer melt season to the beginning of the next
season. This may be reasonable in areas where ice motion still occurs during the winter
season i.e. the Beaufort Sea yet unreasonable in areas where little or no ice motion occurs i.e.
the Canadian Arctic Archipelago.
• Some inconsistencies have been noted in the differentiation between multi-year and second-
year ice. It is recommended that studies involving multi-year ice should consider multi-year,
second-year, and old ice as one ice type.
• Areas of “no data” exist in the dataset. Sometimes these areas can be large and their impact
on statistics may need to be considered.
• The use of “multiple codes” has been noted to affect statistics particularly that of old ice. A
“multiple code” is an area on a chart where two or more ice codes were placed with no line
of delineation between them. Upon digitization, an approximate mid-point between multiple
40

CISDA – Regional Charts: History, Accuracy, and Caveats
codes was drawn. In general, the impact will be minimal due to the similarities in ice
conditions between the codes. However, it has been noted to affect areas of low
concentrations of old ice most notably in Baffin Bay.
• Concentration of “icebergs” 1/10 or greater is sometimes included in the total concentration.
This should be considered for studies pertaining to sea ice only.
• The encoding of “9+” for total concentration can also affect values. Numerical attributes in
the CIS Digital Archive considers this as 9.7/10 or 97% total ice cover. This differs from the
sum of the partial concentrations, which in this case would be 10/10 or 100%. This applies
for all regions and all years in the CIS Digital Archive.
• Changes in the digital base map can affect statistics, but their impact is considered minor.
• Changes in chart extents throughout the dataset can have a marked impact on values. Care
must be taken to ensure a consistent area throughout the dataset for the analysis.
The CIS Digital Archive represents the best available source of detailed, high-resolution digital
data for sea ice in Canadian waters. The dataset contains over 30 years of sea ice data and
represents a compilation of numerous data sources. In its current state the CIS Digital Archive is
of great value for statistical sea ice studies in Canadian and adjacent waters. It is planned to
further improve the quality of the dataset through continuing quality control, and by addressing
the issues above in future releases.
41

CISDA – Regional Charts: History, Accuracy, and Caveats
Acknowledgements
This project was funded by the Program of Energy Research and Development (PERD). Many
thanks to Richard Chagnon, Bea Alt and Steve McCourt for there knowledge and input.
42

CISDA – Regional Charts: History, Accuracy, and Caveats
REFERENCES AND BIBLIOGRAPHY
Anonymous, 1981. Interpreting Canadian Ice Charts (1967-1981), Internal Ice Centre Note.
http://www.ice-glaces.ec.gc.ca/App/WsvPageDsp.cfm?ID=175&Lang=eng (Ice Codes and
Symbols).
http://www.ccrs.nrcan.gc.ca/ccrs/tekrd/satsens/sats/satliste.html (Satellite Information)
Maling, D., 1989. Measurements from Maps: Principles and Methods of Cartometry. Pergamon
Press, Oxford, 577p.
MANIS, 1992. Manual of Ice Services, Environment Canada, Atmospheric Environment
Service.
Massom, R. 1991. Satellite Remote Sensing of Polar Regions, Belhaven Press, London.
Mullane, T. 1980. Operational use of satellite imagery in the Canadian ice program, 6th Canadian
Symposium on Remote sensing, Halifax, Nova Scotia, May 21-23, 1980.
Ramplee-Smith, C. and Hall, R. 1991. The Dash-7 Ice Reconnaissance Aircraft, Presented at the
WMO Operational Ice Remote Sensing Workshop, Ottawa, 11 September, 1991.
Ramsay, B. 1985. Qualitative and quantitative interpretation of satellite imagery as related to sea
ice analysis, AES Ice Centre Note, February, 1985.
Thapa, K., and Bossler, J. 1992. Accuracy of spatial data used in geographic information
systems, Photogrammetric Engineering and Remote Sensing, 58(6): 835-841.
43

CISDA – Regional Charts: History, Accuracy, and Caveats
APPENDIX A: Key Differences between the Ratio and Egg Codes.
The significant differences between the egg code used from 1983 to the present and the ratio
code used prior to 1983 are the amount of detail allowed in reporting the stage of development
and floe size information. These differences are discussed below, along with an indication of
their repercussions with respect to resolution and accuracy.
Stage of Development
The ‘egg’ code differs from the earlier ‘ratio’ in the amount of detail provided in the stage of
development (thickness). The stage of development categories for both systems are given in
Tables A1 and A2. The egg code provides for more detailed reporting in several thickness
categories. These are,
•
•
•
•
•
The egg code provides for separate reporting of new ice and nilas, which are combined in
the ratio code,
The egg code contains an additional ‘young ice’ category which includes grey ice and grey-
white ice, but still allows for these ice types to be reported individually,
The egg code has four development stages for first-year ice, while the ratio code has only
one,
The egg code has separate categories for ‘old ice’ and ‘multi-year’ ice (the ratio code
includes multi-year ice only, and
The egg code contains an ‘ice of land origin’ category.
Table A1. Ratio Coding for Sea Ice Stages of Development.
Description Thickness (cm) Nilas and new ice 0 – 10
Grey ice 10 – 15 Grey-white ice 15 – 30 First-year ice 30 – 200
Second-year ice Multi-year ice
1

CISDA – Regional Charts: History, Accuracy, and Caveats
Table A2. Egg Coding for Sea Ice Stages of Development. Description Thickness (cm) Code New ice <10 1 Nilas; ice rind 0 – 10 2 Young ice 10 – 30 3 Grey ice 10 – 15 4 Grey-white ice 15 – 30 5 First-year ice 30 – 200 6 Thin first-year ice 30 – 70 7 Thin first-year ice, first stage 30 – 50 8 Thin first-year ice, second stage 50 – 70 9 Medium first-year ice 70 – 120 1. Thick first-year ice 120 – 200 4. Old ice 7. Second-year ice 8. Multi-year ice 9. Ice of land origin .
Floe Size The egg code provides 11 floe size categories (Table A3), but only codes 3 or larger (20 – 100m) are reported on the charts. The ratio code includes only the concentration in tenths of floes greater than 100m diameter, for each reported stage of development. Therefore, the charts produced using the ratio code (after 1982) contain more information on small floes.
Table A3. Egg Coding for Ice Floe Size. Description Width (m) Code Pancake ice 0 Small ice cake; Brash ice < 2 1 Ice cake 2 – 20 2 Small floe 20 – 100 3 Medium floe 100 – 500 4 Big floe 500 – 2000 5 Vast floe 2000 – 10000 6 Giant floe > 10000 7 Fast ice, growlers or floebergs 8 Icebergs 9 Undetermined or unknown X
2
CISDA – Regional Charts: History, Accuracy, and Caveats
Repercussions As a result of these differences between reporting procedures, the sea ice charts compiled after
1982 (using the egg code) are of a higher resolution. When detailed information was available
this would result in charts that were also more accurate. However, a significant and sudden
increase in accuracy after 1982 is not expected. The stage of development is often difficult to
observe from airborne platforms, particularly when there is snow cover or the ice is thick. The
accuracy of the charts is likely to be more strongly influenced by changes in remote sensing
technologies than the reporting procedures. The exception may be the floe size data, which is
easily observable from the air and significant improvement can be expected as a result of the
more detailed reporting procedures after 1982.
3

CISDA – Regional Charts: History, Accuracy, and Caveats
APPENDIX B: Availability of Principal Data Sources
DATA SOURCE
1968
1969
1970
1971
1972
1973
1974
1975
1976
1977
1978
1979
1980
1981
1982
1983
1984
1985
1986
1987
1988
1989
1990
1991
1992
1993
1994
1995
1996
1997
1998
Satellite Sensor S R VHRR MS S AVHRR TM SSM/ I SAR1 Airborne Sensor Visua l SLA R SA R Brutus Rada r Weather Rada r Surface Obs. Visua l 1 dashed line indicates ERS-1 and ERS-2, solid line indicates RADARSAT availability.
1

CISDA – Regional Charts: History, Accuracy, and Caveats
APPENDIX C: Specifications of Principal Sensors
SATELLITE SENSORS SR – Scanning Radiometer Wavelength: visible, thermal IR Satellites: NOAA 1-5 Dates: January 1970 – March 1979 Ground Resolution: 3.2km – 8.0km Swath Width: 2,900km VHRR – Very High Resolution Radiometer Wavelength: visible, thermal IR Satellites: NOAA 2-5 Dates: October 1972 – March 1979 Ground Resolution: 1.0km – 1.9km Swath Width: 2,580km MSS – Multi Spectral Scanner Wavelength: visible, near IR Satellites: LANDSAT 1-7 Dates: July 1972 – present Ground Resolution: ∼80m Swath Width: 185km AVHRR – Advanced Very High Resolution Radiometer Wavelength: visible, near IR, thermal IR Satellites: TIROS-N, NOAA 6-11, NOAA ‘NEXT’ Dates: October 1978 – present Ground Resolution: 1.1km Swath Width: 2,580km TM – Thematic Mapper Wavelength: visible Satellites: LANDSAT 4-7 Dates: July 1982 – present Ground Resolution: 30m Swath Width: 185km
1

CISDA – Regional Charts: History, Accuracy, and Caveats
SSM/I – Special Sensor Microwave Imager Wavelength: passive microwave Satellites: DMSP Dates: June 1987 - present Ground Resolution: 25km Swath Width: 1400km SAR – Synthetic Aperture Radar Wavelength: C-band (5.3 GHz) Satellites: ERS-1, ERS-2, RADARSAT Dates: July 1991 – June 1996 (ERS-1), April (1995) – present (ERS-2),
November 1995 – present (RADARSAT) Ground Resolution: 30m (ERS-1, ERS-2), 9 to 100m (RADARSAT) Swath Width: 80-100km (ERS-1, ERS-2), 45-500km (RADARSAT) SMMR – Scanning Multichannel Microwave Radiometer Wavelength: passive microwave Satellites: NIMBUS-7 Dates: October 1978 – July 1988 Ground Resolution: approx. 20 - 80km Swath Width: 783km AIRBORNE SENORS Visual Wavelength: Visible Platforms: DC-4, Lockheed Electra, Dash-7, Challenger, CCG helicopter, and
others Dates: 1968 - present Ground Resolution: typically 10 -100m Swath Width: typically 10 -30km SLAR – Side-Looking Airborne Radar Wavelength: X-band Platforms: Lockheed Electra, Dash-7 Dates: 1978 - present Ground Resolution: 50 – 300m Swath Width: 100km
2

CISDA – Regional Charts: History, Accuracy, and Caveats
SAR – Synthetic Aperture Radar Wavelength: X-band Platforms: Challenger Dates: 1990 - 1995 Ground Resolution: 30m, transmitted as average 100m pixels Swath Width: 50km SURFACE OBSERVATIONS Wavelength: visible Platforms: radio & DEW line stations, lighthouses, CCG, fishing & merchant
marine vessels Dates: 1968 - present Ground Resolution: variable Swath Width: variable
3

![Welcome [cheshirerfu.co.uk]cheshirerfu.co.uk/archive/1994 - 1995/CHESHIRE V...\VclCQI11C ro today's match in the CIS InsuranCt: Counly Championship. This is the second scason rhal](https://img.pdfslide.net/doc/110x75/5abc2bb87f8b9ab1118ddbc8/welcome-1995cheshire-vvclcqi11c-ro-todays-match-in-the-cis-insuranct.jpg)