Embed Size (px)
Citation preview

This is an author produced version of a paper published in Environmental Management. This paper has been peer-reviewed and is proof-corrected, but does not include the journal pagination.
Citation for the published paper: Efrem Garedew, Mats Sandewall & Ulf Söderberg. (2012) A Dynamic Simulation Model of Land-Use, Population, and Rural Livelihoods in the Central Rift Valley of Ethiopia. Environmental Management. Volume: 49, Number: 1, pp 151-162. http://dx.doi.org/10.1007/s00267-011-9783-4.
Access to the published version may require journal subscription. Published with permission from: Springer-Verlag.
Standard set statement from the publisher: The original publication is available at www.springerlink.com at http://link.springer.com/article/10.1007/s00267-011-9783-4?null
Epsilon Open Archive http://epsilon.slu.se
A Dynamic Simulation Model of Land-Use, Population, and Rural Livelihoods in the
Central Rift Valley of Ethiopia
Efrem Garedew1,2 • Mats Sandewall2 • Ulf Soderberg2
Abstract
The dynamic interactions between society and land resources have to be taken into account when
planning and managing natural resources. A computer model, using STELLA software, was
developed through active participation of purposively selected farm households from different
wealth groups, age groups and gender within a rural community and some members of Kebelle
council. The aim of the modeling was to study the perceived changes in land-use, population and
livelihoods over the next 30 years and to improve our understanding of the interactions among
them. The modeling output is characterized by rapid population growth, declining farm size and
household incomes, deteriorating woody vegetation cover and worsening land degradation if
current conditions remain. However, through integrated intervention strategies (including forest
increase, micro-finance, family planning, health and education) the woody vegetation cover is
likely to increase in the landscape, population growth is likely to slow down and households’
income is likely to improve. A validation assessment of the simulation model based on historical
data on land-use and population from 1973 to 2006 showed that the model is relatively robust.
We conclude that as a supporting tool, the simulation model can contribute to the decision
making process.
Keywords: Forest increase; Household income; Land-use; Land degradation; STELLA software
1 School of Forestry, Wondo Genet College of Forestry & Natural Resources, Hawasa University, Shashemene, P.O. Box 128, Ethiopia. Email: [email protected]. 2 Department of Forest Resource Management, Swedish University of Agricultural Sciences, Umea 901-83, Sweden

Introduction
There is a strong and complex relationship between natural resources and rural livelihoods. Rural
people in low income countries depend on the availability and access to natural resources for
supporting their livelihoods (Ellis and Allison 2004). A livelihood comprises the assets (natural,
physical, human, financial and social capital), the activities and the access to these (mediated by
institutions and social relationships) that together determine the living gained by the individual
or household (Ellis 2000).
The increasing global concerns about the sustainable management of natural resources which
followed the UN summit in Rio de Janeiro in 1992 have not visibly reduced the pace of
deforestation in the tropics, which is caused by a complex mixture of demographic, economic,
technological, cultural and institutional factors (Hartemink et al. 2008; Lambin et al. 2003). In
the international discourse on natural resources conservation, there are diverse relationships
between conservation strategy and poverty reduction that reflect conflicting paradigm positions
in the current debate conservation (Adams et al. 2004). The proponents of the so-called ‘‘zero
conservation’’ or ‘‘fortress conservation’’ approach advocate protection measures that seeks to
exclude local people from natural resources (Hutton et al. 2005; Sanderson and Redford 2003).
However, others still equally have different views, community based management projects can
make both development and conservation economically viable and attractive for the local
communities to maintain biodiversity and integrity of nature (Singh 2008; Sunderland et al.
2008). Furthermore, Robbins et al. (2006) and Romero and Andrade (2004) suggested that the
exclusion of communities from conservation ultimately leads to social conflict and
noncompliance with conservation-related regulations (Chan et al. 2007). The combining of
participatory modeling and livelihood studies could contribute to sustainable natural resource
management and livelihood improvement by building shared understanding of critical issues and
helping to focus on conservation and development interventions (Campbell et al. 2008).
Africa is already a region under pressure from climate stresses and is highly vulnerable to the
impacts of climate change (UNFCCC 2007). Thus, African countries working in the
conservation-development nexus need to take active part in the current global and regional
processes on climate change adaptation.

Ethiopian subsistence agriculture is heavily dependent on rain-fed production. The erratic
nature of rainfall leads to reduced crop production. The main reason is the daily, seasonal and
inter-annual rainfall variability (Segele and Lamb 2005). In Ethiopia, widespread land
degradation has led to severe challenges for the people (Amsalu and de Graaff 2006; Argaw
2005; Mahmud et al. 2005; Taddese 2001). Socio-economic and institutional factors, such as
population pressure, poverty and land tenure arrangements are the main contributors to land
degradation. Population growth raises the demand for subsistence cropland and for biomass (fuel
and fodder). Both are leading to deforestation. People’s lack of access to alternative sources for
livelihood exacerbates this, and, therefore increases the problems of erosion and nutrient
depletion (Haile 2004; Nyssen et al. 2009).
In Ethiopia, land tenure is a disputed issue. All rural land is owned by the state and part of
this land is allocated to farmers on a use-right basis (Bogale et al. 2006). The rural land reform
policy strictly prohibits the transfer of land by sale or mortgage. However, it does allow transfer
of use-right in the form of gift, inheritance, restricted leasing and sharecropping (Crewett et al.
2008). Most debates and studies on land ownership of the state mainly revolve around questions
of insecurity (redistributions) of landholdings, degradation of soil quality, unsuitable land use
practice and fragmentation of farms. The federal government and the regional states have started
a process of land registration and certification to address farmers rural land insecurity (Deininger
et al. 2008).
The rapidly growing population in Ethiopia adds approximately two million people per year
and population is predicted to be more than double current levels by the year 2050 (United
Nations Population Division 2009). Internal migration in Ethiopia is high and associated with
education, demographic, economic and environmental and security reasons (Mberu 2006).
Historically rural-to-urban, urban-to-rural and rural-to-rural migration has varied dramatically
with famines and political reforms (Ezra 2001; Tegenu 2003). Households living in the rural
areas such as the Rift Valley are faced with a number of constraints, including erratic rainfall,
recurrent droughts, rapid population growth, deforestation, soil degradation, food insecurity and
low education (Garedew et al. 2009). People are the main agents of environmental degradation
and they are also the victims. Villagers who were involved in previous research with the same
authors acknowledged the importance of a continuous discussion on the sustainable use of
forests and other natural resources, which enabled them to move towards more sustainable

practices. Farmers realized that they over used the local woodland. Recurrent drought and the
constrained subsistence agriculture drove people to overuse the forest as safety net strategy,
because other livelihood options than dry-land agriculture are very limited in the study area.
High population increase would have a major impact on the remaining forests. Further, we
experienced that farmer’s still perceive land tenure as insecure. The establishment and successful
implementation of a forest restoration site by the Forestry and Natural Resource College and an
action research project on the community land has had a positive impact on the behavior of the
surrounding farmers towards forest increase. Accordingly, people are increasingly aware of the
importance of woodland forests as a safety net during recurrent droughts and of the need to
manage them sustainably. During discussions, villagers have also expressed interest in increasing
the forest cover and forest area on the landscape. Some of them already have woodlots around
their homesteads which is an encouraging drive to others.
Further depletion of the environment, low agricultural production and worsening socio-
economic conditions, including rapid population growth could be foreseen if current trends
remain. The objective of this study is to explore a participatory dynamic simulation modeling
approach based on a dialogue with farmers in order to test different development strategies
(scenarios). The approach would include the generation of forward projections (from 2006–
2036) of land-use, population and income under various assumptions discussed with the farmers
and should contribute to the debate on how to address social-economical and environmental
changes.
Material and Methods
Study Area
The study area is ‘‘Keraru’’ Kebelle (Kebelle is the lowest administration unit in the government
structure) in the ‘‘Arsi-Negele’’ district of Oromiya National Regional State located between 205
and 210 km south of Addis Ababa (Fig. 1). It covers 2932 ha and represents a semi-arid flat land
of the district’s lowland climatic zone and is situated below 1800 m ASL (Garedew et al. 2009).
The nearby climate data from the National Meteorological Services Agency for the years’ 1972–
2005 shows that the annual rainfall ranges between 264 mm and 968 (the mean is 710 mm),
while the mean annual minimum and maximum temperatures are 13.5 and 27.7 oC, respectively.

Figure 1 Map of Ethiopia, shows location of the study area
The study area had a population of 3647 in 2004, the population density was 124 persons per
km2, the annual population growth rate was 2.5% ± 0.2 and the rural-urban migration was low
(Garedew et al. 2009). The people in the area are farmers, most of them from the Oromo ethnic
group, who practice Islam and live in polygamous families. The mainstay of their livelihoods is
agriculture including mixed livestock raising and rain-fed crop production. Major crop types
grown are maize, wheat and tef (Eragrostis tef). The government extension service is minimal.
The natural woody vegetation was dominated by woodland’s and wooded-grassland of Acacia
trees, but the area has experienced a rapid deforestation at a rate of 1% per year with cropland
successively replacing woodland and wooded grassland Acacia forests (Garedew et al. 2009).
Methods

We based the participatory modeling on an approach described by the Center for International
Forestry Research (CIFOR) (http://www.cifor.cgiar.org/conservation/_ref/research/index.htm). A
system dynamics model was built using the stock- and- flow model software (STELLA v.8) with
an icon based interface and availability of array functions (Costanza and Voinov 2001; High
Performance Systems Inc. 1996). System dynamics is a concept that considers the dynamic
interaction between the elements of the studied system and can help to understand their behavior
over time, build models, identify how information feedback governs the behavior of the system
and develop a strategy for better management of the studied system (Doerr 1996).
The study was conducted in 2009 using data inputs and assumptions from a previous study
(Garedew et al. 2009), farmers and experts from the district Agricultural & Rural Development
Bureau were involved, unpublished data and other sources (Tables 1, 2 and 3). The present study
involved a process of model building with active participation of 20 informants (focus group)
representing purposively selected households from diverse categories of wealth, age and gender
within the community to obtain diverse information. The selection was made with the help of the
Kebelle council by picking up those individuals who had formal education and considered
reasonably able to understand the topics, express feelings, opinions and perspective on the
situations.
Some members of the Kebelle council were also involved in the study. Repeated meetings
and discussions were also made with the entire community to triangulate the data obtained from
the focus group. The purpose was to obtain good understanding of their objectives in resource
management and building on their knowledge about the trends of the local environment and
livelihood (Sayer and Campbell 2004). Wherever data was lacking, information was provided
through the focus group dialogue and consensus. This helped to improve the input data of the
different sectors of the model for exploring reasonable socio-economical and environmental
pathways.
Three main scenarios were elaborated. The first one was named ‘‘business as usual’’ and did
not assume any significant change in the future conditions or stakeholders’ behavior. In the
second scenario, ‘‘strategies for socio-economic development’’, a number of assumptions

reflecting government (MoFED 2007) and local efforts for socioeconomic change, including
micro-finance, better family planning, better health and better education services, were made.

Table 1 Data inputs and assumptions for ‘land-use model sector’ in studying the trends of land-use using
various scenarios
Data
Assumption Data Sources
With forest increase strategy Without forest
increase strategy
Total area =2932 ha Farmland (FL)=57.6% Grassland (GL)=26.2% Woodland (WL)=6.6% Shrubland (SL)=5% Wooded-grassland (WGL)=1.6% Bareland (BL)=1.6% Settlement (S)=1.4%
1. 0.001% S transfer to WGL 2. No transfer from FL to GL 3. 5% WGL transfer to WL 4. No transfer from SL to BL 5. 10% SL transfer to WGL 6. No transfer from WL to WGL 7. No transfer from WL to BL 8. 0.1% GL transfer to BL 9. 2% GL transfer to WGL 10. 0.5% BL transfer to SL 11. No transfer from WGL to BL 12. No transfer from WL to SL 13. No transfer from WL to FL 14. No transfer from WL to GL 15. No transfer from WGL to FL 16. No transfer from GL to WL 17. No transfer from GL to FL
1. No transfer 2. 0.3% transfer 3. 0.1% transfer 4. 1% transfer 5. No transfer 6. 5% transfer 7. 0.5% transfer 8. 1% transfer 9. 0.7% transfer 10. No transfer 11. 0.5% transfer 12. 0.2% transfer 13. No transfer 14. 2% transfer 15. No transfer 16. 0.5% transfer 17. No transfer
Garedew et al., 2009, with small modification
LULC conversion is mainly driven by the motivation of farmers to increase forest cover and area, and by the population growth. Communities’ motivation for forest increase could help raise forest income to households. Transfer of farmland to settlement is based on the area demand from new household increases. The demand for additional FL can increase but the transfer of GL to FL does not exceed 0.3%. No suitable land for crop is available to convert from WL. If business continuous as usual further environmental degradation is expected.
The third scenario, ‘‘forest increase’’ was put in focus and modeled as a pathway for
restoring the woody vegetation in the landscape through an area closure strategy (e.g., by
excluding cattle).
Table 2 Data inputs and assumptions for ‘human population model sector’ in studying the trends of population using various scenarios
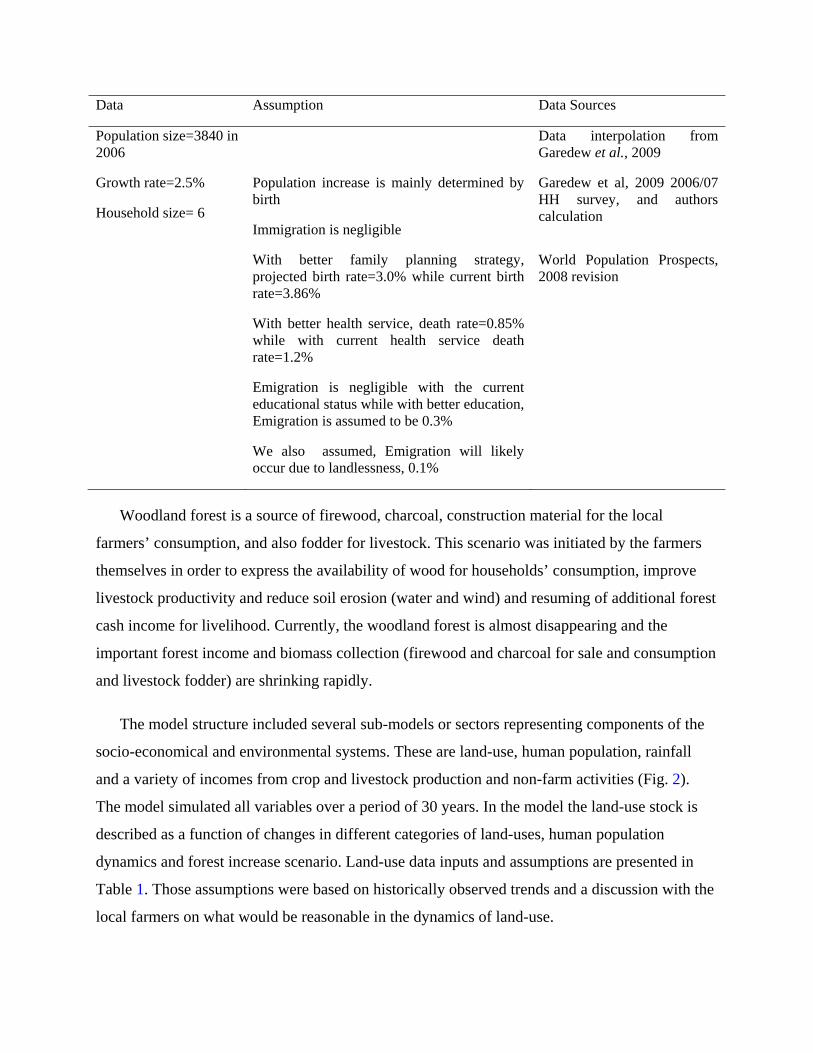
Data Assumption Data Sources
Population size=3840 in 2006
Data interpolation from Garedew et al., 2009
Growth rate=2.5%
Household size= 6
Population increase is mainly determined by birth
Immigration is negligible
Garedew et al, 2009 2006/07 HH survey, and authors calculation
With better family planning strategy, projected birth rate=3.0% while current birth rate=3.86%
With better health service, death rate=0.85% while with current health service death rate=1.2%
Emigration is negligible with the current educational status while with better education, Emigration is assumed to be 0.3%
We also assumed, Emigration will likely occur due to landlessness, 0.1%
World Population Prospects, 2008 revision
Woodland forest is a source of firewood, charcoal, construction material for the local
farmers’ consumption, and also fodder for livestock. This scenario was initiated by the farmers
themselves in order to express the availability of wood for households’ consumption, improve
livestock productivity and reduce soil erosion (water and wind) and resuming of additional forest
cash income for livelihood. Currently, the woodland forest is almost disappearing and the
important forest income and biomass collection (firewood and charcoal for sale and consumption
and livestock fodder) are shrinking rapidly.
The model structure included several sub-models or sectors representing components of the
socio-economical and environmental systems. These are land-use, human population, rainfall
and a variety of incomes from crop and livestock production and non-farm activities (Fig. 2).
The model simulated all variables over a period of 30 years. In the model the land-use stock is
described as a function of changes in different categories of land-uses, human population
dynamics and forest increase scenario. Land-use data inputs and assumptions are presented in
Table 1. Those assumptions were based on historically observed trends and a discussion with the
local farmers on what would be reasonable in the dynamics of land-use.

Figure 2 The structure of the model
The human population size is described as a function of growth rate, death rate and
emigration. The population growth is influenced by the proposed family planning, health and
education scenarios. The livestock number and livestock income are modeled as a function of the
estimated losses and increases in livestock number, the carrying capacity (feed resources) of the
area in terms of tropical livestock unit (TLU), human population dynamics and rainfall.
Livestock carrying capacity was calculated based on the total animal feed available from
different sources: grassland, crop residues and forest land (Table 3). Crop production is based on
farm size of the households, human population dynamics, the variability of rainfall and the
availability of micro-finance. Furthermore, non-farm income is based on the human population
and land-use dynamics, the availability of micro-finance and educational conditions.
The model was built for an average household whose farm size is 1.5 ha, with a cropping
area of maize (65%), wheat (25%) and tef (10%). The estimated average annual crop
productivity of maize was 1.25 ton/ha (varying between 0.7 and 2.2) while wheat was 1.1 ton/ha
(varying between 0.5 and 1.4) and tef 0.5 ton/ha (varying between 0.2 and 0.7). On the farmland,
food crops are grown for subsistence and cash needs of the farming households.
Table 3 Data inputs and assumptions income and rainfall’ model in studying the trends income and rainfall using various scenarios
Data Assumption
CROP PPODUCTION & INCOME
LIVESTOCK PRODUCTION & INCOME
LAND-USE
POPULATIONNON-FARM INCOME
TOTAL HOUSEHOLD INCOME
RAINFALL wooded-grassland
grassland
shrubland
bareland
settlement
farmland
woodland
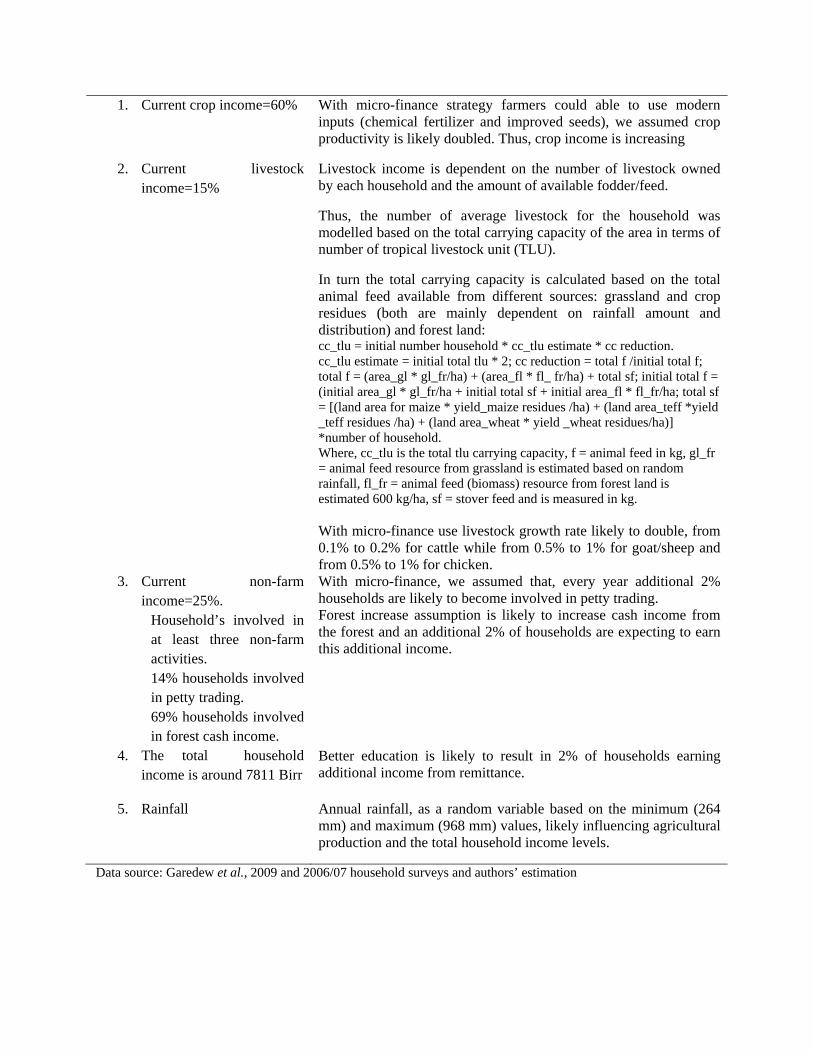
1. Current crop income=60% With micro-finance strategy farmers could able to use modern inputs (chemical fertilizer and improved seeds), we assumed crop productivity is likely doubled. Thus, crop income is increasing
2. Current livestock income=15%
Livestock income is dependent on the number of livestock owned by each household and the amount of available fodder/feed.
Thus, the number of average livestock for the household was modelled based on the total carrying capacity of the area in terms of number of tropical livestock unit (TLU).
In turn the total carrying capacity is calculated based on the total animal feed available from different sources: grassland and crop residues (both are mainly dependent on rainfall amount and distribution) and forest land: cc_tlu = initial number household * cc_tlu estimate * cc reduction. cc_tlu estimate = initial total tlu * 2; cc reduction = total f /initial total f; total f = (area_gl * gl_fr/ha) + (area_fl * fl_ fr/ha) + total sf; initial total f = (initial area_gl * gl_fr/ha + initial total sf + initial area_fl * fl_fr/ha; total sf = [(land area for maize * yield_maize residues /ha) + (land area_teff *yield _teff residues /ha) + (land area_wheat * yield _wheat residues/ha)] *number of household. Where, cc_tlu is the total tlu carrying capacity, f = animal feed in kg, gl_fr = animal feed resource from grassland is estimated based on random rainfall, fl_fr = animal feed (biomass) resource from forest land is estimated 600 kg/ha, sf = stover feed and is measured in kg.
With micro-finance use livestock growth rate likely to double, from 0.1% to 0.2% for cattle while from 0.5% to 1% for goat/sheep and from 0.5% to 1% for chicken.
3. Current non-farm income=25%.
Household’s involved in at least three non-farm activities. 14% households involved in petty trading. 69% households involved in forest cash income.
With micro-finance, we assumed that, every year additional 2% households are likely to become involved in petty trading. Forest increase assumption is likely to increase cash income from the forest and an additional 2% of households are expecting to earn this additional income.
Better education is likely to result in 2% of households earning additional income from remittance.
4. The total household income is around 7811 Birr
5. Rainfall
Annual rainfall, as a random variable based on the minimum (264 mm) and maximum (968 mm) values, likely influencing agricultural production and the total household income levels.
Data source: Garedew et al., 2009 and 2006/07 household surveys and authors’ estimation
Crop net income (both consumption and cash) was calculated by subtracting the estimated
crop cost and loss (30% of total crop income) from the total household crop income. In the study
area, an average household owns five cattle, three goat/sheep, one donkey and two chickens
which generate household livestock income, including sale of livestock products (mainly milk
and eggs), sale of livestock, plough oxen rent, transport rent and consumption uses. All farmers
do not have all kind of livestock goods throughout the year but buy and exchange internally for
their own use while they also supply to the market. The economic contribution of the livestock
sector is considerable and accounts for 15% of the total household income. In the study, non-
farm income comprises wage labor, forest- based activities, small scale fishing, sale of salt-rich
soil for cattle feed, petty trading, sale of sand for construction, sale of traditional drink,
government safety net transfer and remittance (little was reported). A household averagely
enrolled in at least the three of these non-farm income generation sources. All monetary values
are reported in Ethiopian Birr, where USD $1 = *11.50 in 2009.
Model testing was an essential part of the model development process. If the model is to be
used, it should provide relatively accurate information about the system being modeled. In this
study, the model could be validated by using land-use data from 1973 and the actual population
data of the Kebelle from 1975 as input variables (Garedew et al. 2009) and modeling of the
period 1973/75–2006. The resulting simulated land-use values for three occasions (1986, 2000
and 2006) and simulated population values for four occasions (1984, 1994, 2004 and 2006) could
then be compared to observed conditions and values derived from Garedew et al. (2009).
Result
Dynamics in Population
The population sector model simulates natural population growth annually. Table 4 shows the
simulations of population growth based on various intervention strategies, including ‘‘business
as usual’’ and ‘‘better family planning’’, ‘‘better health’’, ‘‘better education’’ and a combination
of the three latter. Over the simulation period (2006–2036), the total population growth varies
between 68% and 136% among the simulated strategies. However, when compared to ‘‘business
as usual’’, the scenario ‘‘better health’’ actually rise population growth (through reduced
mortality), while ‘‘better family planning’’ (implying reduced birth rate), ‘‘better education’’

(meaning increased emigration) and the combined scenario significantly reduce population
growth, Apparently, better family planning and the combined scenarios would be the best
pathways for a balanced population growth compared to other strategies if considering the
carrying capacity and the sustainable use of natural resources.
Table 4 Simulation of human population growth based on different the strategies
Years Business as usual (BAU)
Better family planning
Better health
Better education
Combined (without BAU)
2006 3840 3840 3840 3840 3840 2009 4143 4039 4185 4106 4045 2012 4469 4249 4561 4391 4261 2015 4821 4469 4971 4696 4489 2018 5201 4701 5418 5021 4729 2021 5610 4945 5905 5369 4981 2024 6053 5201 6435 5742 5247 2027 6529 5471 7014 6140 5528 2030 7044 5755 7644 6566 5823 2033 7599 6053 8331 7021 6134 2036 8197 6367 9079 7508 6462
Dynamics in Land-Use
The simulations of the two land-use scenarios ‘‘with’’ and ‘‘without’’ the forest increase strategy
were based on assumptions of land-use change as specified in Table 1. The simulation outcome
as presented in Table 5 illustrate that small modifications in the assumptions of annual land
transfers in the scenario ‘‘with forest increase strategy’’ (as compared to the scenario
‘‘without’’) gave as an outcome that the area of woodland increased quite considerably (203%)
at the expense of other land-use types over a 30 years period.
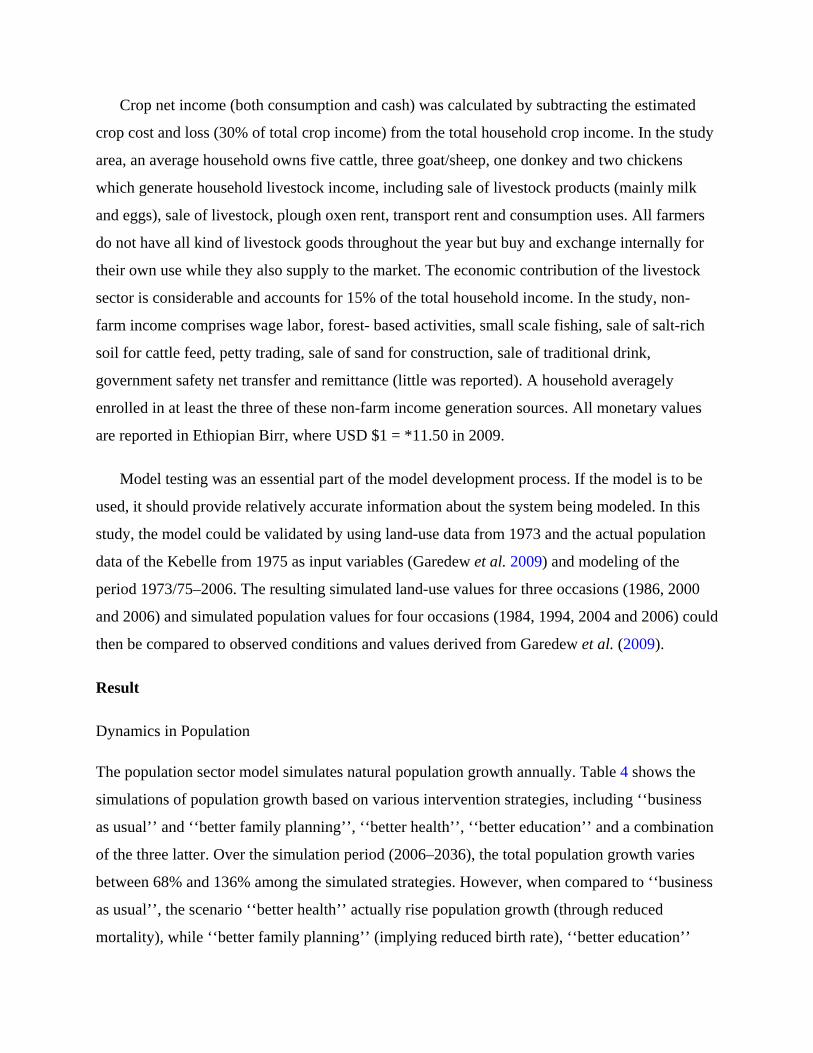
Table 5 Simulation of land-use types (ha) based on without (A) and with (B) forest increase strategies
Years Grassland Woodland Shrubland Wooded-grassland Bareland Farmland Settlement A 0 769 192 145 48 48 1696 42 3 735 174 153 89 72 1672 45 6 707 159 159 123 94 1650 49 9 683 145 163 152 115 1628 53 12 665 134 167 176 134 1608 57 15 650 123 170 196 152 1589 61 18 638 114 172 212 168 1570 66 21 628 106 173 226 184 1552 71 24 621 99 174 237 198 1536 75
27 615 93 175 247 211 1519 80 30 611 88 175 254 223 1504 85 B 0 769 192 145 48 48 1696 42 3 756 214 123 78 44 1679 45 6 745 242 108 97 40 1660 49 9 735 274 96 108 37 1638 53 12 725 309 87 114 34 1614 57 15 716 348 81 116 31 1587 61 18 706 389 76 116 29 1558 66 21 697 433 73 115 26 1525 71 24 688 480 70 113 24 1490 75 27 679 530 67 111 22 1451 80 30 670 583 65 109 20 1410 84
For the villagers who initially defined what they want to achieve, (e.g., increased woodland) the
interesting part (‘‘the result’’) would be what input data generate that output (e.g., more
woodland) and how to go about to harmonize the input data in their daily life situation.
The different rates of population growth in different scenarios affect the settlement area and
the farm size per household (see Figs. 3, 4). Overall, the total area of settlements is increasing
throughout the simulation period while the increments follow different pattern of pathways for
different intervention strategies (Fig. 3). For instance, area of settlement dramatically increases
with better health scenario compared to other intervention strategies. While the farm size per
household tends to decrease throughout the simulation years irrespective of intervention strategy
(Fig. 4). Here also better family planning and the combined scenario options are the best
alternative pathways to slowing down the trends of decreasing farm size of households.
Figure 3 Simulation of settlement areas under five different integrated strategies of scenarios: 1=business
as usual, 2=better family planning, 3= better health, 4= better education, 5=combined scenarios (2, 3 &4)

Figure 4 Simulation of per household farm size under five different integrated strategies of scenarios:
1=business as usual, 2=better family planning, 3= better health, 4= better education, 5=combined
scenarios (2, 3 &4)
Livelihood Strategies and Income Dynamics in the Households
Over the last three decades the households have mainly followed an increasingly extensive
mixed agricultural livelihood strategy (crop and livestock). Farmers have recognized that
recurrent droughts, erratic rainfall and soil degradation have influenced the agricultural
productivity and food security. As those droughts occurred and the population increased, the
forest cover has decreased when farmers tried to compensate the declining crop productivity by
opening new croplands for subsistence agriculture. At this stage no more suitable land is left for
cropland expansion. The demand for land by new households has also increased and as a result
farm size per household is diminishing. During normal rainfall seasons high costs for agricultural
inputs (chemical fertilizer and improved seeds) and lack of plow oxen exacerbate the challenges
for the crop production sector. Households’ efforts to diversify incomes through non-farm
economic activities in order to buy food for the dry season can only provide marginal
opportunities to fill the food gap.
The simulation of the average household income from crops and livestock (Table 6) followed
a range of patterns between different intervention strategies. For agricultural income, all of the
intervention strategies, both the microfinance and the combined scenarios, considerably
improved household incomes in the long-term but they had no regular patterns over the separate
years of simulation. The reason is that households’ income is regulated by the amount of income

generated from agricultural production, which is largely dependent on the amount of rainfall and
its distribution within the growing season, since agriculture is mostly rain-fed in the study area.
Table 6 Simulation of farm household incomes (Birr) based on different strategies
Years Crop income Livestock income Business as usual (BAU)
Micro- finance
Business as usual (BAU)
Forest increase
Micro- finance
Combined (without BAU)
2006 3248 7307 2562 2562 2562 2562 2009 3518 8457 3043 3043 3175 4657 2012 4480 8681 3054 3054 3496 4093 2015 3297 9898 2790 2790 3195 5110 2018 3702 10270 2917 2917 3581 4342 2021 3869 9570 3007 3007 3300 3754 2024 5075 8650 2998 2998 3297 4008 2027 2844 11528 2535 2535 2742 4268 2030 3127 8805 2685 2685 2965 3810 2033 5409 5668 2405 2405 2510 3793 2036 2796 7017 2188 2188 2576 3465
A rainfall model was produced by a random generator providing annual rainfall values
between 250 mm and 950 mm. The simulated output shows that the magnitude of agricultural
income (in particular income from crops) per household varies with the amount of rainfall in the
area (Fig. 5).
Figure 5 Relationships between the simulated rainfall (mm) and household income under the micro-finance strategy
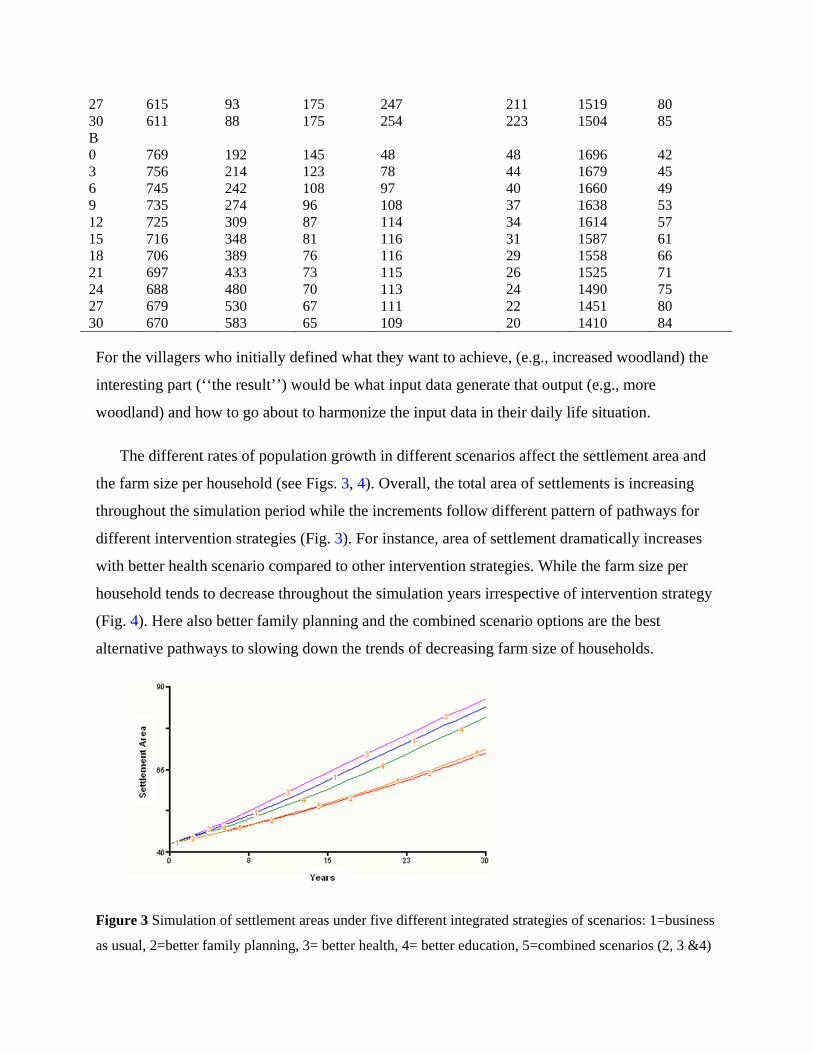
On the other hand, nonfarm income (Table 7) was constant throughout the simulation period
at a level specific for each of the strategies. Informants reported that in the past many households
had been involved in forest activities and generate substantial non-farm income from sale of
firewood, charcoal and other forest-based products. As an example, 69% of the households of the
study are extracting some income from the remnant Acacia forest. Hence, the modeling output
showed that there would be an increasing non-farm income through the ‘‘forest increase’’
strategy and this was simulated to be doubled when compared to the ‘‘business as usual’’
strategy.
Table 7 Simulation of non-farm household income (Birr) based on different strategies
Years Business as usual (BAU)
Forest increase
Micro- finance
Better education
Combined (without BAU)
2006 795 1230 811 796 1247 2009 795 1230 811 796 1247 2012 795 1230 811 796 1247 2015 795 1230 811 796 1247 2018 795 1230 811 796 1247 2021 795 1230 811 795 1247 2024 795 1230 811 795 1247 2027 795 1230 811 795 1247 2030 795 1230 811 795 1247 2033 795 1230 811 795 1247 2036 795 1230 811 795 1247
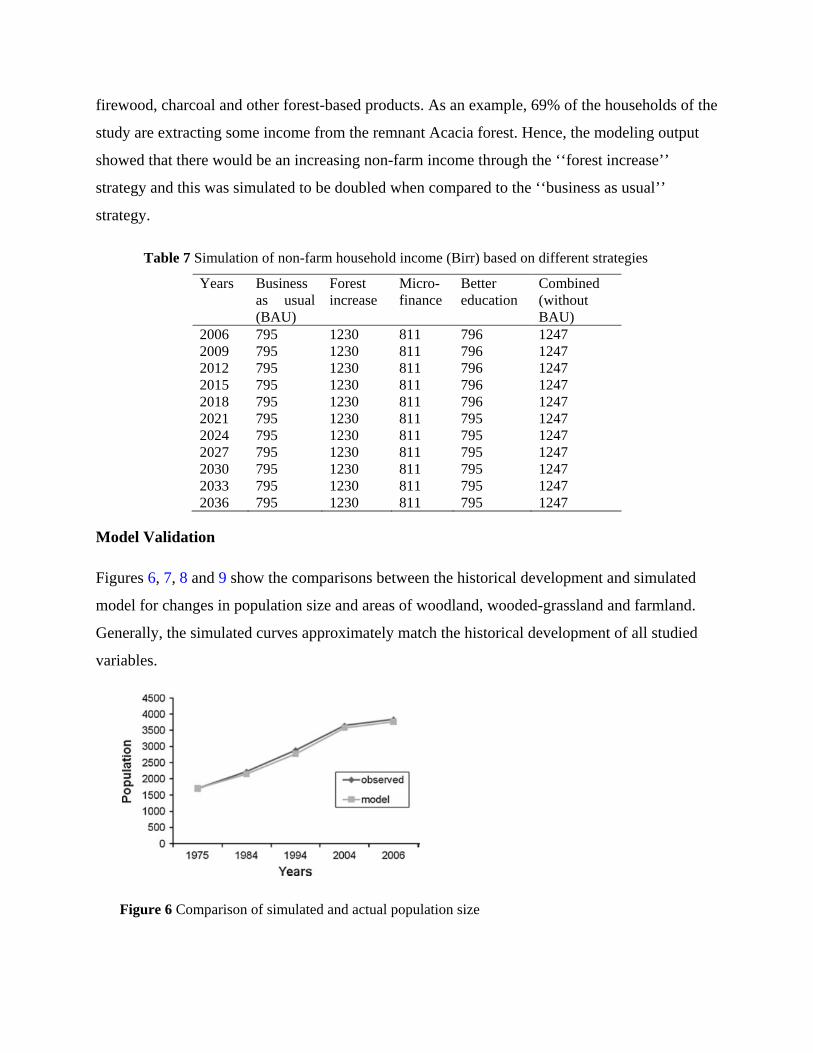
Model Validation
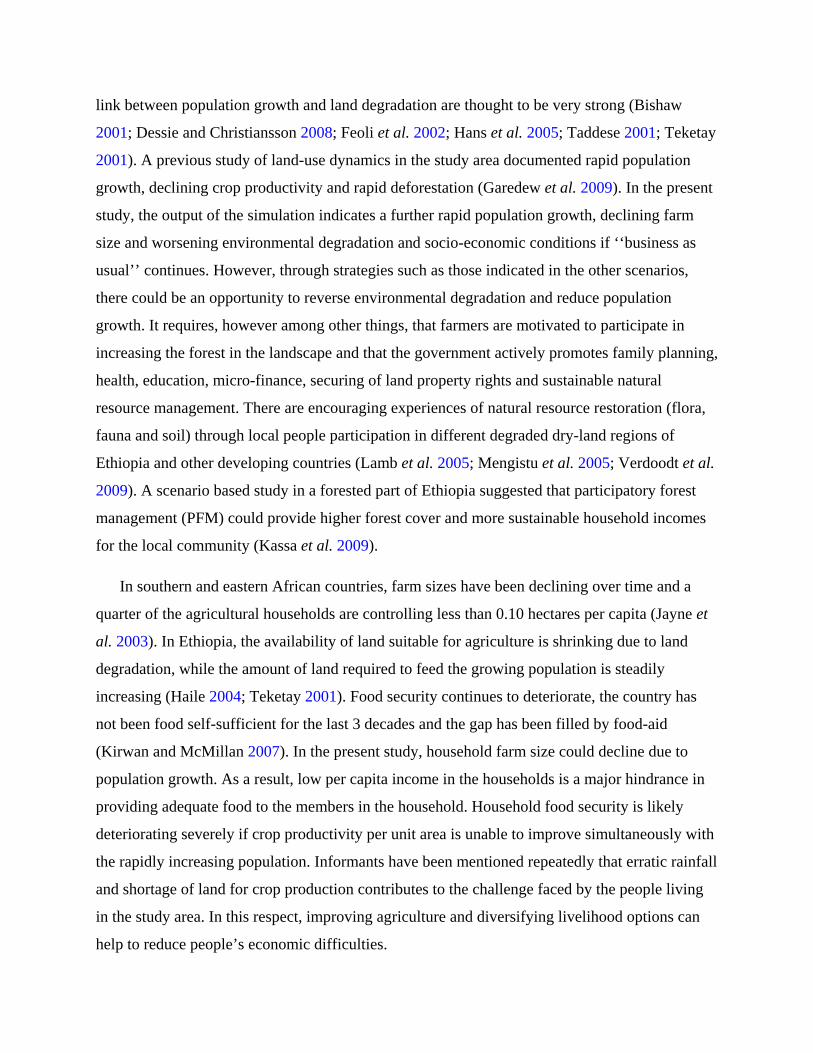
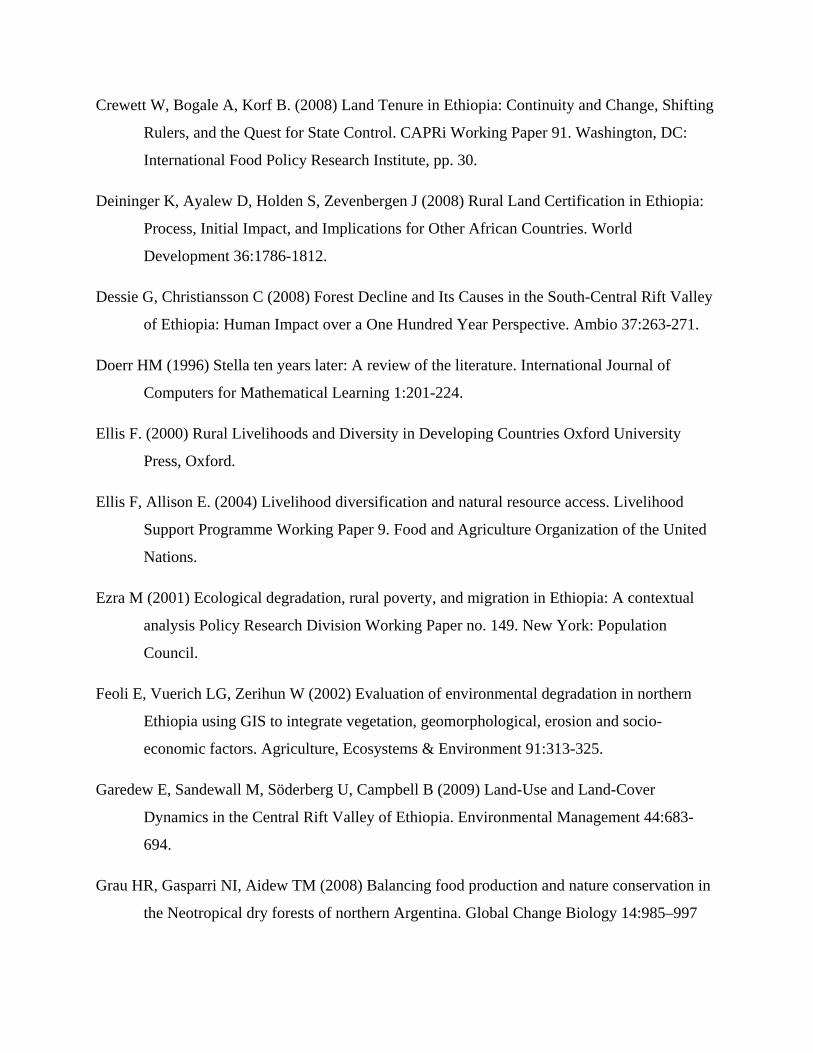
Figures 6, 7, 8 and 9 show the comparisons between the historical development and simulated
model for changes in population size and areas of woodland, wooded-grassland and farmland.
Generally, the simulated curves approximately match the historical development of all studied
variables.
Figure 6 Comparison of simulated and actual population size
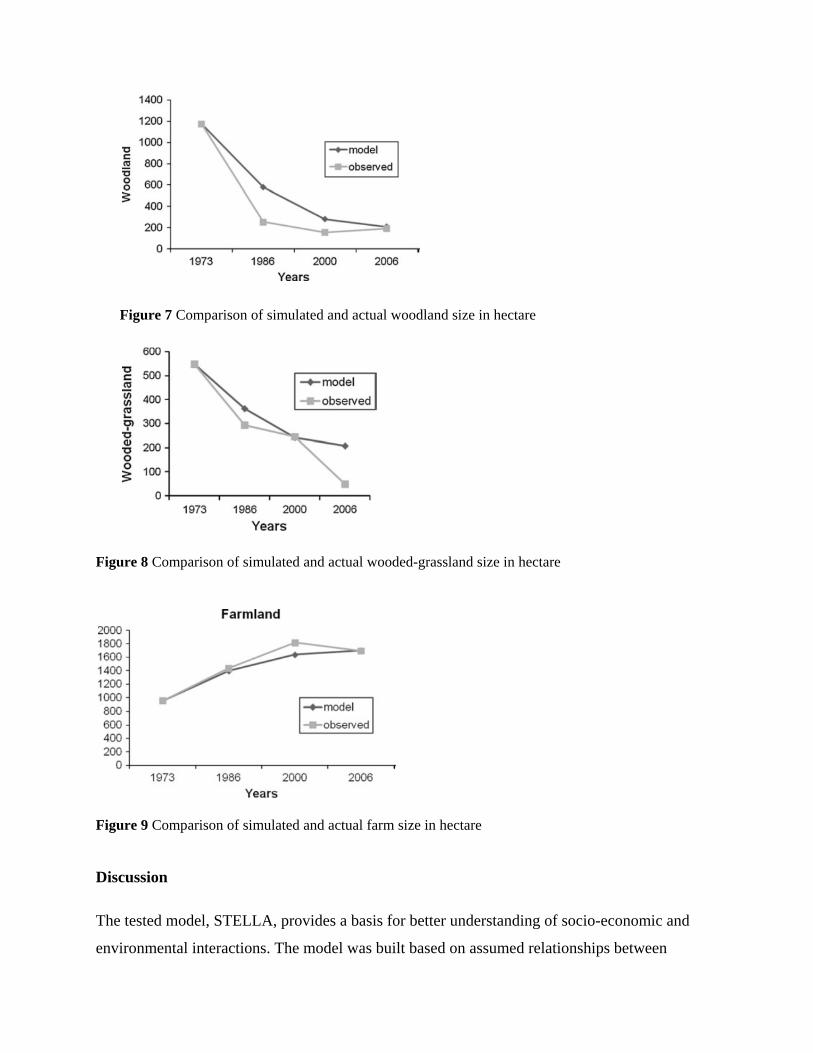
Figure 7 Comparison of simulated and actual woodland size in hectare
Figure 8 Comparison of simulated and actual wooded-grassland size in hectare
Figure 9 Comparison of simulated and actual farm size in hectare
Discussion
The tested model, STELLA, provides a basis for better understanding of socio-economic and
environmental interactions. The model was built based on assumed relationships between

different variables. The outcome of a simulation is entirely dependent on those relationships and
the input data. Therefore, any output always needs to be analyzed in relation to those input
assumptions. The use of a simulation model to predict the future development of the dynamic
system under various conditions (or to study what input data generate a certain desired output) is
important in developing effective strategies. There are many examples of similar system models
that could contribute to the environmental management practices (Hellde´n 2008; Kassa et al.
2009; Sandewall and Nilsson 2001; Sayer et al. 2007; Ste´phenne and Lambin 2001). A
participatory approach in scenario modeling is also an excellent platform for discussing
strategies among different concerned stakeholders. If research data on historical trends are
available it adds quality to the discussion on future developments.
We emphasize that a simulation model is not a forecasting instrument but a planning and
analysis tool. It generates questions to be asked rather than direct answers. If a scenario suggests
that farmers need to convert a certain cropland to woodland the question would be what efforts,
resource inputs or strategies are required to achieve that. If that is not possible the question
would be what other strategies could achieve an acceptable result. A more technical type of
questions would be if the scenario or even the model accurately responds to or describes to the
real world changes or if the model needs to be adjusted. One simple example of the later could
be changes in birth rate as a result of ‘‘family planning’’ which may not happen instantly but
change gradually over time.
In our model testing, it was not possible to undertake a strict statistical evaluation of the
model because of the nature of the input data sets that encompasses a few separate years only.
Therefore, instead of calculating error variance we used a graphical approach. The simulation
outcomes are rough indications rather than very precise predictions. Validation with the
historical development of some of the variables indicates that the model responds to key input
variables more or less in a correct way.
The relationship between population growth and environmental changes is still an area of
active debate (Alexandratos 2005; Carr et al. 2005; Grau et al. 2008; Jha and Bawa 2006;
Nyssen et al. 2004). In Ethiopia, population growth increases the demand for arable land and
encourages the conversion of forests to agriculture. It also increases the demand for wood. The
link between population growth and land degradation are thought to be very strong (Bishaw
2001; Dessie and Christiansson 2008; Feoli et al. 2002; Hans et al. 2005; Taddese 2001; Teketay
2001). A previous study of land-use dynamics in the study area documented rapid population
growth, declining crop productivity and rapid deforestation (Garedew et al. 2009). In the present
study, the output of the simulation indicates a further rapid population growth, declining farm
size and worsening environmental degradation and socio-economic conditions if ‘‘business as
usual’’ continues. However, through strategies such as those indicated in the other scenarios,
there could be an opportunity to reverse environmental degradation and reduce population
growth. It requires, however among other things, that farmers are motivated to participate in
increasing the forest in the landscape and that the government actively promotes family planning,
health, education, micro-finance, securing of land property rights and sustainable natural
resource management. There are encouraging experiences of natural resource restoration (flora,
fauna and soil) through local people participation in different degraded dry-land regions of
Ethiopia and other developing countries (Lamb et al. 2005; Mengistu et al. 2005; Verdoodt et al.
2009). A scenario based study in a forested part of Ethiopia suggested that participatory forest
management (PFM) could provide higher forest cover and more sustainable household incomes
for the local community (Kassa et al. 2009).
In southern and eastern African countries, farm sizes have been declining over time and a
quarter of the agricultural households are controlling less than 0.10 hectares per capita (Jayne et
al. 2003). In Ethiopia, the availability of land suitable for agriculture is shrinking due to land
degradation, while the amount of land required to feed the growing population is steadily
increasing (Haile 2004; Teketay 2001). Food security continues to deteriorate, the country has
not been food self-sufficient for the last 3 decades and the gap has been filled by food-aid
(Kirwan and McMillan 2007). In the present study, household farm size could decline due to
population growth. As a result, low per capita income in the households is a major hindrance in
providing adequate food to the members in the household. Household food security is likely
deteriorating severely if crop productivity per unit area is unable to improve simultaneously with
the rapidly increasing population. Informants have been mentioned repeatedly that erratic rainfall
and shortage of land for crop production contributes to the challenge faced by the people living
in the study area. In this respect, improving agriculture and diversifying livelihood options can
help to reduce people’s economic difficulties.

Conclusions
The model predicts an extensive land-use change, largely based on both the decisions of the
community and natural population growth. The study simulates rapid population growth,
declining household farm size, declining household income, further deterioration of forest cover
and worsening land degradation if current practices continue.
The outlined ‘‘forest increase scenario’’ suggests a pathway that might possibly improve the
restoration of forest cover in the landscape and subsequently raising household income. It
addresses a critical issue but is not an easy way to go, which in practice requires the right
decisions, confidence and interplay among farmers as well as government in order to bring back
the forest.
The scenarios suggest that the level of population growth could be reduced with various
strategies of family planning and education. This has an implication on the land-use patterns, the
per capita household income and thereby on household food security. The amount of household
income is largely dependent on the amount and distribution of rainfall and use of micro-finance.
There was a strong relationship between rainfall variability and agricultural production.
Although, the simulation outcomes are predicted values, the study illustrates that the model
can be used as a valuable supporting tool which can aid in the decision making processes in
natural resource management. Local or regional planners can easily adapt the model and change
variables following additional knowledge and discussions with interested stakeholders in the
local area.
Acknowledgments
The authors are thankful to Professor Bruce M. Campbell and Dr. Neil Collier for their helpful
professional support and Neil Cory editing the paper. We would like to thank the farmers and
field-guides for their valuable participation and time. Special thanks go to Wondo Genet College
of Forestry and Natural Resources and the Swedish International Development Agency (Sida) for
financing the study.
References

Adams WM, Aveling R, Brockington D, Dickson B, Elliott J, Hutton J, Roe D, Vira B, Wolmer
W (2004) Biodiversity Conservation and the Eradication of Poverty. Science 306:1146-
1149.
Alexandratos N (2005) Countries with Rapid Population Growth and Resource Constraints:
Issues of Food, Agriculture, and Development. Population and Development Review
31:237-258.
Amsalu A, de Graaff J (2006) Farmers’ views of soil erosion problems and their conservation
knowledge at Beressa watershed, Central highlands of Ethiopia. Agriculture and Human
Values 23:99–108
Argaw M. (2005) Forest conversion, soil degradation, farmers’ perception nexus: implications
for sustainable land use in the south-west of Ethiopia. PhD thesis, University of Bonn.
Bishaw B (2001) Deforestation and Land Degradationin the Ethiopian Highlands: A Strategy for
Physical Recovery. Northeast African Studies 8:7-25.
Bogale A, Taeb M, Endo M (2006) Land ownership and conflicts over the use of resources:
implication for household vulnerability in eastern Ethiopia. Ecological Economics
58:134–145
Campbell BM, Sayer J, Cowling R, Kassa H, Knight A, Sandker M, Suwarno A. (2008) The role
of participatiory modelling in landscape approaches to reconcile conservation and
development, IUCN and CIFOR.
Carr DL, Suter L, Barbieri A (2005) Population Dynamics and Tropical Deforestation: State of
the Debate and Conceptual Challenges. Population & Environment 27:89-113.
Chan K, Pringle R, Ranganathan J, Boggs C, Chan Y, Ehrlich P, Haff P, Heller N, Al-Khafaji, K
MD (2007) When agendas collide: human welfare and biological conservation.
Conservation Biology 21:59-68.
Costanza R, Voinov A (2001) Modeling ecological and economic systems with STELLA: Part
III. Ecological Modelling 143:1-7.
Crewett W, Bogale A, Korf B. (2008) Land Tenure in Ethiopia: Continuity and Change, Shifting
Rulers, and the Quest for State Control. CAPRi Working Paper 91. Washington, DC:
International Food Policy Research Institute, pp. 30.
Deininger K, Ayalew D, Holden S, Zevenbergen J (2008) Rural Land Certification in Ethiopia:
Process, Initial Impact, and Implications for Other African Countries. World
Development 36:1786-1812.
Dessie G, Christiansson C (2008) Forest Decline and Its Causes in the South-Central Rift Valley
of Ethiopia: Human Impact over a One Hundred Year Perspective. Ambio 37:263-271.
Doerr HM (1996) Stella ten years later: A review of the literature. International Journal of
Computers for Mathematical Learning 1:201-224.
Ellis F. (2000) Rural Livelihoods and Diversity in Developing Countries Oxford University
Press, Oxford.
Ellis F, Allison E. (2004) Livelihood diversification and natural resource access. Livelihood
Support Programme Working Paper 9. Food and Agriculture Organization of the United
Nations.
Ezra M (2001) Ecological degradation, rural poverty, and migration in Ethiopia: A contextual
analysis Policy Research Division Working Paper no. 149. New York: Population
Council.
Feoli E, Vuerich LG, Zerihun W (2002) Evaluation of environmental degradation in northern
Ethiopia using GIS to integrate vegetation, geomorphological, erosion and socio-
economic factors. Agriculture, Ecosystems & Environment 91:313-325.
Garedew E, Sandewall M, Söderberg U, Campbell B (2009) Land-Use and Land-Cover
Dynamics in the Central Rift Valley of Ethiopia. Environmental Management 44:683-
694.
Grau HR, Gasparri NI, Aidew TM (2008) Balancing food production and nature conservation in
the Neotropical dry forests of northern Argentina. Global Change Biology 14:985–997
Geist HJ, Lambin EF (2002) Proximate Causes and Underlying Driving Forces of Tropical
Deforestation. BioScience 52:143-150.
Haile S (2004) Population, Development, and Environment in Ethiopia. ECSP REPORT •
ISSUE 10 • 2004.
Hans H, Kebede T, Gete Z ( 2005) The Implications of Changes in Population, Land Use, and
Land Management for Surface Runoff in the Upper Nile Basin Area of Ethiopia.
Mountain Research and Development 25 147–154.
Hartemink AE, Veldkamp T, Bai Z (2008) Land Cover Change and Soil Fertility Decline in
Tropical Regions. Turkish Journal of Agriculture and Forestry 32:195-213.
Helldén U (2008) A coupled human-environment model for desertification simulation and
impact studies. Global and Planetary Change 64:158-168.
High Performance Systems Inc. (1996) STELLA Software Technical Documentation.
Hutton J, Adams WM, Murombedzi JC (2005) Back to the barriers? Changing narratives in
biodiversity conservation. Forum for Development Studies 2:341–370
Jayne TS, Yamano T, Weber MT, Tschirley D, Benfica R, Chapoto A, Zulu B (2003)
Smallholder income and land distribution in Africa: implications for poverty reduction
strategies. Food Policy 28:253-275.
Jha S, Bawa KS (2006) Population growth, human development, and deforestation in
biodiversity hotspots. Conservation Biology 20:906–912
Kassa H, Campbell B, Sandewall M, Kebede M, Tesfaye Y, Dessie G, Seifu A, Tadesse M,
Garedew E, Sandewall K (2009) Building future scenarios and uncovering persisting
challenges of participatory forest management in Chilimo Forest, Central Ethiopia.
Journal of Environmental Management 90:1004-1013.
Kirwan BE, McMillan M (2007) Food Aid and Poverty. American Journal of Agricultural
Economics 89:1152-1160.
Lamb D, Erskine PD, Parrotta JA (2005) Restoration of degraded tropicat forest landscapes.
Science 310:1628-1632.
Lambin EF, Geist HJ, Lepers E (2003) Dynamics of land-use and land-cover change in Tropical
regions. Annual Review of Environment and Resources 28:205-41.
Mahmud Y, Mekonnen A, Kassie M, Pender J. (2007) Cost of Land Degradation in Ethiopia: A
critical review of past studies, EfD/WB.
Mengistu T, Teketay D, Hultén H, Yemshaw Y (2005) The Role of Communities in Closed Area
Management in Ethiopia. Mountain Research and Development 25:44-50.
MoFED (2007) Ethiopia: Building on Progress: A Plan for Accelerated and Sustained
Development to End Poverty (PASDEP). Annual Progress Report 2006/07, Ministry of
Finance and Economic Development (MoFED), Addis Ababa. pp. 141.
Nyssen J, Poesen J, Moeyersons J, Deckers J, Haile M, Lang A (2004) Human impact on the
environment in the Ethiopian and Eritrean highlands—a state of the art. Earth-Science
Reviews 64:273–320
Nyssen J, Poesen J, Deckers J (2009) Land degradation and soil and water conservation in
tropical highlands. Soil & Tillage Research 103:197-202.
Robbins P, McSweeney K, Waite T, Rice J (2006) Even conservation rules are made to be
broken: implications for biodiversity. Environmental Management 37:162-169.
Romero C, Andrade G (2004) Internation conservation organizations and the fate of local
tropical conservation initiatives. Conservation Biology 18:578–580
Sanderson S, Redford K (2003) Contested relationships between biodiversity conservation and
poverty alleviation. Oryx 37:389-390.
Sandewall M, Nilsson NE (2001) The Area Production Model: A tool and concept for
sustainable land-use and forest-resource management. Journal of Environmental
Management 62:415-427.

Sayer JA, Campbell BM. (2004) The science of sustainable development: local livelihoods and
the global environment Cambridge University Press, Cambridge, UK.
Sayer J, Campbell B, Petheram L, Aldrich M, Perez M, Endamana D, Dongmo Z-L, Defo L,
Mariki S, Doggart N, Burgess N (2007) Assessing environment and development
outcomes in conservation landscapes. Biodiversity and Conservation 16:2677-2694.
Segele ZT, Lamb PJ (2005) Characterization and variability of Kiremt rainy season over
Ethiopia. Meteorology and Atmospheric Physics 89:153-180.
Singh S (2008) Social challenges to integrating conservation and development: the case of
wildlife use in Laos. Society and Natural resources 21:952–955
Stéphenne N, Lambin EF (2001) A dynamic simulation model of land-use changes in Sudano-
sahelian countries of Africa (SALU). Agriculture, Ecosystems and Environment 85:145-
161.
Sunderland T, Ehringhaus C, Campbell B (2008) Conservation and development in tropical
forest landscapes: a time to face the trade-offs? Environmental Conservation 34:276–279
Taddese G (2001) Land degradation: A challenge to Ethiopia. Environmental Management
27:815-824.
Tegenu T (2003) Socio-economic and Environmental Effects of Age Transition in Ethiopia,
1950-2000. Institute for Future Studies Stockholm. Paper presented at the First
International Conference on the Ethiopian Economy, Addis Ababa.
Teketay D (2001) Deforestation, Wood Famine, and Environmental Degradation in Ethiopia’s
Highland Ecosystems: Urgent Need for Action. Northeast African Studies 8:53-76.
UNFCCC. (2007) Climate change: impacts, vulnerabilities and adaptation in developing
countries United Nations Framework Convention on Climate Change (UNFCCC), Bonn,
Germany.

United Nations Population Division (2009) Population Division of the Department of Economic
and Social Affairs of the United Nations Secretariat, World Population Prospects: The
2008 Revision. http://esa.un.org/unpp. Accessed 13 August 2009.
Verdoodt A, Mureithi SM, Ye L, Ranst EV (2009) Chronosequence analysis of two enclosure
management strategies in degraded rangeland of semi-arid Kenya. Agriculture,
Ecosystems and Environment 129:332-339.