Embed Size (px)
Citation preview

1
Ian LLoyd SenIor dIrector, PharmaProjectS/PIPeLIne and data IntegratIon
citeline Pharma r&d annual review 2014

2
Welcome to Citeline’s 2014 review of trends in pharmaceutical R&D. For over twenty years, I’ve been taking an annual look at the state of the pharma nation, freezing the pipeline in time and comparing it to similar data points in previous years. By looking at our information on commercial drug R&D over several years, I’ve identified new trends, raised alarm bells at worrisome signs, or banged the drum for the industry’s successes. In this article, we will be seeing how the pipeline at the very start of 2014 has changed in the past twelve months, and looking for pointers as to what the new year might bring. Here, we’ll be concentrating on the pipeline as a whole. I’ll be adding my thoughts as to the industry’s success stories of the year just passed when we issue our review of 2013’s New Active Substance launches as a supplement to this report, at the beginning of March 2014.
total size of pipeline – up, up and away!So let’s dive straight in with the always hotly-anticipated ‘headline figure’ for the year – the total size of the
global pipeline. Citeline’s drug information service, Pharmaprojects/Pipeline, here counts a pipeline drug
as a single entity or project which is somewhere on its journey from preclinical development through to
market launch. It does also include drugs which are already commercially available but are continuing in
development for follow-on indications or for additional markets. And this year, the news is striking. With
11,307 drugs currently in R&D, the pipeline has swollen by a whopping 7.9%.
A look at Figure 1, which shows the equivalent figure for every year going back to 2001, highlights why this
percentage increase is remarkable in more than one way. Firstly, leaving aside the anomalous increase
seen in from 2007 to 2008 where the rise is hugely flattered by the merging of drug data from our original
database with that from the then newly-acquired Citeline database of clinical trials (Trialtrove), this is by
Figure 1. Total R&D Pipeline Size by Year 2001-2014
5995 6198 6416 6994
7360 7406 7737
9217
9605 9737 9713 10452 10479
11307
0
2000
4000
6000
8000
10000
12000
2001 2002 2003 2004 2005 2006 2007 2008 2009 2010 2011 2012 2013 2014
Source: Pharmaprojects® Pipeline®, January 2014

3
Source: Pharmaprojects® Pipeline®, January 2014
Figure 2. Pipeline By Development Phase
5106
1446
1889
693
158 79
920
102
5484
1541
2011
744
170 95
1074
74 0
1000
2000
3000
4000
5000
6000
Preclin Phase I Phase II Phase III Pre-reg Registered Launched Suspended
2013
2014
some distance the biggest annual increase in numbers ever seen. It’s also the heftiest in percentage terms
in a decade, since the 9.0% seen from 2003 to 2004. This however only represented a jump of 578 drugs – this
year’s rise was of almost one and a half times as many. But the expansion is also in sharp contrast to the change
seen last year, which was almost flat. In fact, it seems that the curious ‘step-wise’ progression of pipeline growth
is undergoing another cycle. There are no internal changes in editorial procedure this year which can explain
this sudden upwards trajectory, so we are forced to conclude that there is genuine growth in the industry’s
pipeline, perhaps tinged with greater disclosure from the pharmaceutical companies. If the latter is a big
factor here, we would expect bigger increases at the earlier stages of development where publication of
compound data is more discretionary, so let’s move to break the pipeline down by development stage.
the 2014 pipeline by phase – increases across the boardThe first thing to note when we examine Figure 2, which looks at the numbers of drugs at each global
development status both now and a year ago, is that there are more drugs at every active development
status now. But this pattern of increase is indeed not uniform. While the number of drugs at Phase I and
Phase II clinical trials has increased by 6.6 and 6.5%, respectively, those at the Preclinical stage of development
have grown their number by 7.4%. This would indicate that a small part of the pipeline size growth could
have come from increased disclosure, or better detection on our part, but that the majority of the increase
is likely genuine organic growth. Indeed, the Phase III figure rose by the same percentage as the Preclinical
one. Interestingly, the biggest growth is seen with the Launched (but still Active) drugs – up 16.7%. This
is surely evidence of companies increasingly wringing more from their successful drugs by continuing to
develop them post-marketing for additional indications.

4
Regular readers of the Citeline Pharma R&D Annual Reviews may recall that last year, alarm bells were
sounding at the Phase I figure, which had shown a decline for the first time ever. Happily, this appears to
have been something of a blip, with the 2014 number more than recovering. Similarly, after flattish data
at Phase II and Phase III in 2013, this year sees a resumption of growth, with the data for Phase II looking
particularly impressive. The numbers of drugs in Phase I, II and III have in fact grown by a formidable
45.3, 47.9 and 66.9%, respectively, over the study period, and eight years is really not that long a time.
This is all mightily encouraging.
As always, a quick note about the seemingly counterintuitive fact that the Phase II figure always exceeds
that for Phase I figure, when clearly drugs drop out of development between the two phases. This is an
effect produced by the snapshot nature of the data: because drugs spend far less time passing through
Phase I, at any one time, more are undergoing the much longer Phase II trials.
The statistics which are usually of most interest here are those surrounding the clinical phases of development,
in many ways the ‘beating heart’ of the pipeline. It’s here that the most clues as to the overall health of the
industry in the coming years can be garnered, so it’s worthwhile taking a slightly longer term look at the
data here. In Figure 3, we look back to 2007 to see how the numbers of drugs at Phases I to III have
changed over an eight year period.
Figure 3. Clinical Phase Trends 2007-2014
0
500
1000
1500
2000
2500
Phase I Phase II Phase III
2007
2008
2009
2010
2011
2012
2013
2014
Source: Pharmaprojects® Pipeline®, January 2014

5
top companies – stability rulesSo if it’s all good news at the top end of our analysis, who are the movers and shakers which stand to
benefit from – or are producing – this upward surge in the industry’s thermometer? Table 1 gives the
standings of the Top 25 pharma companies by the size of their pipelines. This shows GlaxoSmithKline
(GSK) maintaining its place at the summit, but with a much-reduced lead over its nearest rival, Hoffmann-La
Roche. The latter Swiss-based multinational is also revealed to be the company which originated the most
of its development compounds. Interestingly, GSK is the only one of the top five to have fewer R&D
projects this year than last, albeit by only eight drugs. The biggest mover is AstraZeneca (AZ), up to
number five on the back of a 25% expansion in its portfolio. The company did acquire a number of small
companies during 2013, including AlphaCore, Pearl Therapeutics and Aplimmune, but this alone would not
account for such an increase.
table 1: top 25 Pharma companies by size of pipeline
PoSItIon 2014 (2013) comPany no of drugS In PIPeLIne 2014 (2013)
no of orIgInated drugS 2013
1 (1) GlaxoSmithKline 261 (269) 152
2 (2) Hoffmann-La Roche 248 (227) 179
3 (3) Novartis 223 (215) 158
4 (5) Pfizer 205 (202) 136
5 (8) AstraZeneca 197 (157) 110
6 (4) Merck & Co 186 (207) 115
7 (6) Sanofi 180 (183) 83
8 (7) Johnson & Johnson 164 (157) 81
9 (9) Bristol-Myers Squibb 133 (141) 104
10 (10) Takeda 132 (141) 71
11 (11) Eli Lilly 124 (117) 103
12 (12) AbbVie* 113 (114) 3
13 (13) Amgen 97 (95) 75
14 (15) Daiichi Sankyo 96 (91) 54
15 (14) Astellas 92 (93) 54
16 (16) Bayer 88 (87) 57
17 (18) Teva 84 (75) 36
18 (19) Boehringer Ingelheim 81 (68) 57
19 (17) Eisai 79 (81) 45
20 (21) Dainippon Sumitomo Pharma 63 (54) 43
21 (20) Merck KGaA 61 (56) 24
22 (-) Otsuka 60 (-) 37
23 (-) Mitsubishi Tanabe Pharma 56 (-) 35
24 (25) Celgene 53 (47) 26
25 (23) Shionogi 52 (49) 25
*In 2013, Abbott was at No.12 as data was taken just prior to the AbbVie spin-off. The reason that AbbVie has so few originated compounds is that Abbott remains as a discontinued originator on the compounds which it spun-out to AbbVie (which is listed as a licensee)
Source: Pharmaprojects® Pipeline®, January 2014

6
Elsewhere, what’s most remarkable is how little has changed. In what was a year of relative stability for big
pharma in terms of mergers and acquisitions – or a lack thereof – most companies simply shuffled around
slightly in our chart. Despite the continuing lull in mega-merger activity, we still reported on 64 mergers or
acquisitions over the course of the year, which is more than one a week on average. But it’s the complexion
of this activity which has changed, with big pharma firms increasingly, as AZ did, picking up tiny companies
in order to get their hands on a specific technology or drug. This is a prime way in which larger concerns
are seeking to broaden their portfolios at a lower cost, and with far less disruption, than via the traditional
mega-merger. It might also be viewed as an indictment of their own inability to innovate, and proof that
small companies are the ones with the intellectual agility needed to perform truly creative R&D.
So if the big pharma sharks are busy gobbling up the smaller fish, how has this affected the overall
population profile of the R&D ocean? Well, certainly there are more than enough new companies diving
into R&D to replenish this loss. In fact, as Figure 4 shows, 2013 saw the biggest upsurge in the total number
of companies with pipelines seen to date. As of Jan 2014, there were 3,107 pharma R&D firms, an increase
of 362 (13.2%) on the figure from twelve months ago. So perhaps this is the real story this year – an increase
in pipeline size which is to some extent being fuelled by a surge in new company creation.
Figure 4. Total Number of Companies with Active Pipelines 2001-2013
1198 1313
1503 1576 1621 1633 1769
1965 2084
2207 2387
2705 2745
3107
0
500
1000
1500
2000
2500
3000
3500
2001 2002 2003 2004 2005 2006 2007 2008 2009 2010 2011 2012 2013 2014
Year
Source: Pharmaprojects® Pipeline®, January 2014
We can look into this apparent proliferation of R&D minnows in a bit more detail. Last year, 1,475 of the
2,705 reported companies had just one or two candidates in their pipelines. The equivalent figure this year
is up to 1,646. So it seems that the growth in the number of tiny firms is actually only part of the story.
Interestingly, the rate of company addition to our data set, with 492 being newly identified over the past
twelve months, is only marginally above that seen in the previous year, but then the total number was
almost flat. This would lead us to believe that fewer companies left the R&D space in 2013 than in 2012,
which is surely a positive sign, since many of those which drop off the radar do so as a result of business
failure. It also means that, as much as the big pharma fish are feeding on their smaller niche cousins, there

7
is an ever richer shoal of new companies to harvest. This enrichment of pharma’s biosphere, perhaps more
than anything else, gives us cause for great optimism for the future of the industry.
It also forms part of a trend we have been observing over a number of years now where, as the smaller
companies multiply, the power of the biggest pharma companies is beginning to dwindle somewhat. This
year, the Top 10 multinational firms in Table 1 have originated just 10.5% of all compounds in R&D, down
from 11.5% last year and 13.4% the year before. This is not surprising when you consider that certain of the
Top 10 actually have smaller pipelines this year than last. But is this an intrinsically bad thing? Many would
argue that it’s quality rather than quantity that these companies need, and that an organization can only
sensibly manage a portfolio of a limited size. The proof of the pudding, as ever, can only be in seen in the
industry’s ultimate successful output of new drugs onto the market. It’s this topic which we’ll be analyzing
in detail in the New Active Substances in 2013 supplement to this report, to be published in March 2014.
The geographical distribution of the industry is also changing, albeit extremely gradually. Figure 5 looks
at the headquarter countries of the companies developing drugs and contrasts it with the same data from
a year ago. It shows a further small decline in US dominance: America had 50% of companies in 2012,
and has lost 1% share in both years since then.
Figure 5. Distribution of R&D Companies by HQ Country/Region 2013 and 2014
2014 2013
48%
17%
12%
3%
5%
4%
4% 3% 3% 1% USA
Rest Of Europe
Rest Of Asia Pacific
China
UK
Canada
Japan
Germany
France
Central and South America/Africa
49%
15%
14%
2% 5%
4%
4% 3%
3% 1%
Source: Pharmaprojects® Pipeline®, January 2014
But the shift is very subtle. Europe is holding firm, accounting for 29% of companies, as last year. There is
little evidence again of growth in emerging markets this year, with the APAC region’s share actually down
just a little from 18 to 17%.
But these figures hide one definitive trend – the growth of China. It is now the eighth biggest territory in
terms of number of companies producing R&D compounds, up from thirteenth, and with the actual number
of companies far surpassing 2012’s growth rate of 9% to hit 44% through 2013. With 85 companies, China is
fast closing on S Korea to be the second largest Asian pipeline provider, after which it will no doubt have
the R&D powerhouse of Japan in its sights. But Japan will not surrender its pole position without a fight,
and it’s notable that the only two companies this year to enter the Top 25 – Otsuka and Mitsubishi Tanabe
Pharma – are both Japanese.

8
top therapy areas and diseases – growth variations found across therapeutic groupsSo having dissected the industry by who’s who, it’s time to move to what’s what in the pipeline. With such
a big increase in drug R&D across all phases, it’s interesting to note that there are considerable variations
this year when you carve up the pipeline by the major therapeutic groups. This is shown in Figure 6, which
contrasts the 2014 and 2013 figures for each of the fourteen major therapeutic areas and the reformulation,
biotechnology groupings. Note that in this figure, a drug may be counted more than once if it has multiple
therapeutic activities.
Firstly you will see that there is growth across all areas, with the notable exception of the presently moribund
Blood & Clotting drugs area, and the related area of Cardiovascular has grown only very slightly. But within
the other areas, there are considerable variations in growth rates. Top of the pack as ever, Anticancer drugs
increase by 4.9%, for once not outperforming the global growth rate (remember, that stands at 7.9%).
However, this lower than average expansion still puts the oncology set further ahead than last year of its
nearest rival, Neurological, which only experienced a paltry growth rate of 1.6%.
Source: Pharmaprojects® Pipeline®, January 2014
Figure 6. Pipeline by Therapy Group
0
500
1000
1500
2000
2500
3000
3500
Antica
ncer
Biotec
hnolo
gy
Neuro
logica
l
Anti-In
fect
ive
Refor
mula
tions
Alimen
tary
/Met
aboli
c
Mus
culos
kelet
al
Cardiov
ascu
lar
Imm
unolo
gical
Respira
tory
Derm
atolo
gical
Blood &
Clot
ting
Sens
ory
Genito
urina
ry
Horm
onal
Antip
aras
itic
20132014
The star performers this year are Anti-infectives, whose pipeline swelled by 10.2% after a flat 2012-2013,
and Alimentary/Metabolic, up by 8.8%. The latter actually experienced a decline last year, so this is a
considerable reversal of fortune. Actually, purely in percentage terms, the Antiparasitic and Hormonal
groups experienced the largest growth rates, but as can be seen, they are the two smallest players so this
is an increase in a goldfish bowl as opposed to the ocean. Three other therapeutic groups also outperformed
the global growth rate: Respiratory (9.9%), Dermatological (8.8%) and Genitourinary (8.8%). So while there
are no seismic shifts in therapeutic focus on display, there are clearly fairly substantial variations in growth
rates when the pipeline is dissected in this manner.
9
There are also two ‘non-therapeutic’ groups displayed in this graph, for Reformulations and Biotechnology.
We’ll return to the biotech drugs when we move to examine the types of drugs in the pipeline in the next
section of this report, but the rise in reformulations of old drugs into novel delivery systems is more evidence
of the increasing propensity for pharma companies to seek to thoroughly wring out every drop of value
from their successes.
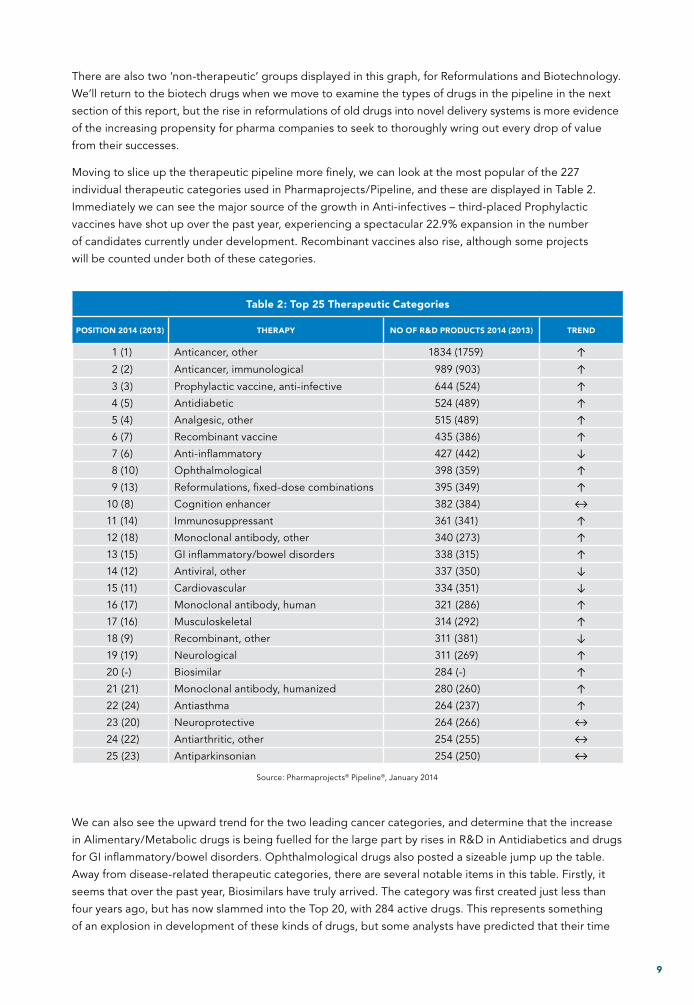
Moving to slice up the therapeutic pipeline more finely, we can look at the most popular of the 227
individual therapeutic categories used in Pharmaprojects/Pipeline, and these are displayed in Table 2.
Immediately we can see the major source of the growth in Anti-infectives – third-placed Prophylactic
vaccines have shot up over the past year, experiencing a spectacular 22.9% expansion in the number
of candidates currently under development. Recombinant vaccines also rise, although some projects
will be counted under both of these categories.
We can also see the upward trend for the two leading cancer categories, and determine that the increase
in Alimentary/Metabolic drugs is being fuelled for the large part by rises in R&D in Antidiabetics and drugs
for GI inflammatory/bowel disorders. Ophthalmological drugs also posted a sizeable jump up the table.
Away from disease-related therapeutic categories, there are several notable items in this table. Firstly, it
seems that over the past year, Biosimilars have truly arrived. The category was first created just less than
four years ago, but has now slammed into the Top 20, with 284 active drugs. This represents something
of an explosion in development of these kinds of drugs, but some analysts have predicted that their time
table 2: top 25 therapeutic categories
PoSItIon 2014 (2013) theraPy no of r&d ProductS 2014 (2013) trend
1 (1) Anticancer, other 1834 (1759) ↑
2 (2) Anticancer, immunological 989 (903) ↑
3 (3) Prophylactic vaccine, anti-infective 644 (524) ↑
4 (5) Antidiabetic 524 (489) ↑
5 (4) Analgesic, other 515 (489) ↑
6 (7) Recombinant vaccine 435 (386) ↑
7 (6) Anti-inflammatory 427 (442) ↓
8 (10) Ophthalmological 398 (359) ↑
9 (13) Reformulations, fixed-dose combinations 395 (349) ↑
10 (8) Cognition enhancer 382 (384) ↔
11 (14) Immunosuppressant 361 (341) ↑
12 (18) Monoclonal antibody, other 340 (273) ↑
13 (15) GI inflammatory/bowel disorders 338 (315) ↑
14 (12) Antiviral, other 337 (350) ↓
15 (11) Cardiovascular 334 (351) ↓
16 (17) Monoclonal antibody, human 321 (286) ↑
17 (16) Musculoskeletal 314 (292) ↑
18 (9) Recombinant, other 311 (381) ↓
19 (19) Neurological 311 (269) ↑
20 (-) Biosimilar 284 (-) ↑
21 (21) Monoclonal antibody, humanized 280 (260) ↑
22 (24) Antiasthma 264 (237) ↑
23 (20) Neuroprotective 264 (266) ↔
24 (22) Antiarthritic, other 254 (255) ↔
25 (23) Antiparkinsonian 254 (250) ↔
Source: Pharmaprojects® Pipeline®, January 2014

10
in the sun may be short-lived, so it will be fascinating to see where they head next year. Original work in
monoclonals also continues to rise. It’s worth noting that the apparent decline in the general category for
Recombinant drugs is somewhat artificial, since the creation of the new category for Fusion proteins saw
many of these candidates migrate to this new class.
Next, in Table 3, we zoom in even further, to look at the individual diseases which are attracting the most
attention from the industry currently.
The trends identified further up the therapeutic activity spectrum, as usual, generally trickle down to the
top diseases list. Within the set of cancer diseases in this table, most are flattish, but a couple of tumour
types do stand out as showing particular pipeline expansion. Liver cancer R&D is up 15.9%, while brain
cancer is just above in the list with an also impressive 9.3% inflation. Prostate cancer falls from third to fifth,
albeit with a decline of just four drugs in its pipeline. Elsewhere, the significant increases in the respiratory
area are revealed to be derived from growth in asthma and COPD R&D, and in the dermatological area
from psoriasis. For those diseases showing decreases this year, it’s interesting to see hepatitis-C drop after
many years of rising. This comes just as the first of the new generation anti-HCV small molecules hit the
market. The fact that this is likely to be a highly competitive area, in which Gilead has reportedly stolen
a march, may not be entirely unconnected with a slight move away from R&D for this disease.
table 3: top 25 Indications
PoSItIon 2014 (2013) dISeaSe* no. of actIve comPoundS trend
1 (1) Cancer, breast 440 (437) ↔
2 (2) Cancer, colorectal 351 (347) ↔
3 (4) Diabetes, Type 2 346 (336) ↑
4 (5) Alzheimer`s disease 340 (331) ↔
5 (3) Cancer, prostate 336 (340) ↔
6 (6) Cancer, lung, non-small cell 324 (314) ↑
7 (7) Arthritis, rheumatoid 322 (313) ↔
8 (8) Cancer, pancreatic 289 (303) ↓
9 (9) Pain, general 287 (292) ↔
10 (10) Cancer, ovarian 279 (273) ↔
11 (11) Cancer, melanoma 257 (246) ↑
12 (12) Asthma 255 (224) ↑
13 (14) Cancer, brain 212 (194) ↑
14 (17) Cancer, liver 204 (176) ↑
15 (15) Parkinson’s disease 196 (186) ↑
16 (13) Infection, hepatitis-C virus 188 (203) ↓
17 (20) Psoriasis 182 (165) ↑
18 (24) Chronic obstructive pulmonary disease 182 (145) ↑
19 (19) Cancer, lymphoma, non-Hodgkin’s 173 (172) ↔
20 (21) Infection, HIV/AIDS 168 (161) ↔
21 (25) Infection, influenza virus prophylaxis 168 (141) ↑
22 (23) Cancer, leukaemia, acute myelogenous 164 (155) ↔
23 (16) Pain, neuropathic 163 (177) ↓
24 (18) Cancer, myeloma 162 (172) ↓
25 (22) Cancer, renal 153 (160) ↔
*Excludes the more generalized indications which include the term ‘unspecified’ to focus in solely on counting drugs where precise target diseases have been identified.
Source: Pharmaprojects® Pipeline®, January 2014

11
One other to note before moving on – there are no new entrants into this chart. The Top 25 diseases are exactly
the same ones as last year. This looks like further evidence of the comparative stability seen in R&D in 2014.
What kinds of drugs are in the pipeline?We’ve already noted the expansion of Biosimilars, but what other kinds of drugs and drug development
strategies are gaining purchase or slipping back? Well, as Figure 6 has already shown us, in the broader
area of Biotechnology drugs in general, there has been impressive growth this year. This year’s figure of
3,123 drugs represents a 13.5% increase in the number of biotech drugs, which now account for 27.6% of
all agents in development. The proportion has risen from 26.2% last year, when both the number and
share had declined.
Also highlighted earlier was the uptick in monoclonal antibody R&D, and we can further investigate the
kinds of drugs in the current pipeline by examining them by the class of active moiety via our Origin of
Material data field. This classifies drugs broadly into chemically-synthesized, biologically-produced and
naturally-derived drugs, and further subdivides them into more specific categories. The Top 25 Origins
are shown in Table 4.
table 4: top 25 origins of pipeline drugs
PoSItIon 2014 orIgIn no of actIve drugS
1 Chemical, synthetic 6262
2 Biological, protein, antibody 1163
3 Biological, protein, recombinant 808
4 Biological, protein 367
5 Chemical, synthetic, peptide 346
6 Biological, virus particles 303
7 Chemical, synthetic, nucleic acid 285
8 Biological, nucleic acid, viral vector 228
9 Natural product, plant 151
10 Biological, peptide 136
11 Biological, cellular, autologous 122
12 Biological, nucleic acid, non-viral vector 118
13 Biological 113
14 Biological, peptide, recombinant 112
15 Biological, cellular, heterologous 99
16 Biological, bacterial cells 94
17 Chemical, semisynthetic 76
18 Biological, cellular 64
19 Biological, nucleic acid 48
20 Natural product, bacterial 44
21 Chemical, synthetic, isomeric 43
22 Natural product 37
23 Biological, other 27
24 Natural product, animal 26
25 Natural product, fungal 22
Source: Pharmaprojects® Pipeline®, January 2014

12
This shows that synthetic chemical small molecules are still by far the largest source of drug candidates,
representing 55.4% of all pipeline drugs, although it is worth pointing out that when the origin of an agent
is undisclosed, our default is to assume that it is in this class until we discover otherwise. Synthetic nucleic
acids are the second most popular class of chemically-synthesized molecules. The data also confirms the
popularity of antibody-based drugs, which now account for 10.3% of all candidates – a pretty remarkable
percentage. The Top 10 also shows us that viral particles and nucleic acid delivered in a viral vector are other
popular biological strategies, and that the most common sources of naturally-derived drugs are botanical.
One of the reasons why understanding the kind of drug a company is developing is important is that it can
have huge bearing on the drug’s delivery method. Figure 7 shows how the pharma pie is sliced up by major
delivery route methods. Perhaps, surprisingly, there are currently more injectable drugs under development
than there are oral ones, despite the fact that oral administration is clearly preferable to both the patient
and the industry. (There is some bias introduced here again in the editorial process, in that a biological
macromolecule can be assumed to be injectable and is therefore labeled as such, whereas a small molecule
could be injectable or oral depending on its pharmacodynamics, and will therefore, in the absence of
any further information, remain labeled as unknown (not shown)). Nonetheless, the small size of the
proportion of oral molecules compared to the entirety of those with a known delivery route may raise
a few eyebrows. Note, however, that drugs under development for use via more than one delivery method
will be double-counted in this data.
Figure 7. Pipeline by Delivery Route
Injectable
Implant
Inhaled
Ophthalmological
Oral
Otic
Rectal
Topical
Transdermal
Vaginal
3445
82 372
143
2830
23 22
448
123 45
Source: Pharmaprojects® Pipeline®, January 2014
Lastly in our analysis, we move to looking at how the drugs in the pipeline are working and what they
are targeting. Table 5 reports on how the landscape of the leading mechanisms of action assigned
to the agents under development has shifted over the past twelve months.

13
table 5: top 25 mechanisms of action (Pharmacology)*
PoSItIon 2014 (2013) mechanISm of actIon (PharmacoLogy)* no. of actIve comPoundS 2014 (2013)
% of comPoundS Pr/r/L
1 (1) Immunostimulant 1441 (1242) 9%
2 (4) Immunosuppressant 185 (146) 31%
3 (2) Angiogenesis inhibitor 169 (188) 17%
4 (7) Opioid mu receptor agonist 132 (112) 26%
5 (5) Apoptosis stimulant 119 (135) 10%
6 (8) DNA inhibitor 110 (107) 16%
7 (17) Tumour necrosis factor alpha antagonist 94 (72) 15%
8 (19) Glucocorticoid agonist 93 (70) 35%
9 (20) PI3 kinase inhibitor 86 (70) 1%
10 (9) Cyclooxygenase 2 inhibitor 81 (92) 42%
11 (13)Vascular endothelial growth factor (VEGF) receptor antagonist
77 (80) 19%
12 (15) DNA topoisomerase II inhibitor 72 (74) 24%
13 (18) Cyclooxygenase 1 inhibitor 64 (71) 47%
14 (10) Tubulin inhibitor 64 (88) 11%
15 (-) DNA synthesis inhibitor 62 (-) 31%
16 (3) Cell cycle inhibitor 62 (147) 27%
17 (-) Opioid delta receptor agonist 62 (-) 26%
18 (-) Gene expression inhibitor 60 (-) 0%
19 (-) Opioid kappa receptor agonist 59 (-) 25%
20 (-) T cell inhibitor 56 (-) 21%
21 (-) Glucagon-like peptide 1 agonist 56 (-) 13%
22 (-) Insulin secretagogue 55 (-) 44%
23 (-) Microtubule stimulant 54 (-) 15%
24 (-) Cell wall synthesis inhibitor 54 (-) 39%
25 (-) Progesterone receptor agonist 54 (-) 44%
*This table is affected this year by a project we undertook to clean-up this data on our drug profiles following the introduction of our hierarchical mechanism of action classification a couple of years ago. This has removed some higher level mechanisms which were present on a drug in addition to more specific ones, so this is why the Top 25 here has appeared to have changed more than the others.
Source: Pharmaprojects® Pipeline®, January 2014
Therefore, it’s perhaps more instructive to this year just focus on our table of the Top 25 targets (Table 6).
This shows that the mu1 opioid receptor, a pain target, remains the single most popular protein to be hit
by drugs in the pipeline, showing good growth and edging slightly further ahead of the second-placed
glucocorticoid receptor. Tumour necrosis factor (a target whose name has been simplified by Gene in the
past twelve months from the earlier ‘tumour necrosis factor (TNF superfamily, member 2)’) posts a sizeable
increase, and with the kappa1 opioid receptor, completes a clean sweep of the Top 4 for targets involved
in pain and inflammation. Elsewhere, another opioid receptor subtype, delta1, climbs the chart, indicating
considerable research across the board in opioid class analgesics at present. Another high riser is the
cancer target epidermal growth factor receptor, up three places to just enter the Top 10. PI3Kα is another
currently voguish cancer target to be seen shooting up the charts. The more old-school beta tubulin can
be seen headed in the opposite direction.

14
table 6: top 25 drug Protein targets
PoSItIon 2014 (2013) target no. of actIve
comPoundS 2014 (2013)
1 (1) Opioid receptor, mu 1 155 (131)
2 (2) Nuclear receptor subfamily 3, group C, member 1 (glucocorticoid receptor) 121 (98)
3 (9) Tumour necrosis factor 91 (69)
4 (7) Opioid receptor, kappa 1 87 (72)
5 (4) Polyprotein, hepatitis-C virus 86 (90)
6 (3) Prostaglandin-endoperoxide synthase 2 (prostaglandin G/H synthase and cyclooxygenase) [COX-2] 85 (94)
7 (8) Insulin receptor 82 (70)
8 (5) Prostaglandin-endoperoxide synthase 1 (prostaglandin G/H synthase and cyclooxygenase) [COX-1] 81 (85)
9 (6) V-erb-b2 avian erythroblastic leukemia viral oncogene homologue 2 [Her-2] 79 (83)
10 (13) Epidermal growth factor receptor 77 (63)
11 (18) Opioid receptor, delta 1 67 (52)
12 (10) Gag-pol, HIV-1 65 (68)
13 (11) Dopamine receptor D2 65 (67)
14 (14) Adrenoceptor beta 2, surface 65 (60)
15 (-) Progesterone receptor 62 (-)
16 (16) Estrogen receptor 1 59 (57)
17 (21) Mechanistic target of rapamycin (serine/threonine kinase) [mTOR ] 58 (48)
18 (15) Kinase insert domain receptor (a type III receptor tyrosine kinase) [VEGFR2] 57 (58)
19 (25) Phosphatidylinositol-4,5-bisphosphate 3-kinase, catalytic subunit alpha [PI3K] 57 (43)
20 (17) Glucagon-like peptide 1 receptor 56 (57)
21 (19) Amyloid beta (A4) precursor protein 55 (51)
22 (12) Tubulin, beta class I 53 (66)
23 (24) Vascular endothelial growth factor A 52 (46)
24 (22) Membrane-spanning 4-domains, subfamily A, member 1 50 (48)
25 (23) Solute carrier family 6 (neurotransmitter transporter), member 4 [CD20 ] 50 (48)
Source: Pharmaprojects® Pipeline®, January 2014
By January 2014, 2,541 individual proteins had at some point been reported or determined by us to have
been targeted by drugs in development since our database began in 1980, of which 2,498 remain so. This
indicates that 68 novel targets were identified in the past twelve months – a figure which is lower than the
89 through 2012 and lower still than the 179 observed the previous year. Is innovation decelerating? If so,
this is perhaps the one worrisome feature of this year’s clutch of statistics. In terms of the number of
targets which currently are the focus of active drug development, this now stands at 1,443, and has risen
more (from 1,416) over the past year than it did over the previous twelve months (from 1,404). So it’s
difficult to form an entirely negative conclusion even here.

15
developing more, spending moreSo despite this slight final note of caution, there is every indication here that the industry should be
clinking those champagne glasses once again. With a tumescent pipeline, swollen at every stage, and
relative stability in corporate manoeuvrings, this looks like the best set of data seen in many a moon.
But while it’s certainly more indicative of a healthy industry than universal declines, a bigger pipeline,
taken in isolation, just tells us that the industry is currently spending more money. And with R&D costs
per compound still spiraling, pharma continues to be bedeviled by high failure rates. A recent paper
by colleagues at our sister company, Sagient Research, published in January 2014’s edition of Nature
Biotechnology (Vol 32(1), pg 40), reports that across 835 drug developers from 2003-2011, while 64%
of compounds made it from Phase I through to Phase II, only 32% passed from Phase II into Phase III.
The overall subsequent approval rate for drugs in Phase I was just 10.4%. So an awful lot of cash is still
going down the drain, while, even though the numbers seesaw up and down from year to year, the long
term trend for delivery of new drug approvals has stayed resolutely flat. To most, this would seem to be
an ultimately unsustainable business model. So before we backslap the industry too much, we should
examine 2013’s output of new active substances, something we will be doing in our supplement to this
report to be published in March 2014, once we have established the truly definitive list. Look out for
that final piece of the jigsaw.
So before we backslap the industry too much, we should examine 2013’s output of new active substances, something we will be doing in our supplement to this report to be published in March 2014, once we have established the truly definitive list.

united States 52 Vanderbilt Avenue 11th Floor New York NY 10017 USA +1 646 957 8919 +1 888 436 3012
united Kingdom Christchurch Court 10-15 Newgate Street London EC1A 7AZ United Kingdom +44 20 7017 5000
japan Kotakudo Ginza Building, 7th Floor 5-14-5 Ginza Chuo-ku Tokyo 104-0061 +81 351 487 670
china 16F Nexxus Building 41 Connaught Road Hong Kong +852 3757 9007
australia Level 7 120 Sussex Street Sydney NSW 2000 +61 2 8705 6900
Citeline © 2014. All rights reserved. Citeline is a trading division of Informa UK Ltd. Registered office: Mortimer House, 37-41 Mortimer Street, London W1T3JH, UK. Registered in England and Wales No 1072954
www.citeline.com
Citeline provides the world’s most comprehensive and
reliable real-time R&D intelligence to the pharmaceutical
industry, covering global clinical trial, investigator and drug
intelligence. Our data is meticulously curated from over
30,000 unique sources by the industry’s largest team –
over 250 full-time expert analysts and editors.
Citeline’s therapeutic area analysts and product managers
regularly produce reports on key aspects of the industry, new
therapy developments and relevant trends. Enjoy free access
to these insights by downloading our latest reports and white-
papers at www.citeline.com/resource-center/whitepapers.