Embed Size (px)
Citation preview

The Liquidity Crisis & Its Impact on the Hedge Fund Industry
Citi PerspectivesA Prime Finance Publication
JULY 2010

1Citi Perspectives, a Prime Finance Publication JULY 2010
Findings At A Glance
Part I lays out the impacts of the liquidity crisis on hedge fund industry participants:
• Hedge funds’ ability to use their collateral to finance posi-
tions with their prime brokers became increasingly more dif-
ficult, prompting an industry-wide de-levering of portfolios.
• Institutional investors experienced the pitfalls of adja-
cency risk in co-mingled portfolios and funds, finding
their own actions constrained by the fund’s other partici-
pants. They also found that many managers had placed
assets in their portfolio that should have been outside
their mandate.
• Many Fund of Funds realized a serious mismatch between
the terms they offered on their portfolios and the liquidity
they were able to realize on their hedge fund investments.
Part II explores participants’ responses to these is-sues over the past 18 months:
• A large number of institutional investors initially tried to
replace co-mingled exposures with separately managed
accounts (SMAs) or Funds of One.
• Cost factors and trading/operational challenges associ-
ated with SMAs and Funds of One prompted many inves-
tors to reconsider this path by the late 2009/2010.
• Improvements in investors’ perception of hedge fund en-
gagement and infrastructure are helping swing interest
back toward co-mingled structures.
• Hedge funds looking to diversify their mix of investors
and attract more direct pension and endowment capi-
tal are becoming more “institutional,” increasing their
transparency, liquidity options and level of investor com-
munications.
• Due diligence is now much more robust between in-
vestors and hedge funds and both investment and op-
erational reviews are becoming an ongoing process that
spans the life of the investment.
• Fund of Funds and consultants are creating more nuance
within the hedge fund industry, adjusting their portfolio
construction approach to align investment strategies
along a “liquidity spectrum” and grouping strategies
with similar profiles.
Part III assesses the likely impact of recent changes and extrapolates current trends:
• The hedge fund industry is moving toward a set of “seg-
ments” that group strategies with similar styles, leverage
and liquidity—the emergence of these segments is help-
ing blur distinctions between the long-only, Alternative
and private equity silos.
• The least-liquid hedge fund segment offers a “complex-
ity” or “illiquidity” premium making that more like a
short-term private equity investment.
• The most-liquid hedge fund segment is now competing
with an emerging class of “Alternative” mutual funds and
regulated UCITS funds for investor allocations—these
hedge funds and regulated Alternative vehicles are draw-
ing allocations away from active long-only managers.
• Between these options and fast-growing “pure beta”
ETFs and index funds, investors looking to take on expo-
sure within an asset class can increasingly choose from a
broad array of investment structures with differing risks,
returns, liquidity profiles and fee structures in order to
achieve diversification. “Asset-Based Structures” may
become the new investor allocation paradigm.
Capital flowed steadily into the hedge fund industry over most of the past decade. There were few stresses to test the
strength of the industry’s practices and controls. When the credit crisis in the dealer and shadow-banking community
triggered a liquidity crisis in the hedge fund industry in late 2008, key process and structural issues came to light.

2Citi Perspectives, a Prime Finance Publication JULY 2010
Survey Introduction & Approach
Citi Perspectives is a new Prime Finance series that brings
our clients timely, relevant and thoughtful information,
leveraging our access and unique vantage point at the
heart of the hedge fund industry.
This first Citi Perspectives publication, The Liquidity Crisis
and Its Impact on the Hedge Fund Industry, is a summary of
a recent survey conducted with a range of industry leaders.
While quantitative surveys are commonly used to gain
input and information, the outputs of such research are
often impersonal and only modestly informative as answers
rarely expose the nuance of findings or tie sets of findings
together to adequately identify and discuss emerging
trends.
Our approach is different and much more qualitative. To
get at the heart of industry needs, wants, opinions and
thoughts, we conducted 30 in-depth, one-on-one interviews
with an array of industry participants—across investors,
intermediaries, hedge funds and service providers.
Using their inputs to spur internal discussion, we collected
over 50 hours of dialog and used this material to obtain a
360-degree view of major themes and developments.
To underscore our findings and help quantify or support
statements made by participants, we also incorporated data
from leading industry research and publications. A listing
of these references is available at the end of the report for
those looking to learn more on specific topics.
Finally, to bring out the richness of our dialog, we have
included many unattributed quotes from participants so
that readers can get a sense of the “voices” contributing to
the findings.
>$10.0 Billion AUMHedge Funds
17% Family Offices
7%
Endowments10%
Fund of Funds13%
Pension Consultants7%
Pension Funds7%
Hedge FundConsultants
3%
<$1.0 Billion AUMHedge Funds
20%
>$1.0 Billion AUMHedge Funds
17%
Mix of Interviewees

3Citi Perspectives, a Prime Finance Publication JULY 2010
Executive Summary 04
Part ILiquidity Crisis Reveals Critical Issues in the Industry 12
• Boom Times in the Hedge Fund Industry: 2000 to Mid-2008
• Bank Credit Tightening Adversely Affects Hedge Funds
• Investors Reverse Allocations & Hedge Funds See Outflows
• Liquidity Mismatches & Portfolio Concerns Come to Light
• Lessons Learned in Crisis Trigger Massive Industry Change
Part IICrisis Responses Help to Institutionalize the Industry 28
• Investors Seek More Direct Control Over Their Portfolios
• Hedge Funds Seek More Direct Investor Allocations
• Industry Due Diligence Reaches an “Institutional” Standard
• Alternatives “Segments” Emerge along a Liquidity Spectrum
Part IIIConvergence of the Investment Landscape Accelerates 40
• Alternatives “Silos” Become Less Distinct
• More Liquid Alternatives Compete with Long-Only
• Complexity of Allocation Decision Increases
References 53
Disclaimer 54
Table of Contents

4Citi Perspectives, a Prime Finance Publication JULY 2010
Sources: Citi Prime Finance, Bloomberg
0
0.5
1
1.5
2
2.5
3
3.5
4
Sep 15 -Oct 14
2007 - Sep 14, 2008
Bas
is P
oin
ts
Spread Between 3-Month LIBOR & Overnight Index Swap Rate:
Concern Turns to Panic
Issues Uncovered In the Crisis
Hedge funds’ ability to use their collateral to finance positions with their prime brokers became limited—forcing managers to de-lever or remain on the sidelines during a period of market opportunity.
By mid-September 2008, the LIBOR-OIS spread that
reflects the willingness of banks to lend money to one
another had risen to near record levels at 86 basis
points ahead of 3rd-quarter 2008 bank earnings. The
September 14th announcement of the Lehman Brothers
bankruptcy and Bank of America/Merrill Lynch merger,
followed by the drop of the Reserve money market fund
under $1.00 on September 16th touched off a panic across
the industry that resulted in this spread skyrocketing to
364 basis points by mid-October. This set the stage for a
liquidity crisis in the hedge fund sector as prime brokers
had diminished ability to fund positions and/or tap into
their bank’s balance sheet.
• Smaller funds were primarily in single prime relationships
with one of two major industry participants. Anecdotal
evidence suggests that at least one major firm began to
manage funds off their platform and another called for
increased collateral to sustain positions. Many small funds
were left with no financing options and were forced to
liquidate positions.
• Larger hedge funds tended to have multiple prime
relationships which allowed them some insulation from
any one prime broker’s demise or demands. Even still,
many with illiquid portfolios were forced to de-lever.
Those with more liquid portfolios were better able to meet
prime broker margin calls, but had little capacity to take
advantage of market opportunities.
“There were very attractive trades available during the
crisis, if you could finance them. We had good terms
on our portfolios, but not a lot of stand-by capacity.”
– >$10.0 Billion AUM Hedge Fund
“We were in bed with [two largest prime brokers]. People were
like, ‘Okay, that’s a good diverse place to be.’ In September 2008,
our prime brokers said you have to be in fully paid securities or
out. There were points we thought we’d be out of business.
Every day we were getting calls to take down our levels.”
– <$1.0 Billion AUM Hedge Fund
Over the last 10 years, the hedge fund industry has expanded rapidly. Between 2000-2007, Hedge Fund Research
(HFR) shows a 4x increase in assets under management; a 2x increase in hedge fund managers and a 5x increase in
the number of Fund of Funds. The speed of industry growth and extended period of capital inflows helped mask many
process and structural issues that emerged in this period. These issues came to light in late 2008 as the credit crisis
triggered a liquidity crisis in the hedge fund industry.
Executive Summary
“By far the number one lesson learned in the past 18 months was that it’s all about managing liquidity. The perils of an illiquid
environment were misunderstood. The crisis uncovered a lot of other problems in the industry.” – Fund of Fund & Seeder

5Citi Perspectives, a Prime Finance Publication JULY 2010
Liquidity of assets in the portfolio
Stated PortfolioLiquidity Terms
Actual PortfolioLiquidity
Long/ShortEquity
EventDriven
Multi-Strat
Global Macro
ConvertibleArbitrage
Fixed IncomeArbitrage
DistressedSecurities
Market Neutral& Dedicated Short
Inve
sto
r ab
ility
to
w
ith
dra
w a
sset
s
LOW HIGH
LOW
HIG
H
Sources: Citi Prime Finance, Size of bubbles represent HFR Q1 2010 AUM.
Institutional investors found that their portfolio value and liquidity were impacted by other investor’s actions and that, in many cases, there were unexpected assets being held in the portfolio that should have been outside a manager’s mandate.
• Whether investors had allocated to a Fund of Fund or
directly to a hedge fund manager, in the majority of cases
their money was co-mingled with other investors’ capital.
During the crisis, managers had to choose actions that
benefitted the totality of their investor pool. For many
with illiquid assets, this caused them to throw up gates,
create side pockets or suspend redemptions.
• The nature of some of these holdings came as a surprise
to many investors as, up until the crisis, most hedge
funds reported little to no information on their portfolio
investments—only their portfolio returns.
Many Fund of Funds experienced a serious mismatch between the terms they offered on their portfolios and the liquidity they were able to realize on their hedge fund investments.
• In constructing their portfolios, they had mixed hedge
fund managers with varying liquidity terms in order to
achieve strategy diversification.
• A significant number of Fund of Funds failed to anticipate
how illiquid many hedge funds would become in a period
of concentrated outflows.
• Rather than being able to withdraw capital in a blended
manner across their pool of managers, Fund of Funds
found that their illiquid managers often could not or
would not meet redemptions.
• Hedge funds with more liquid assets had to cover a
disproportionate share of redemptions. This left the
remaining assets in the fund increasingly less liquid.
“People are much more focused on and concerned
about adjacency risk in hedge fund LP structures.”
– Pension Fund Consultant
“What came out of the crisis was that managers had
positions in the portfolio that were to the detriment of the
investors in a stress period. Assets like private equity or
unrated corporate debt. Many times, these assets were not
even in the manager’s mandate.”
– Fund of Fund & Seeder
“The biggest lesson learned in the past 18 months has
been that the agreed upon liquidity terms of a subscription
agreement don’t really matter when the markets are in
distress—it’s not a guarantee of when you’ll be liquid.”
– Pension Fund
“For us, ensuring liquidity was our biggest lesson
learned. Certain managers had to enforce gates
or close and restructure their funds having several
illiquid underlying investments. We had an idea of their
liquidity. We had transparency into their positions.
The problem was that everyone was selling, so that
things that seemed liquid turned out not to be.”
– Endowment
“There were accepted practices going on in the industry up until
2008 that in retrospect look like a problem. Funds were using
the liquidity of incoming investors to pay out the established
investors without testing the investments themselves. It was
hard to see this until everyone hit the exit at once and everyone
starting asking for their money back at the same time.”
– Fund of Fund & Seeder
Illustrative Fund of Fund Liquidity in the Crisis

6Citi Perspectives, a Prime Finance Publication JULY 2010
Responses to Issues Uncovered During the Crisis
Many institutional investors initially tried to replace co-mingled exposures with Separately Managed Accounts (SMAs) or Funds of One, but encountered significant trading, operational and cost concerns with these structures.
• SMAs were popular vehicles for investors seeking to
replicate mutual fund portfolios and returns in the long-
only space; however, many investors found that it was
much more difficult to mimic hedge fund portfolios and
returns.
• Many hedge fund investments require investors to hold
their own ISDAs and separate prime broker terms. Many
investors could not meet the operational demands of
administering the SMA without a robust back office or
costly platform manager.
• To reduce operational friction, many investors
particularly Fund of Funds, began to explore Funds of
One as a compromise structure between a co-mingled
fund or an SMA. In a Fund of One, the investor is the sole
LP owner or the dual LP owner along with the manager
of a separate share class. These structures are easier to
administer, but costly to set up.
• By 2010, improvements in investors’ perception of hedge
fund engagement and infrastructure were helping to
swing interest back toward co-mingled structures.
Hedge funds emerged from the liquidity crisis with the goal of diversifying their mix of investors and ensuring a more stable capital base—this involved them reducing Fund of Fund contributions and obtaining more direct pension fund, endowment and high-net-worth capital.
“On the long-only public side, we’ll look at SMAs because they’re
easy to manage—not on the Alternative side. We don’t have a back
office and we don’t have the capacity to manage a lot of ISDAs.”
– Endowment
“We only had one investor ask to go to a managed account
structure and we dissuaded them. It’s very hard for
unsophisticated investors to get involved in separately
managed accounts. It can be very dangerous. You really
need to have large organizations with a large back office to
make them work.”
– Fund of Fund
“Some Fund of Funds have negotiated special fees for a Fund
of One. The incentive for a Fund of One can be better claw
back provisions. Everyone knows that there is some beta in
your strategy so having a Fund of One lets you put in a more
reasonable hurdle.”
– Pension Consultant
“Now we are focused on obtaining investor allocations from
Sovereign Wealth Funds and Pension Funds outside the U.S.
Previously, we had a higher percentage of Fund of Fund
money because we were a relatively young hedge fund. Now,
we’re trying to broaden that set of investors to have more
geographic diversity and more diversity by type of investor.”
– >$1.0 Billion AUM Hedge Fund
“We came away from 2008 with a greater ‘know
your customer’ emphasis and a commitment to
diversify our marketing footprint. We are now much
more interested in having a mix of investors.”
– >$10.0 Billion AUM Hedge Fund
“We’ve opened up a relationship with a private
bank and are offering our product via their high-
net-worth platform. We don’t see very large sums
of money coming in from this platform at any
given time, but it trickles in and it’s pretty stable.”
– <$1.0 Billion AUM Hedge FundSource: Citi Prime Finance
Co-Mingled Assets
Fund of Fund-driven administration
Investor-driven administration
Fund of One(Initial setup)
Master fundor fund series(Share class)
Hedge fund-driven administration
Segregated Assets
Cos
tsLO
WE
ST
HIG
HE
ST
Fund ofFund
Fund of OneSingle orDual LP
SeparatelyManagedAccount
Alternative Investment Legal Structures

7Citi Perspectives, a Prime Finance Publication JULY 2010
To attract allocations, many hedge funds embarked on a series of operational and structural investments—creating more “institutional” organizations capable of sustaining direct investor communications and scrutiny.
• Across the industry, hedge funds diversified their set of service relationships, with nearly all funds now multi-prime. Many added custodians to ensure better asset protections and more stability for their portfolios.
• Many hedge funds improved their liquidity terms, increasing the frequency of redemptions and notice periods and shortening lock-ups, either in their flagship funds or as new share classes.
• Larger hedge funds invested money into their IT infrastructure, building out robust risk tools to help senior managers independently monitor activity across funds; integrating risk reports into real-time trade decision-making tools to support the investment process; and building shadow accounting and reporting systems to monitor their service provider data and activities.
• Many also expanded their operational staff and invested time and planning into cataloging and identifying risks across their entire set of processes.
Many hedge funds matched their improved infrastructure with a new willingness to provide investors transparency into their portfolios and the inner workings of their operations as part of expanded due diligence.
• Investors are looking to go to the “molecular level detail” on hedge fund portfolios and many hedge fund managers are facilitating this review by providing snapshots of their portfolios on a lag.
• Some hedge funds are also beginning to permission investors to see their prime broker or fund administrator reports directly or have agreed to report to an investor’s chosen risk aggregator.
• Operational due diligence has also become a norm. Separate teams with deep operational backgrounds delve into the processes, controls and IT platforms at a fund.
“Top of the list in terms of lessons learned has to be the
requirement to have multiple prime broker relationships.”
– <$1.0 Billion AUM Hedge Fund
“We addressed our investor liquidity concerns by offering
them more options. You can continue to do business with
us at the same terms and the same fees, but if people
are willing to pay up on fees for more liquidity, we are
offering them an opportunity to do so through new series.”
– >$1.0 Billion AUM Hedge Fund
“We developed our own proprietary risk application
and have integrated our risk system as part of the
research and investment decision-making process.”
– <$1.0 Billion AUM Hedge Fund
“We invested heavily in IT … We built a parallel system
that captures a mirror accounting process and a mirror
reporting process. We’re not relying on one individual
or one team. We want dual sets of eyes on everything.”
– >$1.0 Billion AUM Hedge Fund
“Another thing we get kudos for is documenting every single
procedure … We don’t hand it out, but when we pull out a 200-
page document with that much detail, people go, ‘Wow!’”
– <$1.0 Billion AUM Hedge Fund
“Performing a holdings-based analysis is now a standard
part of our process.” – Pension Consultant
“Two years ago when we started our operational due
diligence, it was an optional service that clients could ask
for , but that most didn’t. Now this is becoming a standard
part of our process.”
– Pension Consultant
Investment Due Diligence Focus Areas
Pre2009
Since2009
Source: Citi Prime Finance
Fund
’s w
illin
gnes
s to
sha
re in
form
atio
n
LOW
HIGH
Investment Strategy Approach& Key Personnel
Performance
Liquidity Terms& Alignment
Concentrations& Exposures
Positions& Trades
Lower level ofdetail soughtby investors
Higher level ofdetail soughtby investors
Evolution of Investment Due Diligence

8Citi Perspectives, a Prime Finance Publication JULY 2010
Long/ShortEquity
Event-Driven
Multi-Strat
GlobalMacro
Market-Neutral & Dedicated Short
Lower LiquidityMixed Equity &
Credit Strategies
High Liquidity“Simple” Equity
Strategies
Low LiquidityCredit Strategies
Short-termprivate equity
structures
Fixed IncomeArbitrage
Convertible Arbitrage
DistressedSecurities
Sources: Citi Prime Finance, Size of bubbles represent HFR Q1 2010 AUM.
Liquidity of assets in the portfolio
Inve
sto
r ab
ility
to
w
ith
dra
w a
sset
s
LOW HIGH
LOW
HIG
H
Fund of Funds and consultants are creating more nuance within the hedge fund industry, adjusting their portfolio construction approach to align investment strategies along a “liquidity spectrum.”
• Liquidity has emerged as a new third dimension in
the evaluation of hedge fund investment strategies—
supplementing the traditional considerations of style and
leverage.
• Strategies invested in highly liquid underlying assets are
being pressured to offer up more aggressive liquidity terms
that offer investors better cash management options.
• Strategies in less-liquid assets are seen as being able to
demand more intermediate terms, and strategies in illiquid
assets are needing to incent investors to lock up capital
through “complexity premiums.”
Implications of Recent Changes
Grouping hedge fund investment strategies by liquidity, style and leverage is moving the industry toward a set of ‘segments.’ The emergence of these segments is providing investors more choice for allocating within Alternatives and helping to blur distinctions with the long-only and private equity silos.
• The least-liquid hedge fund segment features strategies
that invest in distressed and thinly traded securities
as well as in “hard” assets, often linked to commodity
production (i.e., copper mines).
• This segment is taking on the profile of a private equity
investment. Investors are being offered incentives to
lock up capital for extended periods and, as a result, are
determining their level of interest vis-à-vis their private
equity investment capital.
• The most-liquid hedge funds are now taking on profiles
that narrow the gap between these strategies and
traditional long-only investment fund offerings. Whereas
previously, most hedge funds had, at best, quarterly
liquidity and, oftentimes, annual or even bi-annual terms,
that trend is shifting.
• Many hedge funds, particularly in liquid, equity-focused
strategies, are now offering monthly liquidity options.
UCITS funds, a regulated hedge fund structure offered in
European markets, offer as frequent as weekly liquidity.
“We converted to be a more liquid Fund of Fund. Believe
it or not, we used to have annualized redemptions.
What used to be annualized is now down to quarterly
and what used to be quarterly is now down to
monthly. We’ve had to think about which funds we can
actually invest in to be able to offer those terms.”
– Fund of Fund
“A liquidity and transparency focus is key. If you’re doing
a distressed or asset-backed liability strategy, you have
to put that into a private equity or hybrid structure—
not a quarterly structure. It just doesn’t work.”
– Fund of Fund & Seeder
“There is starting to be a complexity premium. People are
willing to pay a liquidity premium for longer duration trades.”
– Pension Consultant
The Emerging Liquidity Spectrum

9Citi Perspectives, a Prime Finance Publication JULY 2010
“A lot of investors are saying, ‘Hey, my Equity book hasn’t
performed. I shouldn’t have so much of my risk correlated
at 1 with beta. Let’s go into a hedged vehicle.’ If you look
across, allocations to Equities as a whole is flat or going
down—if an investor was 60% in Equities, half of that is
moving to hedge funds.”
– Pension Consultant
Improved liquidity and transparency in simple hedged strategies position these funds as viable substitutes for investors looking at more aggressive, “active” long-only funds or new “Alternative mutual funds,” for enhanced returns.
• Many institutional investors have begun to divert
“relative” return allocations to “passive” ETFs and index
funds as “active” long-only managers under-performed
their benchmarks in recent years.
• To preserve allocations, many active long-only managers
are beginning to launch new “Alternative mutual funds”
that rely on investment techniques, typically used by
hedge funds.
• SEI shows assets under management in Alternative
mutual funds and regulated UCITS funds up $110 billion
in 2009, to $367 billion—in a year when inflows to hedge
funds and “active” long-only managers both fell.
“The complexity premium is a function of how peo-
ple are thinking about their incremental dollar. Where
is it coming from? My PE pool? My long/short pool?”
– Pension Consultant
“I think the biggest change is going to be around the traditional
silos of the investment management business. I don’t see
them staying as they are. We have a practice that looks across
the liquidity spectrum—long-only, hedged, private structures.
At their core, these are all similar in terms of their raw assets.”
– Pension Consultant
“A secondary liquidity trend we’re focusing on, given our
European predominance, is the UCITS funds. We feel our
strategies are well positioned to tap into this space. We
trade primarily in quoted, liquid investments. We are
not very concentrated and we don’t use much leverage.”
– >$1.0 Billion AUM Hedge Fund
“Do you want cheap beta and alpha overlay or do you
want a hedge fund? We don’t know how it will play
out. One of the advantages of the UCITS framework
in Europe is that it may raise institutional comfort
for this type of product. Unfortunately, it might be
the right product in the wrong geography.”
– >$10.0 Billion AUM Hedge Fund
Sources: Citi Prime Finance, ICI, HFR. Size of bubbles are illustrative of AUM.
Transparency
Liq
uid
ity
LOW
HIG
H
EXTENSIVE LIMITED
MoneyMarketFunds
Regulated InvestmentFunds
Alternative Strategies
MoneyMarketFunds “Active” Equity
Mutual Funds
“Active”Hybrid &
Bond MutualFunds
Passive IndexFunds & ETFs,
Equities, Hybrids, Bonds & Commodity Indicies
AlternativeMutual and
UCITS Funds
Simple-HeadedStrategies
2012
2010
Pre-2008
Mixed Equity &Credit Strategies
More LiquidCredit Strategies
IlliquidStrategies
Convergence
Liquidity
Ass
ets
HIGH LOW
Hedged
Alternatives
Short-Term
Long-Only
SimpleStrategies
MixedEquity
& CreditStrategies
MoreLiquidCredit Illiquids
Private Structures
Long-Term
Sources: Citi Prime Finance, ICI, HFR, & Preqin
Investor Allocations
$2T
$1T
Emerging Asset Allocation: Focus on Alternatives
Projected Convergence Between Regulated Funds & Alternatives
10Citi Perspectives, a Prime Finance Publication JULY 2010
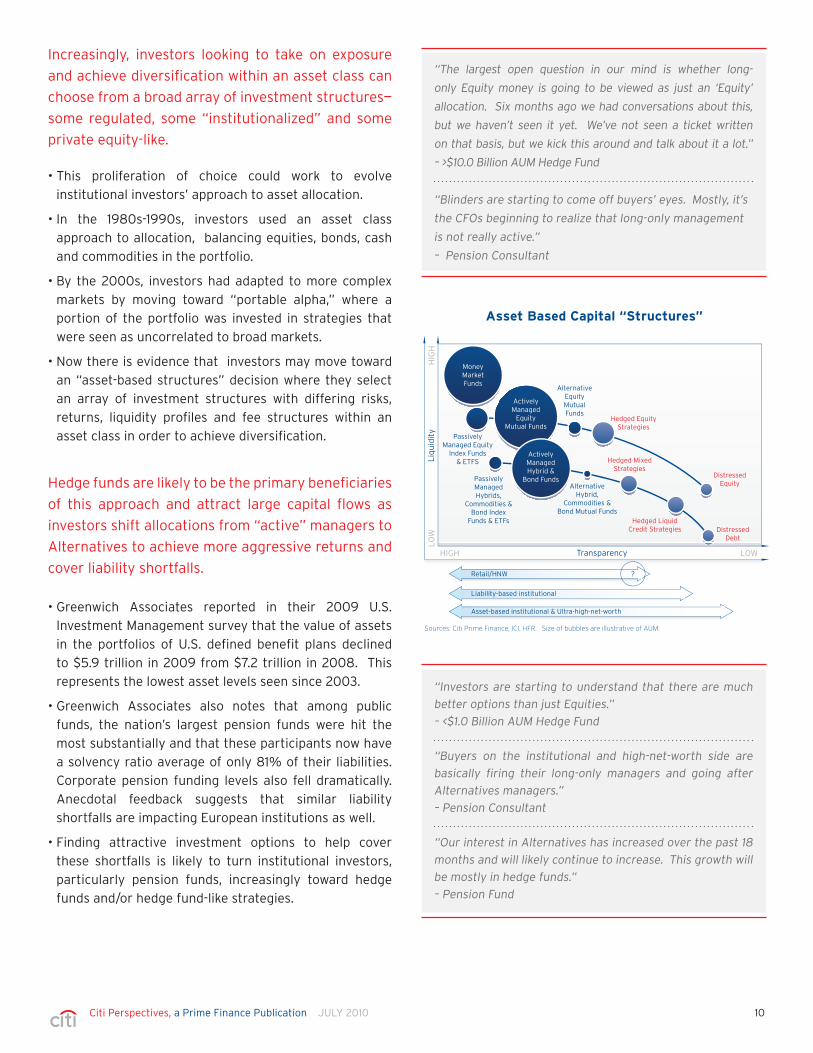
Increasingly, investors looking to take on exposure
and achieve diversification within an asset class can
choose from a broad array of investment structures—
some regulated, some “institutionalized” and some
private equity-like.
• This proliferation of choice could work to evolve
institutional investors’ approach to asset allocation.
• In the 1980s-1990s, investors used an asset class
approach to allocation, balancing equities, bonds, cash
and commodities in the portfolio.
• By the 2000s, investors had adapted to more complex
markets by moving toward “portable alpha,” where a
portion of the portfolio was invested in strategies that
were seen as uncorrelated to broad markets.
• Now there is evidence that investors may move toward
an “asset-based structures” decision where they select
an array of investment structures with differing risks,
returns, liquidity profiles and fee structures within an
asset class in order to achieve diversification.
Hedge funds are likely to be the primary beneficiaries
of this approach and attract large capital flows as
investors shift allocations from “active” managers to
Alternatives to achieve more aggressive returns and
cover liability shortfalls.
• Greenwich Associates reported in their 2009 U.S.
Investment Management survey that the value of assets
in the portfolios of U.S. defined benefit plans declined
to $5.9 trillion in 2009 from $7.2 trillion in 2008. This
represents the lowest asset levels seen since 2003.
• Greenwich Associates also notes that among public
funds, the nation’s largest pension funds were hit the
most substantially and that these participants now have
a solvency ratio average of only 81% of their liabilities.
Corporate pension funding levels also fell dramatically.
Anecdotal feedback suggests that similar liability
shortfalls are impacting European institutions as well.
• Finding attractive investment options to help cover
these shortfalls is likely to turn institutional investors,
particularly pension funds, increasingly toward hedge
funds and/or hedge fund-like strategies.
“The largest open question in our mind is whether long-
only Equity money is going to be viewed as just an ‘Equity’
allocation. Six months ago we had conversations about this,
but we haven’t seen it yet. We’ve not seen a ticket written
on that basis, but we kick this around and talk about it a lot.”
– >$10.0 Billion AUM Hedge Fund
“Blinders are starting to come off buyers’ eyes. Mostly, it’s
the CFOs beginning to realize that long-only management
is not really active.”
– Pension Consultant
“Investors are starting to understand that there are much
better options than just Equities.”
– <$1.0 Billion AUM Hedge Fund
“Buyers on the institutional and high-net-worth side are
basically firing their long-only managers and going after
Alternatives managers.”
– Pension Consultant
“Our interest in Alternatives has increased over the past 18
months and will likely continue to increase. This growth will
be mostly in hedge funds.”
– Pension Fund
Sources: Citi Prime Finance, ICI, HFR. Size of bubbles are illustrative of AUM.
Transparency
Liq
uid
ity
LOW
HIG
H
HIGH LOW
MoneyMarketFunds
ActivelyManaged
EquityMutual Funds
ActivelyManagedHybrid &
Bond Funds
AlternativeEquityMutualFunds
PassivelyManaged Equity
Index Funds& ETFS
PassivelyManagedHybrids,
Commodities &Bond Index
Funds & ETFs
AlternativeHybrid,
Commodities &Bond Mutual Funds
Hedged EquityStrategies
DistressedEquity
DistressedDebt
Hedged MixedStrategies
Hedged LiquidCredit Strategies
Retail/HNW ?
Liability-based institutional
Asset-based institutional & Ultra-high-net-worth
Asset Based Capital “Structures”

11Citi Perspectives, a Prime Finance Publication JULY 2010
Large hedge funds with “institutional” profiles are likely to be the main recipients of increased allocations. This will increase scrutiny on these managers about their ability to generate returns that do not correlate to beta.
• Indications are that the 200+ hedge funds managing at
least $1.0 billion in assets each already control 69.5% of
the industry’s total assets. That figure is likely to become
more concentrated.
• These firms are best positioned to sustain their operations
and investments, based solely on their management fee
in periods when fund returns are below previous high-
water marks.
• Role specialization is also more evident at larger funds and
most have built out extensive investor relations teams.
This benefits the organization’s ability to pursue and
maintain direct relationships with institutional investors
and their intermediaries in a period when investors are
recognizing the benefit of such relationships, and looking
to spend more time getting to know a manager.
• Large managers also have the trading expertise and
reputation to either directly offer or forge affiliations
with traditional managers to offer regulated Alternative
funds. Such was the rationale for the BGI/Blackrock
merger and other high-profile mergers or ventures
announced recently.
• The biggest concern interviewees expressed about these
large hedge funds drawing the majority of institutional
flows is about whether the size of the fund itself becomes
a hurdle in creating alpha. This uncertainty has existed
for some time and was underscored during the liquidity
crisis when many of the larger, more-liquid managers
demonstrated a higher-than-expected correlation to
beta in their portfolios.
“There has been a power shift toward investors substituting
bigger managers in their portfolios.”
– Pension Consultant
“There is a huge investor population not looking for aggressive
returns. They’re looking for consistent returns and really large
hedge funds will serve that purpose.”
– Hedge Fund Consultant
“For products like ours, that are running large correlated
positions, clients are becoming much more aware of how our
positions are constructed, and we’re getting asked more and
more about correlation to beta.”
– >$1.0 Billion AUM Hedge Fund
“Smaller managers are having trouble in the new environment.
All the money is going to the big guys now.”
– Fund of Fund

12Citi Perspectives, a Prime Finance Publication JULY 2010
Sources: HFR, McKinsey & Co., AIMA
AUM
2000
250000
200000
150000
100000
50000
0
60%
50%
40%
30%
20%
10%
0%2001 2002 2003 2004 2005 2006 2007 Q1
2008Q2
2008Institutional Investors as Percent
Mill
ion
s o
f D
olla
rs
As shown in Chart 1, inflows to hedge funds accelerated in
2006. Between 2003 and the peak of industry assets in
the second quarter of 2008, assets under management
increased by 135%, according to HFR, rising from $820.0
billion to $1.93 trillion—an annual average growth rate of
21%. In this same period, the share of industry assets
attributed to institutional investors rose sharply, from less
than 25% in 2003 to nearly 53% of assets.
Part I: Liquidity Crisis Reveals Critical Issues in the Industry
Between 2000 and mid-2008, the hedge fund industry
grew rapidly in terms of funds, managers, assets under
management and service providers. Expansion occurred
against a backdrop of uninterrupted capital inflows and
broad competition to secure capacity with established and
emerging managers.
Investors entering the hedge fund space in this period were
broadly seeking “alpha” and their intermediaries facilitated
such exposure by creating portfolios that incorporated a
broad mix of hedge fund investment strategies. The speed
of the industry’s expansion in these years and the breadth
of participants involved in its growth made it difficult to
spot potential issues.
The credit crisis at the major banks, concern about the
financial system and falling securities markets caused
inflows to turn to outflows by the Fall of 2008. As money
began to exit the hedge fund space, this touched off a
liquidity crisis in the industry, uncovering both process
and structural issues that hedge fund industry participants
were forced to address in 2009 and beyond.
Boom Times In the Hedge Fund Industry: 2000-mid 2008
Hedge Fund Industry Expands Rapidly Post-2000
Between 2000 and 2003, assets under management in
the hedge fund industry increased by 67.1%, according
to HFR, rising from $490.6 billion to $820.0 billion—an
average yearly growth rate of 18.7%. In 2000, hedge fund
industry funding originated almost exclusively from high
net worth individuals and a sprinkling of more ambitious
endowments and foundations.
As the technology boom of the late 1990s faded and
market turmoil set in during the early 2000s, institutional
investors’ allocations to long-only equities and bonds
failed to generate the returns many sought. As their
liability gaps increased, institutional investors began to
broaden their investment horizon and look increasingly at
Alternatives. This started off as a slow engagement that
rapidly gained steam. In 2003, institutional funding of
hedge funds accounted for less than 25% of assets. This
situation soon began to change dramatically.
“People who sprung up in the early 2000s, up to 2004,
didn’t need to have a track record. There was a lot of
funding floating around.”
– <$1.0 Billion Hedge Fund
“You can really say that the sweet spot for the hedge
fund industry was 2003-2008. You could get great
terms on your business and your clients were very
performance oriented. 2008 was a watershed.”
– >$1.0 Billion Hedge Fund
Net Asset Flows Into Hede Funds & InstitutionalInvestor Share of Assets
Chart 1

13Citi Perspectives, a Prime Finance Publication JULY 2010
often the point of contact, and where there was typically
only a light infrastructure.
Finally, institutional allocators wanted exposure to alpha,
but did not have the time, skill set or staff to pick and
choose among the broad number of managers and varying
strategies being utilized in the Alternatives space. All of
these factors prompted institutional investors to turn
primarily to one of two types of intermediaries.
“Looking back, there was clearly an over-concentration of
Fund of Funds, but this was easy money. They made it easy
to launch new products and launch them into what appeared
to be bottomless pools of money.”
– >$10 Billion AUM Hedge Fund
Despite the massive influx of institutional money, hedge
fund managers as a whole remained fairly opaque in
terms of sharing information on their portfolio holdings
and communicating details of their investment approach.
Most managers only reported performance information
and, at best, gave investors some insight into their top
holdings and overall leverage. Investors and Fund of Fund
managers tolerated this situation.
Fund of Funds Become Primary Institutional Channel
Asset-allocation theory among institutional investors
evolved rapidly in the early-2000s, shifting from the
classic “asset-class” approach to a “portable alpha”
mindset. Prior to this period, institutional investors sought
active long-only managers with stock-picking skills, able
to generate “relative” returns better than a standard
industry benchmark. The amount that these investors
were able to “beat” the index was the amount of absolute
or “alpha” return that institutional investors earned on
their portfolio. With the shift to the portable alpha theory,
investors separated out their allocations, giving some to
managers looking to replicate or beat benchmark returns
and some to managers pursuing strategies that were seen
as uncorrelated to the major markets.
The market downturn of the early 2000s was the spark for
this shift in allocation approach. With all the major industry
benchmarks down, a “relatively” good performance often
meant that a manager was down less than the benchmark.
Meanwhile, endowments and foundations that had invested
with hedge funds saw positive returns on many of those
investments in the corresponding period. This led to a
belief that separating or “porting” the alpha component of
a portfolio to a manager focused on “absolute” rather than
“relative” returns would provide greater diversification.
With this goal in mind, institutional investors began to
channel funds into Alternative managers. Allocations
were rarely done on a direct basis, however. Most
institutional investor allocation units had been set up to
focus solely on long-only managers and had little exposure
or understanding of many of the investment techniques
utilized in the Alternatives space, such as shorting,
leverage, financing or hedging.
Moreover, institutional allocators were used to dealing
with large investment management firms, not with small
sell-side spin-outs where the managers themselves were
Fund of Hedge Fund Assets Under Management & Share of Total Industry
Sources: HFR
AUM
2000
900,000
800,000
700,000
600,000
500,000
400,000
300,000
200,000
100,000
0
45%
40%
35%
30%
25%
20%
15%2001 2002 2003 2004 2005 2006 2007 Q1
2008Q2
2008Percent
Mill
ion
s o
f D
olla
rs
Chart 2

14Citi Perspectives, a Prime Finance Publication JULY 2010
Multi-Strat
GlobalMacro
Event-Driven Long/Short
EquityLong/Short
Equity
Fixed IncomeArbitrage
ConvertibleArbitrage
Market-Neutral &Dedicated Short
Distressed Securities
Strategy Diversi
ficatio
n
Sources: Citi Prime Finance, Size of bubbles represent HFR Q1 2010 AUM.
Style
Lev
erag
eLO
WH
IGH
CREDIT-FOCUSED EQUITY-FOCUSED
Institutional investors either developed a direct relationship
with a Fund of Funds focused on the hedge fund space or
they used an institutional consultant. Consultants would
then help investors pick Fund of Funds or occasionally
single managers to receive a direct allocation.
As shown in Chart 2, in 2000, Fund of Funds had $83.5
billion, or 17% of the hedge fund industry’s assets, under
management. By 2003, that figure had more than
tripled, to $293.3 billion, and Fund of Funds’ share of the
Alternatives market had more than doubled, to 36%.
Between 2003 and 2008, gains continued. By the second-
quarter of 2008, Fund of Fund assets under management
in the hedge fund space amounted to $825.9 billion, or
43% of assets under management.
Ensuring Capacity Trumps Extensive Due Diligence
Structurally, the hedge fund industry (particularly in
the early 2000s) was not well aligned to taking in vast
amounts of institutional money. While there were large
numbers of managers, the assets in the industry were
heavily concentrated with a small number of firms.
According to HFR, there were 3,335 hedge funds in
existence in 2000. The vast majority of these funds were
single-manager shops running $100 million or less in
assets. Even by the end of 2009, with 6,836 hedge funds
listed in the HFR database, the annual “Billion Dollar Plus”
roster put out by Absolute Returns listed only 213 firms
with more than $1.0 billion assets under management.
These 213 firms controlled 69.5% of the industry’s assets.
Finding homes for all of the money pouring into the
Alternatives markets and to Fund of Funds was thus a
challenging task. Many of the largest hedge fund managers
filled their capacity quickly and favored existing investors
when opening new funds. New Fund of Funds entering
the space to service the institutional market focused on
emerging managers, looking to lock up their capacity.
Pressure to find, establish a relationship and ensure
capacity with a preferred hedge fund manager was intense.
Oftentimes, managers had just spun out of either successful
Alternative firms or from proprietary trading desks on the
sell-side. These managers had little-to-no track record and
allocations were being done on the basis of reputation alone.
Locking in a manager was seen as key. Due diligence being
done around the operational controls of the manager’s firm
was often minimal, typically limited to filling in answers on a
standard questionnaire.
This reliance on a manager’s reputation and the industry’s
limited focus on Operational due diligence were the roots
of process issues, dramatically underscored by the Madoff
scandal in late 2008.
Spreading the “Bets” through Strategy Diversification
Fund of Funds’ and institutional consultants’ approach for
creating exposure to Alternatives was another factor that
set the stage for much of the shake-out that occurred in
2008-2009.
“We launched in 2007. Our biggest investor was a Fund of
Funds. Their initial ticket to us was $25 million. Then, they
wrote us a ticket for $15 million and then another ticket for
$20 million. There was no due diligence. They didn’t speak
to our Prime Broker or HFA. They came in with a one-page
informational agreement. It was very shocking to us that
business was being done this way and that it was being done
this way across the industry.”
– <$1.0 Billion AUM Hedge Fund
Typical Fund of Fund/Mixed Alternatives Portfolio
Chart 3

15Citi Perspectives, a Prime Finance Publication JULY 2010
For the most part, institutional investors had a broad
mandate of wanting “alpha” when they approached their
consultants or Fund of Fund managers. There was little
guidance beyond that goal. Given their lack of knowledge
and familiarity with the space, institutional investors
trusted their intermediaries to determine who would be
the best managers to provide that alpha. Consultants
and Fund of Funds had a broad landscape of varying
Alternative strategies and techniques to select from in
making that determination.
Chart 3 illustrates the breadth of investment strategy
offerings available in the Alternatives space. From a style
perspective, these strategies ranged from Equity-Focused
to Mixed to Credit-Focused. Each strategy also had a
unique approach in terms of its typical use of leverage to
ensure returns and highly diverse amounts of assets under
management (as illustrated by the size of the circles).
Most Fund of Fund managers chose to diversify across this
spectrum. They would select a mix of managers across
different styles and leverage profiles. This met the goal of
“spreading the bets” in the Alternatives space, enhancing
the odds that at least some strategies in the portfolio
would excel and achieve solid alpha returns regardless of
market conditions.
While each individual Fund of Fund determined their own
mix of investment managers, over time, Macro and asset-
related Credit strategies rose both in terms of industry
assets and holdings in Fund of Fund portfolios. HFR
shows that between 2000 and 2nd-quarter 2008, Macro,
Relative Value and Distressed hedge fund strategies rose
from 34% of industry assets under management to 48%.
Rising emphasis on these strategies had shifted Fund of
Funds blended portfolios toward less-liquid assets with
longer lock-ups/notification terms by the middle of 2008.
Fund of Fund Portfolios Mix Liquidity Profiles
Hedge fund managers each offer a unique set of liquidity
terms around their portfolio. These terms dictate the
minimum amount of time the money allocated to their fund
must be left with the manager (lock-up); how frequently
investors have an option, once their lock-up period is
complete, to redeem money out of the fund (redemption
period); and how far in advance of a redemption their
investors must notify them of their intention to withdraw
money (notice period).
Most hedge funds indicated that they had set their terms
in relation to the perceived liquidity of the assets held
in their portfolio. There are no “standard” terms. As
illustrated in Chart 4, even managers pursuing the same
investment strategy can offer a range of more or less
aggressive liquidity terms.
“Our final lesson learned from the crisis to watch out
for ‘deworsification.’ You can’t just throw stuff into
the portfolio and expect to make money. You need
to pick best-of-breed managers with exceptional skill.
We’re opportunistic. We’re not looking to fill a bucket.”
– Endowment
“Globally, Fund of Funds were chasing yields and returns.
They were choosing more and more guys to put in the
portfolio who were chasing yield through private structures,
and they were trying to offer that out to investors in
a quarterly structure. It was a liquidity mismatch.”
– <$1.0 Billion AUM Hedge Fund
“For our part, we had always run our funds on
the asset-to-liability profile we needed. We
underestimated the ability of our customer base to
misunderstand this very important relationship.”
– >$1.0 Billion AUM Hedge Fund
Typical Fund of Fund/Mixed Alternatives Portfolio
Chart 4
Sources: Citi Prime Finance, Size of bubbles represent HFR Q1 2010 AUM.
Liquidity of Assets in the Portfolio
Fun
d L
ock
-up
/ N
oti
fica
tio
nS
HO
RT
ER
LON
GE
R
LOW HIGH
Multi-StratDistressedSecurities
Fixed IncomeArbitrage Convertible
ArbitrageMarket-
Neutral &Dedicated
Short
Event-Driven
GlobalMacro
Long/ShortEquity

16Citi Perspectives, a Prime Finance Publication JULY 2010
Most Equity-focused strategies tend to offer shorter
liquidity terms, as these assets can be more readily
exited in broadly traded markets. As strategies start to
incorporate less liquid assets, the terms being offered by
the hedge fund manager tend to extend out. Strategies
heavily focused in less-liquid Credit or Distressed Securities
require longer liquidity terms in order to ensure an orderly
dissolution of assets.
Many hedge fund managers, particularly in strategies with
less-liquid assets, required Fund of Funds and other investors
to agree to additional cash management terms. These
terms included granting the hedge fund manager an ability
to “gate” and limit withdrawals from the fund and/or an
ability to impose “side pockets,” where less-liquid portions
of the fund could be isolated while more-liquid parts of the
fund could be exited. These emergency measures could be
triggered at the hedge fund manager’s discretion to control
the outflow of assets from their funds in order to protect
the fund’s overall value for remaining investors.
To achieve their desired level of strategy diversification,
Fund of Funds or investors who worked with consultants
to create their own mixed Alternative portfolios would
combine hedge fund strategies with varying liquidity
terms into the same portfolio. It was not uncommon to
have a highly liquid Equity Long/Short strategy with a 30-
day notice period and monthly redemption window held in
the same portfolio as a Distressed Credit strategy with a
90-day notice period, and annual redemption window.
As shown in Chart 5, the Fund of Fund would then “wrap” this
mixed portfolio of investments into a structure that had its
own set of liquidity terms for institutional or other investors.
Just as the hedge fund managers had done, the Fund of
Fund manager would dictate how frequently their investors
would be able to redeem capital and how much notice they
would have to provide to the Fund of Fund manager before
withdrawing money.
So long as money was flowing consistently into the
hedge fund industry, and to Fund of Funds in particular,
assumptions underlying how Fund of Funds set their
portfolio terms remained untested. As outflows began
in the Fall of 2008, it became clear in many instances
that there was a mismatch between the portfolio and the
investment manager terms.
“The investor community changed dramatically in how they
think about their own liquidity. Prior to the 2008 crisis,
liquidity was not on their Top 5 or even their Top 20 list. It
was clear—looking at a lot of the Fund of Funds and even
some of the more sophisticated investors—that they had not
thought about their own asset-to-liability matching.”
– <$1.0 Billion AUM Hedge Fund
Typical Fund of Fund / Mixed Alternatives Portfolio
Notice Period
Redemption Period
Long/ShortEquity
Event-Driven
Multi-Strat
GlobalMacro
DistressedSecurities
FixedIncome
Arbitrage
ConvertibleArbitrage
Market-Neutral &
Dedicated Short
InvestorWithdrawals
InvestorAllocations
Portfolio Liquidity Terms
Chart 5
Fund of Fund Portfolio Liquidity Structure

17Citi Perspectives, a Prime Finance Publication JULY 2010
“It now looks like hedge funds were better-capitalized than
banks were, going into the crisis.”
– >$10.0 Billion AUM Hedge Fund
Bank Credit Tightening Adversely Affects Hedge Funds
Credit tightening in the intra-bank market in response to
the sub-prime mortgage crisis and rampant counterparty
concerns impacted prime brokers’ ability to provide
financing to hedge funds in the fall of 2008. This led to
a liquidity crisis that rocked the hedge fund industry over
the following months.
Banks Suffer Liquidity Hits Due to Sub-Prime Crisis
Because it unfolded over such a long period, it is easy
to forget just how dramatically the sub-prime mortgage
crisis had been affecting the banking industry prior to
September 2008.
As Chart 6 illustrates, whereas the S&P 500 Index dropped
23.8% from its peak in 2007, the Financial sector declined
by 49.6% before the September 14, 2008 announcement
of the Lehman Brothers bankruptcy filing and the Merrill
Lynch/Bank of America merger.
Throughout this period of falling prices, concerns about
bank balance sheets and their stability as counterparts
had been rising. This impacted their willingness to lend
money to one another.
Chart 7 lays out a timeline for key events in the sub-
prime crisis up until September 14, 2008. These events
are overlaid on top of the 3-month LIBOR-Overnight Index
Swap (OIS) spread. This spread is commonly perceived as
a measure of how risky it would be for banks to lend their
money to each other.
In the early months of 2007 when Freddie Mac announced
that it was no longer going to buy risky sub-prime
mortgages and mortgage lender New Century filed for
Chapter 11, the 3-month LIBOR-OIS spread was flat at
about 7-8 basis points. This reflected a situation where
banks were easily lending funds to one another and where
there was no systemic concern about liquidity.
The spread remained essentially flat even through the
events of June and early July 2007, when Bear Stearns
first suspended redemptions out of—and then liquidated—
two of its mortgage-focused hedge funds, and when
Merrill Lynch subsequently seized $800 million in assets
from Bear Stearns to cover their exposure to those funds.
This situation changed dramatically in late July, however,
when Countrywide, the largest mortgage lender in the United
States, warned of “difficult conditions” and drew down their
entire $11 billion credit line to help sustain operations.
Chart 6
Broad Market vs. Financials Sector Up to Lehman Brothers Bankruptcy
+20.00%
-20.00% Financial Select Sector SPDR ETF
S&P 500 Index
Down23.8%
September 14, 2008
Down49.6%
-40.00%
Sources: Citi Prime Finance, SectorsSPDR.com
Jan 2007Sep 2006 Jan 2008 May 2008May 2007 Sep 2007
+0.00%
Re
lati
ve P
erc
en
t P
rice
Ch
ang
e

18Citi Perspectives, a Prime Finance Publication JULY 2010
By August 2007, another major U.S. mortgage lender,
American Home Mortgage Investment Corporation, filed
for bankruptcy and BNP Paribas halted redemptions on
three of its mortgage-backed funds. These events caused
the 3-month LIBOR-OIS spread to skyrocket from less than
10 to over 90 basis points. The spread remained elevated
and concern about banks’ creditworthiness remained
evident for the next year.
Fears of bank failures grew steadily in this period after
successive quarters of large mortgage-related losses, the
“fire sale” of Bear Stearns to J.P. Morgan Chase in March
2008 and the failure of IndyMac Bank, the fourth-largest
bank failure in the U.S. in July 2008. By September 2008,
the entire investment community was on edge about the
potential for more bank failures as third-quarter earnings
became due.
Anxiety became heightened in early September as the
U.S. government announced a takeover of Fannie Mae
and Freddie Mac, making them the owner or guarantor of
nearly half of all the mortgages in the United States. At
that point in time, investors worldwide held $5.2 trillion in
debt securities backed by the agencies.
The 3-month LIBOR-OIS spread returned to all-time-high
territory just as an emergency meeting was called with the
bank heads in Washington D.C., the weekend of September
13-14th. That meeting culminated with the announcement
that Bank of America would merge with Merrill Lynch and
that Lehman Brothers would file for Chapter 11.
Counterparty Concerns Skyrocket—Shutting Down Credit
It took 591 days for events to unfold between Freddie Mac’s
announcement in February 2007 that it would no longer
buy risky sub-prime mortgages to the announcement
of Lehman Brothers’ bankruptcy. Events accelerated
sharply from that point forward. The next 29 days, from
September 15 to October 14, 2008, are likely to go down in
history as one of the most volatile and risky periods in the
global financial markets, when many worried over the very
survival of the banking system.
Sources: Bloomberg; stlouisfed.org; cnnmoney.com; wikipedia.org
Feb: Freddie Macannounces it will
no longer buyrisky subprime
mortgages
Apr: New Centurysubprime mortgage
lender files for Chater 11
Jun: Bear Stearns suspendsredemptions from 2 mortgage
focused hedge funds; Merrill Lynchseizes $800m in assets from
Bear Stearns’ Funds; S&P/Moody’s downgrade 100 bonds backed bysecond lien subprime mortgages
Nov: Federal Reserve injects $41 billion into the money supply-largest injection since September 2001
Jan: Bank of America announces it will purchase Countrywide; National
Association of Realtors announces 2007U.S. home sales drop most in 25 years
Feb: Northern Rock takeninto State ownership by
Treasury of the U.K.
Mar: Carlyle CaptialGroup receives a default
notice after failing to meet margin calls on its mortgage bond fund;
Bear Stearns acquired byJPMorgan Chase in fire sale to avoid bankruptcy.
Deal backed by the Federal Reserve, providing up to
$30 billion to cover Bear Stearns losses
Jun: S&P downgrades bondinsurers AMBAC MBIA
Jul: IndyMac Bank placed into receivership by the FDIC- 4th largest bank failure in U.S.history; 2nd largest failure of
a regulated thrift
Sep 7th: Federal takeoverof Fannie Mae and Freddie Macwhich at that point owned or
guaranteed about 1/2 of the U.S.mortgage market. Investors worldwide owned $5.2 trillion
of debt securities back by them
Sep 14th: Bank of America announces
its intent to purchaseMerrill Lynch;
Lehman Brothers files for Chapter 11
Dec: Federal Reserve announces
$28 billion Term Auction Facility;
Super Fund idea cancelled
Jan Feb Mar Apr May Jun Jul Aug Sep Oct Nov Dec Jan Feb Mar Apr Jun Jul Aug Sep
4
3.5
3
2.5
2
1.5
1
0.5
0
Bas
is P
oin
ts
Jul: Bear Stearns liquidates 2 mortgage-focused hedge funds;Countrywide warns of “difficult conditions” & takes $11 billion
loan; S&P places 612 securites backed by subprime residential mortgages on credit watch
Aug: American Home Mortgage Investment Corp. files for Chapter 11; BNP Paribas halts redemptions on 3 mortgage-related investment
funds; Fitch downgrates Countrywide; Central Banks coordinate activity to increase liquidity for 1st time since September 11 terrorist attacks
Sep: Bank of England provides
liquidity to support Northern Rock
Oct: A consortiumof U.S. Banks
backed by the U.S.government
announce a “SuperFund” of $100
million to purchase mortgage
backed securities
Chart 7
Spread Between 3-Month LIBOR & Overnight Index Swap Rate During Subprime Mortgage Crisis: 2007 through september 14,2008

19Citi Perspectives, a Prime Finance Publication JULY 2010
stability rating on the Reserve Primary Fund and on their
International Liquidity Fund as well as put nine other
Reserve funds on its credit watch list.
The Federal Reserve was forced to step in and take
extraordinary actions, including guaranteeing money
market funds and loosening lending terms for bank
holding companies. This helped alleviate commercial
paper market fears. As those fears eased, counterparty
concerns continued.
Amid heightened concern about additional investment
bank failures, both Goldman Sachs and Morgan Stanley,
the last remaining U.S. investment banks, announced that
they would change their legal status and become bank
holding companies over the weekend of September 20-
21. This move paved the way for those firms to be able to
access the Federal Reserve’s emergency lending facilities
and broaden their ability to pledge different types of
collateral. These moves helped to stem concerns about
their balance sheets.
“Before the crisis, we were focused on the right things—who
our counterparties were, including our lines of financing.
For the most part, things worked … We used to plan against
a collapse of one and maybe two counterparties. There was
a time in 2008 when it seemed like you could see several in
a week.”
– >$10.0 Billion AUM Hedge Fund
“During the crisis, counterparty concern went from theory
to practice. You could have lived three lifetimes and not
have had to understand your documents and contracts and
ISDAs to the extent we ended up having to. This could have
all been theory for decades, but it got put into practice with
practically no time to plan.”
– <$1.0 Billion AUM Hedge Fund
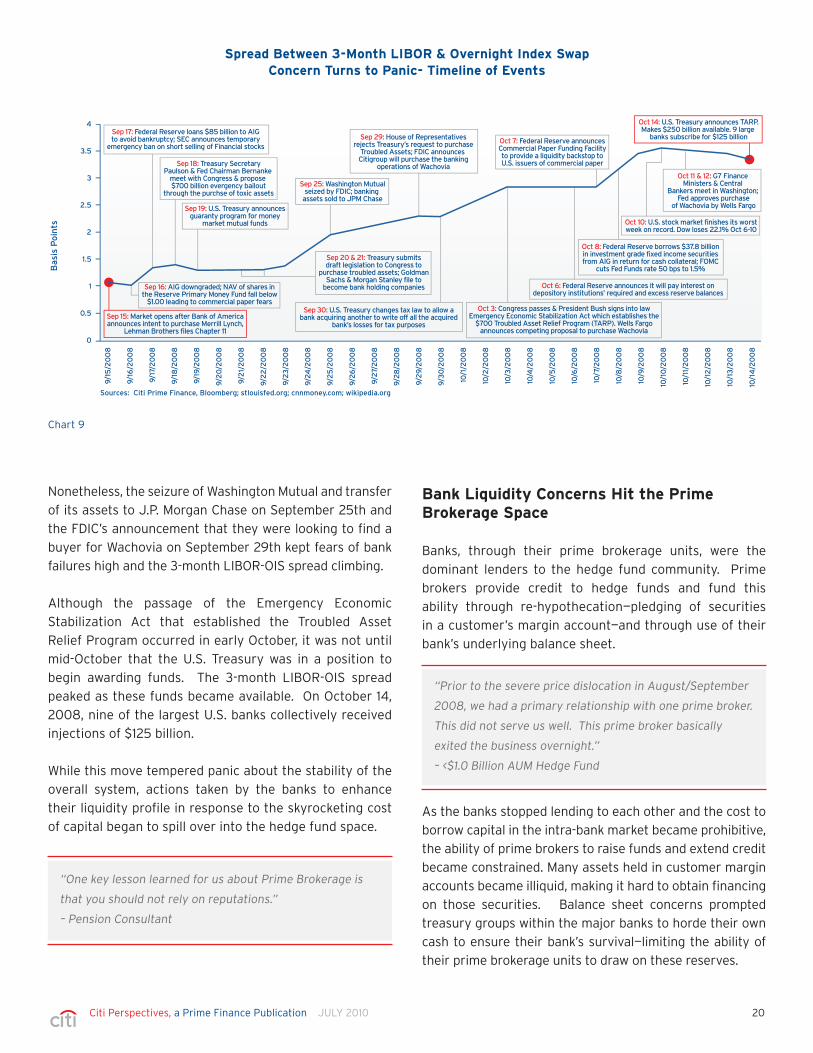
Chart 8 illustrates the drama of these 29 days.
As noted previously, the 3-month LIBOR-OIS spread was
86 basis points on September 12, 2008, holding near its
all-time high when the markets closed for the weekend.
When markets reopened on Monday September 15th, the
impact of three major banks going through such radical
change spooked lenders. The blowout of the spread over
the next four weeks reflected rampant counterparty fears
which resulted in a complete halt in banks’ willingness
to loan funds to one another. By October 13, 2008, the
spread had widened out to 364 basis points.
Chart 9 provides details on the key activities in this 29-day
window.
Following the Lehman Brothers announcement, investors
exposed to Lehman Brothers debt began to realize losses.
The Reserve Primary Fund, the U.S.’s oldest money market
fund, realized losses on $785 million in Lehman Brothers
commercial paper and medium-term notes on September
16th. Asset values in the fund plunged in Monday’s and
Tuesday’s trading sessions, “breaking the buck” to close
at 97 cents a share by Tuesday’s close, causing the fund to
suspend redemptions for seven days.
This was only the second time in history that a money
market had fallen below $1.00 a share net asset value—
the minimum level at which investors expected their
principal investment to hold. S&P lowered their principal
Spread Between 3-Month LIBOR & Overnight Index Swap Rate: Concern Turns To Panic
Sources: Citi Prime Finance, Bloomberg
0
0.5
1
1.5
2
2.5
3
3.5
4
Sep 15 -Oct 14
2007 - Sep 14, 2008
Bas
is P
oin
ts
Chart 8
20Citi Perspectives, a Prime Finance Publication JULY 2010
Nonetheless, the seizure of Washington Mutual and transfer
of its assets to J.P. Morgan Chase on September 25th and
the FDIC’s announcement that they were looking to find a
buyer for Wachovia on September 29th kept fears of bank
failures high and the 3-month LIBOR-OIS spread climbing.
Although the passage of the Emergency Economic
Stabilization Act that established the Troubled Asset
Relief Program occurred in early October, it was not until
mid-October that the U.S. Treasury was in a position to
begin awarding funds. The 3-month LIBOR-OIS spread
peaked as these funds became available. On October 14,
2008, nine of the largest U.S. banks collectively received
injections of $125 billion.
While this move tempered panic about the stability of the
overall system, actions taken by the banks to enhance
their liquidity profile in response to the skyrocketing cost
of capital began to spill over into the hedge fund space.
Bank Liquidity Concerns Hit the Prime Brokerage Space
Banks, through their prime brokerage units, were the
dominant lenders to the hedge fund community. Prime
brokers provide credit to hedge funds and fund this
ability through re-hypothecation—pledging of securities
in a customer’s margin account—and through use of their
bank’s underlying balance sheet.
As the banks stopped lending to each other and the cost to
borrow capital in the intra-bank market became prohibitive,
the ability of prime brokers to raise funds and extend credit
became constrained. Many assets held in customer margin
accounts became illiquid, making it hard to obtain financing
on those securities. Balance sheet concerns prompted
treasury groups within the major banks to horde their own
cash to ensure their bank’s survival—limiting the ability of
their prime brokerage units to draw on these reserves.
“One key lesson learned for us about Prime Brokerage is
that you should not rely on reputations.”
– Pension Consultant
“Prior to the severe price dislocation in August/September
2008, we had a primary relationship with one prime broker.
This did not serve us well. This prime broker basically
exited the business overnight.”
– <$1.0 Billion AUM Hedge Fund
Sep 16: AIG downgraded; NAV of shares inthe Reserve Primary Money Fund fall below
$1.00 leading to commercial paper fears
Oct 14: U.S. Treasury announces TARP.Makes $250 billion available. 9 large
banks subscribe for $125 billion
Oct 11 & 12: G7 Finance Ministers & Central
Bankers meet in Washington; Fed approves purchase
of Wachovia by Wells Fargo
Oct 10: U.S. stock market finishes its worstweek on record. Dow loses 22.1% Oct 6-10
Oct 8: Federal Reserve borrows $37.8 billionin investment grade fixed income securitiesfrom AIG in return for cash collateral; FOMC
cuts Fed Funds rate 50 bps to 1.5%
Oct 7: Federal Reserve announcesCommercial Paper Funding Facilityto provide a liquidity backstop toU.S. issuers of commercial paper
Oct 6: Federal Reserve announces it will pay interest ondepository institutions’ required and excess reserve balances
Oct 3: Congress passes & President Bush signs into lawEmergency Economic Stabilization Act which establishes the
$700 Troubled Asset Relief Program (TARP). Wells Fargoannounces competing proposal to purchase Wachovia
Sep 30: U.S. Treasury changes tax law to allow abank acquiring another to write off all the acquired
bank’s losses for tax purposes
Sep 29: House of Representativesrejects Treasury’s request to purchase
Troubled Assets; FDIC announces Citigroup will purchase the banking
operations of Wachovia
Sep 25: Washington Mutualseized by FDIC; banking
assets sold to JPM Chase
Sep 20 & 21: Treasury submitsdraft legislation to Congress to
purchase troubled assets; GoldmanSachs & Morgan Stanley file to
become bank holding companies
Sep 17: Federal Reserve loans $85 billion to AIGto avoid bankruptcy; SEC announces temporary
emergency ban on short selling of Financial stocks
Sep 19: U.S. Treasury announcesguaranty program for money
market mutual funds
Sep 18: Treasury SecretaryPaulson & Fed Chairman Bernanke
meet with Congress & propose $700 billion evergency bailout
through the purchse of toxic assets
Sep 15: Market opens after Bank of Americaannounces intent to purchase Merrill Lynch,
Lehman Brothers files Chapter 11
Sources: Citi Prime Finance, Bloomberg; stlouisfed.org; cnnmoney.com; wikipedia.org
9/1
5/2
00
8
9/1
6/2
00
8
9/1
7/2
00
8
9/1
8/2
00
8
9/1
9/2
00
8
9/2
0/2
00
8
9/2
1/2
00
8
9/2
2/2
00
8
9/2
3/2
00
8
9/2
4/2
00
8
9/2
5/2
00
8
9/2
6/2
00
8
9/2
7/2
00
8
9/2
8/2
00
8
9/2
9/2
00
8
9/3
0/2
00
8
10/1
/20
08
10/2
/20
08
10/3
/20
08
10/4
/20
08
10/5
/20
08
10/6
/20
08
10/7
/20
08
10/8
/20
08
10/9
/20
08
10/1
0/2
00
8
10/1
1/2
00
8
10/1
2/2
00
8
10/1
3/2
00
8
10/1
4/2
00
8
4
3.5
3
2.5
2
1.5
1
0.5
0
Bas
is P
oin
tsSpread Between 3-Month LIBOR & Overnight Index Swap
Concern Turns to Panic- Timeline of Events
Chart 9

21Citi Perspectives, a Prime Finance Publication JULY 2010
years and usually had several prime brokers with whom they
maintained active relationships by the latter part of 2008.
Having greater diversification across their prime brokerage
set helped many of these larger participants weather the
events of 2008 more effectively. More-liquid large hedge
funds were able to use at least portions of their assets to
continue to secure financing, but the amount of cash they
were able to raise was adversely affected by tightness in
the funding market. To maintain margin requirements,
many of these hedge funds were forced to post their most
liquid assets or cash. This left many of these participants
without excess cash on hand to invest in this period.
Many larger hedge funds with less-liquid assets were
forced to de-lever despite having a broader set of prime
brokers as they sought to manage their exposure.
For those hedge funds (large and small) with assets
caught up in the Lehman Brothers bankruptcy filing, that
situation was more severe as collateral postings made
prior to September 14th, 2008 were frozen as part of
the legal proceedings and unavailable to use during the
volatile market conditions.
Asset Protection Fears Accelerate De-Levering
The legal entity where a significant portion of Lehman
Brothers prime brokerage clients’ collateral postings
were being held was another factor feeding uncertainty.
Lehman Brother’s prime brokerage unit had channeled
much of their client business through their international,
as opposed to their U.S., legal entity. This reflected the
bank’s “arranging” business whereby clients were able
to obtain greater than Reg T leverage levels outside the
United States legal jurisdiction.
Prime brokers responded by requiring their hedge fund
clients to increase the amount of collateral required in
order to maintain or establish positions. Only the most
liquid collateral types or cash were deemed acceptable.
These developments impacted hedge funds across the board.
Cash Constraints Force Hedge Fund Liquidations
Smaller funds with less than $1.0 billion assets under
management were primarily “single” prime in the latter
half of 2008. This meant that these hedge funds had
a primary or exclusive relationship with only one prime
broker on whom they were nearly wholly reliant for credit
and financing to remain in business. These participants
controlled only about 30% of the hedge fund industry’s
total assets, but from a numbers perspective there were
thousands of these smaller participants.
As prime brokerage credit tightened, collateral requests
increased and market prices declined. Many smaller
hedge funds were forced to liquidate positions to meet
margin calls on their portfolios. In some instances, the
assets held in these portfolios were not liquid enough to
sell easily and the funds were forced to take substantial
hits as they exited positions.
The concentration of prime brokerage market share at just
two firms had a disproportionate impact on smaller clients.
Relationship managers at the two firms that controlled
55%-60% of market share were more focused on working
with the larger hedge funds whose greater asset levels
had more impact on the prime broker’s business and
exposures. Anecdotal evidence suggests one major firm
was looking to actively manage many of their smaller
hedge fund clients off their platform during the latter
months of 2008.
Larger hedge funds with more than $1.0 billion assets under
management were far fewer in number (only 200-300) but
typically controlled the majority (~70%) of assets. These
participants had moved to a multi-prime model in earlier
“We needed to be able to post convertibles as collateral. It
didn’t give us ample room to explore opportunities in the
market that we knew were there, but we needed any kind
of credit we could get.”
– <$1.0 Billion AUM Hedge Fund
“We were in bed with [the two largest prime brokers].
People were like, ‘Okay, that’s a good diverse place to
be.’ In September 2008, our prime brokers said you have
to be in fully paid securities or out. There were points
we thought we’d be out of business. Every day we were
getting calls to take down our levels.”
– <$1.0 Billion AUM Hedge Fund

22Citi Perspectives, a Prime Finance Publication JULY 2010
While arranging is a common prime brokerage service,
anecdotal evidence suggests that Lehman Brothers had
a different structure and were more aggressive in their
offering than other prime brokers. Indications were that
Lehman Brothers had a higher proportion of client’s
excess collateral held in their international legal entity as
compared to other prime brokers.
There were no legal precedents on what investor
protections were afforded to assets held in Lehman Brothers
International entity during the bankruptcy proceedings.
Asset holders were left in an uncertain predicament.
This was not an outcome that many in the industry had
considered prior to the events of September 2008.
The direct impact of this situation was clearly on those hedge
funds and their investors caught in the legal proceeding.
The indirect impact, however, was that many investors and
hedge funds became concerned about better protecting
their assets. Even clients unaffiliated with Lehman
Brothers prime brokerage began to voluntarily reduce
their leverage and shift their collateral holdings out of
their prime broker’s international entities.
Investors Reverse Allocations & Hedge Funds See Outflows
Investors too began to notify their Fund of Funds and
hedge fund managers of their intent to redeem allocations
to meet capital calls and as part of their general shift out
of the securities markets and into cash.
For the first time in over a decade, the Alternatives industry
experienced a net outflow rather than a net inflow of
capital. This exposed frauds that had gone undetected in
the industry—the most prominent being the Bernard Madoff
“ponzi” scheme, which came to light on December 9, 2008.
Investors Exit Securities and Shift to Cash
From October 6-10, 2008, the U.S. stock market recorded
its worst week on record, falling 22.1% over the course of
five trading sessions. This inauspicious start to the final
quarter coming on the heels of already substantial market
declines, touched off a significant shift of institutional
investor assets out of securities investments and into
cash. This is illustrated in Chart 10.
“We understood well in advance the risks we had when it
came to asset segregation. We had been proactively talking
to all our primes and pushing people. I guess the lesson
learned is that we pushed, but we didn’t act. We kept giving
our primes more time. We ended up taking a hit on Lehman
Brothers.”
– >$10.0 Billion AUM Hedge Fund
“High net worth investors were negatively impacted
by the recession, and then negatively hit again by
taxes. These investors tend to invest in more than just
Alternative funds. They needed that money unexpectedly.”
– Fund of Funds
“We took bets off and built up a mountain of cash. We
tend to be prudent. We require six weeks notification
ahead of end of quarter. We knew on November 15th
what we’d have to pay out on the 15th day of the new
quarter. We didn’t want to bet on money being available
in January 2009. We went through a disciplined process—
generating cash well ahead of the distribution date. We
went through the same process again on February 15th.”
– >$1.0 Billion AUM Hedge Fund
Sources: Lipper Fund Flows Reports; 10/08, 12/08, 1/09 & 3/09; Lipper Riding the Currentsreport April 2010; HFR Q4 2008 & Q1 2009
Oct-Dec 2008
500
400
300
200
100
0
-100
-200Equity
Mutual FundsBond & HybridMutual Funds
HedgeFunds
Money MarketFunds
Jan-Mar 2009 Change in AUM
-2%
-1%-6%
+4%
-9%
-7%
+12%
0%
Bill
ion
s o
f D
olla
rs
Investor Fund Flows: Q4 2008 & Q1 2009
Chart 10

23Citi Perspectives, a Prime Finance Publication JULY 2010
Outflows from the hedge fund industry in the fourth
quarter of 2008 amounted to $151.7 billion. This compared
to outflows of $140.0 billion from stock and mixed equity
mutual funds and outflows of $67.8 billion from bond
mutual funds.
Given the size of these long-only mutual funds, the dollar
amounts had only minimal impact on their overall assets
under management. By comparison, withdrawals of this
magnitude hit hedge funds much harder, amounting to 9%
of total industry holdings.
The newly guaranteed U.S. money markets and
international money markets were the primary recipients
of this liquidated capital. Inflows to money market mutual
funds topped $418 billion in the fourth quarter, a 12% rise
in assets under management.
By the beginning of 2009, the pace of these withdrawals
slowed appreciably for equity mutual funds. The trend
reversed and investors actually added assets to bond
mutual funds by the end of the first quarter.
Hedge funds did not fare nearly as well, however. News
of the Madoff scandal emerged in early December 2008,
triggering yet another wave of investor liquidations in the
hedge fund space. This drove assets under management
down an additional $103.3 billion and pared another 7%
off of total hedge fund industry holdings.
Madoff Scandal Touches Off Panic in the Fund of Funds Market
A comparison of where investor withdrawals hit the hedge
fund industry in the final quarter of 2008 and first quarter
of 2009 reveals an interesting pattern. Chart 11 shows net
outflows from single hedge fund managers and from Fund
of Funds managers in these periods.
Both hedge fund and Fund of Funds managers suffered net
outflows throughout the six months. Yet, there was a flip
in the primary focus of liquidations from one quarter to
the next.
Of the $151.7 billion redeemed in the fourth quarter 2008,
$101.1 billion of those funds were withdrawn from single
manager hedge funds while only $50.6 billion came from
Fund of Funds managers. By the first quarter of 2009, that
situation inverted. Single-manager hedge funds suffered
only a $17.8 billion decline in assets, whereas Fund of Funds
managers saw withdrawals of $85.4 billion
“We learned an important lesson about the stability of
various investors. Large segments of hedge fund investors
pulled their allocations. Managers had to realize that with those
types of investor allocations, you don’t own that money, you
rent it.”
– >$1.0 Billion AUM Hedge Fund
“We went through a drop in our AUM that we thought
our terms would have protected us against, but we
underestimated what investor demand for liquidity would
be. We saw investors willing to pay fees to get at their
money. Paying 10% fees to get out was clearly a panic play.”
– <$1.0 Billion AUM Hedge Fund
“The irony is that our Fund of Funds was only down 5% in
2008 and up 17% in 2009. We were punished because we
couldn’t provide liquidity, not because our returns were poor.”
– Fund of Funds
“Madoff was like a bomb going off in the industry,
particularly in Europe.”
– Pension Fund Consultant
Hedge Fund Net Flows: Q4 2008 & Q1 2009
Chart 11
Sources: HFR Q4 2008 & Q1 2009
Single Investor Funds
Q4
$101.1 billion
$17.8 billion
$85.4 billion
$50.6 billion
Q1
0
-20,000
-40,000
-60,000
-80,000
-100,000
120,000
Fund of Funds

24Citi Perspectives, a Prime Finance Publication JULY 2010
The discovery of the Bernard Madoff ponzi scheme in
December 9, 2008 cut to the core of investor fears about
Alternatives, particularly in Europe where many Fund of
Funds managers were caught with exposure to Madoff funds.
This event specifically called into question the extent of
due diligence done in selecting hedge fund managers
for institutional investor portfolios. Concerns about due
diligence emerged just as investors were also beginning to
realize that their actual ability to withdraw capital from their
Alternative portfolios was not working out as expected.
Liquidity Mismatches & Portfolio Concerns Come to Light
Outflows from the Alternatives space also disclosed
liquidity mismatches in the portfolio construction approach
utilized by Fund of Funds.
Portfolio Terms Blend Liquidity Profiles
As noted back in Chart 5, in constructing their mixed
Alternatives portfolios, Fund of Funds had typically
selected a number of hedge fund managers with variable
liquidity terms and co-mingled these managers into a
single portfolio. The Fund of Funds then “wrapped” this
portfolio with its own set of liquidity terms.
While hedge fund managers had an ability to “tune”
their liquidity terms to most accurately reflect the nature
of the assets they held in their portfolio, Fund of Funds
managers chose to align their liquidity terms to what they
perceived their “average” ability to withdraw funds would
be across their blended set of hedge fund managers. This
is illustrated in Chart 12.
The thinking from many of these Fund of Funds managers
was that in a blended portfolio, any investor redemptions
could be handled by the more-liquid strategies if, for
whatever reason, the investor needed capital prior to
when the Fund of Funds manager could withdraw money
from hedge fund managers with longer liquidity terms.
Over a period of time, the Fund of Funds would be able
to rebalance the portfolio as money from the longer-
dated funds became available. If this worked out as
expected, redemptions would not have a lasting impact on
performance across the overall fund.
“There were accepted practices going on in the
industry up until 2008 that in retrospect look like a
problem. Funds were using the liquidity of incoming
investors to pay out the established investors without
testing the investments themselves. It was hard to see
this until everyone hit the exit at once, and everyone
starting asking for their money back at the same time”
- Fund of Fund & Seeder
“In looking back, many funds were offering liquidity terms
on portfolios with illiquid investments.”
- Pension Fund
“I used to do a Fund of Funds. Something that used to
bother me a lot was that there was a definite mismatch
between what we were offering and what the managers in
our portfolio were offering. Hedge funds came up with more
onerous liquidity terms, especially from 2004 onwards.
There was nothing we could do about it. As a Fund of Funds,
our terms were set. It was a disaster waiting to happen.”
- >$1.0 Billion AUM Hedge Fund
“Anticipated” Fund of Fund Liquidity Prior to Crisis
Chart 12
Sources: Citi Prime Finance, Size of bubbles represent HFR Q1 2010 AUM.
Liquidity of assets in the portfolio
Stated PortfolioLiquidity Terms
Inve
sto
r ab
ility
to
w
ith
dra
w a
sset
s
LOW HIGH
LOW
HIG
H

25Citi Perspectives, a Prime Finance Publication JULY 2010
This theory remained untested until the latter half of 2008
as investor money flowed steadily into hedge funds and
Fund of Funds. When inflows turned to outflows, however,
the flaws in this approach became readily apparent, to the
detriment of many investors, Fund of Funds and hedge
fund managers.
Many Credit Funds Throw Up Gates
Chart 13 compares what Fund of Funds thought would
happen with their portfolios in terms of liquidity and what
actually happened.
The first assumption that had to be revised was that the
liquidity terms a hedge fund manager had agreed with their
Fund of Funds manager would remain unchanged when a
wave of redemptions occurred. While many managers stuck
with their liquidity terms, many also opted to invoke gates
and create side pockets—measures they had included as
cash management tools in their documents. Many hedge
fund managers suspended redemptions completely as the
extent of withdrawal requests threatened to undermine
their entire fund to the detriment of remaining investors.
Many Fund of Funds managers were ill-prepared for this
move. While they knew the rights to gate and create
side pockets existed, most had never modeled what the
impact of a massive wave of such actions would do to their
holdings. Large portions of their portfolio, which they
expected to be modestly difficult to liquidate, proved to be
impossible to liquidate.
Hedge fund managers with portfolios based around
Distressed Securities, Fixed Income Arbitrage, Multi-
Strategy and in some cases Global Macro with hard asset
investments ended up having much less ability to exit
positions than expected. This steepened and elongated
the distance between a Fund of Funds’ most-liquid and
least-liquid investments.
Investors Go to More-Liquid Funds for Cash
Unable to secure cash out of many of their less-liquid
hedge fund managers, Fund of Funds and other investors
instead began to go to the more-liquid pockets of their
portfolio for withdrawals.
This led to the second assumption that had to be revised.
While the underlying assets in a portfolio may be relatively
more liquid, those funds, too, have trouble exiting positions
in times of stress.
“All of us knew from our documents that there were
side pockets and that funds had an ability to gate, but
we didn’t really think about it as an industry. Our worst-
case scenario was off. By the numbers, we analyzed our
portfolios properly, but we didn’t take into account the
worst-case analysis of our investors leaving us and our
managers all rushing for the gates at the same time.”
- Fund of Fund
“For us, ensuring liquidity was our biggest lesson
learned. Certain managers had to enforce gates, or
close and restructure their funds having several illiquid
underlying investments. We had an idea of their
liquidity. We had transparency into their positions.
The problem was that everyone was selling, so that
things that seemed liquid turned out not to be.”
- Endowment
“We gated in 2008 because we didn’t have easy-to-exit assets
and didn’t want to degrade our performance. Our situation
became much worse when people suspended redemptions
completely. People equated gates to suspended redemptions,
even though they were completely different things. It
gave a bad name to the individual fund, if they gated.”
- >$1.0 Billion AUM Hedge Fund
Illustrative Fund of Fund Liquidity in the Crisis
Chart 13
Sources: Citi Prime Finance, Size of bubbles represent HFR Q1 2010 AUM.
Actual PortfolioLiquidity Terms
Liquidity of assets in the portfolio
Inve
sto
r ab
ility
to
w
ith
dra
w a
sset
s
LOW HIGH
LOW
Stated PortfolioLiquidity Terms
HIG
H
Long/ShortEquity
Multi-Strat
Global Macro
Market-Neutral& Dedicated Short
Event-Driven
ConvertibleArbitrage
Fixed IncomeArbitrage
DistressedSecurities

26Citi Perspectives, a Prime Finance Publication JULY 2010
Liquidations Reveal a Higher-Than-Expected Correlation to Beta
As more and more money came out of liquid portions of
the portfolio, Fund of Funds were forced to revise their
third assumption. While many hedge fund managers sold
themselves as producing ‘alpha,’ their returns in a period
when their strategy should have been able to differentiate
itself from the broader market indices actually revealed
that many were simply using leverage.
The correlation to ‘beta’ returns noted in the industry at
the time crystallized many fears that not all hedge funds
were truly ‘hedging’ and isolating their alpha.
To some extent, this is a chicken and egg question. Many
of these managers were being forced to exit positions to
raise capital for their investors because they were the
only liquid pocket in a Fund of Funds’ or mixed-Alternative
investor’s portfolio. Some of the largest funds at the time
were also heavily concentrated in some positions.
If positions had been left on, or if the portfolio managers
had more options to gate, perhaps the correlation to beta
noted in the period would not have been as high.
Chart 13 shows that even those strategies deemed to
be “highly” liquid (Equity Long/Short, Global Macro and
Market Neutral, Dedicated Short Bias) or even moderately
liquid (Event Driven and Convertible Arbitrage) were all
less liquid than expected. This shifted the entire curve of
the Fund of Funds/mixed investor portfolio downward in
terms of an investors’ ability to withdraw assets.
The concepts illustrated in Chart 13 are backed by the hard
numbers displayed in Chart 14.
Rather than showing a fairly stable balance across the
two quarters to support their “averaging” theory, Chart 14
shows that Fund of Funds and direct investors with mixed
Alternative portfolios pulled far less money out of “low”
liquidity hedge fund strategies (-16.0%) between October
2008 and March 2009 than out of strategies comprised of
assets with a higher liquidity profile (-29%).
“The reality was that people couldn’t get money they needed
and they were forced to go to their more-liquid pockets.
Unfortunately, it was the more successful funds—low leverage,
positive performance—that could get money out.”
– >$1.0 Billion AUM Hedge Fund
“We run reasonably liquid funds. There were many instances
where we served as the ATM machine to the industry.”
– >$10.0 Billion AUM Hedge Fund
“The crisis uncovered a lot of other problems in the industry.
There were deep questions as to what was alpha and what
was beta. People realized that if the market is rising or flat,
it’s easy to put up numbers. Hedge funds were supposed to
be uncorrelated. To have the HFR Fund of Funds index down
20% is just ridiculous.”
– Fund of Fund & Seeder
Sources: Citi Prime Finance, HFR 2008 & 2009
DistressedSecurities
Average Outflows -11% Average Outflows -30%
Fixed IncomeArbitrage
Multi-Strat ConvertibleArbitrage
EventDriven
DedicatedShort
MarketNeutral
EquityLong/Short
0%
-5%
-10%
-15%
-20%
-25%
-30%
-35%
Pe
rce
nt
Ch
ang
e in
To
tal A
UM
Liquidity of Assets in the PortfolioLow High
Q4
Q1
GlobalMacro
Change in Investor Flows by Strategy: Q4 2008 & Q1 2009
Chart 14

27Citi Perspectives, a Prime Finance Publication JULY 2010
On the other hand, perhaps the size of hedge fund
positions in large funds will always result in a higher-than-
anticipated correlation to beta in any period of liquidation.
Regardless of the answer, Fund of Funds and consultants
advising institutional clients on their selection of
managers have been left with a legacy of needing to dig
into a manager’s decision-making process to understand
precisely how they look to create alpha and that just
relying on the hedge fund’s strategy classification is no
longer a sufficient approach.
Portfolios Become Increasingly Less Liquid
The final assumption about Fund of Funds’ approach to
portfolio construction that had to be revised related to
their understanding of their “blended” portfolio liquidity
terms. The going-in assumption of many Fund of Funds
managers was that their blended terms would be close
to their most-liquid portions of the portfolio. Real-life
experience showed that, instead, blended terms were
closer to the most-illiquid portions of the portfolio as
illustrated on Chart 13.
As redemptions occurred in the Fund of Funds’ more-liquid
investments, the remaining assets in the portfolio became
increasingly difficult to exit. Many hedge fund managers
had moved into private equity-like assets—sometimes with,
and sometimes without, the knowledge of their Fund of
Funds manager. Stories about Fund of Funds being left
owning physical real estate and raw commodity production
facilities abound.
Many Fund of Funds continue to hold those assets even
18 months later and will not be able to liquidate those
investments for years. Even those portfolios without
hard assets, but heavily laden with illiquid distressed debt
securities, experienced this problem.
Lessons Learned in Crisis Trigger Massive Industry Change
Outflows of capital from the hedge fund industry subsided
by the spring of 2009. According to HFR, total assets
under management declined $599 billion, or 31%, from
their peak level of $1.93 billion in June 2008 to only $1.33
billion in March 2009. Investor withdrawals accounted
for $287 billion, or 48% of that decline, and performance
losses accounted for the remainder.
Beyond having to look to rebuild assets in the wake of such
dramatic declines, the industry was also left with several
key lessons learned that they would need to address in the
coming period.
Institutional investors realized that they needed to revisit
their approach to, and understanding of, the Alternatives
space, taking on more direct responsibility for their portfolios.
This involved both their getting more educated to make
better decisions about their allocations, and their looking to
take a more-direct role in obtaining the level of transparency
and control they desired to ensure their investments.
Hedge funds recognized that they needed to take active steps
to ensure a more-stable investor mix. This required them to
become more “institutionalized” in terms of their processes—
making substantial adjustments to their service provider
relationships, their internal processes, and their engagement
with and responsiveness to their investor community.
Fund of Funds and Institutional Consultants realized
that they needed to revamp their portfolio construction
philosophy armed with real-life experiences around areas
that had been theoretical up until the events of late
2008-early 2009.
Part II of our report details these changes.
“What came out of the crisis was that managers had
positions in the portfolio that were to the detriment of
investors in a stress period. Assets like private equity or
unrated corporate debt. Many times, these assets were not
even in a manager’s mandate.”
– Fund of Fund & Seeder
“We looked at the side pockets offered on the secondary
market in 2009 because you could buy into these
investments at quite attractive prices. We saw stuff like
real estate in Kazakhstan, copper mines in Angola—lots of
investments in the raw commodity sector. The multiples on
these assets are down and people don’t want to buy that.
It’s at least a 3-5 year commitment.”
– Pension/Insurance Fund
28Citi Perspectives, a Prime Finance Publication JULY 2010
investor can only own shares of the mutual fund and it is
the mutual fund itself that owns the underlying securities.
In an SMA, the investor can hire the actual fund manager
and have direct ownership and custody of the assets.
Concerns about their Fund of Funds and single-manager
experience in the liquidity crisis and their ability to protect
their own assets led many investors to explore the SMA
framework as a preferable approach for working with hedge
fund managers. This trend was particularly noticeable in
the first half of 2009.
Proponents cited several factors driving this interest,
making SMAs preferable to Fund of Funds or direct
allocations to a hedge fund manager’s co-mingled offering.
With an SMA, the investor would be the only asset owner in
the account. There would be no adjacency risk from other
investors looking to liquidate and force down the value of
the fund. Conversely, as the sole owner of the assets, the
investor could choose to liquidate their holdings at will,
without a hedge fund manager or Fund of Funds manager
limiting their ability to act.
Because the investor was the sole owner of the assets, they
would have complete transparency into the holdings of
the account, and could feed information on these holdings
into their own risk systems or to chosen risk aggregators,
such as RiskMetrics. Finally, the investor could choose
their own hedge fund administrator to value and report on
activity in the account. This meant that the investor was
not reliant on the hedge fund’s relationship and that they
could have an independent service provider.
In the immediate aftermath of the liquidity crisis, there
was a wave of requests from investors looking to set up
SMAs with their Alternative hedge fund managers. High-
profile investors announced their intention to transfer
their entire portfolio of Alternative investments into SMA
structures. Even investors with relatively small amounts
of capital were approaching hedge fund managers about
setting up these accounts.
Investors Seek More Direct Control over Their Portfolios
Institutional investors had been increasing their allocations
to Alternative strategies to obtain portfolio diversification
and alpha returns since 2000. Because this was a space
most were not familiar with, the majority of participants
relied on institutional consultants for advice and manager
selection, or they invested directly with Fund of Funds and
outsourced their selection of hedge fund managers.
Issues uncovered during the liquidity crisis pushed investors
to become more active in their approach to Alternatives.
This increased level of engagement was first demonstrated
through a shift in focus away from Fund of Funds investments
and toward Separately Managed Accounts (SMAs).
Explore Separately Managed Accounts as a Structure
Many investors walked away from the liquidity crisis
with concerns about having “adjacency” risk in the
Alternatives space. Adjacency risk was seen as having
other investors able to take actions that would impact the
overall performance of the fund. Because each investor’s
assets were co-mingled with other investors in both single-
manager funds and in Fund of Funds, many felt that their
ability to choose their course of action was limited.
The immediate response to the liquidity crisis, thus, was
for many investors to seek to “segregate” their portfolios
and eliminate their adjacency risk.
Separately Managed Accounts (SMAs) are a common
asset management structure in the long-only space and
one with which many institutional investors are very
comfortable. SMAs are vehicles through which an investor
can have direct exposure to the underlying stocks and/or
bonds that a fund manager may purchase. The appeal of
this approach is that in a mutual fund, the institutional
Part II: Crisis Responses Help to Institutionalize the Industry
“People are much more concerned and focused on adjacency
risk in hedge fund LP structures.”
– Pension Consultant
“The impetus for SMAs comes from clients being very leery on
who they’re partnering with, and their wanting transparency.”
– Pension Consultant

29Citi Perspectives, a Prime Finance Publication JULY 2010
Struggle with SMA Set-Up & Operational Hurdles
Creating the SMA structure in conjunction with a hedge fund proved much more difficult than many investors anticipated. While there were some hedge funds that had worked with these types of accounts prior to 2009, this was an exception rather than the rule in the Alternatives space. Most hedge fund managers had little experience with SMAs and most investors had little experience with Alternative SMAs. This often led to extensive, drawn out negotiations or even confusion over basic building blocks of getting the relationship set up, such as who should be providing the documents—the investor or the hedge fund.
Other factors quickly came to light that many investors had not anticipated in looking to move to an SMA. Chart 15 illustrates the complex nature of operating an SMA within a hedge fund framework.
Replicating the terms a hedge fund receives with its key trading partners in all but the most simple, liquid strategies is difficult for investors in an SMA structure. While a hedge fund manager can use their executing dealer relationships to put on trades and their prime broker relationships to finance and manage trades of behalf of their SMA investor, they cannot do so under their own terms. The investor, not
the hedge fund, is the owner of the assets held in the SMA and therefore the hedge fund has to negotiate a new set of ISDAs and prime brokerage documents for their SMA investor. Terms in these agreements are sometimes not as favorable, making it difficult for the hedge fund to truly replicate their performance in an SMA.
There are also set-up challenges that the hedge fund has to manage in order to be able to work effectively day-to-day with their SMA investors.
Investors independently select a hedge fund administrator to value and report on their SMA portfolio. If this administrator differs from the administrator being used by the hedge fund, the hedge fund must set up their own connectivity to the new administrator. They also must ensure that their prime brokers are set up to share information with that entity. While this may not be exceptionally difficult with one SMA and one additional hedge fund administrator, several hedge funds indicated that the problem compounds exponentially when they are working across eight or nine different SMA
accounts and administrators.
“We’re an exception to the rule, in that we got started with
SMAs, and we’re used to operating with those structures. It
takes more resources and it takes a big back office.”
- >$10.0 Billion AUM Hedge Fund
Separately Managed Account Operating Model
Chart 15
HEDGE FUND PORTFOLIO MANAGERS / TRADERS HEDGE FUND OPERATIONS
InitiateTrades
AllocateTrades
SMAAgree
Terms &Manage
Cash
CashAccounts
ShareClass 1
ShareClass 2
Fund Administrator
ExecutingBrokers
PrimeBrokers
Fund LevelISDA Terms
Investor Level ISDA Terms
Investor LevelFinancing Terms
Investor Level Fees & ChargesPlus Additional SMA Charges
Fund LeveFinancing Terms
Fund LevelFees & Charges
ManagePositions
MasterFeederFund
AgreeValuations
ShareClass 3
SMA PLATFORM OR INVESTOR OPERATIONS
Fund Administrator
“If we were to set up an SMA, we wouldn’t be able to negotiate
the same terms that we get for an investor … They would
have a smaller asset base. They would never be able to do in
an SMA what we can do as a fund.”
- >$10.0 Billion AUM Hedge Fund
“Investors simply can’t put on the same trade with the same
return on investment.”
- <$1.0 Billion AUM Hedge Fund

30Citi Perspectives, a Prime Finance Publication JULY 2010
Finally, the investor also has to either self-administer
their SMA through their own operational unit day-to-
day, or hire an SMA platform manager to perform margin
reconciliations and coordinate cash movements to and
from the hedge fund in order for them to meet their
margin calls.
Managing hedge fund SMAs from their own operational
unit requires that the investor have a team in place with
sufficient expertise and infrastructure to manage ISDAs
and prime broker relationships. While some of the largest
investors might be able to handle this challenge, many
institutional investors are not set up from a systems or
staffing perspective to ensure these functions.
Hiring an SMA platform manager can add excessive cost
into operating an SMA and has to be weighed against the
returns the hedge fund is expected to generate. As one
investor noted, if they are only expecting 7-8% returns
and are paying 2-3% SMA fees, that leaves very little
margin. Several hedge funds also noted that they may
start to charge investors additional fees to help finance
the operational complexity of managing an SMA. This
could cut further into the economics of the structure.
Test Fund of One Structures as SMA Alternatives
Fervor about exploring SMAs appears to have peaked
by the latter part of 2009. Many investors realized that
it would be difficult to truly replicate the hedge fund
manager’s portfolio returns. Smaller investors began to
understand that without a robust operations unit, they
would have to outsource management of their SMA to
an independent manager, adding significant costs to the
structure. Hedge funds not already tooled to service
these types of accounts also pushed back around the
operational complexities.
This left only a segment of the investor community—
with robust infrastructures or enough buying power to
negotiate down SMA management fees—well positioned
to pursue these accounts. Thus, SMAs are likely to remain
a feature of the hedge fund industry, but not catch on to
the extent that many thought in the early months after
the liquidity crisis.
Investors still concerned about adjacency risk, but poorly
situated to handle the complexities of the SMA structure,
were left looking for options on how to effectively
segregate their assets.
“Some Fund of Funds have negotiated special fees for a
Fund of One. The incentive for a Fund of One can be better
claw-back provisions. Everyone knows that there is some
beta in your strategy, so having a Fund of One lets you put in
a more reasonable hurdle.”
– Pension Consultant
“Clients choose their own administrator with an SMA. We
have eight SMAs and eight new relationships we have to
manage. That requires set-ups, free-transfers and a lot of
other work. Even though the direct cost is not ours, the
difficulty of managing these relationships is ours. It’s a
compounding problem. I think it will be a challenge for the
business to continue down the SMA path.”
– >$1.0 Billion AUM Hedge Fund
“On the long-only public side, we’ll look at SMAs because
they’re easy to manage—not on the Alternatives side. We
don’t have a back office and we don’t have the capacity to
manage a lot of ISDAs … managing across multiple prime
brokerage relationships is not going to work for us.”
– Endowment
Alternative Investment Legal Structures
Source: Citi Prime Finance
Co-Mingled Assets
Fund of Fund-driven administration
Investor-driven administration
Fund of One(Initial setup)
Master fundor fund series(Share class)
Hedge fund-driven administration
Segregated Assets
Cos
tsLO
WE
ST
HIG
HE
ST
Fund ofFund
Fund of OneSingle orDual LP
SeparatelyManagedAccount
Chart 16

31Citi Perspectives, a Prime Finance Publication JULY 2010
In both instances the assets of the Fund of One are segregated from the hedge fund’s co-mingled accounts, but as illustrated in Chart 17, the operational maintenance of the account is much simpler as the hedge fund manager has all responsibilities and manages the structure alongside their own funds.
Sole LP Fund of One structures have proven especially attractive to some Fund of Funds looking to have more influence over hedge funds managers in their portfolio. The thinking behind this move is that there would be less likelihood of a hedge fund manager throwing up gates or creating side pockets if the only investor in the fund is a Fund of Funds seeking withdrawals. Additionally, as the owner of the fund, the Fund of Funds will have full transparency in the account’s holdings.
It remains to be seen how widely these Fund of One structures are adopted. Like SMAs, there are likely to continue to be some segments of the institutional investor community that prefer this approach, and their suitability for Fund of Funds may provide room for growth.
Traditional hedge fund industry offerings did not meet their needs. As shown in chart 16, an investor’s assets would be co-mingled with other investors in both a hedge fund manager’s single fund and in a Fund of Funds’ portfolio. This left investors one more structure to explore, and by the latter part of 2009 many investors had begun to work with hedge funds to set up Funds of One.
In many ways, Funds of One are seen as a compromise structure between hedge funds and investors. A version of the Fund of One has existed for some time. Many larger and mid-sized hedge funds have been willing for several years to set up a separate share class for a single investor within their master-feeder structure. The difference between this and a Fund of One relates to the legal structure of the fund and ownership of the assets.
In traditional single-investor funds, the hedge fund manager would remain the legal owner of the fund and would own the assets. The investor would have more leeway on negotiating terms and they would receive the full benefit of returns, but they would not have the right to independently liquidate the assets. They also remained liable for the costs of the management fee and the payout of any incentive fees.
Many of these same limitations remain in place with the newer Fund of One structures, but there are differences around the legal structure and ownership of the assets. Either the investor becomes the sole owner of the account and the assets (Sole LP) or there is an arrangement made whereby the hedge fund manager themselves put capital into the fund along with the investor and they co-own the account and the assets (Dual LP). For investors looking to have their hedge fund manager’s interests optimally aligned with their own interests, the Dual LP structure offered attractive incentives.
“Large investors are looking at Funds of One to handle their
adjacency risk. I have been surprised at the size people are
demanding for these structures. I thought you would have
had to have a larger size.”
– Pension Consultant
“Dual LP Funds of One come up because the investor wants
the GP of the fund to move cash from the big, co-mingled fund
into one where there is direct alignment with the investor.”
– Pension Consultant
Source: Citi Prime Finance
HEDGE FUND PORTFOLIO MANAGERS / TRADERS HEDGE FUND OPERATIONS
InitiateTrades
AllocateTrades
ShareClass 1
ShareClass 2
ShareClass 3
Fund ofOne
Fund Administrator
ExecutingBrokers
PrimeBrokers
Fund LevelISDA Terms
Fund LeveFinancing Terms
Fund LevelFees & Charges
ManagePositions
MasterFeederFund
AgreeValuations
Fund of One Operating Model
Chart 17

32Citi Perspectives, a Prime Finance Publication JULY 2010
The expansion of UCITS funds in Europe (regulated hedge
fund entities with extremely high liquidity) and a greater
focus on Alternatives by private banks has helped to open up
a distribution channel to high net worth individuals further
down the wealth chain from the family office. The majority
of high net worth investors do not have the resources or
knowledge-base to perform the due diligence required
for direct investment with a hedge fund. New private
bank distribution platforms now act as the intermediary
in these relationships—providing the hedge fund a single
counterparty which makes it easier for them to take in the
smaller amounts of capital that come in via these platforms.
To improve their chance of obtaining a more diverse mix of
investors, hedge funds also cited other changes they are
implementing to become more attractive investment vehicles.
Improve Their Liquidity Terms
Many funds reviewed and improved the liquidity terms
they were willing to offer investors or created an expanded
number of options for investors to choose from, to better
align their liquidity requirements.
Changes occurring in parallel that have deepened the
interactions between investors, their intermediaries and their
hedge fund managers may limit the need for these segregated
structures, however. Many participants see increased
engagement and transparency emerging in the hedge fund
industry, swinging the industry back toward direct-investor
allocations to hedge funds’ co-mingled offerings.
Hedge Funds Seek More Direct Investor Allocations
While investors’ immediate response to the crisis was to
seek more direct control over their assets, hedge funds
emerged with a determination to diversify their sources of
capital and ensure a broader, more stable mix of investors.
To accomplish this aim, they have made significant
enhancements to “institutionalize” their controls and
“systematize” their investment edge. Such enhancements
are seen as increasing their attractiveness as direct
investment targets.
Broaden Their Investor Mix
Smaller and mid-size hedge funds indicated that they were
looking to reduce their reliance on Fund of Funds. Some of
the impetus for limiting Fund of Funds exposure tied back
to the liquidity terms mismatch discussed earlier, and the
excessive pressure many hedge funds felt to exit contracts in
order to satisfy Fund of Funds’ shorter redemption windows.
Some of the impetus for this was simply a desire to be less
concentrated with any one type of investor going forward.
Mid- and larger-size hedge funds were looking to expand
their direct-investor allocations from pensions, endowments
and sovereign wealth funds. Securing these allocations was
seen as a longer-term relationship building exercise where
both the institutions and the allocators spent significant
time getting to know one another over the course of many
months. There was also a decided geographic aspect
to these plans with hedge funds wanting to have a more
diverse set of investors to match their global strategies.
Another source of money that proved “stickier” than
expected during the liquidity crisis was contributions from
high net worth investors. The most well organized of these
ultra-high net worth participants—the family office—have
long been a focus for hedge funds and form the foundation
of some firm’s most long-standing capital. These investors
tended to remain with hedge fund managers throughout
the crisis.
“We’ve gotten a lot of calls in the past year from funds that
have kicked out their Fund of Funds investment in favor of
shifting to direct Pension and Endowment investments.”
– Pension Fund
“Our lesson learned is that we want to broaden our investor
base. Going into 2008, 3 out of 4 of our investors were Fund
of Funds. Now going into 2010, we are purposely moving that
ratio to only 2 out of 5.”
– >$1.0 Billion AUM Hedge Fund
“We came away from 2008 with a greater ‘know your
customer’ emphasis, and a commitment to diversify our
marketing footprint. We are now much more interested in
having a mix of investors.”
– >$10.0 Billion AUM Hedge Fund
“We’ve actually opened up a relationship with a private bank
and are offering our product via their high net worth platform
… these investors tend to stick around and see if it works out. In
that sense, they are more like Pension or Endowment money,”
– <$1.0 Billion AUM Hedge Fund

33Citi Perspectives, a Prime Finance Publication JULY 2010
Funds with highly liquid trading strategies noted that this
has become a key selling point for them in marketing calls
with investors, post the events in 2008-2009.
Many of these hedge funds embraced the role they played in
helping investors manage their cash flow during the crisis.
By reducing their notice periods and/or re-engineering their
liquidity terms to offer monthly—as opposed to quarterly—
redemptions, these funds are touting their ability to offer
investors more choices in their cash decisions.
In some instances, hedge funds changed their terms on
existing portfolios and, in many instances, higher liquidity
funds were launched as an additional share class to
supplement the hedge fund’s traditional offerings. For
these newer share classes, most hedge funds were charging
slightly higher fees than in their original portfolios and
putting parameters around the fund’s exposure to credit or
less liquid investments.
Hedge funds trading less-liquid strategies have also shown
some give in their terms. Most of these hedge funds cut
the length of their lock-ups and/or moved to a soft as
opposed to a hard lock-up. Many of these hedge funds too
are offering additional share classes with more favorable
investor liquidity terms at a higher fee, although the
shortest redemption window noted was still quarterly.
Finally, many hedge funds with both highly and moderately
liquid strategies have begun to offer a new approach for
managing their liquidity, called an investor-level gate. Unlike
the fund-level gate that limits how much investors as a whole
can withdraw from the fund, the investor-level gate curtails
the percent of their total investment that an individual
investor can withdraw in a given redemption period.
For example, a 25% investor-level gate in a quarterly
redemption fund means that it would take an entire year
for the investor to completely liquidate their allocation
with the manager. Having an investor-level gate is seen as
a preferable alternative to fund-level gates by many hedge
funds and investors alike, as it provides them protection
against destabilizing withdrawal requests and is seen as
helping them avoid needing to invoke fund-level gates or side
pockets to ensure the fund’s value for remaining investors.
Diversify Their Prime Brokerage Relationships
Another enhancement smaller hedge funds have pursued
to increase their investor appeal has been to diversify their
service relationships. Nearly all funds now pursue a “multi-
prime” model where they have relationships with at least
two, and typically several, prime brokers.
Our survey revealed that even equity-focused hedge funds
with less than $1.0 billion in assets under management now
have active relationships with several prime brokers. The
rationale for this diversification is that hedge funds will
be less vulnerable to counterparty risks and have access
to a broader and more competitive set of credit terms
and financing. This should allow a hedge fund to better
weather another period of liquidity tightening, increase the
likelihood that they will be able to obtain needed capital to
take advantage of market opportunities from at least one of
their counterparts and prevent them from having excessive
exposure to any given bank’s balance sheet.
In their 2010 survey of the prime brokerage space,
Greenwich Associates noted a distinct flattening of prime
brokerage market share in the past year with relationships
now more evenly spread across the “name” prime brokers.
“We’ve seen a lot of quarterly hedge funds going to monthly.
The only reason a lot of them had been quarterly was because
they could get away with it.”
– Fund of Fund
“Some of the less-liquid funds moved from having a two-
year hard lock to a one-year soft lock. Many of the more-
liquid funds moved to having a monthly with 30-day notice
from a quarterly with 60-day notice, and they removed the
fund-level gates.”
– Pension / Insurance Fund
“Top of the list in terms of lessons learned has to be the
requirement to have multiple prime broker relationships.”
– <$1.0 Billion AUM Hedge Fund
“We’ve done a lot around Prime Broker diversification. We
now have at least three prime brokers per account.”
– >$1.0 Billion AUM Hedge Fund
“We addressed our investor liquidity concerns by offering
them more options. You can continue to do business with
us at the same terms and the same fees, but if people are
willing to pay up on fees for more liquidity, we are offering an
opportunity to do so through new series.”
– >$1.0 Billion AUM Hedge Fund

34Citi Perspectives, a Prime Finance Publication JULY 2010
Ensure Better Asset Protections
Hedge funds demonstrated three approaches to better protecting their investor’s assets in the wake of the liquidity crisis.
Hedge funds worked with their prime brokers to maximize their exposure to the bank’s U.S. legal entity with guaranteed SIPC protections. This was a direct response to the Lehman bankruptcy and the uncertainty around the disposition of assets caught up in that event.
Hedge funds established custody relationships, working with their prime brokers and in many instances in-house or third-party custodians, to set up accounts where they could move excess fully paid assets out of their counterpart’s broker-dealer entity and into a more protected entity. Several models of custody emerged in the past 18 months—each with their own unique set of pros and cons. For more information on this topic, please request a copy of our white paper, Prime Custody: Asset Protection & Operational Simplicity.
The final measure hedge funds invoked to provide better protection of their assets was to “sweep” their excess cash reserves into overnight interest-bearing accounts or protected money market funds rather than leaving excess balances with their counterparts.
Showcase Their Operational Strengths
The final way in which hedge funds have sought to underscore their attractiveness as direct investor targets is to increase their investment in their own operational and IT infrastructures to demonstrate their reliability as a counterpart, post the liquidity crisis. Anticipation of coming regulatory changes that are likely to result in hedge funds needing to support audits, reviews and inquiries from several different local and international agencies have also supported such investments.
New spending has been focused on enhancing several operational areas. Many hedge funds are now building out toolsets that allow users to query data and model risk exposures in real time. This offers senior management better control over their portfolio and better information to share with their counterparties and investors.
Integrating the outputs from these risk analytics into the research and portfolio investment process has also been a priority. With a better toolset allowing for real-time queries around risk, hedge funds can now provide their portfolio managers more insight into their capital utilization, buying power and exposures. This increases investor’s confidence
that the manager is well poised to capture market opportunities and effectively generate alpha.Downstream of the trader, many funds are also investing in their infrastructure to create “shadow” views of their prime broker and hedge fund administrator activities. In pursuing this goal, hedge funds are looking to have their own record—to reconcile with, not replace, the services they receive from these providers. Having a “shadow” view is seen as a precautionary move to avoid fraud, reduce errors, control costs and ensure the accuracy of their providers’ data. It also allows hedge funds more ability to create and frame their own reports for their investors and distribute those reports at will.
Finally, several funds have created in-depth manuals that document their operational controls, processes and safeguards. These manuals trace the roles, responsibilities, interactions and disposition of the fund’s orders, trades, positions and assets, both internally and across their set of providers.
Funds possessing this level of insight and control can much more easily engage with investors and demonstrate a level of
transparency most apt to draw the direct allocations they desire.
“We did a lot of work around our counterparty domiciles and
legal entities. Our preference was to be in the U.S. For us, it’s
about the jurisdictional risk.”
– >$1.0 Billion AUM Hedge Fund
“We have one custody relationship that we set up because we
had some specific securities that we wanted fully segregated.
We didn’t want those assets lent out or re-hypothecated.”
- <$1.0 Billion AUM Hedge Fund
“We developed our own proprietary risk application and
have integrated our risk system as part of the research and
investment decision-making process.”
– >$1.0 Billion AUM Hedge Fund
“Another thing we get kudos for is documenting every single
procedure— from cash reconciliations to payroll to compliance—
step by step … We don’t hand it out, but when we pull out a
200-page document with that much detail, people go, ‘Wow!’”
– <$1.0 Billion AUM Hedge Fund
“We invested heavily in our IT. Our thinking was that we didn’t
want to replace or take over what our administrator and what
our prime broker do. We want a parallel system that captures
a mirror. If you’re responsible for something, I’m going to help
you watch it.”
- >$1.0 Billion AUM Hedge Fund

35Citi Perspectives, a Prime Finance Publication JULY 2010
Investment Due Diligence Focus Areas
Pre2009
Since2009
Source: Citi Prime Finance
Fund
’s w
illin
gnes
s to
sha
re in
form
atio
n
LOW
HIGH
Investment Strategy Approach& Key Personnel
Performance
Liquidity Terms& Alignment
Concentrations& Exposures
Positions& Trades
Lower level ofdetail soughtby investors
Higher level ofdetail soughtby investors
Industry Due Diligence Reaches an “Institutional” Standard
Signs that enhancements to hedge funds’ liquidity, transparency and control are working to reassure the investor community can be seen most readily in the manner by which due diligence has evolved. Improvements in this process have increased confidence from investors about hedge funds as counterparts, helping to stem the SMA tide; limited interest in Funds of One; and reinvigorated interest in direct investments into a hedge fund’s co-mingled vehicle.
Investment Due Diligence Expands
Performing due diligence around a hedge fund manager’s investment approach is a long-standing practice. However, as chart 18 shows, on the whole, evaluations prior to 2009 only extended down to a limited depth of information.
Part of the reason investment due diligence was more limited lay with hedge funds’ historic reluctance to share detailed portfolio information. For many years, hedge fund managers were comfortable resisting investors’ requests to have transparency into their portfolios.
Several investors and their intermediaries discussed how competition to gain access to a fund’s limited capacity would make them feel pressured to make a quick allocation decision, even without this information.
The liquidity crisis changed the balance of power in these relationships over the past 18 months. Investors and their intermediaries are now seeking and receiving highly
detailed information “down to the molecular level” from many of the hedge funds they review.
Several hedge funds have also increased their transparency and communications to attract investor allocations, drawing on the experience they had during the liquidity crisis as a model. Many hedge funds were forced to become highly communicative and transparent with their investors during the weeks of the liquidity crisis and this experience helped to ease some of their concerns about information-sharing.
Several hedge funds noted that they were in daily and sometimes more frequent communication with their investors during the height of the liquidity crisis. They openly discussed their portfolio holdings and investment plans with their investors. Rather than this having been a deterrent to their ability to act, many instead noted positive experiences, including some instances where they were able to hold onto allocations or maintain their relationship with an investor and recapture allocations that were redeemed once capital freed up in 2009.
Diminishing concerns from hedge funds about sharing information have positively impacted investors’ ability to perform investment due diligence.
Most investors and their intermediaries are now receiving fairly detailed views into hedge fund manager portfolios. Typically, these views are being offered on a lag—sometimes by as little as a week but more frequently out 30 days. For the purposes expressed by most investors and their intermediaries, this delay is an adequate compromise.
The desire to perform a holdings-based analysis relates to investors’ desire to “check” whether the holdings in the portfolio match the manager’s stated investment approach.
Investors are looking more to see that a manager does not have holdings that would be outside their mandate than to evaluate the specific holdings the manager has in their portfolio.
“Can you get your arms around the risk of a fund at a
molecular level?”
– Pension Consultant
“We always want to see snapshots of the portfolio before
investing. Are they investing as they say they are? If they
say that they’re 50% U.S. and 25% European, I want to see
that reflected in the portfolio snapshot.”
– Fund of Fund
Evolution of Investment Due Diligence
Chart 18

36Citi Perspectives, a Prime Finance Publication JULY 2010
Ongoing Investment Monitoring Improves
Another trend discussed across interviewees was the idea
that investment due diligence is becoming more of an
ongoing part of the relationship between the hedge fund
manager and the investor or intermediary.
Prior to the liquidity crisis, many hedge funds put little
focus on their investor reporting. Either they outsourced
this function to their hedge fund administrator or they
encouraged their internal marketing team to put together
occasional letters, updating investors on their performance
and some key measures around the fund’s top investment
exposures.
Subsequent to the crisis, providing frequent, consistent
reports to the investor community has become a standard
practice. Much more content is being provided in such
reports as well. Many hedge funds are willing to show
details around their portfolio holdings, risk profile, use of
leverage, liquidity, on-hand cash and performance.
Some hedge funds noted that if their investors were willing
to sign confidentiality agreements, they were willing to
copy them on their prime brokerage reports or authorize
them to directly access their fund administrator reports.
As more information around a manager’s risk profile
emerges and is tracked by investors and their intermediaries,
several investors have begun to request that hedge funds
feed this information to independent risk aggregators,
such as RiskMetrics. This would allow the investor or their
intermediaries to build their view of a fund’s concentrations
and exposures out over a period of time and help them
spotlight potential issues and engage in more informed and
detailed discussions with the manager.
There are split views among both investors and hedge funds
as to the efficacy of using third-party risk aggregators,
however. Several investors worried about the dated nature
of the portfolios most funds would be willing to send
through and had questions as to the relevancy of value-
at-risk analysis for many investment strategies. Several
hedge funds, particularly those under $10 billion AUM,
expressed hesitancy at the costs of creating the desired
level of integration and they worried that these platforms
would not be able to adequately measure and reflect the
more esoteric products in their portfolios.
Operational Due Diligence Becomes Mainstream
Operational due diligence existed, but had never gained
as much prominence as investment due diligence prior
to the liquidity crisis, a fact dramatically underscored
by the Madoff scandal. While many consultants offered
operational due diligence as an add-on service, few
investors saw this as a priority. Anecdotes of investors,
particularly Fund of Funds managers, performing only rote
examinations prior to the Madoff scandal were widespread.
Chart 19 shows that, pre-2009, most operational due
diligence consisted of a top level understanding of a hedge
fund’s policies, controls and key service providers. Most
investors and their intermediaries adopted a “check the
box” approach, where they would come in with a standard
questionnaire and ask a series of questions.
Since the liquidity crisis, investors and their intermediaries
have placed a tremendous emphasis on operational
due diligence and have focused numerous resources in
this area. Many intermediaries have built out dedicated
operational due diligence teams that work separately from
the investment due diligence team. Individuals hired into
these roles come from operational backgrounds and are
capable of digging into a hedge fund’s actual process flows
and activities to understand not just what the fund says
their control policies are, but to evaluate how well they are
likely to work.
Operational due diligence teams are performing
independent background and reference checks of the
individuals in key control roles. They are contacting prime
brokers and fund administrators to verify balances.
“Performing a holdings-based analysis is now a standard
part of our process. We’re looking at this from a risk-return
perspective as a way of seeing if the fund aligns with its
stated investment goals.”
– Pension Fund Consultant
“There is a real desire to see different slices and cuts of
the portfolio expressed in different ways. We are starting
to see a little more interest in third-party aggregators, like
RiskMetrics/Barra.”
- Pension Consultant

37Citi Perspectives, a Prime Finance Publication JULY 2010
Operational Due Diligence Focus Areas
Pre2009
Since2009
Source: Citi Prime Finance
ee9
Fund
’s w
illin
gnes
s to
sha
re in
form
atio
n
LOW
HIGH
Policies & Controls
Lower level ofdetail soughtby investors
Higher level ofdetail soughtby investors
Service Partner Relationships
Detailed Process Flows
InfrastructureInvestmentIntegration
& Spend
They are also working closely with hedge fund operational
teams to review how well documented a hedge fund’s
operational and business continuity processes are and, in
many instances, are spending time side-by-side with the
hedge fund team shadowing their middle- and back-office
teams to observe them run through a month-end or daily
process. Hedge funds are also working with operational
due diligence teams to help them understand how recent
investments have “tooled” their infrastructure to support
their trading edge and improve their controls.
To accomplish such a broad examination, most participants
discussed having operational due diligence teams perform
several on-site visits over the course of many sessions
before coming to their final recommendation on a fund.
When an allocation decision is being made, most investors
and their intermediaries indicated that the operational due
diligence team is given a separate vote on the fund and
that, if they raise a red flag, there is a general consensus
to pull back and perform additional analysis before going
forward with an allocation.
Liquidity Spectrum Emerges
Changes discussed thus far made by hedge funds,
institutional investors and their intermediaries (including
Fund of Funds) were all intended to better the quality of
communications, transparency and day-to-day operations
in the industry. Fund of Funds also had a more structural
issue to address, however.
In the wake of their late 2008-early 2009 experience, Fund
of Funds needed to retool their approach to achieving
strategy diversification in the Alternatives space. In
many instances, earlier attempts at combining different
hedge fund managers with divergent liquidity terms into a
single portfolio and wrapping that portfolio with separate
liquidity terms resulted in severe liquidity mismatches.
Since that time, new thinking has emerged and Fund of
Fund managers are now beginning to align investment
strategies across a liquidity spectrum, and create nascent
investment “segments” based around strategies with
similar liquidity, style and leverage profiles.
“Two years ago when we started our operational due
diligence, it was an optional service that clients could ask
for, but that most didn’t. Now, this is becoming a standard
part of our process.”
– Pension Consultant
“Our operational due diligence team is separate from our
financial analysts. They act as a check and balance. They
opine on different things. If they have issues and put
up a red flag on a fund, we have to sit down and have a
discussion. Since you have people focusing on both sides,
you have different areas of expertise. I can say, ‘here’s what
a Distressed manager looks like’ and I can check their trades
to make sure they line up with our expectations. They have
a view of what a Distressed Debt manager’s auditors and
systems should look like. If I did that analysis, the best I could
do was tick some boxes, but they really understand those
profiles and know what to look for.”
Fund of Fund
“We absolutely do operational due diligence. We have a
separate team, and they have their own processes and
forms. They perform their own background and reference
checks. If the manager or someone at the firm fails the
check, we don’t get involved.”
– Fund of Fund & Seeder
Evolution of Investment Due Diligence
Chart 19

38Citi Perspectives, a Prime Finance Publication JULY 2010
Strategies Grouped into Similar Liquidity Pools
The positioning of individual investment strategy pools
shown in Chart 20 represent how liquid the assets held in
different strategies proved to be during the liquidity crisis
and how easily investors were able to withdraw funds from
these strategies. As noted earlier, this array of strategies
turned out to be wider, the spread between the most- and
least-liquid proved to be much steeper and the positioning
of each pool turned out to be less liquid than Fund of Funds
managers had anticipated prior to the liquidity crisis (see
Chart 13).
The major lesson emerging from this period for Fund
of Funds was that they could not create strategy
diversification by mixing this entire set of Alternative
strategies into a single portfolio.
As Chart 20 shows, there are now several liquidity “pools”
that extend across this array of investment strategies.
These pools are based around groups of strategies whose
underlying assets are all such that hedge fund managers in
the pool should be able to offer fairly similar liquidity terms.
When viewed in this manner, the constituent strategies that
make up the most- and the least-liquid “pools” of assets
are widely divergent. For this reason, we are dubbing
these pools as falling along a “liquidity spectrum.”
Less Liquid Strategies Offer a Complexity Premium
Investment strategies in the upper right-hand corner of
Chart 20 represent the most liquid in the Alternatives
space. These are equity-based strategies that have assets
that can be exited in a very short period since they trade
in highly liquid global markets.
Investors choosing to focus solely on strategies in this
space can expect relatively fluid terms that allow them to
move money into and out of a portfolio of such strategies
easily—at worst quarterly, and typically monthly, or in
some cases even less.
By contrast, Distressed Securities, falling in the lower
left-hand corner of the chart, have the least-liquid profile.
Assets held in these strategies begin to take on the
characteristics of short-term private equity structures.
In some instances, hedge funds in this space are offering
investors “series,” providing “vintages” and adopting other
language and concepts from the private equity world.
Investors in these less-liquid strategies would need to
agree to lock-up capital for an extended period of time
to effectively realize the benefit of these investments.
Exiting the assets in a rushed or forced manner is likely
to result a disorderly market and have excessive impact.
“We converted to be a more liquid Fund of Funds. Believe it or
not, we used to have annualized redemptions. What used to
be annualized is now down to quarterly, and what used to be
quarterly is now down to monthly. We’ve had to think about which
funds we can actually invest in, to be able to offer those terms.”
- Fund of Fund
“The biggest change we initiated is to improve the liquidity
of our portfolio. We’re shrinking our bucket of less-liquid
managers.”
– Fund of Fund
“A liquidity and transparency focus is key. If you’re doing a
distressed or asset-backed liability strategy, you have to put
that into a private equity or hybrid structure—not a quarterly
structure. It just doesn’t work.”
– Fund of Fund & Seeder
The Three Dimensions of the Hedge Fund Landscape
Chart 20
Sources: Citi Prime Finance, Size of Strategy Circles Broadly Representative of AUM.
Liquidity of assets in the portfolio
Inve
sto
r ab
ility
to
w
ith
dra
w a
sset
s
LOW HIGH
LOW
HIG
H High Liquidity“Simple” Hedged
Strategies
Market-Neutral &Dedicated
Short
Event-Driven
ConvertibleArbitrage
Fixed IncomeArbitrage
DistressedSecurities
Multi-Strat
Long/ShortEquity
GlobalMacro
Lower LiquidityMixed Equity &
Credit Strategies
Low LiquidityCredit Strategies
Short-Term PrivateEquity Structures

39Citi Perspectives, a Prime Finance Publication JULY 2010
If some of the “hard” assets such as mines and real estate
purchased by Global Macro funds could be pulled out and
separated from the more liquid assets also utilized in
Global Macro strategies, those hard assets would fall even
lower on the left-hand quadrant and require an even more
extended lock-up to prevent excessive impacts.
Increasingly, investors willing to allocate down the liquidity
spectrum can demand an “illiquidity” or “complexity”
premium for their money. This premium can be realized
in several ways.
Some hedge funds in this space were cited as being willing
to set less frequent incentive fee calculations—oftentimes
only when the lock-up periods end. Others are offering
their investors lower fees altogether. Regardless of their
approach, investors have considerable clout in negotiating
terms with hedge fund managers in this space.
Consider Liquidity as the New “Third” Dimension in Alternatives
Chart 21 presents an updated version of the Alternatives
landscape originally highlighted back in Chart 3. Prior to
the liquidity crisis, achieving strategy diversification was
accomplished by moving along the two-dimensions of “style”
and “leverage.” What becomes clear in looking at chart 21
is that “liquidity” has now become the third dimension to
consider in constructing an Alternatives portfolio.
Once this third dimension is considered, the problems that
occurred in 2008-2009 become easy to understand. An
investor cannot look to achieve diversity by trying to blend
a broad set of strategies into a single portfolio because
this causes them to “jump” liquidity pools.
Some strategies overlap liquidity pools, but, even then,
investors would at most be able to blend with one or the
other set of strategies to keep a consistent liquidity profile.
For this reason, rather than viewing Alternatives as a single
landscape, it is becoming increasingly more accurate to
describe the space as a collection of distinct “segments”
that group investment strategies with compatible styles,
leverage and liquidity.
This structural change marks maturation not only in how
Fund of Funds approach the market, but for the way in
which institutional investors and consultants are likely to
think about and allocate to Alternatives.
The impact of this shift in thinking about Alternatives is
likely to accelerate trends already at work pushing hedge
funds toward convergence with elements of the mutual
fund and long-only world. Ultimately, changes wrought in
the hedge fund space could work to transform the current
approach used in portfolio construction.
“Managers are not great at allocating funds to illiquid
investments and end up reaching their side-pocket limits
quickly. We are looking to avoid share classes with exposure
to illiquids.”
– Endowment
“People underestimate the cost of illiquidity. The terms you
get as an investor and the liquidity of the investments that the
manager does have to match up. If you go illiquid, you need a
big bang for your brick.”
- Pension / Insurance Fund
“What hurt most at these hybrid shops is that they had both
liquid and illiquid investments in the same portfolio. The
liquid part of the portfolio did well. It was the illiquid part
that created problems.”
- Pension / Insurance Fund
The Three Dimensions of the Hedge Fund Landscape
Chart 21
Sources: Citi Prime Finance, Size of bubbles represent HFR Q1 2010 AUM.
Style
Lev
erag
eLO
WH
IGH
CREDIT-FOCUSED EQUITY-FOCUSED
Long/ShortEquityEvent-
Driven
GlobalMacro
DistressedSecurities
Market-Neutral &Dedicated Short
ConvertibleArbitrage
Fixed IncomeArbitrage
Lower LiquidityMixed Equity &
Credit Strategies
Multi-Strat
Lower LiquidityCredit Strategies
Short-TermPrivate Equity
Structures
High Liquidity“Simple” Hedged
Strategies

40Citi Perspectives, a Prime Finance Publication JULY 2010
Part III: Convergence of the Investment Landscape Accelerates
In recent years, an investor looking to create broad-based
portfolio exposure would look across long-only, Alternatives
and private equity, and typically make a decision about how
much of their capital they would seek to “budget” to each
of these investment areas. This is illustrated in Chart 22.
What’s important to consider, is that once this highest level
determination was made, all subsequent allocation activity
would take place within one of these three silos. Capital
allocated to long-only funds in the regulated investment
space would be split out across various “traditional”
asset managers. Money allocated to Alternatives would
be channeled directly, through Fund of Funds or through
institutional consultants to hedge fund managers.
Allocations to private equity would go to managers focused
exclusively on these structures. Each of these worlds was
separate and distinct.
Alternatives “Silo” Becomes Less Distinct
Points brought forward in this final section of the report
will highlight how that situation is beginning to change and
how there is likely to be “convergence” and blurring across
these three distinct silos. This will force investors to rethink
their approach to portfolio allocation.
Investors Budget Their Alternative Dollars
Changes wrought by Fund of Funds in their approach to
ensuring strategy diversification have now altered how those
participants create their portfolio and how institutional
consultants seek to advise clients in the Alternatives space.
Rather than there being a single portfolio that could give an
investor exposure to the full set of hedge fund strategies,
there are now, at a high level, multiple Alternative segments.
Institutional consultants are already beginning to discuss
and work with their clients to optimally allocate their risk
across these various segments. Increasingly, Fund of Funds
managers looking for strategy diversification are likely to
offer separate portfolios around each segment for investors
to choose from, and select hedge fund managers based
on their style, leverage and liquidity fit for each segment.
Initially, these portfolios are likely to remain focused on the
most-liquid segments, but over time Fund of Funds are likely
to move away from their “blended” approach and sponsor
distinct offerings across the different liquidity pools
“There is going to be an ongoing premium for liquidity. That’s
definitely here to stay. Investors will always want some part
of their allocation to always be liquid, so that they can get at
it if they need it. You’ll see a lot of conservatism in portfolio
construction.”
- Fund of Fund & Seeder
“Portfolio construction is also likely to change. There will be
more thought and research. How are different portions of your
portfolio going to perform in all market environments? People
will be more serious about risk budgeting, real asset budgeting
and planning for inflation, deflation and growth.”
- Pension Consultant
Liquidity
Ass
ets
Un
der
Man
agem
ent
HIGH LOW
AlternativesRegulated Investment Funds PrivateEquity
Sources: Citi Prime Finance, ICI, HFR, & Preqin. Size of bubbles are illustrative of AUM.
$23T
$1T
$2T
Investor Allocations
Asset Allocation Across Investment Pools
Chart 22

41Citi Perspectives, a Prime Finance Publication JULY 2010
As shown in Chart 23, an investor will thus need to
align their desired liquidity profile to their Alternatives
investments across the liquidity spectrum. In making
this decision, they can work directly with different hedge
fund managers, with their consultants and, over time,
potentially with their Fund of Funds intermediaries, to
“allocate” their Alternative dollar to one or more of the
emerging segments.
There are two reasons for “allocating” this dollar. First,
each segment has a different risk profile in terms of the
liquidity of the underlying assets and their use of leverage.
The investor will need to match their allocation to their
desired levels of exposure and their projected investment
horizon. Additionally, macro market influences are likely
to impact the investment strategies contained within each
segment differently. Investors will want to determine their
overall view on the macro environment and budget their
capital accordingly.
This more “budgeted” approach to Alternatives is likely
to force investors to more closely consider how the most-
and least-liquid options in this space compare to their
long-only and private equity allocations.
Boundaries Around Alternatives Blur
Now that investments with an “illiquid” profile can be
grouped together into their own segment and command
an “illiquidity or complexity premium,” the choice about
whether to invest in that segment is likely to be made
more in relation to an investor’s private equity dollar than
their “Alternatives” dollar.
Indeed, as we have already discussed, these strategies have
lock-ups and offer terms that that are mimicking many
of the structures already in use in private equity funds,
though typically of a shorter-term duration. Chart 23
illustrates this overlap and shows the “Illiquids” segment
aligned under the Private Structures arrow as opposed to
the “Hedged” arrow.
This provides investors a new “mid-liquidity” option
between more liquid Alternatives and traditional private
equity, which typically commands 5-10-year lock-ups.
On the opposite side of the spectrum, there is starting
to be more and more focus on the idea of “convergence”
between the long-only world and the Alternatives space.
Liquidity
Ass
ets
HIGH LOW
Hedged
Alternatives
Short-Term
Long-Only
SimpleHedged
Strategies
MixedEquity
& CreditStrategies
MoreLiquidCredit Illiquids
Private Structures
Long-Term
Sources: Citi Prime Finance, ICI, HFR, & Preqin. Size of bubbles are illustrative of AUM.
Investor Allocations
$2T
$1T
Emerging Asset Allocation Focus On Alternatives
Chart 23
“There is starting to be a complexity premium. People are
willing to pay a liquidity premium for longer-duration trades.
The complexity premium is somewhat a function of how people
are thinking about their incremental dollar. Where is it coming
from? My PE pool? My long/short pool?”
– Pension Consultant

42Citi Perspectives, a Prime Finance Publication JULY 2010
“Regulated” Alternatives Emerge as an Option
Chart 24 shows that improved liquidity terms and a
greater willingness on the part of hedge fund managers to
provide transparency around their portfolio holdings has
resulted in a significant shift upward and to the left for the
set of Alternative investment segments. This has helped
to narrow the gap that traditionally existed between long-
only and Alternatives.
Moreover, the introduction of UCITS funds has allowed
the “Liquid Hedged Strategies” within the Alternatives
space to begin to edge into the regulated investment
funds landscape.
UCITS funds are a European structure that has been
authorized by regulators for broad distribution. They are
extremely high-liquidity (usually weekly) vehicles that are
deemed suitable for retail and high net worth investors,
as well as for the more traditional hedge fund ultra-high
net worth and institutional audiences. Although they are
regulated and more liquid than most other offerings in the
Alternatives space, UCITS funds remain “hedge funds” in
terms of their co-mingled investment structure and their
ability to command both management and incentive fees.
Another class of regulated Alternatives is also emerging.
Within the regulated investment funds space on Chart 24,
right next to the large bubble, sits another smaller dark
blue bubble. This represents a new class of fund offering—
the Alternative mutual fund.
These funds utilize hedge fund investment techniques,
such as long/short or market neutral, and/or CTA
techniques like leverage and trend-following to generate
returns, but unlike hedge funds, these are regulated mutual
fund structures. “Alternative” mutual funds have multiple
flavors including index-tracking mutual funds, actively
managed alpha seeking mutual funds and exchange-
traded-funds (ETFs).
There are also unregulated exchange-traded-notes (ETNs)
tracked within this category. These Alternative funds are
being offered both by traditional asset managers like
PIMCO, Vanguard, Fidelity, T. Rowe Price, Oppenheimer
Funds and Franklin Templeton and by hedge fund managers
like J.P. Morgan Highbridge and AQR. These funds are also
being offered by some high-profile “merger” firms that
have created capabilities across the long-only/alternatives
spectrum—such as Blackrock/BGI and Rydex/SGI.
“Long-only managers came out with opportunistic funds.
This is forcing some commoditization of the Long/Short
strategy side.”
- Pension Consultant
Sources: Citi Prime Finance, ICI, HFR. Size of bubbles are illustrative of AUM.
Transparency
Liq
uid
ity
LOW
HIG
H
EXTENSIVE LIMITED
MoneyMarketFunds
Related Investment Funds Alternative Strategies
Simple-HedgedStrategies
Alternative ManagerLong-Only Funds
Alternative Mutual& UCITS Funds
2010
Pre-2008
Mixed & Credit Strategies
More LiquidCredit Strategies
IlliquidStrategies
Traditional InvestmentManager Long-Only
Mutual Funds& ETFs
A Narrowing Gap Between Regulated Funds & Alternatives
Chart 24
“I think the biggest change is going to be around the traditional
silos of the investment management business. I don’t see them
staying as they are. We have a practice that looks across the
liquidity spectrum—Long-Only, hedged, private structures. At
their core, these are all similar in terms of their raw assets.”
- Pension Consultant

43Citi Perspectives, a Prime Finance Publication JULY 2010
More Liquid Alternatives Compete with Long-Only
The emergence of Alternative mutual funds and
regulated hedge funds is important because this blurs the
boundary between Alternatives and long-only. Ongoing
developments in the long-only space are likely to drive not
just blurring, but actual overlap and direct competition
between Alternative strategies and a large segment of the
long-only space—“active” portfolio managers. This tension
is already playing out in the equity space.
Equity Allocations Fall on Disappointing “Active” Manager Returns
Institutional investors have come to account for a higher
portion of the overall U.S. mutual fund market in the past
five years with holdings increasing from 12.5% in 2005 to
16.5% in 2009 according to ICI. Yet, their focus on equities
as an asset class has diminished.
Greenwich Associates recently completed their 2009
U.S. Investment Management study. Data emerging from
that report showed that as a whole, allocations from U.S.
pension funds, endowments and foundations to domestic
stocks declined to only 32% of total assets in 2009, down
from 47% of assets in 2005.
This drop is shown in Chart 26
The growing popularity of these funds is illustrated in
chart 25.
According to SEI’s Strategic Insight, assets under
management in Alternative mutual funds and UCITS funds
rose $110 billion in 2009, topping $367 billion in total, a new
record for this investment category and a 67% increase
over 2008’s $220 billion. By comparison, ICI estimated a
$28 billion net outflow in US equity mutual funds and HFR
reported $132 billion outflow from the hedge fund industry
in the similar period.
SEI went on to report that 18 U.S. retail Alternative
funds (nearly 5%) topped the $1.0 billion assets under
management mark in net inflows in 2009. Leading these
allocations was $13.6 billion taken in by the SPDR Gold
Shares ETF followed by $6.7 billion taken in by the second-
biggest-selling PIMCO Total Return fund. In contrast, SEI
indicated that only 3% of long-only U.S. funds (including
ETFs) topped $1.0 billion in net inflows in that same period.
In their first-quarter 2010 Alternative Investments
Observer, Morningstar (the mutual fund tracking company),
reported that they are now following 350 Alternative
mutual funds in their database. These Alternative funds
are targeted primarily at the institutional audience seeking
higher, more-diversified returns.
“Buyers on the institutional and high net worth side are
basically firing their long-only managers and going after
Alternatives managers.”
- Pension Consultant
Source: Strategic Insight, Exotic to Mainstream, Growth of Alternative Mutual Fundsin the U.S. and Europe, 2010
European Funds
400
350
300
250
200
150
100
50
02005
$156
$283
$331
$220
$367
2006 2007 2008 2009
U.S. Funds
Bill
ion
s o
f D
olla
rs
Global Assets In Alternative Mutual Funds & UCITS Funds
Chart 25
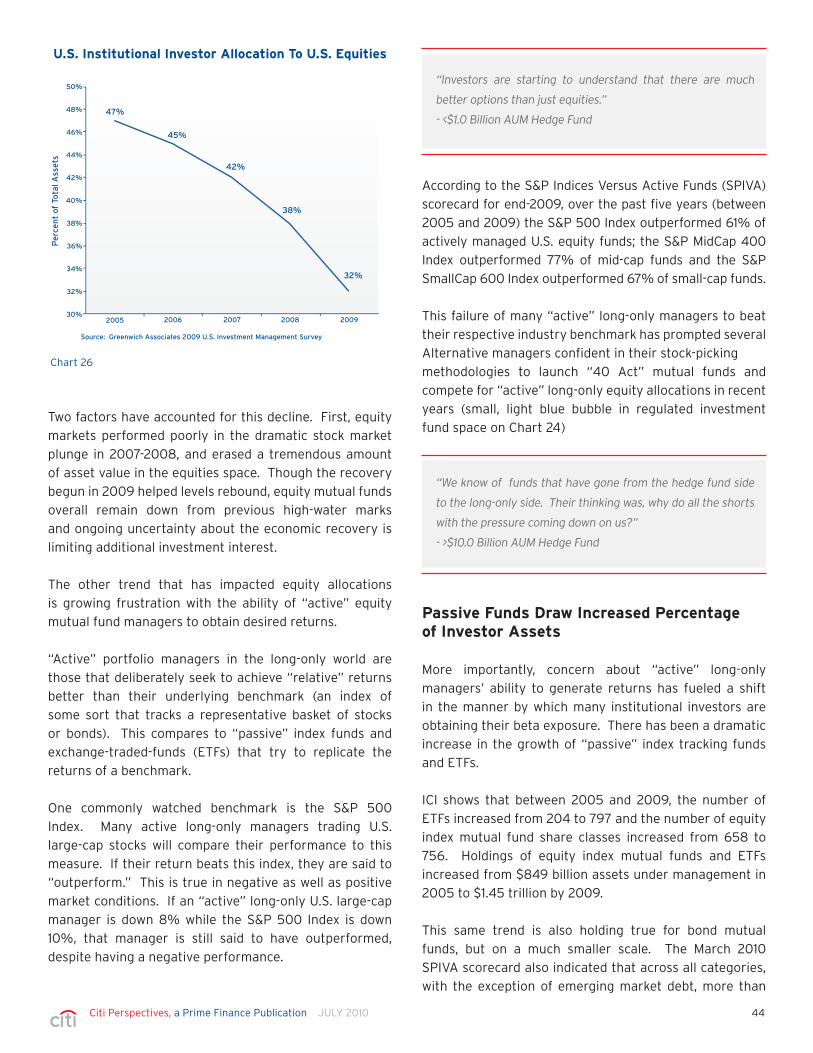
44Citi Perspectives, a Prime Finance Publication JULY 2010
According to the S&P Indices Versus Active Funds (SPIVA)
scorecard for end-2009, over the past five years (between
2005 and 2009) the S&P 500 Index outperformed 61% of
actively managed U.S. equity funds; the S&P MidCap 400
Index outperformed 77% of mid-cap funds and the S&P
SmallCap 600 Index outperformed 67% of small-cap funds.
This failure of many “active” long-only managers to beat
their respective industry benchmark has prompted several
Alternative managers confident in their stock-picking
methodologies to launch “40 Act” mutual funds and
compete for “active” long-only equity allocations in recent
years (small, light blue bubble in regulated investment
fund space on Chart 24)
Passive Funds Draw Increased Percentageof Investor Assets
More importantly, concern about “active” long-only
managers’ ability to generate returns has fueled a shift
in the manner by which many institutional investors are
obtaining their beta exposure. There has been a dramatic
increase in the growth of “passive” index tracking funds
and ETFs.
ICI shows that between 2005 and 2009, the number of
ETFs increased from 204 to 797 and the number of equity
index mutual fund share classes increased from 658 to
756. Holdings of equity index mutual funds and ETFs
increased from $849 billion assets under management in
2005 to $1.45 trillion by 2009.
This same trend is also holding true for bond mutual
funds, but on a much smaller scale. The March 2010
SPIVA scorecard also indicated that across all categories,
with the exception of emerging market debt, more than
Two factors have accounted for this decline. First, equity
markets performed poorly in the dramatic stock market
plunge in 2007-2008, and erased a tremendous amount
of asset value in the equities space. Though the recovery
begun in 2009 helped levels rebound, equity mutual funds
overall remain down from previous high-water marks
and ongoing uncertainty about the economic recovery is
limiting additional investment interest.
The other trend that has impacted equity allocations
is growing frustration with the ability of “active” equity
mutual fund managers to obtain desired returns.
“Active” portfolio managers in the long-only world are
those that deliberately seek to achieve “relative” returns
better than their underlying benchmark (an index of
some sort that tracks a representative basket of stocks
or bonds). This compares to “passive” index funds and
exchange-traded-funds (ETFs) that try to replicate the
returns of a benchmark.
One commonly watched benchmark is the S&P 500
Index. Many active long-only managers trading U.S.
large-cap stocks will compare their performance to this
measure. If their return beats this index, they are said to
“outperform.” This is true in negative as well as positive
market conditions. If an “active” long-only U.S. large-cap
manager is down 8% while the S&P 500 Index is down
10%, that manager is still said to have outperformed,
despite having a negative performance.
“We know of funds that have gone from the hedge fund side
to the long-only side. Their thinking was, why do all the shorts
with the pressure coming down on us?”
- >$10.0 Billion AUM Hedge Fund
Source: Greenwich Associates 2009 U.S. Investment Management Survey
50%
48%
46%
44%
42%
40%
38%
36%
34%
32%
30%2005 2006 2007 2008 2009
Pe
rce
nt
of
Tota
l Ass
ets
47%
45%
42%
38%
32%
“Investors are starting to understand that there are much
better options than just equities.”
- <$1.0 Billion AUM Hedge Fund
U.S. Institutional Investor Allocation To U.S. Equities
Chart 26

45Citi Perspectives, a Prime Finance Publication JULY 2010
70% of active bond managers failed to outperform their
relative benchmarks over the last five years. ICI shows
that allocations to hybrid and bond index funds rose from
$72 billion in 2005 to $159 billion in 2009.
Active Long-Only Managers Squeezed from Both Sides
Thus, “actively” managed long-only funds have been hard hit.
Traditionally, a dollar allocated to long-only strategies
would be divided across “cash” as represented by money
market funds and then either equities or bonds & hybrids.
Now, in addition to this high-level allocation, within both
equities and bonds & hybrids, allocators are increasingly
needing to decide the “structure” they want to play—
passive, active or Alternative.
Competition for investment dollars across these pools is
illustrated in Chart 27.
As noted, passive funds are drawing off a portion of
active managers’ allocations. Putting money into these
funds assures the investor of doing at least as well as the
index they are seeking to replicate. The issue with passive
funds, however, is that these structures leave the investor
wholly exposed to directional market risk. They are not,
therefore, an adequate replacement for investors looking to
obtain better than benchmark returns, nor for those faced
with liability gaps. For those investors, alpha allocations
remain important.
The only investment technique that active portfolio
managers in the long-only space can use to achieve
alpha returns is overweighting or underweighting their
purchases. Indeed, the most aggressive negative stance
an active manager can take is to not own a certain stock
or bond. Alternative mutual fund managers have a much
broader array of investment techniques to choose from in
their pursuit of alpha such as shorting, arbitrage and using
leverage. This broader set of techniques increases the
likelihood that a manager can produce and isolate alpha.
Thus, in addition to diverting a portion of their allocations
from active long-only managers to passive funds,
institutional investors are also shifting a portion of their
active long-only manager money to “direct alpha” funds.
Such funds span Alternative mutual funds, regulated hedge
funds and more “institutionalized” hedge funds focused on
liquid equity strategies.
“Blinders are starting to come off buyers’ eyes. Mostly it’s the
CFOs beginning to realize that long-only management is not
really active. They’re thinking, ‘I might as well go ETF if they’re
small or index if I’m big.’”
- Pension Consultant
Chart 27
“Do you want cheap beta and alpha overlay or do you want a
hedge fund? We don’t know how it will play out. One of the
advantages of the UCITS framework in Europe is that it may raise
institutional comfort for this type of product. Unfortunately, it
might be the right product in the wrong geography.”
- >$10.0 Billion AUM Hedge Fund
“In the traditional long-only world, the most extreme expression
of not liking a stock is not owning it.”
- Pension Consultant
Regulated Investment Funds
Sources: Citi Prime Finance, ICI, HFR. Size of bubbles are illustrative of AUM.
Transparency
Liq
uid
ity
HIG
H
EXTENSIVE
MoneyMarketFunds
Regulated Investment Funds AlternativeStrategies
Sources: Citi Prime Finance, ICI, HFR. Size of bubbles are illustrative of AUM.
Transparency
Liq
uid
ity
LOW
HIG
H
EXTENSIVE LIMITED
MoneyMarketFunds
Related Investment Funds Alternative Strategies
Simple HeadedEquity Strategies
Alternative ManagerLong-Only Funds
Alternative Mutual& UCITS Funds
2010
Pre-2008
Mixed Equity &Credit Strategies
More LiquidCredit Strategies
IlliquidStrategies
Traditional InvestmentManager Long-Only
Mutual Funds& ETFs
Alternative ManagerActively Managed
Mutual Funds
PassivelyManaged
Equity IndexFunds & ETFs
PassivelyManaged Hybrid,
Commodities & BondIndex Funds & ETFs
Money MarketFunds
AlternativeMutual &
UCITS Funds
Simple-HedgedStrategies
Traditional ManagerActively Managed
Equity Mutual Funds
Traditional ManagerActively Managed
Hybrid & Bond Funds
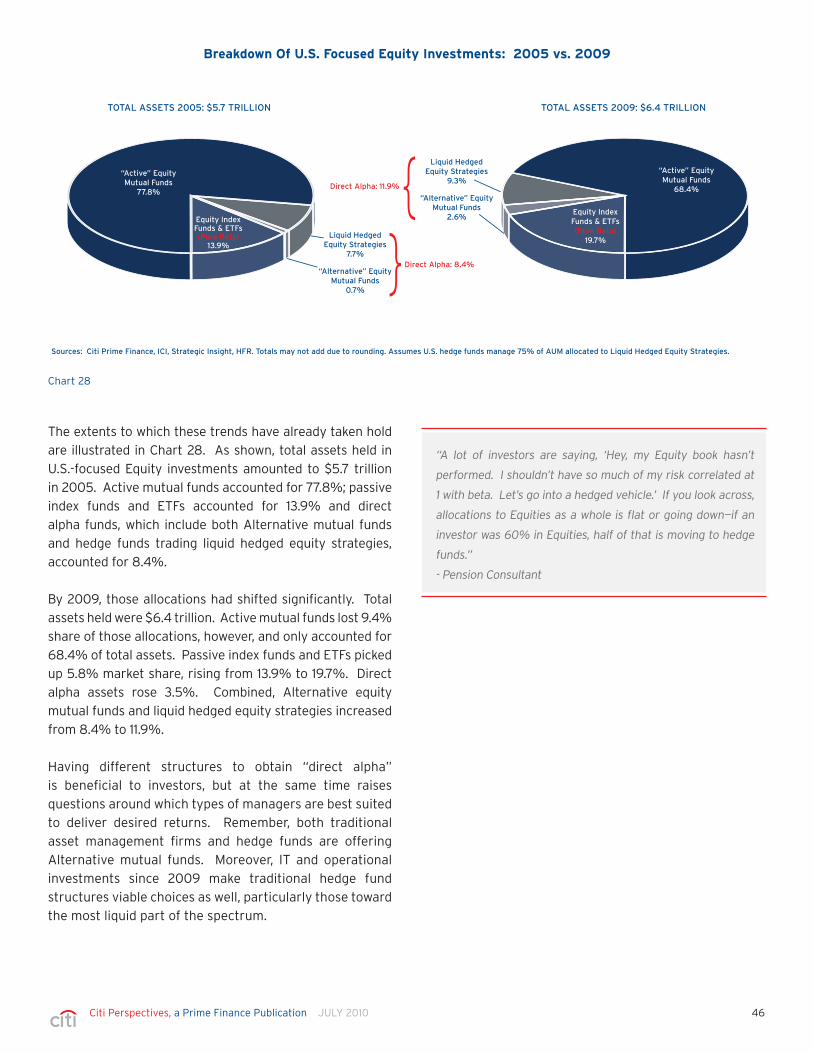
46Citi Perspectives, a Prime Finance Publication JULY 2010
The extents to which these trends have already taken hold
are illustrated in Chart 28. As shown, total assets held in
U.S.-focused Equity investments amounted to $5.7 trillion
in 2005. Active mutual funds accounted for 77.8%; passive
index funds and ETFs accounted for 13.9% and direct
alpha funds, which include both Alternative mutual funds
and hedge funds trading liquid hedged equity strategies,
accounted for 8.4%.
By 2009, those allocations had shifted significantly. Total
assets held were $6.4 trillion. Active mutual funds lost 9.4%
share of those allocations, however, and only accounted for
68.4% of total assets. Passive index funds and ETFs picked
up 5.8% market share, rising from 13.9% to 19.7%. Direct
alpha assets rose 3.5%. Combined, Alternative equity
mutual funds and liquid hedged equity strategies increased
from 8.4% to 11.9%.
Having different structures to obtain “direct alpha”
is beneficial to investors, but at the same time raises
questions around which types of managers are best suited
to deliver desired returns. Remember, both traditional
asset management firms and hedge funds are offering
Alternative mutual funds. Moreover, IT and operational
investments since 2009 make traditional hedge fund
structures viable choices as well, particularly those toward
the most liquid part of the spectrum.
“A lot of investors are saying, ‘Hey, my Equity book hasn’t
performed. I shouldn’t have so much of my risk correlated at
1 with beta. Let’s go into a hedged vehicle.’ If you look across,
allocations to Equities as a whole is flat or going down—if an
investor was 60% in Equities, half of that is moving to hedge
funds.”
- Pension Consultant
Sources: Citi Prime Finance, ICI, Strategic Insight, HFR. Totals may not add due to rounding. Assumes U.S. hedge funds manage 75% of AUM allocated to Liquid Hedged Equity Strategies.
TOTAL ASSETS 2005: $5.7 TRILLION TOTAL ASSETS 2009: $6.4 TRILLION
Equity IndexFunds & ETFs(Pure Beta)
13.9%
Equity IndexFunds & ETFs(Pure Beta)
19.7%
“Alternative” EquityMutual Funds
0.7%
Liquid HedgedEquity Strategies
7.7%
“Alternative” EquityMutual Funds
2.6%
Liquid HedgedEquity Strategies
9.3%
Direct Alpha: 8.4%
Direct Alpha: 11.9%
}}“Active” Equity
Mutual Funds77.8%
“Active” EquityMutual Funds
68.4%
Breakdown Of U.S. Focused Equity Investments: 2005 vs. 2009
Chart 28
47Citi Perspectives, a Prime Finance Publication JULY 2010
Investors Uncertain about Traditional Managers in Alternatives
A lot of focus was given back in 2007 to the emergence
of the 130/30 fund structure. These funds allowed mutual
fund managers to expand their set of investment techniques
beyond overweighting and underweighting to utilize a
limited portion of their portfolio exposure to put on outright
short positions, and to lever their long positions by an equal
percent (i.e., 130% long and 30% short).
Expectations from some industry participants in 2007
were that assets under management in 130/30 structures
could grow to as much as $1.0 trillion by 2011. Actual
interest proved far less. Pensions & Investments estimates
that total assets under management in 130/30 structures
peaked in the third quarter of 2008 at $47 billion.
Morningstar tracks $30 billion of assets in these types
of funds as part of their “levered net long” institutional
category. In their first-quarter 2010 Alternatives
Investments Observer they indicate that “130/30 strategies
have failed to produce the alpha they were expected to
generate.” They note that of the 70 U.S. equity 130/30
strategies in their database, only 33 outperformed the
S&P 500 in 2008 and that only 21 of the 59 reporting
funds in 2009 outperformed.
In explaining the factors impacting 130/30 performance,
Morningstar specifically cites “fears of counterparty credit
risk, financing issues and, to a smaller extent, uncertainty
surrounding short-selling restrictions.”
While these may have been operational concerns for
traditional managers, they are everyday considerations
for hedge fund managers used to dealing with prime
broker counterparts.
In an April 2010 piece entitled Breaking Down the Walls:
Convergence Between Traditional Investment Managers
and Hedge Fund Managers, BNY Mellon and Greenwich
Associates released the results of a survey they had
conducted at the end of 2009 across institutional
investors, traditional asset managers and hedge funds.
In their survey, they noted that 52% of hedge fund
manager respondents indicated that they are reaching
across the hedge fund/long-only divide as a means of
attracting or retaining assets. They also indicated that
46% of traditional investment manager respondents
are launching hedge fund-like products to capitalize on
institutional demand for hedge fund strategies.

48Citi Perspectives, a Prime Finance Publication JULY 2010
Greenwich Associates notes that among public funds, the
nation’s largest pension funds were hit the most substantially
and that these participants now have a solvency ratio
average of only 81% of their liabilities. Corporate pension
funding levels also fell dramatically. The report indicates
that portion of U.S. corporate pensions funded at less than
85% rose from approximately 8% in 2008 to 57% in 2009.
Anecdotal feedback suggests that similar liability shortfalls
are impacting European institutions as well.
Finding attractive investment options to help cover these
shortfalls is likely to turn institutional investors, particularly
pension funds, increasingly toward hedge funds and/or
hedge fund-like strategies. Chart 30 shows the relative
returns of several major investment categories over the
past three years.
Despite the sharp rebound experienced by many markets
in 2009, losses in 2007 and 2008 proved too severe to
recoup. Looking across U.S. equities, international equities
and commodities, major indices were all down over the last
three years. Similarly, the HFRI Fund of Funds index was
also down for reasons highlighted throughout this report.
By contrast, bond market returns were up, as was the HFRI
equal-weighted equity hedge index. Bond allocations in
U.S. mutual funds have already risen sharply as highlighted
previously and may be poised to do so further. Bond
returns, even in favorable markets, are not likely to be
sufficient to close institutional liability and funding gaps,
however. Our expectation is that increasingly, we will see
U.S. and European pension funds raise their exposure to
hedge funds and hedge fund-like investments.
One of the key questions they asked investors was how
receptive they would be to using traditional managers
for hedge fund-like strategies. Of the respondents, 63%
indicated that they had absolutely no interest in using a
traditional manager.
This finding could have profound implications for the
hedge fund space as we may be at the start of a new wave
of institutional investor allocation interest equivalent to or
even greater than the influx of money seen in 2000-2003.
Liability Shortfalls Could Drive Allocations to Hedge Strategies
Chart 29 reflects the impact of recent events on institutional
investors. Greenwich Associates reported in their 2009 U.S.
Investment Management survey that the value of assets in
the portfolios of U.S. defined benefit plans declined to $5.9
trillion in 2009 from $7.2 trillion in 2008. This represents
the lowest asset levels seen since 2003.
“Our interest in Alternatives has increased over the past 18
months and will likely continue to increase. This growth will
be mostly in hedge funds. Our current allocation target is
approximately 24%. A new allocation target is being developed,
and it will probably come out in the 30%-35% range. We are
also very interested in private equity, but the liquidity is a
concern and we can’t allocate too much to this space.”
- Pension Fund
“Pensions and Endowments are so underfunded that, as bad
as Fund of Funds returns were in 2008, if you look at the
absolute return markets versus the long-only markets they
still did relatively well. There’s hundreds of billions of more
capital out there.”
- Fund of Fund & Seeder
Source: Greenwich Associates 2009 U.S. Investment Management Survey
8000
7500
7000
6500
6000
5500
5000
4500
400020052004200320022001 2006 2007 2008 2009
Mill
ion
s o
f D
olla
rs
$5,616
$5,126
$6,009
$5,372
$6,452
$6,816
$7,806
$7,226
$5,987
U.S. Institutional Investor Asset Values
Chart 29
“Larger hedge funds will morph into more of a traditional asset
manager, in their scope and in the types of products they offer.
These firms will be ‘asset players’ who offer both mutual fund
and Alternative asset products.”
- Hedge Fund Consultant
“There are likely to be more pensions and endowments
entering the Alternatives space, looking for better returns.”
- <$1.0 Billion AUM Hedge Fund

49Citi Perspectives, a Prime Finance Publication JULY 2010
deliberately pursuing enhancements to appeal to this
audience, is likely to feed ongoing “institutionalization” of
the hedge fund industry.
The hallmarks of this shift will be increased transparency,
liquidity and controls. Foundational improvements by
hedge fund in their own infrastructure begun in 2009 are
likely to extend into the coming period. These investments
are just beginning to show results as efforts often take
one to three years to be fully realized. Clarification of
the current regulatory uncertainty is also likely to result
in more open exchanges of information. Our projected
impact of such changes is illustrated in Chart 31.
Complexity of Allocation Decision Increases
Institutional Inflows Could Nearly Double
Most pensions and consultants advising such participants
in the Alternatives space contacted for this report indicated
that, on average, institutional allocations to hedge funds
are likely to rise from current targets of 8%-10% among
large pensions to as much as 15%. This target is in line
with allocations currently being awarded to hedge funds
from endowments and foundations. Some participants
cited even higher target levels.
This shift in allocation targets could result in an increase
of more than $150 billion to hedge funds from U.S.
institutional investors alone. In the BNY/Greenwich
Associates survey, total investments from this sector were
estimated at $231 billion in 2009. If this represents an
average 9% allocation, an increase to a 15% allocation
could boost hedge fund assets under management from
these participants toward $385 billion in coming years.
European institutions and sovereign wealth funds are
likely to follow suit and have an even broader array of
choices in the hedge fund space. These investors can
look across traditional hedge fund structures, regulated
UCITS structures being offered by experienced hedge fund
managers and Alternative mutual funds.
Competition to access new inflows from institutional
investors, coming at a time when hedge funds are
“A 10% allocation to hedge funds from our clients wouldn’t
be surprising at all. It has to be enough to move the needle.
The industry seems to be more conducive to institutional
clients in terms of being more transparent, more accessible
and more open.”
- Pension Consultant
“Fees will be based off what the investor is willing to pay.
Investors used to mutual fund products are likely to pay less
fees, and many hedge fund managers may be happy to take
this money, trading off size for fees.”
- Hedge Fund Consultant
+3.2%
-2.5%
-4.6%
-5.6%
-7.0% +6.0%
Sources: HFR, ishares.com
HFRI Equity Hedge Index
HFRI Fund of Funds Index
MSCI All Country World Index
S&P 500 Index
S&P GSCI Commodity Index
Barclays Aggregate Bond Index
-4.0%-6.0%-8.0% -2.0% 0.0% 2.0% 4.0% 6.0%
Relative 3-Year Performance 2007-2009
Chart 30

50Citi Perspectives, a Prime Finance Publication JULY 2010
For investors able to go this route, the appeal of not having
to pay an incentive fee unless the hedge fund manager
actually generates new high performance could erode
resistance to using these managers. Many interviewees
indicated their belief that the majority of direct institutional
investor allocations are already going to the largest hedge
funds most willing to accept high-water arrangements and
that this trend will continue and strengthen. Convergence
and a willingness among hedge funds to tie incentive fees to
performance could set the stage for a more radical shift in
investors’ approach to portfolio allocation in coming years.
Portfolio Decisions Could Shift to “Structures”
While we can readily forecast an increase in allocations
to hedge funds and hedge fund-like strategies, there is a
broader question around which of the investor’s allocation
pools will originate from.
Back in Chart 28 we illustrated the shifts that have occurred
in U.S. institutional investors’ equity holdings. We indicated
that of the total allocation to equities, active long-only
managers’ share had diminished between 2005 and 2009,
while awards to passive funds and direct alpha funds had
both increased. The manner in which we presented that
chart diverges from how an investor would think about their
allocation today, since we blended allocations from two
silos—long-only and Alternatives.
If we followed today’s accepted portfolio allocation approach,
we would have separated out the long-only portion of the
investors’ equity assets and not considered how those
funds were allocated in the same data set as investments in
liquid hedged equity strategies. We would have said that in
the long-only space, U.S. institutional investors altered their
mix of equity holdings, shrinking their allocation to active
Competition for Allocations Could Drive Convergence
By 2012, there is likely to be overlap between simple hedged
strategies in the Alternatives space and Alternative mutual
funds in the regulated investment space. A larger share of
simple hedged strategies are also likely to be regulated
as compared to 2010. This will reflect ongoing growth in
UCITS funds and the likelihood that several of the largest
hedge funds in the U.S. or elsewhere will respond to
investor demand for lower-fee, regulated structures to
satisfy more conservative board members of institutions
and sovereign wealth funds.
As the liquidity and transparency differences between the
various investment options diminish, the major remaining
difference between regulated investment funds and
Alternatives strategies is going to become fees. Many of the
interviewees contacted for this report indicated that they
believed investors would be open to having multiple types
of structures in their portfolios and be willing to pay up for
investment managers capable of posting alpha returns.
Many hedge fund managers are already only requiring
investors to pay incentive fees on returns generated beyond
the fund’s previous high-water mark. If a hedge fund
manager fails to generate such returns, the fund only collects
its management fee which typically ranges from 1% to 2% of
the assets under management. This fee range is broadly in
line with the existing long-only mutual fund space.
“As more capital is flowing into these big, big guys, there is
no incentive for them to change. Hedge funds are going to
keep getting bigger, which is frustrating. Big guys don’t have
to make returns to get rich. They have the management fee.”
- Family Office
“The largest open question in our mind is whether long-
only equity money is going to be viewed as just an ‘equity’
allocation. Six months ago, we had conversations about this,
but we haven’t seen it yet. We’ve not seen a ticket written on
that basis, but we kick this around and talk about it a lot.”
- >$10.0 Billion AUM Hedge Fund
Projected Convergence Between RegulatedFunds & Alternatives
Chart 31
Sources: Citi Prime Finance, ICI, HFR. Size of bubbles are illustrative of AUM.
Transparency
Liq
uid
ity
LOW
HIG
H
EXTENSIVE LIMITED
MoneyMarketFunds
Regulated InvestmentFunds
Alternative Strategies
MoneyMarketFunds “Active” Equity
Mutual Funds
“Active”Hybrid &
Bond MutualFunds
Passive IndexFunds & ETFs,
Equities, Hybrids, Bonds & Commodity Indicies
AlternativeMutual and
UCITS Funds
Simple-HeadedStrategies
2012
2010
Pre-2008
Mixed Equity &Credit Strategies
More LiquidCredit Strategies
IlliquidStrategies
Convergence

51Citi Perspectives, a Prime Finance Publication JULY 2010
long-only managers and increasing their awards to passive
funds and the emerging Alternative mutual funds category.
Separately, U.S. institutional investors also increased their
Alternatives allocation and awarded an increased share of
their portfolio to liquid hedged equity strategies.
The reason we portrayed the pie in the manner we did is
that we wanted to underscore that regardless of whether
there is an official shift in terminology, the impact of
blurring boundaries between Alternatives and long-only
has already begun to occur and that the decisions about
where the money is coming from is being done across silos.
While the difference may seem subtle, it has profound
implications for the way in which investors construct their
portfolios.
Chart 32 puts forward a view of how “new” investment
allocation decisions may be made. In this model, an
institutional investor looking to make an “equities”
allocation would think about those dollars across passively
managed equity index funds and ETFs, actively managed
equity mutual funds, Alternative mutual funds, simple
hedged equity strategies and eventually even distressed
equity strategies.
A “bond or hybrid” decision could similarly be made across
a range of capital market structures, some regulated and
some “institutionalized.”
Some institutional investors are already recognizing the
move in this direction. One example is the San Bernardino
County Employees Retirement Association (SBCERA). In
an April 28, 2010 HFM Week article entitled “A Singular
Approach,” it was revealed that the $5 billion fund would
be increasing its investments in the long/short equity space
with said allocations forming part of its equities allocations
“bucket,” not as part of its Alternatives portfolio.
James Perry, SCBERA’s Investment Officer is quoted in
the HFM Week article as saying “My concern is not about
investing in a long-only traditional account or a hedge
fund or a private equity structure; rather, the objective
is to find the best opportunities set and then identify the
best structure or approach to get an investment in that
opportunity set—and in a lot of cases, the hedge fund
structure is the best structure to attack an opportunities
set.”
If more institutional investors adopt this mindset, there
is likely to be a much-transformed allocation landscape
emerging in coming years with much more fluidity in styles,
leverage and liquidity profiles to be considered.
Large Hedge Funds Most Likely to Benefit
Large hedge funds are best positioned to benefit from this
shift in the portfolio allocation approach. These managers
already draw the majority of hedge fund allocations. They
are also the most well positioned to pick up money shifting
away from active mutual fund managers seeking alpha.
They have both the trading expertise and the reputation
to either directly offer such regulated Alternative funds or
forge affiliations with traditional managers to jointly create
and market such offerings. Such was the rationale for the
BGI/Blackrock merger and other merger activities in the
past year.
“I definitely see more of a specialty-consulting business
coming. We’ve carved out groups to focus on Alternatives and
on hedge funds within that.”
- Pension Consultant
“There is a huge investor population not looking for aggressive
returns. They’re looking for consistent returns and really large
hedge funds will serve that purpose.”
- Hedge Fund Consultant
Sources: Citi Prime Finance, ICI, HFR. Size of bubbles are illustrative of AUM.
Transparency
Liq
uid
ity
LOW
HIG
H
HIGH LOW
MoneyMarketFunds
ActivelyManaged
EquityMutual Funds
ActivelyManagedHybrid &
Bond Funds
AlternativeEquityMutualFunds
PassivelyManaged Equity
Index Funds& ETFS
PassivelyManagedHybrids,
Commodities &Bond Index
Funds & ETFs
AlternativeHybrid,
Commodities &Bond Mutual Funds
Hedged EquityStrategies
DistressedEquity
DistressedDebt
Hedged MixedStrategies
Hedged LiquidCredit Strategies
Retail/HNW ?
Liability-based institutional
Asset-based institutional & Ultra-high-net-worth
Asset-Based Investment “Structures”
Chart 32

52Citi Perspectives, a Prime Finance Publication JULY 2010
As already noted, these managers are best positioned to
sustain their operations and investments based solely on
their management fee in periods of flat to lower returns,
due to the size of their asset base. These hedge funds
also tend to draw the highest share of direct investor
allocations due to the robustness of their IT and operational
infrastructures which are the most “institutionalized” in
the hedge fund space.
Finally, role specialization is also more evident at larger
funds and most have built out extensive investor relations
teams. This benefits the organization’s ability to pursue and
maintain direct relationships with institutional investors
and their intermediaries in a period when investors are
recognizing the benefit of such relationships and looking
to spend more time getting to know a manager.
The biggest concern interviewees expressed about the
largest hedge funds drawing the majority of institutional
flows is about whether the size of the fund itself becomes
a hurdle in creating alpha. This uncertainty has existed
for some time in the market, and was underscored
during the liquidity crisis when many of the larger, more-
liquid managers demonstrated a higher-than-expected
correlation to beta in their portfolios as noted earlier.
One facet to watch in coming years is whether these large
hedge funds are able to sustain their returns and isolate
their performance from beta.
The other facet to watch will be emerging regulatory
mandates and their potential for increasing the operational
burden on hedge funds. Some participants expressed
concerns that excessive regulation could begin to drive
funds out of the major U.S. and European money centers to
Asian or Swiss locations with looser rules. Others worried
about the unintended consequences of regulators trying
to flex their extra-territorial rights. As more clarity about
upcoming rules emerges, we will create another update
exploring those issues in depth.
“There has been a power shift toward investors substituting
bigger managers in their portfolio.”
- Pension Consultant
“Smaller managers are having trouble in the new environment.
All the money is going to the big guys now.”
- Fund of Fund

53Citi Perspectives, a Prime Finance Publication JULY 2010
References
1. “2010 Investment Company Fact Book: A Review of the Trends in the Investment Company Industry”, 50th Edition,
Investment Company Institute, 2010.
2. “A Singular Approach”, HFM Week Magazine, April 28, 2010.
3. “Breaking Down the Walls: Convergence Between Traditional Investment Managers and Hedge Fund Managers”, BNY
Mellon and Greenwich Associates, Thought Leadership Series, April 2010.
4. “Exotic to Mainstream: Growth of Alternative Mutual Funds in the U.S. and Europe”, Strategic Insight, SEI Global
Services Inc.
5. “U.S. Corporate Pension Funds Shed Risk, While Public Funds Embrace It”, March 2010, Greenwich Associates.
6. Morningstar Alternative Investments Observer, First Quarter 2010, Morningstar.

54Citi Perspectives, a Prime Finance Publication JULY 2010
This communication has been prepared by employees of Citi and is distributed by or through its locally authorized affiliates (collectively, the “Firm”). Em-ployees preparing this communication are not Research Analysts and are not employees of Citi Investment Research (CIRA) and the information in this communication (the “Message”) is not intended to constitute “research” as that term is defined by applicable regulations. Any reference to a research report or research recommendation is not intended to represent the whole report and is not in itself considered a recommendation or research report. Please contact your Firm representative for a copy of a comprehensive research report. All views, opinions and estimates expressed in the Message constitute the author’s and/or the Firm’s judgment as of the date of the Message, may change without notice and may differ from those views, opinions and estimates expressed by other Firm personnel.
IRS Circular 230 Disclosure: Citigroup Inc. and its affiliates do not provide tax or legal advice. Any discussion of tax matters in these materials (i) is not intended or written to be used, and cannot be used or relied upon, by you for the purpose of avoiding any tax penalties and (ii) may have been written in connection with the “promotion or marketing” of any transaction contemplated hereby (“Transaction”). Accordingly, you should seek advice based on your particular circumstances from an independent tax advisor.
The Message is provided for information and discussion purposes only and is not a representation or recommendation by the Firm. It does not constitute an offer or solicitation to purchase or sell any financial instruments, and does not take into account the investment objectives or financial situation of any particular person. Investors should obtain advice based on their own individual circumstances from their own tax, financial, legal and other advisors before making an investment decision, and only make such decisions on the basis of the investor’s own objectives, experience and resources. The infor-mation contained in the Message is based on generally available information and, although obtained from sources believed by the Firm to be reliable, its accuracy and completeness cannot be assured, and such information may be incomplete or condensed. Certain personnel or business areas of the Firm may have access to or may have acquired material non-public information that may have an impact (positive or negative) on the information contained in the Message, but that is not available to or known by the author of the Message.
The Firm may be the issuer of, may make a market in or may trade as principal in the financial instruments referred to in the Message or other related financial instruments. The Firm may perform or seek to perform investment banking and other services for the issuer of any such financial instruments. The author of the Message may have discussed the information contained therein with others within or outside the Firm and the author and/or such other Firm personnel may have already acted on the basis of this information (including by trading for the Firm’s proprietary accounts or communicat-ing the information contained herein to other customers of the Firm). Compensation of Firm personnel may include consideration of the performance of such department’s activities.
The Firm, the Firm’s personnel (including those with whom the author may have consulted in the preparation of this communication), and other cus-tomers of the Firm may be long or short the financial instruments referred to in the Message, may have acquired such positions at prices and market conditions that are no longer available, may be a director or officer of any company referenced herein and may have interests different from or adverse to your interests.
Investments in financial instruments carry significant risk, including the possible loss of the principal amount invested. Financial instruments denomi-nated in a foreign currency are subject to exchange rate fluctuations, which may have an adverse effect on the price or value of an investment in such products. No liability is accepted by the Firm for any loss (whether direct, indirect or consequential) that may arise from any use of the information contained in or derived from the Message.
Unless otherwise indicated, the Message is not intended to forecast or predict future events. Past performance is not a guarantee or indication of future results. Any prices provided in the Message (other than those that are identified as being historical) are indicative only and do not represent firm quotes as to either price or size. You should contact your local representative directly if you are interested in buying or selling any financial instrument, or pursu-ing any trading strategy, mentioned herein.
Although the Firm is affiliated with Citibank, N.A. (together with its subsidiaries and branches worldwide, “Citibank”), you should be aware that none of the other financial instruments mentioned in the Message (unless expressly stated otherwise) are (i) insured by the Federal Deposit Insurance Corpora-tion or any other governmental authority, or (ii) deposits or other obligations of, or guaranteed by, Citibank or any other insured depository institution.
The information in this Message may be confidential or otherwise protected by law. If you are not the intended recipient of the Message, please delete and do not disclose or make improper use of it, and promptly notify the sender. The Message contains data compilations, writings and information that are proprietary to the Firm and protected under copyright and other intellectual property laws, and may not be redistributed or otherwise transmitted by you to any other person for any purpose. Electronic messages are not necessarily secure or error free and can contain viruses, and the sender is not liable for any of these occurrences. The Firm reserves the right to monitor, record and retain electronic messages.
We are required to obtain, verify and record certain information that identifies each entity that enters into a formal business relationship with us. We will ask for complete name, street address and tax payer ID number. We may also request corporate formation documents, or other forms of identification, to verify information provided.
Copyright © Citi 2010. All Rights Reserved. Citi and Citi Arc Design are trademarks and service marks of Citigroup Inc. or its affiliates and are used and registered throughout the world.
Firm Disclaimer and Market Commentary Disclosure

55Citi Perspectives, a Prime Finance Publication JULY 2010

Bill MacalusoPrime Finance [email protected]
Tom SheridanPrime Finance [email protected]
New York 1.800.773.2889 Boston 1.617.346.9335 San Francisco 1.415.617.8554 EMEA +44 (0) 207 986 0822 Hong Kong +852 2501-8356 Singapore +65 6432 1223 Sydney +612 8225 6424 Tokyo +813 6270 3165
©2010 Citigroup Inc. All rights reserved. Citi, Citi and Arc Design, Citibank and Citigroup are trademarks and service marks of Citigroup Inc. andare used and registered throughout the world.