Embed Size (px)
Citation preview


Citigold Private Client October 2016
Perspectives
Paul Hodes Head of Traditional Managed
InvestmentsHead of Wealth Management
Asia PacificCitibank N.A.
nt
Dear Clients,
In this month’s Perspectives, we present what the Federal Reserve’s (“Fed“) recent decision to keep rates on hold means for investors. In addition, we explain how the “October e ect” came about and the implications for investor portfolios.
Equity markets rallied after the Fed’s decision not to raise interest rates in September. With the futures market pricing in only a 22% probability of a hike leading into the Fed meeting, a rate increase could have triggered significant market volatility. Citi analysts expect the Fed to raise rates by 25 basis points in December and believe that the rate hike cycle will be gradual with only 2 more rate increases in 2017. While the search for yield continues to benefit income generating investments including bonds and dividend yielding equities, Citi recommends that investors maintain a quality bias in their portfolios. Markets will likely become volatile again given global economic and political uncertainties including the coming US elections in November. Stretching for yield in lower-rated bonds or overvalued dividend stocks is likely to expose portfolios to greater market fluctuations.
Our second article is on the “October e ect” , which is the belief that stocks tend to underperform during the month of October. Investors may want to treat the “October e ect” with some scepticism. S ince 1950, the S&P 500 Index on average returned investors almost 1% in the month of October and nearly 4% in October – December. A caveat is that in an election year, the stock market may face greater uncertainty than in non-election years. Rather than trying to anticipate seasonal price movements, we suggest that investors rebalance their portfolios on a regular basis.
I hope you enjoy reading this edition of our Perspectives. Please speak to your Citibank relationship manager to discuss what the developments in markets mean for your individual portfolio.
Best regards,
Paul
MARKET PERSPEC TIVES
01
All forecasts are expressions of opinion, are not a guarantee of future results, are subject to change without notice and may not meet our expectations due to a variety of economic, market and other factors. Likewise, past performance is no guarantee of future results.

Citigold Private Client October 2016
Views
d
,
“…Equities will notnecessarily suffer from
rising rates….
t
MARKET PERSPEC TIVES
02
All forecasts are expressions of opinion, are not a guarantee of future results, are subject to change without notice and may not meet our expectations due to a variety of economic, market and other factors. Likewise, past performance is no guarantee of future results.
A slow path towards higher interest rates
The Fed stays on hold
At the September 20-21 Federal Open Market Committee (FOMC) meeting, the Committee kept the Fed Funds rate unchanged at the targeted range of 0.25%-0.50%. While the committee was “generally pleased” with how the economy is performing, it chose to take a cautious approach to any future rate increases. There was little evidence that the economy is overheating and the economy appeared to have further room to run, though the committee set the stage for a rate hike later this year.
Should investors fear higher US interest rates?
Post the 2007 – 2008 global financial crisis, global central banks tried to stimulate the economy through expansionary monetary policies. Some of the measures are unprecedented with the Fed lowering the Feds Fund rate to record lows and the Bank of Japan (BoJ) and the European Central Bank (ECB) experimenting with negative interest rates. These policies pushed equity and bond prices higher around the world. Over the last 12-18 months, income generating asset classes including dividend equities, bonds and emerging markets (EM) enjoyed healthy inflows as yields remained low. What is the potential impact on these assets from higher interest rates?
“ Rising interest rates tend to be unfriendly for bonds”
Given the inverse relationship between bond prices and interest rates, rising interest rates are negative for bonds. Rising rates are also more negative for lower coupon bonds than higher coupon bearing bonds. This is because the higher coupons help provide a buffer when bond prices fall in the face of rising yields. Rising yields also impact bonds with varying maturities differently. Longer maturity bonds experience greater price fluctuations to changes in rates relative to shorter maturity bonds. Higher interest rates raise financing costs which present a potential risk for highly indebted high yield issuers.
“ Equities will not necessarily suffer from rising rates”
What might rising rates mean for equities? The MSCI ACWI global benchmark has posted positive returns (+10% in 2010-11, +2% in 2013 and +6% in 2015) as bonds sold off. This appears reasonable as a global economic recovery, while driving rates higher, is also likely to lead to stronger earnings growth (See Figure 1). In an environment of rising rates, cyclical and small cap stocks have historically outperformed (See Figure 2).
“…Given the inverserelationship between bondprices and interest rates,
rising interest rates arenegative for bonds...”

Citigold Private Client October 2016
“…Historically tighter USmonetary policy has led to
higher EPS growth in EMsand thus better returns in
EM equity markets…”
“…. Europe has seen the strongest net equity
in�ows…..”
MARKET PERSP ECTIVES
03
All forecasts are expressions of opinion, are not a guarantee of future results, are subject to change without notice and may not meet our expectations due to a variety of economic, market and other factors. Likewise, past performance is no guarantee of future results.
Fig 1: Performance – MSCI AC World Fig 2: Style Performance With Rising Yields
Source: Citi Research, as of 22 September 2016 Source: Citi Research, as of 22 September 2016
Stronger US and global economic growth have historically driven EM rates and earnings growth higher, resulting in positive returns (see Figures 3 and 4 below). Since the late 1980s (note the 1983 and 1987 cycles are for Asia ex Japan only), earnings in EM improved following Fed rate hikes, with the exception of the cycle in 1983. In the absence of a recovery in earnings growth, rising US interest rates could actually lead to capital outflows from EM.
Fig 3: US rate hike on MSCI EM performance Fig 4: EM EPS in US$ post U.S rate hike
Source: MSCI, Citi Research as of 15 September 2016 Source: MSCI, Citi Research as of 15 September 2016
With yields in dividend yielding equities currently higher than government bonds across major developed economies, dividends have been a key support for equity markets as earnings growth remained soft. A rise in bond yields could potentially lessen the appeal of dividend yielding equities to income seeking investors.
“ A strong US dollar poses risks to emerging markets”
A rise in US rates has historically strengthened the US Dollar. With commodity prices denominated in US dollar, a stronger US dollar lowers earnings in EM by depressing prices and volumes. Weaker export earnings can in turn lower current account (CA) balances and weigh on vulnerable EM currencies with high CA deficits.

Citigold Private Client October 2016
MARKET PERSPEC TIVES
04
All forecasts are expressions of opinion, are not a guarantee of future results, are subject to change without notice and may not meet our expectations due to a variety of economic, market and other factors. Likewise, past performance is no guarantee of future results.
Implications for investors
The Fed is likely to proceed cautiously and raise rates when they feel confident with the outlook of the US economy and inflation. Citi analysts continue to expect one interest hike this year which will increase the Fed’s Fund rate to 0.75% by end-2016. This will be followed by two more projected rate hikes in 2017, moving the policy rate to 1.25% by end-2017. Against this backdrop of gradual rate hikes, Citi analysts believe that developed market corporate bonds as well as emerging market bonds are likely to continue to receive investor inflows. Citi analysts continue to favour stocks that have a track record of growing dividends as this can help mitigate against rising interest rates.
With a slow path of rate hikes expected, any upside to the US dollar is likely to be limited in the medium-term. Citi analysts believe that the US dollar appears to have peaked, given that long-term US dollar appreciation cycles are typically 5-6 years long. As such, the dollar is unlikely to pose significant challenges to EM growth. Citi analysts also note that CA balances in EM are healthier now compared to 2013 when EM currencies experienced significant volatility.
EM companies are currently as profitable as DM companies, when measured by the return on equity (ROE) although EM equity valuations are cheaper. On a price to book basis, EM are trading at a 26% discount to DM. Relatively cheaper valuations and rising earnings in EM may help buffer against concerns over the region’s vulnerability to higher US interest rates. Analysts expect EM earnings to grow 6.9% for 2016 and 12.9% for 2017, after having contracted in 2013 to 2015. EM equities also have room to pay more dividends. Citi analysts note that company cash flows have been improving on the back of greater cost discipline (e.g. reductions in capital expenditures) and higher commodity prices.
Stay diversi�ed
On balance, Citi analysts remain comfortable with our current investment strategy of favouring US Investment Grade credits, as well as US and European High Yield bonds. Stable commodity prices and modest dollar strength are also expected to remain supportive of Emerging Market, including Asian bonds. Within equities, Citi analysts are overweight Emerging Markets with a bias towards Latin America. Dividend equities are expected to continue to perform well as yields remain low.
One potential risk to this strategy may come from the political front as we approach the US Presidential Elections in November. We suggest that investors rebalance their portfolios and stay diversified by reducing overly concentrated exposures in any asset classes.
Citigold Private Client October 2016
The “October e�ect”
There are a number of well-known investment maxims which investors may be familiar with. These include “The Trend is your Friend” or “Sell in May and Go Away”. In this article, we explain how the “October e�ect” came about and what it means for investors.
What is the “October e�ect”?
The “October e�ect” is the belief that stocks tend to underperform during the month of October. In 1929, the Great Depression was triggered by a stock market crash in the US on 29 October. In 1987, the Dow Jones fell 22.6% on 19 October (“Black Monday”). In 2002, markets hit a �ve -year low on 9 October. At the start of the Global Financial Crisis (“GFC”) in 2008, the market also corrected 16% in October.
Myth vs reality
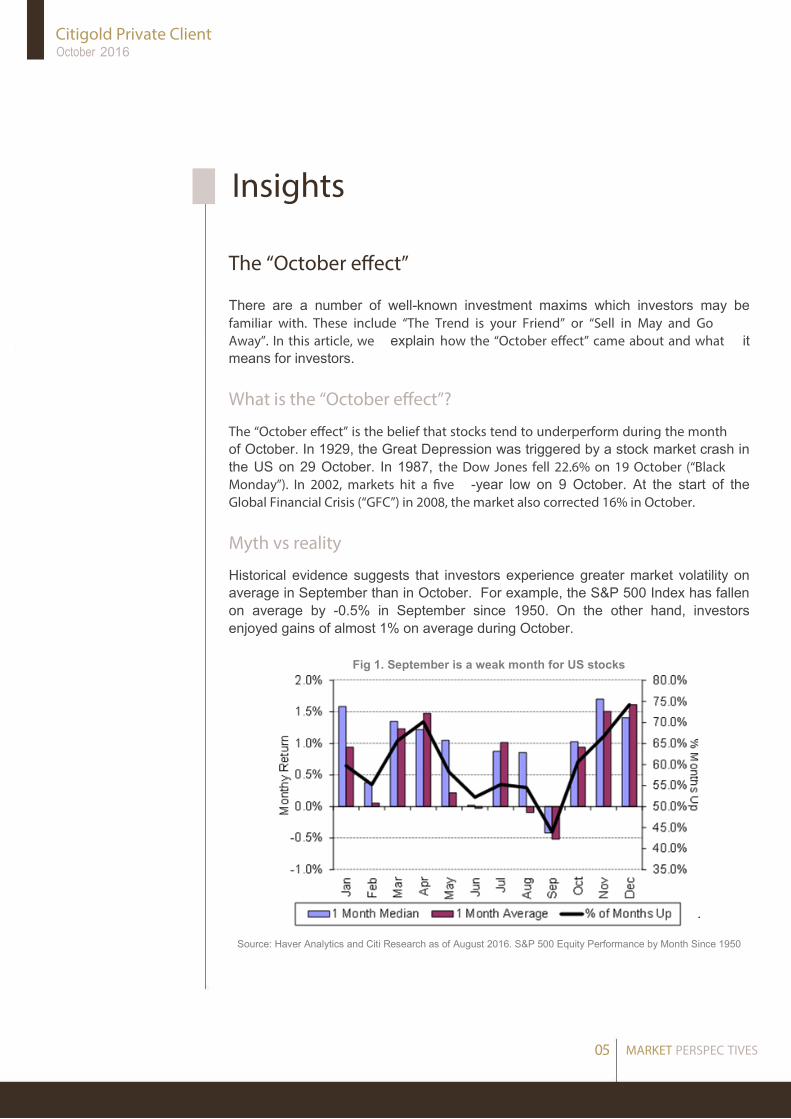
Historical evidence suggests that investors experience greater market volatility on average in September than in October. For example, the S&P 500 Index has fallen on average by -0.5% in September since 1950. On the other hand, investors enjoyed gains of almost 1% on average during October.
Fig 1. September is a weak month for US stocks
Source: Haver Analytics and Citi Research as of August 2016. S&P 500 Equity Performance by Month Since 1950
MARKET PERSPEC TIVES
05
Insights

Citigold Private Client October 2016
The US equity market typically outperforms in the fourth quarter
Since 1950, the US market gains on average nearly 4% in October – December. (See Figure 1). Why does this happen? It is believed that fund managers try to improve year-end results by reallocating their portfolios through purchasing stocks, which pushes stock prices higher. Other potential reasons include year-end bond coupon payments which may partially flow into the stock market. The holiday effect at year-end also plays a role as many investors use the time-off to make investment decisions.
A caveat is that in a presidential election year, the stock market may face greater uncertainty than in non-election years. Since 1900, the S&P 500 has fallen on average 1.2% in year 8 of a presidential term. The great decline happened in 2008 when the S&P 500 fell 41%, coinciding with a US recession. The US economy is healthier in 2016 with Citi analysts expecting the US economy to grow 2% p.a. into the medium term, supported largely by consumer spending.
What does this mean for investors?
Rather than trying to anticipate seasonal price movements, we suggest that investors rebalance their portfolios on a regular basis. By selling investments that have rallied, rebalancing helps investors realise their profits rather than trying to time the market for maximum profit. Likewise, by buying assets which have corrected, investors potentially avoid the risk of buying overvalued investments.
While investors should to treat the “October e�ect” with some scepticism, there are some investment maxims which are sound investment principles. These include:
“Don’t put your eggs in one basket”
A diversified portfolio can mitigate the impact of extreme sell-offs while helping to grow wealth over the long term. In a volatile range bound market, a diversified portfolio is likely to provide better risk-adjusted returns. Investors looking for better portfolio diversification can also consider gaining exposure to non-traditional asset classes to further lower the volatility of their portfolios. See Fig 2.
Fig 2. A diversified portfolio aims to deliver higher returns with lower volatility
Source: Bloomberg as of August 2016. In USD terms.
Hypothetical portfolio comprises of 40% in global investment grade bonds and 60% in global equities. For illustration only. Past performance is not a guarantee of future returns.
MARKET PERSPEC TIVES
06
All forecasts are expressions of opinion, are not a guarantee of future results, are subject to change without notice and may not meet our expectations due to a variety of economic, market and other factors. Likewise, past performance is no guarantee of future results.

Citigold Private Client October 2016
“Ti me in the market is more important than timing the market”
One of the keys to successful investing is resisting the temptation to time the market and to stay invested for the long term. It is impossible to time the markets perfectly as they can rise as quickly as they fall. If a recent market drop has caught you by surprise, then the subsequent rise can be so rapid that you may not be able to re-enter the market in time to reap the potential benefits. See Fig 3 and 4.
Fig 3: Short term market performance MSCI AC World (Oct 07 – Mar 08)
Fig 4: Long term market performance MSCI AC World (Jan 88 – May 08)
Source: Bloomberg. In USD terms. As of August 2016 Source: Bloomberg. In USD terms. As of August 2016
By following these investment principles, together with a clearly defined investment strategy, investors can potentially achieve more predictable investment outcomes over the longer term.
Key Takeaways
� The October effect is a belief that stocks tend to underperform during the month of October. In reality, history shows that the S&P 500 on average has risen by about 4% in the fourth quarter of each year, although this may vary in an election year.
� Rather than entering and exiting the market at various points in time, we suggest that investors rebalance their portfolios on a regular basis. By selling assets that have rallied, rebalancing helps investors realise their profits rather than trying to time the market for maximum profit. Likewise, by buying assets which have corrected, investors potentially avoid the risk of buying overvalued investments.
MARKET PERSPEC TIVES
07
All forecasts are expressions of opinion, are not a guarantee of future results, are subject to change without notice and may not meet our expectations due to a variety of economic, market and other factors. Likewise, past performance is no guarantee of future results.

Citigold Private Client October 2016
World Markets At a Glance
Source: Bloomberg as of 26 September 2016
Last price 52-Week 52-Week
26-Sep-16 High Low 1 week 1 month 1 year Year-to-date
US / Global
Dow Jones Industrial Average 18094.83 18668.44 15450.56 -0.14% -1.63% 10.91% 3.84%
S&P 500 2146.10 2193.81 1810.10 0.33% -1.06% 11.12% 5.00%
NASDAQ 5257.49 5342.88 4209.76 0.43% 0.74% 12.18% 4.99%
Europe
MSCI Europe 399.05 437.44 353.59 0.45% -1.17% -1.50% -2.90%
Stoxx Europe 600 340.00 387.43 302.59 -0.37% -1.08% -2.66% -7.06%
FTSE100 6818.04 6955.34 5499.51 0.07% -0.29% 11.61% 9.22%
CAC40 4407.85 5011.65 3892.46 0.31% -0.77% -1.62% -4.94%
DAX 10393.71 11430.87 8699.29 0.19% -1.83% 7.28% -3.25%
Japan
NIKKEI225 16544.56 20012.40 14864.01 0.15% 1.12% -7.47% -13.08%
Topix 1335.84 1609.76 1192.80 1.86% 3.72% -8.11% -13.67%
Emerging Markets
MSCI Emerging Market 905.49 929.99 686.74 0.87% 0.45% 14.74% 14.02%
MSCI Latin America 2366.54 2540.39 1550.47 1.85% -3.02% 25.00% 29.33%
MSCI Emerging Europe 130.04 134.00 91.09 1.46% 0.81% 9.84% 17.84%
.Brazil Bovespa 58053.53 60310.50 37046.07 1.23% 0.58% 29.49% 33.92%
Russia RTS 986.83 1017.32 607.14 1.76% 1.38% 25.14% 30.35%
Asia
MSCI Asia ex-Japan 551.91 562.79 434.84 0.40% 1.47% 14.44% 10.40%
Australia S&P/ASX 200 5431.42 5611.20 4706.70 2.58% -1.52% 7.72% 2.56%
China HSCEI (H-shares) 9629.35 10884.88 7498.81 -1.21% 0.83% 1.23% -0.33%
China Shanghai Composite 2980.43 3684.57 2638.30 -1.51% -2.93% -3.62% -15.79%
Hong Kong Hang Seng 23317.92 24364.00 18278.80 -0.99% 1.78% 10.06% 6.40%
India Sensex30 28294.28 29077.28 22494.61 -1.19% 1.84% 9.40% 8.33%
Indonesia JCI 5352.14 5476.22 4033.59 0.57% -1.59% 27.15% 16.53%
Malaysia KLCI 1669.50 1729.13 1595.22 1.08% -0.81% 3.37% -1.36%
Korea KOSPI 2047.11 2073.89 1817.97 1.55% 0.47% 5.37% 4.37%
Philippines PSE 7632.46 8118.44 6084.28 0.75% -2.72% 10.33% 9.79%
Singapore STI 2849.94 3104.72 2528.44 -0.08% -0.27% 0.61% -1.14%
Taiwan TAIEX 9194.52 9290.76 7627.89 0.45% 0.69% 13.06% 10.27%
Thailand SET 1490.14 1558.32 1220.96 -0.17% -3.83% 8.23% 15.69%
Commodity
Oil 45.93 51.67 26.05 6.07% -3.59% 0.50% 24.00%
Gold spot 1337.95 1375.45 1046.43 1.89% 1.27% 16.71% 26.05%
Historical Returns (%)
MARKET PERSPEC TIVES
08
All forecasts are expressions of opinion, are not a guarantee of future results, are subject to change without notice and may not meet our expectations due to a variety of economic, market and other factors. Likewise, past performance is no guarantee of future results.
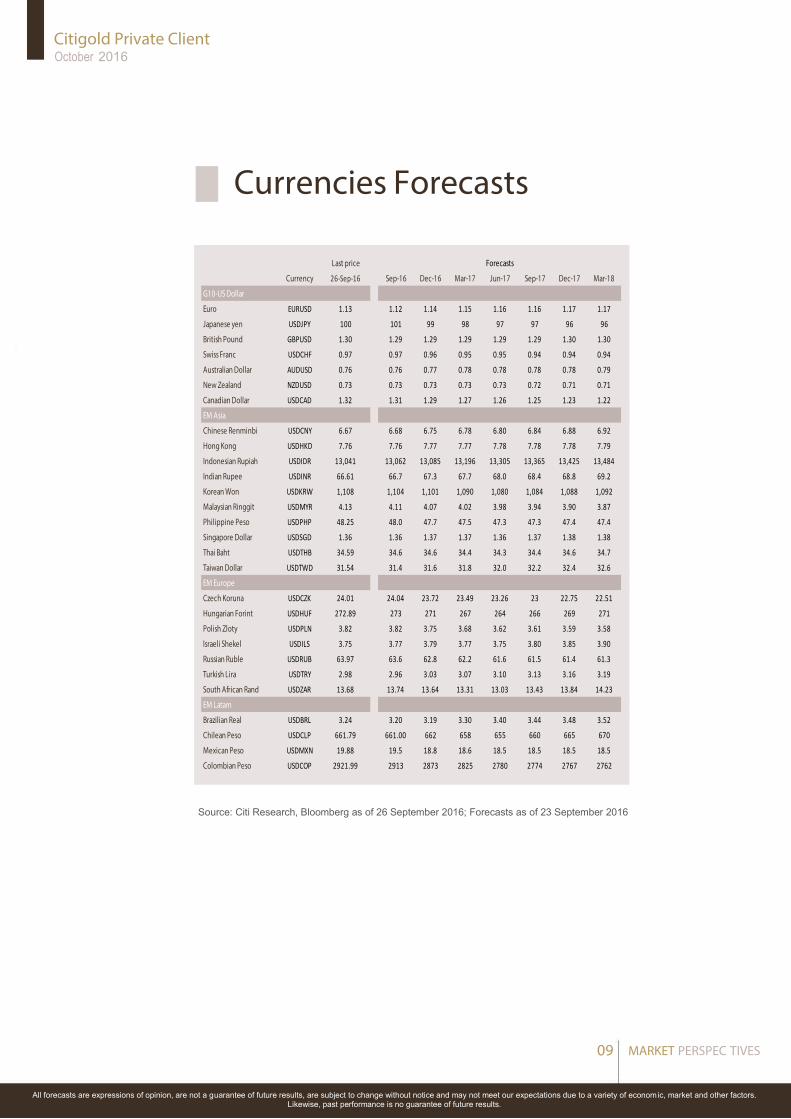
Currencies Forecasts
Citigold Private Client October 2016
Source: Citi Research, Bloomberg as of 26 September 2016; Forecasts as of 23 September 2016
Last price
Currency 26-Sep-16 Sep-16 Dec-16 Mar-17 Jun-17 Sep-17 Dec-17 Mar-18
G10-US Dollar
Euro EURUSD 1.13 1.12 1.14 1.15 1.16 1.16 1.17 1.17
Japanese yen USDJPY 100 101 99 98 97 97 96 96
British Pound GBPUSD 1.30 1.29 1.29 1.29 1.29 1.29 1.30 1.30
Swiss Franc USDCHF 0.97 0.97 0.96 0.95 0.95 0.94 0.94 0.94
Australian Dollar AUDUSD 0.76 0.76 0.77 0.78 0.78 0.78 0.78 0.79
New Zealand NZDUSD 0.73 0.73 0.73 0.73 0.73 0.72 0.71 0.71
Canadian Dollar USDCAD 1.32 1.31 1.29 1.27 1.26 1.25 1.23 1.22
EM Asia
Chinese Renminbi USDCNY 6.67 6.68 6.75 6.78 6.80 6.84 6.88 6.92
Hong Kong USDHKD 7.76 7.76 7.77 7.77 7.78 7.78 7.78 7.79
Indonesian Rupiah USDIDR 13,041 13,062 13,085 13,196 13,305 13,365 13,425 13,484
Indian Rupee USDINR 66.61 66.7 67.3 67.7 68.0 68.4 68.8 69.2
Korean Won USDKRW 1,108 1,104 1,101 1,090 1,080 1,084 1,088 1,092
Malaysian Ringgit USDMYR 4.13 4.11 4.07 4.02 3.98 3.94 3.90 3.87
Philippine Peso USDPHP 48.25 48.0 47.7 47.5 47.3 47.3 47.4 47.4
Singapore Dollar USDSGD 1.36 1.36 1.37 1.37 1.36 1.37 1.38 1.38
Thai Baht USDTHB 34.59 34.6 34.6 34.4 34.3 34.4 34.6 34.7
Taiwan Dollar USDTWD 31.54 31.4 31.6 31.8 32.0 32.2 32.4 32.6
EM Europe
Czech Koruna USDCZK 24.01 24.04 23.72 23.49 23.26 23 22.75 22.51
Hungarian Forint USDHUF 272.89 273 271 267 264 266 269 271
Polish Zloty USDPLN 3.82 3.82 3.75 3.68 3.62 3.61 3.59 3.58
Israeli Shekel USDILS 3.75 3.77 3.79 3.77 3.75 3.80 3.85 3.90
Russian Ruble USDRUB 63.97 63.6 62.8 62.2 61.6 61.5 61.4 61.3
Turkish Lira USDTRY 2.98 2.96 3.03 3.07 3.10 3.13 3.16 3.19
South African Rand USDZAR 13.68 13.74 13.64 13.31 13.03 13.43 13.84 14.23
EM Latam
Brazilian Real USDBRL 3.24 3.20 3.19 3.30 3.40 3.44 3.48 3.52
Chilean Peso USDCLP 661.79 661.00 662 658 655 660 665 670
Mexican Peso USDMXN 19.88 19.5 18.8 18.6 18.5 18.5 18.5 18.5
Colombian Peso USDCOP 2921.99 2913 2873 2825 2780 2774 2767 2762
Forecasts
MARKET PERSPEC TIVES
09
All forecasts are expressions of opinion, are not a guarantee of future results, are subject to change without notice and may not meet our expectations due to a variety of economic, market and other factors. Likewise, past performance is no guarantee of future results.

Singapore
: This report is distributed in Singapore by Citibank Singapore Limited (“CSL”). Investment products are not insured under the provisions of the Deposit Insurance and Policy Owners’ Protection Schemes Act 2011 of Singapore and are not eligible for deposit insurance coverage under the Deposit Insurance Scheme.
Disclaimer
Citigold Private Client October 2016
MARKET PERSPEC TIVES
10
All forecasts are expressions of opinion, are not a guarantee of future results, are subject to change without notice and may not meet our expectations due to a variety of economic, market and other factors. Likewise, past performance is no guarantee of future results.
“Citigold Private Client” is a client segment of Citigroup Inc (“Citigroup”), which provides its clients access to a broad array of products and services available through bank and non-bank affiliates of Citigroup.
“Citi analysts” refers to investment professionals within Citi Investment Publication and Analysis and Citi Global Markets (CGM) and voting members of the Global Investment Committee of Global Wealth Management.
Citibank N.A. and its affiliates / subsidiaries provide no independent research or analysis in the substance or preparation of this document. Investment products are not available to US persons and not all products and services are provided by all affiliates or are available at all locations.
This document is for general informational purposes only and is not intended as a recommendation or an offer or solicitation for the purchase or sale of any security, currency, investment, service or to attract any funds or deposits. Information in this document has been prepared without taking account of the objectives, financial situation or needs of any particular investor. Therefore, investment products mentioned in this document may not be suitable for all investors. Any person considering an investment should seek independent advice on the suitability or otherwise of a particular investment. Before making any investment, each investor must obtain the invest-ment offering materials, which include a description of the risks, fees and expenses and the performance history, if any, which may be considered in connection with making an investment decision. Each investor should carefully consider the risks associated with the investment and make a determination based upon the investor’s own particular circumstances, that the investment is consistent with the investor’s investment objectives. In any event, past performance is no guarantee of future results, and future results may not meet our expectations due to a variety of economic, market and other factors. Further, any projections of potential risk or return are illustrative and should not be taken as limitations of the maximum possible loss or gain. Investments are not deposits or other obligations of, guaranteed or insured by Citibank N.A., Citigroup Inc., or any of their affiliates or subsidiaries, or by any local government or insurance agency, and are subject to invest-ment risk, including the possible loss of the principal amount invested. Investors investing in funds denominated in non-local currency should be aware of the risk of exchange rate fluctuations that may cause a loss of principal.
Neither Citigroup nor its affiliates can accept responsibility for the tax treatment of any investment product, whether or not the invest-ment is purchased by a trust or company administered by an affiliate of Citigroup. Citigroup assumes that, before making any commit-ment to invest, the investor and (where applicable, its beneficial owners) have taken whatever tax, legal or other advice the investor/beneficial owners consider necessary and have arranged to account for any tax lawfully due on the income or gains arising from any investment product provided by Citigroup. If an investor changes country of residence, citizenship, nationality, or place of work, it is his/her responsibility to understand how his/her investment transactions are affected by such change and comply with all applicable laws and regulations as and when such becomes applicable. Although information in this document has been obtained from sources believed to be reliable, Citigroup and its affiliates do not guaran-tee its accuracy or completeness and accept no liability for any direct or consequential losses arising from its use. Opinions expressed herein may differ from the opinions expressed by other businesses or affiliates of Citigroup, and are not intended to be a forecast of future events, a guarantee of future results or investment advice, and are subject to change based on market and other conditions. The information contained herein is also not intended to be an exhaustive discussion of the strategies or concepts.
At any time, Citigroup companies may compensate affiliates and their representatives for providing products and services to clients.
This is not an official statement of Citigroup Inc. and may not reflect all of your investments with or made through Citibank. For an accurate record of your accounts and transactions, please consult your official statement.
If this document shows information coming from Citi Investment Publication and Analysis, please refer to the attached link: https://ww-w.citivelocity.com/cvr/eppublic/citi_research_disclosures which contains the important disclosures regarding companies covered by Citi’s Equity Publication analysts, and please refer to the attached link: https://ir.citi.com/PuXs6xELNHAu7UqkjgvWxnihtUeLtAtDxeE-h%2B2qaPpPb7uukpx8Qw1vzcuidtMtqgn1BWqJqak8%3D for details on the CIRA ratings system.
This document may not be reproduced or circulated without Citigroup written authority. The manner of circulation and distribution may be restricted by law or regulation in certain countries. Persons who come into possession of this document are required to inform themselves of, and to observe such restrictions. Any unauthorised use, duplication, or disclosure of this document is prohibited by law and may result in prosecution.