Embed Size (px)
Citation preview

AARHUSUNIVERSITYAU
CITIZEN SCIENCE BASED BIRD POPULATION STUDIES
Citize
n Science
Ba
sed
Bird
Pop
ulatio
n Studie
s
PhD thesis 2017
Henning Heldbjerg
CITIZEN SCIENCE BASEDBIRD POPULATION STUDIES
ISBN: 978-87-xxxxxxxxxxx
He
nning H
eld
bje
rg • PhD
thesis

CITIZEN SCIENCE BASEDBIRD POPULATION STUDIES
Henning Heldbjerg
PhD thesis 2017
AARHUSUNIVERSITYAU

Title: Citizen Science Based Bird Population Studies Subtitle: PhD thesis Author: Henning Heldbjerg Institute: Aarhus University, Department of Bioscience
Publisher: Aarhus University – DenmarkURL: http://www.au.dk
Year of publication: 2017
PhD supervisors: Professor Anthony D. Fox, Department of Bioscience, Kalø, Aarhus University, DenmarkDr. Peter Sunde, Department of Bioscience, Kalø, Aarhus University, Denmark
Assessment committee: Dr. Kurt Thomas Jensen, Department of Bioscience, Kalø, Aarhus University, DenmarkDr. Kasper Thorup, Natural History Museum of Denmark, University of Copenhagen, DenmarkDr. Simon Gillings, British Trust for Ornithology, Thetford, UK
Please cite as: Heldbjerg, H. (2017). Citizen Science Based Bird Population Studies. PhD thesis. Aarhus University, Department of Bioscience, Denmark. 202 pp.
Reproduction permitted provided the source is explicitly acknowledged Layout: Tinna Christensen, Department of Bioscience, Silkeborg Cover photo: Peter Nielsen
Number of pages: 202
Data sheet

Content
Preface .......................................................................................................................................5
Acknowledgements ..............................................................................................................6
Resume.......................................................................................................................................7
Summary ....................................................................................................................................9
Introduction ............................................................................................................................ 11
How can we improve citizen science based bird population monitoring in Denmark? ........................................................................................................................................................................................ 11
Dedicated studies provide information on the drivers of changing populations as well as the basis for management and conservation .......................................................................... 11
Citizen science based bird population studies in Denmark now and in the future .......... 14
List of manuscripts ............................................................................................................... 16
PAPER 1 How can we improve future citizen science based bird monitoring in Denmark ? .............................................................................................................................. 19
PAPER 2 Continuous population declines for specialist farmland birds 1987-2014 in Denmark indicates no halt in biodiversity loss in agricultural habitats ........................................................................................................... 47
PAPER 3 Regional trends amongst Danish specialist farmland breeding birds ............. 65
PAPER 4 The decline of the Starling Sturnus vulgaris in Denmark is related to changes in grassland extent and intensity of cattle grazing ......................... 77
PAPER 5 Common Starlivngs (Sturnus vulgaris) increasingly select for grazedareas with increasing distance-to-nest ....................................................................... 91
PAPER 6 Large-scale climatic drivers of regional winter bird population trends .........121
PAPER 7 Disentangling the eff ects of multiple environmental drivers on population changes within communities .................................................................137
PAPER 8 Unstructured citizen science data fail to detect long-term population declines of common birds in Denmark ......................................................................163
PAPER 9 Invasive alien birds in Denmark ...................................................................................187
Photo: Poul Holm Pedersen

5PhD thesis by Henning Heldbjerg
Preface
This PhD thesis is the result of an Industrial PhD Project award, partly funded by the Innovation Fund Denmark. The PhD was carried out in a collaboration between DOF-Birdlife Denmark (the company partner) and Department of Bioscience, Kalø, Aarhus University (the university partner), with additional funding from 15. Juni Fonden and Aage V Jensen Naturfond.
The overall aim of the project was to improve the scientifi c use of data from citizen science based bird population studies in Denmark. This was achieved by (i) im-proving the use of the existing data covering more than 40 years and (ii) describ-ing new ways of a) obtaining the information required to cover more species and b) securing adequately detailed information in the future by extending current schemes. Such information is essential to be able to provide the knowledge base for the optimal management and conservation of vulnerable or declining species.
The PhD was initiated in November 2014 and completed in October 2017. Dur-ing this period, the mobility requirements of the PhD were met by collaboration with foreign research groups at the Cornell Lab of Ornithology, Cornell University, Ithaca, US, at British Trust of Ornithology (BTO), Thetford, UK and at Sovon, Dutch Centre for Field Ornithology, Nijmegen, The Netherlands.
The thesis consists of two parts. The fi rst part is a short introduction that aims to defi ne the research questions, describe the nature of the data and their collection methods and to present the results of the investigations. It also briefl y describes how the work relates to the state-of-the-art work within the fi eld. The last section has intentionally been kept short, because much of this ground is covered in a commentary paper included in the second part of the thesis. The second main part of the thesis consists of nine chapters, each of them written as a scientifi c paper in varying stages of completion. Seven papers are published already and two are submitted.

6 PhD thesis by Henning Heldbjerg
Ackno wledgements
First of all, I would like to thank my supervisor Tony Fox for absolute excellent super-vision from the fi rst day we discussed the idea of a PhD to the very end. I could not have asked for more. In the same manner, I thank my co-supervisor Peter Sunde, who did a great job supervising me through the detailed analytical stuff , as well as discussing strategical matters. I thank everyone at Kalø for accepting me as a part time colleague (since industrial PhD-students have at least two working ad-dresses) who appeared and disappeared during the last three years. I enjoyed your hospitality and the fruitful discussions all through the PhD period.
I also like to thank DOF-BirdLife Denmark (DOF) as an organisation for giving me this opportunity. Jan Ejlsted, Michael Grell as well as Steff en Brøgger Jensen, Hen-rik Wejdling and the other members of DOFs Executive Council, who provided the necessary time for the idea of the PhD project to grow and make the original application. The new management team, Sigrid Andersen and Mark Desholm (my supervisor in DOF) supported the idea and accepted my absence to work only on the PhD. All of the staff at DOF kindly helped with all sorts of things, particularly the staff of the Bio-team from whom I received much help and many fruitful discus-sions.
None of this work could have been undertaken without the selfl ess contribution of the very many bird-watchers that during the last almost 50 years have contributed data to the various monitoring projects. I am very grateful to each and every one of you and I sincerely hope that some of you will see the value of your contributions to the results presented in the PhD and that you will continue your invaluable work.
I enjoyed wonderful fi eldwork experiences during the springs of 2015-2017. I am grateful for meeting and working with ‘Starling-Master’ Peder Thellesen, thanks for sharing all your knowledge from a life-long interest in Starlings and thanks to you and Karin for opening your warm, hospital home and letting me invade your farm with videos, cameras, loggers etc. I also thank Michael Fink Jørgensen, Tony Fox, Bjarne Holm, ‘Mikkel’ Torben Mikkelsen, Iben Hove Sørensen and Martin Vester-gaard for various help in the fi eld work, collaboration that I enjoyed greatly.
I had the great opportunity to visit several organisations that I admire for their work based upon Citizen Science bird monitoring. I hand picked those I wanted to visit and was welcomed by the most friendly and skilled scientists Wesley Hochachka at Lab of Ornithology, Cornell University, New York, US, Ruud Foppen at Sovon, The Netherlands, Rob Robertson and David Noble at BTO, UK and fi nally Aleksi Lehikoinen, Finnish Lab of Ornithology, University of Helsinki. Also thanks to all my co-authors, every one of you improved the quality of the papers in this thesis. I am also grateful for permission to include those papers for which I am not the fi rst author in the thesis. I enjoyed the process of working with you all and learned so much from doing so.
I sincerely thank the Innovation Fund Denmark, 15. Juni Fonden and Aage V Jensen Naturfond for providing the economic foundation to allow the project to happen.
Last but not least, thanks to my wife Charlotte and our children Alberte, Eskild and Elise for your endless support and patience all through the project.

7PhD thesis by Henning Heldbjerg
Resume
Termen ’citizen science’ anvendes selv på dansk til at beskrive projekter, hvor al-mindelige borgere bidrager med at indsamle data til videnskabelige projekter. Af og til omtales det også som borgervidenskab. Citizen science udgør et uomgæn-geligt element i fugleovervågning i Danmark ligesom i de fl este andre lande. Den store frivillige indsats skaber betingelserne for at ’tage temperaturen på fuglebe-standene’, så samfundet som helhed får viden om status og udvikling for fuglenes udbredelse og antal. Nogle af de danske projekter har genereret sammenligne-lige data i over 40 år.
Denne PhD fokuserer på at anvende de indsamlede data bedst muligt. Det forsø-ges at svare på spørgsmål om, hvorvidt vi kan bruge de allerede indsamlede data bedre, om vi kan dække fl ere arter bedre og mere eff ektivt, og om hvorvidt vi skal igangsætte nye projekter, der kan øge vores kendskab til de arter, som vi tilstræ-ber at overvåge og beskytte. Analysen viser os, at disse data skaber en væsentlig viden om arter, naturtyper og fuglområder. Endnu vigtigere er det dog, at disse data også skaber et vidensgrundlag for at forklare udviklingen i de enkelte arters bestandsudvikling, hvilket er afgørende for at kunne understøtte forvaltningstiltag og skabe betingelser for beskyttelse af arter og deres leveområder.
Målet med artiklerne i denne afhandling er at demonstrere, hvordan disse citizen science-data kan bidrage til at skabe viden om fuglebestandene. Der inklude-res en vurdering af, hvordan vi kan inddrage andre analyseformer og endvidere, hvordan vi kan supplere med andre former for data og med moderne tekniske løsninger, så vi opnår en større forståelse for, hvad der forklarer ændringerne i fug-lebestandene.
Med udgangspunkt i fugleovervågningen i Danmark før og nu foreslås i den første artikel initiativer, der vil kunne forbedre fugleovervågningen fremover. Der argu-menteres for specialiseret overvågning af arter og naturtyper og for opstart af pro-jekter, der kan skabe viden om fuglebestandenes demografi , altså deres størrelse, sammensætning og udvikling, samt om de forhold og egenskaber, der har ind-fl ydelse herpå. Der opfordres til øget samarbejde og debat mellem de relevante forskere, naturforvaltere, grønne organisationer samt fugle- og naturinteresserede for at udvikle strategier for en bedre fremtidig fugleovervågning.
Resten af artiklerne udgør ’brikker’ i det store puslespil, der udgør den samlede forståelse af, hvilke faktorer, der forklarer udviklingen i de danske fuglebestande. Punkttællingsdata anvendes i analyser, der viser, at landbrugslandet er den na-turtype med størst generel bestandsnedgang og endvidere, at der til trods for for-skelle i landbrugsdriften i forskelle egne af landet kun er ganske få forskelle på de regionale bestandstendenser.
I andre artikler fokuseres der på stæren, der er en af arterne med meget stor be-standsnedgang gennem de undersøgte 40 år. Stærens adfærd og krav til leve-området undersøges og beskrives, og variationerne i stærens regionale bestands-udvikling relateres til variationer i regionale ændringer af landbrugspraksis for at kunne forstå, hvad der har forårsaget den dramatiske bestandsnedgang i stære-bestanden.
Tilsvarende overvågningsprojekter i fl ere lande har skabt tidsserier på mere end 30 år, der kan anvendes til at sammenligne bestandsudviklingen for de almin-delige fugle mellem de forskellige lande og endvidere med ændringer i klima og ændringer i landskabsudnyttelse. Artiklerne viser, hvilke ændringer vi kan se i

8 PhD thesis by Henning Heldbjerg
fuglenes udbredelse og bestandsstørrelser og hvilke konsekvenser, ændringerne i miljø og klima har på fuglesamfundet.
De seneste 15 års store og stigende, usystematiske indsamling af data i DOFbasen anvendes til beregning af bestandstendenser, der sammenlignes med de syste-matisk indsamlede data fra punkttællinger og beskriver styrkerne og begrænsnin-gerne ved anv endelse af DOFbasens data.
Som eksempel på DOFbasens muligheder og med inddragelse af andre typer data præsenteres til sidst et studie af status og bestandsudvikling for invasive fug-learter i Danmark, der viser, hvordan usystematiske data kan bidrage til nationale og europæiske biodiversitetsprogrammer inden for naturbeskyttelse og naturfor-valtning.
Samlet set demonstrerer afhandlingen, hvordan information om fugleforekomster, baseret på forskellige kilder til citizen science-data, kan være ekstremt brugbar til at opfylde de lovpligtige krav i forbindelse med national og international (fx EU-) lovgivning og dermed bidrage til naturbeskyttelse og naturforvaltning.
9PhD thesis by Henning Heldbjerg
Summary
Citizen science makes a major contribution to contemporary bird monitoring in Denmark, just as it does throughout many other parts of the world. Involving thou-sands of participants on a voluntary basis to generate avian distributional and abundance data has become the standard for ‘measuring the temperature’ of common bird populations. Some Danish monitoring projects have now lasted more than 40 years and there is no current reason to believe that the citizen scien-tist contribution will decrease in the future.
This PhD focuses on making the best use of the data from existing citizen science monitoring programmes in Denmark. It also poses the questions: can we use the data in better ways, can we cover more species more eff ectively and can we initiate projects that will increase our knowledge of the species we strive to and need to monitor? What we learn from this analysis is that while such data are extremely useful for generating new knowledge about species, habitats and sites. However, the results from such analyses play an even more vital role in providing the knowledge base for supporting the eff ective management interventions and enlighten the development of conservation policies for species and their habitats by understanding more about the drivers for changes in population abundance.
The papers included in this thesis aim to demonstrate how citizen science based monitoring data contribute to our knowledge of bird populations. They include an assessment of how we can improve the use of the existing data through novel applications and how we might combine avian monitoring data with other data sources and modern techniques to obtain a better understanding of the drivers of observed changes in bird populations.
Based on an analysis of existing and present bird monitoring in Denmark, the fi rst paper suggests future monitoring initiatives and argues for inclusion of more specialised monitoring on species and habitats and for initiating studies on de-mography. The paper urges more collaboration, debate and discussion among researchers, managers, NGO’s and the birdwatching community to begin to de-velop avian monitoring strategies for the future.
The rest of the papers contribute pieces to the jigsaw puzzle that represents our understanding of the drivers behind contemporary population changes among Danish bird populations. The thesis presents analysis of point count data used to monitor common breeding birds in Denmark to show declines are most severe amongst specialist farmland birds and that despite diff erences in farming prac-tice in diff erent regions of the country, there were few diff erences in regional birds trends to gain insight into causes of change. Other sections focus upon the causes of individual species trends, using the Starling as a study species. This is a spe-cies showing long-term declines over the last 40 years, which is investigated to understand diff erences in regions trends, habitats needs and behaviour, as well as its response to changes in the farmland landscape which could contribute to explaining its recent dramatic decline.
Now that citizen science monitoring in diff erent countries have generated time se-ries of 30 or more years, abundance data can be used to compare with changes in climate and land use, and also comparable to similar data from other countries. Thesis papers show how wintering birds have responded, in terms of abundance and distribution, to changes in climate over time and how we can compare the relative eff ects of land use and climate change on changes in the bird community.

10 PhD thesis by Henning Heldbjerg
A comparison between data gathered from Common Bird Monitoring breeding bird data and DOFbasen entries showed the strengths as well as the limitations of using systematic versus unstructured data, especially to track declines amongst common bird species in Denmark.
Finally, with the increase in gathering of opportunistic bird observations, a case study is presented using data from the Danish bird portal DOFbasen to support monitoring of invasive alien species in Denmark to show unsystematically gath-ered data can contribute to national and European biodiversity conservation and management programmes.
Overall, the thesis demonstrates how avian abundance information derived from diff erent citizen science data sources can be extremely useful in directly support-ing biodiversity conservation and management, providing vital support to meeting statutory obligations under national and international (e.g. EU) legislation.

11PhD thesis by Henning Heldbjerg
Introduction
How can we improve citizen science based bird population monitoring in Denmark?
Citizen science relies on the active contribution of non-professionals to collect, re-cord and report data to professionals who collate, analyse and transform such material into usable products for third parties, thereby creating opportunities for research and monitoring that would otherwise not be feasible.
DOF-BirdLife Denmark’s (DOF) own suite of citizen science activities have created programmes that successfully deliver the highest quality of data, analysis and re-porting but has the potential to be used to an even greater extent to support eco-logical research, conservation management actions and policy development. The use of these and similar data demonstrate how citizen science data can deliver high quality science and show how to maximise the potential of citizen science projects, both now and in the future.
The aim of this PhD-project, as outlined in the original PhD application, was to un-dertake extensive studies of declining bird species and their habitat use based on data contributed by DOF volunteers to various diff erent projects and databases. This process should attempt to include diff erent sources of data and exploit dif-ferent analytical techniques that can improve upon our current understanding of population changes and the factors that may be responsible for these observed patterns. By including cross-cutting analyses of all Danish breeding birds derived from data collected over the last 40 years and including new modern techniques, we have searched for adequate explanations for the declines within and be-tween species. Because so much of the Danish habitat is cultivated land, particular emphasis has been placed on the status and trends in farmland bird populations, assessing the absolute and relative eff ects of agricultural change on avian com-munities and species. We have sought to fi nd evidence to support hypotheses re-lating to the key drivers of changes in distribution and abundance of the declining species. Focus on the Starling Sturnus vulgaris enabled some testing of hypotheses relating to the factors aff ecting the regional diff erence rates of decline emerging from analyses of citizen science monitoring data. In this way, it was possible to compare trends in the largely mixed agriculture of western Jutland (where graz-ing animals remain reasonably common to provide what has been traditionally thought of as suitable Starling habitat) with those in the east, where arable ag-riculture has increasingly become the norm. Such results enabled the refi ning of hypotheses relating to regional Starling status and trends that could be tested by applying state-of-the-art telemetry at a farm where Starlings have been the sub-ject of an in-depth citizen science study for 45 years (see below).
Dedicated studies provide information on the drivers of changing populations as well as the basis for management and conservationOne aim of analysing diff erent types of citizen science data at diff erent geographi-cal scales was to produce a variety of studies that may inspire other similar investi-gations. Data from citizen science programmes most often comprise simple obser-vations of abundance at a known site, known time and often known habitat. Many observers contribute to standardised surveys, which demand systematic counts gathered under strict guidelines that permit more robust statistical analyses, such as the point counts that are used to generate breeding bird indices under DOFs Common Bird Monitoring programmes. However, observers are increasingly sub-

12 PhD thesis by Henning Heldbjerg
mitting all their observations as a record of their experiences in the fi eld (most of which constitute unsystematically gathered data). Clearly, there is a greater value in data derived from systematically collated information, but the increasing exist-ence of large numbers of unsystematically derived observations makes it possible to at least assess the value of such data and its potential contribution to specifi c types of avian monitoring. The generation of population trends for breeding and wintering bird populations over many years has been the traditional end-point of much bird monitoring in Europe and North America. However, there has been relatively less attention paid to assessing the variation between habitats and at diff erent spatial scales and the relative roles that environmental variation play in determining how bird population abundance changes over time. In addition to us-ing data from citizen science programmes, parts of the PhD aimed to build upon the knowledge from these time series by adding additional relevant information. These including exploiting data from other sources or using modern techniques to obtain knowledge on individual birds’ precise positions to understand the species’ preferred habitat. The type of data used for each investigation and the major fi nd-ings arising from them are here presented for each of the nine papers in the thesis.
First (Paper 1) the role of the citizen scientist is described and how we can promote debate and discussion to improve the existing citizen science contribution to bird monitoring in Denmark. Papers 2 and 3 then examine the trends emerging for all common Danish breeding birds, and investigate patterns among the declining species. Hereafter (Papers 4 and 5), the focus is upon only one case study species, the Starling, which is one of the species showing the fastest declines, integrating other sources of relevant information to better understand the regional diff erences in abundance and breeding trends among breeding Starling in relation to chang-ing agriculture within Denmark. Because changes in climate and land use are hypothesised to have major impacts on bird community composition, data on all species (both wintering and breeding birds) included in the Common Bird Moni-toring were analysed to fi nd support for the relative consequences of these two major sources of environmental change on avian populations (Papers 6 and 7). Finally (in Papers 8 and 9), specifi c questions are posed about the utility of unsys-tematically derived data which is entered into DOFbasen, the Danish bird portal. Comparisons between breeding bird point counts and DOFbasen data showed that unsystematic data were less eff ective at detecting population declines than data from carefully designed monitoring programmes, whereas DOFbasen pro-vided a valuable tool to describe the status, abundance and distribution of seven critical invasive alien species in Denmark, which were otherwise diffi cult to moni-tor in Denmark by other methods.
Paper 1 is a commentary that describes the past, present and potential future con-tribution of avian citizen science programmes in Denmark. The latter focuses on the potential of such studies based on the ongoing activities, analysis of the gaps in the existing eff ort, links to similar activities in neighbouring countries and refl ec-tions on the interest for participation expressed by volunteers in some of the ongo-ing activities. The analyses include a gap-analysis of all 227 Danish breeding bird species to show which breeding bird species are currently not covered eff ectively to provide information on status and trends and how the Danish monitoring “com-munity” could better cover a larger number of these bird species. As a review of avian citizen science programmes in Denmark, this chapter takes on the role of a more traditional Introduction section, with the result that this section is perhaps rather shorter than traditional.
Paper 2 used trends from 102 Danish breeding birds based on the Common Bird Monitoring programme, initiated in 1976. Restricting the data to those from 1987-2014 to be able to include the same time series for all species, enabled the analy-

13PhD thesis by Henning Heldbjerg
sis and comparison of mean trends for all species within the same habitat. The 2020 EU biodiversity strategy aims to halt the loss of biodiversity and ecosystem services and here we draw attention to the continuing decline of farmland birds, demonstrating that of the 16 specialised farmland species, those breeding on the ground are those in most rapidly decline.
Paper 3 focused on the 16 farmland specialist birds and tested whether we could use regional Common Bird Monitoring data from diff erent parts of Denmark to see if there were diff erences in population trends for these specialised species. Despite the marked diff erences between the mixed farming of western regions of Den-mark and the predominantly arable cultivation in the eastern region, there was very little diff erence between bird trends in the diff erent regions. We only found contrasting trends between regions in one species, the Corn Bunting Emberiza calandra and conclude therefore that the general decline among the farmland species is most likely caused by the overall intensifi cation in agriculture.
Paper 4 also used breeding bird data from the Common Bird Monitoring pro-gramme, contrasting regional trends for the Common Starling that have shown a 60% national decline during the last four decades. The aim of this study was, at a regional scale, to compare the Starling breeding bird trends with the trends in number of dairy cattle and area of grassland. The study confi rmed that not only does the extent of grassland available to breeding Starlings aff ect their relative abundance, but that the intensity of grazing of these grasslands was also of im-portance. These results were important in providing evidence that developments in the dairy sector have had major consequences for the breeding Starling in Den-mark.
Paper 5 follows from the previous paper by testing the hypotheses that individual breeding adult Common Starlings forage selectively upon grazed grasslands. This was the fi rst ever GPS logger study on Starlings to test predictions about general habitat selectivity in the agricultural landscape and increasing feeding selectivity with distance from nest location. Seventeen Starlings provisioning their young in nest boxes were fi tted with GPS loggers at a dairy farm in Southwest Jutland with the aim of understanding their habitat choice at increasing distances from the nest and their general patterns of crop/habitat preference. The results showed that the Starlings foraged within a few hundred meters from the nest and selected for grazed grassland. They avoided altogether winter crops and other forms of high, dense vegetation and were increasingly selective with distance from the nest box. These results highlight the importance of grazed foraging habitats close to the nest site of breeding Starlings. The ecological capacity of intensively man-aged farmland for insectivorous birds such as the Starling is declining because of the conversion of the most strongly selected land cover type (grazed grassland) to those habitats that were far less selected in this study.
Paper 6 used winter bird count data from 50 species in 1980/1981–2013/2014 generated by the Common Bird Monitoring from four countries, The Netherlands, Denmark, Sweden and Finland. We analysed country-specific population growth rates in relation to species’ climatic summer and winter niches, habitat preference and migratory behaviour. The main conclusions were that the generally decreas-ing winter population trends of cold-dwelling breeding species probably reflect the general decline in population sizes of these species. In contrast, increasing winter population trends for populations in the colder parts of the winter distribu-tion indicate a redistribution of wintering individuals towards the north-east. Both these patterns are likely caused by climate change.

14 PhD thesis by Henning Heldbjerg
Paper 7 exploited the Common Bird Monitoring breeding bird annual indices to compare the relative importance of climate change and agricultural land-use change for changes in abundance within the avian community between 1983 and 2013. Because diff erent environmental drivers aff ect population abundance simultaneously, it can be diffi cult to disentangle their eff ects. The results from mod-elling clearly showed that the environmental-data approach suggested that ag-ricultural land-use change has decreased the average abundances of species in the community, aff ecting total community size while the species-attribute based approach suggested that climate change has caused more variation in individual species abundance, aff ecting community composition.
Paper 8 aimed to assess the correlation between trends estimated from structured monitoring data and the increasing availability of citizen science information stored in online public databases of unstructured data. In Denmark we have both types of data, the structured data represented by Common Bird Monitoring breed-ing bird data and the unstructured represented by records from DOFbasen. We included 103 species during 1986-2013 to compare trends from the two datasets, showing that population trends estimated from structured and unstructured data were generally positively correlated. However, there was substantial variation among species, and the declines of many common species were not detected with unstructured citizen science data. We therefore conclude that, as expected, structured monitoring programmes are more powerful to detect population trends than unstructured citizen science data.
Paper 9 describes how unsystematically derived observational data, such as those derived from DOFbasen, can still potentially complement existing avian monitor-ing mechanisms. A novel data requirement to fulfi l information needs under the new European Union Regulation on Invasive Alien Species (IAS) implemented in January 2015 highlighted the lack of monitoring of such alien species in Denmark. We used a range of diff erent projects to contribute data from 2005-2014 on the current geographical and numerical distribution of the few serious IAS present in Denmark. We reviewed the status, abundance and distribution of seven critical IAS that have occurred in Denmark in the last 10 years and conclude that none of these pose a major threat as things stand at the present. We show how these monitoring programmes, not least DOFbasen, can be indispensable in supporting the direct management of alien species problems in this country. This confi rms the need for continued surveillance of all avian IAS through data collection that is es-sential if we are to continue to monitor eff ectively the future extent and nature of the problems posed by such species.
Citizen science based bird population studies in Denmark now and in the futureSeen from the point of view of governmental statutory agencies, ornithological NGOs, the specialist birdwatching community and the general public, the most important function of avian population monitoring has to be as an early warning system to detect major changes in bird distribution and abundance to trigger safe-guard mechanisms before these trends become critical. The work presented here has attempted to use such sources of data and link these to other sources of data (such as climate and habitat change) with the aim of better understanding the factors that contribute to the observed patterns of change. This has been achieved in the diff erent analyses by using diff erent methods to use diff erent sources of data to best eff ect. In doing so, it became obvious that there are data inadequacies associated with some species compared to others and for this reason it became obvious that some review of the extent and effi cacy of existing citizen science data to provide avian monitoring data was a necessary element of this thesis. For

15PhD thesis by Henning Heldbjerg
this reason, Paper 1 provides such an independent review for a wider audience rather than presenting it in this introductory section, even though it contributes to the overall aim of the PhD project.
The current degree of citizen science avian monitoring in Denmark is therefore presented and discussed in Paper 1 of this thesis in order to stimulate some crea-tive thoughts and discussion on how we can improve the situation in the immedi-ate future. We still have a long way to go before we have an ideal system in place, but hopefully this paper will provide some of the context and basic information to promote debate among the very many stakeholders and responsible authorities in Denmark that will help shape this extraordinary source of monitoring data in years to come.
Monitoring is conceived as a means of ‘taking the temperature of bird popula-tions’ i.e. to test how healthy the state of current bird populations may be. There are many potential means of monitoring changes in bird populations and since one design may not always suit all species, we may need to implement several methods in order to monitor all species eff ectively due to the diff erences in their abundance, distribution and behaviour. Monitoring forms the basis for providing a basic understanding of the status and trends of each species to enable decisions on their eff ective management. This is vital for government agencies and appro-priate NGOs who need such data in order to fulfi l requirements under national and international legislation, as well focus priorities for work plans. However, the gaps in our ability to both monitor trends and eff ectively interpret the factors respon-sible for changes in distribution and abundance also highlight the areas where we need to add dedicated research and obtain more detailed information upon which to provide the science base for implementing the necessary management and conservation initiatives. Despite the fact that birds are relatively easy to moni-tor compared to other groups of organisms such as insects or mammals, monitor-ing birds is often not as easy as we would like. There is a major need to develop the way in which we monitor bird populations, how we can include more species and how we can extract as much information as possible to get suffi cient informa-tion to actually enable us to focus the eff ective management of declining species.
At present, there are major diff erences in how monitoring is performed between diff erent European countries but since they ‘know no borders’ and birds are highly mobile, we increasingly need to combine the results from diff erent countries and to improve the quality of our activities through collaboration. Fortunately, there is considerable interest in and enthusiasm for collaboration among avian biologists and this is evident from the number of diverse researchers from diff erent organisa-tions in diff erent countries that have contributed to the body of work presented in this thesis. This has enabled the use of state-of-the-art modelling techniques to address comparative questions about the relative contributions of diff erent envi-ronmental parameters to avian community composition that have not been ad-dressed before as well as application of state-of-the-art technology to tracking Starlings on a southern Jutland dairy farm to generate novel and insightful data on habitat use. Such collaboration takes time to build trust and working relationships, but also creates networks of cooperation that endure, supporting future continua-tion of such team work and innovation. There also remains much to be done, not least in being more strategic about how citizen science networks can be stimulat-ed, supported and grown most eff ectively. Although this thesis represents a major step forward, there remains much to be done in terms of eff ectively setting out an aspirational programme about where to take avian citizen science in the immedi-ate future.

16 PhD thesis by Henning Heldbjerg
List of manuscripts
Paper 1:Heldbjerg, H., Fox, A.D. & Vikstrøm, T. Submitted. How can we improve future citi-zen science based bird monitoring in Denmark? Submitted, as a commentary for Dansk Orn. Foren. Tidsskr.
Paper 2:Heldbjerg, H., Sunde, P. & Fox, A.D. 2017. Continuous population declines for spe-cialist farmland birds 1987-2014 in Denmark indicates no halt in biodiversity loss in agricultural habitats. Bird Conservation International. https://doi.org/10.1017/S0959270916000654
Paper 3:Heldbjerg, H. & Fox A.D. 2016. Regional trends amongst Danish specialist farmland breeding birds. Dansk Orn. Foren. Tidsskr. 110: 214-222.
Paper 4:Heldbjerg, H., Fox, A.D., Levin, G., Nyegaard, T. 2016. The decline of the Starling Sturnus vulgaris in Denmark is related to changes in grassland extent and intensity of cattle grazing. Agriculture, Ecosystems & Environment 230: 24 – 31.
Paper 5:Heldbjerg H., Fox A.D., Thellesen P.V., Dalby L. & Sunde P. 2017. Common Starlings (Sturnus vulgaris) increasingly select for grazed areas with increasing distance-to-nest. PLoS ONE 12(8): e0182504. https://doi.org/10.1371/journal.pone.0182504
Paper 6:Lehikoinen, A., Foppen, R.P.B., Heldbjerg, H., Lindström, Å., van Manen, W., Piirainen, S., van Turnhout, C.A.M. & Butchart, S.H.M. 2016. Large-scale climatic drivers of re-gional winter bird population trends. Diversity and Distributions 22: 1163–1173.
Paper 7:Bowler, D.E., Heldbjerg, H., Fox, A.D, O’Hara, R., Böhning-Gaese, K. Submitted. Dis-entangling the eff ects of multiple environmental drivers on population changes within communities. Submitted Journal of Animal Ecology.
Paper 8:Kamp, J., Oppel, S., Heldbjerg, H. Nyegaard, T. & Donald, P. F. 2016. Unstructured citizen science data fail to detect long-term population declines of common birds in Denmark. Diversity and Distributions 22: 1024-1035.
Paper 9:Fox, A.D., Heldbjerg, H. & Nyegaard, T. 2015. Invasive alien birds in Denmark. Dansk Orn. Foren. Tidsskr. 109: 193-205.

17PhD thesis by Henning Heldbjerg
Henning Heldbjerg’s own contribution to papers in the PhD thesis Citizen Science Based Bird Population Studies.
Additional papers co-authored during the Ph.D. period:
Kahlert, J., Fox, A. D., Heldbjerg, H., Asferg, T. & Sunde, P. 2015. Functional responses of hu-man hunters to their prey – why harvest statistics may not always refl ect changes in prey population abundance. – Wildlife Biology 21(6):294-302.
Schlaich, A.E., Bouten W., Bretagnolle V., Heldbjerg H., Klaassen R.H.G., Sørensen I.H., Villers A., Both C. 2017. A circannual perspective on daily and total fl ight distances in a long-distance migratory raptor, the Montagu’s harrier Circus pygargus. Biol. Lett. 20170073. http://dx.doi.org/10.1098/rsbl.2017.0073
Stephens, P.A., Mason, L.R., Green, R E., Gregory, R.D., Sauer, J.R., Alison,J., Aunins,A., Brotons,L., Butchart, S.H.M., Campedelli,T., Chodkiewicz,T., Chylarecki,P., Crowe,O., Elts,J., Escandell,V., Foppen, R.P.B., Heldbjerg, H., Herrando, S., Husby, M., Jiguet, F., Lehikoinen, A., Lindström, Å., Noble, D.G., Paquet, J.-Y., Reif, J., Sattler, T., Szép, T., Teufelbauer, N., Traut-mann, S., van Strien, A.J., van Turnhout, C.A.M., Vorisek, P., Willis, S.G. 2016. Consistent re-sponse of bird populations to climate change on two continents. – Science 352:84–87.
Sørensen, I.H., Schlaich, A.E., Klaassen, R.H.G., Heldbjerg, H., Koks, B.J. (2017). Rare case of an adult male Montagu’s Harrier Circus pygargus over-summering in West Africa, as revealed by GPS tracking. - Journal of Ornithology 158: 753-760. doi:10.1007/s10336-017-1445-8
Paper Status Research phase Writing phase
Major Proportional Minor Major Proportional Minor
Paper 1 Submitted x x
Paper 2 Published x x
Paper 3 Published x x
Paper 4 Published x x
Paper 5 Published x x
Paper 6 Published x x
Paper 7 Submitted x x
Paper 8 Published x x
Paper 9 Published x x


Manuscript
Henning Heldbjerg, Anthony D. Fox and Thomas Vikstrøm
PAPER 1
HOW CAN WE IMPROVE FUTURE CITIZEN SCIENCE BASED BIRD MONITORING IN DENMARK ?
Photo: Henning Heldbjerg


21PhD thesis by Henning Heldbjerg
HOW CAN WE IMPROVE FUTURE CITIZEN SCIENCE BASED BIRD MONITORING IN DENMARK?
Henning Heldbjerg, Anthony D. Fox and Thomas Vikstrøm
Abstract
Citizen science has become an indispensable means of obtaining the information necessary for main-taining bird monitoring programmes. The aim of this paper is to inspire creative thought and discus-sion among the ornithological community, scientists and decision makers in Denmark to improve the quality and extent of breeding bird monitoring in Denmark. We review the past and present status of monitoring programmes in Denmark and use this information as a basis for discussing how we could best improve citizen science based bird population programmes in Denmark in the future. We undertake a gap analysis to establish some immediate priority areas for attention. In particular, we argue for initiating programmes that deliver information on demography parameters such as survival, reproduction, immigration and emigration to better interpret overall trends in abundance. We suggest combining data from different monitoring programmes to develop the possibilities for the integrated analyses of population counts and demographic data within population models. This will enable a bet-ter understanding of the demographic processes driving population changes and contribute to more effective management and conservation of key species in the future.

22 PhD thesis by Henning Heldbjerg
Introduction
There is a long tradition of monitoring bird abundance and distribution in Denmark and neighbouring coun-tries. This monitoring has become highly dependent on the commitment, interest and willingness of volunteers to participate and contribute. This commentary aims to describe the existing extent of citizen science based bird population monitoring and to build on what has been done in the past and in recent years to stimulate debate about how this can be better maintained and improved to secure a major contribution to avian research and conservation within Denmark in the future. It also con-cludes by undertaking a gap analysis to establish some immediate priority areas for attention in the future.
One major objective of this exercise was to establish an exhaustive annotated list of all breeding species record-ed in Denmark to quantify the degree to which each of these species is covered by the various existing moni-toring programmes to elucidate which species currently suffer inadequate coverage and recommend where we need to set additional focus in the years to come.
The aim is not to come with a defi nitive list of what to do next, but rather to inspire creative thought and dis-cussion among the ornithological community, scientists and decision makers in Denmark to improve the quality and extent of breeding bird monitoring in Denmark for the benefi t of future generations.
Defi nitionsCitizen science has been defi ned as ‘projects, where volunteers partner with scientists to answer real-world questions’ (www.birds.cornell.edu) and such public participation is now heavily involved in environmental research and monitoring across the world. Monitoring focuses on changes in state. It usually compares meas-urements at different places and times with re-meas-urements as a key part of a monitoring programme. In population monitoring, the intent is usually to detect a population trend and the rate at which change is occur-ring (i.e. whether a population is stable, decreasing or increasing, and whether that change is slowing or accel-erating). The target may be a population of a single spe-cies, populations of numbers of species, or composition of selected ecosystems (Greene 2012). Such work is most successful where there is a strong partnership between the amateurs and the professionals, based on their com-plementary roles (Greenwood 2007).
Why do we need citizen science?In the nature conservation world, citizen science has be-come an indispensable means of obtaining extensive in-
formation on very broad scales; in the absence of profes-sional networks to supply environmental data, it forms the basis for governmental decision-making processes and policy development. It is also important for sup-porting the development of policy, prioritisation and work programmes within the NGO sector. For exam-ple, it has become vital in many practical ways in sup-porting the conservation of avian species, management of sites and regulation of hunting. Citizen science has become the accepted means of generating crucial data on bird population sizes and rate of change to fulfi l the requirements of national and international legislations and agreements, such as the European Union Birds and Habitats Directives and establishing population sizes for site designation under the Ramsar Convention based on their support of 1% of fl yway populations. By virtue of the existing extensive networks of volunteers coor-dinated by relatively few professionals, citizen science has become absolutely indispensable to perform sur-veys undertaken at a variety of spatial scales (from the site level to covering whole continents) driven by highly competent and motivated but ultimately volunteer par-ticipants.
The participation of such large numbers of volunteers generates information that would otherwise be impos-sible to derive (Greenwood 2007). This relates to a) the logistics of carrying out surveys at very large numbers of sites over short time periods, b) maintenance of long time series based on similar effort every year and c) the fi nancial cost because employing professionals to gather comparable data (even if logistically possible) would in-fl ate total budgets to levels rendering them impossible to perform.
However, we must never forget that major contribu-tions from citizen science also arise as a result of proj-ects coordinated by individuals or groups of dedicated birdwatchers that over time become specialists in their target species or habitats. Such studies may either result directly in scientifi c publications with or without the co-ordination or help of professionals (e.g. Thellesen 2017; Østergaard 2017) or create a substantial foundation of knowledge and expertise upon which to facilitate fur-ther studies (e.g. Heldbjerg et al. 2017).
Citizen science in Denmark in the past
Before the formal creation of research establishments and centres of learning, all human curiosity relating to our environment could have been considered to con-stitute a form of “citizen science”! “Ordinary” people, receiving no fi nancial or commercial gain from their

23PhD thesis by Henning Heldbjerg
endeavours, driven by pure curiosity and their fascina-tion for birds in their immediate surroundings contrib-uted to the very fi rst citizen science activities relating to birds in Denmark. When Hans Christian Cornelius Mortensen started ringing Starlings Sturnus vulgaris to fi nd whether the same birds returned to his nest box-es each year and understand where they travelled in winter, he was amongst the earliest and most famous to make contributions to Danish citizen science (Preuss 1997). The fi rst truly national Danish monitoring project covering the entire country was a site-based survey of the most important bird areas, initiated in 1960 by DOF-Birdlife Denmark (Dansk Ornitologisk Forening (DOF)), the results of which were published in 1971 (Ferdinand 1971). This and similar repeat surveys were undertaken in 1960-71, 1978-81, 1993-96 and 2003-13 (Flensted & Vikstrøm 2006; Vikstrøm et al. 2015). From the mid-1960s to mid-1970s, various DOF volunteer groups un-dertook surveys of different bird groups (e.g. rare spe-cies, raptors and waders; see Møller 2006). During the same period, the fi rst national mid-winter monitoring of migratory waterbirds was undertaken in a joint project coordinating professionals (undertaking aerial survey from aircraft) with large numbers of volunteers under-taking land-based counts (Joensen 1974). This was re-peated again in 1987-1992 and 2000 (Petersen et al. 2006) and as part of the National Monitoring and Assessment Programme for the Aquatic and Terrestrial Environ-ments (NOVANA) in 2004, 2008 and 2013 (Holm et al. 2016), with monitoring at reduced coverage in many of the intervening years. Monitoring of wintering geese and swans was included annually since 1981 and 1992, respectively (Holm et al. 2016).
The fi rst initiative to map the distribution of all Dan-ish breeding birds was the fi rst DOF atlas undertaken in 1971-1974, involving 745 volunteers (Dybbro 1976). The second DOF Atlas was undertaken in 1993-1996, by then involving 750 participants, which included an attempt at estimating relative breeding bird densities of the common species (Grell 1998). A subsequent spe-cialist survey attempted to determine breeding birds of small rural biotopes in Denmark (Meltofte et al. 2009). In May 2002, the Danish national bird reporting portal DOFbasen went online (Nyegaard et al. 2012), that built upon some prior initiatives taken by some of the local branches of DOF. The aim of this data portal website www.dofbasen.dk was to facilitate online reporting of all bird observations from any part of the country throughout the year.
The regular annual monitoring of the relative abun-dance of common birds in Denmark (“Common Birds Monitoring”), is based on observers sampling local avi-an abundance by undertaking mapped and timed point counts in the fi eld. Initiated in the winter of 1975-1976 for
wintering birds and in 1976 for breeding birds (Møller 2006), these are now among the oldest bird monitoring programmes in Europe (Heldbjerg et al. 2015). This an-nual survey has now provided population indices for all common birds for more than 40 years and as well as being a vital measure of the health of Danish birds that has contributed to numerous signifi cant research pro-jects (e.g. Fox 2004, Heldbjerg et al 2016, Lehikoinen et al. 2016).
Additional intensive site-based monitoring (performed by professional ornithologists) at fi eld stations was es-tablished by different governmental departments be-tween the 1930s and 1980s at some of the most important breeding and staging areas for waterbirds in Denmark, namely at Vejlerne, Tipperne, Vorsø and Langli, with monitoring of migrant passerines undertaken on Chris-tiansø (Lyngs 2006). These programmes were all closed down (or activities signifi cantly reduced) in the 1990s. These stations undoubtedly provided valuable annu-ally reported results that cannot be replaced at present, but the major costs of supporting these potentially very signifi cant programmes failed to guarantee their conti-nuity. The lesson to be learned here might be that very ambitious (and thus costly) programmes may suffer a higher risk of failing to last for longer periods, which seems to contrast the apparent robustness of the rather simpler but nevertheless successful and so far persistent citizen science surveys.
Present citizen science in Denmark The Danish Ministry of Environment and Food has ob-ligations under international conventions and interna-tional (e.g. EU) law to report on the status of key species and habitats, including birds. To meet these reporting responsibilities, existing monitoring programmes are de-signed to fulfi l commitments, for example, to the Europe-an Commission under the Birds and Habitats Directives, based around NOVANA (Miljøstyrelsen et al. 2017).
In addition, there is also considerable interest among the general public, as well as among the various relevant NGO’s, to know more about the status and trends of Danish breeding birds that are not necessarily the focus of international requirements.
Currently, most Danish bird monitoring projects are organised and run by DOF-Birdlife Denmark (DOF) and/or the Department of Bioscience, Kalø, Aarhus University. Some, such as NOVANA and the CBM, are run as partnerships, fi nanced to varying degrees by The Ministry of Environment and Food. Other projects are fi nanced by private charity foundations, such as the At-las programme (which was supported by the Aage V Jensen Foundation). In recent years, many monitoring

24 PhD thesis by Henning Heldbjerg
programmes remain ongoing (DOFbasen, CBM, Mid-winter counts) or are being periodically repeated (Atlas III; 2014-2017; Table 1).
Monitoring speciesThere is an undoubtedly pressing and continuing need for monitoring of species and habitats if we are ever to maintain and improve upon current levels of biodiver-sity in Denmark. This requires knowledge of the state of species and habitats and the effects of implemented local (i.e. site based) and national initiatives and action plans (Miljøstyrelsen et al. 2017). Species monitoring aims to track changes in distribution as well as abun-dance, from the local up to the national and international levels, since national schemes also need to feed into an international perspective, in order to differentiate local changes in distribution and abundance from patterns at the population fl yway level as well as generating fl yway population estimates.
Denmark has initiated systematic monitoring of habitats and species included in the Habitats and Birds Directives through the launch of the NOVANA (Holm et al. 2016).
The main objective of this was to monitor population size and distribution of breeding birds and regularly occur-ring migratory bird species following Article 4.2 of the Birds Directive. Since 2004, the Mid-winter counts are also (after a period when we lacked such monitoring) part of this monitoring framework (Holm et al. 2016).
Annually monitoring of abundance
Knowledge about the year-to-year relative abundance of avian species is obtained by different monitoring programmes depending on the species, for example, how numerous it is, how secretive it is and when it is active during the day. So, for instance, Common Birds Monitoring data are gathered in winter and during the breeding period by 300 volunteers to generate samples of relative abundance and contribute to the estimation of annual indices for 80-110 species, which are reported annually (Moshøj et al. 2017).
At the other end of the abundance scale, more focussed and intense monitoring is required to generate nation-al trends for rare and scarce breeding birds. For many years, DOF maintained a programme for Threatened
Table 1. Overview of the most signifi cant citizen science national monitoring projects for birds undertaken in Denmark during 1960-2017.Oversigt over de mest betydningsfulde, frivilligt baserede, nationale fugleovervågningsprojekter i Danmark i perioden 1960-2017.
Project Projekt
First yearFørste år
Last yearSidste år
PublicationPublikation
(No English title); Større danske fuglelokaliteter 1960 1971 Ferdinand 1971
(No English title); Fuglene i landskabet 1960 1977 Ferdinand 1980
Mid-winter monitoring of staging waterfowl; Midvintertællinger
1965 1973 Joensen 1974
Atlas I: (No English title); De danske ynglefugles udbredelse 1971 1974 Dybbro 1976
Common Bird Monitoring, winter; Punkttællinger, vinter 1975/1976 Ongoing Moshøj et al. 2017
Common Bird Monitoring, breeding; Punkttællinger, ynglefugle
1976 Ongoing Moshøj et al. 2017
Rare and threatened breeding birds in Denmark 1976 1991 Sørensen 1995
(No English title); Status for danske fuglelokaliteter 1978 1981 Dybbro 1985
Mid-winter waterbirds in Denmark; Midvintertællinger 1987 1992 Petersen et al. 2006
Atlas II: (No English title); Fuglenes Danmark 1993 1996 Grell 1998
(No English title); Fuglenes Danmark: Fuglelokaliteterne i Nordjyllands (etc.) Amt
1993 1996 Various authors 1997-1999
DATSY - Rare and threatened breeding birds in Denmark; DATSY - Truede og sjældne ynglefugle
1998 2012 Grell et al. 2004; Nyegaard et al. 2014
Mid-winter waterbirds in Denmark; Midvintertællinger 2000 2000 Petersen et al. 2006
DOFbasen (www.dofbasen.dk); www.dofbasen.dk 2002 Ongoing Nyegaard et al. 2012
IBA Caretaker project; Status og udviklingstendenser for Danmarks internationalt vigtige fugleområder
2003 2013 Vikstrøm et al. 2015
Mid-winter counts; Midvintertællinger 2004 Ongoing Holm et al. 2016
Birds in Danish gardens in winter; Den Store Vinterfugle-tælling
2007 2011 Meltofte & Larsen 2015
Atlas III; Atlas III 2014 2017 Levinsky 2016

25PhD thesis by Henning Heldbjerg
and Rare Breeding Birds, known as DATSY, to generate annual population estimates for such species (Grell et al. 2004; Nyegaard et al. 2014; Table 1). The programme connected birdwatchers with interest in one or more of these rare breeding birds and their joint efforts have pro-vided improved estimates of abundance and a mecha-nism for assessing changes in the size of national pop-ulations. Initially this programme was funded by the Aage V Jensen Foundation (Flensted & Vikstrøm 2006) and later as part of the ‘agreement between DOF and MoE’ (Nyegaard 2016). From 2013 onwards, this group of birds has only been covered for some of those listed on Annex 1 of the Birds Directive and from 2018 only on sites designated for those species (Miljøstyrelsen et al. 2017). As a result of these changes, we will no longer be able to produce reliable annual population estimates and trends for any of these species excepting White-tailed Eagle Haliaeetus albicilla, Montagu’s Harrier Cir-cus pygargus, Golden Eagle Aquila chrysaetos and Osprey Pandion haliaetus for which there exist specifi c citizen science monitoring programmes organised within DOF.
Regular but less than annually NOVANA monitoring
With the exception of Cormorant Phalacrocorax carbo, which is monitored in detail by annual nest counts (Bregnballe & Nitschke 2017), the monitoring of coastal and colonial breeding birds is restricted to those species listed on Annex 1 in the Birds Directive and only at the sites designated for a given species. The aim of these programmes is to monitor and document the status and trend of the distribution and abundance of the listed species (Miljøstyrelsen et al. 2017). However, this moni-toring is maintained through a rolling plan on a 6 years cycle, alternating between species from year to year, monitoring a given species every two or three years and for some species including national coverage (including areas outside sites designated for the Annex 1 species) once in every 6 years period. This is relevant for 36 of the breeding birds listed on Annex 1 that are part of the so-called ‘Intensive 1 monitoring of breeding birds’ (Ap-pendix 1; Miljøstyrelsen et al. 2017). The monitoring is largely undertaken by staff at the Environmental Protec-tion Agency and consultants paid for the purpose.
The rest of the breeding birds listed on Annex 1 (11 spe-cies) comprise part of the ‘Intensive 2 monitoring of breeding birds’: Black Stork Ciconia nigra, White Stork Ciconia ciconia, White-tailed Eagle, Montagu’s Harrier, Golden Eagle, Osprey, Peregrine Falco peregrinus, Medi-terranean Gull Larus melanocephalus, Short-eared Owl, Asio fl ammeus, Boreal Owl Aegolius funereus, Tawny Pipit Anthus campestris, (Appendix 1). These species are moni-tored based on quality assured data derived from DOF/DOFbasen, i.e. entirely based on citizen science records (Holm & Søgaard 2017).
Distribution
Avian distribution has traditionally been described via the Danish atlas surveys performed to date every c. 20 years. The 3rd breeding bird atlas (based on fi eldwork in 2014-17) is ongoing, generating comparable data us-ing the same methods to the two previous atlases which mapped the distribution of all Danish breeding birds. The current project includes a new initiative to estimate both relative and absolute bird densities in both win-ter and during the breeding season, based on line tran-sects with distance bands. This is expected to provide improved and reliable national population estimates for c. 30 (winter) and 45 (breeding) species (Levinsky 2016).
DOFbasen has become an important tool for hosting vast numbers of casual (i.e. unsystematically compiled) avian records. The numbers of sites, observers and re-cords have increased every year until 2016 when contri-butions seem to have stabilized at c. 1.5 million records contributed by c. 2400 observers from c. 14000 sites an-nually. The unsystematic nature of the data restricts the use and interpretation of such data, although complete lists of timed visits are encouraged and are potentially far more valuable that casual incomplete records (Kamp et al. 2016). Nevertheless, the vast number of records accumulated provides another valuable source of in-formation on avian abundance and distribution all year round.
Monitoring sitesInternational legislation also obliges Denmark (as other nations) to monitor the most important sites for biodi-versity, which are statutorily protected for their birds under the cohesive network of NATURA 2000 protected areas throughout the EU. Two typical types of NATU-RA 2000 sites are scheduled for birds, breeding areas for scarce breeding species that are listed on Annex 1 of the Birds Directive and those sites of international importance for their wintering, staging and breeding species. The Danish Environmental Protection Agency is responsible for reporting the status and trends at the NATURA 2000 sites to EU. Municipalities, large land owners and NGO’s such as the Bird Protection Fund (which works closely with DOF) also share an interest in tracking changes in biodiversity at the sites by moni-toring different organism groups.
Government requires site quality monitoring and bird numbers are an attribute of this. Site-based knowledge is also relevant for understanding whether the decline of a given species refl ects a fl yway decline rather than degradation in local site quality. This underlines the need to describe changes in distribution and abundance at fl yway level and the importance of differentiating contributions from local changes to site quality with

26 PhD thesis by Henning Heldbjerg
changes in regional and global distribution and abun-dance at larger spatial scales. If declines are the result of reductions in site quality, such local site monitoring can also be used to test whether sympathetic site manage-ment also has a benefi cial effect on restoring numbers. Thus, a cohesive integrated site-based monitoring forms the basis for contributing to management and conserva-tion at both the site and fl yway levels.
DOFs Important Bird Area (IBA) “Caretaker” pro-ject was almost exclusively based upon citizen science monitoring to provide detailed knowledge on avian abundance at the most important bird sites in Denmark. The focus was primarily on those species for which any given site was designated under the Birds Directive. This work was funded by the Aage V Jensen Founda-tion during 2003-2013 (Vikstrøm et al. 2015) but has presently no funding or dedicated platform. Currently 130 IBAs regularly support more than 1% of the fl yway population of a species or are judged by other criteria to be of international importance to one or more species of breeding, staging or migrating birds under this pro-gramme (Vikstrøm et al. 2015).
DOF ”Caretakers” are often involved in actively manag-ing the sites to benefi t the birds and nature conservation interest and enhance the visitor experience for the pub-lic visiting such sites. They also help in communicating the value of the sites by leading fi eld trips into areas, maintaining websites etc. Finally, they support govern-mental bodies, the wider community and landowners to protect sites and the organisms they support by raising awareness of the environmental pressures acting upon and damaging the sites.
As part of the NOVANA monitoring programme, the important bird areas, Wadden Sea, Tøndermarsken, Fjords in West Jutland and Vejlerne are also monitored (Holm et al. 2016). This work includes coverage of the breeding birds in these areas and is mainly done by con-sultants with little or no citizen science involvement.
Parameters relevant for distribution and abundance
Population parameters
The basic objectives for monitoring any species are to establish their distribution (where is a given species?), phenology (when is a species at a given site?) and abun-dance (how many are there?). While information on distributions is mainly obtained by the Atlas surveys and abundance by the Common Bird Monitoring and Mid-winter counts, DOFbasen provides information on
the phenology at any one site, all year round from very many sites. The disadvantage of the latter is that data are not systematically collected and observers typically only provide presence data but not absence data, which makes it much more diffi cult, if not impossible, to esti-mate the changes over time and the variation between areas (Kamp et al. 2016). However, it is possible and encouraged within DOFbasen to indicate if you have entered data on all registered species and thus use so-called ‘timed full lists’ to overcome this problem.
Understanding factors aff ecting distribution and abundance
For a number of species we are witnessing considerable changes in distribution and/or abundance over time. The reasons for these changes can relate to factors such as climate and land use changes and other human effects (e.g. hunting or disturbances) as well as a consequence of changes in other species’ populations. The changes in distribution and abundance are obviously important for statutory agencies and NGOs charged with protecting and maintaining distributions and abundances of spe-cies under international legislation and interests of their members. However, to target appropriate management strategies, we require more than just information on numbers and distribution, and we need to see if changes relate to reduced reproductive success or survival, be-cause causal factors may be manifest at different times in the annual cycle and therefore in different geographi-cal areas. It is therefore equally important to understand the mechanisms behind the observed changes in order to implement effective management to restore declin-ing populations. In the end, there may be good value for money gained from converting knowledge (i.e. about species increasing or decreasing) into targeted manage-ment actions. Obviously if you do not know where or when the key factors causing population decline occur, you will be unable to focus your actions, a very power-ful reason for tracking demographic measures simulta-neously with population trajectories.
Demographical parametersFor any population, changes in abundance and/or dis-tribution arise from changes in demography, i.e. surviv-al, reproductive success, emigration or immigration, as well as changes in sex ratio. A proportion of all birds will die every year, with some annual variation in this rate. Survival rate is often lower for the birds in year(s) before maturity and such changes may be largely confi ned to only one age class. If the survival rate increases or de-creases in any of the age classes, it will inevitably have consequences for the population size. Since many small-bodied birds are relatively short-lived, annual changes in population size are highly dependent on the relative

27PhD thesis by Henning Heldbjerg
production of a large number of fl edglings. Such popula-tions need to produce suffi cient young to replace annual numbers dying or the population declines. In contrast, many long-lived birds are more susceptible to change in adult survival. This is especially the case among hunt-able species, where shooting mortality may be additive (rather than compensatory, where hunters remove a harvestable surplus of individuals which would have died of other causes anyway) to natural mortality mak-ing them sensitive to immediate reductions in popula-tion size as a result of an increase in harvest.
For all species, however, even greater insights into the process limiting reproductive success may be derived from understanding the steps faced by birds along the route to successfully produce suffi cient young to in-dependence (Newton 2014). These include: age of fi rst breeding and breeding propensity throughout adult life, the number of eggs laid, the proportion of the eggs that hatch, the number of hatchlings that fl edge and the number of clutches laid per season. Such parameters can be derived for the commoner species through nest re-cording schemes and such data can be derived from citi-zen science networks given proper encouragement and training to observers to ensure minimum levels of dis-turbance associated with such data gathering activities.
With detailed and focused studies, like CES (Constant Effort Site ringing) it is possible to estimate the annual production of a given species and over time, generate estimates of survival. For other species, similar informa-tion can be obtained from studying plumage characters on wings from hunted species (see below).
For a few species, it is only possible to estimate the an-nual production of young outside the breeding season. Some goose species like the Dark-Bellied Brent Goose Branta bernicla bernicla can be aged during the winter where they spend the winter in family groups at the staging sites. This gives the opportunity to estimate the annual ratio between young and adult birds several thousand kilometres away from the breeding grounds and to identify the often complex and interacting driv-ers of change in reproductive success linked to Arctic lemming and predator populations (Nolet et al. 2013).
There can be many explanations for changes in the de-mographical parameters of avian populations over time, such as climate change, changes in land use (crops, agri-cultural treatment), other human (hunting, disturbance) and biological effects (competition, predation, parasite level etc.). Population models can help reveal to what degree different parameters affect avian abundance (e.g. Bowler et al. submitted) and how demographic fac-tors contribute to annual rates of change in population size, including immigration/emigration rates at the site
level (Weegman et al. 2016). Such insights can help us understand where and when to look for limiting and regulating factors in the environment. Such knowledge is a powerful tool for guiding policy and management actions.
Other methods to describe the demo-graphic parametersThere are other measures for providing insight to the demographical parameters.
Ringing
Bird ringing recoveries not only enlighten us about their migration (e.g. Lyngs 2003, Bønløkke et al. 2006, Ham-mer et al. 2014) but also play a vital role in identifying changes in demographical parameters.
Ringing can provide crucial information on annual pro-duction, survival and dispersal. Changes in any of these parameters will inevitably contribute to changes in de-mography. Modern ringing schemes emphasise system-atic and structured capture and recapture of birds to maximise the return on investment. Such an approach enables estimation of the annual productivity based on age determination ratios among individuals in the catch, following sets of pre-agreed plumage character-istics followed by citizen science contributors and sur-vival from relative contributions of young to adults in the catch sample and from the probabilities of recapture respectively. Constant Effort Site ringing (CES) gener-ates annual estimates of productivity and survival. This was started in Denmark in 2004 and by 2015 consisted of fi ve contributing ringing sites (Knudsen 2015, Ettrup 2016, Ettrup & Madsen in press). A similar Retrapping Adults for Survival project (RAS), launched by the BTO in the UK was designed to estimate annual adult sur-vival rates (as in the case of hirundines, Robinson et al. 2008) and has yet to be introduced in Denmark. Al-though the capture and marking of birds is restricted to ringers, for many species (e.g. gulls and geese) the reading of conspicuous markers on birds in the fi eld are reliant on networks of amateur enthusiasts. Traditional rings fi tted to birds are made of steel or aluminium and bear a return address and a unique code which is usu-ally only possible to read if the bird is caught or found dead. Colour rings and other more conspicuous individ-ual marks gives the opportunity to determine the iden-tity of an individual at a distance with certainty without the need to catch it, making such schemes important for their contribution to survival and other studies.
Recent high-technology developments have produced GPS-loggers that can be deployed on birds, which have enabled extremely detailed information on geographi-

28 PhD thesis by Henning Heldbjerg
cal positions, altitude, speed and behaviour, often with additional data, to be downloadable directly to the com-puter. Such devices provide new possibilities to study wildlife but size of device still limits the species that can be studied due to the size/weight of the loggers rela-tive to bird size, as well as equipment costs. So far, these are so costly and require such special technical skills, so they remain in the realm of citizen science/professional partnerships (Heldbjerg et al. 2017).
Hunting
Hunters are also in a unique position to contribute valu-able monitoring data, which are otherwise diffi cult or impossible to derive. The willingness of hunters to par-ticipate as citizen scientists can contribute valuable in-formation, especially new knowledge on demographic parameters of quarry species. The most fundamental and important contribution is the simple reporting of annual numbers of individuals brought down per species (ul-timately to generate local, regional and national annual hunting harvest data). However, the determination of an-nual sex and age class contributions to the overall popu-lation by the submission of wings from hunter shot birds and the reporting of shot birds bearing unique markings.
In Denmark, hunting is restricted to species for which there is good scientifi c evidence that population can withstand current levels of hunting pressure without diminishing population size, often described as ‘sus-tainable hunting’. Such species are subject to legislative scientifi c review every four years. In order to be able to provide such confi rmation for a given species, funda-mental knowledge about the species’ demography is essential. In Denmark, there has been a very long his-tory, extending back to 1941, of requiring hunters to re-port hunting bags for all quarry species (Christensen et al. 2013). All Danish hunters are obliged to report the sizes and species composition of their annual harvest, which generates annual data on the size of the kill for all huntable species. Although changes in these param-eters may potentially provide proxies for changes in population sizes, such relationships are complicated by changes in hunting season length, hunter effort and self-regulation applied by hunters themselves in the face of increasingly rare prey (Kahlert et al. 2015). The Danish Wing Survey, that is an important part of the Danish hunting bag statistics, was started in 1970 with a study on Woodcocks Scolopax rusticola (Clausager 1973). In the 1980s, the survey was extended to also include ducks and wading birds, and later still, geese and gulls were also included (Bioscience 2017a). The wing survey is based on voluntary contributions from hunters, result-ing in more than 13,000 wings annually providing infor-mation on the annual variation in sex ratio and age ratio (e.g. Christensen & Fox 2014).
Considerations for the future citizen science on birds in Denmark
When discussing how to improve existing avian moni-toring in Denmark we must be aware that bird popula-tions may be limited at any time of the year and that mi-gratory species only occur in Denmark at certain times of the year. For this reason, it makes sense to treat peri-ods in the annual cycle separately, based on the seasons, i.e. breeding, winter and migration.
Millions of migrating birds pass through Denmark eve-ry spring and autumn. Systematic monitoring of this fascinating phenomenon can provide information on relative abundance and annual productivity at fl yway levels. Migrants include many species that are only in Denmark for a short period and with a high turnover. The important sites for staging migrants are not neces-sarily the same as for breeding birds or wintering birds and the monitoring therefore must be coordinated with respect to other parts of the EU Birds Directive (article 4 stk. 2; Miljøstyrelsen et al. 2017). Although Denmark is clearly globally signifi cant for the large numbers of passing and staging bird numbers, for the scope of this analysis, the discussion about the future activities in this paper is limited to considering citizen science based bird monitoring of Denmark’s breeding and wintering birds.
Large numbers of individuals of many bird species occur in Denmark during winter. Monitoring results provides information on the variation in abundance and distribu-tion and contributes to understanding what impact the variation in weather (temperature, precipitation, snow cower) or the fruit mast production has on the move-ments and winter quarter choice for the different spe-cies (Fox et al. 2009, Lindén et al. 2011). Our knowledge about the variation in winter bird distributions could be further improved by initiating a dedicated winter bird atlas, comparable to those in other countries (e.g. UK (Balmer et al. 2013) and Catalonia (Herrando et al. 2011)). Monitoring during winter could potentially also involve thousands of citizen science observers in proj-ects like “Feeder watch”, where people not necessarily very interested in birds report bird abundance on their garden feeders. Such schemes provide detailed informa-tion on the variations in abundance and distribution of winter birds and involve citizen scientists not normally involved with environmental monitoring. As such, such schemes can provide an important recruitment func-tion to broaden the interest of observers in the natural world and potentially to make further contributions to bird or biodiversity monitoring. Such schemes now exist in many countries but not in Denmark at present. Although it may appear to be on the periphery of stan-dard monitoring, such schemes still have the potential to offer supplementary information to more mainstream

29PhD thesis by Henning Heldbjerg
monitoring mechanisms. For instance, “Feeder watch” turned out to be the key monitoring mechanism to fol-low the spread of the infectious disease Trichomonosis due to the protozoan parasite Trichomonas gallinae (Rob-inson et al. 2010).
Furthermore, for many of the northernmost of breeding birds, such as many species of ducks and geese, accurate assessment of total population size is only possible when aggregated on their relatively restricted wintering areas, compared to their very low breeding densities over vast areas in summer. This period is also critical in their an-nual life cycle for survival between breeding periods and site based data also provides vital insight upon which to base the construction of site safeguard networks to pro-tect vital habitat outside of the breeding season.
One dilemma we face in considering potential improve-ments to the monitoring of breeding birds and win-tering birds in Denmark, is that there are two obvious ways to go. One could pursue a quantitative approach, where we seek to include as many species as possible, or a qualitative approach where we try to include collec-tion of demographical parameters for a limited number of selected species. Either way, we must be aware that no matter how many species we monitor we can only understand the key drivers behind population changes if we include demography parameters, so preferably, we should attempt to embrace both approaches.
The following section will focus on monitoring of breed-ing birds and on the quantitative approach, because the detailed knowledge that exists for many species that are breeding in Denmark and their population size makes it possible to undertake a gap analysis to describe which species are not covered by existing monitoring pro-grammes. Wintering birds and the qualitative approach are only described in broad terms below.
A gap analysis of the monitoring of breeding birds in DenmarkIn order to provide a framework for effective avian monitoring of breeding birds in Denmark in the future, we need to analyse how well we monitor changes in avi-an population abundance and distribution now. Such an attempt was performed by DOF’s Scientifi c Committee in 2000 (Thorup et al. 2000) but the challenge to review and update our needs remains just as relevant today.
Do we obtain adequate monitoring data on changes in annual population size for all bird species in Denmark?
The breeding period results in rapid population level changes in a relatively short period from its annual low-
est to its highest level, representing the only part of the annual cycle when population numbers increase. Poor reproduction constrains the population to remain at a low level until the next reproductive period. For this reason, attention is focussed upon this vital part of the annual cycle during a period when the breeding birds are confi ned to the breeding range.
To identify those breeding species that are insuffi ciently monitored to provide reliable annual population esti-mates and trends at present, we undertook a gap analy-sis, covering all species that have ever bred regularly in Denmark (227 species; Appendix 1). In order to focus only on those which are ‘Regular’ breeding species at present, all ‘Regionally extinct’ species (9 species) and ‘Occasional’ breeding birds (24) were excluded. In addi-tion, we chose to exclude all introduced/invasive alien breeding alien species (Canada Goose Branta canaden-sis, Egyptian Goose Alopochen aegyptiaca, Pheasant Pha-sianus colchicus and Rock Dove Columba livia).
Species that have bred in ten consecutive years over any given time period in Denmark are considered ‘Regular’ breeding birds, including those assigned to the Danish Red List (Bioscience 2017b). Since the last version from 2009, four species, Whooper Swan Cygnus cygnus, Medi-terranean Gull, Golden Eagle and Boreal Owl were add-ed as recent regular breeding birds (Knud Flensted, pers comm). The status for each species has been updated until 2017, including records of last confi rmed breeding, based on information from Dybbro (1978), Grell (1998), Nyegaard et al. (2014), Olsen (1992) and unpublished in-formation from DOFbasen and Atlas (Appendix 1).
After excluding these species, we are left with 190 regu-lar breeding species, for which we have estimates for size of the Danish bird populations, as provided for the European Red List (Birdlife International 2015) but these have been adapted where additional information was found. Of these, 110 are suffi ciently abundant and detectable to produce a breeding population index with an acceptable degree of confi dence, as part of the CBM scheme. The CBM scheme generates annual changes in population size as an index, i.e. as relative annual changes with no direct relationship with absolute popu-lation sizes. In general, the more common a species is, the more precise the population index; however, for the purpose of this analysis, all species with a CBM index are included, independent of the degree of precision. At the other extreme of avian abundance, we also know with a high degree of accuracy the situation for a few of the very rare breeding birds, i.e. those that have received special attention through different projects (at present only four species) for which we are more or less able to determine the entire population. The intermediate group of 76 regular breeding species (Appendix 2) are

30 PhD thesis by Henning Heldbjerg
far more diffi cult to monitor, since they are too numer-ous to count individually and too scarce (or diffi cult) to monitor by traditional means. In fact, we are currently unable to effectively monitor the majority of the species in the 1-10000 pairs categories adequately (Fig 1).
To improve the monitoring of some of these species, we will need to search for patterns among them. First, we can assign the species as (i) ‘Predictable’ (20 species that effectively breed at the same sites year after year), and (ii) ‘Unpredictable’, (56 species which may shift their breeding sites between a large number of places of which we are not always aware). The ‘unpredictable’ group comprise 11 nocturnal species and 45 diurnal, while the ‘predictable’ group comprises only diurnal species.
In the ‘Predictable’ group, the majority are coastal breeders (11; 55%) or inland wetland breeding birds (25%) (Table 2). A similar pattern is found in the ‘Unpre-dictable’ group (39% in wetland and 16% at the coast), but here is also an additional signifi cant habitat group in forest (30%).
The majority of the species in the ‘unpredictable’ group (66%) are day-active and solitary nesting, indicating that monitoring will only adequately cover this group if it is carried out within a sampling framework and per-formed at large spatial scales. Twenty-one of the day-active solitarily nesting species (46%) occur on inland wetlands, which would therefore seem to represent a good starting point for adequately monitoring a broad suite of these species.
CBM Rare NOVANA None
0 10 20 30 40
1-10
11-100
101-1000
1001-10000
10001-100000
>100000
No. of species/Antal arter
No.
of b
reed
ing
pairs
/Ant
al y
ngle
par
Figure 1. Histogram showing the degree of monitoring cover for 190 regular breeding bird species in Denmark. Well-cov-ered rare species (Rare; 4 species) are indicated in orange, Common Bird Monitoring species (CBM; 110) in yellow and those species not currently monitored (None; 76) in blue. In addition, of the not monitored species, those covered by the NOVANA programme every 2nd or 3rd year at sites where they are designated for is shown in light green (NOVANA; 35).
Graden af årlig overvågning af de 190 regelmæssige ynglefug-le i Danmark. Sjældne arter (4) er vist med orange, punkttæl-lingsarter (110) med gul og arter uden årlig national dækning (76) med blå farve. De af de ikke dækkede arter, der er delvist dækket af NOVANA (35) med tællinger hvert 2. eller 3. år på de områder, der er udpeget for arten er vist med lys grøn farve.
Figure 2. Breeding habitat of 76 regular Danish birds with no annual monitoring coverage at present that occur at ‘Pre-dictable’ (dark green) as well as ‘Unpredictable’ (dark blue) breeding sites. Additional NOVANA monitoring (less then annual coverage; only Annex 1 species and only at sites designated for these) is included for comparison (‘Predictable’ (light green); ‘Unpredictable’ (light blue)).
Ynglehabitat for 76 danske ynglefugle uden årlig overvågning, der forekommer på ’forudsigelige’ (mørkt grøn) eller ’uforudsi-gelige’ (mørkt blå) ynglelokaliteter. NOVANA-overvågede arter er tillige vist opdelt på forudsigelige (lyst grøn) og uforudsige-lige arter (lyst blå).
Predictable-NOVANAPredictable
Unpredictable-NOVANAUnpredictable
No. of species/Antal arter
WetVådområder
ForestSkov
CoastKyst
FarmlandLandbrugsland
HeathlandHede
UrbanByområde
StreamÅ
0 5 10 15 20 25

31PhD thesis by Henning Heldbjerg
Nineteen of the day-active species (34%) are colonial breeders, roughly half each in the ’Predictable’ and ’Un-predictable’ groups. Monitoring of such species obvi-ously necessitates counting methods designed for and dedicated to that specifi c purpose. In several countries monitoring of colonial breeding birds such as Grey Her-on are well established (e.g. Marchant et al. 2004).
Nocturnal species (14%) constitute a discrete set of spe-cies needing specially designed monitoring programmes such as the one established by the Swedish Bird Survey at Lund University (Green et al. 2017).
The results from the gap analysis (Table 2) offer a useful basis for discussing the kind of monitoring that could and should be initiated to cover the greatest number of species in the most cost-effi cient way. In this context, it will also be important to consider how well the NO-VANA monitoring has been able to provide trends for the species included in this list. This depends very much on what proportion of a population lives in a given study area, i.e. those sites designated for the given spe-cies. Figure 2 shows the number of species included in the NOVANA monitoring compared with the required coverage in each habitat. It reveals that 29–40% of the species in the three habitats with most species lacking annual national monitoring are partly covered by the NOVANA monitoring.
Can we get more out of the existing data?
We should also consider whether the extent of exist-ing monitoring provides suffi cient information to sup-port their effective conservation. There are two ways to achieve a better understanding of the factors acting to constrain a species in time and space. Firstly, we could start by better using the existing information in the CBM on habitat and geographical distribution of count locations in Denmark to study variation in space and habitat. Examples of this are analyses undertaken for Corn Bunting (Fox & Heldbjerg 2008) and special-ized farmland birds (Heldbjerg & Fox 2016). The CBM offers largely untapped potential to support such anal-yses on e.g. declining species. Secondly, the use of the habitat information is partly limited by the coarse habi-tat classifi cations used in this programme to date. Each of the common species’ use of the nine defi ned habitats (Coniferous woodland, Deciduous woodland, Arable, Grassland, Heath, Dunes/ Shore, Bog/Marsh, Lake and Urban) have been analysed (Larsen et al. 2011) for the purpose of defi ning and using habitat indicators (Es-kildsen et al. 2013). These analyses can show whether a given species has a preference for instance for arable farming land, but does not show if and how population size and density may vary between different crops. As a result, we learn little about how specifi c changes in ag-ricultural production in the farmland landscape impact upon the abundance of the common farmland birds, be-cause we cannot see, for instance, when spring cereal is converted to winter cereal or fodder beats to winter oil
Sites Time Nesting Wet Forest Coast Farmland Heathland Urban Stream SUMLokalitet Tid Vådområde Vådområde Skov Kyst Agerland/Eng Hede By Å
Predictable NightNat
0 0 0 0 0 0 0 0
Forudsigelig DayDag
ColonialKoloni
2 0 8 0 0 0 0 10
– SolitaryEnkeltvis
3 0 3 0 3 1 0 10
SUM 5 0 11 0 3 1 0 20
Unpredictable NightNat
2 5 0 4 0 0 0 11
Uforudsigelig DayDag
ColonialKoloni
2 0 6 1 0 0 0 9
– SolitaryEnkeltvis
18 12 3 0 1 1 1 36
SUM 22 17 9 5 1 1 1 56
SUM all/I alt 27 17 20 5 4 2 1 76
Table 2. Number of regular breeding bird species in Denmark not annually monitored, divided into diff erent groups based on habitat categories, whether the breeding sites are predictable, the optimal monitoring period during the day and nesting habits.
Fordeling af de regelmæssigt ynglende fuglearter i Danmark uden årlig fugleovervågning, opdelt på naturtype, forudsigelighed af yngleplads, tidsrum for primære aktivitet og kolonialitet.

32 PhD thesis by Henning Heldbjerg
seed rape and what effect this may have on a given spe-cies. Inclusion of such information could be an obvious next step to improve the quality of on-site monitoring, as well as generating additional research questions and a means of answering these.
Could we answer more specifi c habitat specifi c questions?
If we are not able to capture the relevant detailed in-formation within the existing monitoring programmes, another way of tackling this could be to establish short and focused projects with more narrow aims than the traditional monitoring programmes. If we could involve a large number of citizen scientists in short and well de-fi ned projects across the country, we could obtain more detailed new information on a large scale within limited habitats. For example, we could highlight the effects of changes in the composition in mosaics of human land use in Denmark. These include the dramatic increases in the farmed area under oil seed rape or maize or the differences in bird community composition and abun-dance in forest patches consisting of 100-year-old trees compared to patches with the age of 50 or 25 years. Such analyses would generate results that are of immediate use in relation to sympathetic habitat management.
Can we include demography for better under-standing of the observed trends?
We now move from the HOW-step (how-are-the-trends?) to the WHY-step (why-is-the-trend-as-it-is?), where new projects will have to be initiated to provide demo-graphical information. Nest record schemes provide vi-tal knowledge on clutch and brood size and are useful for understanding the variation over time and eventual differences between regions and habitats in such metrics. This in turn provides insight into patterns of reproduc-tive success (see above) which can potentially be built into models to predict species’ trends. Combining such methods with marking of adult birds for information on age of fi rst breeding, breeding propensity and survival, such schemes can dramatically contribute knowledge about the demography of common species. The UK (Crick et al. 2003) and the Netherlands (Sovon 2017) have instigated coordinated programmes (such as the Nest Re-cord Scheme and focused ringing schemes) to measure productivity and survival to support the construction of population models to better understand where annual bottle-necks occur in the annual cycle. The potential for involving large numbers of citizen scientists in nest re-cord studies is substantial. However, developing such a scheme will probably require some years to establish the worth, the degree of interest and the required infrastruc-ture and effort to get such a scheme up and running.
Integrated population modelIn order to understand why a species is declining we need to effectively combine information from several sources. In Denmark, we have a good understanding about whether species are increasing, decreasing or remaining stable, based on indices and trends. Unfor-tunately, we can only rarely explain the drivers that are operating on a population to cause the observed patterns in the trends. We will need to establish pro-grammes that focus on these elements. If we can derive such information for a broad number of species, we will have information available for a given species once the trends suggest that it is in trouble.
By combining information from several sources of moni-toring data to develop integrated analyses of population counts and demographic data in population models, we will be able to better understand the demographic pro-cesses driving population changes (Baillie 1990; Fig. 3). Robinson et al. (2014) combined abundance data from CBM with chick production and nesting success from Nest Record Scheme and with survival estimates for different age classes from mark-recapture data from the Ringing Scheme. Using an integrated approach (combining datasets on different demographic param-eters) allowed important demographic parameters to be identified for a number of species. Such an approach has also been used to give a better understanding of the causes of declines in Wadden Sea birds (van der Jeugd et al. 2014).
Citizen science – potential, motivation and limitsBefore embarking upon a discussion about whether we could start new, or improve existing, monitoring pro-grammes, we need to be convinced that there are citizen scientists willing to participate in such programmes. To understand this, we need to better understand the moti-vation of Citizen Scientists to contribute to such projects. For a large proportion of people contributing to citizen science projects, the overriding motivation is simple, namely that they find the work enjoyable (Greenwood 2007). This was confi rmed by a recent questionnaire (Mathiasen in prep.) from Denmark among the 3rd bird atlas project and CBM programme participants (N = 434 respondents). The three most important motivating fac-tors for participation in similar potential projects was an interest in birds (95% of the answers), an interest in na-ture (86%), and a desire to contribute knowledge (77%). Asked for suggestions for future projects, participants generated great variance in their preferences, but most expressed interest in participating in more bird monitor-ing projects with a scientifi c purpose and of relevance for conservation.

33PhD thesis by Henning Heldbjerg
To sustain, maintain and grow such a dedicated group of volunteers, it is important to maintain their interest and willingness to participate in the citizen science pro-jects. In the light of the circa 1,450 observers which par-ticipated in the Atlas III project so far, it seems that we still have a large and highly motivated group of partici-pants willing to support such programmes. Most peo-ple simply like to help and are interested to contribute as long as they see appropriate use of their data and as long as they feel comfortable carrying out the methods that they are asked to undertake. The nature of the feed-back to each of the participants is also extremely impor-tant and the professional project managers must make sure that they demonstrate their gratitude, appreciation and understanding, that the continuing contributions are greatly valued and that they contribute to some clearly defi ned greater goal. Such feedback can range from a simple thank you for the annual contribution to a statement in a report or a scientifi c paper that this was only possible due to the participation of hundreds of participants. Participants want and need to know what was discovered as a result of their efforts, and there-fore have similar needs to those coordinating the work (see also Greenwood 2007). Feedback in all forms must convince most of the volunteers that by their own rela-tively modest effort, they have contributed to a much more massive compilation of knowledge at the local, regional and/or European scale. It should also enable participants to understand how their work supports the bigger picture and contributes overall to the fi ndings of the project.
There are several ways to broaden the citizen science involvement in bird monitoring projects, but there are of course also limitations to this. We have seen that the Danish citizen scientists in general are happy to be in-volved but the limits to this involvement should be ex-plored before initiating new citizen science projects. We forget at our peril that these brilliant folk do the work for nothing apart from their own enjoyment and we should be very careful about over exploiting such incredible goodwill. There are of course limits to the complexity of the tasks for which they are being asked to contribute with their free time and labour. This could relate to the fi eld activities or to the way the data are reported and uploaded.
Many people prefer to work with methods with which they are comfortable, but for professional project coor-dinators, it is important to try to educate and challenge the citizen science community to use other methods. As an added project to the 3rd Danish bird atlas, avian den-sity data are gathered using line transect and distance bands (Levinsky 2016). This is the fi rst time such meth-ods have been proposed and initially they were met with widespread scepticism among participants. As a result, organisers were encouraged to engage in more thorough communication and discussion both internally and with the citizen scientist community. This exchange of views led to improvements in the clarity of the goals of the project, clearer instructions and improved understand-ing amongst survey participants, but also, necessarily, to some weakening of the original data demands for the
Common Bird Monitoring
DOFbasen
Mid-wintercounts
Site-basedmonitoring
Population size
Breedingsuccess Survival
Nest recordscheme
Feeder watch
Integrated population model
Background ringing
Distribution
ATLAS III
Winter atlas
Habitat based
NocturnalColonial birds
Species specific
Constant EffortSite ringing
Retrapping Adultsfor Survivala
Figure 3. Diagram showing existing (dark blue) and suggested (light blue) Danish schemes and how they can contribute to the knowledge on the most important parameters needed for an Integrated Population Model.
Diagram, der viser eksisterende (mørkt blå) og foreslåede (lyst blå) fugleovervågningsprojekter i Danmark, og hvordan de kan bidrage til de væsentligste parametre, der er relevante for en Integreret Populationsmodel.

34 PhD thesis by Henning Heldbjerg
surveys. As a result, the observers were convinced that it was worth giving the techniques a try and the technical changes resulted in changes in attitudes on all sides. The result has been a success, with highly satisfactory results in terms of involvement and quality of data (although the data have yet to be analysed). This process surely will in-spire coming projects, including those still to be initiated in the future. However, there remains the risk that poten-tial participants will refuse to take part if the demands to participate are too complex, to demanding or too ambi-tious, underlining the clear need to consult effectively to better understand the feelings of the citizen science com-munity ahead of novel surveys. Data inputting is now mostly done by the observers themselves via apps in the fi eld or via a portal after the fi eldwork, imposing yet more demands on participants. However, we should be eternally grateful that it is much easier now compared to the transfer of data from note book to forms that needed to be submitted by post to be centrally analysed, which was still the “gold” standard up until a few years ago. This is a crucial part since even the most skilled and dedi-cated participants may decide to stop their involvement if they fi nd it too complicated to enter and upload data. For this reasonthe third British Atlas project (2007-11) re-tained the possibility for the participants to submit data on paper as well as online (Balmer et al. 2013).
Another issue concerns the quality of the observations themselves. It is important to bear in mind that there is a risk that involving far more people in a certain project may result in the increasing participation of less skilled observers, which may affect data quality, depending on the nature of the survey. Surveying only the commoner bird species allows participation of far more people than surveying all bird species. To fulfi l the ultimate scientifi c objective, it is an important pre-requisite to ensure that data are collected to a given standard after which the professional organisers will have to make sure that the contributions meet the threshold for quality assurance. It is often advisable to combine the monitoring project with an outreach and education programme, to improve skills among volunteers and to educate to create a more skilled and interested community of potential citizen scientists. Dynamic, attractive and informative feedback may also retain volunteers and improve their skills over time. In this way, recruits may fi rst become engaged by participating in a less demanding project such as the Feeder Watch project and over time become involved in more demanding programmes such as the CBM (Greenwood 2007). In addition, good communication from professional organisers will also reach a large part of people who will never be adequately skilled to par-ticipate but are still interested in the monitoring and its results and may even appeal to young people, who are often (considered to be) most notable by their absence in contributing to such programmes.
Conclusions and recommendations
The aim of this paper has not been to develop a sim-ple recipe for the future monitoring of breeding birds in Denmark, but rather to create a foundation for a discus-sion within the bird monitoring community about fu-ture directions, outlining what we can, should and will do in the future. In the longer term, we need to be think-ing about developing more detailed strategies to enable us to reach our specifi c goals.
In Denmark, there are currently relatively few organi-sations involved in bird monitoring. In order to main-tain and improve the monitoring it is essential for this relatively small community to regularly to discuss goals and objectives. This is vital to establish what is needed to adequately generate the necessary data on the distri-bution and abundance of all species, improve species, habitat and geographical coverage, involve new genera-tions of observers, as well retaining the current network of stalwarts and to effectively integrate demographic parameters in the monitoring.
We should aim to ‘pick the low hanging fruits’ by con-sidering adaptations of existing monitoring schemes and collation of existing data to achieve greater aims without compromising quality or quantity. We should also consider initiating new monitoring schemes to cov-er missing elements in our current monitoring portfolio, e.g. species, habitats, demography parameters, other taxa than birds, detailed and focused studies etc.. We should also ensure that we generate the data we need to answer specifi c research questions and to enable the effective conservation and management of Danish birds in the future (Table 3).
We argue for the need to focus in future on monitoring the less numerous avian species of wetland, coastal and forest habitats and that nocturnal species also need par-ticular attention. We also urge the initiation of projects that provide information on demographical parameters, in order to support ultimately the establishment of Inte-grated Population Monitoring modelling which would vastly benefi t from the integration of information from the different sources.
Monitoring biologists across Europe are also working increasingly closely together in networks like BirdLife International, the European Bird Census Council and Wetlands International, which makes it easier to collab-orate and to learn from each other’s experiences. New Danish initiatives may fi nd help and guidance from sim-ilar suitable programmes in neighbouring countries and thereby make it easier to start and run well-designed programmes, as well as generating comparable results from different countries. Our scientifi c understanding

35PhD thesis by Henning Heldbjerg
only increases by enlarging our scope from the single point count to the relatively little area of Denmark to looking at patterns at far larger scales, such as Scandi-navia or Europe.
Acknowledgements
We gratefully acknowledge the thousands of citizen sci-entists taking part in different DOF projects in the past 50 years. Thanks also to the bio-team in DOF for dis-cussions to support the gap analysis and help with the overall species list. HH acknowledges the support of an industrial PhD stipend awarded by Innovationsfonden, which, together with Aage V. Jensen Naturfond and 15. Juni Fonden also supported this work.
Resumé
Hvordan kan vi forbedre fugleovervågningen i Danmark fremover?
I overvågningen af danske fugle og dansk natur har kyndige frivillige ulønnede deltagere altid spillet en væsentlig rolle. Dette samarbejde mellem borgere og uddannet fagpersonale omtales, selv på dansk, som ’ci-tizen science’ med ’’borgervidenskab’ som et alternativt navn. Det er blevet den accepterede standard, at over-vågning løses ved inddragelse af citizen scientist, hvil-ket gør det muligt at gennemføre et stort antal tællinger på kort tid, at fortsætte undersøgelser over mange år og at holde omkostningerne tilstrækkeligt lave til at sikre gennemførelse.
Danmark har brug for overvågning for at kunne opfylde forpligtigelserne i henhold til europæisk og internatio-nal lovgivning og for at kunne tage de nødvendige be-slutninger vedrørende forvaltning og beskyttelse af den danske natur. Desuden har organisationer som DOF og BirdLife International en stærk interesse i at kende sta-tus og udvikling for de danske fugle.
Formålet med artiklen er at tage afsæt i den tidligere og nuværende fugleovervågning for at undersøge, hvor vi kan gøre det bedre i Danmark i fremtiden. Dette præ-senteres i håb om, at folk med behov for eller interesse i at kende de danske fugles status og tendenser, vil blive inspireret til at skabe et grundlag for bedre fugleunder-søgelser og fuglebeskyttelse i Danmark fremover.
Observer type Abundance/distribution Detailed studies DemographyObservatørtype Forekomst/udbredelse Detaljerede studier Demografi Interested in birdsFugleinteresseret
Feeder watchFoderbrætsundersøgelse
Nest Record SchemeRedeundersøgelser
Skilled birderFuglekyndig
Habitat studiesNaturtype-studier
Nocturnal speciesNat-aktive fugle
Species-specifi cArtsspecifi kke studier
Colonial birdsKolonirugere
CommunitiesFuglesamfundsstudier
Winter atlasVinteratlas
RingerRingmærker
CES/CESRAS/RAS
Citizen scientist-Professional interfaceCitizen scientist-professionel grænsefl ade
Expert facilitated collaborationEkspertbaseret samarbejde
Table 3. Overview of suggested areas to improve the monitoring of the breeding birds and winter birds in the future years with the indication of the main observer type relevant to involve for each.
Oversigt over foreslåede områder, hvorpå den danske fugleovervågning kan forbedres, og med angivelse af, hvilken type obser-vatør, der ønskes involveret på hvert område.

36 PhD thesis by Henning Heldbjerg
I løbet af 1960’erne opstod de første store landsdæk-kende overvågningsprogrammer med optællinger på de bedste fuglelokaliteter og midvintertællinger. I 1970’erne fulgte atlasundersøgelse og punkttællinger. Flere programmer er gennemført eller gentaget siden da, og fra 2002 fulgte DOFbasen på www.dofbasen.dk (tabel 1).
Den nationale årlige overvågning af de danske fugle be-står nu af dels punkttællinger, der anses for tilstrække-ligt pålidelige til at give et bestandsindeks (men ikke et bestandsestimat) for 110 arter af ynglefugle og 80 arter af vinterfugle, dels en særlig arts-fokuseret indsats for fi re sjældne arter, , nemlig Havørn, Hedehøg, Kongeørn og Fiskeørn, for hvilke det er muligt at registrere hvert enkelt par. Desuden gennemføres der i regi af NOVA-NA en overvågning, der dækker de områder, for hvilke de arter, der er på liste 1 på Fugledirektivet, indgår i udpegningsgrundlaget. Disse arter er desuden nationalt dækkende hvert sjette år (se appendiks 1).
Danmark har stor betydning for trækkende og overvin-trende fugle, men overvejelser om en forbedret over-vågning af trækfugle indgår ikke i denne artikel. Hvis vi skal lave en bedre overvågning af de danske fugle om vinteren og i ynglesæsonen fremover, kan vi enten forsøge at inkludere fl ere arter eller forsøge at lave en bedre overvågning af udvalgte arter.
Blandt de 190 regelmæssige ynglefugle i Danmark er der 76 arter, der ikke indgår i den eksisterende årlige overvågning. En analyse viser, at disse arter har bestan-de skønnet til 1-10.000 par og således kan betegnes som sjældne og fåtallige arter (Fig. 1); nogle af disse arter er dog dækket af NOVANA-overvågningen (Fig. 2). End-videre ses det, at de mangelfuldt dækkede arter primært fi ndes i de tre naturtyper skov, vådområder og kyst. I sidstnævnte naturtype er 70 % ydermere kolonirugende arter. Endelig er 11 af arterne nataktive (tabel 2). Alle
disse forhold er afgørende at kende til, når man skal prioritere, hvilken målrettet indsats, der skal supplere den eksisterende fremover.
Hvis målet er at få et dybere kendskab til baggrunden for de bestandstendenser, vi ser (bestandsfremgang, -nedgang, stabilitet, fl uktuation), bliver vi nødt til at inkludere demografi ske parametre. Hvis en bestand ændrer sig, skyldes det ændringer i en eller fl ere af pa-rametrene overlevelse, ungeproduktion samt ind- og udvandring. Inkluderes studier af disse parametre, kan vi få mere viden om, hvorfor en bestand ændrer sig, i modsætning til nu, hvor vi må nøjes med at konstatere, hvor meget den ændrer sig. For at opnå viden om disse parametre, kræves særlige indsatser som fx etablering af et rederegistreringsprojekt, men det er også muligt at bruge data fra ringmærkningsprojekter som ’Constant Effort Site’ – ringmærkning (med konstant fangstind-sats af ynglefugle) og anvendelse af mærknings-/afl æs-ningsprojekter (Fig. 3). Desuden kan vingeundersøgel-ser af nedlagte, jagtbare arter give viden om køns- og aldersfordelingen hos disse arter og således give øget viden om variationen af den årlige ungeproduktion. Vinterindsatsen kan med fordel udvides med et vin-teratlas for at få bedre kendskab til arternes udbredelse og variationen i forekomsten mellem årene samt med en velovervejet have-/foderbrætsundersøgelse, der kan give detaljeret viden om arternes vinterforekomst og in-volvere en masse nye fugleinteresserede.
Den danske fugleovervågning udføres i samarbejde med europæiske og internationale samarbejdspart-nere som BirdLife International, European Bird Cen-sus Council og Wetlands International. Eventuelle nye tiltag kan med fordel drage nytte af de erfaringer, der er opnået i andre lande. Desuden kan nogle indsatser med fordel gennemføres sammen med andre lande, så vi i fællesskab kan dække større geografi ske områder og sammenligne udviklingen i de forskellige delområder.

37PhD thesis by Henning Heldbjerg
ReferencesBaillie, S.R. 1990: Integrated population monitoring of breed-ing birds in Britain and Ireland. – Ibis 132(2): 151–166.
Balmer, D., S. Gillings, B. Caffrey, B. Swann, I. Downie & R. Fuller 2013: Bird Atlas 2007–11: the breeding and wintering birds of Britain and Ireland. BTO Books, Thetford, UK.
Bioscience 2017a: Danish Wing Survey and hunting bag. http://bios.au.dk/en/knowledge-exchange/til-jagt-og-vildt-interesserede/wing-survey/, approached 29. aug. 2017.
Bioscience 2017b: Artsgrupper i den danske rødliste. http://bios.au.dk/videnudveksling/til-jagt-og-vildtinteresserede/redlistframe/artsgrupper/ , approached 29. aug. 2017.
BirdLife International 2015: European Red List of Birds. Luxembourg: Offi ce for Offi cial Publications of the Euro-pean Communities.
Bowler, D.E., H. Heldbjerg, A.D. Fox, R. O’Hara, & K. Böh-ning-Gaese. In press: Disentangling the effects of multiple environmental drivers on population changes within commu-nities. – J. Anim. Ecol. 000: 000-000.
Bregnballe, T. & M. Nitschke 2017: Danmarks ynglebestand af skarver i 2017. Aarhus Universitet, DCE – Nationalt Center for Miljø og Energi, 40 s. – Teknisk rapport fra DCE – Nationalt Center for Miljø og Energi nr. 103 http://dce2.au.dk/pub/TR103.pdf
Bønløkke, J., J.J. Madsen, K. Thorup, K.T. Pedersen, M. Bjer-rum & C. Rahbek 2006: The Danish Bird Migration Atlas. – Forlaget Rhodos A/S & Zoologisk Museum, Københavns Universitet. Rhodos
Christensen, T.K. & A.D. Fox 2014: Changes in age- and sex-ratios amongst samples of hunter-shot wings from common duck species in Denmark 1982-2010. – Eur. J. Wildlife Res. 60: 303–312.
Christensen, T.K., T. Asferg, A.B. Madsen, J. Kahlert, P. Clau-sen, K. Laursen, P. Sunde & L. Haugaard 2013: Jagttidsrevision 2014. Vurdering af jagtens bæredygtighed i forhold til gæl-dende jagttider. Aarhus Universitet, DCE – Nationalt Center for Miljø og Energi, 108 s. – Videnskabelig rapport fra DCE – Nationalt Center for Miljø og Energi nr. 66. http://dce2.au.dk/pub/SR66.pdf
Clausager, I. 1973: Age and sex determination of the Woodcok (Scolopax rusticola). – Danish Review Game Biology 8(1): 1-18.
Crick, H.Q.P., S.R. Baillie & D.I. Leech 2003: The UK Nest Record Scheme: its value for science and conservation. – Bird Study 50:3, 254-270.
Dybbro, T. 1976: De danske ynglefugles udbredelse. – Dansk Ornitologisk Forening.
Dybbro, T. 1978: Oversigt over Danmarks fugle. – Dansk Or-nitologisk Forening
Dybbro, T. 1985: Status for danske fuglelokaliteter. – Dansk Ornitologisk Forening
Eskildsen, A., J.D. Larsen & H. Heldbjerg 2013: Use of an objective indicator species selection method shows decline in bird populations in Danish habitats. – Dansk Orn. Foren. Tidsskr. 107 (2013): 191-207.
Ettrup, H. 2016: Danmarks Ringmærkerforening 2015. – Fugleåret 2015: 241-244.
Ettrup, H. & J.J. Madsen In press: Standardiseret ynglefugle-fangst i Danmark. Dansk Orn. Foren. Tidsskr. 111(4): 00-00.
Ferdinand, L. 1971: Større danske fuglelokaliteter. – Dansk Ornitologisk Forening & Statens naturfrednings-og landskabs-konsulent.
Ferdinand, L. 1980: Fuglene i landskabet. – Dansk Ornitolo-gisk Forening.
Flensted, K.N. & T. Vikstrøm 2006: De store feltprojekter: fra viden til naturbevarelse. – Dansk Orn. Foren. Tidsskr. 100: 197-205.
Fox, A.D. 2004: Has Danish agriculture maintained farmland bird populations? – J. Appl. Ecol. 41: 427-439.
Fox, A.D. & H. Heldbjerg, 2008: Which regional features of Danish agriculture favour the corn bunting in the contempo-rary farming landscape? – Agr. Ecosyst. Environ. 126: 261-269.
Fox, A.D., S. Kobro, A. Lehikoinen, P. Lyngs & R.A. Väisänen 2009: Northern Bullfi nch Pyrrhula p. pyrrhula irruptive behav-iour linked to rowanberry Sorbus aucuparia abundance. – Ornis Fennica 86: 51-60.
Green, M., F. Haas & Å. Lindström 2017: Monitoring popula-tion changes of birds in Sweden. Annual report for 2016. – Department of Biology, Lund University. 84 pp.
Greene, T. 2012: DOCDM-87057, A guideline to monitoring populations. Version 1.0. New Zealand Department of Con-servation http://www.doc.govt.nz/Documents/science-and-technical/inventory-monitoring/guideline-to-monitoring-populations.pdf, approached 27. Sept 2017.
Greenwood, J.J.D. 2007: Citizens, science and bird conserva-tion. – J. Ornithol. 148:77-124.
Grell, M.B. 1998: Fuglenes Danmark. – Gads Forlag & Dansk Ornitologisk Forening.
Grell, M.B., H. Heldbjerg, B. Rasmussen, M. Stabell, J. Tofft & T. Vikstrøm (red.) 2004: Rare and threatened breeding birds in Denmark, status 1998-2003. In Danish with an English sum-mary. – Dansk Orn. Foren. Tidsskr. 98: 45-100.
Hammer, S., J.J. Madsen, J-K. Jensen, K.T. Pedersen, D. Bloch & K. Thorup 2014: Færøsk Trækfugleatlas, The Faroese Bird Migration Atlas. – Torshavn: Faroe University Press.
Heldbjerg, H. & A.D. Fox 2016: Regional trends amongst Dan-ish specialist farmland breeding birds. – Dansk Orn. Foren. Tidsskr. 110: 214-222.
Heldbjerg, H., A. Klvaňová, & A. Anselin 2015: The status of winter land bird monitoring in Europe. – Bird Census News 29 (1–2): 3–8.
Heldbjerg, H., A.D. Fox, G. Levin & T. Nyegaard 2016: The decline of the Starling Sturnus vulgaris in Denmark is related to changes in grassland extent and intensity of cattle grazing. – Agr. Ecosyst. Environ. 230: 24–31.
Heldbjerg H., A.D. Fox, P.V. Thellesen, L. Dalby & P. Sunde 2017: Common Starlings (Sturnus vulgaris) increasingly select for grazed areas with increasing distance-to-nest. – PLoS ONE 12(8): e0182504.

38 PhD thesis by Henning Heldbjerg
Herrando, S., L. Brotons, J. Estrada, S. Guallar & M. Anton (eds.) 2011: Atles dels ocells de Catalunya a l’hivern 2006-2009. – Generalitat de Catalunya, CX Catalunya Caixa & Lynx.
Holm, T.E., P. Clausen, R.D. Nielsen, T. Bregnballe, I.K. Pe-tersen, P. Mikkelsen, J. Bladt, J. Kotzerka & B. Søgaard 2016: Fugle 2015. NOVANA. Aarhus Universitet, DCE – Nationalt Center for Miljø og Energi, 142 s. – Videnskabelig rapport fra DCE – Nationalt Center for Miljø og Energi nr. 210
Holm, T.E. & B. Søgaard 2017: Intensiv 2-overvågning af yn-glefugle. Teknisk Anvisning A179, DCE, Aarhus Universitet. http://bios.au.dk/fi leadmin/bioscience/Fagdatacentre/Bio-diversitet/TAA179_Intensiv2_v1.pdf
van der Jeugd H.P., Ens B.J., M. Versluijs & H. Schekkerman 2014: Geïntegreerde monitoring van vogels van de Neder-landse Waddenzee. Vogeltrekstation rapport 2014-01. Vogel-trekstation, Wageningen; CAPS-rapport 2014-01; Sovon-rap-port 2014/18. – Sovon Vogelonderzoek Nederland, Nijmegen.
Joensen, A.H. 1974: Waterfowl populations in Denmark 1965-73. – Danish Review of Game Biology 9(1). 206 s.
Kahlert, J., A.D. Fox, H. Heldbjerg, T. Asferg, & P. Sunde 2015: Functional responses of human hunters to their prey – why harvest statistics may not always refl ect changes in prey population abundance. – Wildlife Biol. 21(6):294-302.
Kamp, J., S. Oppel, H. Heldbjerg, T. Nyegaard & P.F. Donald 2016: Unstructured citizen science data fail to detect long-term population declines of common birds in Denmark. – Divers. Distrib. 22: 1024-1035.
Knudsen, V. 2015: Fluctuations in populations of common Danish breeding birds – Using ringing data from the Danish Constant Effort Sites. Master Thesis, Center for Macroecology, Evolution and Climate, Natural History Museum of Den-mark, University of Copenhagen, Faculty of Science.
Larsen J.L., H. Heldbjerg & A. Eskildsen 2011: Improving national habitat specifi c biodiversity indicators using relative habitat use for common birds. – Ecol. Indic. 11: 1459-1466.
Lehikoinen, A., R.P.B. Foppen, H. Heldbjerg, Å. Lindström, W. van Manen, S. Piirainen, C.A.M. van Turnhout, & S.H.M. Butchart, 2016: Large-scale climatic drivers of regional winter bird population trends. – Divers. Distrib. 22: 1163–1173.
Levinsky, I. 2016: ATLAS III – kortlægning af Danmarks yn-gle- og vinterfugle 2014-2017. Fugleåret 2015: 136-139. – DOF.
Lindén, A., Lehikoinen, A., Hokkanen, T. & Väisänen, R.A. (2011) Modelling irruptions and population dynamics of the great spotted woodpecker – joint effects of density and cone crops. – Oikos 120: 1065-1075.
Lyngs, P. 2003: Migration and winter ranges of birds in Greenland. An analysis of ringing recoveries. – Dansk Orn. Foren. Tidsskr. 97: 1-167.
Lyngs, P. 2006: De danske fuglestationer: fra Jordsand til Christiansø. – Dansk Orn. Foren. Tidsskr. 100: 215-225.
Marchant, J.H., S.N. Freeman, H.Q.P. Crick & L.P. Beaven 2004: The BTO Heronries Census of England and Wales 1928–2000: new indices and a comparison of analytical methods. – Ibis 146: 323–334.
Mathiasen, C. In prep: Motivationsundersøgelse af projektak-tive fuglekiggere - ATLAS III og Punkttælling. Notat, DOF.
Meltofte, H., M.B. Grell, P.l. Lindballe & T. Nyegaard 2009: The breeding birds on small biotopes in Denmark. In Danish with an English summary. – Dansk Orn. Foren. Tidsskr. 103: 11-21.
Meltofte, H. & J.D. Larsen 2015: Birds in Danish gardens in winter. In Danish with an English summary. – Dansk Orn. Foren. Tidsskr. 109: 167-178.
Miljøstyrelsen, DCE – Nationalt Center for Miljø og Energi ved Aarhus Universitet samt GEUS – De Nationale Geolo-giske Undersøgelser for Danmark og Grønland 2017: NO-VANA Det nationale overvågningsprogram for vandmiljø og natur 2017-21. – Miljøstyrelsen. ISBN: 978-87-7120-862-7.
Moshøj, C.M., D.P. Eskildsen, T. Nyegaard, M.F. Jørgensen & T. Vikstrøm (2017): Common Bird Census in Denmark 1975-2016. Annual report from the Danish Point Count Census. In Danish with an English summary. – Dansk Ornitologisk Forening.
Møller, H.U.S. 2006: DOFs faglige grupper: fra Rapportgrup-pen til Uglegruppen. – Dansk Orn. Foren. Tidsskr. 100: 226-241.
Newton, I. 2014: Bird Populations. – Harper Collins, London.
Nolet, B.A., S. Bauer, N. Feige, Y.I., Kokorev, I.Y. Popov & B.S. Ebbinge 2013: Faltering lemming cycles reduce productivity and population size of a migratory Arctic goose species. – J. Anim Ecol 82: 804-813.
Nyegaard, T., H. Heldbjerg & S. Brølling 2012: DOFbasen 10 years. – Bird Census News 25 (1):13-16
Nyegaard, T, H. Meltofte, J. Tofft & M.B. Grell. 2014: Rare and threatened breeding birds in Denmark 1998-2012. In Danish with an English summary. – Dansk Orn. Foren. Tidsskr. 108: 1-144.
Nyegaard, T. 2016: Projekt truede og sjældne ynglefugle 2013-17. Fugleåret 2015: 140. – DOF.
Olsen, K.M. 1992: Danmarks fugle – en oversigt. – Dansk Or-nitologisk Forening.
Petersen, I.K., S. Pihl, J.P. Hounisen, T.E. Holm, P. Clausen, O. Therkildsen, & T.K. Christensen 2006: Landsdækkende optællinger af vandfugle, januar og februar 2004. Danmarks Miljøundersøgelser. 76 s. – Faglig rapport fra DMU nr. 606. http://www.dmu.dk/Pub/FR606.pdf
Preuss, N.O. 1997: Ringmærkning og hvad den afslører. – Dyr i natur og museum 1997(2): 2-6.
Robinson, R.A., D.E. Balmer & J.H. Marchant 2008: Survival rates of hirundines in relation to British and African rainfall. – Ringing & Migration 24: 1-6.
Robert A. Robinson , Becki Lawson , Mike P. Toms, Kirsi M. Peck, James K. Kirkwood, Julian Chantrey, Innes R. Clatworthy, Andy D. Evans, Laura A. Hughes, Oliver C. Hutchinson, Shinto K. John, Tom W. Pennycott, Matthew W. Perkins, Peter S. Rowley, Vic R. Simpson, Kevin M. Tyler, Andrew A. Cunningham. 2010. Emerging Infectious Disease Leads to Rapid Population Declines of Common British Birds. – PLoS ONE 5(8): e12215. https://doi.org/10.1371/journal.pone.0012215.

39PhD thesis by Henning Heldbjerg
Robinson, R.A., C.A. Morrison & S.R. Baillie. 2014: Integrating demographic data: towards a framework for monitoring wild-life populations at large spatial scales. – Methods Ecol. Evol. 2014(5): 1361–1372.
Sovon 2017: Nestkaarten. https://www.sovon.nl/nestkaart, approached 19 sept 2017
Sørensen, U.G. 1995: Truede og sjældne danske ynglefugle 1976-1991. – Dansk Orn. Foren. Tidsskr. 89: 1-48.
Thellesen, P.V. 2017: Common Starling Sturnus vulgaris clutch size, brood size and timing of breeding during 1971-2015 in Southwest Jutland, Denmark. In Danish with an English sum-mary. – Dansk Orn. Foren. Tidsskr. 111(3): 87-95.
Thorup, O., E.M. Jacobsen & J. Fjeldså (red.) 2000: Dansk Ornitologisk Forening og overvågningen af fugle i Danmark Ynglefugle. - Dansk Ornitologisk Forenings Videnskabelige Udvalg.
Vikstrøm, T., T. Nyegaard, M. Fenger, N. Brandtberg & H. Thomsen, 2015: Status og udviklingstendenser for Danmarks internationalt vigtige fugleområder (IBA’er). – Dansk Orni-tologisk Forening.
Weegman, M.D., S. Bearhop, A.D. Fox, G.M. Hilton, A.J. Walsh, J.F. McDonald & D.J. Hodgson 2016: Integrated popu-lation modelling reveals a perceived source to be a cryptic sink. – J. Anim. Ecol. 85: 467-475.
Østergaard, E. 2017: Migration and breeding site fi delity in Northern Wrynecks Jynx torquilla ringed in Denmark. In Dan-ish with an English summary. – Dansk Orn. Foren. Tidsskr. 111(2): 66-70.
Henning Heldbjerg ([email protected]) & Anthony D. Fox, Depart-ment of Bioscience, Aarhus University, Kalø, Grenåvej 14, DK-8410 Rønde
Henning Heldbjerg & Thomas Vikstrøm, Dansk Ornitologisk Forening BirdLife Denmark, Vesterbrogade 138-140, DK-1620 København
Appendix
Appendix 1: List of all breeding birds in Denmark, showing their breeding status, population estimate (c. 2011) and coverage under existing monitoring projects. Oversigt over alle danske ynglefugle med angivelse af status, bestandsestimat (ca. 2011) og nuværende overvågningspro-jekt.
Appendix 2: List of regular breeding birds in Den-mark which currently lack monitoring schemes, with an indication of whether the breeding sites are predictable or not, the optimal monitoring pe-riod during the day, nesting habits and habitat type.Oversigt over regelmæssige danske ynglefugle uden årlig overvågning. Endvidere er vist forudsigelighed af yngleplads, tidsrum for primære aktivitet, kolonialitet og naturtype.
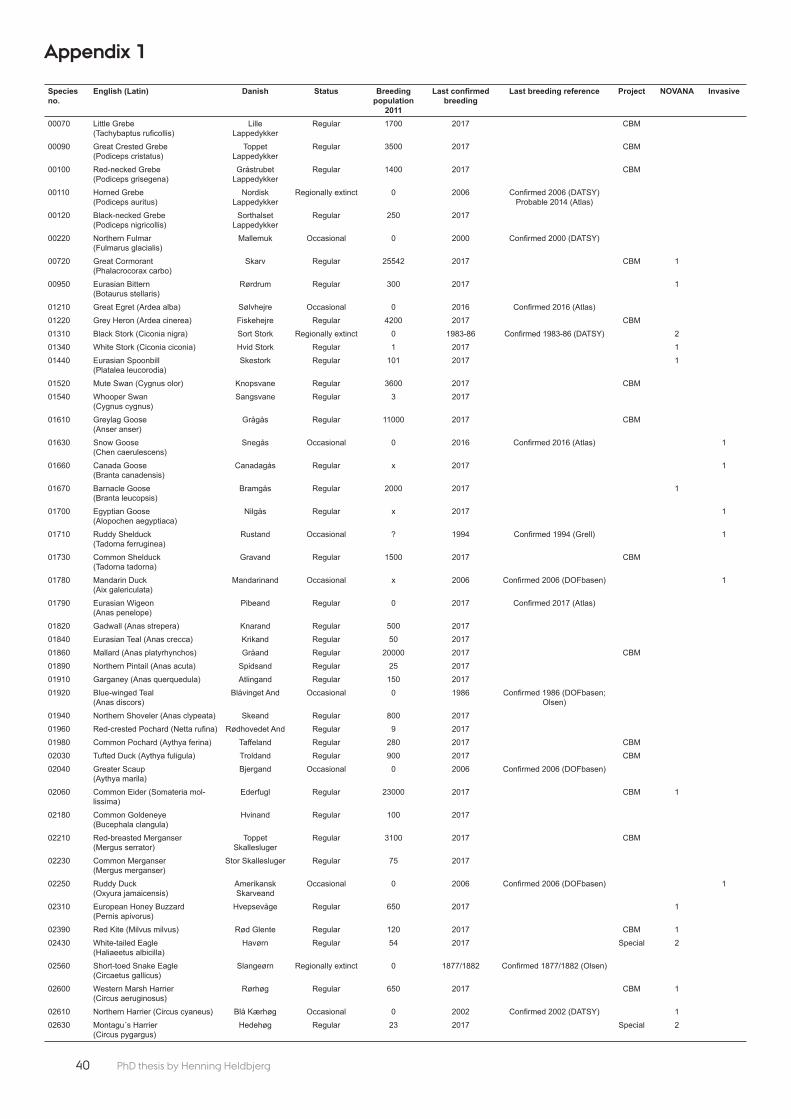
40 PhD thesis by Henning Heldbjerg
Species no.
English (Latin) Danish Status Breeding population
2011
Last confi rmed breeding
Last breeding reference Project NOVANA Invasive
00070 Little Grebe(Tachybaptus rufi collis)
Lille Lappedykker
Regular 1700 2017 CBM
00090 Great Crested Grebe (Podiceps cristatus)
Toppet Lappedykker
Regular 3500 2017 CBM
00100 Red-necked Grebe (Podiceps grisegena)
Gråstrubet Lappedykker
Regular 1400 2017 CBM
00110 Horned Grebe (Podiceps auritus)
Nordisk Lappedykker
Regionally extinct 0 2006 Confi rmed 2006 (DATSY)Probable 2014 (Atlas)
00120 Black-necked Grebe (Podiceps nigricollis)
Sorthalset Lappedykker
Regular 250 2017
00220 Northern Fulmar (Fulmarus glacialis)
Mallemuk Occasional 0 2000 Confi rmed 2000 (DATSY)
00720 Great Cormorant (Phalacrocorax carbo)
Skarv Regular 25542 2017 CBM 1
00950 Eurasian Bittern (Botaurus stellaris)
Rørdrum Regular 300 2017 1
01210 Great Egret (Ardea alba) Sølvhejre Occasional 0 2016 Confi rmed 2016 (Atlas)01220 Grey Heron (Ardea cinerea) Fiskehejre Regular 4200 2017 CBM01310 Black Stork (Ciconia nigra) Sort Stork Regionally extinct 0 1983-86 Confi rmed 1983-86 (DATSY) 201340 White Stork (Ciconia ciconia) Hvid Stork Regular 1 2017 101440 Eurasian Spoonbill
(Platalea leucorodia)Skestork Regular 101 2017 1
01520 Mute Swan (Cygnus olor) Knopsvane Regular 3600 2017 CBM01540 Whooper Swan
(Cygnus cygnus)Sangsvane Regular 3 2017
01610 Greylag Goose (Anser anser)
Grågås Regular 11000 2017 CBM
01630 Snow Goose (Chen caerulescens)
Snegås Occasional 0 2016 Confi rmed 2016 (Atlas) 1
01660 Canada Goose (Branta canadensis)
Canadagås Regular x 2017 1
01670 Barnacle Goose (Branta leucopsis)
Bramgås Regular 2000 2017 1
01700 Egyptian Goose (Alopochen aegyptiaca)
Nilgås Regular x 2017 1
01710 Ruddy Shelduck (Tadorna ferruginea)
Rustand Occasional ? 1994 Confi rmed 1994 (Grell) 1
01730 Common Shelduck(Tadorna tadorna)
Gravand Regular 1500 2017 CBM
01780 Mandarin Duck (Aix galericulata)
Mandarinand Occasional x 2006 Confi rmed 2006 (DOFbasen) 1
01790 Eurasian Wigeon (Anas penelope)
Pibeand Regular 0 2017 Confi rmed 2017 (Atlas)
01820 Gadwall (Anas strepera) Knarand Regular 500 201701840 Eurasian Teal (Anas crecca) Krikand Regular 50 201701860 Mallard (Anas platyrhynchos) Gråand Regular 20000 2017 CBM01890 Northern Pintail (Anas acuta) Spidsand Regular 25 201701910 Garganey (Anas querquedula) Atlingand Regular 150 201701920 Blue-winged Teal
(Anas discors)Blåvinget And Occasional 0 1986 Confi rmed 1986 (DOFbasen;
Olsen)01940 Northern Shoveler (Anas clypeata) Skeand Regular 800 201701960 Red-crested Pochard (Netta rufi na) Rødhovedet And Regular 9 201701980 Common Pochard (Aythya ferina) Taff eland Regular 280 2017 CBM02030 Tufted Duck (Aythya fuligula) Troldand Regular 900 2017 CBM02040 Greater Scaup
(Aythya marila)Bjergand Occasional 0 2006 Confi rmed 2006 (DOFbasen)
02060 Common Eider (Somateria mol-lissima)
Ederfugl Regular 23000 2017 CBM 1
02180 Common Goldeneye(Bucephala clangula)
Hvinand Regular 100 2017
02210 Red-breasted Merganser(Mergus serrator)
Toppet Skallesluger
Regular 3100 2017 CBM
02230 Common Merganser (Mergus merganser)
Stor Skallesluger Regular 75 2017
02250 Ruddy Duck (Oxyura jamaicensis)
Amerikansk Skarveand
Occasional 0 2006 Confi rmed 2006 (DOFbasen) 1
02310 European Honey Buzzard(Pernis apivorus)
Hvepsevåge Regular 650 2017 1
02390 Red Kite (Milvus milvus) Rød Glente Regular 120 2017 CBM 102430 White-tailed Eagle
(Haliaeetus albicilla)Havørn Regular 54 2017 Special 2
02560 Short-toed Snake Eagle (Circaetus gallicus)
Slangeørn Regionally extinct 0 1877/1882 Confi rmed 1877/1882 (Olsen)
02600 Western Marsh Harrier (Circus aeruginosus)
Rørhøg Regular 650 2017 CBM 1
02610 Northern Harrier (Circus cyaneus) Blå Kærhøg Occasional 0 2002 Confi rmed 2002 (DATSY) 102630 Montagu´s Harrier
(Circus pygargus)Hedehøg Regular 23 2017 Special 2
Appendix 1

41PhD thesis by Henning Heldbjerg
Species no.
English (Latin) Danish Status Breeding population
2011
Last confi rmed breeding
Last breeding reference Project NOVANA Invasive
02670 Northern Goshawk (Accipiter gentilis)
Duehøg Regular 270 2017 CBM
02690 Eurasian Sparrowhawk (Accipiter nisus)
Spurvehøg Regular 2100 2017 CBM
02870 Common Buzzard (Buteo buteo) Musvåge Regular 5000 2017 CBM02960 Golden Eagle (Aquila chrysaetos) Kongeørn Regular 3 2017 Special 203010 Osprey (Pandion haliaetus) Fiskeørn Regular 3 2017 Special 203040 Common Kestrel
(Falco tinnunculus)Tårnfalk Regular 1500 2017 CBM
03100 Eurasian Hobby (Falco subbuteo) Lærkefalk Regular 17 201703200 Peregrine Falcon
(Falco peregrinus)Vandrefalk Regular 15 2017 2
03320 Black Grouse (Lyrurus tetrix) Urfugl Regionally extinct 0 1988 Confi rmed 1988 (DATSY) and 1991 (dofbasen.dk/ART)
03670 Grey Partridge (Perdix perdix) Agerhøne Regular 6000 2017 CBM03700 Common Quail (Coturnix coturnix) Vagtel Regular 1830 201703940 Common Pheasant
(Phasianus colchicus)Fasan Regular x 2017 1
04070 Water Rail (Rallus aquaticus) Vandrikse Regular 1100 2017 CBM04080 Spotted Crake (Porzana porzana) Plettet Rørvagtel Regular 46 2017 104210 Corn Crake (Crex crex) Engsnarre Regular 160 2017 104240 Common Moorhen
(Gallinula chloropus)Grønbenet Rørhøne
Regular 3600 2017 CBM
04290 Eurasian Coot (Fulica atra) Blishøne Regular 6800 2017 CBM04330 Common Crane (Grus grus) Trane Regular 142 2017 104500 Eurasian Oystercatcher
(Haematopus ostralegus)Strandskade Regular 7000 2017 CBM
04550 Black-winged Stilt (Himantopus himantopus)
Stylteløber Occasional 3 2014 Confi rmed 2014 (Atlas)
04560 Pied Avocet (Recurvirostra avosetta)
Klyde Regular 2400 2017 1
04690 Little Ringed Plover (Charadrius dubius)
Lille Præstekrave
Regular 300 2017
04700 Common Ringed Plover(Charadrius hiaticula)
Stor Præstekrave
Regular 1500 2017 CBM
04770 Kentish Plover (Charadrius alexandrinus)
Hvidbrystet Præstekrave
Regular 43 2017 1
04850 European Golden Plover (Pluvialis apricaria)
Hjejle Regular 1 2017 1
04930 Northern Lapwing (Vanellus vanellus)
Vibe Regular 20000 2017 CBM
05120 Dunlin (Calidris alpina) Almindelig Ryle Regular 135 2017 105170 Ruff (Calidris pugnax) Brushane Regular 66 2017 105190 Common Snipe
(Gallinago gallinago)Dobbeltbekkasin Regular 1300 2017 CBM
05200 Great Snipe (Gallinago media) Tredækker Regionally extinct 0 1902 Confi rmed 1902 (Olsen); Probable 2017 (Atlas)
05290 Eurasian Woodcock (Scolopax rusticola)
Skovsneppe Regular 2000 2017
05320 Black-tailed Godwit (Limosa limosa)
Stor Kobber-sneppe
Regular 532 2017
05410 Black-tailed Godwit (Numenius arquata)
Storspove Regular 451 2017 CBM
05460 Common Redshank (Tringa totanus)
Rødben Regular 9000 2017 CBM
05530 Green Sandpiper (Tringa ochropus)
Svaleklire Regular 30 2017
05540 Wood Sandpiper (Tringa glareola) Tinksmed Regular 94 2017 105560 Common Sandpiper
(Actitis hypoleucos)Mudderklire Occasional 0 2015 Confi rmed 2015 (Atlas);
Probable 2017 (DOFbasen)05610 Ruddy Turnstone
(Arenaria interpres)Stenvender Regular 36 2017
05750 Mediterranean Gull (Larus melanocephalus)
Sorthovedet Måge
Regular 22 2017 2
05780 Little Gull (Hydrocoloeus minutus) Dværgmåge Regular 1 2017 105820 Common Black-headed Gull
(Chroicocephalus ridibundus)Hættemåge Regular 80000 2017 CBM
05900 Mew Gull (Larus canus) Stormmåge Regular 33000 2017 CBM05910 Lesser Black-backed Gull
(Larus fuscus)Sildemåge Regular 5000 2017 CBM
05920 Herring Gull (Larus argentatus) Sølvmåge Regular 65000 2017 CBM06000 Great Black-backed Gull
(Larus marinus)Svartbag Regular 1800 2017 CBM
06020 Black-legged Kittiwake (Rissa tridactyla)
Ride Regular 340 2017
06050 Gull-billed Tern (Gelochelidon nilotica)
Sandterne Regular 1 2017 1
06060 Caspian Tern (Hydroprogne caspia)
Rovterne Regular 8 2017 1

42 PhD thesis by Henning Heldbjerg
Species no.
English (Latin) Danish Status Breeding population
2011
Last confi rmed breeding
Last breeding reference Project NOVANA Invasive
06110 Sandwich Tern (Sterna sandvicensis)
Splitterne Regular 3868 2017 1
06150 Common Tern (Sterna hirundo) Fjordterne Regular 425 2017 CBM06160 Arctic Tern (Sterna paradisaea) Havterne Regular 4500 2017 106240 Little Tern (Sternula albifrons) Dværgterne Regular 410 2017 106270 Black Tern (Chlidonias niger) Sortterne Regular 53 2017 106280 White-winged Tern (Chlidonias
leucopterus)Hvidvinget Terne Occasional 0 2016 Confi rmed 2016 (Atlas)
06340 Common Murre (Uria aalge) Lomvie Regular 2900 2017 106360 Razorbill (Alca torda) Alk Regular 1300 2017 106380 Black Guillemot (Cepphus grylle) Tejst Regular 1530 2017 106630 Pallas´s Sandgrouse
(Syrrhaptes paradoxus)Steppehøne Occasional 0 1888 Confi rmed 1888 (Olsen)
06650 Rock Dove (Columba livia) Klippedue (Tam-due)
Regular x 2017 1
06680 Stock Dove (Columba oenas) Huldue Regular 950 2017 CBM06700 Common Wood Pigeon
(Columba palumbus)Ringdue Regular 290000 2017 CBM
06840 Eurasian Collared Dove (Streptopelia decaocto)
Tyrkerdue Regular 26000 2017 CBM
06870 European Turtle Dove (Streptopelia turtur)
Turteldue Regular 100 2017
07085 Monk Parakeet (Myiopsitta monachus)
Munkeparakit Occasional 0 c. 1990 Confi rmed c. 1990 (DOFbasen)
1
07240 Common Cuckoo (Cuculus canorus)
Gøg Regular 17000 2017 CBM
07350 Barn Owl (Tyto alba) Slørugle Regular 65 201707440 Eurasian Eagle-Owl (Bubo bubo) Stor Hornugle Regular 70 2017 107570 Little Owl (Athene noctua) Kirkeugle Regular 30 201707610 Tawny Owl (Strix aluco) Natugle Regular 3100 2017 CBM07670 Long-eared Owl (Asio otus) Skovhornugle Regular 2000 201707680 Short-eared Owl (Asio fl ammeus) Mosehornugle Regular 5 2017 207700 Boreal Owl (Aegolius funereus) Perleugle Regular 7 2017 207780 European Nightjar (Caprimulgus
europaeus)Natravn Regular 510 2017 1
07950 Common Swift (Apus apus) Mursejler Regular 15000 2017 CBM08310 Common Kingfi sher (Alcedo atthis) Isfugl Regular 300 2017 108400 European Bee-eater (Merops
apiaster)Biæder Occasional 3 2017
08410 European Roller (Coracias garrulus)
Ellekrage Regionally extinct 0 1868 Confi rmed 1868 (Olsen)
08460 Eurasian Hoopoe (Upupa epops) Hærfugl Regionally extinct 0 1977 Confi rmed 1977 (DOFbasen; Olsen);
Probable 2014 (Atlas)08480 Eurasian Wryneck (Jynx torquilla) Vendehals Regular 48 201708560 European Green Woodpecker
(Picus viridis)Grønspætte Regular 320 2017 CBM
08630 Black Woodpecker (Dryocopus martius)
Sortspætte Regular 225 2017 CBM 1
08760 Great Spotted Woodpecker (Den-drocopos major)
Stor Flagspætte Regular 38500 2017 CBM
08830 Middle Spotted Woodpecker (Dendrocopos medius)
Mellemfl ag-spætte
Regionally extinct 0 1959 Confi rmed 1959 (Olsen);Probable 2016 (Atlas)
08870 Lesser Spotted Woodpecker (Dendrocopos minor)
Lille Flagspætte Regular 50 2017
09680 Short-toed Lark (Calandrella brachydactyla)
Korttået lærke Occasional 0 2011 Confi rmed 2011 (DOFbasen);Probable 2014 (Atlas)
09720 Crested Lark (Galerida cristata) Toplærke Regular 2 2017 209740 Woodlark (Lullula arborea) Hedelærke Regular 400 2017 109760 Eurasian Skylark (Alauda arvensis) Sanglærke Regular 700000 2017 CBM09810 Sand Martin (Riparia riparia) Digesvale Regular 11000 2017 CBM09920 Barn Swallow (Hirundo rustica) Landsvale Regular 230000 2017 CBM10010 Common House Martin
(Delichon urbicum)Bysvale Regular 38000 2017 CBM
10050 Tawny Pipit (Anthus campestris) Markpiber Regular 2 2017 210090 Tree Pipit (Anthus trivialis) Skovpiber Regular 10000 2017 CBM10110 Meadow Pipit (Anthus pratensis) Engpiber Regular 21000 2017 CBM10135 Eurasian Rock Pipit
(Anthus petrosus)Skærpiber Regular 100 2017
10170 Western Yellow Wagtail (Motacilla fl ava)
Gul Vipstjert Regular 6200 2017 CBM
10190 Grey Wagtail (Motacilla cinerea) Bjergvipstjert Regular 400 2017 CBM10200 White Wagtail (Motacilla alba) Hvid Vipstjert Regular 130000 2017 CBM10500 White-throated Dipper
(Cinclus cinclus)Vandstær Regular 1 2011 Confi rmed 2011 (DATSY) and
2016 (Atlas);Probable 2017 (DOFbasen)
10660 Winter Wren (Troglodytes troglodytes)
Gærdesmutte Regular 130000 2017 CBM

43PhD thesis by Henning Heldbjerg
Species no.
English (Latin) Danish Status Breeding population
2011
Last confi rmed breeding
Last breeding reference Project NOVANA Invasive
10840 Dunnock (Prunella modularis) Jernspurv Regular 50000 2017 CBM10990 European Robin
(Erithacus rubecula)Rødhals Regular 160000 2017 CBM
11030 Thrush Nightingale (Luscinia luscinia)
Nattergal Regular 9000 2017 CBM
11040 Common Nightingale (Luscinia megarhynchos)
Sydlig Nattergal Occasional 0 2006 Confi rmed 2006 (DOFbasen);Probable 2017 (Atlas)
11060 Bluethroat (Luscinia svecica) Blåhals Regular 314 2017 111210 Black Redstart
(Phoenicurus ochruros)Husrødstjert Regular 500 2017 CBM
11220 Common Redstart (Phoenicurus phoenicurus)
Rødstjert Regular 50000 2017 CBM
11370 Whinchat (Saxicola rubetra) Bynkefugl Regular 2700 2017 CBM11390 European Stonechat
(Saxicola rubicola)Sortstrubet Bynkefugl
Regular 58 2017
11460 Northern Wheatear (Oenanthe oenanthe)
Stenpikker Regular 2000 2017 CBM
11870 Common Blackbird (Turdus merula)
Solsort Regular 1700000 2017 CBM
11980 Fieldfare (Turdus pilaris) Sjagger Regular 500 2017 CBM12000 Song Thrush (Turdus philomelos) Sangdrossel Regular 220000 2017 CBM12010 Redwing (Turdus iliacus) Vindrossel Occasional 0 2003 Confi rmed 2003 (DOFbasen);
Probable 2014 (Atlas)12020 Mistle Thrush (Turdus viscivorus) Misteldrossel Regular 15000 2017 CBM12360 Common Grasshopper Warbler
(Locustella naevia)Græshoppe-
sangerRegular 1100 2017 CBM
12380 Savi´s Warbler (Locustella luscinioides)
Savisanger Regular 20 2017
12430 Sedge Warbler (Acrocephalus schoenobaenus)
Sivsanger Regular 2000 2017 CBM
12480 Blyth´s Reed Warbler (Acrocephalus dumetorum)
Buskrørsanger Occasional 0 2012 Confi rmed 2012 (DOFbasen);Probable 2014 (Atlas)
12500 Marsh Warbler (Acrocephalus palustris)
Kærsanger Regular 28000 2017 CBM
12510 Eurasian Reed Warbler (Acrocephalus scirpaceus)
Rørsanger Regular 34000 2017 CBM
12530 Great Reed Warbler (Acrocephalus arundinaceus)
Drosselrør-sanger
Regular 7 2017
12590 Icterine Warbler (Hippolais icterina) Gulbug Regular 7500 2017 CBM12730 Barred Warbler (Sylvia nisoria) Høgesanger Regionally extinct 0 1998 Confi rmed 1998 (DATSY)
and 2003 (DOFbasen);Probable 2008 (DATSY/
DOFbasen)12740 Lesser Whitethroat (Sylvia curruca) Gærdesanger Regular 100000 2017 CBM12750 Common Whitethroat
(Sylvia communis)Tornsanger Regular 320000 2017 CBM
12760 Garden Warbler (Sylvia borin) Havesanger Regular 130000 2017 CBM12770 Eurasian Blackcap
(Sylvia atricapilla)Munk Regular 440000 2017 CBM
12930 Greenish Warbler (Phylloscopus trochiloides)
Lundsanger Occasional 0 2014 Confi rmed 2014 (Atlas);Probable 2017 (DOFbasen)
13080 Wood Warbler (Phylloscopus sibilatrix)
Skovsanger Regular 4200 2017 CBM
13110 Common Chiff chaff (Phylloscopus collybita)
Gransanger Regular 300000 2017 CBM
13120 Willow Warbler (Phylloscopus trochilus)
Løvsanger Regular 260000 2017 CBM
13140 Goldcrest (Regulus regulus) Fuglekonge Regular 29000 2017 CBM13150 Firecrest (Regulus ignicapilla) Rødtoppet Fu-
glekongeRegular 25 2017
13350 Spotted Flycatcher (Muscicapa striata)
Grå Fluesnapper Regular 7000 2017 CBM
13430 Red-breasted Flycatcher (Ficedula parva)
Lille Fluesnap-per
Occasional 0 2016 Confi rmed 2016 (Atlas);Probable 2017 (DOFbasen)
13490 European Pied Flycatcher (Ficedula hypoleuca)
Broget Fluesnapper
Regular 8000 2017 CBM
13640 Bearded Reedling (Panurus biarmicus)
Skægmejse Regular 2000 2017
14370 Long-tailed Bushtit (Aegithalos caudatus)
Halemejse Regular 4700 2017 CBM
14400 Marsh Tit (Poecile palustris) Sumpmejse Regular 13000 2017 CBM14420 Willow Tit (Poecile montana) Fyrremejse Regular 500 201714540 European Crested Tit
(Lophophanes cristatus)Topmejse Regular 15000 2017 CBM
14610 Coal Tit (Periparus ater) Sortmejse Regular 90000 2017 CBM14620 Blue Tit (Cyanistes caeruleus) Blåmejse Regular 235000 2017 CBM14640 Great Tit (Parus major) Musvit Regular 700000 2017 CBM14790 Eurasian Nuthatch
(Sitta europaea)Spætmejse Regular 26000 2017 CBM

44 PhD thesis by Henning Heldbjerg
Species no.
English (Latin) Danish Status Breeding population
2011
Last confi rmed breeding
Last breeding reference Project NOVANA Invasive
14860 Eurasian Treecreeper (Certhia familiaris)
Træløber Regular 13000 2017 CBM
14870 Short-toed Treecreeper (Certhia brachydactyla)
Korttået Træløber
Regular 1500 2017
14900 Eurasian Penduline Tit (Remiz pendulinus)
Pungmejse Regular 6 2017
15080 Eurasian Golden Oriole(Oriolus oriolus)
Pirol Regular 9 2017
15150 Red-backed Shrike (Lanius collurio)
Rødrygget Torn-skade
Regular 1500 2017 CBM 1
15200 Great Grey Shrike(Lanius excubitor)
Stor Tornskade Regular 5 2017
15390 Eurasian Jay (Garrulus glandarius) Skovskade Regular 32000 2017 CBM15490 Eurasian Magpie (Pica pica) Husskade Regular 180000 2017 CBM15570 Spotted Nutcracker
(Nucifraga caryocatactes)Nøddekrige Regular 2 2009 Confi rmed 2009 (DATSY)
and 2016 (Atlas);Probable 2017 (Atlas)
15600 Western Jackdaw (Corvus monedula)
Allike Regular 100000 2017 CBM
15630 Rook (Corvus frugilegus) Råge Regular 75000 2017 CBM15671 Carrion Crow (Corvus corone) Sortkrage Regular 1000 2017 CBM15673 Hooded Crow (Corvus cornix) Gråkrage Regular 150000 2017 CBM15720 Northern Raven (Corvus corax) Ravn Regular 1000 2017 CBM15820 Common Starling
(Sturnus vulgaris)Stær Regular 270000 2017 CBM
15910 House Sparrow (Passer domesticus)
Gråspurv Regular 490000 2017 CBM
15980 Eurasian Tree Sparrow (Passer montanus)
Skovspurv Regular 450000 2017 CBM
16360 Common Chaffi nch (Fringilla coelebs)
Bogfi nke Regular 1300000 2017 CBM
16380 Brambling (Fringilla montifringilla) Kvækerfi nke Occasional 0 1974 Confi rmed 1974 (Dybbro)16400 European Serin (Serinus serinus) Gulirisk Regular 20 201716490 European Greenfi nch
(Chloris chloris)Grønirisk Regular 500000 2017 CBM
16530 European Goldfi nch(Carduelis carduelis)
Stillits Regular 230000 2017 CBM
16540 Eurasian Siskin (Spinus spinus) Grønsisken Regular 200 201716600 Common Linnet
(Linaria cannabina)Tornirisk Regular 100000 2017 CBM
16635 Lesser Redpoll (Acanthis cabaret) Lille Gråsisken Regular 6000 2017 CBM16650 Two-barred Crossbill
(Loxia leucoptera)Hvidvinget Korsnæb
Occasional 5 2015 Confi rmed 2015 (DOFbasen; Atlas)
16660 Common Crossbill(Loxia curvirostra)
Lille Korsnæb Regular 850 2017 CBM
16680 Parrot Crossbill (Loxia pytyopsittacus)
Stor Korsnæb Occasional 0 2017 Confi rmed 2017 (Atlas)
16790 Common Rosefi nch(Erythrina erythrina)
Karmindompap Regular 50 2017
17100 Eurasian Bullfi nch (Pyrrhula pyrrhula)
Dompap Regular 15000 2017 CBM
17170 Hawfi nch(Coccothraustes coccothraustes)
Kernebider Regular 9500 2017 CBM
18570 Yellowhammer (Emberiza citrinella)
Gulspurv Regular 310000 2017 CBM
18770 Common Reed Bunting (Emberiza schoeniclus)
Rørspurv Regular 36000 2017 CBM
18820 Corn Bunting (Emberiza calandra) Bomlærke Regular 28000 2017 CBM

45PhD thesis by Henning Heldbjerg
Appendix 2
Species no.
English (Latin) Danish Site Time Nesting Habitat
00120 Black-necked Grebe (Podiceps nigricollis) Sorthalset Lappedykker Unpredictable Day Colonial Wet
00950 Eurasian Bittern (Botaurus stellaris) Rørdrum Unpredictable Night Solitary Wet
01340 White Stork (Ciconia ciconia) Hvid Stork Unpredictable Day Colonial Farmland
01440 Eurasian Spoonbill (Platalea leucorodia) Skestork Predictable Day Colonial Coast
01540 Whooper Swan (Cygnus cygnus) Sangsvane Unpredictable Day Solitary Wet
01670 Barnacle Goose (Branta leucopsis) Bramgås Unpredictable Day Colonial Coast
01790 Eurasian Wigeon (Anas penelope) Pibeand Unpredictable Day Solitary Wet
01820 Gadwall (Anas strepera) Knarand Unpredictable Day Solitary Wet
01840 Eurasian Teal (Anas crecca) Krikand Unpredictable Day Solitary Wet
01890 Northern Pintail (Anas acuta) Spidsand Unpredictable Day Solitary Wet
01910 Garganey (Anas querquedula) Atlingand Unpredictable Day Solitary Wet
01940 Northern Shoveler (Anas clypeata) Skeand Unpredictable Day Solitary Wet
01960 Red-crested Pochard (Netta rufi na) Rødhovedet And Predictable Day Solitary Wet
02180 Common Goldeneye (Bucephala clangula) Hvinand Unpredictable Day Solitary Wet
02230 Common Merganser (Mergus merganser) Stor Skallesluger Predictable Day Solitary Wet
02310 European Honey Buzzard (Pernis apivorus) Hvepsevåge Unpredictable Day Solitary Forest
03100 Eurasian Hobby (Falco subbuteo) Lærkefalk Unpredictable Day Solitary Forest
03200 Peregrine Falcon (Falco peregrinus) Vandrefalk Predictable Day Solitary Coast
03700 Common Quail (Coturnix coturnix) Vagtel Unpredictable Night Solitary Farmland
04080 Spotted Crake (Porzana porzana) Plettet Rørvagtel Unpredictable Night Solitary Wet
04210 Corn Crake (Crex crex) Engsnarre Unpredictable Night Solitary Farmland
04330 Common Crane (Grus grus) Trane Unpredictable Day Solitary Wet
04560 Pied Avocet (Recurvirostra avosetta) Klyde Predictable Day Solitary Wet
04690 Little Ringed Plover (Charadrius dubius) Lille Præstekrave Unpredictable Day Solitary Wet
04770 Kentish Plover (Charadrius alexandrinus) Hvidbrystet Præstekrave Predictable Day Colonial Coast
04850 European Golden Plover (Pluvialis apricaria) Hjejle Predictable Day Solitary Heathland
05120 Dunlin (Calidris alpina) Almindelig Ryle Predictable Day Solitary Coast
05170 Ruff (Calidris pugnax) Brushane Predictable Day Solitary Coast
05290 Eurasian Woodcock (Scolopax rusticola) Skovsneppe Unpredictable Night Solitary Forest
05320 Black-tailed Godwit (Limosa limosa) Stor Kobbersneppe Predictable Day Colonial Coast
05530 Green Sandpiper (Tringa ochropus) Svaleklire Unpredictable Day Solitary Forest
05540 Wood Sandpiper (Tringa glareola) Tinksmed Predictable Day Colonial Wet
05610 Ruddy Turnstone (Arenaria interpres) Stenvender Unpredictable Day Solitary Coast
05750 Mediterranean Gull (Larus melanocephalus) Sorthovedet Måge Unpredictable Day Colonial Coast
05780 Little Gull (Hydrocoloeus minutus) Dværgmåge Predictable Day Colonial Wet
06020 Black-legged Kittiwake (Rissa tridactyla) Ride Predictable Day Colonial Coast
06050 Gull-billed Tern (Gelochelidon nilotica) Sandterne Unpredictable Day Colonial Coast
06060 Caspian Tern (Hydroprogne caspia) Rovterne Predictable Day Colonial Coast
06110 Sandwich Tern (Sterna sandvicensis) Splitterne Unpredictable Day Colonial Coast
06160 Arctic Tern (Sterna paradisaea) Havterne Unpredictable Day Colonial Coast
06240 Little Tern (Sternula albifrons) Dværgterne Unpredictable Day Colonial Coast
06270 Black Tern (Chlidonias niger) Sortterne Unpredictable Day Colonial Wet
06340 Common Murre (Uria aalge) Lomvie Predictable Day Colonial Coast
06360 Razorbill (Alca torda) Alk Predictable Day Colonial Coast
06380 Black Guillemot (Cepphus grylle) Tejst Predictable Day Colonial Coast
06870 European Turtle Dove (Streptopelia turtur) Turteldue Unpredictable Day Solitary Forest
07350 Barn Owl (Tyto alba) Slørugle Unpredictable Night Solitary Farmland
07440 Eurasian Eagle-Owl (Bubo bubo) Stor Hornugle Unpredictable Night Solitary Forest
07570 Little Owl (Athene noctua) Kirkeugle Unpredictable Night Solitary Farmland
07670 Long-eared Owl (Asio otus) Skovhornugle Unpredictable Night Solitary Forest
07680 Short-eared Owl (Asio fl ammeus) Mosehornugle Unpredictable Day Solitary Wet
07700 Boreal Owl (Aegolius funereus) Perleugle Unpredictable Night Solitary Forest
07780 European Nightjar (Caprimulgus europaeus) Natravn Unpredictable Night Solitary Forest
08310 Common Kingfi sher (Alcedo atthis) Isfugl Unpredictable Day Solitary Wet
08480 Eurasian Wryneck (Jynx torquilla) Vendehals Unpredictable Day Solitary Forest

46 PhD thesis by Henning Heldbjerg
Species no.
English (Latin) Danish Site Time Nesting Habitat
08870 Lesser Spotted Woodpecker (Dendrocopos minor) Lille Flagspætte Unpredictable Day Solitary Forest
09720 Crested Lark (Galerida cristata) Toplærke Predictable Day Solitary Urban
09740 Woodlark (Lullula arborea) Hedelærke Unpredictable Day Solitary Forest
10050 Tawny Pipit (Anthus campestris) Markpiber Predictable Day Solitary Heathland
10135 Eurasian Rock Pipit (Anthus petrosus) Skærpiber Unpredictable Day Solitary Coast
10500 White-throated Dipper (Cinclus cinclus) Vandstær Unpredictable Day Solitary Stream
11060 Bluethroat (Luscinia svecica) Blåhals Unpredictable Day Solitary Wet
11390 European Stonechat (Saxicola rubicola) Sortstrubet Bynkefugl Unpredictable Day Solitary Heathland
12380 Savi´s Warbler (Locustella luscinioides) Savisanger Unpredictable Day Solitary Wet
12530 Great Reed Warbler (Acrocephalus arundinaceus) Drosselrørsanger Unpredictable Day Solitary Wet
13150 Firecrest (Regulus ignicapilla) Rødtoppet Fuglekonge Unpredictable Day Solitary Forest
13640 Bearded Reedling (Panurus biarmicus) Skægmejse Unpredictable Day Solitary Wet
14420 Willow Tit (Poecile montana) Fyrremejse Unpredictable Day Solitary Wet
14870 Short-toed Treecreeper (Certhia brachydactyla) Korttået Træløber Unpredictable Day Solitary Forest
14900 Eurasian Penduline Tit (Remiz pendulinus) Pungmejse Unpredictable Day Solitary Wet
15080 Eurasian Golden Oriole (Oriolus oriolus) Pirol Unpredictable Day Solitary Forest
15200 Great Grey Shrike (Lanius excubitor) Stor Tornskade Predictable Day Solitary Heathland
15570 Spotted Nutcracker (Nucifraga caryocatactes) Nøddekrige Unpredictable Day Solitary Forest
16400 European Serin (Serinus serinus) Gulirisk Unpredictable Day Solitary Urban
16540 Eurasian Siskin (Spinus spinus) Grønsisken Unpredictable Day Solitary Forest
16790 Common Rosefi nch (Erythrina erythrina) Karmindompap Unpredictable Day Solitary Coast
Defi nitions Description Reference
Regular breeding Breeding 10 consecutive years Bioscience 2017b; updated to 2017
Regionally extinct Has been a regular breeding bird in Denmark but is extinct here now Bioscience 2017b; updated to 2017
Occasional Breeding less frequent than 10 consecutive years
Breeding population 2011/2012
The estimates for the Danish bird populations provided for this publication, however adapted where additional information
Birdlife International 2015
Last breeding references
"Last breeding year for species with a 2011/2012 population estimate of zero. Only confi rmed breeding. In addition, probable breeding if this is more recent"
Atlas Atlasbasen https://dofbasen.dk/atlas/ approached primo October 2017
DOFbasen www.dofbasen.dk; approached primo october 2017
Dybbro Dybbro, T. 1978: Oversigt over Danmarks fugle. – Dansk Ornitologisk Forening.
Grell Grell, M.B. 1998: Fuglenes Danmark. – Gads Forlag & Dansk Ornitologisk Forening.
DATSY Nyegaard, T, H. Meltofte, J. Toff t & M.B. Grell. 2014: Rare and threatened breeding birds in Denmark 1998-2012. In Danish with an English summary. – Dansk Orn. Foren. Tidsskr. 108: 1-144.
CBM Common Bird Monitoring Moshøj et al. 2017
Special Special initiatives to count the national population anually
NOVANA National Monitoring and Assessment Programme for the Aquatic and Terrestrial Environments
Miljøstyrelsen et al. 2017
ReferencesBioscience 2017b: Artsgrupper i den danske rødliste. http://bios.au.dk/videnudveksling/til-jagt-og-vildtinteresserede/redlistframe/artsgrupper/approached 29. aug. 2017.BirdLife International (2015) European Red List of Birds. Luxembourg: Offi ce for Offi cial Publications of the European Communities.Miljøstyrelsen, DCE – Nationalt Center for Miljø og Energi ved Aarhus Universitet samt GEUS – De Nationale Geologiske Undersøgelser for Danmark og Grønland 2017: NOVANA Det nationale overvågningsprogram for vandmiljø og natur 2017-21.Moshøj, C.M., D.P. Eskildsen, T. Nyegaard, M.F. Jørgensen & T. Vikstrøm (2017): Common Bird Census in Denmark 1975-2016. Annual report from the Danish Point Count Census. In Danish with an English summary. – Dansk Ornitologisk Forening.

Bird Conservation International, page 1 of 15. ©BirdLife International, 2017, doi:10.1017/S0959270916000654
HENNING HELDBJERG, PETER SUNDE and ANTHONY DAVID FOX
PAPER 2
CONTINUOUS POPULATION DECLINES FOR SPECIALIST FARMLAND BIRDS 1987-2014 IN DENMARK INDICATES NO HALT IN BIODIVERSITY LOSS IN AGRICULTURAL HABITATS
Photo: Steen E Jensen


49PhD thesis by Henning Heldbjerg
Bird Conservation International, page 1 of 15. © BirdLife International, 2017doi:10.1017/S0959270916000654
Continuous population declines for specialist farmland birds 1987-2014 in Denmark indicates no halt in biodiversity loss in agricultural habitatsHENNING HELDBJERG, PETER SUNDE and ANTHONY DAVID FOX
Summary
The 2020 EU biodiversity strategy aims to halt the loss of biodiversity and ecosystem services, but this requires effective monitoring to determine whether these aims are achieved. Common bird monitoring continuously assesses changes in the avian community, providing a powerful tool for monitoring temporal changes in the abundance and distribution of these upper trophic level con-sumers. Two-thirds of Denmark’s land area is intensively farmed, so agricultural habitats make a major contribution to Danish biodiversity. We looked for changes in abundance amongst farm-land birds in Denmark during 1987–2014 to test for reductions in declines and to predict whether the 2020-target can be expected to be achieved. Sixteen specialist farmland species were those showing the most rapid declines amongst 102 common breeding species in Denmark. Of these, those species nesting on the ground showed significant long-term declines, which was not the case for those that nest elsewhere, i.e. in hedgerows, trees and buildings. There was no evidence to sug-gest that these trends were attributable to widespread declines in long-distance migrant species (as reported elsewhere), which may be affected by conditions at other times in the annual cycle. We therefore conclude that continued declines in specialist farmland breeding bird species are due to contemporary agricultural changes within Denmark and urge habitat- and species-specific analy-sis to identify the core causes of these changes and halt the declines.
Introduction
In 2011, the European Commission adopted a new strategy to halt the loss of biodiversity by 2020 and restore previous losses as far as this is feasible. The situation amongst the farmland birds relates especially to the third of six targets in the strategy that focuses on improving the integration of biodiversity conservation into key policies for agriculture and forestry (European Commission 2011).
Denmark has one of Europe’s most intensively farmed landscapes, with approximately 66% of the total area cultivated (Danmarks Statistik 2009) mostly under winter wheat, grass ley, fodder and spring barley (Brink and Jensen 2012). The total area of arable agriculture has been more or less stable at c.27,000 km2 during 1920–1980, since when there has been a slight decline (Levin and Normander 2008). Danish farmland consists of two major predominant landscape types, arable areas (where tillage predominates) and mixed farming (with more permanent and managed grassland). These two types of farming have become increasingly regionally discrete, with pastoral agriculture primarily practiced in the west of Denmark and a more homogeneous arable landscape predomi-nating in the east of the country, a process that has continued since the 1980s (Reenberg 1988).

50 PhD thesis by Henning Heldbjerg
H. Heldbjerg et al. 2
The intensity of agricultural activity has been increasing in both the arable and pastoral sectors and in particular, arable practices have changed over time, especially in choice of crops, which has had an adverse effect on associated bird populations in Denmark (Fox 2004) as elsewhere in Europe (Donald et al. 2001) and across continents (Reif 2013).
The reformed EU Common Agricultural Policy (CAP) for 2014–2020 aims at reducing biodi-versity loss but has been criticised for having ‘such diluted environmental prescriptions that they are unlikely to benefit biodiversity’ (Pe’er et al. 2014). Because such a high proportion of Denmark is subject to intensive cultivation, farmland makes a disproportionate contribution to the mainte-nance of Danish biological diversity. This is particularly the case amongst bird species, which are a conspicuous and well monitored element of Danish biodiversity and which contribute greatly to that of farmland landscapes. Because of their mobility and situation in the upper trophic levels of such ecosystems, birds are considered to be good habitat indicators, showing sensitivity and rapid responses to anthropogenic change in the environment. Furthermore, monitoring data exist in the form of long term time-series on their abundance and distribution across large parts of Europe (Gregory and van Strien 2010). Here, we use data from the Common Bird Monitoring programme to study whether there has been a reduction in the decline of specialised farmland birds in Denmark, and use this information to provide a basis for raising key questions in the Discussion section about how we can achieve the 2020 goal.
Populations of common birds have been monitored in all Danish habitats and regions since the mid-1970s, providing information on changes in population size and their trends for common breeding bird species in Denmark over nearly 40 years. This programme is a powerful tool for monitoring changes in abundance within the bird community in any given period, as well providing insight to enable judgements as to whether the 2020-target is likely to be achieved. An earlier analysis showed that after major changes in the 1980s, the breeding birds of Danish farmland had shown less radical variation in abundance up until the early 2000s than in UK (Fox 2004). However, that study considered a wide spectrum of generalist avian species occurring in agricultural landscapes in Denmark, of which only limited proportions of their populations depend purely upon farmland as breeding habitat.
Here, we divide our study into two major parts. Firstly, we take the broad perspective and compare the rates of change of specialist farmland birds with those which specialised in using other habitats. Secondly we define a group of breeding bird species that show a high degree of specialism for farmland habitats (i.e. those species largely confined to farmland for breeding habitat; see Methods below for specific definitions) for more detailed studies and use these species to compare changes in their abundance during 2001–2014 with those during 1987–2001.
There have been substantial changes in the Danish agricultural landscape in the study period (see Discussion) and we seek to find support for the hypotheses that changes in abundance of dif-ferent farmland specialist bird species are related to their responses to differences in (i) farming type (species exploiting grasslands versus arable land), (ii) nest-site (those species which nest on the ground, usually within fields, versus those that build their nests elsewhere) to separate those species that nest in the fields and are thus fully dependent on the field environment from those species that are only partly dependent on field habitats and (iii) migratory strategy (long-distance, short-distance versus resident species). We use a model selection framework to explain the trends for each species incorporating these features as explanatory variables, contrasting those in the periods 1987–2001 and 2001–2014.
Materials and methods
Data collection and time series
The Danish Common Bird Monitoring (CBM) programme estimates indices and trends for common birds. It is based upon a point count census of breeding birds undertaken since 1976. This pro-gramme has involved sampling bird species abundance at more than 70 routes (>300 routes since 1987; mean ± 95% CI, 1987–2014 = 341 ± 11, median 346.5) throughout the country. Most routes

51PhD thesis by Henning Heldbjerg
Farmland bird declines in Denmark 3
consist of 20 (but always > 10) ‘points’ which are identical in subsequent years at which all birds seen and heard regardless of distance from observer were registered and recorded in a 5-min observation period (Heldbjerg 2005). Observers simultaneously counting birds also ascribe the habitat in quarters surrounding each count point to one or more of nine predefined basic habitat types: 1) Coniferous woodland, 2) Deciduous woodland, 3) Arable, 4) Grassland, 5) Heath, 6) Dunes/Shore, 7) Bog/Marsh, 8) Lake and 9) Urban. The best covered habitat types were combined into four broader habitat types: Urban (habitat type 9; Annual mean of 10% of totally monitored habitats; Eskildsen et al. 2013), Farmland (3,4; 39%), Freshwater (7,8; 10%), Forest (1,2; 38%) whereas the habitats with least coverage are omitted (5,6; 3%). Although only c.13.2% of the count points came from purely arable landscapes and c.1.5% from permanent meadows/grassland plots, the majority of the surveyed count points were from ‘mixed’ habitats, which included extensive areas of farmland. In total an annual mean of 27.8% and 11.1% of all habitat descriptions were from arable habitat and grasslands respectively. Each route was monitored by the same observer each year, at the same time of year (± 7 days), same time of day (± 30 min) and under comparable weather conditions. Although the CBM started in 1976 (Heldbjerg et al. 2014), because of rapid increases in the number of participants in the early years we restricted the time series to 1987–2014 to ensure robust and comparable data with more even coverage in all years for the more detailed analysis.
Selection of common bird species
Initially, we included all species from the Danish CBM (Heldbjerg et al. 2014). Mallard Anas platyrhynchos and Pheasant Phasianus colchicus were omitted from the analysis because their Danish populations are heavily influenced by rearing and releases (Noer et al. 2009). For the remaining 102 species, we compared the trends for the specialist farmland species with all special-ist species from other major habitats in order to compare the trends of farmland specialists to trends of specialists in other habitats.
Defining species relative habitat use
Not all avian species are habitat specialists, in the sense that they are almost exclusively found in only one of the above nine habitat types, so it is important to establish the degree to which species are confined to specific habitats or to what extent they are habitat generalists. Each species’ habitat association in the breeding season was defined in terms of their Relative Habitat Use (RHU), calculated as the abundance of a given species in a particular habitat relative to the mean abun-dance of that species in all other habitats. The number of observed individuals at each point was weighted with the proportion of the given habitat at the point. The sum of the weighted number of individuals of each species in a particular habitat could then be used to calculate a RHU value from the following equation:
/( )/( )
i i
i i
n pRelative Habitat Use
N n P p=
− −
where ni is the number of individuals in the ith habitat, pi is the total number of i-habitat points, adjusted according to proportional habitat share at each point, N is the total number of individuals and P is the total number of points. For full details and examples, see Larsen et al. 2011 (Figure 1) and Eskildsen et al. (2013).
A RHU > 2 indicates an abundance in the specified habitat at least twice the mean abundance in all other habitats, representing a High use habitat specialist (HiU). Where 2 > RHU > 1, this indi-cates an abundance in the given habitat above the mean elsewhere (but less than double) defined here as Intermediate use habitat specialist (IU). Where RHU < 1, the species is considered a general-ist, which uses the given habitat less than other habitats, and these are omitted from this study.

52 PhD thesis by Henning Heldbjerg
H. Heldbjerg et al. 4
Defining farmland
The habitat here defined as Farmland (F) is a combination of the two habitat categories in the CBM programme, Arable (A) and Grassland (G) habitats. A consists of arable areas such as fields and fallow land, as well as associated lesser elements within the arable landscape like hedgerows, farms and orchards. G consists of meadows, salt marshes, pastures, dry grassland and other grass-dominated areas with or without scattered trees and/or shrubs.
Defining farmland birds
We defined Farmland birds (FB) as all species which had a RHU value for F (consisting of A and G ) that was larger than 1. However, the G constitutes a relatively small area but is broad in its definition (e.g. including salt marshes). G therefore included breeding species that were not typi-cally confined to farmland habitats, which we subsequently removed (e.g. Greater Black-backed Gull Larus marinus). We also removed those species with a Danish breeding population of less than 1,000 pairs (e.g. Curlew Numenius arquata) and species for which less than 50 individuals were registered per year (e.g. Sparrowhawk Accipiter nisus, Common Wheatear Oenanthe oenanthe and Grasshopper Warbler Locustella naevia). The final list of FB therefore included 41 species (Appendix S1 in the online Supplementary Material).
Levels of analysis
In this study, we undertook two levels of analysis. First, we compared the trends for High Use Farmland Birds (HiUFB) with HiU species of other habitats and then we focused only on farmland birds. For the latter group we first compared HiUFB with Intermediate Use Farmland Birds (2 > RHU > 1; IUFB) and then we combined these two categories to generate a broader category of avian species associated with farmland (RHU > 1; FB).
Defining and comparing specialists in different habitat categories
We followed the indicator species selection from Eskildsen et al. (2013) where the HiU indi-cators for the broad habitats Urban, Farmland, Freshwater and Forest was found to cover 75% of all species included in the CBM and categorized the rest as Non-habitat specific.
Figure 1. Histograms showing the mean percentage change per year in index values generated by log-linear modelling of Danish breeding bird point count data (± 95% CI) showing long term (1987–2014) trends for 102 common Danish breeding bird species divided into their Relative Habitat Use specialist groups (RHU > 2; HiU).

53PhD thesis by Henning Heldbjerg
Farmland bird declines in Denmark 5
We analysed changes in abundance with regard to these major habitats and compared trends (mean percentage change per year), using the additive slope provided by TRIM for 1987–2014 between groups by presenting an assessment of the variance within each group to show differences. In order to describe recent trends in farmland birds we also introduced a change point in 2001 (the last year included in Fox 2004) also used as base year (index 100) and compared the changes before and after this year.
Population indices and trends
Population indices and trends for all 102 species were calculated by fitting a log linear regression model to point count data with Poisson error terms using the software TRends and Indices for Monitoring data (TRIM; Pannekoek and van Strien 2004), where the count at a given site in a given year is assumed to be the result of a site and a year effect. The programme also estimates the dispersion factor, correcting for over-dispersion where this occurs, and takes account of serial correlation between counts at the same site in different years. Standard errors for the indices are generated based on the assumption that the variance is proportional to the mean, and a pattern of serial correlation, which declines exponentially with time between counts (Pannekoek and van Strien 2004). The assessment of the annual rate of change was used in this study to generate species trends, taking the standard errors into account. The population changes were described by indices and we are only interested in the relative changes (not the absolute number) for each species during the study period. Subsequently, individual species indices were combined into a single indicator value in each year for all species belonging to the same farmland birds specialisation category. The multi-species indicators were calculated as the geometric mean of the individual species indices for each year. The index mean is considered a measure of biodiversity change, a stable indicator trend reflects a balance between positive and negative indices whereas a reduction in index mean will occur if more species are declining than increasing and vice versa (Buckland et al. 2005; Gregory et al. 2005). Two indicators were produced for those bird spe-cies which specialised in each habitat: one for HiUFB and one for IUFB. Low-use species with an RHU < 1 were omitted from the analyses on the assumption that such species were habitat generalists.
Since there was a high degree of consistency between the population trends calculated using habitat-specific point counts and using all point counts irrespective of habitat (Eskildsen et al. 2013; based on percentage population changes on the same data across 24 years (1986–2009) from 12 habitat categories, r2 = 0.82), in this study we used data from all point counts relating to a given species, not only those from points in their primary habitat.
Model for the trends for all 41 farmland birds
Among the 41 FB we included a number of parameters in a model analysed separately for the earlier (1987–2001) and most recent (2001–2014) 14-year periods by using generalised linear models (GLIMMIX procedure in SAS 9.4) on the basis of maximum likelihood optimisation (‘method=mspl’ statement).
1. Influence of farmland typeWe compared the trends for species in grassland habitat to species in arable habitat. For this
purpose we used the RHU in each of the habitat types Grassland (RHUG) and Arable (RHUA) as well as the combined Farmland habitat (RHUF).
2. Influence of nesting siteWe compared ground-nesting species to species nesting outside of the fields (defined using
Ferguson-Lees et al. 2011) to test whether those species habitually exploiting fields for nest sites were more likely to be declining than those more associated with field margins and other elements of the agricultural landscape.

54 PhD thesis by Henning Heldbjerg
H. Heldbjerg et al. 6
3. Influence of migratory patternsDeclining farmland bird species that winter elsewhere could potentially be subject to factors
acting at other points in the annual life cycle other than on Danish farmland. Given the general decline among Trans-Saharan migrants in Denmark (Heldbjerg and Fox 2008) and Europe in general (Vickery et al. 2014), we also grouped species by their migratory strategy, i.e. long dis-tance migrants (Trans-Saharan migrants), short distance migrants (Europe and North Africa) and resident species based on ringing-recovery data on Danish breeding birds (Bønløkke et al. 2006).
Statistical analysis
The most parsimonious models to describe the trend patterns were identified by comparing AICc weight of 16 candidate models representing all main effect combinations of nesting behaviour (ground nester or not ground nester), migration strategy (resident, short distance migrator, long distance migrator) and specialisation to F, A or G (using log-transformed RHU-variables in order to achieve normal distributed data).
To investigate whether population trends differed between the two periods, we compared AICc weights of models explaining the 14-year population trends in the combined dataset (41 species × 2 periods = 82 trend values). For this analysis, we evaluated models with and without time period, nesting behaviour and specialization to arable land as main effects and interaction terms between time period and nesting behaviour, migration strategy and specialisation to arable land, respectively. Nesting behaviour and specialization to arable land were selected as the top-ranked variables in the initial analysis.
In addition to the candidate models with different predictor combinations of central tendency described above, we also evaluated models with heteroscedasticity (unequal variance) between groups (nesting behaviour, migration strategy and time period).
Results
Farmland specialists compared to specialists in other habitats
Of all the major Danish habitat types, the strongest declines in habitat specialists (RHU > 2, Eskildsen et al. 2013) among the 102 common breeding birds in the period 1987–2014 were found in the farm-land habitat (Figure 1). The majority of farmland bird populations showed decreasing or stable trends (Table 1) and overall tended to show more negative trends compared to species exploiting other habi-tats. This fact is the background for more detailed studies on all 41 Farmland birds (FB).
Differences in trends related to the specialization of the farmland birds
Long term (1987–2014) declines amongst the 41 FB species mainly occurred among HiUFB, of which 63% declined and 19% increased. On average, there was an annual -1.55% long term decline (95% CI: -1.76% to -1.33%) in HiUFB species over the period 1987–2014 (n = 28, r2 = 0.893, P < 0.0001, Fig. 2). In comparison, species categorised as IUFB decreased on average with
Table 1. Numbers of common Danish bird species showing differing long and short term trends, broken down by High use (HiUFB) and Intermediate use (IUFB) of farmland habitats (see text for details).
1987–2014 1987–2001 2001–2014
Farmland HiUFB IUFB HiUFB IUFB HiUFB IUFB
Increase 3 9 3 10 3 6Stable 3 7 4 6 4 4Decline 10 9 9 9 9 15SUM 16 25 16 25 16 25
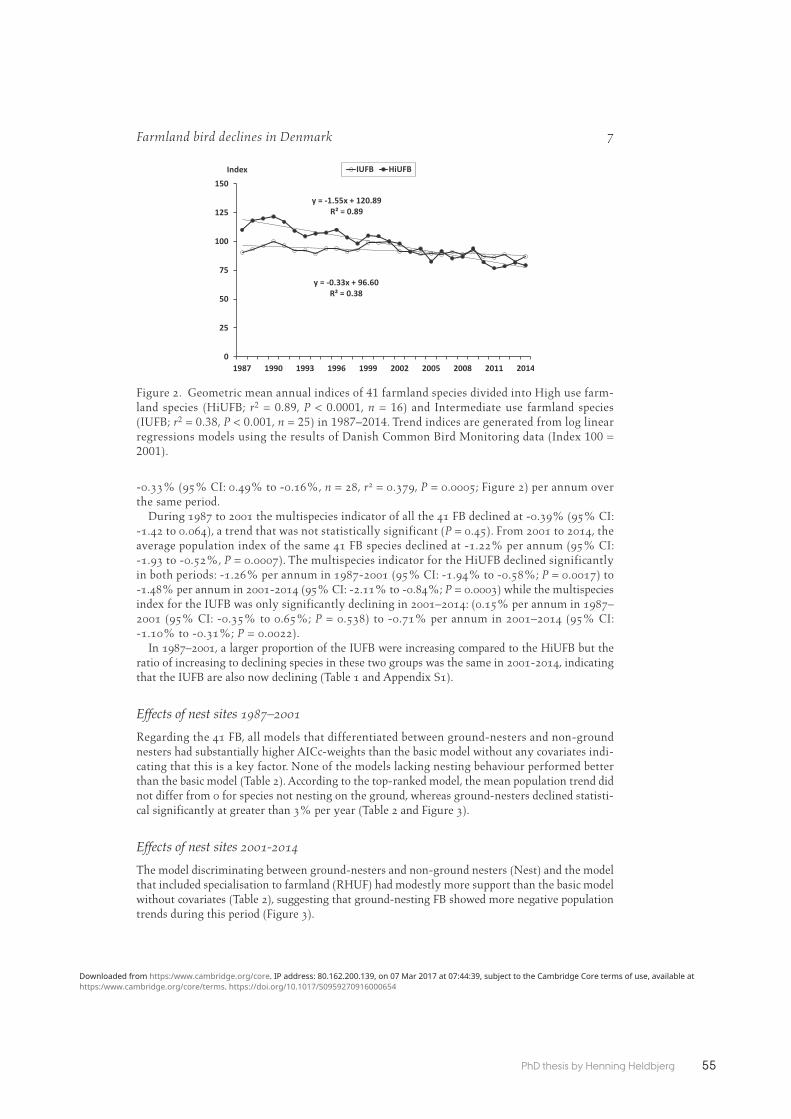
55PhD thesis by Henning Heldbjerg
Farmland bird declines in Denmark 7
-0.33% (95% CI: 0.49% to -0.16%, n = 28, r2 = 0.379, P = 0.0005; Figure 2) per annum over the same period.
During 1987 to 2001 the multispecies indicator of all the 41 FB declined at -0.39% (95% CI: -1.42 to 0.064), a trend that was not statistically significant (P = 0.45). From 2001 to 2014, the average population index of the same 41 FB species declined at -1.22% per annum (95% CI: -1.93 to -0.52%, P = 0.0007). The multispecies indicator for the HiUFB declined significantly in both periods: -1.26% per annum in 1987-2001 (95% CI: -1.94% to -0.58%; P = 0.0017) to -1.48% per annum in 2001-2014 (95% CI: -2.11% to -0.84%; P = 0.0003) while the multispecies index for the IUFB was only significantly declining in 2001–2014: (0.15% per annum in 1987–2001 (95% CI: -0.35% to 0.65%; P = 0.538) to -0.71% per annum in 2001–2014 (95% CI: -1.10% to -0.31%; P = 0.0022).
In 1987–2001, a larger proportion of the IUFB were increasing compared to the HiUFB but the ratio of increasing to declining species in these two groups was the same in 2001-2014, indicating that the IUFB are also now declining (Table 1 and Appendix S1).
Effects of nest sites 1987–2001
Regarding the 41 FB, all models that differentiated between ground-nesters and non-ground nesters had substantially higher AICc-weights than the basic model without any covariates indi-cating that this is a key factor. None of the models lacking nesting behaviour performed better than the basic model (Table 2). According to the top-ranked model, the mean population trend did not differ from 0 for species not nesting on the ground, whereas ground-nesters declined statisti-cal significantly at greater than 3% per year (Table 2 and Figure 3).
Effects of nest sites 2001-2014
The model discriminating between ground-nesters and non-ground nesters (Nest) and the model that included specialisation to farmland (RHUF) had modestly more support than the basic model without covariates (Table 2), suggesting that ground-nesting FB showed more negative population trends during this period (Figure 3).
Figure 2. Geometric mean annual indices of 41 farmland species divided into High use farm-land species (HiUFB; r2 = 0.89, P < 0.0001, n = 16) and Intermediate use farmland species (IUFB; r2 = 0.38, P < 0.001, n = 25) in 1987–2014. Trend indices are generated from log linear regressions models using the results of Danish Common Bird Monitoring data (Index 100 = 2001).

56 PhD thesis by Henning Heldbjerg
H. Heldbjerg et al. 8
Figure 3. Mean annual changes (± 95% CI) in population abundance index of common Danish farmland bird species divided on period and nesting behaviour (n = 8 ground nesting species, 33 non-ground nesting species).
Comparison between Arable and Grassland specialists
Three times as many farmland bird species were significantly declining during 2001–2014 as were significantly increasing amongst the HiUFB and IUFB (Table 1; see Appendix S1 in supporting information). The RHU for each farmland species is included for Arable habitat, Grassland habitat and for the combined Farmland habitat to categorize each species as an Arable species or a Grassland specialist.
Table 2. Parsimony statistics of candidate models to explain variation in population trends of 41 common breeding bird species in Denmark 2001-14 (a) and 1987-2001 (b). wi = Akaike’s weight, ER(.) = evidence ratio in Akaike’s weights relative to the basic model only estimating the intercept. Abbreviations for predictor variables: Nest = Ground nester or non-ground nester, Mig = Migration strategy (resident, short-distance migrant, long-distance migrant), RHUA = specialization to arable habitats, RHUG = specialization to grassland habitats, RHUF = specialization to farmland habitats.
a) 2001–2014 b) 1987–2001
Model AICc wi ER(.) Model AICc wi ER(.)
Nest 0.00 0.229 3.4 RHUA + Nest 0.00 0.276 27.4RHUF 0.02 0.226 3.4 Nest 0.97 0.170 16.9RHUF + Nest 1.53 0.107 1.6 RHUF + Nest 1.27 0.146 14.5RHUG + Nest 2.07 0.081 1.2 RHUG + Nest 1.83 0.110 11.0. 2.45 0.067 . RHUA + Nest + Mig 2.18 0.093 9.2RHUA + Nest 2.45 0.067 1.0 Nest + Mig 2.63 0.074 7.4Nest + Mig 2.88 0.054 0.8 RHUF + Nest + Mig 2.86 0.066 6.6RHUA 3.66 0.037 0.5 RHUG + Nest + Mig 4.38 0.031 3.1RHUF + Mig 3.84 0.034 0.5 . 6.62 0.010 .RHUG 4.17 0.028 0.4 RHUG 7.03 0.008 0.8RHUF + Nest + Mig 5.10 0.018 0.3 RHUF 8.14 0.005 0.5RHUA + Nest + Mig 5.46 0.015 0.2 RHUA 8.89 0.003 0.3RHUG + Nest + Mig 5.63 0.014 0.2 Mig 9.26 0.003 0.3Mig 5.83 0.012 0.2 RHUG + Mig 9.36 0.003 0.3RHUA + Mig 6.66 0.008 0.1 RHUF + Mig 10.81 0.001 0.1RHUG + Mig 8.04 0.004 0.1 RHUA + Mig 11.82 0.001 0.1

57PhD thesis by Henning Heldbjerg
Farmland bird declines in Denmark 9
Of the seven Arable HiU species, five, Kestrel Falco tinnunculus, Grey Partridge Perdix perdix, Lapwing Vanellus vanellus, Skylark Alauda arvensis and Yellow Wagtail Motacilla flava, have all been declining in this period. Ten out of 17 Grassland HiU species have significantly declined over this period. Greylag Goose Anser anser, Marsh Harrier Circus aeruginosus and Herring Gull Larus argentatus are the only exceptions that were significantly increasing.
Comparison of 1987–2001 vs. 2001–2014 and the two periods combined
The top-ranked model for the combined dataset (trends 1987–2001 and 2001–2014) predicted more negative population trends for ground nesters than non-ground nesters with higher residual vari-ance in the first than in the second period (Table 3). Models including effects of habitat specialisation (RHUF) or migratory behaviour all performed worse than model alternatives without these terms (Table 3). Models with main effects of period or interaction effects of period with nesting behaviour performed marginally worse than model alternatives without these effects (Table 3), suggesting lit-tle support for substantial differences in population trend patterns in the two periods. Predictions from models with interactive effects of period and nesting behaviour, suggested that ground nesters declined at an average rate of about 3% per year in both periods, whereas non-ground nesters appeared to be stable in the first period, but declined with an average rate of 1% per year in the second period. The top-ranked model included nesting behaviour without any effect of period. This model generated an average annual decline of c.3% for ground nesters, but found no significant decline for non-ground nesters throughout the entire period, 1987–2014 (Figure 3). Only three out of 16 HiUFB showed significant increases during 1987–2014, namely Marsh Harrier increasing at 3.3% per year, Common Gull Larus canus at 2.2 % per year and Common Whitethroat Sylvia com-munis at 0.5% per year. The two former are both breeding in other habitat types and only partly foraging in the farmland habitat, which shows the potential importance of farmland as foraging habitat for birds nesting in other habitats. In contrast, 10 species declined significantly, of which Whinchat Saxicola rubetra showed an average decline of > 5% per year, corresponding to a halving of the population within 14 years. Another seven species were declining at > 2% per year, halving their population size within 35 years: Grey Partridge, Oystercatcher Haematopus ostralegus, Lapwing, Skylark, Meadow Pipit Anthus pratensis, Yellow Wagtail, and Starling Sturnus vulgaris.
Table 3. Parsimony statistics of candidate models to explain variation in population trends of common breed-ing bird species in Denmark 1987-2001 and 2001-14 (n = 82 time series from 41 species, (see Appendix S1). wi = Akaike’s weight, ER(.) = evidence ratio in Akaike’s weights to ‘base’ model only estimating the intercept. Abbreviations for predictor variables: Nest = Ground nester or non-ground nester, P = period (1987-2001 vs 2001-2014), Mig = Migration strategy (resident, short-distance migrant, long-distance migrant), RHUA = specialization to arable habitats.
Fixed effects Heteroscedasticity AICc wi ER(.)
Nest P 0.00 0.233 518Nest + P P 0.29 0.201 448RHUA + Nest P 1.35 0.118 264Nest*P P 1.41 0.115 256RHUA + Nest + P P 1.66 0.101 226Nest . 2.29 0.074 165RHUA + Nest*P P 2.82 0.057 126RHUA*P + Nest*P P 2.82 0.057 126RHUA*P + Nest P 3.67 0.037 83. P 9.07 0.002 5.6P P 9.58 0.002 4.3. Nest 11.53 0.001 1.6. . 12.50 0.000 .. Mig 12.81 0.000 0.9. Nest*P 12.73 0.000 0.9

58 PhD thesis by Henning Heldbjerg
H. Heldbjerg et al. 10
Discussion
This analysis established that Danish specialist farmland birds have shown greater long term declines in abundance than specialists in other habitats. The analysis also showed that amongst these farmland birds, ground nesting species showed greater declines in the period 1987–2001 and whereas in 2001–14 this trend continued, in the latter period there are also significant declines amongst species not nesting on the ground as well.
Long-term declines in farmland bird populations
After apparent stability in 1987–2001, the farmland specialist species in Denmark are now showing long term declines in contrast to species in other habitats. Although less dramatic than in the late 1970s and early 1980s (Eskildsen et al. 2013), this is important within Denmark because such a large area of the land surface is under cultivation.
Fox (2004) analysed Danish farmland bird populations in 1983–2001 in relation to changes in 26 agricultural variables, comparing these with the situation in UK and found marked differ-ences between national patterns of agriculture and more favourable population trends in Denmark compared to the UK. The present study included additional data from 13 more years (2002–2014), calculated trends using TRIM software (rather than the chain-index method) and selected spe-cies based on their habitat preferences in the Danish landscape. Eskildsen et al. (2013) found that while generalist species using farmland showed stable trends, the specialist species have shown consistent declines since the 1990s (see their Figure 3).
The situation in Denmark is now very similar to that found throughout Europe in general. The Farmland Bird Indicator (FBI) combines the aggregate population trends of 39 species classified as farmland birds on a European scale, of which 24 are decreasing and only six are increasing, with a further six showing stable and three uncertain trends. Overall, the indicator shows a decline of 54% during 1980–2012 (EBCC 2014).
Because the farming landscape represents two-thirds of the total land area in Denmark, agri-biodiversity makes an important contribution to overall biological diversity, so it is important to establish hypotheses relating to potential factors responsible for species declines in order to develop adaptive management options and mitigating actions to reduce and reverse species declines where possible.
Arable versus grassland species
The Farmland birds generally showed adverse population trends across both grassland and arable agriculture, however, model selection for the period 1987–2001 suggested that ground-nesting species associated with arable habitat were suffering more acute problems associated with this type of farming.
With the notable exception of Grey Partridge, all of the declining HiU species are associated with grazed grassland habitats at some stage in their breeding cycle, which suggest changes in such habi-tats may be implicated in their change of status. The consequences of the decline in grazing pressure is known to have an adverse effect on the Starling (Heldbjerg et al. 2016). Given the dramatic expan-sion in rotational grassland throughout Denmark and the removal of grazing animals from grass-land outdoors into buildings for most or all of the year, there is an urgent need for more detailed investigation of how these major changes in agriculture affects the changes in population sizes of the species associated with different types of managed grassland (which include Snipe Gallinago gallinago, Oystercatcher, Lapwing, Skylark, Meadow Pipit and Yellow Wagtail).
The number of species significantly declining among the IUFB was less than the HiUFB in 1987–2001 but at the same level in 2001-2014, suggesting that the most specialised farmland species experienced the greatest difficulties in the first period but both groups have problems in the contemporary Danish agricultural landscape.

59PhD thesis by Henning Heldbjerg
Farmland bird declines in Denmark 11
Effects of nest site
Ground-nesting species showed significant decreases, whilst those species not nesting on the ground only shows declines since 2001, even though both sets of species tend to forage within the same habitat. This could suggest some causal link with tillage and conditions within the field where we assume that most nests are placed, but these are factors that need to be further investigated with regards to the species concerned. It has been shown in several studies that the effects of agricultural intensification affects farmland specialists (Donald et al. 2001) and habitat generalists if they feed in farmland and especially if they are specialist seed eaters, e.g. Linnet Carduelis cannabina (Hewson and Noble 2009, Reif et al. 2011). The only arable HiUFB species that was not declining in the long term period and/or the most recent short term period was the Barn Swallow Hirundo rustica, which does not nest in fields. The remainder of the ground-nesting species with less affiliation to arable habitat were declining and all eight ground-nesting species of the 41 FB also showed significant declines in the long term and/or the most recent period which underlines the need for further research to uncover the reasons for these patterns. Van Turnhout et al. (2010) also found ground-nesting species to be declining in the Netherlands, although Reif et al. (2010) found no general relationship between species’ nest sites and their population trends in the Czech Republic.
Effects of migratory behaviour
Although we investigated the alternative hypothesis that it could be factors outside the Danish farmland landscape that could be affecting the status of populations, and despite the fact that the three species with the largest decline are African migrants, there was little evidence that long or short distance migrants were suffering more adverse population trends than sedentary birds (confirmed by Vickery et al. 2014). This suggests the declines are somehow mainly connected to factors operating within the Danish agricultural landscape. This seems to be the case for the Whinchat, based on levels of unoccupied suitable wintering habitat in Africa, see Hulme and Cresswell (2012), but which is associated with low intensity grazing of marginal grasslands in Denmark, which are increasingly being abandoned or intensified.
Agricultural changes in Denmark
Farmland practices have changed drastically before and up to the start of our study period. The first and most important change that occurred in the Danish farming landscape between the early 1980s and the mid-1990s was the change from spring barley (which declined from 1.4 to 0.6 mill. hectares) to winter wheat (which increased from 0.18 to 0.7 mill. hectares) which undoubtedly affected many farmland specialist bird species at the time (see Figure 1 in Fox 2004). However, since then, the most marked changes in the Danish farming landscape have been: (i) the 50% increase in the area of rotationally managed grassland and clover since 2004, especially after set-aside was removed from the Danish farmland landscape after 2008, (ii) the upsurge in rape cultivation and especially (iii) the 15-fold increase in the area of maize cultivated (Danmarks Statistik 2016; Appendix S2 in the Supplementary Materials). Between 1993 and 2008, 150,000–200,000 ha of land were taken out of production as set-aside. Although some authors suggest very little biodiversity benefit from such land abandonment without set management goals (e.g. Sotherton 1998, Sotherton et al. 1994), in Ireland, non-rotational set-aside attracted many birds species, in particular Skylark and Meadow Pipit, at densities much higher than adjacent agricultural fields (Bracken and Bolger 2006). In the UK rotational set-aside was equally effective at attracting higher densities and species diversity of birds in summer compared to adjacent cul-tivated fields (Henderson et al. 2000a, 2000b), including those species showing declines in Danish farmland, Grey Partridge, Skylark, Linnet and Yellowhammer Emberiza citrinella (e.g. Buckingham et al. 1999). Hence, it seems likely that loss of set-aside in 2008 from the Danish agricultural landscape could have contributed to the declines of some key species since that time. Finally, the most
60 PhD thesis by Henning Heldbjerg
H. Heldbjerg et al. 12
dramatic and ongoing change in the agricultural landscape since the millennium has been the increase in the areas of land cultivated for maize, which have increased from 50,000 ha in 2000 to c.180,000 ha in 2015 (Appendix S2). Maize generally grows too late and develops above ground biomass too densely to support breeding bird species of any kind in Europe (e.g. Engel et al. 2012, Sauerbrei et al. 2014). Hence, one urgent line of enquiry is to better understand the effects of maize cultivation on breeding birds across Denmark and the consequences for its continued spread in the future.
Although the combination of changes in cropping (cereals, maize and rape) could have contrib-uted to the long-term declines in specialist farmland bird populations, it is not easy to assign specific declines in farmland birds to one single parameter, especially when changes in crop area are spread over many years of gradual change. Reif et al. (2008) suggests that we should analyse patterns at a finer scale than the classical broad habitat classes such as “farmland”, “forest” etc. to understand the direct reasons behind general declines because habitat association is a continuous rather than categorical variable. There is no doubt we need to understand more about how individ-ual species exploit very specific crops and biotopes and in what ways during the course of the annual avian and agricultural cycle, not least because with a single habitat the same change can adversely affect one species whilst benefitting another.
Achieving the 2020 goal
We now have good knowledge about the trends for each of the common birds in Denmark and we witness a general major decline in avian farmland specialists, which raises two questions. Firstly, do we know what is needed to identify the reasons behind the declines in a way that help to restore the different species to more favourable conservation status? Secondly, does Danish society care enough about these facts to be willing to try to improve the situation for the farmland birds? The key questions here relate to (i) What are the species-specific reasons for declines? (ii) What can we do in practical terms to reverse these trends? (iii) What are the costs of these actions to farm-ers, society and food security? (iv) Is this a price society is willing to pay? But before we can answer these questions, we will need studies focussed on the key declining species throughout the annual cycle in the Danish farmland landscape as undertaken elsewhere in order to understand their breeding biology and the reasons for the specific declines among farmland species.
Conclusions
This study shows that farmland specialists in Denmark are in decline and most problems are associ-ated with those that nest on the ground which are showing the worst declines. There was also weak support for species associated with arable agriculture are suffering more than those on grazing areas, but species are suffering in both agricultural landscapes. This suggests that species specific studies are needed to understand the changes in abundance of single species in relation to changing patterns of agriculture and especially arable farming in time and space. Such knowledge will be essential if we hope to reverse changes in declining farmland bird populations before 2020 through evidence-based conservation interventions and targeted conservation management actions.
Supplementary Material
To view supplementary material for this article, please visit https://doi.org/10.1017/S0959270916000654
Acknowledgements
This study would not have been possible without the large numbers of birdwatchers that have contributed data to the common bird monitoring year after year: our very sincere thanks to each

61PhD thesis by Henning Heldbjerg
Farmland bird declines in Denmark 13
and every one of you. HH acknowledges the support of an industrial PhD stipend awarded by Innovationsfonden, which, together with Aage V Jensen Naturfond and 15. Juni Fonden also supported this work. We also gratefully acknowledge The Danish Nature Agency for funding the project: “Agerlandets almindelige og sjældne fugle”, of which this study is part and to Jiri Reif and two anonymous referees for helpful suggestions for how to improve an earlier version of the manuscript.
References
Bønløkke, J., Madsen, J. J., Thorup, K., Pedersen, K. T., Bjerrum, M. and Rahbek, C. (2006) Dansk Trækfugleatlas. Humlebæk, Denmary: Rhodos. (In Danish).
Bracken, F. and Bolger, T. (2006) Effects of set-aside management on birds breeding in lowland Ireland. Agric. Ecosyst. Environ. 117: 178–184.
Brink, M. and Jensen, J. (2012) Denmark. Pp. 184–189 in R. Oppermann, G. Beaufoy and G. Jones, eds. High nature value farming in Europe. 35 European countries - expe-riences and perspectives. Ubstadt-Weiher: Verlag Regionalkultur.
Buckingham, D. L., Evans, A. D., Morris, A. J., Orsman, C. J. and Yaxley, R. (1999) Use of set-aside land in winter by declining farm-land bird species in the UK. Bird Study 46: 157–169.
Buckland, S. T., Magurran, A. E., Green, R. E., Fewster, R. M. (2005) Monitoring change in biodiversity through composite indices. Phil. Trans. Roy. Soc. B 360: 243–254.
Danmarks Statistik (2009) Danmark i tal 2009. Copenhagen, Denmark: Danmarks Statistik. (In Danish). Accessible at: http://www.dst.dk/pukora/epub/upload/13448/dkital.pdf (last accessed 20 June 2016).
Danmarks Statistik (2016) Stat Bank Denmark. http://www.statbank.dk/statbank5a/default.asp?w=1680 (last accessed 17. June 2016).
Donald, P. F., Green, R. E. and Heath, M. F. (2001) Agricultural intensification and the collapse of Europe’s farmland bird popula-tions. Proc. R. Soc. Lond. B 268: 25–29.
EBCC (2014) European wild bird indicators, 2014 update: Common farmland bird indi-cator, Europe, single European species habi-tat classification, 1980-2014. Prague, Czech Republic: European Bird Census Council. http://www.ebcc.info/index.php?ID=558 (last accessed 20 June 2016).
Engel, J., Huth, A. and Frank, K, (2012) Bioenergy production and Skylark (Alauda arvensis) population abundance – a model-ling approach for the analysis of land-use change impacts and conservation options. GCB Bioenergy 4: 713–727.
Eskildsen, A., Larsen, J. D. and Heldbjerg, H. (2013) Use of an objective indicator species selection method shows decline in bird pop-ulations in Danish habitats. Dansk Orn. Foren. Tidsskr. 107: 191–207.
European Commission (2011) Our life insur-ance, our natural capital: an EU biodiver-sity strategy to 2020. Brussels: European Commission. Accessible at: http://ec.europa.eu/environment/nature/biodiversity/ strategy/index_en.htm (last accessed 26 May 2016).
Ferguson-Lees, J., Castell, R. and Leech, D. (2011) A field guide to monitoring nests. Thetford, UK: British Trust for Ornithology.
Fox, A. D. (2004) Has Danish agriculture main-tained farmland bird populations? J. Appl. Ecol. 41: 427–439.
Gregory, R. D. and van Strien, A. (2010) Wild bird indicators: using composite population trends of birds as measures of environmental health. Ornithol. Sci. 9: 3–22.
Gregory, R. D., van Strien, A., Vorisek, P., Meyling, A. W. G., Noble, D. G., Foppen, R. P. B. and Gibbons, D. W. (2005) Developing indicators for European birds. Phil. Trans. Roy. Soc. B. 360: 269–288.
Heldbjerg, H. (2005) De almindelige fugles bestandsudvikling i Danmark 1975–2004. Dansk. Orn. Foren. Tidsskr. 99: 182–195.
Heldbjerg, H. and Fox, A. D. (2008) Long-term population declines in Danish trans-Saharan migrant birds. Bird Study 55: 267–279.
Heldbjerg, H., Brandtberg, N. and Jørgensen, M. F. (2014) Overvågning af de almind-elige fuglearter i Danmark 1975–2013.

62 PhD thesis by Henning Heldbjerg
H. Heldbjerg et al. 14
Årsrapport for Punkttællingsprogrammet. Dansk Ornitologisk Forening. (In Danish).
Heldbjerg, H., Fox, A. D., Levin, G. and Nyegaard, T. (2016). The decline of the Starling Sturnus vulgaris in Denmark is related to changes in grassland extent and intensity of cattle grazing. Agric. Ecosyst. Environ. 230: 24–31.
Henderson, I. G., Cooper, J., Fuller, R. J. and Vickery, J. (2000a) The relative abundance of birds on set-aside and neighbouring fields in summer. J. Appl. Ecol. 37: 335–347.
Henderson, I. G., Vickery, J. A. and Fuller, R. J. (2000b) Summer bird abundance and distri-bution on set-aside fields on intensive arable farms in England. Ecography 23: 50–59.
Hewson, C. M. and Noble, D. G. (2009) Population trends of breeding birds in British woodlands over a 32-year period: relation-ships with food, habitat use and migratory behaviour. Ibis 151: 464–486.
Hulme, M. F. and Cresswell, W. (2012) Density and behaviour of Whinchats Saxicola rubetra on African farmland suggest that winter habitat conditions do not limit European breeding populations. Ibis 154: 680–692.
Larsen, J. L., Heldbjerg, H. and Eskildsen, A. (2011) Improving national habitat specific bio-diversity indicators using relative habitat use for common birds. Ecol. Indic. 11: 1459–1466.
Levin, G. and Normander, B. (2008) Arealanvendelse i Danmark siden slutningen af 1800-tallet. Danmarks Miljøundersøgelser, Aarhus Universitet. DMU Faglig Rapport 682. (In Danish). Accessible at: http://www.dmu.dk/Pub/FR682_final.pdf (last accessed 20 June 2016).
Noer, H., Asferg, T., Clausen, P., Olesen, C. R., Bregnballe, T., Laursen, K., Kahlert, J., Teilmann, J., Christensen, T. K. and Haugaard, L. (2009) Vildtbestande og jag-ttider i Danmark: Det biologiske grund-lag for jagttidsrevisionen (2010) Danmarks Miljøundersøgelser, Aarhus Universitet. DMU Rapport nr. 742. (In Danish) Accessible at: http://www.dmu.dk/Pub/FR742.pdf (last accessed 20 June 2016).
Pannekoek, J. and van Strien, A. (2004) TRIM 3 manual (Trends and Indices for Monitoring data). Amsterdam, The Netherlands: Statistics Netherlands. Accessible at: www.ebcc.info/trim.html (last accessed 13 March 2014).
Pe’er, G., Dicks, L. V., Visconti, P., Arlettaz, R., Báldi, A., Benton, T. G., Collins, S., Dieterich, M., Gregory, R. D., Hartig, F., Henle, K., Hobson, P. R., Kleijn, D., Neumann, R. K., Robijns, T., Schmidt, J., Shwartz, A., Sutherland, W. J., Turbé, A., Wulf, F. and Scott, A. V. (2014) EU agricul-tural reform fails on biodiversity. Science 344: 1090–1092.
Reenberg, A. (1988) Agricultural land-use in Denmark in the 1980s. Geograf. Tidsskr. 88: 8–13.
Reif, J. (2013) Long-term trends in bird pop-ulations: A review of patterns and potential drivers in North America and Europe. Acta Ornithol. 48: 1–16.
Reif, J., Bohning-Gaese, K., Flade, M., Schwarz, J. and Schwager, M. (2011) Population trends of birds across the iron curtain: Brain matters. Biol. Conserv. 144: 2524–2533.
Reif, J., Storch, D., Vo íšek, P., Š astný, K. and Bej ek, V. (2008) Bird-habitat associations predict population trends in central European forest and farmland birds. Biodivers. Conserv. 17: 3307–3319.
Reif, J., Vermouzek, V., Vo íšek, P., Š astný, K., Bej ek, V. and Flousek, J. (2010) Population changes in Czech passerines are predicted by their life history and ecological traits. Ibis 152: 610–621.
Sauerbrei, R., Ekschmitt, K., Wolters, V. and Gottschalk, T. K. (2014) Increased energy maize production reduces farmland bird diversity. GCB Bioenergy 6: 265–274.
Sotherton, N. W. (1998) Land use changes and the decline of farmland wildlife: An appraisal of the set-aside approach. Biol. Conserv. 83: 259–268.
Sotherton, N. W., Boatman, N. D., Mañosa, S. and Roberston, P. A., (1994) Management of set-aside for game and wildlife. Asp. Appl. Biol. 40: 497–505.
Van Turnhout, C. A. M., Foppen, R. P. B., Leuven, R. S. E. W., van Strien, A. and Sipel, H (2010) Life-history and ecological correlates of population change in Dutch breeding birds. Biol. Conserv. 143: 173–181.
Vickery, J. A., Ewing, S. R., Smith, K. W., Pain, D. J., Bairlein, F., Skorpilov, J. and Gregory, R. D. (2014) The decline of Afro-Palaearctic migrants and an assessment of potential causes. Ibis 156: 1–22.

63PhD thesis by Henning Heldbjerg
Farmland bird declines in Denmark 15
HENNING HELDBJERG*DOF-BirdLife Denmark, Vesterbrogade 140, DK-1620 Copenhagen V, Denmark; and
Department of Bioscience, Aarhus University, Kalø, Grenåvej 14, DK-8410 Rønde, Denmark.
PETER SUNDE, ANTHONY DAVID FOXDepartment of Bioscience, Aarhus University, Kalø, Grenåvej 14, DK-8410 Rønde, Denmark.
*Author for correspondence; e-mail: [email protected]
Received 11 July 2016; revision accepted 13 December 2016


Dansk Orn. Foren. Tidsskr. 110 (2016): 214-222
Henning Heldbjerg & Anthony D. Fox
PAPER 3
REGIONAL TRENDS AMONGST DANISH SPECIALIST FARMLAND BREEDING BIRDS
Photo: Erik Borch


67PhD thesis by Henning Heldbjerg
Regional trends amongst Danish specialist farmland
breeding birds
HENNING HELDBJERG & ANTHONY D. FOX
Dansk Orn. Foren. Tidsskr. 110 (2016): 214-222
(Med et dansk resumé: Regionale bestandstendenser for danske ynglefuglearter specialiseret i landbrugsområder)
Abstract The mean rates of change in annual abundance for 16 farmland specialist breeding bird species based on point counts from three regions of Denmark (West, Central and East) during 1987-2015 inclusive were analysed to see if grassland and arable specialists were showing regional changes that could be related to their respective specializations. Generally, few species showed differences in regional population trends, despite the increasing concentration of mixed (mainly pastoral) agriculture in the West and predominantly arable cultivation in the East. Most grassland and arable specialists were declining in all regions. Only Mew Gull Larus canus showed consistent increases in all regions, Western Marsh Harrier Circus aeruginosus and Common Whitethroat Sylvia communis showed increases in the East and West while Barn Swallow Hirundo rustica showed little change in abundance anywhere during the period. Corn Bunting Emberiza calandra showed significant declines in the East of Denmark in contrast to stable trends in the Central and Western regions, but was declining everywhere since 2003. The results underline the need to understand how individual farmland species exploit specific crops and micro-biotopes as well as the combination of different crops.
Introduction
The European Commission has undertaken to halt the loss of biodiversity and ecosystem services throughout the European Union (EU) and where possible reinstate previous losses before 2020 (European Commission 2011). The reformed EU Common Agricultural Policy for 2014-2020 also aims to reduce biodiversity loss, al-though it has been stated that it comprises ‘such dilut-ed environmental prescriptions that they are unlikely to benefit biodiversity’ (Pe’er et al. 2014). More than 60% (c.
27 000 km2) of Denmark’s total surface area is cultivat-ed, making it the most intensively farmed landscape in Europe (Danmarks Statistik 2009, FAOSTAT 2016). Most of the cultivated areas are given over to winter wheat, grass ley and spring barley, although increasing areas produce maize and oilseed rape (Levin & Normander 2008, Brink & Jensen 2012). Given such a high propor-tion of the land surface is cultivated, farmland contrib-utes disproportionately to maintaining overall biologi-cal diversity in Denmark.

68 PhD thesis by Henning Heldbjerg
Birds are highly mobile and dispersive, features which make them good indicators of overall habitat quality and disturbance, as they often show rapid and sensitive responses to human-induced changes in their immediate environment. Birds are also well studied and, especially for the commoner species, there exist long term time-series on their distribution and abundance across much of Europe (Gregory & van Strien 2010). As a result, changes in farmland bird populations have come to play an important role in showing the effects of agricultural intensification on wider countryside na-ture conservation interest, including Denmark where common birds are a conspicuous and well monitored element of Danish biodiversity (e.g. Fox 2004, Eskildsen et al. 2013).
A previous analysis of the status and trends of farm-land birds in Denmark suggested that, at least some species (e.g. Corn Bunting Emberiza calandra) showed more favourable conservation status than was the case in other western European countries, for example Great Britain (Fox 2004). However, more recent analyses based on the BirdLife Denmark’s Common Bird Monitoring (CBM) confirm that 16 specialist farmland bird species in Denmark are showing the most rapid declines among 102 common birds associated with a range of other hab-itats (Heldbjerg et al. in print). This new analysis brings into sharp focus the effects that contemporary changes in the Danish agricultural landscape are having on the breeding birds of the country, especially those that are restricted to reproduction in agricultural landscapes. This suggests that current changes in agricultural prac-tice are likely to be affecting bird populations in Den-mark. We need to understand what changes in farming that have affected these species and how we can find mechanisms to reduce such adverse effects on their number and distribution.
One way to study this is to adopt a comparative ap-proach to contrast different landscapes to see if special-ist farmland bird populations are responding in different ways. Danish farmland can be broadly divided into two major predominant landscape components, an arable type (where tillage predominates, especially autumn sown wheat and rape, as well as spring sown barley) and a mixed farming type (also including permanent, and increasingly, rotational grassland; Brink & Jensen 2012). Since the 1980s, mixed farming has primarily been prac-ticed in the west of Denmark, whilst a more uniform and homogeneous arable practice dominates the landscape in the east (Reenberg 1988). Agricultural intensification has been a feature of both the arable and mixed farm-ing sectors; for instance, arable cropping patterns, the degree of mechanization, use of pesticides and fertilis-ers have changed over time, often with adverse effects
on farmland bird populations in Denmark (Fox 2004) as elsewhere in Europe (Donald et al. 2001) and across con-tinents (Reif 2013). Equally, pastoral agriculture has seen increasing numbers of cattle kept indoors throughout the year, a shift from grass and fodder beet to maize and a reduction in permanent pasture, while rotational grassland has increased in extent (Heldbjerg et al. 2016, Statistikbanken 2016).
Because we may expect certain specialist farmland birds in Denmark to be either closely associated with features of arable or pastoral agriculture, these patterns offer opportunities to compare regional changes in spe-cialist farmland bird populations to better understand factors affecting their abundance. Hence, we might ex-pect loss of pasture and grazing animals in East to re-sult in a decline for Common Starlings Sturnus vulgaris, whereas we would expect a stable trend in West (see Heldbjerg et al. 2016). Equally, we may expect a species such as Corn Bunting to be declining in East as a result of intensification of arable agriculture, but show stable trends in West where there remains much spring barley and grassland which are known to be favoured by this species (Fox & Heldbjerg 2008). For this reason, in this analysis, we use data from the BirdLife Denmark’s CBM programme (based upon point count census counts undertaken since 1976) to compare trends of specialist farmland species in three Danish regions from west to east to see if we can gain insight from regional patterns in contrasting species.
Materials and methods
Data collectionThe CBM programme is based upon a point count cen-sus of breeding birds that started in 1976 and is con-ducted annually within the period 1 May – 15 June. Each route consists of 10-20 marked ‘points’. At each point, all birds seen and heard, regardless of distance from the observer, are registered and recorded in a 5-minute ob-servation window (Heldbjerg 2005). All points counted in at least two years by the same observer, at the same time of year (± 7 days), same time of day (± 30 min.) and under comparable weather conditions are included in this analysis. We restricted the time series to 1987-2015 because of the rapid increase in participants in the early years, to ensure robust and comparable data with an equal coverage in all years for the more detailed analysis (Nyegaard et al. 2015). Bird species abundance has been sampled annually at > 300 routes since 1987 (mean ± 95% CI 1987-2015 = 340 ± 10, median 346).
Habitats surrounding each count point are ascribed in quarters to one or more of nine predefined habitat categories (coniferous woodland, deciduous woodland,
215Regional trends in farmland birds

69PhD thesis by Henning Heldbjerg
216 Regional trends in farmland birds
arable, grassland, heath, dunes/shore, bog/marsh, lake and urban; Heldbjerg 2005, Larsen et al. 2011, Eskildsen et al. 2013). On this basis, 13.2% of points came from purely arable landscapes and 1.5% from permanent meadows/grassland plots; however, the majority of the surveyed plots are from ‘mixed’ habitats including ex-tensive areas of farmland, such that a total of 27.8% and 11.1% of all habitat registrations are from arable habitat and grasslands, respectively.
Defining species relative habitat use and comparing across habitatsMany species are habitat generalists in the sense that they are not exclusively found in only one of the nine habitat types. We defined species’ habitat associations by their Relative Habitat Use (RHU), calculated as the abundance of a given species in a particular habitat relative to the mean abundance of that species in all other habitats. The number of individuals observed at each point was weighted by the proportion of the given habitat at the point. The sum of the weighted number of individuals of each species in a particular habitat could then be used to calculate a RHU value from the follow-ing equation:
where ni is the number of individuals in the ith habitat, pi is the total number of i-habitat points, adjusted ac-cording to proportional habitat share at each point, N is the total number of individuals and P is the total number of points. We use the term Farmland as a combination of arable and grassland habitats. For full details and examples, see Fig. 1 in Larsen et al. (2011) and Eskildsen et al. (2013).
Heldbjerg et al. (in print) used values of RHU > 2 (‘high use’) to indicate an abundance in the specified habitat at least twice the mean abundance in all other habitats, to select farmland habitat specialists (but omitted those with a Danish breeding population of less than 1000 pairs and species for which less than 50 individuals were registered per year (Heldbjerg et al. in print). In this way, we restricted the analysis to only covering 16 common farmland specialists for which there existed high-quali-ty data. In this analysis, we also extend this method to define arable and grassland specialists using the same approach. If the ratio of a species’ RHU in arable to that in grassland exceeded 1.5, we considered it an arable species and vice versa. Species with 0.67 < Ratio < 1.5 were assigned as farmland generalists as they showed no specialization for arable or grassland (see Tab. 1). Since there was a high degree of consistency between the population trends calculated using habitat-specific
point counts and using all point counts irrespective of habitat (Eskildsen et al. 2013), we used data from all point counts relating to a given species, not only those from points in their primary habitat.
Species, indices and indicatorsIn this study, we focus only on avian species associ-ated with farmland, arable and grassland habitats. The habitat defined as ‘arable’ consists of arable areas such as cultivated fields and fallow land, ‘grassland’ included meadows, salt marshes, pastures, dry grassland and other grass-dominated areas with or without scattered trees and/or shrubs. The common species names and systematic order follows Fjeldså et al. (2016).
Indices and trends were calculated by fitting a log lin-ear regression model to point count data with Poisson error terms using the software TRends and Indices for Monitoring data (TRIM; Pannekoek & van Strien 2004), where the observations at a given site in a given year is assumed to be the result of a site and a year effect. The programme also estimates the dispersion factor, cor-recting for over-dispersion where this occurs, and takes account of serial correlation between counts at the same site in different years. Standard errors for the indi-ces are generated based on the assumption that the var-iance is proportional to the mean, and a pattern of serial correlation which declines exponentially with time be-tween counts (Pannekoek & van Strien 2004). The TRIM assessment of rate of change was used in this study to generate species trends, taking the standard errors into account. Trends for the 16 species were calculated for three regions of Denmark representing a mixed farm-ing (with grassland) area (West – west coastal counties; based on 437 routes monitored one or more years) and an arable cultivated area (East – Zealand and Bornholm; 605 routes) plus an intermediate area (Central – eastern coastal parts of Jutland and Funen; 358 routes; Fig. 1).
Results
The mean rates of change in annual abundance (± SE) for the selected 16 farmland specialist bird species in the three regions of Denmark from 1987-2015 inclusive are shown in Tab. 1. The majority of the species-regions combinations are declining. The Mew Gull Larus canus is the only species significantly increasing in all three regions, where it forages in, but generally does not spe-cifically nest in, farmland habitats. Western Marsh Har-rier Circus aeruginosus and Common Whitethroat Sylvia communis showed increases in East and West, but no significant change in Central, while Marsh Warbler Acro-cephalus palustris showed a significant increase in West.
Generally, few species showed radical differences in

70 PhD thesis by Henning Heldbjerg
217Regional trends in farmland birds
Fig. 1. The regional divisions of Denmark used in this study. W = West (blue), C = Central (red), E = East (green). Black dots in-dicate routes monitored one or more years during 1987-2015.Den anvendte regionale opdeling i dette studie. W = Vest (blå), C = Central (rød), E = Øst (grøn). Sorte prikker viser punkttællingsru-ter optalt en eller flere gange i perioden 1987-2015.
Species Art Class.RHU value
RHU-værdi N Trend Tendens
F A G W C E W C E
Grey Partridge Agerhøne A 5.2 4.2 1.6 25 25 36 -5.80 ± 1.28 -4.12 ± 1.51 -2.61 ± 0.89Eurasian Oystercatcher Strandskade G 3.1 0.7 8.6 101 111 201 -1.96 ± 0.86 -2.68 ± 0.91 -4.28 ± 0.43
Northern Lapwing Vibe F 5.2 2.6 3.8 491 356 529 -3.63 ± 0.47 -4.22 ± 0.52 -1.92 ± 0.35Common Redshank Rødben G 2.6 0.5 9.0 104 31 100 -3.21 ± 1.36 -4.71 ± 1.41 -0.12 ± 0.54
Mew Gull Stormmåge F 2.3 2.0 1.6 375 420 669 3.41 ± 0.75 3.22 ± 0.83 2.42 ± 0.52Western Marsh Harrier Rørhøg G 2.5 1.7 2.6 16 16 31 4.80 ± 1.68 0.79 ± 1.33 3.85 ± 0.89Common Kestrel Tårnfalk F 2.8 2.1 2.1 32 32 41 0.48 ± 0.85 -2.54 ± 0.85 -1.51 ± 0.69
Eurasian Sky Lark Sanglærke A 5.9 5.6 1.0 1604 1220 1588 -3.10 ± 0.17 -2.78 ± 0.21 -2.19 ± 0.16Marsh Warbler Kærsanger G 3.2 0.4 4.3 50 96 108 1.36 ± 0.68 -0.06 ± 0.49 -0.22 ± 0.39
Barn Swallow Landsvale A 2.8 2.5 1.6 1249 1141 1283 -0.25 ± 0.23 0.16 ± 0.33 0.54 ± 0.28
Common Whitethroat Tornsanger F 2.3 1.9 1.6 634 558 780 0.40 ± 0.19 0.43 ± 0.24 0.78 ± 0.18
Common Starling Stær F 2.3 1.8 1.9 2012 1405 2160 -1.39 ± 0.34 -4.40 ± 0.42 -2.39 ± 0.30Whinchat Bynkefugl G 2.8 1.2 4.8 58 14 15 -6.21 ± 0.71 -1.12 ± 1.70 -4.57 ± 1.18Meadow Pipit Engpiber G 3.1 0.7 8.3 118 24 49 -2.79 ± 0.76 0.85 ± 1.41 -4.70 ± 0.81
Yellow Wagtail Gul Vipstjert G 3.7 2.0 3.4 21 NA 20 -2.35 ± 2.15 NA -7.30 ± 1.32
Corn Bunting Bomlærke A 11.3 11.0 0.6 196 65 25 0.56 ± 0.41 1.60 ± 1.67 -6.88 ± 1.78
Tab. 1. The 16 Danish farmland specialist species with Relative Habitat Use (RHU) > 2 showing the classification of specialization, the respective RHU values for arable and grassland habitats, the mean number of individuals recorded per year and per region (W = West, C = Central and E = East) of each species (= N) and trends (± 95% CI; bold text: p < 0.05, italics: p < 0.01)). Species with a ratio of arable RHU to that in grassland which exceeded 1.5 were considered an arable species (identified as A) and vice versa (G indicates grassland specialist); species with 0.67 < RHU-ratio < 1.5 we assigned as farmland specialists (F) as they showed no specialization for arable or grassland. De 16 danske fuglearter specialiserede i det danske landbrugsland med en Relativ Habitatudnyttelse (RHU; se teksten) på > 2, der end-videre viser specialiserings-klassifikation, RHU-værdier i henholdsvis agerland og enge samt det gennemsnitlige antal registrerede fugle per år og region (W = Vest, C = Central and E = Øst) for hver art (= N) og tendens (± 95% CI; fed text: p < 0.05, kursiveret: p < 0.01). Arter med en ratio mellem agerlands-RHU og enge-RHU større end 1,5 anses som agerlandsfugle (A), arter med en ratio mindre end 0,67 som engfugle (G) og de resterende som landbrugslandsfugle (0,67 < RHU-ratio < 1.5; F), da de ikke udviser specialisering for hverken agerland eller enge.
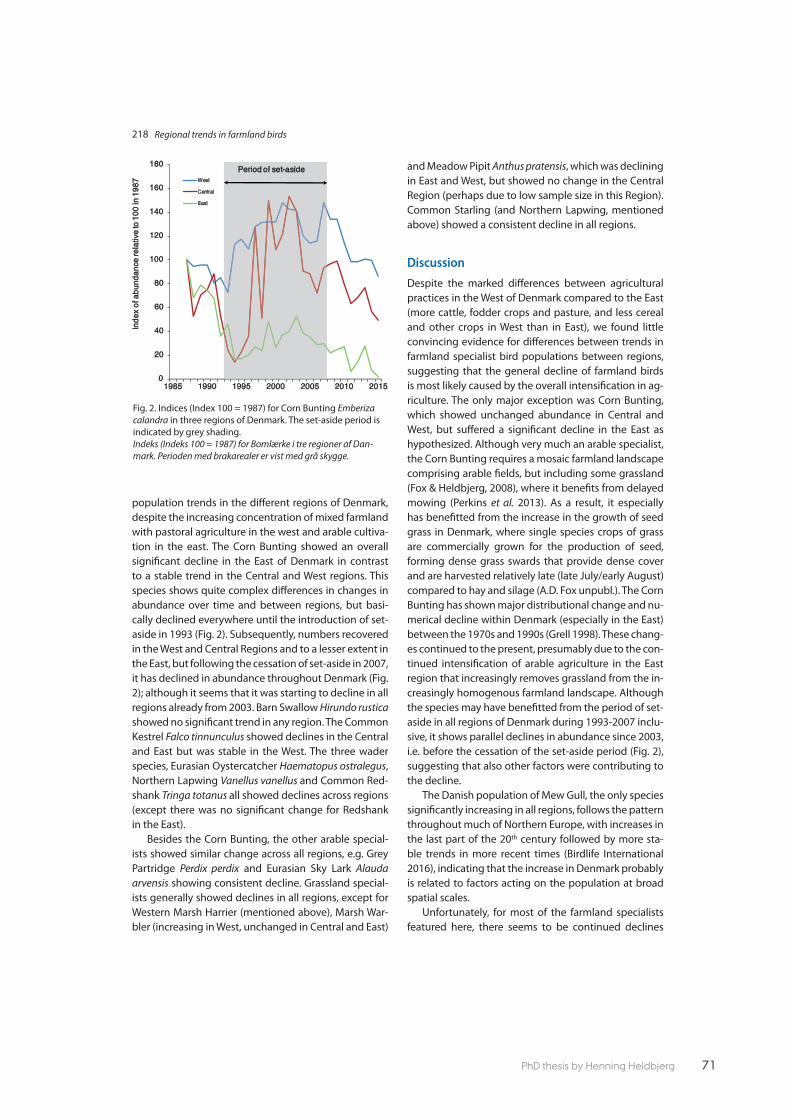
71PhD thesis by Henning Heldbjerg
218 Regional trends in farmland birds
population trends in the different regions of Denmark, despite the increasing concentration of mixed farmland with pastoral agriculture in the west and arable cultiva-tion in the east. The Corn Bunting showed an overall significant decline in the East of Denmark in contrast to a stable trend in the Central and West regions. This species shows quite complex differences in changes in abundance over time and between regions, but basi-cally declined everywhere until the introduction of set-aside in 1993 (Fig. 2). Subsequently, numbers recovered in the West and Central Regions and to a lesser extent in the East, but following the cessation of set-aside in 2007, it has declined in abundance throughout Denmark (Fig. 2); although it seems that it was starting to decline in all regions already from 2003. Barn Swallow Hirundo rustica showed no significant trend in any region. The Common Kestrel Falco tinnunculus showed declines in the Central and East but was stable in the West. The three wader species, Eurasian Oystercatcher Haematopus ostralegus, Northern Lapwing Vanellus vanellus and Common Red-shank Tringa totanus all showed declines across regions (except there was no significant change for Redshank in the East).
Besides the Corn Bunting, the other arable special-ists showed similar change across all regions, e.g. Grey Partridge Perdix perdix and Eurasian Sky Lark Alauda arvensis showing consistent decline. Grassland special-ists generally showed declines in all regions, except for Western Marsh Harrier (mentioned above), Marsh War-bler (increasing in West, unchanged in Central and East)
and Meadow Pipit Anthus pratensis, which was declining in East and West, but showed no change in the Central Region (perhaps due to low sample size in this Region). Common Starling (and Northern Lapwing, mentioned above) showed a consistent decline in all regions.
Discussion
Despite the marked differences between agricultural practices in the West of Denmark compared to the East (more cattle, fodder crops and pasture, and less cereal and other crops in West than in East), we found little convincing evidence for differences between trends in farmland specialist bird populations between regions, suggesting that the general decline of farmland birds is most likely caused by the overall intensification in ag-riculture. The only major exception was Corn Bunting, which showed unchanged abundance in Central and West, but suffered a significant decline in the East as hypothesized. Although very much an arable specialist, the Corn Bunting requires a mosaic farmland landscape comprising arable fields, but including some grassland (Fox & Heldbjerg, 2008), where it benefits from delayed mowing (Perkins et al. 2013). As a result, it especially has benefitted from the increase in the growth of seed grass in Denmark, where single species crops of grass are commercially grown for the production of seed, forming dense grass swards that provide dense cover and are harvested relatively late (late July/early August) compared to hay and silage (A.D. Fox unpubl.). The Corn Bunting has shown major distributional change and nu-merical decline within Denmark (especially in the East) between the 1970s and 1990s (Grell 1998). These chang-es continued to the present, presumably due to the con-tinued intensification of arable agriculture in the East region that increasingly removes grassland from the in-creasingly homogenous farmland landscape. Although the species may have benefitted from the period of set-aside in all regions of Denmark during 1993-2007 inclu-sive, it shows parallel declines in abundance since 2003, i.e. before the cessation of the set-aside period (Fig. 2), suggesting that also other factors were contributing to the decline.
The Danish population of Mew Gull, the only species significantly increasing in all regions, follows the pattern throughout much of Northern Europe, with increases in the last part of the 20th century followed by more sta-ble trends in more recent times (Birdlife International 2016), indicating that the increase in Denmark probably is related to factors acting on the population at broad spatial scales.
Unfortunately, for most of the farmland specialists featured here, there seems to be continued declines
0
20
40
60
80
100
120
140
160
180
1985 1990 1995 2000 2005 2010 2015
Ind
ex
of a
bu
nd
an
ce re
lativ
e to
10
0 in
19
87 West
Central
East
Period of set-aside
Fig. 2. Indices (Index 100 = 1987) for Corn Bunting Emberiza calandra in three regions of Denmark. The set-aside period is indicated by grey shading. Indeks (Indeks 100 = 1987) for Bomlærke i tre regioner af Dan-mark. Perioden med brakarealer er vist med grå skygge.
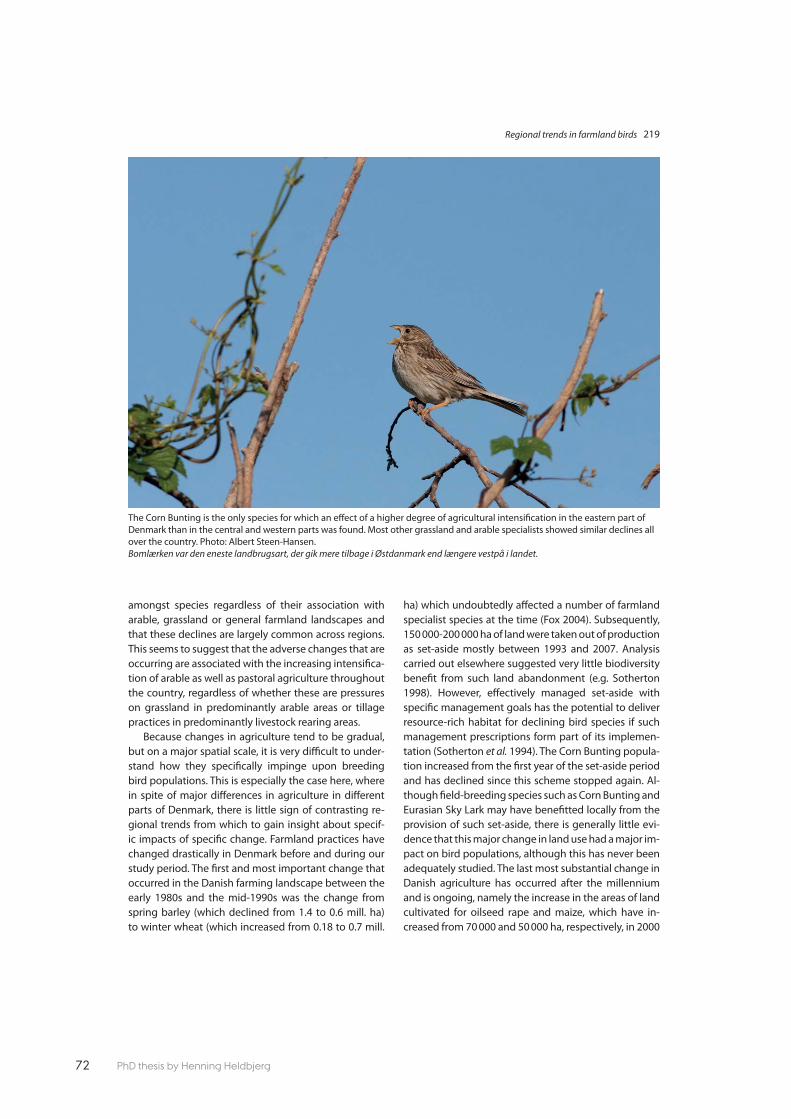
72 PhD thesis by Henning Heldbjerg
219Regional trends in farmland birds
amongst species regardless of their association with arable, grassland or general farmland landscapes and that these declines are largely common across regions. This seems to suggest that the adverse changes that are occurring are associated with the increasing intensifica-tion of arable as well as pastoral agriculture throughout the country, regardless of whether these are pressures on grassland in predominantly arable areas or tillage practices in predominantly livestock rearing areas.
Because changes in agriculture tend to be gradual, but on a major spatial scale, it is very difficult to under-stand how they specifically impinge upon breeding bird populations. This is especially the case here, where in spite of major differences in agriculture in different parts of Denmark, there is little sign of contrasting re-gional trends from which to gain insight about specif-ic impacts of specific change. Farmland practices have changed drastically in Denmark before and during our study period. The first and most important change that occurred in the Danish farming landscape between the early 1980s and the mid-1990s was the change from spring barley (which declined from 1.4 to 0.6 mill. ha) to winter wheat (which increased from 0.18 to 0.7 mill.
ha) which undoubtedly affected a number of farmland specialist species at the time (Fox 2004). Subsequently, 150 000-200 000 ha of land were taken out of production as set-aside mostly between 1993 and 2007. Analysis carried out elsewhere suggested very little biodiversity benefit from such land abandonment (e.g. Sotherton 1998). However, effectively managed set-aside with specific management goals has the potential to deliver resource-rich habitat for declining bird species if such management prescriptions form part of its implemen-tation (Sotherton et al. 1994). The Corn Bunting popula-tion increased from the first year of the set-aside period and has declined since this scheme stopped again. Al-though field-breeding species such as Corn Bunting and Eurasian Sky Lark may have benefitted locally from the provision of such set-aside, there is generally little evi-dence that this major change in land use had a major im-pact on bird populations, although this has never been adequately studied. The last most substantial change in Danish agriculture has occurred after the millennium and is ongoing, namely the increase in the areas of land cultivated for oilseed rape and maize, which have in-creased from 70 000 and 50 000 ha, respectively, in 2000
The Corn Bunting is the only species for which an effect of a higher degree of agricultural intensification in the eastern part of Denmark than in the central and western parts was found. Most other grassland and arable specialists showed similar declines all over the country. Photo: Albert Steen-Hansen. Bomlærken var den eneste landbrugsart, der gik mere tilbage i Østdanmark end længere vestpå i landet.

73PhD thesis by Henning Heldbjerg
220 Regional trends in farmland birds
to c. 180 000 ha of each in 2015 (Statistikbanken 2016). In the light of these recent increases in rape and
maize, it is interesting to consider the effect of these changes on the bird community. Common Whitethroats prefer rape to other crops in Denmark (Petersen 1996), and it is interesting to speculate whether this species has benefitted from rape becoming increasingly cultivated throughout Denmark, especially in the east and south-east. The Common Whitethroat showed significant increase in East and West while showing a similar ten-dency (although failing to attain statistical significance) in Central Denmark. This is a species whose abundance crashed across western Europe between the breed-ing seasons in 1968 and 1969 (Winstanley et al. 1974), probably including Denmark (see Berthold 1973), and which has shown relatively little change in abundance since that time (e.g. PECBMS 2014). Results from the Danish CBM suggest a gradual increase in abundance, especially since the mid-1990s. It is important to un-derstand whether such a crop is valuable as breeding habitat, in terms of its ability to support reproductive success comparable or higher than other habitats. De-spite the increase in Common Whitethroat abundance at the national level, it is also important to understand, whether rape functions as an ecological trap (by attract-ing breeding birds from other habitats but failing to sup-port the production of young), as well as the potential threat this poses to the species because of its exposure to agro-chemicals used in relation to this particular crop. Hence, this relationship should be investigated in more detail given that very few other farmland bird special-ist species seem to be adapting in a positive way to changes in the contemporary agricultural landscape of Northwest Europe.
Maize generally grows too late and develops above ground biomass too densely to support breeding bird species of any kind in Europe (e.g. Engel et al. 2012, Sau-erbrei et al. 2014), so the 15-fold increase in area of this crop since the 1980s has likely had a dramatic effect on local breeding birds. Unfortunately, we are not aware of any specific Danish studies of the breeding birds of maize fields and this remains an urgent research prior-ity. Hence, one urgent line of enquiry is to better under-stand the effects of maize and oilseed rape cultivation on breeding birds across Denmark and the consequenc-es for its continued spread in the future.
Although the combination of changes in cropping (cereals, maize and oilseed rape) could have contrib-uted to the long term declines in specialist farmland bird populations, there is no obvious parameter that could account for the overall patterns reported here. Heldbjerg et al. (in print) showed that ground nesting farmland specialist species were showing greater rates
of decline than those that nested elsewhere, hinting that the changes were in some way linked to nest site as well as foraging areas during the brood rearing period. This supports the assertion of Reif et al. (2008) that we should use a finer scale than the classical broad habi-tat classes as “farmland”, “forest” etc. to understand the reasons behind the general decline because habitat is a continuous rather than a categorical variable. In this respect, we need to better understand the effects of the earlier and more vigorous growth of crops (especially early in the season), the increasingly effective weed and insect control, which denies food for birds and the in-creasing trend to exploit every last piece of productive land that increasingly removes less intensively cultivat-ed biotopes from the increasing homogenous farming landscape. We urgently need to understand far more about how individual farmland species exploit very specific crops and micro-biotopes and the way mosaics of these features are arranged in the landscape during the course of the annual avian and agricultural cycle, not least because within a single habitat the same change can adversely affect one species negatively whilst ben-efitting another.
Acknowledgements
None of this work could have been undertaken with-out the annual, selfless contribution of the very many bird-watchers that have contributed data to the CBM. We are very grateful to each and every one of you for making this type of analysis possible through the pro-vision of point count data. Thanks to Jan Drachmann, Thomas Vikstrøm and to two anonymous referees for their comments on an earlier version, Timme Nyegaard for making the map and to The Danish Nature Agency for funding from the project: “Agerlandets almindelige og sjældne fugle”. HH acknowledges the support of an industrial PhD stipend awarded by Innovationsfonden, which, together with Aage V. Jensen Naturfond and 15. Juni Fonden also supported this work.
Resumé
Regionale bestandstendenser for danske ynglefuglearter specialiseret i landbrugsområder Europakommissionen har besluttet at standse tabet af biodi-versitet før 2020. Over 60 % af Danmarks areal er landbrugs-jord, og dermed er Danmark det mest intensivt dyrkede land i Europa. De arealmæssigt væsentligste afgrøder er vinter-hvede, vårbyg, græs og grøntfoder og i de senere år også majs og raps. For at kunne følge udviklingen af biodiversitet i landbrugslandet udgør fuglene en væsentlig gruppe som in-dikator. En ny undersøgelse af udviklingen for de almindelige danske ynglefugle viser, at det er fuglene i landbrugslandet, der udviser de største bestandsnedgange.

74 PhD thesis by Henning Heldbjerg
221Regional trends in farmland birds
I denne artikel undersøger vi, om udviklingen for de 16 mest specialiserede landbrugslands-arter har været ensartet på tværs af landet. Termen Landbrugsland anvendes som en fælles betegnelse for habitaterne Eng og Agerland. Sammen-ligningen er baseret på bestandsindeks på baggrund af DOF’s punkttællinger, men kun for perioden 1987-2015, da antallet af optalte ruter kun i denne periode vurderes at være tilstræk-keligt stort til at kunne opdele landet i de tre regioner, Vest, Central og Øst (Fig. 1). Den generelle udvikling i landbruget i det seneste halve århundrede har medført, at mælkeproduk-tionen er flyttet mod vest, så man her har flere køer og mere græs end i den østlige del, hvor der primært er plantepro-duktion. Udviklingen i begge typer har været markant, og det er vist, at det intensiverede landbrug har haft en betydelig effekt på fuglelivet i Danmark og i Europa generelt.
Vi har endvidere underopdelt de 16 landbrugslands-specialister i specialister i Enge hhv. Agerland eller arter, der anvender begge habitater i Landbrugsland ligeligt (Tab. 1). Til dette formål er an-vendt punkttællingernes naturtype-information til beregning af arternes RHU (Relative Habitatudnyt-telse), der udtrykker, hvor ofte en art registreres i en naturtype i forhold til i de øvrige.
Resultaterne viser, at langt hovedparten af ar-terne er i tilbagegang (Tab. 1). Blot tre arter, Rørhøg, Stormmåge og Tornsanger er i generel fremgang på tværs af landet, hvoraf de to førstnævnte arter fou-ragerer, men ikke yngler i landbrugslandet.
Generelt er der ret lille forskel på arternes bestandsudvikling i de for-skellige regioner af landet, og vi kan konkludere, at trods forskellig udvikling i landbrugspraksis i de tre regioner, ses kun få regio-nale forskelle i arternes be-standsudvikling. Størst for-skel ses hos Bomlærke med en markant signifikant til-bagegang i Øst i modsæt-ning til en stabil udvikling i de to øvrige regioner. I alle regioner sås en tilba-gegang frem til 1993, hvor
brakordningen introduceredes. Dette synes at have haft en positiv effekt på arten, da der sås fremgang i alle regioner herefter. Tilsvarende sås en tilbagegang i alle regioner fra 2003, dvs. nogle år før brakordningen ophørte i 2007 (Fig. 2).
Tornsangeren er generelt i fremgang (landbrugslands-art), mens Landsvalen ikke udviser nogen signifikant tendens i nogen regioner. Tårnfalken er i tilbagegang i Central og Øst og stabil i Vest. De tre vadefuglearter, Strandskade, Vibe og Rødben er i generel tilbagegang i hele landet.
Ud over Bomlærke viser de øvrige agerlandsspecialister en ensartet udvikling på tværs af landet. Fx er både Agerhøne og Sanglærke i tilbagegang i alle regioner. Eng-arterne er ge-nerelt i tilbagegang i alle regioner, men fremgang ses dog for Kærsanger i Vest. Landbrugslandsarterne udviser en til-svarende udvikling på tværs af regionerne med Vibe og Stær i signifikant tilbagegang i alle regioner.
Den generelle bestandsnedgang hos arter specialiseret til landbrugslandet, hvad enten de forekommer mest i eng eller
The Whinchat was among the farmland species showing the most pronounced decreases. Photo: John Larsen. Bynkefuglen er gået stærkt tilbage i landbrugslandet.

75PhD thesis by Henning Heldbjerg
Regional trends in farmland birds222
agerland eller ligeligt i begge, indikerer, at den intensive drift af etårige afgrøder såvel som af enge har en negativ effekt på fuglelivet. De væsentligste ændringer i arealet med etårige afgrøder i undersøgelsesperioden er primært ændringerne i arealet fra vårbyg til vinterhvede, brakarealet, der blev taget ud af driften i 1993-2007 og senest den øgede produktion af raps og majs.
De behandlede arter har stort set kun det tilfælles, at de er specialister i landbrugslandet. Hvis vi skal forstå, hvad der forklarer bestandsudviklingen for den enkelte art og hvor-dan, de hver især bliver påvirket af de ændringer, der sker i afgrødevalg og driftsformer, er vi nødt til at arbejde mere detaljeret med fokus på de enkelte arter og i de forskellige landbrugstyper.
References
Berthold, P. 1973: Über starken Rückgang der Dorngrasmücke Sylvia communis und anderer Singvogelarten im westlichen Europa. – J. Ornithol. 114: 348-360.
BirdLife International 2016: Species factsheet: Larus canus. – http://www.birdlife.org/ datazone/species/factsheet/22694308 (last accessed on 12 August 2016).
Brink, M. & J. Jensen 2012: Denmark. Pp 184-189 in: R. Oppermann, G. Beaufoy & G. Jones (eds): High Nature Value Farming in Eu-rope. 35 European Countries - Experiences and Perspectives. – Verlag Regionalkultur, Ubstadt-Weiher.
Danmarks Statistik 2009: Danmark i tal 2009. – Danmarks Statis-tik, Copenhagen. – http://www.dst.dk/pukora/epub/up-load/13448/dkital.pdf (last accessed 12 August 2015).
Donald, P.F., R.E. Green & M.F. Heath 2001: Agricultural intensifica-tion and the collapse of Europe’s farmland bird populations. – Proc. R. Soc. Lond. B 268: 25-29.
Engel, J., A. Huth & K. Frank 2012: Bioenergy production and Skylark (Alauda arvensis) population abundance – a model-ling approach for the analysis of land-use change impacts and conservation options. – GCB Bioenergy 4: 713-727.
Eskildsen, A., J.D. Larsen & H. Heldbjerg 2013: Use of an objective indicator species selection method shows decline in bird po-pulations in Danish habitats. – Dansk Orn. Foren. Tidsskr. 107: 191-207.
European Commission 2011: Our life insurance, our natural capital: an EU biodiversity strategy to 2020. – European Commission, Brussels.
FAOSTAT 2016: Inputs, land. – http://faostat3.fao.org/download/R/RL/E (last accessed 12 August 2016).
Fjeldså, J., S. Rønnest & M. Benche-Pedersen. 2016: Vestpalæarkti-ske fugle. – Dansk Ornitologisk Forening.
Fox, A.D. 2004: Has Danish agriculture maintained farmland bird populations? – J. Appl. Ecol. 41: 427-439.
Fox, A.D. & H. Heldbjerg 2008: Which regional features of Danish agriculture favour the corn bunting in the contemporary farm-ing landscape? – Agr. Ecosyst. & Environ. 126: 261-269.
Gregory, R.D. & A. van Strien 2010: Wild bird indicators: using com-posite population trends of birds as measures of environmen-tal health. – Ornithological Science 9: 3-22.
Grell, M.B. 1998: Fuglenes Danmark. – Gad, Copenhagen.Heldbjerg, H. 2005: Population changes of common birds in Den-
mark 1975-2004. – Dansk Orn. Foren. Tidsskr. 99: 182-195 (in Danish, with English summary).
Heldbjerg, H., A.D. Fox, G. Levin & T. Nyegaard 2016: The decline of the Starling Sturnus vulgaris in Denmark is related to changes
in the extent and intensity of cattle grazing. – Agr. Ecosyst. & Environ. 230: 24-31.
Heldbjerg, H., P. Sunde & A.D. Fox in print: Continuous population declines for specialist farmland birds 1987-2014 in Denmark indicates no halt in biodiversity loss in agricultural habitats. – Bird Conserv. Int..
Larsen, J.L., H. Heldbjerg & A. Eskildsen 2011: Improving national habitat specific biodiversity indicators using relative habitat use for common birds. – Ecol. Indic. 11: 1459-1466.
Levin, G & B. Normander 2008: Arealanvendelse i Danmark siden slutningen af 1800-tallet. – DMU Faglig Rapport 682.
Nyegaard, T., J.D. Larsen, N. Brandtberg & M.F. Jørgensen 2015: Common bird Census in Denmark 1975-2014. – Dansk Ornito-logisk Forening (in Danish, with English summary).
Pannekoek, J. & A. van Strien 2004: TRIM 3 manual. – Statistics Netherlands, Amsterdam, Netherlands. – www.ebcc.info/trim.html (last accessed 12 August 2016).
PECBMS 2014: Trends of common birds in Europe, 2014 update. – CSO, Prague. – http://www.ebcc.info/index.php?ID=557 (last accessed 12 August 2016).
Pe’er, G., L.V. Dicks, P. Visconti, R. Arlettaz, A. Báldi, T.G. Benton et al. 2014: EU agricultural reform fails on biodiversity. – Science 344: 1090-1092.
Perkins, A.J., H.E. Maggs, J.D. Wilson & A. Watson 2013: Delayed mo-wing increases corn bunting Emberiza calandra nest success in an agri-environment scheme trial. – Agr. Ecosyst. & Environ. 181: 80-89.
Petersen, B.S. 1996: The distribution of birds in Danish farmland. Pesticide Research. – Report No. 17. Ministry of Environment and Energy, Denmark
Reenberg, A. 1988: Agricultural land-use in Denmark in the 1980s. – Geografisk Tidsskrift 88: 8-13.
Reif, J. 2013: Long-Term Trends in Bird Populations: A Review of Patterns and Potential Drivers in North America and Europe. – Acta Ornithol. 48: 1-16.
Reif, J., D. Storch, P. Voříšek, K. Šťastný & V. Bejček 2008: Bird-habi-tat associations predict population trends in central European forest and farmland birds. – Biodivers. Conserv. 17: 3307-3319.
Sauerbrei, R., K. Ekschmitt, V. Wolters & T.K. Gottschalk 2014: Incre-ased energy maize production reduces farmland bird diver-sity. – GCB Bioenergy 6: 265-274.
Sotherton, N.W. 1998: Land use changes and the decline of farm-land wildlife: An appraisal of the set-aside approach. – Biol. Conserv. 83: 259-268.
Sotherton, N.W., N.D. Boatman, S. Mañosa & P.A. Roberston 1994: Management of set-aside for game and wildlife. – Asp. App. Biol. 40: 497-505.
Statistikbanken 2016: AFG07: Cultivated area by region, unit and crop. – Danmarks Statistik, Copenhagen–http://www.stat-bank.dk/statbank5a/default.asp?w=1680 (last accessed 12 August 2016).
Winstanley, D., R. Spencer & K. Williamson 1974: Where have all the Whitethroats gone? – Bird Study 21: 1-14.
Author’s addresses:Henning Heldbjerg ([email protected]), DOF-BirdLife Denmark, Ve-sterbrogade 140, DK-1620 Copenhagen V, Denmark and De-partment of Bioscience, Aarhus University, Kalø, Grenåvej 14, DK-8410 Rønde, Denmark
Anthony D. Fox, Department of Bioscience, Aarhus University, Kalø, Grenåvej 14, DK-8410 Rønde, Denmark


Agriculture, Ecosystems and Environment 230 (2016) 24–31, http://dx.doi.org/10.1016/j.agee.2016.05.025
Henning Heldbjerga,b*, Anthony D. Foxa, Gregor Levinc, Timme Nyegaardb
a Department of Bioscience, Aarhus University, Kalø, Grenåvej 14, DK 8410 Rønde, Denmarkb DOF BirdLife Denmark, Vesterbrogade 140, DK 1620 Copenhagen, Denmarkc Department of Environmental Science, Aarhus University, Frederiksborgvej 399, DK 4000 Roskilde, Denmark
*Corresponding author at: Department of Bioscience, Aarhus University, Kalø, Grenåvej 14, DK 8410 Rønde, DenmarkE-mail address: [email protected] (H. Heldbjerg)
PAPER 4
THE DECLINE OF THE STARLING STURNUS VULGARIS IN DENMARK IS RELATED TO CHANGES IN GRASSLAND EXTENT AND INTENSITY OF CATTLE GRAZING
Photo: Jan Skriver


79PhD thesis by Henning Heldbjerg
The decline of the Starling Sturnus vulgaris in Denmark is related tochanges in grassland extent and intensity of cattle grazing
Henning Heldbjerga,b,*, Anthony D. Foxa, Gregor Levinc, Timme Nyegaardb
aDepartment of Bioscience, Aarhus University, Kalø, Grenåvej 14, DK 8410 Rønde, DenmarkbDOF BirdLife Denmark, Vesterbrogade 140, DK 1620 Copenhagen, DenmarkcDepartment of Environmental Science, Aarhus University, Frederiksborgvej 399, DK 4000 Roskilde, Denmark
A R T I C L E I N F O
Article history:Received 3 February 2016Received in revised form 18 May 2016Accepted 22 May 2016Available online xxx
Keywords:Dairy cattleGrazing pressureGrassland managementPopulation trendStarling Sturnus vulgaris
A B S T R A C T
The Danish breeding Starling population declined at a mean annual rate of �2.24% � 0.39 (95% CI) during1976–2015 (a 60% decline overall). Starling density in the mid-1990s was positively correlated with dairycattle abundance in 13 local areas. Regional declines in Starling abundance between 2001 and 2014 werepositively correlated with loss of high intensity grazing pressure by dairy cattle, as more animalhusbandry moved indoors. The long-term decline in national Starling abundance was positivelycorrelated with the long term numbers of dairy cattle grazing outdoors. This study therefore confirmsthat not only does the extent of available grassland to breeding Starlings affect their relative abundance,but that the intensity of grazing of these grasslands is also of importance.ã 2016 The Author(s). Published by Elsevier B.V. This is an open access article under the CC BY-NC-ND
license (http://creativecommons.org/licenses/by-nc-nd/4.0/).
1. Introduction
Studies of farmland birds have tended to focus on speciesbreeding and/or foraging on arable land (e.g. Robinson andSutherland, 2002; Robinson et al., 2001). The annual cycle oftillage creates a series of temporary habitat states, with ploughing,for example, exposing invertebrates, seeds and plant storageorgans, drilling providing seed, plant growth offering foraginghabitat and harvest again providing food from spilled grain (e.g.Robinson and Sutherland, 1999). Not surprisingly, changes incropping and agricultural practices have had a huge impact onsome birds especially seed eating species (e.g. Chamberlain et al.,2000). This has been slightly to the neglect of those commonspecies that are dependent on pastoral systems, a majority ofwhich are more dependent on invertebrates and with seasonalpatterns of food provision and availability that do not follow thesame “boom and bust” cycle that occurs in arable agriculture(Vickery et al., 2001).
Denmark is predominantly an agricultural landscape (c. 60% oftotal land area is farmland; Levin and Normander, 2008) which hasfor centuries supported large numbers of dairy cattle. As the
numerically dominant form of reared livestock, dairy cowabundance, nationally and regionally, is closely related to area ofmanaged grassland. Although beef cattle contribute to grazingnumbers, dairy cattle are numerically dominant: the ratio of dairyto beef cattle changed from 1:17 in 1982–1:6 in 2013. Dairy cattlerequire the best managed grassland, so dairy cattle are likely toconstitute the key group of livestock that most drives relationshipsbetween cattle production, farmland practices, soil invertebratefauna and their predators.
In this case study, we focus on the effects of regional changes inDanish agriculture on the changes in distribution and abundance ofthe Starling Sturnus vulgaris, a specialist grassland invertebratefeeder and a numerous and widespread species in Denmark as wellas throughout Europe. Due to its abundance and association withhuman habitation it is a familiar and popular bird of societalinterest. However, numbers of breeding Starlings in Denmark havedeclined during the last 40 years (Nyegaard et al., 2015). As afarmland species often associated with grazing cattle wehypothesized that radical changes in pastoral agriculture in thesame period could have contributed to the Starling decline.
In this analysis, we first determine the degree to which theDanish Starling population has declined and if there wereregional changes that correlate with the changes in the extentof grassland in these areas. Since the Starling depends on shortgrassland as foraging habitat for provisioning their nestlings
* Corresponding author at: Department of Bioscience, Aarhus University, Kalø,Grenåvej 14, DK 8410 Rønde, Denmark.
E-mail address: [email protected] (H. Heldbjerg).
http://dx.doi.org/10.1016/j.agee.2016.05.0250167-8809/ã 2016 The Author(s). Published by Elsevier B.V. This is an open access article under the CC BY-NC-ND license (http://creativecommons.org/licenses/by-nc-nd/4.0/).
Agriculture, Ecosystems and Environment 230 (2016) 24–31
Contents lists available at ScienceDirect
Agriculture, Ecosystems and Environment
journa l homepage : www.e l sev ier .com/ loca te /agee
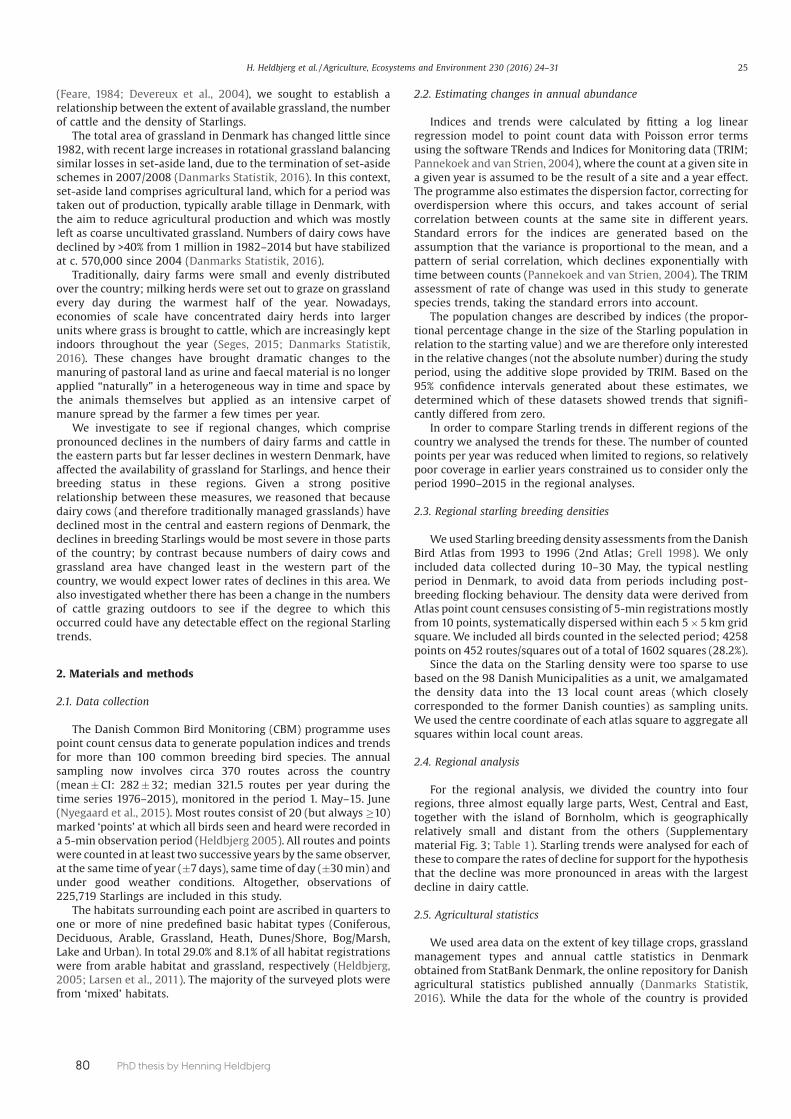
80 PhD thesis by Henning Heldbjerg
(Feare, 1984; Devereux et al., 2004), we sought to establish arelationship between the extent of available grassland, the numberof cattle and the density of Starlings.
The total area of grassland in Denmark has changed little since1982, with recent large increases in rotational grassland balancingsimilar losses in set-aside land, due to the termination of set-asideschemes in 2007/2008 (Danmarks Statistik, 2016). In this context,set-aside land comprises agricultural land, which for a period wastaken out of production, typically arable tillage in Denmark, withthe aim to reduce agricultural production and which was mostlyleft as coarse uncultivated grassland. Numbers of dairy cows havedeclined by >40% from 1 million in 1982–2014 but have stabilizedat c. 570,000 since 2004 (Danmarks Statistik, 2016).
Traditionally, dairy farms were small and evenly distributedover the country; milking herds were set out to graze on grasslandevery day during the warmest half of the year. Nowadays,economies of scale have concentrated dairy herds into largerunits where grass is brought to cattle, which are increasingly keptindoors throughout the year (Seges, 2015; Danmarks Statistik,2016). These changes have brought dramatic changes to themanuring of pastoral land as urine and faecal material is no longerapplied “naturally” in a heterogeneous way in time and space bythe animals themselves but applied as an intensive carpet ofmanure spread by the farmer a few times per year.
We investigate to see if regional changes, which comprisepronounced declines in the numbers of dairy farms and cattle inthe eastern parts but far lesser declines in western Denmark, haveaffected the availability of grassland for Starlings, and hence theirbreeding status in these regions. Given a strong positiverelationship between these measures, we reasoned that becausedairy cows (and therefore traditionally managed grasslands) havedeclined most in the central and eastern regions of Denmark, thedeclines in breeding Starlings would be most severe in those partsof the country; by contrast because numbers of dairy cows andgrassland area have changed least in the western part of thecountry, we would expect lower rates of declines in this area. Wealso investigated whether there has been a change in the numbersof cattle grazing outdoors to see if the degree to which thisoccurred could have any detectable effect on the regional Starlingtrends.
2. Materials and methods
2.1. Data collection
The Danish Common Bird Monitoring (CBM) programme usespoint count census data to generate population indices and trendsfor more than 100 common breeding bird species. The annualsampling now involves circa 370 routes across the country(mean � CI: 282 � 32; median 321.5 routes per year during thetime series 1976–2015), monitored in the period 1. May–15. June(Nyegaard et al., 2015). Most routes consist of 20 (but always �10)marked ‘points’ at which all birds seen and heard were recorded ina 5-min observation period (Heldbjerg 2005). All routes and pointswere counted in at least two successive years by the same observer,at the same time of year (�7 days), same time of day (�30 min) andunder good weather conditions. Altogether, observations of225,719 Starlings are included in this study.
The habitats surrounding each point are ascribed in quarters toone or more of nine predefined basic habitat types (Coniferous,Deciduous, Arable, Grassland, Heath, Dunes/Shore, Bog/Marsh,Lake and Urban). In total 29.0% and 8.1% of all habitat registrationswere from arable habitat and grassland, respectively (Heldbjerg,2005; Larsen et al., 2011). The majority of the surveyed plots werefrom ‘mixed’ habitats.
2.2. Estimating changes in annual abundance
Indices and trends were calculated by fitting a log linearregression model to point count data with Poisson error termsusing the software TRends and Indices for Monitoring data (TRIM;Pannekoek and van Strien, 2004), where the count at a given site ina given year is assumed to be the result of a site and a year effect.The programme also estimates the dispersion factor, correcting foroverdispersion where this occurs, and takes account of serialcorrelation between counts at the same site in different years.Standard errors for the indices are generated based on theassumption that the variance is proportional to the mean, and apattern of serial correlation, which declines exponentially withtime between counts (Pannekoek and van Strien, 2004). The TRIMassessment of rate of change was used in this study to generatespecies trends, taking the standard errors into account.
The population changes are described by indices (the propor-tional percentage change in the size of the Starling population inrelation to the starting value) and we are therefore only interestedin the relative changes (not the absolute number) during the studyperiod, using the additive slope provided by TRIM. Based on the95% confidence intervals generated about these estimates, wedetermined which of these datasets showed trends that signifi-cantly differed from zero.
In order to compare Starling trends in different regions of thecountry we analysed the trends for these. The number of countedpoints per year was reduced when limited to regions, so relativelypoor coverage in earlier years constrained us to consider only theperiod 1990–2015 in the regional analyses.
2.3. Regional starling breeding densities
We used Starling breeding density assessments from the DanishBird Atlas from 1993 to 1996 (2nd Atlas; Grell 1998). We onlyincluded data collected during 10–30 May, the typical nestlingperiod in Denmark, to avoid data from periods including post-breeding flocking behaviour. The density data were derived fromAtlas point count censuses consisting of 5-min registrations mostlyfrom 10 points, systematically dispersed within each 5 � 5 km gridsquare. We included all birds counted in the selected period; 4258points on 452 routes/squares out of a total of 1602 squares (28.2%).
Since the data on the Starling density were too sparse to usebased on the 98 Danish Municipalities as a unit, we amalgamatedthe density data into the 13 local count areas (which closelycorresponded to the former Danish counties) as sampling units.We used the centre coordinate of each atlas square to aggregate allsquares within local count areas.
2.4. Regional analysis
For the regional analysis, we divided the country into fourregions, three almost equally large parts, West, Central and East,together with the island of Bornholm, which is geographicallyrelatively small and distant from the others (Supplementarymaterial Fig. 3; Table 1). Starling trends were analysed for each ofthese to compare the rates of decline for support for the hypothesisthat the decline was more pronounced in areas with the largestdecline in dairy cattle.
2.5. Agricultural statistics
We used area data on the extent of key tillage crops, grasslandmanagement types and annual cattle statistics in Denmarkobtained from StatBank Denmark, the online repository for Danishagricultural statistics published annually (Danmarks Statistik,2016). While the data for the whole of the country is provided
H. Heldbjerg et al. / Agriculture, Ecosystems and Environment 230 (2016) 24–31 25
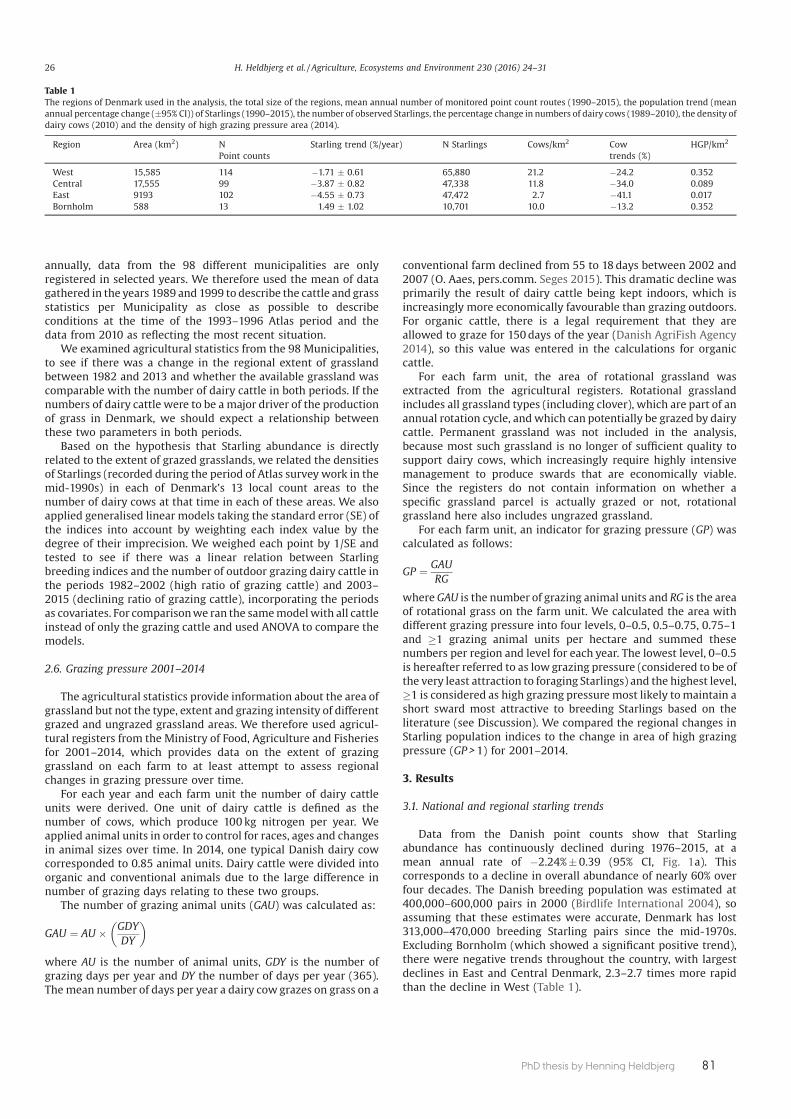
81PhD thesis by Henning Heldbjerg
annually, data from the 98 different municipalities are onlyregistered in selected years. We therefore used the mean of datagathered in the years 1989 and 1999 to describe the cattle and grassstatistics per Municipality as close as possible to describeconditions at the time of the 1993–1996 Atlas period and thedata from 2010 as reflecting the most recent situation.
We examined agricultural statistics from the 98 Municipalities,to see if there was a change in the regional extent of grasslandbetween 1982 and 2013 and whether the available grassland wascomparable with the number of dairy cattle in both periods. If thenumbers of dairy cattle were to be a major driver of the productionof grass in Denmark, we should expect a relationship betweenthese two parameters in both periods.
Based on the hypothesis that Starling abundance is directlyrelated to the extent of grazed grasslands, we related the densitiesof Starlings (recorded during the period of Atlas survey work in themid-1990s) in each of Denmark’s 13 local count areas to thenumber of dairy cows at that time in each of these areas. We alsoapplied generalised linear models taking the standard error (SE) ofthe indices into account by weighting each index value by thedegree of their imprecision. We weighed each point by 1/SE andtested to see if there was a linear relation between Starlingbreeding indices and the number of outdoor grazing dairy cattle inthe periods 1982–2002 (high ratio of grazing cattle) and 2003–2015 (declining ratio of grazing cattle), incorporating the periodsas covariates. For comparison we ran the same model with all cattleinstead of only the grazing cattle and used ANOVA to compare themodels.
2.6. Grazing pressure 2001–2014
The agricultural statistics provide information about the area ofgrassland but not the type, extent and grazing intensity of differentgrazed and ungrazed grassland areas. We therefore used agricul-tural registers from the Ministry of Food, Agriculture and Fisheriesfor 2001–2014, which provides data on the extent of grazinggrassland on each farm to at least attempt to assess regionalchanges in grazing pressure over time.
For each year and each farm unit the number of dairy cattleunits were derived. One unit of dairy cattle is defined as thenumber of cows, which produce 100 kg nitrogen per year. Weapplied animal units in order to control for races, ages and changesin animal sizes over time. In 2014, one typical Danish dairy cowcorresponded to 0.85 animal units. Dairy cattle were divided intoorganic and conventional animals due to the large difference innumber of grazing days relating to these two groups.
The number of grazing animal units (GAU) was calculated as:
GAU ¼ AU � GDYDY
� �
where AU is the number of animal units, GDY is the number ofgrazing days per year and DY the number of days per year (365).The mean number of days per year a dairy cow grazes on grass on a
conventional farm declined from 55 to 18 days between 2002 and2007 (O. Aaes, pers.comm. Seges 2015). This dramatic decline wasprimarily the result of dairy cattle being kept indoors, which isincreasingly more economically favourable than grazing outdoors.For organic cattle, there is a legal requirement that they areallowed to graze for 150 days of the year (Danish AgriFish Agency2014), so this value was entered in the calculations for organiccattle.
For each farm unit, the area of rotational grassland wasextracted from the agricultural registers. Rotational grasslandincludes all grassland types (including clover), which are part of anannual rotation cycle, and which can potentially be grazed by dairycattle. Permanent grassland was not included in the analysis,because most such grassland is no longer of sufficient quality tosupport dairy cows, which increasingly require highly intensivemanagement to produce swards that are economically viable.Since the registers do not contain information on whether aspecific grassland parcel is actually grazed or not, rotationalgrassland here also includes ungrazed grassland.
For each farm unit, an indicator for grazing pressure (GP) wascalculated as follows:
GP ¼ GAURG
where GAU is the number of grazing animal units and RG is the areaof rotational grass on the farm unit. We calculated the area withdifferent grazing pressure into four levels, 0–0.5, 0.5–0.75, 0.75–1and �1 grazing animal units per hectare and summed thesenumbers per region and level for each year. The lowest level, 0–0.5is hereafter referred to as low grazing pressure (considered to be ofthe very least attraction to foraging Starlings) and the highest level,�1 is considered as high grazing pressure most likely to maintain ashort sward most attractive to breeding Starlings based on theliterature (see Discussion). We compared the regional changes inStarling population indices to the change in area of high grazingpressure (GP > 1) for 2001–2014.
3. Results
3.1. National and regional starling trends
Data from the Danish point counts show that Starlingabundance has continuously declined during 1976–2015, at amean annual rate of �2.24% � 0.39 (95% CI, Fig. 1a). Thiscorresponds to a decline in overall abundance of nearly 60% overfour decades. The Danish breeding population was estimated at400,000–600,000 pairs in 2000 (Birdlife International 2004), soassuming that these estimates were accurate, Denmark has lost313,000–470,000 breeding Starling pairs since the mid-1970s.Excluding Bornholm (which showed a significant positive trend),there were negative trends throughout the country, with largestdeclines in East and Central Denmark, 2.3–2.7 times more rapidthan the decline in West (Table 1).
Table 1The regions of Denmark used in the analysis, the total size of the regions, mean annual number of monitored point count routes (1990–2015), the population trend (meanannual percentage change (�95% CI)) of Starlings (1990–2015), the number of observed Starlings, the percentage change in numbers of dairy cows (1989–2010), the density ofdairy cows (2010) and the density of high grazing pressure area (2014).
Region Area (km2) NPoint counts
Starling trend (%/year) N Starlings Cows/km2 Cowtrends (%)
HGP/km2
West 15,585 114 �1.71 � 0.61 65,880 21.2 �24.2 0.352Central 17,555 99 �3.87 � 0.82 47,338 11.8 �34.0 0.089East 9193 102 �4.55 � 0.73 47,472 2.7 �41.1 0.017Bornholm 588 13 1.49 � 1.02 10,701 10.0 �13.2 0.352
26 H. Heldbjerg et al. / Agriculture, Ecosystems and Environment 230 (2016) 24–31

82 PhD thesis by Henning Heldbjerg
3.2. Cattle and grassland
The relative density of Starlings registered during the nestingperiod in 1993-96 was significantly positively correlated with thenumbers of dairy cows in the 13 local count areas (Linearregression (�SE); y = 2.37 � 10�6� (�7.65 �10�7) + 0.90, n = 13,r2 = 0.47, p = 0.010; Fig. 2), with highest densities of Starlings anddairy cattle in the west of the country (Jutland; Supplementary
material Fig. 3). Since there are very few cows in the GreaterCopenhagen area, dominated by urban and suburban areas but alsowith extensive areas of farmland, and this point is an outlier, werecalculated the regression with the same data minus GreaterCopenhagen area and found an improved model fit (y = 3.08 � 10�6 � (� 5.64 �10�7) + 0.71, n = 12, r2 = 0.75, p � 0.001; Fig. 2).
The number of dairy cattle in Denmark declined by 43.7% in1982–2014 to c. 560,000, although this has stabilized since 2004,and the proportion of these grazing outside on the grasslanddeclined from 74% in 2003 to 25% in 2013 (Fig. 1b).
The majority of Danish dairy cows are now raised in Jutland,mainly in the western and southern parts (Danmarks Statistik,2014). Most of the grassland is also restricted to the samemunicipalities (see Supplementary material Figs. 1 and 2) andthere was a very highly significant relationship between the area ofgrassland and the number of dairy cows in the 98 Danishmunicipalities, based on the mean of 1989 and 1999 (Linearregression (�SE); y = 4.59 (�0.08) + 595, n = 98, r2 = 0.973, p� 0.001) as well as in 2010 (y = 1.38 (�0.04) � 1550, n = 98,r2 = 0.93, p � 0.001). We therefore consider the number of dairycattle as a good measure of available grassland throughoutDenmark, and conclude that the density of dairy cattle supportedby the area of grassland has clearly fallen over this time period.
3.3. Changes in numbers of cows grazing outdoors
Bornholm showed the smallest reduction in the number ofdairy cows, with largest reductions in Central and East (Table 1),similar to differences in Starling trends in the four regions.
For 2001–2014 we have an indirect measurement of thenumber of cattle grazing on a given area of available rotationalgrassland in each region using the calculation of grazing pressuredescribed in 2.6. This showed that the area of grassland subject tohigh grazing pressure is declining all across the country (Fig. 1c),although in the West, the relatively larger grassland area hasshown a relatively less pronounced decline (Fig. 3). This region stillsupports a larger area of grassland subject to high grazing pressurethan the other regions (4 times more than Central, 20 times morethan East), while the absolute area of high grazing pressure haschanged little on Bornholm. Albeit that 4 points are too few tocontribute to a meaningful regression model, there was a positivecorrelation between the regional relative change in high grazingpressure and the Starling population trend in the four regions(Fig. 3), implying that the greater the regional reduction in the areawith high grazing pressure the greater the decline in Starlingabundance.
At the same time, the area of grassland with the lowest level ofgrazing pressure has increased in all regions. The ratio of the areawith a low grazing pressure to the area with a high grazingpressure has changed from a factor of 2.8 to a factor of c. 35indicating a clear decline in grazing pressure across the country. Ascould be expected due to the steady decline in both parameters,there was a highly significant correlation at the national scalebetween the number of dairy cows and the Starling index during1982–2002 (Linear regression (�SE), y = 5.1 �10�5� (�1.5 �10�5) + 38.8, n = 21, r2 = 0.36; p = 0.01; see filled symbols, Fig. 4). Basedon the only existing results from the three years of surveysundertaken between 2003 and 2014, there was a steep decline inthe proportion of the dairy cows that were grazed outside (Fig. 1b).As a result, the area of actively grazed grassland fell and during thisperiod, there was no correlation between the number of dairy cowsand Starling index (Linear regression, y = �1.36 � 10�4� (�1.73� 10�4) + 127.34, n = 12, r2 = 0.06; p = 0.45; see the open symbols inFig. 4). For the latter period, we also correlated the Starling index tothe estimated number of grazing dairy cattle (calculated bymultiplying the number of dairy cattle reported in the national
0
25
50
75
100
125
150
197 6 1982 1988 1994 200 0 200 6 2012
Star
ling
inde
x (1
976
= 10
0)
74%
35%
25%
0
250
500
750
100 0
125 0
197 6 19 82 198 8 19 94 200 0 20 06 201 2
Num
ber o
f dai
ry co
ws (
x 100
0)
0
1
2
3
4
5
197 6 1982 1988 1994 2000 200 6 201 2
Log
(1 +
≥1
Graz
ing
anim
al u
nits
per
ha)
West Central East Bornholm
A
C
B
Fig. 1. A) Annual indices � SE (shading) for the Danish population of StarlingSturnus vulgaris during 1976–2015 (1976 = index 100) based on breeding bird pointcounts. The population has significantly declined at �2.24 � 0.39% (index � 95% CI)per annum over the period. The noticeable decline in 2013 was a result of aprolonged winter, which affected the populations in all regions. The indices arebased on data from the Danish Common Breeding Bird Monitoring programme runby DOF BirdLife Denmark. B) The annual total number of dairy cows in Denmarkduring 1982–2014 (circles) and the proportion of these grazing outside on grassland(triangles). C) The total areas (log transformed) of rotational grassland in the fourregions of Denmark defined in Supplementary material Fig. 3 indicated by thegrazing pressure of �1 animal units per hectare rotational grassland. West, shownby black circles declined by 76.4%, Central, open circles by 89.8%, East, grey trianglesby 94.0% and Bornholm, open diamonds by 33.4%.
H. Heldbjerg et al. / Agriculture, Ecosystems and Environment 230 (2016) 24–31 27
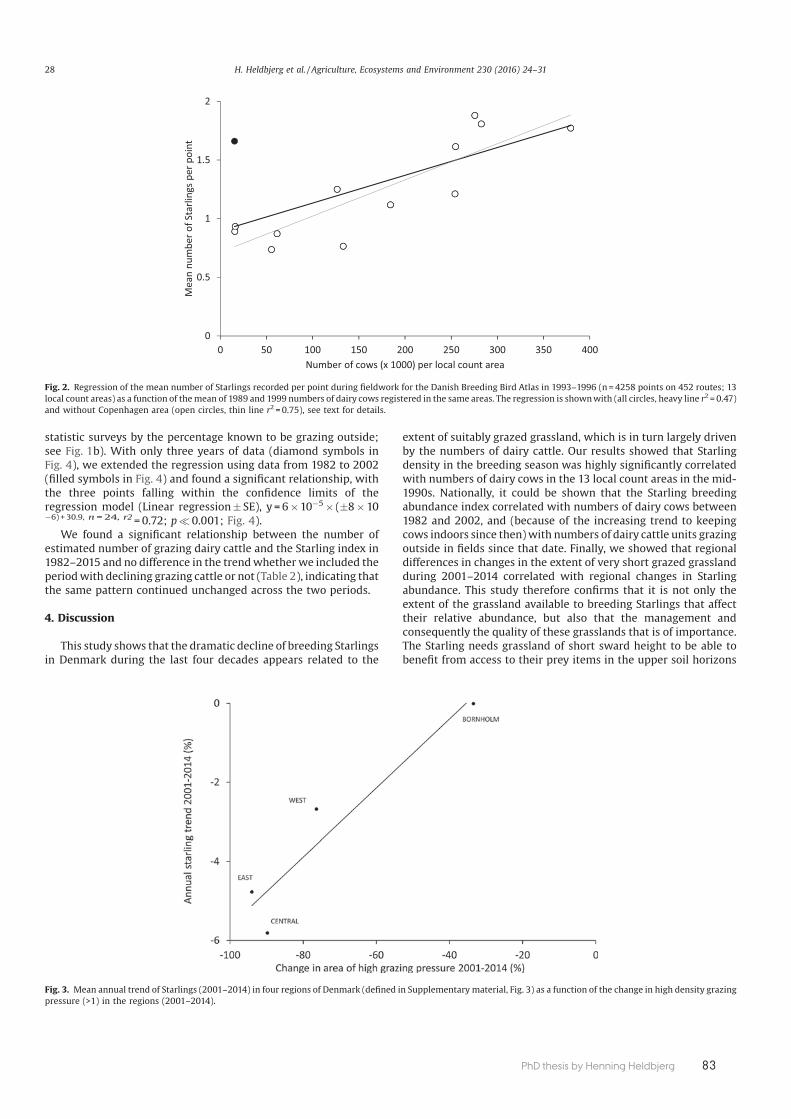
83PhD thesis by Henning Heldbjerg
statistic surveys by the percentage known to be grazing outside;see Fig. 1b). With only three years of data (diamond symbols inFig. 4), we extended the regression using data from 1982 to 2002(filled symbols in Fig. 4) and found a significant relationship, withthe three points falling within the confidence limits of theregression model (Linear regression � SE), y = 6 � 10�5� (�8 � 10�6) + 30.9, n = 24, r2 = 0.72; p � 0.001; Fig. 4).
We found a significant relationship between the number ofestimated number of grazing dairy cattle and the Starling index in1982–2015 and no difference in the trend whether we included theperiod with declining grazing cattle or not (Table 2), indicating thatthe same pattern continued unchanged across the two periods.
4. Discussion
This study shows that the dramatic decline of breeding Starlingsin Denmark during the last four decades appears related to the
extent of suitably grazed grassland, which is in turn largely drivenby the numbers of dairy cattle. Our results showed that Starlingdensity in the breeding season was highly significantly correlatedwith numbers of dairy cows in the 13 local count areas in the mid-1990s. Nationally, it could be shown that the Starling breedingabundance index correlated with numbers of dairy cows between1982 and 2002, and (because of the increasing trend to keepingcows indoors since then) with numbers of dairy cattle units grazingoutside in fields since that date. Finally, we showed that regionaldifferences in changes in the extent of very short grazed grasslandduring 2001–2014 correlated with regional changes in Starlingabundance. This study therefore confirms that it is not only theextent of the grassland available to breeding Starlings that affecttheir relative abundance, but also that the management andconsequently the quality of these grasslands that is of importance.The Starling needs grassland of short sward height to be able tobenefit from access to their prey items in the upper soil horizons
0
0.5
1
1.5
2
0 50 100 150 200 250 300 350 400
Mea
n nu
mbe
r of S
tarli
ngs p
er p
oint
Number of cows (x 1000 ) per local count area
Fig. 2. Regression of the mean number of Starlings recorded per point during fieldwork for the Danish Breeding Bird Atlas in 1993–1996 (n = 4258 points on 452 routes; 13local count areas) as a function of the mean of 1989 and 1999 numbers of dairy cows registered in the same areas. The regression is shown with (all circles, heavy line r2 = 0.47)and without Copenhagen area (open circles, thin line r2 = 0.75), see text for details.
Fig. 3. Mean annual trend of Starlings (2001–2014) in four regions of Denmark (defined in Supplementary material, Fig. 3) as a function of the change in high density grazingpressure (>1) in the regions (2001–2014).
28 H. Heldbjerg et al. / Agriculture, Ecosystems and Environment 230 (2016) 24–31

84 PhD thesis by Henning Heldbjerg
(Devereux et al., 2004). Such habitat requirements are likely metby grazing cattle that continuously maintain a short swardthroughout the Starling breeding season. Contemporary animalhusbandry increasingly keeps dairy cattle herds indoors all yearround and the expansion in the relative area of rotational silagegrassland that has increasingly replaced grazed grasslands verylikely contributes to the adverse effect on Starling breedingabundance.
4.1. Starling trends
We found a significant annual national decline of 2.24% inStarling abundance during 1976–2015 and significant mean annualdeclines of 1.7–4.5% in the three major areas during 1990–2015, incontrast to the increasing mean annual trend of 1.5% for the smallpopulation on Bornholm (Table 1).
The rate of decline amongst Starling trends in the Central andEast regions of the country were more rapid than in the West. Somelarge local Starling populations persist in areas of grassland withgrazing cattle in the East region of Denmark (own observations),showing that even in the areas showing most rapid declines, wheresuitable feeding conditions continue to prevail, there still remainsthe potential to support a healthy local breeding Starlingpopulation. The slightly higher density of Starlings in the GreaterCopenhagen area compared to the rest of the East region is heavilyinfluenced by two large Starling observations (4.7 and 7.8 times themean of the rest) in two nature management areas retainingextensive areas of grassland grazed by cattle but is probably also aresult of the areas of grazed grasslands managed to support largenumbers of horses, kept for riding in the outskirts of Copenhagen(and in North Zealand), where horse densities in some Municipali-ties are up to 6 times the mean for the country as a whole
(Danmarks Statistik, 2016). Telemetry studies of the foraging areasused by breeding Starlings provisioning young confirm thatStarlings forage in horse grazed areas in the absence of grazingcows (Heldbjerg et al. in prep.).
The moderate increase in the Starling population on Bornholmis, by comparison, unusual. Bornholm is a small island, with arelatively long coastline that might provide an additional and morestable habitat for Starlings. It also differs geologically from therest of Denmark in being rocky and hilly, which retains moremarginal grazed areas and fewer biotopes modified by agriculture(Gravesen, 1996). Bornholm farms are smaller and more diversethan average for Denmark, with four times the density of cattlecompared to that in the East of Denmark (Table 1), however itremains unclear why these differences should support an increasein Starling abundance, which would repay further investigation.
4.2. Starlings in relation to extent of suitably grazed grassland
The significant positive relationship between the number ofdairy cows and the mean Starling density in 13 local count areas inthe mid-1990s strongly suggested that the breeding density of thespecies depended on the extent of cattle grazing. The markedchange in the significant relationship between the area ofgrassland and the number of dairy cows in the 98 municipalitiesbetween the 1990s and 2010 showed that the dairy farmingindustry has been able to support many fewer cows on the samearea of grazing land in more recent years. This development hasbeen possible by the increasing amount of indoor dairy husbandry,with fewer cows allowed to graze outside. This results in changesin the nature of the swards available to Starlings, which favour veryshort sward heights maintained by sequential grazing by stock.This relationship is also confirmed by the finding that changes inStarling regional abundance in Denmark correlated with regionalchanges in the extent of highly grazed grassland.
Grassland is largely maintained in the Danish landscape toprovide cattle food. There are now strong economic reasons forkeeping cattle indoors, which have major effects on the current andfuture management of grasslands. Grass is now largely cut forsilage to feed cattle indoors, instead of being grazed. Increasingly,even non-rotational areas are cut for silage, whilst in many valleybottom grasslands grazing has been abandoned. As a result, thedecline in the dairy cow population has not been associated with achange of the same magnitude in the grassland area. This canpartly be explained by the extra energy intake of the dairy cowswhich produced 18.5% more milk in 2012 than in 2000 (DanmarksStatistik, 2016), but it is also an effect of the termination of set-aside schemes in 2007/2008 and the subsequent removal of setaside from the Danish landscape, much of which has beenconverted into grassland area.
Traditional grazing by dairy cows, which ensured dailyheterogeneous applications of small amounts of manure andurine to grasslands, has been replaced by infrequent and uniformapplications of large amounts of concentrated manure, which haslikely affected invertebrate abundance and diversity and limitedaccess to food by birds (Plantureux et al., 2005). Invertebrate
0
25
50
75
100
125
0 250 500 750 1000
Star
ling
popu
la�o
n in
dex
Number of dairy cows (x 1000)
1982-2002 2003-2014 Grazing 2003-2014
Fig. 4. The changes in the annual Danish Starling breeding population index as afunction of the number of dairy cows. There is a significant linear correlation in1982–2002 (r2 = 0.36), but no such correlation in 2003–2014 (r2 = 0.06). Theestimated number of grazing dairy cows are also used as an alternative for 2003–2014 (see text).
Table 2Linear models on Starling indices and number of cattle in 1982–2015 showing estimates and p-values of each linear model and F and p-values for ANOVA’s indicating if theincorporated periods are significantly different from each other (see also text).
Cattle Period, covariate LM ANOVA
Estimate �SE p-value F-statistic DF p value
Estimated grazing No 6.56e–05 � 9.08e-06 4.06e-07Estimated grazing Yes 4.55e–06 � 1.98e-05 0.821 0.053 2,21 0.821All No 4.64e–05 � 1.78e-05 0.014All Yes �3.43e–05 � 7.74e-06 0.0001 19.60 2,30 0.0001
H. Heldbjerg et al. / Agriculture, Ecosystems and Environment 230 (2016) 24–31 29

85PhD thesis by Henning Heldbjerg
abundance and diversity also declines with a reduction in swarddiversity and structural complexity (Vickery et al., 2001). Foodabundance for grassland foraging insectivore birds tends toincrease with sward height but food accessibility also declineswith sward height (Atkinson et al., 2004; Buckingham et al., 2004).Tipulidae larvae form the main food item for the Starling nestlings(Rhymer et al., 2012) but since Starling field use was inverselycorrelated with sward height (Fuller et al., 2003), access to foodmay be the critical factor (Atkinson et al., 2005).
Hence, in addition to changes in sward height caused bychanges in grazing regimes, there is a possibility that changes inthe contemporary management of grassland, like structuralcomplexity and use of fertiliser may change the abundance anddiversity of prey from that available in earlier forms of regularlygrazed and managed grassland.
This study showed that there were regional relationshipsbetween grassland management and the population trends forbreeding Starlings. These relationships are only correlative,because such species/habitat linkages are very difficult to establishbut the general declines in cattle/grass coincide with declines inthe Starlings. Processes at small spatial scale such as the local lossof good foraging habitat has been suggested as the main reason forthe general decline in the Swedish Starling population (Smith et al.,2012) and we will have to study their foraging ecology andbreeding biology in areas with different farmland management aswell as different aspects of the Starlings demography to under-stand what causes the significant decline in Denmark which isreflected in population trends throughout much of Northern andWestern Europe (BirdLife International, 2015).
5. Conclusions
This study provided evidence that developments in the dairysector in Denmark have had major consequences for the breedingStarling in Denmark. Our results reveal that regional declines ingrazing dairy cattle correlate with declines in breeding Starlingabundance. Latterly, during a period of stability in managedgrassland area, the increasing trend to keep dairy cows fed indoorshas likely contributed to the reduction in very short grazedgrassland that is most attractive to nesting Starlings. To betterunderstand how we might investigate positive management forStarlings in the future, we need to undertake further studies to:
1. investigate effects of changes in grassland management oninvertebrate abundance, diversity and accessibility to foragingadult Starlings for feeding nestlings
2. confirm the relationship between different types of grasslandand grassland management and Starling reproductive success inDenmark and throughout Europe, and
3. Use the results from these to address policy needs to recognizethe effects of agricultural changes on Starling populations inDenmark and throughout Europe and consider how agri-environment schemes could safeguard appropriate grazingregimes to restore the Starling to more favourable conservationstatus.
Acknowledgements
None of this work could have been undertaken without theannual, selfless contribution of the very many bird-watchers thathave contributed data to the common bird monitoring. We are verygrateful to each and every one of you for making this type ofanalysis possible through the provision of point count data. Thanksto The Danish Nature Agency for funding from the project:“Agerlandets almindelige og sjældne fugle”. HH acknowledges the
support of an industrial PhD stipend awarded by Innovationsfon-den, which, together with Aage V Jensen Naturfond and 15. JuniFonden also supported this work. We thank Karsten Kjeld Larsen,Danmarks Statistik for help in accessing farmland statistics and OleAaes and Rudolf Thøgersen, Seges for sharing their knowledge onchanges in the nature of grazing cattle in Denmark and RobRobinson and an anonymous referee for improving the manuscriptby their comments on an earlier draft. We also thank Rob Robinsonfor statistical advice.
Appendix A. Supplementary data
Supplementary data associated with this article can be found, inthe online version, at http://dx.doi.org/10.1016/j.agee.2016.05.025.
References
Atkinson, P.W., Buckingham, D., Morris, A.J., 2004. What factors determine whereinvertebrate-feeding birds forage in dry agricultural grasslands? Ibis 146,99–107.
Atkinson, P.W., Fuller, R.J., Vickery, J.A., Conway, G.J., Tallowin, J.R.B., Smith, R.E.N.,Haysom, K.A., Ings, T.C., Asteraki, E.J., Brown, V.K., 2005. Influence of agriculturalmanagement, sward structure and food resources on grassland field use bybirds in lowland England. J. Appl. Ecol. 42, 932–942.
BirdLife International, 2015. European Red List of Birds. Office for OfficialPublications of the European Communities, Luxembourg.
Birdlife International,, 2004. Birds in Europe: Population Estimates, Trends andConservation Status. BirdLife International, Cambridge, UK (BirdLifeConservation Series No. 12).
Buckingham, D.L., Atkinson, P.W., Rook, A.J., 2004. Testing solutions ingrass-dominated landscapes: a review of current research. Ibis 146,163–170.
Chamberlain, D.E., Fuller, R.J., Bunce, R.G.H., Duckworth, J.C., Shrubb, M., 2000.Changes in the abundance of farmland birds in relation to the timing ofagricultural intensification in England and Wales. J. Appl. Ecol. 37,771–788.
Danish AgriFish Agency, 2014. Vejledning om økologisk jordbrugsproduktion.Januar 2014.
Danmarks Statistik, 2014. Nyt fra Danmarks Statistik nr. 384, 23. juli 2014.Danmarks Statistik, 2016. Stat Bank Denmark. Business Sector Statistics. . (last
accessed 20.01.16) http://www.statistikbanken.dk/statbank5a/default.asp?w=1536.
Devereux, C.L., McKeever, C.U., Benton, T.G., Whittingham, M.J., 2004. The effect ofsward height and drainage on Common Starlings Sturnus vulgaris and NorthernLapwings Vanellus vanellus foraging in grassland habitats. Ibis 146,115–122.
Feare, C., 1984. The Starling. Oxford University Press, Oxford.Fuller, R.J., Atkinson, P.W., Asteraki, E.J., Conway, G.J., Goodyear, J., Haysom, K., Ings,
T., Smith, R.E.N., Tallowin, J.R., Vickery, J.A., 2003. Changes in Lowland GrasslandManagement: Effects on Invertebrates and Birds. Report to Defra onCommissioned Project BD1435. Research Report 350. Thetford, British Trust forOrnithology.
Gravesen, P., 1996. Bornholm. En beskrivelse af områder af national geologiskinteresse. Miljø- og Energiministeriet, Skov- og Naturstyrelsen Geografforlaget:Copenhagen.
Grell, M.B., 1998. Fuglenes Danmark. Gad, Copenhagen.Heldbjerg, H., 2005. De almindelige fugles bestandsudvikling i Danmark
1975–2004. Dansk Orn. Foren. Tidsskr. 99, 182–195.Larsen, J.L., Heldbjerg, H., Eskildsen, A., 2011. Improving national habitat specific
biodiversity indicators using relative habitat use for common birds. Ecol. Indic.11, 1459–1466.
Levin G. & Normander B. 2008. Arealanvendelse i Danmark siden slutningen af1800-tallet. Danmarks Miljøundersøgelser, Aarhus Universitet. 46 s.—Fagligrapport fra DMU nr. 682 (In Danish). http://www2. dmu.dk/Pub/FR682_final.pdf.
Nyegaard, T., Larsen, J.D., Brandtberg, N., Jørgensen, M.F., 2015. Overvågning af dealmindelige fuglearter I Danmark 1975–2014. Årsrapport forPunkttællingsprogrammet. Dansk Ornitologisk Forening. København (InDanish).
Pannekoek, J., van Strien, A., 2004. TRIM 3 Manual (Trends and Indices forMonitoring Data). Statistics Netherlands, Amsterdam, Netherlands.
Plantureux, S., Peeters, A., McCracken, D., 2005. Biodiversity in intensive grasslands:effect of management, improvement and challenges. Grassland Sci. Eur.10, 417–426.
Rhymer, C.M., Devereux, C.L., Denny, M.J.H., Whittingham, M.J., 2012. Diet of StarlingSturnus vulgaris nestlings on farmland: the importance of Tipulidae larvae. BirdStudy 59, 426–436.
Robinson, R.A., Sutherland, W.J., 1999. The winter distribution of seed-eating birds:habitat structure: seed density and seasonal depletion. Ecography 22,447–454.
30 H. Heldbjerg et al. / Agriculture, Ecosystems and Environment 230 (2016) 24–31

86 PhD thesis by Henning Heldbjerg
Robinson, R.A., Sutherland, W.J., 2002. Post-war changes in arable farming andbiodiversity in Great Britain. J. Appl. Ecol. 39, 157–176.
Robinson, R.A., Wilson, J.D., Crick, H.Q.P., 2001. The importance of arable habitat forfarmland birds in grassland landscapes. J. Appl. Ecol. 38, 1059–1069.
Seges, 2015. Fakta om kvæg produktion. . (last accessed 11.11.15) http://www.seges.dk/Afdelinger/Kvaeg/FaktaOmKvaegproduktion/Dyrevelfaerd/Faktaomkoerpaagraes/hvor_mange_paa_graes.htm.
Smith, H.G., Ryegård, A., Svensson, S., 2012. Is the large-scale decline of the Starlingrelated to local changes in demography? Ecography 35, 741–748.
Vickery, J.A., Tallowin, J.R., Feber, R.E., Asteraki, E.J., Atkinson, P.W., Fuller, R.J., Brown,V.K., 2001. The management of lowland neutral grasslands in Britain: effects ofagricultural practices on birds and their food resources. J. Appl. Ecol. 38,647–664.
H. Heldbjerg et al. / Agriculture, Ecosystems and Environment 230 (2016) 24–31 31
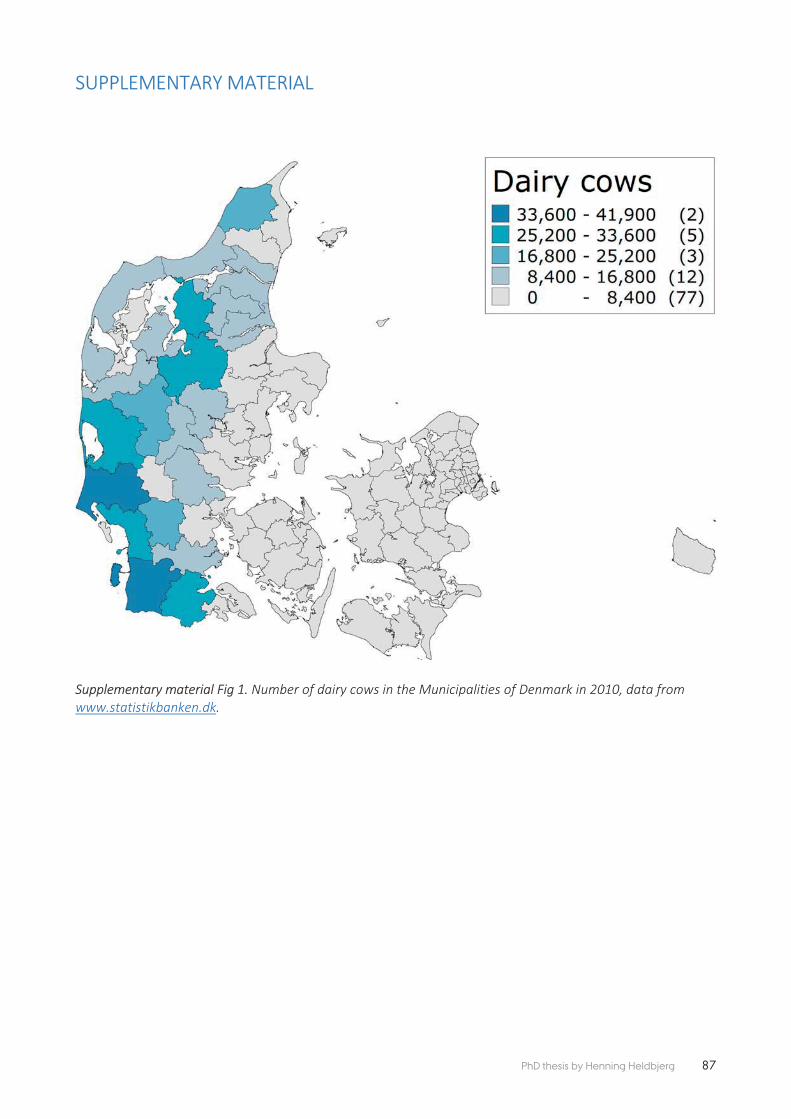
87PhD thesis by Henning Heldbjerg

88 PhD thesis by Henning Heldbjerg
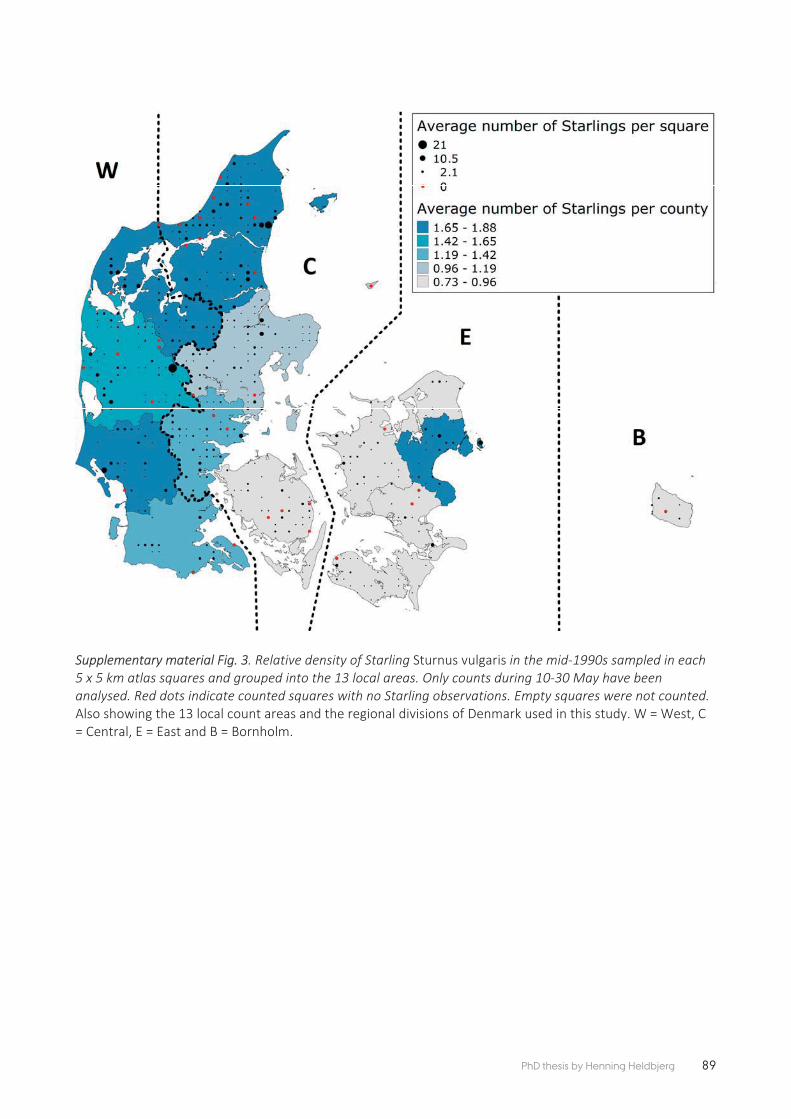
89PhD thesis by Henning Heldbjerg


PLOS ONE | https://doi.org/10.1371/journal.pone.0182504 August 3, 2017
Henning Heldbjerg1,2*, Anthony D. Fox1, Peder V. Thellesen3, Lars Dalby1, Peter Sunde1
1 Department of Bioscience – Wildlife Ecology, Aarhus University, Kalø, Rønde, Denmark2 DOF BirdLife Denmark, Copenhagen, Denmark3 Hjortkær, Årre, Denmark
PAPER 5
COMMON STARLINGS (STURNUS VULGARIS) INCREASINGLY SELECT FOR GRAZED AREAS WITH INCREASING DISTANCE-TO-NEST
Photo: Anthony D. Fox


93PhD thesis by Henning Heldbjerg
RESEARCH ARTICLE
Common Starlings (Sturnus vulgaris)increasingly select for grazed areas withincreasing distance-to-nest
Henning Heldbjerg1,2 , Anthony D. Fox1, Peder V. Thellesen3, Lars Dalby1, Peter Sunde1
1 Department of Bioscience–Wildlife Ecology, Aarhus University, Kal , R nde, Denmark, 2 DOF BirdLifeDenmark, Copenhagen, Denmark, 3 Hjortkær, rre, Denmark
Abstract
The abundant and widespread Common Starling (Sturnus vulgaris) is currently declining
across much of Europe due to landscape changes caused by agricultural intensification.
The proximate mechanisms causing adverse effects to breeding Starlings are unclear, ham-
pering our ability to implement cost-efficient agri-environmental schemes to restore popula-
tions to former levels. This study aimed to show how this central foraging farmland bird uses
and selects land cover types in general and how use of foraging habitat changes in relation
to distance from the nest. We attached GPS-loggers to 17 breeding Starlings at a Danish
dairy cattle farm in 2015 and 2016 and analysed their use of different land cover types as a
function of distance intervals from the nest and their relative availability. As expected for a
central place forager, Starlings increasingly avoided potential foraging areas with greater
distance-to-nest: areas� 500 m were selected 100 times less frequently than areas within
100 m. On average, Starlings selected the land cover category Grazed most frequently, fol-
lowed by Short Grass, Bare Ground, Meadow andWinter Crops. Starlings compensated for
elevated travel costs by showing increasing habitat selection the further they foraged from
the nest. Our results highlight the importance of Grazed foraging habitats close to the nest
site of breeding Starlings. The ecological capacity of intensively managed farmlands for
insectivorous birds like the Starling is decreasing through conversion of the most strongly
selected land cover type (Grazed) to the least selected (Winter Crops) which may be further
exacerbated through spatial segregation of foraging and breeding habitats.
IntroductionIn Western and Central Europe, bird populations associated with farmland habitats have been
steadily decreasing for three decades (e.g. [1–4]). These long term and large scale population
declines of multiple species have been associated with ‘agricultural intensification’ [2,5]. How-
ever, the underlying specific, proximate causes hidden beneath such a generic explanation
(which may result from multiple causes, even for a single species) often remain poorly under-
stood. For instance, populations may decline or disappear entirely due to: (1) general
PLOSONE | https://doi.org/10.1371/journal.pone.0182504 August 3, 2017 1 / 17
a1111111111a1111111111a1111111111a1111111111a1111111111
Citation: Heldbjerg H, Fox AD, Thellesen PV, DalbyL, Sunde P (2017) Common Starlings (Sturnusvulgaris) increasingly select for grazed areas withincreasing distance-to-nest. PLoS ONE 12(8):e0182504. https://doi.org/10.1371/journal.pone.0182504
Editor: Csaba Moskat, Hungarian Academy ofSciences, HUNGARY
Received:March 1, 2017
Accepted: July 19, 2017
Published: August 3, 2017
Copyright: 2017 Heldbjerg et al. This is an openaccess article distributed under the terms of theCreative Commons Attribution License, whichpermits unrestricted use, distribution, andreproduction in any medium, provided the originalauthor and source are credited.
Data Availability Statement: A raw data filecontaining all positions, date and time from allinstrumented Starlings is within the paper and itsSupplementary Material.
Funding: The Danish Nature Agency funded theproject: "Agerlandets almindelige og sjældne fugle"for HH and ADF. HH acknowledges the support ofan industrial PhD stipend awarded byInnovationsfonden, which, together with Aage VJensen Naturfond and 15. Juni Fonden alsosupported this work. The funders had no role in

94 PhD thesis by Henning Heldbjerg
deterioration in food availability, caused by intensified cultivation, (2) conversion of land
cover types providing rich feeding opportunities to other cover types of less or no value and/or
(3) increasing homogenisation of the agricultural mosaic (e.g. larger field units), reducing
micro-habitat presence and diversity (e.g. nesting and foraging habitats) within an individual’s
activity range [6–8]. Although the overall process of agricultural intensification may not be
reversible, the adverse effects on biodiversity components (such as species abundance) may be
diminished or reversed through agri-environmental schemes or voluntary means. Such benefi-
cial actions should include modest management targets to achieve the highest possible biodi-
versity benefit in a given landscape context. To achieve the best results, knowledge of a species’
micro habitat requirements, which include the spatial configuration of these elements in
relation to each other, are of paramount importance. To understand these requirements, pre-
dictive models of habitat suitability based on use by observed individuals relative to habitat
availability, so called Resource Selection Functions (RSFs), have increasingly been used [9–11].
Ecological inference from RSFs is based on the premise that selection (i.e. the disproportionate
use of a resource relative to its availability) reflects optimal behavioural decisions made by an
organism in response to relative habitat quality, since relative differences in selection between
habitat units are likely to be approximately proportional to their difference in quality [11–12].
The logic is that if a given habitat type, A, is used x times as often as another habitat type, B, if
equally available and all other factors are held equal, then habitat A can be assumed to be
approximately x times (the selection ratio or odds ratio of selection) as important as B. This is
the case as long as both habitats are used for exactly the same purpose (e.g. foraging). Similarly,
by simultaneously modelling several habitat variables, RSFs can estimate partial variation in
habitat quality (as a proxy) as a function of individual habitat traits in a given environmental
context (all other habitat factors held equal). RSFs can also quantify selection for different land
cover types at different distances from the nest. Finally, maps of individual selectivity can be
generated from RSFs comprising multiple predictors (e.g. effects of land cover types and dis-
tance-to-nest), which in turn can be considered as fairly reliable proxies for the relative impor-
tance of the individual area units within the studied subjects’ home range [11–12].
In this study, we present a spatially explicit habitat selection model for foraging Common
Starlings (Sturnus vulgaris, hereafter Starling) breeding in a Danish farmland landscape. We
use recent developments in lightweight GPS logger technology to track foraging Starlings on a
traditionally managed dairy cattle farm in southern Jutland in order to determine their habitat
use in relation to land cover type (i.e. habitat) availability and distance-to-nest.
The Starling is one of Europe’s most common and geographically widespread farmland
birds, occupying a wide range of open habitat types, feeding on invertebrates harvested from
the ground and upper soil horizons. As such, it is a perfect model species to study of how ‘com-
mon’ insectivorous farmland birds adapt to prevailing food conditions in farmland habitats.
The Starling is a short distance migrant and a common and widespread summer visitor to
Denmark, where breeding abundance has significantly declined by 2.2% per annum during
1976–2015 [13], similar to the mean annual decline of 1.9% throughout Europe during 1980–
2013 [14]. During 1976–2015, Danish farmland has changed considerably through intensifica-
tion and specialisation, with a major shift from spring sown to autumn sown cereals during
the 1980s and 1990s and a reduction in number, an increase in mean size and an increasing
concentration of dairy farms in the south and west of the country [15–16]. The extent of grazed
grassland has decreased as the area of intensively managed silage grassland and maize cultiva-
tion has increased, because dairy cows are now predominantly fed indoors [4]. An earlier
national study showed contrasting trends in breeding Starling abundance between Danish
regions depending on the regional land use change, particularly in relation to grassland area
and intensity of cattle grazing [16]. However, in the absence of data on precise habitat use by
Distance dependent habitat selection among Common Starlings
PLOSONE | https://doi.org/10.1371/journal.pone.0182504 August 3, 2017 2 / 17
study design, data collection and analysis, decisionto publish, or preparation of the manuscript.
Competing interests: The authors have declaredthat no competing interests exist.

95PhD thesis by Henning Heldbjerg
Starlings within the farmland mosaic, it is difficult to gather more than correlational support
for hypotheses regarding their population declines.
Starlings provisioning offspring become classic central-place foragers, harvesting inverte-
brate prey and returning to a central place (the nest site) to deliver food to their nestlings. This
provides a unique opportunity to determine habitat selection at a landscape scale in relation to
availability, and look at the interaction between selectivity and distance. Since prolonging for-
aging trip duration is both energetically costly and reduces trip frequency, we predict that hab-
itat selection will be greater with increasing distance, increasing load size or energy content to
elevate profitability [17]. For these reasons, we deployed GPS loggers on breeding male and
female Starlings solely while feeding their nestlings, when habitat choice is critical to their for-
aging efficiency, and to their reproductive success. Since it is known that breeding Starlings
select especially short sward grasslands [18–19], we were curious to see how such habitats
(grazed and ungrazed, and others) were selected in the agricultural landscape by individual
birds from the same colony in relation to their relative availability.
Methods
Study siteThe study site was chosen at a colony on a traditional dairy farm with grazing cattle and mixed
crops of spring barley, winter wheat, grass and fodder beets, owned by PVT in Hjortkær, near
Esbjerg (55˚32.4077’N 8˚43.6529’E) in the area of southwest Denmark. Starlings in this part of
Denmark have shown the least declines in abundance nationally [16] and hence this area was
chosen because it was expected to represent birds showing least disturbed behaviour in the
country. All studied Starlings bred in 27 nestboxes mounted on farm buildings or surrounding
trees within 50 m of each other, 3–4 m above the ground. Breeding success at this colony has
been stable since 1971 [20] and occupancy was more or less 100% until c. 10 years ago, since
when the proportion has fallen to roughly 60%.
GPS loggersWe attached battery powered Gypsy 5 GPS loggers (Technosmart Europe srl., Rome) with a
total mass (including Teflon harness) of c. 3.2 g (c. 3.5–4% of Starling body mass) and posi-
tional accuracy down to 2–4 metres. All loggers were set to record 1 fix/minute during the day-
light period and either low frequency (1 fix /hour) or no fixes at night (night positions were
not considered in this study), commencing one day after attachment to exclude eventual beha-
vioural effects of being caught and handled. At this frequency of positional logging and a bat-
tery capacity of up to 32 hours, we re-caught tagged birds after 3–5 days to retrieve loggers to
obtain as much data as possible, extracting data via a cable connection.
Capture and instrumentationThe capture and instrumenting of Starlings used in this study conforms with the Aarhus Uni-
versity code of practice to ensure responsible research conduct and was carried out with the
expressed permission of the Ringing Centre of the Danish Natural History Museum. Breeding
Starlings were caught during 5–14 May 2015 (7) and 6–14 May 2016 (10) either in nestboxes
or in mist nets nearby while provisioning offspring (see S1 Table). There was very little varia-
tion in the clutch size and pairs at the colony breed highly synchronously (Thellesen in print),
so the ringing/logging period was chosen to include a comparable group of adult birds with
chicks at the age of 4–7 days. Hence, we consider breeding stage and brood size had little effect
on individual behaviour. Individual body mass of provisioning Starlings varied by several
Distance dependent habitat selection among Common Starlings
PLOSONE | https://doi.org/10.1371/journal.pone.0182504 August 3, 2017 3 / 17

96 PhD thesis by Henning Heldbjerg
grams per day, so mass at capture was not incorporated into the models. Starlings were fitted
with a logger using a harness of 2 mm Teflon ribbon around each wing, held together by a
short 4 mm Teflon ribbon in front of the sternum. Harness straps were either knotted, sewed
and glued to the logger on the back of the bird (in 2015) or secured by a metal clipped loop to
the logger (in 2016). For two experienced ringers the handling time was 10–20 minutes includ-
ing ringing, colour ringing and attachment of the logger. Data were extracted from 17 individ-
ual first clutch breeding birds (6–32 hours of data per bird; S1 Table). Despite a potential day-
to-day variation in prey availability within the c. one week per year the data were sampled, we
consider the data derived from all loggers from the same year as samples of the same general
conditions of prey availability in relation to habitat availability.
Starling positions and filtering the dataEach logger provided a data file (.txt) giving information on every fix until the battery runs
short of energy. Each fix comprised information on time, position, speed and precision see
[21] and S1 Fig.
We filtered the data to focus on habitat use only while foraging and included only precise
positions. We excluded all data of birds flying (speed> 0.0) and all data with a precision less
than c. 10 m (HDOP> 2.5) to maximize the number of data points assigned to foraging habi-
tat categories. We also excluded all data between 20:00 and 05:30 local time to exclude posi-
tions related to movements to and from night roosts. Finally we excluded all data from the
habitat categories buildings, gardens, forests and lakes (10.4% of total area within 1 km from
the colony) since these were clearly associated with behavioural activities other than feeding
(e.g. sleeping, roosting, singing, mating, drinking etc.) and were not relevant in the context of
describing foraging behaviour. We only included birds/loggers with more than 50 observa-
tions which resulted in 52–382 (mean ± SE: 241 ± 25, S1 Table) positions per Starling.
Description and coding of land cover types and distance-to-nestcategoriesAll uniform habitats out to a radius of 1 km from the capture site (in excess of the maximum
distance from the nest where the Starlings foraged) were described to habitat/crop on maps
within field and land parcel units, to define their relative availability to foraging Starlings. Field
polygons were retrieved from the common agriculture register (GLR, “Det Generelle Land-
brugsregister”) maintained by the Danish AgriFish Agency [22]. For all other habitat catego-
ries (meadows, forests, etc.) we used publicly available map layers from the Danish public
geographical administration data (GeoDanmark, downloaded 2012, http://download.
kortforsyningen.dk). This habitat information was transferred to GIS layers by defining poly-
gons for all registered crops.
For the statistical analyses, land cover types were condensed into five predominant crop cat-
egories available for all birds: Grazed (grazed grass, but management otherwise is unknown),
Short Grass (at the time of the study), Bare Ground (new-sown maize and spring cereals),
Winter Crops (autumn-sown cereals and rape) and Meadows (non-grazed/mown grassland)
(Fig 1).
Habitat availability was measured as the frequency of each land cover type at different dis-
tance-to-nest categories. This was determined by superimposing a 50 m grid overlaid upon the
land-use classification map covering the study area out to beyond the maximum observed
Starling foraging distance from the farm. The habitats present at each grid intersection (4 ha-1,
hereafter referred to as relative availability points for habitat sampling, ‘RAPs’) were then used
Distance dependent habitat selection among Common Starlings
PLOSONE | https://doi.org/10.1371/journal.pone.0182504 August 3, 2017 4 / 17
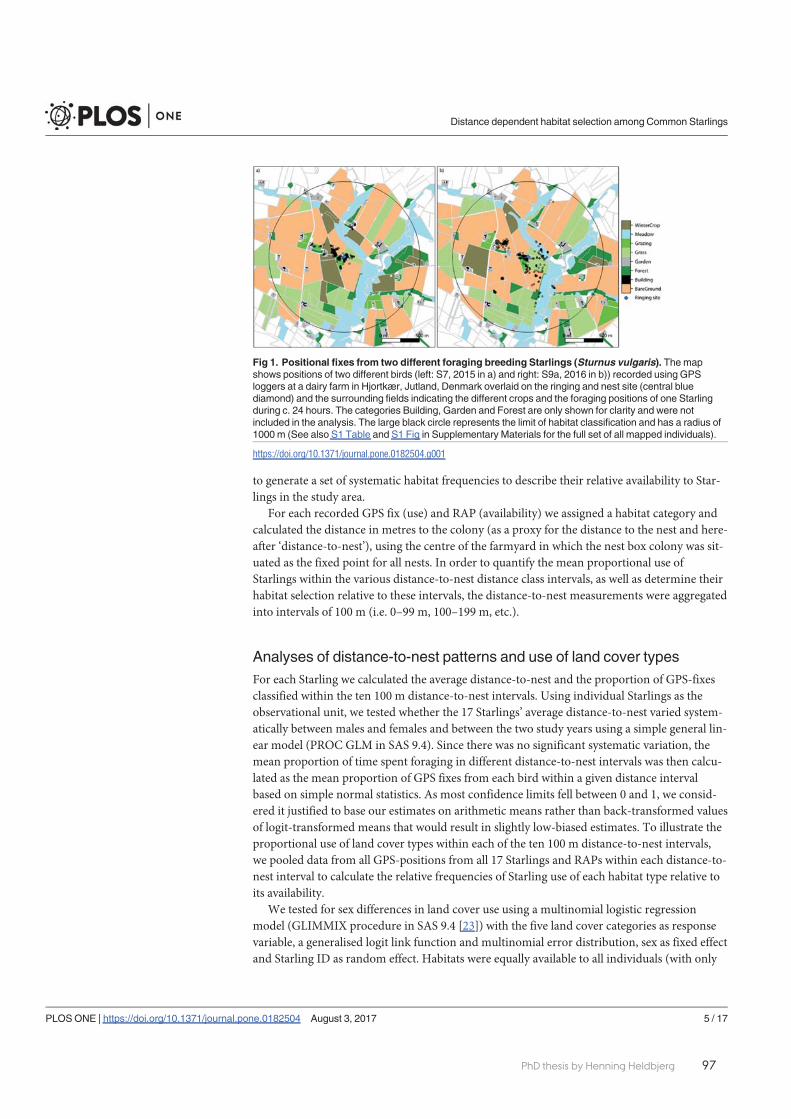
97PhD thesis by Henning Heldbjerg
to generate a set of systematic habitat frequencies to describe their relative availability to Star-
lings in the study area.
For each recorded GPS fix (use) and RAP (availability) we assigned a habitat category and
calculated the distance in metres to the colony (as a proxy for the distance to the nest and here-
after ‘distance-to-nest’), using the centre of the farmyard in which the nest box colony was sit-
uated as the fixed point for all nests. In order to quantify the mean proportional use of
Starlings within the various distance-to-nest distance class intervals, as well as determine their
habitat selection relative to these intervals, the distance-to-nest measurements were aggregated
into intervals of 100 m (i.e. 0–99 m, 100–199 m, etc.).
Analyses of distance-to-nest patterns and use of land cover typesFor each Starling we calculated the average distance-to-nest and the proportion of GPS-fixes
classified within the ten 100 m distance-to-nest intervals. Using individual Starlings as the
observational unit, we tested whether the 17 Starlings’ average distance-to-nest varied system-
atically between males and females and between the two study years using a simple general lin-
ear model (PROC GLM in SAS 9.4). Since there was no significant systematic variation, the
mean proportion of time spent foraging in different distance-to-nest intervals was then calcu-
lated as the mean proportion of GPS fixes from each bird within a given distance interval
based on simple normal statistics. As most confidence limits fell between 0 and 1, we consid-
ered it justified to base our estimates on arithmetic means rather than back-transformed values
of logit-transformed means that would result in slightly low-biased estimates. To illustrate the
proportional use of land cover types within each of the ten 100 m distance-to-nest intervals,
we pooled data from all GPS-positions from all 17 Starlings and RAPs within each distance-to-
nest interval to calculate the relative frequencies of Starling use of each habitat type relative to
its availability.
We tested for sex differences in land cover use using a multinomial logistic regression
model (GLIMMIX procedure in SAS 9.4 [23]) with the five land cover categories as response
variable, a generalised logit link function and multinomial error distribution, sex as fixed effect
and Starling ID as random effect. Habitats were equally available to all individuals (with only
Fig 1. Positional fixes from two different foraging breeding Starlings (Sturnus vulgaris). The mapshows positions of two different birds (left: S7, 2015 in a) and right: S9a, 2016 in b)) recorded using GPSloggers at a dairy farm in Hjortkær, Jutland, Denmark overlaid on the ringing and nest site (central bluediamond) and the surrounding fields indicating the different crops and the foraging positions of one Starlingduring c. 24 hours. The categories Building, Garden and Forest are only shown for clarity and were notincluded in the analysis. The large black circle represents the limit of habitat classification and has a radius of1000 m (See also S1 Table and S1 Fig in Supplementary Materials for the full set of all mapped individuals).
https://doi.org/10.1371/journal.pone.0182504.g001
Distance dependent habitat selection among Common Starlings
PLOSONE | https://doi.org/10.1371/journal.pone.0182504 August 3, 2017 5 / 17

98 PhD thesis by Henning Heldbjerg
very minor differences between 2015 and 2016). The sex distribution between habitats was
also almost identical in the two study years. Hence, the lack of systematic difference in use of
land cover types between males and females could be inferred as a lack of difference in habitat
selection between males and females, confirmed in the analysis (see Results). Hence, sex was
not considered as factor in the subsequent analyses of habitat selection.
Analyses of habitat selectionHabitat selection was modelled as differential Starling use of habitats relative to their availability
as a RSF, comparing GPS positions (representing use) with availability derived from the com-
bined frequencies from RAPs for each Starling as observation units [9]. We used generalized
linear mixed models with a logit link function and binomially distributed error terms (‘logistic
regression’) to model the relative probability that an observation would be categorized as GPS-
location (use) or as RAPs as functions of cover type and/or distance interval to the nest.
The data set consisted of all use (GPS-positions) and availability locations within the five
selected land cover categories within 999 m from the colony centre for each of 17 Starlings (i.e.
for each Starling a set of RAPs were entered with its ID annotated). To account for different
ratios of GPS-fixes and RAPs between individuals, Starling ID was entered as a random factor.
To adjust for variance inflation due to individual variation in habitat selection (which may
appear as a simple result of serial dependency of consecutively recorded GPS-locations in the
same field block unit), as the random effects we included interaction term(s) between Starling
ID and all habitat variables entered as fixed effects [24]. All models were run in the GLIMMIX
procedure in SAS 9.4 with denominator degrees of freedom estimated using the Satterthwaites
approximation method [23].
As follows from RSF theory, the predicted probability provided by a RSF of an observation
being a GPS-location as opposed to a RAP observation is uninformative (because the numbers
of GPS-fixes and RAPs were arbitrarily chosen). However, the logistic regression coefficients
describe the relative log-transformed differences in preference (which is equivalent to the rela-
tive difference in use assuming availability is constant) between habitat types when all other
influencing factors were held equal in the model [9]. In the present analysis, selection for land
cover types was expressed in relation to the land use category Grazed (i.e. how often the other
land cover types were used relative to Grazed if equally available) and selection for distance-to-
nest intervals as being relative to the 0–99 m interval.
RSFs were constructed for (i) land cover types (five categories) in isolation (i.e. ignoring varia-
tion in distance-to-nest), (ii) distance-to-nest intervals (100 m categories) in isolation (ignoring
variation in composition of land cover types) and (iii) both variables combined as main effects.
Because some models failed to converge due to unbalanced data amongst individuals (e.g.
because of missing observations within certain habitat categories) it was not possible to con-
struct models that incorporated selection for land cover types as function of varying distance-
to-nests (interaction terms between distance-to-nest and land cover types). Instead, selection
for land cover types at different distance zones from the nest were estimated from separate
RSFs constructed for sub-divisions of the data set at 0–199 m, 200–399 m and 400–999 m from
the nest. To achieve model convergence, the RSF analysis from the furthest distance-to-nest
zone (400–999 m) was restricted to seven Starlings with> 20 GPS locations within this interval
(Loggers S2, S3, S5, S8, S9, S9a, S10, S1 Table). Also, the category Winter Crops was excluded
from the analysis since no Starling was ever observed in this land cover type> 399 m from the
nest. Selection coefficients (SC) for Winter Crops relative to Grazed 400–999 m from the nest
were approximated for each individual Starling using the method of [25]. This calculates
SCWC-G = ln(UWC/AWC)–ln(UGR/AGR)], where UWC/AWC and UGR/AGR are the proportions
Distance dependent habitat selection among Common Starlings
PLOSONE | https://doi.org/10.1371/journal.pone.0182504 August 3, 2017 6 / 17
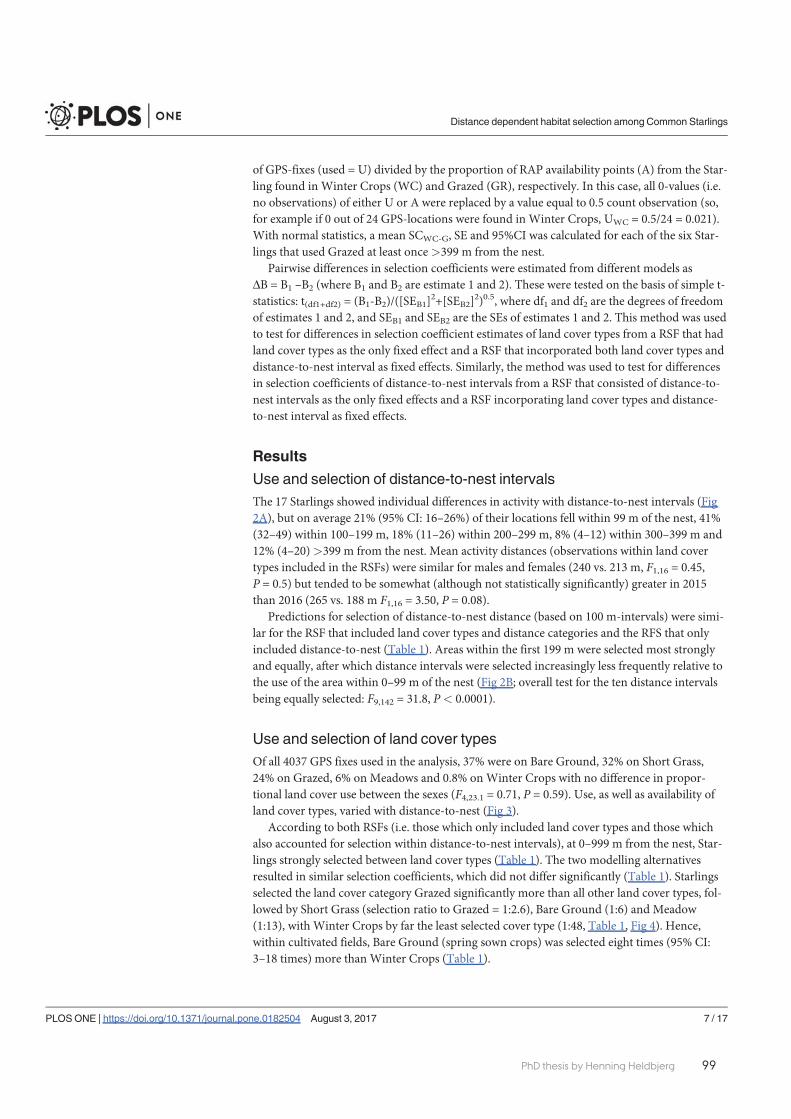
99PhD thesis by Henning Heldbjerg
of GPS-fixes (used = U) divided by the proportion of RAP availability points (A) from the Star-
ling found in Winter Crops (WC) and Grazed (GR), respectively. In this case, all 0-values (i.e.
no observations) of either U or A were replaced by a value equal to 0.5 count observation (so,
for example if 0 out of 24 GPS-locations were found inWinter Crops, UWC = 0.5/24 = 0.021).
With normal statistics, a mean SCWC-G, SE and 95%CI was calculated for each of the six Star-
lings that used Grazed at least once>399 m from the nest.
Pairwise differences in selection coefficients were estimated from different models as
B = B1 –B2 (where B1 and B2 are estimate 1 and 2). These were tested on the basis of simple t-
statistics: t(df1+df2) = (B1-B2)/([SEB1]2+[SEB2]
2)0.5, where df1 and df2 are the degrees of freedom
of estimates 1 and 2, and SEB1 and SEB2 are the SEs of estimates 1 and 2. This method was used
to test for differences in selection coefficient estimates of land cover types from a RSF that had
land cover types as the only fixed effect and a RSF that incorporated both land cover types and
distance-to-nest interval as fixed effects. Similarly, the method was used to test for differences
in selection coefficients of distance-to-nest intervals from a RSF that consisted of distance-to-
nest intervals as the only fixed effects and a RSF incorporating land cover types and distance-
to-nest interval as fixed effects.
Results
Use and selection of distance-to-nest intervalsThe 17 Starlings showed individual differences in activity with distance-to-nest intervals (Fig
2A), but on average 21% (95% CI: 16–26%) of their locations fell within 99 m of the nest, 41%
(32–49) within 100–199 m, 18% (11–26) within 200–299 m, 8% (4–12) within 300–399 m and
12% (4–20)>399 m from the nest. Mean activity distances (observations within land cover
types included in the RSFs) were similar for males and females (240 vs. 213 m, F1,16 = 0.45,
P = 0.5) but tended to be somewhat (although not statistically significantly) greater in 2015
than 2016 (265 vs. 188 m F1,16 = 3.50, P = 0.08).
Predictions for selection of distance-to-nest distance (based on 100 m-intervals) were simi-
lar for the RSF that included land cover types and distance categories and the RFS that only
included distance-to-nest (Table 1). Areas within the first 199 m were selected most strongly
and equally, after which distance intervals were selected increasingly less frequently relative to
the use of the area within 0–99 m of the nest (Fig 2B; overall test for the ten distance intervals
being equally selected: F9,142 = 31.8, P< 0.0001).
Use and selection of land cover typesOf all 4037 GPS fixes used in the analysis, 37% were on Bare Ground, 32% on Short Grass,
24% on Grazed, 6% on Meadows and 0.8% onWinter Crops with no difference in propor-
tional land cover use between the sexes (F4,23.1 = 0.71, P = 0.59). Use, as well as availability of
land cover types, varied with distance-to-nest (Fig 3).
According to both RSFs (i.e. those which only included land cover types and those which
also accounted for selection within distance-to-nest intervals), at 0–999 m from the nest, Star-
lings strongly selected between land cover types (Table 1). The two modelling alternatives
resulted in similar selection coefficients, which did not differ significantly (Table 1). Starlings
selected the land cover category Grazed significantly more than all other land cover types, fol-
lowed by Short Grass (selection ratio to Grazed = 1:2.6), Bare Ground (1:6) and Meadow
(1:13), with Winter Crops by far the least selected cover type (1:48, Table 1, Fig 4). Hence,
within cultivated fields, Bare Ground (spring sown crops) was selected eight times (95% CI:
3–18 times) more thanWinter Crops (Table 1).
Distance dependent habitat selection among Common Starlings
PLOSONE | https://doi.org/10.1371/journal.pone.0182504 August 3, 2017 7 / 17

100 PhD thesis by Henning Heldbjerg
When RSFs were constructed for different distance-to-nest intervals, selection for land
cover types varied with increasing distance to nest, as Grazed was selected significantly more
than other cover types 400-999m from the nest compared to within the first 199 m from the
nest (Table 2, Fig 4). Hence, while Short Grass was selected approximately equally to Grazed at
0–199 and 200–399 m from the nest, Grazed was selected significantly over Short Grass at a
ratio of 9:1 further away than 399 m from the nest.
DiscussionThe deployment of GPS logger units on Starlings in this study provided data with high spatial
accuracy on space use and habitat selection of foraging adult breeding birds during the critical
Fig 2. Foraging distance for breeding Starlings. (A) Proportion of GPS-locations of 17 foraging Starlingsat different distance intervals from the nest, the different symbols indicate different birds. (B) Selectioncoefficients of distance intervals relative to the selection in the nearest interval (0–99 m) from RSF that alsoaccounts for selection of land cover types. The anti-log of the coefficients indicate the approximate odds ratioby which a distance category is used relative to availability compared to 0–99 m from the nest (horizontalstippled lines indicate odds ratios of 1:10 and 1:100 as a guide).
https://doi.org/10.1371/journal.pone.0182504.g002
Distance dependent habitat selection among Common Starlings
PLOSONE | https://doi.org/10.1371/journal.pone.0182504 August 3, 2017 8 / 17

101PhD thesis by Henning Heldbjerg
Tab
le1.
Model
param
etersofR
SFsforh
abitat
selection.
Model
=Cove
rtype+distance
Model
=Distance
only
Model
=Cove
rtypeonly
Difference
inse
lectionco
efficien
ts
Fixed
effects:
BSE(b)
df
tP
BSE(b)
df
tP
BSE(b)
df
tP
BSE(
B)
df
tP
cove
rtyp
eGrazing
(ref.)
0.00
..
..
0.00
..
..
..
..
.
Sho
rtGrass
-0.94
0.33
59.1
-2.89
0.00
5-1.56
0.32
50.0
-4.9
0.00
01-0.62
0.46
109
-1.35
0.18
BareGroun
d-1.83
0.32
58.4
-5.64
0.00
01-2.10
0.32
49.7
-6.6
0.00
01-0.27
0.46
108
-0.60
0.55
Mea
dow
-2.55
0.33
65.2
-7.66
0.00
01-3.01
0.33
53.8
-9.2
0.00
01-0.46
0.47
119
-0.98
0.33
WinterC
rop
-3.87
0.43
107
-8.97
0.00
01-4.48
0.37
91.6
-12
0.00
01-0.61
0.57
199
-1.06
0.29
Ove
ralleffect
ofco
vertyp
e:F4,77.7=54
.10,
P0.00
01F4,56.8=42
.4,P
0.00
01
Distanc
e0–
99m
(ref)
0.00
..
..
0.00
..
..
..
..
100–
199m
-0.27
0.51
119
-0.52
0.60
4-0.57
0.56
126.3
-1.02
ns-0.31
0.76
245
-0.40
0.69
200–
299m
-1.05
0.51
120
-2.04
0.04
3-1.95
0.56
126.8
-3.47
0.00
07-0.90
0.76
247
-1.18
0.24
300–
399m
-2.16
0.52
123
-4.18
0.00
01-2.96
0.56
128.2
-5.25
0.00
01-0.80
0.76
251
-1.05
0.29
400–
499m
-3.02
0.52
126
-5.81
0.00
01-3.55
0.57
130.9
-6.27
0.00
01-0.53
0.77
257
-0.69
0.49
500–
599m
-4.06
0.52
130
-7.74
0.00
01-3.98
0.57
131.3
-7.01
0.00
010.08
0.77
261
0.11
0.92
600–
699m
-4.57
0.53
136
-8.61
0.00
01-4.99
0.58
139
-8.67
0.00
01-0.42
0.78
275
-0.54
0.59
700–
799m
-5.61
0.56
172
-9.99
0.00
01-6.13
0.60
168.9
-10.14
0.00
01-0.51
0.83
340
-0.62
0.53
800–
899m
-5.82
0.56
175
-10.3
0.00
01-6.34
0.61
174.9
-10.41
0.00
01-0.52
0.83
350
-0.63
0.53
900–
999m
-4.81
0.53
138
-9.03
0.00
01-5.28
0.58
142.6
-9.12
0.00
01
Ove
ralleffect
ofdistan
ceca
tego
ry:F
9,142=31
.8,P
0.00
01F9,144.5=28
.1,P
0.00
01
Ran
dom
effects(cov
arianc
epa
rameters)
Starling
ID0.32
0.26
11.24
0.22
0.45
0.25
11.77
0.11
0.10
0.11
10.95
0.34
Starling
ID*D
istanc
e2.13
0.29
17.36
0.00
012.60
0.34
17.70
0.00
01.
..
.
Starling
ID*C
over
type
0.78
0.16
14.75
0.00
01.
.0.82
0.17
14.74
0.00
01
Mod
elpa
rametersan
dov
erallstatisticalsign
ifica
nce(typ
e-III
effects)
ofva
riables
ofRes
ourceSelec
tionFun
ctions
forh
abita
tselec
tionby
GPS-tag
gedStarling
s0–
999m
from
the
nest
site.
https://doi.org/10.1371/journal.pone.0182504.t001
Distance dependent habitat selection among Common Starlings
PLOSONE | https://doi.org/10.1371/journal.pone.0182504 August 3, 2017 9 / 17

102 PhD thesis by Henning Heldbjerg
Fig 3. Availability and use of land cover types by 17 GPS-tagged Starlings. The availability and use ofland cover types is shown at different distance intervals from the nest (all fixes in a given distance intervalpooled across individuals).
https://doi.org/10.1371/journal.pone.0182504.g003
Fig 4. Selection for land cover types. Selection for land cover types is shown relative to “Grazing” by 17GPS-tagged Starlings at different distance-to-nest intervals (within which selection for 100 m distanceintervals are accounted for unless otherwise stated). The anti-log of the coefficients gives the approximateodds ratio to the frequency by which a land cover category is used relative to grazed areas if availability is thesame (horizontal stippled lines indicate odds ratios of 1:10 and 1:100 as a guide).
https://doi.org/10.1371/journal.pone.0182504.g004
Distance dependent habitat selection among Common Starlings
PLOSONE | https://doi.org/10.1371/journal.pone.0182504 August 3, 2017 10 / 17
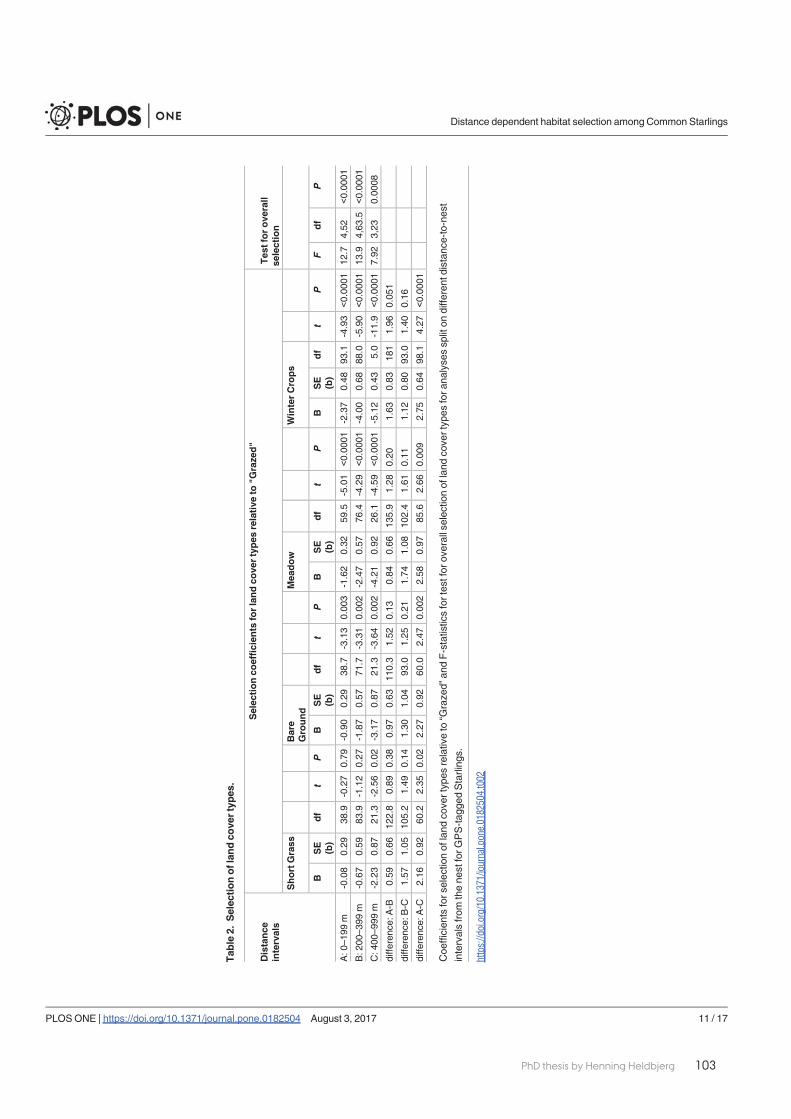
103PhD thesis by Henning Heldbjerg
Tab
le2.
Selec
tionoflan
dco
vertyp
es.
Distance
intervals
Selec
tionco
efficien
tsforlandco
vertypes
relative
to"G
raze
d"
Tes
tforove
rall
selection
ShortGrass
Bare
Ground
Mea
dow
WinterCrops
BSE
(b)
df
tP
BSE
(b)
df
tP
BSE
(b)
df
tP
BSE
(b)
df
tP
Fdf
P
A:0
–199
m-0.08
0.29
38.9
-0.27
0.79
-0.90
0.29
38.7
-3.13
0.00
3-1.62
0.32
59.5
-5.01
0.00
01-2.37
0.48
93.1
-4.93
0.00
0112
.74,52
0.00
01
B:2
00–3
99m
-0.67
0.59
83.9
-1.12
0.27
-1.87
0.57
71.7
-3.31
0.00
2-2.47
0.57
76.4
-4.29
0.00
01-4.00
0.68
88.0
-5.90
0.00
0113
.94,63
.50.00
01
C:4
00–9
99m
-2.23
0.87
21.3
-2.56
0.02
-3.17
0.87
21.3
-3.64
0.00
2-4.21
0.92
26.1
-4.59
0.00
01-5.12
0.43
5.0
-11.9
0.00
017.92
3,23
0.00
08
diffe
renc
e:A-B
0.59
0.66
122.8
0.89
0.38
0.97
0.63
110.3
1.52
0.13
0.84
0.66
135.9
1.28
0.20
1.63
0.83
181
1.96
0.05
1
diffe
renc
e:B-C
1.57
1.05
105.2
1.49
0.14
1.30
1.04
93.0
1.25
0.21
1.74
1.08
102.4
1.61
0.11
1.12
0.80
93.0
1.40
0.16
diffe
renc
e:A-C
2.16
0.92
60.2
2.35
0.02
2.27
0.92
60.0
2.47
0.00
22.58
0.97
85.6
2.66
0.00
92.75
0.64
98.1
4.27
0.00
01
Coe
fficien
tsfors
elec
tionof
land
cove
rtyp
esrelativeto
“Graze
d”an
dF-statisticsfortes
tfor
overallselec
tionof
land
cove
rtyp
esfora
nalyse
ssp
liton
diffe
rent
distan
ce-to-ne
st
intervalsfrom
thene
stforG
PS-tag
gedStarling
s.
https://doi.org/10.1371/journal.pone.0182504.t002
Distance dependent habitat selection among Common Starlings
PLOSONE | https://doi.org/10.1371/journal.pone.0182504 August 3, 2017 11 / 17

104 PhD thesis by Henning Heldbjerg
period when they seek to maximise food provisioning. The results clearly showed Starlings for-
aged at distances more than 500 m from the nest more than 100 times less frequently than
within 100 m and selected Grazed grassland over all other habitat category types in the farm-
land landscape. These novel results provide three key implications for agri-environmental
management schemes.
Firstly, this study quantified the differences in use by foraging Starlings between common
available crops in a Danish farmland landscape and illustrated how some crops were clearly
avoided by Starlings foraging to provision their offspring. The strong selection for Grazed
areas confirmed the importance of grazing livestock (in this case cattle) for maintaining short-
grazed high quality foraging habitats for Starlings. Grazed areas were selected 2.6 times more
than ungrazed (at the time of the study) Short Grass and six times more than Bare Ground. It
seems likely that food items should be equally accessible in these crops (relative to their den-
sity) for foraging Starlings, implying that Grazed habitats host a higher density of available
prey compared to cut Short Grass and Bare Ground (i.e. ploughed cultivated fields for spring
crops). Grazed grassland was selected 13 and 48 times more than Meadow andWinter Crops,
while Bare Ground (i.e. new sown spring crops) was selected by a factor of 8 over Winter
Crops, indicating the relative profitability of foraging between these habitats. If we assume that
microhabitat selection coefficients from RSFs reflect differences in habitat quality, then the
behaviour of the tagged breeding Starlings supports the hypothesis that long term population
declines in Starling populations in Denmark and other western European countries are caus-
ally linked to the transformation of actively grazed pastures to managed silage swards and cul-
tivated crops. It therefore follows that the conservation of actively grazed areas is one of the
main key actions likely to guard against further loss of foraging habitats for Starlings and other
ground feeding insectivorous farmland birds in order to safeguard these populations from fur-
ther declines in the future [26].
Secondly, the shape of the activity and selection patterns for distance-to-nest intervals indi-
cate that areas further than 200 m from the nest increasingly lose foraging value with increas-
ing distance, a pattern that undoubtedly relates to increasing travelling costs between nest and
foraging sites. In practice, this means that disconnection of breeding sites (i.e. safe nesting cav-
ities in buildings or holes in trees) from foraging habitats at scales beyond a few hundred
metres is likely to reduce the quality of potential foraging habitats because increased commut-
ing costs reduce foraging time and elevate flight energy expenditure [27].
Thirdly, the selection increased with foraging distance. Starlings became increasingly selec-
tive in their habitat choice the longer they flew, i.e. the more they invested in the foraging trip.
Starlings were thus able to compensate to some extent for more widely distributed resources in
the landscape by concentrating on exploiting the most profitable patches. Starlings breeding in
modern agricultural landscapes (i.e. with large fields and long commuting distances between
nest and foraging sites) will profit more by access to limited patches of very high foraging
value (e.g. cattle grazed pastures) than larger areas of modest foraging quality (e.g. grass or
open land), which fail to balance the energetic costs of commuting to and from the nest site.
Land cover types and the significance of habitat qualityStarlings showed strong preferences for Grazed over Bare Ground and Short Grass, avoiding
Meadows andWinter-crops. These significant differences between habitat types likely mirror
food accessibility. Starlings mainly prey on larvae of crane flies (Tipulidae) but also those ofbutterflies, moths and beetles [28]. We were unable to study prey availability in the different
crops at our study site but [29] found greater prey abundance in pasture and other permanent
grass than in cereal fields in South Sweden and we see no reason why this pattern should be
Distance dependent habitat selection among Common Starlings
PLOSONE | https://doi.org/10.1371/journal.pone.0182504 August 3, 2017 12 / 17

105PhD thesis by Henning Heldbjerg
different at our study site. The abundance and density of invertebrates is also lower in intensive
grassland monocultures than in extensively managed grassland [30]. As well as density, prey
availability is likely affected by vegetation height [19,31–32], because the least preferred tall
Winter Crops such as rape or winter wheat reach vegetation heights of c. 150 cm and 40–50
cm, respectively, during the Starling breeding season. In contrast, spring sown crops such as
maize (common in the area), fodder beet (rare) and spring sown cereals (mainly barley, which
is relatively common) show such late season growth that extensive Bare Ground remains
between growing plants during the Starling breeding season, providing additional foraging
opportunities for Starlings. Grazed grassland seems to provide the most optimal combination
of high prey density and easy access to prey.
At the study site, Grazed grass was available in abundance immediately adjacent to the nest
colony, which could explain the consistently high breeding density of Starlings here. The local
composition of crops has remained largely unchanged during 1971–2016, during which time
there has been no significant change in the mean production of nestlings produced per pair
[20]. In order to obtain a better understanding of what influences density and accessibility of
the prey, we would also need to consider the variation in mechanical and chemical treatment
of the fields as well as determining the effect the presence of grazing cattle has per se, but suchinvestigations were beyond the scope of this study.
Activity distance and the significance of resource dispersionNinety-two percent of foraging positions recorded from 17 Starlings of both sexes in two years
were within 500 m of the nest, indicating the importance of foraging areas close to nest sites.
Wiersma et al. [33] showed that daily flight times increased 4-fold with a 3-fold decline in food
availability to caged Starlings, increasing daily energy expenditure by 43%. Starlings make up
to 250 feeding roundtrips per day [28], so an increase from 100 m to 200 m will increase the
total daily travelled distance from 50 km to 100 km. At a mean flight speed of 10 m per second
(close to the optimal flight speed at minimummetabolic power of 9.4 W [34]) this would
increase daily energy expenditure from 47 kJ to 94 kJ. Starling nestlings consume c. 40 g fresh
food per day [35] or c. 160 Tipula larvae (mean wet weight c. 0.25 g and an energy content of c
4 kJ/g; [28, 35]); corresponding to a daily energy demand of c. 160 kJ per nestling. In this way,
adding an additional 100 m to the foraging distance equates to c. 30% of the daily energy
requirements of one nestling. Thus, extending foraging trips will adversely affect breeding suc-
cess, reflected in the negative relationship between nestling feeding frequency and adult forag-
ing distance [18], which may reduce nestling survival.
Increased selection with increasing foraging distanceAs far as we are aware, few avian studies (e.g. Ring-billed Gulls Larus delawarensis [17] andCinereous vulture Aegypius monachus [36]) have demonstrated an increase in habitat selection
with distance-to-nest. In this study, we analyse the importance of distance and habitats, and
combine them to analyse the relative importance of the different habitat types at different dis-
tances from the Starlings nesting site. The significance of Grazed grass for foraging Starlings in
the agricultural landscape was further supported by the fact that the selection for this habitat
type became more pronounced with increasing distance.
This result conforms to expectations, since the area within each additional 100 m wide cir-
cular distance bands away from the nest is increasing, thus providing a greater number of for-
aging opportunities if and when the Starling invests in longer foraging trips. However, this
requires greater habitat selection to compensate for the increasing energetic costs associated
with flying longer distances.
Distance dependent habitat selection among Common Starlings
PLOSONE | https://doi.org/10.1371/journal.pone.0182504 August 3, 2017 13 / 17

106 PhD thesis by Henning Heldbjerg
Nesting Starlings are classic central place foragers (as shown by aviary studies, e.g. [37] and
in the field, e.g. [28]) and our new approach clearly demonstrated increasing habitat selection
with distance-to-nest, confirming results from radio-transmitter studies [18]. It seems likely
that this is the case for many other species for which such patterns have yet to be demon-
strated. Improving telemetry technology offers exciting opportunities to improve our under-
standing of animal–habitat relationships at finer scales by incorporating interactions to the
distance components of RSFs [38].
The ‘Starling landscape’ and conservation implicationsThe Starling is highly dependent on two important landscape elements, 1) nest site and 2) for-
aging areas, as is the case for many other species. Our results show that both resources must be
available in close proximity within the ‘Starling landscape’. Within Denmark, the extent of
actively grazed grasslands has fallen in recent years as more cattle remain indoors throughout
the year [16]. Given these trends and the propensity of Starlings nesting on adjacent farms to
commute 500–700 m to forage on selected habitat adjacent to the study farm, it is easy to
understand how loss of grazed grassland may have contributed to the observed Starling popu-
lation declines. Such changes in the agricultural landscape have occurred nationally, as well as
at a Western European scale, which may contribute to explaining the differences between
declining trends here compared to stable and increasing trends in Eastern Europe [39]. The
decline in grazed areas is also known to have an important effect on the populations of Little
Owl (Athene noctua), another declining species that hunts insect prey in open farmland [40–
41].
Summer Starling densities correlated with numbers of grazing cattle and changes in
regional Starling breeding abundance correlate with changes in grazing intensity across Den-
mark [16]. However, even in parts of Denmark with very few cattle, Starlings can persist where
a single local farm retains grazing cattle (own observations). Despite a farmland ‘ocean’ of
unsuitable habitats within the agricultural mosaic, Starlings can persist if they can find ‘islands’
of nesting and foraging areas in sufficiently close proximity to provide safety from predators
and sufficient food to provision nestlings to fledging. Such a habitat matrix is more frequent in
western Denmark (where the more dominant dairy farming provides grazed grassland), where
Starling densities remain highest and declines have been of least magnitude. In the arable dom-
inated farmland in eastern Denmark, with little or no preferred Grazed or Grassland, the ‘Star-
ling landscape’ is far more restricted and commuting distances are extended to relatively few
distant ‘islands’ in far greater ‘oceans’ of unsuitable habitat for the Starling. Smith & Bruun
[42] found that both breeding density and production of Starling young per nest was positively
related to the availability of pasture close to the breeding colony.
Away from the study farm, loss of actively grazed grassland has presumably caused Starlings
nesting in traditionally suitable areas to forage further and further from suitable nesting habi-
tat, to a point where it is no longer energetically profitable to provision offspring at such long
distance. This potentially supports the contention that the reduction of pasture in modern
agricultural landscape may explain the declining Starling population, as cited by [42]. Elevating
Starling breeding abundance can probably better be facilitated by establishing ‘islands’ of high
quality Starling habitat across the farming landscape rather than by large areas of modest qual-
ity. Future studies should focus on the relationship between provisioning flight distance, forag-
ing profitability and habitat selection in other farmland mosaics, where the distance and
availability of habitats contrast the more favourable ones studied here and should also include
urban areas and open woodland areas where Starling breed and also show declining trends.
Comparisons should also be sought at larger spatial scales. For instance, comparing other parts
Distance dependent habitat selection among Common Starlings
PLOSONE | https://doi.org/10.1371/journal.pone.0182504 August 3, 2017 14 / 17

107PhD thesis by Henning Heldbjerg
of Denmark or other countries with less favourable agricultural landscape mosaics for Starlings
with central or eastern parts of Europe, where locally breeding Starling numbers are either sta-
ble or increasing. The GPS-logger technology provides valuable information on for instance
flight distances and home-range sizes e.g. [43] and we have here shown the value of deploying
such devices on a species as small as a Starling for the first time, which illustrates the potential
for similar studies on a larger number of species.
Supporting informationS1 Fig. Maps of the ringing site and the surrounding fields indicating the different crops
and the foraging positions of 17 different tagged Starlings tracked during May 2015 and
2016.
(PDF)
S1 File. Data set used for analyses of use and selection of habitat categories of GPS-tagged
Starlings.
(XLSX)
S1 Table. Information about the 17 loggers/Starlings showing year, logger, sex, start and
length of each logger period, number of foraging positions and registered mean and max
distance.
(DOCX)
AcknowledgmentsThanks to the Bird Ringing Centre, Natural History Museum of Denmark for permitting
deploying loggers on the Starlings, to Michael Fink Jørgensen, ‘Mikkel’ Torben Mikkelsen and
Karin Thellesen for valuable help with fieldwork and Carlo Catoni, Techno Smart for technical
and practical advice all throughout both field seasons. Finally thanks to Jeroen Minderman
and an anonymous referee for detailed and valuable comments to an earlier version of the
manuscript.
Author ContributionsConceptualization:Henning Heldbjerg, Anthony D. Fox, Peder V. Thellesen, Peter Sunde.
Data curation:Henning Heldbjerg, Lars Dalby.
Formal analysis:Henning Heldbjerg, Anthony D. Fox, Lars Dalby, Peter Sunde.
Funding acquisition:Henning Heldbjerg, Anthony D. Fox.
Investigation:Henning Heldbjerg, Anthony D. Fox, Peder V. Thellesen, Lars Dalby.
Methodology:Henning Heldbjerg, Anthony D. Fox, Lars Dalby, Peter Sunde.
Project administration:Henning Heldbjerg.
Resources:Henning Heldbjerg, Anthony D. Fox.
Software:Henning Heldbjerg, Lars Dalby, Peter Sunde.
Supervision: Anthony D. Fox, Peter Sunde.
Validation:Henning Heldbjerg, Anthony D. Fox, Lars Dalby, Peter Sunde.
Visualization:Henning Heldbjerg, Lars Dalby, Peter Sunde.
Writing – original draft:Henning Heldbjerg, Anthony D. Fox, Lars Dalby, Peter Sunde.
Distance dependent habitat selection among Common Starlings
PLOSONE | https://doi.org/10.1371/journal.pone.0182504 August 3, 2017 15 / 17

108 PhD thesis by Henning Heldbjerg
Writing – review & editing:Henning Heldbjerg, Anthony D. Fox, Peder V. Thellesen, Lars
Dalby, Peter Sunde.
References1. Fuller RJ, Gregory RD, Gibbons DW, Marchant JH, Wilson JD, Baillie SR et al. Population Declines and
Range Contractions among Lowland Farmland Birds in Britain. Conserv Biol. 1995; 9: 1425–1441.
2. Donald PF, Green RE, Heath MF. Agriculture intensification and the collapse of Europe’s farmland birdpopulations. Proc R Soc Lond B Biol Sci. 2001; 268: 25–29.
3. Butler SJ, Boccaccio L, Gregory RD, Vorisek P, Norris K. Quantifying the impact of land-use change toEuropean farmland bird populations, Agric Ecosyst Environ. 2010; 137: 348–357.
4. Heldbjerg H, Sunde P, Fox AD. Continuous population declines for specialist farmland birds 1987–2014in Denmark indicates no halt in biodiversity loss in agricultural habitats. Bird Conserv Internat. 2017Mar06. https://doi.org/10.1017/S0959270916000654
5. Robinson RA, SutherlandWJ. Post-war changes in arable farming and biodiversity in Great Britain. JAppl Ecol. 2002; 39: 157–176.
6. Newton I. The recent declines of farmland bird populations in Britain: an appraisal of causal factors andconservation actions. Ibis. 2004; 146: 579–600.
7. CunninghamMA, Johnson DH. Proximate And Landscape Factors Influence Grassland Bird Distribu-tions. Ecol Appl. 2006; 16: 1062–1075. PMID: 16827003
8. Chamberlain DE, Fuller RJ, Bunce RGH, Duckworth JC, ShrubbM. Changes in the abundance of farm-land birds in relation to the timing of agricultural intensification in England andWales. J Appl Ecol. 2000;37: 771–788.
9. BoyceMS, Vernier PR, Nielsen SE, Schmiegelow FKA. Evaluating resource selection functions. EcolModell. 2002; 157: 281–300.
10. Northrup JM, Hooten MB, Anderson CR, Wittemyer G. Practical guidance on characterizing availabilityin resource selection functions under a use–availability design. Ecology. 2013; 94: 1456–1463. PMID:23951705
11. Lele SR, Merrill EH, Keim J, Boyce MS. Selection, use, choice and occupancy: clarifying concepts inresource selection studies. J Anim Ecol. 2013; 82: 1183–1191. https://doi.org/10.1111/1365-2656.12141 PMID: 24499379
12. BoyceMS, Johnson CJ, Merrill EH, Nielsen SE, Solberg EJ, van Moorter B. REVIEW: Can habitatselection predict abundance? J Anim Ecol. 2016; 85: 11–20. https://doi.org/10.1111/1365-2656.12359PMID: 25786026
13. Fenger M, Nyegaard T, J rgensen MF. Common Bird Census in Denmark 1975–2015. Annual report,Dansk Ornitologisk Forening (In Danish with an English summary);2016.
14. EBCC. Trends of common birds in Europe, 2015 update. Available from http://ebcc.info/index.php?ID=587. Last visited 3. May 2016.
15. Fox AD. Has Danish agriculture maintained farmland bird populations? J Appl Ecol. 2004; 41: 427–439.
16. Heldbjerg H, Fox AD, Levin G, Nyegaard T. The decline of the Starling Sturnus vulgaris in Denmark isrelated to changes in the grassland extent and intensity of cattle grazing. Agric Ecosyst Environ. 2016;230: 24–31.
17. Patenaude-Monette M, Belisle M, Giroux J-F. Balancing Energy Budget in a Central-Place Forager:Which Habitat to Select in a Heterogeneous Environment? PLoSONE. 2014: 9(7): e102162. https://doi.org/10.1371/journal.pone.0102162 PMID: 25029498
18. Bruun M, Smith HG. Landscape composition affects habitat use and foraging flight distances in breed-ing European Starlings. Biol Conserv. 2003; 114(2): 179–187.
19. Devereux CI, Mckeever CU, Benton TG,WhittinghamMJ. The effect of sward height and drainage onCommon Starlings Sturnus vulgaris and Northern Lapwings Vanellus vanellus foraging in grasslandhabitats. Ibis. 2004; 146 (Suppl. 2): 115–122.
20. Thellesen, PV. Starling clutch size and timing of breeding during 1971–2015 in Southwest Jutland.Dansk Orn Foren Tidsskr. In Danish with an English summary. Accepted;Forthcoming.
21. Technosmart. Technosmart Gypsy-5. Micro GPS datalogger for tracking free-moving animals. Operat-ing manual (Version 1.1, February 2015). Available from www.technosmart.eu (Last visited 5. May2016).
Distance dependent habitat selection among Common Starlings
PLOSONE | https://doi.org/10.1371/journal.pone.0182504 August 3, 2017 16 / 17
109PhD thesis by Henning Heldbjerg
22. Danish Ministry of Food, and Fisheries. Directive for the Digital Danish Agricultural Registers (Forskriftfor GLR/CHRGenerelt LandbrugsRegister/Centralt HusdyrbrugsRegister). Copenhagen; 1999.
23. Littell RC, Milliken GA, StroupWW,Wolfinger RD, Schabenberger O. SAS for mixed models 2nd ed.SAS Inst., Cary, NC; 2006.
24. Duchesne T, Fortin D, Courbin N. Mixed conditional logistic regression for habitat selection studies. JAnim Ecol. 2010; 79: 548–555. https://doi.org/10.1111/j.1365-2656.2010.01670.x PMID: 20202010
25. Aebischer NJ, Robertson PA, Kenward RE. Compositional analysis of habitat use from anial radio-tracking data. Ecology. 1993; 74: 1313–1325.
26. Vickery JA, Tallowin JR, Feber RE, Asteraki EJ, Atkinson PW, Fuller RJ et al. The management of low-land neutral grasslands in Britain: effects of agricultural practices on birds and their food resources. JAppl Ecol. 2001; 38: 647–664.
27. BruunM, Smith HG. Landscape composition affects habitat use and foraging flight distances in breed-ing European starlings. Biol Conserv. 2003; 114: 179–187.
28. Tinbergen JM. Foraging Decisions in Starlings (Sturnus vulgaris L.). Ardea 1981; 69: 1–67.
29. BruunM. On Starlings and farming: population decline, foraging strategies, cost of reproduction andbreeding success. PhD thesis, Lund University. 2002. Available from https://lup.lub.lu.se/search/publication/464710
30. Schekkerman H, Beintema AJ. Abundance of invertebrates and foraging success of Black-Tailed God-wit Limosa limosa chicks in relation to agricultural grasslandmanagement. Ardea. 2007; 95: 39–54.
31. Williamson P, Gray L. Foraging Behavior of the Starling (Sturnus vulgaris) in Maryland. Condor. 1975;77: 84–89.
32. Butler SJ, Gillings S. Quantifying the effects of habitat structure on prey detectability and accessibility tofarmland birds. Ibis. 2004; 146: 123–130.
33. Wiersma P, Salomons HM, Verhulst S. Metabolic adjustments to increasing foraging costs of starlingsin a closed economy. J Exp Biol. 2005; 208(21): 4099–4108.
34. Ward S, Moller U, Rayner JMV, Jackson DM, Nachtigall W, Speakman JR. Metabolic power of Euro-pean starlings Sturnus vulgaris during flight in a wind tunnel, estimated from heat transfer modelling,doubly labelled water and mask respirometry. J Exp Biol. 2004; 207: 4291–4298. https://doi.org/10.1242/jeb.01281 PMID: 15531650
35. Westerterp K, Gortmaker W,Wijngaarden H. An energetic optimum in brood rearing in the Starling Stur-nus vulgaris: an experimental study. Ardea. 1982; 70: 155–162.
36. Carrete M, Donazar JA. Application of central-place foraging theory shows the importance of Mediterra-nean dehesas for the conservation of the cinereous vulture, Aegypius monachus. Biol Conserv. 2005;126 (4): 582–590.
37. Kacelnik A, Cuthill I. Central Place Foraging in Starlings (Sturnus vulgaris). II. Food Allocation to Chicks.J Anim Ecol. 1990; 59(2): 655–674.
38. Beyer HL, Haydon DT, Morales JM, Frair JL, Hebblewhite M, Mitchell M, et al. The interpretation of hab-itat preference metrics under use-availability designs. Philos Trans R Soc Lond B Biol Sci. 2010; 365:2245–2254. https://doi.org/10.1098/rstb.2010.0083 PMID: 20566501
39. Reif J, Hanzelka J. Grassland winners and arable land losers: The effects of post-totalitarian land usechanges on long-term population trends of farmland birds. Agric Ecosyst Environ. 2016; 232: 208–217.
40. Salek M, Riegert J, Kivan V. The impact of vegetation characteristics and prey availability on breedinghabitat use and diet of Little Owls Athene noctua in Central European farmland. Bird Study. 2010; 57(4):495–503.
41. Thorup K, Sunde P, Jacobsen LB, Rahbek C. Breeding season food limitation drives population declineof the Little Owl Athene noctua in Denmark. Ibis. 2010; 152: 803–814.
42. Smith HG, Bruun M. The effect of pasture on Starling (Sturnus vulgaris) breeding success and popula-tion density in a heterogeneous agricultural landscape in southern Sweden. Agric Ecosyst Environ.2002; 92: 107–114.
43. Gustin M., Giglio G, Pellegrino SC, Frassanito A, Ferrarini A. Space use and flight attributes of breedingLesser Kestrels Falco naumanni revealed by GPS tracking. Bird Study. 2017; https://doi.org/10.1080/00063657.2017.1314449
Distance dependent habitat selection among Common Starlings
PLOSONE | https://doi.org/10.1371/journal.pone.0182504 August 3, 2017 17 / 17

110 PhD thesis by Henning Heldbjerg

111PhD thesis by Henning Heldbjerg
Supporting information for the paper:
Common Starlings (Sturnus vulgaris) increasingly select for grazed areas with increasing distance-to-nest Henning Heldbjerg, Anthony D. Fox, Peder V. Thellesen, Lars Dalby & Peter Sunde. Plos One (2017)
Data set used for analyses of use and selection of habitat categories of GPS-tagged Starlings:
Variable name Explanation
LoggerID Logger (starling) Identity (17 starlings in total)
Sex Gender of starling: F=Female, M= Male
Year Study year
U_A 1=use (GPS location), 0=availability point (one for every 50 m in grid)
Distance Distance from nest (centre of colony) in m
dist_int100 100-m distance from nest: 0-99, 100-199, …. 900-999}
dist_int200_3cat Distance intervals (3 categories): 0-199m, 200-399m, 400-999m
landcover Landcover type: Selected for the analysis:{Grazed, Grass, Bareground, Meadow, WinterCrop}, deselected: {NA, Forest; Bulding, Garden}
PolyID Idendity of GIS-polygon
selected 1= observation selected for the analyses (< 1000 m from the nest, landcover = {Grazed, Grass, Bareground, Meadow, WinterCrop}, 0 = observation not included in analysis (shaded)
Data set 23029 records available at http://journals.plos.org/plosone/article?id=10.1371/journal.pone.0182504#sec018

112 PhD thesis by Henning Heldbjerg
Supporting information for the paper: Starlings (Sturnus vulgaris)
Common Starlings (Sturnus vulgaris) increasingly select for grazed areas with increasing distance-to-nest Henning Heldbjerg, Anthony D. Fox, Peder V. Thellesen, Lars Dalby & Peter Sunde. Plos One (2017).
This document contains maps of the ringing site and the surrounding fi elds indicating the different crops and the foraging positions of 17 different tagged Starlings tracked during May 2015 and 2016.
S1−2016
●●●
●
●
●
●●
●●
●
●
●●●
●
●
●
●
●●
●●●
●●●●
●●●
●
●●●
●●
●●●
●●●●
●●
●
●●
●
●●●
●●
●●
●●
●
●●●
●
●●●
●●
●
●●●●●
●●
●
●
●●●●●●●●●●●●●●●●●●●
●●●●●●●●●●●●●●●●●
●●●●●●●●●●
●●
●● ●●●
●
●
●
●● ●
●●●
●●● ●●● ●●●●
●● ●●●●
●
●●
●
●●●●
● ●
●
●●●
●●
●●●
●
●●●●●●●
●●● ●
●●●
●●●
●
●●
●
●●●
●
●●
●
●●●
●●
●●
●
●●● ●●●
●●
●
●
●●
●
●●
●
●●●●●
●●●●
●
●●
●●●●
●●
●
●●●
●●●●
●●
500 m0 m
BareGround
Building
Forest
Garden
Grass
Grazing
Meadow
WinterCrop
S10−2015
●●●●●
●●●●●
●
●●●
●●●●●●●●
●●●
●●●●● ●●
●● ●
●
●
●●●
●
●●●●●
●
●●●●
●●●
●●●●●●●
●
●●●●●
●●
●●●●●●●
●
●
●●●●●
●●
●●●
●●●●●
●
●●●●●●●●
●●
●●●●
●●
●●●
●●●●
●●
●●●●●●
●●●
●
●●●●● ●●●
●●●●●
●●
●●
●
●●●●●● ●●●●
●●
●●●● ●
●●
●●●
●●●
●●
●
●●●
● ●●●
●●
●●
●●●●
●●
●●
●●●●●●●●●●
●●●●
●●●●●●●●
●●
●●
●●●●●●●●
●●●●●
●●●●●
●
●●●●●●●
●
●●
●●●
●●●●●
●●●●●
●●●
●●●●●
●
●●●●●●●●
●●
●●●
500 m0 m
BareGround
Building
Forest
Garden
Grass
Grazing
Meadow
WinterCrop

113PhD thesis by Henning Heldbjerg
S11−2016
●●●●●●●●●●
●●
●●●● ●
●●●●●●●●
●●
●●●●
●●●●
●●●
●●●
●●●●●●●●
●●●●●●●●●●
●●
●●●●
●
●●●
●●●●
●
●●●●●●●
●
●
●●●
●
●
●●●●●
●
●
●●●●●●●●
●
●
●●●●
●●●
●●●●●
●
●●●●●●●●
●●
●
●●●●
●●●
●
●●●●●●
●●●●
●
●●●●●●●●●●●●●
●
●●●●●●●
●●●●●●●
●● ●●
● ●●
●
●●●●
●
●●●●●●● ●● ●
●●●
●
●●
●
●
●●●●
●●●
●● ●●●●●●●●●
●●
●●●
●
●●●
●●
●
●
●●
● ●●●●●●●●
●●●●●
●●●●●●●
●●●●●●
●
●●●
● ●
●●● ●●●●●
●●●●●●
●●
●●●●●●●
●
●●●
●●●●●●
●●●●●●
●
●●●●
●●
●●
●●
● ●●●●●●●
●●
●●●
●●●●
●●●●●●●●
● ●●●●●●●
●
●●●●●●●
●●●●●●●●●●
●●
●●●●●
●
●
●
●
●●●
●
●●●
●●●●●
500 m0 m
BareGround
Building
Forest
Garden
Grass
Grazing
Meadow
WinterCrop
S12−2016
●●● ●
●●●●●●●●●●●
●●●●●●●●●●
●●
●●
●●●●
●●●●
●●●●
●●●●●●●●●●●●
●●
●●●●
●●●●●
●●●●●●●●
●●
●●●● ●●
●●●
●●●●●●●●
●●●●
●●●●●●●
●●
●●
●●●
●●
●
500 m0 m
BareGround
Building
Forest
Garden
Grass
Grazing
Meadow
WinterCrop
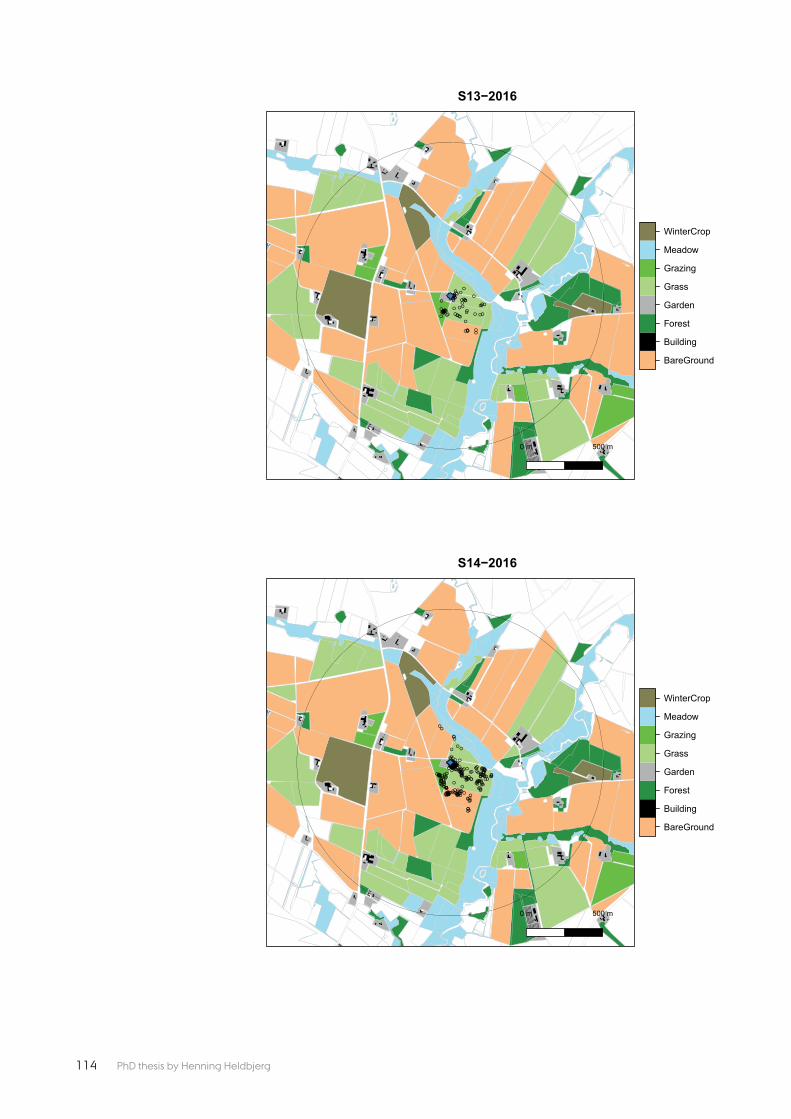
114 PhD thesis by Henning Heldbjerg
S13−2016
●●●
●●●●●
●●
●●●●
●
●
●●●●●●
●
●
●●●●●●
●
●
●●
●
●●
●●
●●
●
●●●●
●●●●●●
●●
● ●●
●●
●
●●
●
●
●●●●
500 m0 m
BareGround
Building
Forest
Garden
Grass
Grazing
Meadow
WinterCrop
S14−2016
●●●●●
●●●●●
●
●●
●●●●●●●
●●●●
●●
●●●●●
●●●●
●●
●●
●●●
●
●●●●●●
●
●●●●●●
●●
●●●●
●●●●●●●●●●
●
●●
●●●●
●
●●●
●
●
●
●●●●●●●●
●●●
●●●●●●●●●●
●
●●
●●●●●
●
●●●●●● ●
●●
●
● ●
●●●●●
●
●
●●
●●
●●●●●
●●●●●●●●●●●●●●●●●●
●
●●●●●●●
●●●
●●
●●●●●●●●
●● ●●
●●●
●●
●
●
●
●●
●
●●
●●●
●●●●●●
●●●●●●●●●●
●●●●●●● ●●●
●●●●
●●●
●●●●
●●●●●●●●
●●
●●
●●●●●●●● ●●●●●●
●●●●
●●
●●●●●●●●
●●●●●●
●●●●
●●●
●
●●●●
●●●
●●●●●●
●●●
●●●●●●
●●●●
●
●●●
●●●
●●
●●
●
●
●
●●
●
●
●●●
●
●
●●●
500 m0 m
BareGround
Building
Forest
Garden
Grass
Grazing
Meadow
WinterCrop

115PhD thesis by Henning Heldbjerg
S17−2016
●
●
●
●●
●
●
●
●●
●
●●
●
●●●●●
●
●●●
●
●
●●●●
●●●
●●●●
●●
●●●
●●
●●●
●●
●
●●
●
●
●●
●
●●
●●●
●
●●●●●
●
●
●●
●●
●●●●
●●
●●●●●
●●●●
●
●
●●
●●●●●
●●
●
● ●
●
●
●●
●
●●●●●●
●
●
●
●
●
●
●●●●●
●
●●
●●●●
●●●●●●●●●
●●●●●
●● ●●●
●
●●●●
●●●●●
●●●●
●●●●
●●●●
●●●
●●●
● ●●●●●●●●●
●●●
●
●●●●●● ●
●●●●●
●●●
●●
●●
●
●●
●●
●●●
●●●
●
●●
●
●
●●
●
●
●
●
●●●
●●●●
●●●●●●●
●●●●●●
●●●●●●●●●●
● ●●●●●●●●
●
●●●
●●●●
●●●●
●●●●●
●
●● ●●●●●●●
●●●
●●●
●●●
●●●
●
●●
●●●●●●●●
●●
●
●●●●
●●● ●●●●●
●●●●
●●●
●● ●
●
●●
●●●●
●
●
●●●●●●●●
●●
●●●●●●
●
●●
●
●●●●●
●
●
500 m0 m
BareGround
Building
Forest
Garden
Grass
Grazing
Meadow
WinterCrop
S2−2015
●●
●●
●●●●
●
●●●●●●●
●
●●●●●
●●●●●
●●●●●●
●
●
●●
●
●●
●●
●
●●●●●●●
●
●
●●
●●●●●
●
●●● ●●●
●
●●
●●
●●●●●
●●
●●●●●●
●
●●●●●●●●
●●
●●●●●
● ●●●●
●●
●●●●●●●●●●●●●●●●
●●
●●●●
●●●●
●●●●●
●●
●●
●●●●
●
●●●●
●
●●
●●●●
●●
●●●
●
●●●●
● ●
●●●
●●● ●
●●●●● ●●●
●●
●●●●●●
●
●
●●●●●
●●● ●
●●●●●
●
●●
●●
●●
●
●●●●●●
● ●●
●
●●●●
500 m0 m
BareGround
Building
Forest
Garden
Grass
Grazing
Meadow
WinterCrop

116 PhD thesis by Henning Heldbjerg
S3−2015
●●
●●
●●
●●●●●
●●
●●
●●●●
●●
●●●
●●●●
●●● ●
●●●
●●
●●●
●●●
●●●●
●●
●●●
●●●●●●●●●
●
●
●●●●
●●●●●●●
●●●●●●●●●●●●●●●●●●●
●
●●●●●●●
●●●
●●●●
●●
●●
●●●●
●●●●
●●
●●●●●
●●●●
●●●●●
●
●●
●
●●
●●●●
●
●●●
●
●●
●●
●
●
●
500 m0 m
BareGround
Building
Forest
Garden
Grass
Grazing
Meadow
WinterCrop
S4a−2016
●
●●●
●●●●
●●●●
●
●●●●
●●●●
●●●
●
●●
●
●●●●●
●●
●
●●●●●●●
●
●●●
●●●●
●
●●
●● ●●
●
●●●●●●●
●
●
●
●●●
●
●●●●●●●●●●
●●●
●
●●●
●●●●
●●●
●●
●●●●●●●●●●●●
●●
●
●●
●●●●●●●●
●●●●●●
●●
●●
●●●●●
●
●
●●●●
●●●●●
●●●●●●●●●●●●●●●●●●●●●●●●●●●●●●●●●●●●●●●
●●●
●
●
●
●●● ●
●
● ●
●
●●
●●●●●●●●
●
●●●
●
●●●●●●●●
●●●●●●●●●●●
●●●●
●●●●●●
●●●
●●
●●
●●
●●●
●
●●●●●●●
●
●●●●
●●●
●●●
●
●●●
●
●●●●●●●
●●●
●●●●●●
●●
●●
● ●●
●
●●●●
●
●
●●●
●
●●
●●
●●
●●
●●●●
●●●●
●●●●●●●●●
●
●●●●
●●●
●●●●●●
●
●●●●●●
●
●●
●●
●●
●●●●
●●●
●●●
●
●●●●
●●
●●●●●●●●●●●●●●●
●●●●
500 m0 m
BareGround
Building
Forest
Garden
Grass
Grazing
Meadow
WinterCrop
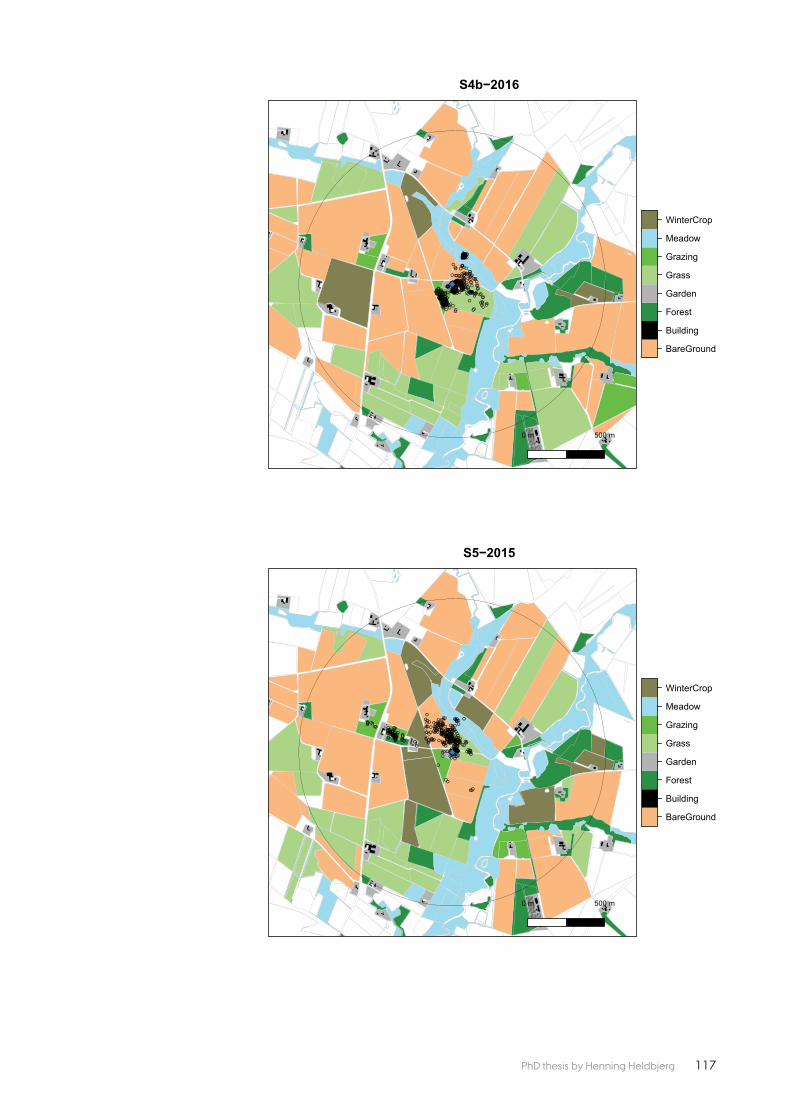
117PhD thesis by Henning Heldbjerg
S4b−2016
●●●●●●●●
●●●●●
●●
●
●●●●●●
●●
●●●● ●
●●●●
●
●●●
●●●
●
●●●●●●
●
●
●●●●●
●●●
●●●●
●
●●●●●
●
●
●
●
●●●●●●●
●●
●
●●●●
●●
●●
●●
●●
●●●●●●●●
●●● ●●
●
●
●
●
●
●●
●
●●●●●●●●●●
●●
●
●●●●●
●●
●●●●●
●●
●●●●●
●●●●
●●
●●
●
●●●●
● ●●●●●●
●●●●
●●● ●●●
●
●●●●●
●
●
●● ●●
●
●●●●●
●●●●●●●●●●●●●●●●●●●●●
●●●●●●●●●●●●
●
●
●
●
●●● ●
●●●●
●
●
●
●
●
●
●●●
●●●●
●●●●●●
●●●●●
●●
●●●●●●●●●●
●
●●● ●●●●●●●●●●●●●●●●●●●
●●●
●●●●●●●●●●●●●●●●●●●●●●●●
●
●●●●
●●●●●●●●●●●●●●●●●●●●
●●
●
●●●●●●●●●●
●●●●●●●●●●●●●●
●●●●
●●
●
●●●●●●●●●●●●●●
●●
●●●
●●●
● ●●●
●●●
●
●
●
●
●●
500 m0 m
BareGround
Building
Forest
Garden
Grass
Grazing
Meadow
WinterCrop
S5−2015
●
●●●●●
●●●●●●●●●●●●●●●●●●●●●●●●●
●
●●●●
●●
●●
●
●●●●●●● ●●
●●
●
●●●
●
●●●●●
●●●
●●●●
●●
●●
●●●●●●●●
●●●●●●●
●
●●●●
●
●
●●
●
●●
●
●●●
●●●●●●●●●●
●●●●
●●●●●●●
●●
●●●●●●
●●●●●
●
●●
●
●●●●●●
●● ●●●●●●●●● ●●●●●●
●
●●●●●●●
●
●●●●●
●
●●●●●
●●●●●●●
● ●●●●●●●●
●●●●●
●●●●●●●●●●●●●●●●
●●●●●
●●●
●●●
●●●●●●● ●
●●●●●
●
●
●
●●●●●●●●●●●
●
●●●●●●●●●●●
●●●●
●●●●●●●
●●●●●
●●
●●●
●●●●●
●
●●●
●● ●●
●●●●
●●●
●●
●●●
●●●
●●●●●●●●
●
●
●
●
●
●
●●●●●
●
●
●●●●
●● ●●●
●●●●
●●●●
●●●●●
●
500 m0 m
BareGround
Building
Forest
Garden
Grass
Grazing
Meadow
WinterCrop

118 PhD thesis by Henning Heldbjerg
S7−2015
●●●●●
●●●●●●
●
●●●●●●●
●●
●●●●●
●●●●●●
●
● ●●●●●●
●
●●
●●
●●●●●●●●●●●●●●●●●
●
●●
●●●●●●●●
●
●●●●
●●●●●●●
●●●●●●●●
●●●●●●●●●
●●●●
●
●●●●●●●●●●●●●●●●●●●●●●
●●●●●
●●●●●●●●●●
●●●●●●●●●
●●●●
●●●●●●●●
●
●
●●
●●●
●●●●●
●
●●●●●●●●●●●●●●●●●●●●●●●●●●●●●
●
●●●●●●●●●●●●●
●●●
●●●●●●●●●●●●
●●●●●●●●●●●
●●●●
●
●
●●●●●
●
●●
●●●●●
●●●●●
●●●●●●
●●
●●●●
●●●●●●●●
●●●
●●●●●●●●●
●
●●●●●
●●●●
●●
●
●●●
●●
●●●●
●●●●●●●●●●●●●● ●●●● ●●●●● ●
500 m0 m
BareGround
Building
Forest
Garden
Grass
Grazing
Meadow
WinterCrop
S8−2015
●●●●●
●●●
●
●
●
●
●●●●●●●●●●●●●●●
●●●●
●●●●●●●●●●
●
●●●●●●
●
●
●●●●
●
●●●●●●●●
●●●
●●●●●●●●●●●
●●●
●●
●●●●●●●●●●●●
●●●●●
●
●●●●
●●●●●●●
●●●●●
●●●●
●●●
●●●●
●●●
●●
●●●●●●
● ●●● ●●●●
●●
●●●●
●
●●●●●●
●
●●●
●
●●●
●●●●●●●●●
●● ●●●●●
●●●●●
●●●●
●●●●●
●
●●●●●●●●
●●●●●●●●●●●
●●●●●●●
●
●●●
●
●
●
●●●●●
●●●
●
●●●
●●●●●●●
●●●●
●●
●●
●●●●●
●
●●●●●●●●●● ●●●
●●●●●●●
500 m0 m
BareGround
Building
Forest
Garden
Grass
Grazing
Meadow
WinterCrop

119PhD thesis by Henning Heldbjerg
S9−2015
●●●●
●● ●●
●
●●● ●●
●●●●
●●●
●●
●●●●
●
●●
●●
●●●●●●●●
●
● ●●●
●●
●●
●
●
●●
●●
●
●
●●●●●●
●●●●●●●●●
●●●●●●●●
●●●●●●●●●●
●● ●
●●●
●
●●
●●●
●
●
●
●
●●
●
●●
● ●
●●●●●
●
●●●●●●●
●●●
●●●●
●●●
●●
●●●●
●
●●●●●●●
●●●
●●●●
●
●●
●
●●
●
●
●●
●●
●
●● ●●
●
●
●●●●●●●●●●●●●●●
●●●
●●
●●●●
●
●●●●●●●●●
●●●●●●●● ●●●●●●
●●
● ●●●●●●
●●
●●
●●●●
●
●●
●
●●●●●●●
●
●
●●
●
●
●●●●●●
●
●●●
●●●●
●●●
●●●●●●●●●
●●●●●●●
●
●
●●●
●●●●●●
●●● ●●
●●
●
●
●
●●●●●●
●●●●●
●●●
●
●●●
●
●●●●●●●●●
●
●●●●●●●●
●●
●●●●
●
●●
●●●
●●
●●
●●●
●●●●●
●●
●●●
●●
●●●
●●●
●●●●●
●●
●●
● ●●●
●●●●
●●●●●●●
●
●●●●●
● ●
●●●●●●●
●●
●
●●●●●
●●●
●●●
●
●●●●●
●●
●●
●●●
●●●●●
●●●
●
●●
●●●●
●
●●●●●●● ●
●●●●●●
●
500 m0 m
BareGround
Building
Forest
Garden
Grass
Grazing
Meadow
WinterCrop
S9a−2016
●
●
●●●●
●●
●
●
●●●
●●●
●●●●●●
●●
●●●
●●●●
●
●●
●●●●
●●
●●●
●●●●●
●●●
●●
●●
●●
●●●
●●
●●●
●●●
●
●●
●
●●
●
●
●
● ●
●
●
●
●
●●
●
●
●
● ●
●
●●
●
●
●
●
●
●●●●●●●●●
●
●●
●
●●●●●●●●●●
●
●●●●
●
●● ●●●●
●●●●●●●
●●●●●●●●●●●●●
●
●●
●
●●●
●●●●
●●
●●
●●●●●
●●●●●
●
●●
●
●● ●●●
●
●
●
●
●●● ●
●●●
●
●●●●●●●●●●●●●●●
●●
●●
●●●●●
●●●●●●●
●●●●●
●
●●●●●●
●
●●●● ●●●●●●●●
●
●
●●● ●
●●
●
●●
●●●● ●●
●●●●●●●
●
●
●●
500 m0 m
BareGround
Building
Forest
Garden
Grass
Grazing
Meadow
WinterCrop

120 PhD thesis by Henning Heldbjerg
S9b−2016
●●
●●●●●●
●●
●●
●●
●●
●
●●●
●
●●
●● ●●●●● ●●●●●
●●●●●●
●●
●
●●●
●●●
●
●●●●●●●
●●●●●●
● ●
●
● ●
●
●
●
●
●
●●
●●●
●●●
●
●●●
●●●●●●●
●●●●●●●
●●
●●●
●●
●●●
●
●●●
●●
●●●●
●●
●●
●
●●●●● ●
●
●●●
●●●
●●●●●●●●●●●
●●
●
●●●●
●●●●●●●● ●●●●●●
● ●●●●
●●●
●●
●
●●●
●●●●●●●
●●●●●●●
●●●
● ●
●●●
●●●
●●●●
●
●●
●
●
●
●
●
●
●
●
●● ●●
●●●●●
●●
●
●●●●●●●●●●●●●●●● ●●●●
●●●●●
●●●
●
●●●●●
●
●●●●●●
●●
●
●●●●●●●
●●●
●●●●
●●●●● ●●
●●●●●●
●●●●●●●●
●●
●●●●●●
●●● ●●● ● ●●
●●
●
●●
●●●●●
●●●●●
●●● ●
●●●●●●●●●●●●●●●●●●●●●●
●●●●●●●●●●●
●●
●●
●●●●
●●●●
●
●
●●●●
●
●
●●●
●●●
●●●●●●●●●●●●
●●
●●
●
●●●
500 m0 m
BareGround
Building
Forest
Garden
Grass
Grazing
Meadow
WinterCrop
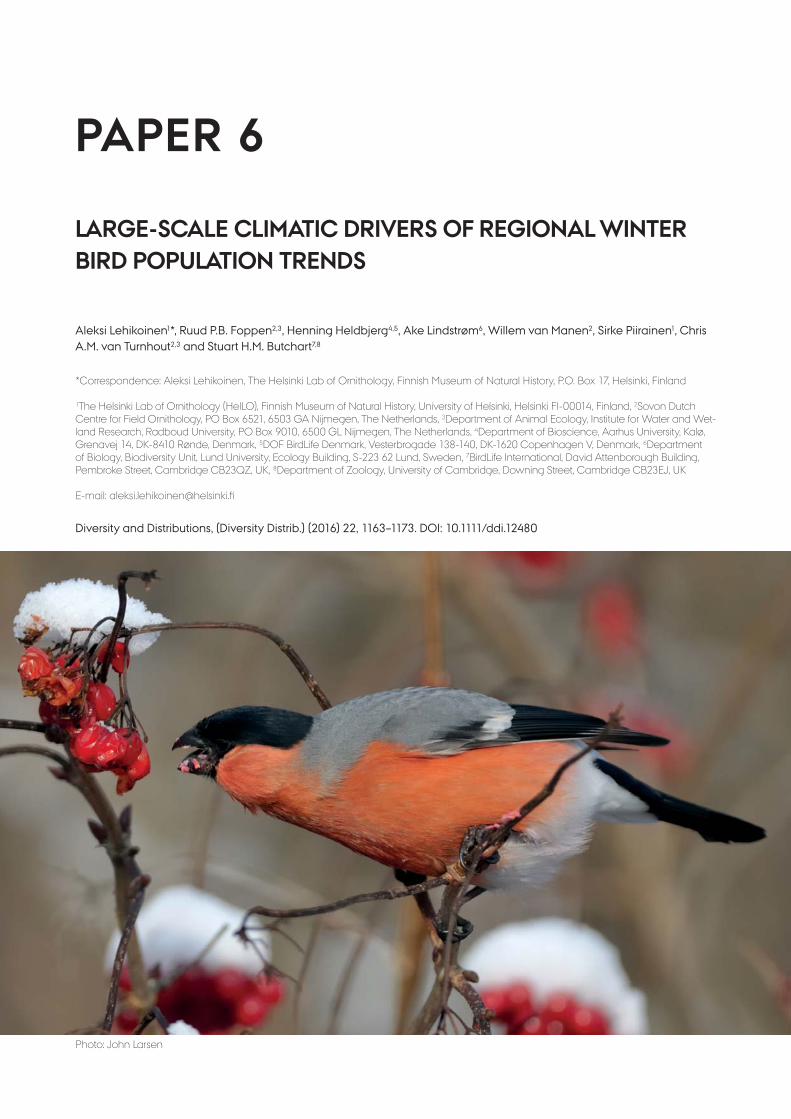
Diversity and Distributions, (Diversity Distrib.) (2016) 22, 1163–1173. DOI: 10.1111/ddi.12480
Aleksi Lehikoinen1*, Ruud P.B. Foppen2,3, Henning Heldbjerg4,5, Ake Lindstrøm6, Willem van Manen2, Sirke Piirainen1, Chris A.M. van Turnhout2,3 and Stuart H.M. Butchart7,8
*Correspondence: Aleksi Lehikoinen, The Helsinki Lab of Ornithology, Finnish Museum of Natural History, P.O. Box 17, Helsinki, Finland
1The Helsinki Lab of Ornithology (HelLO), Finnish Museum of Natural History, University of Helsinki, Helsinki FI-00014, Finland, 2Sovon Dutch Centre for Field Ornithology, PO Box 6521, 6503 GA Nijmegen, The Netherlands, 3Department of Animal Ecology, Institute for Water and Wet-land Research, Radboud University, PO Box 9010, 6500 GL Nijmegen, The Netherlands, 4Department of Bioscience, Aarhus University, Kalø, Grenavej 14, DK-8410 Rønde, Denmark, 5DOF BirdLife Denmark, Vesterbrogade 138-140, DK-1620 Copenhagen V, Denmark, 6Department of Biology, Biodiversity Unit, Lund University, Ecology Building, S-223 62 Lund, Sweden, 7BirdLife International, David Attenborough Building, Pembroke Street, Cambridge CB23QZ, UK, 8Department of Zoology, University of Cambridge, Downing Street, Cambridge CB23EJ, UK
E-mail: [email protected]
PAPER 6
LARGE-SCALE CLIMATIC DRIVERS OF REGIONAL WINTER BIRD POPULATION TRENDS
Photo: John Larsen

123PhD thesis by Henning Heldbjerg
BIODIVERSITYRESEARCH
Large-scale climatic drivers of regionalwinter bird population trends
Aleksi Lehikoinen1*, Ruud P. B. Foppen2,3, Henning Heldbjerg4,5,�Ake Lindstr€om6, Willem van Manen2, Sirke Piirainen1,
Chris A. M. van Turnhout2,3 and Stuart H. M. Butchart7,8
1The Helsinki Lab of Ornithology (HelLO),
Finnish Museum of Natural History,
University of Helsinki, Helsinki FI-00014,
Finland, 2Sovon Dutch Centre for Field
Ornithology, PO Box 6521, 6503 GA
Nijmegen, The Netherlands, 3Department of
Animal Ecology, Institute for Water and
Wetland Research, Radboud University, PO
Box 9010, 6500 GL Nijmegen, The
Netherlands, 4Department of Bioscience,
Aarhus University, Kalø, Gren�avej 14,
DK-8410 Rønde, Denmark, 5DOF BirdLife
Denmark, Vesterbrogade 138-140, DK-1620
Copenhagen V, Denmark, 6Department of
Biology, Biodiversity Unit, Lund University,
Ecology Building, S-223 62 Lund, Sweden,7BirdLife International, David Attenborough
Building, Pembroke Street, Cambridge
CB23QZ, UK, 8Department of Zoology,
University of Cambridge, Downing Street,
Cambridge CB23EJ, UK
*Correspondence: Aleksi Lehikoinen, The
Helsinki Lab of Ornithology, Finnish Museum
of Natural History, P.O. Box 17, Helsinki,
Finland.
E-mail: [email protected]
ABSTRACT
Aim Changes in climate and land use practices have been found to affect
animal populations in different parts of the world. These studies have typically
been conducted during the breeding season, whereas the non-breeding season
(hereafter ‘winter’) has received much less attention. Changes in regional winter
abundances could be caused by changes in overall population sizes and/or
redistribution of populations. We tested these mechanisms for terrestrial winter
bird population changes in Northern Europe and explored the role of climate
change and species habitat preference.
Location The Netherlands, Denmark, Sweden, Finland.
Methods We used winter bird counts from four countries conducted annually
between 15 December and 20 January in 1980/1981–2013/2014. We report
national population trends for 50 species for which a trend could be calculated
in at least three of the countries. We analysed country-specific population
growth rates in relation to species’ climatic summer and winter niches, habitat
preference and migratory behaviour.
Results Species breeding in colder (typically northern) areas showed more neg-
ative winter population trends than species breeding in warmer areas. Regional
winter population trends were negatively correlated with characteristics of their
winter climatic niche: populations in the colder part of their winter distribution
increased in abundance, whereas populations in the warmer part of their winter
distribution decreased. Woodland species tended to do better than farmland
species. Migratory behaviour did not explain variation in population trends.
Main conclusions The generally decreasing winter population trends of cold-
dwelling breeding species probably reflect the general decline in population
sizes of these species. In contrast, increasing winter population trends for popu-
lations in the colder parts of the winter distribution indicate a redistribution of
wintering individuals towards the north-east. Both these patterns are likely
caused by climate change.
Keywords
farmland, forest, global warming, management actions, monitoring, spatio-
temporal changes.
INTRODUCTION
An increasing number of studies has shown that distribu-
tions and population dynamics of animals are affected by cli-
mate change and human land use practices (Parmesan et al.,
1999; Fahrig, 2003; Parmesan, 2006; Jetz et al., 2007; Butchart
et al., 2010; Chen et al., 2011). Such distribution and
population changes have most frequently been studied dur-
ing the reproductive season (Jonsson & Jonsson, 2009;
Brommer & Møller, 2010; Breed et al., 2012; Walsh et al.,
2015). Spatio-temporal population changes during other
parts of the annual cycle have received much less attention.
It is widely acknowledged that climate change influences the
phenology of migratory species, affecting the occurrence of
DOI: 10.1111/ddi.12480ª 2016 John Wiley & Sons Ltd http://wileyonlinelibrary.com/journal/ddi 1163
Diversity and Distributions, (Diversity Distrib.) (2016) 22, 1163–1173A
Jou
rnal
of
Cons
erva
tion
Bio
geog
raph
yD
iver
sity
and
Dis
trib
utio
ns
124 PhD thesis by Henning Heldbjerg
species in space and time (Parmesan, 2006; Lehikoinen &
Sparks, 2010). However, long-term changes in abundances
during the non-breeding season (hereafter ‘winter’) have
rarely been examined, especially at large spatial scales and for
a large number of species. It is important to understand
what influences distribution and abundance outside the
reproductive season, as processes during winter have a large
impact on survival and thus general population dynamics
(Newton, 1998; Jørgensen et al., 2016).
One in five of all bird species are migratory, and this pro-
portion is greater at high latitudes (Kirby et al., 2008;
Newton, 2008). Birds are one of the few taxonomic groups
for which large-scale, long-term and multispecies datasets are
available (Pearce-Higgins & Green, 2014). This makes birds
excellent species to study the effect of increasing winter tem-
perature on winter distribution. In North America, the cen-
tre of wintering abundances of 254 bird species has shifted
northwards c. 1 km per year due to increasing winter tem-
perature during 1975–2004 (La Sorte & Thompson, 2007; La
Sorte & Jetz, 2012). Furthermore, some wader and duck spe-
cies in Europe have shifted the centre of their winter distri-
bution towards the north-east (Austin & Rehfisch, 2005;
Maclean et al., 2008; Lehikoinen et al., 2013a; Pav�on-Jord�an
et al., 2015). Nevertheless, these studies have not investigated
what factors are correlated with the species-specific variation
in population trends. To our knowledge, the only multi-
species study on wintering populations that examined the
impact of climate change and human land use changes
simultaneously is from Finland (Fraixedas Nu~nez et al.,
2015a). This study showed that population sizes of wintering
water birds have increased on average, due to increasing
temperature, while increasing population sizes in urban bird
species and declines in forest bird species are likely driven by
human land use changes. Nevertheless, to draw broader con-
clusions on which factors are influencing trends of wintering
populations, such patterns should be investigated at larger
spatial scales, taking regional variation into account.
We investigated which factors have driven the winter pop-
ulation trends of 50 bird species of terrestrial habitats over
34 years in four countries spanning more than 2000 km
along a north-east–south-west latitudinal gradient in North-
ern Europe. We concentrate here on land-birds, as large-scale
studies on wintering terrestrial bird species are largely lacking
(but see La Sorte & Thompson, 2007; La Sorte & Jetz, 2012).
Regional winter population trends may be driven by at
least two major processes: i) changes in the overall popula-
tion size, which will lead to an increase or decrease in the
regional winter population size; and/or ii) redistribution of
the winter population, as a result of increases in some
regions and decreases in others. To investigate these two
alternatives, we studied the national winter population trends
in relation to species’ traits linked to general population dri-
vers, that is climate and land use, during breeding and non-
breeding season. A change in overall population size is
known to be linked with migratory behaviour (Laaksonen &
Lehikoinen, 2013; Vickery et al., 2014; Jørgensen et al.,
2015). However, redistribution of the winter population is
also connected with migratory behaviour because of a change
in the proportion of individuals that migrate, and/or a
reduction in the distance that individuals travel, possibly as a
response to milder winters (Austin & Rehfisch, 2005;
Maclean et al., 2008; Visser et al., 2009; Lehikoinen et al.,
2013a).
To evaluate drivers of overall population size, we first
investigated whether characteristics of the climatic niche dur-
ing the breeding season was associated with population
trends, as more northern and cold-dwelling species have
declined in North Europe compared to southern species
(Devictor et al., 2008; Jiguet et al., 2013; Laaksonen & Lehi-
koinen, 2013; Lindstr€om et al., 2013). Our first hypothesis
was that cold-dwelling birds will on average show more neg-
ative winter trends than more southerly breeding species,
simply because cold-dwelling species are expected have suf-
fered more from warmer summers.
Second, we evaluated the potential impacts of human land
use changes on wintering birds by adding habitat preference
as a covariate. We hypothesize that birds breeding and win-
tering in woodland would fare better than farmland birds, as
farmland biodiversity has declined severely in Europe in
recent decades (Donald et al., 2001; Warren et al., 2001;
Gregory et al., 2005, 2007). However, there could be spatial
differences in land use changes throughout our study area,
and thus, an interaction between country and habitat could
reveal local differences. For instance, many wintering forest
birds have declined in Finland (Fraixedas Nu~nez et al.,
2015a). If forest management has had more negative impacts
in the north of Europe, we would expect a significant nega-
tive interaction between region and habitat.
Third, in contrast to drivers of overall population
change, we hypothesize that regional winter trends are
affected by the climatic niche of each species during winter.
With warmer winters in northern Europe [European Envi-
ronment Agency (EEA), 2012], we expect more positive
trends in winter population sizes in the colder parts of the
winter distribution, and more negative trends in the war-
mer parts of the winter distribution (Jiguet et al., 2010a,b;
Lehikoinen et al., 2013a). To evaluate this, we developed
and applied a ‘species winter temperature index’ for Euro-
pean land-birds (cf. Devictor et al., 2008, and see Materials
and Methods).
Finally, we examined the impact of migratory behaviour
per se, as this has been shown to be associated with species’
population trends (Vickery et al., 2014; Jørgensen et al.,
2015; Gilroy et al., 2016) and also to impact the redistribu-
tion of wintering populations (Fraixedas Nu~nez et al.,
2015a). We hypothesize that winter populations of partial
migrants increased more than residents. Partial migrants can
benefit from favourable circumstances during the breeding
and non-breeding season, and/or from a shift of wintering
ranges towards the north because of more favourable winter
conditions (Brommer, 2008; Meller et al., 2016; V€alim€aki
et al., 2016).
1164 Diversity and Distributions, 22, 1163–1173, ª 2016 John Wiley & Sons Ltd
A. Lehikoinen et al.

125PhD thesis by Henning Heldbjerg
MATERIAL AND METHODS
Study area and census data
The study area includes four mainly northern European
countries: the Netherlands, Denmark, Sweden and Finland.
These countries are situated along a south-west–north-eastclimatic gradient spanning c. 2000 km between 51° and
70°N (Fig. S1). In all countries, winter populations have
been systematically monitored annually at least since winter
1980–1981 (hereafter winter 1981), and our study period
covers the winters 1981–2014 (34 years). The national
schemes each use somewhat different methods (explained
below in more detail), but this does not influence the results
of our study, as the primary analysis is a comparison
between national temporal trends, which are largely indepen-
dent of census methods (e.g. point counts, line transects and
territory mapping, see Gregory et al., 2005).
In the Netherlands, the winter counts consist of free-
choice point-count routes, which are surveyed once during
mid-winter, in the period between 15 December and 1 Jan-
uary (Boele et al., 2008). Each route consists of 20 points,
separated by at least 500 m, at which all birds heard or seen
are counted during exactly 5 min. The counts started in
1978. The annual number of routes counted averaged 376
(range 143–464) during the study period. The routes are dis-
tributed over the entire country (Fig. S1). In all countries, all
routes counted at least twice are included in the analyses.
The Danish Common Winter Bird Monitoring pro-
gramme is based upon free-choice point counts censused in
the period 20 December–20 January. Each route consists of
10–20 points. At each point, all birds seen and heard,
regardless of distance from observer, are registered and
recorded in a 5-min observation window (Heldbjerg, 2005;
Nyegaard et al., 2015). The number of routes increased
from around 100 at the start and has been relatively stable
around 280 since 1988 (mean 244, range 104–324 in the
whole period). The routes are distributed over the entire
country (Fig. S1).
In Sweden, the winter counts consist of free-choice point-
count routes, which are surveyed either five times per winter
or once during mid-winter (Green & Lindstr€om, 2015). For
the present analysis, we only used data from the more
numerous midwinter counts (19 December–8 January). The
average annual number of mid-winter counts was 347 (range
246–505). Each route consists of 20 points, separated by at
least 300 m, at which all birds heard or seen are counted
during exactly 5 min. Most routes have been surveyed in the
southern half of Sweden, in and around the most human-
populated regions. On the few winter counts that are carried
out in the northern half of Sweden, normally very few indi-
viduals of a small number of species are observed (Fig. S1).
In Finland, monitoring of winter birds since the 1950s is
based on a free-choice line-transect method. Annual abun-
dances of wintering bird populations have been monitored
on 4000 transect routes, the average length of which is about
10 km. Observers repeat the same route by either walking or
skiing and count all birds recorded (see Lehikoinen et al.,
2013b; Fraixedas Nu~nez et al., 2015a). There are three census
periods in winter, but for this study, we only used the mid-
winter counts from 25 December to 7 January because this
maximizes survey effort and this period overlaps with those
in the other countries. The annual mean number of routes
was 530 (range 455–602). The majority of the census sites
are carried out in the south and central part of the country
(Fig. S1; Fraixedas Nu~nez et al., 2015a). In all countries, all
routes counted at least twice are included in the analyses.
Selection of species
We included all land-bird species that had reliable trend data
(data from at least 29 of 34 winters) from at least three of
the four countries. In most of the cases (> 93%), data cov-
ered all years. Altogether, our analyses included 50 species.
The country-specific sample sizes are shown in Table 1.
Temperature data
To evaluate temporal and spatial trends in winter tempera-
tures, we calculated mean temperatures from each country
during December–February. For the Netherlands, we used
the referential weather station from De Bilt, provided by the
Dutch Royal Meteorological Institute (KNMI)
(https://data.knmi.nl/portal/KNMI-DataCentre.html#_). For
Denmark, we used the mean Danish temperature provided
by the Danish Meteorological Institute (http://www.dmi.dk/
vejr/arkiver/maanedsaesonaar/). For Sweden, we used
monthly mean data from the Swedish Meteorological and
Hydrological Institute (SMHI, www.smhi.se, data were sent
on request). Data from approximately 300 weather stations
around Sweden were interpolated to a 4 9 4 km grid, using
geo-statistic interpolation (Johansson, 2000). We averaged
data from all grid stations S of 61°N, from where the vast
majority of all bird data originate. For Finland, weather data
interpolated in 10 km grids was obtained from the Finnish
Meteorological Institute (www.fmi.fi, Ven€al€ainen et al.,
2005). We used data between 59°500N and 68°N, which cov-
ers > 95% of the census sites.
Explanatory variables
We used four explanatory variables for the national trends.
First, we used the Species Temperature Index during the
breeding season (first variable, hereafter STIs) to describe the
general temperature niche of the species during their breeding
season (derived from Devictor et al., 2008). The STIs are the
mean temperature in April–August (1961–2008, www.world
clim.org) of the breeding distribution of the species in Europe
(Hagemeijer & Blair, 1997). Typically, cold-dwelling species
that have more northerly breeding distributions have lower
Diversity and Distributions, 22, 1163–1173, ª 2016 John Wiley & Sons Ltd 1165
Climatic drivers of regional winter bird population
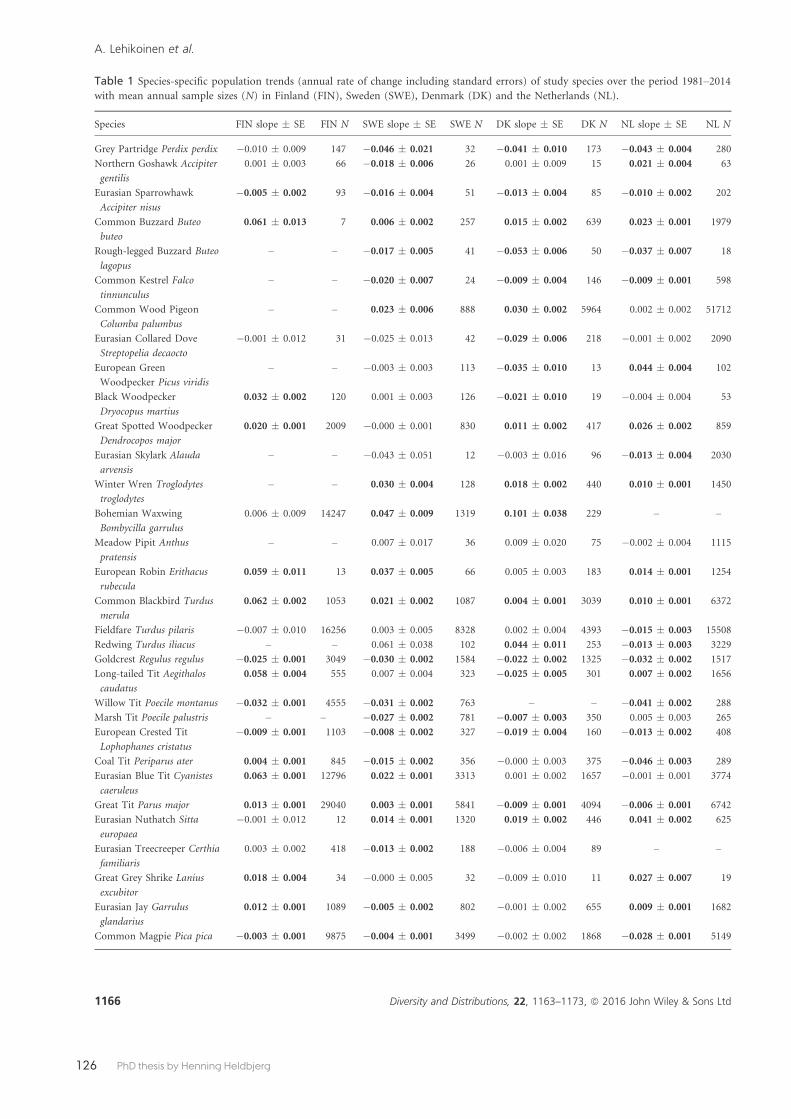
126 PhD thesis by Henning Heldbjerg
Table 1 Species-specific population trends (annual rate of change including standard errors) of study species over the period 1981–2014with mean annual sample sizes (N) in Finland (FIN), Sweden (SWE), Denmark (DK) and the Netherlands (NL).
Species FIN slope � SE FIN N SWE slope � SE SWE N DK slope � SE DK N NL slope � SE NL N
Grey Partridge Perdix perdix �0.010 � 0.009 147 �0.046 � 0.021 32 �0.041 � 0.010 173 �0.043 � 0.004 280
Northern Goshawk Accipiter
gentilis
0.001 � 0.003 66 �0.018 � 0.006 26 0.001 � 0.009 15 0.021 � 0.004 63
Eurasian Sparrowhawk
Accipiter nisus
�0.005 � 0.002 93 �0.016 � 0.004 51 �0.013 � 0.004 85 �0.010 � 0.002 202
Common Buzzard Buteo
buteo
0.061 � 0.013 7 0.006 � 0.002 257 0.015 � 0.002 639 0.023 � 0.001 1979
Rough-legged Buzzard Buteo
lagopus
– – �0.017 � 0.005 41 �0.053 � 0.006 50 �0.037 � 0.007 18
Common Kestrel Falco
tinnunculus
– – �0.020 � 0.007 24 �0.009 � 0.004 146 �0.009 � 0.001 598
Common Wood Pigeon
Columba palumbus
– – 0.023 � 0.006 888 0.030 � 0.002 5964 0.002 � 0.002 51712
Eurasian Collared Dove
Streptopelia decaocto
�0.001 � 0.012 31 �0.025 � 0.013 42 �0.029 � 0.006 218 �0.001 � 0.002 2090
European Green
Woodpecker Picus viridis
– – �0.003 � 0.003 113 �0.035 � 0.010 13 0.044 � 0.004 102
Black Woodpecker
Dryocopus martius
0.032 � 0.002 120 0.001 � 0.003 126 �0.021 � 0.010 19 �0.004 � 0.004 53
Great Spotted Woodpecker
Dendrocopos major
0.020 � 0.001 2009 �0.000 � 0.001 830 0.011 � 0.002 417 0.026 � 0.002 859
Eurasian Skylark Alauda
arvensis
– – �0.043 � 0.051 12 �0.003 � 0.016 96 �0.013 � 0.004 2030
Winter Wren Troglodytes
troglodytes
– – 0.030 � 0.004 128 0.018 � 0.002 440 0.010 � 0.001 1450
Bohemian Waxwing
Bombycilla garrulus
0.006 � 0.009 14247 0.047 � 0.009 1319 0.101 � 0.038 229 – –
Meadow Pipit Anthus
pratensis
– – 0.007 � 0.017 36 0.009 � 0.020 75 �0.002 � 0.004 1115
European Robin Erithacus
rubecula
0.059 � 0.011 13 0.037 � 0.005 66 0.005 � 0.003 183 0.014 � 0.001 1254
Common Blackbird Turdus
merula
0.062 � 0.002 1053 0.021 � 0.002 1087 0.004 � 0.001 3039 0.010 � 0.001 6372
Fieldfare Turdus pilaris �0.007 � 0.010 16256 0.003 � 0.005 8328 0.002 � 0.004 4393 �0.015 � 0.003 15508
Redwing Turdus iliacus – – 0.061 � 0.038 102 0.044 � 0.011 253 �0.013 � 0.003 3229
Goldcrest Regulus regulus �0.025 � 0.001 3049 �0.030 � 0.002 1584 �0.022 � 0.002 1325 �0.032 � 0.002 1517
Long-tailed Tit Aegithalos
caudatus
0.058 � 0.004 555 0.007 � 0.004 323 �0.025 � 0.005 301 0.007 � 0.002 1656
Willow Tit Poecile montanus �0.032 � 0.001 4555 �0.031 � 0.002 763 – – �0.041 � 0.002 288
Marsh Tit Poecile palustris – – �0.027 � 0.002 781 �0.007 � 0.003 350 0.005 � 0.003 265
European Crested Tit
Lophophanes cristatus
�0.009 � 0.001 1103 �0.008 � 0.002 327 �0.019 � 0.004 160 �0.013 � 0.002 408
Coal Tit Periparus ater 0.004 � 0.001 845 �0.015 � 0.002 356 �0.000 � 0.003 375 �0.046 � 0.003 289
Eurasian Blue Tit Cyanistes
caeruleus
0.063 � 0.001 12796 0.022 � 0.001 3313 0.001 � 0.002 1657 �0.001 � 0.001 3774
Great Tit Parus major 0.013 � 0.001 29040 0.003 � 0.001 5841 �0.009 � 0.001 4094 �0.006 � 0.001 6742
Eurasian Nuthatch Sitta
europaea
�0.001 � 0.012 12 0.014 � 0.001 1320 0.019 � 0.002 446 0.041 � 0.002 625
Eurasian Treecreeper Certhia
familiaris
0.003 � 0.002 418 �0.013 � 0.002 188 �0.006 � 0.004 89 – –
Great Grey Shrike Lanius
excubitor
0.018 � 0.004 34 �0.000 � 0.005 32 �0.009 � 0.010 11 0.027 � 0.007 19
Eurasian Jay Garrulus
glandarius
0.012 � 0.001 1089 �0.005 � 0.002 802 �0.001 � 0.002 655 0.009 � 0.001 1682
Common Magpie Pica pica �0.003 � 0.001 9875 �0.004 � 0.001 3499 �0.002 � 0.002 1868 �0.028 � 0.001 5149
1166 Diversity and Distributions, 22, 1163–1173, ª 2016 John Wiley & Sons Ltd
A. Lehikoinen et al.

127PhD thesis by Henning Heldbjerg
STIs. The methodology is described in detail by Devictor et al.
(2008).
We also calculated Species Temperature Index values for
winter distributions (hereafter STIw) using distribution data
from BirdLife International and NatureServe (2015). STIw
values were calculated using species’ winter distribution in
Europe and Africa, excluding parts of the distribution where
the species occurs year round south of the Sahara, because
such populations are unlikely to influence winter population
trends in Europe. For Common Buzzard Buteo buteo, we
excluded the sub-Saharan wintering distribution because this
relates to a different subspecies (vulpinus) which largely
breeds in Asia (Forsman, 1999). We used climate data from
worldclim (www.worldclim.org; Hijmans et al., 2005), more
specifically the monthly mean temperature for December,
January and February in the second half of the 20th century
(the time period is presented as 1950–2000). The climate
data were in ESRI-format and had a cell size of 30-arc sec-
onds (c. 1 km). The bird distribution data were used to
calculate the mean winter mean temperatures for each spe-
cies. We first converted the species range polygons into raster
format, overlaid these rasters with the climate raster and then
counted the overall mean of all the overlapping raster cells.
When converting the species distribution polygons to raster,
the cell size was set to be the same as for the climate data,
which matched the output raster. The same procedure was
conducted on all the three winter months. Finally, the mean
winter temperature was counted as the average of the
monthly means. All the geographical information system
(GIS) analyses were conducted with ARCMAP 10.3.1, Red-
lands, California, USA.
Once species-specific STIw values were estimated, we cal-
culated the relative winter thermal niche for each species in
each country (second variable, regional STIw, hereafter
rSTIw) by calculating how much the winter temperature in
the study region (see above) differed from the STIw of the
species. Negative values mean that a population is situated in
the colder part of the species’ winter distribution (typically
Table 1 Continued.
Species FIN slope � SE FIN N SWE slope � SE SWE N DK slope � SE DK N NL slope � SE NL N
Western Jackdaw Corvus
monedula
0.051 � 0.002 8817 0.006 � 0.002 10317 0.016 � 0.003 4312 �0.002 � 0.001 31009
Rook Corvus frugilegus �0.084 � 0.039 12 0.029 � 0.005 1084 �0.003 � 0.003 4610 �0.030 � 0.002 13469
Hooded/Carrion Crow
Corvus corone
�0.009 � 0.001 13501 �0.015 � 0.001 9547 �0.006 � 0.002 6960 �0.000 � 0.023 19058
Northern Raven Corvus
corax
0.032 � 0.002 897 0.013 � 0.002 1257 0.116 � 0.010 122 0.025 � 0.009 53
Common Starling Sturnus
vulgaris
�0.006 � 0.010 78 0.063 � 0.020 113 0.014 � 0.011 512 �0.004 � 0.002 77336
House Sparrow Passer
domesticus
�0.043 � 0.001 17421 �0.022 � 0.003 1062 �0.030 � 0.003 1450 �0.021 � 0.001 5656
Eurasian Tree Sparrow
Passer montanus
0.089 � 0.003 2831 �0.009 � 0.002 1914 0.013 � 0.003 1619 �0.039 � 0.002 2598
Common Chaffinch Fringilla
coelebs
0.002 � 0.002 231 0.004 � 0.005 390 �0.005 � 0.002 3055 0.010 � 0.002 10614
Brambling Fringilla
montifringilla
�0.014 � 0.007 178 �0.017 � 0.019 13947 �0.012 � 0.006 1548 �0.030 � 0.005 1033
European Greenfinch
Carduelis chloris
0.045 � 0.001 17698 �0.004 � 0.002 3969 �0.006 � 0.003 1788 0.036 � 0.004 1809
European Goldfinch
Carduelis carduelis
0.075 � 0.006 269 0.019 � 0.009 121 0.018 � 0.008 323 0.031 � 0.004 929
European Siskin Carduelis
spinus
0.046 � 0.005 2837 �0.024 � 0.004 3390 �0.012 � 0.003 2434 �0.012 � 0.002 4500
Twite Carduelis flavirostris – – �0.036 � 0.025 57 �0.008 � 0.018 254 �0.097 � 0.012 231
Common Redpoll Carduelis
flammea
�0.006 � 0.002 13515 �0.024 � 0.004 2950 �0.034 � 0.009 661 �0.000 � 0.001 424
Hawfinch Coccothraustes
coccothraustes
– – 0.021 � 0.007 142 0.021 � 0.010 50 0.034 � 0.008 57
Red Crossbill Loxia
curvirostra
�0.031 � 0.005 1223 �0.016 � 0.006 742 0.003 � 0.005 648 0.033 � 0.008 303
Eurasian Bullfinch Pyrrhula
pyrrhula
�0.021 � 0.001 7761 �0.006 � 0.001 2742 0.002 � 0.003 586 0.006 � 0.003 268
Yellowhammer Emberiza
citrinella
�0.012 � 0.001 30586 �0.021 � 0.002 7104 �0.029 � 0.003 2441 0.029 � 0.004 762
Significant trends are shown in bold. ‘–’ means that there was not enough data to calculate trends.
Diversity and Distributions, 22, 1163–1173, ª 2016 John Wiley & Sons Ltd 1167
Climatic drivers of regional winter bird population

128 PhD thesis by Henning Heldbjerg
to the north), where the population would be expected to
increase due to climate change. Conversely, positive values
mean that the population is situated in the warmer (typically
southerly) part of the distribution and is thus expected to
decline if the temperature increases.
We classified species based on their main winter habitat
(third variable, acronym ‘Hab’) using two main habitat cate-
gories: woodland and farmland (for classification based on
habitat preference in winter bird counts, see Boele et al.,
2008; Fraixedas Nu~nez et al., 2015a).
For each country, we classified the species’ migratory
behaviour (fourth variable, acronym ‘Mig’) into three cate-
gories: (1) resident, for which only a minimum of migra-
tion movements is known; (2) partial migrant, where a
substantial part of the population migrates, or the winter
population consists of both resident breeding birds and
migrants from the north; and (3) migrant, where a majority
of the population leaves a country, or the species is present
in the country only during non-breeding season (Fransson
& Pettersson, 2001; Bønløkke et al., 2006; Fransson & Hall-
Karlsson, 2008; Fransson et al., 2008; Saurola et al., 2013;
Valkama et al., 2014).
The explanatory variables used were not strongly corre-
lated (using the criteria of 0.5 correlation max; Booth et al.,
1994). The highest collinearity was found between STIs and
migratory behaviour (r = 0.32): birds with high STIs in gen-
eral were more often residents. In the rest of the cases,
|r| < 0.22. Species-specific classifications are shown in
Table S1.
Statistical analyses
We used log-linear Poisson regression (program TRIM, Pan-
nekoek & Van Strien, 2004) to calculate annual population
growth rates for each combination of species and country.
TRIM imputes missing values and takes serial autocorrela-
tion and over-dispersion into account. We used the annual
growth rates calculated by TRIM as a response variable in
the final model. We aimed to explain the variation in coun-
try-specific growth rates of species with the explanatory vari-
ables using linear mixed effect models.
We used the Deviance information criterion (DIC, similar
to AIC, Akaike information criterion see Burnham & Ander-
son, 2002) in model selection, which was carried out in two
steps. First, we investigated which phylogenetic structure fits
best with the full model (all fixed factor predictors including
interactions), using ten different combinations of phylogeny,
downloaded from www.birdtree.org (Table S2). The model
with the best fit based in DIC values (tree #7) (Table S2)
was used in the second step of the analyses. In all cases, the
models were within 2 DIC-value, so the variation in the phy-
logeny was not very large.
In the second step of the model selection, we built models
using all combinations of variables (STIs, rSTIw, Hab, Mig)
as main effects. Then, we included the corresponding models
where rSTIw was interacting with Hab and Mig. Both STIs
and rSTIw values were centralized (mean zero) before analy-
ses. The best phylogenetic structure was used in all model
combinations. Altogether, we analysed 26 models (Table 2).
All the analyses were carried out in program R version
3.2.2 (R Development Core Team, 2015).
RESULTS
The Netherlands had the lowest proportion of increasing
population trends (29%) and the largest proportion of
declining trends (40%), whereas the pattern was opposite in
Finland (43% and 33% of the species increased and declined,
respectively; Table 3). The species-specific growth rates in
each country are shown in Table 1.
Annual mean temperatures in December–February did not
increase significantly during the study period in any of the
countries (all Ps > 0.15; see Table 4). However, in all coun-
tries, there was a tendency towards a warmer winter climate,
although there were two cold winters at the very end of the
study period (Table 4; Fig. 1). The top ranked model
included STIs, rSTIw and habitat, and this model was clearly
better than other models (ΔDIC ≥ 2; Table 2). Based on
coefficients of the variables of the top ranked model, STI val-
ues were positively associated with population trends
(Table 5, Fig. 2a), meaning that (summer) warm-dwelling
species had on average higher growth rates than cold-dwell-
ing species. Common Buzzard, Common Blackbird Turdus
merula, Goldfinch Carduelis carduelis and Hawfinch Cocco-
traustes coccotraustes are examples of warm-dwelling species
with increasing population trends, whereas Rough-legged
Buzzard Buteo lagopus, Willow Tit Poecile montanus, Bram-
bling Fringilla montifringilla and Twite Carduelis flavirostris
are examples of cold-dwelling (northern) declining species.
Furthermore, rSTIw values were negatively associated with
growth rates, meaning that populations situated on the cold
side of their wintering distribution increased compared to
populations that were situated on the warm side of their dis-
tribution (Table 5, Fig. 2b). In addition, woodland species
tended to have more positive population trends than farm-
land species (P = 0.06; Table 5).
DISCUSSION
Most winter populations of common land-birds in Northern
Europe have changed significantly in size during the last
three decades. This is likely driven both by changes in the
overall population size and by redistribution of wintering
populations, suggesting shifts in densities towards the north-
east. Our analyses revealed that cold-dwelling species (species
with low STIs), which on average have more northern breed-
ing distributions, are doing worse compared with more
southerly species. This supports previous findings that cli-
mate change has affected cold-dwelling species negatively
(Hill et al., 2002; Virkkala & Rajas€arkk€a, 2011; Jiguet et al.,
2013; Laaksonen & Lehikoinen, 2013; Lindstr€om et al.,
2013), often leading to an overall decline in population size
1168 Diversity and Distributions, 22, 1163–1173, ª 2016 John Wiley & Sons Ltd
A. Lehikoinen et al.

129PhD thesis by Henning Heldbjerg
and/or distribution. In contrast, warmer winters may
improve the survival of warm-dwelling species (species with
high STIs, but also populations with low rSTIw), leading to
increased population sizes, as has been demonstrated in
recent studies concerning both residents and short-distance
migratory species, including partial migrants (Jørgensen
et al., 2015; Pearce-Higgins et al., 2015). Several studies have
shown that winter temperatures in general show a long-term
increase especially in Fennoscandia, and that in general, there
has been a decreasing frequency of extreme cold tempera-
tures (EEA, 2012; Mikkonen et al., 2015). This is in line with
the temperature development in our study period (although
with no significant increase). Although the fact that the lin-
ear increase in temperatures was statistically non-significant
during our study period, the general tendency of an increase
of 1.3–1.7 degrees in regional temperatures can have biologi-
cal significance.
Furthermore, our results indicate that regional population
trends increased in the colder part of winter distributions
and decreased in the warmer parts. This indicates that the
mean centres of winter abundances of the species have
shifted towards the north along their winter climate niche,
probably due to climate change (La Sorte & Thompson,
2007). Climate-driven poleward shifts of populations have
previously been documented both during breeding and win-
tering season (Parmesan et al., 1999; Parmesan, 2006; La
Sorte & Thompson, 2007; Brommer & Møller, 2010; Pearce-
Table 2 The explanatory power of different linear mixed-effects models in explaining the population trends of wintering bird
population in four countries. Variables included were species’ summer temperature index (STIs), regional species’ winter temperature
index (rSTIW), habitat (Hab), migration strategy (Mig) and order (Ord). Phylogeny structure (Tree2 in Table S1) was a random factor
in all models. Deviance information criteria (DIC) and difference to the top ranked model (ΔDIC) are shown.
Nr Model DIC ΔDIC
9 rSTIw + STIs + Hab �821.60 0.00
12 rSTIw + STIs + Hab + Mig �819.45 2.15
15 rSTIw + STIs + Hab + Hab*rSTIw �819.43 2.17
6 rSTIw + STIs �818.04 3.56
22 rSTIw + STIs + Hab + Hab*rSTIw + Mig �817.89 3.71
23 STIs + Hab �817.67 3.93
26 STIs + Hab + Mig �816.57 5.03
10 rSTIw + STIs + Mig �816.30 5.30
20 rSTIw + STIs + Hab + Mig + Mig*rSTIw �815.72 5.88
3 STIs �814.72 6.88
18 rSTIw + STIs + Hab + Hab*rSTIw + Mig + Mig*rSTIw �813.60 8.00
24 STIs + Mig �813.02 8.58
16 rSTIw + STIs + Mig + Mig*rSTIw �812.41 9.19
7 rSTIw + Hab �807.82 13.78
13 rSTIw + Hab + Hab*rSTIw �806.58 15.02
11 rSTIw + Hab + Mig �806.32 15.28
21 rSTIw + Hab + Hab*rSTIw + Mig �805.43 16.17
2 rSTIw �804.58 17.02
8 rSTIw + Mig �804.38 17.22
19 rSTIw + Hab + Mig + Mig*rSTIw �802.88 18.72
17 rSTIw + Hab + Hab*STIw + Mig + Mig*rSTIw �801.78 19.82
4 Hab �801.33 20.27
14 rSTIw + Mig + Mig*rSTIw �800.85 20.75
1 Gen (Base model) �798.10 23.50
25 Hab + Mig �798.02 23.58
5 Mig �797.00 24.60
Table 3 Number of study species in each country (N) and
proportion of species with significantly increasing or decreasing
population trends.
Country N Increased, % Decreased, %
Finland 39 43 33
Sweden 50 30 36
Denmark 49 41 39
The Netherlands 48 29 40
Table 4 Change in mean winter temperature (December–February) in the four study countries during 1981–2014, astested by linear regression.
Country B � SE F-value P-value
Finland 0.0504 � 0.0379 1.76 0.19
Sweden 0.0427 � 0.0430 0.99 0.33
Denmark 0.0385 � 0.0359 1.15 0.29
The Netherlands 0.0391 � 0.0296 1.75 0.20
Diversity and Distributions, 22, 1163–1173, ª 2016 John Wiley & Sons Ltd 1169
Climatic drivers of regional winter bird population
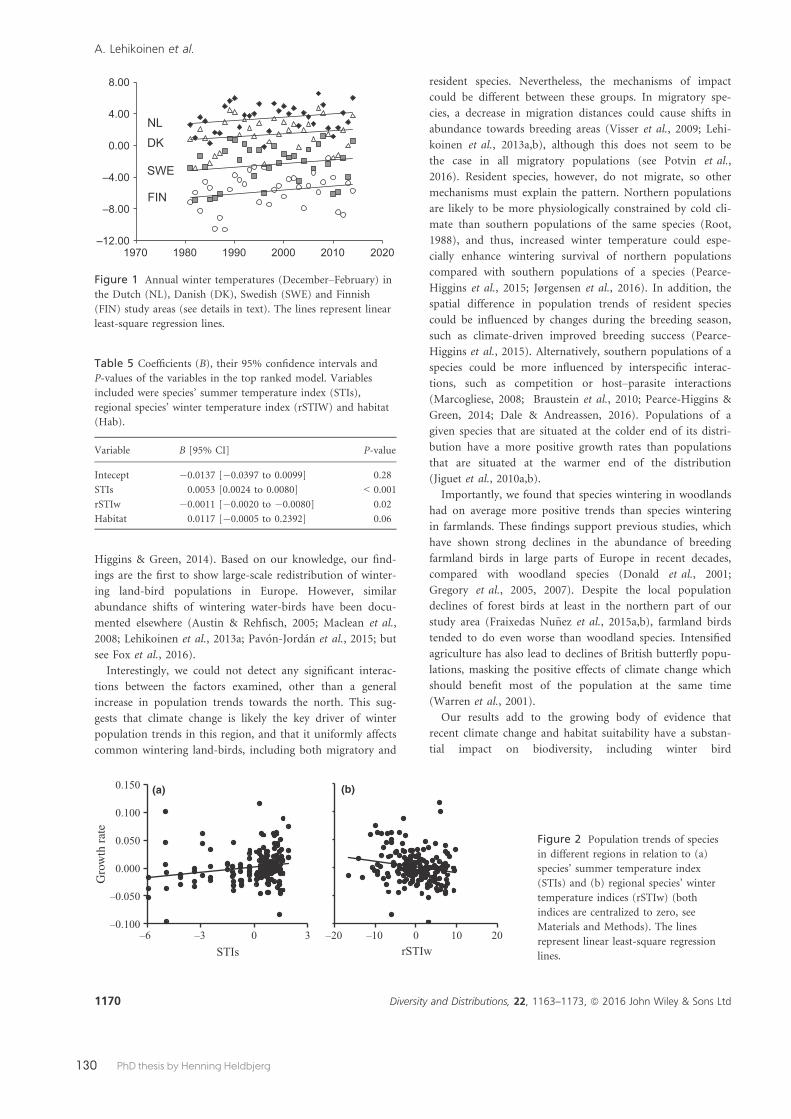
130 PhD thesis by Henning Heldbjerg
Higgins & Green, 2014). Based on our knowledge, our find-
ings are the first to show large-scale redistribution of winter-
ing land-bird populations in Europe. However, similar
abundance shifts of wintering water-birds have been docu-
mented elsewhere (Austin & Rehfisch, 2005; Maclean et al.,
2008; Lehikoinen et al., 2013a; Pav�on-Jord�an et al., 2015; but
see Fox et al., 2016).
Interestingly, we could not detect any significant interac-
tions between the factors examined, other than a general
increase in population trends towards the north. This sug-
gests that climate change is likely the key driver of winter
population trends in this region, and that it uniformly affects
common wintering land-birds, including both migratory and
resident species. Nevertheless, the mechanisms of impact
could be different between these groups. In migratory spe-
cies, a decrease in migration distances could cause shifts in
abundance towards breeding areas (Visser et al., 2009; Lehi-
koinen et al., 2013a,b), although this does not seem to be
the case in all migratory populations (see Potvin et al.,
2016). Resident species, however, do not migrate, so other
mechanisms must explain the pattern. Northern populations
are likely to be more physiologically constrained by cold cli-
mate than southern populations of the same species (Root,
1988), and thus, increased winter temperature could espe-
cially enhance wintering survival of northern populations
compared with southern populations of a species (Pearce-
Higgins et al., 2015; Jørgensen et al., 2016). In addition, the
spatial difference in population trends of resident species
could be influenced by changes during the breeding season,
such as climate-driven improved breeding success (Pearce-
Higgins et al., 2015). Alternatively, southern populations of a
species could be more influenced by interspecific interac-
tions, such as competition or host–parasite interactions
(Marcogliese, 2008; Braustein et al., 2010; Pearce-Higgins &
Green, 2014; Dale & Andreassen, 2016). Populations of a
given species that are situated at the colder end of its distri-
bution have a more positive growth rates than populations
that are situated at the warmer end of the distribution
(Jiguet et al., 2010a,b).
Importantly, we found that species wintering in woodlands
had on average more positive trends than species wintering
in farmlands. These findings support previous studies, which
have shown strong declines in the abundance of breeding
farmland birds in large parts of Europe in recent decades,
compared with woodland species (Donald et al., 2001;
Gregory et al., 2005, 2007). Despite the local population
declines of forest birds at least in the northern part of our
study area (Fraixedas Nu~nez et al., 2015a,b), farmland birds
tended to do even worse than woodland species. Intensified
agriculture has also lead to declines of British butterfly popu-
lations, masking the positive effects of climate change which
should benefit most of the population at the same time
(Warren et al., 2001).
Our results add to the growing body of evidence that
recent climate change and habitat suitability have a substan-
tial impact on biodiversity, including winter bird
–20 –10 0 10 20 –0.100
–0.050
0.000
0.050
0.100
0.150
–6 –3 0 3
(a) (b)
STIs rSTIw
Gro
wth
rat
e
Figure 2 Population trends of species
in different regions in relation to (a)
species’ summer temperature index
(STIs) and (b) regional species’ winter
temperature indices (rSTIw) (both
indices are centralized to zero, see
Materials and Methods). The lines
represent linear least-square regression
lines.
–12.00
–8.00
–4.00
0.00
4.00
8.00
1970 1980 1990 2000 2010 2020
NL DK
SWE
FIN
Figure 1 Annual winter temperatures (December–February) in
the Dutch (NL), Danish (DK), Swedish (SWE) and Finnish
(FIN) study areas (see details in text). The lines represent linear
least-square regression lines.
Table 5 Coefficients (B), their 95% confidence intervals and
P-values of the variables in the top ranked model. Variables
included were species’ summer temperature index (STIs),
regional species’ winter temperature index (rSTIW) and habitat
(Hab).
Variable B [95% CI] P-value
Intecept �0.0137 [�0.0397 to 0.0099] 0.28
STIs 0.0053 [0.0024 to 0.0080] < 0.001
rSTIw �0.0011 [�0.0020 to �0.0080] 0.02
Habitat 0.0117 [�0.0005 to 0.2392] 0.06
1170 Diversity and Distributions, 22, 1163–1173, ª 2016 John Wiley & Sons Ltd
A. Lehikoinen et al.

131PhD thesis by Henning Heldbjerg
communities. Moreover, our study illustrates that when
investigating population trends during the non-breeding sea-
son, it is important to consider the factors influencing the
overall size of populations, as well as their spatial redistribu-
tion.
ACKNOWLEDGEMENTS
We are sincerely grateful to the many thousands of volunteers
who have counted winter birds in our four countries during
the past decennia, of which several persons have even partici-
pated throughout the complete study period. The Danish
common bird monitoring (winter and summer) is supported
by the Danish Nature Agency. The Swedish winter bird count
scheme is supported by the Swedish Environmental Protection
Agency and carried out within the framework of the ‘Centre
for Animal Movement Research’ (CAnMove, Linnaeus grant
349-2007-8690) and the strategic research environment ‘Biodi-
versity and Ecosystem Services in a Changing Climate’
(BECC). Finnish winter bird counts have been supported by
the Ministry of Environment. A.L. received funding from the
Academy of Finland (grant no. 275606). Statistics Netherlands
(CBS) calculated the national trends for the Netherlands. Erik
van Winden (Sovon) produced the map with location of study
sites. Comments by two anonymous referees improved the
clarity of the manuscript.
REFERENCES
Austin, G.E. & Rehfisch, M.M. (2005) Shifting nonbreeding
distributions of migratory fauna in relation to climate
change. Global Change Biology, 11, 31–38.BirdLife International and NatureServe (2015) Bird species
distribution maps of the world. BirdLife International, Cam-
bridge, UK and NatureServe, Arlington, TX, USA.
Boele, A., Hustings, F., Koffijberg, K., Van Turnhout, C. &
Plate, C. (2008) Population trends in wintering landbirds
in The Netherlands 1980–2006: effects of region, habitat
and migratory behaviour. Limosa, 81, 50–61.Bønløkke, J., Madsen, J.J., Thorup, K., Pedersen, K.T., Bjer-
rum, M. & Rahbek, C. (2006) The Danish bird migration
atlas. Rhodos, Humlebæk, Denmark.
Booth, G., Niccolucci, M. & Schuster, E. (1994) Identifying
proxy sets in multiple linear regression: an aid to better coef-
ficient interpretation. U.S. Department of Agriculture Forest
Service, Washington, DC.
Braustein, A.R., Walls, S.C., Bancroft, B.A., Lawler, J.J.,
Searle, C.L. & Gervasi, S.S. (2010) Direct and indirect
effects of climate change on amphibian populations. Diver-
sity, 2, 281–313.Breed, G.A., Stichter, S. & Crone, E.E. (2012) Climate-driven
changes in northeastern US butterfly communities. Nature
Climate Change, 3, 142–145.Brommer, J.E. (2008) Extent of recent polewards range mar-
gin shifts in Finnish birds depends on their body mass and
feeding ecology. Ornis Fennica, 85, 109–117.
Brommer, J. & Møller, A.P. (2010) Range margin changes,
life history and ecology. In: Effects of climate change on
birds (ed. by A.P. Møller, W. Fiedler and P. Berthold),
pp. 249–274. Oxford University Press, New York, NY,
USA.
Burnham, K.P. & Anderson, D.R. (2002) Model selection and
multimodel inference. Springer, New York, NY.
Butchart, S.H.M., Walpole, M., Collen, B. et al. (2010) Glo-
bal biodiversity: indicators of recent declines. Science, 328,
1164–1168.Chen, I.C., Hill, J.K., Ohlem€uller, R., Roy, D.B. & Thomas,
C.D. (2011) Rapid range shifts of species associated with
high level of climate warming. Science, 333, 1024–1026.Dale, S. & Andreassen, E.T. (2016) Population decline of the
Siberian Tit (Poecile cinctus) in southern Norway and an
assessment of possible causes. Ornis Fennica, 93, 77–87.Devictor, V., Julliard, R., Couvet, D. & Jiguet, F. (2008) Birds
are tracking climate warming, but not fast enough. Proceed-
ings of the Royal Society B: Biological Sciences, 275, 2743–2748.Donald, P.F., Green, R.E. & Heath, M.F. (2001) Agricultural
intensification and the collapse of Europe’s farmland bird
populations. Proceedings of the Royal Society B: Biological
Sciences, 268, 25–29.European Environment Agency (EEA) (2012) Climate change
impacts and vulnerability in Europe 2012. An indicator-based
report. EEA Report No 12/2012.European Environment
Agency (EEA), Copenhagen, Denmark.
Fahrig, L. (2003) Effects of habitat fragmentation on biodi-
versity. Annual Review of Ecology, Evolution, and Systemat-
ics, 34, 487–515.Forsman, D. (1999) The raptors of Europe and the Middle
East. T & AD Poyser, London.
Fox, A.D., Dalby, L., Christensen, T.K., Nagy, S., Crowe, O.,
Clausen, P., Deceuninck, B., Devos, K., Holt, C.A., Horn-
man, M., Keller, V., Langendoen, T., Lehikoinen, A.,
Molina, B., Lorentsen, S.-H., Nilsson, L., St�ıpniece, A. &
Wahl, J. (2016) Seeking explanations for recent changes in
abundance of wintering Eurasian Wigeon Anas penelope in
northwest Europe. Ornis Fennica, 93, 12–25.Fraixedas Nu~nez, S., Lehikoinen, A. & Lind�en, A. (2015a)
Impact of climate and land change on wintering bird popu-
lations in Finland. Journal of Avian Biology, 46, 63–72.Fraixedas Nu~nez, S., Lind�en, A. & Lehikoinen, A. (2015b)
Recent population trends of commoner breeding birds in
southern Finland correspond with trends in forest manage-
ment and climate change. Ornis Fennica, 92, 187–203.Fransson, T. & Hall-Karlsson, S. (2008) Svensk ringm€arkn-
ingsatlas, 3rd edn. Naturhistoriska riksmuseet, Stockholm.
Fransson, T. & Pettersson, J.(2001) Svensk ringm€arkningsatlas,
1st edn. Naturhistoriska riksmuseet, Stockholm.
Fransson, T., €Osterblom, H. & Hall-Karlsson, S. (2008)
Svensk ringm€arkningsatlas, 2nd edn. Naturhistoriska riks-
museet, Stockholm.
Gilroy, J.J., Gill, J., Butchart, S.H.M., Jones, V.R. & Franco,
A.M.A. (2016) Migratory diversity predicts population
declines in birds. Ecology Letters, 19, 308–317.
Diversity and Distributions, 22, 1163–1173, ª 2016 John Wiley & Sons Ltd 1171
Climatic drivers of regional winter bird population

132 PhD thesis by Henning Heldbjerg
Green, M. & Lindstr€om, �A. (2015) Monitoring population
changes of birds in Sweden. Annual report for 2014, Depart-
ment of Biology, Lund University, Lund, Sweden, 86 pp.
Gregory, R.D., van Strien, A., Vo�r�ı�sek, P., Meyling, A.W.G.,
Noble, D.G., Foppen, R.P.B. & Gibbons, D.W. (2005)
Developing indicators for European birds. Philosophical
Transactions of the Royal Society B: Biological Sciences, 360,
269–288.Gregory, R.D., Vo�r�ı�sek, P., Van Strien, A., Meyling, A.W.G.,
Jiguet, F., Fornasari, L., Reif, J., Chylarecki, P. & Burfield,
I.J. (2007) Population trends of widespread woodland birds
in Europe. Ibis, 149, 78–97.Hagemeijer, W.J.M. & Blair, M.J. (1997) The EBCC atlas of
European breeding birds: their distribution and abundance.
Poyser, London, UK.
Heldbjerg, H. (2005) De almindelige fugles bestandsudvikling
i Danmark 1975–2004. Dansk Ornitologisk Forening Tids-
skrift, 99, 182–195. In Danish with an English summary.
Hijmans, R., Cameron, S., Parra, J. & Jarvis, A. (2005) Very
high resolution interpolated climate surfaces for global
land areas. International Journal of Climatology, 25, 1965–1978.
Hill, J.K., Thomas, C.D., Fox, R., Telfer, M.G., Willis, S.G.,
Asher, J. & Huntley, B. (2002) Responses of butterflies to
twentieth century climate warming: implications for future
ranges. Proceedings of the Royal Society B: Biological
Sciences, 269, 2163–2171.Jetz, W., Wilcove, D.S. & Dobson, A.P. (2007) Projected
impacts of climate and land-use change on the global
diversity of birds. PLoS Biology, 5, 1211–1219.Jiguet, F., Devictor, V., Ottwall, R., van Turnhout, C., van
der Jeugd, H. & Lindstr€om, �A. (2010a) Bird population
trends are linearly affected by climate change along species
thermal ranges. Proceedings of the Royal Society B: Biological
Sciences, 277, 3601–3608.Jiguet, F., Gregory, R.D., Devictor, V., Green, R.E., Vorisek,
P., Van Strien, A. & Couvet, D. (2010b) Population trends
of European common birds are predicted by characteristics
of their climatic niche. Global Change Biology, 16, 497–505.Jiguet, F., Barbet-Massin, M., Devictor, V., Jonz�en, N. &
Lindstr€om, �A. (2013) Current population trends mirror
forecasted changes in climatic suitability for Swedish breed-
ing birds. Bird Study, 60, 60–66.Johansson, B. (2000) Areal precipitation and temperature in
the Swedish mountains: an evaluation from a hydrological
perspective. Nordic Hydrology, 31, 207–228.Jonsson, B. & Jonsson, N. (2009) A review of the likely
effects of climate change on anadromous Atlantic salmon
Salmo salar and brown trout Salmo trutta, with a particular
reference to water temperature and flow. Journal of Fish
Biology, 75, 2381–2447.Jørgensen, P.S., B€ohning-Gaese, K., Thorup, K., Tøttrup,
A.P., Chylarecki, P., Jiguet, F., Lehikoinen, A., Noble, D.,
Reif, J., Schmid, H., van Turnhout, C., Burfield, I., Foppen,
R., Vo�r�ı�sek, P., van Strien, A., Gregory, R.D. & Rahbek, C.
(2016) Continent-scale global change attribution in
European birds – combining annual and decadal time
scales. Global Change Biology, 22, 530–543.Kirby, J.S., Stattersfield, A.J., Butchart, S.H.M., Evans, M.I.,
Grimmett, R.F.A., Jones, V., O’ Sullivan, J., Tucker, G. &
Newton, I. (2008) Key conservation issues for migratory
land- and waterbird species on the world’s major flyways.
Bird Conservation International, 18(suppl.), 49–73.La Sorte, F.A. & Jetz, W. (2012) Tracking of climatic niche
boundaries under recent climate change. Journal of Animal
Ecology, 81, 914–925.La Sorte, F.A. & Thompson, F.R. (2007) Poleward shifts in
winter ranges of North American birds. Ecology, 88, 1803–1812.
Laaksonen, T. & Lehikoinen, A. (2013) Population trends in
boreal birds: continuing declines in agricultural, northern,
and long-distance migrant species. Biological Conservation,
168, 99–107.Lehikoinen, E. & Sparks, T.H. (2010) Changes in migration.
Effects of climate change on birds (ed.by A. Møller, W. Fie-
dler and P. Berthold), pp. 89–112. Oxford University Press,
Oxford, UK.
Lehikoinen, A., Jaatinen, K., V€ah€atalo, A., Clausen, P.,
Crowe, O., Deceuninck, B., Hearn, R., Holt, C.A., Horn-
man, M., Keller, V., Nilsson, L., Langendoen, T.,
Tom�ankov�a, I., Wahl, J. & Fox, A.D. (2013a) Rapid climate
driven shifts in wintering distributions of three common
waterbird species. Global Change Biology, 19, 2071–2081.Lehikoinen, A., Lehikoinen, E., Valkama, J., V€ais€anen, R.A. &
Isomursu, M. (2013b) Impacts of trichomonosis epidemics
on Greenfinch Chloris chloris and Chaffinch Fringilla coelebs
populations in Finland. Ibis, 155, 357–366.Lindstr€om, �A., Green, M., Paulson, G., Smith, H.G. & Devic-
tor, V. (2013) Rapid changes in bird community composi-
tion at multiple spatial scales in response to recent climate
change. Ecography, 36, 313–322.Maclean, I.M.D., Austin, G.E., Rehfisch, M.M., Blew, J.,
Crowe, O., Delany, S., Devos, K., Deceuninck, B., G€unther,
K., Laursen, K., van Roomen, M. & Wahl, J. (2008) Cli-
mate change causes rapid changes in the distribution and
site abundance of birds in winter. Global Change Biology,
14, 2489–2500.Marcogliese, D.J. (2008) The impact of climate change on
parasites and infectious diseases of aquatic animals. Revue
scientifique et techinique (International Office of Epizootics),
27, 467–484.Meller, K., Lehikoinen, A., Piha, M., Hokkanen, T., Rintala,
J. & V€ah€atalo, A.V. (2016) Annual variation and long-term
trends in proportions of resident individuals in partially
migratory birds. Journal of Animal Ecology, 85, 570–580.Mikkonen, S., Laine, M., M€akel€a, H.M., Gregow, H.,
Tuomenvirta, H., Lahtinen, M. & Laaksonen, A. (2015)
Trends in the average temperature in Finland, 1847–2013.Stochastical Environmental Research Risk Assessment, 19,
1521–1529.Newton, I. (1998) Population limitation in birds. Elsevier
Academic Press, Bath, Avon, UK.
1172 Diversity and Distributions, 22, 1163–1173, ª 2016 John Wiley & Sons Ltd
A. Lehikoinen et al.
133PhD thesis by Henning Heldbjerg
Newton, I. (2008) The migration ecology of birds. Academic
Press, San Diego, CA.
Nyegaard, T., Larsen, J.D., Brandtberg, N. & Jørgensen, M.F.
(2015) Overv�agning af de almindelige fuglearter i Danmark
1975–2014.�Arsrapport for Punkttællingsprogrammet. Dansk
Ornitologisk Forening. In Danish with an English summary
http://www.dof.dk/images/projekter/punkttaelling/dokumenter/
Punktt%C3%A6llingsrapport2014.pdf (accessed 1 June
2016).
Pannekoek, J. & Van Strien, A. (2004) TRIM 3 manual
(trends & indices for monitoring data). Statistics Nether-
lands, Voorburg, the Netherlands.
Parmesan, C. (2006) Ecological and evolutionary responses
to recent climate change. Annual Review of Ecology, Evolu-
tion and Systematics, 37, 637–669.Parmesan, C., Ryrholm, N., Stefanescu, C., Hill, J.K., Tho-
mas, C.D., Descimon, H., Huntley, B., Kaila, L., Kullberg,
J., Tammaru, T., Tennent, W.J., Thomas, J.A. & Warren,
M. (1999) Poleward shifts in geographical ranges of butter-
fly species associated with regional warming. Nature, 399,
579–583.Pav�on-Jord�an, D., Fox, A.D., Clausen, P. et al. (2015) Cli-
mate driven changes in winter abundance of a migratory
waterbird in relation to EU protected areas. Diversity and
Distribution, 21, 571–582.Pearce-Higgins, J.W. & Green, R.E. (2014) Birds and climate
change: impacts and conservation solutions. Cambridge
University Press, Cambridge, UK.
Pearce-Higgins, J.W., Eglington, S.M., Martay, B. & Cham-
berlain, D.E. (2015) Drivers of climate change impacts on
bird communities. Journal of Animal Ecology, 84, 943–954.Potvin, D., V€alim€aki, K. & Lehikoinen, A. (2016) Differences
in shifts of wintering and breeding ranges lead to changing
migration distances in European birds. Journal of Avian
Biology. Doi: 10.1111/jav.00941.
R Development Core Team (2015) R: a language and envi-
ronment for statistical computing. The R Foundation for
Statistical Computing, Vienna.
Root, T. (1988) Energy constraints on avian distributions
and abundances. Ecology, 69, 330–339.Saurola, P., Valkama, J. & Velmala, W. (2013) The Finnish
bird ringing atlas, Vol. I. Finnish Museum of Natural His-
tory, Helsinki.
V€alim€aki, K., Lind�en, A. & Lehikoinen, A. (2016) Velocity of
density shifts in Finnish land bird species depends on their
migration ecology and body mass. Oecologia, 181, 313–321.Valkama, J., Saurola, P., Lehikoinen, A., Lehikoinen, E., Piha,
M., Sola, P. & Velmala, W. (2014) The Finnish bird ringing
atlas, Vol. II. Finnish Museum of Natural History, Hel-
sinki.
Ven€al€ainen, A., Tuomenvirta, H. & Drebs, S. (2005) A basic
Finnish climate data set 1961–2000 – description and illustra-
tions. Finnish Meteorological Institute, Helsinki, Finland.
Vickery, J.A., Ewing, S.R., Smith, K.W., Pain, D.J., Bairlein,
F., �Skorpilov�a, J. & Gregory, R.D. (2014) The decline of
Afro-Palaearctic migrants and an assessment of potential
causes. Ibis, 156, 1–22.Virkkala, R. & Rajas€arkk€a, A. (2011) Climate change affects
populations of northern birds in boreal protected areas.
Biology Letters, 7, 395–398.Visser, M.E., Perdeck, A.C., van Balen, J.H. & Both, C.
(2009) Climate change leads to decreasing bird migration
distances. Global Change Biology, 15, 1859–1865.Walsh, H.J., Richardson, D.E., Marancik, K.E. & Hare, J.A.
(2015) Long-term changes in the distribution of larval and
adult fish in the northeast U.S. shelf ecosystem. PLoS ONE,
10, e0137382.
Warren, M.S., Hill, J.K., Thomas, J.A., Asher, J., Fox, R.,
Huntley, B., Roy, D.B., Telfer, M.G., Jeffcoate, S., Harding,
P., Jeffcoate, G., Willis, S.G., Greatorex-Davies, J.N., Moss,
D. & Thomas, C.D. (2001) Rapid responses of British but-
terflies to opposing forces of climate and habitat change.
Nature, 414, 65–69.
SUPPORTING INFORMATION
Additional Supporting Information may be found in the
online version of this article:
Table S1. Classifications of species according to their order,
family, species’ temperature index in summer and winter,
winter habitat preference and migratory behaviour in differ-
ent countries.
Table S2. Comparison of the full models with different phy-
logenetic structures obtained from www.birdtree.org.
Figure S1. Location of the census sites in Finland, Sweden,
Denmark and the Netherlands.
BIOSKETCH
Aleksi Lehikoinen is leading the research group of the Hel-
sinki Lab of Ornithology (Finnish Museum of Natural His-
tory). He is interested in understanding how climate change
and land use changes affect different aspects of the ecology
and population dynamics of species. This international pro-
ject was a collaboration within the network of the European
Bird Census Council (EBCC), an organization focussing
on collecting and analysing bird monitoring and distribution
data across Europe to improve the knowledge of the popula-
tion changes of birds in Europe.
Author contributions: A.L., R.P.B.F, H.H., �A.L. and C.A.M.T.
conceived the study. A.L., H.H., �A.L., W.M., S.P. and
S.H.M.B. gathered the data. A.L. analysed the data and inter-
preted the results. A.L. wrote the article, with a significant
input from other authors.
Editor: Diederik Strubbe
Diversity and Distributions, 22, 1163–1173, ª 2016 John Wiley & Sons Ltd 1173
Climatic drivers of regional winter bird population

134 PhD thesis by Henning Heldbjerg
Perdix perdix Buteo buteo Alauda arvensis Anthus prantensis Troglodytes troglodytes Bombycilla garrulus
Erithacus rubecula Turdus iliacus Sitta europeae Corvus frugilegus Sturnus vulgaris Carduelis flavirostris

135PhD thesis by Henning Heldbjerg
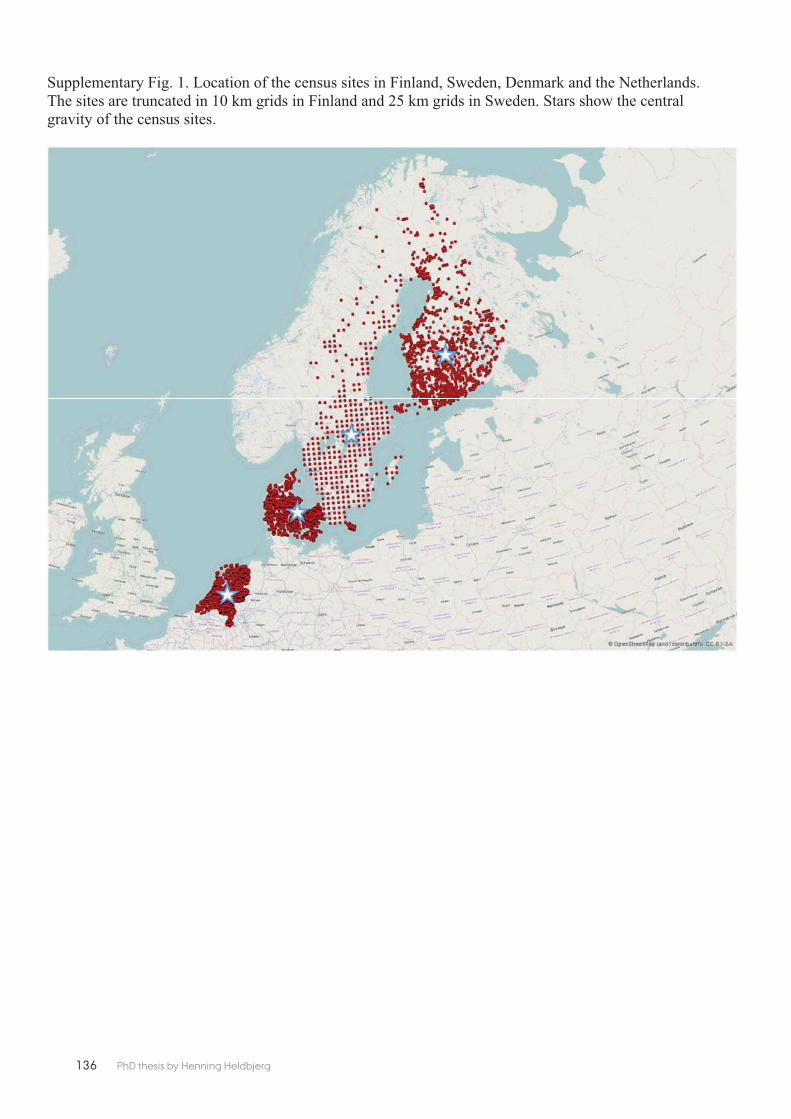
136 PhD thesis by Henning Heldbjerg

Manuscript
Bowler, D.E.1, Heldbjerg, H.2,3, Fox, A.D.3 & O’Hara, R.B.1,4 & Böhning-Gaese, K.1,5
1Senckenberg Biodiversity and Climate Research Centre, Frankfurt am Main, Germany2DOF-BirdLife Denmark, Vesterbrogade 140, DK-1620 Copenhagen V, Denmark3Department of Bioscience, Aarhus University, Kalø, Grenåvej 14, DK-8410 Rønde, Denmark4Department of Mathematical Sciences, Norwegian University of Science and Technology, 7491 Trondheim, Norway5Institute of Ecology, Evolution & Diversity, Goethe University Frankfurt, Frankfurt am Main, Germany
Corresponding author: Diana Bowler ([email protected])Present address: Norwegian Institute for Nature Research – NINA, 7485 Trondheim, Norway
PAPER 7
DISENTANGLING THE EFFECTS OF MULTIPLE ENVIRONMENTAL DRIVERS ON POPULATIONCHANGES WITHIN COMMUNITIES
Photo: Jan Skriver


139PhD thesis by Henning Heldbjerg
Abstract
1. The effects of different environmental drivers on population abundances can be diffi cult to disen-tangle since they often act simultaneously. Researchers have built statistical models that include environmental variables (such as annual temperature), or species attributes (such as a species’ temperature preference), which are assumed to detect the impacts of specifi c drivers (such as cli-mate change). However, these approaches are often applied separately or, even if combined, not explicitly compared.
2. We show the complementary insights gained by applying both these approaches to a community dataset on Danish terrestrial birds. We use our analysis to compare the relative importance of cli-mate change and agricultural land-use change for changes in abundances within the community between 1983 and 2013.
3. Population models were fi tted to the community data of species’ annual abundances with pre-dictors comprising: species attributes, environmental variables, or both. Relationships between species’ abundances and environmental variables were used to identify the drivers associated with average abundance changes of species in the community. Relationships between species’ abundances and their attributes were used to understand the drivers causing interspecifi c varia-tion in abundance changes.
4. Warmer winters were positively associated with community-level abundances, and warm-adapt-ed species had more positive abundance changes than cold-adapted ones. Agricultural area was negatively associated with community-level abundances, and birds using a high proportion of meadow and habitat specialists had more negative abundance changes than birds using other habitats and habitat generalists. Effect sizes of environmental variables were larger for agricul-tural land-use change while those for species attributes were larger for climate change.
5. The environmental-data approach suggested that agricultural land-use change has decreased the average abundances of species in the community, affecting total community size while the spe-cies-attribute based approach suggested that climate change has caused more variation in species abundance, affecting community composition. We show that a combined approach, which draws on the mechanistic link supplied by environmental data and the generality supplied by species attribute data is most useful to understand how communities have changed in the past and how they might change under further environmental change.
Key words: Climate change; Community ecology; Land-use change; Population trends; Species at-tributes; Trait-based approach
DISENTANGLING THE EFFECTS OF MULTIPLE ENVIRONMENTAL DRIVERS ON POPULATIONCHANGES WITHIN COMMUNITIES
Bowler, D.E.1, Heldbjerg, H.2,3, Fox, A.D.3 & O’Hara, R.B.1,4 & Böhning-Gaese, K.1,5
1Senckenberg Biodiversity and Climate Research Centre, Frankfurt am Main, Germany2DOF-BirdLife Denmark, Vesterbrogade 140, DK-1620 Copenhagen V, Denmark3Department of Bioscience, Aarhus University, Kalø, Grenåvej 14, DK-8410 Rønde, Denmark4Department of Mathematical Sciences, Norwegian University of Science and Technology, 7491 Trondheim, Norway5Institute of Ecology, Evolution & Diversity, Goethe University Frankfurt, Frankfurt am Main, Germany
Corresponding author: Diana Bowler ([email protected])Present address: Norwegian Institute for Nature Research – NINA, 7485 Trondheim, Norway

140 PhD thesis by Henning Heldbjerg
Introduction
Understanding the causes of changes in species’ popu-lation abundances is essential for effective conservation management and policy development (Butchart et al. 2010; Díaz et al. 2015; Gamero et al. 2016; Stephens et al. 2016). Much of the change in abundances since the 1970s can be attributed to broad-scale direct anthropogenic drivers (Díaz et al. 2015), especially climate change and agricultural land-use change (Stoate et al. 2001; Pereira, Navarro & Martins 2012; WWF 2014; Burns et al. 2016). As populations have simultaneously been subjected to these different drivers, teasing apart their relative im-portance for species abundances is a challenge. To iso-late the impact of a particular environmental change, such as climate change, studies have taken different approaches. Ecologists have either related popula-tion abundances directly to measured environmental change, e.g. annual temperature (Saether et al. 2000) (hereafter “environmental-data” approach) or have re-lated interspecifi c variation in abundance trends to spe-cies attributes, e.g., temperature preference (Jiguet et al. 2010, Buckley & Kingsolver 2012) (hereafter “species at-tribute-based” approach). Few studies have recognized the relative contributions and value of each approach. In this paper, we combine the strengths of both approaches into one framework to identify drivers of past popula-tion change in species’ communities.
Most commonly, the effect of environmental change has been studied by relating summary variables of environ-mental change, such as of climate or land-use change, to species’ population abundances in statistical models. Climate change can be summarized in a myriad of dif-ferent ways but monthly or seasonal mean temperatures are often used in models (Eglington & Pearce-Higgins 2012; Pearce-Higgins et al. 2015a). For instance, Sæther et al. (2000) related inter-annual changes in the size of the White-throated Dipper (Cinclus cinclus) population to mean winter temperature, and from this inferred the likely impacts of climate change. Models of bird popu-lation dynamics have also included annual cereal yield or indices of the number of cattle and sheep as prox-ies of agricultural land-use change and found that these proxies could explain long-term decreases in abundance (Eglington & Pearce-Higgins 2012). The “environmen-tal-data” approach is usually applied to study the re-sponses of single species but it can also be applied to community datasets to determine whether there are any average or common relationships between abundances and environmental conditions across species in a com-munity. Roy et al. (2001) found positive associations between temperatures, especially during previous sum-mer, and abundances across various species in a butter-fl y community.
Rather than identifying the most predictive environ-mental variables of abundance changes, some studies have focused on explaining the interspecifi c variation of abundance changes using a species trait- or attrib-ute-based approach as a way to infer environmental change impacts. Variation in species’ long-term popula-tion trends have been related to a range of species at-tributes (i.e., traits measurable on individuals as well as other variables, such as niche, measured more often on populations), such as their ecological preference, life history traits, physiology and morphology (Lemoine et al. 2007a; Williams et al. 2008; Jiguet et al. 2010; van Turn-hout et al. 2010). Of course, many species attributes, such as habitat and temperature preferences, are inferred us-ing environmental data but the attributes are assumed to be intrinsic species characteristics and not to change over years. For example, bird species regarded as ‘farm-land birds’ (i.e., using farmland as a preferred breeding habitat) have declined while others have not (Lemoine et al. 2007a; Jorgensen et al. 2016), which has been taken as an indicator of the impacts of agricultural intensifi ca-tion. Similarly, positive relationships between species’ temperature preferences and the population trends of birds and butterfl ies, representing relative increases of warm-adapted species over cool-adapted species, have pointed towards the effects of climate change (Jiguet et al. 2010; Devictor et al. 2012).
Recent studies have begun to combine both species at-tributes and environmental variables in statistical mod-els of community dynamics (Pearce-Higgins et al. 2015b; Jorgensen et al. 2016). However, these studies have not explicitly compared the roles of species attributes ver-sus environmental variables for explaining changes in species’ abundances within communities. The environ-mental-data and attribute-based approaches ask subtly different questions (Fig. 1). The environmental-data approach estimates how much, and in what direction, species’ abundances change with environmental change (Fig. 1 left). When the environmental-data approach is applied to a community dataset, rather than that of a single species, for instance by modelling species dif-ferences as only random effects, it can be used to ask whether there are average or consistent abundance changes across species, which would affect total com-munity abundance. In contrast, the attribute-based ap-proach focuses on the variation of species responses and informs rather on impacts on community composition (Fig. 1 right). If all species in a community are similar (in their niche, tolerances or traits) and therefore respond similarly (positively or negatively) to a specifi c environ-mental driver, then environmental variables may show non-zero average effects on the community; and species attributes are likely to be weak predictors. In contrast, when there is greater species variation and some spe-cies respond positively and others negatively, the aver-
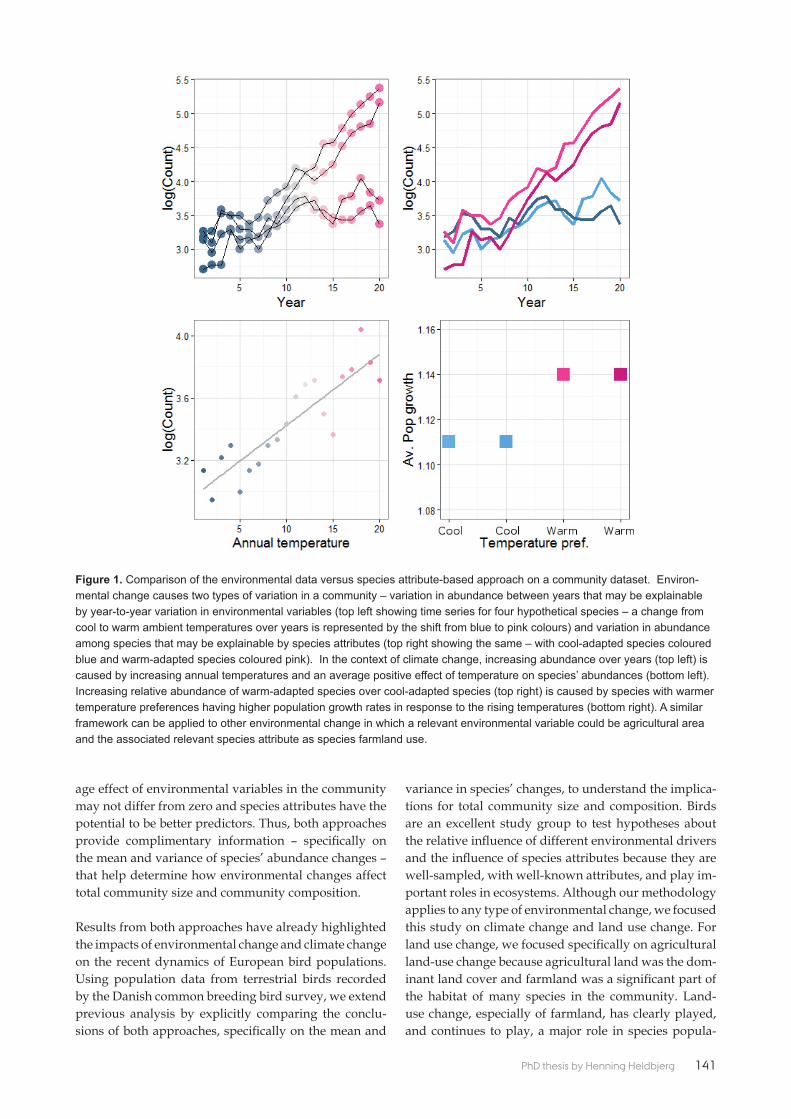
141PhD thesis by Henning Heldbjerg
age effect of environmental variables in the community may not differ from zero and species attributes have the potential to be better predictors. Thus, both approaches provide complimentary information – specifi cally on the mean and variance of species’ abundance changes – that help determine how environmental changes affect total community size and community composition.
Results from both approaches have already highlighted the impacts of environmental change and climate change on the recent dynamics of European bird populations. Using population data from terrestrial birds recorded by the Danish common breeding bird survey, we extend previous analysis by explicitly comparing the conclu-sions of both approaches, specifi cally on the mean and
variance in species’ changes, to understand the implica-tions for total community size and composition. Birds are an excellent study group to test hypotheses about the relative infl uence of different environmental drivers and the infl uence of species attributes because they are well-sampled, with well-known attributes, and play im-portant roles in ecosystems. Although our methodology applies to any type of environmental change, we focused this study on climate change and land use change. For land use change, we focused specifi cally on agricultural land-use change because agricultural land was the dom-inant land cover and farmland was a signifi cant part of the habitat of many species in the community. Land-use change, especially of farmland, has clearly played, and continues to play, a major role in species popula-
Figure 1. Comparison of the environmental data versus species attribute-based approach on a community dataset. Environ-mental change causes two types of variation in a community – variation in abundance between years that may be explainable by year-to-year variation in environmental variables (top left showing time series for four hypothetical species – a change from cool to warm ambient temperatures over years is represented by the shift from blue to pink colours) and variation in abundance among species that may be explainable by species attributes (top right showing the same – with cool-adapted species coloured blue and warm-adapted species coloured pink). In the context of climate change, increasing abundance over years (top left) is caused by increasing annual temperatures and an average positive eff ect of temperature on species’ abundances (bottom left). Increasing relative abundance of warm-adapted species over cool-adapted species (top right) is caused by species with warmer temperature preferences having higher population growth rates in response to the rising temperatures (bottom right). A similar framework can be applied to other environmental change in which a relevant environmental variable could be agricultural area and the associated relevant species attribute as species farmland use.

142 PhD thesis by Henning Heldbjerg
tion trends for bird communities within Europe (Jul-liard, Jiguet & Couvet 2004; Eglington & Pearce-Higgins 2012); however, it may be decelerating in some regions (Gingrich et al. 2015). Some recent studies suggest that climate change could be becoming as important as land-use change for population trends (Lemoine et al. 2007b; Jorgensen et al. 2016). Danish breeding bird populations have been shown previously to be affected by land-use changes (Fox 2004; Eskildsen, Larsen & Heldbjerg 2013; Heldbjerg, Sunde & Fox 2017) but the impact of climate change has so far not been assessed.
We tested the hypotheses that: (1) species’ abundances, on average, increased after years with warmer tempera-tures (Pearce-Higgins et al. 2015b) and decreased with increasing agricultural land-use use change (Eglington & Pearce-Higgins 2012) (environmental data approach, Table 1: hypotheses 1); (2) temperature preference and habitat breadth/farmland specialisation explain varia-tion in the abundance changes of different species, lead-ing to relative increases of warm-adapted species and habitat generalists (Jiguet et al. 2010; Davey et al. 2012) (species attribute-based approach Table 1: hypotheses 2). To explain variation in species’ responses to each en-vironmental variable, we additionally tested (3) whether temperature preferences mediated (i.e., interacted with) species’ population responses to a climatic variable (Pearce-Higgins et al. 2015a); whether habitat breadth/preference mediated species’ responses to an agricultur-al land-use variable (Jorgensen et al. 2016) and wheth-er migratory strategy determined species response to changing temperatures (Møller et al. 2008) (combined approach, Table 1: hypotheses 3). Moreover (4), we ex-pected that the effects sizes of environmental variables or species attributes associated with agricultural land-use change were greater than the effect sizes of variables associated with climate change on the assumption that year-to-year changes in land-use have been stronger than that of climate (Eglington & Pearce-Higgins 2012).
Finally (5), we expected that more variation in the com-munity data would be explained by species attributes than by environmental data alone because of the broad range of species in the dataset that were expected to re-spond differently to environmental change.
Materials and Methods
Data
We analysed the annual national population indices of 77 terrestrial species made publically available online by DOF-Birdlife Denmark (http://www.dof.dk/), selected by exclusion of species that had been affected by culling or hunting, and freshwater species associated with open water (SOM A shows species that were included). These indices are based on annual point count surveys that now involves c. 370 routes across the country monitored in the period 1st May – 15th June (Nyegaard et al. 2015). Most routes consist of 10–20 marked ‘points’ at which all birds seen and heard are recorded in a 5-min obser-vation period (Heldbjerg 2005). All routes are counted in at least two years by the same observer, at the same time of year (± 7 days), same time of day (± 30 min) and under good weather conditions. The annual national abundance indices for each species had been calculated by DOF-Birdlife Denmark by fi tting a log linear regres-sion model to the point count data with Poisson error terms using the software TRends and Indices for Moni-toring data (TRIM) (Pannekoek & van Strien 2004). In this model, the count at a given route in a given year is assumed to be the result of a route and a year effect, ac-counting for overdispersion and temporal autocorrela-tion. Because these abundance data are indices and not true counts, we used the log of the annual indices as our response variable.
Environmental change(Hypothesis #)
Environmental variable (1)
Species attribute (2)
Combined: Interactions (3)
Climate change
Temperatures (+)
Precipitation (+)
Temperature preference(+)
Migration(–)
Temperatures x Preference (+)
Temperatures x migration (–)
Agricultural land-use change Agricultural yield and area (–)
Arable land use/ meadow use (–)
Agricultural Yield/area * use (–)
Environmental change (climate or land-use) – Habitat breadth
(+)
Temperatures * Habitat breadth (+)
Yield/area * Habitat breadth(+)
Table 1. The species attributes and environmental variables that are hypothesized to relate to climate and agricultural land-use change impacts on species’ population abundances. The sign in brackets indicates the hypothesis regarding the direction of the eff ect (i.e., / means the environmental variable/species attribute is positively/negatively associated with species’ abundances.

143PhD thesis by Henning Heldbjerg
Environmental data were compiled on climate and agri-cultural land-use. Daily mean temperature and precipi-tation amount data were extracted from the portion of the E-OBS dataset (Haylock et al. 2008) that overlapped with the Danish boundary. These data were used to calculate mean daily temperature values and monthly precipitation totals for each season (winter: Dec to Feb; spring: Mar to May; summer: June to Aug; autumn: Sept to Nov) of each year, averaged across the country. We focused on these seasons as they represent the extremes, as well as conditions during the breeding season, and were expected to be most important. Annual national land-use data were extracted from databases of the FAO (http://www.fao.org/faostat; annual cereal, barley and wheat yield) and Statistics Denmark (www.dst.dk; an-nual areas of grassland, winter wheat, spring barley and maize). We focused on land-use variables related to ag-riculture as this is the dominant land-use in Denmark.
Species attribute data were compiled from different sources. Species’ temperature preferences were cal-culated by overlaying species distribution data (Bird-LifeInternational & NatureServe 2012) with average (1969–1990) daily mean temperature maps from an E-OBS map delimitated to Europe. Because some spe-cies were trans-Saharan migrants and therefore not in Europe all year, we only used the breeding distribution and spring (March to May) temperature data. However, our aim was only to create a variable that put species on a gradient from cool to warm temperature prefer-ring. Using the temperature data of climatic grid cells intersecting with each species distribution, unimodal response curves were fi tted using the eHOF package (Jansen & Oksanen 2013) and the optimum temperature (i.e., peak of the curve) was extracted for each species, but similar results were obtained using only the average temperature over the range. Data on species’ relative habitat uses (classifi ed for coniferous forest, deciduous forest, arable land, meadow, bog/marsh, heath, dunes/shore, lake and urban) across Denmark were taken from the appendix of Larsen et al. (2011). Using the point counts of the Danish breeding bird survey, Larsen et al. (2011) had calculated species’ relative habitat uses as the abundance of a species in a particular habitat relative to the abundance of this species in all other habitats. Here, we focused on species’ habitat uses of “meadow use” and “arable-land use” – these were continuous variables refl ecting how much each species is specialised on each of these habitats (Larsen, Heldbjerg & Eskildsen 2011). Although not all of these bird species are traditionally regarded as ‘farmland birds’, all used farmland to some extent over their range in Denmark (Larsen, Heldbjerg & Eskildsen 2011). As a measure of habitat breadth, we used the coeffi cient of variation of species’ relative uses (Julliard et al. 2006) across all nine different habitats listed above; this was multiplied by –1 so that species
using similar proportions of different habitats (i.e., gen-eralists) would have higher values, while species mostly using one habitat (i.e., specialists) would have low val-ues. Finally, species were classifi ed as trans-Saharan migrants or otherwise (sedentary, partial migrant and short distance migrants were combined) based on ring-ing recovery data (Bønløkke et al. 2006).
Because some of the environmental data only began in 1983, we fi tted the statistical models to data from this year onwards to 2013. Hypotheses for the effects of the species attributes and environmental variables, and their links to environmental change are found in Table 1.
Statistical modelling
Our analysis was designed to test whether variation in species’ abundances in a community can be explained by annual environmental data, species attributes, and/or their interaction (Fig. 1). In general, our model was a standard autoregressive model (of order 1) of the fol-lowing form:
xt=a + ρ xt-1+ b1 Var_1+...+ bn Var_n + ε
where t is the logged national population index () of a species in year t. Var_n is either a species attribute or an environmental variable. is the intercept; is the autocor-relation term, and are the coeffi cients of each attribute/variable (usually slopes as all variables/attributes were continuous apart from migration), which are estimat-ed by the model. The model was fi t to the community dataset comprising all 77 species so additional random effects (independent and identically distributed) were added for year and for species (on and ).
We ran three sets of models using different types of pre-dictors: (1) Environmental data: annual climatic (temperatures and precipitations in each season), annual agricultural area (maize, winter wheat) and annual agricultural yield (cereal, wheat and barley) variables were included in the model to test hypothesis (1). All data were taken for the year prior to the census except winter tempera-ture that also included the winter immediately preced-ing the census. We also considered temperatures in the previous year to this as well as cumulative lagged ef-fects for the climatic variables using rolling means of the previous two years. In addition to the general model de-scribed above, species-level variation was modelled by including species-specifi c random slopes of the effects of each environmental variable.
Many of the land-use variables were strongly correlated (Fig. S1). Hence, we fi rst tested the strength of each vari-

144 PhD thesis by Henning Heldbjerg
able’s association with species’ population abundance in separate regression models. We highlight the two strongest associated variables (assessed by the z-score of each coeffi cient) from each of the three aforementioned groups, which were combined (when uncorrelated) into a multiple regression model of the form below.
xt = a+ ρ xt-1 + b1 Environ_1+... + bn Environ_n + ε
(2) Species attributes: temperature preference, habi-tat uses (meadow, arable – on a continuous scale and logged because of skew), habitat breadth and migra-tion (trans-Saharan migrant or not) were included in the model to test hypothesis (2). Because species attributes used in the analysis were not strongly correlated (all r<0.7), they were included in the same multiple regres-sion model. Initially, the effects of attributes on popula-tion abundance changes were assumed to be constant over time (i.e. tested by an attribute X year interaction term, meaning that the attribute affects species’ long-term population trends), as has been done previously (Jorgensen et al. 2016). However, we also built random walk models in which the effects of species attributes were allowed to vary between years. The general model was of the form:
xt =a + ρ xt-1 + f(Year,Attr_1) +...f(Year,Attr_n) + ε
(3) Combined approach: In the third set of models, we asked whether we could link the effects of species attrib-utes to specifi c environmental changes to test hypoth-esis (3). Using the environmental variables and species attributes that were statistically signifi cant in previous models, we tested interactions in a multiple regression model according to our hypotheses (Table 1).
xt = a + ρ xt-1 + b1 Environ_1*Attr_1+...+ bn Environ_n*Attr_n+ ε
Models were fi t using R-INLA (Rue, Martino & Chopin 2009). All variables were standardized to units of stand-ard deviation prior to analysis so regression coeffi cients represent standardized effect sizes (Schielzeth 2010). For
the effects of the environmental variables on abundanc-es’, we also compared the effect sizes that accounted for the long-term in each variable (i.e., effect size of each en-vironmental variable in its original units [e.g., log abun-dance change ºC-1] multiplied by its long–term trend [e.g., ºC y-1], giving an effect size of comparable units of log abundance change y-1). We used the effect sizes to compare the relative importance of land-use change and climate change to test hypothesis (4). We calculated the variance explained by the fi xed effects of the mod-els (species attributes and/or environmental variables) to test hypothesis (5). Signifi cant effects were identifi ed as those with 95% confi dence intervals not overlapping zero. For all multiple regression models, insignifi cant terms were removed to obtain the fi nal simplifi ed model and the effect sizes of the signifi cant variables; the insig-nifi cant terms were then added one-by-one to the fi nal model to also obtain their effect sizes. All analysis was conducted using R (R Core Team 2013) and a sample script is provided in SOM B.
Results
Environmental changes
We found evidence that both the climate and agricultur-al land-use has changed over time (Fig. 2; further trends are shown in Fig. S2 and Table S1). Out of the climatic variables, winter and spring temperatures increased the most. Agricultural intensifi cation began in the 1980s, but some changes, such as maize area, increased more during the 00s.
Environmental data approachIn the fi rst set of models, we used environmental vari-ables to model the changes in species’ population abun-dances between years at the community-level (species-level variation was only included as random effects). In simple regression models, the most important cli-matic variables were winter (averaged over 2 years)
Figure 2. Time series of environmental variables (temperatures in ºC; maize area in ha and yield in Hg ha-1) for Denmark since 1980. The blue line is a loess smoother to highlight the trend.

145PhD thesis by Henning Heldbjerg
and spring precipitation, which were positively associ-ated with population abundance (Fig. 3, Table S2). The most important agricultural area and yield variables were maize and winter wheat area, and barley and ce-real yield, respectively, which were negatively associ-ated with population change (Fig. 3). Thus, our fi ndings supported our hypothesis (1). The effect sizes for the agricultural area variables tended to be greater than the climatic variables, supporting hypothesis (4). A similar pattern was obtained when standardizing the effect siz-es by the long-term trend in each (Fig. S3), because the land-use variables had stronger trends than the climatic variables. When combining the best uncorrelated vari-ables from each group (correlations among them shown in Fig. S1), only winter temperature and maize area re-tained signifi cant effects. The fi xed effects of the envi-ronmental variables in this best model (i.e., population average effects for winter temperature plus maize area) explained only 2% of the variation in the data.
Species attribute-based approachIn the second set of models, we used species attributes to model the changes in species’ population abundanc-es. Temperature niche had the largest effect on changes in abundance: warm-adapted species increased in abun-dance over years relative to cool-adapted species (Fig. 4). Species using a higher proportion of meadow tended to decrease in relative abundance over time. In contrast, arable land use was associated with a slight positive ef-fect on abundance. Habitat breadth was positively as-sociated with changes in abundance, refl ecting relative increases of generalists over specialists, (Fig. 4) and it had a stronger effect than either meadow or arable land-use. Trans-Saharan migrants also had more negative changes in abundance than other species (effect size = -0.11, 96% CI = -0.0013, -0.021). Thus, apart from the sur-prising positive effect of arable land use, our fi ndings supported hypothesis (2). Contrary to our hypothesis (4), the effect size for temperature niche reached greater
Figure 3. Eff ects (mean ef-fect size ± 95% confi dence intervals) of environmental variables on the log of species’ population abundance indices. All variables were tested sepa-rately on the community data in regression models, with spe-cies included as random terms (intercept and slopes) and an autocorrelation term. Shown are the best two variables for each environmental variable type (climatic, agricultural area or yield) as inferred from the z-score of each coeffi cient. Ef-fect sizes for all other variables tested are shown in Table S2.
Figure 4. Cumulative eff ects (i.e., eff ect of the attribute on the log population abundance index from the fi rst year: 1983) and 95% confi dence intervals of species attributes on the changes in species’ population abundances over years (obtained from a random walk model).

146 PhD thesis by Henning Heldbjerg
values than the effect sizes for the other attributes. Most-ly similar results were obtained assuming attributes had temporally constant effects and only infl uenced species long-term population trends, but the effect of arable-land use was not statistically signifi cant (Fig. S4, Table S3). The fi xed effects of the model (species attributes X year effects) explained 12% of the variation in the data. Thus, our results were consistent with hypothesis (5) as more variation was explained by the species attributes compared with the average effects of the environmental variables (12% versus 2%).
Combined approach: testing interactions Finally, we built models that included both the environ-mental variables and species attributes, and tested their interactions. We only tested interactions based on a priori hypotheses (Table 1; all tested interactions are shown in Fig. 5). These interactions showed that relative increas-es of warm-adapted species over cold-adapted species were associated with warmer winters (Fig. 5). The abun-dances of trans-Saharan migrants were more negatively associated with warmer springs than the abundances of non-trans-Saharan migrants. The abundances of species using a high proportion of meadow were more nega-tively associated with increasing maize area. In contrast, the negative effect of maize area of species abundances was weaker for habitat generalists. There was no evi-dence that habitat breadth affected species response to winter or spring temperatures. Apart from the lack of link between habitat breadth and a land-use variable, our hypothesis (3) was supported. Effects of the attrib-utes and environmental variables together explained 14% of the variation in the data.
Discussion
Different analytical approaches can be used to study the response of species to environmental change. Directly relating environmental variables to changes in species’ population abundances can be the most useful approach for single-species studies (Saether et al. 2000) but the fi ndings cannot be necessarily extended to other spe-cies. Analysing the effects of species attributes on spe-cies’ abundance changes can be a community-level indi-cator of environmental change but only informs on the variation in abundance response among species. Here we applied both approaches to a community dataset of Danish breeding birds to understand how environmen-tal changes have affect the mean and variance of spe-cies’ abundance changes, which have consequences for total community size and composition. By comparing these approaches, we can extend previous analysis and show the contrasting information that each supplies: ag-ricultural land-use change has most likely had stronger mean effects on species’ abundance changes (environ-mental data approach) while climate change has most likely had stronger effects on the variance in species’ abundance changes (species attribute based approach).
Using the environmental-data approach, we could ask whether there were any average or community-level re-lationships between environmental variables and popu-lation abundances. Since we found both signifi cant cli-matic and agricultural variables, many species appeared to be responding in the same direction to environmental change, which means that environmental change has affected the total size of the community. Across spe-cies in the community, abundances generally increased
Figure 5. Interactions (mean ± 95% confi dence intervals) between species attributes and environmental variables on the log population abundance indices. All variables were continuous standardized variables except migration, which was a categorical variable: non-trans-Saharan migrant or trans-Saharan migrant.

147PhD thesis by Henning Heldbjerg
after years with warmer winters, perhaps by reducing overwinter mortality (Robinson, Baillie & Crick 2007; Lehikoinen et al. 2016). However, the average negative effect sizes of the land-use related environmental vari-ables were larger than the positive effect sizes of the cli-matic variables. This suggests that the negative effects of land-use change have outweighed any direct benefi ts from warmer winters due to climate change on species’ abundances, which is consistent with the overall de-cline of bird abundances in this community. The most strongly related agricultural land-use variable in our analysis was maize area, which has markedly increased since 1990, more recently than other features of agricul-tural change (e.g., the shift from spring to winter cere-als, which occurred in the 1980s). Many Danish breed-ing birds are insectivores and maize cultivation (used for livestock fodder) rapidly forms dense biomass that provides no feeding resources for them (Engel, Huth & Frank 2012; Sauerbrei et al. 2014). Unfortunately, we had no information on species-specifi c maize use to explore this with the attribute-based approach. Because many environmental variables, especially for land-use change, show similar directional changes over time (Robinson & Sutherland 2002; Fox 2004; Heldbjerg et al. 2016), it is diffi cult to confi dently determine the most important component of land-use change. Thus, we cannot deter-mine whether maize area itself or associated changes were the main driver – most likely it was a combination. Nonetheless, our results suggest agricultural change has had large and detrimental repercussions for the terres-trial bird community leading to lower abundances of the bird community.
Using the species-attribute based approach, we asked whether signals of climate change and land-use change were also visible on the interspecifi c variation in abun-dance changes. We found the strongest evidence for relative increases of warm-adapted species and habi-tat generalists over cold-adapted species and habitat specialists (Devictor et al. 2012). As temperature niche had the largest effect size on abundances out of all the species attributes, climate change has potentially been most responsible for causing variation in abundance changes among species, which would change commu-nity composition. However, land-use change has likely also caused changes in community-composition. The most important habitat use affecting species’ abundanc-es appeared to be meadow use and probably relates to changes in grassland management. This is probably be-cause dry grasslands are grazed less, as more livestock are kept indoors, and reseeded swards are instead inten-sively managed to maximise silage production, which reduces suitability for species such as the Starling, Stur-nus vulgaris (Heldbjerg et al. 2016). In addition, many wet marginal grasslands that are important for more specialised breeding bird species have been abandoned
for grazing (e.g. Lapwing Vanellus vanellus, Redshank Tringa totanus and Curlew Numenius arquata) (Heldbjerg et al. 2016). The slight positive effect of arable land-use was unexpected, although few species were specialists of arable land (Larsen, Heldbjerg & Eskildsen 2011), and the effect may be due to temporary positive effects of set-aside schemes on species such as the Corn Bunting, Miliaria calandra that showed a high association with ar-able land.
Potentially the effects of species attributes are mediated by unstudied environmental drivers, or correlations be-tween these species attributes and unstudied species at-tributes or traits. However, the interactions between spe-cies attributes and environmental variables give weight to the inference that the effects of temperature niche on species’ abundances were due to temperature change, and the effects of habitat breadth were due to land-use change. The community shift to warm-adapted species could be linked to the effects of increasing winter tem-peratures (Prince & Zuckerberg 2015), as shown by the signifi cant interaction between winter temperature and temperature preference. The positive effect of warm-ing spring temperatures on abundances was lower for migratory species, which may be linked with a grow-ing mismatch between their timing of breeding and the peak timing of food supply (Both et al. 2006; Møller et al. 2008). There is widespread evidence for communities becoming more dominated by generalist species, which could be hypothesized to be a consequence of either cli-mate change or habitat change (van Turnhout et al. 2010; Davey et al. 2012; Pearce-Higgins et al. 2015a; Thomsen et al. 2016). In our dataset, the increased relative abun-dance of habitat generalists, compared with specialists, could be better explained by agricultural intensifi cation than by temperature change because habitat breadth only signifi cantly interacted with a land-use environ-mental variable and not a climatic one.
Our analysis shows the knowledge that can be gained from combining species attributes and environmental variables together in a single analysis. The combined model only explained slightly more variation in the data than the attribute-based approach alone (14% vs 12%), probably because the ‘year’ effect in the attributes mod-el captured the directional trends in the environmental variables. However, as shown above, in the combined model, we could test hypotheses about which environ-mental variables interacted with which species attrib-utes. On their own, both approaches have their own merits and supply different information on the impacts of environmental change. The attribute-based approach can be most useful when local environmental data are not readily available but community data on species oc-currences/abundances are. Ecological data are increas-ingly better organized and accessible; however, we still

148 PhD thesis by Henning Heldbjerg
often lack data on environmental variables (apart from climatic data), especially at an annual resolution, from regions of population surveys. Species attribute data can be easier to obtain; thus, species attribute (or trait-based) approaches can be useful and practical shortcuts to identify whether an environmental change has affect-ed the abundances of species in a community. The fi nd-ings of the attribute-based approach are also potentially generalizable across different species, with predictions of abundance changes being possible for a species, even if there is no population data, given suffi cient informa-tion on its attributes (Williams et al. 2008).
A short-coming of inferring the impacts of environmen-tal change from species attributes is that any links may be due to multiple drivers and correlated species at-tributes/traits. Thus, the environmental-data approach can always be regarded as superior if the most relevant components of environmental change can be identifi ed and relevant data obtained. Then, the advantage is that the statistical model includes some of the mechanisms through which environmental change affects popula-tions, which enables projection of abundances to other scenarios, on the basis of environmental data. How-ever, the major challenge to this approach is to identify the most relevant environmental variable(s); aspects to consider include the environmental variable (e.g., tem-perature or aridity); the time period and spatial scale of data to be integrated (lagged or not) and the summary parameter (e.g., mean or maximum) (van de Pol et al. 2016).
We show how a combined analysis of environmental and species attribute data can disentangle the effects of environmental change on communities. Analysis of the effect of species attributes on changes in species’ abundances shows which types of species are increas-ing relative to others, helping to understand changes in the species composition of communities. However, the inclusion of environmental variables is essential to link the changes in abundance with the actual environmen-tal change and understand the consequences for chang-es in absolute population and community size. We sug-gest that this combined approach, which draws on the mechanistic link supplied by environmental data and the generality supplied by species attribute data will be potentially most useful to project how communities might change under further environmental change.
Acknowledgements
We thank all those involved in the collection of the bird population data for making it available for public use. DB was funded by the German Research Foundation (DFG: Grant no. BO 1221/23-1). HH acknowledges the support of an industrial PhD stipend awarded by In-novationsfonden, which, together with Aage V Jensen Naturfond and 15. Juni Fonden also supported this work. We also thank the associate editor and two re-viewers for constructive comments on a previous ver-sion. The authors have no confl icts of interest to declare.
Author contributions
DB conceived the idea, performed the analysis and wrote the fi rst draft; HH provided data. HH, AF and KB contributed to hypothesis development and interpreta-tion of the results. All authors contributed to the drafts and gave fi nal approval for publication.
Data accessibilityThe bird population data is freely available from the DOF website:http://www.dof.dk/fakta-om-fugle/punkttaelling-sprojektet/indeks-og-tendenser
Web links to other data sources are found within the SOM.

149PhD thesis by Henning Heldbjerg
ReferencesBirdLifeInternational & NatureServe (2012) Bird species dis-tribution maps of the world. BirdLife International, Cambridge, UK and NatureServe, Arlington, USA.
Bønløkke, J., Madsen, J.J., Thorup, K., Pedersen, K.T., Bjerrum, M. & Rahbek, C. (2006) The Danish Bird Migration Atlas. pp. 798–799. Rhodos, Humlebæk.
Both, C., Bouwhuis, S., Lessells, C.M. & Visser, M.E. (2006) Climate change and population declines in a long-distance migratory bird. Nature, 441, 81-83.
Buckley, L.B. & Kingsolver, J.G. (2012) Functional and phloge-netic approaches to forecasting species’ responses to climate change. Annual Review of Ecology, Evolution, and Systematics, 43, 205-226.
Burns, F., Eaton, M.A., Barlow, K.E., Beckmann, B.C., Brere-ton, T., Brooks, D.R., Brown, P.M.J., Al Fulaij, N., Gent, T., Henderson, I., Noble, D.G., Parsons, M., Powney, G.D., Roy, H.E., Stroh, P., Walker, K., Wilkinson, J.W., Wotton, S.R. & Gregory, R.D. (2016) Agricultural Management and Climatic Change Are the Major Drivers of Biodiversity Change in the UK. Plos One, 11, e0151595.
Butchart, S.H., Walpole, M., Collen, B., Van Strien, A., Scharle-mann, J.P., Almond, R.E., Baillie, J.E., Bomhard, B., Brown, C., Bruno, J., Carpenter, K.E., Carr, G.M., Chanson, J., Chenery, A.M., Csirke, J., Davidson, N.C., Dentener, F., Foster, M., Galli, A., Galloway, J.N., Genovesi, P., Gregory, R.D., Hockings, M., Kapos, V., Lamarque, J.F., Leverington, F., Loh, J., McGeoch, M.A., McRae, L., Minasyan, A., Hernandez Morcillo, M., Old-fi eld, T.E., Pauly, D., Quader, S., Revenga, C., Sauer, J.R., Skol-nik, B., Spear, D., Stanwell-Smith, D., Stuart, S.N., Symes, A., Tierney, M., Tyrrell, T.D., Vie, J.C. Watson, R. (2010) Global Bio-diversity: Indicators of Recent Declines. Science, 328, 1164-1168.
Davey, C.M., Chamberlain, D.E., Newson, S.E., Noble, D.G. & Johnston, A. (2012) Rise of the generalists: evidence for climate driven homogenization in avian communities. Global Ecology and Biogeography, 21, 568-578.
Devictor, V., van Swaay, C., Brereton, T., Brotons, L., Cham-berlain, D., Heliola, J., Herrando, S., Julliard, R., Kuussaari, M., Lindstrom, A., Reif, J., Roy, D.B., Schweiger, O., Settele, J., Stefanescu, C., Van Strien, A., Van Turnhout, C., Vermouzek, Z., WallisDeVries, M., Wynhoff, I. & Jiguet, F. (2012) Diffe-rences in the climatic debts of birds and butterfl ies at a conti-nental scale. Nature Climate Change, 2, 121-124.
Díaz, S., Demissew, S., Joly, C., Lonsdale, W.M. & Larigauderie, A. (2015) A Rosetta Stone for Nature’s Benefi ts to People. Plos Biology, 13, e1002040.
Eglington, S.M. & Pearce-Higgins, J.W. (2012) Disentangling the Relative Importance of Changes in Climate and Land-Use Intensity in Driving Recent Bird Population Trends. Plos One, 7.
Engel, J., Huth, A. & Frank, K. (2012) Bioenergy production and Skylark (Alauda arvensis) population abundance - a mod-elling approach for the analysis of land-use change impacts and conservation options. Global Change Biology Bio-energy, 4, 713-727.
Eskildsen, A., Larsen, J.D. & Heldbjerg, H. (2013) Use of an objective indicator species selection method shows decline in bird populations in Danish habitats. Dansk. Orn. Foren. Tidsskr., 107, 191-207.
Fox, A.D. (2004) Has Danish agriculture maintained farmland bird populations? Journal of Applied Ecology, 41, 427-439.
Gamero, A., Brotons, L., Brunner, A., Foppen, R., Fornasari, L., Gregory, R.D., Herrando, S., Hořák, D., Jiguet, F., Kmecl, P., Lehikoinen, A., Lindström, Å., Paquet, J.-Y., Reif, J., Sirkiä, P.M., Škorpilova, J., van Strien, A., Szép, T., Telenský, T., Teufelbauer, N., Trautmann, S., van Turnhout, C.A.M., Vermouzek, Z., Vikstrøm, T. & Voříšek, P. (2016) Tracking progress towards EU biodiversity strategy targets: EU policy effects in preserving its common farmland birds. Conservation Letters, 10, 395–402
Gingrich, S., Niedertscheider, M., Kastner, T., Haberl, H., Cosor, G., Krausmann, F., Kuemmerle, T., Müller, D., Reith-Musel, A., Jepsen, M.R., Vadineanu, A. & Erb, K.H. (2015) Exploring long-term trends in land use change and above-ground human appropriation of net primary production in nine European countries. Land Use Policy, 47, 426-438.
Haylock, M.R., Hofstra, N., Tank, A., Klok, E.J., Jones, P.D. & New, M. (2008) A European daily high-resolution gridded data set of surface temperature and precipitation for 1950-2006. Journal of Geophysical Research-Atmospheres, 113, D20119.
Heldbjerg, H. (2005) De almindelige fugles bestandsudvikling i Danmark 1975–2004. Dansk Ornitologisk Forenings Tidsskrift, 99, 182-195.
Heldbjerg, H., Fox, A.D., Levin, G. & Nyegaard, T. (2016) The decline of the Starling Sturnus vulgaris in Denmark is related to changes in the extent and intensity of cattle grazing. Agri-culture Ecosystems and Environment, 230, 24-31.
Heldbjerg, H., Sunde, P. & Fox, A.D. (2017) Continuous population declines for specialist farmland birds 1987-2014 in Denmark indicates no halt in biodiversity loss in agricultural habitats. Bird Conservation International. 1-15.
Jansen, F. & Oksanen, J. (2013) How to model species responses along ecological gradients - Huisman-Olff-Fresco models revi-sited. Journal of Vegetation Science, 24, 1108-1117.
Jiguet, F., Gregory, R.D., Devictor, V., Green, R.E., Vorisek, P., Van Strien, A. & Couvet, D. (2010) Population trends of Euro-pean common birds are predicted by characteristics of their climatic niche. Global Change Biology, 16, 497-505.
Jorgensen, P.S., Boehning-Gaese, K., Thorup, K., Tottrup, A.P., Chylarecki, P., Jiguet, F., Lehikoinen, A., Noble, D.G., Reif, J., Schmid, H., van Turnhout, C., Burfi eld, I.J., Foppen, R., Vorisek, P., van Strien, A., Gregory, R.D. & Rahbek, C. (2016) Continent-scale global change attribution in European birds - combining annual and decadal time scales. Global Change Biology, 22, 530-543.
Julliard, R., Clavel, J., Devictor, V., Jiguet, F. & Couvet, D. (2006) Spatial segregation of specialists and generalists in bird communities. Ecology Letters, 9, 1237-1244.

150 PhD thesis by Henning Heldbjerg
Julliard, R., Jiguet, F. & Couvet, D. (2004) Common birds facing global changes: what makes a species at risk? Global Change Biology, 10, 148-154.
Larsen, J.L., Heldbjerg, H. & Eskildsen, A. (2011) Improving na-tional habitat specifi c biodiversity indicators using relative hab-itat use for common birds. Ecological Indicators, 11, 1459-1466.
Lehikoinen, A., Foppen, R.P.B., Heldbjerg, H., Lindström, Å., van Manen, W., Piirainen, S., van Turnhout, C.A.M. & Butchart, S.H.M. (2016) Large-scale climatic drivers of regional winter bird population trends. Diversity and Distributions, 22, 1163–1173.
Lemoine, N., Bauer, H.-G., Peintinger, M. & Boehning-Gaese, K. (2007a) Effects of climate and land-use change on species abundance in a central European bird community. Conserva-tion Biology, 21, 495-503.
Lemoine, N., Bauer, H.G., Peintinger, M. & Bohning-Gaese, K. (2007b) Effects of climate and land-use change on species abundance in a central European bird community. Conserva-tion Biology, 21, 495-503.
Møller, A.P., Rubolini, D. & Lehikoinen, E. (2008) Populations of migratory bird species that did not show a phenological response to climate change are declining. Proceedings of the National Academy of Sciences of the United States of America. 105, 16195-16200.
Nyegaard, T., Larsen, J.D., Brandtberg, N. & Jørgensen, M.F. (2015) Common bird Census in Denmark 1975-2014. Dansk Ornitologisk Forening (in Danish, with English summary).
Pannekoek, J. & van Strien, A. (2004) TRIM 3 manual. Statis-tics Netherlands, Amsterdam, Netherlands.
Pearce-Higgins, J.W., Eglington, S.M., Martay, B. & Chamber-lain, D.E. (2015a) Drivers of climate change impacts on bird communities. Journal of Animal Ecology, 84, 943-954.
Pearce-Higgins, J.W., Ockendon, N., Baker, D.J., Carr, J., White, E.C., Almond, R.E.A., Amano, T., Bertram, E., Brad-bury, R.B., Bradley, C., Butchart, S.H.M., Doswald, N., Foden, W., Gill, D.J.C., Green, R.E., Sutherland, W.J. & Tanner, E.V.J. (2015b) Geographical variation in species’ population re-sponses to changes in temperature and precipitation. Proceed-ings of the Royal Society B-Biological Sciences, 282.
Pereira, H.M., Navarro, L.M. & Martins, I.S. (2012) Global Bio-diversity Change: The Bad, the Good, and the Unknown. An-nual Review of Environment and Resources, Vol 37 (eds A. Gadgil & D.M. Liverman), pp. 25-50.
Prince, K. & Zuckerberg, B. (2015) Climate change in our backyards: the reshuffl ing of North America’s winter bird communities. Global Change Biology, 21, 572-585.
R Core Team (2013) R: A language and environment for sta-tistical computing. R Foundation for Statistical Computing, Vienna, Austria.
Robinson, R.A., Baillie, S.R. & Crick, H.Q.P. (2007) Weather-dependent survival: implications of climate change for pas-serine population processes. Ibis, 149, 357-364.
Robinson, R.A. & Sutherland, W.J. (2002) Post-war changes in arable farming and biodiversity in Great Britain. Journal of Ap-plied Ecology, 39, 157–176.
Roy, D.B., Rothery, P., Moss, D., Pollard, E., Thomas, J.A. (2001). Butterfl y numbers and weather: predicting historical trends in abundance and the future effects of climate change. Journal of Animal Ecology, 70, 201-217.
Rue, H., Martino, S. & Chopin, N. (2009) Approximate Bayesian inference for latent Gaussian models by using in-tegrated nested Laplace approximations. Journal of the Royal Statistical Society Series B-Statistical Methodology, 71, 319-392.
Saether, B.E., Tufto, J., Engen, S., Jerstad, K., Rostad, O.W. & Skatan, J.E. (2000) Population dynamical consequences of climate change for a small temperate songbird. Science, 287, 854-856.
Sauerbrei, R., Ekschmitt, K., Wolters, V. & Gottschalk, T.K. (2014) Increased energy maize production reduces farmland bird diversity. Global Change Biology Bioenergy, 6, 265-274.
Schielzeth, H. (2010) Simple means to improve the inter-pretability of regression coeffi cients. Methods in Ecology and Evolution, 1, 103-113.
Stephens, P.A., Mason, L.R., Green, R.E., Gregory, R.D., Sauer, J.R., Alison, J., Aunins, A., Brotons, L., Butchart, S.H.M., Cam-pedelli, T., Chodkiewicz, T., Chylarecki, P., Crowe, O., Elts, J., Escandell, V., Foppen, R.P.B., Heldbjerg, H., Herrando, S., Husby, M., Jiguet, F., Lehikoinen, A., Lindström, A., Noble, D.G., Paquet, J.-Y., Reif, J., Sattler, T., Szép, T., Teufelbauer, N., Trautmann, S., van Strien, A.J., van Turnhout, C.A.M., Vorisek, P., Willis, S.G. (2016) Consistent response of birds populations to climate change on two continents. Science, 352, 84-87.
Stoate, C., Boatman, N.D., Borralho, R.J., Carvalho, C.R., de Snoo, G.R. & Eden, P. (2001) Ecological impacts of arable in-tensifi cation in Europe. Journal of Environmental Management, 63, 337-365.
Thomsen, P.F., Jorgensen, P.S., Bruun, H.H., Pedersen, J., Riis-Nielsen, T., Jonko, K., Slowinska, I., Rahbek, C. & Karsholt, O. (2016) Resource specialists lead local insect community turnover associated with temperature - analysis of an 18-year full-seasonal record of moths and beetles. Journal of Animal Ecology, 85, 251-261.
van de Pol, M., Bailey, L.D., McLean, N., Rijsdijk, L., Lawson, C.R. & Brouwer, L. (2016) Identifying the best climatic predic-tors in ecology and evolution. Methods in Ecology and Evolu-tion, 7, 1246-1257.
van Turnhout, C.A.M., Foppen, R.P.B., Leuven, R.S.E.W., et al. (2010) Life-history and ecological correlates of population change in Dutch breeding birds. Biological Conservation, 143, 173-181.
Williams, S.E., Shoo, L.P., Isaac, J.L., Hoffmann, A.A. & Lang-ham, G. (2008) Towards an Integrated Framework for As-sessing the Vulnerability of Species to Climate Change. Plos Biology, 6, 2621-2626.
WWF (2014) Living Planet Report 2014: species and spaces, people and places. (eds R. McLellan, L. Iyengar, B. Jeffries & N. Oerlemans). WWF, Gland, Switzerland.
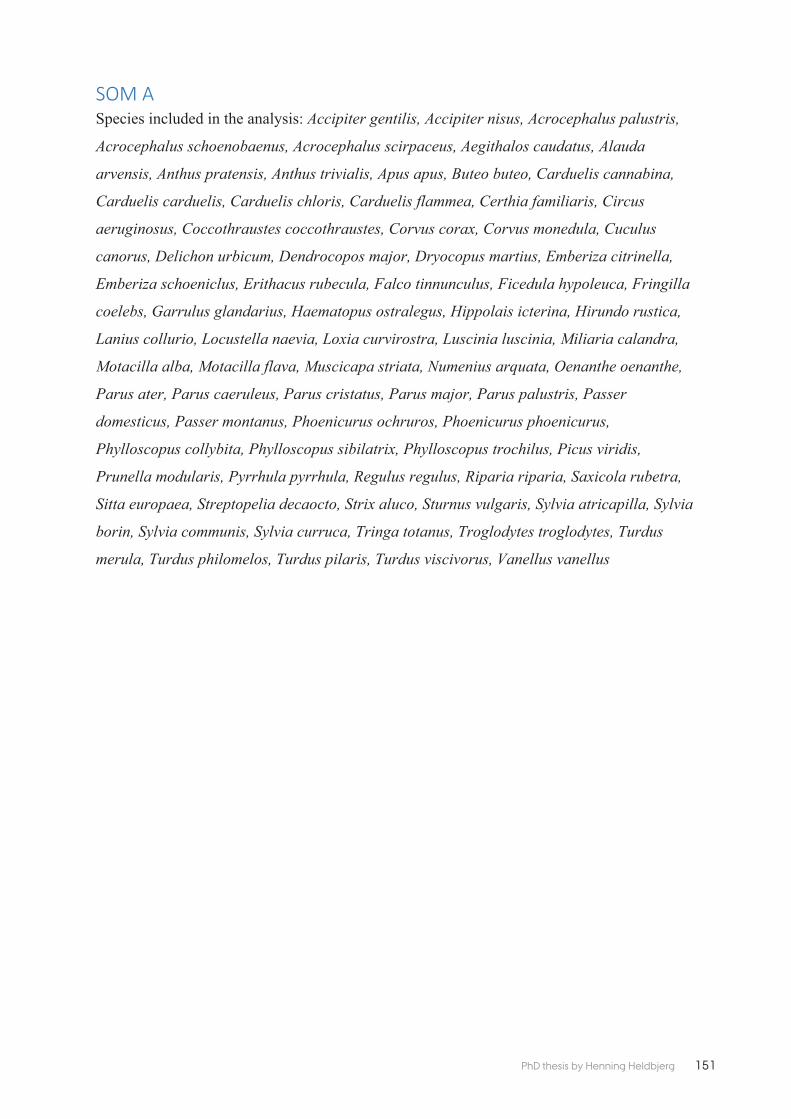
151PhD thesis by Henning Heldbjerg
Accipiter gentilis, Accipiter nisus, Acrocephalus palustris,
Acrocephalus schoenobaenus, Acrocephalus scirpaceus, Aegithalos caudatus, Alauda
arvensis, Anthus pratensis, Anthus trivialis, Apus apus, Buteo buteo, Carduelis cannabina,
Carduelis carduelis, Carduelis chloris, Carduelis flammea, Certhia familiaris, Circus
aeruginosus, Coccothraustes coccothraustes, Corvus corax, Corvus monedula, Cuculus
canorus, Delichon urbicum, Dendrocopos major, Dryocopus martius, Emberiza citrinella,
Emberiza schoeniclus, Erithacus rubecula, Falco tinnunculus, Ficedula hypoleuca, Fringilla
coelebs, Garrulus glandarius, Haematopus ostralegus, Hippolais icterina, Hirundo rustica,
Lanius collurio, Locustella naevia, Loxia curvirostra, Luscinia luscinia, Miliaria calandra,
Motacilla alba, Motacilla flava, Muscicapa striata, Numenius arquata, Oenanthe oenanthe,
Parus ater, Parus caeruleus, Parus cristatus, Parus major, Parus palustris, Passer
domesticus, Passer montanus, Phoenicurus ochruros, Phoenicurus phoenicurus,
Phylloscopus collybita, Phylloscopus sibilatrix, Phylloscopus trochilus, Picus viridis,
Prunella modularis, Pyrrhula pyrrhula, Regulus regulus, Riparia riparia, Saxicola rubetra,
Sitta europaea, Streptopelia decaocto, Strix aluco, Sturnus vulgaris, Sylvia atricapilla, Sylvia
borin, Sylvia communis, Sylvia curruca, Tringa totanus, Troglodytes troglodytes, Turdus
merula, Turdus philomelos, Turdus pilaris, Turdus viscivorus, Vanellus vanellus

152 PhD thesis by Henning Heldbjerg
#####################################################################
#Data sources - all data is freely downloadable from the web
#####################################################################
#Bird population data is obtainable from:
#http://www.dof.dk/fakta-om-fugle/punkttaellingsprojektet/indeks-og-tendenser
#Climatic data is available from:
#http://www.ecad.eu/download/ensembles/download.php
#Agricultural yield and area variables from:
#http://www.fao.org/faostat/en/#data
#http://www.statbank.dk/
#Species habitat uses from the SOM of:
#http://www.sciencedirect.com/science/article/pii/S1470160X11000768
#R-INLA for fitting population models from:
#http://www.r-inla.org/
######################################################################
#Environmental variables models
######################################################################
inla1<-inla(log(Count) ~ avWinter.temp + prev.Maize.area+#fixed effects
f(Year.index, model="ar1", replicate=Species.idx, constr=T)+#ar1 terms
f(Species.int, model="iid", constr=T)+#species random intercept
f(Species.winter.id, avWinter.temp, model="iid",constr=T)+#random
slope
f(Species.maize.id, prev.Maize.area, model="iid",constr=T),#random
slope
data = inla_df, family = "gaussian")
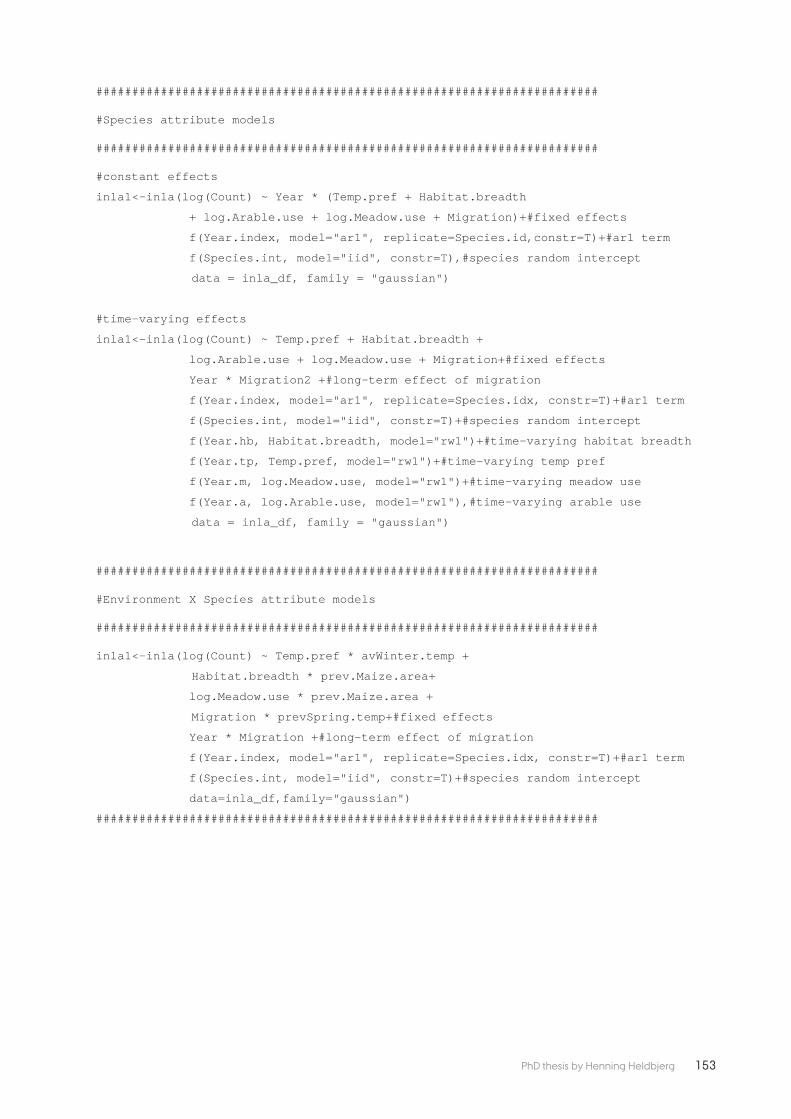
153PhD thesis by Henning Heldbjerg
######################################################################
#Species attribute models
######################################################################
#constant effects
inla1<-inla(log(Count) ~ Year * (Temp.pref + Habitat.breadth
+ log.Arable.use + log.Meadow.use + Migration)+#fixed effects
f(Year.index, model="ar1", replicate=Species.id,constr=T)+#ar1 term
f(Species.int, model="iid", constr=T),#species random intercept
data = inla_df, family = "gaussian")
#time-varying effects
inla1<-inla(log(Count) ~ Temp.pref + Habitat.breadth +
log.Arable.use + log.Meadow.use + Migration+#fixed effects
Year * Migration2 +#long-term effect of migration
f(Year.index, model="ar1", replicate=Species.idx, constr=T)+#ar1 term
f(Species.int, model="iid", constr=T)+#species random intercept
f(Year.hb, Habitat.breadth, model="rw1")+#time-varying habitat breadth
f(Year.tp, Temp.pref, model="rw1")+#time-varying temp pref
f(Year.m, log.Meadow.use, model="rw1")+#time-varying meadow use
f(Year.a, log.Arable.use, model="rw1"),#time-varying arable use
data = inla_df, family = "gaussian")
######################################################################
#Environment X Species attribute models
######################################################################
inla1<-inla(log(Count) ~ Temp.pref * avWinter.temp +
Habitat.breadth * prev.Maize.area+
log.Meadow.use * prev.Maize.area +
Migration * prevSpring.temp+#fixed effects
Year * Migration +#long-term effect of migration
f(Year.index, model="ar1", replicate=Species.idx, constr=T)+#ar1 term
f(Species.int, model="iid", constr=T)+#species random intercept
data=inla_df,family="gaussian")
######################################################################

154 PhD thesis by Henning Heldbjerg

155PhD thesis by Henning Heldbjerg

156 PhD thesis by Henning Heldbjerg

157PhD thesis by Henning Heldbjerg

158 PhD thesis by Henning Heldbjerg
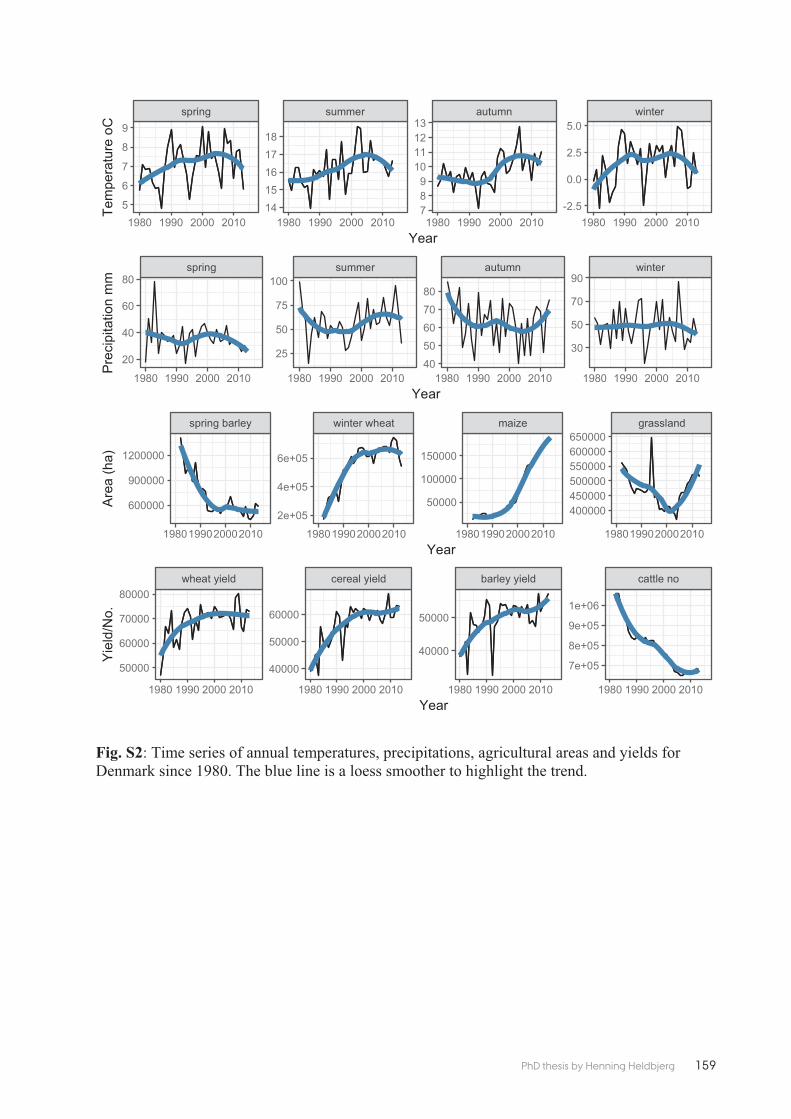
159PhD thesis by Henning Heldbjerg

160 PhD thesis by Henning Heldbjerg

161PhD thesis by Henning Heldbjerg

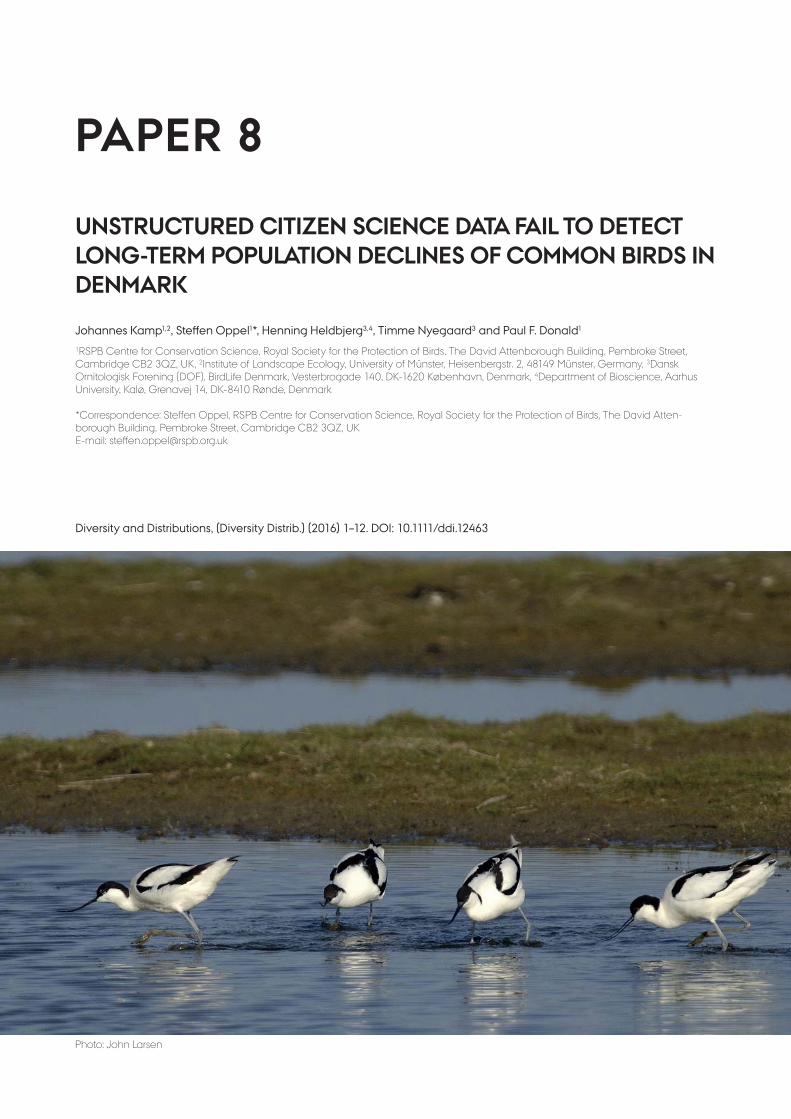
Diversity and Distributions, (Diversity Distrib.) (2016) 1–12. DOI: 10.1111/ddi.12463
Johannes Kamp1,2, Steff en Oppel1*, Henning Heldbjerg3,4, Timme Nyegaard3 and Paul F. Donald1
1RSPB Centre for Conservation Science, Royal Society for the Protection of Birds, The David Attenborough Building, Pembroke Street, Cambridge CB2 3QZ, UK, 2Institute of Landscape Ecology, University of Münster, Heisenbergstr. 2, 48149 Münster, Germany, 3Dansk Ornitologisk Forening (DOF), BirdLife Denmark, Vesterbrogade 140, DK-1620 København, Denmark, 4Department of Bioscience, Aarhus University, Kalø, Grenavej 14, DK-8410 Rønde, Denmark
*Correspondence: Steff en Oppel, RSPB Centre for Conservation Science, Royal Society for the Protection of Birds, The David Atten-borough Building, Pembroke Street, Cambridge CB2 3QZ, UKE-mail: steff [email protected]
PAPER 8
UNSTRUCTURED CITIZEN SCIENCE DATA FAIL TO DETECT LONG-TERM POPULATION DECLINES OF COMMON BIRDS IN DENMARK
Photo: John Larsen


165PhD thesis by Henning Heldbjerg
BIODIVERSITYRESEARCH
Unstructured citizen science data fail todetect long-term population declines ofcommon birds in Denmark
Johannes Kamp1,2, Steffen Oppel1*, Henning Heldbjerg3,4,
Timme Nyegaard3 and Paul F. Donald1
1RSPB Centre for Conservation Science,
Royal Society for the Protection of Birds,
The David Attenborough Building, Pembroke
Street, Cambridge CB2 3QZ, UK, 2Institute
of Landscape Ecology, University of M€unster,
Heisenbergstr. 2, 48149 M€unster, Germany,3Dansk Ornitologisk Forening (DOF),
BirdLife Denmark, Vesterbrogade 140,
DK-1620 København, Denmark,4Department of Bioscience, Aarhus
University, Kalø, Gren�avej 14,
DK-8410 Rønde, Denmark
*Correspondence: Steffen Oppel, RSPB Centre
for Conservation Science, Royal Society for
the Protection of Birds, The David
Attenborough Building, Pembroke Street,
Cambridge CB2 3QZ, UK.
E-mail: [email protected]
ABSTRACT
Aim Long-term monitoring of biodiversity is necessary to identify population
declines and to develop conservation management. Because long-term monitor-
ing is labour-intensive, resources to implement robust monitoring programmes
are lacking in many countries. The increasing availability of citizen science data
in online public databases can potentially fill gaps in structured monitoring
programmes, but only if trends estimated from unstructured citizen science
data match those estimated from structured monitoring programmes. We
therefore aimed to assess the correlation between trends estimated from struc-
tured and unstructured data.
Location Denmark.
Methods We compared population trends for 103 bird species estimated over
28 years from a structured monitoring programme and from unstructured citi-
zen science data to assess whether trends estimated from the two data sources
were correlated.
Results Trends estimated from the two data sources were generally positively
correlated, but less than half the population declines identified from the struc-
tured monitoring data were recovered from the unstructured citizen science
data. The mismatch persisted when we reduced the structured monitoring data
from count data to occurrence data to mimic the information content of
unstructured citizen science data and when we filtered the unstructured data to
reduce the number of incomplete lists reported. Mismatching trends were espe-
cially prevalent for the most common species. Worryingly, more than half the
species showing significant declines in the structured monitoring showed signif-
icant positive trends in the citizen science data.
Main conclusions We caution that unstructured citizen science databases can-
not replace structured monitoring data because the former are less sensitive to
population changes. Thus, unstructured data may not fulfil one of the most
critical functions of structured monitoring programmes, namely to act as an
early warning system that detects population declines.
Keywords
citizen science, common bird monitoring, JAGS, occupancy model, population
trend, volunteer.
INTRODUCTION
Monitoring changes in species’ populations is an essential
element of biodiversity conservation. Objective quantification
of population change allows problems to be identified and
conservation responses to be developed. The performance of
subsequent management can then be evaluated from contin-
ued monitoring. Dedicated population monitoring schemes
for biodiversity have been running for decades in many
countries, particularly in Europe and North America
DOI: 10.1111/ddi.12463ª 2016 John Wiley & Sons Ltd http://wileyonlinelibrary.com/journal/ddi 1
Diversity and Distributions, (Diversity Distrib.) (2016) 1–12A
Jou
rnal
of
Cons
erva
tion
Bio
geog
raph
yD
iver
sity
and
Dis
trib
utio
ns

166 PhD thesis by Henning Heldbjerg
(Greenwood, 2003; Schmeller et al., 2012). However, these
structured schemes require considerable investment and
organization, and usually rely on a large number of dedi-
cated volunteers who are able and willing to apply standard-
ized methods over large areas and long time periods
(Schmeller et al., 2009). Many biodiversity-rich countries,
however, lack the resources for such schemes, necessitating
the identification of other sources of data and methods to
monitor biodiversity.
Casual observations collected without following a struc-
tured protocol by members of the public may potentially
contribute to research and conservation, and a growing
number of unstructured ‘citizen science’ databases have
become available in recent years (Devictor et al., 2010; Sulli-
van et al., 2014; Theobald et al., 2015). However, several
sources of bias in unstructured data are well known and the
information content of unstructured data can be highly vari-
able (Dickinson et al., 2010; Hochachka et al., 2012; Isaac &
Pocock, 2015). Field observations collected in an unstruc-
tured manner usually do not represent random samples and
exhibit considerable spatial bias towards more densely popu-
lated regions (Boakes et al., 2010; Lin et al., 2015), protected
areas, and areas rich in biodiversity and threatened species
(Tulloch et al., 2013a). Observation effort is not standardized
as in structured monitoring schemes (Dickinson et al.,
2010), and there might be considerable reporting bias, as
many observers tend to report only unusual or rare species
(van Strien et al., 2013). These characteristics of unstructured
data make it difficult to assess how reliable they can be for
biodiversity monitoring.
Several approaches have been developed to account for
some of the bias inherent in unstructured data and extract
more reliable information (van Strien et al., 2010;
Hochachka et al., 2012; Isaac et al., 2014). Correcting for
varying observation effort in unstructured data has been
achieved using the number of species reported per visit (‘list
length’; Szabo et al., 2010) or, where recorded, the time
spent per field visit (Kindberg et al., 2009). A more signifi-
cant challenge, the problem that an unknown proportion of
those species that are present will not be detected during a
given visit, has been addressed using site-occupancy models
that account for imperfect detection and may simultaneously
correct for reporting bias (K�ery et al., 2010a,b; van Strien
et al., 2013). However, a robust validation of such
approaches is necessary before unstructured data can be used
with confidence for biodiversity monitoring (Isaac et al.,
2014).
The value of unstructured monitoring data can be assessed
by comparing population trends derived from unstructured
citizen science data against the best available independent,
structured monitoring schemes. Previous comparisons have
detected correlations between reporting rates from weakly
structured atlas data and data from a standardized random-
sampled survey that range from strong (Szabo et al., 2012)
to weak and inconsistent (Sn€all et al., 2011). Accounting for
imperfect detection using occupancy models based on
comprehensive species lists matched the trends of a robust
monitoring scheme better than presence-only data (van
Strien et al., 2010), and strong trends in structured monitor-
ing data may be recovered from unstructured data when
analysed with occupancy models (van Strien et al., 2013;
Isaac et al., 2014). The usefulness of unstructured data there-
fore clearly depends on how they are processed and analysed.
One major difference between many long-term structured
monitoring programmes and unstructured citizen science
data is that the former often provide counts or indices of
abundance, whereas unstructured citizen science data often
only provide detection/non-detection data because of highly
varying recording intensity in space and over time (Isaac
et al., 2014). However, if unstructured data are to fulfil the
role of structured monitoring programmes, then they need
to be able to identify approximately the same population
trends as structured monitoring despite this inherent differ-
ence in data quality. Because even simple detection/non-
detection data can allow inference about the abundance of a
population (Royle & Nichols, 2003), population trends
should be detectable with unstructured citizen science data
(van Strien et al., 2013; Isaac et al., 2014), but may be less
reliable than trends derived from structured monitoring data
with higher information content (Johnston et al., 2015). The
potential for unstructured data to recover trends could there-
fore possibly be improved using only records with higher
information content (Roy et al., 2012). A typical deficiency
of many online public databases is the lack of differentiation
between complete species lists (which allow inference about
the non-detection of species) and incidental records of a sub-
set of the species actually observed (K�ery et al., 2010b; van
Strien et al., 2013; Tulloch et al., 2013b). Using data sets
with higher information content that allow the statistical
modelling of detection probability can yield improved trend
estimates (K�ery et al., 2010a; Isaac & Pocock, 2015), but
whether such filtering can overcome other deficiencies of
unstructured citizen science data is unclear.
Here, we assess whether unstructured observation records
can recover population trends derived with confidence from
structured surveys, despite having data with inherently lower
information content. We use unstructured bird monitoring
data from a country-wide public online database containing
more than 12 million records collected over 28 years in Den-
mark. We first estimated population trends of 103 bird spe-
cies from unstructured data using occupancy models. We
then correlated these trends with population trends estimated
over the same period by a structured, standardized common
bird monitoring programme in the same country. Finally, we
compared trend estimates from both data sources and
assessed whether mismatches in these estimates were a conse-
quence of fundamentally different information content by:
(1) reducing the information content of structured monitor-
ing data from count to detection/non-detection data, and (2)
applying multiple filtering criteria to retain only records in
the unstructured data with increasing information content.
Our study thus provides a thorough examination of the
2 Diversity and Distributions, 1–12, ª 2016 John Wiley & Sons Ltd
J. Kamp et al.

167PhD thesis by Henning Heldbjerg
potential of unstructured citizen science data to detect popu-
lation trends and identifies factors that may affect the corre-
spondence between structured and unstructured data sources
for biodiversity monitoring.
MATERIALS AND METHODS
Structured monitoring and unstructured observation
data
The Common Bird Monitoring (CBM) scheme in Denmark
was established in 1975 (Heldbjerg et al., 2014) following
standard guidelines for structured bird monitoring pro-
grammes (Gregory et al., 2004). Birds were monitored once
during the breeding season (1 May to 15 June) on observer-
chosen (non-randomly placed) routes, with each route con-
taining 10–20 points which were spaced at least 300 m apart
and were visited each year by the same observer. At each
point, all birds seen or heard within a 5-min interval were
counted. This forms the key difference to unstructured
observation data, which are generally obtained from random
surveys of highly variable duration yielding only detection/
non-detection information. Although no a priori stratifica-
tion of routes was applied, the survey routes covered all
main habitat types in Denmark and were distributed rela-
tively evenly across the country with no obvious concentra-
tions in urban areas. We used data from 1986 to 2013,
during which the number of routes remained relatively stable
at between 300 and 400 (Fig. 1; Heldbjerg et al., 2014).
We used unstructured observation data from the online
database ‘DOFbasen’ (http://www.dofbasen.dk, Nyegaard
et al., 2012), developed by the Dansk Ornitologisk Forening
(DOF). DOFbasen was launched in 2002, and most observa-
tions have been entered since then (Fig. S1 in Supporting
Information). However, many observers have entered data
retrospectively, and DOFbasen now holds sufficient historical
data to compare trends with structured monitoring data
from 1986 to 2013. All records include key fields such as spe-
cies, date and location. As with many public online data-
bases, DOFbasen did not differentiate until 2012 between
complete bird lists (lists of all the species observed on each
visit) and incidental records of a subset of the species
observed (K�ery et al., 2010b; van Strien et al., 2013; Tulloch
et al., 2013b).
Observations recorded in DOFbasen were not distributed
randomly across Denmark (Fig. 1). However, records cov-
ered all parts of the country and areas with a larger number
of structured monitoring survey routes from the common
bird monitoring overlapped with areas of high DOFbasen
data density (Spearman’s rank correlation between the num-
ber of contributed DOFbasen records and the number of
common bird monitoring counts per 100 km2 area,
rS = 0.78; Fig. 1). It is therefore reasonable to assume that
trends derived from these unstructured data were as repre-
sentative of a well-covered country such as Denmark as the
structured monitoring data.
Population trend estimation
We compared population trends estimated from a standard-
ized population monitoring scheme (CBM) and from
unstructured observation data (DOFbasen) to assess the
extent to which trends estimated from the two data sources
matched. We estimated population trends for 103 species
breeding in Denmark (Table S1) over a 28-year period
(1986–2013) for which data were available from both data
sources. However, because the citizen science database was
launched only in 2002, we also estimated trends for a shorter
11-year period (2002–2013) corresponding to the period
after the launch of the database when observers could enter
contemporary records.
From the structured monitoring data, we estimated a pop-
ulation trend for each species using a generalized linear
mixed model with a Poisson error distribution and a random
‘route’ effect to account for spatial and habitat differences at
the route level. This approach is the standard analytical pro-
cedure for estimating trends from bird count data when no
ancillary data (e.g. distance to detected birds, continuous
covariates affecting detectability) or repeat visits are available
to account for imperfect detection (K�ery & Schaub, 2012;
Inger et al., 2014). We implemented the GLMM in R pack-
age ‘lme4’ for each species with the generic formula glmer
(Number ~ Year + (Year|Route_ID), family = ‘poisson’).
‘Year’ was fitted as a continuous covariate.
From the unstructured citizen science data, we first
extracted only breeding season records (May and June), cor-
responding to the recording period of the structured moni-
toring scheme. Every record in DOFbasen includes a location
Figure 1 Map of Denmark showing the distribution of
common bird monitoring census points used between 1986 and
2013 (black dots) and the distribution of records available from
the online database ‘DOFbasen’ until 2013 aggregated over a
grid of 10 9 10 km squares. Darker shading indicates higher
density of records. The quantity of data from each data source
per grid cell was positively correlated (rS = 0.78).
Diversity and Distributions, 1–12, ª 2016 John Wiley & Sons Ltd 3
Unstructured citizen science data for trend estimation

168 PhD thesis by Henning Heldbjerg
identifier, which served as our definition of a ‘site’ at which
observations of species were recorded, but these sites are not
of a defined size, which makes any abundance information
difficult to interpret. Every visit to a site that was entered
into the online database was treated as a ‘list’ of species, and
species that were not recorded on the list were assigned a
value of 0 (not observed or not reported). To estimate
population trends from the unstructured data, we used a
multi-year occupancy modelling framework to account for
imperfect detection or recording (van Strien et al., 2013;
Isaac et al., 2014). We used the detection/non-detection
information contained in contributed species lists and con-
sidered that two covariates influenced the probability of
detection: we included ‘month’ (May or June) as a covariate
because for some birds, the probability of detection can vary
over the course of the breeding season, and we included the
number of species recorded during that visit at that site, as
an indication of observer effort and quality (Franklin, 1999;
Roberts et al., 2007; Szabo et al., 2010).
We fitted occupancy models using Markov Chain Monte
Carlo (MCMC) methods in a Bayesian framework following
the approach described by Isaac et al. (2014), including a
random site effect to account for spatial differences. The
trend model component of the multi-year occupancy model
was therefore structurally similar to the trend GLMM used
for the structured monitoring data described above. For each
species, we ran three Markov chains each with 5000 itera-
tions and discarded the first 2500 iterations as burn-in. From
the remaining iterations we only used every second iteration
for inference. Convergence was tested using the Gelman-
Rubin diagnostic (Brooks & Gelman, 1998), and trend esti-
mates were retained only if this diagnostic indicated conver-
gence (R-hat < 1.02). We fitted all occupancy models in JAGS
3.3 (Plummer, 2012) via the R2JAGS package (Su & Yajima,
2012) called from R 3.1.1 (R Development Core Team,
2013).
Comparison of trends derived from structured and
unstructured data
We used Spearman’s rank correlation coefficient to assess
whether population trends derived from the unstructured
and the structured data across the 103 species were corre-
lated using a significance threshold of a = 0.05, and we per-
formed separate correlations for the long (1986–2013) and
the short (2002–2013) time series. Because the correlation
does not account for the uncertainty in trend estimates, we
also compared the direction of trend estimates between the
two data sources taking uncertainty into account. We first
classified trend direction as either increasing or decreasing if
the 95% confidence interval of the estimated population
growth rate was > 0 or < 0. Species for which the 95% confi-
dence interval of the estimated population growth rate
spanned 0 were considered to have stable or inconclusive
trends. We then cross-tabulated the trend directions from
both data sources and calculated the proportion of species
that had matching and non-matching trend directions for
the period 1986–2013 and 2002–2013.
Examining causes for mismatches in trend direction
Because the structured monitoring data have a higher infor-
mation content than the unstructured data (abundance vs.
detection/non-detection), and because the value of unstruc-
tured monitoring data may vary among species (van Strien
et al., 2013), we expected some discrepancies among trend
estimates and examined whether these were due to the infor-
mation content of the data or could be explained by species-
specific traits such as abundance and migratory strategy.
To examine the information content of data, we first
reduced the structured monitoring data to simple detection/
non-detection data and estimated trends using a similar
GLMM as described above but with a binomial rather than a
Poisson error structure, which is analogous to the trend
model used for the unstructured data. In a second step, we
aimed to increase the quality of the unstructured data by
retaining only selected records with high information con-
tent. We applied three hierarchical data filters to the unstruc-
tured data, discarded all records that did not meet these
filtering criteria and estimated trends from the data remain-
ing after each iteration.
The first filter was applied to the number of species
recorded during a site visit to increase the likelihood that a
list was complete and that the species missing from that list
could therefore be considered as not observed in data analy-
sis. We discarded all records that reported only a single spe-
cies during a visit to one site on one day, and considered the
remaining lists ‘complete’ if the number of species recorded
exceeded a threshold that was scaled to the total number of
species recorded at a given site to avoid bias due to spatial
effects of species richness (K�ery et al., 2010a). We explored
three different thresholds, considering lists as ‘complete’ if
the number of recorded species exceeded 5%, 10% or 25%
of the cumulative total number of all species ever recorded
at a particular site. We explored higher thresholds, but
because the number of records that reported > 25% of all
known species at a site was very small, it was rarely possible
to estimate trends when a higher threshold was chosen.
The second data filtering step considered the number of
reported visits to a given site during May and June in
one year. Repeat visits during a period of demographic clo-
sure are necessary to account for imperfect detection in an
occupancy modelling framework. The probability of observ-
ing a species increases with the number of visits to a site,
and we therefore used thresholds of 3, 5 and 10 visits during
the breeding season to include sites in the estimation of
occupancy. We eliminated sites that had less than the various
thresholds of site visits on the subset of ‘complete’ lists based
on the criteria described in the first filtering step above. The
third and final data filtering step considered the number of
years during which sites were covered with a sufficient num-
ber of visits meeting the criteria for ‘complete’ lists (Roy
4 Diversity and Distributions, 1–12, ª 2016 John Wiley & Sons Ltd
J. Kamp et al.

169PhD thesis by Henning Heldbjerg
et al., 2012; Isaac et al., 2014). Trend estimation is generally
more reliable if the same sites are monitored over a longer
period of time. We therefore eliminated sites if they had vis-
its with ‘complete’ lists for < 3, < 5 or < 10 years. These dif-
ferent data filtering rules resulted in a total of 27
combinations (3 thresholds for list length, 3 thresholds for
number of visits and 3 thresholds for number of years) of
selected data for estimating annual occupancy and popula-
tion trend for all our target species. For the estimation of
trends from 2002 to 2013, we omitted the data filtering step
that mandated sites with at least 10 years of monitoring data,
because the monitoring interval included only 11 years and
very few sites matched this criterion.
Besides the information content of the data, we also exam-
ined species-specific biological traits that explained statistical
variation in the mismatches between population trend esti-
mates derived from structured and unstructured data. We
used the cross-tabulation of matching and non-matching
trend estimates over the period 1986–2013 described above
and linked this response (match/mismatch) to five explana-
tory variables: male body mass (as a proxy for body size),
national population size in Denmark, breeding system (colo-
nial, semi-colonial and territorial), habitat preference (mar-
ine, coastal, inland wetland, boreal and temperate forests,
farmland and grassland, habitat generalists) and migration
strategy (resident, partial migrant, migrant within Europe,
short-distance migrant to North Africa or the Middle East,
long-distance migrant to sub-Saharan Africa or Asia). We
extracted body mass data, migration strategy and habitat
preferences from standard references (Glutz von Blotzheim,
1985–1998; Tucker & Evans, 1997; Snow & Perrins, 1998).
Population size was calculated as the geometric mean of the
minimum and maximum population estimates for Denmark
(BirdLife International, 2004).
We used a machine-learning algorithm based on ensem-
bles of regression trees (RandomForest) to evaluate which of
these five variables explained the most variation in mis-
matching trend estimates (Cutler et al., 2007; Hochachka
et al., 2007).We used a random forest procedure with unbi-
ased classification trees based on a conditional inference
framework (package ‘party’ in R 3.1.1; Hothorn et al., 2006)
that allows to account for bias in variable importance mea-
sures among categorical variables with different numbers of
levels (Strobl et al., 2007; Boulesteix et al., 2012). We con-
structed 1500 classification trees and used a random subset
of 64% of the data without replacement to build single trees.
We report the relative variable importance as the decrease in
model accuracy after permutation scaled to 100% for the
most important variable. The accuracy of the random forest
model was assessed with a simple confusion matrix of the
predicted and actual trend estimate matches.
RESULTS
Based on the structured monitoring for the full 28 years, 60
species showed significant long-term declines in abundance,
26 species increased significantly and the remaining 17 spe-
cies showed either stable or fluctuating populations without
a significantly positive or negative trend (Table 1). For the
shorter time period (2002–2013), 48 species declined signifi-
cantly, 25 species increased significantly and 30 were stable
or the trend estimate was too imprecise to assign the trend
as increasing or decreasing (Table S2). By contrast, the
unstructured data identified only 20 species as declining over
28 years (19 species over 11 years), 49 species as increasing
(48 over 11 years) and 34 species (35 over 11 years) that
were either stable or where the trend estimate was too
imprecise (Tables 1 & S2).
There was a general positive correlation between popula-
tion trends estimated from structured and unstructured data
sources (Table 2, Fig. 2). However, despite the positive cor-
relation between trends derived from structured and unstruc-
tured data, the direction of trend estimates matched for
< 50% of species when taking the uncertainty in trend esti-
mates into account (Table 1). The majority of species that
were in decline based on the structured monitoring were
estimated to have a stable or increasing population trend in
the unstructured data (Table 1). Conversely, population
declines estimated from unstructured data were largely con-
firmed by the structured monitoring (Table 1).
Reducing the information content of the structured moni-
toring data to estimate trends in occupancy rather than
abundance did not increase the strength of the trend correla-
tion (Table 2, Fig. 2) or the proportion of matching trend
directions between structured and unstructured data
(Tables 1 & S2 for 2002–2013). Similarly, filtering the
unstructured data to retain only data with higher informa-
tion content did not improve the strength of the correlation;
increasingly strict filters led to poorer correlations (Table 2).
By contrast, trends in occupancy and abundance derived
from the structured monitoring data were strongly correlated
(rS = 0.87, Fig. S2), and the trend direction matched for
82.5% of all species (Table S3).
The three most important variables explaining the mis-
match of trend estimates between the structured monitoring
and unstructured citizen science data were population size,
body size and habitat preference (classification success of
random forest model = 84.2%). Trend estimates did not
match at all for very abundant species (blackbird Turdus
merula, chaffinch Fringilla coelebs and skylark Alauda arven-
sis, all with population sizes > 1 million birds) and matched
poorly for relatively small birds, especially in forest and
inland wetland habitats (Fig. 3). When the structured moni-
toring data were reduced to detection/non-detection data,
mismatches in trend direction were almost exclusively
explained by male body size (classification success = 80.3%),
with birds below 500 g body size having generally poorly
matching trends, while trend estimates matched well for
birds > 500 g. In both analyses, migration strategy and
breeding system had no influence on the extent to which
trends from the two data sources matched (both < 5% rela-
tive variable importance).
Diversity and Distributions, 1–12, ª 2016 John Wiley & Sons Ltd 5
Unstructured citizen science data for trend estimation

170 PhD thesis by Henning Heldbjerg
DISCUSSION
Population trends estimated from structured and unstruc-
tured data were generally positively correlated, but there was
substantial variation among species, and the declines of many
common species were not detected with unstructured citizen
science data. This pattern was evident regardless of whether
we used the abundance information in the structured
monitoring data or reduced these data to simple detection/
non-detection data. We therefore conclude that structured
monitoring programmes are more powerful to detect popula-
tion declines than unstructured citizen science data.
Many common European bird species are declining (San-
derson et al., 2006; Inger et al., 2014), and range retractions
are also common (Balmer et al., 2014). However, more than
half of the species that showed significant long-term popula-
tion declines in both abundance and occupancy based on
our structured monitoring data were classified as either
stable or even increasing by the unstructured data (Table 1).
This discrepancy indicates that caution is needed when using
unstructured data for estimating population trends, and that
unstructured citizen science data cannot generally replace
standardized monitoring schemes. While this mismatch may
be explained by factors such as the reporting of complete
lists which may not apply to all online databases, we caution
that unstructured citizen science data may not fulfil one of
the most critical functions of structured monitoring pro-
grammes, namely to act as an early warning system that
detects population declines, especially of common and wide-
spread species (Inger et al., 2014).
The structured monitoring data yielded similar numbers
of species declining, increasing or with stable or inconclusive
trend regardless of whether we used abundance data or
reduced the information content to use just detection/non-
detection data. The mismatching trends derived from struc-
tured monitoring data and unstructured citizen science data
are therefore not due to the inherently lower information
content of unstructured data. Furthermore, our filtering to
extract only records with the highest information content
from the unstructured citizen science data did not improve
the correlation between trend estimates. Stricter filter criteria
led to a rapid decline in the amount of data that passed the
filter, and trend estimates resulting from these smaller data
sets were generally less reliable. Appropriate modelling of the
various sources of bias in citizen science data may therefore
be the best strategy to derive the most reliable trend infor-
mation (van Strien et al., 2013; Isaac et al., 2014), but this
information is nonetheless inferior to the power of standard-
ized monitoring programmes in detecting species declines.
In situations where structured monitoring is not feasible
or too costly, online databases might constitute the only data
sources available. While such data can be informative, their
value for trend monitoring could be improved by informing
contributors about deficiencies (Sullivan et al., 2014). For
example, in our data set, the number of visits to sites every
year was highly skewed, with some sites receiving > 500 visits
per year, and others only single visits. Encouraging recorders
to repeatedly contribute data from rarely visited areas might
increase the suitability of data for trend analyses using rec-
ommended methods that account for imperfect detection
(van Strien et al., 2013; Isaac et al., 2014; Isaac & Pocock,
2015). The skewed distribution of visits is likely a result of
casual observers frequenting easily accessible, well-known
and ‘interesting’ sites (e.g. sites with high diversity or rare
species, Tulloch & Szabo, 2012; Tulloch et al., 2013a). One
solution to this problem could be to survey regions and
habitats that are neglected by casual observers with profes-
sional observers (Tulloch et al., 2013a), an approach used
during fieldwork of the recent UK breeding bird atlas (Bal-
mer et al., 2014). There are many other approaches for entic-
ing ‘citizen scientists’ to provide data that are of higher
information content, but the effort required to do this may
be better spent on designing a structured monitoring scheme
and recruiting observers to participate in this scheme (Isaac
& Pocock, 2015). After all, the structured monitoring data
we analysed here were also collected by volunteer ‘citizen sci-
entists’, who follow a certain set of standard protocols which
renders trend estimation and inference more reliable.
Table 1 Number of species with matching and non-matching population trend directions for 103 bird species between 1986 and 2013
in Denmark derived from an unstructured observation database and a structured monitoring scheme using either original abundance
data or simple detection/non-detection data (occupancy)
Unstructured data
Decreasing Stable/inconclusive Increasing
Structured monitoring Abundance Decreasing 16 23 21
Stable/inconclusive 4 7 6
Increasing 0 4 22
Occupancy Decreasing 18 25 24
Stable/inconclusive 2 4 1
Increasing 0 5 24
Trends were considered increasing or decreasing if the 95% confidence interval of the population growth rate estimate was > 0 or < 0, respec-
tively, and stable or inconclusive if the interval spanned 0.
6 Diversity and Distributions, 1–12, ª 2016 John Wiley & Sons Ltd
J. Kamp et al.

171PhD thesis by Henning Heldbjerg
The most important biological variables explaining mis-
matching population trend estimates were population size
for the abundance data and body mass for occupancy. Abun-
dance trends estimated for extremely common and wide-
spread species matched very poorly between the structured
and unstructured data, which may be a consequence of the
unstructured data yielding only information about occur-
rence: very common species may experience declines in
abundance before completely disappearing from certain
areas, and the unstructured data may therefore not be ideal
to detect the declines of common species which are currently
occurring across Europe (Inger et al., 2014). When we
reduced the structured monitoring data to occurrence data,
the mismatches persisted but were better explained by male
body size, indicating that trends of mostly small birds are
very poorly captured by the unstructured citizen science
data.
Another potential explanation for differences in trend esti-
mates could be that the different analytical approaches used
for both data sources account for variable amounts of uncer-
tainty. In particular, imperfect detection is a well-known
problem for the monitoring of wild animals (Royle &
Nichols, 2003; K�ery et al., 2009). We used occupancy mod-
elling to correct for varying detection probability in the
unstructured data, but we could not apply this method to
the structured monitoring data as neither repeated visits nor
ancillary data were available from our CBM programme, as
is the case for a large number of standardized monitoring
programmes (Schmeller et al., 2012). While our method of
trend estimation incorporates some uncertainty associated
with spatial heterogeneity, the inability to account for imper-
fect detection may introduce bias into the structured moni-
toring data if detection probability changes systematically
over time (K�ery et al., 2010b).
Table 2 Correlation (Spearman’s rank correlation coefficient rS) between population trend estimates for 103 bird species derived from a
structured monitoring scheme and an unstructured observation database filtered by certain criteria over a 28-year period (1986–2013)and an 11-year period (2002–2013) in Denmark
Proportional list length n visits n years
Abundance Occupancy
rS (28 years) rS (11 years) rS (28 years) rS (11 years)
Unfiltered data 0.600 0.491 0.625 0.501
0.25 10 10 0.147 0.175
5 0.327 0.184 0.376 0.199
3 0.355 0.185 0.412 0.202
5 10 0.353 0.346
5 0.314 0.197 0.374 0.121
3 0.358 0.179 0.432 0.212
3 10 0.363 0.350
5 0.402 0.246 0.459 0.259
3 0.408 0.357 0.467 0.374
0.1 10 10 0.475 0.484
5 0.357 0.191 0.405 0.171
3 0.388 0.222 0.444 0.211
5 10 0.413 0.463
5 0.424 0.416 0.515 0.353
3 0.437 0.438 0.510 0.394
3 10 0.464 0.541
5 0.485 0.479 0.550 0.463
3 0.501 0.491 0.574 0.482
0.05 10 10 0.384 0.444
5 0.390 0.348 0.469 0.336
3 0.409 0.359 0.479 0.355
5 10 0.470 0.545
5 0.485 0.435 0.537 0.419
3 0.469 0.426 0.528 0.426
3 10 0.517 0.570
5 0.503 0.465 0.567 0.434
3 0.498 0.453 0.548 0.438
Data from the structured monitoring were either used as counts (abundance) or reduced to detection/non-detection (occupancy). Filters were
applied in a hierarchical fashion based on the number of species recorded during each visit (as proportion of the total species number ever
recorded at a given site, prop. list length), the number of visits with ‘complete’ lists in a given year, and the number of years with sufficient visits
with ‘complete’ lists. Strongest correlations are highlighted in bold.
Diversity and Distributions, 1–12, ª 2016 John Wiley & Sons Ltd 7
Unstructured citizen science data for trend estimation
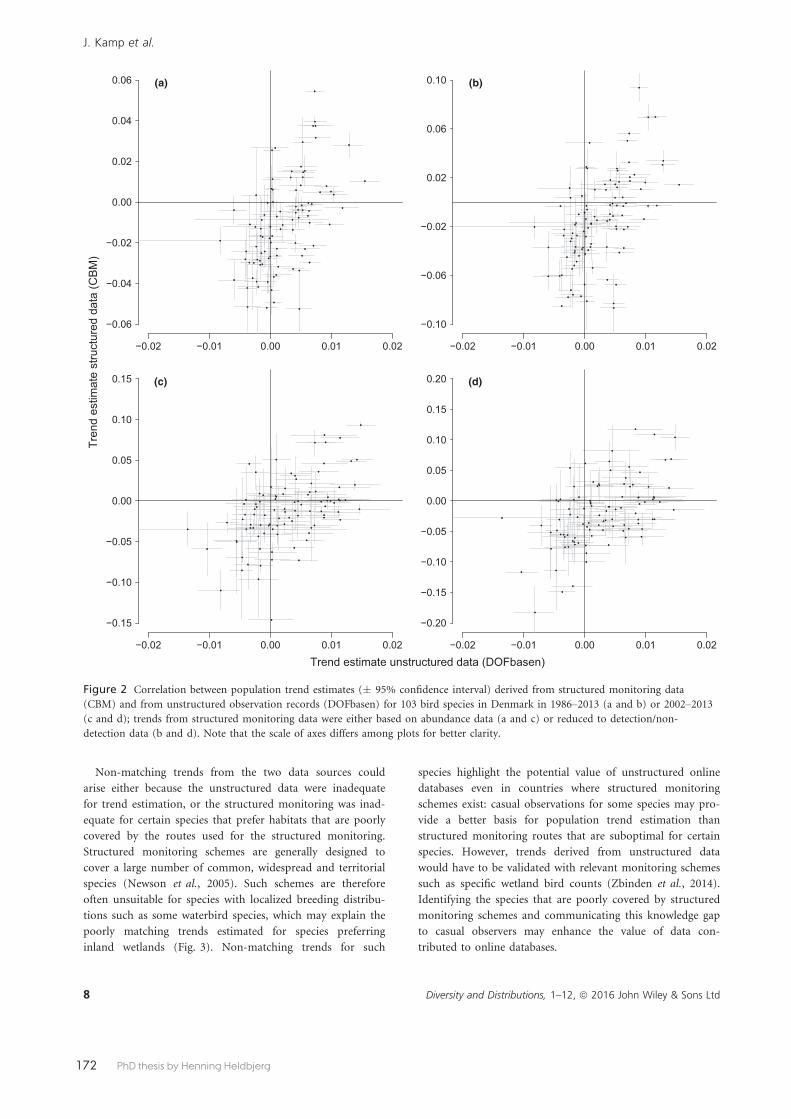
172 PhD thesis by Henning Heldbjerg
Non-matching trends from the two data sources could
arise either because the unstructured data were inadequate
for trend estimation, or the structured monitoring was inad-
equate for certain species that prefer habitats that are poorly
covered by the routes used for the structured monitoring.
Structured monitoring schemes are generally designed to
cover a large number of common, widespread and territorial
species (Newson et al., 2005). Such schemes are therefore
often unsuitable for species with localized breeding distribu-
tions such as some waterbird species, which may explain the
poorly matching trends estimated for species preferring
inland wetlands (Fig. 3). Non-matching trends for such
species highlight the potential value of unstructured online
databases even in countries where structured monitoring
schemes exist: casual observations for some species may pro-
vide a better basis for population trend estimation than
structured monitoring routes that are suboptimal for certain
species. However, trends derived from unstructured data
would have to be validated with relevant monitoring schemes
such as specific wetland bird counts (Zbinden et al., 2014).
Identifying the species that are poorly covered by structured
monitoring schemes and communicating this knowledge gap
to casual observers may enhance the value of data con-
tributed to online databases.
−0.02 −0.01 0.00 0.01 0.02
−0.06
−0.04
−0.02
0.00
0.02
0.04
0.06 (a)
−0.02 −0.01 0.00 0.01 0.02
−0.10
−0.06
−0.02
0.02
0.06
0.10 (b)
−0.02 −0.01 0.00 0.01 0.02
−0.15
−0.10
−0.05
0.00
0.05
0.10
0.15 (c)
−0.02 −0.01 0.00 0.01 0.02
−0.20
−0.15
−0.10
−0.05
0.00
0.05
0.10
0.15
0.20 (d)
Trend estimate unstructured data (DOFbasen)
Tren
d es
timat
e st
ruct
ured
dat
a (C
BM)
Figure 2 Correlation between population trend estimates (� 95% confidence interval) derived from structured monitoring data
(CBM) and from unstructured observation records (DOFbasen) for 103 bird species in Denmark in 1986–2013 (a and b) or 2002–2013(c and d); trends from structured monitoring data were either based on abundance data (a and c) or reduced to detection/non-
detection data (b and d). Note that the scale of axes differs among plots for better clarity.
8 Diversity and Distributions, 1–12, ª 2016 John Wiley & Sons Ltd
J. Kamp et al.

173PhD thesis by Henning Heldbjerg
Population size (thousand)0 50 100 150 200 250 300 350 400 450 500
0.0
0.2
0.4
0.6
0.8
1.0 (a)
Male body mass (g)0 500 1000 1500 2000 2500 3000 3500 4000 4500 5000
0.0
0.2
0.4
0.6
0.8
1.0 (b)
Fore
st
Coa
stal
Farm
/gra
ssla
nd
Gen
eral
ists
Inla
nd w
etla
nd
Mar
ine
0.0
0.2
0.4
0.6
0.8
1.0 (c)
Pred
icte
d pr
opor
tion
of m
atch
ing
trend
s
Figure 3 Predicted proportion of matching population trend estimates (� 1 standard deviation) derived from structured monitoring
data and from unstructured citizen science data for 103 bird species depending on (a) their total population size in Denmark, (b) their
body size measured as male body mass (in g) and (c) their preferred habitat. Predictions are based on a conditional random forest
model classifying trend matches.
Diversity and Distributions, 1–12, ª 2016 John Wiley & Sons Ltd 9
Unstructured citizen science data for trend estimation

174 PhD thesis by Henning Heldbjerg
Further important causes of non-matching trends between
structured and unstructured data are changes in reporting
behaviour or the observer community over time (Sn€all et al.,
2011). We found positive trends for several common species
in the unstructured data, which declined according to the
structured monitoring data. There are two potential explana-
tions for this pattern: (1) the initial contributors to an online
reporting scheme are likely to be experienced birdwatchers,
who may tend to record mostly those species they consider
‘interesting’ (Isaac & Pocock, 2015). As a scheme becomes
more publicized and widely known, an increasing number of
citizens might join who may record also more common and
widespread birds (Fig. S1). Our finding that trends did not
match for the most common and smallest species is consis-
tent with such an interpretation. (2) In addition to the
change in the reporting community, declines of species
revealed by structured monitoring schemes might be publi-
cized and lead to a higher awareness among birdwatchers,
resulting in changes in reporting behaviour and more con-
tributed records of formerly common and underreported
species (Sn€all et al., 2011). Examples in our data that are
consistent with such explanations include the House Sparrow
(Passer domesticus; widespread, heavily publicized declines of
a familiar urban bird, Hole et al., 2002; De Laet & Summers-
Smith, 2007) and the Willow Warbler (Phylloscopus trochilus;
flagship species for a suite of declining long-distance
migrants, Morrison et al., 2010). The best solution to tackle
reporting bias is to offer recorders the possibility to submit
‘complete’ checklists, that is lists that contain all species
recorded and allow inference about species that were not
detected (Sullivan et al., 2009; K�ery et al., 2010a; van Strien
et al., 2013). This feature, which was absent from the Danish
online database when we conducted our analysis, has in the
meantime been launched in Denmark and other online data-
bases and is considered a standard solution to address some
of the biases inherent in citizen science data (Isaac & Pocock,
2015).
CONCLUSIONS
Our analyses suggest that citizen science data collected using
unstructured methods may be useful for biodiversity monitor-
ing for species or in areas where dedicated, structured survey
data are not available, but that various sources of bias need to
be considered in the interpretation of population trend esti-
mates. We recommend retaining all data for analysis and
encouraging database managers to distinguish between the
reporting of complete and incomplete lists. We suggest that in
countries currently without dedicated monitoring systems,
encouraging observers to submit records to online databases
could make a useful contribution to the monitoring of biodi-
versity. In countries where structured monitoring data are
available, unstructured databases may play a useful role in
public education and monitoring of areas or species that can-
not be covered with a structured approach. However, our
results warn against abandoning existing structured
monitoring schemes in the hope that unstructured data con-
tributed by volunteers would be able to fulfil the same pur-
pose with the same power and precision.
ACKNOWLEDGEMENTS
We want to thank all field observers who spent considerable
time and effort to enter their observations into DOFbasen, as
well as all volunteers participating in the Danish Common
Bird Census scheme. We appreciate the support and advice
of Marc K�ery, Nick Isaac, Tom August, Arco van Strien and
Adam Butler in implementing multi-year occupancy models.
Ian Fisher assisted with processing DOFbasen data. The com-
ments of Alison Johnston, Wesley Hochachka, Mark Eaton,
Dana€e Sheehan, Richard Gregory, Graeme Buchanan, Alison
Beresford, Rob Robinson, Boris Schr€oder and an anonymous
reviewer improved the manuscript considerably. The Euro-
pean Commission is acknowledged for financial support as
part of the EuroGEOSS project (Grant Agreement 226487).
REFERENCES
Balmer, D., Gillings, S., Caffrey, B., Swann, B., Downie, I. &
Fuller, R. (2014) Bird Atlas 2007–11: the breeding and win-
tering birds of Britain and Ireland. HarperCollins, Glasgow,
UK..
BirdLife International (2004) Birds in Europe: population esti-
mates, trends and conservation status. BirdLife International,
Cambridge.
Boakes, E.H., McGowan, P.J.K., Fuller, R.A., Chang-qing, D.,
Clark, N.E., O’Connor, K. & Mace, G.M. (2010) Distorted
views of biodiversity: spatial and temporal bias in species
occurrence data. PLoS Biology, 8, e1000385.
Boulesteix, A.L., Janitza, S., Kruppa, J. & K€onig, I.R. (2012)
Overview of random forest methodology and practical guid-
ance with emphasis on computational biology and bioinfor-
matics. Technical Report 129, pp. 1–31. Department of
Statistics, University of Munich, Munich, Germany.
Brooks, S.P. & Gelman, A. (1998) General methods for mon-
itoring convergence of iterative simulations. Journal of
Computational and Graphical Statistics, 7, 434–455.Cutler, D.R., Edwards, T.C. Jr, Beard, K.H., Cutler, A., Hess,
K.T., Gibson, J. & Lawler, J.J. (2007) Random forests for
classification in ecology. Ecology, 88, 2783–2792.De Laet, J. & Summers-Smith, J. (2007) The status of the
urban house sparrow Passer domesticus in north-western
Europe: a review. Journal of Ornithology, 148, 275–278.Devictor, V., Whittaker, R.J. & Beltrame, C. (2010) Beyond
scarcity: citizen science programmes as useful tools for
conservation biogeography. Diversity and Distributions, 16,
354–362.Dickinson, J., Zuckerberg, B. & Bonter, D.N. (2010) Citizen
science as an ecological research tool: challenges and bene-
fits. Annual Review of Ecology, Evolution, and Systematics,
41, 149–172.
10 Diversity and Distributions, 1–12, ª 2016 John Wiley & Sons Ltd
J. Kamp et al.
175PhD thesis by Henning Heldbjerg
Franklin, D.C. (1999) Evidence of disarray amongst granivo-
rous bird assemblages in the savannas of northern Aus-
tralia, a region of sparse human settlement. Biological
Conservation, 90, 53–68.Glutz von Blotzheim, U.N. ed. (1985–1998). Handbuch der
V€ogel Mitteleuropas. Aula, Wiesbaden.
Greenwood, J.J.D. (2003) The monitoring of British breeding
birds: a success story for conservation science? Science of
the Total Environment, 310, 221–230.Gregory, R.D., Gibbons, D.W. & Donald, P.F. (2004) Bird
census and survey techniques. Bird ecology and conserva-
tion: a handbook of techniques (ed. by W.J. Sutherland, I.
Newton and R.E. Green), pp. 17–55. Cambridge University
Press, Cambridge, UK.
Heldbjerg, H., Brandtberg, N. & Jørgensen, M.F. (2014)
Overv�agning af de almindelige fuglearter i Danmark 1975-
2013. �Arsrapport for Punkttællingsprogrammet. Dansk
Ornitologisk Forening, Copenhagen.
Hochachka, W.M., Caruana, R., Fink, D., Munson, A.R.T.,
Riedewald, M., Sorokina, D. & Kelling, S. (2007) Data-
mining discovery of pattern and process in ecological sys-
tems. Journal of Wildlife Management, 71, 2427–2437.Hochachka, W.M., Fink, D., Hutchinson, R.A., Sheldon, D.,
Wong, W.-K. & Kelling, S. (2012) Data-intensive science
applied to broad-scale citizen science. Trends in Ecology
and Evolution, 27, 130–137.Hole, D.G., Whittingham, M.J., Bradbury, R.B., Anderson,
G.Q., Lee, P.L., Wilson, J.D. & Krebs, J.R. (2002) Wide-
spread local house-sparrow extinctions. Nature, 418, 931–932.
Hothorn, T., Hornik, K. & Zeileis, A. (2006) party: A Labora-
tory for Recursive Part(y)itioning. Available at: http://
CRAN.R-project.org/ (accessed 13 December 2014).
Inger, R., Gregory, R., Duffy, J.P., Stott, I., Vo�r�ı�sek, P. &
Gaston, K.J. (2014) Common European birds are declining
rapidly while less abundant species’ numbers are rising.
Ecology Letters, 18, 28–36.Isaac, N.J.B. & Pocock, M.J.O. (2015) Bias and information
in biological records. Biological Journal of the Linnean Soci-
ety, 115, 522–531.Isaac, N.J.B., van Strien, A.J., August, T.A., de Zeeuw, M.P.
& Roy, D.B. (2014) Statistics for citizen science: extracting
signals of change from noisy ecological data. Methods in
Ecology and Evolution, 5, 1052–1060.Johnston, A., Fink, D., Reynolds, M.D., Hochachka, W.M.,
Sullivan, B.L., Bruns, N.E., Hallstein, E., Merrifield, M.S.,
Matsumoto, S. & Kelling, S. (2015) Abundance models
improve spatial and temporal prioritization of conservation
resources. Ecological Applications, 25, 1749–1756.K�ery, M. & Schaub, M. (2012) Bayesian population analysis
using WinBUGS: a hierarchical perspective. Academic Press,
Oxford, UK.
K�ery, M., Dorazio, R.M., Soldaat, L., van Strien, A., Zuider-
wijk, A. & Royle, J.A. (2009) Trend estimation in popula-
tions with imperfect detection. Journal of Applied Ecology,
46, 1163–1172.
K�ery, M., Gardner, B. & Monnerat, C. (2010a) Predicting
species distributions from checklist data using site-occu-
pancy models. Journal of Biogeography, 37, 1851–1862.K�ery, M., Royle, J.A., Schmid, H., Schaub, M., Volet, B.,
Hafliger, G. & Zbinden, N. (2010b) Site-occupancy distri-
bution modeling to correct population-trend estimates
derived from opportunistic observations. Conservation Biol-
ogy, 24, 1388–1397.Kindberg, J., Ericsson, G. & Swenson, J.E. (2009) Monitoring
rare or elusive large mammals using effort-corrected volun-
tary observers. Biological Conservation, 142, 159–165.Lin, Y.-P., Deng, D., Lin, W.-C., Lemmens, R., Crossman,
N.D., Henle, K. & Schmeller, D.S. (2015) Uncertainty anal-
ysis of crowd-sourced and professionally collected field
data used in species distribution models of Taiwanese
moths. Biological Conservation, 181, 102–110.Morrison, C.A., Robinson, R.A., Clark, J.A. & Gill, J.A.
(2010) Spatial and temporal variation in population trends
in a long-distance migratory bird. Diversity and Distribu-
tions, 16, 620–627.Newson, S.E., Woodburn, R.J., Noble, D.G., Baillie, S.R. &
Gregory, R.D. (2005) Evaluating the Breeding Bird Survey
for producing national population size and density esti-
mates. Bird Study, 52, 42–54.Nyegaard, T., Heldbjerg, H. & Brølling, S. (2012) DOFbasen
10 years. Bird Census News, 25, 13–16.Plummer, M. (2012) JAGS version 3.3.0. Available at:
http://sourceforge.net/projects/mcmc-jags/files/Manuals/
(accessed 12 August 2013).
R Development Core Team (2013) R: a language and envi-
ronment for statistical computing. R Foundation for Statisti-
cal Computing, Vienna, Austria. http://cran.r-project.org/.
Roberts, R.L., Donald, P.F. & Green, R.E. (2007) Using sim-
ple species lists to monitor trends in animal populations:
new methods and a comparison with independent data.
Animal Conservation, 10, 332–339.Roy, H.E., Adriaens, T., Isaac, N.J., Kenis, M., Onkelinx, T.,
Martin, G.S., Brown, P.M., Hautier, L., Poland, R. & Roy,
D.B. (2012) Invasive alien predator causes rapid declines of
native European ladybirds. Diversity and Distributions, 18,
717–725.Royle, J.A. & Nichols, J.D. (2003) Estimating abundance
from repeated presence-absence data or point counts. Ecol-
ogy, 84, 777–790.Sanderson, F.J., Donald, P.F., Pain, D.J., Burfield, I.J. & van
Bommel, F.P.J. (2006) Long-term population declines in
Afro-Palaearctic migrant birds. Biological Conservation, 131,
93–105.Schmeller, D.S., Henry, P.-Y., Julliard, R., Gruber, B., Clobert,
J., Dziock, F., Lengyel, S., Nowicki, P., Deri, E. & Budrys, E.
(2009) Advantages of volunteer-based biodiversity monitor-
ing in Europe. Conservation Biology, 23, 307–316.Schmeller, D., Henle, K., Loyau, A., Besnard, A. & Henry,
P.-Y. (2012) Bird-monitoring in Europe – a first overview
of practices, motivations and aims. Nature Conservation, 2,
41–57.
Diversity and Distributions, 1–12, ª 2016 John Wiley & Sons Ltd 11
Unstructured citizen science data for trend estimation
176 PhD thesis by Henning Heldbjerg
Sn€all, T., Kindvall, O., Nilsson, J. & Part, T. (2011) Evaluat-
ing citizen-based presence data for bird monitoring. Biolog-
ical Conservation, 144, 804–810.Snow, D. & Perrins, C. (1998) The birds of the western
palearctic: concise edition. Oxford University Press, Oxford.
van Strien, A.J., Termaat, T., Groenendijk, D., Mensing, V. &
K�ery, M. (2010) Site-occupancy models may offer new
opportunities for dragonfly monitoring based on daily spe-
cies lists. Basic and Applied Ecology, 11, 495–503.van Strien, A.J., van Swaay, C.A.M. & Termaat, T. (2013)
Opportunistic citizen science data of animal species produce
reliable estimates of distribution trends if analysed with occu-
pancy models. Journal of Applied Ecology, 50, 1450–1458.Strobl, C., Boulesteix, A.-L., Zeileis, A. & Hothorn, T. (2007)
Bias in random forest variable importance measures: illus-
trations, sources and a solution. BMC Bioinformatics, 8,
25–45.Su, Y.-S. & Yajima, M. (2012) R2jags: A package for running
jags from R. version 0.03-08. Available at: http://CRAN.R-
project.org/package=R2jags (accessed 12 August 2013).
Sullivan, B.L., Wood, C.L., Iliff, M.J., Bonney, R.E., Fink, D.
& Kelling, S. (2009) eBird: a citizen-based bird observation
network in the biological sciences. Biological Conservation,
142, 2282–2292.Sullivan, B.L., Aycrigg, J.L., Barry, J.H. et al. (2014) The
eBird enterprise: an integrated approach to development
and application of citizen science. Biological Conservation,
169, 31–40.Szabo, J.K., Vesk, P.A., Baxter, P.W.J. & Possingham, H.P.
(2010) Regional avian species declines estimated from vol-
unteer-collected long-term data using List Length Analysis.
Ecological Applications, 20, 2157–2169.Szabo, J.K., Fuller, R.A. & Possingham, H.P. (2012) A com-
parison of estimates of relative abundance from a weakly
structured mass-participation bird atlas survey and a
robustly designed monitoring scheme. Ibis, 154, 468–479.Theobald, E.J., Ettinger, A.K., Burgess, H.K., DeBey, L.B.,
Schmidt, N.R., Froehlich, H.E., Wagner, C., HilleRisLam-
bers, J., Tewksbury, J., Harsch, M.A. & Parrish, J.K. (2015)
Global change and local solutions: tapping the unrealized
potential of citizen science for biodiversity research. Biolog-
ical Conservation, 181, 236–244.Tucker, G.M. & Evans, M.I. (1997) Habitats for birds in Eur-
ope: a conservation strategy for the wider environment. Bird-
Life International, Cambridge, UK.
Tulloch, A.I. & Szabo, J.K. (2012) A behavioural ecology
approach to understand volunteer surveying for citizen
science datasets. Emu, 112, 313–325.Tulloch, A.I., Mustin, K., Possingham, H.P., Szabo, J.K. &
Wilson, K.A. (2013a) To boldly go where no volunteer has
gone before: predicting volunteer activity to prioritize
surveys at the landscape scale. Diversity and Distributions,
19, 465–480.Tulloch, A.I., Possingham, H.P., Joseph, L.N., Szabo, J. &
Martin, T.G. (2013b) Realising the full potential of citizen
science monitoring programs. Biological Conservation, 165,
128–138.Zbinden, N., K�ery, M., H€afliger, G., Schmid, H. & Keller, V.
(2014) A resampling-based method for effort correction in
abundance trend analyses from opportunistic biological
records. Bird Study, 61, 506–517.
SUPPORTING INFORMATION
Additional Supporting Information may be found in the
online version of this article:
Figure S1 Number of records in DOFbasen from 1986 to
2013.
Figure S2 Correlation between population trends from occu-
pancy and abundance data.
Table S1 List of all species and trend estimates derived from
structured and unstructured monitoring data.
Table S2 Number of species with matching population
trends between 2002 and 2013.
Table S3 Number of species with matching population
trends derived from structured occupancy and abundance
data.
BIOSKETCH
Johannes Kamp, Steffen Oppel and Paul Donald are
conservation scientists at the University of M€unster and the
RSPB Centre for Conservation Science. Their work focuses
on monitoring populations of threatened species, identifying
causes for decline and developing conservation solutions.
Henning Heldbjerg and Timme Nyegaard are conserva-
tion scientists coordinating citizen science based monitoring
of bird populations as well as identifying and communicating
causes for population changes.
Author contributions: J.K. and P.D. conceived the idea and
coordinated the project. H.H. and T.N. coordinated surveys
and accumulated and managed the data. S.O. analysed the
data. J.K. and S.O. wrote the manuscript, and all authors
contributed to the text.
Editor: Boris Schr€oder
12 Diversity and Distributions, 1–12, ª 2016 John Wiley & Sons Ltd
J. Kamp et al.

177PhD thesis by Henning Heldbjerg

178 PhD thesis by Henning Heldbjerg

179PhD thesis by Henning Heldbjerg
Hir
undo
rust
ica
Phoe
nicu
rus o
chru
ros
Dry
ocop
us m
artiu
s
Turd
us m
erul
a
Sylv
ia a
tric
apill
a
Laru
s rid
ibun
dus
Paru
s cae
rule
us
Pyrr
hula
pyr
rhul
a
Bute
o bu
teo
Cor
vus c
oron
e
Frin
gilla
coe
lebs
Phyl
losc
opus
col
lybi
ta
Paru
s ate
r
Stre
ptop
elia
dec
aoct
o
Fulic
a at
ra
Phal
acro
cora
x ca
rbo
Mili
aria
cal
andr
a
Paru
s cri
statu
s
Loxi
a cu
rvir
ostra
Cuc
ulus
can
orus

180 PhD thesis by Henning Heldbjerg
Num
eniu
s arq
uata
Dry
ocop
us m
artiu
s
Som
ater
ia m
ollis
sim
a
Turd
us p
ilari
s
Sylv
ia b
orin
Regu
lus r
egul
us
Car
duel
is c
ardu
elis
Locu
stel
la n
aevi
a
Laru
s mar
inus
Podi
ceps
cri
stat
us
Den
droc
opos
maj
or
Paru
s maj
or
Picu
s vir
idis
Car
duel
is c
hlor
is
Arde
a ci
nere
a
Perd
ix p
erdi
x
Anse
r ans
er
Coc
coth
raus
tes
cocc
othr
aust
es
Laru
s arg
enta
tus
Del
icho
n ur
bicu
m
Pass
er d
omes
ticus
Hip
pola
is ic
teri
na
Cor
vus m
oned
ula
Gar
rulu
s gla
ndar
ius
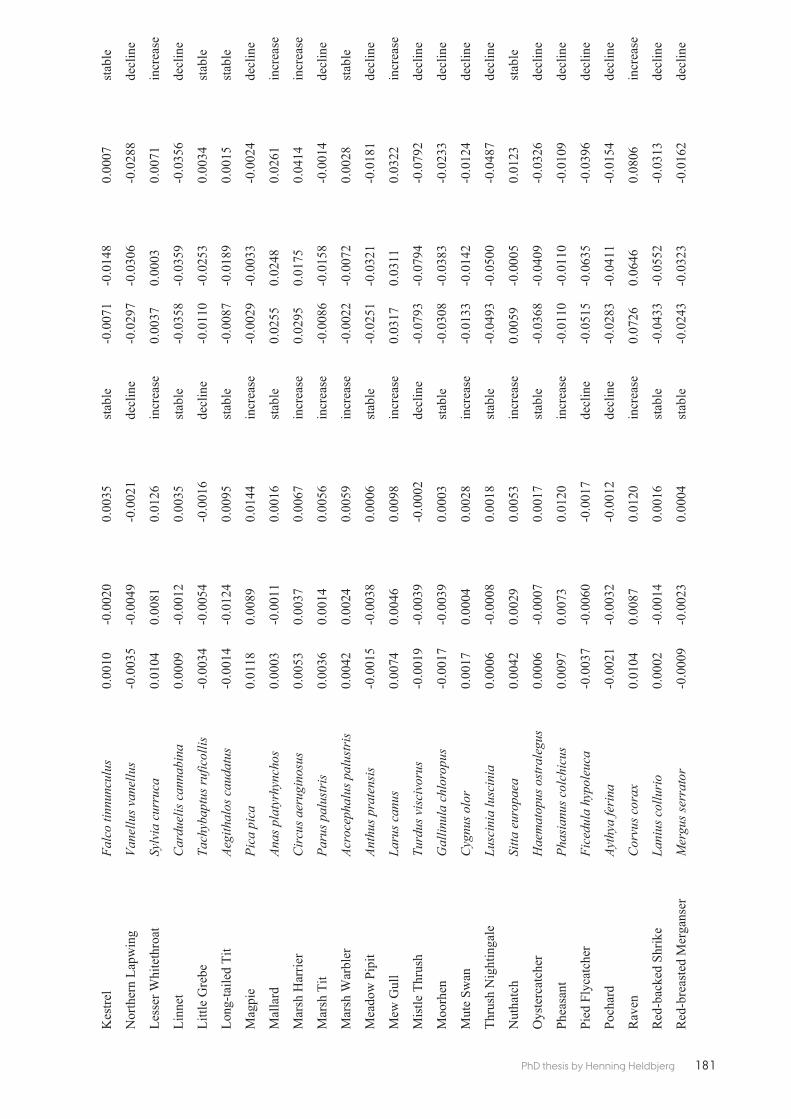
181PhD thesis by Henning Heldbjerg
Falc
o tin
nunc
ulus
Vane
llus v
anel
lus
Sylv
ia c
urru
ca
Car
duel
is c
anna
bina
Tach
ybap
tus r
ufic
ollis
Aegi
thal
os c
auda
tus
Pica
pic
a
Anas
pla
tyrh
ynch
os
Cir
cus a
erug
inos
us
Paru
s pal
ustr
is
Acro
ceph
alus
pal
ustr
is
Anth
us p
rate
nsis
Laru
s can
us
Turd
us v
isci
voru
s
Gal
linul
a ch
loro
pus
Cyg
nus o
lor
Lusc
inia
lusc
inia
Sitta
eur
opae
a
Hae
mat
opus
ost
rale
gus
Phas
ianu
s col
chic
us
Fice
dula
hyp
oleu
ca
Ayth
ya fe
rina
Cor
vus c
orax
Lani
us c
ollu
rio
Mer
gus s
erra
tor

182 PhD thesis by Henning Heldbjerg
Podi
ceps
gri
sege
na
Car
duel
is fl
amm
ea
Trin
ga to
tanu
s
Phoe
nicu
rus p
hoen
icur
us
Embe
riza
scho
enic
lus
Acro
ceph
alus
scir
paca
eus
Erith
acus
rube
cula
Cor
vus f
rugi
legu
s
Ripa
ria ri
paria
Ac
roce
phal
us
scho
enob
aenu
s Ta
dorn
a ta
dorn
a
Car
duel
is sp
inus
Alau
da a
rven
sis
Gal
linag
o ga
llina
go
Turd
us p
hilo
mel
os
Acci
pite
r nis
us
Mus
cica
pa st
riata
Stur
nus v
ulga
ris
Col
umba
oen
as
Apus
apu
s
Stri
x al
uco
Anth
us tr
ivia
lis
Pass
er m
onta
nus
Cer
thia
fam
iliar
is

183PhD thesis by Henning Heldbjerg
Ayth
ya fu
ligul
a
Oen
anth
e oe
nant
he
Mot
acill
a al
ba
Sylv
ia c
omm
unis
Phyl
losc
opus
troc
hilu
s
Trog
lody
tes t
rogl
odyt
es
Col
umba
pal
umbu
s
Phyl
losc
opus
sibi
latr
ix
Mot
acill
a fla
va
Embe
riza
citr
inel
la

184 PhD thesis by Henning Heldbjerg
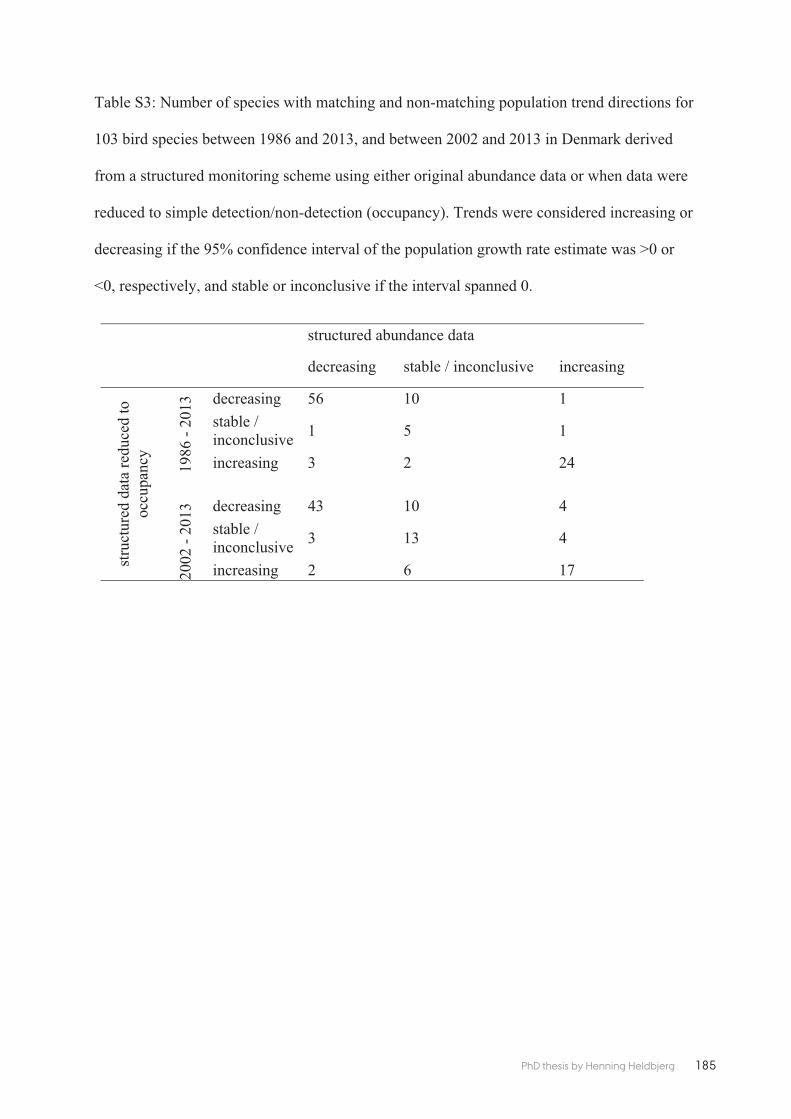
185PhD thesis by Henning Heldbjerg

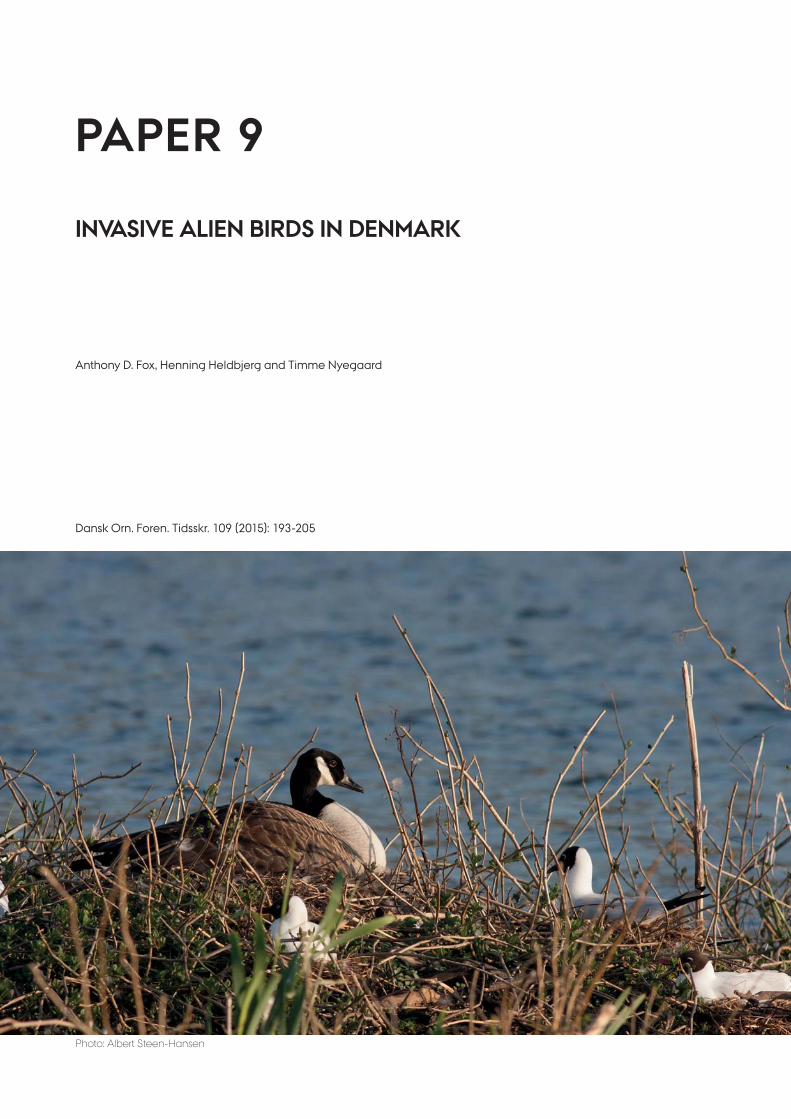
Dansk Orn. Foren. Tidsskr. 109 (2015): 193-205
Anthony D. Fox, Henning Heldbjerg and Timme Nyegaard
PAPER 9
INVASIVE ALIEN BIRDS IN DENMARK
Photo: Albert Steen-Hansen


189PhD thesis by Henning Heldbjerg
Invasive alien birds in Denmark
ANTHONY D. FOX, HENNING HELDBJERG AND TIMME NYEGAARD
(Med et dansk resumé: Invasive fuglearter i Danmark)
Dansk Orn. Foren. Tidsskr. 109 (2015): 193-205
Abstract Avian Introduced Alien Species (IAS) constitute a threat to the integrity of native biodiversity, the economy and human health, so here we briefly review some of the problems posed by such species around the world in relation to such bird species in Denmark. A new European Union Regulation on Invasive Alien Species implemented in January 2015 establishes a framework for actions to combat alien species, which requires Member States to prevent the spread of alien species, provide early warning and rapid responses to their presence and management of established alien species where they occur. We show the importance of mechanisms such as DOF’s (Dansk Ornitologisk Forening, BirdLife Denmark) Atlas project, Common Bird Census (breeding and wintering species) and DOFbasen to contribute data on the current geographical and numerical distribution of the few serious alien avian species already present in Denmark. We review the status, abundance and distribution of seven critical IAS that do, or have, occurred in Denmark in the last 10 years and conclude that none of these pose a major threat as things stand at the present, although breeding Egyptian Geese Alopochen aegyptiaca and Canada Geese Branta canadensis potentially give cause for future concern. We underline the need for continued surveillance of all avian IAS through data collection via DOF’s monitoring programmes and Aarhus University’s mid-winter waterbird census, hunting bag and wing surveys. These programmes are essential if we are to continue to effectively monitor the extent and nature of the problems constituted by IAS in support of the Danish Nature Agency in their direct management of alien species problems in this country.
Introduction
Humans have been introducing plant and animal spe-cies to areas across the globe outside of their natural native ranges for thousands of years, some deliberately and others accidently. Many such modifications to dis-tributional range have been to feed us, for instance, the Greylag Goose Anser anser was one of the first bird spe-cies known to be domesticated some 5000 years ago (Sossinka 1982), and the species has since been intro-duced around the world. In more recent times, human colonisers have taken examples of the European avifau-na around the world to remind themselves of home (e.g. Thomson 1922, Lever 2010). In the case of a very wide range of wildfowl (members of the Anatidae; Fox 2009) and parrot species (from the order Psittaciformes; Cassey
et al. 2004), substantial numbers have been introduced to Europe since the 1700s as a source of curiosity, enter-tainment and ornamental decoration. The introduction of such alien species outside their native range as a re-sult of human action is usually benign, because the vast majority of such organisms fail to survive in often unsuit-able environments (Blackburn et al. 2014). However, we see some alien species adapting to new conditions and establishing viable, self-sustaining populations in the wild where they can also cause significant ecological, economic and human health impacts, although these are not always easily foreseeable (Blackburn et al. 2014). These impacts can be many and varied (see for example some case studies provided in Tab. 1), but because these cannot easily be predicted in advance, it is far better to

190 PhD thesis by Henning Heldbjerg
194 Invasive alien birds
attempt to stop the arrival and colonisation of all new invasive species rather than attempt to manage a major problem once such species have become established and creating challenges. Such species spread by human agency outside their natural range are known as Inva-
sive Alien Species (IAS) and they increasingly pose prob-lems to global biodiversity, where they are considered to be one of the greatest current threats to natural sys-tems and species diversity (Sala et al. 2000). As a result of the threats such aggressive species pose to biodiversity,
Tab. 1. Some example case studies of the effects of alien introduced species on native fauna.Eksempler på effekter af invasive arters forekomst på den hjemmehørende natur.
Effect Description and examples of effects Source references
Predation Introduced predators such as feral cats Felis catus, American mink Mustela vison and even house mice Mus musculus radically effect ground nesting seabirds never previously exposed to such threats.
Craik 1997, Holdaway 1999, Keitt et al. 2002, Croll et al. 2005, Wanless et al. 2007, Kurle et al. 2008
Hybridisa-tion
Hybridisation of alien and native forms can lead to the dilution of the native genotype, e.g. North American Ruddy Duck Oxyura jamaicensis with White-headed Duck Oxyura leucocephala in Spain.
Kershaw & Hughes 2002, Hughes et al. 2006, Muñoz-Fuentes et al. 2007
Demogra-phic ascen-dancy
Despite similar survival rate, the greater breeding success of the alien introduced Mallard Anas platyrhynchos compared to the native and closely related Grey Duck Anas superciliosa in New Zealand, makes it numerically abundant over the native species.
Williams & Basse 2006
Disruption to ecosystem function
Danish lakes stocked with reared Mallards had higher phosphorus level than those not stocked, with acidic, nutrient-poor waterbodies being more sensitive to change as a result of relatively modest elevations in phospho-rus concentrations. Rearing of Common Pheasants Phasianus colchicus creates conflict with birds of prey such as Northern Goshawk Accipiter gentilis which are then persecuted.
Paludan 1967, Noer et al. 2008
Diseases and parasites
Some Hawaiian birds are now restricted to high altitudes to escape disea-ses and parasites brought by introduced avian species that thrive in the lowlands. Duck Viral Enteritis is almost confined to captive reared or non-migratory waterfowl in Europe, Asia and North America, and outbreaks in wild waterbirds often follow contact with captive or released individuals.
Burgess et al. 1979, Burgess & Yuill 1982, Gough 1984, Brand 1988, Brand & Docherty 1988, Gough & Alexander 1990, Bibby 2000, LaPointe et al. 2005
Damage to agriculture
Escaped free-flying Rose-ringed Parakeets Psittacula krameri have bred in SE England for 40 years, where they create damage to fruits, vineyards and market gardens.
Pithon & Dytham 1999, Butler 2003, FERA 2009
Urban con-flicts
Alien avian species in urban environments may have fewer predators and (at least initially) a supportive human population. However, introduced Canada Geese Branta canadensis in Europe and North America have caused damage to crops, disruption to golf courses, problems with droppings, have attacked humans and collided with vehicles or aircraft and created many other problems.
Conover & Chasko 1985, Watola et al. 1996, Owen et al. 2006, Dolbeer 2009
Damage, degrade or modify habitats
Introduced Canada Geese have destroyed wild rice stands in eastern North America. Mute Swan Cygnus olor in Maryland remove submerged aquatic vegetation (e.g. widgeon grass Ruppia maritima and eelgrass Zostera marina) affecting sediment patterns, submerged plant, invertebrate and fish communities.
Perry et al. 2004, Allin & Husband 2004, Naylor 2004, Tatu et al. 2007, Nichols 2014
Health and safety
Waterfowl can be natural reservoirs for zoonotic pathogens, e.g. abundant introduced resident Canada Geese in urban and suburban North American can potentially transmit Campylobacter and Avian Influenza through human contact with faecal deposits and contaminated water.
Rutledge et al. 2013
Competition for nest sites
In Australia, the introduced Common Myna Acridotheres tristis and European Starling Sturnus vulgaris compete with native species for nest holes, potentially affecting the breeding success of the Red-rumped Parrot Psephotus haematonotus, Crimson Platycercus elegans and Eastern Rosella Platycercus eximius.
Pell & Tidemann 1997
Competition for food
Native garden birds showed reduced feeding rates and increased vigilance in response to Rose-ringed Parakeet compared to Great Spotted Wood-peckers Dendrocopos major.
Peck et al. 2014

191PhD thesis by Henning Heldbjerg
195Invasive alien birds
the economy and human health, it is estimated that IAS have cost the European Union (EU) €12 billion (89 billion Danish kroner) per year over the last 20 years and that figure is increasing annually (Sundseth 2014). For that reason, the EU has implemented a new Regulation on Invasive Alien Species that came into effect on 1 January 2015 (European Commission 2014). This was a major ob-jective of the EUs Biodiversity Strategy Target 5 for 2020 to coordinate EU-wide actions to prevent, minimise and mitigate the adverse impacts of IAS on biodiversity and ecosystem services, the economy and public health. The Regulation seeks to establish three types of measures, namely (i) prevention, (ii) early warning and rapid re-sponse and (iii) management of already established IAS.
But how does this affect DOF and Danish birds? Den-mark has been highlighted as supporting particularly high densities of IAS compared to countries like Spain and France, even if the number of IAS is not that differ-ent (Sundseth 2014), so we have good reasons to be vigilant. Furthermore, as we hope to establish here, DOF and the volunteers contributing to the various existing recording schemes have a major role to play now and increasingly in the future in monitoring the distribution and abundance of avian IAS throughout Denmark.
In this analysis, we first assess the status of avian IAS in Denmark (which constitute problems elsewhere in Europe) based on knowledge from existing monitor-ing schemes and present an overview of all IAS species so far recorded here (excluding the Common Pheasant Phasianus colchicus). Then we review why IAS constitute such a problem and consider briefly the mechanisms with which to deal with them. We will also briefly con-sider how the EUs framework for action under the new Regulation can be implemented in Denmark with regard to avian IAS. Finally, we assess the importance of mech-anisms such as DOFs Atlas project, the point counts schemes and DOFbasen data to contribute knowledge and advice to the Danish Nature Agency for the effective management of IAS problems in this country.
Methods
Using existing avian monitoring programmes to track IAS distribution and abundanceDOF maintains a series of different ornithological mon-itoring projects, all of which provide some basis for monitoring IAS now and in the future. The data on IAS from the Common Bird Census (based on point counts) are often too sparse to provide a useful perspective on such species and the present atlas period (2014-2017) means that although data will be forthcoming in the future, it is too early to use this source in the present review. Despite the unsystematic nature of data report-
ed to DOFbasen, the volume of records (c. 16 million) entered by a couple of thousand observers from many sites (c. 18 000) throughout Denmark provides an excel-lent basis for estimating the abundance and distribution of IAS. In our review, we included data from 2005-2014 to assess changes in the abundance and distribution for the selected species. One complication is that contribu-tions to DOFbasen have increased considerably in this period. The number of annual records in DOFbasen have increased 2.4 times from c. 578 000 in 2005 to c. 1.4 mil-lion records in 2014, the number of visited sites have in-creased 1.9 times from c. 7200 in 2005 to 13 600 in 2014 and the number of observers have increased 2.2 times from c. 1000 observers in 2005 to c. 2200 observers in 2014. Hence, relative changes in abundance and dis-tribution must take this increase in effort into account. However, because most IAS are relatively scarce anyway, rather than weight the observations in DOFbasen for overall annual increases in observers and observations, we here first imposed a 10 × 10 km grid layer across Den-mark and generated annual maximum counts from all sites within each square. Whilst such an approach may generally underestimate the true numbers present, it is a very useful indicator of presence and relative change in abundance for such species. Sites were assigned to grid squares based on the central coordinate of each site. We used changes in the annual sum of all grid square maximum counts generated in this way per year as an annual index to evaluate abundance trends for each species. The present abundance status of each species was calculated as a mean from the years 2011-2014 to incorporate fluctuations from year to year. Linear regres-sion models were fitted to trends in abundance (annual sums of grid square maximum counts) and distribution (number of occupied grid squares) for all species over the period 2005-2014. In order to normalise the residual variance, the regression models were performed on nat-ural logarithm transformed annual indices (results are given for the most numerous IAS in Tab. 2). Selecting species for particular attention Under the European Commission’s Sixth Framework Programme, the Delivering Alien Invasive Species In Europe project (DAISIE 2014) was established to (i) cre-ate an inventory of European invasive species, (ii) pro-vide the basis for prevention and control of biological invasions, (iii) assess the risks and impacts of the most widespread and/or noxious invasive species, and (iv) provide distribution data and experiences from Mem-ber States as a framework for considering indicators for early warning and action against IAS. This process includes profiling of the “100 of the worst” a database of the most aggressive, noxious or problematic of IAS

192 PhD thesis by Henning Heldbjerg
196 Invasive alien birds
(DAISIE 2014), which includes only four species of birds that are present in Denmark or have been reported here, the Canada Goose Branta canadensis, North American Ruddy Duck Oxyura jamaicensis, Sacred Ibis Threskiornis aethiopicus and Rose-ringed Parakeet Psittacula krameri.
DOFbasen data on these species have been analysed and presented in the annual reports Fugleåret (Lange 2014), but here we present a more detailed analysis. For most of the species, we base our analysis on numbers gathered throughout the entire year, but in the case of the Canada Goose we are interested in separating the modest but potentially problematic breeding popula-tion from the much larger numbers present during the migration and winter periods.
Results
Canada GooseThe Canada Goose is a regular winter visitor to Den-mark but a scarce breeder. Although introduced to this country as an ornamental waterbird in the late 1930s (Løppenthin 1967), the breeding population has not in-creased dramatically over the last 40 years. This is some-thing that needs maintained vigilance and monitoring, however, since we show that the number of birds in Denmark during summer is now increasing more rap-idly (see below and Fig. 3). Large established breeding populations exist in Sweden, southern Norway and southern Finland, and it is thought that considerable numbers of mainly Swedish breeding Canada Geese are those that winter in Denmark (Bønløkke et al. 2006),
especially in the south-eastern part of the country, but aggregations also occur in Thy and at Tøndermarsken. Usually the species occurs in small flocks of up to a few hundred, often with swans and other geese, but more than 1000 birds are regularly recorded, for example, on Basnæs Nor near Skælskør and Nyord near Møn. Man-agement of the population occurs through hunting, as the species is legally huntable in Denmark and is a popular quarry species. Numbers killed are monitored via the Danish Hunting Bag and Wing Surveys, accord-ing to which less than 100 were shot per annum in the 1960s, this rose to 1000-1500 in the 1990s (Bregnballe et al. 2003) and to between 5100 (2009/10) and 10 000 (2013/14) per annum in the last six years (Asferg 2011, 2014). The recent levels of exploitation seem until now to have been compatible with holding the population at a similar level in mid-winter in recent years, as both the DOF winter point counts and the Aarhus Universi-ty midwinter goose counts show that the population is relatively stable and slightly below the peak since 2000 (Fig. 1). This suggests for the avian IAS which is the most numerically threatening to Denmark, the situation is at least not currently getting any worse. This also seems to match with trends in the population breeding in Swe-den (Ottvall et al. 2009) which also winter there, where mid-winter counts peaked at over 70000 in January of 2009 and 2010, but since numbers have declined there as well (Nilsson 2014). Such a ‘holding pattern’ for this IAS is important, since although this species is consid-ered the most damaging avian IAS in Europe (Kumschick & Nentwig 2010) it would be extremely complex and
Tab. 2. Fitted trends for the four most abundant invasive alien species using simple linear regression models based on records in DOFbasen from 2005 to 2014 inclusive. Information on abundance was based on the annual sum of maximum counts from sites amalgamated in 10 × 10 km grid squares distributed across Denmark and for distribution on the annual numbers of occupied grid squares (see text for details). Regression coefficient, r2, F-value and P value are shown for all fitted models. Tendenser for udviklingen for de fire mest almindelige invasive fuglearter i Danmark 2005-14 baseret på data fra DOFbasen. Både ten-densen i antal og i udbredelse er vist. For Canadagås er kun rastende og ynglende fugle fra månederne maj-juli inkluderet. For de øvrige arter er alle fugle fra hele året inkluderet.
Species Included
period
Trend abundance Trend distribution
Coefficient r2 F P Coefficient r2 F P
Black Swan Cygnus atratus All year -0.248 0.760 25.3 0.001 -0.201 0.6976 18.4 0.003
Canada Goose Branta canadensis May-July 0.209 0.828 38.5 <0.001 0.126 0.919 91.1 <0.001
Egyptian Goose Alopochen aegyptiaca All year 0.053 0.610 12.5 0.008 0.026 0.384 5.0 0.06
Ruddy Shelduck Tadorna ferruginea All year 0.051 0.204 2.0 0.190 0.063 0.400 5.3 0.05

193PhD thesis by Henning Heldbjerg
197Invasive alien birds
costly to agree, coordinate and mount an international programme to eradicate the species from Europe at the present time. Thus, this is likely to be a species that is maintained at acceptable levels for the current time.
In contrast, we see a significant 21% increase in the number of birds reported and a 13% increase in the number of occupied 10 × 10 km grid squares in the breeding period during 2005-2014 (Tab. 2 and Fig. 2). In summer, the geese are spread over most of coastal Denmark (Fig. 3). The population was estimated at c. 20 breeding pairs in the first Atlas in 1971-1974 (Dybbro 1976) and at 25-50 breeding pairs during the second Atlas project in 1993-1996. The range, defined as breed-ing in 5 × 5 km squares, increased from the first to the second Atlas by more than 180% (Grell 1998). Also now there are several confirmed breeding pairs in the south-ern and eastern parts of the country, as well as signs of increase on Bornholm, albeit still in low numbers, sug-gesting the potential for further expansion of a breeding population in Denmark. The increase in range does not seem to have continued, but this and the current size of the breeding population will become clearer after the third Atlas period in 2014-2017. So far, all recoveries of juveniles ringed in Denmark are local which indicates that there is as yet no major migration by the Danish population (Bønløkke et al. 2006). It remains important that contributions to DOFbasen and the present Atlas track the changing status of this species as a breeding bird now and in the future.
North American Ruddy DuckThe North America Ruddy Duck escaped from captivi-ty in England in the mid twentieth century, and estab-lished a feral breeding population of 6000 individuals
by 2000 (Kershaw & Hughes 2002, Hughes et al. 2006). Although there were no apparent competitive or other adverse interactions with the native avifauna (Hughes 1992), increasing immigrants to Spain from the core concentration in Britain threatened the successful con-servation efforts to restore the Spanish population of White-headed Duck Oxyura leucocephala from the brink of extinction. Hybrids between the two Oxyura species rapidly appeared, threatening to create a hybrid swarm of Oxyura ducks of mixed genotype with the eventual disappearance of the White-headed Duck as the genetic entity we recognise today (Muñoz-Fuentes et al. 2007). Conservation plans for the White-headed Duck high-lighted the need for action to save the species (Anstey 1989, Green & Hughes 1996, Li & Mundkur 2002, Hughes et al. 2006). This led to the development of a strategy to eradicate the Ruddy Duck from throughout the West-ern Palearctic, because the species was increasingly dis-persing from Britain and breeding elsewhere in Europe (see Henderson 2009). By the winter of 2014/15, this eradication strategy was close to success, largely due to the concentrated campaign in the United Kingdom (Robertson et al. 2015). Recent estimates of the cost of the Ruddy Duck eradication there have been in the order of £3.6 to £5.4 million (36-54 million DKK), a very substantial amount of money in relation to other con-servation budgets. However, it is perhaps instructive to compare the relative costs of control of a species like the Ruddy Duck with those of nine invasive plant species that cause serious economic consequences, amounting to an expenditure of £300 million (3 billion DKK) per annum in the United Kingdom, and the adverse costs of native weed plant species which cost well over twice that amount without resolution (Williamson 2002).
Fig. 1. Changes in the Danish winter population of Canada Goose based on changes in relative annual abundance, shown by annual winter point count indices for the Canada Goose in Denmark 1987/88-2014/15 (red line; Nyegaard et al. 2015, updated 2015) with 1987/88 set to a value of 100 and annual mid-winter counts of the Canada Goose in Denmark 1981-2013 (blue histograms, Danish Centre for Environment and Energy, Aarhus University). Udviklingen i den danske vinter-bestand af Canadagås baseret på henholdsvis punkttællings-data i perioden 1987/88-2014/15 (kurve) og data fra midvintertællingerne fra januar i årene 1981-2013 (søjler).

194 PhD thesis by Henning Heldbjerg
198 Invasive alien birds
The first North American Ruddy Duck in Denmark was seen in 1985 (Olsen 1988). Numbers peaked in 2007 (Fig. 2), culminating in the only confirmed breeding by the species in Denmark at Maribo Nørresø in 2006, 2007 and 2008 (DOFbasen). Luckily, the species did not con-solidate as a breeding species, and numbers have since fallen, almost certainly as a result of the highly success-ful eradication programme in the United Kingdom, where it is thought the majority of Danish birds origi-nated. As of early 2015, it is thought that the population in Britain is less than 15 females, down from a popula-tion there of over 6000 individuals at its peak in 2000. The abundance and the distribution of North American Ruddy Ducks reported in Denmark are both significantly
declining during the last decade, confirming the trend from Britain (Figs 2 and 3). The species is listed as hunt-able in Denmark, and 20-30 birds are estimated to have been shot here over the last 30 years (T. Asferg pers. comm.). Clearly, Denmark needs to remain vigilant to this species given its capacity to breed here, but given the loss of the source population and the apparent lack of any observations in three out of the last four years, it would appear the species does not constitute the threat it once did in the mid-2000s.
Sacred IbisThe African Sacred Ibis seems an unlikely threat to the European avifauna, but it has been introduced to
Fig. 2. The trends in abundance (left) and distribution (right) for seven invasive alien avian species in Denmark in 2005-2014 based on records in DOFbasen. See text for full explanation of the methods used and Tab. 2 for associated statistics and explanations. Udviklingen i hyppighed (venstre) og udbredelse (højre) for syv invasive fuglearter i perioden 2005-14 baseret på data i DOFbasen.

195PhD thesis by Henning Heldbjerg
199Invasive alien birds
France, Italy and Spain where rapidly growing popula-tions in southern Europe are seen as a major problem, because of their devastating effects on breeding colo-nies of species such as terns, as well as their successful competition with native Cattle Bubulcus ibis and Little
Egrets Egretta garzetta for nest sites (Clergeau & Yésou 2006). Their adaptability to forage on rubbish tips has enabled them to survive harsh winters in temperate re-gions, so it is not beyond the bounds of possibility that the species could colonise Denmark. To date there have
Fig. 3. Maximum counts (individuals) in DOFbasen of six invasive alien bird species in Denmark in 2011-2014. Red circles indicate breeding records. For Canada Goose, only staging birds during May-July and breeding birds are included. All other species maps include all records (regardless of season) in these years.Maksimumantal i DOFbasen for seks invasive fuglearter i Danmark i årene 2011-14. Røde cirkler indikerer yngleforekomster. For Canada-gås er kun rastende fugle fra månederne maj-juli og ynglefugle inkluderet. For de øvrige arter er alle fugle fra hele året inkluderet.

196 PhD thesis by Henning Heldbjerg
200 Invasive alien birds
been two observations of a single bird in 1994 and 36 observations of probably a single bird in 2007 in DOF-basen, although there have been other observations in previous years not formally recorded. However, there is no evidence at present for any long term colonisation of Denmark by this species, for which DOFbasen again should function as an effective early warning system.
Rose-ringed ParakeetThere have been 32 observations of the Rose-ringed Parakeet in nine different years since 1980 in DOFbasen, mostly from the Greater Copenhagen area, but also from Jutland (see Figs 2 and 3). It is thought that these individuals are escaped birds from captivity within Den-mark, but they are strong fliers and it cannot be exclud-ed that these are birds coming from areas further south where established breeding populations exist. So far, there are no signs of breeding here, but this remains a high possibility. In 2014, the species is more widespread and numerous than ever before in the last decade and we need continued vigilance via DOFbasen and the At-las to be convinced as to whether this is part of a trend or is just a coincidence. There have also been three ob-servations of the Monk Parakeet Myiopsitta monachus in DOFbasen from 2014, a species which is known to breed in the wild in small numbers for many years at Solrød Strand, Køge Bugt (K. Flensted pers. comm.). Elsewhere in Europe, both of these species are established, where they can be highly aggressive towards, and cause other
problems for, native bird species (Strubbe & Matthysen 2009, Hernández-Brito et al. 2014), so these constitute species of concern which also require continued surveil-lance.
Other species of potential concernAll invasive species give cause for concern, but three waterbird species are, to some extent, already present in Denmark and are considered ‘pest’ species in neighbour-ing countries, namely the Egyptian Goose Alopochen ae-gyptiaca, Ruddy Shelduck Tadorna ferruginea and Black Swan Cygnus atratus (Tabs 2 and 3, Figs 2 and 3).
The first observation of Egyptian Goose in Denmark was in 1983 (Netfugl), but the first confirmed breeding record is from 2000 (DOFbasen). The Egyptian Goose is largely confined to the southern and western parts of Denmark (Fig. 3) where it now breeds in small but in-creasing numbers that give some cause for future con-cern if these trends continue. The species seems to have originated from the Dutch population, part of an IAS population estimated at over 26000 breeding pairs in 2010 (Gyimesi & Lensink 2012). Numbers in Denmark do seem to be increasing (Tab. 2), with flocks of up to 136 birds reported from Uge, close to the German border in southern Jutland. It is a legal quarry species in Denmark, shot in relatively small numbers (155 in season 2012/13, 128 in 2013/14; Asferg 2014), but should the population show signs of major increase, this offers a potential form of control.
Tab. 3. Status of seven invasive alien species based on records in DOFbasen. The status assessment is based on annual data from 2011-2014. Values indicate the mean number of records, the mean summed maximum number recorded per 10 × 10 km grid square per year (abundance) and the number of these squares occupied (distribution). 1indicates a pair of Black Swans seen with cygnets in 2007 where it was not known for sure whether the breeding was in a park or on a natural breeding site.Status for syv invasive fuglearter i Danmark baseret på forekomsten i 2011-14 og på data fra DOFbasen.
Species Phenology Confirmed
breeding
Included
period
Mean records
per year
Mean sum of
max per year
Mean 10 ×10
per year
Sacred Ibis Threskiornis aethiopicus Occasional No All year 0 0 0
Black Swan Cygnus atratus All year Yes1 All year 33.0 12.3 10.3
Canada Goose Branta canadensis
All yearMajority at winter Yes May-July 412 781 85.3
Egyptian Goose Alopochen aegyptiaca All year Yes All year 882 416 116
Ruddy Shelduck Tadorna ferruginea Occasional No All year 111 39.0 23.8
North American Ruddy Duck Oxyura jamaicensis Occasional No All year 19.5 0.5 0.5
Rose-ringed Parakeet Psittacula krameri Occasional No All year 2.5 2.5 2

197PhD thesis by Henning Heldbjerg
201Invasive alien birds
The Ruddy Shelduck is less numerous and usually encountered singly or in very small groups in Denmark (Tab. 3, Fig. 3). The last survey suggested 105-425 breed-ing pairs in Western Europe, where it is not considered native, mostly in Germany and Switzerland (Banks et al. 2008). However this species has been documented to occur in western Europe since the 1800s and in the past has been notable for ‘eruption years’ when substan-tial numbers of apparently wild origin birds (probably from further east in Eurasia) occur simultaneously, even reaching Iceland and Greenland, so some birds may still be of truly wild origin. In 1994, as many as 100 birds were reported in Denmark, although a breeding pair report-ed from Himmerland that year (the only confirmed re-cent breeding record) is likely to have been the result of escaped individuals. There is a tendency (which closely approximates to statistical significance at P = 0.0502) for an increase in the population in Denmark in 2005-2014, with a marked increase since 2011, which may be partially the result of the free-flying young dispersing throughout the Copenhagen area from a pair of wing-clipped Ruddy Shelduck in Tivoli Gardens (Tab. 2).
Black Swans have been introduced from Australia and are thought to number 155-225 breeding pairs in Europe in 2004-2007, mostly in Netherlands, Belgium and the UK (Banks et al. 2008). Numbers reported to DOFbasen seem to show relative low levels since 2010 compared to previous years (Fig. 2), and the species has declined significantly in abundance and distribution during 2005-2014 (Tab. 2). There is one observation of a breeding pair with cygnets near Rågø in 2007 in DOF-basen, but there is doubt whether this confirmed breed-ing stems from local captive birds within a park there or from a natural site. There have also been other accounts of this species breeding in the past (e.g. on Lolland and Fyn; K. Flensted pers. comm.). Black Swan is also listed as huntable during the open season, but has not been reported shot in very recent years. Since Black Swan does not yet seem to have established itself as a breed-ing bird, this remains another species for which active management does not seem urgent, but monitoring vigilance is required to ensure no sudden expansion in numbers and range.
DiscussionDoes Denmark currently have a serious problem with in-troduced alien species? The simple answer appears to be “no, not yet”. Of Eu-rope’s 100 worst avian IAS, only the Canada Goose is numerous enough as a winter visitor to cause concern, but all the monitoring indications are that after a pe-riod of increase, the Nordic population of this species is a legal popular quarry species showing relative stable
trends and indeed has shown slight declines in recent years. Worryingly, we see an increase in the numbers of Canada Geese in Denmark during the breeding period. This could potentially be the first sign of an establishing Danish population, which is also confirmed by reports of number of breeding pairs in the last few years. The increasing German population was estimated at 3600-5400 breeding pairs in 2005-2009 (Gedeon et al. 2014). Of these, the population in Schleswig-Holstein was esti-mated to have increased from 180 pairs in 1999 (Berndt et al. 2002) to 700 pairs in 2005-2009 with the majority near Kieler Fjord c. 50 km away from Denmark across the Baltic Sea (Koop & Bernt 2014). It remains unknown whether the increasing number of summer visitors is the result of the increasing breeding population south of Denmark (as seems likely) rather than being related to the many geese of Swedish origin that winter in Den-mark.
Of the species of known concern in neighbouring Eu-ropean countries, the Egyptian Goose is clearly increas-ing in Denmark and is a species to watch. The Egyptian Goose has arrived in Denmark recently and was not even mentioned in the second Danish Atlas project in 1993-1996 (Grell 1998), which indicates how fast the species has colonised Denmark. The species is also increasing in Germany with an estimated population at 5000-7500 pairs in 2005-2009 (Gedeon et al. 2014) of which more than c. 250 pairs are found in Schleswig-Holstein (Koop & Bernt 2014). We recommend that both of these spe-cies be made the subject of future and more detailed analysis of changes in their behaviour, distribution and abundance which should consider their effect on other wildlife and potential management options. Other spe-cies do not currently appear to constitute a problem at the present time.
How do we best maintain vigilance with regard to intro-duced alien species?The short answer is to continue to improve what we are currently doing. Denmark has a system of avian moni-toring in place through DOFbasen that provides data on exotic species, including IAS, as these occur. We there-fore urge all contributors to the system to continue to enter records of non-native invasive species as well as native species, so that the programme can contribute to our knowledge of the distribution and abundance of such species. Although DOFbasen data requires correc-tion for spatio-temporal variation in observer effort, it provides an early warning system and the basis for de-veloping more sophisticated systematic monitoring of IAS populations, should the need arise. The same is true for the Common Bird Census systems for breeding and wintering birds and Atlas fieldwork, as these are further

198 PhD thesis by Henning Heldbjerg
202 Invasive alien birds
means of collecting and collating data on the more nu-merous species that are already present in Denmark but also as a means of tracking new IAS as they occur.
As huntable species, annual reporting of Black Swan, Ruddy Duck and Egyptian Goose by hunters continues to be important in contributing data on the numbers of birds shot. All of these sources of data are essential to supporting the work of DOF to supply the Nature Agency with information on these species, in concert with the mid-winter counts, hunting bag statistics and wing surveys carried out by Aarhus University.
As we have seen earlier, contributing regular moni-toring of these species, even at very low levels of abun-dance, is essential in supporting all the stages of the EU Regulation on IAS. In particular, monitoring provides vi-tal data to the Nature Agency to support (i) prevention of spread of IAS, (ii) early warning and rapid response to IAS where and when they occur and (iii) management of already established IAS. The famous British ornitholo-gist Colin Bibby (2000) once remarked that IAS were ‘the only form of pollution which spontaneously self-replicates’! Many birdwatchers consider IAS as a form of pollution, but that does not mean we should not be re-cording their presence and numbers, given the threats that these species constitute to our own biodiversity, avifauna and economy! The new EU Regulation gives us ample reason to continue this monitoring in the future, and we thank all those that have been diligent in report-ing IAS to the present.
How do we deal with the problem once introduced alien species have arrived?The new EU Regulation on Invasive Alien Species Regu-lation proposes three distinct types of measures, which follow an internationally agreed hierarchical approach to combatting IAS. Firstly through prevention, by being aware of the IAS that threaten our avifauna and biodi-versity and implementing robust measures to prevent new IAS from entering the EU in the first place, either intentionally or unintentionally. Secondly, by having early warning systems in place to enable rapid respons-es where these are necessary. The Regulation requires that Member States must put in place an early warning system to detect the presence of IAS as early as possible and as we have shown above, DOFbasen makes a very significant contribution to this mechanism, in concert with breeding bird and winter point counts and through coverage of the present and previous breeding Atlas projects. The existence of such vital monitoring mecha-nisms provide Denmark with an assessment of the num-bers and distribution of IAS as they occur and provide the Nature Agency with the spatial and, to some extent, numerical information required to implement rapid re-
sponse measures when these are required to prevent such species becoming established. Finally, the Regula-tion requires management of previously established IAS to minimise their spread, abundance and impact, again a task that falls to the Nature Agency to fulfil. Clearly to judge the effectiveness of such measures requires regular monitoring of the status and distribution of IAS whilst subject to such management, so again the Atlas projects but especially DOFbasen and the point count networks can make direct and essential contributions to this process.
Acknowledgements
We are very grateful to Preben Clausen for supply of the Aarhus University coordinated mid-winter counts of Canada Geese. The authors acknowledge support funding from the Danish Nature Agency to DOF to support avian monitoring and to ADF and Aarhus University to support the preparation of this report. HH acknowledges the support of an industrial PhD stipend award-ed by Innovationsfonden, which, together with Aage V Jensen Naturfond and 15. Juni Fonden also supported this work. This article is dedicated to the very many observers that selflessly give of their time to entirely voluntarily contribute to ‘Citizen Science’ projects such as those described here, which contrib-ute so much to our knowledge of our native as well as alien avifauna. Hans Meltofte, Thomas Bregnballe, Preben Clausen, Knud Flensted and two anonymous referees all kindly com-mented on earlier versions of this manuscript. Thanks to you all.
Resumé
Invasive fuglearter i DanmarkIntroducerede arter fra andre geografiske områder udgør en potentiel risiko for den hjemmehørende natur. Dette gælder også for fugle. I denne artikel præsenteres status for og udvik-ling i bestandsstørrelse og udbredelse for syv af disse invasive fuglearter, der har vist sig at udgøre et problem i andre lande. Status er beregnet som et gennemsnit af forekomsten i perio-den 2011-14, og bestandsudviklingen dækker perioden 2005-14 med bemærkninger om forekomsten før denne periode.
I starten af januar 2015 implementeredes et nyt EU-regu-lativ, der har til formål at skabe en platform for, hvordan EU-medlemslandene skal forvalte de forskellige invasive arter og sikre, at de ikke spreder sig. Målet er at sikre et godt kendskab til arternes udbredelse i de enkelte lande, sikre en tidlig varsling og en hurtig respons på deres forekomst og at forvalte bestan-dene, hvor de allerede har etableret sig.
I denne forbindelse er der udarbejdet en liste over ’de 100 værste arter’ (se DAISIE 2014), hvoraf fire af de her inkluderede arter er med: Canadagås Branta canadensis, Amerikansk Skar-veand Oxyura jamaicensis, Hellig Ibis Threskiornis aethiopicus og Alexanderparakit Psittacula krameri. Da alle invasive arter po-tentielt udgør et problem, har vi yderligere inkluderet tre arter vandfugle, der i varierende grad har etableret sig i Danmark: Nilgås Alopochen aegyptiaca, Rustand Tadorna ferruginea og Sortsvane Cygnus atratus.
Der er talrige eksempler på, at invasive arter skaber proble-mer, når de introduceres til områder uden for deres naturlige udbredelse. Der er eksempler på, at de invasive arter påvirker

199PhD thesis by Henning Heldbjerg
203Invasive alien birds
andre arter ved fx prædation, hybridisering og konkurrence. De kan også påvirke levesteder ved fx eutroficering og overgræs-ning af vandplanter. Endelig kan de skabe konflikter med men-nesker som følge af spredning af sygdomme og afgrødeskader (se Tab. 1 for eksempler). Da det er svært at forudsige konse-kvenserne ved etablering af en invasiv art i et nyt område, er det bedre at forsøge at stoppe og begrænse arten før indvandring og etablering. Omkostningerne ved at bekæmpe invasive arter vurderes at være stigende, og skønnes at have kostet EU 89 mil-liarder kroner pr. år i de sidste 20 år, dog primært til kontrol af ukrudt. Dette er baggrunden for, at det nye regulativ er trådt i kraft i 2015. Regulativet er en følge af mål 5 i EU’s Biodiversitets-strategi for 2020 om at lave en koordineret indsats på EU-plan for at undgå, minimere og imødegå påvirkningerne af invasive arter.
De forskellige danske fugleovervågningssystemer er gen-nemgået for at undersøge deres anvendelighed for denne analyse, og DOFbasen viste sig at udgøre den bedste database for en vurdering af de syv arters forekomst i Danmark. Da an-vendelsen af DOFbasen er steget markant i den valgte periode (antal observationer med en faktor 2,4; lokaliteter med 1,9; ob-servatører med 2,2) er det nødvendigt at forholde sig til denne ændring. DOFbasens lokaliteter er derfor grupperet inden for et 10 × 10 km netværk, hvortil DOFbasens lokaliteter er grup-peret baseret på deres centerkoordinat. For hver art er herefter anvendt det maksimale antal fugle pr. kvadrat pr. år. På bag-grund af summen af disse maksima beregnes en tendens for artens bestandsudvikling. Antallet af kvadrater pr. år anvendes tilsvarende til at vurdere, om der er sket en ændring i artens udbredelse. For Canadagås fokuseres på dens forekomst i yng-letiden, hvorfor kun rastende fugle fra månederne maj-juli samt ynglende fugle er inkluderet.
Af de nævnte arter vurderes fem at være uproblematiske i øjeblikket, mens bestandsudviklingen for to bør følges nøje. De enkelte arters tendens er vist i Fig. 2 og deres udbredelse i Fig. 3. Et overblik over arternes tendens og status er vist i henholdsvis
Tab. 2 og Tab. 3. De to opmærksomhedskrævende arter er Ca-nadagås og Nilgås. Canadagås har sin primære forekomst her i landet i vinterhalvåret, hvor et stort antal svenske ynglefugle (introducerede) kommer hertil for at overvintre. Både midvin-tertællingerne af vandfugle og vinterpunkttællingerne viser, at denne bestand var i fremgang i 1980erne og 1990erne, top-pede omkring årtusindeskiftet og nu er for nedadgående. Det seneste årti ses dog en fremgang i antallet af fugle i yngletiden, hvilket kan være et tegn på, at arten er ved at etablere sig som fast ynglefugl i Danmark. I Tyskland, nær Østersøkysten spreder Canadagåsen sig og har gjort det i de seneste årtier, og spørgs-målet er, om ikke den danske bestand udvikler sig fra denne og er uafhængig af den svenske?
Nilgås er den anden art, som bør følges nøje. Siden første ynglefund i 2000 er der nu kendskab til talrige ynglepar i Jyl-land med størst koncentration i Sønderjylland, og bestanden er i signifikant fremgang med meget høje antal registreret på lokaliteter nær den dansk-tyske grænse. Spredningen til Dan-mark kommer givetvis sydfra, idet der er meget store bestande af Nilgås i både Holland og Tyskland.
De øvrige arter vurderes ikke at ville udgøre et problem i den nærmeste fremtid. Sortsvane har været signifikant nedad-gående i de seneste 10 år, og Amerikansk Skarveand er næsten helt forsvundet fra den danske natur, ganske givet som følge af en systematisk forfølgelse af arten i Storbritannien, hvor bestan-den er bragt ned fra cirka 13000 i 2000 til blot 15 hunner i 2015.
Rustand har haft en spredt og nogenlunde stabil forekomst i Danmark i perioden. Det er dog værd at bemærke, at der ses en stigning i udbredelse med et højere antal siden 2012, der dog måske kan forklares af, at der netop i 2012 kom unger af et stækket ynglepar fra Tivoli i København, der opholdt sig på mange lokaliteter i hele Storkøbenhavn.
For Alexanderparakit er der kun ganske få observationer om året, og da det er en almindelig burfugl, er det ikke utænkeligt, at det kan skyldes undslupne fugle. Hellig Ibis er registreret med mindst to fugle her i landet, senest i 2007.
Ornamental birds have developed into invasive alien species in many parts of the world. Photo: Steen E. Jensen, Black Swans.Prydfugle har udviklet sig til invasive arter mange steder I verden. Sortsvaner.

200 PhD thesis by Henning Heldbjerg
204 Invasive alien birds
DOFbasen har vist sig at være et glimrende værktøj til at følge udviklingen for de invasive arter i Danmark, og det er vigtigt, at der opretholdes et stort netværk af ornitologer til at bidrage til såvel den systematiske overvågning (fx Atlas, punkt-tællinger og midvintertællinger) som den mindre systematiske overvågning via DOFbasen.
References
Allin, C.C. & T.P. Husband 2004: Mute Swan (Cygnus olor) impact on submerged aquatic vegetation and macroinvertebrates in a Rhode Island coastal pond. – Northeastern Nat. 10: 305-318.
Anstey, S. 1989: The Status and Conservation of the White-headed Duck Oxyura leucocephala. – International Waterfowl and Wet-lands Bureau Special Publication 10.
Asferg, T. 2011: Vildtudbyttestatistik for jagtsæsonen 2010/11. – Report from the Danish Centre for Environment and Energy, Aarhus University.
Asferg, T. 2014: Vildtudbyttestatistik for jagtsæsonen 2013/14. – Report from the Danish Centre for Environment and Energy, Aarhus University.
Banks, A.N., L.J. Wright, I.M.D. Maclean, C. Hann & M.M. Rehfisch 2008: Review of the status of introduced non-native waterbird species in the area of the African-Eurasian Waterbird Agre-ement: 2007 Update. – Report to 8th Meeting of the African Eurasian Waterbird Agreement Technical Committee. BTO, Thetford.
Berndt, R.K., B. Koop. & B. Struwe-Juhl 2002: Vogelwelt Schleswig-Holsteins, Band 5, Brutvogelatlas. – Wachholtz Ver-lag, Neumünster.
Bibby, C. 2000: More than enough exotics? – Brit. Birds 93: 2-3.Blackburn, T.M., F. Essl, T. Evans, P.E. Hulme, J.M. Jeschke, I. Kühn
et al. 2014: A unified classification of alien species based on the magnitude of their environmental impacts. – PLoS Biol. 12: e1001850.
Brand, C.J. 1988: Duck Plague. Pp 117-128 in: M. Friend (ed.): Field Guide to Wildlife Diseases: general field procedures and dis-eases of migratory birds. – US Fish and Wildlife Service Re-source Publication No. 167.
Brand, C. J. & D.D. Docherty 1988: Post-epizootic surveys of wa-terfowl for duck plague (duck viral enteritis). – Avian Dis. 32: 117-128.
Bregnballe, T., T. Asferg, I. Clausager, H. Noer, P. Clausen & T.K. Chri-stensen 2003: Vildtbestande, jagt og jagttider i Danmark 2002: En biologisk vurdering af jagtens bæredygtighed som grund-lag for jagttidsrevisionen 2003. – National Environmental Re-search Institute, Aarhus University Report No. 428.
Burgess, E.C. & T.M. Yuill 1982: Super-infection in ducks persistently infected with duck plague virus. – Avian Dis. 26: 40-46.
Burgess, E.C., J. Ossa & T.M. Yuill 1979: Duck plague: a carrier state in wildfowl. – Avian Dis. 23: 940-949.
Butler, C.J. 2003: Population biology of the introduced Rose-ringed Parakeet Psittacula krameri in the UK. – Unpublished D. Phil thesis, University of Oxford.
Bønløkke, J., J.J. Madsen, K. Thorup, K.T. Pedersen, M. Bjerrum & C. Rahbek 2006: Dansk Trækfugleatlas. – Rhodos, Humlebæk.
Cassey, P., T.M. Blackburn, G.J. Russell, K.E. Jones & J.L. Lockwood 2004: Influences on the transport and establishment of exotic bird species: an analysis of the parrots (Psittaciformes) of the world. – Global Change Biol. 10: 417-426.
Clergeau, P. & P. Yésou 2006: Behavioural flexibility and numerous potential sources of introduction for the sacred ibis: causes of concern in western Europe? – Biol. Invas. 8: 1381-1388.
Conover, M.R. & G.G. Chasko 1985: Nuisance goose problems in the eastern United States. – Wildl. Soc. Bull. 13: 228-233.
Craik, C. 1997: Long-term effects of American Mink Mustela vison on seabirds in western Scotland. – Bird Study 44: 303-309.
Croll, D.A., J.L. Maron, J.E. Estes, E.M. Danner & G.V. Byrd 2005: Intro-duced predators transform subarctic islands from grassland to tundra. – Science 307: 1959-1961.
DAISIE 2014: Delivering Alien Invasive Species Inventories for Europe. European Commission, Brussels. – http://www.eu-rope-aliens.org
Dolbeer, R.A. 2009: Birds and aircraft – fighting for airspace in ever more crowded skies. – Human-Wildlife Conflicts 3: 165-166.
Dybbro, T. 1976: De danske ynglefugles udbredelse. – Dansk Or-nithologisk Forening.
European Commission 2014: European Union Regulation 1143/2014 on Invasive Alien Species. European Commission, Brussels. – http://ec.europa.eu/environment/nature/inva-sivealien/index_en.htm
FERA (Food and Environment Research Agency) 2009: Rose-ringed Parakeets in England: a scoping study of potential damage to agricultural interests and management measures. – Report SID5 to the Department for Environment, Food and Rural Affairs, London.
Fox, A.D. 2009: What makes a good alien? Dealing with the prob-lems of non-native wildfowl. – Brit. Birds 102: 660-679.
Gedeon, K., C. Grüneberg, A. Mitschke, C. Sudfeldt, W. Eikhorst, S. Fischer et al. 2014: Atlas Deutscher Brutvogelarten. Atlas of German Breeding Birds. – Stiftung Vogelmonitoring Deutsch-land und Dachverband Deutscher Avifaunisten. Hohen-stein-Ernstthal.
Gough, R.E. 1984: Laboratory confirmed outbreaks of duck viral enteritis (duck plague) in the United Kingdom 1977-1982. – Vet. Rec. 114: 262-265.
Gough, R.E. & D.J. Alexander 1990: Duck viral enteritis in Great Brit-ain, 1980 to 1989. – Vet. Rec. 127: 262-265.
Green, A.J. & B. Hughes 1996: Action Plan for the White-headed Duck. Pp 119-146 in: B. Heredia, L. Rose & M. Painter (eds.): Globally Threatened Birds in Europe. – Council of Europe, Strasbourg.
Grell, M.B. 1998: Fuglenes Danmark. – Gads Forlag, København.Gyimesi, A. & R. Lensink 2012: Egyptian Goose Alopochen aegypti-
aca: an introduced species spreading in and from the Nether-lands. – Wildfowl 62: 128-145.
Henderson, I. 2009: Progress of the UK Ruddy Duck eradication programme. – Brit. Birds 102: 680-690.
Hernández-Brito, D., M. Carrete, A.G. Popa-Lisseanu, C. Ibáñez & J.L. Tella 2014: Crowding in the City: losing and winning competi-tors of an invasive bird. – PLoS One 9(6): e100593.
Holdaway, R.N. 1999: Introduced predators and avifaunal ex-tinction in New Zealand. Pp 189-238 in: R.D.E MacFee (ed.): Extinction in Near Time. Causes, context and consequences. – Springer, New York.
Hughes, B. 1992: The ecology and behaviour of the Ruddy Duck Oxyura jamaicensis jamaicensis (Gmelin) in Great Britain. – Un-published PhD thesis, University of Bristol.
Hughes, B., J.A. Robinson, A.J. Green, Z.W.D Li & T. Mundkur 2006: International single species action plan for the conservation of the white-headed duck Oxyura leucocephala. – Convention for Migratory Species Technical Series No 13 and Africa-Eurasian Waterbird Agreement Technical Series No 8, Bonn.
Keitt, B.S., C. Wilcox, B.R. Tershy, D.A. Croll & C.J. Donlan 2002: The effect of feral cats on the population viability of black-vented shearwaters (Puffinus opisthomelas) on Natividad Island, Me-xico. – Anim. Conserv. 5: 217-223.

201PhD thesis by Henning Heldbjerg
205Invasive alien birds
Kershaw, M., & B. Hughes 2002: The Winter Status and Distribu-tion of Ruddy Ducks Oxyura jamaicensis in the UK, 1966/67-1999/2000. – WWT/Wetland Advisory Service report to the Central Science Laboratory, Slimbridge.
Koop, B. & R.K. Bernt (eds.) 2014: Vogelwelt Schleswig-Holsteins. Band 7: Zweiter Brutvogelatlas. – Wachholtz Verlag, Neumünster.
Kumschick, S. & W. Nentwig 2010: Some alien birds have as severe an impact as the most effectual alien mammals in Europe. – Biol. Conserv. 143: 2757-2762.
Kurle, C.M, D.A. Croll & B.R. Tershy 2008: Introduced rats indirectly change marine rocky intertidal communities from algae- to invertebrate-dominated. – Proc. Nat. Acad. Sci. USA 105: 3800-3804.
Lange, P. (ed.) 2014: Fugle i Danmark 2013. – Fugleåret 2013: 24-113.
LaPointe, D., T.L. Benning & C. Atkinson 2005: Avian Malaria, Cli-mate Change, and Native Birds of Hawaii. Pp 317-322 in: T.E. Lovejoy & L.J. Hannah (eds.): Climate Change and Biodiversity. – University Press, Yale.
Lever, C. 2010: Naturalized Animals, the ecology of successfully introduced species. – T. & A.D. Poyser, London.
Li, D. & T. Mundkur 2002: Overview and Recommendations for Conservation of the White-headed Duck in Central Asia. – Wet-lands International Report to the Bonn Convention. Wetlands International, Malaysia.
Løppenthin, B. 1967: Danske ynglefugle i fortid og nutid. – Odense Universitetsforlag.
Muñoz-Fuentes, V., C. Vila, A.J. Green, J.J. Negro & M.D. Sørenson 2007: Hybridization between White-headed Ducks and intro-duced Ruddy Ducks in Spain. – Mol. Ecol. 16: 629-638.
Naylor, M. 2004: Potential impacts of Mute Swans to submerged aquatic vegetation in Chesapeake Bay. Pp 36-37 in: M.C. Perry (ed.): Mute Swans and their Chesapeake Bay Habitats: Proceedings of a Symposium. U.S. Geological Survey, Biolog-ical Resources Discipline Information and Technology Report USGS/BRD/ITR 2204-2005. – U.S. Geological Survey, Reston, Virginia, and U.S. Department of the Interior, Washington D.C..
Nichols, T.C. 2014: Integrated damage management reduces graz-ing of wild rice by resident Canada geese in New Jersey. – Wildl. Soc. Bull. 38: 229-236.
Nilsson, L. 2014: Counts of staging and wintering waterfowl and geese in Sweden. Annual report 2013/14. – Department of Biology, Lund University.
Noer, H., M. Søndergaard & T.B. Jørgensen 2008: [Releases of Mal-lard in Denmark and effects on lake phosphorus levels]. – Re-port of the National Environmental Research Institute, Aarhus University. (In Danish) www2.dmu.dk/Pub/FR687.pdf
Nyegaard, T., J.D. Larsen, N. Brandtberg & M.F. Jørgensen 2015: Overvågning af de almindelige fuglearter i Danmark 1975-2014. – Dansk Ornitologisk Forening.
Olsen, K.M. 1988: Sjældne fugle i Danmark og Grønland 1986 og 1987. – Dansk Orn. Foren. Tidsskr. 81: 109-120.
Ottvall, R., L. Edenius, J. Elmberg, H. Engtröm, M. Green, N. Hol-mqvist et al. 2009: Population trends for Swedish breeding birds. – Ornis Svecica 19: 117-192.
Owen, M., D. Callaghan & J. Kirby 2006: Guidelines on Avoidance of Introductions of Non-native Waterbird Species. – AEWA Tech-nical Series No. 12. www.unep-aewa.org/publications/techni-cal_series/ts12_guidelines_non-native-species_complete.pdf
Paludan, K. 1967: Rovfuglenes historie i Danmark. – Naturens Ver-den: 148-161.
Peck, H.L., H.E. Pringle, H.H. Marshall, I.P.F Owens & A.M. Lord 2014: Experimental evidence of impacts of an invasive parakeet on foraging behavior of native birds. – Behav. Ecol. 25: 582-590.
Pell, A. & C. Tidemann 1997: The impact of two exotic hollow-nesting birds on two native parrots in savannah and wood-land in Eastern Australia. – Biol. Conserv. 79: 145-153.
Perry, M.C., P.C. Osenton & E.J.R. Lohnes 2004: Food habits of Mute Swans in Chesapeake Bay. Pp 31-36 in: M.C. Perry (ed.): Mute Swans and their Chesapeake Bay Habitats: Proceedings of a Symposium. U.S. Geological Survey, Biological Resources Dis-cipline Information and Technology Report USGS/BRD/ITR 2204-2005. – U.S. Geological Survey, Reston, Virginia, and U.S. Department of the Interior, Washington D.C..
Pithon, J.A. & C. Dytham 1999: Census of the British Ring-necked Parakeet Psittacula krameri population by simultaneous counts of roosts. – Bird Study 46: 112-115.
Robertson, P.A., T. Adriaens, A. Caizergues, P.A. Cranswick, K. De-vos, C. Gutiérrez-Expósito et al. 2015: Towards the European eradication of the North American ruddy duck. – Biol. Invas. 17: 9-12.
Rutledge, M.E., R.M. Siletzky, W. Gu, L.A. Degernes, C.E. Moorman, C.S. DePerno & S. Kathariou 2013: Characterisation of Campy-lobacter from resident Canada Geese in an urban environment. – J. Wildl. Dis. 49: 1-9.
Sala, O.E., F.S. Chapin III, J.J. Armesto, E. Berlow, J. Bloomfield, R. Dirzo et al. 2000: Global biodiversity scenarios for the year 2100. – Science 287: 1770-1774.
Sossinka, R. 1982: Domestication in birds. Pp 373-403 in: D.S. Far-ner, J.R. King & K.C. Parkes (eds.): Avian Biology Volume 6. – Academic Press, New York.
Strubbe, D. & E. Matthysen 2009: Establishment success of invasive ring-necked and monk parakeets in Europe. – J. Biogeog. 36: 2264-2278.
Sundseth, K. 2014: Invasive Alien Species: A European response. – European Commission DG Environment Units B.2 and B.3, Brussels.
Tatu, K.S., J.T. Anderson, L.J. Hindman & G. Seidel 2007: Mute Swans’ Impact on Submerged Aquatic Vegetation in Chesa-peake Bay. – J. Wildl. Manage. 71: 1431-1439.
Thomson, G.M. 1922: The Naturalization of Animals and Plants in New Zealand. – University Press, Cambridge.
Wanless, R.M., A. Angel, R.J. Cuthbert, G.M. Hilton & P.G. Ryan 2007: Can predation by invasive mice drive seabird extinctions? – Biol. Lett. 3: 241-244.
Watola, G., J. Allan & C. Feare 1996: Problems and management of naturalised introduced Canada Geese Branta canadensis in Britain. Pp 71-77 in: J.S. Holmes & J.R. Simons (eds.): The Intro-duction and Naturalisation of Birds. – HMSO, London.
Williams, M.J. & B. Basse 2006: Indigenous Grey Ducks Anas super-ciliosa and introduced Mallards A. platyrhynchos in New Zea-land: processes and outcome of a deliberate meeting. – Acta Zool. Sin. 52 (Suppl.): 579-582.
Williamson, M. 2002: Alien plants in the British Isles. Pp 91-12 in: D. Pimentel (ed.): Biological Invasions: economic and environ-mental costs of alien plant, animal and microbial species. – CRC Press, Boca Raton.
Anthony D. Fox ([email protected]) & Henning HeldbjergDepartment of BioscienceAarhus UniversityGrenåvej 14DK-8410 Rønde
Henning Heldbjerg & Timme NyegaardDanish Ornitological Society / BirdLife DenmarkVesterbrogade 138-140DK-1620 Copenhagen V


AARHUSUNIVERSITYAU
CITIZEN SCIENCE BASED BIRD POPULATION STUDIES
Citize
n Science
Ba
sed
Bird
Pop
ulatio
n Studie
s
PhD thesis 2017
Henning Heldbjerg
CITIZEN SCIENCE BASEDBIRD POPULATION STUDIES
ISBN: 978-87-xxxxxxxxxxx
He
nning H
eld
bje
rg • PhD
thesis