Embed Size (px)
Citation preview

CITY DEVELOPMENTS LIMITED (REG. NO. 196300316Z)
Page 1
UNAUDITED FOURTH QUARTER AND FULL YEAR FINANCIAL STATEMENT FOR THE YEAR ENDED 31 DECEMBER 2019 PART I – INFORMATION REQUIRED FOR ANNOUNCEMENTS OF QUARTERLY (Q1, Q2 & Q3), HALF-YEAR AND FULL YEAR RESULTS 1(a)(i) An income statement (for the group) together with a comparative statement for the corresponding period of the
immediately preceding financial year.
These figures have not been audited.
Incr/ Incr/2019 2018 (Decr) 2019 2018 (Decr)
S$'000 S$'000 S$'000 S$'000% %
Revenue (1) 946,899 788,314 20.1 3,428,725 4,222,563 (18.8)Cost of sales (521,227) (351,717) 48.2 (1,790,239) (2,308,489) (22.4)
Gross profit (2) 425,672 436,597 (2.5) 1,638,486 1,914,074 (14.4)Other income (3) 1,790 640 NM 175,210 45,567 NM
Administrative expenses (4) (165,843) (140,220) 18.3 (591,093) (528,835) 11.8
Other operating expenses (5) (159,161) (206,653) (23.0) (568,669) (526,231) 8.1Profit from operating activities 102,458 90,364 13.4 653,934 904,575 (27.7)Finance income 28,520 26,416 8.0 108,527 62,825 72.7
Finance costs (64,240) (48,362) 32.8 (204,691) (156,765) 30.6
Net finance costs (6) (35,720) (21,946) 62.8 (96,164) (93,940) 2.4Share of after-tax profit of associates (7) 30,285 20,643 46.7 98,539 38,831 NMShare of after-tax profit of joint ventures (8) 11,238 21,534 (47.8) 97,768 26,072 NMProfit before tax 108,261 110,595 (2.1) 754,077 875,538 (13.9)
Tax expense (9) (13,412) (38,214) (64.9) (140,716) (214,760) (34.5)Profit for the period/year 94,849 72,381 31.0 613,361 660,778 (7.2)
Attributable to:Owners of the Company 87,655 77,947 12.5 564,576 557,330 1.3Non-controlling interests 7,194 (5,566) NM 48,785 103,448 (52.8)Profit for the period/year 94,849 72,381 31.0 613,361 660,778 (7.2)
Earnings per share - basic 9.0 cents 7.9 cents 13.9 60.8 cents 59.9 cents 1.5 - diluted 9.0 cents 7.9 cents 13.9 59.3 cents 58.4 cents 1.5
NM: not meaningful
The Group Fourth Quarter Ended
31 December
The Group Full Year ended
31 December

CITY DEVELOPMENTS LIMITED (REG. NO. 196300316Z)
Page 2
Notes to the Group's Income Statement: (1) The variances in revenue for Q4 2019 and FY 2019 were primarily attributable to the property development segment due to the
timing of revenue recognition for development projects. Q4 2019 revenue from property development segment included contributions from The Tapestry, Whistler Grand and Amber Park,
which were recognised progressively based on their stages of construction of sold units, and fully-sold units in 32 Hans Road, located in United Kingdom (UK). Comparatively, Q4 2018 revenue was recognised largely from New Futura, a completed project.
For FY 2019, revenue from property development segment was recognised mainly from abovementioned Singapore projects that
are still under construction and balance units in Gramercy Park, New Futura, Hong Leong City Center (HLCC), Suzhou and Hongqiao Royal Lake, Shanghai.
Included in FY 2018 revenue was substantial contribution from several completed projects in Singapore and overseas. In
Singapore, these completed projects included New Futura, Gramercy Park and The Criterion Executive Condominium (EC) while overseas projects comprised largely Park Court Aoyama The Tower, Tokyo and HLCC. Revenue from overseas projects was recognised only upon handover of units. Revenue from The Criterion EC was recognised in entirety upon receiving its Temporary Occupation Permit (TOP) in Q1 2018.
Items 14 and 15 of this announcement further analyse the performance by business segments.
(2) Gross profit margin achieved for Q4 2019 was 45%, lower than the comparative period of 55%. This was due to lower profit
margins for recently launched Singapore residential projects vis-à-vis higher contribution by high margin projects, of which revenue was fully recognised on handover in Q4 2018.
For FY 2019, the lower gross profit was due to the property development segment, in tandem with lower revenue. However, the
gross profit margin remained relatively constant as The Criterion EC dampened the gross profit margin in FY 2018. (3) Other income for FY 2019 comprised a gain of $10.5 million on sale of a vacant land parcel at Jervois Road in July 2019, as well
as substantial gains recognised from the partial unwinding of the Group’s Profit Participation Securities (PPS) 1 and the unwinding of PPS 2. PPS 1 In April 2019, the Group acquired the remaining PPS instruments issued by Sunbright Holdings Limited (Sunbright), an associate of the Group, which was established in 2014 under the Group’s PPS 1 structure, in connection with the non-residential components of the Quayside Collection, an integrated development comprising W Singapore – Sentosa Cove hotel and Quayside Isle, a waterfront F&B and retail property, that the Group did not own. With these acquisitions, the Group gained full control of the two properties. As part of the purchase price allocation exercise, a net gain of about $7 million was recorded due to remeasurement of its existing stake in these properties at fair value. PPS 2 In FY 2019, the Group realised deferred gains of $144.3 million and $9.6 million from the divestment of Manulife Centre and 7 & 9 Tampines Grande respectively, from the Group’s PPS 2 structure established in 2015. These were gains on the sale of the two properties in 2015 to Golden Crest Holdings (Golden Crest), an associate of the Group established under the PPS 2 platform and were previously deferred to the extent of the Group’s retained interest in Golden Crest. Following the divestment of these two properties by Golden Crest to external parties in January 2019 and May 2019 respectively, the deferred gains were realised by the Group. Additionally, the Group received distribution of $52.6 million from Golden Crest for its 40% investment in PPS 2 in accordance with the stipulated waterfall distribution. This was accounted under share of after-tax profit of associates. Other income for FY 2018 relates mainly to a gain of $12.4 million on disposal of a vacant shophouse plot at Jalan Besar, together with a gain of $29 million on the divestment of Mercure Brisbane and Ibis Brisbane by CDL Hospitality Trusts (CDLHT), an indirect subsidiary of the Group.
(4) Administrative expenses comprised mainly depreciation, hotel administrative expenses and salaries and related expenses. The increase in administrative expenses for Q4 2019 and FY 2019 was primarily due to depreciation of right-of-use assets following the adoption of SFRS(I) 16 Leases on 1 January 2019 (as detailed in Item 5). Additionally, full quarter/year depreciation of investment properties added to the Group’s portfolio in later part of FY 2018 which included Aldgate House, 125 Old Broad Street, Central Mall Office Tower, Le Grove Serviced Residences (reopened in July 2018) and HLCC retail mall (opened in June 2018) also contributed to the higher depreciation for Q4 2019 and FY 2019. The Group’s acquisition of W Singapore – Sentosa Cove and Quayside Isle in Q2 2019 via the abovementioned PPS 1 financial instruments also contributed to the increase in administrative expenses for the current quarter and year.

CITY DEVELOPMENTS LIMITED (REG. NO. 196300316Z)
Page 3
(5) Other operating expenses included impairment losses recognised/reversed on investment properties and property, plant and
equipment, property taxes, other operating expenses on hotels and professional fees. The increase in other operating expenses for FY 2019 was largely attributable to higher hotel operating expenses due to the addition of W Singapore – Sentosa Cove to the Group’s portfolio in April 2019, as well as one-off costs incurred for the successful privatisation of the Group’s previously 65% owned subsidiary, Millennium & Copthorne Hotels plc (M&C) in October 2019. The increase was partially offset by lower impairment loss recognised by the Group in FY 2019. In Q3 2019, the Group recognised impairment loss of $36.9 million on Millennium Hilton Seoul and Millennium Hilton New York One UN Plaza, owned by M&C. In Q4 2019, additional impairments were made for Millennium Hilton New York One UN Plaza and CDLHT hotels, primarily Raffles Maldives Meradhoo. The total impairment losses on property, plant and equipment in FY 2019 amounted to $60.4 million (FY 2018: $94.1 million).
(6) Net finance costs comprised the following:
Incr/ Incr/Note 2019 2018 (Decr) 2019 2018 (Decr)
S$'000 S$'000 % S$'000 S$'000 %Finance incomeInterest income (i) 28,706 17,654 62.6 79,259 56,798 39.5 Fair value gain on financial derivatives (ii) - 4,062 NM 11,936 6,091 96.0 Fair value gain on financial assets measured at fair value through profit or loss (net) (iii) - 4,703 NM 17,572 - NMLess: finance income capitalised (186) (3) NM (240) (64) NM
28,520 26,416 8.0 108,527 62,825 72.7 Finance costsAmortisation of transaction costs capitalised (2,159) (1,549) 39.4 (7,960) (5,493) 44.9 Interest expenses (iv) (58,355) (39,680) 47.1 (208,993) (136,288) 53.3 Fair value loss on financial derivatives (ii) (3,347) - NM - - NMFair value loss on financial assets measured at fair value through profit or loss (net) (iii) (7,161) - NM - (5,004) NMNet exchange loss (v) (3,351) (10,481) (68.0) (14,034) (18,242) (23.1) Unwinding of discount on non-current liabilities (127) (388) (67.3) (575) (1,723) (66.6) Less: finance costs capitalised 10,260 3,736 NM 26,871 9,985 NM
(64,240) (48,362) 32.8 (204,691) (156,765) 30.6
Net finance costs (35,720) (21,946) 62.8 (96,164) (93,940) 2.4
NM: not meaningful
Fourth Quarter Ended31 December
The Group The GroupFull Year Ended
31 December
(i) The increase in interest income for Q4 2019 and FY 2019 was mainly due to interest income earned on a US$230 million
bond issued by Sincere Property Group, a real estate developer in China which the Group intends to take an approximately 24% equity stake in the developer when relevant conditions, including regulatory approvals, are met.
(ii) Fair value gain/loss on financial derivatives for FY 2019 relates mainly to the net effect arising from the re-measurement of foreign exchange forward contracts and Euro/United States dollar cross-currency interest rate swap contract (CCS) entered into by CDLHT, Sterling Pound/Singapore dollar, Japanese Yen/Singapore dollar, Euro/Singapore dollar and Renminbi/Singapore dollar CCS, foreign currency exchange swap and floating-for-fixed Singapore dollar interest rate swaps entered into by the Company.
Fair value gain for FY 2019 relates mainly to the $12.7 million gain recognised on Renminbi/Singapore dollar foreign currency exchange swap entered by the Group in connection with loan granted to Sincere Property Group.
(iii) This mainly arose from the remeasurement of unquoted debt instruments and investments in equities and funds measured
at fair value through profit or loss. The substantial gain for FY 2019 was largely a result of net fair value gain on the abovementioned Renminbi loan granted to Sincere Property Group, which is classified as an unquoted debt instrument measured at fair value through profit or loss. Fair value gain on this debt instrument for FY 2019 includes interest income of $49.5 million and a translation loss from the depreciation of Renminbi against Singapore dollar. The gain was partially reduced by fair value loss on remeasurement of certain quoted equities.
The loss for Q4 2019 was attributable to translation loss on the abovementioned Renminbi loan granted to Sincere Property Group which had more than offset its interest income component, and fair value loss on remeasurement on certain quoted equities.
(iv) The increase in interest expenses for Q4 2019 and FY 2019 was mainly due to the Group’s higher borrowings to provide various funding requirements including the subscription of US dollar bond issued by Sincere Property Group, along with loan granted to them, acquisition and development of land sites/properties in Singapore and overseas, and acquisition of shares in M&C that the Group did not own.

CITY DEVELOPMENTS LIMITED (REG. NO. 196300316Z)
Page 4
(v) Net exchange loss for Q4 2019 and FY 2019 was mainly due to the translation loss from the weakening of USD denominated
intercompany loan receivables and bank deposits. Net exchange loss for FY 2019 was also attributed to translation loss from the depreciation of Australian dollar and Euro denominated receivables and cash balances against Singapore dollar. The net exchange loss in Q4 2018 and FY 2018 resulted mainly from exchange losses from weakening of Renminbi denominated intercompany loan receivable against Hong Kong dollar and strengthening of United States dollar (USD) denominated bank borrowings against Singapore dollar, as well as depreciation of Australian dollar denominated receivables against Singapore dollar, partially reduced by exchange gains recognised from USD denominated bank deposits held by the Group.
(7) The increase in share of after-tax profit of associates for Q4 2019 and FY 2019 was due to the progressive share of distribution
from Golden Crest of $9.3 million and $52.6 million respectively, arising from the unwinding of PPS 2 structure in May 2019.
In addition, higher contribution from First Sponsor Group Limited (FSGL), following the commencement of handover of units in the Star of East River project in Dongguan, in which FSGL has a 30% stake and recognition of a gain on divestment of Oliphant office property in Amsterdam to its 33% owned equity investee in November 2019 also contributed to the increase.
(8) The significant increase in share of after-tax profit of joint ventures for FY 2019 was due to contribution from South Beach Residences and Boulevard 88 which were launched for sale in Q3 2018 and Q1 2019 respectively, along with returns recognised from the sale of units in the Ivy and Eve project in Brisbane, Australia. The decrease in share of after-tax profit of joint ventures for Q4 2019 was due to lower contribution from South Beach joint venture and Forest Woods as well as higher share of loss from the Group’s investment in Shanghai Distrii Technology Development Co, Ltd, a leading operator of co-working spaces in China, resulted from the effect of adoption of SFRS(I) 16 in which depreciation and interest costs were recognised which were higher than the otherwise operating lease expense. This was partially reduced by contribution from Boulevard 88.
(9) Tax expense for the period/year is derived at by applying the varying statutory tax rates on the taxable profit/(loss) and
taxable/deductible temporary differences of the different countries in which the Group operates.
2019 2018 2019 2018The tax charge relates to the following: S$'m S$'m S$'m S$'m
Profit for the period/year 23.1 21.8 144.1 160.1 (Over provision of land appreciation tax (LAT))/LAT (5.0) 11.2 9.7 57.8 (Over)/Under provision in respect of prior periods/years (4.7) 5.2 (13.1) (3.1)
13.4 38.2 140.7 214.8
The Group
31 DecemberFourth Quarter Ended
The GroupFull Year Ended
31 December
(10) Profit before tax included the following:
2019 2018 2019 2018S$'000 S$'000 S$'000 S$'000
Allowance written back/(made) for doubtful receivables and bad debts written off 1,121 (3,844) (6,643) (4,310) Allowance written back/(made) for foreseeable loss on development properties 4,742 (20,100) 6,524 (19,256) Dividend income 888 836 5,559 6,071 Depreciation and amortisation (77,870) (59,818) (275,987) (218,840) Gain on remeasurement of previously held interest in an associate which became a subsidiary - - 6,608 - Impairment loss on property, plant and equipment (23,526) (94,099) (60,386) (94,099) Impairment loss written back on investment properties 2,414 - 2,414 - Impairment loss on investment in an associate (3,000) - (3,000) - Loss on liquidation of subsidiaries (net) - (6) (79) (41) Loss on dilution of an associate - - (39) - Profit/(Loss) on sale of property, plant and equipment and investment properties (net) 12 (50) 164,988 41,735
The Group
31 DecemberFourth Quarter Ended
The GroupFull Year Ended
31 December

CITY DEVELOPMENTS LIMITED (REG. NO. 196300316Z)
Page 5
1(a)(ii) Consolidated Statement of Comprehensive Income
2019 2018 2019 2018S$'000 S$'000 S$'000 S$'000
Profit for the period/year 94,849 72,381 613,361 660,778
Other comprehensive income:Items that will not be reclassified to profit or loss:Change in fair value of equity instruments measured at fair value through other comprehensive income 65,531 (32,632) 66,786 (34,427) Defined benefit plan remeasurements (2,634) 6,948 (2,634) 6,948
Items that are or may be reclassified subsequently to profit or loss:Effective portion of changes in fair value of cash flow hedges (2,966) (886) (2,997) (2,399) Exchange differences on hedges of net investment in foreign operations 12,952 (699) 7,526 (5,414) Exchange differences on monetary items forming part of net investment in foreign operations 13,129 (12,042) 15,627 (3,460) Exchange differences reclassified to profit or loss on liquidation/cessation of business of foreign operations - - 58 850 Share of translation differences of equity-accounted investees 3,356 (435) (11,530) (8,639) Translation differences arising on consolidation of foreign operations (22,783) (7,612) (85,908) (41,590)
Total other comprehensive income for the period/year, net of tax 66,585 (47,358) (13,072) (88,131)
Total comprehensive income for the period/year 161,434 25,023 600,289 572,647
Attributable to:Owners of the Company 149,051 27,557 579,159 498,405 Non-controlling interests 12,383 (2,534) 21,130 74,242
Total comprehensive income for the period/year 161,434 25,023 600,289 572,647
Fourth Quarter Ended31 December
Full Year Ended31 December
The Group

CITY DEVELOPMENTS LIMITED (REG. NO. 196300316Z)
Page 6
1(b)(i) A statement of financial position (for the issuer and group), together with a comparative statement as at the end of the
immediately preceding financial year.
NoteAs at As at As at As at
31.12.2019 31.12.2018 31.12.2019 31.12.2018S$'000 S$'000 S$'000 S$'000
Non-current assetsProperty, plant and equipment (1) 5,462,367 5,013,300 43,677 13,994 Investment properties (1) 4,410,261 3,741,327 436,510 452,217 Lease premium prepayment (1) - 101,349 - - Investments in subsidiaries - - 2,024,934 2,067,869 Investments in associates (2) 562,876 427,852 - - Investments in joint ventures (3) 1,192,456 1,307,639 37,360 37,360 Financial assets (4) 1,060,292 884,476 375,964 352,831 Other non-current assets (5) 677,732 310,496 5,134,558 3,620,324
13,365,984 11,786,439 8,053,003 6,544,595 Current assetsLease premium prepayment - 3,752 - - Development properties (6) 5,155,642 5,703,910 181,735 182,833 Contract costs 26,151 12,156 - - Contract assets (7) 242,048 107,241 - 42,921 Consumable stocks 16,650 13,254 - - Financial assets (8) 562,681 14,203 - - Assets held for sale (9) 211,375 - - - Trade and other receivables (10) 822,074 955,490 5,521,625 4,426,381 Cash and cash equivalents 2,797,652 2,289,247 1,269,235 727,373
9,834,273 9,099,253 6,972,595 5,379,508
Total assets 23,200,257 20,885,692 15,025,598 11,924,103
Equity attributable to Owners of the CompanyShare capital 1,991,397 1,991,397 1,991,397 1,991,397 Reserves 8,528,853 8,049,300 4,615,886 4,706,110
10,520,250 10,040,697 6,607,283 6,697,507 Non-controlling interests (11) 746,306 2,233,243 - -
Total equity 11,266,556 12,273,940 6,607,283 6,697,507
Non-current liabilitiesInterest-bearing borrowings* (12) 7,673,152 5,068,840 4,211,386 2,192,985 Employee benefits 28,662 26,392 - - Lease liabilities (1) 189,448 - 20,003 - Other liabilities (13) 130,825 262,242 9,912 8,847 Provisions 26,809 36,719 - - Deferred tax liabilities 107,592 113,778 21,242 17,561
8,156,488 5,507,971 4,262,543 2,219,393 Current liabilitiesTrade and other payables (14) 1,198,907 1,293,336 2,799,268 2,510,898 Lease liabilities 17,752 - 5,769 - Contract liabilities (7) 209,503 104,007 - - Interest-bearing borrowings* (12) 2,037,999 1,258,412 1,341,294 437,525 Employee benefits 27,495 26,562 2,364 2,562 Provision for taxation 249,506 385,393 7,077 56,218 Provisions 28,471 36,071 - -
3,769,633 3,103,781 4,155,772 3,007,203 Liabilities directly associated with the assets held for sale (9) 7,580 - - -
Total liabilities 11,933,701 8,611,752 8,418,315 5,226,596
Total equity and liabilities 23,200,257 20,885,692 15,025,598 11,924,103
The Group The Company
* These balances are stated at amortised cost after taking into consideration their related transaction costs.

CITY DEVELOPMENTS LIMITED (REG. NO. 196300316Z)
Page 7
Notes to the statements of financial position of the Group and the Company 1) Following the adoption of SFRS(I) 16 Leases on 1 January 2019, the Group and the Company recognised right-of-use
assets (the right to use leased assets) and lease liabilities (its obligations to make lease payments) in relation to its existing operating lease arrangements. Right-of-use assets that relate to property, plant and equipment are presented within property, plant and equipment while right-of-use assets that relate to investment properties are within investment properties. The Group also reclassified lease premium prepayment (both current and non-current portion) to property, plant and equipment and investment properties. Refer to Item 5 for more details.
Furthermore, the Group consolidated the performance of W Singapore – Sentosa Cove with effect from April 2019 following its acquisition of the remaining PPS instruments under PPS 1 structure, in connection with the non-residential components of the Quayside Collection, an integrated development comprising W Singapore – Sentosa Cove hotel and Quayside Isle that it did not own. Accordingly, the hotel and retail property are now consolidated in property, plant and equipment and investment properties respectively. In addition, the Group completed the acquisition of 100% interests in subsidiaries which own Shanghai Hongqiao Sincere Centre (Phase 2) from Sincere Property Group in Q4 2019, contributing to the increase in investment properties of the Group for the year. Aside from this, the Group also expanded its investment properties portfolio by entering into the fast-growing UK Private Rented Sector, through the acquisition of 100% interests in subsidiaries which own a freehold site located at Monk Bridge in Leeds, UK in Q1 2019, as well as acquiring two freehold residential developments slated for lease in Osaka in Q2 2019 and Q3 2019.
2) The increase in investments in associates at the Group was mainly due to conversion of series 1 perpetual convertible
capital securities (PCCS 1), issued in 2018 by FSGL, to its ordinary shares in Q2 2019. PCCS 1 was previously accounted for as financial assets measured at fair value through other comprehensive income under other non-current assets. With the conversion, the carrying value of PCCS 1 was reclassified to investments in associates.
In addition, the Group acquired 12.5% stake in IREIT Global during the year for a consideration of approximately $60 million.
3) The decrease in investment in joint ventures at the Group was mainly due to return of capital from the mixed-use South Beach development, partially offset with share of profits for the year.
4) The increase in financial assets at the Group was mainly due to the subscription of a US$230 million bond issued by Sincere
Property Group and series 2 of PCCS issued by FSGL. This was partially reduced by full redemption of bonds that the Group previously subscribed for under PPS 2 structure following the divestments of underlying properties in the structure, coupled with the conversion of PCCS 1 disclosed in Note (2) above.
5) The increase in other non-current assets at the Group was largely due to advances granted to equity-accounted investees
to finance the acquisition of Liang Court retail mall and land site at Sims Drive respectively. The increase was also attributable to the reclassification of restricted deposits from cash and cash equivalents to other non-current assets following the refinancing of the related bank borrowings for which the deposits were being pledged.
The increase in other non-current assets at the Company was mainly due to additional loans granted to subsidiaries to meet several funding requirements including the acquisition of 12.5% stake in IREIT Global and 50% stake in IREIT Global Group Pte. Ltd. (the trust manager of IREIT Global), subscription of the aforementioned bond issued by Sincere Property Group as well as advancement of loan to a subsidiary to fund the acquisition of the remaining non-controlling stake in M&C in October 2019. This was partially reduced by repayment of certain existing loans owing by subsidiaries.
6) The movement in development properties was due to development costs incurred, progressive cost recognition for projects
under construction as well as the handover of units for completed projects. The decrease in development properties was due to sold units from completed projects including Park Court Aoyama The Tower, Phase 2 of HLCC, Gramercy Park and New Futura being handed over, along with progressive sales recognised for The Tapestry, Amber Park and Whistler Grand. This was partially reduced by additional development costs incurred in 2019 on Whistler Grand, Piermont Grand, Amber Park, Haus on Handy and UK development properties.
7) Contract assets and liabilities at the Group increased due to timing of revenue recognition vis-à-vis progress billings to the
purchasers. Contract assets for the Company as at 31 December 2018 was due to unbilled receivables on the unit sales of Coco Palms and D’Nest in 2018. The amounts were subsequently billed in 2019.
8) Short-term financial assets at the Group increased significantly in FY 2019 due to the aforementioned loan granted to Sincere
Property Group in January 2019, being reclassified from trade and other receivables to unquoted debt instrument measured at fair value through profit or loss.

CITY DEVELOPMENTS LIMITED (REG. NO. 196300316Z)
Page 8
9) Assets held for sale and the liabilities directly associated to the assets held for sale relate to the proposed divestments of
Novotel Singapore Clarke Quay, Millennium Hotel Cincinnati and Sceptre Hospitality Resources (SHR). On 21 November 2019, CDLHT announced its proposed divestment of Novotel Singapore Clarke Quay to a consortium in which the Group has a 50% interest for a consideration of S$375.9 million. The divestment is expected to complete in Q2 2020. The Group had the intention to sell its entire 75.1% interest in the common units and voting interest in SHR based on an offer received from a third party during the year for a total consideration of US$47.6 million. The sale is expected to complete in 1H 2020. During the year, M&C entered into a sales and purchase agreement to sell Millennium Hotel Cincinnati to a third party for a consideration of US$36 million. The sale was completed on 14 February 2020. Accordingly, their related assets and liabilities were reclassified to assets and liabilities held for sale.
10) The decrease in trade and other receivables at the Group was mainly due to the decrease in loans owing by joint ventures following their progressive repayments. Trade and other receivables at the Company increased mainly due to advances extended to subsidiaries to provide funding for the Group’s share of contribution towards the acquisition of land site at Sims Drive and Liang Court retail mall as well as to fund the loan granted to Sincere Property Group.
11) The substantial decrease in non-controlling interests was a result of the buyout of minority interests’ 35% stake in M&C upon the privatisation of this subsidiary.
12) The overall increase in interest-bearing borrowings (current and non-current portion) at the Group and Company was mainly due to loans taken up and new medium term notes issued to meet several funding requirements including the subscription of the US dollar bond issued by Sincere Property Group, along with loan granted to them, acquisition of a 100% stake in subsidiaries which own Shanghai Hongqiao Sincere Centre (Phase 2) from Sincere Property Group, acquisition of shares in M&C that the Group did not already own pursuant to the privatisation exercise as well as acquisition and development of land sites/properties both in Singapore and overseas.
Further, the Group also consolidated the existing borrowings of Shanghai Hongqiao Sincere Centre (Phase 2) upon its acquisition.
13) The decrease in other liabilities at the Group was mainly due to realisation of a deferred gain of $153.9 million following the divestment of Manulife Centre and 7 & 9 Tampines Grande to external parties in relation to the Group’s PPS 2 structure.
14) The increase in trade and other payables at the Company was mainly due to advances granted primarily from a wholly-
owned subsidiary via proceeds from a bond issuance by that subsidiary.

CITY DEVELOPMENTS LIMITED (REG. NO. 196300316Z)
Page 9
1(b)(ii) Aggregate amount of group’s borrowings and debt securities. The Group’s net borrowings refer to aggregate borrowings from banks, financial institutions and lease liabilities, after deducting
cash and cash equivalents. Unamortised balance of transaction costs had not been deducted from the gross borrowings.
As at As at31.12.2019 31.12.2018
S$'000 S$'000Unsecured- repayable within one year 1,827,113 1,011,789 - repayable after one year 6,027,540 3,644,924
(a) 7,854,653 4,656,713
Secured- repayable within one year 229,583 247,209 - repayable after one year 1,850,621 1,438,724
(b) 2,080,204 1,685,933
Gross borrowings (a) + (b) 9,934,857 6,342,646 Less: cash and cash equivalents as shown in the statement of financial position (2,797,652) (2,289,247) Less: restricted deposits included in other non-current assets (284,691) (222,979) Less: cash and cash equivalents classified under assets held for sale (1,429) - Net borrowings 6,851,085 3,830,420
Details of any collateral
Where secured, borrowings are collateralised by: - mortgages on the borrowing companies’ hotels, investment and development properties; - assignment of all rights and benefits to sale, lease and insurance proceeds in respect of hotels, investment and development
properties; - pledge of cash deposits; - pledge of shares in a non-wholly owned subsidiary; - a statutory lien on certain assets of foreign subsidiaries; and - statutory preferred right over the assets of a foreign subsidiary.

CITY DEVELOPMENTS LIMITED (REG. NO. 196300316Z)
Page 10
1(c) A statement of cash flows (for the group), together with a comparative statement for the corresponding period of the
immediately preceding financial year.
2019 2018 2019 2018S$'000 S$'000 S$'000 S$'000
Cash flows from operating activitiesProfit for the period/year 94,849 72,381 613,361 660,778
Adjustments for:Depreciation and amortisation 77,870 59,818 275,987 218,840 Dividend income (888) (836) (5,559) (6,071) Equity settled share-based transactions - (994) - 636 Finance costs 44,773 27,373 190,657 124,818 Finance income (6,142) (26,416) (107,633) (62,825) Loss on liquidation of subsidiaries/dilution of an associate (net) - 6 118 41 Impairment loss on investment properties and property, plant and equipment (net) 21,112 94,099 57,972 94,099 Impairment loss on investment in an associate 3,000 - 3,000 - Gain on remeasurement of previously held interest in an associate which became a subsidiary - - (6,608) - (Profit)/Loss on sale of property, plant and equipment and investment properties (net) (12) 50 (164,988) (41,735) Property, plant and equipment and investment properties written off 778 2,772 3,469 4,007 Share of after-tax profit of associates (30,285) (20,643) (98,539) (38,831) Share of after-tax profit of joint ventures (11,238) (21,534) (97,768) (26,072) Tax expense 13,412 38,214 140,716 214,760
Operating profit before working capital changes 207,229 224,290 804,185 1,142,445
Changes in working capitalDevelopment properties 146,340 16,693 382,624 (1,362,237) Consumable stocks and trade and other receivables 55,672 168,415 15,745 101,426 Contract costs (9,677) (12,065) (13,995) 611 Contract assets (81,332) 26,730 (134,807) 201,186 Trade and other payables (75,304) (65,855) (77,463) (223,122) Contract liabilities 29,485 (74,219) 103,711 (252,110) Employee benefits 2,893 580 303 2,858 Cash generated from/(used in) from operations 275,306 284,569 1,080,303 (388,943)
Tax paid (10,616) (5,620) (243,915) (210,689)
Net cash from/(used in) operating activities (1) 264,690 278,949 836,388 (599,632)
Cash flows from investing activitiesAcquisition of subsidiaries (net of cash acquired) (2) (152,253) (981,427) (244,298) (1,309,243) Repayment of advances/(Advances granted) to a real estate developer in China (3) 105,653 - (552,200) - Capital expenditure on investment properties (40,229) (24,133) (88,920) (60,016) Dividends received- an associate 10,364 1,630 63,035 6,747 - financial investments 888 836 5,559 6,071 - joint ventures 10,087 - 35,628 33,383 Increase in amounts owing by equity-accounted investee (non-trade) (4) (58,149) (172,685) (297,083) (187,984) Increase in investments in associates (5) - (373) (64,917) (15,185) Decrease in investments in joint ventures (6) 123,774 - 167,031 8,146 Interest received 32,615 13,521 77,388 49,712 Payment for intangible assets (524) (34) (524) (38) Payments for purchase of property, plant and equipment (53,036) (69,141) (218,405) (201,087) Purchase of investment properties (7) (15,579) - (41,760) (30,726) Purchase of financial assets (net) (8) (10,697) (37,951) (408,728) (122,748) Proceeds from distribution from investments in financial assets (9) 45,486 639 180,920 1,332 Proceeds from sale of property, plant and equipment and investment properties (10) 1,069 208 14,157 94,736 Settlement of financial derivatives 5,183 - 22,873 (1,827) Cash flows from/(used in) investing activities 4,652 (1,268,910) (1,350,244) (1,728,727)
Fourth Quarter Ended Full Year Ended31 December 31 December

CITY DEVELOPMENTS LIMITED (REG. NO. 196300316Z)
Page 11
2019 2018 2019 2018S$'000 S$'000 S$'000 S$'000
Cash flows from financing activitiesAcquisition of non-controlling interests (1,330,014) (1,142) (1,330,014) (1,208) Capital contribution from/(distribution to) non-controlling interests - 506 (9,829) (2,605) Decrease in deposits pledged to financial institutions 28,516 8,971 58,251 43,076 Dividends paid (7,086) (10,507) (268,671) (285,308) Repayment of lease liabilities and finance lease payable (6,827) (24) (17,022) (142) Increase in restricted cash (4,560) (188) (4,093) (59) Increase/(Decrease) in other long-term liabilities - 2,589 - (1,318) Interest paid (including amounts capitalised in investment properties, property, plant and equipment and development properties) (60,457) (41,009) (187,100) (127,817) Net (repayment to)/advances from related parties (non-trade) (104,706) 1,741 29,116 105,298 Net proceeds from revolving credit facilities and short-term bank borrowings 270,795 864,013 1,183,133 857,047 Payment of issue expenses by a subsidiary (230) - (230) (30) Payment of financing transaction costs (542) (3,505) (11,632) (8,071) Proceeds from borrowings 1,269,029 91,269 2,059,709 1,172,543 Proceeds from issuance of bonds and notes - 61,000 900,000 79,300 Purchase of treasury shares - (5,774) - (21,442) Repayment of bank borrowings (257,385) (320,614) (856,975) (582,528) Repayment of bonds and notes (2,714) - (395,275) (329,150) Cash flows (used in)/from financing activities (11) (206,181) 647,326 1,149,368 897,586
Net increase/(decrease) in cash and cash equivalents 63,161 (342,635) 635,512 (1,430,773)
Cash and cash equivalents at beginning of the period/year 2,726,845 2,501,125 2,162,373 3,599,044 Effect of exchange rate changes on balances held in foreign currencies (437) 3,883 (8,316) (5,898)
Cash and cash equivalents at end of the period/year 2,789,569 2,162,373 2,789,569 2,162,373
Cash and cash equivalents comprise:-Cash and cash equivalents as shown in the statement of financial position 2,797,652 2,289,247 2,797,652 2,289,247 Restricted deposits included in other non-current assets 284,691 222,979 284,691 222,979 Cash and cash equivalents included in assets held for sale 1,429 - 1,429 - Less: Deposits pledged to financial institutions (288,807) (348,515) (288,807) (348,515) Less: Restricted cash (5,395) (1,338) (5,395) (1,338) Less: Bank overdrafts (1) - (1) -
2,789,569 2,162,373 2,789,569 2,162,373
Fourth Quarter Ended31 December
Full Year Ended31 December

CITY DEVELOPMENTS LIMITED (REG. NO. 196300316Z)
Page 12
Notes to the statement of cash flows
(1) The cash outflows for FY 2018 were due to the payment for land sites at Handy Road, West Coast Vale and Sumang Walk,
as well as the collective en bloc acquisition of Amber Park.
(2) The cash outflows for Q4 2019 were mainly due to the payment for the acquisition of 100% stake in subsidiaries which own Shanghai Hongqiao Sincere Centre (Phase 2). Cash outflows for FY 2019 also included payments made to acquire the remaining PPS 1 instruments issued by Sunbright, in connection to the non-residential components of the Quayside Collection which the Group did not own and the acquisition of 100% interest in subsidiaries which own a freehold site located at Monk Bridge in Leeds, UK.
The cash outflows for Q4 2018 and FY 2018 relate mainly to the payment for the acquisition of subsidiaries which own 125 Old Broad Street, Central Mall Office Tower and Hotel Cerretani Firenze. For FY 2018, it also included the consideration paid for the acquisition of 100% interest in subsidiaries which own Aldgate House, London in Q3 2018.
(3) The cash outflows for FY 2019 were in relation to the loan granted to Sincere Property Group. In Q4 2019, part of the
advances granted to Sincere were repaid upon the completion of the acquisition of 100% stake in subsidiaries which own Shanghai Hongqiao Sincere Centre (Phase 2).
(4) The cash outflows for Q4 2019 were mainly due to advances granted to IREIT Global, an associate acquired by the Group during the year. FY 2019 cash outflows also included advances granted to equity-accounted investees to fund the acquisition of a land site at Sims Drive and Liang Court retail mall.
(5) The cash outflows for FY 2019 were largely due to the Group’s acquisition of 12.5% stake in IREIT Global. The cash outflows
for FY 2018 relate primarily to the Group’s investment in Suzhou Dragonrise Pan-Artificial Intelligence High-Tech Fund. (6) The net cash inflows for Q4 2019 and FY 2019 were mainly due to the return of capital from South Beach Consortium (SBC).
The cash inflows for FY 2019 were partially reduced by cash outflows for investment in 50% stake in IREIT Global Group Pte. Ltd. (the trust manager for IREIT Global) as well as additional investment in Shanghai Distrii Technology Development Co., Ltd.
The net cash inflows for FY 2018 relate mainly to the return of principal of the Group’s investment via preferred equity interest in a joint development of a prime residential land site in Brisbane, partially reduced by the progressive investment in SBC.
(7) The cash outflows for Q4 2019 were due to the acquisition of Pregio Joto Chuo, a freehold residential project in Osaka, Japan.
Included in the cash outflows for FY 2019 was the consideration paid for the acquisition of Horie Lux, a 34-unit freehold residential property, which is also in Osaka. The cash outflows for FY 2018 were in relation to the acquisition of an office block within the Yaojiang International Complex in Shanghai’s prime North Bund Business District.
(8) The significant cash outflows for FY 2019 were largely due to the Group’s subscription of a US$230 million bond issued by Sincere Property Group. The cash outflows for Q4 2019 were mainly due to additional investment in Real Estate Capital Asia Partners V, a private real estate fund and Corsair V Financial Services Capital Partners, a private investment fund.
(9) The cash inflows for Q4 2019 relate largely to interest income received from the aforementioned loan granted to Sincere
Property Group. The significant cash inflows for FY 2019 also included proceeds from the redemption of bonds issued by In-V Asset Holding Pte. Ltd., a financing vehicle under the PPS 2 platform for which the Group subscribed to previously.
(10) The proceeds from the sale of property, plant and equipment and investment properties for FY 2019 relate largely to the proceeds received from the divestment of a vacant land parcel at Jervois Road in July 2019. The FY 2018 proceeds relate mainly to proceeds received from the disposal of a vacant shophouse plot at Jalan Besar in Q3 2018 and the divestment of Mercure Brisbane and Ibis Brisbane by CDLHT in Q1 2018.
(11) The Group had net cash outflows from financing activities of $206.2 million (Q4 2018: net cash inflows of $647.3 million) for Q4 2019 and net cash inflows of $1,149.4 million (FY 2018: $897.6 million) for FY 2019.
The net cash outflows for Q4 2019 were resulted from payment made for the acquisition of shares in M&C that the Group did not already own pursuant to the privatisation exercise in October 2019 and increase in advances to related parties. This was largely offset with a net increase in borrowings of $1,279.7 million. For FY 2019, the net cash inflows were largely due to net increase in borrowings of $2,890.6 million which were raised to provide various funding requirements including subscription of the bond issued by Sincere Property Group and loan granted to them, abovementioned acquisition of shares in M&C, as well as acquisition/development of land sites/properties in Singapore and overseas. This was offset by payment made for the acquisition of shares in M&C and dividends paid during the year. The net cash inflows for Q4 2018 were mainly due to increase in borrowings of $695.7 million to finance the purchase of overseas and local properties. For FY 2018, the net cash inflows were due to increase in borrowings of $1,197.2 million primarily used for the purchase of Amber Park and Sumang Walk land site which the Group has 80% and 60% interest respectively, and advances from fellow subsidiaries for their share of contribution towards the acquisition of these 2 land sites. The above cash inflows were partially offset by cash outflows arising from dividends paid and purchase of the Company’s shares.

CITY DEVELOPMENTS LIMITED (REG. NO. 196300316Z)
Page 13
1(d)(i) A statement (for the issuer and group) showing either (i) all changes in equity or (ii) changes in equity other than those
arising from capitalisation issues and distributions to shareholders, together with a comparative statement for the corresponding period of the immediately preceding financial year.
Exch. Non-The Group Share Cap. Other Fluct. Accum. controlling Total
Capital Res. Res.* Res. Profits Total Interests EquityS$m S$m S$m S$m S$m S$m S$m S$m
At 1 January 2019 1,991.4 185.9 16.6 (119.5) 7,966.3 10,040.7 2,233.2 12,273.9
Profit for the year - - - - 564.6 564.6 48.8 613.4
Other comprehensive income for the year, net of tax - (0.2) 58.1 (45.6) 2.3 14.6 (27.7) (13.1) Total comprehensive income for the year - (0.2) 58.1 (45.6) 566.9 579.2 21.1 600.3
Transactions with owners, recorded directly in equity
Contributions by and distributions to ownersCapital distribution to non-controlling interests (net) - - - - - - (9.4) (9.4) Dividends - - - - (194.3) (194.3) (74.8) (269.1) Issue expenses of a subsidiary - (0.1) - - - (0.1) (0.1) (0.2) Transfer to statutory reserve - - 1.2 - (1.2) - - - Total contributions by and distributions to owners - (0.1) 1.2 - (195.5) (194.4) (84.3) (278.7)
Changes in ownership interests in subsidiariesAcquisition of subsidiaries with non-controlling interests - - - - - - 1.0 1.0 Change of interests in subsidiaries without loss of control - 94.7 - - - 94.7 (1,424.7) (1,330.0) Total change in ownership interests in subsidiaries - 94.7 - - - 94.7 (1,423.7) (1,329.0)
Total transactions with owners - 94.6 1.2 - (195.5) (99.7) (1,508.0) (1,607.7)
At 31 December 2019 1,991.4 280.3 75.9 (165.1) 8,337.7 10,520.2 746.3 11,266.5
* Other reserves comprise mainly fair value reserve arising from re-measurement of financial assets at fair value through other comprehensive income, hedging reserve, share of other reserve of associates, statutory reserve and share option reserve.
Attributable to Owners of the Company

CITY DEVELOPMENTS LIMITED (REG. NO. 196300316Z)
Page 14
Exch. Non-The Group Share Cap. Other Fluct. Accum. controlling Total
Capital Res. Res.* Res. Profits Total Interests EquityS$m S$m S$m S$m S$m S$m S$m S$m
At 1 January 2018 1,991.4 182.1 42.6 (95.4) 7,633.7 9,754.4 2,254.8 12,009.2
Profit for the year - - - - 557.3 557.3 103.4 660.7
Other comprehensive income for the year, net of tax - - (39.3) (24.1) 4.5 (58.9) (29.2) (88.1) Total comprehensive income for the year - - (39.3) (24.1) 561.8 498.4 74.2 572.6
Transactions with owners, recorded directly in equity
Contributions by and distributions to ownersCapital distribution to non-controlling interests (net) - - - - - - (2.1) (2.1) Dividends - - - - (194.7) (194.7) (91.1) (285.8) Purchase of treasury shares - - - - (21.4) (21.4) - (21.4) Share-based payment transactions - - 0.2 - - 0.2 0.1 0.3 Transfer to statutory reserve - - 13.1 - (13.1) - - - Total contributions by and distributions to owners - - 13.3 - (229.2) (215.9) (93.1) (309.0)
Changes in ownership interests in subsidiariesAcquisition of subsidiaries with non-controlling interests - - - - - - 2.3 2.3 Change of interests in subsidiaries without loss of control - 3.8 - - - 3.8 (5.0) (1.2) Total change in ownership interests in subsidiaries - 3.8 - - - 3.8 (2.7) 1.1
Total transactions with owners - 3.8 13.3 - (229.2) (212.1) (95.8) (307.9)
At 31 December 2018 1,991.4 185.9 16.6 (119.5) 7,966.3 10,040.7 2,233.2 12,273.9
* Other reserves comprise mainly fair value reserve arising from re-measurement of financial assets at fair value through other comprehensive income, hedging reserve, share of other reserve of associates, statutory reserve and share option reserve.
Attributable to Owners of the Company
CITY DEVELOPMENTS LIMITED (REG. NO. 196300316Z)
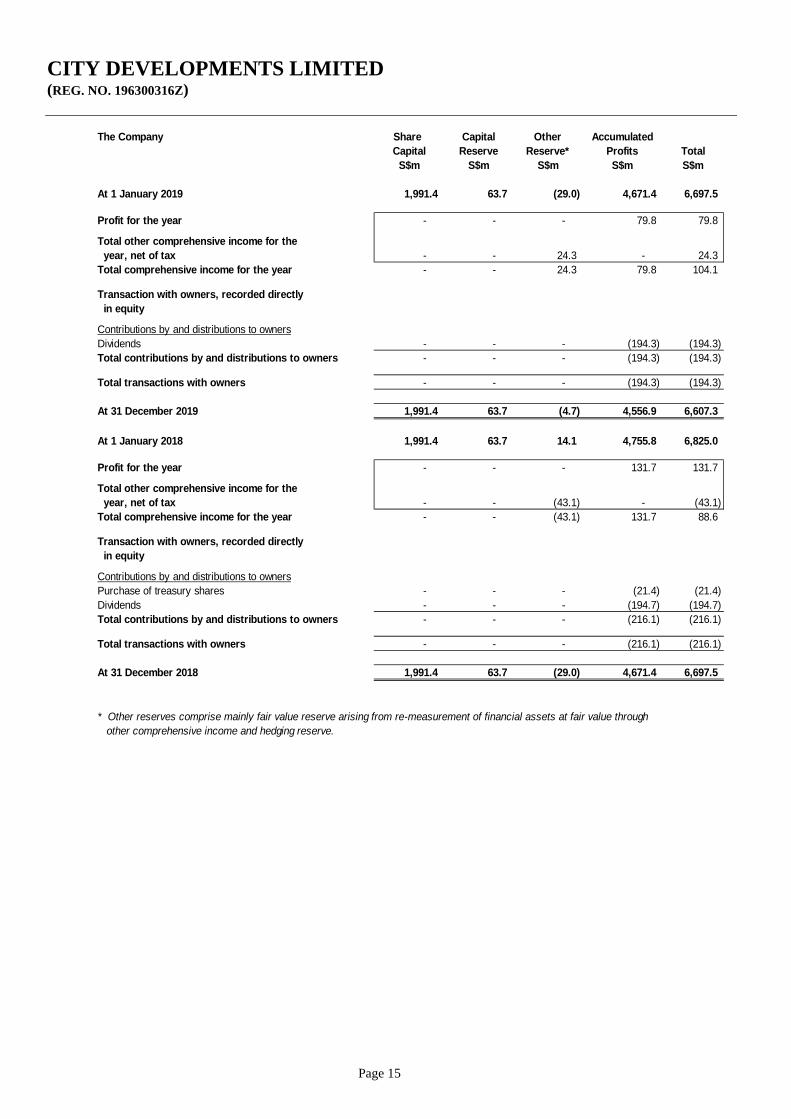
Page 15
The Company Share Capital Other Accumulated
Capital Reserve Reserve* Profits TotalS$m S$m S$m S$m S$m
At 1 January 2019 1,991.4 63.7 (29.0) 4,671.4 6,697.5
Profit for the year - - - 79.8 79.8
Total other comprehensive income for the year, net of tax - - 24.3 - 24.3 Total comprehensive income for the year - - 24.3 79.8 104.1
Transaction with owners, recorded directly in equity
Contributions by and distributions to ownersDividends - - - (194.3) (194.3) Total contributions by and distributions to owners - - - (194.3) (194.3)
Total transactions with owners - - - (194.3) (194.3)
At 31 December 2019 1,991.4 63.7 (4.7) 4,556.9 6,607.3
At 1 January 2018 1,991.4 63.7 14.1 4,755.8 6,825.0
Profit for the year - - - 131.7 131.7
Total other comprehensive income for the year, net of tax - - (43.1) - (43.1) Total comprehensive income for the year - - (43.1) 131.7 88.6
Transaction with owners, recorded directly in equity
Contributions by and distributions to ownersPurchase of treasury shares - - - (21.4) (21.4) Dividends - - - (194.7) (194.7) Total contributions by and distributions to owners - - - (216.1) (216.1)
Total transactions with owners - - - (216.1) (216.1)
At 31 December 2018 1,991.4 63.7 (29.0) 4,671.4 6,697.5
* Other reserves comprise mainly fair value reserve arising from re-measurement of financial assets at fair value through other comprehensive income and hedging reserve.

CITY DEVELOPMENTS LIMITED (REG. NO. 196300316Z)
Page 16
1(d)(ii) Details of any changes in the company's share capital arising from rights issue, bonus issue, subdivision, consolidation,
share buy-backs, exercise of share options or warrants, conversion of other issues of equity securities, issue of shares for cash or as consideration for acquisition or for any other purpose since the end of the previous period reported on. State the number of shares that may be issued on conversion of all the outstanding convertibles, if any, against the total number of issued shares excluding treasury shares and subsidiary holdings of the issuer, as at the end of the current financial period reported on and as at the end of the corresponding period of the immediately preceding financial year. State also the number of shares held as treasury shares and the number of subsidiary holdings, if any, and the percentage of the aggregate number of treasury shares and subsidiary holdings held against the total number of shares outstanding in a class that is listed as at the end of the current financial period reported on and as at the end of the corresponding period of the immediately preceding financial year.
Ordinary share capital
There was no change in the Company’s issued share capital during the three months ended 31 December 2019.
Preference share capital
There was no change in the Company’s issued preference share capital during the three months ended 31 December 2019.
As at 31 December 2019, the maximum number of ordinary shares that may be issued upon full conversion of all of the non-redeemable convertible non-cumulative preference shares of the Company (“Preference Shares”) at the sole option of the Company is 44,998,898 ordinary shares (31 December 2018: 44,998,898 ordinary shares).
1(d)(iii) To show the total number of issued shares excluding treasury shares as at the end of the current financial period and as at the end of the immediately preceding year.
Ordinary share capital
As at 31 December 2019, the total number of issued ordinary shares (excluding treasury shares) was 906,901,330 (31 December 2018: 906,901,330). Preference share capital
The total number of issued Preference Shares as at 31 December 2019 and 31 December 2018 was 330,874,257.
Treasury Shares As at 31 December 2019, the Company held 2,400,000 treasury shares (31 December 2018: 2,400,000) which represents 0.26%
of the total number of issued shares (excluding treasury shares). 1(d)(iv) A statement showing all sales, transfers, cancellation and/or use of treasury shares as at the end of the current financial
period reported on. There were no sales, transfers, disposal, cancellation and/or use of treasury shares during the three months ended 31 December
2019.
1(d)(v) A statement showing all sales, transfers, cancellation and/or use of subsidiary holdings as at the end of the current financial period reported on.
Not applicable. 2. Whether the figures have been audited or reviewed and in accordance with which auditing standard or practice.
The figures have neither been audited nor reviewed by our auditors.
3. Where the figures have been audited or reviewed, the auditors’ report (including any qualifications or emphasis of a matter).
Not applicable.
4. Whether the same accounting policies and methods of computation as in the issuer’s most recently audited annual financial statements have been applied.
Except as disclosed in Item 5 below, the Group has applied the same accounting policies and methods of computation in the financial statements for the current financial period as those applied in the Group's most recently audited financial statements for the year ended 31 December 2018.

CITY DEVELOPMENTS LIMITED (REG. NO. 196300316Z)
Page 17
5. If there are any changes in the accounting policies and methods of computation, including any required by an
accounting standard, what has changed, as well as the reasons for, and the effect of, the change.
The new/revised SFRS(I)s applicable for the financial period beginning 1 January 2019 are as follows: SFRS(I) 16 Leases SFRS(I) INT 23 Uncertainty over Income Tax Treatment Long-term Interests in Associates and Joint Ventures (Amendments to SFRS(I) 1-28) Prepayment Features with Negative Compensation (Amendments to SFRS(I) 9) Previously Held Interest in a Joint Operation (Amendments to SFRS(I) 3 and 11) Income Tax Consequences of Payments on Financial Instruments Classified as Equity (Amendments to SFRS(I) 1-12) Borrowing Costs Eligible for Capitalisation (Amendments to SFRS(I) 1-23) Plan Amendment, Curtailment or Settlement (Amendments to SFRS(I) 1-19) SFRS(I) 16 SFRS(I) 16 introduces a single, on-balance sheet lease accounting model for lessees. A lessee recognises a right-of-use (ROU) asset representing its rights to use the underlying asset and a lease liability representing its obligation to make lease payments. Remaining lease payments under the operating leases will be recognised at their present value discounted using an appropriate discount rate and the nature of expenses will now change as SFRS(I) 16 replaces the straight-line operating lease expense with depreciation charge of ROU assets and interest expense on lease liabilities. As a lessee, the Group had adopted SFRS(I) 16 using the modified retrospective approach. Therefore, the cumulative effect of adoption SFRS(I) 16 was recognised as an adjustment to the opening balance of accumulated profits at 1 January 2019, with no restatement of comparative information. The Group had applied the practical expedient to grandfather the definition of a lease on transition and the practical expedient to recognise ROU assets equal to its lease liabilities as at 1 January 2019.
The adoption of SFRS(I) 16 resulted in adjustments to the statement of financial position of the Group as at 1 January 2019.
Statement of financial position
1.1.2019$'000
Increase in property, plant and equipment 260,970 Increase in investment properties 43,861 Decrease in lease premium prepayment (105,101) Increase in lease liabilities (204,439) Decrease in trade and other receivables (1,522) Decrease in other liabilities 6,476 Increase in trade and other payables (245)
As a result of initially applying SFRS(I) 16, in relation to the leases that were previously classified as operating leases, the Group recorded right-of-use assets of $297.9 million and lease liabilities of $207.1 million as at 31 December 2019. In relation to those leases under SFRS(I) 16, the Group has recognised depreciation and interest costs, instead of operating lease expense. During the year ended 31 December 2019, the Group recognised depreciation charge of $23.5 million and interest costs of $8.4 million from these leases.
The Group had also early applied Amendments to SFRS(I) 3: Definition of a Business which is effective on 1 January 2020. Amendments to SFRS(I) 3: Definition of a Business The Accounting Standards Council (ASC) has issued amendments to the guidance in SFRS(I) 3, ‘Business Combinations’, that
revises the definition of a business. The new guidance provides a framework to evaluate when an input and a substantive process are present (including for early
stage companies that have not generated outputs). To be a business without outputs, there will now need to be an organised workforce. The definition of the term ‘outputs’ is narrowed to focus on goods and services provided to customers, generating investment income and other income, and it excludes returns in the form of lower costs and other economic benefits. It is also no longer necessary to assess whether market participants are capable of replacing missing elements or integrating the acquired activities and assets.
An entity can apply a ‘concentration test’ that, if met, eliminates the need for further assessment. Under this optional test, where
substantially all the fair value of gross assets acquired is concentrated in a single asset (or a group of similar assets), the assets acquired would not represent a business.

CITY DEVELOPMENTS LIMITED (REG. NO. 196300316Z)
Page 18
6. Earnings per ordinary share of the group for the current financial period reported on and the corresponding period of
the immediately preceding financial year, after deducting any provision for preference dividends.
2019 2018 2019 2018
Basic Earnings per share (cents) 9.0 7.9 60.8 59.9
Diluted Earnings per share (cents) 9.0 7.9 59.3 58.4
Earnings per share is calculated based on:
a) Profit attributable to owners of the Company (S$'000) (*) 81,185 71,477 551,672 544,426 b) Profit used for computing diluted earnings per share (S$'000) 81,185 71,477 564,576 557,330 c) Weighted average number of ordinary shares in issue: - basic 906,901,330 907,002,417 906,901,330 908,581,604 - diluted (**) 906,901,330 907,002,417 951,900,228 953,580,502
* After deducting preference dividends of $6,470,000 paid in Q4 2019 (Q4 2018: $6,470,000) and in full year 2019 of $12,904,000 (FY 2018: $12,904,000).** For computation of diluted earnings per share, the weighted average number of ordinary shares has been adjusted for any dilutive effect of potential ordinary shares arising from the conversion of all preference shares. For the fourth quarter ended 31.12.2019 and 31.12.2018, the preference shares were antidilutive and therefore excluded from the computation of diluted earnings per share.
Fourth Quarter Ended31 December
Full Year Ended31 December
7. Net asset value (for the issuer and group) per ordinary share based on the total number of issued shares (excluding
treasury shares) of the issuer at the end of the: - (a) current financial period reported on; and (b) immediately preceding financial year.
31.12.2019 31.12.2018 31.12.2019 31.12.2018S$ S$ S$ S$
Net Asset Value per ordinary share based on the number of issued 906,901,330 ordinary shares (excluding treasury 11.60 11.07 7.29 7.39shares) as at 31 December 2019 (906,901,330 ordinary shares(excluding treasury shares) as at 31 December 2018)
The CompanyThe Group
8. A review of the performance of the group, to the extent necessary for a reasonable understanding of the group’s
business. It must include a discussion of the following: -
(a) any significant factors that affected the turnover, costs, and earnings of the group for the current financial period reported on, including (where applicable) seasonal or cyclical factors; and
(b) any material factors that affected the cash flow, working capital, assets or liabilities of the group during the current financial period reported on.
Group Performance
The Group delivered a resilient performance despite the challenging macroeconomic environment. For the fourth quarter ended 31 December 2019 (Q4 2019), net attributable profit after tax and non-controlling interests (PATMI) increased by 12.5% to $87.7 million (Q4 2018: $77.9 million). PATMI for the year ended 31 December 2019 (FY 2019) increased 1.3% to $564.6 million (FY 2018: $557.3 million).
Q4 2019 Revenue for Q4 2019 rose 20.1% to $946.9 million (Q4 2018: $788.3 million) with increased contribution across all business segments. Property development segment was backed by several Singapore projects including The Tapestry, Whistler Grand and Amber Park, as well as the fully sold 32 Hans Road project in the UK. The inclusion of W Singapore – Sentosa Cove into the Group’s hotel portfolio in Q2 2019 bolstered the increase for the hotel operations segment. Furthermore, the acquisition of UK’s Aldgate House and 125 Old Broad Street (OBS) in late 2018 boosted the investment properties segment for Q4 2019 revenue.

CITY DEVELOPMENTS LIMITED (REG. NO. 196300316Z)
Page 19
Gross profit margin was lower due to compressed profit margins for the Singapore projects that contributed to this segment in Q4 2019, vis-à-vis New Futura – a completed high-end luxury project which was the main contributor for Q4 2018, as well as the write-back of provisions following finalisation of costs for main contractors of a few projects which contributed favourably to Q4 2018. In terms of profit before tax (PBT), the property development segment was the main contributor, making up 80.7% of the Group’s pre-tax profits, followed by investment properties segment. The hotel operations segment recorded lower impairment losses in Q4 2019 vis-à-vis Q4 2018. Basic earnings per share for Q4 2019 increased by 13.9% to 9.0 cents (Q4 2018: 7.9 cents). FY 2019 Revenue for FY 2019 was $3.4 billion (FY 2018: $4.2 billion). The decline was due to the timing of revenue recognition for the property development segment as the revenue for certain overseas projects, and Singapore Executive Condominium (EC) projects cannot be recognised progressively but only upon completion in entirety. The main contributing projects to revenue for FY 2019 were The Tapestry and Whistler Grand, for which the revenue and profits were recognised progressively based on their stage of construction, along with the sale of balance units in completed projects including Gramercy Park, New Futura, Suzhou Hong Leong City Center (HLCC) and Shanghai Hongqiao Royal Lake. Comparatively, revenue in FY 2018 was boosted primarily from completed projects including New Futura, Gramercy Park, and The Criterion EC in which its entire revenue was recognised upon TOP, as well as substantial revenue from overseas projects including HLCC and Park Court Aoyama The Tower, Tokyo upon handover of units following their completion. Despite lower revenue in FY 2019, the Group’s PATMI remained relatively constant when compared with FY 2018. This was bolstered by substantial gains from the unwinding of the Group’s second Profit Participation Securities (PPS 2) structure which included the realisation of pre-tax deferred gains of $153.9 million from the divestment of Manulife Centre and 7 & 9 Tampines Grande and a pre-tax $52.6 million gain from the Group’s stake in PPS 2. Additionally, the contributions from Aldgate House, 125 OBS, Le Grove Serviced Residences and Central Mall Office Tower were added to the Group’s portfolio at various timings in 2018 which also contributed positively to PATMI. While revenue for joint venture (JV) development projects are not included in revenue, the profit contribution from these under JV/associates including South Beach Residences, Boulevard 88, Brisbane’s Ivy and Eve project, as well as Star of East River project, Dongguan (held under First Sponsor Group Limited) also contributed to the resilient PBT and PATMI. For the hotel operations segment, a loss of $6.6 million was reported for FY 2019 due to several factors, including impairment losses of $58.2 million (FY 2018: $94.1 million) made on hotels in US, Europe and Asia; transaction costs for the M&C privatisation; disruptions to operations following the closure of Millennium Hotel London Mayfair and Dhevanafushi Maldives Luxury Resort in 2018 for repositioning; and refurbishment works at Orchard Hotel Singapore. The Biltmore Mayfair contributed an operating loss of $21 million, which adversely impacted the performance of this segment. Basic earnings per share for FY 2019 stands at 60.8 cents (FY 2018: 59.9 cents). Capital Position As at 31 December 2019, the Group has strong cash reserves of $3.1 billion. The Net Asset Value (NAV) per share as at 31 December 2019 stands at $11.60. Notably, the Group adopts the policy of stating investment properties at cost less accumulated depreciation and impairment losses. Had the Group factored in fair value gains on its investment properties, the Revalued Net Asset Value (RNAV) per share would be $16.46. Net gearing ratio (including fair value gains on investment properties), post privatisation of M&C in October 2019, is 43%. If the fair value on investment properties were excluded, net gearing would increase to 61%. Interest cover remains healthy at 14.0 times (FY 2018: 14.9 times). Dividends In addition to the final ordinary dividend of 8.0 cents per share, the Board is also recommending a special final ordinary dividend of 6.0 cents per share. Considering the special interim ordinary dividend of 6.0 cents per share paid in September 2019, the total dividends for FY 2019 amounts to 20.0 cents per share (FY 2018: 20.0 cents). PROPERTY Singapore For FY 2019, the Group and its JV associates sold 1,554 units including ECs with a total sales value of $3.3 billion (FY 2018: 1,113 residential units with a total sales value of $2.2 billion). The Group launched a record number of six projects in 2019, emerging as one of the top-selling private sector developers in Singapore.

CITY DEVELOPMENTS LIMITED (REG. NO. 196300316Z)
Page 20
Project Location Launched Total
Units Units Sold#
ASP achieved
Boulevard 88* Orchard Boulevard March 154 91 >$3,790 psf Amber Park* Amber Road May 592 202 >$2,480 psf Haus on Handy Handy Road July 188 32 >$2,870 psf Piermont Grand* Sumang Walk July 820 484 >$1,090 psf Nouvel 18~ Anderson Road July 156 27 >$3,460 psf Sengkang Grand Residences* Sengkang Central November 680 237 >$1,730 psf
*JV project #As of 23 February 2020 ~ Divested project under PPS 3, marketed by CDL
Projects launched in 2018 continued to register strong sales. 132 of the 190-unit JV South Beach Residences have been sold. The Group’s 861-unit The Tapestry and the 716-unit Whistler Grand have sold 712 and 475 units respectively. Profits for Q4 2019 were booked in from The Tapestry, Amber Park and Whistler Grand as well as from JV projects such as South Beach Residences, Boulevard 88, Forest Woods and The Jovell. In November 2019, the Group and its JV partner CapitaLand Limited announced its plan to redevelop Liang Court site into an integrated development following the proposed sale by CDL Hospitality Trusts (CDLHT) of its total interest in Novotel Singapore Clarke Quay, which was approved by CDLHT’s unitholders at its EGM in January 2020. Concurrently, Ascott Reit will sell part of its interest in Somerset Liang Court Singapore to the Group. Subject to approval from the relevant authorities, the proposed development with a total GFA of 100,263 square metres (sq m) will comprise two residential towers offering around 700 apartment units, a commercial component, a hotel and a serviced residence with a hotel licence. The 50:50 CDL-CapitaLand JV entities will own the residential and commercial components while Ascott Reit will own the 192-unit serviced residence with a hotel licence. CDLHT will own the hotel which will have about 460-475 rooms under a forward purchase agreement with the Group. The hotel will operate under the Moxy brand by Marriott International while the serviced residence will retain its Somerset brand. The proposed integrated development is targeted to open in phases from 2024. The Group’s office portfolio remains resilient with a committed occupancy of 89.8% as at 31 December 2019, on par with the island-wide occupancy rate of 89.5%. Overseas Markets Property Development
Australia The 476-unit Ivy and Eve, the Group’s JV residential project with ASX-listed Abacus Property Group (Abacus) in Brisbane, is now fully sold and all settlements achieved. In 1H 2019, the Group acquired Abacus’ residential development division for A$25.9 million ($25 million) which included a portfolio of three prime freehold mixed development sites – two in Melbourne and one in Brisbane. The Marker, a JV project comprising 195 residential units, several retail units and a supermarket located on Spencer Street, West Melbourne, has to date sold over 60% of the apartments. The two other development sites are in the planning and design stages. The Group purchased another JV mixed-use site located at Macaulay Road, North Melbourne for A$18.5 million ($17.4 million), near the future North Melbourne Station. Meanwhile, the Group’s collaboration with Waterbrook Lifestyle for the 135-unit retirement village project in Bowral commenced pre-sales towards the end of 2019. Over 50% of the initial 52 units launched received reservations. Japan The Group’s prime 180,995 sq ft freehold site in the prestigious Shirokane residential enclave within central Tokyo remains in its land bank, while 154 (96%) out of 160 units at Park Court Aoyama The Tower in Tokyo, a JV residential project, have been handed over to buyers as at 31 December 2019.

CITY DEVELOPMENTS LIMITED (REG. NO. 196300316Z)
Page 21
UK Residential buyers and investors remain cautious amid Brexit-related uncertainties and global growth concerns. Despite the UK’s subdued property market, the Group managed to move some residential inventory in 2019. 100 Sydney Street in Chelsea (eight apartments and a retail unit) has sold three units to date. Chesham Street (six units) in Belgravia has sold one unit, with three units leased. Teddington Riverside, the 239-unit development in Teddington, South West London, is expected to be completed in Q2 2020. Phase 1 comprises two blocks with 76 units. To date, over 30 units have been sold or leased. The Group believes that sales will progress with increased political stability in the UK. At end January 2020, the Group received planning consent from the Planning Committee of the London Borough of Richmond for a major mixed-use scheme on its 22-acre site at the former Stag Brewery in Mortlake, South West London – the largest development in the Borough. The scheme proposes 663 residential units and a care village. It has flexible use floorspace for various commercial, community and leisure purposes which includes a hotel, cinema, gym, bars and restaurants. There will also be a new secondary school with a full-sized football pitch, multi-use games area and play space. The finalised scheme is expected to be determined by Q2 2020. China In FY 2019, the Group’s wholly-owned subsidiary CDL China Limited and its JV associates sold 526 residential units and four villas in China, achieving sales value of RMB 1.81 billion (approximately $350 million) (FY 2018: Sold 259 residential units and 18 villas with total sales value of RMB 1.32 billion (approximately $269 million)). The mixed-use development – HLCC in Suzhou has to date sold 1,651 (92%) of its 1,804 residential units. Operational since June 2019, HLCC’s Grade A office tower is now about 70% occupied. Occupancy of the HLCC mall is currently at 82% and the 295-room five-star M Social Hotel is slated to open in 2021. In Chongqing, CDL China’s JV project Emerald, an 820-unit luxury development has sold 473 (58%) units and the completed 126-unit Eling Palace has sold 80 units (64%) to date. Hongqiao Royal Lake in Shanghai has sold 56 (66%) out of the 85 villas to date. As landed developments are no longer permitted in China, the project has strong potential for capital appreciation given the scarcity. Notably, the Group has already achieved breakeven based on the completed sales. Investment Properties Japan In 2019, the Group acquired four rental apartment projects in Osaka, including three forward funded projects. One of the forward funded projects, Pregio Joto Chuo which was completed in September 2019, has achieved better-than-expected occupancy of 95% within three months of completion. The remaining forward funded projects are expected to be completed by Q1 2020. The four freehold projects will benefit from the strong leasing market in Osaka. The Group’s total rentable assets in Japan is JPY 5.46 billion (approximately $69.3 million). UK Office The Group’s two freehold commercial buildings in Central London acquired in 2018 – Aldgate House and 125 OBS, have already shown significant positive rental reversions post-acquisition. In 2019, the Group embarked on several asset enhancement initiatives and feasibility studies on these office assets, enhancing the potential for higher rental upside. On 31 January 2020, 23:00 GMT, the UK formally left the European Union (EU) and entered an 11-month transition period until 31 December 2020. After nearly three years of uncertainty, the transition period provides long-awaited clarity on Brexit and paves the way for what is expected to be a more stable future. The Group remains a long-term investor in the UK and has confidence in the fundamentals of the UK economy. The Group does not expect the Brexit impact to be prolonged as there is still pent-up investment demand from the international community. The outlook for Central London’s office market is positive with rental growth expected through 2021, bolstered by low unemployment, currency advantage and tight Grade A office supply, likely resulting in upward pressure on prime rents. UK Private Rented Sector (PRS) In March 2019, the Group acquired a £15.4 million (approximately $27.5 million) freehold site in Leeds that will yield 664 residential units with retail space located within the site’s attractive heritage arches beneath a viaduct. The PRS sector is driven fundamentally by domestic demand and is expected to be insulated from the impact of Brexit. The development is slated for completion in 2023.

CITY DEVELOPMENTS LIMITED (REG. NO. 196300316Z)
Page 22
China Office The Group completed its 100% stake acquisition in Shanghai’s Hongqiao Sincere Centre (Phase 2) in November 2019 for a total purchase price of RMB 1.75 billion (approximately $344 million). To date, occupancy for office and serviced apartment is around 50% and 70% respectively. Hong Leong Plaza Hongqiao, Shanghai has leased three out of five towers (equivalent to 71% of its NLA) to a serviced apartment operator and a postnatal confinement centre. Fund Management The Group has been actively building its pipeline and is in active collaborations with capital partners to acquire new AUM. It is on track to hit its target of US$5 billion by 2023. In April 2019, the Group acquired a 50% stake in IREIT Global Group Pte. Ltd., the manager of Singapore-listed IREIT Global, and currently owns approximately 12.5% of the total issued units in IREIT Global. Besides being earnings accretive with immediate contribution to recurring income through management fees and attractive yields, the investment also strengthens the Group’s fund management expertise and establishes its track record. Hotels 2019 marked a significant milestone as the Group privatised M&C which was listed on the London Stock Exchange since 1996. As at 31 December 2019, the Group has 156 hotels under its portfolio, of which 71 hotels (46%) are owned by the Group, 19 hotels (12%) are operated under JV arrangements or under CDLHT, and the balance (42%) are managed or franchised hotels. Notably, the CDLHT hotels are under a master lease arrangement and classified as investment properties. Key operating statistics for hotels owned by the Group:
FY FY Incr / FY FY Incr / FY FY Incr /2019 2018 (Decr) 2019 2018 * (Decr) 2019 2018 * (Decr)
% % % $ $ % $ $ %Singapore 86.2 83.7 2.5 186.9 175.0 6.8 161.2 146.6 10.0Rest of Asia 70.5 68.9 1.6 158.5 163.2 (2.9) 111.8 112.5 (0.6)Total Asia 76.4 74.3 2.1 170.4 168.0 1.4 130.1 124.8 4.2New Zealand 82.4 82.5 (0.1) 154.7 154.1 0.4 127.4 127.2 0.2London 79.1 80.1 (1.0) 240.3 221.7 8.4 190.1 177.6 7.0Rest of Europe 69.6 71.2 (1.6) 131.5 137.1 (4.1) 91.5 97.6 (6.3)Total Europe 74.2 75.6 (1.4) 187.8 181.4 3.5 139.3 137.1 1.6New York 86.6 86.3 0.3 344.1 349.3 (1.5) 298.2 301.5 (1.1)Regional US 58.0 57.6 0.4 186.1 188.5 (1.3) 108.0 108.6 (0.6)Total US 67.5 67.1 0.4 253.2 256.8 (1.4) 170.9 172.2 (0.8)Total Group 73.7 73.1 0.6 196.7 196.8 (0.1) 145.0 143.9 0.8
RevPARRoom Occupancy Average Room Rate
Q4 Q4 Incr / Q4 Q4 Incr / Q4 Q4 Incr /2019 2018 (Decr) 2019 2018 * (Decr) 2019 2018 * (Decr)
% % % $ $ % $ $ %Singapore 85.6 81.3 4.3 203.1 176.8 14.9 173.9 143.7 21.0Rest of Asia 78.7 72.6 6.1 158.6 177.1 (10.4) 124.8 128.6 (3.0)Total Asia 81.3 75.7 5.6 176.5 177.0 (0.3) 143.5 134.0 7.1New Zealand 86.4 86.1 0.3 160.9 159.7 0.8 139.0 137.6 1.0London 75.0 86.9 (11.9) 257.6 229.9 12.0 193.3 199.8 (3.3)Rest of Europe 65.5 68.5 (3.0) 130.2 138.7 (6.1) 85.3 95.0 (10.2)Total Europe 70.4 77.2 (6.8) 199.3 187.4 6.4 140.3 144.7 (3.0)New York 91.5 89.8 1.7 381.3 394.8 (3.4) 348.8 354.4 (1.6)Regional US 52.3 51.0 1.3 169.6 185.0 (8.3) 88.6 94.4 (6.1)Total US 65.2 63.8 1.4 267.8 282.5 (5.2) 174.6 180.4 (3.2)Total Group 74.4 73.3 1.1 205.5 212.0 (3.1) 152.8 155.5 (1.7)
RevPARRoom Occupancy Average Room Rate
* For comparability, FY 2018 Average Room Rate and RevPAR had been translated at constant exchange rates (31 Dec 2019).

CITY DEVELOPMENTS LIMITED (REG. NO. 196300316Z)
Page 23
In constant currency, global revenue per available room (RevPAR) for FY 2019 increased by 0.8% to $145.0 (FY 2018: $143.9) but decreased by 1.7% to $152.8 for Q4 2019 (Q4 2018: $155.5). Asia Asia RevPAR for FY 2019 increased by 4.2% to $130.1 (FY 2018: $124.8). Singapore RevPAR rose 10.0% to $161.2 (FY 2018: $146.6) due to the inclusion of W Singapore – Sentosa Cove to the Group’s portfolio in Q2 2019, coupled with healthy visitor arrivals and strong convention business. New Zealand (NZ) NZ RevPAR increased marginally at 0.2% to $127.4 (FY 2018: $127.2). Notably, NZ contributions have increased steadily over the years with more NZ hotels and a rise in tourist arrivals. However, the market softened in 2019 with competition from new hotel inventory in the Auckland and Queenstown regions. Europe London RevPAR grew by 7.0% to $190.1 (FY 2018: $177.6). All London hotels recorded positive RevPAR growth, partly due to rate-driven initiatives in the middle of the year offsetting a drop in Q1 2019. The weaker pound continues to support London as an attractive destination for inbound tourists. However, the bottom line was impacted by The Biltmore Mayfair’s £12 million ($21 million) loss for FY 2019 due to pre-opening costs and higher depreciation. RevPAR for Rest of Europe was down by 6.3%. Decreases were recorded in Millennium Hotel Paris Opera where phased refurbishment is still on-going as well as transport strikes in Paris since December 2019, causing significant business travel disruption. US US RevPAR for FY 2019 decreased by 0.8% to $170.9 (FY 2018: $172.2). Q1 2019 demand was impacted due to the shut-down of the federal government and extreme cold weather arising from the polar vortex. New York RevPAR decreased by 1.1% to $298.2 (FY 2018: $301.5). Revenue recovery strategy for Millennium Times Square New York includes joining Hilton as an affiliate with access to its reservation channels and loyalty programme to enhance contribution. This hotel, and Millennium Hilton One UN Plaza, continue to be loss-making primarily due to high labour costs as a result of labour union, whilst the US regional hotels remained profitable collectively. Refurbishments The Group’s refurbished Mayfair property in London – rebranded as The Biltmore Mayfair – reopened on 9 September 2019 after a £60 million ($106 million) makeover. Hilton manages it under its luxury LXR Hotels and Resorts brand – the first in Europe. The Group also completed major refurbishment for Orchard Hotel Singapore. Phased renovations for the Millennium Hotel Paris Opera, Millennium Gloucester Hotel London Kensington and Copthorne King’s Hotel in Singapore have commenced and are expected to complete over the course of 2020/2021. Developments The construction cost of the Sunnyvale California project, comprising of a 263-room hotel (planned for an M Social) and a 250-unit residential apartment block is estimated at US$180 million ($244 million). Project is expected to complete in the next two years. The Group continues to study alternative options for its development site in Yang Dong, Seoul adjacent to its Millennium Hilton Seoul and does not expect construction to commence in 2020.
9. Where a forecast, or a prospect statement, has been previously disclosed to shareholders, any variance between it and
the actual results.
The Group’s performance for the period under review is in line with its expectations as disclosed in the announcement of results for the third quarter and nine months ended 30 September 2019.

CITY DEVELOPMENTS LIMITED (REG. NO. 196300316Z)
Page 24
10. A commentary at the date of the announcement of the significant trends and competitive conditions of the industry in
which the group operates and any known factors or events that may affect the group in the next reporting period and the next 12 months.
Singapore Singapore economy grew at a decade-low of 0.7% in 2019, down from 3.4% in 2018. The Ministry of Trade and Industry has forecasted economic growth for 2020 to be within a range of between -0.5% and 1.5% amid concerns of the ongoing COVID-19 (coronavirus) outbreak, signalling the possibility of a technical recession. Based on URA’s data for FY 2019, prices of private residential properties increased by 2.7%, compared with a 7.9% increase in 2018. The decline in price growth can be attributed to a slowing economy and property cooling measures implemented in July 2018. Private home sales rose 13% as developers sold 10,104 units (excluding ECs) in 2019 compared with 9,912 units in 2018, reflecting Singapore’s resilient housing market and healthy home demand from first-time buyers and upgraders. While a sizeable supply is expected to come onstream in 2020 (due to the heightened collective sales fever in 2017/8), residential prices are likely to remain competitive with developers curating relevant unit mixes and pricing to suit homebuyers’ expectations. In response to the slowing economic growth, substantial supply of residential units and a moderation of demand following the July 2018 property market cooling measures, the Government has moderated its 2019 and 1H 2020 Government Land Sales (GLS) programme. In January 2020, the Group successfully tendered for Irwell Bank Road – the year’s first GLS site. This prime 137,634 sq ft site, won at $583.9 million or $1,515 psf ppr, was a thin winning margin of only 4.2% above the next highest bidder. Located along River Valley Road in District 9, this site is within walking distance to Great World City mall and the upcoming Great World MRT station. The Group plans to develop a condominium comprising two 36-storey towers with about 580 units and a basement carpark. Subject to market conditions, the Group’s 60% JV partner Hong Leong Holdings Limited is preparing to launch its 566-unit residential project at Sims Drive in 1H 2020. The site is near Aljunied MRT station. The Group is actively studying the feasibility of redeveloping its eligible assets such as Fuji Xerox Towers under the CBD Incentive scheme, which offers an avenue to rejuvenate its sites and replenish its development land bank. On 6 February 2020, the Ministry of Law announced that it will allow the exemption from the Qualifying Certificate (QC) regime for publicly listed housing developers with a substantial connection to Singapore. This change has been long-awaited as the QC policy places listed developers who are locally controlled (like the Group) to be in a disadvantaged position as it is subject to double penalties of QC and additional buyer’s stamp duty (ABSD) on land. This revision offers more flexibility as the Group can consider both GLS and en bloc sites for land replenishment, without the QC penalty for the latter. Notably, the onerous ABSD penalty and the tight 5-year timeline remain a hefty consideration for developers. In view of the current subdued market sentiment and the challenging economic outlook, the Group hopes that the Government will continue to review market conditions and make further policy tweaks. Strategic Investment in Sincere Property Group (China) In May 2019, the Group entered into a strategic partnership with Sincere Property Group (Sincere), a real estate developer in China. The proposed total investment of RMB 5.5 billion (approximately $1.1 billion) represents a 24% effective equity stake in Sincere and an interest-bearing loan extended to Sincere. The transaction is being renegotiated and the exact terms will be shared once finalised. Despite the COVID-19 crisis, the Group continues to hold a long-term view of its China investments and remains confident of China’s strong fundamentals and its ability to rebound. The Chinese government has provided several support policies and liquidity to stabilise its economy. During this short-term challenge posed by the virus outbreak, it offers a window opportunity to assess real estate investments with an attractive valuation. Hotels With M&C’s privatisation, the Group is focused on achieving synergies, cost efficiencies and driving profitability by tapping onto the wider Group’s capabilities. This will be achieved by driving revenues via rate optimisation, customer segmentation, enhancing M&C’s digital marketing strategies and most importantly, improving customer experience. The Group is also taking a holistic review of its enlarged hotel portfolio to drive synergies. It assumes a more proactive stance as a sponsor to M&C’s listed REIT associate, CDLHT, with its 37.8% effective interest. CDLHT unitholders approved its acquisition of the W Singapore – Sentosa Cove hotel from the Group for $324 million or $1.35 million per key at its EGM held in January 2020. The injection of this hotel into CDLHT’s portfolio is an extension of the Group’s commitment to seed suitable hotel assets to support the REIT’s expansion plans. M&C’s 2020 Capex programme is expected at around $140 million. Millennium Hilton New York Downtown plans to undergo a phased refurbishment over 2020/2021 for an estimated US$37 million ($50 million). In Singapore, there are planned refurbishments for Grand Copthorne Waterfront and Studio M. These renovations will be phased to minimise impact to profits.

CITY DEVELOPMENTS LIMITED (REG. NO. 196300316Z)
Page 25
The divestment of Millennium Cincinnati was completed on 14 February 2020 and a profit of $24 million will be recognised in Q1 2020. The Group will continue to evaluate divestment opportunities in M&C’s portfolio where appropriate. However, its priority is to improve M&C’s hotel performance and to explore alternative uses that complement the Group’s real estate capabilities so as to build a stronger recurring income base.
Group Prospects 2020 has been laden with several unprecedented events which have severely dampened market sentiments. Besides geopolitical tensions and a weakening global economy, there is a thick cloud of uncertainty over the biggest disruptor – the COVID-19 outbreak, placing the global economic and social resilience to the test. The Group welcomes the swift response of fiscal and business relief measures offered by the Government in its $4 billion Stabilisation and Support Package announced at Budget 2020 to help companies ride out the economic downturn. The Group views the outlook for 2020 with an optimistic prism. It believes that with collective efforts from government, businesses and individuals, the situation will stabilise and recover in time. It is heartened that the Government has indicated that it will consider further relief measures should the situation warrant. The Group is closely tracking its operations and the impact from COVID-19 on its businesses, operations and supply chains. The virus outbreak is a fitting reminder that with globalisation and the Group’s scale, as part of its risk management, it cannot be overly reliant on a specific geography or asset class. The Group’s underlying fundamentals remain solid with a geographically diversified portfolio and strong balance sheet. It will press on with its GET (Growth, Enhancement and Transformation) strategy, focusing on execution and bringing its targets to fruition. It is confident in managing the headwinds with tenacity, clear-mindedness, cost control and tight discipline.
11. Dividend
(a) Current Financial Period Reported On
Any dividend declared for the current financial period reported on?
Yes. The Company had paid the following tax-exempt (one-tier) special interim ordinary dividend to ordinary shareholders and non-cumulative preference dividends to holders of City Developments Limited Non-redeemable Convertible Non-cumulative Preference Shares (“Preference Shares”).
Name of Dividend Tax exempt (One-tier)
Special Interim Ordinary Dividend
Tax exempt (One-tier) Preference Dividend
Date of Payment 12 September 2019 1 July 2019 31 December 2019
Dividend Type Cash Cash Cash
Dividend Amount (in cents)
6.0 cents per Ordinary Share
1.94 cents per Preference Share^
1.96 cents per Preference Share^
Dividend rate (in %) N.A. 3.9% per annum on the issue price of each Preference Share
3.9% per annum on the issue price of each Preference Share
Dividend Period N.A. From 31 December 2018 to 30 June 2019 (both dates inclusive)
From 1 July 2019 to 30 December 2019 (both dates inclusive)
Issue Price N.A. $1.00 per Preference Share $1.00 per Preference Share
^ Preference dividend for each Preference Share is calculated at the dividend rate of 3.9% per annum of the issue price
of $1.00 for each Preference Share on the basis of the actual number of days comprised in the dividend period divided by 365 days.
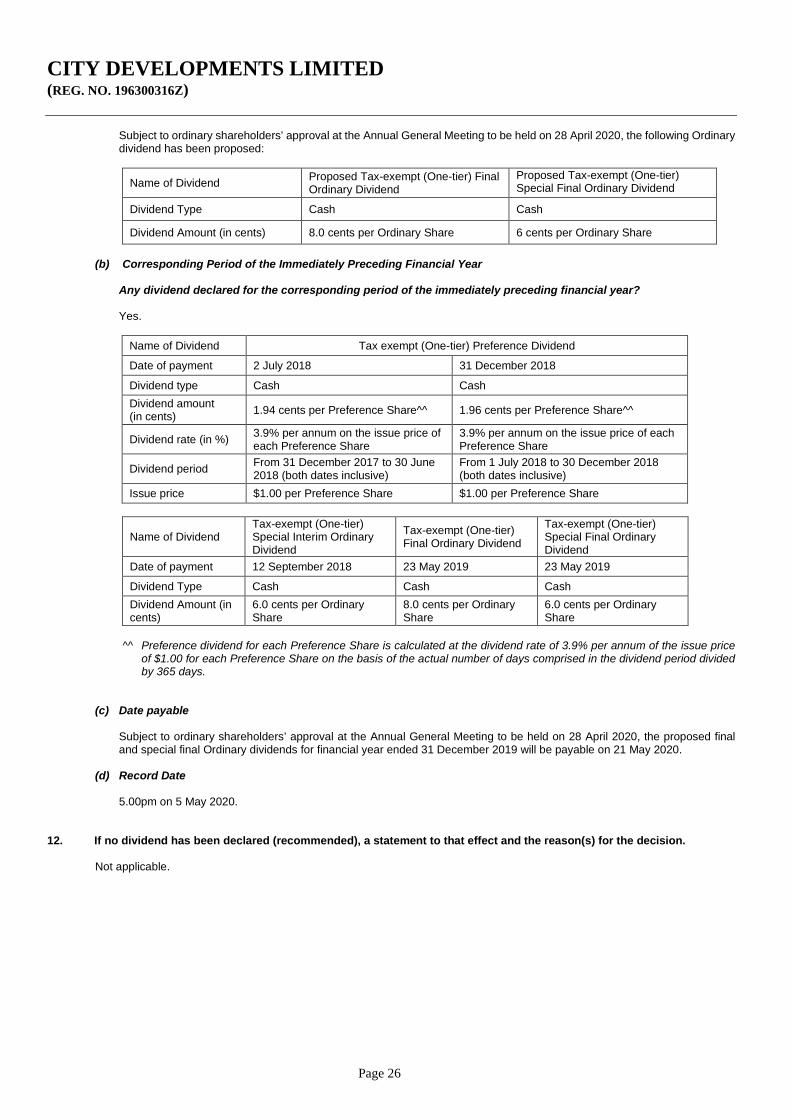
CITY DEVELOPMENTS LIMITED (REG. NO. 196300316Z)
Page 26
Subject to ordinary shareholders’ approval at the Annual General Meeting to be held on 28 April 2020, the following Ordinary dividend has been proposed:
Name of Dividend Proposed Tax-exempt (One-tier) Final Ordinary Dividend
Proposed Tax-exempt (One-tier) Special Final Ordinary Dividend
Dividend Type Cash Cash
Dividend Amount (in cents) 8.0 cents per Ordinary Share 6 cents per Ordinary Share
(b) Corresponding Period of the Immediately Preceding Financial Year
Any dividend declared for the corresponding period of the immediately preceding financial year? Yes.
Name of Dividend Tax exempt (One-tier) Preference Dividend
Date of payment 2 July 2018 31 December 2018
Dividend type Cash Cash Dividend amount (in cents) 1.94 cents per Preference Share^^ 1.96 cents per Preference Share^^
Dividend rate (in %) 3.9% per annum on the issue price of each Preference Share
3.9% per annum on the issue price of each Preference Share
Dividend period From 31 December 2017 to 30 June 2018 (both dates inclusive)
From 1 July 2018 to 30 December 2018 (both dates inclusive)
Issue price $1.00 per Preference Share $1.00 per Preference Share
Name of Dividend Tax-exempt (One-tier) Special Interim Ordinary Dividend
Tax-exempt (One-tier) Final Ordinary Dividend
Tax-exempt (One-tier) Special Final Ordinary Dividend
Date of payment 12 September 2018 23 May 2019 23 May 2019
Dividend Type Cash Cash Cash Dividend Amount (in cents)
6.0 cents per Ordinary Share
8.0 cents per Ordinary Share
6.0 cents per Ordinary Share
^^ Preference dividend for each Preference Share is calculated at the dividend rate of 3.9% per annum of the issue price
of $1.00 for each Preference Share on the basis of the actual number of days comprised in the dividend period divided by 365 days.
(c) Date payable
Subject to ordinary shareholders’ approval at the Annual General Meeting to be held on 28 April 2020, the proposed final and special final Ordinary dividends for financial year ended 31 December 2019 will be payable on 21 May 2020.
(d) Record Date
5.00pm on 5 May 2020.
12. If no dividend has been declared (recommended), a statement to that effect and the reason(s) for the decision.
Not applicable.

CITY DEVELOPMENTS LIMITED (REG. NO. 196300316Z)
Page 27
13. Interested Person Transactions
Name of interested person
Nature of relationship Aggregate value of all interested person transactions conducted under shareholders' mandate pursuant to Rule 920 (excluding transactions less than $100,000)
$’000
Subsidiaries of Hong Leong Investment Holdings Pte. Ltd.
Hong Leong Investment Holdings Pte. Ltd. is a controlling shareholder of the Company. Its subsidiaries are interested persons being associates of a controlling shareholder.
Property-related
(a) Provision to interested persons of housekeeping services for a hospitality development; and
(b) Lease of premises to interested persons
8,325
Management and support services
Provision of management and consultancy services by interested persons
449
Total: 8,774
Directors and their immediate family members
Nil
14. Segment Reporting
By Business Segments
2019 2018 2019 2018S$'000 S$'000 S$'000 S$'000
Revenue
Property Development 310,490 196,915 1,136,730 2,045,309 Hotel Operations* 473,824 452,864 1,705,015 1,679,418 Investment Properties 119,455 102,835 438,143 358,234 Others 43,130 35,700 148,837 139,602
946,899 788,314 3,428,725 4,222,563
Profit/(Loss) before tax**
Property Development 87,361 103,103 378,075 623,358 Hotel Operations (8,196) (53,154) (6,576) 39,977 Investment Properties 34,490 57,968 332,906 189,002 Others (5,394) 2,678 49,672 23,201
108,261 110,595 754,077 875,538
Fourth Quarter Ended Full Year EndedThe Group
31 December 31 December
* Revenue from hotel operations includes room revenue of $1,154.2 million (FY 2018: $1,136.9 million) for FY 2019 from hotels
that are owned by the Group. ** Includes share of after-tax profit of associates and joint ventures.

CITY DEVELOPMENTS LIMITED (REG. NO. 196300316Z)
Page 28
Segmental results for full year ended 31 December
Property Hotel Investment
Development Operations Properties Total Others TotalS$'000 S$'000 S$'000 S$'000 S$'000 S$'000
2019
External revenue 1,136,730 1,705,015 438,143 3,279,888 148,837 3,428,725
ResultsProfit from operating activities 277,154 60,698 311,630 649,482 4,452 653,934 Share of after-tax profit/(loss) of associates and joint ventures 153,643 (16,758) 45,790 182,675 13,632 196,307
Finance income 38,125 8,815 10,657 57,597 50,930 108,527 Finance costs (90,847) (59,331) (35,171) (185,349) (19,342) (204,691) Net finance (costs)/income (52,722) (50,516) (24,514) (127,752) 31,588 (96,164)
Reportable segment profit/(loss) before tax 378,075 (6,576) 332,906 704,405 49,672 754,077
2018
External revenue 2,045,309 1,679,418 358,234 4,082,961 139,602 4,222,563
ResultsProfit from operating activities 619,829 73,870 197,928 891,627 12,948 904,575 Share of after-tax profit of associates and joint ventures 37,405 1,227 11,048 49,680 15,223 64,903
Finance income 28,217 15,422 14,392 58,031 4,794 62,825 Finance costs (62,093) (50,542) (34,366) (147,001) (9,764) (156,765) Net finance costs (33,876) (35,120) (19,974) (88,970) (4,970) (93,940)
Reportable segment profit before tax 623,358 39,977 189,002 852,337 23,201 875,538
15. In the review of performance, the factors leading to any material changes in contributions to turnover and earnings by
the business or geographical segments.
Property Development Revenue increased by $113.6 million to $310.5 million (Q4 2018: $196.9 million) for Q4 2019 but decreased by $908.6 million to $1,136.7 million (FY 2018: $2,045.3 million) for FY 2019. Pre-tax profit decreased by $15.7 million to $87.4 million (Q4 2018: $103.1 million) for Q4 2019 and $245.3 million to $378.1 million (FY 2018: $623.4 million) for FY 2019. Projects that contributed to both revenue and profit in FY 2019 include Whistler Grand, The Tapestry, Gramercy Park, New Futura, HLCC, Hongqiao Royal Lake, Park Court Aoyama The Tower, Hans Road project in Knightsbridge, Phase 1 of Teddington Riverside in Borough of Richmond upon Thames and Chesham Street project in Belgravia. Sales of residential properties in New Zealand and units in Zenith Residences by M&C Group also contributed to the Group’s revenue and pre-tax profit for this segment. In accordance with the Group’s policy of equity accounting for the results of its joint ventures, whilst revenue from joint venture developments such as South Beach Residences, Boulevard 88, The Jovell and Forest Woods had not been consolidated into the Group’s total revenue, the Group’s share of profit arising from these joint venture developments had been included in pre-tax profit. The increase in revenue for Q4 2019 and decrease for FY 2019 was largely due to the timing of revenue recognition. Contribution from EC is recognised in entirety upon completion for sold units whilst overseas projects are recognised upon unit handover. For Singapore private residential units, there is progressive recognition of profit based on the stages of construction and sales status. The increase in revenue for Q4 2019 was mainly attributable to higher progressive contribution from Whistler Grand and The Tapestry due to higher percentage of completion achieved, as well as contribution from 32 Hans Road project which was fully sold. In contrast, revenue declined for FY 2019, as FY 2018 revenue was powered by strong contribution from New Futura (sale launch in Q1 2018), and The Criterion EC, coupled with contribution from Phase 2 of HLCC and Park Court Aoyama The Tower following their completion in 2018 in which sold units were handed over to buyers in that same year.

CITY DEVELOPMENTS LIMITED (REG. NO. 196300316Z)
Page 29
Despite the increase in revenue for Q4 2019, pre-tax profit for this segment declined as profit was largely recognised from The Tapestry and Whistler Grand, which have thinner margin as compared to Q4 2018, where profit was largely contributed by New Futura, a high margin project where revenue was fully recognised upon sale completion. For FY 2019, the lower gross profit was in line with the lower revenue achieved. The decrease in pre-tax profit for FY 2019 was partially mitigated by share of profit contributed by two well-sold joint venture projects, South Beach Residences and Boulevard 88, along with returns recognised from the sale of units in the Ivy and Eve project in Australia, as well as higher share of contribution from FSGL following the commencement of hand over of units in its Star of East River project in Dongguan and gain recognised from divestment of its Oliphant office building to its 33% equity-accounted investee.
Hotel Operations Revenue for this segment increased $20.9 million to $473.8 million (Q4 2018: $452.9 million) for Q4 2019 and $25.6 million to $1,705.0 million (FY 2018: $1,679.4 million) for FY 2019. This segment reported a pre-tax loss of $8.2 million (Q4 2018: $53.2 million) for Q4 2019 and a pre-tax loss of $6.6 million (FY 2018: pre-tax profit of $40.0 million) for FY 2019. The increase in revenue for Q4 2019 and FY 2019 was mainly contributed by the addition of W Singapore - Sentosa Cove to the Group’s hotel portfolio in April 2019. This segment recorded a lower pre-tax loss in Q4 2019, mainly due to lower impairment loss recognised in the current quarter as compared to Q4 2018. In Q4 2019, the Group recognised an additional $21.3 million impairment loss on top of the $36.9 million already provided in Q3 2019. On the other hand, the total impairment loss of $94.1 million for FY 2018 was recognised entirely in Q4 2018. The lower impairment loss was partially offset by a higher share of loss from FSGL, resulting mainly from higher impairment loss recognised for Crowne Plaza Chengdu Wenjiang and the adjoining hotspring. The pre-tax loss of $6.6 million recorded in FY 2019 was attributable to a myriad of factors including one-off costs incurred for the successful privatisation of M&C Group in October 2019 and impairment loss made on several hotels, albeit a lower impairment loss as compared to FY 2018. Further, the closure of Biltmore Mayfair since July 2018 and Raffles Maldives Meradhoo since June 2018 for enhancement and rebranding works had also negatively impacted the Group’s performance. Both hotels re-opened in September 2019.
Investment Properties Revenue for this segment increased by $16.7 million to $119.5 million (Q4 2018: $102.8 million) for Q4 2019 and $79.9 million to $438.1 million (FY 2018: $358.2 million) for FY 2019. Pre-tax profit decreased by $23.5 million to $34.5 million (Q4 2018: $58.0 million) for Q4 2019 but increased by $143.9 million to $332.9 million (FY 2018: $189.0 million) for FY 2019. The increase in revenue for both Q4 2019 and FY 2019 were largely contributed by the full contributions from Aldgate House (London), 125 Old Broad Street (London) and Central Mall Office Tower, which were acquired in late 2018. In addition, the increase in revenue for FY 2019 was also contributed by Le Grove Serviced Residences, which re-opened in July 2018 following a major revamp, and HLCC retail mall, which opened in June 2018. Despite the increase in revenue, pre-tax profit for Q4 2019 declined as the Group received a lower $9.3 million income distributed by Golden Crest Group in Q4 2019 in accordance to the stipulated waterfall structure under PPS 2 platform, as compared to Q4 2018, where the Group wrote back $19.3 million of the provision for bond interest support under the same PPS 2 platform, following the redemption of the said bonds. Pre-tax profit for FY 2019 soared due to divestment gains recognised. In 1H 2019, the Group successfully unwound its PPS 2 platform and realised deferred gains on the sale of investment properties of $153.9 million, in addition to receiving a total $52.6 million distribution from Golden Crest. The Group also recognised a $10.5 million gain from the divestment of a vacant land parcel at Jervois Road in July 2019. Other than the abovementioned release of provision for bond support, included in FY 2018 pre-tax profit was a gain on divestment of Mercure Brisbane and Ibis Brisbane by CDLHT of $29 million and another gain on disposal of a vacant shophouse plot at Jalan Besar of $12.4 million.

CITY DEVELOPMENTS LIMITED (REG. NO. 196300316Z)
Page 30
Others Revenue, comprising mainly income from building maintenance contracts, project management, club operations, laundry services and dividend income, increased by $7.4 million to $43.1 million (Q4 2018: $35.7 million) for Q4 2019 and $9.2 million to $148.8 million (FY 2018: $139.6 million) for FY 2019. The increases for Q4 2019 and FY 2019 were due to higher project management fees earned. This segment reported a pre-tax loss of $5.4 million (Q4 2018: pre-tax profit of $2.7 million) for Q4 2019 but pre-tax profit increased by $26.5 million to $49.7 million (FY 2018: $23.2 million) for FY 2019. The pre-tax loss for Q4 2019 was mainly attributable to the mark-to-market loss recognised on remeasurement of certain quoted securities held by the Group vis-à-vis a mark-to market gain recognised in Q4 2018. The substantial increase in pre-tax profit for FY 2019 was largely due to interest income earned on loan granted to and bonds issued by Sincere Property Group. This was partially offset by the mark-to-market loss recognised on certain quoted securities held by the Group.
16. A breakdown of the total annual dividend (in dollar value) for the issuer’s latest full year and its previous full year.
Total Annual Net Dividend (Refer to Para 18 of Appendix 7.2 for the required details)
Full Year Full Year 2019 2018
S$'000 S$'000Ordinary 72,552 72,552 Special 108,942 108,942 Preference 12,904 12,904 Total 194,398 194,398
The final tax-exempt (one-tier) ordinary dividend and special final tax-exempt (one-tier) ordinary dividend for the year ended 31 December 2019 of 8.0 cents and 6 cents respectively per ordinary share are subject to the approval of ordinary shareholders at the forthcoming Annual General Meeting and the dividend amounts are based on the number of issued ordinary shares as at 31 December 2019.
17. A breakdown of sales and operating profit after tax for first half year and second half year.
2019 2018 Incr/(Decr)
S$'000 S$'000 %a) Revenue
- First half 1,596,528 2,417,370 (34.0) - Second half 1,832,197 1,805,193 1.5
3,428,725 4,222,563 (18.8)
b) Operating profit after tax before deducting non-controlling interests- First half 394,216 389,462 1.2 - Second half 219,145 271,316 (19.2)
613,361 660,778 (7.2)
18. Confirmation pursuant to Rule 720(1) of the Listing Manual
The Company confirms that it has procured undertakings from all its directors and executive officers in the format set out in Appendix 7.7 in accordance with Rule 720(1) of the Listing Manual.

CITY DEVELOPMENTS LIMITED (REG. NO. 196300316Z)
Page 31
19. Disclosure of person occupying a managerial position in the Company or any of its principal subsidiaries who is a
relative of a director or chief executive officer or substantial shareholder of the Company pursuant to Rule 704(13) of the Listing Rules.
City Developments Limited (“CDL”) and the following principal subsidiaries: • Millennium & Copthorne Hotels Limited (“M&C”) • M&C REIT Management Limited (“M&CREIT”), manager of CDL Hospitality Real Estate Investment Trust (“H- REIT”) • M&C Business Trust Management Limited (“M&CBTM”), trustee-manager of CDL Hospitality Business Trust (“HBT”) • CDL China Limited (“CDL China”)
Name Age Family relationship with any director, chief executive officer and/or substantial shareholder
Current position and duties, and the year the position was held
Details of changes in duties and position held, if any, during the year
Mr Kwek Leng Beng
79
Cousin of Mr Kwek Leng Peck, non-executive Director of CDL.
Father of Mr Sherman Kwek Eik Tse, Executive Director and Group Chief Executive Officer of CDL.
CDL Executive Chairman of CDL since 1 January 1995, having overall executive responsibility to provide leadership and vision in the Board of Directors’ review and development of the business direction and strategies for the sustainable growth of the CDL group of companies. M&C Appointed Executive Chairman of M&C on 18 November 2019 with executive responsibility to lead and drive M&C’s performance, with the assistance of the management team of M&C, and through better synergies from integration with CDL following the privatisation of M&C.
Mr Kwek was appointed the Executive Chairman of M&C on 18 November 2019, after the privatization of M&C.
Mr Sherman Kwek Eik Tse
43
Son of Mr Kwek Leng Beng, Executive Chairman of CDL.
Nephew of Mr Kwek Leng Peck, non-executive Director of CDL.
CDL Appointed Chief Executive Officer of the Group in 2018.
As Executive Director and Group Chief Executive Officer, Mr Sherman Kwek is responsible for setting and implementing the business strategies and decisions for the Group as endorsed by the Board, providing leadership to drive the pursuit of the Group’s strategic objectives, and having overall executive responsibility for the Group.
CDL China Appointed Executive Chairman of CDL China in 2016, with overall executive responsibility for CDL China’s investments and operations.
Mr Kwek was appointed Executive Director of CDL with effect from 15 May 2019.

CITY DEVELOPMENTS LIMITED (REG. NO. 196300316Z)
Page 32
Name Age Family relationship with any director, chief executive officer and/or substantial shareholder
Current position and duties, and the year the position was held
Details of changes in duties and position held, if any, during the year
Mr Kwek Eik Sheng
38
Nephew of Mr Kwek Leng Beng, Executive Chairman of CDL, and Mr Kwek Leng Peck, non-executive Director of CDL.
Cousin of Mr Sherman Kwek Eik Tse, Executive Director and Group Chief Executive Officer of CDL.
CDL Appointed Chief Strategy Officer of CDL in 2014. In his current position as Group Chief Strategy Officer, Mr Kwek Eik Sheng supports the Group Chief Executive Officer of CDL in investment analysis and formulation of business strategies to explore new sectors for growth and to drive increased corporate efficiency and innovation. M&C Appointed Executive Director of M&C on 18 November 2019, with executive responsibilities including oversight on: (i) investment management,
including reviewing opportunities for mergers & acquisitions and asset disposals;
(ii) capital planning, including capital expenditure planning, treasury matters and corporate finance and financial planning; and
(iii) development projects for the M&C group and strategic corporate planning, including the spearheading the integration between M&C and CDL.
Mr Kwek was appointed Executive Director of M&C on 18 November 2019.
Mr Vincent Yeo Wee Eng
51
Nephew of Mr Kwek Leng Beng, Executive Chairman of CDL, and Mr Kwek Leng Peck, non-executive Director of CDL.
Cousin of Mr Sherman Kwek Eik Tse, Executive Director and Group Chief Executive Officer of CDL.
M&CREIT/M&CBTM Director and Chief Executive Officer of M&CREIT (as manager of H-REIT) and M&CBTM (as trustee-manager of HBT) with effect from 17 May 2006 and 19 July 2006 respectively. Responsible for working within the M&CREIT and M&CBTM Boards and as CEO of M&CREIT and M&CBTM to develop and implement the overall business, investment and operational strategies for H-REIT and HBT.
No change.
BY ORDER OF THE BOARD Shufen Loh @ Catherine Shufen Loh Company Secretary 26 February 2020