Embed Size (px)
Citation preview
CITY OF
ANN ARBOR
2015 NON-MOTORIZED
PROGRESS REPORT
CITY OF ANN ARBOR, MICHIGAN Public Services Area/Systems Planning 301 East Huron Street P.O. Box 8647, Ann Arbor, Michigan 48107 Phone: (734) 794-6430 Fax: (734) 994-1744 Web: www.a2gov.org
1
Table of Contents
Executive Summary……………………………………………….1
Non-Motorized Facility Network…………………...……………..2
State of the System in 2015……………………………………2
New Non-Motorized Facilities in 2015………………………..2
2016 Planned Non-Motorized Projects………..……………...4
Other Non-Motorized Efforts……………………..……………....6
Pedestrian Safety and Access Task Force…………..………6
South State Street Corridor Study………...…………..……...6
ArborBike Bike Share Full Launch……………………………6
Outreach and Involvement….…………………………………….7
Commuter Challenge…………..……………………………….7
Alternative Transportation Committee………………..………7
Safety Bike Light Giveaway Program………………..……….7
Data Collection………………………….………………………….8
On-Road Bicycle Facility Inventory…………………..……….8
2015 Non-Motorized Counts……………..…………..…….….9
Non-Motorized Count Data 2006-2015………………………....13
1
Executive Summary The City of Ann Arbor continues to make progress installing new non-motorized facilities
recommended in the Non-Motorized Transportation Plan. The plan has guided the Non-Motorized
Program since 2007. Today, Ann Arbor boasts a network of approximately 132 mid-block
crosswalks (19 with an enhanced crosswalk warning device), 79 lane-miles of on-street bike lanes,
58 miles of shared-use paths, and 12 lane-miles of marked shared lanes (sharrows).
The Pedestrian Safety and Access Task Force (PSATF) submitted their final recommendations on
how to improve pedestrian safety to Council in September 2015. Council approved the PSATF
Final Recommendations in October 2015, and City staff are starting the implementation process
and working towards accomplishing the goal of zero traffic fatalities.
The Clean Energy Coalition installed 7 new ArborBike bike share stations in May 2015, for a total
of 13 working stations throughout downtown and the University of Michigan campus. ArborBike
concluded its first full season in December 2015 with over 14,000 trips taken.
City Council directed staff to implement a Safety Bike Light Giveaway Program for Ann Arbor
Residents in December 2015, to encourage safe bicycling practices and increase the safety of all
commuters. Over 300 bike safety lights and information about safe riding have been distributed to
residents.
The City continued to collect non-motorized system performance data through the annual non-
motorized count program and on-road bicycle facility conditions inventory. City staff conducted
cyclist and pedestrian counts at 10 intersections around Ann Arbor with help from the Washtenaw
Area Transportation Study. This is the tenth year of data collection, please see separate Non-
Motorized Inventory Report available at the City website. City staff also completed an annual
inspection of the on-road bike lane and sharrow system. 2015 was the ninth year that inventory
data was used to rate existing conditions and prioritize bike facility maintenance needs.
2016 will be another busy year for the Non-Motorized Program. Over 1 lane mile of new and
restored bike lanes and 6 crosswalk enhancements, Rectangular Rapid Flash Beacons (RRFBs),
will be installed. One major project is the reconstruction of Geddes Avenue between Hickory Circle
and Huntington Drive. This major project includes adding a bike lane and improving and extending
the sidewalk along this road segment.
2
Non-Motorized Facility Network
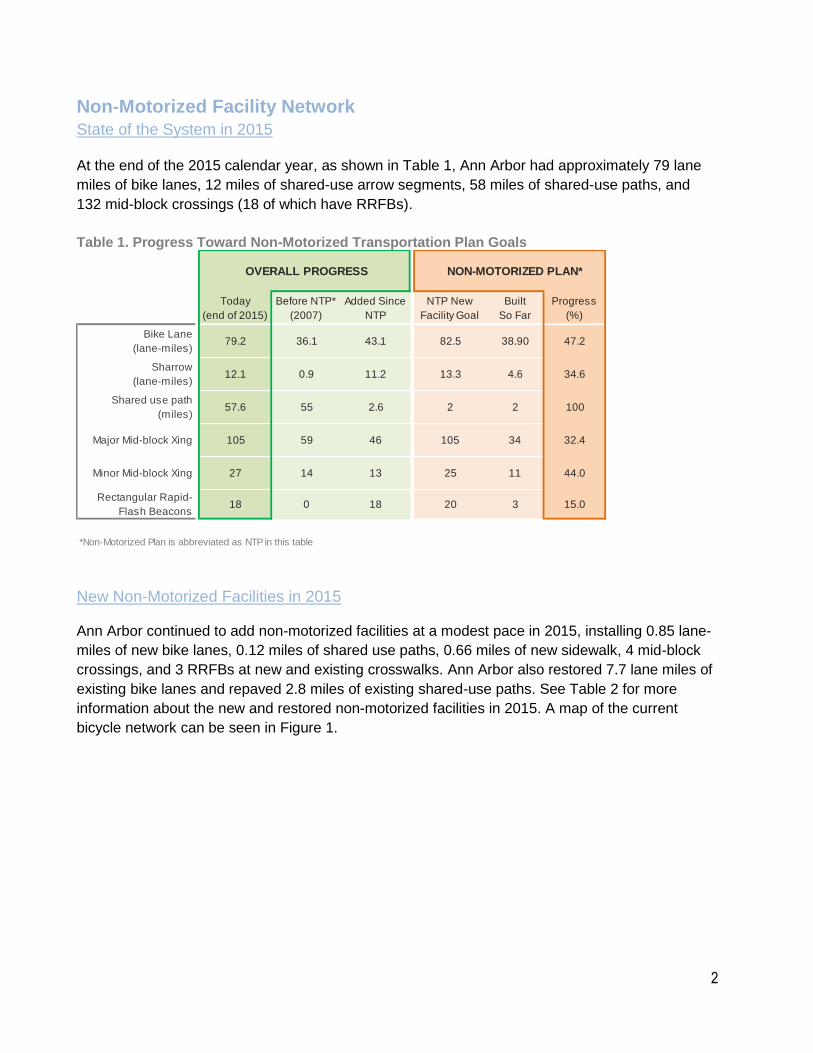
State of the System in 2015 At the end of the 2015 calendar year, as shown in Table 1, Ann Arbor had approximately 79 lane
miles of bike lanes, 12 miles of shared-use arrow segments, 58 miles of shared-use paths, and
132 mid-block crossings (18 of which have RRFBs).
Table 1. Progress Toward Non-Motorized Transportation Plan Goals
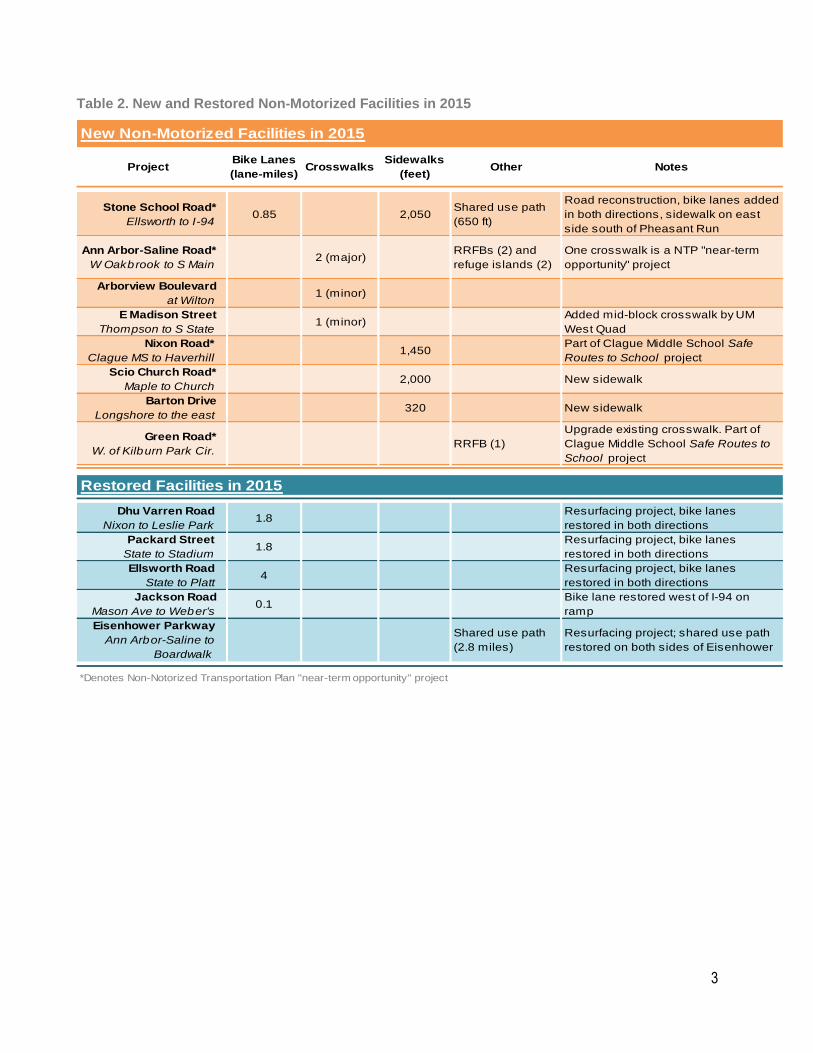
New Non-Motorized Facilities in 2015 Ann Arbor continued to add non-motorized facilities at a modest pace in 2015, installing 0.85 lane-
miles of new bike lanes, 0.12 miles of shared use paths, 0.66 miles of new sidewalk, 4 mid-block
crossings, and 3 RRFBs at new and existing crosswalks. Ann Arbor also restored 7.7 lane miles of
existing bike lanes and repaved 2.8 miles of existing shared-use paths. See Table 2 for more
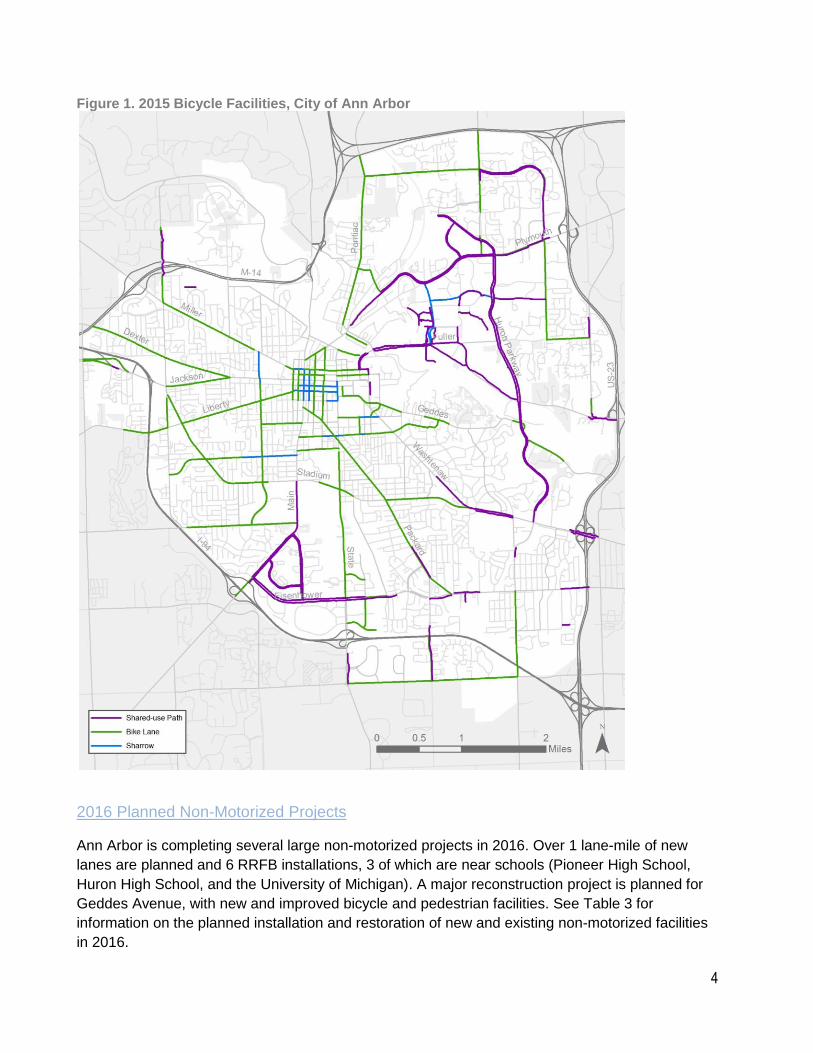
information about the new and restored non-motorized facilities in 2015. A map of the current
bicycle network can be seen in Figure 1.
OVERALL PROGRESS NON-MOTORIZED PLAN* OTHER
Today
(end of 2015)
Before NTP*
(2007)
Added Since
NTP
NTP New
Facility Goal
Built
So Far
Progress
(%)
Non-NTP Built
Since 2007
Bike Lane
(lane-miles)79.2 36.1 43.1 82.5 38.90 47.2 4.2
Sharrow
(lane-miles)12.1 0.9 11.2 13.3 4.6 34.6 6.6
Shared use path
(miles)57.6 55 2.6 2 2 100 0.6
Major Mid-block Xing 105 59 46 105 34 32.4 12
Minor Mid-block Xing 27 14 13 25 11 44.0 2
Rectangular Rapid-
Flash Beacons18 0 18 20 3 15.0 15
*Non-Motorized Plan is abbreviated as NTP in this table
3
Table 2. New and Restored Non-Motorized Facilities in 2015
ProjectBike Lanes
(lane-miles)Crosswalks
Sidewalks
(feet)Other Notes
Stone School Road*
Ellsworth to I-940.85 2,050
Shared use path
(650 ft)
Road reconstruction, bike lanes added
in both directions, sidewalk on east
side south of Pheasant Run
Ann Arbor-Saline Road*
W Oakbrook to S Main2 (major)
RRFBs (2) and
refuge islands (2)
One crosswalk is a NTP "near-term
opportunity" project
Arborview Boulevard
at Wilton1 (minor)
E Madison Street
Thompson to S State1 (minor)
Added mid-block crosswalk by UM
West Quad
Nixon Road*
Clague MS to Haverhill1,450
Part of Clague Middle School Safe
Routes to School project
Scio Church Road*
Maple to Church2,000 New sidewalk
Barton Drive
Longshore to the east320 New sidewalk
Green Road*
W. of Kilburn Park Cir.RRFB (1)
Upgrade existing crosswalk. Part of
Clague Middle School Safe Routes to
School project
Dhu Varren Road
Nixon to Leslie Park1.8
Resurfacing project, bike lanes
restored in both directions
Packard Street
State to Stadium1.8
Resurfacing project, bike lanes
restored in both directions
Ellsworth Road
State to Platt4
Resurfacing project, bike lanes
restored in both directions
Jackson Road
Mason Ave to Weber's0.1
Bike lane restored west of I-94 on
ramp
Eisenhower Parkway
Ann Arbor-Saline to
Boardwalk
Shared use path
(2.8 miles)
Resurfacing project; shared use path
restored on both sides of Eisenhower
*Denotes Non-Notorized Transportation Plan "near-term opportunity" project
New Non-Motorized Facilities in 2015
Restored Facilities in 2015
4
Figure 1. 2015 Bicycle Facilities, City of Ann Arbor
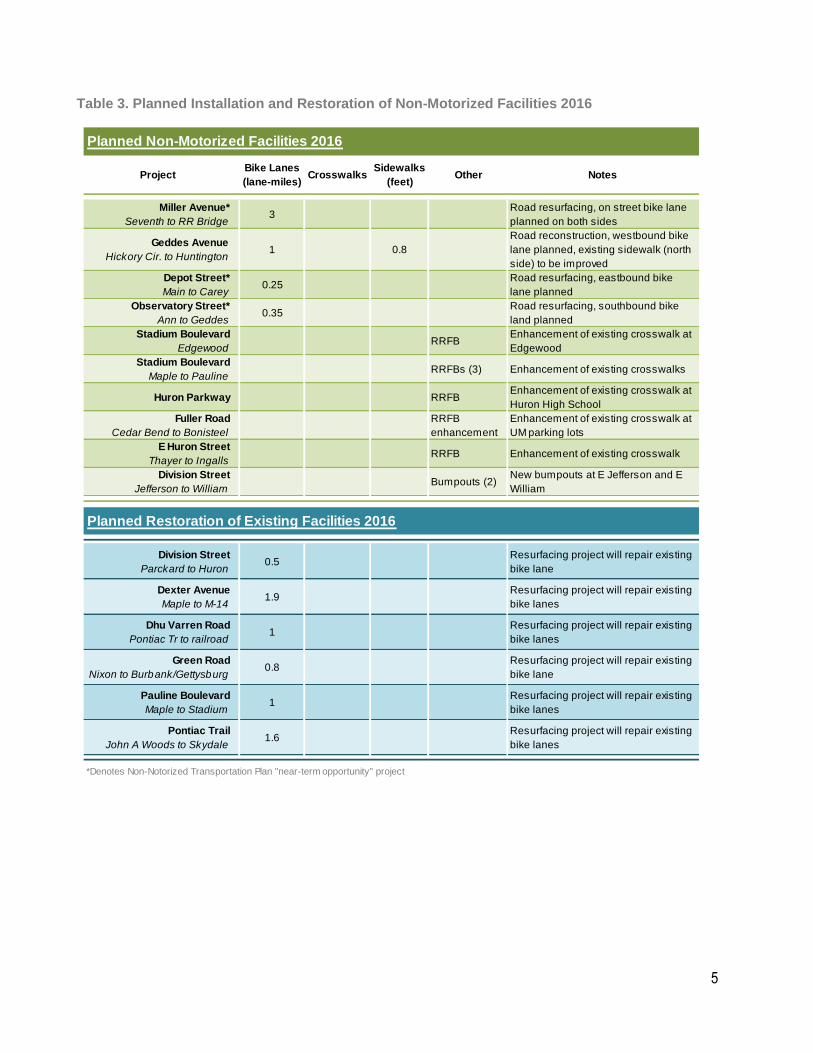
2016 Planned Non-Motorized Projects
Ann Arbor is completing several large non-motorized projects in 2016. Over 1 lane-mile of new
lanes are planned and 6 RRFB installations, 3 of which are near schools (Pioneer High School,
Huron High School, and the University of Michigan). A major reconstruction project is planned for
Geddes Avenue, with new and improved bicycle and pedestrian facilities. See Table 3 for
information on the planned installation and restoration of new and existing non-motorized facilities
in 2016.
5
Table 3. Planned Installation and Restoration of Non-Motorized Facilities 2016
ProjectBike Lanes
(lane-miles)Crosswalks
Sidewalks
(feet)Other Notes
Miller Avenue*
Seventh to RR Bridge3
Road resurfacing, on street bike lane
planned on both sides
Geddes Avenue
Hickory Cir. to Huntington1 0.8
Road reconstruction, westbound bike
lane planned, existing sidewalk (north
side) to be improved
Depot Street*
Main to Carey0.25
Road resurfacing, eastbound bike
lane planned
Observatory Street*
Ann to Geddes0.35
Road resurfacing, southbound bike
land planned
Stadium Boulevard
EdgewoodRRFB
Enhancement of existing crosswalk at
Edgewood
Stadium Boulevard
Maple to PaulineRRFBs (3) Enhancement of existing crosswalks
Huron Parkway RRFBEnhancement of existing crosswalk at
Huron High School
Fuller Road
Cedar Bend to Bonisteel
RRFB
enhancement
Enhancement of existing crosswalk at
UM parking lots
E Huron Street
Thayer to IngallsRRFB Enhancement of existing crosswalk
Division Street
Jefferson to WilliamBumpouts (2)
New bumpouts at E Jefferson and E
William
Division Street
Parckard to Huron0.5
Resurfacing project will repair existing
bike lane
Dexter Avenue
Maple to M-141.9
Resurfacing project will repair existing
bike lanes
Dhu Varren Road
Pontiac Tr to railroad1
Resurfacing project will repair existing
bike lanes
Green Road
Nixon to Burbank/Gettysburg0.8
Resurfacing project will repair existing
bike lane
Pauline Boulevard
Maple to Stadium1
Resurfacing project will repair existing
bike lanes
Pontiac Trail
John A Woods to Skydale1.6
Resurfacing project will repair existing
bike lanes
*Denotes Non-Notorized Transportation Plan "near-term opportunity" project
Planned Non-Motorized Facilities 2016
Planned Restoration of Existing Facilities 2016
6
Other Non-Motorized Efforts
Pedestrian Safety and Access Task Force City Council created the PSATF in November 2013 to identify and better understand pedestrian
safety and access issues in Ann Arbor. The 9-member citizen task force, with support from City
staff and consultant Greenway Collaborative, held monthly meetings and engaged with over 1,000
residents for their input through community meetings, focus groups, mass surveys, and web-based
mapping exercises to develop recommendations for Council. In September 2015, the PSATF
submitted their final recommendations for improving pedestrian safety and access in Ann Arbor to
Council. The overall goal of the recommendations is zero traffic fatalities. In order to achieve this
goal, the PSATF identified five major objectives:
1. Improve pedestrian access and encourage use;
2. Improve understanding of traffic laws and local expectations;
3. Improve the physical conditions of the roadway and pedestrian environment to reflect best
practices for pedestrian safety;
4. Address the safety and access for all users; and
5. Reduce distractions and minimize consequences.
In addition, the PSATF outlined 55 total recommendations and 9 implementation strategies for
accomplishing these objectives. City Council approved the recommendations in October 2015, and
City staff are now working towards implementing the recommendations.
South State Street Corridor Transportation Study The City continued working with consultants Parsons Brinckerhoff and LSL Planning on the South
State Street Corridor Transportation Study in 2015. The project team analyzed current conditions
on South State Street from Oakbrook Drive to Ellsworth Road, looking at safety, multi-modal
considerations, and alignment with the land use vision outlined in the 2013 South State Street
Corridor Plan. The project team held a stakeholder meeting and a public workshop in October
2015 to gather input from residents and adjacent business owners on three design alternatives that
include the addition of wide or narrow medians, bike lanes, new sidewalks, and more controlled
signals at intersections. The project team is now creating a recommended design based on public
feedback and will host a second set of public workshops in 2016.
ArborBike Bike Share Full Launch The City of Ann Arbor partnered with the University of Michigan, TheRide, and the Clean Energy
Coalition to create ArborBike in Fall 2014. The CEC installed 7 new ArborBike bike share stations
in May 2015, for a total of 13 working stations throughout downtown and the University of Michigan
campus. ArborBike concluded its first full season in December 2015 with over 14,000 trips taken
and almost 40,000 miles traveled. The busiest stations were all at or near the University of
Michigan central campus, at South University /East University, State Street/North University, and
7
the Central Campus Recreation Building on Washtenaw Avenue. ArborBike will re-launch for the
new season in March 2016.
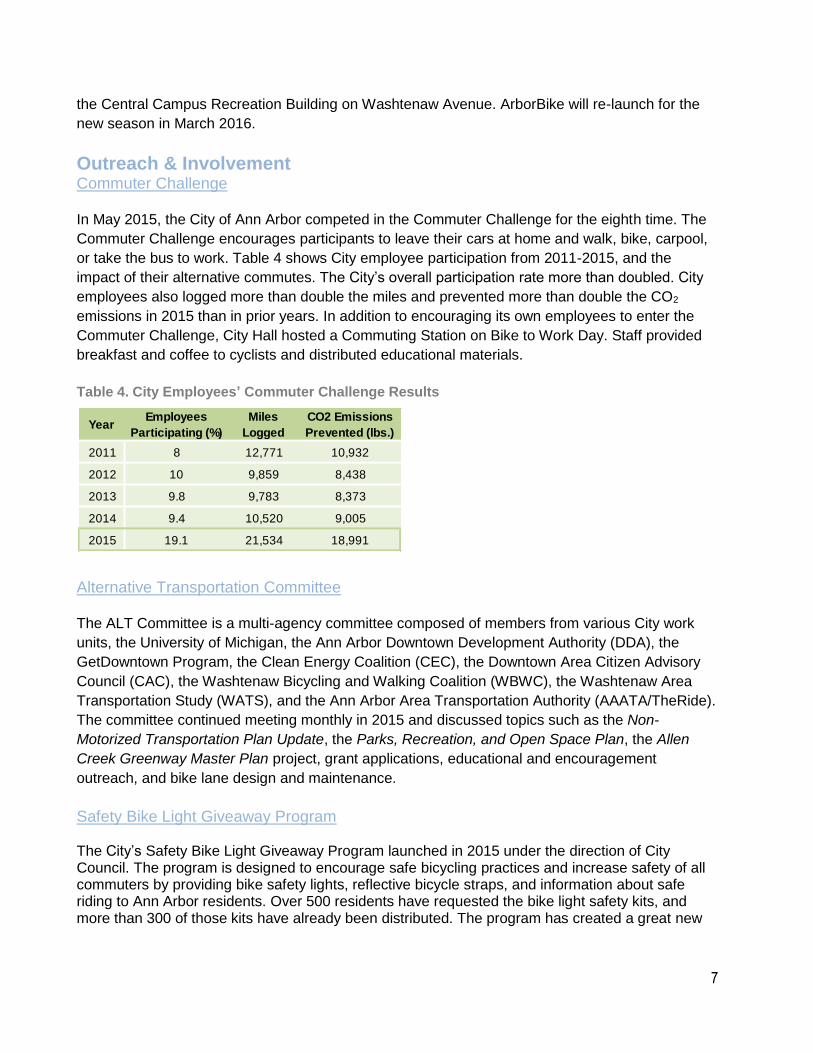
Outreach & Involvement Commuter Challenge In May 2015, the City of Ann Arbor competed in the Commuter Challenge for the eighth time. The
Commuter Challenge encourages participants to leave their cars at home and walk, bike, carpool,
or take the bus to work. Table 4 shows City employee participation from 2011-2015, and the
impact of their alternative commutes. The City’s overall participation rate more than doubled. City
employees also logged more than double the miles and prevented more than double the CO2
emissions in 2015 than in prior years. In addition to encouraging its own employees to enter the
Commuter Challenge, City Hall hosted a Commuting Station on Bike to Work Day. Staff provided
breakfast and coffee to cyclists and distributed educational materials.
Table 4. City Employees’ Commuter Challenge Results
Alternative Transportation Committee The ALT Committee is a multi-agency committee composed of members from various City work
units, the University of Michigan, the Ann Arbor Downtown Development Authority (DDA), the
GetDowntown Program, the Clean Energy Coalition (CEC), the Downtown Area Citizen Advisory
Council (CAC), the Washtenaw Bicycling and Walking Coalition (WBWC), the Washtenaw Area
Transportation Study (WATS), and the Ann Arbor Area Transportation Authority (AAATA/TheRide).
The committee continued meeting monthly in 2015 and discussed topics such as the Non-
Motorized Transportation Plan Update, the Parks, Recreation, and Open Space Plan, the Allen
Creek Greenway Master Plan project, grant applications, educational and encouragement
outreach, and bike lane design and maintenance.
Safety Bike Light Giveaway Program The City’s Safety Bike Light Giveaway Program launched in 2015 under the direction of City Council. The program is designed to encourage safe bicycling practices and increase safety of all commuters by providing bike safety lights, reflective bicycle straps, and information about safe riding to Ann Arbor residents. Over 500 residents have requested the bike light safety kits, and more than 300 of those kits have already been distributed. The program has created a great new
YearEmployees
Participating (%)
Miles
Logged
CO2 Emissions
Prevented (lbs.)
2011 8 12,771 10,932
2012 10 9,859 8,438
2013 9.8 9,783 8,373
2014 9.4 10,520 9,005
2015 19.1 21,534 18,991
8
platform for educating the public on laws and safe practices, and residents have reacted very positively to this program.
Data Collection On-Road Bicycle Facility Inventory 2015 marks the ninth year of maintaining an up-to-date record of bicycle facility conditions as a
basis for maintenance recommendations. Staff surveyed the on-street bicycle facility system in
August 2015 and assigned each road segment scores for the following criteria:
- Presence and integrity of a bike lane stripe (rated 1-5, 5 is new striping)
- Presence and integrity of bicycle-related pavement symbols (rated 1-5, 5 is new
symbol)
- Presence of signage (no rating, but proper spacing and placement is noted)
- Pavement condition within the bike lane or shared lane (rated 1-10, 10 is new
pavement)
Streets that were newly inventoried in 2015 include Ann Arbor-Saline Road (from the City
boundary to Eisenhower Parkway), Fuller Street (from Glen Avenue to State Street), Jackson
Avenue (from Maple Road to Dexter Road/Huron Street), and Pontiac Trail (from M-14 to Skydale
Drive).
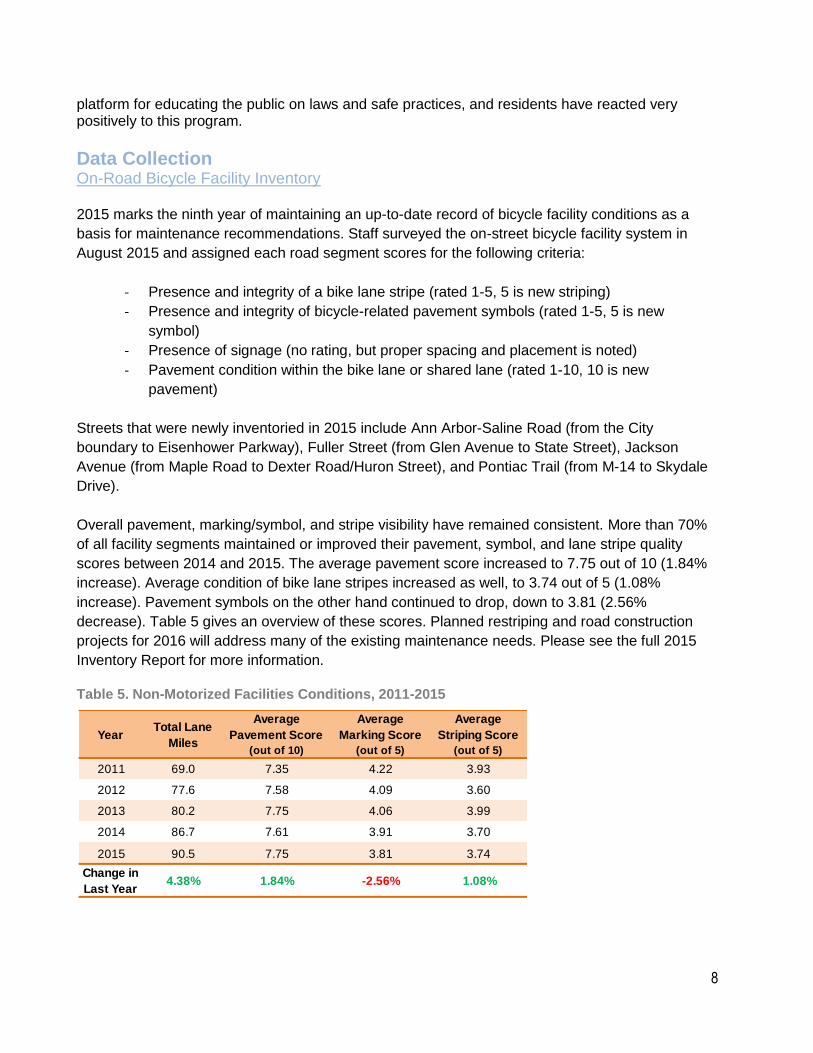
Overall pavement, marking/symbol, and stripe visibility have remained consistent. More than 70%
of all facility segments maintained or improved their pavement, symbol, and lane stripe quality
scores between 2014 and 2015. The average pavement score increased to 7.75 out of 10 (1.84%
increase). Average condition of bike lane stripes increased as well, to 3.74 out of 5 (1.08%
increase). Pavement symbols on the other hand continued to drop, down to 3.81 (2.56%
decrease). Table 5 gives an overview of these scores. Planned restriping and road construction
projects for 2016 will address many of the existing maintenance needs. Please see the full 2015
Inventory Report for more information.
Table 5. Non-Motorized Facilities Conditions, 2011-2015
YearTotal Lane
Miles
Average
Pavement Score
(out of 10)
Average
Marking Score
(out of 5)
Average
Striping Score
(out of 5)
2011 69.0 7.35 4.22 3.93
2012 77.6 7.58 4.09 3.60
2013 80.2 7.75 4.06 3.99
2014 86.7 7.61 3.91 3.70
2015 90.5 7.75 3.81 3.74
Change in
Last Year 4.38% 1.84% -2.56% 1.08%
9
2015 Non-Motorized Counts The Non-Motorized Count Program continued to expand in 2015, covering 20 corridors at 10
intersections. City staff collaborated with the Washtenaw Area Transportation Study (WATS) for a
second year to conduct twice as many counts than in prior years. The 2015 counts focused on a
mix of high-volume locations, screen line locations, locations near newly installed ArborBike
stations, and locations along the Main Street corridor. The two high-volume locations, State Street
at Washington Street and East University at South University, provide a snapshot of the intense
non-motorized activity occurring downtown and near the University of Michigan Central Campus.
The 2015 count program also observed three locations along the Main Street corridor.
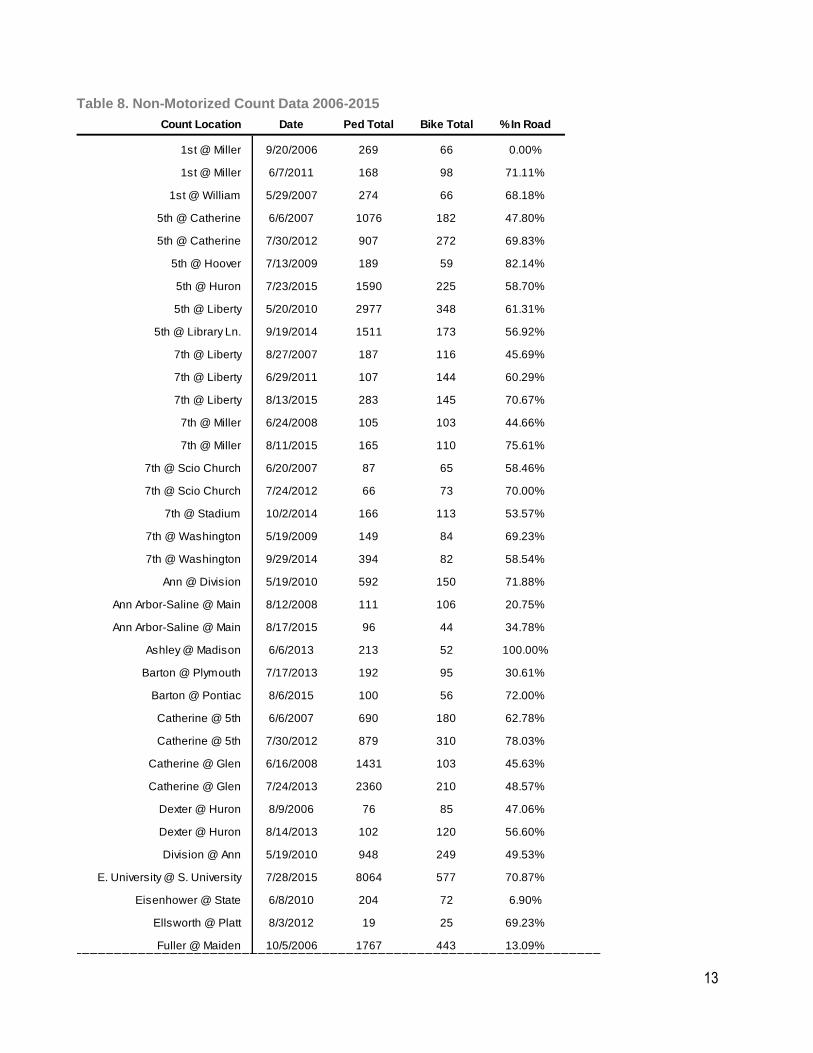
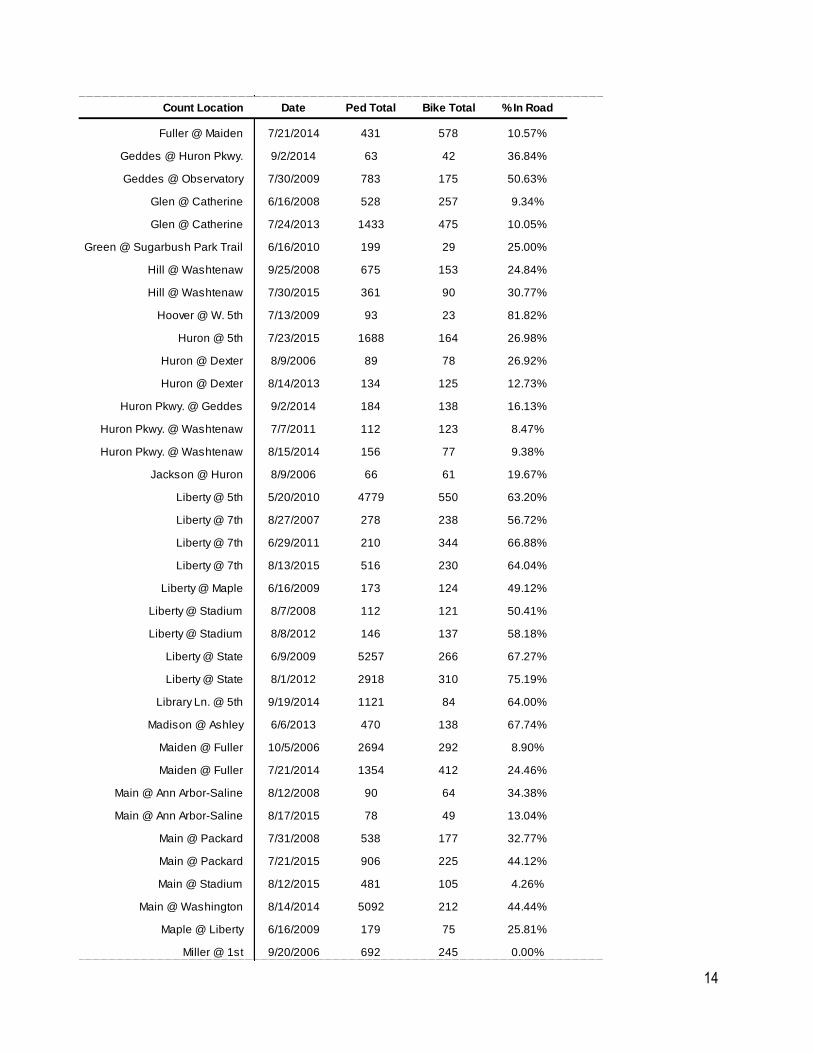
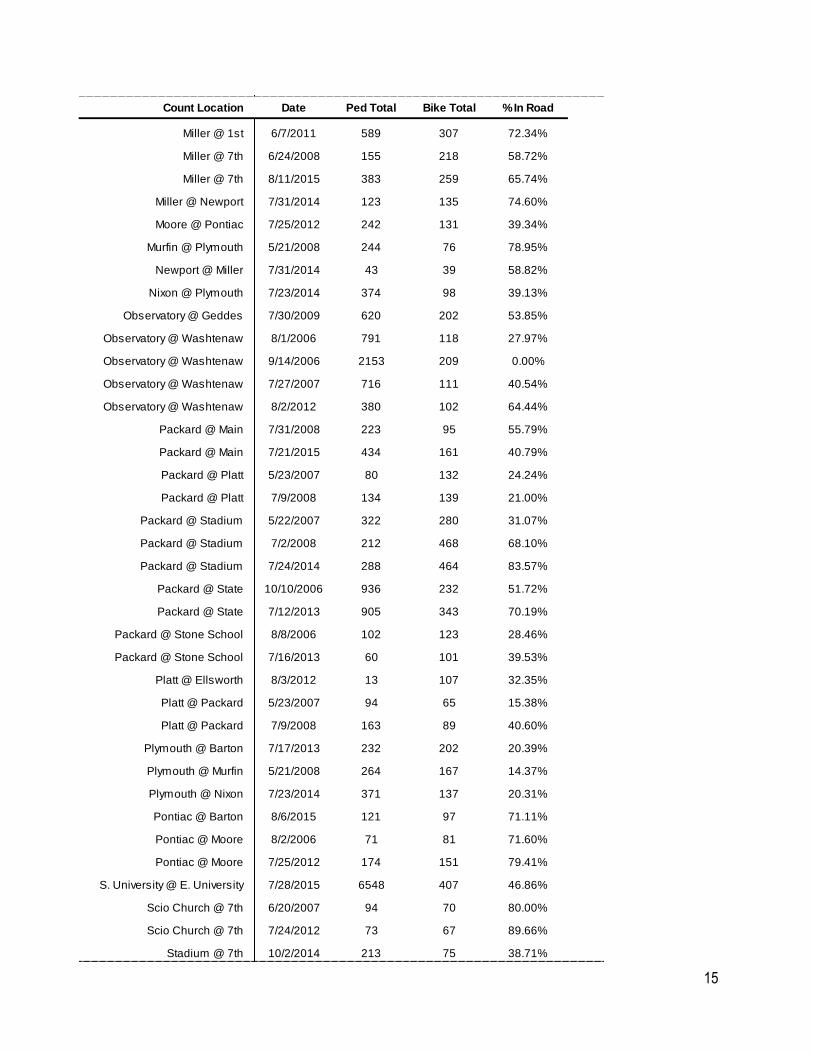
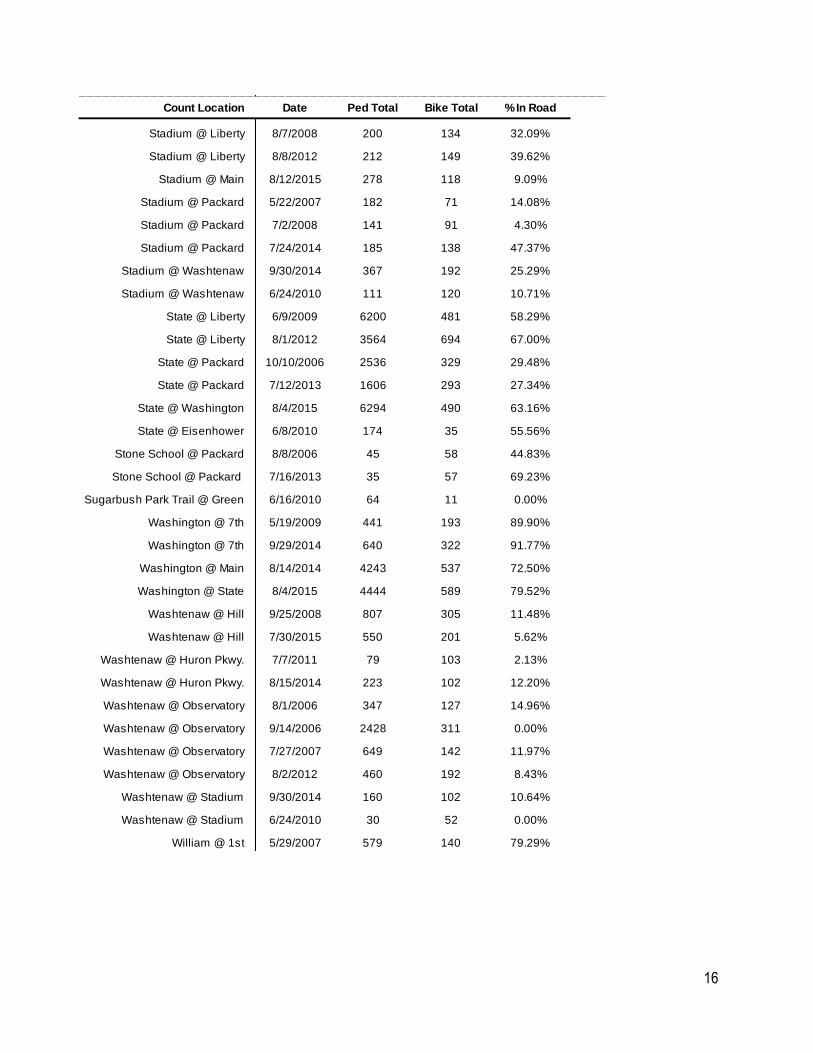
The City of Ann Arbor has collected 142 counts on 93 corridor segments since 2006. A full record
of count locations is included at the end of this report. Counts are conducted at each intersection
during three daily peak travel times: morning (7:45 am to 9:15 am), midday (11:45 am to 1:15 pm),
and evening (5:00 pm to 6:30 pm). These three 90-minute observations are used to estimate total
pedestrian and bicyclist volumes for a typical day on the two intersecting road corridors. Observers
also collect data on the proportions of cyclists riding on the street versus the sidewalk and riding
with versus against traffic.
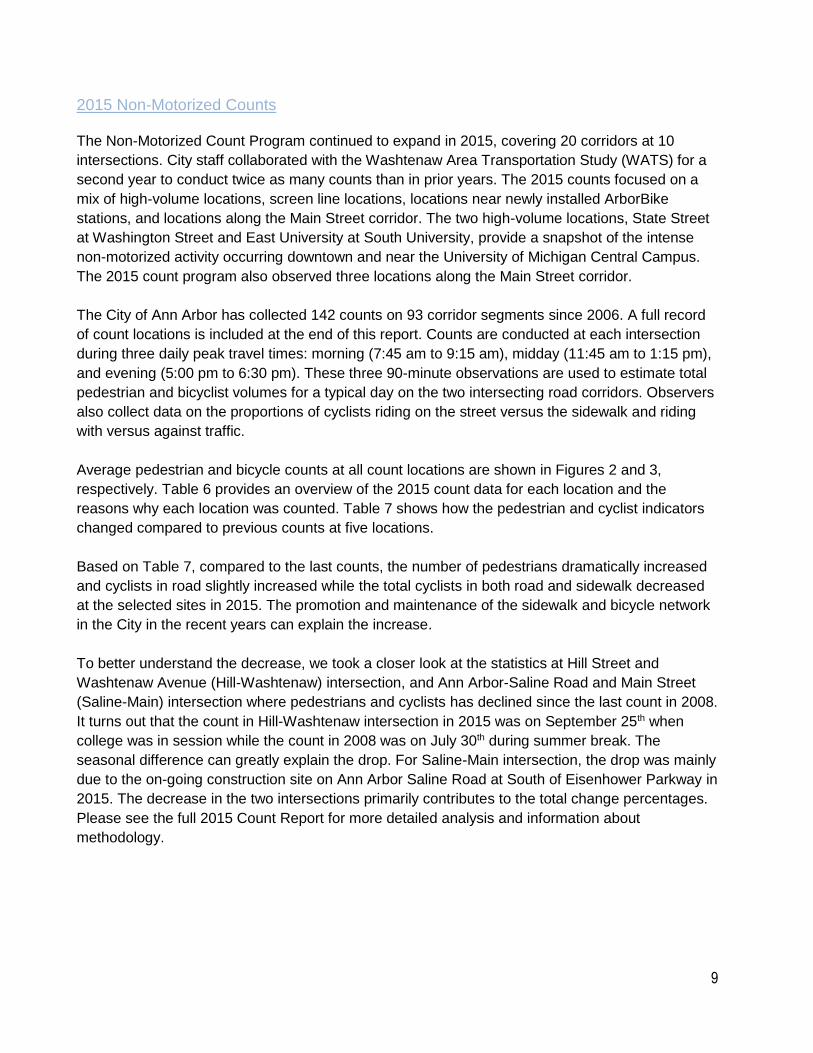
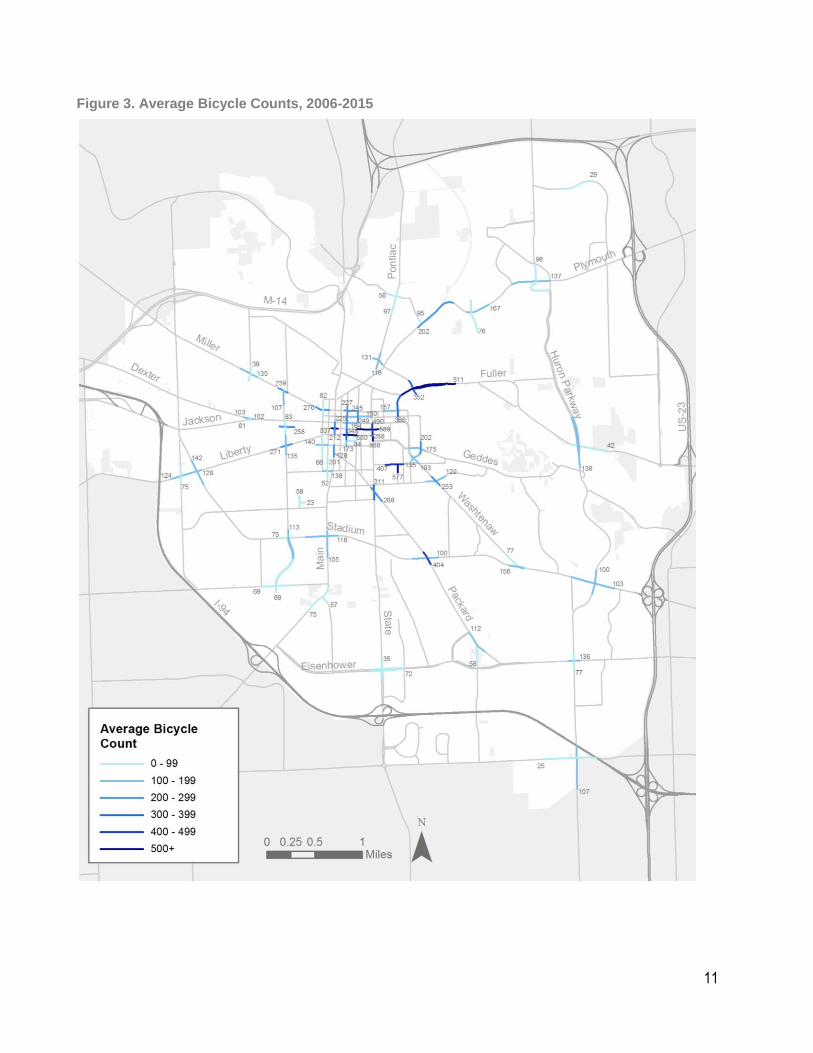
Average pedestrian and bicycle counts at all count locations are shown in Figures 2 and 3,
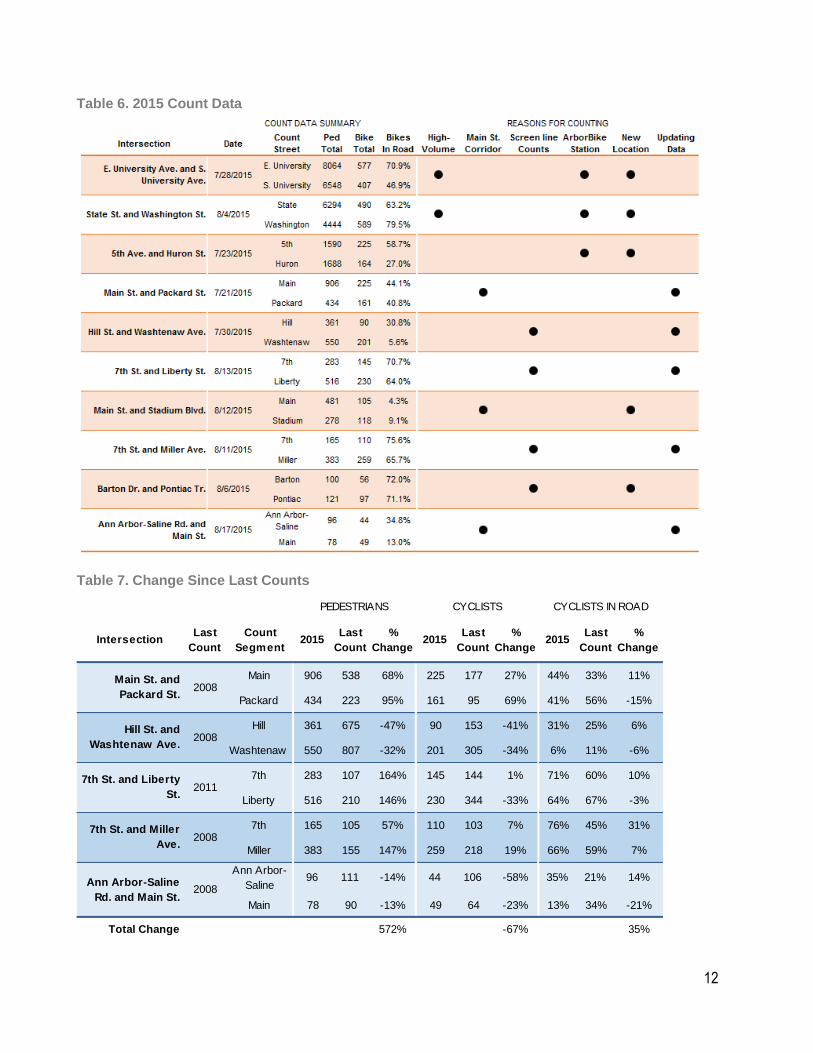
respectively. Table 6 provides an overview of the 2015 count data for each location and the
reasons why each location was counted. Table 7 shows how the pedestrian and cyclist indicators
changed compared to previous counts at five locations.
Based on Table 7, compared to the last counts, the number of pedestrians dramatically increased
and cyclists in road slightly increased while the total cyclists in both road and sidewalk decreased
at the selected sites in 2015. The promotion and maintenance of the sidewalk and bicycle network
in the City in the recent years can explain the increase.
To better understand the decrease, we took a closer look at the statistics at Hill Street and
Washtenaw Avenue (Hill-Washtenaw) intersection, and Ann Arbor-Saline Road and Main Street
(Saline-Main) intersection where pedestrians and cyclists has declined since the last count in 2008.
It turns out that the count in Hill-Washtenaw intersection in 2015 was on September 25th when
college was in session while the count in 2008 was on July 30th during summer break. The
seasonal difference can greatly explain the drop. For Saline-Main intersection, the drop was mainly
due to the on-going construction site on Ann Arbor Saline Road at South of Eisenhower Parkway in
2015. The decrease in the two intersections primarily contributes to the total change percentages.
Please see the full 2015 Count Report for more detailed analysis and information about
methodology.
10
Figure 2. Average Pedestrian Counts, 2006-2015
11
Figure 3. Average Bicycle Counts, 2006-2015
12
Table 6. 2015 Count Data
Table 7. Change Since Last Counts
IntersectionLast
Count
Count
Segment2015
Last
Count
%
Change2015
Last
Count
%
Change2015
Last
Count
%
Change
Main 906 538 68% 225 177 27% 44% 33% 11%
Packard 434 223 95% 161 95 69% 41% 56% -15%
Hill 361 675 -47% 90 153 -41% 31% 25% 6%
Washtenaw 550 807 -32% 201 305 -34% 6% 11% -6%
7th 283 107 164% 145 144 1% 71% 60% 10%
Liberty 516 210 146% 230 344 -33% 64% 67% -3%
7th 165 105 57% 110 103 7% 76% 45% 31%
Miller 383 155 147% 259 218 19% 66% 59% 7%
Ann Arbor-
Saline 96 111 -14% 44 106 -58% 35% 21% 14%
Main 78 90 -13% 49 64 -23% 13% 34% -21%
Total Change 572% -67% 35%
PEDESTRIANS CYCLISTS CYCLISTS IN ROAD
Main St. and
Packard St.2008
Ann Arbor-Saline
Rd. and Main St.2008
Hill St. and
Washtenaw Ave.2008
7th St. and Liberty
St.2011
7th St. and Miller
Ave.2008
13
Count Location Date Ped Total Bike Total % In Road
1st @ Miller 9/20/2006 269 66 0.00%
1st @ Miller 6/7/2011 168 98 71.11%
1st @ William 5/29/2007 274 66 68.18%
5th @ Catherine 6/6/2007 1076 182 47.80%
5th @ Catherine 7/30/2012 907 272 69.83%
5th @ Hoover 7/13/2009 189 59 82.14%
5th @ Huron 7/23/2015 1590 225 58.70%
5th @ Liberty 5/20/2010 2977 348 61.31%
5th @ Library Ln. 9/19/2014 1511 173 56.92%
7th @ Liberty 8/27/2007 187 116 45.69%
7th @ Liberty 6/29/2011 107 144 60.29%
7th @ Liberty 8/13/2015 283 145 70.67%
7th @ Miller 6/24/2008 105 103 44.66%
7th @ Miller 8/11/2015 165 110 75.61%
7th @ Scio Church 6/20/2007 87 65 58.46%
7th @ Scio Church 7/24/2012 66 73 70.00%
7th @ Stadium 10/2/2014 166 113 53.57%
7th @ Washington 5/19/2009 149 84 69.23%
7th @ Washington 9/29/2014 394 82 58.54%
Ann @ Division 5/19/2010 592 150 71.88%
Ann Arbor-Saline @ Main 8/12/2008 111 106 20.75%
Ann Arbor-Saline @ Main 8/17/2015 96 44 34.78%
Ashley @ Madison 6/6/2013 213 52 100.00%
Barton @ Plymouth 7/17/2013 192 95 30.61%
Barton @ Pontiac 8/6/2015 100 56 72.00%
Catherine @ 5th 6/6/2007 690 180 62.78%
Catherine @ 5th 7/30/2012 879 310 78.03%
Catherine @ Glen 6/16/2008 1431 103 45.63%
Catherine @ Glen 7/24/2013 2360 210 48.57%
Dexter @ Huron 8/9/2006 76 85 47.06%
Dexter @ Huron 8/14/2013 102 120 56.60%
Division @ Ann 5/19/2010 948 249 49.53%
E. University @ S. University 7/28/2015 8064 577 70.87%
Eisenhower @ State 6/8/2010 204 72 6.90%
Ellsworth @ Platt 8/3/2012 19 25 69.23%
Fuller @ Maiden 10/5/2006 1767 443 13.09%
All Non-Motorized Counts 2006-2015Table 8. Non-Motorized Count Data 2006-2015
14
Count Location Date Ped Total Bike Total % In Road
Fuller @ Maiden 7/21/2014 431 578 10.57%
Geddes @ Huron Pkwy. 9/2/2014 63 42 36.84%
Geddes @ Observatory 7/30/2009 783 175 50.63%
Glen @ Catherine 6/16/2008 528 257 9.34%
Glen @ Catherine 7/24/2013 1433 475 10.05%
Green @ Sugarbush Park Trail 6/16/2010 199 29 25.00%
Hill @ Washtenaw 9/25/2008 675 153 24.84%
Hill @ Washtenaw 7/30/2015 361 90 30.77%
Hoover @ W. 5th 7/13/2009 93 23 81.82%
Huron @ 5th 7/23/2015 1688 164 26.98%
Huron @ Dexter 8/9/2006 89 78 26.92%
Huron @ Dexter 8/14/2013 134 125 12.73%
Huron Pkwy. @ Geddes 9/2/2014 184 138 16.13%
Huron Pkwy. @ Washtenaw 7/7/2011 112 123 8.47%
Huron Pkwy. @ Washtenaw 8/15/2014 156 77 9.38%
Jackson @ Huron 8/9/2006 66 61 19.67%
Liberty @ 5th 5/20/2010 4779 550 63.20%
Liberty @ 7th 8/27/2007 278 238 56.72%
Liberty @ 7th 6/29/2011 210 344 66.88%
Liberty @ 7th 8/13/2015 516 230 64.04%
Liberty @ Maple 6/16/2009 173 124 49.12%
Liberty @ Stadium 8/7/2008 112 121 50.41%
Liberty @ Stadium 8/8/2012 146 137 58.18%
Liberty @ State 6/9/2009 5257 266 67.27%
Liberty @ State 8/1/2012 2918 310 75.19%
Library Ln. @ 5th 9/19/2014 1121 84 64.00%
Madison @ Ashley 6/6/2013 470 138 67.74%
Maiden @ Fuller 10/5/2006 2694 292 8.90%
Maiden @ Fuller 7/21/2014 1354 412 24.46%
Main @ Ann Arbor-Saline 8/12/2008 90 64 34.38%
Main @ Ann Arbor-Saline 8/17/2015 78 49 13.04%
Main @ Packard 7/31/2008 538 177 32.77%
Main @ Packard 7/21/2015 906 225 44.12%
Main @ Stadium 8/12/2015 481 105 4.26%
Main @ Washington 8/14/2014 5092 212 44.44%
Maple @ Liberty 6/16/2009 179 75 25.81%
Miller @ 1st 9/20/2006 692 245 0.00%
15
Count Location Date Ped Total Bike Total % In Road
Miller @ 1st 6/7/2011 589 307 72.34%
Miller @ 7th 6/24/2008 155 218 58.72%
Miller @ 7th 8/11/2015 383 259 65.74%
Miller @ Newport 7/31/2014 123 135 74.60%
Moore @ Pontiac 7/25/2012 242 131 39.34%
Murfin @ Plymouth 5/21/2008 244 76 78.95%
Newport @ Miller 7/31/2014 43 39 58.82%
Nixon @ Plymouth 7/23/2014 374 98 39.13%
Observatory @ Geddes 7/30/2009 620 202 53.85%
Observatory @ Washtenaw 8/1/2006 791 118 27.97%
Observatory @ Washtenaw 9/14/2006 2153 209 0.00%
Observatory @ Washtenaw 7/27/2007 716 111 40.54%
Observatory @ Washtenaw 8/2/2012 380 102 64.44%
Packard @ Main 7/31/2008 223 95 55.79%
Packard @ Main 7/21/2015 434 161 40.79%
Packard @ Platt 5/23/2007 80 132 24.24%
Packard @ Platt 7/9/2008 134 139 21.00%
Packard @ Stadium 5/22/2007 322 280 31.07%
Packard @ Stadium 7/2/2008 212 468 68.10%
Packard @ Stadium 7/24/2014 288 464 83.57%
Packard @ State 10/10/2006 936 232 51.72%
Packard @ State 7/12/2013 905 343 70.19%
Packard @ Stone School 8/8/2006 102 123 28.46%
Packard @ Stone School 7/16/2013 60 101 39.53%
Platt @ Ellsworth 8/3/2012 13 107 32.35%
Platt @ Packard 5/23/2007 94 65 15.38%
Platt @ Packard 7/9/2008 163 89 40.60%
Plymouth @ Barton 7/17/2013 232 202 20.39%
Plymouth @ Murfin 5/21/2008 264 167 14.37%
Plymouth @ Nixon 7/23/2014 371 137 20.31%
Pontiac @ Barton 8/6/2015 121 97 71.11%
Pontiac @ Moore 8/2/2006 71 81 71.60%
Pontiac @ Moore 7/25/2012 174 151 79.41%
S. University @ E. University 7/28/2015 6548 407 46.86%
Scio Church @ 7th 6/20/2007 94 70 80.00%
Scio Church @ 7th 7/24/2012 73 67 89.66%
Stadium @ 7th 10/2/2014 213 75 38.71%
16
Count Location Date Ped Total Bike Total % In Road
Stadium @ Liberty 8/7/2008 200 134 32.09%
Stadium @ Liberty 8/8/2012 212 149 39.62%
Stadium @ Main 8/12/2015 278 118 9.09%
Stadium @ Packard 5/22/2007 182 71 14.08%
Stadium @ Packard 7/2/2008 141 91 4.30%
Stadium @ Packard 7/24/2014 185 138 47.37%
Stadium @ Washtenaw 9/30/2014 367 192 25.29%
Stadium @ Washtenaw 6/24/2010 111 120 10.71%
State @ Liberty 6/9/2009 6200 481 58.29%
State @ Liberty 8/1/2012 3564 694 67.00%
State @ Packard 10/10/2006 2536 329 29.48%
State @ Packard 7/12/2013 1606 293 27.34%
State @ Washington 8/4/2015 6294 490 63.16%
State @ Eisenhower 6/8/2010 174 35 55.56%
Stone School @ Packard 8/8/2006 45 58 44.83%
Stone School @ Packard 7/16/2013 35 57 69.23%
Sugarbush Park Trail @ Green 6/16/2010 64 11 0.00%
Washington @ 7th 5/19/2009 441 193 89.90%
Washington @ 7th 9/29/2014 640 322 91.77%
Washington @ Main 8/14/2014 4243 537 72.50%
Washington @ State 8/4/2015 4444 589 79.52%
Washtenaw @ Hill 9/25/2008 807 305 11.48%
Washtenaw @ Hill 7/30/2015 550 201 5.62%
Washtenaw @ Huron Pkwy. 7/7/2011 79 103 2.13%
Washtenaw @ Huron Pkwy. 8/15/2014 223 102 12.20%
Washtenaw @ Observatory 8/1/2006 347 127 14.96%
Washtenaw @ Observatory 9/14/2006 2428 311 0.00%
Washtenaw @ Observatory 7/27/2007 649 142 11.97%
Washtenaw @ Observatory 8/2/2012 460 192 8.43%
Washtenaw @ Stadium 9/30/2014 160 102 10.64%
Washtenaw @ Stadium 6/24/2010 30 52 0.00%
William @ 1st 5/29/2007 579 140 79.29%