Embed Size (px)
Citation preview
CITY OF
BLOOMINGTON
COMMITTEE OF THE
WHOLE MEETING
FEBRUARY 16, 2016

AGENDA
City Logo Design Rationale The symbol for the City of Bloomington is multifaceted in its visual and conceptual approach. Visually the symbol and the City's identity represent a modern progressive style which is consistent with the City's government. The symbol is based on three different concepts which combine to represent the City in a contemporary and appropriate way. First and foremost is the chevron. The City government is a respected agency dedicated to serving the public. In this way, the chevron represents service, rank and authority. The symbol may also be seen as a three dimensional building. This represents growth and diversity in our community. Finally, the flower or plant derived from the original name "Blooming Grove," represents a community that is friendly and safe. Progress and growth are also associated with plant life as well as regeneration and renewal. The symbol's positive upward movement is representative of the City's commitment to excellence!
City of Bloomington – Strategic Plan Vision 2025 Bloomington 2025 is a beautiful, family friendly city with a downtown - the heart of the community and great neighborhoods. The City has a diverse local economy and convenient connectivity. Residents enjoy quality education for a lifetime and choices for entertainment and recreation. Everyone takes pride in Bloomington. Jewel of Midwest Cities. Mission The Mission of the City of Bloomington is to be financially responsible providing quality, basic municipal services at the best value. The city engages residents and partners with others for community benefit. Core Beliefs Enjoy Serving Others Produce Results Act with Integrity Take Responsibility Be Innovative Practice Teamwork Show the SPIRIT!! Goals 2015 Financially Sound City Providing Quality Basic Services Upgrade City Infrastructure and Facilities Strong Neighborhoods Grow the Local Economy Great Place to Live - A Livable, Sustainable City Prosperous Downtown Bloomington
12/11/2010

2015 Strategic Plan Goals
Goal 1. Financially Sound City Providing Quality Basic Services
Objective a. Budget with adequate resources to support defined services and level of services
b. Reserves consistent with city policies
c. Engaged residents that are well informed and involved in an open governance process
d. City services delivered in the most cost-effective, efficient manner
e. Partnering with others for the most cost-effective service delivery
Goal 2. Upgrade City Infrastructure and Facilities
Objective a. Better quality roads and sidewalks
b. Quality water for the long term
c. Functional, well maintained sewer collection system
d. Well-designed, well maintained City facilities emphasizing productivity and customer service
e. Investing in the City’s future through a realistic, funded capital improvement program
Goal 3. Grow the Local Economy
Objective a. Retention and growth of current local businesses
b. Attraction of new targeted businesses that are the “right” fit for Bloomington
c. Revitalization of older commercial homes
d. Expanded retail businesses
e. Strong working relationship among the City, businesses, economic development organizations
Goal 4. Strong Neighborhoods
Objective a. Residents feeling safe in their homes and neighborhoods
b. Upgraded quality of older housing stock
c. Preservation of property/home valuations
d. Improved neighborhood infrastructure
e. Strong partnership with residents and neighborhood associations
f. Residents increasingly sharing/taking responsibility for their homes and neighborhoods
Goal 5. Great Place – Livable, Sustainable City
Objective a. Well-planned City with necessary services and infrastructure
b. City decisions consistent with plans and policies
c. Incorporation of “Green Sustainable” concepts into City’s development and plans
d. Appropriate leisure and recreational opportunities responding to the needs of residents
e. More attractive city: commercial areas and neighborhoods
Goal 6. Prosperous Downtown Bloomington
Objective a. More beautiful, clean Downtown area
b. Downtown Vision and Plan used to guide development, redevelopment and investments
c. Downtown becoming a community and regional destination
d. Healthy adjacent neighborhoods linked to Downtown
e. Preservation of historic buildings
Note: No action will be taken on any matters at this meeting beyond approval of the minutes.
1. Call to Order
2. Roll Call of Attendance
3. Public Comment 4. Consideration of approving the Committee of the Whole Meeting Minutes of
January 19, 2016. (Recommend that the reading of the minutes of the Committee of the Whole Proceeding of January 19, 2016 be dispensed with and the minutes approved as printed.)
5. Downtown Development Project Update (Jeff Giebelhausen, Presentation 15 minutes, and SB Friedman, 30 minute presentation, Council discussion TBD)
6. Adjournment
CITY COUNCIL COMMITTEE OF THE WHOLE
MEETING AGENDA CITY HALL COUNCIL CHAMBERS
109 E. OLIVE STREET, BLOOMINGTON, IL 61701 TUESDAY, FEBRUARY 16, 2016, 5:30 P.M.
COMMITTEE OF THE WHOLE MEETING
AGENDA ITEM NO. 4
FOR COUNCIL: February 16, 2016 SUBJECT: Consideration of approving Committee of the Whole Meeting Minutes from January 19, 2016. RECOMMENDATION/MOTION: That the reading of the minutes of Committee of the Whole Proceedings of January 19, 2016 be dispensed with and the minutes approved as printed. STRATEGIC PLAN LINK: Goal 1. Financially sound City providing quality basic services. STRATEGIC PLAN SIGNIFICANCE: Objective 1d. City services delivered in the most cost-effective, efficient manner. BACKGROUND: In compliance with the Open Meetings Act, Committee Proceedings must be approved within thirty (30) days after the meeting or at the Committee’s second subsequent regular meeting whichever is later. In accordance with the Open Meetings Act, Committee Proceedings are made available for public inspection and posted to the City’s web site within ten (10) days after Committee approval. COMMUNITY GROUPS/INTERESTED PERSONS CONTACTED: Not applicable. FINANCIAL IMPACT: Not applicable. Respectfully submitted for Committee consideration. Prepared by: Cherry L. Lawson, City Clerk Recommended by:
David A. Hales City Manager Attachments:
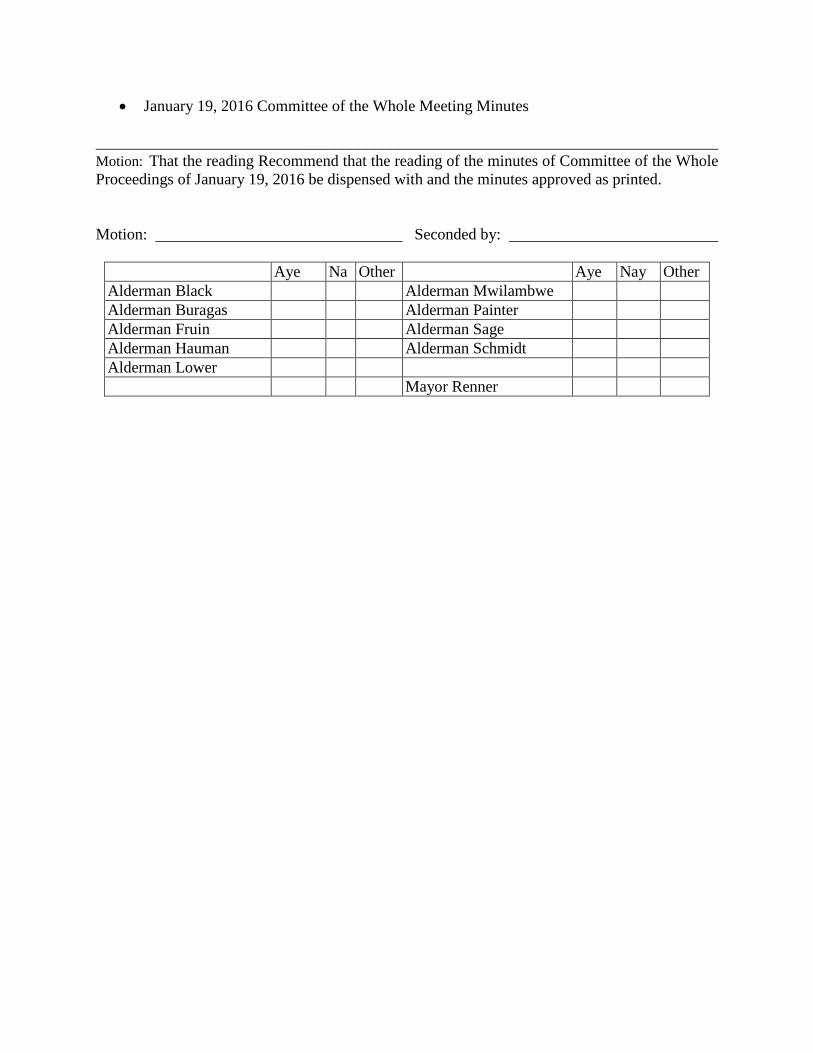
• January 19, 2016 Committee of the Whole Meeting Minutes
______________________________________________________________________________ Motion: That the reading Recommend that the reading of the minutes of Committee of the Whole Proceedings of January 19, 2016 be dispensed with and the minutes approved as printed. Motion: Seconded by:
Aye Na
Other Aye Nay Other Alderman Black Alderman Mwilambwe Alderman Buragas Alderman Painter Alderman Fruin Alderman Sage Alderman Hauman Alderman Schmidt Alderman Lower Mayor Renner
Committee of the Whole Meeting October 19, 2015; 5:30 PM
Page 1 of 8
COMMITTEE AS A WHOLE SESSION PUBLISHED BY THE AUTHORITY OF THE CITY COUNCIL OF
BLOOMINGTON, ILLINOIS TUESDAY, JANUARY 19, 2016; 5:30 P.M.
1. Call to Order
Mayor Renner called the meeting to order at 5:30 PM and asked City Clerk Lawson to call the roll.
2. Roll Call
Aldermen: Jim Fruin, David Sage, Mboka Mwilambwe, Joni Painter, Karen Schmidt, Scott Black, Diana Hauman, Kevin Lower
Absent: Aldermen: Amelia Buragas
3. Public Comment
Mayor Renner opened the meeting to receive Public Comment. The following individuals provided comments during the meeting. Jesse Smart Alton Franklin Jim Thompson Charles Kline Harry Lovell
4. Consideration of approving the Committee of the Whole Meeting Minutes of October 19, 2015. (Recommend that the reading of the minutes of the Committee of the Whole Proceeding of October 19, 2015 be dispensed with and the minutes approved as printed.
Motion by Alderwoman Painter, second by Alderwoman Schmidt that the minutes of the Committee of the Whole Meeting of October 19, 2015 be dispensed with and approved as printed.
Motion carried.
5. Presentation of the Budget Task Force Committee Recommendations David Hales, City Manager, introduced continued discussion on recommendations for topics as prioritized by the City Council. He stated Staff had been pursuing action on the top priorities voted on by Council. Golf operational changes. Mr. Hales stated results of soliciting proposals from

Committee of the Whole Meeting October 19, 2015; 5:30 PM
Page 2 of 8
professionals and experienced, qualified firms would be available by May or June. Comparison between outsourcing against current status quo with existing personnel would be made. Sick Leave Buy Back. Staff was compiling a detailed inventory of benefits currently provided to employees, prioritized these to bring back to Council. Mr. Hales stated Council was looking at a comprehensive compensation policy or philosophy as no definitive written approved policy on where we want to go in the future on compensation for public or private sector employees exists. More information on this would be compiled within the next sixty (60) days. Downtown Hireback Program. Mr. Hales recommended options three (3), Late Hours Liquor License and four (4), Fee Increase for Liquor License City-wide, be given further attention. Solid Waste. Mr. Hales stated that an Ordinance could be forthcoming to institute a fee of $20 for bulk waste for one (1) bucket, $40 for additional. Mr. Hales further commented on other items: Audits for Information Services and Bloomington Center for the Performing Arts (BCPA). The Coliseum Contract was a major endeavor with a lot of staff time and effort. Five (5) year Capitol Improvement budget plan is a work in progress. Storm Water and Sanitary Sewer proposals as well as City Facilities and Fire proposals are under review for the Operating budget next year with a draft proposal to the Council in March. Fee and service charge study would require much time and policy decisions for the Council. Long term financial sustainability plan was ongoing. Mr. Hales mentioned five (5) high level goals where important information and detail were provided as drafts. 1.) Economic Development; 2.) Infrastructure; 3.) Financial Planning; 4.) Reduced Emergency Response Time and 5.) Downtown Implementation Plan.
6. Council discussion regarding Budget Priorities Mayor Renner directed the Council to start with comments on Bloomington Center for the Performing Arts (BCPA); specifically what direction should we give staff, keep it status quo, gain more efficiencies, dramatic cuts, or elimination entirely of the BCPA. Alderman Painter recused herself from voting on the BCPA as she is on the Community Foundation Board. She commented that the BCPA is broadly supported by the community and should be supported by the Council. She expressed her opposition to elimination of the BCPA. Alderman Mwilambwe expressed support for maintaining the BCPA in the community. He recommended that we be more creative with funds to come up with better ways to manage funds and be more efficient. He advised that the Golf Courses, BCPA and other amenities were not intended to bring in huge revenue, but were more for enjoyment and improvement of our quality of life, to promote tourism and help others to experience what the community has to offer. Mr. Mwilambwe recommended bringing in someone from outside BCPA to provide additional experience in finding some efficiencies for BCPA. He mentioned a breakfast
Committee of the Whole Meeting October 19, 2015; 5:30 PM
Page 3 of 8
meeting with OSF/St. Joseph’s and BroMenn where the executives mentioned the need to have quality of life venues to attract top notch doctors to the community. Alderman Sage recommended having a more targeted and specific conversation about the five (5) items to provide direction to staff, to figure out what has council support and what doesn’t. These include: 1.) Sell BCPA; 2.) Sell Creativity Center; 3.) Convert BCPA to enterprise fund; 4.) Reduce BCPA budget and 5.) BCPA audit with 501c3 impact considered. Mayor Renner, another option would be to continue status quo. Alderwoman Painter expressed agreement with the audit. Alderman Sage expressed interest in the outcome of the audit as well as reducing the BCPA budget. Alderman Black mentioned the difficulty in trying to measure where the revenue was coming from when other establishments are involved in the same venue. He stated that he is not in favor of selling. If selling is not an option, then Council needs to review the budget to consider options in handling expenses. Let’s stop talking about it and start promoting it. Let’s get more people there, let’s get more things happening. Mr. Black stated he would like to understand the tax audit. Mr. Hales, the history of the tax stating about three (3) or four (4) years ago, Council capped the amount of the quarter percent sales tax that would go to the BCPA. Prior to that, it had been about one point nine (1.9%) percent. The Council at that time indicated that the cap would be one point seven percent (1.7%) to the BCPA and challenged the BCPA to hire a development manager to start to raise additional revenue to help offset some of the costs of the BCPA. Alderman Schmidt, it was intended that other revenues would continue to be provided to the BCPA to keep them going. However, the funds then got dispersed to other projects as time went on. Alderman Black, the next step would be for staff to draft an Ordinance to be considered by Council relating to sales tax money distributed to the BCPA with potential options. Mr. Hales explained, Alderman Schmidt was referring pre-Recession when funding for BCPA was capped. At the time of the great Recession, about 100 full-time positions had to be cut. It was felt that due to the expanding cost of Police and Fire and other high priority services the city couldn’t afford to allocate as much money as before. Mayor Renner recommended going back to the five (5) or six (6) points of referral with the sixth as not reducing any funding.
Committee of the Whole Meeting October 19, 2015; 5:30 PM
Page 4 of 8
Alderman Black recommended going back to the Ordinance to determine whether funds would be reallocated back to the BCPA to negate the funding challenge that they have. Mayor Renner explained that was the past and in today’s budget they would have to figure out where that money would come from. Mr. Hales, the FY budget for 2017 incorporated $1.7million in sales tax revenue going to the BCPA. It is up to the Council to look at providing greater or less funding. These recommendations came before the sales tax vote. Since that vote, a quarter percent of the tax is going to mental health, a quarter percent to street resurfacing and the other half percent is to help offset the need to eliminate personnel. Without the other half percent of the tax the City was looking at significant potential for layoffs and elimination of personnel. Mr. Hales stated that FY 2017 has the potential for a good, strong balanced budget. Alderman Black, he would favor the audit with the 501c3 impact to get the public engaged and he would be open to having a conversation about selling the Creativity Center. He stated that he would welcome conversations to understand what it would mean to reduce the budget, what those numbers would be. Alderman Hauman, she was in favor of investing in the BCPA to promote downtown. She questioned the possibility of selling naming rights to the BCPA as was done with the Coliseum. The Creativity Center could be a possible revenue producer. Combining management from the Coliseum and the BCPA should go forward, as it appeared to have full support from Council. In order to promote downtown, she encouraged the Council to have the courage to start to develop the strategic plan for downtown. Alderman Lower thanked the Budget Task Force (BTF) for their time reviewing the budget, stating it has narrowed the vision on what cuts might be available. There should be more conversations beyond what was outlined as options by the BTF. He offered further history on the purchase of the BCPA and purpose of the City at that time. At that time, the City had not intended to fund the programs and take care of expenses to run the entity. Entertainment is not a primary function of government. Repair of roads, sewers, having fresh water should be a higher priority for the City than entertainment. He questioned what it would take to have the City maintain the building, paying for the heating and cooling; however, let the BCPA fund their programs separately, whether with an enterprise fund, privately, etc. The Creativity Center needs some major work to be done to it. Alderman Schmidt, she was not in favor of reducing the budget for the BCPA. She is interested in seeing the results of the audit. She is in favor of the Council supporting the entity and letting the staff at BCPA do what they do best. Alderman Fruin, he was very supportive of the BCPA as it is critical to our community, to downtown and our diversity. A consensus on how the Council views entertainment, not limited to BCPA, but including Golf, the Zoo, quality of life to get a council philosophy on what to subsidize, is needed.
Committee of the Whole Meeting October 19, 2015; 5:30 PM
Page 5 of 8
Alderman Sage, asked whether the City Manager had a sense of what option had the most support from the Council. He acknowledged that the audit seems to have the majority of support. Mr. Hales, his impression was the majority has no interest in or support of moving ahead with any of the other items that would involve reduction of the current level of funding, the $1.7 million. There has been a majority of interest in findings of the audit. Beyond that, he has not heard privately that any of the Council wishes to address any of the other options at this time. Alderman Sage, he is in favor of reducing the BCPA budget in addition to the audit as well as selling the Creativity Center. Alderman Black asked for the Council to weigh in on the Creativity Center and the thought of selling it. Mayor Renner inquired whether more than three (3) Council members were interested in selling the Creativity Center. No other Aldermen agreed. Alderman Fruin, he does not have enough information on the Creativity Center, its usage and cost, to make that decision. Mr. Hales stated, some analysis of operating expenses of the Creativity Center had been done by the previous director. The management of the BCPA as well as any Fundraisers would want a definitive policy statement by the Council, maybe in the form of a Resolution, which would indicate support for the Creativity Center, including assistance with operating expenses, subject to private donations being raised to complete the remodeling. Council will need to make it public that the majority supports this, to move forward with the Creativity Center. Mayor Renner, more information needs to be gathered and to bring back to a future meeting for further discussion. He agreed that the audit would need to be reviewed at that time, also. Alderman Black was in favor of having a presentation done by the current management of the BCPA, along with having a resolution of Council support that speaks to the concerns and then vote at that time. Mayor Renner asked Council to move on to the next topic, Downtown Hireback. Mr. Hales suggested that the focus be narrowed, such as looking at the Late Hour Liquor license including some liquor license fees citywide. Mayor Renner highlighted the items Mr. Hales was referring to. Items three (3) and four (4). 3.) Establishing Late Hour Liquor License and 4.) Increase Liquor License Fees Citywide
Committee of the Whole Meeting October 19, 2015; 5:30 PM
Page 6 of 8
to support the Police department. Mayor Renner clarified the entire city has some residual benefits from the Downtown Hireback. He mentioned some of the worst violations for liquor license issues or problems had not been from the downtown businesses but other parts of the City. The last time liquor licenses were increased was 1983, and all the increased costs of liquor enforcement have been paid for by taxpayers. Mr. Hales agreed with the Mayor and added that the police force had to cut back on liquor related enforcement citywide due to budget constraints. He recommended that staff do more research so they can bring back specific recommendations to get the fees to where they need to be. Mayor Renner, questioned the fee study being done would include this. Mr. Hales stated only the policy would be updated with that study. The policy would identify the purpose for each fee or service charge. A recovery of the cost for the hire back is what items three (3) and four (4) above would accomplish. Alderman Black stated he would like to see a Resolution or an Ordinance adjustment for option three (3) A, which puts the late hours liquor license for the downtown owners proportional to the occupancy and how that cost plays out. He stated he would vote on it and support it. Alderman Schmidt mentioned that downtown tavern owners raised a question as to why monies collected for ordinance violations do not contribute to costs. Mr. Hales, violation fees cannot be counted on as a constant source of revenue. Fines are designed to change behavior and that fee may not be available the next year. It comes back into the General Fund as do other sales tax revenue. Alderman Painter stated she is in favor of a citywide two o’clock (2:00) a.m. special liquor license and did not think it unreasonable for them to pay for this service. She is in favor of raising the liquor fees across the whole city. Alderman Lower, agreed; however, expressed concern for smaller entities that have not seen disruptions and violations and still must experience the increased fees. He does not have a big problem with raising the fees if done incrementally at a small amount so the market will bear it, over a period of ten (10) years. He commented on the plan to see a diminished force downtown as behavior is changed; and therefore, would prefer to see fines instead of increased fees. Alderman Sage voiced support for option three (3) A, as downtown entities are consuming the services of the downtown police hire back. Option four (4) should be a separate conversation as the topic was Downtown Police Hireback and option four (4) relates to a citywide fee increase.
Committee of the Whole Meeting October 19, 2015; 5:30 PM
Page 7 of 8
Alderman Hauman, she is in favor of continuing the Downtown Hireback as the police officers do deter unwanted activity. She questioned the taxes generated by the downtown taverns. The downtown establishments were paying a two percent (2%) tax over and above the regular sales tax, and the tax was already covering expenses for the Downtown Hire back. Mayor Renner commented on separating the two (2) options or blend them to pay for the cost of the Downtown Hire back. Alderman Hauman commented on the number of violations downtown dealing with public urination to suggest needing a public washroom downtown. She stated that making downtown a destination to generate more revenue through the BCPA or the Coliseum or whatever, Council would need to develop a strategy to encompass all aspects. She is not in favor of the downtown taverns footing the bill for the Hireback. Alderman Mwilambwe stated, he favored the blended approach of increasing the liquor license fees citywide and three (3) A, but would not want to put anyone out of business. He favored increases in increments over a period of time. Alderman Fruin, the issues are 1.) downtown and 2.) late hours. He was not in favor of spreading the cost citywide, and questioned continuing the culture that currently exists downtown causing the need for the Hireback. Alderman Schmidt stated she favored a blended system, increases in increments, and encouraged Council to have a meeting with the license holders to get their feedback and ideas. Mayor Renner emphasized that these conversations have been heard, and this item is a Council decision for a broader budget process. A hearing at the Liquor Commission could be had to hear feedback from the license holders. Mayor Renner mentioned Golf and Solid Waste were two more subjects to be discussed. Mr. Hales asked whether Council was ready to consider an Ordinance in one of the next meetings on a Solid Waste proposal of $20 for the first bucket of bulk waste, and $40 for the second bucket as a majority had shown support for this. Mayor Renner asked for comments from the Council on this proposal. Alderman Sage asked whether the cost would be $40 for each bucket after the first bucket. Mr. Hales stated yes. Alderman Sage stated his support for the proposal.
Committee of the Whole Meeting October 19, 2015; 5:30 PM
Page 8 of 8
Alderman Haumann inquired whether a person is charged if they took bulk waste to the transfer site themselves. She stated she was in favor of the increase. Mr. Hales, there is no charge for taking bulk waste to the transfer site themselves. Alderman Black, inquired whether there would be three (3) or four (4) free pickups per year, such as Spring cleanup. He is in favor of the increase. Mr. Hales suggested keeping the idea of free pickups separate from the administrative proposal as that had not been thoroughly discussed. Alderman Fruin stated he was not in favor of the increase. Alderman Lower stated he was not in favor of the increase. Alderman Mwilambwe stated he was not in favor of the increase. Alderman Painter stated she was not in favor of the increase. Alderman Schmidt stated she was in favor of the increase but agreed with the need to have one (1) or two (2) days a year for free pickup. Mayor Renner noted the concensus of Council and added Alderman Buragas would be given an opportunity to express her thoughts on this item. 7. Adjournment
Motion by Alderman Schmidt, seconded by Alderman Fruin to adjourn Committee as a Whole Session. Time: 7:37 p.m.
Motion carried. (viva voce) CITY OF BLOOMINGTON ATTEST Tari Renner, Mayor Cherry L. Lawson, City Clerk
Item 5
Downtown Development Project Update
SB FRIEDMAN | DEVELOPMENT ADVISORS 1 www.sbfriedman.com
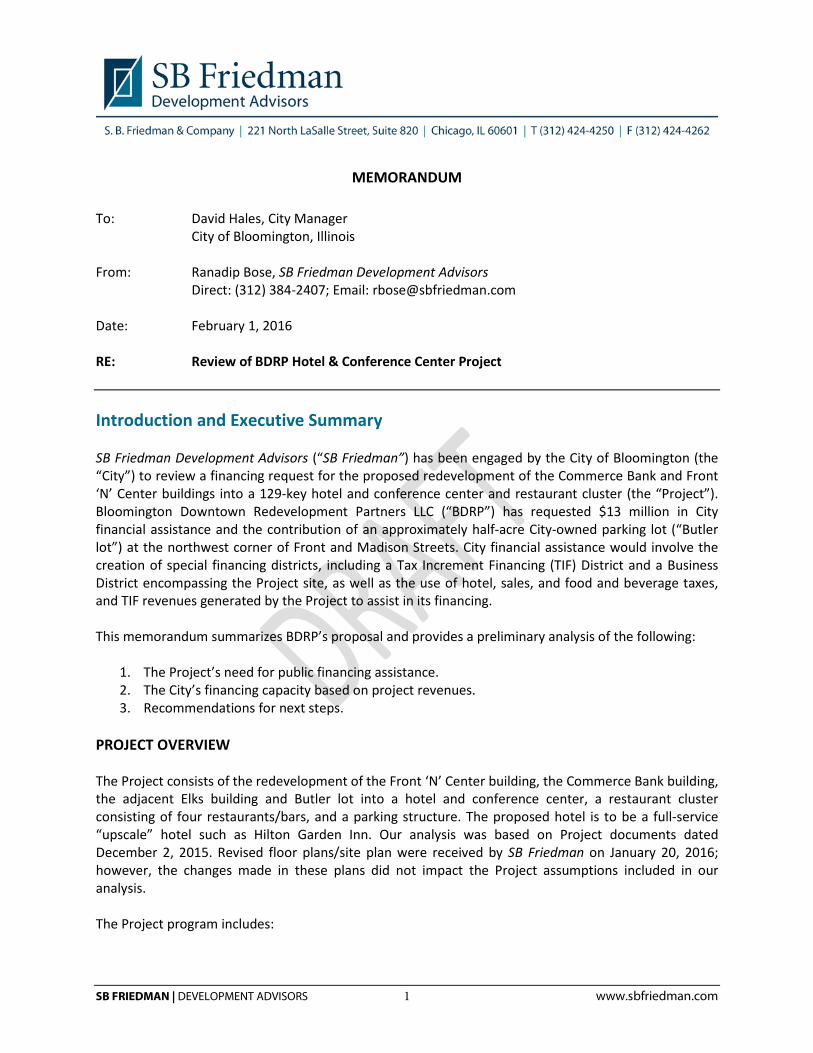
MEMORANDUM To: David Hales, City Manager
City of Bloomington, Illinois From: Ranadip Bose, SB Friedman Development Advisors
Direct: (312) 384-2407; Email: [email protected] Date: February 1, 2016 RE: Review of BDRP Hotel & Conference Center Project Introduction and Executive Summary SB Friedman Development Advisors (“SB Friedman”) has been engaged by the City of Bloomington (the “City”) to review a financing request for the proposed redevelopment of the Commerce Bank and Front ‘N’ Center buildings into a 129-key hotel and conference center and restaurant cluster (the “Project”). Bloomington Downtown Redevelopment Partners LLC (“BDRP”) has requested $13 million in City financial assistance and the contribution of an approximately half-acre City-owned parking lot (“Butler lot”) at the northwest corner of Front and Madison Streets. City financial assistance would involve the creation of special financing districts, including a Tax Increment Financing (TIF) District and a Business District encompassing the Project site, as well as the use of hotel, sales, and food and beverage taxes, and TIF revenues generated by the Project to assist in its financing. This memorandum summarizes BDRP’s proposal and provides a preliminary analysis of the following:
1. The Project’s need for public financing assistance. 2. The City’s financing capacity based on project revenues. 3. Recommendations for next steps.
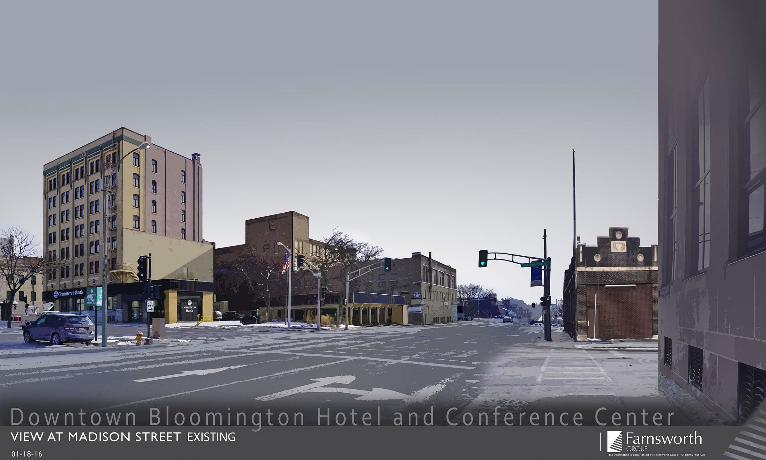
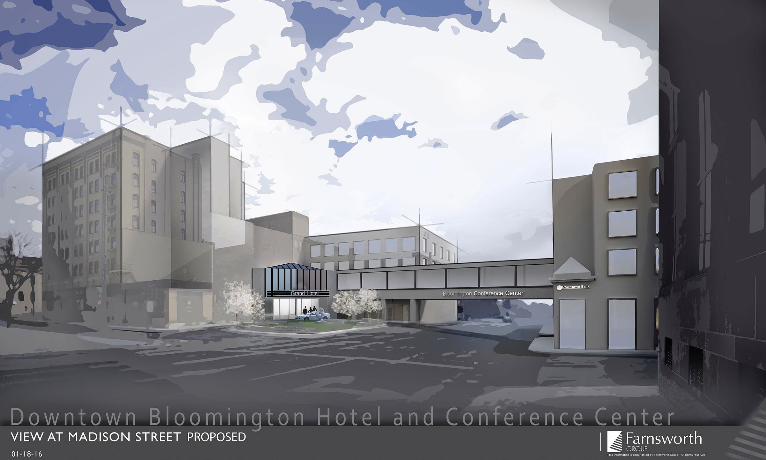
PROJECT OVERVIEW The Project consists of the redevelopment of the Front ‘N’ Center building, the Commerce Bank building, the adjacent Elks building and Butler lot into a hotel and conference center, a restaurant cluster consisting of four restaurants/bars, and a parking structure. The proposed hotel is to be a full-service “upscale” hotel such as Hilton Garden Inn. Our analysis was based on Project documents dated December 2, 2015. Revised floor plans/site plan were received by SB Friedman on January 20, 2016; however, the changes made in these plans did not impact the Project assumptions included in our analysis. The Project program includes:

City of Bloomington Review of BDRP Hotel & Conference Center
SB FRIEDMAN | DEVELOPMENT ADVISORS 2 www.sbfriedman.com
• 129-key full-service upscale hotel including a restaurant operated as part of the hotel • 12,000-SF conference center/ meeting space • 10,000 SF of space for three restaurants that will be leased out to operators separate from the
hotel • 250-space parking garage • Skybridge connecting the hotel with the conference center
REVIEW OF PROJECT CONCEPT Based on our review of the development proposal, we believe the Project could be a pioneering development in Downtown Bloomington. The proposed Project site is strategically located adjacent to the historic downtown square anchored by the iconic McLean County Museum of History, and is directly north of the U.S. Cellular Coliseum-- a City-owned arena that hosts concerts, ice shows, motor sports and trade shows. The historic renovation of the mostly vacant and underutilized Commerce Bank and Front ‘N’ Center buildings into a hotel and cluster of four restaurants has the potential to activate the heart of downtown and create a new dining destination in the City. There are also significant opportunities for synergy between the Project’s hotel, conferencing and restaurant/bar facilities and the adjacent U.S. Cellular Coliseum to boost programming, hotel stays and downtown dining. PROJECT STATUS/PRELIMINARY NATURE OF INFORMATION While BDRP has submitted estimates of Project development cost estimates, operating revenues and expenses, and financing sources, the Project is still in the pre-development concept stage. The Project program, plans and budget need to be finalized, other financing sources such as EB-5 and New Market Tax Credits (NMTCs) explored, and financing commitments from lending institutions and investors secured. It is our understanding that BDRP Principal Jeff Giebelhausen is functioning as a broker/development facilitator for the Project and is in discussions with multiple entities with experience in developing and operating similar hotel projects. He will partner with one of these entities who will be the final developer/operator of the Project and solicit the specific hotel flag and other restaurant tenants. The preliminary nature of cost estimates, financing and revenue projections suggests that significant work needs to be done to reach a full terms sheet and Redevelopment Agreement, including firming up the Project concept and securing actual developer/operator and financial partners. SUMMARY OF ANALYSIS SB Friedman reviewed and benchmarked the Project budget, cash flow and financing sources submitted by BDRP. We made several adjustments to the information submitted and conducted additional analyses to estimate the financing gap of the Project and the City’s financing capacity based on tax revenues generated. Specific adjustments and analyses conducted by SB Friedman are summarized below and discussed in detail in this memorandum:
• Revised development costs based on industry data. • Adjusted Project revenues and expenses to be more consistent with the Hotel & Conference
Center Feasibility Study conducted by HVS for the City in 2014. • Adjusted capital structure to reflect typical financing terms of lending institutions and investors. • Projected tax revenues generated by the Project including hotel taxes, food and beverage taxes,
sales taxes, and TIF revenues, and the associated present value off all the revenue streams.
City of Bloomington Review of BDRP Hotel & Conference Center
SB FRIEDMAN | DEVELOPMENT ADVISORS 3 www.sbfriedman.com
• Assessed the financing gap of the Project and the availability of City tax revenues to fund the gap.
CONCLUSIONS Our analysis of the Project’s cash flow and pro forma, as detailed in the following section of this memorandum, indicates that the Project needs a present value of approximately $8.2 to 11.2 million in public assistance and the contribution of the City-owned Butler lot in order to achieve competitive returns. This estimate of the financing gap is $1.8 to $4.8 million lower than BDRP’s request of $13 million in assistance. Our review of select public revenues produced by the Project including hotel, sales and food and beverage taxes, and TIF revenues indicates that the Project is projected to generate up to $16.9 million in present-value terms over a 25-year period at a 4.5% discount rate. Depending on the form of City financial assistance and associated financing terms, the tax revenues from the Project would result in City financing capacity ranging from $8.8 to $13.2 million and could be adequate to cover SB Friedman’s estimate of the Project financing gap of $8.2 to $11.2 million. Therefore, even after the public assistance is provided, over a 25-year period, the City stands to gain a net direct fiscal benefit of $5.7 to $8.7 million in present value terms. However, because of the preliminary nature of the Project concept and real estate financial information, the estimates of financing gap and financing capacity can materially change once the Project concept is refined and the various parameters are firmed up. Prior to a firm commitment of City assistance and disbursement of funds, an experienced hotel developer/operator and financing commitments from investors and lending institutions must be attained. The specific form of assistance can be structured to further mitigate risk to the City. Some options are described in the “Analysis of Public Financing Capacity” section of the memorandum. We recommend the City endorse BDRP’s continued efforts to advance the Project and undertake preliminary steps such as creation of the TIF and Business Districts and obtaining appraisals of the Project site. The City could utilize an Inducement Resolution to memorialize the City’s support for the Project subject to a complete and acceptable development team and program that would include the following:
• Commitment from an appropriate and acceptable hotel developer; • Evidence of site control; • Financing commitments from acceptable lenders, tax credit buyers and equity investors; • Lease or other commitments from appropriate other tenants; • Franchising agreement for an acceptable hotel brand; • Detailed plans and specifications for the development acceptable to the City administration; • Construction and development costs prepared in sufficient detail by a general contractor or
professional cost estimator; and • Revised, final financial projections of net operating income, tax generation, and other factors.
The Inducement Resolution should further detail the undertakings required and expected of each party, delineate the timeframe for performance, initiate the process to designate the TIF/Business Districts in the project area, and provide for undertaking the pre-development activities that are the City’s responsibility.
City of Bloomington Review of BDRP Hotel & Conference Center
SB FRIEDMAN | DEVELOPMENT ADVISORS 4 www.sbfriedman.com
BDRP Pro Forma Assumptions and Benchmarking SB Friedman reviewed the preliminary data submitted by BDRP on December 2, 2015 and engaged in subsequent conversations with BDRP to obtain additional information and understand the underlying assumptions of the Project. The following data was received by SB Friedman from BDRP for review:
• Preliminary site plans and floor plans illustrating the Project. • Development budget in PDF format that includes financing sources and Project hard and soft
costs. • Pro forma showing operating revenues and expenses of the Project, net operating income, and
the repayment of Project debt. No returns calculations were included in the cash flow. • Hotel and sales tax revenue assumptions (dated December 11, 2015).
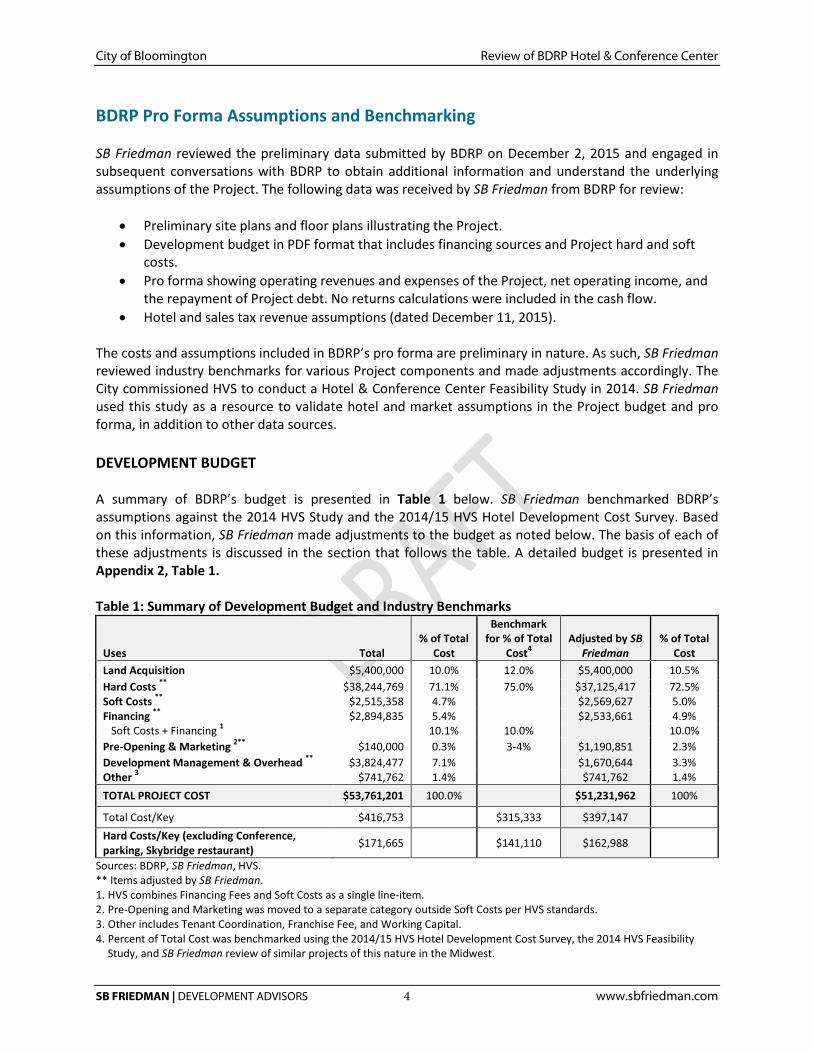
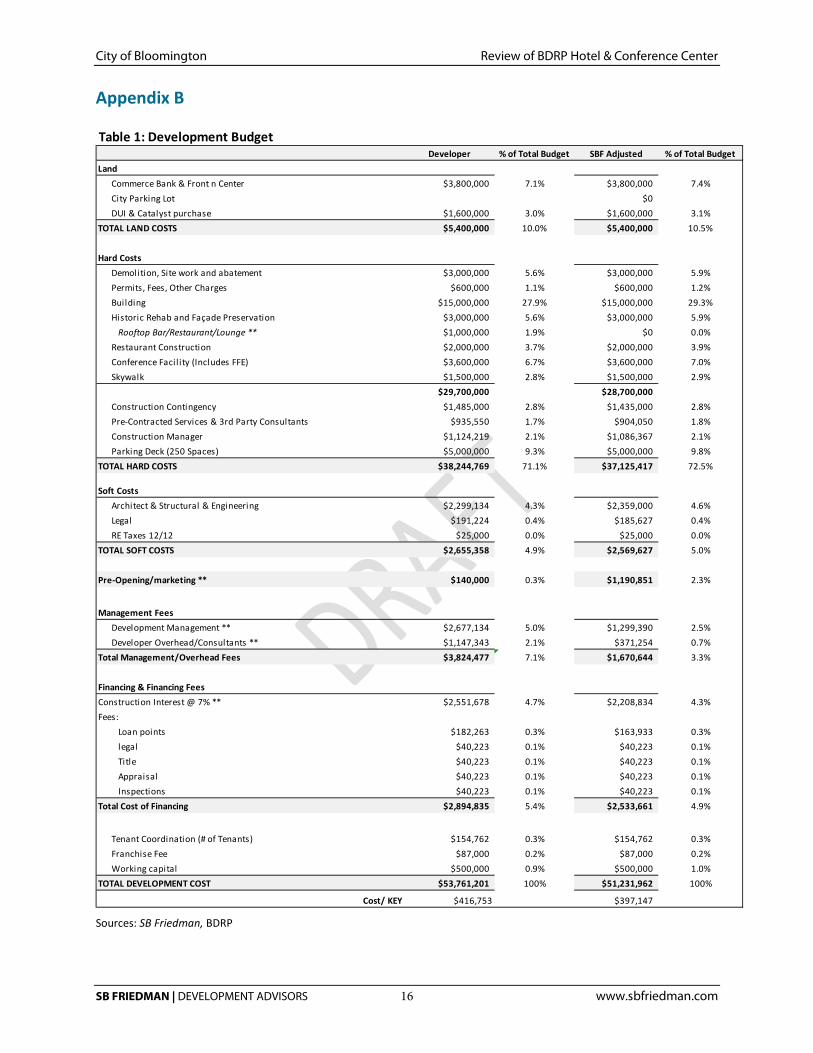
The costs and assumptions included in BDRP’s pro forma are preliminary in nature. As such, SB Friedman reviewed industry benchmarks for various Project components and made adjustments accordingly. The City commissioned HVS to conduct a Hotel & Conference Center Feasibility Study in 2014. SB Friedman used this study as a resource to validate hotel and market assumptions in the Project budget and pro forma, in addition to other data sources. DEVELOPMENT BUDGET A summary of BDRP’s budget is presented in Table 1 below. SB Friedman benchmarked BDRP’s assumptions against the 2014 HVS Study and the 2014/15 HVS Hotel Development Cost Survey. Based on this information, SB Friedman made adjustments to the budget as noted below. The basis of each of these adjustments is discussed in the section that follows the table. A detailed budget is presented in Appendix 2, Table 1. Table 1: Summary of Development Budget and Industry Benchmarks
Uses Total % of Total
Cost
Benchmark for % of Total
Cost4 Adjusted by SB
Friedman % of Total
Cost Land Acquisition $5,400,000 10.0% 12.0% $5,400,000 10.5% Hard Costs ** $38,244,769 71.1% 75.0% $37,125,417 72.5% Soft Costs ** $2,515,358 4.7% $2,569,627 5.0% Financing ** $2,894,835 5.4% $2,533,661 4.9% Soft Costs + Financing 1 10.1% 10.0% 10.0% Pre-Opening & Marketing 2** $140,000 0.3% 3-4% $1,190,851 2.3% Development Management & Overhead ** $3,824,477 7.1% $1,670,644 3.3% Other 3 $741,762 1.4% $741,762 1.4% TOTAL PROJECT COST $53,761,201 100.0% $51,231,962 100%
Total Cost/Key $416,753 $315,333 $397,147 Hard Costs/Key (excluding Conference, parking, Skybridge restaurant) $171,665 $141,110 $162,988
Sources: BDRP, SB Friedman, HVS. ** Items adjusted by SB Friedman. 1. HVS combines Financing Fees and Soft Costs as a single line-item. 2. Pre-Opening and Marketing was moved to a separate category outside Soft Costs per HVS standards. 3. Other includes Tenant Coordination, Franchise Fee, and Working Capital. 4. Percent of Total Cost was benchmarked using the 2014/15 HVS Hotel Development Cost Survey, the 2014 HVS Feasibility
Study, and SB Friedman review of similar projects of this nature in the Midwest.
City of Bloomington Review of BDRP Hotel & Conference Center
SB FRIEDMAN | DEVELOPMENT ADVISORS 5 www.sbfriedman.com
The following details key components of the development budget summary shown in the table above.
• Land Acquisition. BDRP assumes total land acquisition costs of $5.4 million or 10% of the total Project. This includes $3.8 million for the Commerce Bank building, Front ‘N’ Center building and Elks building, and $1.6 million for the future purchase of the DUI building and the relocation of DUI to the Catalyst building. BDRP has drawn two sets of plans, one incorporating and the other working around the DUI parcel. At this stage, the economics of the Project include the DUI parcel. Additionally, BDRP is assuming a contribution of the City-owned Butler lot at no cost. In absence of a site appraisal, SB Friedman has not independently validated the site acquisition cost. However, the $3.8 million site acquisition cost for the Commerce Bank building, Front ‘N’ Center building and Elks building appears to be three times higher than the assessor’s market value of $1.2 million. While costs of site assembly in infill locations can be higher due to such factors as the need for tenant relocations, it is recommended that the City obtain an as-is appraisal of all properties being acquired. This will provide the extent of variance of site acquisition costs shown in the pro forma from the market value of the sites. Additionally, it will provide an understanding of the monetary value of the City contribution associated with the Butler lot.
• Hard Costs and FF&E. Hard costs include demolition and building construction costs for the
hotel, conference center, restaurants, parking deck, and skybridge. FF&E, which typically includes supplies, equipment and finishes, was not specifically broken out in the development budget and was included along with hard costs. BDRP has estimated construction and building/renovation costs including FF&E to total $38.0 million, or 71% of the total Project budget. The only adjustment made by SB Friedman is the removal of $1.0 million for construction of a “Rooftop Bar/Restaurant/Lounge,” which was listed as “TBD” on the sales revenue documents and was not included in the cash flow. On average, for projects of this nature, Hard Costs and FF&E represent 75% of the budget and therefore, overall, these costs appear to be in line with industry standards. However, on a per key basis, the Hard Costs for the hotel component of the program as adjusted by SB Friedman (and excluding conference center, parking, skybridge, and restaurant construction) are $161,785, or 13% higher than the HVS estimate of $141,110 per key for a new construction hotel of similar quality. Due to the preliminary nature of these estimates and the nature of historic renovation, we would recommend further validation of construction costs.
• Soft Costs. SB Friedman adjusted this cost upward to be 5.0% of total development costs, to be
consistent with industry standards.
• Pre-Opening and Marketing. We adjusted this cost upward to be consistent with industry standards, which are on average 3-4% of total development costs (2014/15 HVS Cost Estimate).
• Financing Costs. Nearly $2.9 million has been included in the Project budget for financing costs, which include construction period interest, loan points and financing fees. BDRP did not include a draw schedule and a specific calculation that shows the basis of the financing cost calculation. SB Friedman’s estimate of financing costs with an 18-month construction draw schedule and a
City of Bloomington Review of BDRP Hotel & Conference Center
SB FRIEDMAN | DEVELOPMENT ADVISORS 6 www.sbfriedman.com
7% interest rate and the associated fees/expenses amounts to approximately $2.5 million. We adjusted the financing cost downwards accordingly.
• Development Management & Development Overhead. These combined developer fees amount to $3.8 million or 7% of the overall budget. SB Friedman reduced these fees to $1.7 million or 3.2% of the total budget, bringing this allocation closer to other comparable commercial development projects reviewed by our firm in the Midwest.
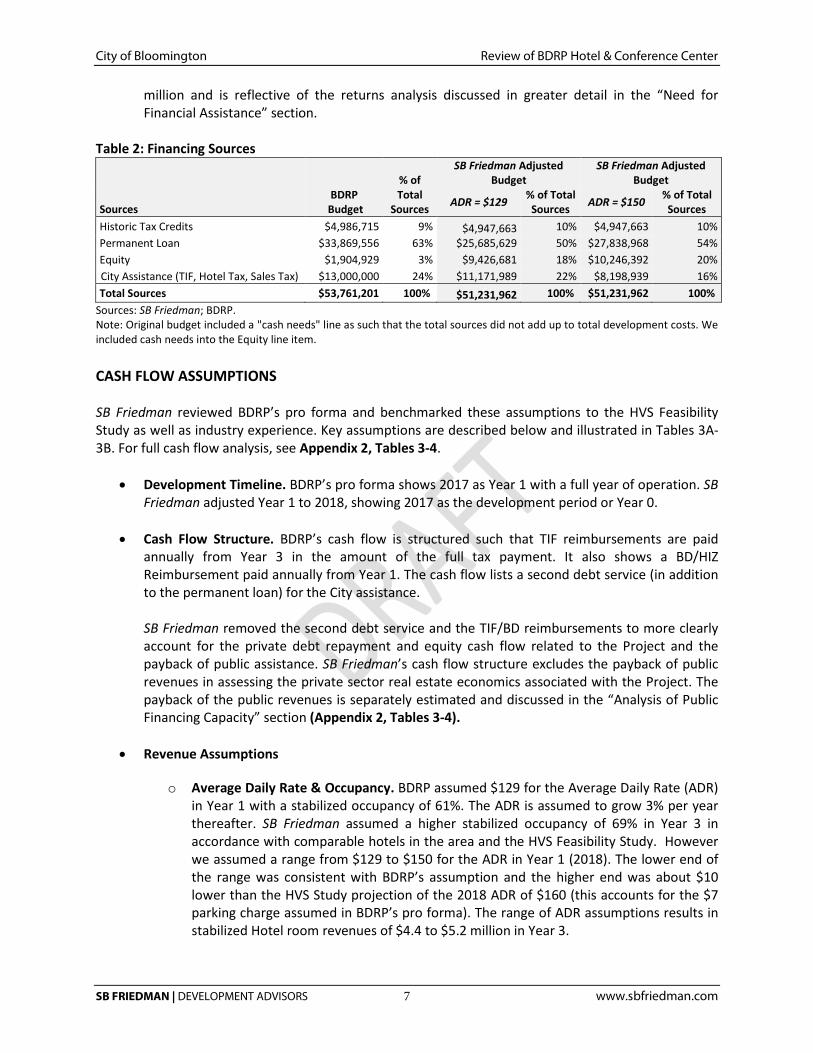
FINANCING SOURCES BDRP anticipates that the Project will be financed by Historic Tax Credits, a 25-year permanent loan and developer equity, in addition to the requested City assistance, as seen below in Table 2. Per the assistance request, BDRP has assumed $13 million in City assistance stemming from TIF revenues, hotel taxes, food and beverage taxes, and sales tax revenues. SB Friedman reassessed the Project’s financing gap after adjusting the Project’s sources to adhere to financing parameters for similar projects as detailed below.
• Historic Tax Credits (HTC). BDRP has anticipated approximately $4.9 million in Federal Historic Tax Credits based on a calculation of 20% of eligible hard costs (hard costs net of conference center, skybridge, parking deck, construction management and contingency). The federal credits are presumed to sell at $1/credit. This is a reasonable assumption according to the National Trust for Historic Preservation, which cites $0.95-0.99/credit. SB Friedman did not make adjustments to the tax credit calculation. The Project is not eligible for State Historic Tax Credits. The funds generated by the tax credits function as additional equity in the project.
• Permanent Loan. BDRP assumes a 25-year permanent loan at a 4.5% interest rate. Lenders commonly use a Loan-to-Value (LTV) ratio to determine the optimal level of debt financing. The original $33.9 million loan assumed by BDRP far exceeds the industry standard 50-80% LTV ratio for hotel properties (PwC Investor Survey 2015 and RealtyRates Investor Survey, 2015). Currently, BDRP does not possess a Letter of Intent for financing. We adjusted the interest rate to 5% and the loan principal to $27.8 million to reflect a 70% Loan-to-Value ratio and a 1.6 debt coverage at stabilization to be consistent with industry conditions (RealtyRates Investor Survey, 2015). Depending on the Average Daily Rate (ADR) assumptions outlined under the “Cash Flow Assumptions” section, this results in a supportable permanent loan range of $25.7 to $27.8 million.
• Equity. The equity contribution as shown by BDRP represents a very low portion of total project costs (3%). With low equity and high debt service, BDRP’s pro forma appears to offer little debt coverage and exceedingly high returns to the investor. SB Friedman adjusted BDRP’s equity contribution to reflect 18-20% of the total Project costs. Since Historic Tax Credits generate project equity, the total effective equity for the Project ranges from 28% to 30% depending on the assumed ADR range. This is consistent with industry benchmarks which range from 20-41% equity (including equity from tax credits) for full-service hotels (RealtyRates Investor Survey, 2015). We assumed a target return on equity of 18% per HVS and industry standards to estimate the equity contribution range of $9.4 to $10.2 million.
• Financing Gap/City Assistance. After making the above alterations to the sources of cash, the remaining cash needs reflect the Project’s adjusted financing gap and thus the required level of City assistance per SB Friedman’s analysis. This amounts to a present value of $8.2 to $11.2
City of Bloomington Review of BDRP Hotel & Conference Center
SB FRIEDMAN | DEVELOPMENT ADVISORS 7 www.sbfriedman.com
million and is reflective of the returns analysis discussed in greater detail in the “Need for Financial Assistance” section.
Table 2: Financing Sources
Sources BDRP
Budget
% of Total
Sources
SB Friedman Adjusted Budget
SB Friedman Adjusted Budget
ADR = $129 % of Total Sources ADR = $150 % of Total
Sources Historic Tax Credits $4,986,715 9% $4,947,663 10% $4,947,663 10% Permanent Loan $33,869,556 63% $25,685,629 50% $27,838,968 54% Equity $1,904,929 3% $9,426,681 18% $10,246,392 20% City Assistance (TIF, Hotel Tax, Sales Tax) $13,000,000 24% $11,171,989 22% $8,198,939 16% Total Sources $53,761,201 100% $51,231,962 100% $51,231,962 100%
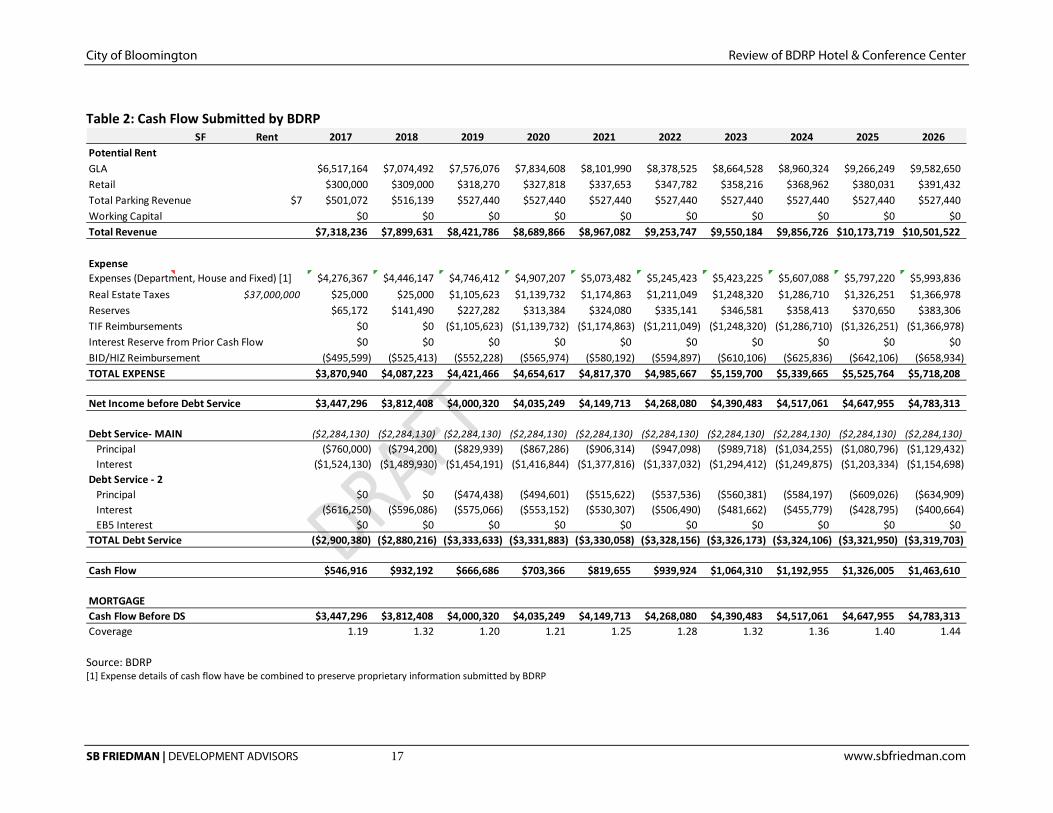
Sources: SB Friedman; BDRP. Note: Original budget included a "cash needs" line as such that the total sources did not add up to total development costs. We included cash needs into the Equity line item. CASH FLOW ASSUMPTIONS SB Friedman reviewed BDRP’s pro forma and benchmarked these assumptions to the HVS Feasibility Study as well as industry experience. Key assumptions are described below and illustrated in Tables 3A-3B. For full cash flow analysis, see Appendix 2, Tables 3-4.
• Development Timeline. BDRP’s pro forma shows 2017 as Year 1 with a full year of operation. SB Friedman adjusted Year 1 to 2018, showing 2017 as the development period or Year 0.
• Cash Flow Structure. BDRP’s cash flow is structured such that TIF reimbursements are paid annually from Year 3 in the amount of the full tax payment. It also shows a BD/HIZ Reimbursement paid annually from Year 1. The cash flow lists a second debt service (in addition to the permanent loan) for the City assistance. SB Friedman removed the second debt service and the TIF/BD reimbursements to more clearly account for the private debt repayment and equity cash flow related to the Project and the payback of public assistance. SB Friedman’s cash flow structure excludes the payback of public revenues in assessing the private sector real estate economics associated with the Project. The payback of the public revenues is separately estimated and discussed in the “Analysis of Public Financing Capacity” section (Appendix 2, Tables 3-4).
• Revenue Assumptions
o Average Daily Rate & Occupancy. BDRP assumed $129 for the Average Daily Rate (ADR) in Year 1 with a stabilized occupancy of 61%. The ADR is assumed to grow 3% per year thereafter. SB Friedman assumed a higher stabilized occupancy of 69% in Year 3 in accordance with comparable hotels in the area and the HVS Feasibility Study. However we assumed a range from $129 to $150 for the ADR in Year 1 (2018). The lower end of the range was consistent with BDRP’s assumption and the higher end was about $10 lower than the HVS Study projection of the 2018 ADR of $160 (this accounts for the $7 parking charge assumed in BDRP’s pro forma). The range of ADR assumptions results in stabilized Hotel room revenues of $4.4 to $5.2 million in Year 3.
City of Bloomington Review of BDRP Hotel & Conference Center
SB FRIEDMAN | DEVELOPMENT ADVISORS 8 www.sbfriedman.com
o Hotel Food & Beverage Revenues. Food & Beverage was included in the line item “GLA Income” in BDRP’s pro forma. Per the provided Sales Tax Revenue Assumptions, the restaurant space operated by the hotel is assumed to generate approximately $2.5 million in revenue at stabilization ($554/SF). National Restaurant Association’s 2010 Industry Operations Report shows that restaurants with an average check of $25+ reported a range of $209-$638 in sales per square foot. As this was listed as a bar/restaurant with room service, SB Friedman did not adjust this assumption.
o Conference Center Food & Beverage Revenues. The food and beverage sales associated
with the conference center were projected to be $1.04 million by BDRP. We adjusted this assumption downwards to $520,000 to reflect a more conservative two events per week as opposed to four events per week.
o Rental Income from Restaurants. The Project is assumed to receive $30/SF in net rent for the three restaurants that total 10,000 square feet of space and will be leased to third-party operators not affiliated with the hotel. The viability of four restaurants in Downtown Bloomington should be validated by BDRP through market studies or letters of intent from potential restaurant operators.
o Parking. Approximately $500,000 in parking revenue is assumed at roughly $7 per
space. This is consistent with Bloomington-Normal Marriott’s parking fee of $8/day.
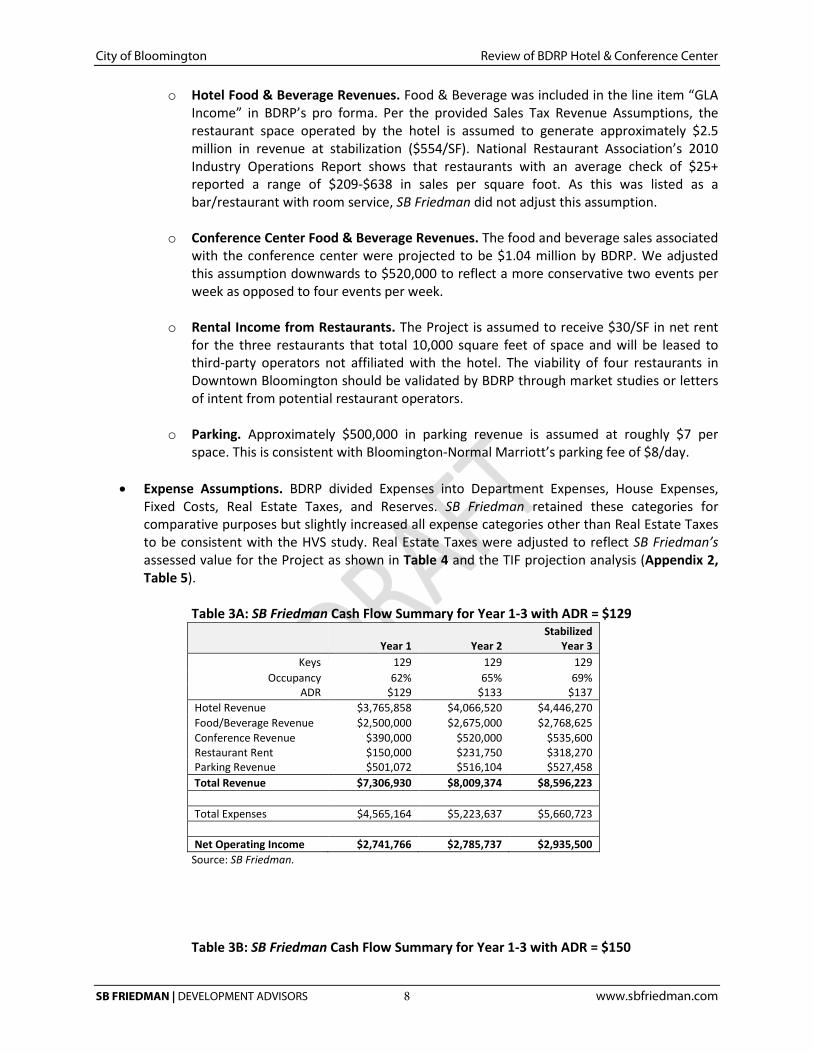
• Expense Assumptions. BDRP divided Expenses into Department Expenses, House Expenses, Fixed Costs, Real Estate Taxes, and Reserves. SB Friedman retained these categories for comparative purposes but slightly increased all expense categories other than Real Estate Taxes to be consistent with the HVS study. Real Estate Taxes were adjusted to reflect SB Friedman’s assessed value for the Project as shown in Table 4 and the TIF projection analysis (Appendix 2, Table 5).
Table 3A: SB Friedman Cash Flow Summary for Year 1-3 with ADR = $129
Year 1 Year 2 Stabilized
Year 3 Keys 129 129 129
Occupancy 62% 65% 69% ADR $129 $133 $137
Hotel Revenue $3,765,858 $4,066,520 $4,446,270 Food/Beverage Revenue $2,500,000 $2,675,000 $2,768,625 Conference Revenue $390,000 $520,000 $535,600 Restaurant Rent $150,000 $231,750 $318,270 Parking Revenue $501,072 $516,104 $527,458 Total Revenue $7,306,930 $8,009,374 $8,596,223 Total Expenses $4,565,164 $5,223,637 $5,660,723 Net Operating Income $2,741,766 $2,785,737 $2,935,500
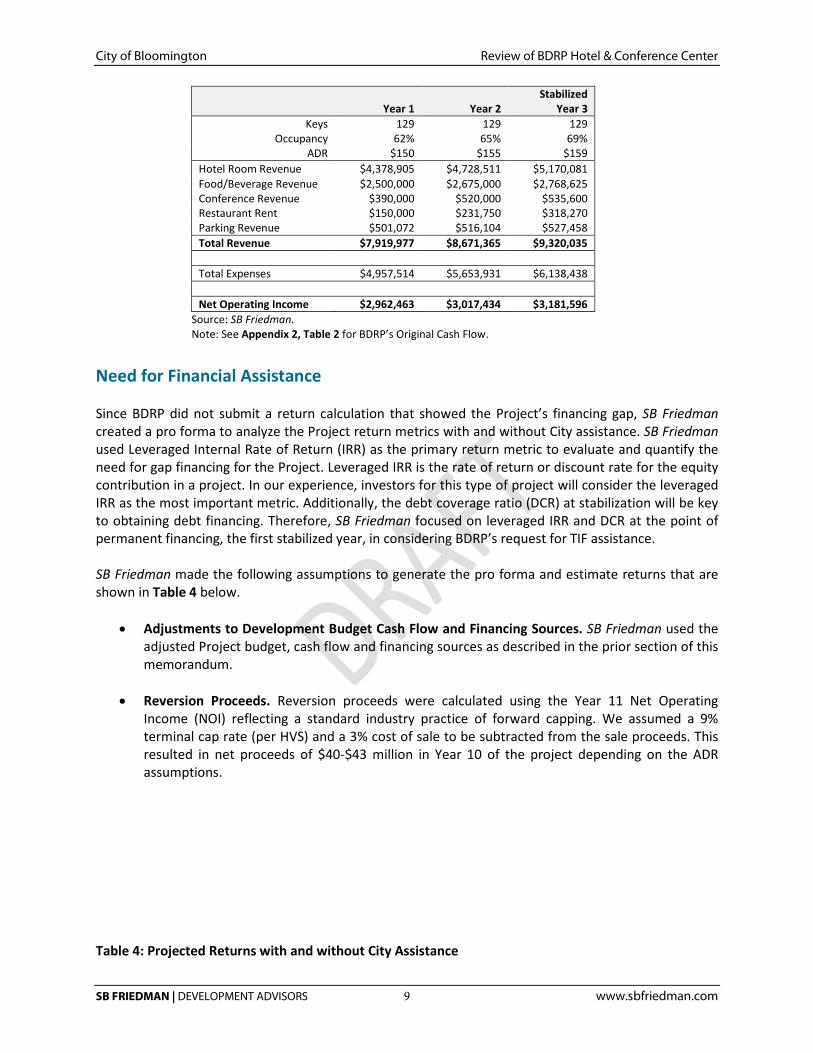
Source: SB Friedman. Table 3B: SB Friedman Cash Flow Summary for Year 1-3 with ADR = $150
City of Bloomington Review of BDRP Hotel & Conference Center
SB FRIEDMAN | DEVELOPMENT ADVISORS 9 www.sbfriedman.com
Year 1 Year 2 Stabilized
Year 3 Keys 129 129 129
Occupancy 62% 65% 69% ADR $150 $155 $159
Hotel Room Revenue $4,378,905 $4,728,511 $5,170,081 Food/Beverage Revenue $2,500,000 $2,675,000 $2,768,625 Conference Revenue $390,000 $520,000 $535,600 Restaurant Rent $150,000 $231,750 $318,270 Parking Revenue $501,072 $516,104 $527,458 Total Revenue $7,919,977 $8,671,365 $9,320,035 Total Expenses $4,957,514 $5,653,931 $6,138,438 Net Operating Income $2,962,463 $3,017,434 $3,181,596
Source: SB Friedman. Note: See Appendix 2, Table 2 for BDRP’s Original Cash Flow.
Need for Financial Assistance Since BDRP did not submit a return calculation that showed the Project’s financing gap, SB Friedman created a pro forma to analyze the Project return metrics with and without City assistance. SB Friedman used Leveraged Internal Rate of Return (IRR) as the primary return metric to evaluate and quantify the need for gap financing for the Project. Leveraged IRR is the rate of return or discount rate for the equity contribution in a project. In our experience, investors for this type of project will consider the leveraged IRR as the most important metric. Additionally, the debt coverage ratio (DCR) at stabilization will be key to obtaining debt financing. Therefore, SB Friedman focused on leveraged IRR and DCR at the point of permanent financing, the first stabilized year, in considering BDRP’s request for TIF assistance. SB Friedman made the following assumptions to generate the pro forma and estimate returns that are shown in Table 4 below.
• Adjustments to Development Budget Cash Flow and Financing Sources. SB Friedman used the
adjusted Project budget, cash flow and financing sources as described in the prior section of this memorandum.
• Reversion Proceeds. Reversion proceeds were calculated using the Year 11 Net Operating Income (NOI) reflecting a standard industry practice of forward capping. We assumed a 9% terminal cap rate (per HVS) and a 3% cost of sale to be subtracted from the sale proceeds. This resulted in net proceeds of $40-$43 million in Year 10 of the project depending on the ADR assumptions.
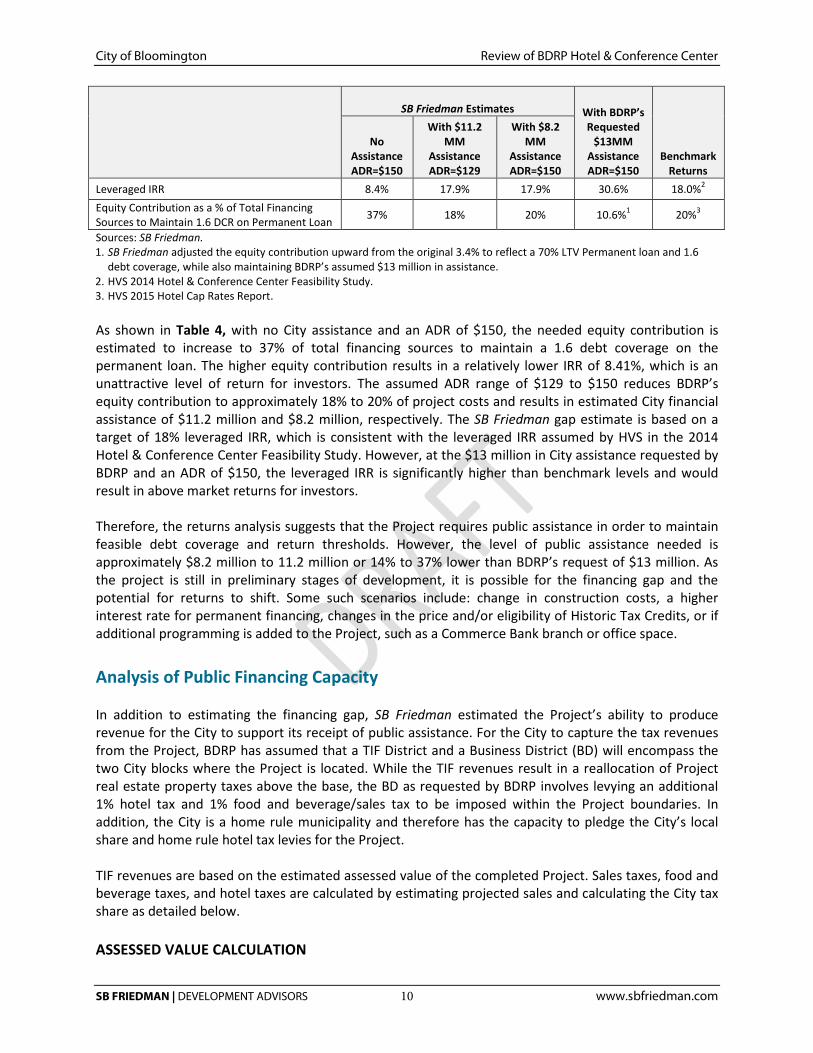
Table 4: Projected Returns with and without City Assistance
City of Bloomington Review of BDRP Hotel & Conference Center
SB FRIEDMAN | DEVELOPMENT ADVISORS 10 www.sbfriedman.com
SB Friedman Estimates With BDRP’s
Requested $13MM
Assistance ADR=$150
Benchmark Returns
No Assistance ADR=$150
With $11.2 MM
Assistance ADR=$129
With $8.2 MM
Assistance ADR=$150
Leveraged IRR 8.4% 17.9% 17.9% 30.6% 18.0%2 Equity Contribution as a % of Total Financing Sources to Maintain 1.6 DCR on Permanent Loan 37% 18% 20% 10.6%1 20%3
Sources: SB Friedman. 1. SB Friedman adjusted the equity contribution upward from the original 3.4% to reflect a 70% LTV Permanent loan and 1.6
debt coverage, while also maintaining BDRP’s assumed $13 million in assistance. 2. HVS 2014 Hotel & Conference Center Feasibility Study. 3. HVS 2015 Hotel Cap Rates Report. As shown in Table 4, with no City assistance and an ADR of $150, the needed equity contribution is estimated to increase to 37% of total financing sources to maintain a 1.6 debt coverage on the permanent loan. The higher equity contribution results in a relatively lower IRR of 8.41%, which is an unattractive level of return for investors. The assumed ADR range of $129 to $150 reduces BDRP’s equity contribution to approximately 18% to 20% of project costs and results in estimated City financial assistance of $11.2 million and $8.2 million, respectively. The SB Friedman gap estimate is based on a target of 18% leveraged IRR, which is consistent with the leveraged IRR assumed by HVS in the 2014 Hotel & Conference Center Feasibility Study. However, at the $13 million in City assistance requested by BDRP and an ADR of $150, the leveraged IRR is significantly higher than benchmark levels and would result in above market returns for investors. Therefore, the returns analysis suggests that the Project requires public assistance in order to maintain feasible debt coverage and return thresholds. However, the level of public assistance needed is approximately $8.2 million to 11.2 million or 14% to 37% lower than BDRP’s request of $13 million. As the project is still in preliminary stages of development, it is possible for the financing gap and the potential for returns to shift. Some such scenarios include: change in construction costs, a higher interest rate for permanent financing, changes in the price and/or eligibility of Historic Tax Credits, or if additional programming is added to the Project, such as a Commerce Bank branch or office space. Analysis of Public Financing Capacity In addition to estimating the financing gap, SB Friedman estimated the Project’s ability to produce revenue for the City to support its receipt of public assistance. For the City to capture the tax revenues from the Project, BDRP has assumed that a TIF District and a Business District (BD) will encompass the two City blocks where the Project is located. While the TIF revenues result in a reallocation of Project real estate property taxes above the base, the BD as requested by BDRP involves levying an additional 1% hotel tax and 1% food and beverage/sales tax to be imposed within the Project boundaries. In addition, the City is a home rule municipality and therefore has the capacity to pledge the City’s local share and home rule hotel tax levies for the Project. TIF revenues are based on the estimated assessed value of the completed Project. Sales taxes, food and beverage taxes, and hotel taxes are calculated by estimating projected sales and calculating the City tax share as detailed below. ASSESSED VALUE CALCULATION
City of Bloomington Review of BDRP Hotel & Conference Center
SB FRIEDMAN | DEVELOPMENT ADVISORS 11 www.sbfriedman.com
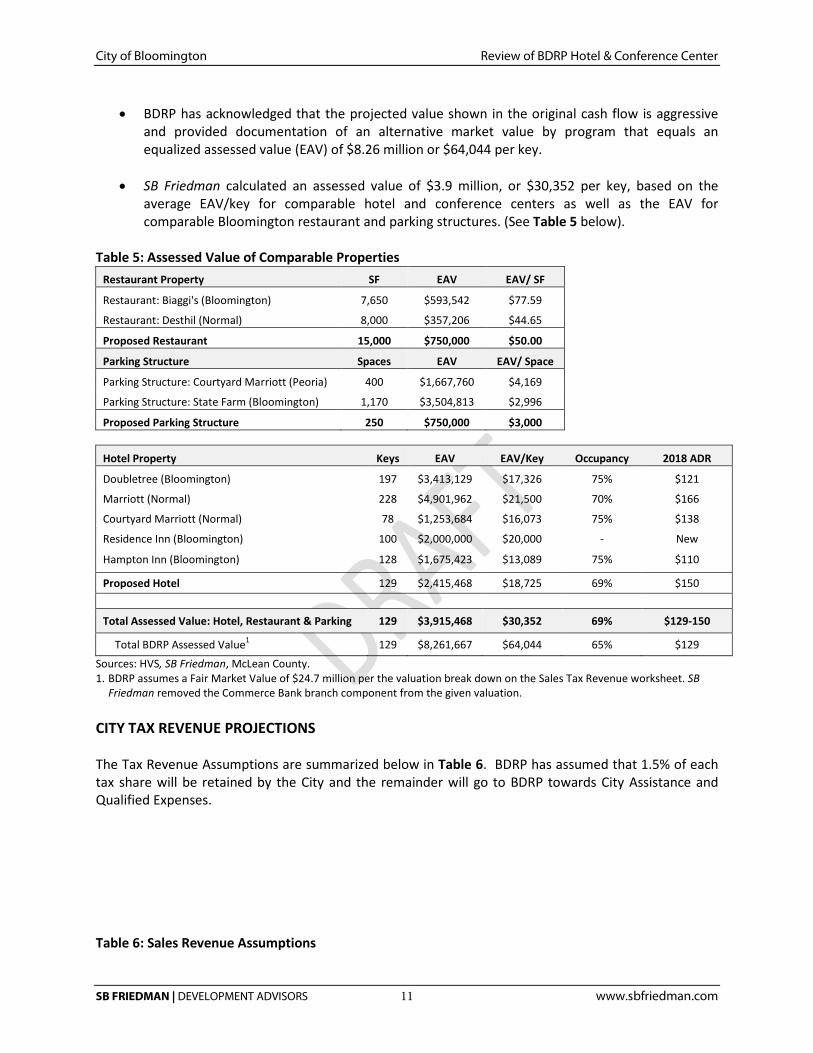
• BDRP has acknowledged that the projected value shown in the original cash flow is aggressive
and provided documentation of an alternative market value by program that equals an equalized assessed value (EAV) of $8.26 million or $64,044 per key.
• SB Friedman calculated an assessed value of $3.9 million, or $30,352 per key, based on the average EAV/key for comparable hotel and conference centers as well as the EAV for comparable Bloomington restaurant and parking structures. (See Table 5 below).
Table 5: Assessed Value of Comparable Properties
Restaurant Property SF EAV EAV/ SF
Restaurant: Biaggi's (Bloomington) 7,650 $593,542 $77.59
Restaurant: Desthil (Normal) 8,000 $357,206 $44.65
Proposed Restaurant 15,000 $750,000 $50.00
Parking Structure Spaces EAV EAV/ Space
Parking Structure: Courtyard Marriott (Peoria) 400 $1,667,760 $4,169
Parking Structure: State Farm (Bloomington) 1,170 $3,504,813 $2,996
Proposed Parking Structure 250 $750,000 $3,000
Hotel Property Keys EAV EAV/Key Occupancy 2018 ADR
Doubletree (Bloomington) 197 $3,413,129 $17,326 75% $121
Marriott (Normal) 228 $4,901,962 $21,500 70% $166
Courtyard Marriott (Normal) 78 $1,253,684 $16,073 75% $138
Residence Inn (Bloomington) 100 $2,000,000 $20,000 - New
Hampton Inn (Bloomington) 128 $1,675,423 $13,089 75% $110
Proposed Hotel 129 $2,415,468 $18,725 69% $150
Total Assessed Value: Hotel, Restaurant & Parking 129 $3,915,468 $30,352 69% $129-150
Total BDRP Assessed Value1 129 $8,261,667 $64,044 65% $129
Sources: HVS, SB Friedman, McLean County. 1. BDRP assumes a Fair Market Value of $24.7 million per the valuation break down on the Sales Tax Revenue worksheet. SB
Friedman removed the Commerce Bank branch component from the given valuation.
CITY TAX REVENUE PROJECTIONS The Tax Revenue Assumptions are summarized below in Table 6. BDRP has assumed that 1.5% of each tax share will be retained by the City and the remainder will go to BDRP towards City Assistance and Qualified Expenses. Table 6: Sales Revenue Assumptions

City of Bloomington Review of BDRP Hotel & Conference Center
SB FRIEDMAN | DEVELOPMENT ADVISORS 12 www.sbfriedman.com
BDRP SB Friedman
Sales Revenue Assumptions 1 Total Sales FB Sales/SF Total Sales FB
Sales/SF Food & Beverage Revenue: Hotel Restaurant $2,500,000 $554 $2,500,000 $554 Food & Beverage Revenue: Non-Hotel Affiliated Restaurants $5,500,000 $520 $4,232,800 $400
Conference Food & Beverage Revenue 3 $1,040,000 $520,000 Hotel Revenue 4 $3,948,077 $3,765,858 - $4,378,905
Sources: BDRP, SB Friedman.
1. Table does not include additional $250,000 of retail sales from hotel. 2. Sales tax revenue was adjusted to assume an average across restaurants of $400/SF per 2010 National Restaurant
Association Report. 3. Conference Revenue was based on events per week at $20/ticket 4. Based on an ADR range of $129-$150
Table 7: Tax Revenue Assumptions
Tax Revenue Assumptions Tax Rate BDRP Tax Revenue SBF Tax Revenue Sales & Food/Bev. Tax Revenue 1 6.5% $598,850 $482,682
Hotel Tax Revenue 2 7.0% $276,365 $263,610 - $306,523 TIF Revenue 3 8.1142% $968,428 $247,910 Sources: BDRP, SB Friedman.
1. 1% of State Sales Tax, 2% of City F/B Tax, 2.5% Home Rule Sales Tax, 1% New BD Tax. Includes $11,250 of Sales Tax revenue (at 4.5%) in addition to Food & Beverage Tax revenue. The 2.5% home rule sales tax includes a new 1% tax effective January 2016. Negotiations are still underway on the use of this new 1% sales tax revenue, therefore the potential to pledge this additional 1% is subject to further discussions.
2. 6% Hotel Tax + 1% BD Tax. Hotel Revenue based on an ADR range of $129-$150. 3. Revenue above the 2014 Base based on assessed value. SB Friedman reviewed BDRP’s projections of hotel revenues, food and beverage, and retail sales, and TIF revenues, and made the following adjustments:
• The projected food and beverage revenues of the restaurants not affiliated with the hotel were reduced based on the assumptions above such that the sales per square foot were consistent with industry data on the performance of restaurants.
• The conference food and beverage revenue was adjusted downwards to reflect two events per week as previously discussed.
• The hotel revenue was calculated using the ADR and occupancy assumptions show in Table 5. • TIF revenue was based off of the assessed value calculation above in Table 5.
The appropriate City tax rates along with a 1% BD tax rate was applied to estimate the hotel, food and beverage, and sales taxes generated by the Project as shown in Table 7. To estimate TIF revenue at stabilization, the City property tax rate was applied to the equalized assessed value of the Project above the 2014 base value of the site. The City financing capacity, based on the cumulative tax revenue stream, can be estimated by calculating the present value of the revenue stream at an appropriate discount rate and debt coverage. The discount rate is a function of the type of financing instrument that would ultimately be used to finance the City assistance and depends on the risk profile of each instrument. The financing options that could be considered for the Project include the following (in order of increasing level of risk from the City’s perspective):
City of Bloomington Review of BDRP Hotel & Conference Center
SB FRIEDMAN | DEVELOPMENT ADVISORS 13 www.sbfriedman.com
• Developer Notes – an obligation subject to the developer obtaining financing based on tax
revenues generated by the Project. • Special Revenue Bonds – a bond secured by the tax revenues generated by the Project only. • Alternate Revenue Bond with Special Tax Backing – a bond secured by specific City-wide
revenues sources such as sales taxes. • Alternate Revenue Bond with General Obligation (GO) Backing – a revenue bond with the
general obligation of the City serving as backup security for the bond.
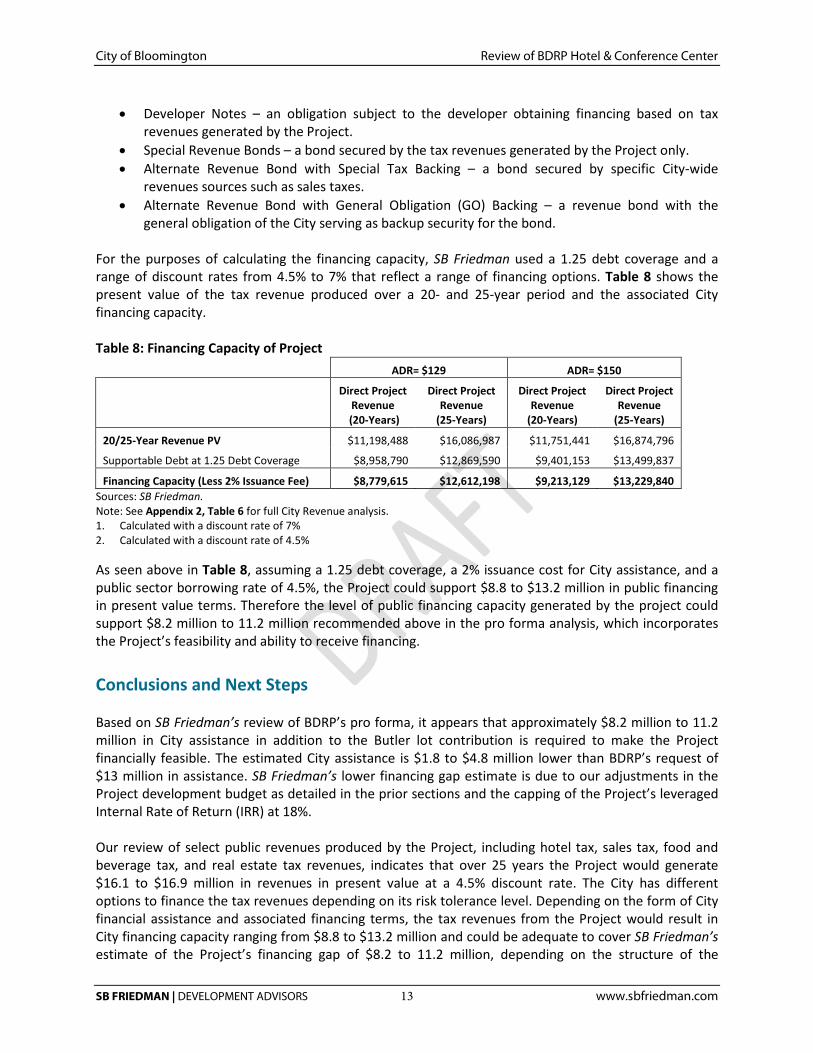
For the purposes of calculating the financing capacity, SB Friedman used a 1.25 debt coverage and a range of discount rates from 4.5% to 7% that reflect a range of financing options. Table 8 shows the present value of the tax revenue produced over a 20- and 25-year period and the associated City financing capacity. Table 8: Financing Capacity of Project
ADR= $129 ADR= $150
Direct Project Revenue
(20-Years)
Direct Project Revenue
(25-Years)
Direct Project Revenue
(20-Years)
Direct Project Revenue
(25-Years)
20/25-Year Revenue PV $11,198,488 $16,086,987 $11,751,441 $16,874,796
Supportable Debt at 1.25 Debt Coverage $8,958,790 $12,869,590 $9,401,153 $13,499,837
Financing Capacity (Less 2% Issuance Fee) $8,779,615 $12,612,198 $9,213,129 $13,229,840 Sources: SB Friedman. Note: See Appendix 2, Table 6 for full City Revenue analysis. 1. Calculated with a discount rate of 7% 2. Calculated with a discount rate of 4.5%
As seen above in Table 8, assuming a 1.25 debt coverage, a 2% issuance cost for City assistance, and a public sector borrowing rate of 4.5%, the Project could support $8.8 to $13.2 million in public financing in present value terms. Therefore the level of public financing capacity generated by the project could support $8.2 million to 11.2 million recommended above in the pro forma analysis, which incorporates the Project’s feasibility and ability to receive financing. Conclusions and Next Steps Based on SB Friedman’s review of BDRP’s pro forma, it appears that approximately $8.2 million to 11.2 million in City assistance in addition to the Butler lot contribution is required to make the Project financially feasible. The estimated City assistance is $1.8 to $4.8 million lower than BDRP’s request of $13 million in assistance. SB Friedman’s lower financing gap estimate is due to our adjustments in the Project development budget as detailed in the prior sections and the capping of the Project’s leveraged Internal Rate of Return (IRR) at 18%. Our review of select public revenues produced by the Project, including hotel tax, sales tax, food and beverage tax, and real estate tax revenues, indicates that over 25 years the Project would generate $16.1 to $16.9 million in revenues in present value at a 4.5% discount rate. The City has different options to finance the tax revenues depending on its risk tolerance level. Depending on the form of City financial assistance and associated financing terms, the tax revenues from the Project would result in City financing capacity ranging from $8.8 to $13.2 million and could be adequate to cover SB Friedman’s estimate of the Project’s financing gap of $8.2 to 11.2 million, depending on the structure of the
City of Bloomington Review of BDRP Hotel & Conference Center
SB FRIEDMAN | DEVELOPMENT ADVISORS 14 www.sbfriedman.com
financial assistance. Therefore, even after City assistance is deducted from the 25-year present value of Project tax revenues of $16.1 to $16.9 million, the City stands to gain a net direct fiscal benefit of $4.9 -$8.7 million in present value terms. However, because of the preliminary nature of the Project concept and real estate financial information, the estimates of financing gap and financing capacity can materially change once the Project concept is refined and the various parameters are firmed up. Prior to a firm commitment of City assistance and disbursement of funds, a complete development team and program must be obtained. This would include, among other requirements, an experienced hotel developer/operator, identification of the hotel flag, detailed plans/costs, and financing commitments from equity investors, tax credit buyers and lending institutions. The specific form of assistance can be structured to further mitigate risk to the City. Based on our review of the development proposal, we believe the Project, if successfully developed, would be a pioneering project in Downtown Bloomington. It has the potential to activate the heart of downtown and create a new dining destination in the City. There are also significant opportunities for synergy between the Project’s hotel, conferencing and restaurant/bar facilities and the adjacent U.S. Cellular Coliseum to boost programming, hotel stays and downtown dining. However, because it is expected to be a pioneering development downtown, the Project presents a level of risk to BDRP and the City, higher than what may be found in other parts of the City. Therefore, there could be volatility in several key Project components during development and stabilization. We recommend the City endorse BDRP’s continued efforts to advance the Project and undertake preliminary steps such as creation of the TIF and Business Districts and obtaining appraisals of the Project site. The City could utilize an Inducement Resolution to memorialize the City’s support for the Project subject to a complete and acceptable development team and program that would include the following:
• Commitment from an appropriate and acceptable hotel developer; • Evidence of site control; • Financing commitments from acceptable lenders, tax credit buyers and equity investors; • Lease or other commitments from appropriate other tenants; • Franchising agreement for an acceptable hotel brand; • Detailed plans and specifications for the development acceptable to the City administration; • Construction and development costs prepared in sufficient detail by a general contractor or
professional cost estimator; and • Revised, final financial projections of net operating income, tax generation, and other factors.
The Inducement Resolution should further detail the undertakings required and expected of each party, delineate the timeframe for performance by BDRP, initiate the process to designate the TIF/Business Districts in the project area, and provide for undertaking the pre-development activities that are the City’s responsibility.
City of Bloomington Review of BDRP Hotel & Conference Center
SB FRIEDMAN | DEVELOPMENT ADVISORS 15 www.sbfriedman.com
Appendix A LIMITATIONS OF OUR ENGAGEMENT Our memorandum is based on estimates, assumptions and other information developed from research of the market, knowledge of the industry, and meetings/teleconferences with the City of Bloomington and BDRP during which we obtained certain information. The sources of information and bases of the estimates and assumptions are stated in the memorandum. Some assumptions inevitably will not materialize, and unanticipated events and circumstances may occur; therefore, actual results achieved during the period covered by our analysis will necessarily vary from those described in our memorandum, and the variations may be material. The terms of this engagement are such that we have no obligation to revise analyses or the memorandum to reflect events or conditions that occur subsequent to the date of the memorandum. These events or conditions include, without limitation, economic growth trends, governmental actions, changes in TIF statute, additional competitive developments, interest rates, and other market factors. However, we will be available to discuss the necessity for revision in view of changes in the economic or market factors affecting the proposed project. Our memorandum is intended solely for your information, for purposes of reviewing a request for financial assistance, and is not a recommendation to issue bonds or other securities. The memorandum should not be relied upon by any other person, firm or corporation, or for any other purposes. Neither the memorandum nor its contents, nor any reference to our Firm, may be included or quoted in any offering circular or registration statement, appraisal, sales brochure, prospectus, loan, or other agreement or document intended for use in obtaining funds from individual investors without our prior written consent. We acknowledge that upon submission to the City of Bloomington, the memorandum may become a public document within the meaning of the Freedom of Information Act. Nothing in these limitations is intended to block the disclosure of the documents under such Act.
City of Bloomington Review of BDRP Hotel & Conference Center
SB FRIEDMAN | DEVELOPMENT ADVISORS 16 www.sbfriedman.com
Appendix B
Sources: SB Friedman, BDRP
Table 1: Development BudgetDeveloper % of Total Budget SBF Adjusted % of Total Budget
LandCommerce Bank & Front n Center $3,800,000 7.1% $3,800,000 7.4%City Parking Lot $0DUI & Catalyst purchase $1,600,000 3.0% $1,600,000 3.1%
TOTAL LAND COSTS $5,400,000 10.0% $5,400,000 10.5%
Hard CostsDemolition, Site work and abatement $3,000,000 5.6% $3,000,000 5.9%Permits, Fees, Other Charges $600,000 1.1% $600,000 1.2%Building $15,000,000 27.9% $15,000,000 29.3%Historic Rehab and Façade Preservation $3,000,000 5.6% $3,000,000 5.9%
Rooftop Bar/Restaurant/Lounge ** $1,000,000 1.9% $0 0.0%Restaurant Construction $2,000,000 3.7% $2,000,000 3.9%Conference Facil ity (Includes FFE) $3,600,000 6.7% $3,600,000 7.0%Skywalk $1,500,000 2.8% $1,500,000 2.9%
$29,700,000 $28,700,000Construction Contingency $1,485,000 2.8% $1,435,000 2.8%Pre-Contracted Services & 3rd Party Consultants $935,550 1.7% $904,050 1.8%Construction Manager $1,124,219 2.1% $1,086,367 2.1%Parking Deck (250 Spaces) $5,000,000 9.3% $5,000,000 9.8%
TOTAL HARD COSTS $38,244,769 71.1% $37,125,417 72.5%
Soft CostsArchitect & Structural & Engineering $2,299,134 4.3% $2,359,000 4.6%Legal $191,224 0.4% $185,627 0.4%RE Taxes 12/12 $25,000 0.0% $25,000 0.0%
TOTAL SOFT COSTS $2,655,358 4.9% $2,569,627 5.0%
Pre-Opening/marketing ** $140,000 0.3% $1,190,851 2.3%
Management FeesDevelopment Management ** $2,677,134 5.0% $1,299,390 2.5%Developer Overhead/Consultants ** $1,147,343 2.1% $371,254 0.7%
Total Management/Overhead Fees $3,824,477 7.1% $1,670,644 3.3%
Financing & Financing FeesConstruction Interest @ 7% ** $2,551,678 4.7% $2,208,834 4.3%Fees:
Loan points $182,263 0.3% $163,933 0.3%legal $40,223 0.1% $40,223 0.1%Title $40,223 0.1% $40,223 0.1%Appraisal $40,223 0.1% $40,223 0.1%Inspections $40,223 0.1% $40,223 0.1%
Total Cost of Financing $2,894,835 5.4% $2,533,661 4.9%
Tenant Coordination (# of Tenants) $154,762 0.3% $154,762 0.3%Franchise Fee $87,000 0.2% $87,000 0.2%Working capital $500,000 0.9% $500,000 1.0%
TOTAL DEVELOPMENT COST $53,761,201 100% $51,231,962 100%
Cost/ KEY $416,753 $397,147
City of Bloomington Review of BDRP Hotel & Conference Center
SB FRIEDMAN | DEVELOPMENT ADVISORS 17 www.sbfriedman.com
Table 2: Cash Flow Submitted by BDRP
Source: BDRP [1] Expense details of cash flow have be combined to preserve proprietary information submitted by BDRP
SF Rent 2017 2018 2019 2020 2021 2022 2023 2024 2025 2026Potential RentGLA $6,517,164 $7,074,492 $7,576,076 $7,834,608 $8,101,990 $8,378,525 $8,664,528 $8,960,324 $9,266,249 $9,582,650Retail $300,000 $309,000 $318,270 $327,818 $337,653 $347,782 $358,216 $368,962 $380,031 $391,432Total Parking Revenue $7 $501,072 $516,139 $527,440 $527,440 $527,440 $527,440 $527,440 $527,440 $527,440 $527,440Working Capital $0 $0 $0 $0 $0 $0 $0 $0 $0 $0Total Revenue $7,318,236 $7,899,631 $8,421,786 $8,689,866 $8,967,082 $9,253,747 $9,550,184 $9,856,726 $10,173,719 $10,501,522
ExpenseExpenses (Department, House and Fixed) [1] $4,276,367 $4,446,147 $4,746,412 $4,907,207 $5,073,482 $5,245,423 $5,423,225 $5,607,088 $5,797,220 $5,993,836Real Estate Taxes $37,000,000 $25,000 $25,000 $1,105,623 $1,139,732 $1,174,863 $1,211,049 $1,248,320 $1,286,710 $1,326,251 $1,366,978Reserves $65,172 $141,490 $227,282 $313,384 $324,080 $335,141 $346,581 $358,413 $370,650 $383,306TIF Reimbursements $0 $0 ($1,105,623) ($1,139,732) ($1,174,863) ($1,211,049) ($1,248,320) ($1,286,710) ($1,326,251) ($1,366,978)Interest Reserve from Prior Cash Flow $0 $0 $0 $0 $0 $0 $0 $0 $0 $0BID/HIZ Reimbursement ($495,599) ($525,413) ($552,228) ($565,974) ($580,192) ($594,897) ($610,106) ($625,836) ($642,106) ($658,934)TOTAL EXPENSE $3,870,940 $4,087,223 $4,421,466 $4,654,617 $4,817,370 $4,985,667 $5,159,700 $5,339,665 $5,525,764 $5,718,208
Net Income before Debt Service $3,447,296 $3,812,408 $4,000,320 $4,035,249 $4,149,713 $4,268,080 $4,390,483 $4,517,061 $4,647,955 $4,783,313
Debt Service- MAIN ($2,284,130) ($2,284,130) ($2,284,130) ($2,284,130) ($2,284,130) ($2,284,130) ($2,284,130) ($2,284,130) ($2,284,130) ($2,284,130)Principal ($760,000) ($794,200) ($829,939) ($867,286) ($906,314) ($947,098) ($989,718) ($1,034,255) ($1,080,796) ($1,129,432)Interest ($1,524,130) ($1,489,930) ($1,454,191) ($1,416,844) ($1,377,816) ($1,337,032) ($1,294,412) ($1,249,875) ($1,203,334) ($1,154,698)
Debt Service - 2Principal $0 $0 ($474,438) ($494,601) ($515,622) ($537,536) ($560,381) ($584,197) ($609,026) ($634,909)Interest ($616,250) ($596,086) ($575,066) ($553,152) ($530,307) ($506,490) ($481,662) ($455,779) ($428,795) ($400,664)EB5 Interest $0 $0 $0 $0 $0 $0 $0 $0 $0 $0
TOTAL Debt Service ($2,900,380) ($2,880,216) ($3,333,633) ($3,331,883) ($3,330,058) ($3,328,156) ($3,326,173) ($3,324,106) ($3,321,950) ($3,319,703)
Cash Flow $546,916 $932,192 $666,686 $703,366 $819,655 $939,924 $1,064,310 $1,192,955 $1,326,005 $1,463,610
MORTGAGECash Flow Before DS $3,447,296 $3,812,408 $4,000,320 $4,035,249 $4,149,713 $4,268,080 $4,390,483 $4,517,061 $4,647,955 $4,783,313Coverage 1.19 1.32 1.20 1.21 1.25 1.28 1.32 1.36 1.40 1.44
City of Bloomington Review of BDRP Hotel & Conference Center
SB FRIEDMAN | DEVELOPMENT ADVISORS 18 www.sbfriedman.com
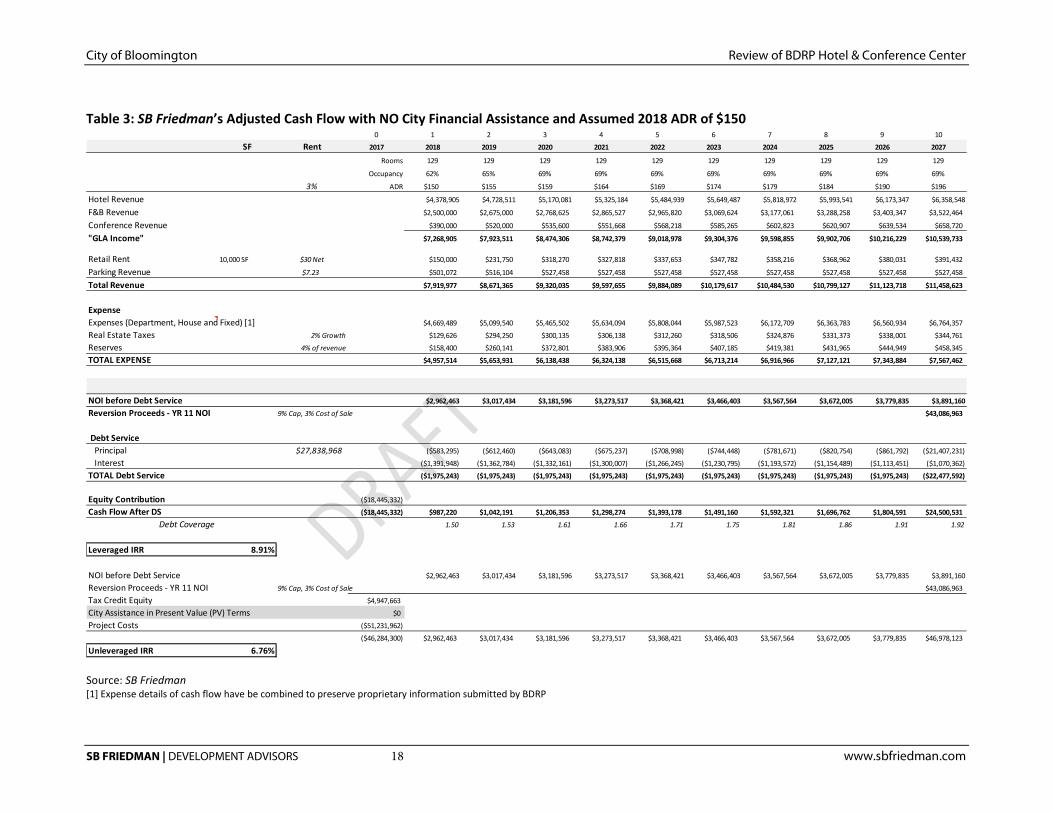
Table 3: SB Friedman’s Adjusted Cash Flow with NO City Financial Assistance and Assumed 2018 ADR of $150
Source: SB Friedman [1] Expense details of cash flow have be combined to preserve proprietary information submitted by BDRP
0 1 2 3 4 5 6 7 8 9 10
SF Rent 2017 2018 2019 2020 2021 2022 2023 2024 2025 2026 2027
Rooms 129 129 129 129 129 129 129 129 129 129
Occupancy 62% 65% 69% 69% 69% 69% 69% 69% 69% 69%
3% ADR $150 $155 $159 $164 $169 $174 $179 $184 $190 $196
Hotel Revenue $4,378,905 $4,728,511 $5,170,081 $5,325,184 $5,484,939 $5,649,487 $5,818,972 $5,993,541 $6,173,347 $6,358,548
F&B Revenue $2,500,000 $2,675,000 $2,768,625 $2,865,527 $2,965,820 $3,069,624 $3,177,061 $3,288,258 $3,403,347 $3,522,464
Conference Revenue $390,000 $520,000 $535,600 $551,668 $568,218 $585,265 $602,823 $620,907 $639,534 $658,720
"GLA Income" $7,268,905 $7,923,511 $8,474,306 $8,742,379 $9,018,978 $9,304,376 $9,598,855 $9,902,706 $10,216,229 $10,539,733
Retail Rent 10,000 SF $30 Net $150,000 $231,750 $318,270 $327,818 $337,653 $347,782 $358,216 $368,962 $380,031 $391,432
Parking Revenue $7.23 $501,072 $516,104 $527,458 $527,458 $527,458 $527,458 $527,458 $527,458 $527,458 $527,458
Total Revenue $7,919,977 $8,671,365 $9,320,035 $9,597,655 $9,884,089 $10,179,617 $10,484,530 $10,799,127 $11,123,718 $11,458,623
ExpenseExpenses (Department, House and Fixed) [1] $4,669,489 $5,099,540 $5,465,502 $5,634,094 $5,808,044 $5,987,523 $6,172,709 $6,363,783 $6,560,934 $6,764,357
Real Estate Taxes 2% Growth $129,626 $294,250 $300,135 $306,138 $312,260 $318,506 $324,876 $331,373 $338,001 $344,761
Reserves 4% of revenue $158,400 $260,141 $372,801 $383,906 $395,364 $407,185 $419,381 $431,965 $444,949 $458,345
TOTAL EXPENSE $4,957,514 $5,653,931 $6,138,438 $6,324,138 $6,515,668 $6,713,214 $6,916,966 $7,127,121 $7,343,884 $7,567,462
NOI before Debt Service $2,962,463 $3,017,434 $3,181,596 $3,273,517 $3,368,421 $3,466,403 $3,567,564 $3,672,005 $3,779,835 $3,891,160
Reversion Proceeds - YR 11 NOI 9% Cap, 3% Cost of Sale $43,086,963
Debt ServicePrincipal $27,838,968 ($583,295) ($612,460) ($643,083) ($675,237) ($708,998) ($744,448) ($781,671) ($820,754) ($861,792) ($21,407,231)
Interest ($1,391,948) ($1,362,784) ($1,332,161) ($1,300,007) ($1,266,245) ($1,230,795) ($1,193,572) ($1,154,489) ($1,113,451) ($1,070,362)
TOTAL Debt Service ($1,975,243) ($1,975,243) ($1,975,243) ($1,975,243) ($1,975,243) ($1,975,243) ($1,975,243) ($1,975,243) ($1,975,243) ($22,477,592)
Equity Contribution ($18,445,332)
Cash Flow After DS ($18,445,332) $987,220 $1,042,191 $1,206,353 $1,298,274 $1,393,178 $1,491,160 $1,592,321 $1,696,762 $1,804,591 $24,500,531
Debt Coverage 1.50 1.53 1.61 1.66 1.71 1.75 1.81 1.86 1.91 1.92
Leveraged IRR 8.91%
NOI before Debt Service $2,962,463 $3,017,434 $3,181,596 $3,273,517 $3,368,421 $3,466,403 $3,567,564 $3,672,005 $3,779,835 $3,891,160
Reversion Proceeds - YR 11 NOI 9% Cap, 3% Cost of Sale $43,086,963
Tax Credit Equity $4,947,663
City Assistance in Present Value (PV) Terms $0
Project Costs ($51,231,962)
($46,284,300) $2,962,463 $3,017,434 $3,181,596 $3,273,517 $3,368,421 $3,466,403 $3,567,564 $3,672,005 $3,779,835 $46,978,123
Unleveraged IRR 6.76%
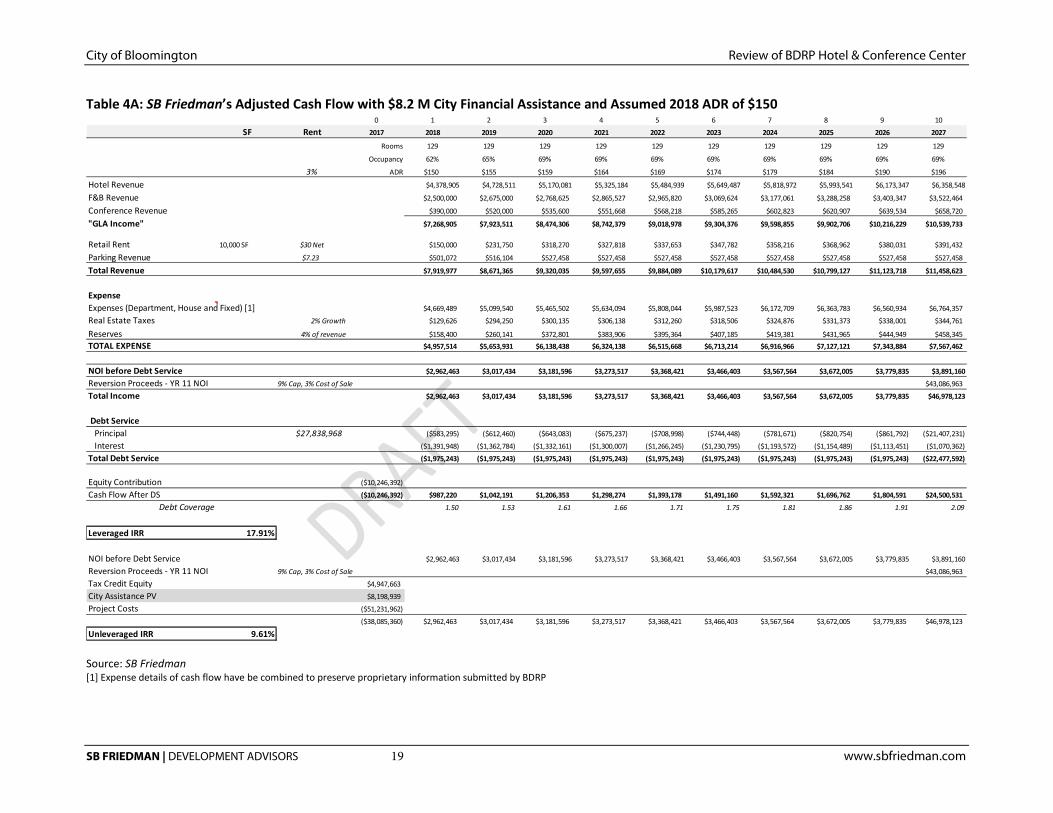
City of Bloomington Review of BDRP Hotel & Conference Center
SB FRIEDMAN | DEVELOPMENT ADVISORS 19 www.sbfriedman.com
Table 4A: SB Friedman’s Adjusted Cash Flow with $8.2 M City Financial Assistance and Assumed 2018 ADR of $150
Source: SB Friedman [1] Expense details of cash flow have be combined to preserve proprietary information submitted by BDRP
0 1 2 3 4 5 6 7 8 9 10
SF Rent 2017 2018 2019 2020 2021 2022 2023 2024 2025 2026 2027
Rooms 129 129 129 129 129 129 129 129 129 129
Occupancy 62% 65% 69% 69% 69% 69% 69% 69% 69% 69%
3% ADR $150 $155 $159 $164 $169 $174 $179 $184 $190 $196
Hotel Revenue $4,378,905 $4,728,511 $5,170,081 $5,325,184 $5,484,939 $5,649,487 $5,818,972 $5,993,541 $6,173,347 $6,358,548
F&B Revenue $2,500,000 $2,675,000 $2,768,625 $2,865,527 $2,965,820 $3,069,624 $3,177,061 $3,288,258 $3,403,347 $3,522,464
Conference Revenue $390,000 $520,000 $535,600 $551,668 $568,218 $585,265 $602,823 $620,907 $639,534 $658,720
"GLA Income" $7,268,905 $7,923,511 $8,474,306 $8,742,379 $9,018,978 $9,304,376 $9,598,855 $9,902,706 $10,216,229 $10,539,733
Retail Rent 10,000 SF $30 Net $150,000 $231,750 $318,270 $327,818 $337,653 $347,782 $358,216 $368,962 $380,031 $391,432
Parking Revenue $7.23 $501,072 $516,104 $527,458 $527,458 $527,458 $527,458 $527,458 $527,458 $527,458 $527,458
Total Revenue $7,919,977 $8,671,365 $9,320,035 $9,597,655 $9,884,089 $10,179,617 $10,484,530 $10,799,127 $11,123,718 $11,458,623
ExpenseExpenses (Department, House and Fixed) [1] $4,669,489 $5,099,540 $5,465,502 $5,634,094 $5,808,044 $5,987,523 $6,172,709 $6,363,783 $6,560,934 $6,764,357
Real Estate Taxes 2% Growth $129,626 $294,250 $300,135 $306,138 $312,260 $318,506 $324,876 $331,373 $338,001 $344,761
Reserves 4% of revenue $158,400 $260,141 $372,801 $383,906 $395,364 $407,185 $419,381 $431,965 $444,949 $458,345TOTAL EXPENSE $4,957,514 $5,653,931 $6,138,438 $6,324,138 $6,515,668 $6,713,214 $6,916,966 $7,127,121 $7,343,884 $7,567,462
NOI before Debt Service $2,962,463 $3,017,434 $3,181,596 $3,273,517 $3,368,421 $3,466,403 $3,567,564 $3,672,005 $3,779,835 $3,891,160
Reversion Proceeds - YR 11 NOI 9% Cap, 3% Cost of Sale $43,086,963
Total Income $2,962,463 $3,017,434 $3,181,596 $3,273,517 $3,368,421 $3,466,403 $3,567,564 $3,672,005 $3,779,835 $46,978,123
Debt ServicePrincipal $27,838,968 ($583,295) ($612,460) ($643,083) ($675,237) ($708,998) ($744,448) ($781,671) ($820,754) ($861,792) ($21,407,231)
Interest ($1,391,948) ($1,362,784) ($1,332,161) ($1,300,007) ($1,266,245) ($1,230,795) ($1,193,572) ($1,154,489) ($1,113,451) ($1,070,362)
Total Debt Service ($1,975,243) ($1,975,243) ($1,975,243) ($1,975,243) ($1,975,243) ($1,975,243) ($1,975,243) ($1,975,243) ($1,975,243) ($22,477,592)
Equity Contribution ($10,246,392)
Cash Flow After DS ($10,246,392) $987,220 $1,042,191 $1,206,353 $1,298,274 $1,393,178 $1,491,160 $1,592,321 $1,696,762 $1,804,591 $24,500,531
Debt Coverage 1.50 1.53 1.61 1.66 1.71 1.75 1.81 1.86 1.91 2.09
Leveraged IRR 17.91%
NOI before Debt Service $2,962,463 $3,017,434 $3,181,596 $3,273,517 $3,368,421 $3,466,403 $3,567,564 $3,672,005 $3,779,835 $3,891,160
Reversion Proceeds - YR 11 NOI 9% Cap, 3% Cost of Sale $43,086,963
Tax Credit Equity $4,947,663
City Assistance PV $8,198,939
Project Costs ($51,231,962)
($38,085,360) $2,962,463 $3,017,434 $3,181,596 $3,273,517 $3,368,421 $3,466,403 $3,567,564 $3,672,005 $3,779,835 $46,978,123
Unleveraged IRR 9.61%
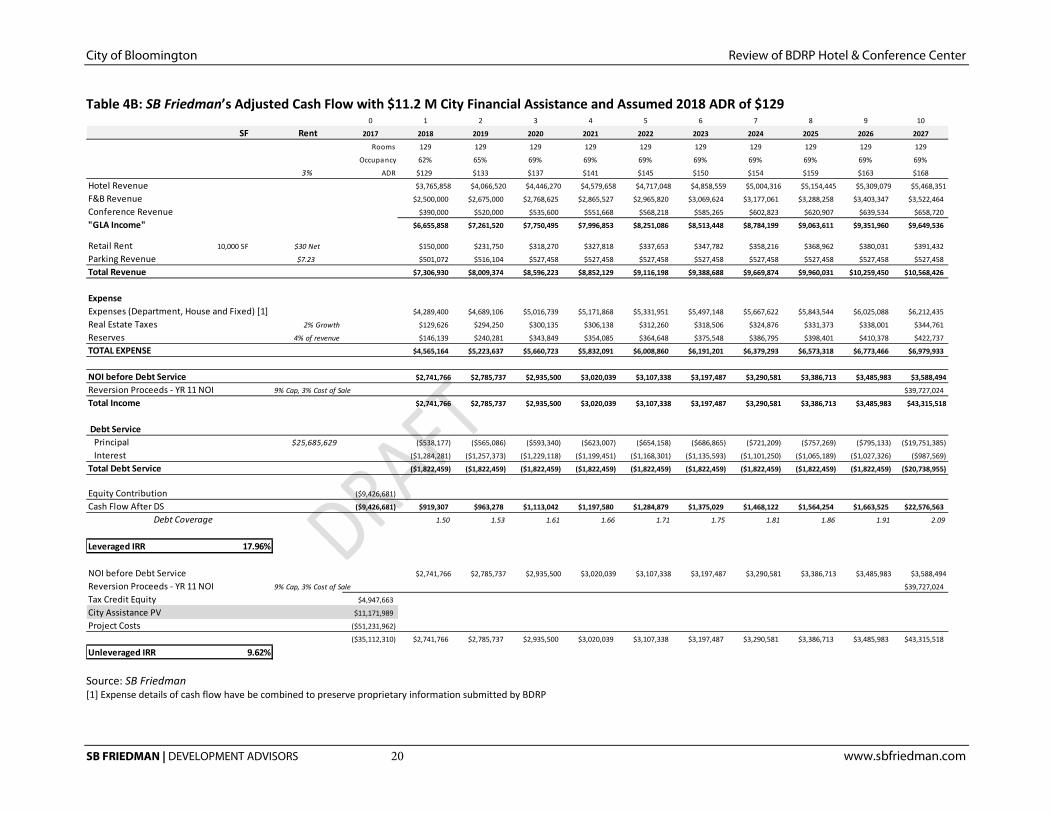
City of Bloomington Review of BDRP Hotel & Conference Center
SB FRIEDMAN | DEVELOPMENT ADVISORS 20 www.sbfriedman.com
Table 4B: SB Friedman’s Adjusted Cash Flow with $11.2 M City Financial Assistance and Assumed 2018 ADR of $129
Source: SB Friedman [1] Expense details of cash flow have be combined to preserve proprietary information submitted by BDRP
0 1 2 3 4 5 6 7 8 9 10
SF Rent 2017 2018 2019 2020 2021 2022 2023 2024 2025 2026 2027
Rooms 129 129 129 129 129 129 129 129 129 129
Occupancy 62% 65% 69% 69% 69% 69% 69% 69% 69% 69%
3% ADR $129 $133 $137 $141 $145 $150 $154 $159 $163 $168
Hotel Revenue $3,765,858 $4,066,520 $4,446,270 $4,579,658 $4,717,048 $4,858,559 $5,004,316 $5,154,445 $5,309,079 $5,468,351
F&B Revenue $2,500,000 $2,675,000 $2,768,625 $2,865,527 $2,965,820 $3,069,624 $3,177,061 $3,288,258 $3,403,347 $3,522,464
Conference Revenue $390,000 $520,000 $535,600 $551,668 $568,218 $585,265 $602,823 $620,907 $639,534 $658,720
"GLA Income" $6,655,858 $7,261,520 $7,750,495 $7,996,853 $8,251,086 $8,513,448 $8,784,199 $9,063,611 $9,351,960 $9,649,536
Retail Rent 10,000 SF $30 Net $150,000 $231,750 $318,270 $327,818 $337,653 $347,782 $358,216 $368,962 $380,031 $391,432
Parking Revenue $7.23 $501,072 $516,104 $527,458 $527,458 $527,458 $527,458 $527,458 $527,458 $527,458 $527,458
Total Revenue $7,306,930 $8,009,374 $8,596,223 $8,852,129 $9,116,198 $9,388,688 $9,669,874 $9,960,031 $10,259,450 $10,568,426
ExpenseExpenses (Department, House and Fixed) [1] $4,289,400 $4,689,106 $5,016,739 $5,171,868 $5,331,951 $5,497,148 $5,667,622 $5,843,544 $6,025,088 $6,212,435
Real Estate Taxes 2% Growth $129,626 $294,250 $300,135 $306,138 $312,260 $318,506 $324,876 $331,373 $338,001 $344,761
Reserves 4% of revenue $146,139 $240,281 $343,849 $354,085 $364,648 $375,548 $386,795 $398,401 $410,378 $422,737
TOTAL EXPENSE $4,565,164 $5,223,637 $5,660,723 $5,832,091 $6,008,860 $6,191,201 $6,379,293 $6,573,318 $6,773,466 $6,979,933
NOI before Debt Service $2,741,766 $2,785,737 $2,935,500 $3,020,039 $3,107,338 $3,197,487 $3,290,581 $3,386,713 $3,485,983 $3,588,494
Reversion Proceeds - YR 11 NOI 9% Cap, 3% Cost of Sale $39,727,024
Total Income $2,741,766 $2,785,737 $2,935,500 $3,020,039 $3,107,338 $3,197,487 $3,290,581 $3,386,713 $3,485,983 $43,315,518
Debt ServicePrincipal $25,685,629 ($538,177) ($565,086) ($593,340) ($623,007) ($654,158) ($686,865) ($721,209) ($757,269) ($795,133) ($19,751,385)
Interest ($1,284,281) ($1,257,373) ($1,229,118) ($1,199,451) ($1,168,301) ($1,135,593) ($1,101,250) ($1,065,189) ($1,027,326) ($987,569)
Total Debt Service ($1,822,459) ($1,822,459) ($1,822,459) ($1,822,459) ($1,822,459) ($1,822,459) ($1,822,459) ($1,822,459) ($1,822,459) ($20,738,955)
Equity Contribution ($9,426,681)
Cash Flow After DS ($9,426,681) $919,307 $963,278 $1,113,042 $1,197,580 $1,284,879 $1,375,029 $1,468,122 $1,564,254 $1,663,525 $22,576,563
Debt Coverage 1.50 1.53 1.61 1.66 1.71 1.75 1.81 1.86 1.91 2.09
Leveraged IRR 17.96%
NOI before Debt Service $2,741,766 $2,785,737 $2,935,500 $3,020,039 $3,107,338 $3,197,487 $3,290,581 $3,386,713 $3,485,983 $3,588,494
Reversion Proceeds - YR 11 NOI 9% Cap, 3% Cost of Sale $39,727,024
Tax Credit Equity $4,947,663
City Assistance PV $11,171,989
Project Costs ($51,231,962)
($35,112,310) $2,741,766 $2,785,737 $2,935,500 $3,020,039 $3,107,338 $3,197,487 $3,290,581 $3,386,713 $3,485,983 $43,315,518
Unleveraged IRR 9.62%
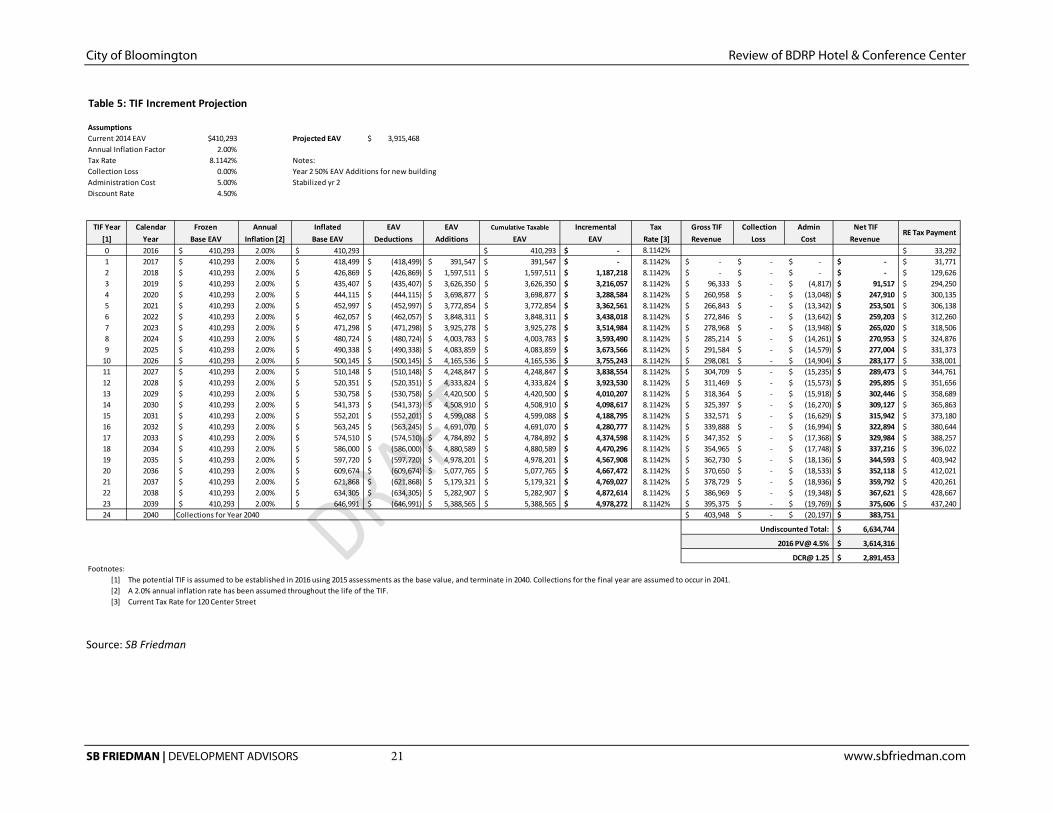
City of Bloomington Review of BDRP Hotel & Conference Center
SB FRIEDMAN | DEVELOPMENT ADVISORS 21 www.sbfriedman.com
Source: SB Friedman
Table 5: TIF Increment Projection
AssumptionsCurrent 2014 EAV $410,293 Projected EAV 3,915,468$ Annual Inflation Factor 2.00%Tax Rate 8.1142% Notes:Collection Loss 0.00% Year 2 50% EAV Additions for new buildingAdministration Cost 5.00% Stabilized yr 2Discount Rate 4.50%
TIF Year Calendar Frozen Annual Inflated EAV EAV Cumulative Taxable Incremental Tax Gross TIF Collection Admin Net TIF[1] Year Base EAV Inflation [2] Base EAV Deductions Additions EAV EAV Rate [3] Revenue Loss Cost Revenue 0 2016 410,293$ 2.00% 410,293$ 410,293$ -$ 8.1142% 33,292$ 1 2017 410,293$ 2.00% 418,499$ (418,499)$ 391,547$ 391,547$ -$ 8.1142% -$ -$ -$ -$ 31,771$ 2 2018 410,293$ 2.00% 426,869$ (426,869)$ 1,597,511$ 1,597,511$ 1,187,218$ 8.1142% -$ -$ -$ -$ 129,626$ 3 2019 410,293$ 2.00% 435,407$ (435,407)$ 3,626,350$ 3,626,350$ 3,216,057$ 8.1142% 96,333$ -$ (4,817)$ 91,517$ 294,250$ 4 2020 410,293$ 2.00% 444,115$ (444,115)$ 3,698,877$ 3,698,877$ 3,288,584$ 8.1142% 260,958$ -$ (13,048)$ 247,910$ 300,135$ 5 2021 410,293$ 2.00% 452,997$ (452,997)$ 3,772,854$ 3,772,854$ 3,362,561$ 8.1142% 266,843$ -$ (13,342)$ 253,501$ 306,138$ 6 2022 410,293$ 2.00% 462,057$ (462,057)$ 3,848,311$ 3,848,311$ 3,438,018$ 8.1142% 272,846$ -$ (13,642)$ 259,203$ 312,260$ 7 2023 410,293$ 2.00% 471,298$ (471,298)$ 3,925,278$ 3,925,278$ 3,514,984$ 8.1142% 278,968$ -$ (13,948)$ 265,020$ 318,506$ 8 2024 410,293$ 2.00% 480,724$ (480,724)$ 4,003,783$ 4,003,783$ 3,593,490$ 8.1142% 285,214$ -$ (14,261)$ 270,953$ 324,876$ 9 2025 410,293$ 2.00% 490,338$ (490,338)$ 4,083,859$ 4,083,859$ 3,673,566$ 8.1142% 291,584$ -$ (14,579)$ 277,004$ 331,373$
10 2026 410,293$ 2.00% 500,145$ (500,145)$ 4,165,536$ 4,165,536$ 3,755,243$ 8.1142% 298,081$ -$ (14,904)$ 283,177$ 338,001$ 11 2027 410,293$ 2.00% 510,148$ (510,148)$ 4,248,847$ 4,248,847$ 3,838,554$ 8.1142% 304,709$ -$ (15,235)$ 289,473$ 344,761$ 12 2028 410,293$ 2.00% 520,351$ (520,351)$ 4,333,824$ 4,333,824$ 3,923,530$ 8.1142% 311,469$ -$ (15,573)$ 295,895$ 351,656$ 13 2029 410,293$ 2.00% 530,758$ (530,758)$ 4,420,500$ 4,420,500$ 4,010,207$ 8.1142% 318,364$ -$ (15,918)$ 302,446$ 358,689$ 14 2030 410,293$ 2.00% 541,373$ (541,373)$ 4,508,910$ 4,508,910$ 4,098,617$ 8.1142% 325,397$ -$ (16,270)$ 309,127$ 365,863$ 15 2031 410,293$ 2.00% 552,201$ (552,201)$ 4,599,088$ 4,599,088$ 4,188,795$ 8.1142% 332,571$ -$ (16,629)$ 315,942$ 373,180$ 16 2032 410,293$ 2.00% 563,245$ (563,245)$ 4,691,070$ 4,691,070$ 4,280,777$ 8.1142% 339,888$ -$ (16,994)$ 322,894$ 380,644$ 17 2033 410,293$ 2.00% 574,510$ (574,510)$ 4,784,892$ 4,784,892$ 4,374,598$ 8.1142% 347,352$ -$ (17,368)$ 329,984$ 388,257$ 18 2034 410,293$ 2.00% 586,000$ (586,000)$ 4,880,589$ 4,880,589$ 4,470,296$ 8.1142% 354,965$ -$ (17,748)$ 337,216$ 396,022$ 19 2035 410,293$ 2.00% 597,720$ (597,720)$ 4,978,201$ 4,978,201$ 4,567,908$ 8.1142% 362,730$ -$ (18,136)$ 344,593$ 403,942$ 20 2036 410,293$ 2.00% 609,674$ (609,674)$ 5,077,765$ 5,077,765$ 4,667,472$ 8.1142% 370,650$ -$ (18,533)$ 352,118$ 412,021$ 21 2037 410,293$ 2.00% 621,868$ (621,868)$ 5,179,321$ 5,179,321$ 4,769,027$ 8.1142% 378,729$ -$ (18,936)$ 359,792$ 420,261$ 22 2038 410,293$ 2.00% 634,305$ (634,305)$ 5,282,907$ 5,282,907$ 4,872,614$ 8.1142% 386,969$ -$ (19,348)$ 367,621$ 428,667$ 23 2039 410,293$ 2.00% 646,991$ (646,991)$ 5,388,565$ 5,388,565$ 4,978,272$ 8.1142% 395,375$ -$ (19,769)$ 375,606$ 437,240$ 24 2040 Collections for Year 2040 403,948$ -$ (20,197)$ 383,751$
Undiscounted Total: 6,634,744$
2016 PV@ 4.5% 3,614,316$
DCR@ 1.25 2,891,453$ Footnotes:
[1] The potential TIF is assumed to be established in 2016 using 2015 assessments as the base value, and terminate in 2040. Collections for the final year are assumed to occur in 2041.[2] A 2.0% annual inflation rate has been assumed throughout the life of the TIF. [3] Current Tax Rate for 120 Center Street
RE Tax Payment

City of Bloomington Review of BDRP Hotel & Conference Center
SB FRIEDMAN | DEVELOPMENT ADVISORS 22 www.sbfriedman.com
Table 6A: City Revenue Projection with ADR=$150
Assumptions Stabilized Revenue% Available for
Bond
$482,682 100%$247,910 100%
Annual Hotel Tax Revenues Equivalent $361,906 100%
$1,092,498Annual Growth Factor RETaxes 2.0%Annual Growth Factor Sales Tax, Hotel Tax 2.0%AssumedDevelopment Note Interest Rate 7%
4.5%
Bond Revenue
Bond Year TIF Year TIF Revenue
Hotel/ Motel Tax Sales Tax 20 Year Bond
25-Year Bond with
Refinancing at Year 20
Cap I 0 $0 $0 $0 $0 0Cap I 1 $0 $0 $0 $0 01 2 $0 $306,523 $362,012 $668,535 $668,5352 3 $91,517 $330,996 $482,682 $905,195 $905,1953 4 $247,910 $361,906 $492,336 $1,102,151 $1,102,1514 5 $253,501 $369,144 $502,182 $1,124,827 $1,124,8275 6 $259,203 $376,527 $512,226 $1,147,956 $1,147,9566 7 $265,020 $384,057 $522,471 $1,171,548 $1,171,5487 8 $270,953 $391,738 $532,920 $1,195,611 $1,195,6118 9 $277,004 $399,573 $543,578 $1,220,156 $1,220,1569 10 $283,177 $407,565 $554,450 $1,245,192 $1,245,19210 11 $289,473 $415,716 $565,539 $1,270,728 $1,270,72811 12 $295,895 $424,030 $576,850 $1,296,775 $1,296,77512 13 $302,446 $432,511 $588,387 $1,323,343 $1,323,34313 14 $309,127 $441,161 $600,154 $1,350,443 $1,350,44314 15 $315,942 $449,984 $612,157 $1,378,084 $1,378,08415 16 $322,894 $458,984 $624,401 $1,406,278 $1,406,27816 17 $329,984 $468,164 $636,889 $1,435,036 $1,435,03617 18 $337,216 $477,527 $649,626 $1,464,370 $1,464,37018 19 $344,593 $487,077 $662,619 $1,494,290 $1,494,29019 20 $352,118 $496,819 $675,871 $1,524,808 $1,524,80820 21 $359,792 $506,755 $689,389 $1,555,937 $1,555,937
22 $367,621 $516,890 $703,177 $1,587,68823 $375,606 $527,228 $717,240 $1,620,07424 $383,751 $537,773 $731,585 $1,653,108
$6,634,744 $9,662,125 $13,176,728 $25,281,261 $30,142,131
Present value (7% to 4.5%) $11,751,441 $16,874,796
Debt Coverage 1.25 1.25
Supportable Debt $9,401,153 $13,499,837
Issuance Cost @2% $188,023 $269,997
Financing Capacity $9,213,129 $13,229,840
Annual Sales Tax Collected
Assumed Alternate Bond Interest Rate
Total Stabilized Revenue Sources (2016 $s)
Annual TIF Revenue
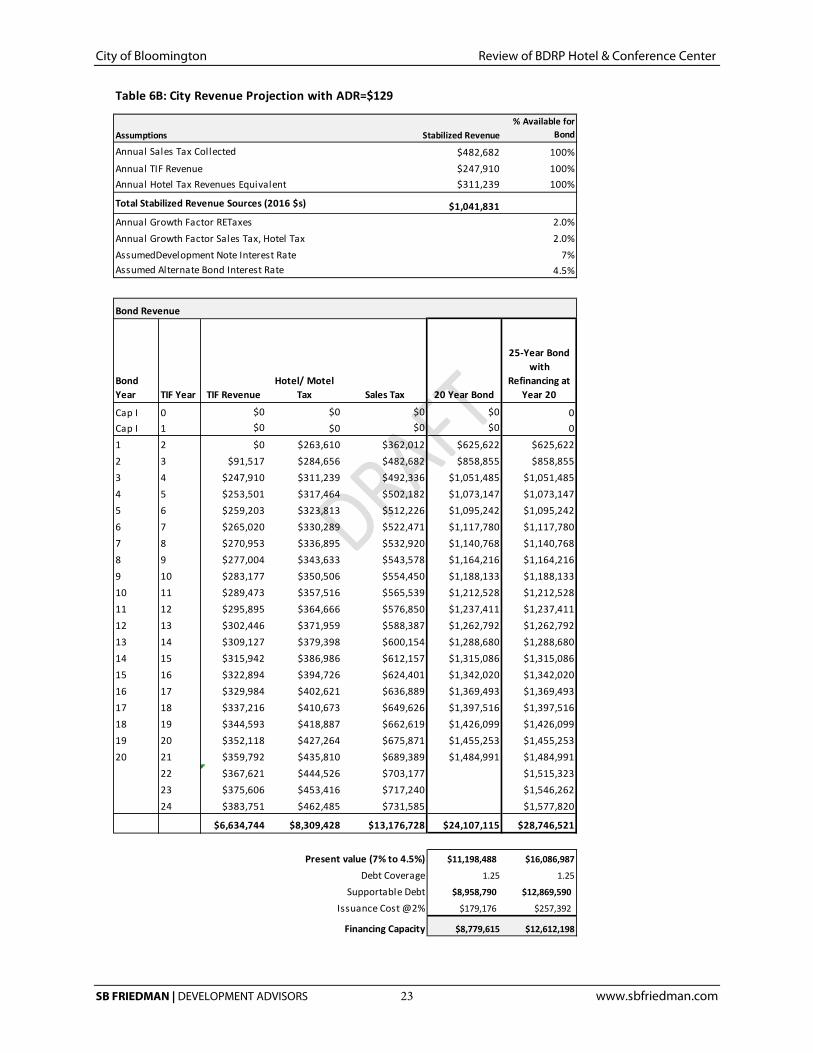
City of Bloomington Review of BDRP Hotel & Conference Center
SB FRIEDMAN | DEVELOPMENT ADVISORS 23 www.sbfriedman.com
Table 6B: City Revenue Projection with ADR=$129
Assumptions Stabilized Revenue% Available for
Bond
$482,682 100%$247,910 100%
Annual Hotel Tax Revenues Equivalent $311,239 100%
$1,041,831Annual Growth Factor RETaxes 2.0%Annual Growth Factor Sales Tax, Hotel Tax 2.0%AssumedDevelopment Note Interest Rate 7%
4.5%
Bond Revenue
Bond Year TIF Year TIF Revenue
Hotel/ Motel Tax Sales Tax 20 Year Bond
25-Year Bond with
Refinancing at Year 20
Cap I 0 $0 $0 $0 $0 0Cap I 1 $0 $0 $0 $0 01 2 $0 $263,610 $362,012 $625,622 $625,6222 3 $91,517 $284,656 $482,682 $858,855 $858,8553 4 $247,910 $311,239 $492,336 $1,051,485 $1,051,4854 5 $253,501 $317,464 $502,182 $1,073,147 $1,073,1475 6 $259,203 $323,813 $512,226 $1,095,242 $1,095,2426 7 $265,020 $330,289 $522,471 $1,117,780 $1,117,7807 8 $270,953 $336,895 $532,920 $1,140,768 $1,140,7688 9 $277,004 $343,633 $543,578 $1,164,216 $1,164,2169 10 $283,177 $350,506 $554,450 $1,188,133 $1,188,13310 11 $289,473 $357,516 $565,539 $1,212,528 $1,212,52811 12 $295,895 $364,666 $576,850 $1,237,411 $1,237,41112 13 $302,446 $371,959 $588,387 $1,262,792 $1,262,79213 14 $309,127 $379,398 $600,154 $1,288,680 $1,288,68014 15 $315,942 $386,986 $612,157 $1,315,086 $1,315,08615 16 $322,894 $394,726 $624,401 $1,342,020 $1,342,02016 17 $329,984 $402,621 $636,889 $1,369,493 $1,369,49317 18 $337,216 $410,673 $649,626 $1,397,516 $1,397,51618 19 $344,593 $418,887 $662,619 $1,426,099 $1,426,09919 20 $352,118 $427,264 $675,871 $1,455,253 $1,455,25320 21 $359,792 $435,810 $689,389 $1,484,991 $1,484,991
22 $367,621 $444,526 $703,177 $1,515,32323 $375,606 $453,416 $717,240 $1,546,26224 $383,751 $462,485 $731,585 $1,577,820
$6,634,744 $8,309,428 $13,176,728 $24,107,115 $28,746,521
Present value (7% to 4.5%) $11,198,488 $16,086,987
Debt Coverage 1.25 1.25
Supportable Debt $8,958,790 $12,869,590
Issuance Cost @2% $179,176 $257,392
Financing Capacity $8,779,615 $12,612,198
Annual Sales Tax Collected
Assumed Alternate Bond Interest Rate
Total Stabilized Revenue Sources (2016 $s)
Annual TIF Revenue