Embed Size (px)
Citation preview

City of Boston Department of Neighborhood
Development
2002 Abandoned Building Survey
2002
230 Boston Street
2001
2002 Abandoned Building Survey Results Introduction
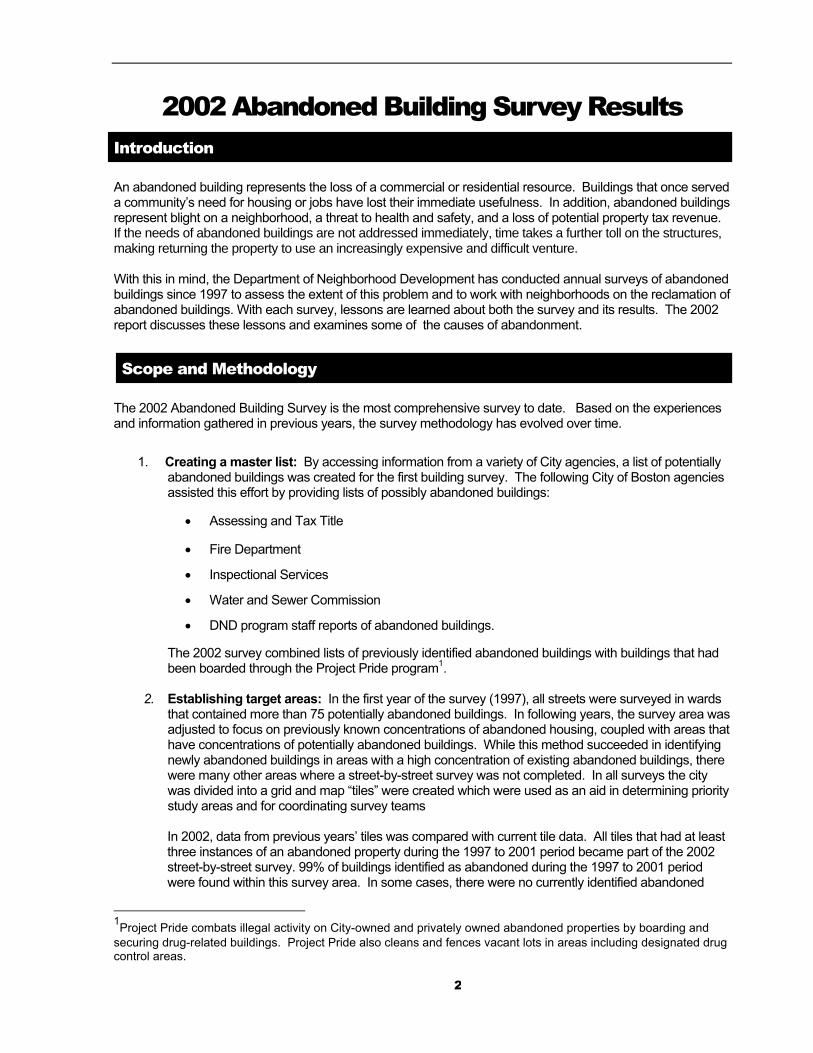
An abandoned building represents the loss of a commercial or residential resource. Buildings that once served a community’s need for housing or jobs have lost their immediate usefulness. In addition, abandoned buildings represent blight on a neighborhood, a threat to health and safety, and a loss of potential property tax revenue. If the needs of abandoned buildings are not addressed immediately, time takes a further toll on the structures, making returning the property to use an increasingly expensive and difficult venture. With this in mind, the Department of Neighborhood Development has conducted annual surveys of abandoned buildings since 1997 to assess the extent of this problem and to work with neighborhoods on the reclamation of abandoned buildings. With each survey, lessons are learned about both the survey and its results. The 2002 report discusses these lessons and examines some of the causes of abandonment.
Scope and Methodology
The 2002 Abandoned Building Survey is the most comprehensive survey to date. Based on the experiences and information gathered in previous years, the survey methodology has evolved over time.
1. Creating a master list: By accessing information from a variety of City agencies, a list of potentially
abandoned buildings was created for the first building survey. The following City of Boston agencies assisted this effort by providing lists of possibly abandoned buildings:
• Assessing and Tax Title • Fire Department
• Inspectional Services
• Water and Sewer Commission
• DND program staff reports of abandoned buildings.
The 2002 survey combined lists of previously identified abandoned buildings with buildings that had been boarded through the Project Pride program1.
2. Establishing target areas: In the first year of the survey (1997), all streets were surveyed in wards
that contained more than 75 potentially abandoned buildings. In following years, the survey area was adjusted to focus on previously known concentrations of abandoned housing, coupled with areas that have concentrations of potentially abandoned buildings. While this method succeeded in identifying newly abandoned buildings in areas with a high concentration of existing abandoned buildings, there were many other areas where a street-by-street survey was not completed. In all surveys the city was divided into a grid and map “tiles” were created which were used as an aid in determining priority study areas and for coordinating survey teams
In 2002, data from previous years’ tiles was compared with current tile data. All tiles that had at least three instances of an abandoned property during the 1997 to 2001 period became part of the 2002 street-by-street survey. 99% of buildings identified as abandoned during the 1997 to 2001 period were found within this survey area. In some cases, there were no currently identified abandoned
1Project Pride combats illegal activity on City-owned and privately owned abandoned properties by boarding and securing drug-related buildings. Project Pride also cleans and fences vacant lots in areas including designated drug control areas.
2

buildings in a tile (though there were such buildings in previous reports). This substantially increased the area covered by the street-by-street survey, while excluding areas where there was little chance of finding an abandoned building.
For the purpo
Any residresidentia(i.e. board
The rationale fabandonmentneighborhoods
Map 1
ses of this report, abandoned property is defined as:
ential, commercial, industrial or mixed-use building - excluding sheds and garages on l properties - which is not occupied and which shows visible signs of physical distress ed up, burned, open to the elements, or otherwise deteriorated).
or this specific definition of abandonment is that it best reflects the most problematic form of in Boston, i.e., that which has the most detrimental impact on the quality of life in Boston’s .
3

Data Gathered
Staff and volunteers fanned out across Boston with maps, survey forms and digital cameras to complete the survey during August, September and October of 2002. Fieldwork provided the following information about buildings:
• Abandonment type (abandoned, boarded, burned, or no longer abandoned);
• Specific signs of physical distress (roof, walls, windows, porches, etc.);
• Photos. The 2002 survey also gathered information about the following:
• Vacant lots that need to be cleaned (regardless of ownership);
• Partially abandoned buildings. These buildings are partially boarded, but some portion of the building is still in use. The survey identified 48 buildings that met this criterion, with only 15 being residential. Just as with fully abandoned buildings, these properties are an eyesore and are at risk for abandonment.
Causes of Abandonment
Buildings are abandoned for a number of reasons, some of which are specific to a family or business problem or crisis. Some are linked to wider changes, either within a community or an economic sector. In bringing a property back to use, the reason for the initial abandonment plays an important role in which strategy should be used to renovate the property. While this is an obvious issue with abandonment resulting from fires, the strategies are less straightforward in dealing with abandonment caused by general economic changes.
Cause: Fire
7 Lamson Court, East Boston
32 Buildings (7.5% of the total) were identified as “burned”. In a number of cases, fires lead to the abandonment of not just one, but two or three buildings.
Cause: Foreclosure
62 Clifford Street, Roxbury
19 buildings in the survey had mortgage foreclosures associated with them, but only 11 (2.6% of the total) could be clearly connected to the time of the abandonment. For this reason, it does not appear that foreclosures are a significant factor in abandonment at this time.
4

Cause: Changes In A Particular Economic Sector
“Shocks” to a particular economic sector, such as new storage tank requirements for gas stations or changes in funding programs for nursing homes has lead to abandonment. While both of these cases did not lead to a surge in abandoned properties, they do represent situations that require unique responses.
The a neby othe e
1607 Dorchester Avenue, Dorchester
Cause: Neighborhoods in T
South Boston’s Westexistence of marginal property types (such as warehouses) cighborhood can lead to “transitional abandonment”. With botbsolete building uses, rapid identification of these buildings anffect of the abandonment on the surrounding neighborhood.
5
533 Cambridge Street, Allston
ransition
End ombined with real or anticipated changes in h this case and with abandonment created d plans for re-use of the properties can limit
Map 2

Cause:
General Changes in the Economy 154 Terrace Street, Mission Hill
A movement away from smaller, older or less efficient storage facilities has lead to the abandonment of a number of buildings.
Survey Results: Overall
3
Map
All Identified Abandoned
Buildings, 2002
Residential: 274 Mixed-Use: 27 Commercial: 125 Total: 426
The geographical spread of these properties is similar to past years, with the largest portion of abandoned buildings located along the Blue Hill and Warren Avenue corridors in Mattapan, Dorchester and Roxbury.
A break down by neighborhood is outlined in the residential and commercial sections of this report.
6

The number of abandoned buildings has decreased 60% since 1997 and 30% since 2000. With a 66% drop in abandonment, residential buildings have outperformed the commercial/mixed-use sector, which experienced a 40% drop in abandoned buildings since 2000.
Abandoned Buildings, by Property Type
1068
426441
611688
758813
553
274301407
461
255205 227 204 140 152
0
200
400
600
800
1,000
1,200
1997 1998 1999 2000 2001 2002
TotalResidentialCommercial/Mixed
C
Map 4
Newly IAbandone
2ResidenMixed-UCommeTotal:
Using Project PrInspectional Serinformation, Washut-off data, in previous survey160 buildings thidentified were dbeen abandonesurvey.
A number of abawere discoveredlarger street-by-but there were aabandoned buildthe commercial/that have been alast year.
dentified d Buildings, 002
tial: 87 se: 16 rcial: 57 160
ide and vices’ boarding ter and Sewer’s conjunction with data, 63 of the at were newly etermined to have d before the last
ndoned buildings because of the street survey area, number of newly ings, especially in
warehouse sector bandoned in the
hart 1
7

Map 5
No Longer Abandoned
Buildings, 2002
Residential: 77 Mixed-Use: 7 Commercial: 29 Total: 114
41% of buildings found to be no longer abandoned are located in Roxbury.
Survey Results: Residential
Looking more closely at residential abandoned buildings draws a more detailed picture of not only how many residential buildings are abandoned, but also how many housing units are abandoned. Additionally, these results allow us to reasonably extrapolate which types of housing are more likely to be abandoned, and where we might find further concentrations of abandoned buildings. Summary Statistics
The number of residential abandoned buildings fell 9% from 2001, from 301 to 274 buildings. While not a significant decrease, this shows steady progress in moving toward the goal set by Mayor Thomas Menino in his 2000 housing preservation and production strategy, Leading the Way. The goal of this strategy is to reduce the number of abandoned residential buildings by 50%; 2001 numbers show a total reduction of 33% thus far. Although to meet the goal, an additional 133 buildings will need to be returned to use, currently 65 buildings are already undergoing rehab and 22 Boston Housing Authority properties are scheduled to begin work, putting Mayor Menino’s goal soon within reach. Residential Abandonment by Property Type and Number of Housing Units Chart 2
Residential Abandoned By Type, 2002
All other17% 1 unit
29%
2 units17%
3 units37%
Three-family homes make up the largest share of abandoned residential buildings. This suggests that three-family homes are a residential type where city efforts should be concentrated, especially since they can provide more units of housing, compared to single- or two-family homes. In total, the 301 currently abandoned residential and mixed-use buildings contain 884 units of housing. Of these, 65 buildings (containing 195 housing units) were identified in the field as currently undergoing some level of renovation or repair. 75 residential and mixed-use buildings, which were identified in 2002 as “no longer abandoned”, contain approximately 203 units of housing.
8

Residential Abandonment by Neighborhood
2002 Residential Abandoned Buildings, By Neighborhood
Roxbury47%
Roslindale1%
Mattapan11%
Jamaica Plain3%
Hyde Park1%
East Boston7%
Dorchester19%
South Boston4%
Back Bay/ Beacon Hill
1%Central1%
South End5%
Chart 3 As seen in the chart 3, Roxbury has by far the largest number of abandoned buildings. The table below outlines detailed information about each of Boston’s neighborhoods. The following results are significant: • Most central Boston
neighborhoods have experienced little or no abandonment.
• In neighborhoods that had a
moderate rate of abandonment in 1997(including Hyde Park, Mattapan, the South End, Jamaica Plain and East Boston), there has been a significant decrease in abandonment.
Allston/Brighton, Charlestown & Fenway/Kenmore had no abandoned residential buildings.
Abandonment in Roxbury has been reduced significantly in terms of the number of residential buildings (from 288 to 127), but this is a smaller decrease (56%), than the city-wide decrease of 66%.
Abandoned Residential Buildings, by Neighborhood
Neighborhood 1997 2001 2002 % Change 2001 – 2002
% Change 1997 - 2002
Allston/Brighton 3 2 0 -100% -100%
Back Bay/Beacon Hill 3 2 2 0% -33%
Central 12 2 2 0% -83%
Charlestown 1 0 0 0% -100%
Dorchester 176 66 51 -23% -71%
East Boston 50 20 20 0% -60%
Fenway/Kenmore 0 1 1 0% N/A
Hyde Park 45 4 3 -25% -93%
Jamaica Plain 37 10 7 -30% -81%
Mattapan 101 24 30 25% -70%
Roslindale 11 5 4 -20% -64%
Roxbury 288 140 127 -9% -56%
South Boston 7 10 12 20% 71%
South End 45 14 15 7% -67%
West Roxbury 3 1 0 -100% -100%
Unknown2 31 0 0 N/A N/A
Total 813 301 274 -9% -66%
Table 1
9
2 The unknown category includes properties that were unable to be “geocoded” within a neighborhood boundary. For 2001 and 2002, all properties were successfully geocoded.

Residential Abandonment by Ownership Type and Tax Status
1997Public/ Exempt
17%
Private, Taxes Owed16%
Private Tax
Current67%
Chart 4
2002Public/ Exempt
17%Private Tax
Current53% Private,
Taxes Owed31%
Chart 5
Addressing Abandoned Residential
Private Renovation of Abandoned Buildings: Many properties that are no longer abandoned havebuildings can be re-occupied with sweat equity and level of renovation. 12-14 Creighton Street in Jamrenovate a property. Identified in the initial abandonebuilding in 2000. The renovations continued until ea
12-14 Creighton 1999
Buildings Renovated through Public/Private Coo Other properties are renovated through the efforts oexample, 136 Pleasant Street in Dorchester is a six-Street Inn purchased the property in 1999. With funNeighborhood Development, the Putnam Senior ExHousing and Community Development, the Federal
An examination of abandoned residential buildings based on their ownership type (public or private) and their tax status gives us further information that can shape DND programs.
While privately held tax-current property has comprised the largest category of residential abandonment since 1997, the adjacent charts show that this has decreased as a percentage of total abandonment from 1997 to 2002, from 67% to 53%. Tax delinquent property, however, has nearly doubled as a percentage of total abandonment, from 16% in 1997 to 31% in 2002. This does not mean that there are more tax delinquent properties, as the total number of abandoned buildings has fallen from 813 to 274 (a 66% decrease). This proportion has increased because the number of tax delinquent buildings has only fallen 35%, from 130 to 85.
Buildings
been returned to use by the private market. While some a minimum amount of rehab, other properties need a high aica Plain is a good example of the time it can take to d building survey of 1997 private work began on the rly 2002, when the building was finally re-occupied.
Street, Jamaica Plain
2002
peration:
f non-profits, lenders, and government agencies. For unit building that was damaged by fire in 1998. The Pine ding from the City of Boston’s Department of ecutives Foundation, the Massachusetts Department of Home Loan Bank of Boston and Wainwright Bank and
10

Trust Company, construction began in July 2001 and was completed in early 2002. The property will remain permanently affordable as housing for formerly homeless families.
136 Pleasant Street, Dorchester
2000 2002
Department of Neighborhood Development Programs Efforts to eliminate abandoned housing have been successful, but as this report shows, there are areas in which the City of Boston can focus its efforts: 1) Three-family homes present an excellent opportunity to increase the number of available housing
units. There is currently a need for a purchase/rehab program that could address this property type. 2) Privately owned, tax-delinquent buildings have failed to respond to the private market or City efforts.
Further analysis should be done with tax title data to determine if more aggressive tax foreclosures and/or receiverships may help to reduce the stock of such buildings.
3) Roxbury continues to have the highest concentration of abandoned buildings. DND has been working
diligently with the citizens of Roxbury to plan the future of the neighborhood, not just in terms of abandoned housing, but also as it regards vacant lots, neighborhood business districts, schools, and other facilities.
A range of existing City of Boston programs assist in bringing abandoned buildings back to use. • The 1-4 Family Program, administered by LISC and the Boston Community Loan Fund, provides funding
to a network of community development corporations (CDCs) to acquire and rehabilitate privately owned abandoned buildings. The CDCs rehabilitate the building and sell the finished house to a first-time homebuyer at an affordable price.
• Homeowners who wish to re-occupy an abandoned home can access DND programs including Boston
HomeWorks, Boston’s Historic HomeWorks, and Senior Home Rehabilitation to assist with funding the repairs that can make the house livable again.
• The Hidden Assets Program provides grants for the renovation of smaller apartment buildings (five or
more units) for long-term affordable housing. • DND staff reaches out to abandoned building owners to determine what assistance, if any, the Department
can offer. If outreach is unsuccessful, action can be taken through the Receivership Program. Boston’s Inspectional Services Department can force otherwise reluctant owners to renovate their buildings.
Survey Results: Commercial and Mixed Use
From 2001 to 2002, there was a 7% increase in the number of commercial and mixed-use abandoned buildings in the survey. Even with this increase, the number of abandoned commercial and mixed-use
11

buildings has fallen 40% since 1997. There are many difficulties in properly identifying and assessing the abandonment status of such properties, since a large number of buildings used for storage may appear to be abandoned (due to little day-to-day activity around the buildings or disrepair), when in fact they are not. Even though staff makes a great effort to be consistent, the number of abandoned commercial buildings can change from year to year. Commercial and Mixed Use Abandonment by Neighborhood
2002 Commercial / Mixed-Use Abandoned,by Neighborhood
Others4%
South Boston9%
South End9%
Roxbury37% Roslindale
2%
Mattapan5%
Jamaica Plain5%
Dorchester12%
Central9%
East Boston5% Hyde Park
3%
Chart 6
As seen in the chart above, Roxbury has by far the largest number of abandoned commercial and mixed-use buildings. Table 2 outlines detailed information about each of Boston’s neighborhoods
Table 2: Abandoned Commercial & Mixed-Use Buildings by Neighborhood Neighborhood 2000 2001 2002 % Change
2000 – 2001
% Change
2001 - 2002
Allston/Brighton 1 3 2 200% -33%
Back Bay/Beacon Hill 0 0 2 0% N/A
Central 13 8 13 -38% 63%
Charlestown 3 0 0 -100% 0%
Dorchester 19 14 19 -26% 36%
East Boston 16 11 7 -31% -36%
Fenway/Kenmore 1 0 0 -100% 0%
Hyde Park 3 3 4 0% 33%
Jamaica Plain 10 6 8 -40% 33%
Mattapan 18 11 8 -39% -27%
Roslindale 4 3 3 -25% 0%
Roxbury 89 61 57 -31% -7%
South Boston 12 9 13 -25% 44%
South End 18 12 14 -33% 17%
West Roxbury 1 1 2 0% 100%
Unknown3 1 0 0 N/A N/A
Total 209 142 1524 -32% 7%
12
3 The unknown category includes properties that were unable to be “geocoded” within a neighborhood boundary.

13
In many neighborhoods the number of abandoned commercial or mixed-use buildings is so few that the addition or subtraction of a building from the results appears to be a dramatic upturn or downturn in abandonment. In neighborhoods such as Allston/Brighton, Back Bay/Beacon Hill, Charlestown, Fenway/Kenmore, Hyde Park and West Roxbury this is the case. More meaningful results include:
While the number of abandoned commercial/mixed-use buildings has increased in Central Boston from 2001 to 2002, this is largely due to a more thorough survey in the Chinatown/Downtown Crossing area of the city, not due to a sudden increase in abandonment.
In South Boston, there has been an increase in abandoned commercial/mixed-use buildings over the last year, as marginal properties (mostly warehouses) have been vacated.
City of Boston Efforts to Reduce the Number of Commercial and Mixed-Use Abandoned Buildings
Through its programs intended to strengthen neighborhoods and local business districts, the Department of Neighborhood Development’s Office of Business Development has addressed abandoned commercial buildings in several ways:
Through the Commercial Real Estate and Business Finance program, larger properties are restored to usefulness. This program is instrumental in the ongoing efforts to restore the currently abandoned Ferdinand’s Furniture Store in Dudley Square.
Some buildings are no longer useable and are demolished in preparation for new construction.
The Boston Main Streets program helps to revitalize local business districts. As a result, formerly abandoned buildings have found new life.
In some cases, private investment brings an old commercial space back to use, and DND’s ReStore Boston assists by providing additional funding to upgrade the storefront.
In the case of mixed-use properties, both the Office of Business Development and DND’s Neighborhood Housing Development Division work together to provide funding and technical assistance.
Next Steps
Less than 1% of all buildings in Boston are abandoned, but a single abandoned building can lead to a decline in investment in a street or neighborhood. For this reason, the Department of Neighborhood Development will continue its efforts to reduce the number of abandoned buildings through a combination of existing programs, stepped-up tax foreclosure and receivership efforts, as well as research into new programs that can address more stubborn issues, such as the number of abandoned three-family homes. Credits: Text, Charts, Graphs and Maps: Tim Davis Edits: Erin Amar, Bob Gehret, Mary Knasas and Carol Owens Fieldwork Maps: Andrew Theokas Field Work: Larry Braman, Tim Davis, Mary Knasas, Keith Kuzmin, Gabe Scheinmann, Phil Sweeney, and Andrew Theokas
4 In 2002, 9 commercial/mixed-use abandoned buildings had for sale or for rent signs. There were five such buildings in 2001.