Embed Size (px)
Citation preview

City of Boulder
Pedestrian Crossing Treatment Installation Guidelines
January 2006
Prepared for: City of Boulder Transportation Division
P.O. Box 791 Boulder, Colorado 80306

For More Information, please contact:
City of Boulder – Transportation Division P.O. Box 791
Boulder, Colorado 80306 (303) 441-3266

City of Boulder Pedestrian Crossing Treatment Installation Guidelines Page i
TABLE OF CONTENTS
List of Tables and Figures .......................................................................................................ii
Executive Summary ........................................................................................................iii
1.0 BACKGROUND.................................................................................................... 1 1.1 Standards and Policies ..................................................................................... 1 1.2 Pedestrian Crossing Enhancements................................................................. 3 1.3 Evaluation of Demonstration Devices Used in the City of Boulder.................... 4
2.0 CROSSING LOCATION EVALUATION PROCEDURES ..................................... 6 Step 1: Identification and Description of Crossing Location........................................ 6 Step 2: Physical Data Collection................................................................................. 6 Step 3: Traffic Data Collection .................................................................................... 7 Step 4: Apply Data to Figure 1 and Table 1 to Determine Appropriate Treatments.... 7
3.0 SUPPLEMENTAL POLICIES ............................................................................. 11 3.1 Minimum Vehicular Volume for Treatments .................................................... 11 3.2 Crosswalk Lighting.......................................................................................... 11 3.3 Avoiding Overuse of Crossing Treatments...................................................... 11 3.4 Multi-Use Path Crossings................................................................................ 11 3.5 Textured and Colored Pavement Treatments ................................................. 12 3.6 Minimum Median Refuge Width ...................................................................... 12 3.7 Accessible Crosswalks ................................................................................... 12 3.8 Raised Crossings at Right-Turn Bypass Islands ............................................. 12 3.9 Removal of Treatments................................................................................... 12
4.0 NEXT STEPS ..................................................................................................... 14
Bibliography .................................................................................................................. 15 Appendix A: Summary of Applicable Technical Literature
Appendix B: Crossing Treatment “Demonstration Device” Evaluations

City of Boulder Pedestrian Crossing Treatment Installation Guidelines Page ii
LIST OF FIGURES AND TABLES
Pedestrian Crossing Evaluation Worksheet ........................................................................... 8
Figure 1 – Pedestrian Crossing Treatment Flowchart............................................................ 9
Table 1 – Criteria for Crossing Treatments at Uncontrolled Locations................................. 10

City of Boulder Pedestrian Crossing Treatment Installation Guidelines Page iii
Executive Summary Providing safe and efficient pedestrian facilities is a long-established goal of the City of Boulder. Pedestrian facilities are of particular importance as we try to reduce our dependency on the automobile. The decision to travel as a pedestrian is in part subject to the pedestrian’s ability and perceived ability to safely and efficiently cross roadways along the travel route. With this in mind, the City of Boulder has established this document to provide a set of criteria, procedures, and policies to guide the installation of crossing treatments. This document, intended to replace the City of Boulder Pedestrian Crossing Treatment Warrants implemented in 1996, incorporates data collected both for the previous document and recently collected for this effort. Specifically, this document summarizes:
Proposed pedestrian crossing criteria and procedures for evaluating the need for crossing treatments, including a “flowchart” approach
Specific pedestrian crossing treatments that may be applicable for a particular set of pedestrian volumes, pedestrian types, vehicular volumes, vehicular speeds, and roadway geometry.
A technical literature research regarding applicable standards, policies, and treatments being used in other communities both in the U.S. and elsewhere
An evaluation of various pedestrian crossing treatments utilized in the City of Boulder including crosswalk compliance and safety analysis
When Boulder’s original Pedestrian Crossing Treatment Warrants were developed in 1996, there were relatively few studies available at the federal, state, and municipal levels with respect to the installation of crosswalks and other crossing treatments. Over the past few years more studies have been published which assist in the formulation of specific local policies. However, national standards still provide little guidance for the installation of marked crosswalks and treatments, particularly at mid-block locations. Crosswalks and other crossing treatments are typically installed based on engineering judgment. Key issues, such as the circumstances in which a crosswalk should be installed, how much safety benefit crosswalks provide, and the application of various crossing enhancements are still commonly debated topics. Information recently published by the Federal Highways Administration (FHWA) (Zegeer et al)1 suggests that on two-lane roadways, marked crosswalks alone at uncontrolled locations have no effect on pedestrian accident rates. The FHWA study goes on to suggest that, on higher volume, multi-lane roadways, marked crosswalks alone (without any other treatments) are associated with higher vehicle-pedestrian accidents rates compared to unmarked locations. Over the past eight years, the City of Boulder has undertaken an extensive evaluation of the effectiveness and safety of various treatments being tested at crossing locations in the City. The City has installed demonstration devices at 36 locations including two-lane and multi-lane crossings. These treatments have included enhanced crosswalk signing, pedestrian-

City of Boulder Pedestrian Crossing Treatment Installation Guidelines Page iv
actuated flashing signs, raised crossings on right-turn bypass islands, and other devices. This evaluation has shown that while these devices most often result in a significant increase in driver compliance (yielding to crossing pedestrians) at crosswalks, some of these devices may lead to higher vehicle-vehicle and vehicle-pedestrian accidents at multi-lane, high pedestrian/vehicle volume locations. The results of the data collection to date have been incorporated into these guidelines, though the City of Boulder will continue to evaluate these and other treatments and may make changes to the guidelines over time. The Pedestrian Crossing Treatment Installation Guidelines are intended to provide a consistent procedure for considering the installation of crossing treatments where needed on a case-by-case basis in the City of Boulder. Implementation of crossing treatments will require funds that could potentially have been spent on other transportation system improvements, and, therefore, must be considered carefully in the funding allocation process. How have these guidelines changed since the previous (1996 Pedestrian Crossing Treatment Warrants) document?
Incorporated eight years of compliance data collection and five-year safety analysis for demonstration device installations within the City of Boulder
Included guidelines for installation of crosswalks at controlled locations (stop signs
and traffic signals) Lowered minimum volume thresholds for crossing treatments based on FHWA and
other sources Removed vehicular gap data as a primary crossing location evaluation criterion due
to infeasibility of performing these studies on regular basis
Updated the guidelines to include crossing enhancements such as “State Law – Yield to Pedestrians” signs and pedestrian-actuated flashing signs as potential treatments
Added a new flowchart and tables guiding the installation of crosswalks and
treatments based on updated criteria
Added a worksheet to guide City staff through the evaluation process at a particular crossing location
Added supplemental policies, including application of street lighting at crossing
locations, avoiding overuse of treatments, application of textured/colored pavement treatments at crossings, and removal of treatments
Updated the document to include school crossing treatments in conformance with
the 1999 City of Boulder and Boulder Valley School District Safe Access to Schools Program

City of Boulder Pedestrian Crossing Treatment Installation Guidelines Page 1
City of Boulder Pedestrian Crossing Treatment Installation Guidelines
1.0 BACKGROUND Roadway crossings can be barriers to pedestrian travel. The decision to travel as a pedestrian is in part dependent upon the actual and perceived ability to safely and efficiently cross roadways along the pedestrian’s intended travel route. The City of Boulder wants to encourage pedestrian travel by providing safe and efficient roadway crossing opportunities. There are a variety of methods available to help facilitate pedestrian crossings on busy roadways, including marked crosswalks, enhanced crosswalks, and traffic signals. Crosswalk enhancements may include alternative signing, pedestrian-activated warning devices that draw attention to the pedestrian and alert motorists to their presence at a crosswalk, and physical enhancements intended to increase pedestrian visibility and/or reduce exposure such as neckdowns, raised crosswalks, and median refuges. Signalized traffic control measures to reduce pedestrian-vehicle conflicts typically increase delays for both pedestrian and vehicular traffic. This creates a conflict between providing safety and generating operational efficiency for all modes of travel. These guidelines are tailored to meet the needs of the City of Boulder for optimizing safety and minimizing delay. The Pedestrian Crossing Treatment Installation Guidelines will provide a framework for identifying locations where pedestrian crossing treatments are appropriate and should be implemented by the City. Application of these guidelines should accomplish the following project goals:
Promote pedestrian travel by providing safe, efficient, and effective roadway crossing opportunities
Reflect the needs of our diverse range of pedestrian age and ability groups
Provide for a balance between the demand for treatments and resources to implement them
Achieve a reasonable balance of impacts to all modes of travel 1.1 Standards and Policies Upon beginning the process of determining pedestrian crossing installation criteria, an extensive review of the latest available technical literature was conducted. This current effort was intended to build upon the research conducted during the previous (1996) effort. Summaries of relevant reports for the latest research are included in Appendix A. The Manual on Uniform Traffic Control Devices (MUTCD) is the national standard for establishing traffic control on roadways throughout the United States and has been adopted by the City of Boulder as the City standard. Although the MUTCD does provide pedestrian

City of Boulder Pedestrian Crossing Treatment Installation Guidelines Page 2
crossing warrant criteria for the installation of pedestrian traffic signals, these warrants have been controversial in that signals are typically very hard to justify. According to the Federal Highway Administration’s report on pedestrian signalization alternatives (July 1985), “The existing [1978] MUTCD Minimum Pedestrian Volume Warrant is highly impractical for most real-world conditions and is largely ignored by the traffic engineering community.” The MUTCD also offers little guidance with respect to the installation of marked crosswalks, stating that “crosswalks should be marked at all intersections where there is a substantial conflict between vehicular and pedestrian movements” and that an “engineering study should be performed before they are installed at (uncontrolled) locations.” In response to the controversial MUTCD pedestrian volume and school crossing traffic signal warrants, and lack of guidance by the MUTCD with respect to the installation of marked crosswalks, some agencies have developed their own unique policies and procedures. Generally, these documents supplement the basic provisions of the MUTCD with more detailed criteria based on their own research and field studies. In 1997, the Institute of Transportation Engineers (ITE) adopted the “Design and Safety of Pedestrian Facilities”2 as a Recommended Practice. This document built on MUTCD policies and guidelines and provided thresholds for the installation of marked crosswalks at uncontrolled locations based on those developed by Steven A Smith and Richard L. Knoblauch3. These guidelines are provided on page A2 in the Appendix, and provide recommended thresholds for marked crosswalks based on minimum hourly pedestrian volume, average daily traffic volumes, roadway configuration (laneage and presence of median refuges). In 2002 the FHWA published a report titled, “Safety Effects of Marked vs. Unmarked Crosswalks at Uncontrolled Locations: Executive Summary and Recommended Guidelines”1. Based on a five-year safety analysis at 1,000 marked crosswalks and 1,000 unmarked crossing locations, this report provides recommendations for installing marked crosswalks and enhancements based on roadway volume, speed, and laneage (Table 1 on page A5 in Appendix A). The report suggests that on two-lane roadways, marked crosswalks alone at uncontrolled locations have no effect on pedestrian accident rates. The report also suggests that, on multi-lane roadways with a traffic volume greater than 12,000 vehicles per day, marked crosswalks alone (without any other treatments) are associated with higher vehicle-pedestrian accidents rates compared to unmarked locations. The Virginia Department of Transportation recently adopted a set of guidelines4 for the installation of marked crosswalks that built upon the FHWA recommendations and provided more detailed guidance with respect to what types of crosswalk enhancements may be appropriate for a given set of roadway conditions (shown in Table 2 in the Appendix). These guidelines provided five basic levels of devices given the conditions present. Level 1: standard crosswalk, raised crossing, rumble strips Level 2: high-visibility crosswalks (retroreflective white markings and textured pavements) Level 3: refuge islands, split-pedestrian crossover, neckdowns Level 4: overhead signs and flashing beacons, in-roadway warning lights Level 5: pedestrian-actuated traffic signals, grade-separated crossings

City of Boulder Pedestrian Crossing Treatment Installation Guidelines Page 3
During the research review, it was noted that the City of Boulder’s existing minimum pedestrian volume thresholds (based on the 1996 document) for basic crossing treatments were typically higher than those adopted by the agencies researched. The Virginia guidelines4, for instance, state a minimum requirement of 20 pedestrians per hour (15 elderly and/or children) or 60 in four hours crossing at the location in question. The City of San Jose, CA5 have adopted guidelines that require at least 15 pedestrians crossing the street during the highest one-hour period or 25 pedestrians crossing during the highest consecutive two-hour period. This is in comparison to the previously adopted City of Boulder thresholds of 100 pedestrians per hour or 50 pedestrians per hour during the peak four hours. It is believed that this downward trend in pedestrian volume necessary to warrant treatments is both a result of increased efforts by agencies to accommodate pedestrians and provide safer and more efficient pedestrian facilities. 1.2 Pedestrian Crossing Enhancements A wide range of crossing enhancements (treatments used to increase the effectiveness of marked crosswalks) are being used in other communities in the United States and elsewhere which have been considered for use in the City of Boulder. The most comprehensive resource for information relative to these devices, including pros and cons, costs, and effectiveness, is the Alternative Treatments for At-Grade Pedestrian Crossings6. Enhancements being used elsewhere include:
Automated detection Curb extensions In-pavement lighting Flags Flashing beacons In-roadway signs Lane reductions Rumble strips
Markings and legends Overhead signs Pedestrian railings Raised markers (with LEDs) Refuge islands Street lighting Raised crossings Pavement treatments
Many of these treatments are being used and/or have been tested as “demonstration” devices in the City of Boulder, with varying degrees of success. Devices used in the City of Boulder have included most of the physical devices shown above, in addition to demonstration devices such as in-pavement lighting, rumble strips, flashing signs, in-roadway signs, and alternative signs and markings (such as the “State Law Yield-to-Pedestrians” signs and advance yield markings). In 2000, city staff began demonstrating two new enhanced pedestrian crossing treatments. The purpose of these treatments was to draw attention to high volume pedestrian crossing locations and to encourage vehicles to have better compliance with their legal requirement to yield to pedestrians in these locations. The first demonstration was a new, multi-colored sign which stated “State Law - YIELD to Pedestrians in Crosswalk." The signs were placed on an orange barrel or bollard in the street and mounted on a standard assembly at the side of the street. The other demonstration was pedestrian actuated flashing lights imbedded in a standard pedestrian

City of Boulder Pedestrian Crossing Treatment Installation Guidelines Page 4
warning sign, mounted at the side of the road and on medians in the center of the road. These lights flash when a pedestrian pushes a button. Over the past five years, staff has been expanding the use of these demonstration devices to other locations within the city. Pedestrian actuated flashing signs have been installed at 11 locations; however, two have subsequently been removed. State Law signs have been installed at 25 locations; however, one has subsequently been removed. Section 3.3 contains an evaluation (to date) of some of these demonstration devices that have been tested in the City of Boulder. The City of Boulder will continue to stay abreast of the latest crossing enhancement technologies and research and will continue to test and modify its own applications to maximize the safety and efficiency of these treatments. A discussion of the “Next Steps” involved in this process is included in Section 4.0 1.3 Evaluation of Demonstration Devices Used in the City of Boulder Over the past eight years, the City of Boulder has evaluated driver compliance at crosswalks both before and after the installation of “demonstration devices”. The devices evaluated included:
“State Law–Yield to Pedestrians” Signs and Bollards (used at 2 or 3-lane crossings) Pedestrian Activated Flashing Signs (used primarily at multi-lane crossings)
In addition to evaluating the effectiveness of these devices in terms of driver compliance, six-year accident histories were compiled to compare the safety effects of the demonstration devices both before and after installation. Since pedestrian and bicycle accidents are relatively infrequent and a six-year history does not provide a large sample size of data, some generalizations can be made and are included in the following text. The evaluation and safety analysis data is summarized in Appendix B. The evaluations showed that both demonstration devices are effective at getting vehicles to comply with state law and yield to pedestrians in crosswalks. They accomplish this with a relatively minor impact to vehicle delay. In addition, the evaluation showed that at locations with “State Law – Yield to Pedestrians” signs, there were very few examples of increased accident frequency for either rear-end collisions or accidents involving pedestrians or bicyclists being hit by a motor vehicle. The majority of accident frequencies either stayed the same or was reduced at locations studied. At locations using the pedestrian-actuated flashing signs, there were increases in rear-end collision frequencies at some locations and increases in the frequency of pedestrians or bicycles being hit in the crosswalk at several locations. Injury accident frequencies also increased at many locations. It should be noted that, since these devices were installed primarily at multi-lane crossing locations, the effectiveness of these devices cannot be directly compared to the “State-Law” signs.
City of Boulder Pedestrian Crossing Treatment Installation Guidelines Page 5
While the pedestrian-actuated flashing signs do not change the rules of the roadway, the effectiveness of encouraging vehicles to yield to pedestrians has resulted in more vehicles stopping for pedestrians, which has further resulted in more rear-end collisions (this same phenomenon exists when new traffic signals are installed in the roadway). It is possible that the increased compliance of motor vehicles yielding to pedestrians is also resulting in some pedestrians and bicyclists using less caution when they cross which in turn results in an increase in vehicle-pedestrian and vehicle-bicycle accidents. Further analysis of the safety effects of these devices is recommended so that a larger sample of data may be obtained and accident trends related to physical and environmental variables may be identified.
City of Boulder Pedestrian Crossing Treatment Installation Guidelines Page 6
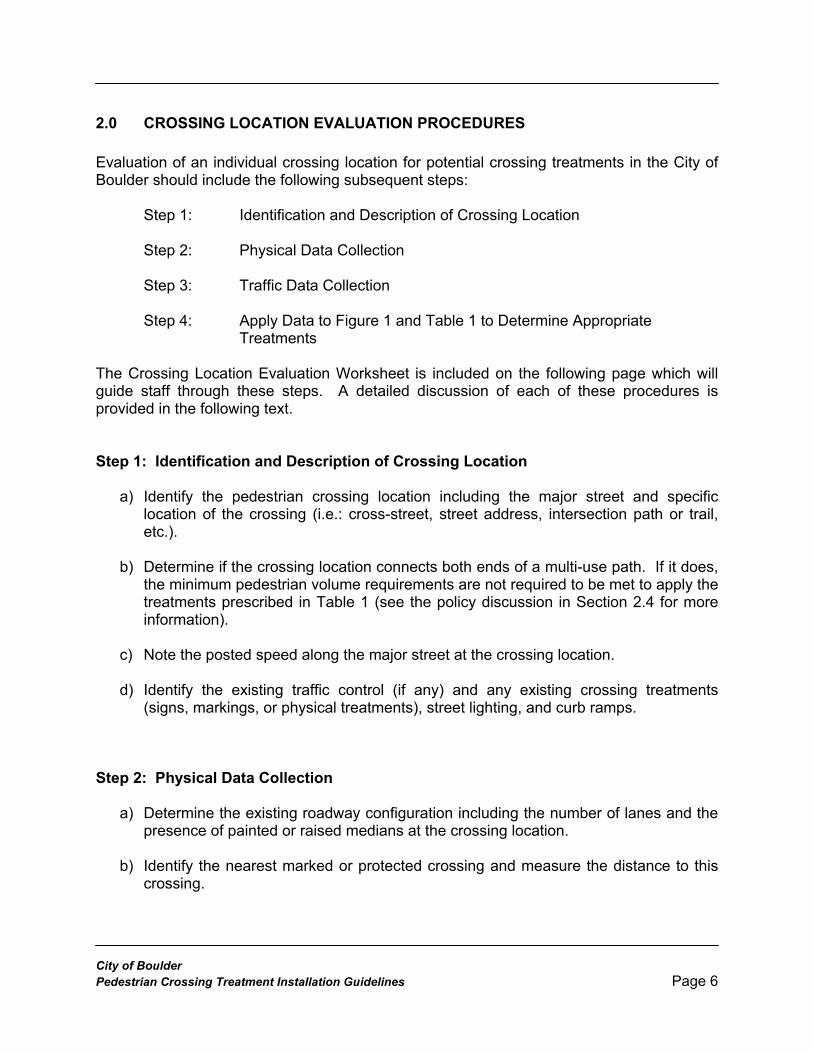
2.0 CROSSING LOCATION EVALUATION PROCEDURES Evaluation of an individual crossing location for potential crossing treatments in the City of Boulder should include the following subsequent steps: Step 1: Identification and Description of Crossing Location Step 2: Physical Data Collection Step 3: Traffic Data Collection Step 4: Apply Data to Figure 1 and Table 1 to Determine Appropriate Treatments The Crossing Location Evaluation Worksheet is included on the following page which will guide staff through these steps. A detailed discussion of each of these procedures is provided in the following text. Step 1: Identification and Description of Crossing Location
a) Identify the pedestrian crossing location including the major street and specific location of the crossing (i.e.: cross-street, street address, intersection path or trail, etc.).
b) Determine if the crossing location connects both ends of a multi-use path. If it does,
the minimum pedestrian volume requirements are not required to be met to apply the treatments prescribed in Table 1 (see the policy discussion in Section 2.4 for more information).
c) Note the posted speed along the major street at the crossing location.
d) Identify the existing traffic control (if any) and any existing crossing treatments
(signs, markings, or physical treatments), street lighting, and curb ramps. Step 2: Physical Data Collection
a) Determine the existing roadway configuration including the number of lanes and the presence of painted or raised medians at the crossing location.
b) Identify the nearest marked or protected crossing and measure the distance to this
crossing.

City of Boulder Pedestrian Crossing Treatment Installation Guidelines Page 7
c) Measure the stopping sight distance (SSD) on all vehicular approaches to the crossing. If the SSD is less than eight times (8x) the posted speed limit, determine if improvements (such as removal of obstructions) and/or lowering of the posted speed limit are feasible means to mitigate the inadequate SSD.
Step 3: Traffic Data Collection
a) Gather or collect pedestrian crossing volumes during the peak hours of use. This will typically involve AM, mid-day, and PM peak hours. Locations near schools may only require two hours of data collection (AM and PM peak hours corresponding to school opening and closing times). All pedestrian volumes should include and differentiate between pedestrians and bicyclists and should note separately the number of young, elderly, and/or disabled pedestrians. For locations where school crossing traffic is anticipated, the volume of student pedestrians (school age pedestrians on their way to/from school) should also be separately noted.
b) Gather or collect average daily traffic (ADT) volumes for vehicular traffic along the
major roadway at the crossing location. Step 4: Apply Data to Figure 1 and Table 1 to Determine Appropriate Treatments
a) Using the available data, utilize Figure 1 – Pedestrian Crossing Treatment Flowchart and Table 1 – Criteria for Crossing Treatments at Uncontrolled Locations (if applicable) to determine appropriate treatment(s) for signalized, stop-controlled, or uncontrolled locations.

City of Boulder Pedestrian Crossing Treatment Installation Guidelines Crossing Location Evaluation Worksheet
Step 1 – Location Description Major Street: _________________________ Crossing Location: ___________________________ Is this a multi-use path crossing? Yes No Posted Speed Limit: ______ mph Existing Traffic Control: Stop Sign Traffic Signal Uncontrolled Existing Crossing Treatments (if any): ________________________________________________
_______________________________________________________________________________ Nearby Pedestrian Generators (School, transit stop, commercial, etc.): ______________________
_______________________________________________________________________________ Step 2 – Physical Data Roadway Configuration: 2-Lane 5 Lane w/Striped Median 3-Lane w/Striped Median 5 Lane w/Raised Median 3 Lane w/Raised Median 6 Lane 4 Lane Other: _______________ Nearest Marked or Protected Pedestrian Crossing: _______________ Distance to: _______ft (For uncontrolled location only) Stopping Sight Distance (SSD) = _______ ft _______ ft. Is SSD ≥ 8x Speed Limit? Yes No If No, are improvements to SSD feasible? Yes No Step 3 – Traffic Data Pedestrian Crossing Volumes / Bicycle Crossing Volumes): AM Mid-Day PM Other
Time: to to to to
Date/Day of Week: / / / /
# of Transit Boardings (if applicable)
# of Young Peds / Bicyclists / / / /
# of Elderly Peds
# of Disabled Peds
# of Non-Y/E/D Peds / Bicyclists / / / / TOTAL PEDS (Actual) (Include All
Bicyclists in Total Sum)
TOTAL PEDS (Adjusted for 2x Y/E/D
Major Street Vehicular Volume: ADT = ______________ veh/day Step 4 – Apply Data to Figure 1 and Table 1 Recommended Treatment(s): _______________________________________________________
_______________________________________________________________________________
_______________________________________________________________________________

Iden
tify
cand
idat
e cr
ossi
ng lo
catio
nU
NC
ON
TRO
LLED
C
RO
SSIN
G
LOC
ATI
ON
CO
NTR
OLL
ED
CR
OSS
ING
LO
CA
TIO
N
Nea
rest
mar
ked
or p
rote
cted
cr
ossi
ng >
300
’aw
ay?
Adeq
uate
st
oppi
ng s
ight
di
stan
ce?
(8x
spee
d lim
it)
Go
to
Tabl
e 1
No
actio
n re
com
men
ded
Mee
ts 2
xth
e m
inim
um
pede
stria
n vo
lum
e th
resh
olds
(2) ?
Dire
ct p
eds
to
near
est m
arke
d or
pr
otec
ted
cros
sing
Dire
ct p
eds
to
near
est m
arke
d or
pr
otec
ted
cros
sing
or
con
side
r tra
ffic
sign
al o
r gra
de-
sepa
rate
d cr
ossi
ng
Stop
sig
n or
si
gnal
co
ntro
lled?
Unc
ontr
olle
d
Sign
al
Exis
ting
mar
ked
cros
swal
k?
Scho
ol
Cro
ssin
g?**
Inst
all m
arke
d cr
ossw
alk
w/ s
choo
l ped
estri
an
cros
sing
sig
n (S
1-1)
and
do
wn
arro
w (1
6-7p
) at
cros
swal
k pl
us a
dvan
ce
(S1-
1) s
igns
ADT ≥
1,50
0 vp
d?
Inst
all m
arke
d cr
ossw
alk
Mee
ts m
in.
pede
stria
n vo
lum
e th
resh
olds
(2)
?
Staf
f co
ncer
ns
abou
t driv
er
com
plia
nce
at
cros
swal
k?
Con
side
r ne
ckdo
wns
, m
edia
n re
fuge
, or
addi
tiona
l sig
ns to
in
crea
se d
river
aw
aren
ess
of
pede
stria
ns
Is lo
catio
n co
ntro
lled
or
unco
ntro
lled? Figu
re 1
–Pe
dest
rian
Cro
ssin
g Tr
eatm
ent F
low
char
t
Y Y
Y
Y
YY
N
N
NN N
Inst
all m
arke
d cr
ossw
alk
w/
adva
nce
pede
stria
n si
gns
(W11
-2)
Rem
ove
sigh
t di
stan
ce
obst
ruct
ion
or
low
er s
peed
lim
it Feas
ible
Not
Fe
asib
le
Scho
ol
Cro
ssin
g?**
Inst
all m
arke
d cr
ossw
alk
w/
scho
ol c
ross
ing
sign
on
mas
t ar
m (S
1-1)
N Y
Y
N
Y
N
N
Page 9
No
actio
n re
com
men
ded
No
actio
n re
com
men
ded
No
actio
n re
com
men
ded
Mul
ti-U
se P
ath
Cro
ssin
g?N
Y
* Yo
ung,
eld
erly
, and
dis
able
d pe
dest
rians
cou
nt 2
x to
war
ds v
olum
e th
resh
olds
** S
choo
l Cro
ssin
g de
fined
as
a cr
ossi
ng lo
catio
n th
at m
eets
min
imum
ped
estri
an v
olum
e th
resh
olds
and
has
a h
igh
conc
entra
tion
of s
tude
nt p
edes
trian
s
(2)
Min
imum
Ped
estr
ian
Volu
me
Thre
shol
ds:
-20
peds
per
hou
r* in
any
one
hou
r, or
-18
peds
per
hou
r* in
any
two
hour
s, o
r
-15
peds
per
hou
r* in
any
thre
e ho
urs
(1)Ex
cept
ions
to th
e 1,
500
vpd
min
. roa
dway
vol
ume
thre
shol
d m
ay b
e m
ade
for
Scho
ol C
ross
ings
whe
re th
e pe
ak h
our t
raffi
c ex
ceed
s 10
% o
f the
dai
ly tr
affic
Mul
ti-U
se P
ath
Cro
ssin
g?
Inst
all m
arke
d cr
ossw
alk
w/
adva
nce
pede
stria
n si
gns
(W11
-2)
Y
N
ADT ≥
1,50
0 vp
d(1)
?N
o ac
tion
reco
mm
ende
dN
Y
Mee
ts m
in.
pede
stria
n vo
lum
e th
resh
olds
(2)
?
YN
City
of B
ould
er P
edes
trian
Cro
ssin
g Tr
eatm
ent I
nsta
llatio
n G
uide
lines
Con
trol
led

City of Boulder Pedestrian Crossing Treatment Installation GuidelinesTable 1 - Criteria for Crossing Treatments at Uncontrolled Locations
≤ 30 mph
35 mph
40 mph
≥ 45 mph
≤ 30 mph
35 mph
40 mph
≥ 45 mph
≤ 30 mph
35 mph
40 mph
≥ 45 mph
≤ 30 mph
35 mph
40 mph
≥ 45 mph
A B B D A B C D B B C D B C C D
A B B D A B C D B C C D C C C D
A B B D A B C D B C C D C C C D
A B C D B C C D B C C D C C C D
A B C D B C C D B C C D C C C D
A B C D B C C D B C C D C C C D
D D D D D D D D D D D D D D D D
A Install marked crosswalk with enhanced road-side signs
B Install marked crosswalk with enhanced road-side and in-roadway (bollard mounted) signs
C
D Do not install marked crosswalk. Consider pedestrian traffic signal or grade-separated crossing.
3 Lanes w//Striped Median
4 Lanes
Specific Guidance : Install marked crosswalk with "State Law - Yield to Pedestrian" signs (for 2 or 3-lane roadways) mounted on the side of the roadway and on in-roadway bollards or median mounted signs; use standard (W11-2) advance pedestrian warning signs; use S1-1 signs for School Crossing locations. For 4 or 5 lane roadways, flashing signs and/or other adopted City of Boulder treatment for multi-lane crossings should be used. Add neckdowns (for 2-lane roadways) or median refuge islands (for 3+ lane roadways) to shorten the pedestrian crossing distance and increase pedestrian visibility to motorists.
5 Lanes w/Raised Median
5 Lanes w/Striped Median
6 Lanes
Specific Guidance : Install marked crosswalk with "State Law - Yield to Pedestrian" signs mounted on the side of the roadway and on in-roadway bollards; use standard (W11-2) advance pedestrian warning signs; use S1-1 signs for School Crossing locations.
Specific Guidance : Install marked crosswalk with "State Law - Yield to Pedestrian" signs mounted on the side of the roadway with standard (W11-2) advance pedestrian warning signs; use S1-1 signs for School Crossing locations.
Install marked crosswalk with enhanced signs and geometric improvements to increase pedestrian visibility and reduce exposure
Specific Guidance : Consider traffic signal or grade-separated crossing; application of these treatments will consider corridor signal progression, existing grades, phyiscal contraints, and other engieering factors
> 15,000 vpd
Roadway Configuration
Roadway ADT and Posted Speed
1,500- 9,000 vpd 9,000-12,000 vpd 12,000-15,000
2 Lanes
3 Lanes w/Raised Median
Page 10

City of Boulder Pedestrian Crossing Treatment Installation Guidelines Page 11
3.0 SUPPLEMENTAL POLICIES This section contains discussion of supplemental policies to guide the installation of crossing treatments in the City of Boulder. 3.1 Minimum Vehicular Volume for Treatments Recognizing the limited availability of resources to implement crossing treatments within the City, crossing treatments should generally not be installed at locations where the ADT is lower than 1,500 vehicles per day. Exceptions may be made at school crossing locations where the peak hour vehicle traffic exceeds 10% of the ADT. School crossings are defined as locations meeting the minimum pedestrian volume thresholds on Page 2 and having a significant volume of student pedestrians. Treatments for roadways with greater than 1,500 vehicles per day should be installed based on the criteria in Table 1. 3.2 Crosswalk Lighting The FHWA recommends that adequate nighttime lighting should be provided at marked crosswalks to enhance the safety of pedestrians crossing at night. Such lighting should be provided at all crosswalks in the City of Boulder, where feasible. At crosswalks in the City of Boulder where there is an expectation of night time use, adequate nighttime lighting shall be provided under all circumstances. 3.3 Avoiding Overuse of Crossing Treatments The FHWA recommends that overuse of crosswalk markings should be avoided to maximize their effectiveness. Crosswalks and sign treatments (such as the “State Law – Yield to Pedestrians” and flashing signs) should be used discriminately within the City of Boulder so that the effectiveness of these treatments is not deteriorated by overuse. Although these treatments may be effective at individual locations, overuse of these treatments city-wide may lead to a decrease in their value as drivers become desensitized to them. Minimum pedestrian and vehicular volume criteria have been established in this document with this in mind. 3.4 Multi-Use Path Crossings Crossing locations where a multi-use path crosses a roadway should automatically be considered for crossing treatments, regardless of pedestrian crossing volumes. This policy is to promote the use of multi-use paths recognizing that roadway crossings often create barriers for pedestrians and bicyclists and may contribute to a lack of use. However, the minimum vehicular volume criterion in Section 3.1 still applies for multi-use path crossing locations.

City of Boulder Pedestrian Crossing Treatment Installation Guidelines Page 12
3.5 Textured and Colored Pavement Treatments Textured, brick, and/or colored pavement treatments should typically not be used in lieu of a marked crosswalk. When such treatments are used they are often aesthetic and not considered traffic control devices. Retroreflective pavement markings are required at any location serving as a marked crosswalk. Exceptions are granted for signalized intersection crossings, right-turn bypass (raised) crossings, and for multi-use path crossings at driveways and unsignalized intersections where the City has developed procedures for utilizing blue pavement in crossings with high conflict potential. 3.6 Minimum Median Refuge Width The City of Boulder acknowledges median refuge islands as effective crossing treatments by allowing pedestrians to cross a roadway in two stages, therefore minimizing exposure. Median refuge islands used in the City of Boulder should be at least 6 feet in width to be considered a viable median refuge treatment. A median of this width will allow over two feet on each side for splash protection; it will store a group of pedestrians; and it will accommodate the storage of a bicycle without it overhanging into the traffic lanes. For multi-use path crossing locations, a 10’ median refuge width is desirable to better accommodate bicycles with child trailers, recumbent bicycles, and tandem bicycles. 3.7 Accessible Crosswalks It is the goal of the City of Boulder that all crosswalks installed will comply with the Americans with Disabilities Act (ADA) to maximize mobility for all users. Where a new crosswalk is installed in a curbed roadway, curb ramps will include a detectable warning surface. The City intends to retrofit existing non-ADA compliant curb ramps with detectable warning surfaces as part of its on-going sidewalk maintenance program. 3.8 Raised Crossings at Right-Turn Bypass Islands Raised pedestrian crossings at right-turn bypass islands meet the goals of these guidelines by improving visibility for pedestrians, improving accessibility, and helping to mitigate the speed of right-turning vehicle traffic. City staff will review all new or proposed right-turn bypass movements to determine if a raised crossing should be installed. If deemed feasible, a raised crossing will be incorporated into the design. 3.9 Removal of Treatments Conditions that contribute to the need for a crosswalk or crossing treatments may change over time, and an existing crosswalk or treatment may no longer be needed. When a roadway surface is to be impacted by reconstruction or resurfacing, a review of any unprotected crosswalks should be performed to determine their use and need. If the use of a crosswalk is less than half of that which would be required for it to be warranted based on the criteria established in these guidelines for a new installation, the crosswalk should not be replaced when the construction or resurfacing is done and any other treatments will be removed. In such cases, residents and property owners within 1000’ of walking distance to

City of Boulder Pedestrian Crossing Treatment Installation Guidelines Page 13
the crosswalk in question will be notified via mail. In addition, notices will be visibly posted for 30 days prior at the crossing location to inform the public of the intent to remove them. City contact information will be provided on these mailings and notices. Should concerns arise from the public as a result of that mailing or from the notification sign at the crosswalk, staff may then begin a more substantial public process with concerned parties.

City of Boulder Pedestrian Crossing Treatment Installation Guidelines Page 14
4.0 NEXT STEPS The City of Boulder is committed to providing safe and effective pedestrian crossing treatments and will continue to evaluate the criteria and treatments being used to implement treatments throughout the City. Specifically, City staff will carry out the following “Next Steps” to ensure that the pedestrian crossing treatment program meets the goals defined in this document:
Continue testing and evaluation of new multi-lane crossing treatments. These treatments may include variations and/or combinations of the existing pedestrian-activated flashing signs with “State Law – Yield to Pedestrians” along with signs and/or audible devices to increase both driver and pedestrian awareness at crosswalks. Passive detection devices, such as microwave or video detection may also be tested. As performed for existing devices in the City, evaluation of new devices will include both the effectiveness of devices and a safety (accident history) analysis. Although operational impacts can be evaluated within months of installation of a treatment, it should be noted that safety analysis will require years of accident data to provide relevant results.
Stay current with the latest pedestrian crossing research being performed at the federal, state, and municipal level. As more communities strive to increase the viability of pedestrian mode use additional studies and new findings are being made available. The City of Boulder will look to utilize this research to improve its own use of pedestrian crossing treatments.
Continue to receive feedback from City of Boulder citizens with respect to various crossing treatments and the criteria established in this document to implement these treatments.
Continue to work with the Transportation Advisory Board and City Council to implement policies, including these guidelines and any future amendments to this document, to promote the use of pedestrian facilities and the safety of people using them.
Coordinate with the State of Colorado to modify current state law to include the curb ramp area the definition of a legal crosswalk so that it is clear that a motorist should yield to a pedestrian waiting to cross at a crosswalk.
Develop an implementation plan to upgrade existing, qualifying crossing locations with “State Law – Yield to Pedestrians” signs as prescribed in this document.
Continue to evaluate the effectiveness of raised crossings at right-turn bypass islands and work to develop a city-wide policy for application of these treatments.
Collect data at crossing locations where treatments have been requested (or as defined in the Transportation Master Plan) and apply the criteria in this document to create a list of projects for implementation. Staff will then prioritize the list of projects and perform crossing treatment installations based on funding availability.

City of Boulder Pedestrian Crossing Treatment Installation Guidelines Page 15
Bibliography
1 Zegeer, C.V., Stewart, R.J., Huang, H.H., Lagerwey, P.A. Safety Effects of Marked vs. Unmarked Crosswalks at Uncontrolled Locations: Executive Summary and Recommended Guidelines, FHWA RD-01-075. Federal Highway Administration, Washington D.C., February 2002. 2 Institute of Transportation Engineers. Design and Safety of Pedestrian Facilities. Washington, D.C., March 1998. 3 Smith, Steven A., Knoblauch, Richard L. Guidelines for the Installation of Crosswalk Markings. Transportation Research Record 1141, Transportation Research Board, National Research Council, Washington, D.C., 1987. 4 Dougald, Lance E. Development of Guidelines for the Installation of Marked Crosswalks. Virginia Transportation Research Council, Charlottesville, Virginia. December 2004.
5 City of San Jose, California, Department of Transportation. Guidelines for the Installation and Removal of Marked Crosswalks. April 2005.
6 Lalani Nazir and the ITE Pedestrian and Bicycle Task Force. Alternative Treatments for At-Grade Pedestrian Crossings. Institute of Transportation Engineers. 2001.

Appendix A
Summary of Applicable Technical Literature Review

A1
Design and Safety of Pedestrian Facilities Institute of Transportation Engineers March 1998 Description: Provides guidance for the design and safety of pedestrian facilities and was approved in June 1997 as a Recommended Practice of the Institute of Transportation Engineers. Builds on MUTCD policies and guidelines. Key Findings and Recommendations Applicable to this Project: • Engineering judgment is the most useful tool when determining the need for
crosswalk markings • Overuse of crosswalks should be avoided to maximize the effectiveness of those that
are marked • Marked crosswalks are generally recommended at the following locations:
- signalized intersections with pedestrian signal indications or substantial crossings - where a marked crosswalk can concentrate or channelized multiple pedestrian
crossings to a single location - where there is a need to delineate the optimal crossing location when it is unclear
because of confusing geometrics or traffic operations - at approved school crossings or for crossings on recommended safe school
routes - at other locations with significant pedestrian crossings and pedestrian-vehicle
conflicts • Crosswalk installation should also consider the following factors:
- adequate sight distance - crosswalks should not be located immediately downstream from bus stops - an examination of street lighting should be conducted. It is advantageous to
locate a marked crosswalk at a streetlight, particularly if nighttime crossings are common.
- When possible, it is best to mark crosswalks at 90 degrees to vehicle traffic to designate the shortest path for pedestrians and to avoid having the pedestrians back turned to oncoming traffic
• Criteria developed by Steven A. Smith and Richard L. Knoblauch (1987) can be used
to indicate locations where the benefits of a marked crosswalk may outweigh possible disadvantages (shown on following page)
• Cites the following criteria for grade-separated crossings (developed by Axler in
1984): - Pedestrian hourly volume should be greater than 300 in the four highest
continuous hour periods if the vehicle speed is > 40 mph in urban areas; otherwise 100 pedestrians in the four highest continuous hour periods

A2
- Vehicular volume should be more than 10,000 in the same four-hour period or the roadway should have an ADT > 35,000 vpd if vehicle speeds are over 40 mph in urban areas. If these two conditions are not met, the vehicle volume should be more than 7,500 in the four hours or have an ADT > 25,000 vpd.
Source: Institute of Transportation Engineers. Design and Safety of Pedestrian Facilities. Washington, D.C., 1998.
A3
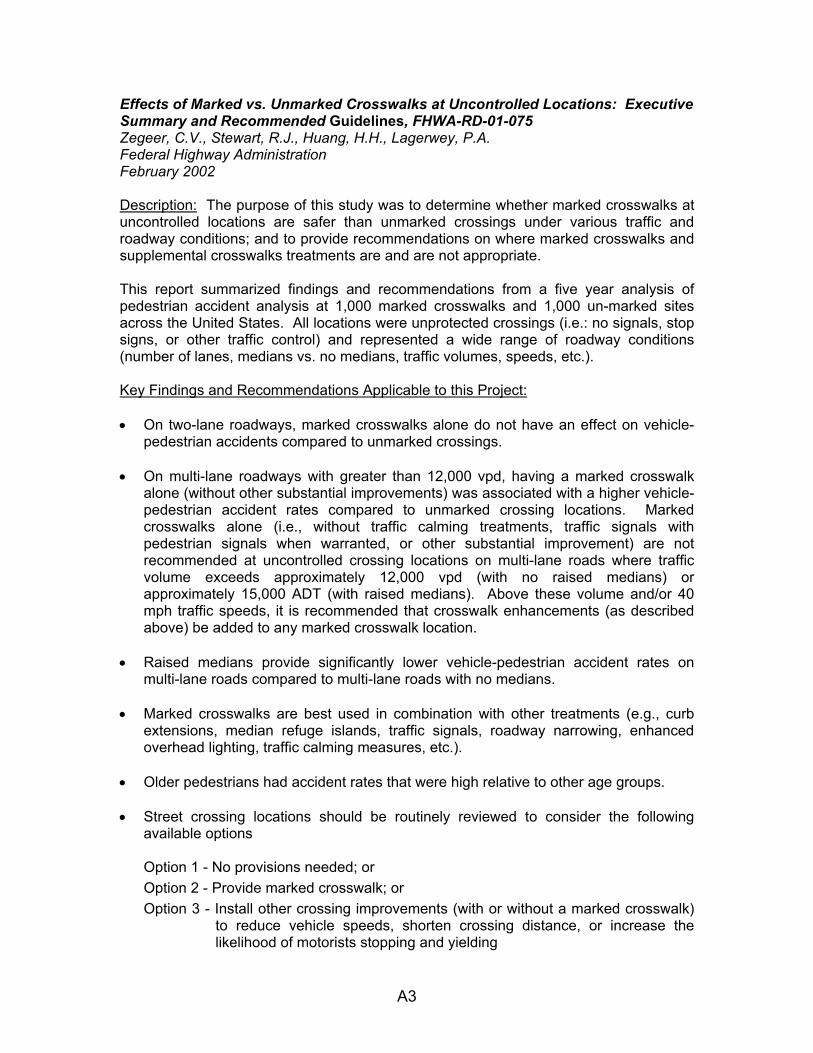
Effects of Marked vs. Unmarked Crosswalks at Uncontrolled Locations: Executive Summary and Recommended Guidelines, FHWA-RD-01-075 Zegeer, C.V., Stewart, R.J., Huang, H.H., Lagerwey, P.A. Federal Highway Administration February 2002 Description: The purpose of this study was to determine whether marked crosswalks at uncontrolled locations are safer than unmarked crossings under various traffic and roadway conditions; and to provide recommendations on where marked crosswalks and supplemental crosswalks treatments are and are not appropriate. This report summarized findings and recommendations from a five year analysis of pedestrian accident analysis at 1,000 marked crosswalks and 1,000 un-marked sites across the United States. All locations were unprotected crossings (i.e.: no signals, stop signs, or other traffic control) and represented a wide range of roadway conditions (number of lanes, medians vs. no medians, traffic volumes, speeds, etc.). Key Findings and Recommendations Applicable to this Project: • On two-lane roadways, marked crosswalks alone do not have an effect on vehicle-
pedestrian accidents compared to unmarked crossings. • On multi-lane roadways with greater than 12,000 vpd, having a marked crosswalk
alone (without other substantial improvements) was associated with a higher vehicle-pedestrian accident rates compared to unmarked crossing locations. Marked crosswalks alone (i.e., without traffic calming treatments, traffic signals with pedestrian signals when warranted, or other substantial improvement) are not recommended at uncontrolled crossing locations on multi-lane roads where traffic volume exceeds approximately 12,000 vpd (with no raised medians) or approximately 15,000 ADT (with raised medians). Above these volume and/or 40 mph traffic speeds, it is recommended that crosswalk enhancements (as described above) be added to any marked crosswalk location.
• Raised medians provide significantly lower vehicle-pedestrian accident rates on
multi-lane roads compared to multi-lane roads with no medians. • Marked crosswalks are best used in combination with other treatments (e.g., curb
extensions, median refuge islands, traffic signals, roadway narrowing, enhanced overhead lighting, traffic calming measures, etc.).
• Older pedestrians had accident rates that were high relative to other age groups. • Street crossing locations should be routinely reviewed to consider the following
available options
Option 1 - No provisions needed; or Option 2 - Provide marked crosswalk; or Option 3 - Install other crossing improvements (with or without a marked crosswalk)
to reduce vehicle speeds, shorten crossing distance, or increase the likelihood of motorists stopping and yielding

A4
• In some situations, installing a marked crosswalk may help consolidate multiple crossing points. Engineering judgment should be used to installed crosswalks at preferred crossing locations (e.g., at a crossing location with a streetlight as opposed to an unlit crossing nearby).
• Higher priority should be placed on providing crosswalk where pedestrian volume
exceeds about 20 per peak hour (or 15 or more elderly and/or children per peak hour).
• Recommended measures to supplement marked and unmarked crossing locations:
- Raised medians / pedestrian refuge islands (minimum 4’ wide) - Installing traffic signals (with pedestrian signals), where warranted - Reducing the crossing distance for pedestrians (curb extensions) - Traffic calming measures to slow vehicle speeds - Providing adequate nighttime lighting at crossing locations - Using various pedestrian warning signs, flashers, and other traffic control
devices to supplement marked crosswalks • For marked crosswalks in an uncontrolled, multi-lane situation, consideration of an
advance stop line is recommended at a point up to approximately 30ft in advance of the crosswalk along with the sign “STOP HERE FOR CROSSWALK”.
• Parking should be removed on the approach to uncontrolled crosswalks to improve
vision between pedestrians and motorists. • The current MUTCD pedestrian signal warrant should be reviewed to determine
whether the warrant should be modified to more easily allow for installing a traffic signal at locations were pedestrian cannot safely cross the street.
• There should be continued research, development, and testing/explanation of
innovative traffic control and roadway design alternatives that could provide improved access and safety for pedestrians attempting to cross streets (e.g., in-pavement warning lights, variations in pedestrian warning and regulatory signs, etc.).
• Table 1 on the following page provides recommendations for what conditions are
appropriate for marked crosswalks and other treatments

A5
Source: Safety Effects of Marked vs. Unmarked Crosswalks at Uncontrolled Locations. Zegeer, C.V., Stewart, R.J., Huang, H.H., Lagerwey, P.A. FHWA . 2002.

A6
Guidelines for the Installation and Removal of Marked Crosswalks City of San Jose, California, Department of Transportation April 2005. Description: Guidelines for installation and removal of marked crosswalks in the City of San Jose, CA. Key Findings and Recommendations Applicable to this Project: • All of the following indicators of need should be met when considering the installation
of a marked crosswalk:
1. At least 15 pedestrians crossing the street during the highest one-hour period or 25 pedestrians crossing during the highest consecutive two-hour period.
2. The crossing is on a direct route to/from a significant generator of pedestrian
traffic such as a school, or within 1,000 feet of a park, community center, commercial district, or transit facility.
3. During the peak five-minute period of pedestrian crossing, there are less than
five gaps in traffic where a pedestrian has sufficient time to cross the street without impeding approaching vehicles.
• Crosswalk enhancements may be required where any of the following indicators are
present:
1. Two-lane roadway with 5,000 ADT or higher 2. One direction roadway, with three or more travel lanes 3. Two direction roadway, with two or more travel lanes in one direction 4. Posted speed greater than 35 mph 5. Sight distance of pedestrians by motorists is less than 10 times the speed limit
• Enhancements may include:
1. Higher visibility crosswalk markings and warning signs 2. Textured pavement within crosswalks 3. Curb extensions to reduce the width of the pedestrian crossing 4. Pedestrian refuge areas 5. Pedestrian activated warning lights

A7
Development of Guidelines for the Installation of Marked Crosswalks Dougald, Lance E. Virginia Transportation Research Council December 2004 Description: Guidelines for the installation of marked crosswalks for the Virginia Department of Transportation and supporting research summary. Generally follows the recommendations of the Safety Effects of Marked vs. Unmarked Crosswalks at Uncontrolled Locations FHWA document, with modifications. Key Findings and Recommendations Applicable to this Project: • The MUTCD provides little guidance on the installation of marked crosswalks,
especially at locations other than intersections (i.e., mid-block locations) • At controlled locations (traffic signals, stop sign, or yield control), crosswalk markings
should be considered on all approaches near pedestrian generators. The installation of stop lines at crosswalk locations controlled by traffic signals or stop signs is recommended as effective measure in reducing vehicle encroachments on the crosswalk. Where crash data or observations of conflicts identify a crosswalk of particular concern, consider special treatments and warning signs. Special treatments at controlled intersections include traffic signal enhancements, pavement stencils to alert pedestrians, advance stop/yield lines, and geometric improvements.
• At uncontrolled locations (such as mid-block locations), crosswalk markings should
be considered only after an engineering study is completed and all of the following criteria are met:
1. The crosswalk would serve 20 pedestrians per hour during the peak hour, 15
elderly and/or children per hour, or 60 pedestrians for the highest consecutive 4-hour period; or the crossing is on a direct route form a pedestrian generator such as a school, library, hospital, senior center, shopping center, park, employment center, and transit center or service.
2. The location is 300 feet or more from another crossing location or a controlled crossing location.
3. The location has sufficient sight distance (sight distance in feet should be greater
than 10 times the speed limit) and/or sight distance will be improved prior to crosswalk marking.
4. Safety considerations do not preclude a crosswalk.
• Figure B3 (shown on the following page) was adopted from the City of Stockton, CA,
and illustrates the flowchart recommended for justifying installation of marked crosswalks at uncontrolled locations
• Table 1 (shown on the subsequent page) from the 2002 FHWA study was adopted
and modified. This table provides different “Levels” of treatments to enhance marked crosswalk locations (Level 1-5 ascending in application of lower-to higher potential vehicle-pedestrian conflicts).

A8
Source: Development of Guidelines for the Installation of Marked Crosswalks. Dougald, Lance E. Virginia Transportation Research Council. 2004.

A9
Source: Development of Guidelines for the Installation of Marked Crosswalks. Dougald, Lance E. Virginia Transportation Research Council. 2004.

A10
Level 1 Devices:
- standard crosswalk - raised mid-block crosswalk - rumble strips
Level 2 Devices:
- high-visibility crosswalks (retroreflective white markings and textured pavements)
Level 3 Devices:
- refuge islands - split pedestrian crossover (SPXO) (mid-block crossing with a refuge
island configured such that it forces pedestrians to face traffic before crossing each leg)
- bulb-outs (curb extensions, both mid-block and at intersections)
Level 4 Devices: - overhead signs and flashing beacons (pedestrian actuation
recommended) - in-roadway warning lights (IRWL)
Level 5 Devices:
- pedestrian actuated traffic signals - grade-separated crossings

A11
Pedestrian Crosswalk Case Studies, FHWA-RD-00-103 Knoblauch, R.L.., Nitzburg, M., Seifert, R.F., Federal Highway Administration August 2001. Description: Before & after field studies of crosswalk markings at 11 locations in 4 U.S. cities to determine the effect of markings on driver and pedestrian behavior at unsignalized intersections. Behavior observed included: pedestrian crossing location, vehicle speeds, driver yielding, and pedestrian crossing behavior. Key Findings and Recommendations Applicable to this Project: • Drivers approach a pedestrian in a marked crosswalk somewhat slower than at
unmarked crossing locations • Crosswalk usage increases after marking are installed • No evidence was found indicating that pedestrians behave less vigilantly in a marked
crosswalk • No changes were found in driver yielding or pedestrian assertiveness with markings
vs. no markings • Marking pedestrian crosswalks at relatively low-speed, low-volume unsignalized
intersections is a desirable practice

A12
Alternative Treatments for At-Grade Pedestrian Crossings Lalani, Nazir and the ITE Pedestrian and Bicycle Task Force Institute of Transportation Engineers 2001 Description: Provides an overview of various alternative crossings treatments at controlled and uncontrolled locations. Summarizes techniques being used in other countries in addition to results from various studies performed by public agencies related to vehicle-pedestrian accidents. Key Findings and Recommendations Applicable to this Project:
• Provides information for various treatments being applied in the U.S., Canada,
Europe, and Australia intended to reduce the potential for vehicle-pedestrian accidents at marked crosswalk locations. Information includes: costs, typical applications, advantages, disadvantages, related studies, and example applications.
• Alternative treatments types and devices discussed this document include:
− Automated detection − Curb extensions − Curb ramps − Flags − Flashing beacons − In-roadway signs − Lane reductions − Markings and legends − Overhead signs − Pedestrian railings − Raised markers (with LEDs) − Refuge islands − Street lighting − Pavement treatments
• Discusses the removal of crosswalks and crosswalk treatments at marked locations
and cites studies which show a decrease in vehicle-pedestrian accidents with such removal. Acknowledges that removal does not support pedestrian mobility.

A13
Advance Yield Markings Reduce Motor Vehicle/Pedestrian Conflicts at Multilane Crosswalks with an Uncontrolled Approach Von Houten, R., Malenfant, J.E. Center for Education and Research in Safety. Halifax, Nova Scotia, Canada. 2002. Description: Field study to evaluate the effects of advance yield markings and a symbol sign prompting motorists to yield to pedestrians on pedestrian safety at multi-lane crosswalks with pedestrian-activated yellow flashing beacons. Key Findings and Recommendations Applicable to this Project:
• Advance yield markings and signage resulted in vehicles stopping further away from
the crosswalk to yield to pedestrians and resulted in less vehicle-pedestrian conflicts. • Markings and the sign together were more effective than sign alone.

A14
Florida Pedestrian Planning and Design Handbook Florida Department of Transportation Prepared by University of North Carolina Highway Safety Research Center April 1999. Description: Comprehensive guidelines, standards, and criteria for the planning, design, construction, operation, and maintenance of pedestrian facilities in the State of Florida. Provides guidelines for the installation of marked crosswalks and mid-block crossing treatments. Key Findings and Recommendations Applicable to this Project: • Uses ITE guidelines as a basis for establishing criteria for recommended marked
crosswalk locations • Recommended marking crosswalks at locations with more than 25 pedestrians per
hour • Recommends marking crossings “to reach channelized islands when the volume of
pedestrians times the number of vehicles exceeds 800 per hour. Do not use crosswalks at lower levels of conflict”.
• A raised median island should be considered as a minimum enhancement for mid-
block crossings and may be essential on multi-lane roadways. • Medians are cheaper to build and maintain than two-way-left-turn-lanes.

A15
Transportation Access Management Guidelines City of Tucson, Arizona March 2003. Description: Policy document providing guidelines for access management for the City of Tucson, AZ. Key Findings and Recommendations Applicable to this Project: • Provides criteria for the installation of HAWK, pelican, and toucan crossing treatments High Intensity Activated CrossWalk (HAWK). Operates similar to standard mid-block
pedestrian signal except that it is only in operation when actuated by a pedestrian. Includes a red-yellow-red signal head that provides varying flashing modes to control vehicular traffic during a crossing event. Locations considered for the installation of HAWK devices should generally meet the following criteria:
1. Meet the Arizona State warrant for consideration of marked crosswalk, and 2. Meet the FHWA Traffic Control Devices Handbook guidelines for beacons at
school crossings, i.e. Pedestrian volume of 40 to 60 pedestrians crossing during a 2-hour period of a normal day; Where the 85th percentile vehicle speed is in excess of 35 mph (Note: Vehicle speed refers to the speed of vehicles approaching the beacon), and
3. There is no other crossing controlled by a traffic signal, stop sign or crossing guard within 600 feet of the proposed location, and
4. If a school crossing, the intersection is identified on the "School Route Plan" and/or has a significant number of special needs pedestrians
TOUCAN Crossing (Two Can Cross). Combined pedestrian and bicycle crossing using a combination of vehicular signalized traffic control and both pedestrian and bicycle signal indications. Locations considered for the installation TOUCAN crossings should generally meet the following criteria 1. Meet the Arizona State warrant for consideration of marked crosswalk, and 2. Meet an MUTCD warrant for consideration of a traffic signal: Warrant 1 – Eight-
Hour Vehicular Volume, Warrant 2 - Four-Hour Vehicular Volume, Warrant 3 - Peak-Hour, Warrant 4 - Ped Crossing, or Warrant 5 - School Crossing, and
3. Installation is in conformance with the Tucson Roadway Development Policy Ordinance, and
4. Ability to install barrier islands to prohibit all motor vehicle traffic crossing the street and only right turns are permitted
PELICAN Crossing (PEdestrian LIght ACtuAtioN). Similar to a traditional mid-block pedestrian signal. Includes a flashing amber phase for vehicles towards the end of the protected pedestrian phase which vehicles may proceed through the crosswalk if not occupied by a pedestrian. Locations considered for the installation of PELICAN crossings devices should generally meet the following criteria: 1. Meet the Arizona State warrant for consideration of marked crosswalk, and

A16
2. Meet an MUTCD warrant for consideration of a traffic signal installation: Warrant 4 - Pedestrian Crossing or Warrant 5 - School Crossing, and
3. Spacing is not in violation of the Tucson Roadway Development Policy Ordinance, and
4. If designed as a school crossing the location is on the "School Route Plan", and
5. The proposed location is not within 600 feet of another signalized crossing or STOP sign or flashing beacon and sign crossing.

Appendix B
Crossing Treatment “Demonstration Device” Evaluations

B1
Pedestrian Crossing Treatments “Demonstration Devices” Summary of Effectiveness Results
Table A: Compliance Results – Pedestrian actuated flashing signs
Location Year
Installed
Vehicle Volume (daily) *
Pedestrian Volume (3 peak hours)
Yield Compliance
(Before)
Yield Compliance
(After)
Percent Increase
Pearl (2900 Block) 10/00 24,000 70 26% 54% +110% Canyon & 11th Street 01/01 19,000 460 38% 80% +110% Broadway & Pleasant 07/01
removed 10/04
39,000 530 16% 71% +340%
Broadway & 18th Street 07/01 43,000 440 23% 78% +240% Pearl west of 48th Street 01/02
removed 07/03
18,000 10 0% 9% Infinite
Folsom & Walnut 06/02 23,000 100 11% 54% +390% Broadway & Norwood 09/02 17,000 20 6% 60% +900% Valmont & Center Green 07/03 24,000 10 6% 83% +1280% Canyon & 19th Street 02/04 24,000 80 10% 55% +450% Broadway & 17th Street 10/04 43,000 180 42% 67% +60% Canyon & 10th Street ** 02/05 19,000 No Data No Data No Data n/a * - Many of the daily traffic volumes have been estimated from peak-hour turning movement counts and should be considered approximations. ** - Data collection has not yet occurred.

B2
Table B: Compliance Results – “State Law – Yield to Pedestrians” signing
Location
Vehicle Volume (daily) *
Pedestrian
Volume (3 peak hours)
Yield
Compliance (Before)
Yield
Compliance (After)
Percent Increase
9th Street & Walnut 10,000 190 54% 93% +72% 9th Street & Hawthorne ----- ----- ----- ----- ----- 19th Street & Sumac 3,000 50 96% * * n/a University & 15th Street 10,000 180 47% 69% +47% University & 17th Street 10,000 170 68% 89% +31% Iris & 15th Street 20,000 10 5% 50% +900% Arapahoe & 13th Street 14,000 140 34% 65% +91% Arapahoe & 11th Street 12,000 130 38% 70% +84% Alpine west of Broadway
5,000 550 91% 90% 0%
Mapleton & 8th Street ----- 70 82% 87% +6% 19th Street & Norwood 3,000 40 24% 33% +38% Greenbriar & Chambers
----- ----- ----- ----- -----
Walnut & 16th Street 3,000 140 25% * * n/a 19th Street & Upland ----- ----- ----- ----- ----- Pearl & 19th Street 12,000 80 21% 66% +214% Linden & 4th Street 3,000 100 45% 81% +80% Folsom south of Arapahoe
14,000 50 28% * * n/a
Spruce & 21st Street ----- ----- ----- ----- ----- 14th Street & Mapleton ----- ----- ----- ----- ----- Walnut & 10th Street ----- ----- ----- ----- ----- Pine & 21st Street ----- ----- ----- ----- ----- College & 8th Street ----- ----- ----- ----- ----- 20th Street & Spruce ----- ----- ----- ----- ----- 17th Street & Marine ----- ----- ----- ----- ----- 17th Street & Grove ----- ----- ----- ----- ----- * - Many of the daily traffic volumes have been estimated from peak-hour turning movement counts and should be considered approximations. * * - Data collection has not yet occurred.

B3
Pedestrian Crossing Treatments “Demonstration Devices” Summary of Accident Trends
Accident Descriptions Rear-end auto: This accident involved a motor vehicle stopping for a pedestrian or bicyclist in the crosswalk and being struck from behind by another motor vehicle. Bike/ped - auto: This accident involved a pedestrian or bicyclist entering the crosswalk and being struck by a motor vehicle that did not yield to them. Injury: This accident resulted in at least one person being injured. These accidents were either “rear-end auto” collisions or “bike/ped - auto” collisions. Pedestrian-actuated Flashing Signs Intersection: Pearl Street east of 28th Street (Installation Date: October 2000) Before condition studied: January 1999 to October 2000 (22 months) After condition studied: November 2000 to December 2004 (50 months) Average Yearly Accidents
Accident Type Before Condition After Condition Change
(%) Rear-end auto 0.5 1.4 164%Bike/ped-auto 0.0 0.7 -- Total 0.5 2.2 296%Injury 0.5 1.4 164%
Intersection: Canyon Boulevard and 11th Street (Installation Date: January 2001) Before condition studied: January 1999 through January 2001 (25 months) After condition studied: February 2001 through December 2004 (47 months) Average Yearly Accidents
Accident Type Before Condition After Condition Change
(%) Rear-end auto 2.9 3.8 33%Bike/ped-auto 1.0 0.3 -73%Total 3.8 4.1 6%Injury 1.0 1.5 60%

B4
Intersection: Broadway & Pleasant (Installation Date: July 2001) Before condition studied: January 1999 to July 2001 (31 months) After condition studied: August 2001 to October 2004 (39 months) Average Yearly Accidents
Accident Type Before Condition After Condition Change
(%) Rear-end auto 1.5 11.1 615%Bike/ped-auto 0.4 0.9 138%Total 1.9 12.0 520%Injury 0.4 3.1 695%
Intersection: Broadway & 18th Street (Installation Date: July 2001) Before condition studied: January 1999 to July 2001 (31 months) After condition studied: August 2001 to December 2004 (41 months) Average Yearly Accidents
Accident Type Before Condition After Condition Change
(%) Rear-end auto 10.1 9.7 -4%Bike/ped-auto 0.4 1.5 278%Total 10.5 11.1 6%Injury 3.1 3.5 13%
Intersection: Folsom Avenue & Walnut Street (Installation Date: June 2002) Before condition studied: January 1999 to March 2002 (41 months) After condition studied: June 2002 to December 2004 (31 months) Average Yearly Accidents
Accident Type Before Condition After Condition Change
(%) Rear-end auto 0.9 1.9 120%Bike/ped-auto 0.6 0.4 -34%Total 1.5 2.3 59%Injury 0.6 1.5 165%

B5
Intersection: Broadway & Norwood Avenue (Installation Date: September 2002) Before condition studied: January 1999 to August 2002 (44 months) After condition studied: September 2002 to December 2004 (28 months) Average Yearly Accidents
Accident Type Before Condition After Condition Change
(%) Rear-end auto 0.0 0.4 -- Bike/ped-auto 0.0 0.0 -- Total 0.0 0.4 -- Injury 0.0 0.4 --
Intersection: Valmont Road & Center Green (Installation Date: July 2003) Before condition studied: January 2001 to July 2003 (31 months) After condition studied: August 2003 to July 2005 (24 months) Average Yearly Accidents
Accident Type Before Condition After Condition Change
(%) Rear-end auto 0.4 0.0 -100%Bike/ped-auto 0.0 0.0 -- Total 0.4 0.0 -100%Injury 0.0 0.0 --
Intersection: Canyon Boulevard & 19th Street (Installation Date: February 2004) Before condition studied: January 2001 to February 2004 (38 months) After condition studied: March 2004 to July 2005 (17 months) Average Yearly Accidents
Accident Type Before Condition After Condition Change
(%) Rear-end auto 0.9 2.1 124%Bike/ped-auto 0.6 1.4 124%Total 1.6 3.5 124%Injury 1.6 2.8 79%

B6
Intersection: Lee Hill & 5th Street (Installation Date: September 2003) Before condition studied: January 1999 to September 2003 (57 months) After condition studied: October 2003 to December 2004 (15 months) Average Yearly Accidents
Accident Type Before Condition After Condition Change
(%) Rear-end auto 0.0 0.0 -- Bike/ped-auto 0.0 0.0 -- Total 0.0 0.0 -- Injury 0.0 0.0 --

B7
“State Law – Yield to Pedestrians” signs and bollards Intersection: 9th Street and Walnut Avenue (Installation Date: August 2000) Before condition studied: January 1999 to October 2001 (34 months) After condition studied: November 2001 to December 2004 (38 months) Average Yearly Accidents
Accident Type Before Condition After Condition Change
(%) Rear-end auto 0.0 1.3 -- Bike/ped-auto 0.0 1.0 -- Total 0.0 2.3 -- Injury 0.0 1.6 --
Intersection: 19th Street & Sumac Avenue (Installation Date: August 2000) Before condition studied: January 1999 to August 2000 (20 months) After condition studied: September 2000 to December 2004 (52 months) Average Yearly Accidents
Accident Type Before Condition After Condition Change
(%) Rear-end auto 0.0 0.0 -- Bike/ped-auto 0.0 0.0 -- Total 0.0 0.0 -- Injury 0.0 0.0 --
Intersection: University Avenue and 15th Street (Installation Date: December 2000) Before condition studied: January 1999 to December 2000 (24 months) After condition studied: January 2001 to December 2004 (48 months) Average Yearly Accidents
Accident Type Before Condition After Condition Change
(%) Rear-end auto 1.0 0.5 -50%Bike/ped-auto 0.0 0.0 -- Total 1.0 0.5 -50%Injury 0.5 0.0 -100%

B8
Intersection: University Avenue and 17th Street (Installation Date: December 2000) Before condition studied: January 1999 to December 2000 (24 months) After condition studied: January 2001 to December 2004 (48 months) Average Yearly Accidents
Accident Type Before Condition After Condition Change
(%) Rear-end auto 0.0 0.2 -- Bike/ped-auto 0.0 0.0 -- Total 0.0 0.2 -- Injury 0.0 0.0 --
Intersection: Arapahoe Avenue & 13th Street (Installation Date: September 2001) Before condition studied: January 1999 to August 2001 (32 months) After condition studied: September 2001 to December 2004 (40 months) Average Yearly Accidents
Accident Type Before Condition After Condition Change
(%) Rear-end auto 2.3 0.6 -74%Bike/ped-auto 0.0 0.4 -- Total 2.3 1.0 -57%Injury 0.7 0.4 -43%
Intersection: Arapahoe Avenue & 11th Street (Installation Date: September 2001) Before condition studied: January 1999 to August 2001 (32 months) After condition studied: September 2001 to December 2004 (40 months) Average Yearly Accidents
Accident Type Before Condition After Condition Change
(%) Rear-end auto 0.0 0.0 -- Bike/ped-auto 0.0 0.4 -- Total 0.0 0.4 -- Injury 0.0 0.4 --
B9
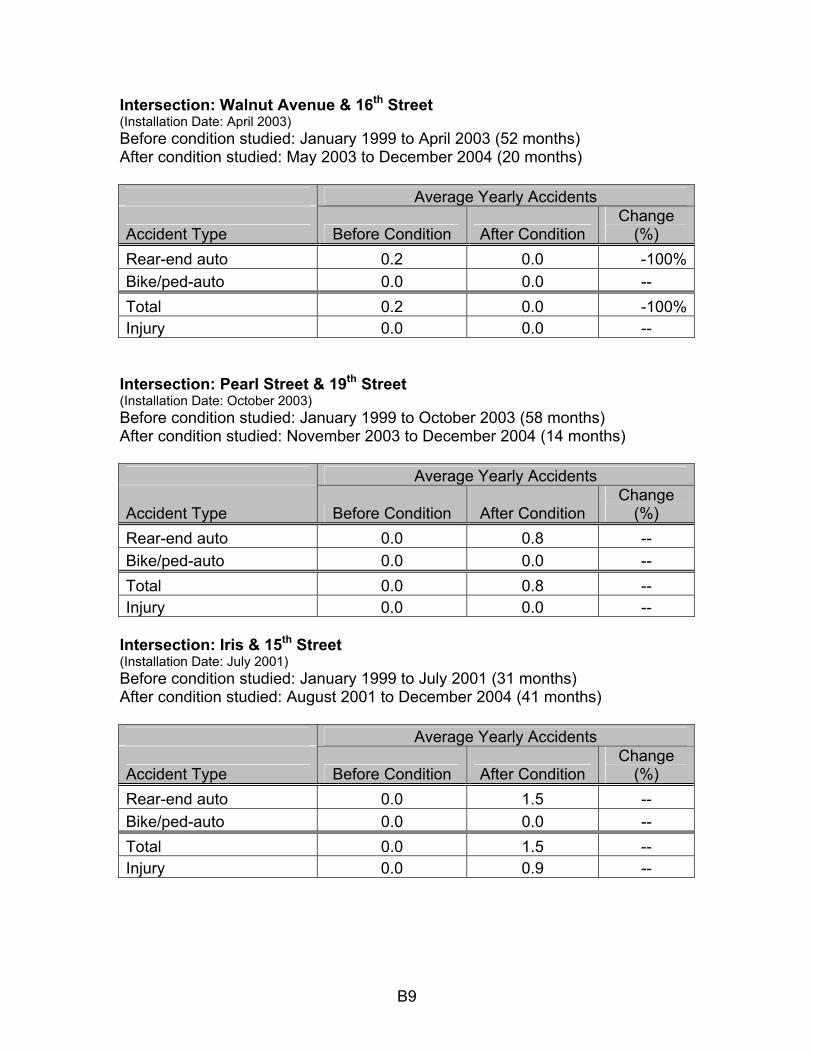
Intersection: Walnut Avenue & 16th Street (Installation Date: April 2003) Before condition studied: January 1999 to April 2003 (52 months) After condition studied: May 2003 to December 2004 (20 months) Average Yearly Accidents
Accident Type Before Condition After Condition Change
(%) Rear-end auto 0.2 0.0 -100%Bike/ped-auto 0.0 0.0 -- Total 0.2 0.0 -100%Injury 0.0 0.0 --
Intersection: Pearl Street & 19th Street (Installation Date: October 2003) Before condition studied: January 1999 to October 2003 (58 months) After condition studied: November 2003 to December 2004 (14 months) Average Yearly Accidents
Accident Type Before Condition After Condition Change
(%) Rear-end auto 0.0 0.8 -- Bike/ped-auto 0.0 0.0 -- Total 0.0 0.8 -- Injury 0.0 0.0 --
Intersection: Iris & 15th Street (Installation Date: July 2001) Before condition studied: January 1999 to July 2001 (31 months) After condition studied: August 2001 to December 2004 (41 months) Average Yearly Accidents
Accident Type Before Condition After Condition Change
(%) Rear-end auto 0.0 1.5 -- Bike/ped-auto 0.0 0.0 -- Total 0.0 1.5 -- Injury 0.0 0.9 --

B10
Intersection: Folsom south of Arapahoe (Installation Date: January 2004) Before condition studied: January 1999 to January 2004 (61 months) After condition studied: February 2004 to December 2004 (11 months) Average Yearly Accidents
Accident Type Before Condition After Condition Change
(%) Rear-end auto 1.4 2.2 +57% Bike/ped-auto 0.0 0.0 -- Total 1.4 2.2 +57% Injury 0.6 1.1 +83%
Intersection: Linden & 4th Street (Installation Date: November 2003) Before condition studied: January 1999 to November 2003 (59 months) After condition studied: December 2003 to December 2004 (13 months) Average Yearly Accidents
Accident Type Before Condition After Condition Change
(%) Rear-end auto 0.0 0.0 -- Bike/ped-auto 0.0 0.0 -- Total 0.0 0.0 -- Injury 0.0 0.0 --