Embed Size (px)
DESCRIPTION
Making space for water Integrated Urban Drainage pilots River Aire Strategic Studies Preliminary results. City of Bradford Metropolitan District Council Leeds City Council Yorkshire Water Environment Agency Pennine Water Group, Universities of Bradford and Sheffield. The challenge. - PowerPoint PPT Presentation
Citation preview
Making space for waterIntegrated Urban Drainage pilots
River Aire Strategic StudiesPreliminary results
City of Bradford Metropolitan District Council
Leeds City Council
Yorkshire Water
Environment Agency
Pennine Water Group, Universities of Bradford and Sheffield

The challenge
To provide information to facilitate a sea change in behaviour
What if?
• The global carbon economy continues to expand unabated until constrained by the economies of scarcity?
• Densification of our urban areas continues at the same rate as it has done for the past 50 years?
• The management of our urban drainage systems continues as it has done for the past 50 years?
Pressures
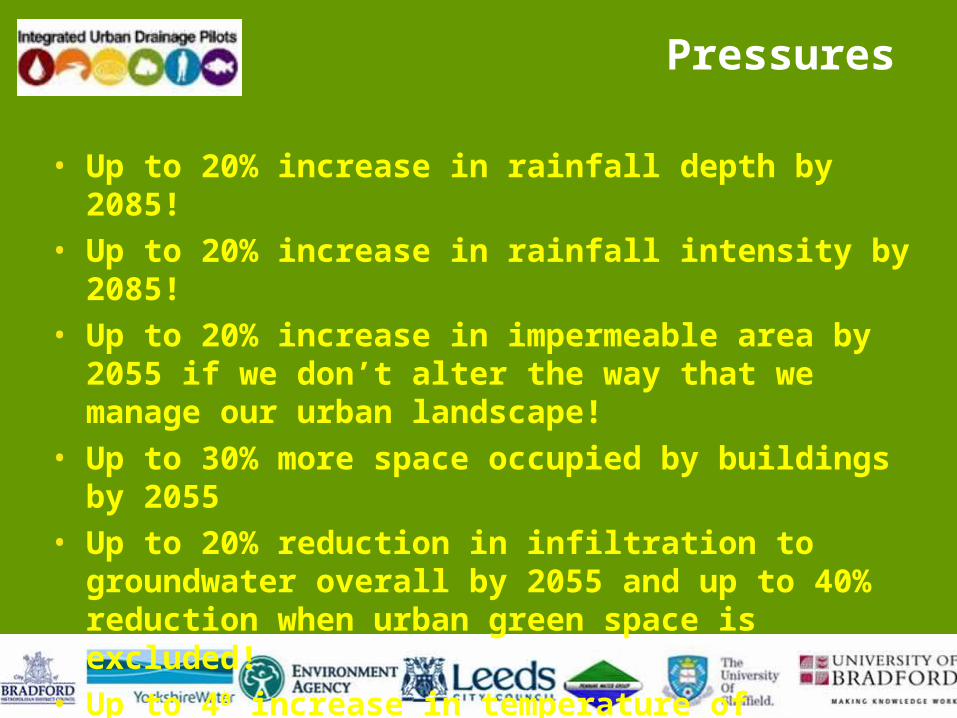
• Up to 20% increase in rainfall depth by 2085!• Up to 20% increase in rainfall intensity by 2085!• Up to 20% increase in impermeable area by 2055 if we
don’t alter the way that we manage our urban landscape!
• Up to 30% more space occupied by buildings by 2055• Up to 20% reduction in infiltration to groundwater
overall by 2055 and up to 40% reduction when urban green space is excluded!
• Up to 40 increase in temperature of receiving waters in summer coupled with reduced base flows!
States• Ofwat and the Environment Agency will continue to
regulate inflexible nationally driven campaign based investment programmes with set deliverables identified on a five yearly basis. There will be little funding available for large scale upgrading of urban drainage systems
• Government refuses to legislate to define responsibilities such as the adoption of SuDS or to provide real guidance for brownfield development
• Local authorities will continue to be under-funded and under staffed in relevant disciplines and so will not be able to address the emerging problems
• As a result of this developments go ahead using conventional piped drainage systems with little concern for the management of excess flows
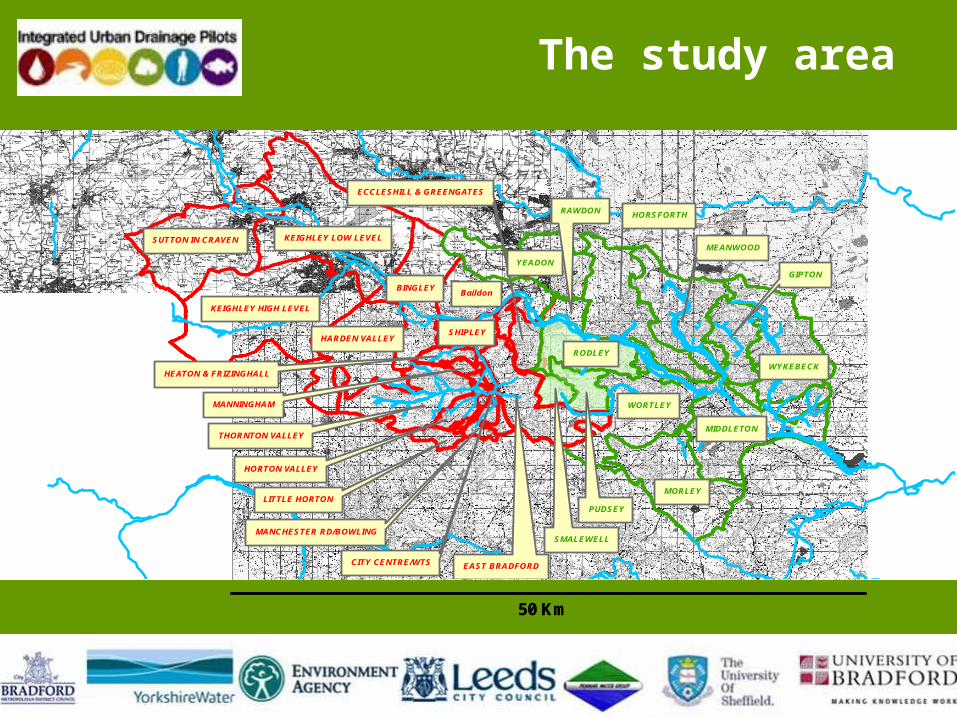
The study area
50 Km
KEIGHLEY HIGH LEVEL
KEIGHLEY LOW LEVELSUTTON IN CRAVEN
BINGLEY
HARDEN VALLEYSHIPLEY
EAST BRADFORD
THORNTON VALLEY
LITTLE HORTON
HORTON VALLEY
HEATON & FRIZINGHALL
CITY CENTRE/WTS
MANNINGHAM
MANCHESTER RD/BOWLING
Baildon
ECCLESHILL & GREENGATES
RAWDON
YEADON
RODLEY
PUDSEY
SMALEWELL
MORLEY
MIDDLETON
WORTLEY
HORSFORTH
WYKEBECK
MEANWOOD
GIPTON
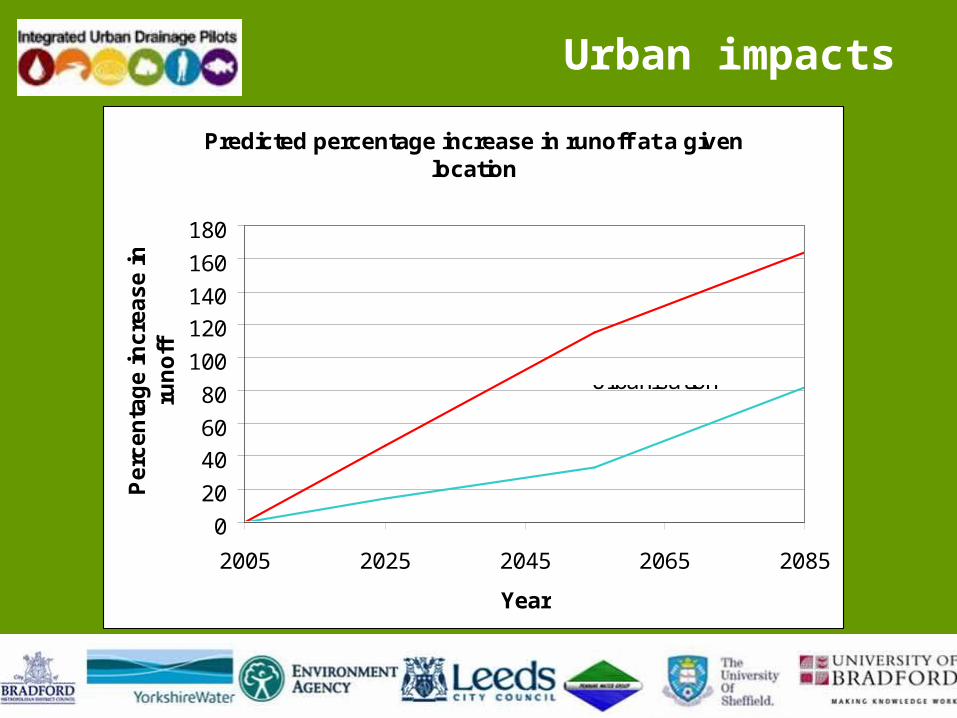
Urban impacts
Predicted percentage increase in runoff at a given location
0
20
40
60
80
100
120
140
160
180
2005 2025 2045 2065 2085
Year
Pe
rce
nta
ge
in
cre
as
e i
n
run
off
Climate change
Urbanisation
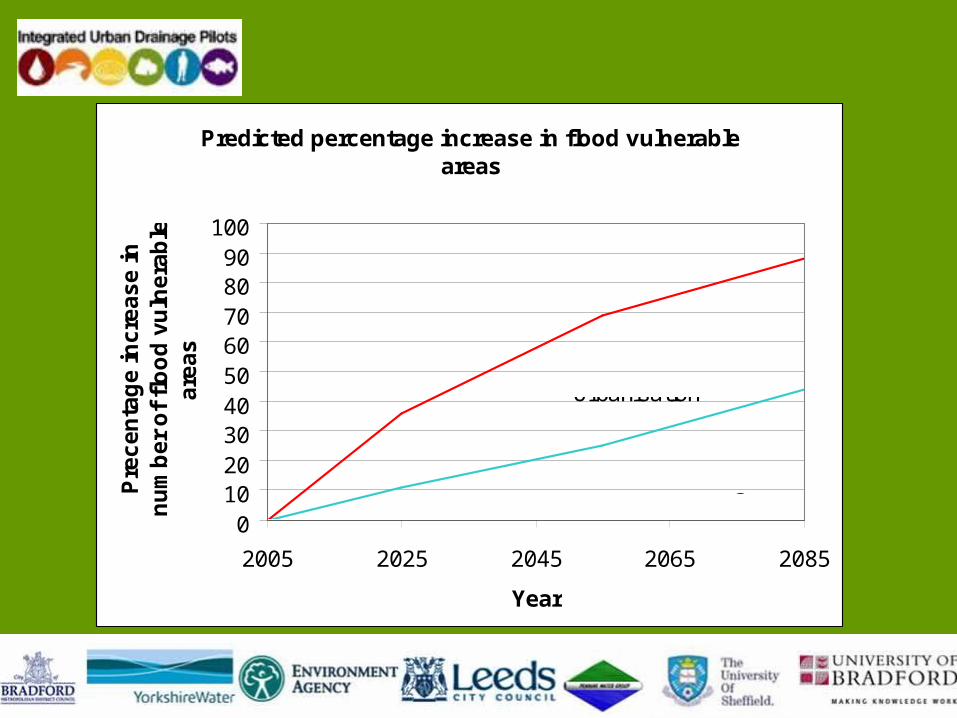
Predicted percentage increase in flood vulnerable areas
0102030405060708090
100
2005 2025 2045 2065 2085
Year
Pre
ce
nta
ge
in
cre
as
e i
n
nu
mb
er
of
flo
od
vu
lne
rab
le
are
as
Urbanisation
Climate change
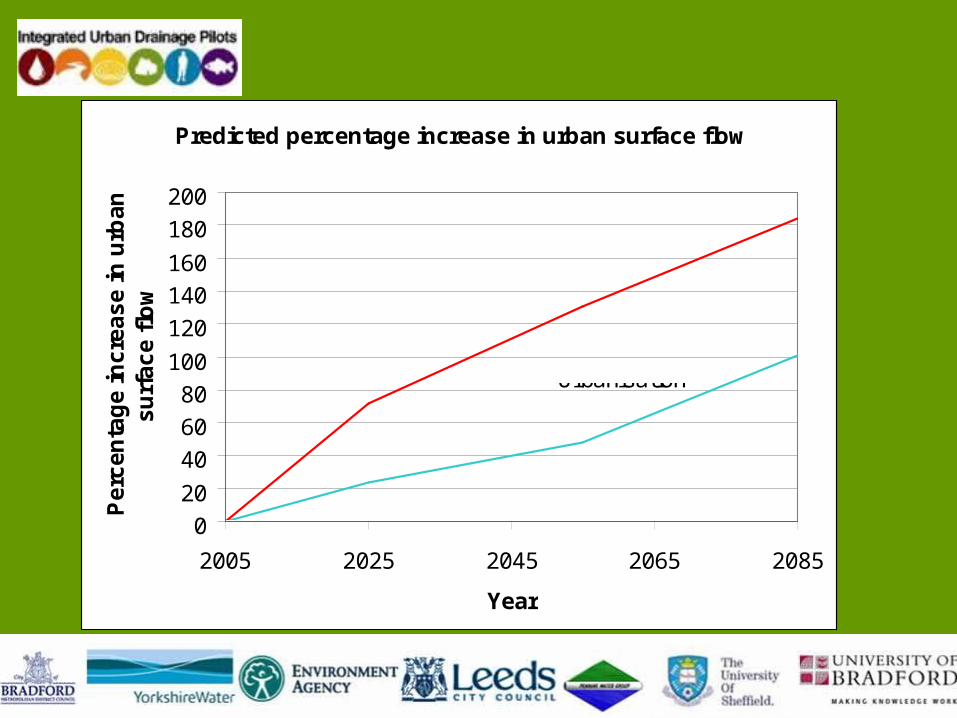
Predicted percentage increase in urban surface flow
0
20
40
60
80
100
120
140
160
180
200
2005 2025 2045 2065 2085
Year
Pe
rce
nta
ge
in
cre
as
e i
n u
rba
n
su
rfa
ce
flo
w
Urbanisation
Climate change
• Potential doubling of the frequency of flooding due to climate change at a given location
• Potential doubling of the frequency of flooding due to urbanisation at a given location
• Potential quadrupling of the frequency of flooding due to combined impacts
River impacts
• Up to 15% increase in peak spill to receiving waters due to climate change during extreme wet weather, but unlikely to coincide with river peak
• Up to 80% increase in spill volume due to climate change at drainage area scale for twice yearly summer rainfall
• Up to 10% increase in flow to full treatment due to climate change during wet weather
Tales of the river bank
• Interaction between the river and the sewers
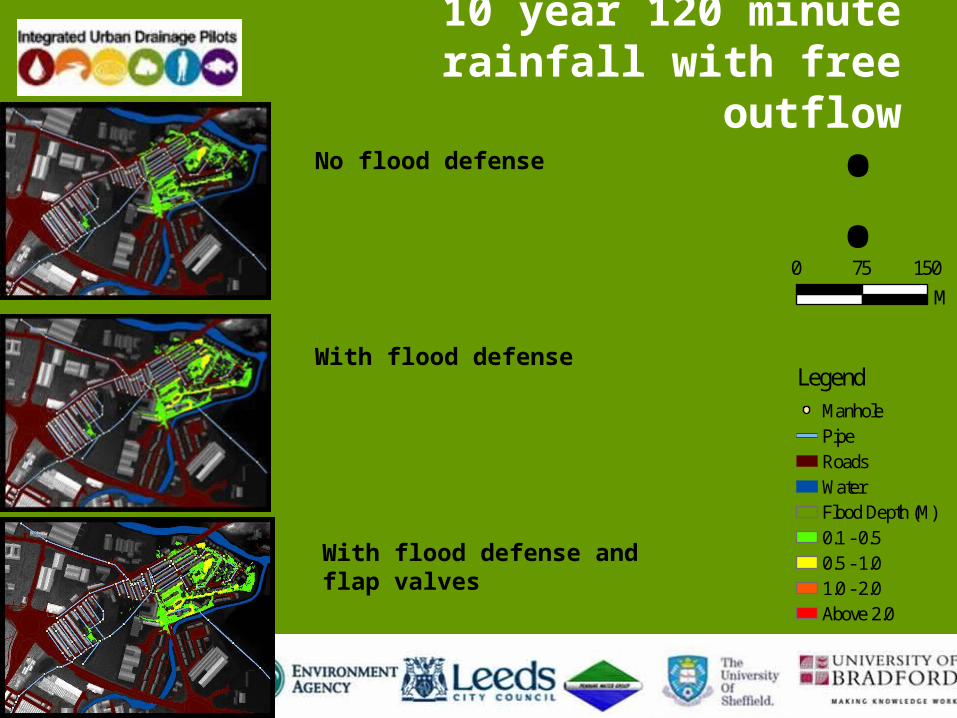
LegendManholePipeRoadsWaterFlood Depth (M)0.1 - 0.50.5 - 1.01.0 - 2.0Above 2.0
:0 15075
M
No flood defense
With flood defense and flap valves
With flood defense
10 year 120 minute rainfall with free outflow
LegendManholePipeRoadsWaterFlood Depth (M)0.1 - 0.50.5 - 1.01.0 - 2.0Above 2.0
:0 15075
M
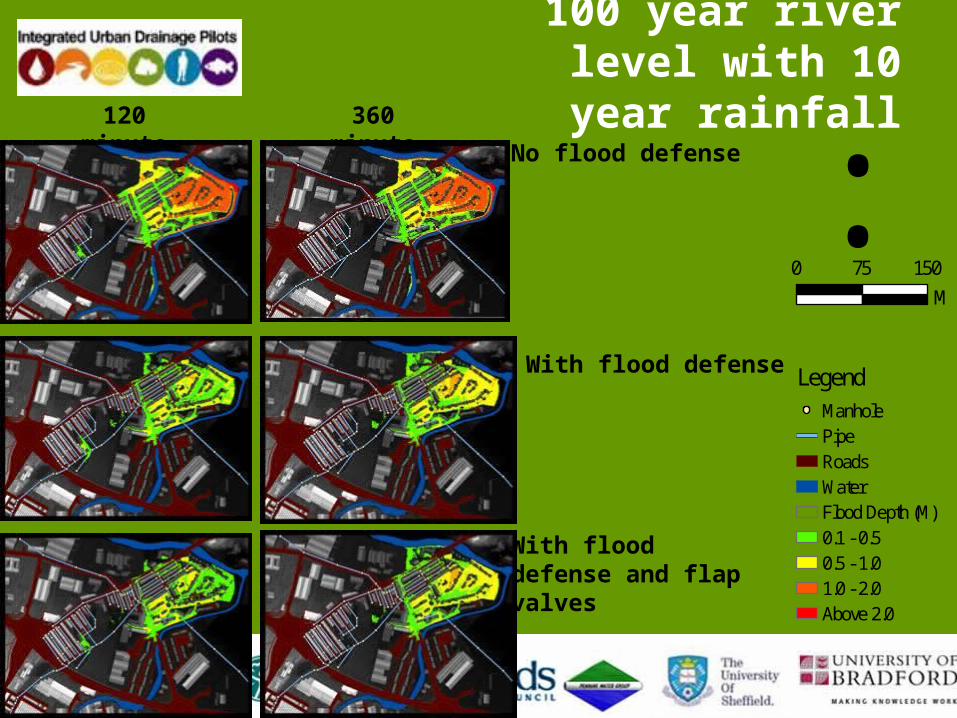
No flood defense
With flood defense and flap valves
With flood defense
100 year river level with 10 year rainfall
120 minute 360 minute
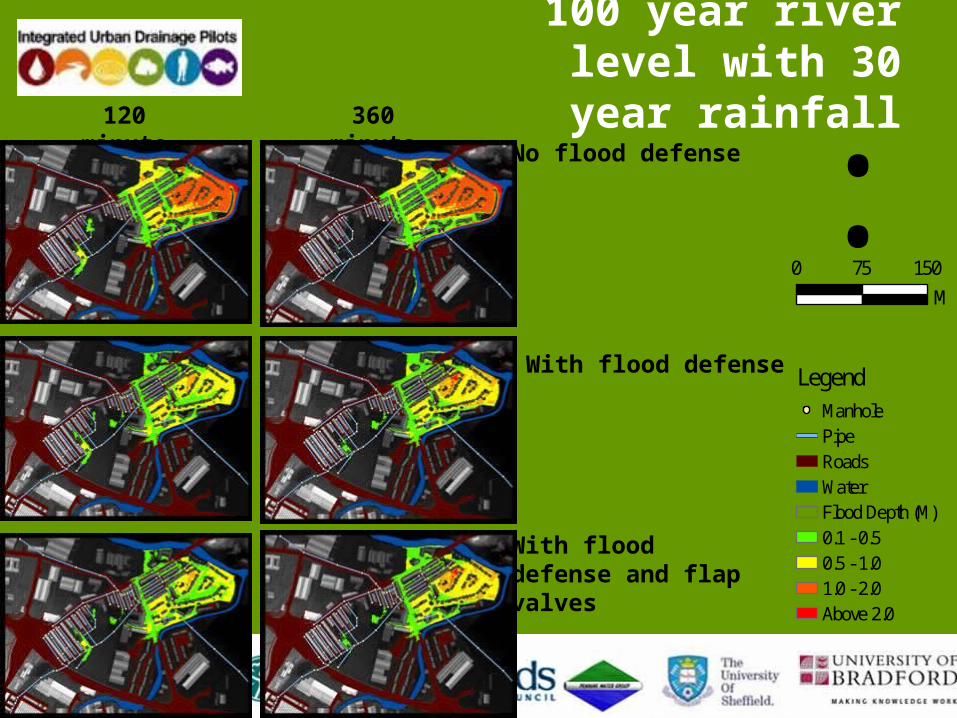
LegendManholePipeRoadsWaterFlood Depth (M)0.1 - 0.50.5 - 1.01.0 - 2.0Above 2.0
:0 15075
M
No flood defense
With flood defense and flap valves
With flood defense
100 year river level with 30 year rainfall
120 minute 360 minute
The way forward
• The analysis is providing compelling evidence to change the way that things are done.
• Planners want to know where the predicted flooding is likely to occur so that they can either– Avoid specific areas– Develop suitable policy to allow development
• There are concerns over issues relating to blight of properties, so Defra needs to insist that the models and/or the results of the simulations are made available.
• The outputs indicate where more detailed modelling is required.
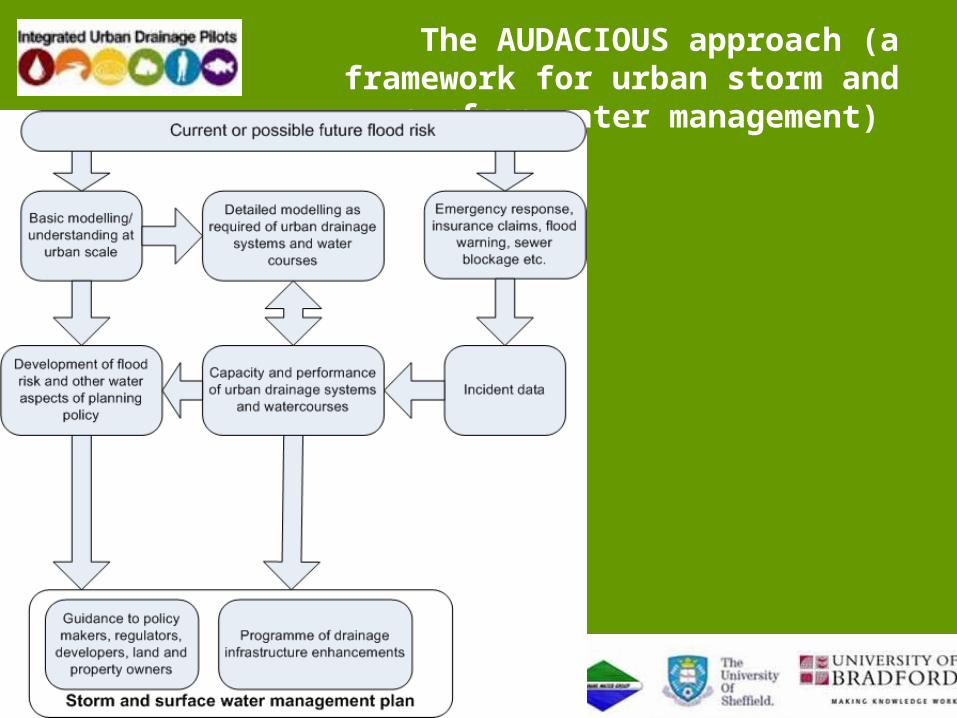
The AUDACIOUS approach (a framework for urban storm and surface
water management)
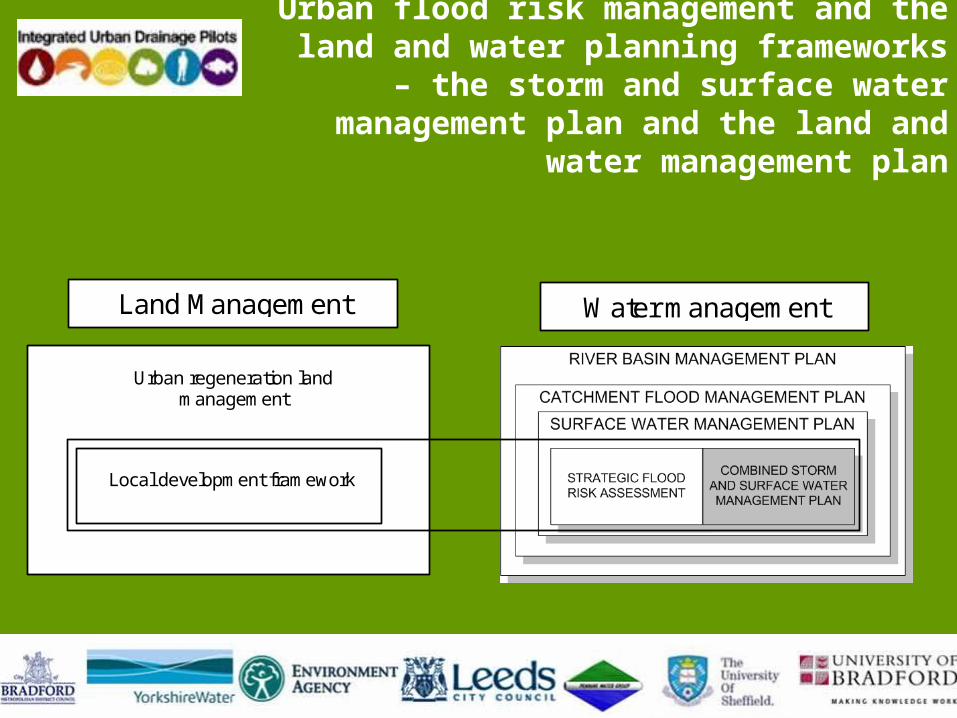
Urban flood risk management and the land and water planning frameworks – the storm
and surface water management plan and the land and water management plan
Water management Land Management management
Local development framework
Urban regeneration land management