Embed Size (px)
Citation preview
City of Brawley
Water Master Plan
Volume 1
Prepared for
City of Brawley
Public Works Department
Prepared
September 2012
Psomas Job No.
5BRA041000

September 2012 i
TABLE OF CONTENTS
Volume 1: Water Master Plan
Executive Summary .......................................................................................................E-1
1.0 Introduction .......................................................................................................... 1-1
1.1 Background .................................................................................................... 1-1
1.2 Scope of Work ............................................................................................... 1-1
1.3 Acknowledgements ........................................................................................ 1-4
1.4 Water Master Plan Objectives ....................................................................... 1-4
1.5 Master Plan Development .............................................................................. 1-5
1.6 Study Area ..................................................................................................... 1-7
1.7 Abbreviations ................................................................................................. 1-7
1.8 Unit Conversions ......................................................................................... 1-10
2.0 Existing Water System Facilities ........................................................................ 2-1
2.1 General ........................................................................................................... 2-1
2.2 Supply Sources............................................................................................... 2-1
2.3 Water Treatment Plant ................................................................................... 2-2
2.4 Storage Facilities ............................................................................................ 2-2
2.5 Pump Stations ................................................................................................ 2-4
2.6 Transmission and Distribution Pipelines ....................................................... 2-5
2.7 Water System Conditions .............................................................................. 2-7
3.0 Water Demands and Planning Data ................................................................... 3-1
3.1 Historical Water Consumption ...................................................................... 3-1
3.2 Existing and Projected Population ................................................................. 3-3
3.3 Land Use and Development ........................................................................... 3-4
3.4 Water Demand Calculations ........................................................................ 3-15
3.5 Fire Flow Requirements ............................................................................... 3-24
4.0 Water Supply ........................................................................................................ 4-1
4.1 City Water Supplies ....................................................................................... 4-1
4.2 Future Water Supply Sources ........................................................................ 4-1
4.3 Water Quality ................................................................................................. 4-2
5.0 Hydraulic Computer Model Development ......................................................... 5-1
5.1 Planning and Design Criteria Summary ........................................................ 5-1
5.2 Hydraulic Model ............................................................................................ 5-2
5.3 Previous Computer Model ............................................................................. 5-2
5.4 Hydraulic Model Software Program .............................................................. 5-2
5.5 Model Development....................................................................................... 5-3
5.6 Model Validation ......................................................................................... 5-10
6.0 Water Distribution System Analysis .................................................................. 6-1
6.1 Model Simulations ......................................................................................... 6-1
6.2 Modeling Results ........................................................................................... 6-1
7.0 Other Water Facilities Analyses ......................................................................... 7-1
7.1 Water Storage Analysis.................................................................................. 7-1
7.2 Water Treatment Plant and Distribution PS Capacity ................................... 7-3
September 2012 ii
8.0 Recommended Capital Improvement Program ................................................ 8-1
8.1 Recommended Improvement Projects ........................................................... 8-2 8.2 Water Storage and Pump Station Improvements ........................................... 8-4 8.3 Water Treatment Plant Expansion ................................................................. 8-5 8.4 Water Quality ................................................................................................. 8-6 8.5 Summary of Recommended Water System Improvements ........................... 8-6 8.6 Capital Improvement Program Costs ............................................................. 8-8
9.0 Funding Mechanisms ........................................................................................... 9-1

September 2012 iii
Tables
Table 1-1 Pipeline Velocities ................................................................................... 1-6 Table 2-1 Treated Water Storage Reservoirs ........................................................... 2-4 Table 2-2 Potable Water Pump Stations................................................................... 2-5 Table 2-3 Summary of Water Pipe Length by Diameter .......................................... 2-6 Table 2-4 Length of Pipelines by Material Type ..................................................... 2-7 Table 2-5 Fire Hydrant Test Data ............................................................................. 2-8 Table 3-1 Average Water Consumption ................................................................... 3-1 Table 3-2 2009 to 2010 Average Water Consumption............................................. 3-2 Table 3-3 Historical and Projected Population and Housing ................................... 3-3 Table 3-4 Existing Land Use .................................................................................... 3-7 Table 3-5 Development Project Status ................................................................... 3-11 Table 3-6 Projected 2030 Land Use ....................................................................... 3-12 Table 3-7 Projected 2020 Land Use ....................................................................... 3-14 Table 3-8 Summary of Existing and Projected Land Use ...................................... 3-15 Table 3-9 Existing Largest Water User Demands .................................................. 3-17 Table 3-10 Existing School Water Demands ........................................................... 3-18 Table 3-11 Existing Water Demand and Factors by Land Use ................................ 3-18 Table 3-12 Summary of Existing Water Demands .................................................. 3-19 Table 3-13 Estimated Water Demand Factors by Planning Year ............................ 3-20 Table 3-14 Future 2030 Water Demands by Land Use ............................................ 3-20 Table 3-15 Future 2020 Water Demands by Land Use ............................................ 3-21 Table 3-16 Maximum Day Peaking Factors............................................................. 3-23 Table 3-17 Existing System Peaking Factors and Demands .................................... 3-24 Table 3-18 Future System Peaking Factors and Demands ....................................... 3-24 Table 3-19 Fire Flow Requirements ......................................................................... 3-25 Table 4-1 Water Shortage Stages and Reduction Goals ........................................... 4-2 Table 5-1 Water Planning and Design Criteria Summary ........................................ 5-1 Table 5-2 Summary of Pump Data ........................................................................... 5-5 Table 5-3 Summary of Hydraulic Model Scenarios ............................................... 5-10 Table 6-1 Model Simulations ................................................................................... 6-1 Table 6-2 Existing System Required and Available Fire Flow ................................ 6-7 Table 6-3 Future System Required and Available Fire Flow ................................. 6-15 Table 6-4 Summary of Pipe Length by Diameter .................................................. 6-17 Table 7-1 Additional Raw Water Storage Needed ................................................... 7-1 Table 7-2 Treated Water Storage ............................................................................. 7-2 Table 7-3 Additional Treated Water Storage Needed .............................................. 7-3 Table 7-4 Water Treatment Plant Capacity .............................................................. 7-3 Table 8-1 Unit Construction Costs – Water System Improvements ........................ 8-2 Table 8-2 Water Storage Improvements .................................................................. 8-5 Table 8-3 Water Treatment Plant Capacity .............................................................. 8-6 Table 8-4 Summary of Water System Improvement Costs ...................................... 8-7 Table 9-1 Comparison of Financing Alternatives .................................................... 9-5

September 2012 iv
Figures
Figure 1-1 Vicinity Map Figure 1-2 City Limits and Sphere of Influence Figure 2-1 Brawley Existing Water Infrastructure (map pocket in back) Figure 2-2 Water Treatment Plant Figure 3-1 Land Use Map Figure 3-2 Vacant Land/Big Water Users/School Map Figure 3-3 Future Development Figure 3-4 2020 Vacant Land by Land Use Figure 5-1 Development Project Locations Figure 5-2 WTP Pump Station Curve Figure 5-3 Airport Pump Station Curve Figure 5-4 Diurnal Curves Figure 5-5 Comparison of Model and Field HGL at the Pressure Sensing Stations Figure 6-1 Existing System Peak Hour Results Figure 6-2 Existing System Fire Flow Results Figure 6-3 Existing System Water Age Results Figure 6-4 Year 2030 Peak Hour Results without Imperial Development Figure 6-5 Year 2030 Peak Hour Results with Imperial Development Figure 8-1 Brawley Water Capital Improvement Projects and Future Water
Infrastructure (map pocket in back)

September 2012 v
Volume 2: Appendices
Appendix A Pipe Break Records Appendix B Fire Hydrant Test Data Appendix C Chlorine Residual Data Appendix D Maximum Day Extended Period Simulation Appendix E Existing Water Age Appendix F Future Peak Hour Model Results Appendix G Water Model Data Appendix H Water Improvement Itemized Costs
September 2012 E-1
Executive Summary
Introduction
The City of Brawley owns and operates its water system, which generally includes distribution pipelines, reservoirs, pump stations, and a treatment plant. This Water Master Plan analyzes and evaluates these facilities and their ability to meet current and projected demands. It also addresses supply and regulatory requirements to assure continued reliable potable water service. This Plan is an update to the previous Water Master Plan and Capital Improvement Program that was prepared in 1999.
Scope of Work
The Water Master Plan scope of work includes the following tasks:
1. Water System Design Criteria
2. Water Demand Projections
3. Water System Computer Modeling
4. Raw Water Capacity Analysis
5. Water Treatment Plant Capacity
6. Capital Improvement Project Recommendations
Master Plan Development
Portions of this Master Plan have been based on fundamental assumptions established throughout the project. The City and Psomas discussed these assumptions and agreed that they resulted in a reasonable approach to developing the Master Plan. One of these assumptions is to use the Year 2030 as the future buildout planning year.
To help quantify the Master Plan objectives, a minimum acceptable level of service was established to help identify deficiencies in existing facilities, as well as to help determine the need for, and size of, proposed improvements. The established criteria meet Federal, State, and local regulations governing water quality for potable use, including AWWA M31, AWWA M32, NFPA, CDPH, and IID.
Existing Water System Facilities
Currently, the City of Brawley (City) manages an existing water system that includes two (2) raw water storage reservoirs, a water treatment plant (WTP), two (2) clearwell storage tanks, a distribution water pump station located at the WTP, one treated water storage tank with booster pump station, and approximately 100 miles of 2-inch to 36-inch water pipeline. The City consists of one pressure zone and serves approximately 5,900 potable water service connections.

September 2012 E-2
The City purchases Colorado River water from the Imperial Irrigation District (IID) via the All American Canal system and, ultimately, is supplied to the Water Treatment Plant via the 19 MGD capacity Mansfield Canal. Raw water is treated at the City’s 15 MGD capacity Water Treatment Plant, which can be modified or expanded to accommodate future growth. The WTP’s power supply is backed up with a 1,000 kW diesel generator that has adequate capacity and fuel to run the entire plant for 60 days. The City currently has 36 MG of raw water storage and 6 MG of treated water storage located at the Water Treatment Plant. In addition, they have a 3 MG treated water storage tank located near the Airport. Currently, treated water is pumped to the City’s single pressure zone via five (5) 4,000 gpm pumps located at the WTP. In addition, there is a 1,600 gpm booster pump station that supplies water from the Airport tank. All residential customers now have water meters along with many of the business/commercial customers.
Water Demands and Planning Data
Water demands represent water that leaves the distribution system through metered or unmetered connections, or at pipe joints (leaks) or breaks. Water demands occur throughout the distribution system and typically vary based on the number and type of consumer in each location. To analyze demands for this Master Plan, the historical water usage was reviewed, along with the metered services, large users, unaccounted for water users (non-metered lots, parks, etc.), and land use. For this report, an average water consumption of 7.53 MGD was used, representing the 2009 and 2010 demands. Land use designations were used to calibrate existing demands and project future demands for 2020 and 2030. The current General Plan was used to estimate land use areas, populations, and dwelling units within the current City limits and the existing sphere of influence. This analysis was complicated by the fact that the current recession has resulted in a number of approved, partially constructed, and partially occupied subdivisions that needed to be considered in the existing analysis. For this Plan, it was assumed that only occupied homes/businesses would be included and that the remaining units would be occupied by the 2020 scenario. Projected populations were 24,953 existing, 42,748 year 2020; and 60,524 year 2030. Existing water demand factors were developed for the various land uses including low density residential, medium density residential, commercial, public facilities, industrial and light industrial/business park. Water demand factors were then developed for each land use to get the total to reach the current average water demand of 7.53 MGD. Peaking factors were estimated to establish maximum day demands and peak hour demands. These factors are 1.5 and 2.2 times the average daily flow respectively. Fire flow factors were developed for each land use based on accepted fire flows and residual pressures.
September 2012 E-3
In addition, the City has been in discussions with the City of Imperial regarding the planned Rancho Los Lagos development located south of the City’s sphere of influence. For the purposes of this Plan, it was shown as a single demand on the 2030 scenario.
Water Distribution System Analysis
The model development and analysis for this 2012 Master Plan was completed primarily within the computer modeling software “InfoWater”, with the final model deliverables being exported to EPANet files for the City’s use. For this Master Plan, the City elected to leverage GIS by utilizing a hydraulic model that incorporates GIS features into the hydraulic model analyses. The roughness coefficients from the 1999 hydraulic model were used as a baseline value for the new hydraulic model.
The original models were updated to reflect additional developments and facilities constructed since 1999. Pipes and junctions were verified as to their attributes (elevations, sizes, and materials), and system operations were based on maintaining a 50 to 60 psi at the Malan pressure sensor location. Static water demands were distributed to pipe junctions (nodes) based on the number of nodes in a specific land use area. Demands were allocated accordingly to each node and total flows verified against the 2009 and 2010 average water demands. In master planning, the computer model assists in measuring system performance, analyzing operational improvements, and developing a systematic method of determining the size and timing required for new facilities. The calibrated model can be used to analyze existing water systems, future water systems, or even specific improvements to the existing water system. The hydraulic computer model was used to simulate the existing and future water distribution system in an effort to identify deficiencies that might occur under selected conditions. The following table identifies the model simulations that were conducted for this project.

September 2012 E-4
Model Simulations
Simulation Existing
2020
2030
w/o
Los
Lagos
2030
with Los
Lagos Duration Demands
Average Day X X X Steady State ADD
Maximum Day plus Fire X X X X Steady State MDD
Peak Hour X X X X Steady State PHD
EPS Waterage X 24 Hours ADD
EPS - Typical X 24 Hours MDD
For the existing system, based on these runs, there were three (3) areas identified as not meeting the design criteria:
• North Highway 111 is served by a small diameter pipeline and has pressures between 25 to 37 psi, which is less than the required 40 psi.
• The Cattle Call area, which is lower in elevation, has pressures in excess of 60 to 70 psi.
• The single pipeline serving the National Beef Plant has velocities in excess of 7 ft/sec.
In addition, there were 20 locations chosen for a fire flow analysis. Of these 20, seven (7) failed to meet the design criteria:
• The Brawly M.O.B Hospital had an available fire flow of 2,693 gpm (6,000 gpm required.
• The Pioneer Hospital had an available fire flow of 2,974 gpm (6,000 gpm required).
• The Phil Swing Elementary School had an available fire flow of 1,956 gpm (3,000 gpm required).
• The Poe Colonia development had an available fire flow of 1,341 gpm (1,500 gpm required). The pipeline serving this development also had a velocity exceeding 10 fps.
• The Hovley Drive and Park View Drive area had an available fire flow of 467 gpm (1,500 gpm required).
• Highway 111 and Shank Road had an available fire flow of 190 gpm (3,000 gpm required).
• SDSU had an available fire flow of 2,486 gpm (3,000 gpm required). The future modeling scenarios showed many of the same deficiencies as the existing models for pressures, velocities and fire flows. This indicates that these deficiencies should be resolved during the first phases of improvements. The models also sized new pipelines for the developing areas which may either be constructed directly by the developers or by the City (with possible reimbursement).

September 2012 E-5
Water distribution systems often rely on stored water to help equalize fluctuations between supply and demand, supply sufficient water for firefighting, and meet demands during an emergency or unplanned outage of a major supply source. Adequate storage requirements include the sum of operational, fire, and emergency storage volumes. Based on discussions with IID, the storage required needs to offset the loss of production from the IID connections for six (6) average day demands. The City currently has 36 MG of storage in open at-grade reservoirs at the Water Treatment Plant. The following table summarizes the required raw water storage for the existing and future conditions:
Additional Raw Water Storage Needed
Condition ADD (MGD)
6 days
of ADD
(MG)
Existing
Raw
Water
Storage
(MG)
Additional
Needed
Raw
Water
Storage
(MG)
Existing 7.5 45 36 9
2020 10.6 64 36 28
2030 w/o Rancho Los
Lagos 14.3 86 36 50
2030 with Rancho Los
Lagos 17.6 106
36 70
Treated water storage within the City’s system also has to meet similar criteria for operational fluctuations, fires, and emergencies. The City currently has 9 MG of available treated water storage.
September 2012 E-6
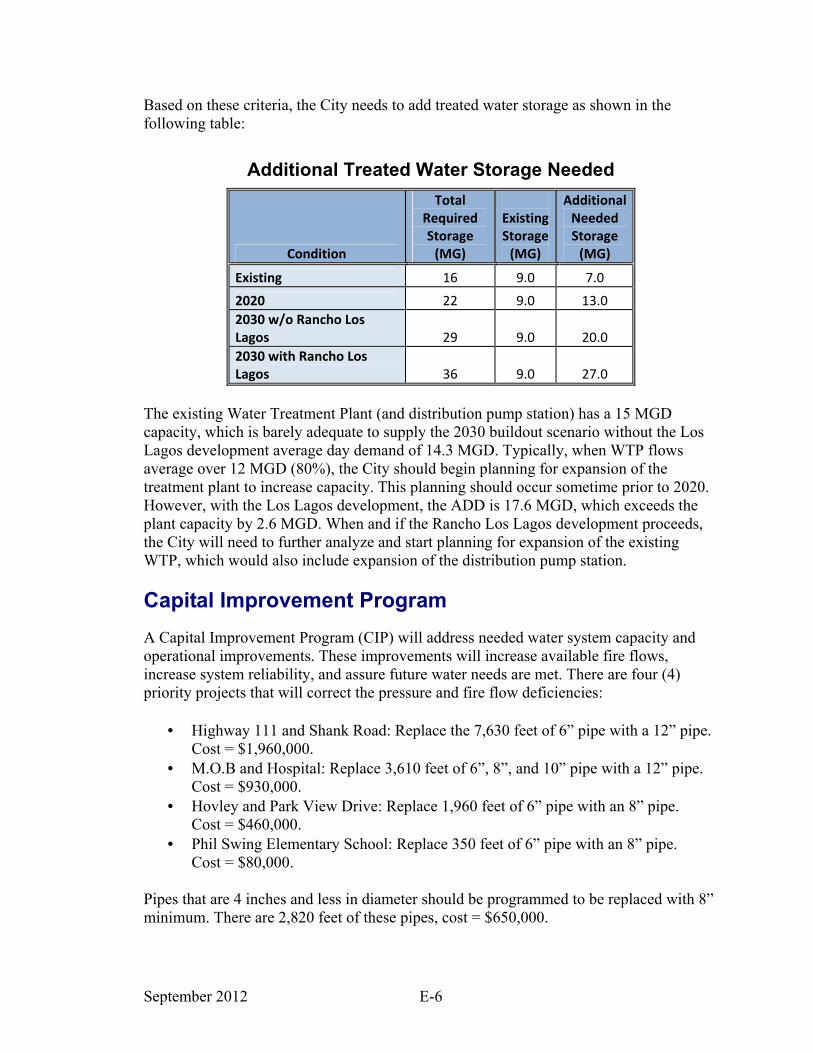
Based on these criteria, the City needs to add treated water storage as shown in the following table:
Additional Treated Water Storage Needed
Condition
Total
Required
Storage
(MG)
Existing
Storage
(MG)
Additional
Needed
Storage
(MG)
Existing 16 9.0 7.0
2020 22 9.0 13.0
2030 w/o Rancho Los
Lagos 29 9.0 20.0
2030 with Rancho Los
Lagos 36 9.0 27.0
The existing Water Treatment Plant (and distribution pump station) has a 15 MGD capacity, which is barely adequate to supply the 2030 buildout scenario without the Los Lagos development average day demand of 14.3 MGD. Typically, when WTP flows average over 12 MGD (80%), the City should begin planning for expansion of the treatment plant to increase capacity. This planning should occur sometime prior to 2020. However, with the Los Lagos development, the ADD is 17.6 MGD, which exceeds the plant capacity by 2.6 MGD. When and if the Rancho Los Lagos development proceeds, the City will need to further analyze and start planning for expansion of the existing WTP, which would also include expansion of the distribution pump station.
Capital Improvement Program
A Capital Improvement Program (CIP) will address needed water system capacity and operational improvements. These improvements will increase available fire flows, increase system reliability, and assure future water needs are met. There are four (4) priority projects that will correct the pressure and fire flow deficiencies:
• Highway 111 and Shank Road: Replace the 7,630 feet of 6” pipe with a 12” pipe. Cost = $1,960,000.
• M.O.B and Hospital: Replace 3,610 feet of 6”, 8”, and 10” pipe with a 12” pipe. Cost = $930,000.
• Hovley and Park View Drive: Replace 1,960 feet of 6” pipe with an 8” pipe. Cost = $460,000.
• Phil Swing Elementary School: Replace 350 feet of 6” pipe with an 8” pipe. Cost = $80,000.
Pipes that are 4 inches and less in diameter should be programmed to be replaced with 8” minimum. There are 2,820 feet of these pipes, cost = $650,000.
September 2012 E-7
The existing cast iron pipes are very old and should all be replaced. Priorities should be given to areas that have a high break rate. There are a total of 126,700 feet of CIP in the system. Costs to replace them are $29,560,000. Lastly, there is an existing need to provide additional raw water and treated water storage. The 9 MG raw water storage pond can be constructed at the WTP for a cost of $5,120,000. The additional 7 MG of treated water storage can be met by the 3 MG La Paloma tank/pump station (when it is constructed) and by a new 4 MG northern area storage tank and pump station costing $9,100,000. This can be constructed as a CIP project or funded by developers. In the future, the City will be faced with an additional raw water storage shortfall of 41 MG. This construction cost of $23,320,000 can be part of a new CIP program funded by either developer fees or City obtained monies. There are four (4) additional treated water storage tanks/pump stations and 156,300 feet of transmission pipe which will most likely be constructed by developers as the work progresses. Total cost, $62,000,000.
September 2012 1-1
1.0 Introduction
The City of Brawley owns and operates its water system, which generally includes distribution pipelines, reservoirs, pump stations, and a treatment plant. This Water Master Plan analyzes and evaluates these facilities and their ability to meet current and projected demands. It also addresses supply and regulatory requirements to assure continued reliable potable water service. This Plan is an update to the previous Water Master Plan and Capital Improvement Program that was prepared in 1999.
1.1 Background
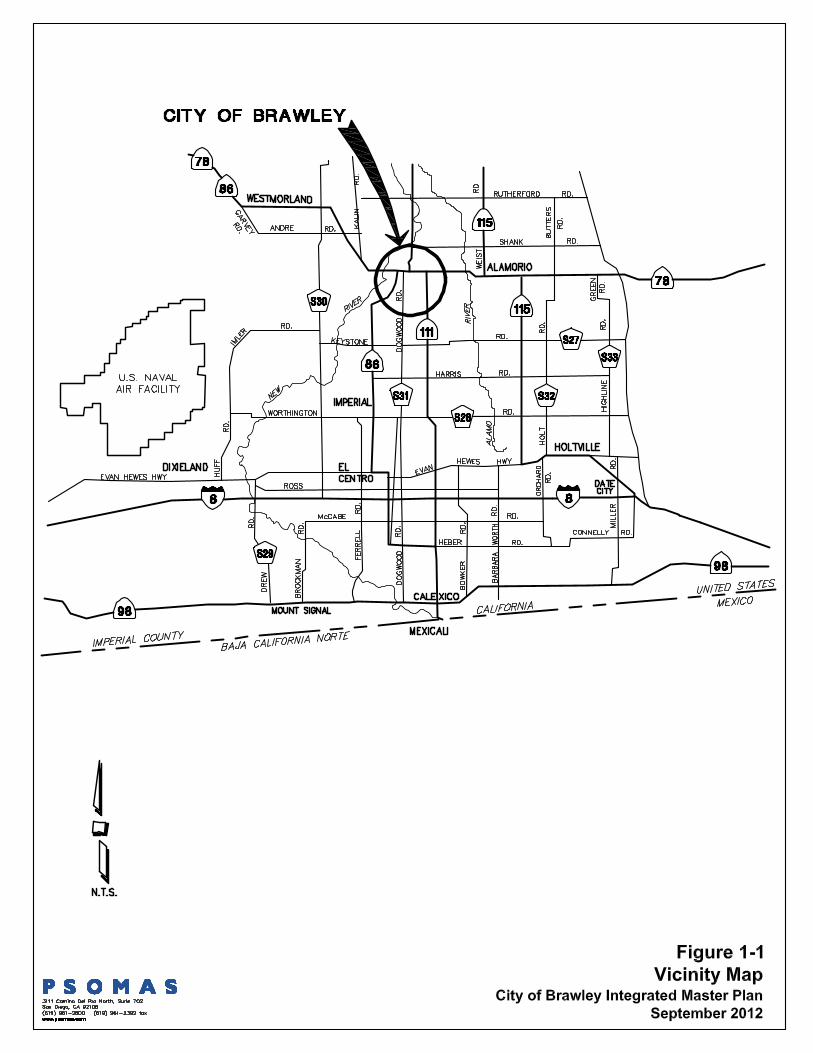
The City of Brawley is located centrally in the broad desert expanse of Imperial County, California. It is approximately 13 miles north of El Centro and 15 miles southeast of the Salton Sea. See Figure 1-1 for the Vicinity Map. The City was founded in 1902 and became incorporated in 1908. In the early 1900s the population was small, consisting mainly of railroad workers. Since then the population has grown to almost 25,000 persons and now includes year-round agriculture along with the cattle and feed industries as its biggest economic trades. Brawley has grown steadily over the years and because of the City’s careful and continued planning efforts, is able to ensure water resources are available for future growth and development.
1.2 Scope of Work
The Water Master Plan scope of work includes the following tasks:
1. Water System Design Criteria
a. Develop minimum and maximum pressure criteria for static, fire flow and peak flow conditions.
b. Develop flow rates including average daily demand (ADD), maximum daily demand (MDD), and peak hour demand (PHD), including fire flows for existing, Year 2020, and Year 2030.
c. Develop criteria for pipeline maximum velocities, Hazen-Williams roughness “C” factors and minimum pipe sizes. The “C” factors will be adjusted to reflect replacement of old existing cast iron pipe.
d. Develop storage requirements based on operational, fire flow, and emergency storage requirements.
e. Determine minimum required fire flow rates per land use and durations and pressures required per the latest version of the California Fire Code and City Fire Department.
f. Develop current and future water quality criteria.
September 2012 1-3
2. Water Demand Projections
a. Develop water usage for each land use category. The rates will be calibrated to reflect flows observed at the Water Treatment Plant.
b. Develop future water demand projections based on current and proposed land use and population projections.
3. Water System Computer Modeling
a. Develop base system, including pipes, tanks, pump stations, and fire hydrants. b. Provide an existing system model based on current conditions. c. Calibrate the existing system model with the results of fire flow tests and
historical data from the Water Treatment Plant. d. Model the system to determine the required upgrades to the existing system to
meet established design criteria. e. Model the system using Year 2020 and Year 2030 growth projections and
determine the required improvements for the future system to meet established design criteria.
f. Perform a storage analysis. g. Perform an extended time period analysis to model water quality, including
estimating age of water and disinfection residuals.
4. Raw Water Capacity Analysis
a. Analyze the adequacy of the existing and future raw water supply and storage. b. Coordinate with Imperial Irrigation District (IID) and review their Urban
Water Management Plan. c. Investigate raw water delivery capacities to assure the supply canals have
adequate capacity to serve the City. d. Evaluate availability and/or need for a redundant raw water source.
5. Water Treatment Plant Capacity
a. Evaluate the adequacy of the Water Treatment Plant to serve the existing and future water needs of the City.
b. Develop a schedule of required upgrades to meet state health requirements for reliable capacity and water quality.
6. Capital Improvement Project Recommendations
a. Evaluate the results of the hydraulic analyses and identify system deficiencies. b. Develop a capital improvement program (CIP) for short term and long term
capital improvements required to meet established design criteria. c. Prepare a written report of the CIP recommendations, including:
i. Priority projects ii. Water storage requirements
iii. Water booster station requirements iv. Recommended future system upgrades v. Water treatment plant capacity expansions
vi. Operational improvements
September 2012 1-4
vii. Telemetry and Supervisory Control and Data Acquisition (SCADA) improvements
viii. Raw water supply redundancy
ix. Water conservation recommendations x. Cost opinions
xi. Possible funding sources
1.3 Acknowledgements
Project staff would like to acknowledge the following City of Brawley staff members who provided valuable information and assistance, contributing greatly to the successful completion of this project:
• Yazmin Arellano, Public Works Director
• Gordon Gaste, City Planner
• Steven Sullivan, Project Manager
• Guillermo Sillas, Associate Civil Engineer
• Alan Chan, Engineering Technician
• Ruben Mireles, Superintendent of Operations
• Fernando Soto, Water Treatment Facility Supervisor
• David Arvizu, Distribution/Pretreatment Supervisor
• Tony Verdugo, Streets and Utilities Supervisor
• Andrew Escobar, Chief Wastewater Plant Operator
1.4 Water Master Plan Objectives
This Water Master Plan has been prepared to provide a reference document for the existing water system operations and maintenance and a framework for future water system planning. The Plan objectives include the following:
1. Develop a comprehensive computer model calibrated to the existing system conditions.
2. Develop performance criteria for both existing and proposed water facilities.
3. Use the computer model to conduct hydraulic analyses of the existing water system and identify current deficiencies in the existing water system.
4. Identify and evaluate system improvements that will alleviate existing system deficiencies.
5. Incorporate projected water demands into the model and identify future system improvements that will be needed to meet the future demands.
September 2012 1-5
6. Perform hydraulic analyses of the water system using the computer model to evaluate operations of the current and future water systems.
7. Review and summarize water quality and proposed regulations that may have an impact on local water supplies.
8. Develop a capital improvement program and capital costs for water system improvements and expansion.
9. Develop a phased project list to prioritize future water system improvement projects.
10. Review alternative financing programs for possible funding sources to pay for the recommended improvements.
1.5 Master Plan Development
Portions of this Master Plan have been based on fundamental assumptions that were established throughout the project. The City and Psomas discussed these assumptions and agreed that they resulted in a reasonable approach to developing the Master Plan. One of these assumptions is to use the Year 2030 as the future buildout planning year.
To help quantify the Plan objectives outlined above, a minimum acceptable level of service also needed to be established to help identify deficiencies in existing facilities, as well as to help determine the need for, and size of, proposed improvements. The criteria listed below were established to quantify the minimum service requirements for the water system and to serve as the minimum acceptable conditions under which the water system would be considered adequate. The criteria were intended to be used to analyze existing facilities and design proposed improvements. Where applicable, the source of these criteria is provided in parentheses.
1. The water provided to the City’s consumers shall meet all federal, state, and local regulations governing water quality for potable use.
2. The water system shall be capable of providing the minimum fire flow, as determined in this Master Plan, with a minimum residual pressure of 20 psi (American Water Works Association (AWWA) M31, Manual of Water Supply Practices, Distribution System Requirements for Fire Protection, Chapter 2, Section: Rates of Water Use; Fire Marshal, National Fire Protection Association (NFPA)).
3. The water system shall be capable of providing at least 40 psi (California Department of Public Health (CDPH)) for the following demand periods: average day, maximum day, and peak hour. The water system shall be capable of providing a static pressure of at least 60 psi (the City is currently regulating the pressures at the treatment plant below 60 psi). Since there is only one pressure zone in the City, the 60 psi pressure would be considered the maximum pressure the system will see. Accordingly, pressure regulators and high pressure pipes are not required.

September 2012 1-6
4. The maximum velocity in any proposed pipeline should be in accordance with the following guidelines (Standard Practice) (Table 1-1):
Table 1-1 Pipeline Velocities
Desired Range
Questionable
Range
Deficient
Range
Average Day
Analysis
0 to 5 fps 5 to 7 fps Over 7 fps
Maximum Day
and Peak Hour
Analysis
0 to 7 fps 7 to 10 fps Over 10 fps
Fire Flow
Analysis
0 to 15 fps -- Over 15 fps
Pipes with velocities in the Questionable Range should be reviewed on an individual basis. Those with velocities in the Deficient Range should be considered for replacement or paralleling.
5. The water system should have at least two independent supply sources (AWWA). Where two sources of supply are not practical, the zone should have sufficient storage to meet all emergency criteria with the supply out of service. Based on discussions with IID, the storage required needs to offset the loss of production from the IID connections for six (6) average day demands. (This is the period of time IID has indicated may be required for taking the canal out of service.)
6. Where water is pumped from an imported supply source, the booster pumping station shall have a backup pump online and be equal in size to the largest pump in the station. The station shall also have a backup (or secondary) power source. A portable generator can be considered acceptable as a backup power source for the booster station.
7. The water system shall have adequate potable water storage (AWWA M32, Manual of Water Supply Practices, Computer Modeling of Water Distribution Systems, Chapter 5, Section: System Design Criteria). This storage shall include operational, fire flow, and emergency storage. Operational storage shall be at least 30 percent of the maximum day demands (MDD). Storage for fire flows shall be at least the largest volume determined for any fire flow. Emergency storage shall be the volume required to offset the loss of electricity City-wide or Treatment Plant operation for 24 hours of maximum day demands.
The sum of the operational storage, fire flow, and emergency storage volumes shall be the minimum required storage for the water system.

September 2012 1-7
8. To meet pressure and velocity objectives, the following criteria are recommended for new pipelines. The minimum diameter for new pipelines shall be 8 inches, except in short cul-de-sac streets, where 6-inch pipe may be used beyond the last fire hydrant. In commercial and business areas, the minimum diameter for new pipelines shall be 12 inches. These diameters shall not preclude the use of larger diameters when needed to meet the minimum fire flows or other criteria. In some cases, smaller diameter pipelines (such as 6-inch or 8-inch) may be proposed to facilitate connection with nearby pipelines and avoid large headlosses from irregular connectivity.
9. Pipelines shall be looped to prevent one pipeline outage from disrupting service to a large area. An exception may be granted by the City’s Engineer in special situations (AWWA M31, Manual of Water Supply Practices, Distribution System Requirements for Fire Protection).
10. Fire flows should be able to be met with one major water component out of service (American Water Works Association (AWWA) M31, Manual of Water Supply Practices, Distribution System Requirements for Fire Protection, Chapter 4).
11. Operational improvements are difficult to quantify. Nevertheless, proposed operational improvements that increase system reliability, efficiency, or reduce the cost to deliver water, should be examined. Where a benefit is found, the proposed improvement should be recommended.
1.6 Study Area
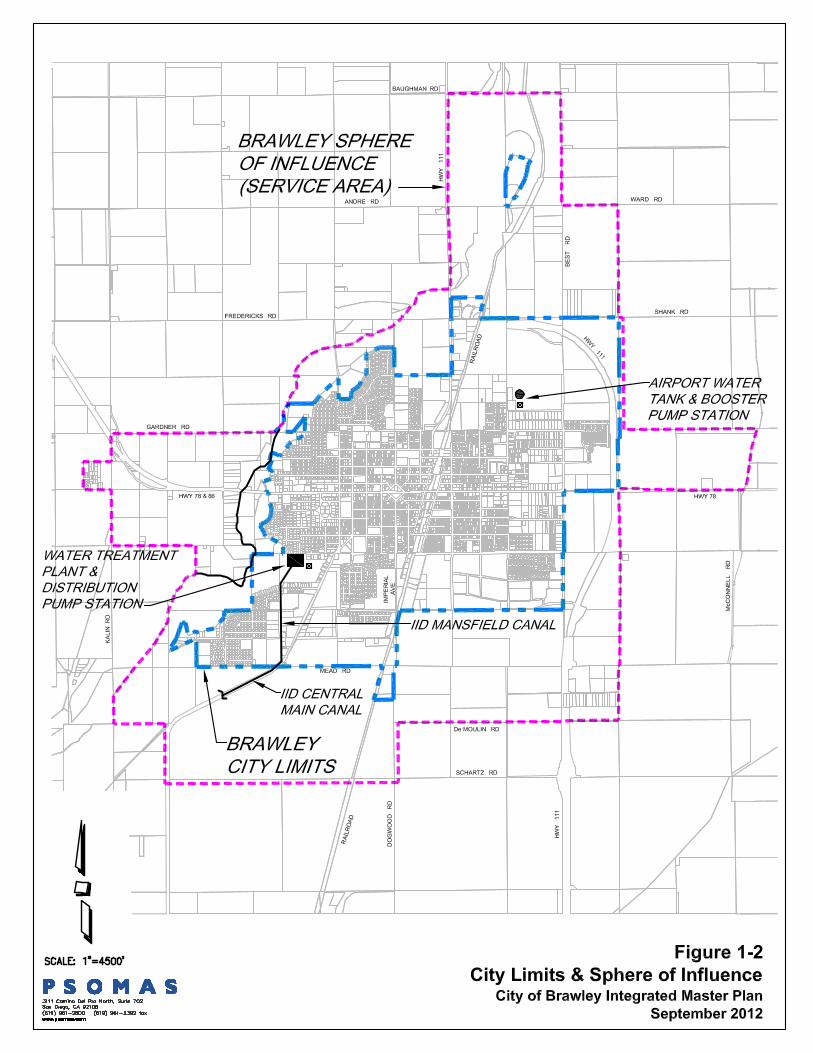
The City of Brawley water service sphere of influence covers approximately 17 square miles, as shown in Figure 1-2. This area includes both the incorporated City of Brawley as well as unincorporated areas outside the current City limits.
1.7 Abbreviations
The following is a list of abbreviations used in this report:
AC Asbestos Cement
ACP Asbestos Cement Pipe
ADD Average Day Demand
ac-ft Acre-foot (one acre-foot of water is equal to 325,829 gallons)
ac-ft/yr Acre-foot/year
AWWA American Water Works Association
BPS Booster Pumping Station
ccf One hundred cubic feet

September 2012 1-9
CDPH California Department of Public Health
cfs Cubic feet per second
CIP Cast Iron Pipe
DI
DIP
Ductile Iron
Ductile Iron Pipe
Dia Diameter
EPS Extended Period Simulation (special type of hydraulic model simulation)
FCV Flow Control Valve
fps Feet per second
ft Foot or feet
ft-MSL Feet above Mean Sea Level
gpcd Gallons per capita-day
gpd Gallons per day
gpd/ac Gallons per day per acre (volume of water used per acre of land)
gpm Gallons per minute
HGL Hydraulic Grade Line
Hp Horsepower
HWL High Water Level
IID Imperial Irrigation District
in Inch or inches
kWh Kilowatt-hour
MDD Maximum Day Demand
MG Million Gallons
MGD Million Gallons per Day
PHD Peak Hour Demand
PRS Pressure-regulating Station
PRV Pressure-Reducing Valve
psi Pounds per square inch (measure of pressure)
PSV Pressure-sustaining Valve
PVC Polyvinyl Chloride
SWP California State Water Project
TDH Total Dynamic Head

September 2012 1-10
UFC Uniform Fire Code
UPC Uniform Plumbing Code
USGS United States Geologic Survey
WTP Water Treatment Plant
1.8 Unit Conversions
This section provides a list of conversion factors that are commonly used to convert values from one unit to another.
1.8.1 Volume
• Convert MG to ac-ft: Multiply by 3.0691.
• Convert ac-ft to MG: Multiply by 0.32583.
1.8.2 Flow Rate
• Convert ac-ft/yr to cfs: Multiply by 0.001381.
• Convert ac-ft/yr to gpd: Multiply by 892.7.
• Convert ac-ft/yr to gpm: Multiply by 0.621.
• Convert ac-ft/yr to MGD: Multiply by 0.000893.
• Convert cfs to ac-ft/yr: Multiply by 724.
• Convert cfs to gpd: Multiply by 646,300.
• Convert cfs to gpm: Multiply by 448.8.
• Convert cfs to MGD: Multiply by 0.646.
• Convert gpd to ac-ft/yr: Multiply by 0.00112.
• Convert gpd to cfs: Multiply by 0.000001547.
• Convert gpd to gpm: Multiply by 0.0006944.
• Convert gpd to MGD: Multiply by 0.000001 (or divide by one million).
• Convert gpm to ac-ft/yr: Multiply by 1.61.
• Convert gpm to cfs: Multiply by 0.002228.
• Convert gpm to gpd: Multiply by 1,440.

September 2012 1-11
• Convert gpm to MGD: Multiply by 0.00144.
• Convert MGD to ac-ft/yr: Multiply by 1,120.
• Convert MGD to cfs: Multiply by 1.547.
• Convert MGD to gpd: Multiply by 1,000,000.
• Convert MGD to gpm: Multiply by 694.4.

September 2012 2-1
2.0 Existing Water System Facilities
2.1 General
Currently, the City of Brawley (City) manages an existing water system that includes two raw water storage reservoirs, a water treatment plant (WTP), two (2) clearwell storage tanks and a distribution water pump station located at the WTP, one treated water storage tank with booster pump station, and approximately 100 miles of 2-inch to 36-inch diameter water pipelines. The City consists of one pressure zone and, per the 2010 Urban Water Management Plan (UWMP), serves approximately 5,900 potable water service connections. See Figures 1-2 and 2-1. (Figure 2-1 is included in a pocket at back of report.)
2.2 Supply Sources
2.2.1 Import Water
2.2.1.1 Imperial Irrigation District
The City purchases water from the Imperial Irrigation District (IID), which obtains its water from the Colorado River. Water is diverted from the River at the Imperial Dam near Yuma, Arizona, and is then transported via the IID-owned and operated 80-mile long All-American Canal which supplies the Imperial Valley. From the All American Canal, water flows through various IID canals, including the Central Main and Mansfield Canals which deliver the raw water directly to the City of Brawley Water Treatment Plant. The Mansfield Canal has a capacity of 19 MGD. Untreated water used for agricultural purposes is delivered directly to the customers via the canals. Water used for domestic purposes is stored in raw water reservoirs and then filtered and disinfected at the Water Treatment Plant before being pumped into the City’s potable water distribution system. According to the UWMP, IID has assured the City that all of its required water supply demands will be delivered, even under shortage, drought conditions, and/or a worst case water supply scenario. IID has senior water rights to the Colorado River flows, and it is unlikely that the urban water supply of IID, which comprise less than three percent of its annual water deliveries, will ever be affected. Thus, the City expects no supply shortage at any point in the future. In the event of a water shortage due to a catastrophic interruption, the City will follow the contingency plan, as defined in the Urban Water Management Plan.

September 2012 2-2
2.3 Water Treatment Plant
2.3.1 Description and Capacity
Currently, the City owns and operates a 15 MGD WTP located in the southwest portion of the City at 760 Willard Avenue. See Figure 2-2. This plant began operation in April 1999 and replaced the City’s older plant that was located approximately one half mile north of the current location. The current plant was constructed to provide increased levels of filtration and disinfection to meet then current raw water treatment requirements and to alleviate capacity problems occurring at the older Water Treatment Plant. The WTP capacity of 15 MGD is capable of being expanded to 30 MGD to accommodate future growth. In general, the plant includes raw water storage and pumping, chemical injection, primary sedimentation, flocculation, filtration, and treated water storage and distribution pumping. The WTP also has emergency power supplied by a 1,000 kW diesel generator that has adequate capacity and fuel to run the entire plant for 60 days at current average day flow rates.
2.4 Storage Facilities
2.4.1 Raw Water Storage
The City currently has two raw water reservoirs with a total capacity of 36 MG. These reservoirs are located at the WTP and are at-grade open reservoirs which receive IID raw water.
2.4.2 Treated Water Storage
The City also has nine (9) MG of treated water storage. (See Table 2-1 for a summary of the tanks.) Six (6) MG of this storage is located at the WTP within two (2) above grade steel tank clearwells. Each tank has 3 MG of capacity and an operational depth of 24’.
A second storage facility, the Airport (Jones) Tank, is located in the northeast portion of the City. The maximum water depth of the tank is 29.3 ft. An altitude valve on the inlet of the Airport Tank closes and opens based on the water level in the tank.
The City also has an abandoned elevated steel water storage tank located at Cesar Chavez Street and H Street. This tank was utilized until the early 2000’s at which time it was taken out of service due to concerns with leaking and its structural stability. Although over the years the City has considered rehabilitating the tank and bringing it back in service, required upgrades to the tank have made it cost prohibitive.


September 2012 2-4
Table 2-1 Treated Water Storage Reservoirs
Location
Year
Installed Material
Base
Elevation
(ft)
Diameter
(ft)
Overflow
Capacity
(MG) Description
Depth
(ft)
HWL
(ft-
MSL)
Hinojosa Tank H Street Abandoned Steel -- -- -- -- 0.25
WTP Tanks Willard/Cattle
Call 1998 Steel -121.2 125 24 -97.2 6.00
Airport Tank Eastern/River 1992 Steel -127 30 30 -97 3.00
2.5 Pump Stations
The City currently operates two potable water pump stations: one located at the WTP and the other adjacent to the Airport Tank in the northeastern portion of the City.
2.5.1 WTP (Distribution) Pump Station Capacity and Operation
The booster pump station at the WTP consists of the five (5) 4,000 gpm pumps. Four (4) of the pumps are variable frequency drive (VFD) pumps and one (1) is a constant speed pump. The pumps and their design points are summarized in Table 2-2. They are designed to provide enough water to hold a constant system pressure, set at generally around 55 to 60 psi. Typically, the selected VFD pumps will run in tandem and ramp up and down to meet pressures. As system demands increase and the pressures drop, then the constant speed pump turns on with the operating VFD pumps ramping down to 50%. While working in conjunction with the constant speed pump, the VFD-controlled pumps will then increase speed to meet the demands and hold the discharge pressure. The VFD pumps can be run by the emergency diesel generator located at the WTP.
2.5.2 Airport Booster Pump Station Capacity and Operation
The Airport Booster Pump Station includes three 1,600 gpm constant speed pumps. Up to two pumps operate, with the third pump used as a backup. The Airport Pump Station pumps from the Airport Tank during peak demand periods to maintain pressures within the system. These pumps are operated manually and, typically, used minimally. A 300kW diesel generator is located at the pump station that is capable of providing emergency power for up to five (5) days of average day flow.
September 2012 2-5
Table 2-2 Potable Water Pump Stations
Pump
Number
Pump
Type
Total
Dynamic
Head
(ft)
Nameplate
Horsepower
(Hp)
Capacity
(gpm) Facility Name
WTP Pump Station
FWP-421 1
VFD-
Electric 156
140 4,000
FWP-422 2
VFD-
Electric 156
140 4,000
FWP-423 3
VFD-
Electric 156
140 4,000
FWP-424 4
VFD-
Electric 156
140 4,000
FWP-425 5 Electric 156 140 4,000
Total Reliable Capacity1 16,000
Airport Pump Station
PMP-B-1 1 Electric 140 75 1,600
PMP-B-2 2 Electric 140 75 1,600
PMP-B-3 (Airport PS) 3 Electric 140 75 1,600
Total Reliable Capacity 3,200
1 Reliable capacity is capacity with largest pump out of service.
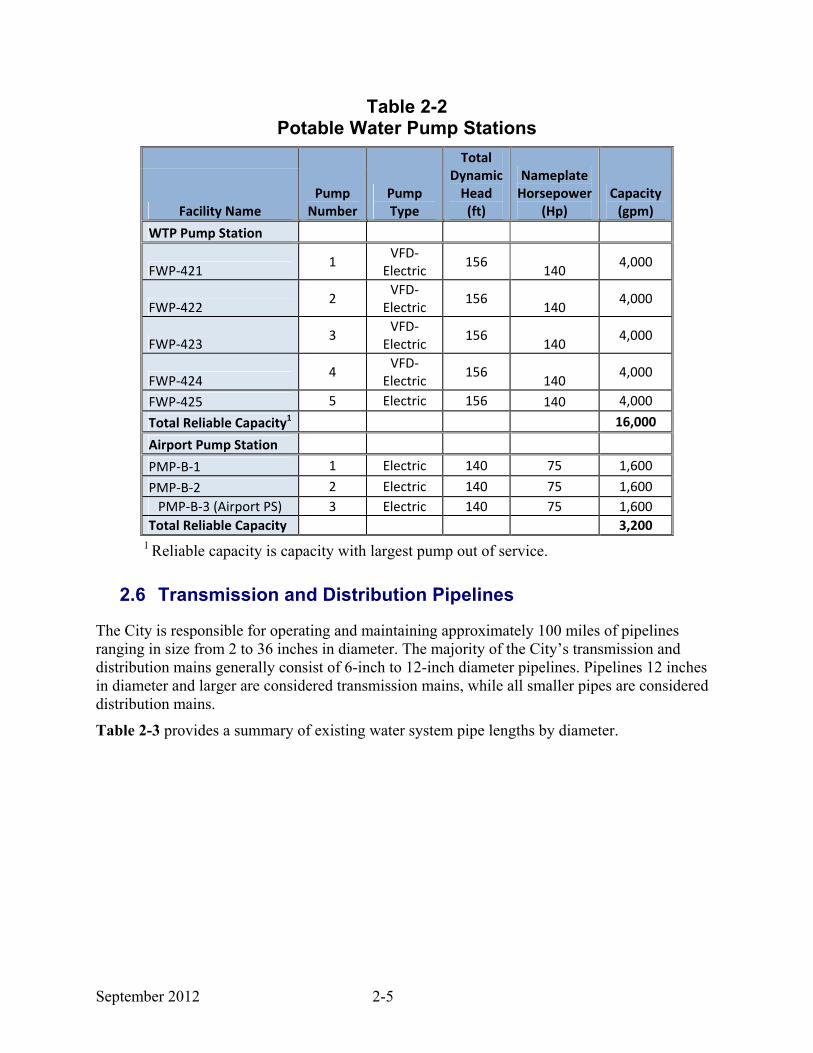
2.6 Transmission and Distribution Pipelines
The City is responsible for operating and maintaining approximately 100 miles of pipelines ranging in size from 2 to 36 inches in diameter. The majority of the City’s transmission and distribution mains generally consist of 6-inch to 12-inch diameter pipelines. Pipelines 12 inches in diameter and larger are considered transmission mains, while all smaller pipes are considered distribution mains.
Table 2-3 provides a summary of existing water system pipe lengths by diameter.

September 2012 2-6
Table 2-3 Summary of Water Pipe Length by Diameter
Pipe Diameter
(in) Length (ft)
Percent of Total
Length (%)
2 419 0.08
3 698 0.13
4 22,513 4.26
6 152,746 28.9
8 184,665 34.9
10 14,918 2.82
12 98,230 18.6
14 8,174 1.55
16 19,640 3.71
18 7,679 1.45
20 348 0.07
24 16,830 3.18
36 2,049 0.39
Total Pipe Length 528,909
Table 2-4 provides a summary of pipe lengths by material and roughness coefficient (c factor) used in the hydraulic model. Most of the oldest pipe in the City’s system is cast iron (CI) and represents approximately one-quarter of the total pipe length. The oldest pipe is located primarily in the downtown core and central area of the distribution system. Asbestos cement (AC) pipe accounts for a little over a quarter of all water pipelines, while the smallest amount of pipe is ductile iron (DI), which represents less than 1%. Polyvinyl Chloride (PVC) pipe is the largest quantity of pipe material installed and accounts for over 45% of the City system. PVC is typically the newest pipe that has been installed.

September 2012 2-7
Table 2-4 Length of Pipelines by Material Type
Pipe Material Length (mi)
Percent of Total
Length (%) C-Factor
Cast Iron 26.0 26
80 (less than 16”)
100 (16” and larger)
Ductile Iron 0.6 1 120
Asbestos Cement 28.0 28 120
Polyvinyl Chloride 45.0 45 130
Total Pipe Length 99.6
2.7 Water System Conditions
2.7.1 Water Main Breaks
The City has experienced water main breaks in the past, a large portion of which have occurred within the cast iron pipe sections. It has been noted by City staff that the cast iron pipe that has been removed tends to have scale build-up on the insides, which decreases pipe capacity. It is likely that the alkaline soil has also contributed to the deterioration of the cast iron pipe. See Appendix A for the City’s pipe break records.
2.7.2 System Pressures and Fire Hydrant Flow Data
The City has four pressure monitoring stations located as follows:
1. Water Treatment Plant 2. East Malan Street and Old Highway 111 3. Airport/Jones Water Tank 4. River Drive and 3rd Street
Hydrant flow data was provided by the City for five (5) locations. (See Appendix B.) The data was per the Insurance Services Office (ISO). This data was used to help calibrate the water model. Table 2-5 summarizes the five (5) hydrant locations tested.

September 2012 2-8
Table 2-5 Fire Hydrant Test Data
Test Type Location Available Flow at 20psi
1 Comm Shank Road and Route 111 500 gpm
2 Res Pedrino Court and Poe Colonia Lane 2,500 gpm
3 Comm W. Route 86 and Las Flores Drive 1,100 gpm
4 Comm Route 78 and Best Road 3,400 gpm
5 Res Legion Road and Los Olivos Drive 1,900 gpm
September 2012 3-1
3.0 Water Demands and Planning Data
Water demands represent water that leaves the distribution system through metered or unmetered connections, or at pipe joints (leaks) or breaks. Water demands occur throughout the distribution system and typically vary based on the number and type of consumer at each location. Water demands also vary throughout the day, resulting in a diurnal demand pattern that typically includes one peak in the morning and a second in the evening. In addition, demands vary seasonally, with the peak demands usually occurring during summer months.
To analyze the City’s water system, a method of allocating the demands within the distribution system is essential. One commonly used method of distributing water demands is to group water users based on their land use (or zoning). Land use can be a very good measure of water use. In addition, land-use information is readily available and can be applied to existing areas, as well as future development projects. In this method, the water demands are typically calculated using the acreage of a specified area and a water demand factor, which represents a measure of water use per acre based on the land-use type or density of the area. The resulting calculated demands represent the estimated average day demand (ADD). Water system demands for other demand periods, such as maximum day and peak hour, are then developed by applying a peaking factor to the ADD.
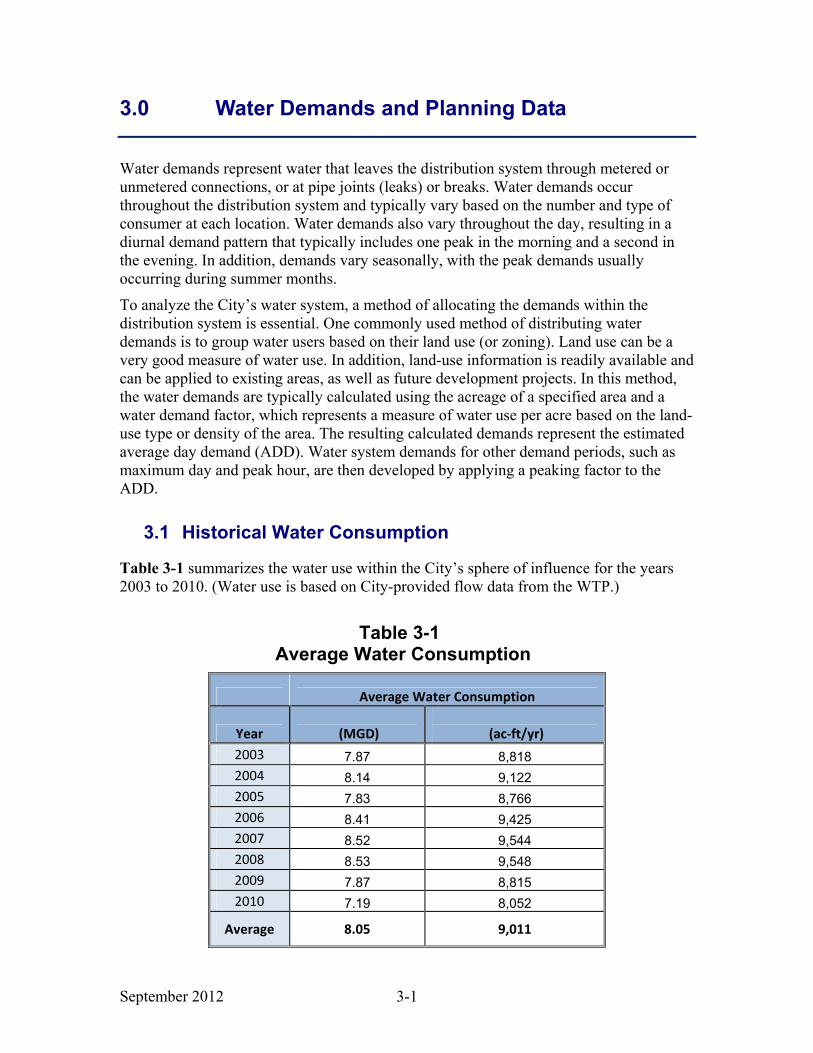
3.1 Historical Water Consumption
Table 3-1 summarizes the water use within the City’s sphere of influence for the years 2003 to 2010. (Water use is based on City-provided flow data from the WTP.)
Table 3-1 Average Water Consumption
Average Water Consumption
Year
(MGD)
(ac-ft/yr)
2003 7.87 8,818
2004 8.14 9,122
2005 7.83 8,766
2006 8.41 9,425
2007 8.52 9,544
2008 8.53 9,548
2009 7.87 8,815
2010 7.19 8,052
Average 8.05 9,011

September 2012 3-2
As shown by the table, water consumption through the years has varied both up and down. This is likely a result of new development and expansion, combined with the fact that the City started installing water meters in 2003. Since 2003, the City has installed
meters on all single family homes, most multi-residential lots, and on larger commercial/industrial services. In most cases, however, the commercial services are not currently metered; nor are City schools. Typically, water usage decreases with water meter installation, but
in the City’s case this was likely offset by increased development. In addition to water conservation efforts and City expansion, other influences, such as the impacts to the housing market and the economic recession that began in late 2008, could have brought the total water consumption down.
For this Master Plan, the average water consumption from the years 2009 and 2010 will be used for establishing water demand factors for the existing system. These years were selected as they are the most recent and include the most metered flow data. Table 3-2 summarizes the City’s water use for these two years and shows that the average water use within the City’s sphere of influence is about 7.53 MGD.
Table 3-2 2009 to 2010 Average Water Consumption
Year
Average Water
Consumption
(MGD) Average Annual Water
Consumption (ac-ft/yr)
2009 7.87 8,814
2010 7.19 8,053
Average 7.53 8,434
3.1.1 Unaccounted-for-Water
Water taken out of the distribution system at metered connections is relatively simple to measure; however, not all water that leaves the system does so at metered connections. Water that exits the distribution system and cannot be measured or accounted for is known as “unaccounted-for-water” or non-revenue water. Unaccounted-for-water is the difference between metered water production and metered water consumption, and represents “lost” water. Unaccounted-for-water occurs for a number of reasons:
• Unmetered services (Currently in the City of Brawley this is mostly commercial and schools).
• Water lost from system leaking (i.e., from pipes, valves, pumps, etc.).
• The City Fire Department performs hydrant testing to monitor the level of fire protection available throughout the City and the City Water Department performs hydrant flushing to eliminate settled sediment and ensure better water quality. Neither is metered. However, the quantity of water used is estimated and taken into consideration when calculating unaccounted-for-water.
• Water used by the Fire Department to fight fires is also not metered.
September 2012 3-3
• Customer meter inaccuracies. Meters have an inherent accuracy for a specified flow range. However, flow above or below this range is usually registered at a lower rate. Meters become less accurate with time due to wear.
It is important for water models to include unaccounted-for-water in the system demands so that the total water demand will balance with the total water supply. Once the City reaches a point to where all of the system’s connections are metered, then an analysis could be made to determine how the City has improved or how the City can decrease the amount of unaccounted-for-water. This may be done in advance and/or at the time of analysis by the replacement of leaking pipelines, improved meters, or refinement of accounting disparities. Based on AWWA, an acceptable range of unaccounted-for-water is somewhere between 5 to 10 percent. The California Urban Water Conservation Council recommends a complete distribution system audit if unaccounted-for-water exceeds 10%. Once the City is able to do so, it is recommended that the values be observed on a yearly basis to monitor the losses.
3.1.2 Existing Water Demands
As described in Section 3.1, the City’s annual average water production is about 8,434 ac-ft/yr (7.53 MGD) for the years of 2009 and 2010. This is the value this report will use as the City’s total existing average day demand.
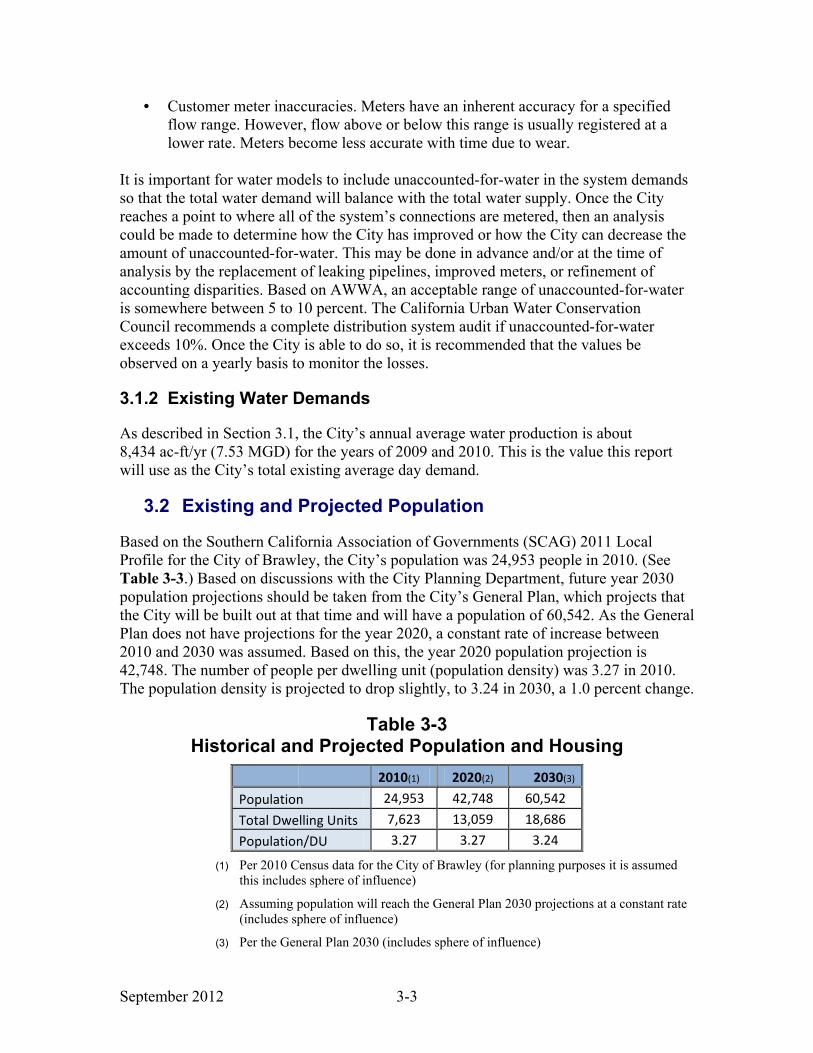
3.2 Existing and Projected Population
Based on the Southern California Association of Governments (SCAG) 2011 Local Profile for the City of Brawley, the City’s population was 24,953 people in 2010. (See Table 3-3.) Based on discussions with the City Planning Department, future year 2030 population projections should be taken from the City’s General Plan, which projects that the City will be built out at that time and will have a population of 60,542. As the General Plan does not have projections for the year 2020, a constant rate of increase between 2010 and 2030 was assumed. Based on this, the year 2020 population projection is 42,748. The number of people per dwelling unit (population density) was 3.27 in 2010. The population density is projected to drop slightly, to 3.24 in 2030, a 1.0 percent change.
Table 3-3 Historical and Projected Population and Housing
2010(1) 2020(2) 2030(3)
Population 24,953 42,748 60,542
Total Dwelling Units 7,623 13,059 18,686
Population/DU 3.27 3.27 3.24
(1) Per 2010 Census data for the City of Brawley (for planning purposes it is assumed this includes sphere of influence)
(2) Assuming population will reach the General Plan 2030 projections at a constant rate (includes sphere of influence)
(3) Per the General Plan 2030 (includes sphere of influence)
September 2012 3-4
3.3 Land Use and Development
In the coming years, the City of Brawley anticipates new development and continued redevelopment within its sphere of influence. This expansion is expected to increase water demands. To prepare for this growth, the City will require accurate water demand projections.
Actual water demands vary from user to user, depending on many factors, but land use is one of the primary determining factors for estimating water demands. Using land use to estimate water demands is common in master planning because the information is readily available, relatively accurate, and can be used for existing areas as well as future developments.
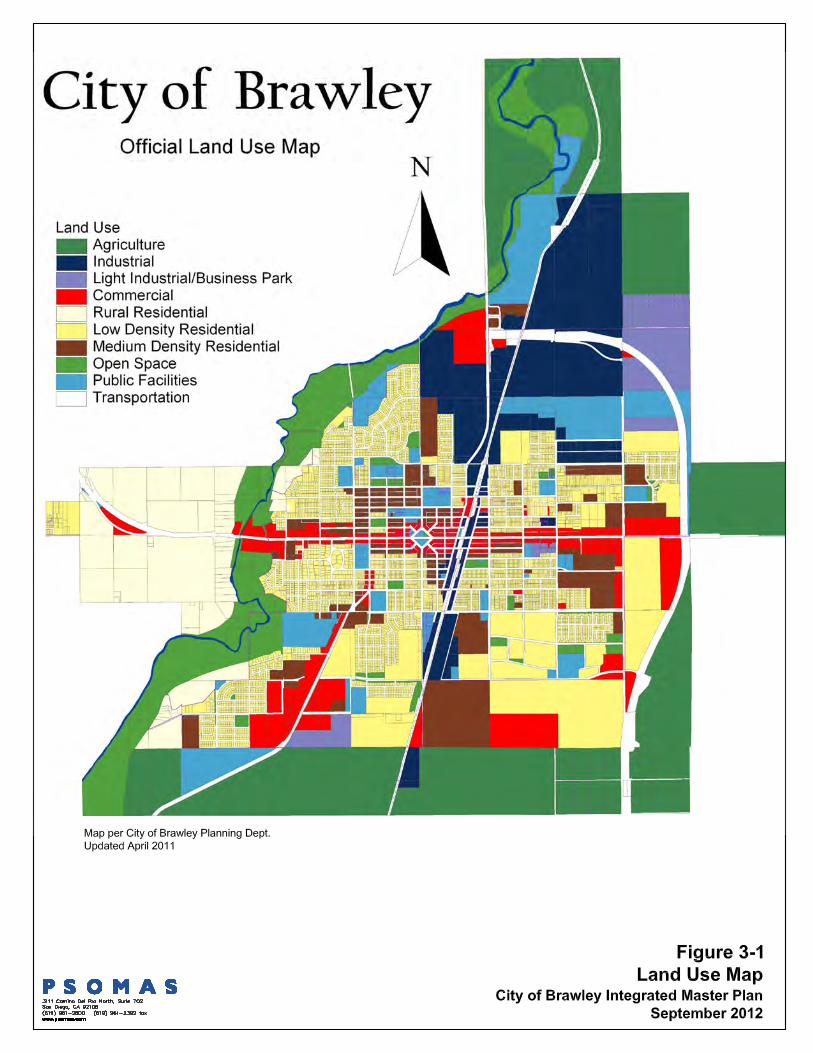
Information on land use, including new development and redevelopment zones within the City’s sphere of influence, was obtained from the City of Brawley Planning Department. Figure 3-1 shows the City’s buildout condition (Year 2030) Official Land Use Map. This map includes all the area within the City sphere of influence, both the incorporated and the unincorporated areas.
The City’s land use map was developed from the City’s geographic information system (GIS) database. The database includes all the individual parcels within the City’s sphere of influence. It also contains specific information for each parcel, such as parcel acreage and land use designation. Parcels vary in size and range from less than one acre to several hundred acres. Based on discussions with the City’s Planning Department, this map represents future land use for the Year 2030. The land use designation categories were used to distribute water demands and to establish fire flow demands.
3.3.1 Land Use Designations
For this Master Plan analysis, land uses are divided into four broad categories or designations: residential, commercial, public facilities, and industrial.
Residential land uses are subdivided into categories that generally reflect the density of existing residential development. These subcategories include single family and multiple family. Single family residential development is characterized by those residential neighborhoods or subdivisions with detached housing intended for use by a single family. The majority of the land within the City designated as residential falls into this category. Apartments and condominium developments are included in the multiple family residential categories. The commercial land use designation refers to a wide range of retailing, administrative, and service-related activities. The public facilities land use designation includes a wide range of public facilities, such as government offices, fire and police stations, religious facilities, hospitals, parks, schools, and medical offices.

September 2012 3-5
Industrial land uses are divided into light industrial/business and industrial. The light industrial designation allows for a range of non-manufacturing uses, such as warehousing and distribution facilities, while industrial refers to such industrial activities as manufacturing and assembly.

September 2012 3-7
3.3.2 Existing Land Use Areas
Based on the City’s GIS database and the City Land Use Map, there are 5,431 acres of land within the City’s sphere of influence that were considered in this Master Plan for the purposes of estimating water demands. This acreage represents both developed and undeveloped land. It does not include rural residential, open space, transportation, and agricultural land, as water demands for these land use areas were considered negligible. (Agricultural land obtains water directly from IID canals.) To determine the existing developed versus undeveloped areas, an analysis was performed which determined locations of vacant lots as well as those areas where new developments had started, but were abandoned due to the economy. (Brawley has a number of developments in the south and east sides of town that have homes built but are not occupied.) Figure 3-2 shows the areas that were deemed vacant or ‘not developed’ by land use category. Existing land use in the City’s sphere of influence is tabulated in Table 3-4. (Land uses presented in this Water Master Plan are solely for the purposes of estimating water demands.) About 46% of the area within the City’s sphere of influence remains as vacant land (2,516 acres).
Table 3-4 Existing Land Use
General Plan Land Use Category
Sphere of
Influence
Total Area
(Ac)
Existing
Developed
Area
(Ac)
Vacant
Area
(Ac)
% Vacant
by Land
Use
% of
Total
Vacant
Land
Residential
Low Density (3 to 7 DU/Ac) 1,977 1,127 850 43% 33%
Medium Density (15 DU/Ac) 621 364 257 41% 10%
Residential Subtotal 2,598 1,491 1,107 43% 44%
Commercial 704 349 355 50% 14%
Public Facilities 747 551 196 26% 8%
Industrial
Industrial 1,073 437 636 59% 25%
Light Industrial/Business 309 87 222 72% 9%
Industrial Subtotal 1,382 524 858 62% 34%
TOTAL 5,431 2,915 2,516 46% 100%

September 2012 3-9
3.3.3 Future Land Use Areas
3.3.3.1 Projected 2030 Development
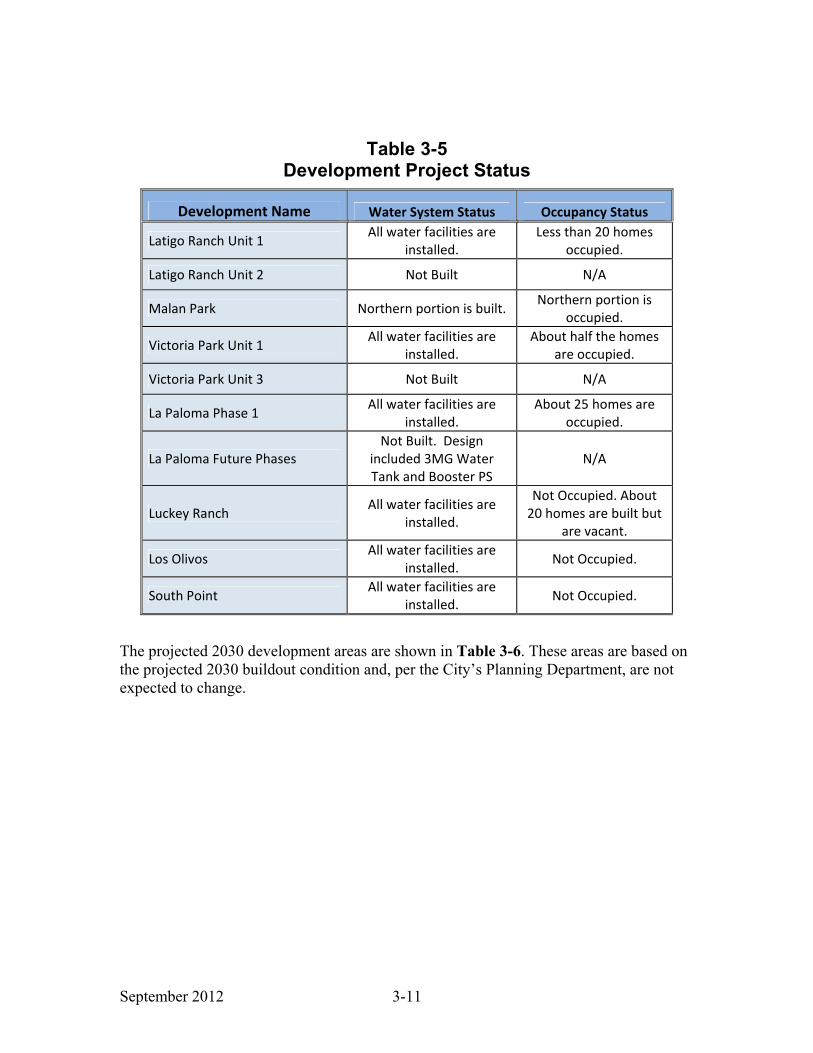
As shown in Table 3-3, the City has 2,516 acres of vacant land, of which 44 percent is zoned for future residential development. The other large future use is Industrial, with approximately one third of the area designated for this use. All of the vacant land is projected to be developed by the year 2030, which will increase demands on the City’s water system. Due to the downturn in the economy at the end of 2008, the City has a number of new developments where construction was halted before they were completed. These developments were largely residential and located on the south and east sides of town. See Table 3-5 for a summary of these projects and Figure 3-3 for their locations. Some of these projects, such as Luckey Ranch, have utilities and roads constructed as well as a few unoccupied homes. The figure also shows other planned developments that likely were intended to be constructed by now, but have been delayed and/or are being reevaluated. These projects have been incorporated into the future land use projections.

September 2012 3-11
Table 3-5 Development Project Status
Development Name Water System Status Occupancy Status
Latigo Ranch Unit 1 All water facilities are
installed.
Less than 20 homes
occupied.
Latigo Ranch Unit 2 Not Built N/A
Malan Park Northern portion is built. Northern portion is
occupied.
Victoria Park Unit 1 All water facilities are
installed.
About half the homes
are occupied.
Victoria Park Unit 3 Not Built N/A
La Paloma Phase 1 All water facilities are
installed.
About 25 homes are
occupied.
La Paloma Future Phases
Not Built. Design
included 3MG Water
Tank and Booster PS
N/A
Luckey Ranch All water facilities are
installed.
Not Occupied. About
20 homes are built but
are vacant.
Los Olivos All water facilities are
installed. Not Occupied.
South Point All water facilities are
installed. Not Occupied.
The projected 2030 development areas are shown in Table 3-6. These areas are based on the projected 2030 buildout condition and, per the City’s Planning Department, are not expected to change.

September 2012 3-12
Table 3-6 Projected 2030 Land Use
General Plan Land Use Category
Projected 2030
(Sphere of
Influence)
Total Area
(Ac)
Residential
Low Density (3 to 7 DU/Ac) 1,977
Medium Density (15 DU/Ac) 621
Residential Subtotal 2,598
Commercial 704
Public Facilities 747
Industrial
Industrial 1,073
Light Industrial/Business 309
Industrial Subtotal 1,382
TOTAL 5,431
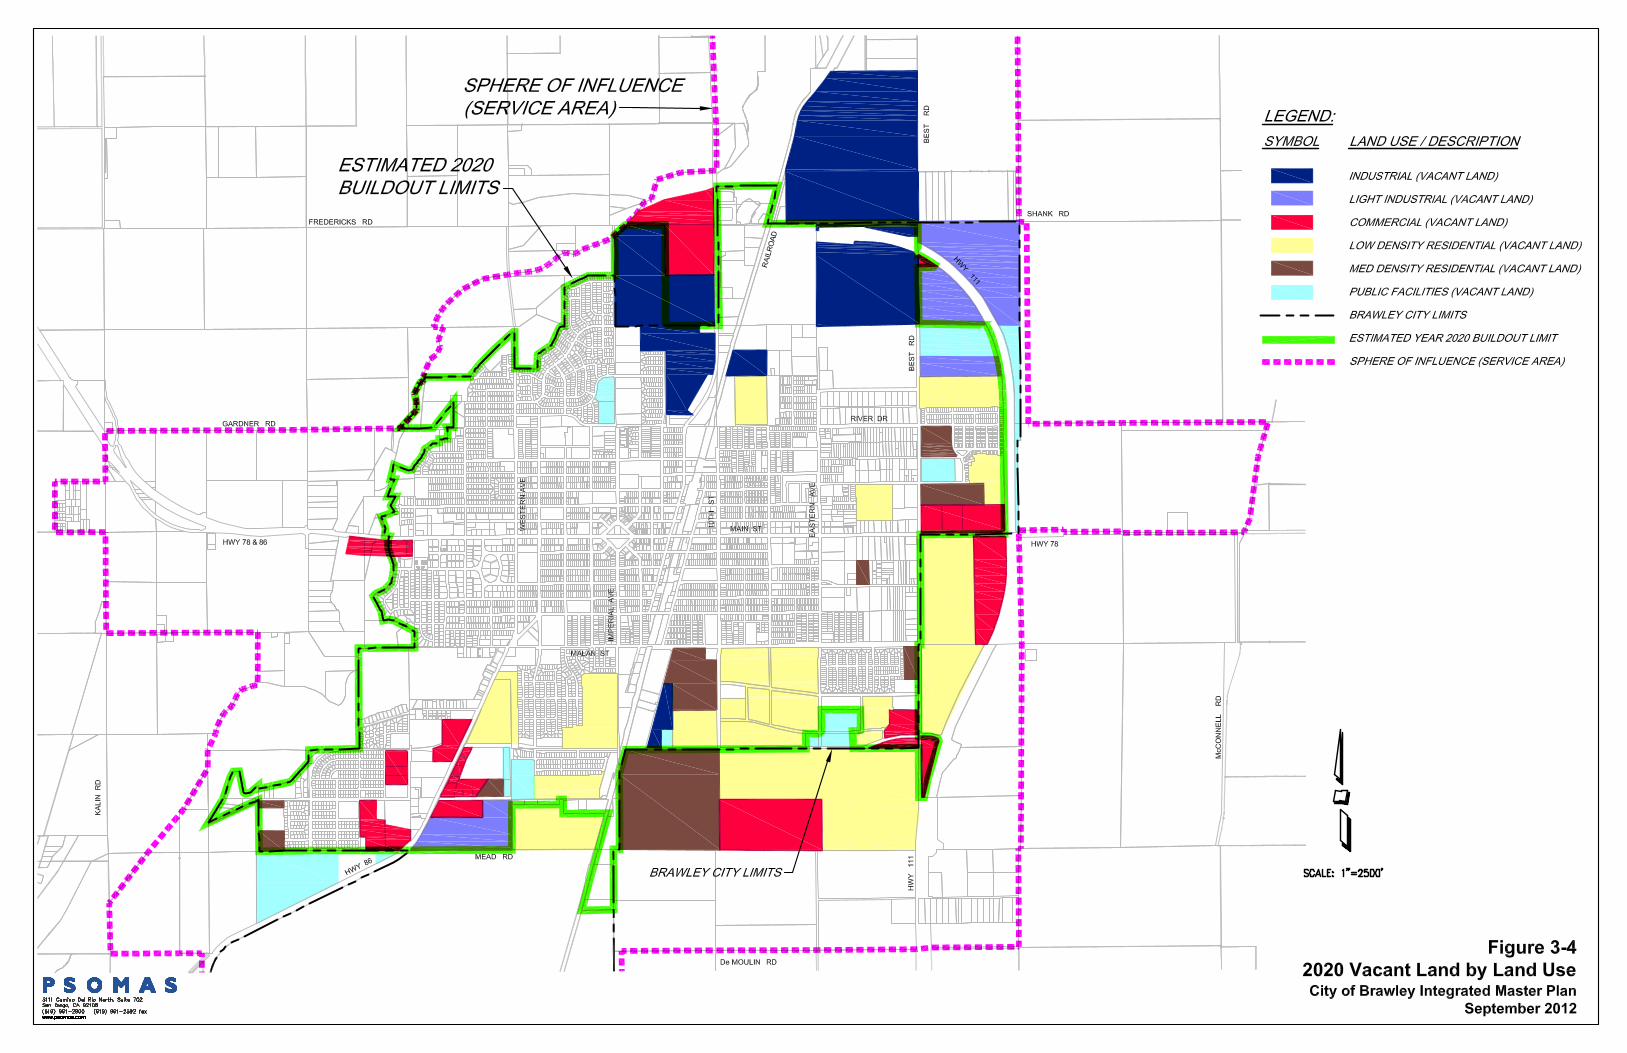
3.3.3.2 Projected 2020 Development
In addition to the year 2030 buildout condition, this Master Plan is also evaluating the projected year 2020 development and corresponding water demands. The 2020 projected development areas are shown in Table 3-7 and Figure 3-4. These areas were calculated based on the assumption that development will occur at a relatively constant rate between now and the projected 2030 buildout condition.
September 2012 3-14
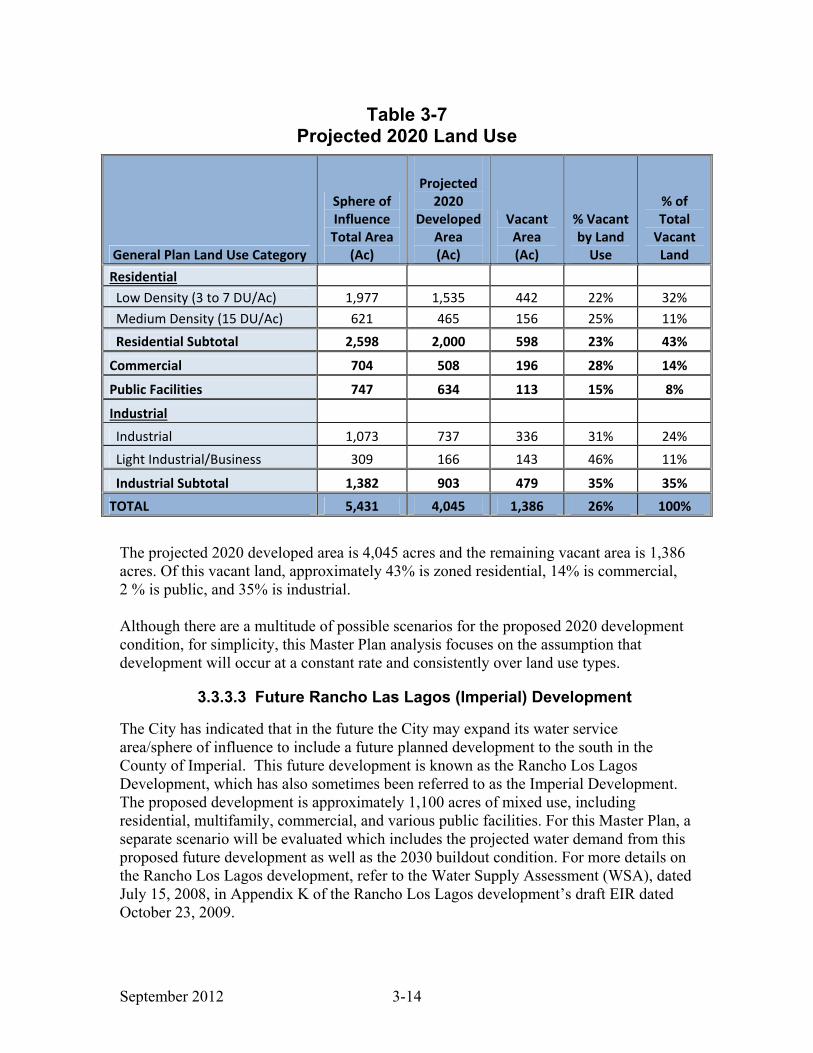
Table 3-7 Projected 2020 Land Use
General Plan Land Use Category
Sphere of
Influence
Total Area
(Ac)
Projected
2020
Developed
Area
(Ac)
Vacant
Area
(Ac)
% Vacant
by Land
Use
% of
Total
Vacant
Land
Residential
Low Density (3 to 7 DU/Ac) 1,977 1,535 442 22% 32%
Medium Density (15 DU/Ac) 621 465 156 25% 11%
Residential Subtotal 2,598 2,000 598 23% 43%
Commercial 704 508 196 28% 14%
Public Facilities 747 634 113 15% 8%
Industrial
Industrial 1,073 737 336 31% 24%
Light Industrial/Business 309 166 143 46% 11%
Industrial Subtotal 1,382 903 479 35% 35%
TOTAL 5,431 4,045 1,386 26% 100%
The projected 2020 developed area is 4,045 acres and the remaining vacant area is 1,386 acres. Of this vacant land, approximately 43% is zoned residential, 14% is commercial, 2 % is public, and 35% is industrial. Although there are a multitude of possible scenarios for the proposed 2020 development condition, for simplicity, this Master Plan analysis focuses on the assumption that development will occur at a constant rate and consistently over land use types.
3.3.3.3 Future Rancho Las Lagos (Imperial) Development
The City has indicated that in the future the City may expand its water service area/sphere of influence to include a future planned development to the south in the County of Imperial. This future development is known as the Rancho Los Lagos Development, which has also sometimes been referred to as the Imperial Development. The proposed development is approximately 1,100 acres of mixed use, including residential, multifamily, commercial, and various public facilities. For this Master Plan, a separate scenario will be evaluated which includes the projected water demand from this proposed future development as well as the 2030 buildout condition. For more details on the Rancho Los Lagos development, refer to the Water Supply Assessment (WSA), dated July 15, 2008, in Appendix K of the Rancho Los Lagos development’s draft EIR dated October 23, 2009.

September 2012 3-15
3.3.4 Land Use Summary
Table 3-8 shows a summary of the existing and projected land use acreages for each of the planning years.
Table 3-8 Summary of Existing and Projected Land Use
General Plan Land Use Category Existing (Ac) 2020 (Ac) 2030 (Ac)
Residential
Low Density (3 to 7 DU/Ac) 1,127 1,535 1,977
Medium Density (15 DU/Ac) 364 465 621
Residential Subtotal 1,491 2,000 2,598
Commercial 349 508 704
Public Facilities 551 634 747
Industrial
Industrial 437 737 1,073
Light Industrial/Business 87 166 309
Industrial Subtotal 524 903 1,382
Total Developed Area 2,915 4,045 5,431
3.4 Water Demand Calculations
The historical per capita consumption rate can be multiplied by population projections to estimate future water demands. However, land use-derived water demands provide a more accurate representation of the locations of increased water demands. Therefore, the water system demands within the City’s sphere of influence were calculated using land use information.
The resulting water demands represent the water system demands for an average day of the year. Seasonal and daily variations in the water demands are accounted for by using various peaking factors times the ADD to simulate other demand periods. These multipliers, or peaking factors, were developed to calculate the maximum day and peak hour demands using ADD as a basis.
3.4.1 Water Demand and Factors
3.4.1.1 Existing System Water Demand and Factors
For the existing system, water demand factors were determined by evaluating a combination of historical data, metered data, and similar factors used for other similar cities. Water demand factors for residential areas, as well as the City’s 20 largest users, were developed from City-provided meter data for the years 2009 and 2010.
September 2012 3-16
For the low density and medium density residential demand factors, specific areas of the City were selected that had only that specific residential land use. The individual meter readings within that area were then tabulated and divided by the estimated acreage to generate an average usage per acre for each land use category. Using this methodology, the resulting water demand factors were estimated to be 2,514 gpd/acre for low density residential and 3,000 gpd/acre for medium density residential. Distributing the 2010 census population, as shown in Table 3-3, of 24,953, over an estimated total low density residential land usage of 1,127 acres and medium density residential land usage of 364 acres, equates to an average existing residential demand rate of 157 gpd per person. In developing the demand factors, the 20 largest water users were identified, based on the metered data, and isolated out of the residential demand factor calculation described above. This was done so these large users would not skew the results and would provide a more realistic demand factor for the other existing land use areas. Table 3-9 shows the 20 largest water users with their associated acreages and average water usage.

September 2012 3-17
Table 3-9 Existing Largest Water User Demands
Largest Water Users Land Use
Area
(ac)
Average Day
Water
Demand
(MGD)
1 National Beef Plant Industrial 96.0 1.620
2 Pioneer Hospital Commercial 14.0 0.061
3 I.V. Housing Authority (1250
N. Imp.)
Medium Density Residential 8.0 0.056
4 Crown Cooling Industrial 18.0 0.053
5 Salton Village Apartments Medium Density Residential 2.2 0.038
6 Travel Inn Commercial 1.4 0.028
7 I.V. Housing Authority (950
N. Imp.)
Medium Density Residential 13.0 0.027
8 Walmart Stores Commercial 19.0 0.027
9 Brawley Family Apartments Medium Density Residential 5.0 0.024
10 D'Arrigo Brothers Industrial 6.0 0.019
11 Priest Development Corp. Medium Density Residential 8.0 0.019
12 DS Water of America Industrial 0.5 0.018
13 Amcal Housing, Inc.
(1605,1623 C)
Medium Density Residential 4.0 0.018
14 Malan Mobile Home Park Medium Density Residential 6.0 0.018
15 Brawley M.O.B, LLC
(Hospital)
Commercial 4.5 0.016
16 Spring-Encino Apartments Medium Density Residential 4.0 0.016
17 Green Valley Farms Industrial 3.3 0.016
18 Housing Authority (820 N.
Imp.)
Medium Density Residential 17.0 0.015
19 Brawley Park Imperial, LLC Medium Density Residential 3.0 0.013
20 Spring-Encino Apartments
(1165 B)
Medium Density Residential 2.0 0.012
Totals 235.0 2.115
The schools are not metered. Therefore, current school populations were used to calculate their water demands, and their areas were isolated out of the demand factor by land use calculation as well. Table 3-10 shows the schools with their associated acreages and average water usage.

September 2012 3-18
Table 3-10 Existing School Water Demands
Schools (Public Facility Land Use)
Student
Population
Area
(ac)
Average Day
Water Demand
(MGD)
Brawley High School 1,750 18 0.035
Miguel Hidalgo Elementary 700 6 0.014
Oakley Elementary 750 8 0.015
Witter Elementary 720 11 0.014
Phil Swing Elementary 850 10 0.017
Barbara Worth Junior High 850 5 0.017
Totals 58 0.112
The metered data did not seem to provide enough consistency to be used in establishing accurate water demand factors for the commercial, public facility, industrial, and light industrial/business park land use areas. As a result, after isolating the 20 largest water users and isolating the school areas, the initial water demand factors for the subsequent land use areas were then adjusted so that the summation of all the water demands was close to the total existing demand of 7.53 MGD. These resulting demand factors are comparable to other demand factors used for similar cities in the desert when it is considered that the big users and schools are not included.
Open space, agriculture, rural residential, transportation, and vacant/undeveloped land-use areas were assigned a value of 0 gpd/ac, as these uses do not have any significant water demand. The adjusted water demand factors are shown in Table 3-11. The resulting average day demands, less the demands for the 20 largest users and the schools, were estimated to be 5.304 MGD.
Table 3-11 Existing Water Demand and Factors by Land Use
Land Use Type Area (ac)
Water
Demand
Factor
(gpd/ac)
Average Day
Water
Demand
(MGD)
Low Density Residential 1,127 2,514 2.834
Medium Density Residential 292 3,000 0.876
Commercial 310 1,100 0.341
Public Facilities 493 1,100 0.542
Industrial 313 1,990 0.622
Light Industrial/Business Park 87 1,030 0.089
Totals 2,622 -- 5.304
September 2012 3-19
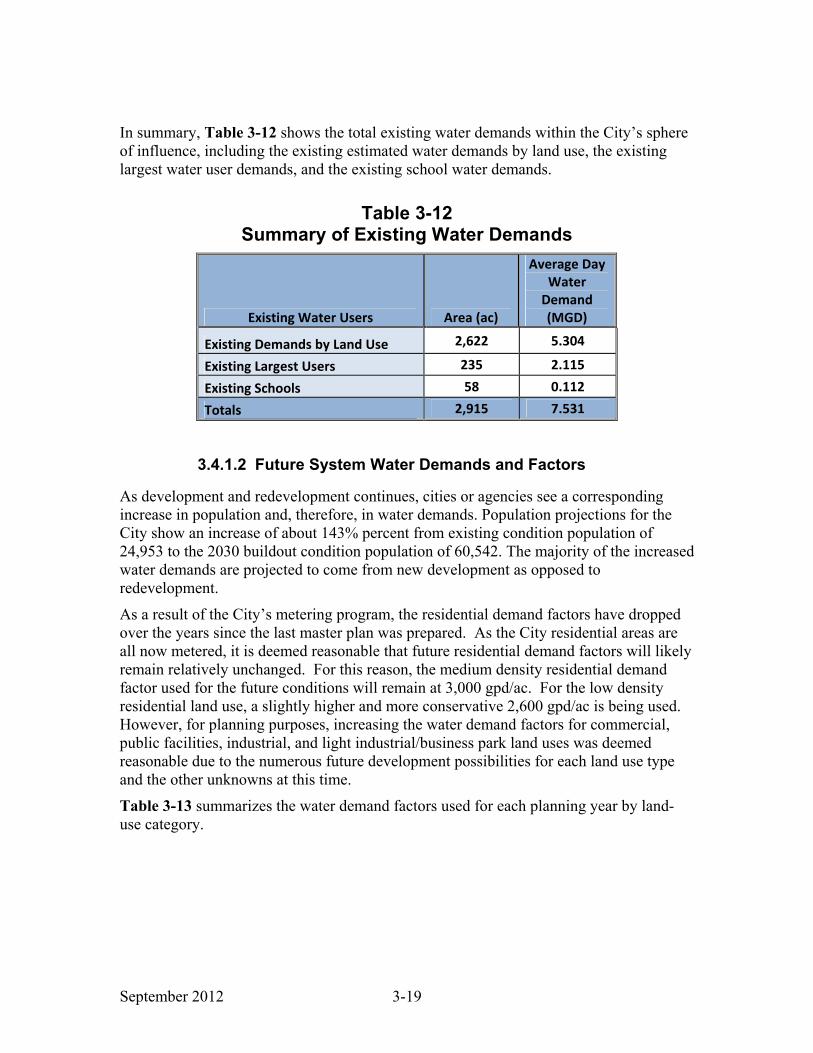
In summary, Table 3-12 shows the total existing water demands within the City’s sphere of influence, including the existing estimated water demands by land use, the existing largest water user demands, and the existing school water demands.
Table 3-12 Summary of Existing Water Demands
Existing Water Users Area (ac)
Average Day
Water
Demand
(MGD)
Existing Demands by Land Use 2,622 5.304
Existing Largest Users 235 2.115
Existing Schools 58 0.112
Totals 2,915 7.531
3.4.1.2 Future System Water Demands and Factors
As development and redevelopment continues, cities or agencies see a corresponding increase in population and, therefore, in water demands. Population projections for the City show an increase of about 143% percent from existing condition population of 24,953 to the 2030 buildout condition population of 60,542. The majority of the increased water demands are projected to come from new development as opposed to redevelopment.
As a result of the City’s metering program, the residential demand factors have dropped over the years since the last master plan was prepared. As the City residential areas are all now metered, it is deemed reasonable that future residential demand factors will likely remain relatively unchanged. For this reason, the medium density residential demand factor used for the future conditions will remain at 3,000 gpd/ac. For the low density residential land use, a slightly higher and more conservative 2,600 gpd/ac is being used. However, for planning purposes, increasing the water demand factors for commercial, public facilities, industrial, and light industrial/business park land uses was deemed reasonable due to the numerous future development possibilities for each land use type and the other unknowns at this time.
Table 3-13 summarizes the water demand factors used for each planning year by land-use category.

September 2012 3-20
Table 3-13 Estimated Water Demand Factors by Planning Year
Land-use Type
Water Demand Factor (gpd/ac)
2010 2020 2030
Low Density Residential 2,514 2,600 2,600
Medium Density Residential 3,000 3,000 3,000
Commercial 1,100 2,000 2,000
Public Facilities 1,100 2,000 2,000
Industrial 1,990 3,500 3,500
Light Industrial/Business Park 1,030 2,000 2,000
Future 2030 Water Demands and Factors
Table 3-14 shows the future water demands for the projected 2030 buildout condition by land use category. It is projected that an additional water demand of 6.7 MGD will be added to the system by the year 2030. This will increase the total system demand to 14.3 MGD, slightly less than double the existing demand of 7.5 MGD.
Table 3-14 Future 2030 Water Demands by Land Use
Land Use Type &
Existing Users
Additional
2030
Developed
Area (ac)
Water
Demand
Factor
(gpd/ac)
Additional
2030
Average
Day Water
Demand
(MGD)
Existing
Average Day
Water
Demand
(MGD)
Total 2030
Average Day
Water
Demand
(MGD)
Low Density Residential 850 2,600 2.209 2.834 5.043
Medium Density
Residential 257 3,000 0.770 0.876 1.646
Commercial 355 2,000 0.709 0.341 1.050
Public Facilities 196 2,000 0.392 0.542 0.934
Industrial 636 3,500 2.224 0.622 2.846
Light
Industrial/Business Park
222 2,000 0.443 0.090 0.532
Existing Largest Users -- -- -- 2.115 2.115
Existing Schools -- -- -- 0.112 0.112
Totals 2,516 -- 6.747 7.531 14.278
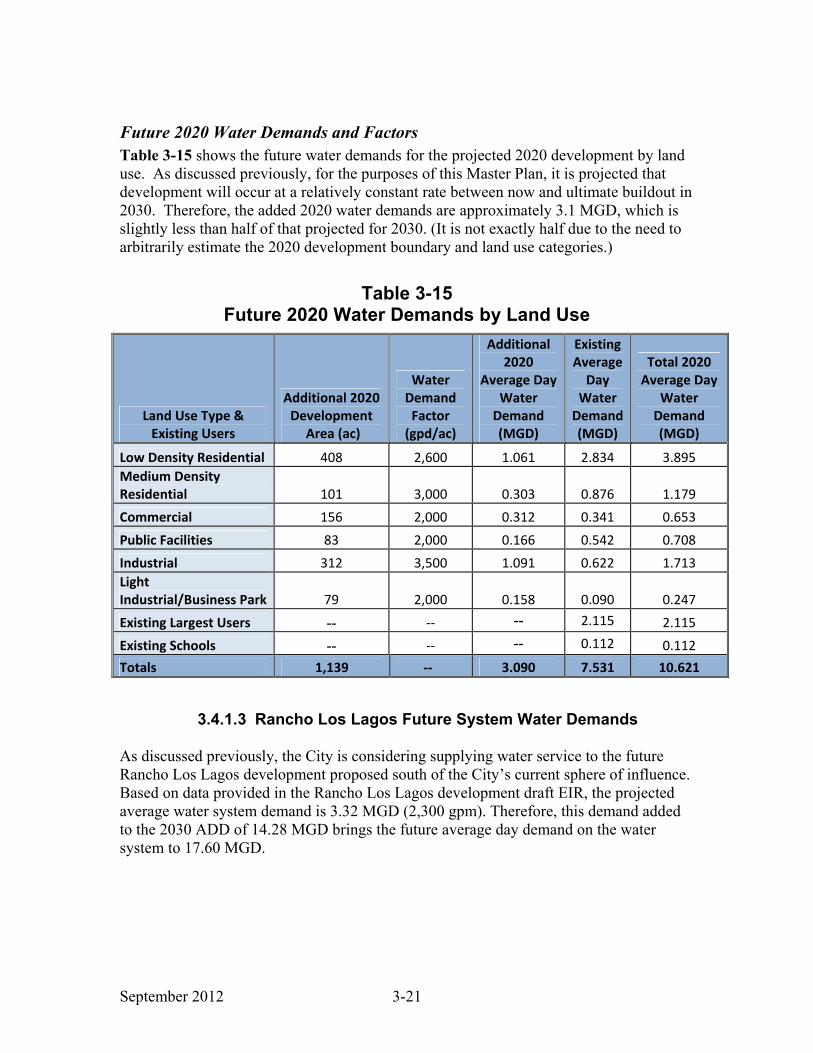
September 2012 3-21
Future 2020 Water Demands and Factors
Table 3-15 shows the future water demands for the projected 2020 development by land use. As discussed previously, for the purposes of this Master Plan, it is projected that development will occur at a relatively constant rate between now and ultimate buildout in 2030. Therefore, the added 2020 water demands are approximately 3.1 MGD, which is slightly less than half of that projected for 2030. (It is not exactly half due to the need to arbitrarily estimate the 2020 development boundary and land use categories.)
Table 3-15 Future 2020 Water Demands by Land Use
Land Use Type &
Existing Users
Additional 2020
Development
Area (ac)
Water
Demand
Factor
(gpd/ac)
Additional
2020
Average Day
Water
Demand
(MGD)
Existing
Average
Day
Water
Demand
(MGD)
Total 2020
Average Day
Water
Demand
(MGD)
Low Density Residential 408 2,600 1.061 2.834 3.895
Medium Density
Residential 101 3,000 0.303 0.876 1.179
Commercial 156 2,000 0.312 0.341 0.653
Public Facilities 83 2,000 0.166 0.542 0.708
Industrial 312 3,500 1.091 0.622 1.713
Light
Industrial/Business Park 79 2,000 0.158 0.090 0.247
Existing Largest Users -- -- -- 2.115 2.115
Existing Schools -- -- -- 0.112 0.112
Totals 1,139 -- 3.090 7.531 10.621
3.4.1.3 Rancho Los Lagos Future System Water Demands As discussed previously, the City is considering supplying water service to the future Rancho Los Lagos development proposed south of the City’s current sphere of influence. Based on data provided in the Rancho Los Lagos development draft EIR, the projected average water system demand is 3.32 MGD (2,300 gpm). Therefore, this demand added to the 2030 ADD of 14.28 MGD brings the future average day demand on the water system to 17.60 MGD.

September 2012 3-22
3.4.2 Peaking Factors and Demands
Peaking factors were developed in order to determine the water demands for conditions other than an average day's water use. Peaking factors account for fluctuations in demands on a daily or hourly basis. For example, during hot summer days, water use is typically higher than on a cold and/or rainy winter day. Common peaking factors include factors for maximum day demands (MDD), peak hour demand (PHD), and minimum day demand (MinDD) periods. Peaking factors are determined using the water system demands for a selected period and dividing the quantity by the ADD. The MDD factor, for example, is determined by comparing the water demands for the day of the year with the highest daily water demand to the ADD.
Variations in water demand also occur during a 24-hour period. In residential areas, there are often two peak-use periods, in the morning and again in the late afternoon. Areas that have automatic sprinkler systems for irrigation may also see peak periods late at night through the early morning hours.
System-wide peaking factors can be difficult to determine. An hourly water use curve, known as the system diurnal curve, is often developed for water systems to help identify how demands change through the day. This curve can be used to develop hourly factors used by the computer model. The following is a discussion of the development of each of the peaking factors developed for this study.
3.4.2.1 Average Day Demand
The ADD is calculated by dividing the total annual water demand by the number of days in a year. The ADD was taken from the Years 2009 and 2010, using the metered data and WTP flows. For the City, the average annual water production for these two calendar years was used to establish the average day demand of 8,434 ac-ft/yr, resulting in an average daily production of 7.53 MGD (5,230 gpm).
3.4.2.2 Maximum Day Peaking Factor
The maximum day peaking factor represents the ratio of the largest daily demand observed in the year to the ADD for the same year. This factor can then be applied to the ADD of future planning years to project maximum day water demands. MDDs are commonly used to establish production and pumping capacity requirements system-wide.
Historical water production records for the Years 2009 and 2010 were used to establish the maximum day peaking factor. As City records provide information on total water production on a daily basis, MDDs can then be researched. Table 3-16 summarizes the maximum day production and peaking factor for the given years. The maximum day peaking factor used for system modeling and future projections in this Master Plan is 1.5, which is an approximate average of the two years.

September 2012 3-23
Table 3-16 Maximum Day Peaking Factors
Year
Maximum Day
Date
Maximum Day
Production
(MGD)
Average Day
Production
(MGD)
Maximum
Day Peaking
Factor
2009 7/30/2009 11.49 7.87 1.46
2010 7/2/2010 11.19 7.19 1.56
Maximum Day Peaking Factor 1.5
3.4.2.3 Peak Hour Peaking Factor
PHD represents the hour with the highest water system demand during the maximum day. Water systems often experience the highest demand on reservoirs and booster stations during peak hour. This period can also be the controlling demand period for pipeline sizing, although the maximum day plus fire flow demand is often more critical. Minimum water system criteria, such as the minimum allowable system pressure, are often evaluated using peak hour demands.
The peak hour peaking factor developed for the City’s water system was based on peak hourly production data provided from the WTP for the Year 2010. Peak hour data from historical readings for the WTP indicate a peak hour flow of 16.9 MGD occurred on July 20, 2010. Based on this hourly demand, the peak hourly demand was determined to be 2.2 times the ADD.
3.4.2.4 Minimum Day Demand Factor
MinDDs in this Master Plan represent the lowest water system demand during the day. The minimum day demand factor developed for the City’s water system was based on 2010 production data provided from the WTP. Based on this data, the minimum day demand was determined to be 0.2 times the ADD.
3.4.2.5 Existing System Peaking Factors and Demand Summary
The average water demand for the City’s water system is currently 7.53 MGD. Using the maximum day peaking factor of 1.5, the MDD for the existing system is 11.3 MGD. For the PHD, a peaking factor of 2.2 times ADD results in peak hour flows of 16.56 MGD. Table 3-17 summarizes the resulting peaking factors and existing system demands for average day, maximum day, peak hour, and minimum day demand.
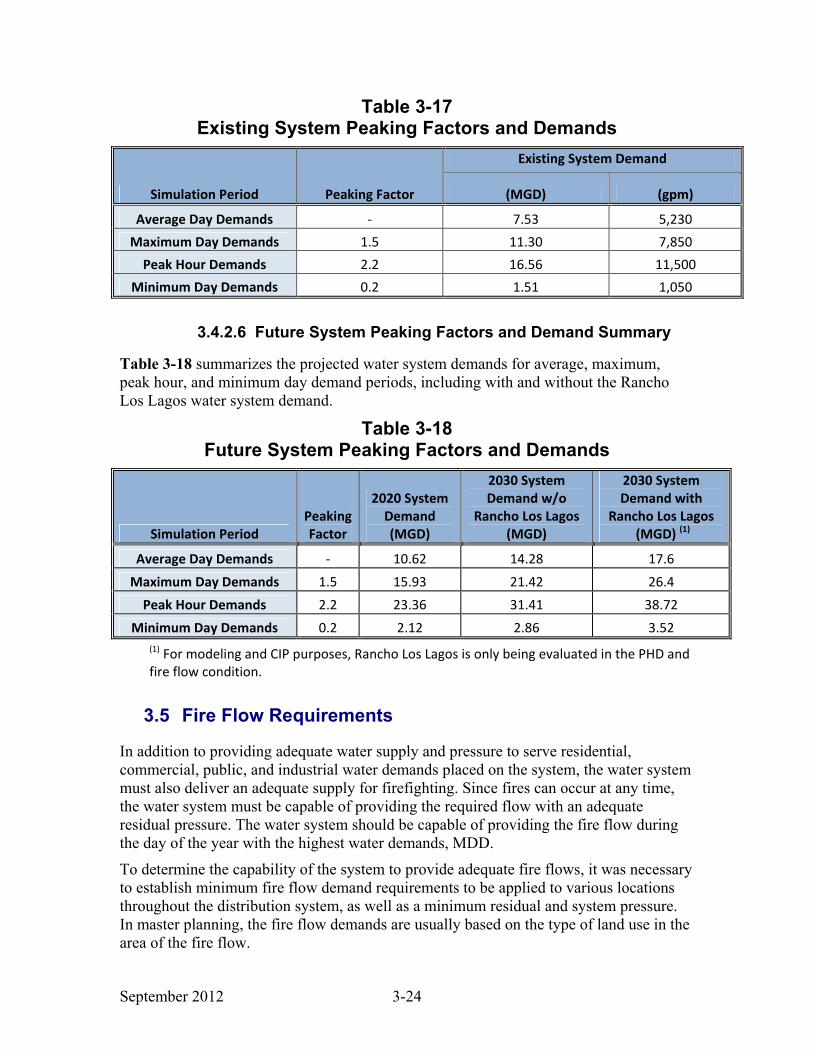
September 2012 3-24
Table 3-17 Existing System Peaking Factors and Demands
Simulation Period Peaking Factor
Existing System Demand
(MGD) (gpm)
Average Day Demands - 7.53 5,230
Maximum Day Demands 1.5 11.30 7,850
Peak Hour Demands 2.2 16.56 11,500
Minimum Day Demands 0.2 1.51 1,050
3.4.2.6 Future System Peaking Factors and Demand Summary
Table 3-18 summarizes the projected water system demands for average, maximum, peak hour, and minimum day demand periods, including with and without the Rancho Los Lagos water system demand.
Table 3-18 Future System Peaking Factors and Demands
Simulation Period
Peaking
Factor
2020 System
Demand
(MGD)
2030 System
Demand w/o
Rancho Los Lagos
(MGD)
2030 System
Demand with
Rancho Los Lagos
(MGD) (1)
Average Day Demands - 10.62 14.28 17.6
Maximum Day Demands 1.5 15.93 21.42 26.4
Peak Hour Demands 2.2 23.36 31.41 38.72
Minimum Day Demands 0.2 2.12 2.86 3.52
(1) For modeling and CIP purposes, Rancho Los Lagos is only being evaluated in the PHD and
fire flow condition.
3.5 Fire Flow Requirements
In addition to providing adequate water supply and pressure to serve residential, commercial, public, and industrial water demands placed on the system, the water system must also deliver an adequate supply for firefighting. Since fires can occur at any time, the water system must be capable of providing the required flow with an adequate residual pressure. The water system should be capable of providing the fire flow during the day of the year with the highest water demands, MDD.
To determine the capability of the system to provide adequate fire flows, it was necessary to establish minimum fire flow demand requirements to be applied to various locations throughout the distribution system, as well as a minimum residual and system pressure. In master planning, the fire flow demands are usually based on the type of land use in the area of the fire flow.

September 2012 3-25
The fire flow requirements are summarized in Table 3-19. The criteria listed were developed based on local codes, criteria used in other similar agencies, and previous discussions with City of Brawley Fire Department.
Table 3-19 Fire Flow Requirements
Land Use Category
Minimum Fire
Flow Required
(gpm)
Minimum
Residual
Pressure (psi)
Duration
(hrs)
Low Density Residential 1500 20 2
Medium Density Residential 2500 20 2
Commercial/Public/Light
Industrial and Business Park 3000 20 3
Industrial 5000 20 4
Beef Plant/Hospital 6000 20 4
September 2012 4-1
4.0 Water Supply
Historical Potable Water Production
Potable water production is measured by the WTP metered flows. Historical potable water production for 8 years, 2003 through 2010, was shown previously in Table 3-1. The total supply is regulated only by the total amount of water that can be treated and pumped at the WTP. As shown in Table 3-2 the City provides an average annual water supply of 8,434 ac-ft/yr, (7.53 MGD) to meet water system demands.
4.1 City Water Supplies
4.1.1 IID Current Agreement and Redundant Supply
The City of Brawley has a long standing agreement with IID to provide raw water to the City via the Colorado River and the All American Canal. From the All American Canal, water flows through various IID-owned and operated canals, including the Mansfield Canal, which delivers raw water directly to the City of Brawley Water Treatment Plant. The Mansfield Canal has a capacity of 19 MGD. The City does not have a redundant supply of raw water.
4.2 Future Water Supply Sources
Currently, there are no practical alternative water supplies for the City. The local groundwater is high in Total Dissolved Solids (TDS) and other agricultural pollutants. The New and Alamo Rivers also are high in TDS and pollutants. There are no other sources of new water available to the City in the foreseeable future. Accordingly, the City is entirely dependent on IID for their water supplies. However, since the municipal demands only account for around 3 percent of IID’s total demand, even major impacts to the Colorado River supplies would not have a significant impact on municipal supplies. The City’s 2010 Urban Water Management Plan describes IID’s significant water rights to the Colorado supply and states it is doubtful that any drought-related cutbacks would impact municipal supplies.
4.2.1 Water Conservation
The City has recently completed installing meters on all domestic services and many commercial and industrial users. This has resulted in apparent reduction in water usage, lowering the per capita demands. This could be due to an increased awareness by the users and the associated costs from excessive or wasteful usage. As shown in Section 3.4.1.1, the City’s current per capita usage is estimated to be 157 gpcd. This is a 40% per capita reduction from the 259 gpcd used in the 1999 Water Master Plan.
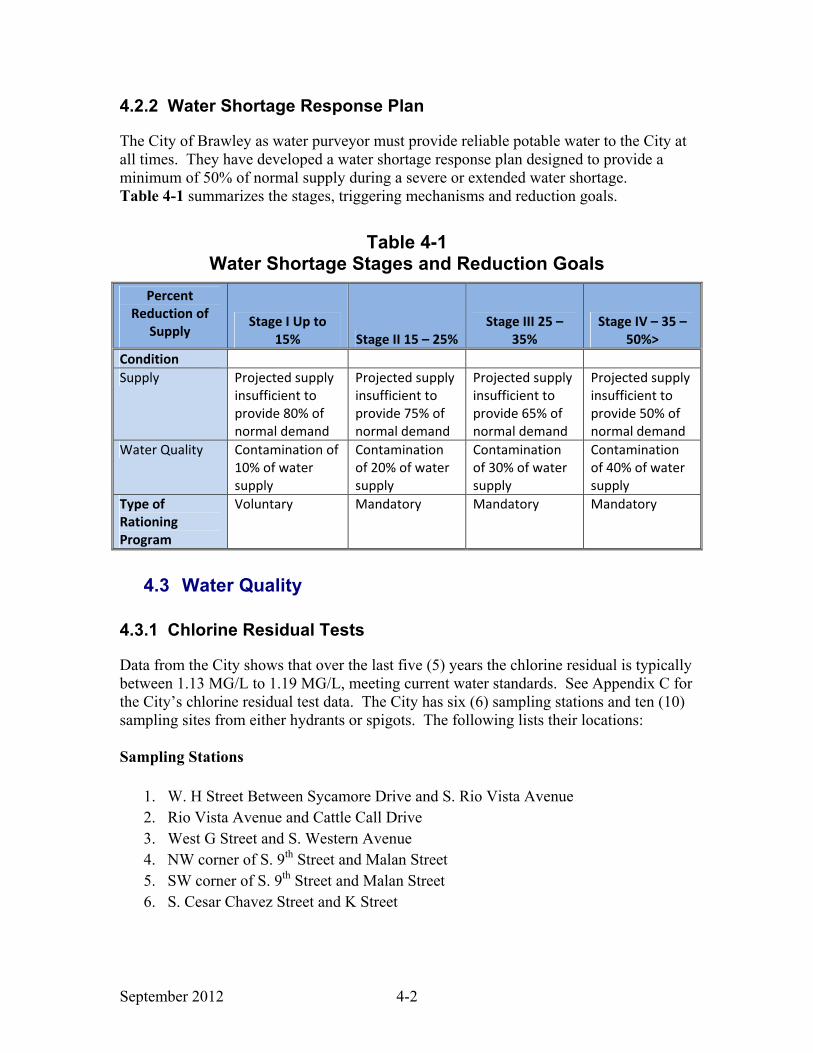
September 2012 4-2
4.2.2 Water Shortage Response Plan
The City of Brawley as water purveyor must provide reliable potable water to the City at all times. They have developed a water shortage response plan designed to provide a minimum of 50% of normal supply during a severe or extended water shortage. Table 4-1 summarizes the stages, triggering mechanisms and reduction goals.
Table 4-1 Water Shortage Stages and Reduction Goals
Percent
Reduction of
Supply Stage I Up to
15% Stage II 15 – 25%
Stage III 25 –
35%
Stage IV – 35 –
50%>
Condition
Supply Projected supply
insufficient to
provide 80% of
normal demand
Projected supply
insufficient to
provide 75% of
normal demand
Projected supply
insufficient to
provide 65% of
normal demand
Projected supply
insufficient to
provide 50% of
normal demand
Water Quality Contamination of
10% of water
supply
Contamination
of 20% of water
supply
Contamination
of 30% of water
supply
Contamination
of 40% of water
supply
Type of
Rationing
Program
Voluntary Mandatory Mandatory Mandatory
4.3 Water Quality
4.3.1 Chlorine Residual Tests
Data from the City shows that over the last five (5) years the chlorine residual is typically between 1.13 MG/L to 1.19 MG/L, meeting current water standards. See Appendix C for the City’s chlorine residual test data. The City has six (6) sampling stations and ten (10) sampling sites from either hydrants or spigots. The following lists their locations: Sampling Stations
1. W. H Street Between Sycamore Drive and S. Rio Vista Avenue
2. Rio Vista Avenue and Cattle Call Drive
3. West G Street and S. Western Avenue
4. NW corner of S. 9th Street and Malan Street
5. SW corner of S. 9th Street and Malan Street
6. S. Cesar Chavez Street and K Street

September 2012 4-3
Sampling Sites
1. Cattle Call Drive & Rio Vista Avenue Hydrant
2. South 9th Street & H Street Hydrant
3. North 5th Street & Magnolia Street Hydrant
4. 1656 River Drive Hydrant
5. Pioneers Memorial Hospital
6. Hidalgo School
7. Imperial Oasis, 590 West Main Street
8. Witter School
9. Brawley Auto Body, 1667 Main Street
10. Imperial Valley Apts., 694 N. 3rd Street
11. 3.0 MG tank, 1515 Jones Street
12. Police Department
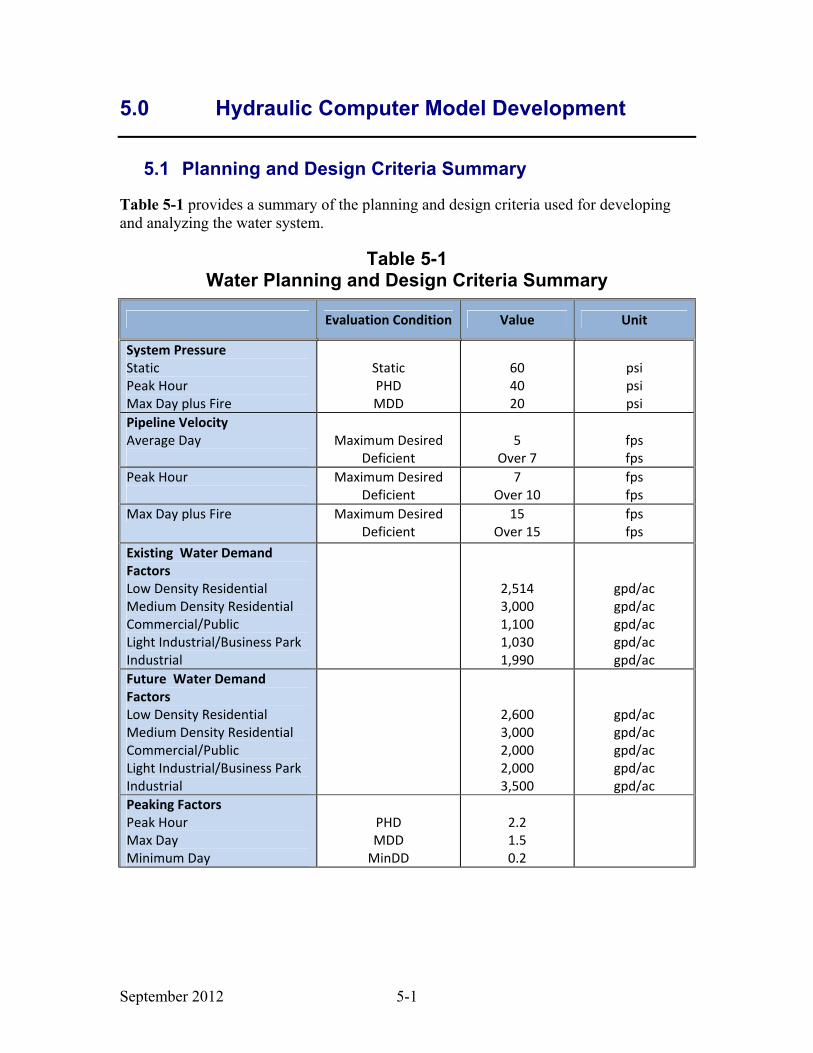
September 2012 5-1
5.0 Hydraulic Computer Model Development
5.1 Planning and Design Criteria Summary
Table 5-1 provides a summary of the planning and design criteria used for developing and analyzing the water system.
Table 5-1 Water Planning and Design Criteria Summary
Evaluation Condition Value Unit
System Pressure
Static
Peak Hour
Max Day plus Fire
Static
PHD
MDD
60
40
20
psi
psi
psi
Pipeline Velocity
Average Day
Maximum Desired
Deficient
5
Over 7
fps
fps
Peak Hour
Maximum Desired
Deficient
7
Over 10
fps
fps
Max Day plus Fire Maximum Desired
Deficient
15
Over 15
fps
fps
Existing Water Demand
Factors
Low Density Residential
Medium Density Residential
Commercial/Public
Light Industrial/Business Park
Industrial
2,514
3,000
1,100
1,030
1,990
gpd/ac
gpd/ac
gpd/ac
gpd/ac
gpd/ac
Future Water Demand
Factors
Low Density Residential
Medium Density Residential
Commercial/Public
Light Industrial/Business Park
Industrial
2,600
3,000
2,000
2,000
3,500
gpd/ac
gpd/ac
gpd/ac
gpd/ac
gpd/ac
Peaking Factors
Peak Hour
Max Day
Minimum Day
PHD
MDD
MinDD
2.2
1.5
0.2

September 2012 5-2
Evaluation Condition Value Unit
Fire Flow Requirements
Low Density Residential
Medium Density Residential
Commercial/Public
Light Industrial/Business Park
Industrial
Beef Plant/Hospital
MDD
MDD
MDD
MDD
MDD
MDD
1,500
2,500
3,000
3,000
5,000
6,000
gpm for 2 hours
gpm for 2 hours
gpm for 3 hours
gpm for 3 hours
gpm for 4hours
gpm for 4 hours
Treated Water Storage
Operational
Fire Flow
Emergency
MDD
Largest Fire
MDD
30%
6,000
100%
Gallons
gpm for 4 hours
Gallons
Raw Water Storage
Emergency ADD 6 days MG
5.2 Hydraulic Model
The model development and analysis for this 2012 Master Plan is being completed primarily within the computer modeling software “InfoWater”, with the final model deliverables being exported to EPANet files for the City’s use. To develop the current hydraulic model, initially the previous 1999 water model was imported into InfoWater and then edits were made to it to reflect changes that have occurred to the water system since 1999.
5.3 Previous Computer Model
The City’s previous hydraulic model, completed by Weston and Pountney Associates in 1999, was developed and calibrated in a water modeling software called Cybernet. The vendor providing this software was Haestad Methods, Inc. The base platform of the City’s previous hydraulic model was AutoCAD, with very little reference to GIS.
For this Master Plan, the City elected to leverage GIS by utilizing a hydraulic model that incorporates GIS features into the hydraulic model analyses. The roughness coefficients from the 1999 hydraulic model were used as a baseline value for the new hydraulic model. These values were adjusted based on current field testing and calibration efforts.
5.4 Hydraulic Model Software Program
Innovyze, Inc., has captured a large market share in Southern California and promotes the water modeling software brands H2ONET®, H2OMAP Water, and InfoWater. For the City’s purposes in hydraulic modeling, Innovyze’s InfoWater software was selected for evaluating the water distribution system.
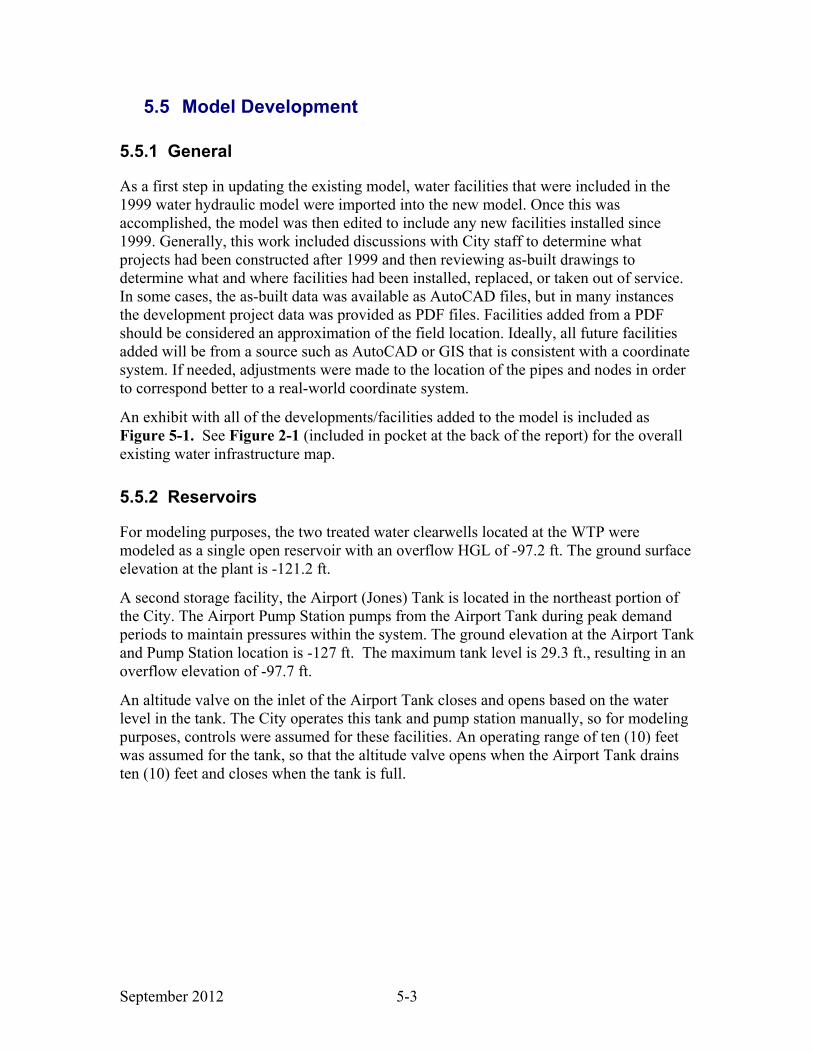
September 2012 5-3
5.5 Model Development
5.5.1 General
As a first step in updating the existing model, water facilities that were included in the 1999 water hydraulic model were imported into the new model. Once this was accomplished, the model was then edited to include any new facilities installed since 1999. Generally, this work included discussions with City staff to determine what projects had been constructed after 1999 and then reviewing as-built drawings to determine what and where facilities had been installed, replaced, or taken out of service. In some cases, the as-built data was available as AutoCAD files, but in many instances the development project data was provided as PDF files. Facilities added from a PDF should be considered an approximation of the field location. Ideally, all future facilities added will be from a source such as AutoCAD or GIS that is consistent with a coordinate system. If needed, adjustments were made to the location of the pipes and nodes in order to correspond better to a real-world coordinate system.
An exhibit with all of the developments/facilities added to the model is included as Figure 5-1. See Figure 2-1 (included in pocket at the back of the report) for the overall existing water infrastructure map.
5.5.2 Reservoirs
For modeling purposes, the two treated water clearwells located at the WTP were modeled as a single open reservoir with an overflow HGL of -97.2 ft. The ground surface elevation at the plant is -121.2 ft.
A second storage facility, the Airport (Jones) Tank is located in the northeast portion of the City. The Airport Pump Station pumps from the Airport Tank during peak demand periods to maintain pressures within the system. The ground elevation at the Airport Tank and Pump Station location is -127 ft. The maximum tank level is 29.3 ft., resulting in an overflow elevation of -97.7 ft.
An altitude valve on the inlet of the Airport Tank closes and opens based on the water level in the tank. The City operates this tank and pump station manually, so for modeling purposes, controls were assumed for these facilities. An operating range of ten (10) feet was assumed for the tank, so that the altitude valve opens when the Airport Tank drains ten (10) feet and closes when the tank is full.
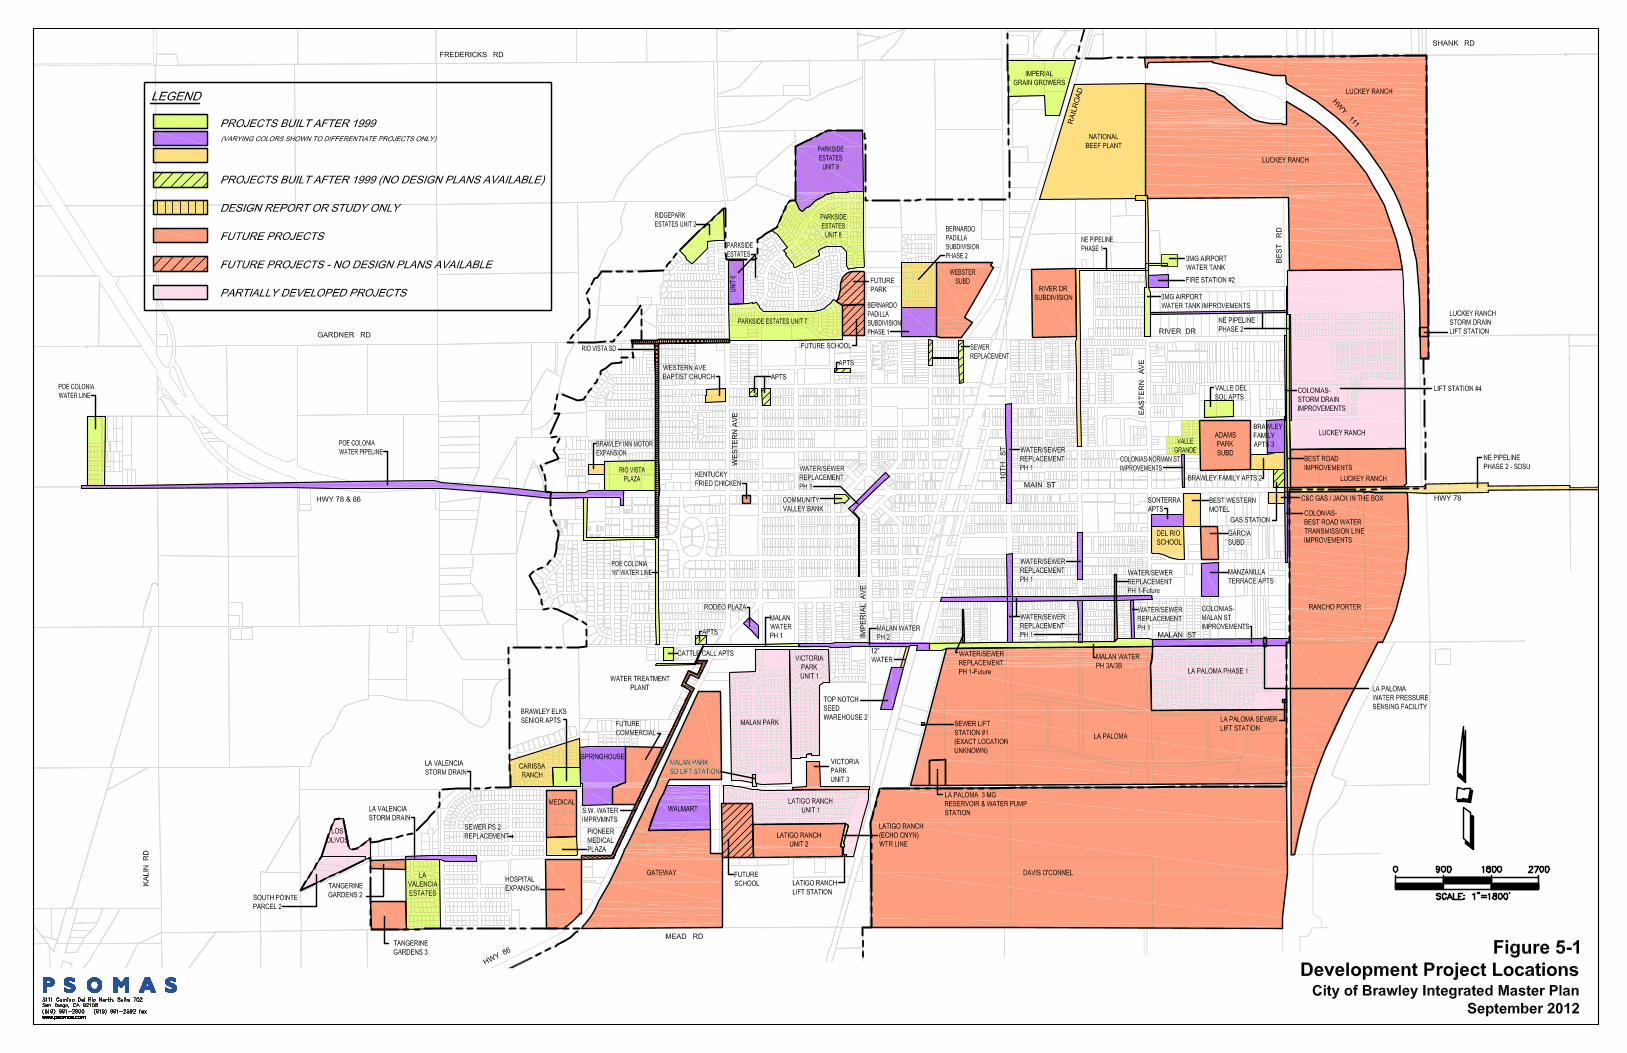

September 2012 5-5
5.5.3 Pump Stations
The pumps at the Water Treatment Plant (WTP) and Airport Pump Station were entered in the model with multi-point curves taken from the original pump design data. The same curve was used for the five (5) WTP pumps and a different curve for each of the three (3) Airport pumps. There are four (4) variable frequency drive (VFD) pumps at the WTP and one (1) constant speed pump. The pumps and their design points are summarized in Table 5-2. Figures 5-2 and 5-3 show the curves used in the model for the WTP pumps and the Airport Pump Station pumps.
Table 5-2 Summary of Pump Data
Pump ID
Variable or
Constant Speed
Total Design
Head (ft)
Design
Flow (gpm)
FWP-421 (WTP) Variable 155 4,000
FWP-422 (WTP) Variable 155 4,000
FWP-423 (WTP) Variable 155 4,000
FWP-424 (WTP) Variable 155 4,000
FWP-425 (WTP) Constant 155 4,000
PMP-B-1 (Airport PS) Constant 140 1,600
PMP-B-2 (Airport PS) Constant 140 1,600
PMP-B-3 (Airport PS) Constant 140 1,600
Figure 5-2 WTP Pump Station Curve
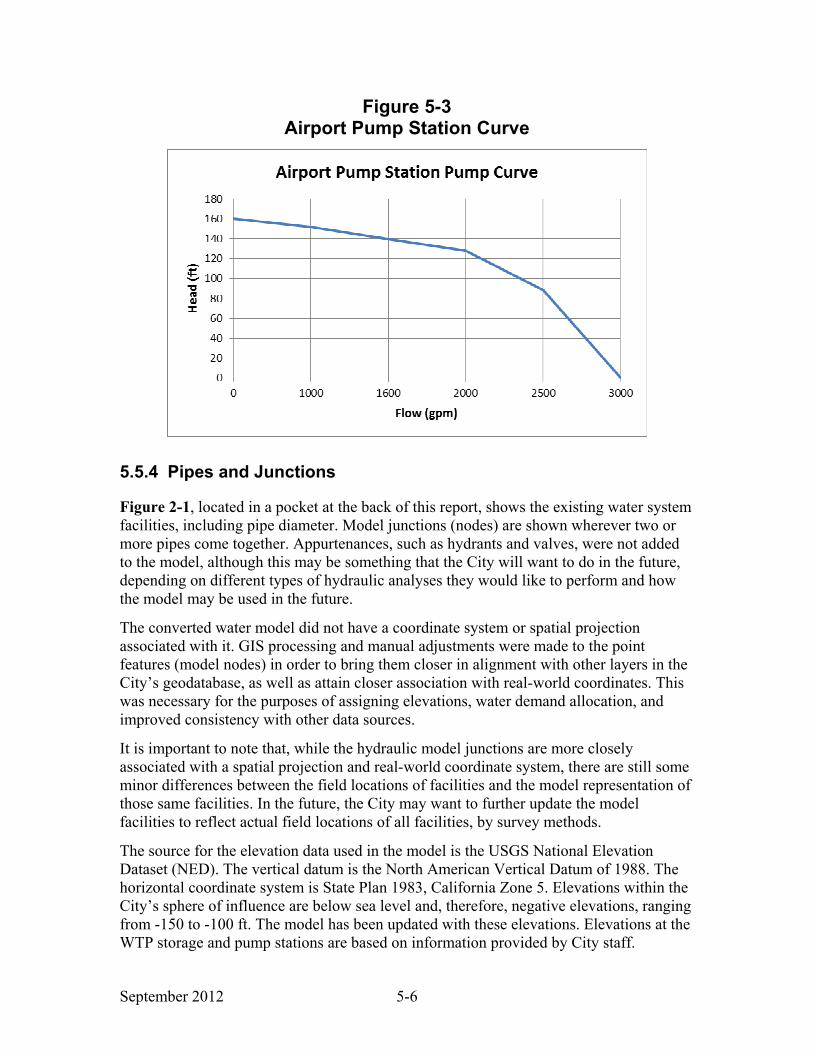
September 2012 5-6
Figure 5-3 Airport Pump Station Curve
5.5.4 Pipes and Junctions
Figure 2-1, located in a pocket at the back of this report, shows the existing water system facilities, including pipe diameter. Model junctions (nodes) are shown wherever two or more pipes come together. Appurtenances, such as hydrants and valves, were not added to the model, although this may be something that the City will want to do in the future, depending on different types of hydraulic analyses they would like to perform and how the model may be used in the future.
The converted water model did not have a coordinate system or spatial projection associated with it. GIS processing and manual adjustments were made to the point features (model nodes) in order to bring them closer in alignment with other layers in the City’s geodatabase, as well as attain closer association with real-world coordinates. This was necessary for the purposes of assigning elevations, water demand allocation, and improved consistency with other data sources.
It is important to note that, while the hydraulic model junctions are more closely associated with a spatial projection and real-world coordinate system, there are still some minor differences between the field locations of facilities and the model representation of those same facilities. In the future, the City may want to further update the model facilities to reflect actual field locations of all facilities, by survey methods.
The source for the elevation data used in the model is the USGS National Elevation Dataset (NED). The vertical datum is the North American Vertical Datum of 1988. The horizontal coordinate system is State Plan 1983, California Zone 5. Elevations within the City’s sphere of influence are below sea level and, therefore, negative elevations, ranging from -150 to -100 ft. The model has been updated with these elevations. Elevations at the WTP storage and pump stations are based on information provided by City staff.

September 2012 5-7
Elevations at the Airport Tank and Pump Station are based on the USGS elevation data. It should be noted, however, that many elevations on various City construction plans show positive elevations, indicating that 500 to 1,000 feet has been added to the actual elevation to make the number positive and easier to understand. Unfortunately, there has been no standard bench mark conversion adopted within the City and as a result, without additional surveys, ground elevations cannot be verified. For this report, many ground elevations were extrapolated from other data and should be considered approximations.
5.5.5 Operational Data
The operational data included in the model are the controls for the pumps and the Airport Tank altitude valve (modeled as a throttle control valve). The five (5) pumps at the Water Treatment Plant all operate based on pressure in the system. In the field, pressures between 55 and 60 psi at two (2) pressure sensing stations (Malan Street/Old Hwy 111 and River Drive/Pater Street) are used to control when the booster pumps at the WTP turn on and off, as well as when the speed changes for the two variable speed pumps. For modeling purposes a pressure range between 50 and 60 psi at the Malan Street location is used to control the operation of the pumps (i.e., pumps turn on when pressure drops below 50 psi and turn off above 60 psi). The pumps at the Airport Pump Station are operated manually in the field, although used minimally. For modeling purposes, a single pump was operated for those scenarios where the Airport Tank and Pump Station were active.
5.5.6 Water Demands and Allocation
Water use factors, expressed as average rate in gpd/acre, were developed for each land use type. The water use factors were used for developing and allocating the average day water demands to the water distribution system model. As described in Chapter 3, in general, the water use factors were developed based on historical meter data by customer class. Water demands for large users and schools were developed and allocated separately.
In developing the model, the demands for large users and schools were first applied to the nearest model junction based on the service address. A GIS process was then utilized to develop water demands for each parcel by multiplying the parcel acreage by the associated water use factor according to the land use of each parcel.
The centroid of each parcel was associated with the nearest model junction. The demand per parcel was then assigned to the associated model junctions for the system-wide model demand allocation. A similar process was completed for the existing land use scenario and for 2020 and 2030 scenarios assigning demands to vacant parcels slated for development in the future. The water demands assigned to the model were verified against historical total production from the treatment plant for 2009 and 2010.
Due to their insignificant water demand, parcels with a land use of natural open space, agriculture, transportation, or rural residential were excluded from the parcels for which

September 2012 5-8
water demands were calculated. The parcels associated with existing large users and schools were also excluded from demand calculations by parcel area, since those customers had point demands assigned based on historical meter data for each of those customers, with the exception of schools which were projected.
5.5.7 Diurnal Curve Development
Hourly flows from the WTP finished water storage for a 24-hour period were used to develop diurnal curves for the City’s sphere of influence. Two diurnal curves were developed and loaded to the model: one for maximum day demand conditions and one for average day demand conditions. The diurnal curve developed for the City is shown in Figure 5-4 and shows a typical pattern of higher usage in early to mid-morning and again in late afternoon to evening.
It is important to note that this hourly data shows the pattern for flows for the finished water storage, but does not provide a clear indication of water demands by different customer classes within the system. In order to develop more accurate diurnal curves that accurately reflect customer usage throughout the system, it would be necessary to have hourly data for all of the facilities within the system in order to determine the total mass balance.
It can sometimes be preferable to develop different diurnal curves for different types of land use, since water use patterns can have a noticeable variation, especially when comparing commercial and industrial customers with residential customers, for example. It is necessary for there to be sufficient data to develop land use specific diurnal curves, which is not the case for Brawley at this time. The City’s system-wide water use is considered uniform enough for a single demand pattern to be used. Figure 5-4 shows the diurnal curves developed from the WTP data and used for the EPS demand data sets and scenarios in the model.
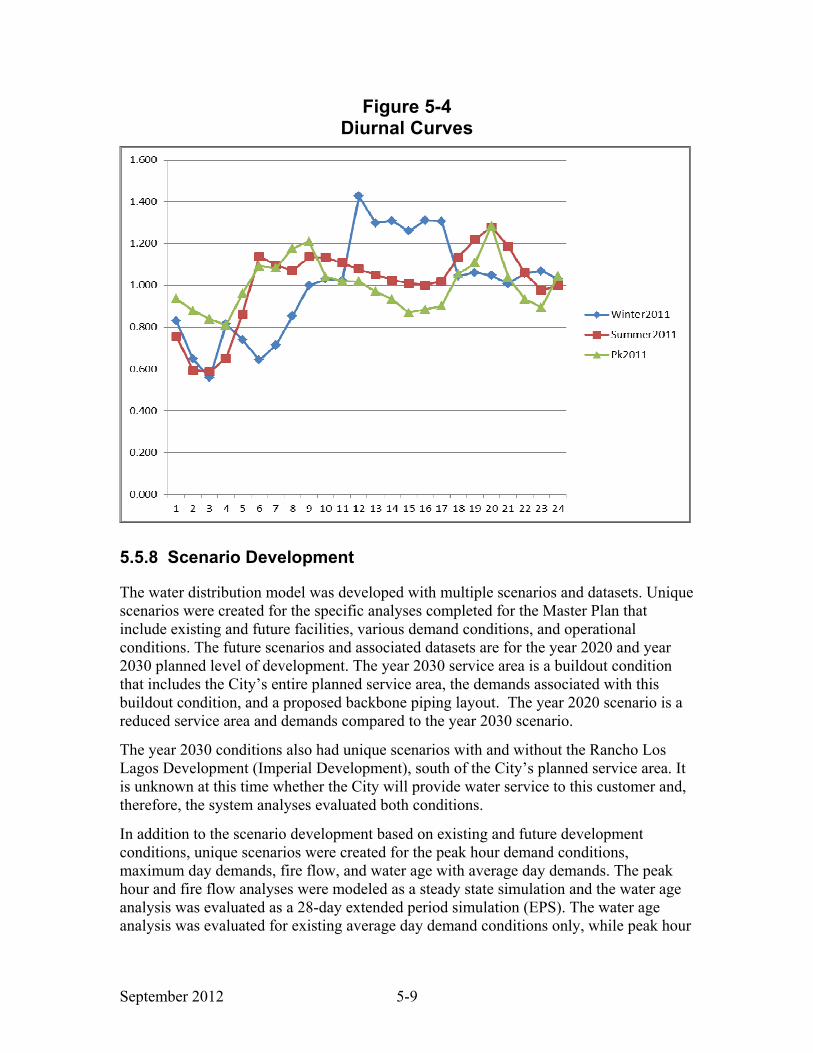
September 2012 5-9
Figure 5-4 Diurnal Curves
5.5.8 Scenario Development
The water distribution model was developed with multiple scenarios and datasets. Unique scenarios were created for the specific analyses completed for the Master Plan that include existing and future facilities, various demand conditions, and operational conditions. The future scenarios and associated datasets are for the year 2020 and year 2030 planned level of development. The year 2030 service area is a buildout condition that includes the City’s entire planned service area, the demands associated with this buildout condition, and a proposed backbone piping layout. The year 2020 scenario is a reduced service area and demands compared to the year 2030 scenario.
The year 2030 conditions also had unique scenarios with and without the Rancho Los Lagos Development (Imperial Development), south of the City’s planned service area. It is unknown at this time whether the City will provide water service to this customer and, therefore, the system analyses evaluated both conditions.
In addition to the scenario development based on existing and future development conditions, unique scenarios were created for the peak hour demand conditions, maximum day demands, fire flow, and water age with average day demands. The peak hour and fire flow analyses were modeled as a steady state simulation and the water age analysis was evaluated as a 28-day extended period simulation (EPS). The water age analysis was evaluated for existing average day demand conditions only, while peak hour

September 2012 5-10
and fire flow analyses were run for existing and future development conditions. An EPS maximum day demand scenario was run for existing system conditions to evaluate operational conditions over a 72-hour time period.
Table 5-3 provides a summary of the model scenarios and description of each. There were several other scenarios that were developed and used within InfoWater for the purposes of the Master Plan, but only those scenarios exported to EPANet are summarized in the table below. There are several unique data sets created in InfoWater for demands, controls, patterns, and pipes, but since EPANet does not use this type of database structure, a summary of those unique data sets are not included herein.
Table 5-3 Summary of Hydraulic Model Scenarios
Model Scenario Description
Existing System
EX_ADD_WATERAGE Water age scenario with existing average day
demand
EX_MDD_EPS Extended period simulation with existing
maximum day demand
EX_MDD_FF Steady state fire flow analysis with existing
maximum day demand
EX_PHD_SS Steady state existing peak hour demand
Future System
FUT_2020_MDD_FF Year 2020 steady state fire flow scenario with
maximum day demands
FUT_2020_PHD Year 2020 steady state peak hour demand
FUT_2030_FF_IMPDEV
Year 2030 steady state fire flow with maximum
day demand and the Imperial Development (Los
Lagos)
FUT_2030_FF_NOIMPDEV
Year 2030 steady state fire flow with maximum
day demand and no Imperial Development (Los
Lagos)
FUT_2030_PHD_IMPDEV Year 2030 steady state peak hour demand with
the Imperial Development (Los Lagos)
FUT_2030_PHD_NOIMPDEV Year 2030 steady state peak hour demand with no
Imperial Development (Los Lagos)
5.6 Model Validation
Only limited water system data was available for the City’s water system facilities (primarily at the WTP); therefore, a detailed model calibration was not possible.

September 2012 5-11
However, model validation was completed utilizing pressure readings at the two pressure sensing stations within the distribution system, as well as an operational knowledge of how the pumps and storage tank typically operate. Some historical fire flow test data was also available, although it was unknown what was occurring at all facilities within the system while the tests were conducted, nor the time of day when the tests were completed, so it was used only as a general guideline.
Model validation of the water hydraulic model was completed for both the steady state and extended period simulation scenarios with existing demand conditions. The hydraulic model results were compared to historical field conditions to ensure the model is representing the actual system with a reliable degree of accuracy.
The following subsections describe the steady state and extended period simulation model validation. It is typically preferable to use the hydraulic grade line (HGL) for model calibration and validation, so both pressure and HGL of model and field results were compared.
5.6.1 Steady State Validation
The City conducted hydrant fire flow tests on June 16, 2011, at five (5) locations. The hydrant tests were used for steady state calibration of the water hydraulic model. There are also two pressure sensing stations within the system (Malan Street/Old Hwy 111 and River Drive/Pater Street) that were used to compare field results to the model results. At both locations, the model results were within 2 psi of the field results and both model and field results operate within a 55 to 60 psi range.
5.6.2 Extended Period Simulation Validation
The City has some SCADA data (recorded data) available for the finished water tank levels and pump flows which were used as a guideline for pump and tank operation. There were no operational controls available for either pump station within the system, so several assumptions were made based on known operating conditions and the response of the system under various modeled scenarios.
Since hourly pressure readings were not available at the two pressure sensing stations on Malan Street and River Drive, the minimum and maximum HGL over time was used to compare to the model HGL at these two locations. Figure 5-5 shows the model results for the HGL at the two pressure sensing stations for a 24-hour simulation, with the minimum and maximum HGL at both pressure sensing stations from the field data. The model is operating within the range of HGLs recorded in the field at both locations. The pressures at these two locations are between 50 and 60 psi for the EPS model simulations, which is consistent with field results.

September 2012 5-12
Figure 5-5
Comparison of Model and Field HGL at the Pressure Sensing Stations
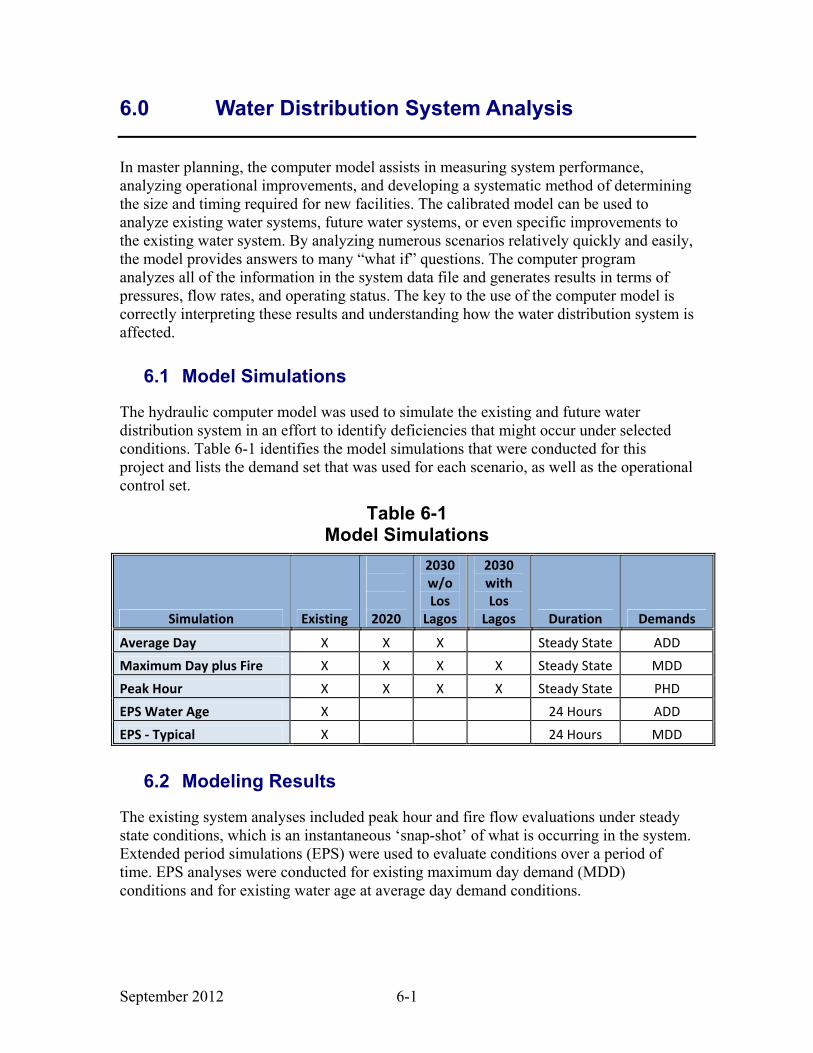
September 2012 6-1
6.0 Water Distribution System Analysis
In master planning, the computer model assists in measuring system performance, analyzing operational improvements, and developing a systematic method of determining the size and timing required for new facilities. The calibrated model can be used to analyze existing water systems, future water systems, or even specific improvements to the existing water system. By analyzing numerous scenarios relatively quickly and easily, the model provides answers to many “what if” questions. The computer program analyzes all of the information in the system data file and generates results in terms of pressures, flow rates, and operating status. The key to the use of the computer model is correctly interpreting these results and understanding how the water distribution system is affected.
6.1 Model Simulations
The hydraulic computer model was used to simulate the existing and future water distribution system in an effort to identify deficiencies that might occur under selected conditions. Table 6-1 identifies the model simulations that were conducted for this project and lists the demand set that was used for each scenario, as well as the operational control set.
Table 6-1 Model Simulations
Simulation Existing
2020
2030
w/o
Los
Lagos
2030
with
Los
Lagos Duration Demands
Average Day X X X Steady State ADD
Maximum Day plus Fire X X X X Steady State MDD
Peak Hour X X X X Steady State PHD
EPS Water Age X 24 Hours ADD
EPS - Typical X 24 Hours MDD
6.2 Modeling Results
The existing system analyses included peak hour and fire flow evaluations under steady state conditions, which is an instantaneous ‘snap-shot’ of what is occurring in the system. Extended period simulations (EPS) were used to evaluate conditions over a period of time. EPS analyses were conducted for existing maximum day demand (MDD) conditions and for existing water age at average day demand conditions.
September 2012 6-2
Future system analyses evaluated development conditions for year 2020 and year 2030. Year 2030 development is considered a buildout condition with most of the growth occurring east and south of the existing development. The year 2020 development uses a percentage of the area of the undeveloped parcels to estimate an intermediate growth level.
Analyses for the future system development included peak hour and fire flow steady state evaluations. A separate analysis evaluated a year 2030 condition with the Imperial Development included to the south. Initial piping sizes for the future pipe grid were primarily 8 inches.
Model results were compared to the desired service criteria in order to evaluate system deficiencies. Pipe velocities between 7 and 10 ft/sec are considered questionable and pipes with velocities greater than 10 ft/sec are considered critical. The minimum service pressure criterion is 40 psi. (See Appendix G for the Existing and Future Model Data.)
6.2.1 Existing System Analysis
6.2.1.1 Peak Hour Analysis
Service pressures and velocities were evaluated with the peak hour demand (PHD) condition to ensure that the distribution system is able to meet the service criteria under this condition. Total peak hour demand is 11,500 gpm. Pressure is maintained between 40 and 60 psi throughout most of the distribution system. Figure 6-1 shows the system-wide pressures during the existing peak hour demand condition. The following are the areas that did not meet the recommended criteria:
• The area at the far north end of Hwy 111 has the lowest pressures, between 25 to 37 psi, which do not meet the required service criteria. The pipe supplying the customers at this location is 6-inch diameter, with a total length of 7,630 ft (1.45 mi). Because it was necessary to make several assumptions in the development and allocation of the demands to the model, it is possible that customer demands at this location are higher in the model than what typically occurs in the field. However, the 6-inch pipe also provides limited capacity for meeting fire flow demands, as discussed later in this section, and needs to be upsized to provide adequate supply to the north end of Hwy 111.
• The Cattle Call area, in the southwest part of the system, has the highest pressures of between 62 and 72 psi. The pipes supplying this area have a diameter of primarily 4 inches.
• There is only one pipe, serving the National Beef Plant, which has a velocity above the maximum criteria of 7 ft/sec (7.5 ft/sec) under existing peak hour conditions.

��!��!��!
��!��!��!��!��!a
kj
�?
�?�?
Water Treatment Plantand Pump Station
Airport Tank and Pump Station
0 0.5 10.25Miles
Legend
Pressures (psi)
0 - 20
20 - 40
40 - 60
> 60
Velocities (ft/s)
0 - 7
7 - 10
> 10
�? Control Valve
kj Tank
a Reservoir
��! Pump Station
Parcels
City Limits
Sphere of Influence
Existing System Peak Hour Results
Figure 6-1
City of Brawley Integrated Master Plan
July 2012
qLa
st
Up
da
ted:
07
/11
/20
12
September 2012 6-4
The peak hour demands were evaluated with and without the Airport Tank and Pump Station in operation, since the City operates the Airport Pump Station manually and utilizes it minimally. There was minimal difference between the two operating conditions.
6.2.1.2 Fire Flow Analysis
There were 20 locations selected within the City’s water service area to analyze available fire flow demands. The locations were selected in order to provide a thorough distribution across the water system, a mix of land use types, and some of the most critical locations, such as hospitals and schools. The fire flow analysis locations are shown in Figure 6-2. The fire flow locations, model node ID, required fire flow and available fire flows are summarized in Table 6-2.
All fire flow analyses were evaluated under steady state MDD conditions. Initial conditions assumed that one of the Airport pumps was on in conjunction with three of the pumps at the Water Treatment Plant (two VFD pumps and one constant speed pump).
There are seven (7) locations where the calculated available fire flow was less than the required fire flow. These seven locations are described below and illustrated with red dots in Figure 6-2.
• The Brawley M.O.B. Hospital (junction J64), located at Evelyn Avenue and West Legion Road, has a required fire flow demand of 6,000 gpm and the available fire flow is 2,693 gpm. As there is not a continuous larger diameter distribution main directly from the WTP, the capacity to supply this large fire flow demand is limited.
• The Pioneer Hospital (junction J88), located at Willard Avenue & West Legion Road, has a required fire flow demand of 6,000 gpm and available fire flow of 2,974 gpm. There is not a continuous larger diameter distribution main directly from the WTP, which limits the capacity to supply this large fire flow demand.
• Phil Swing Elementary School (junction J762) on West A Street has a required fire flow of 3,000 gpm. The available flow is 1,956 gpm. The piping serving this area is 6-inch diameter, limiting the fire flow demand that can be supplied to this location.
• West Cady Road in the Poe Colonia development (junction J1684) is at the far western end of the City’s distribution system and cannot meet the required residential fire flow of 1,500 gpm. The available fire flow is 1,341 gpm. The pipe serving the Poe Colonia development is a 16-inch main. However, all of the piping within the development is 6-inch diameter, limiting the available fire flow. Under fire flow conditions, velocity in the 6-inch pipe supplying the hydrant exceeds 10 fps.

September 2012 6-5
• Hovley Drive and Park View Drive (junction J654) primarily serves a residential neighborhood and has a required fire flow of 1,500 gpm. The available fire flow is 467 gpm. There is only a 6-inch main along Hovley Drive north of Park View Drive, which limits the amount of demand that can be supplied to this area.
• Hwy 111 and Shank Road (junction J618) serves several industrial and public customers at the north end of the system, with a required fire flow of 3,000 gpm. The pipe along US Hwy 111 is a 6-inch and, therefore, provides very limited supply during fire flow demands as well as under PHD. The available fire flow for existing system conditions is 190 gpm.
• San Diego State University (J1544) at US Hwy 78, west of McConnell Road, has a required fire flow of 3,000 gpm. The available fire flow is 2,486 gpm. The single 12-inch main serving this customer is sufficient to meet the peak hour demands, but the headloss is significant enough in this long distribution main such that full fire flow cannot be supplied.

��!��!��!
��!��!��!��!��!a
kj
�?
�?�?
Airport Tank and Pump Station
Water Treatment Plantand Pump Station
J654467 gpm
J618190 gpm
J882,974 gpm
J642,693 gpm
J7621,956 gpm
J16841,341 gpm
J15442,486 gpm
J4
J904
J892
J770
J610
J542
J514
J292
J248
J1446
J1336
J1296
J1130
0 0.5 10.25Miles
Legend
Existing Fire Flow Availibility
Deficient
Borderline
Adequate
�? Control Valve
kj Tank
a Reservoir
��! Pump Station
Existing Pipes
Parcels
City Limits
Sphere of Influence
Existing System Fire Flow Results
Figure 6-2
City of Brawley Integrated Master Plan
September 2012
qLa
st
Up
da
ted:
07
/11
/20
12
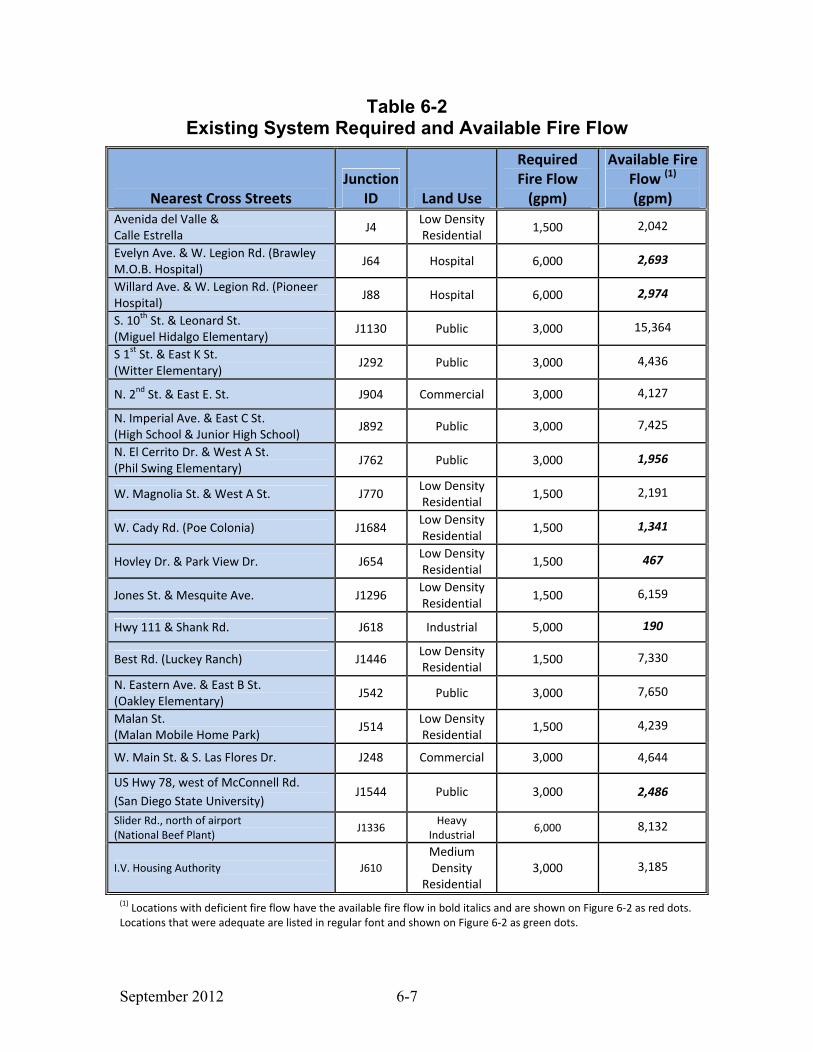
September 2012 6-7
Table 6-2 Existing System Required and Available Fire Flow
Nearest Cross Streets
Junction
ID Land Use
Required
Fire Flow
(gpm)
Available Fire
Flow (1)
(gpm)
Avenida del Valle &
Calle Estrella J4
Low Density
Residential 1,500 2,042
Evelyn Ave. & W. Legion Rd. (Brawley
M.O.B. Hospital) J64 Hospital 6,000 2,693
Willard Ave. & W. Legion Rd. (Pioneer
Hospital) J88 Hospital 6,000 2,974
S. 10th
St. & Leonard St.
(Miguel Hidalgo Elementary) J1130 Public 3,000 15,364
S 1st
St. & East K St.
(Witter Elementary) J292 Public 3,000 4,436
N. 2nd
St. & East E. St. J904 Commercial 3,000 4,127
N. Imperial Ave. & East C St.
(High School & Junior High School) J892 Public 3,000 7,425
N. El Cerrito Dr. & West A St.
(Phil Swing Elementary) J762 Public 3,000 1,956
W. Magnolia St. & West A St. J770 Low Density
Residential 1,500 2,191
W. Cady Rd. (Poe Colonia) J1684 Low Density
Residential 1,500 1,341
Hovley Dr. & Park View Dr. J654 Low Density
Residential 1,500 467
Jones St. & Mesquite Ave. J1296 Low Density
Residential 1,500 6,159
Hwy 111 & Shank Rd. J618 Industrial 5,000 190
Best Rd. (Luckey Ranch) J1446 Low Density
Residential 1,500 7,330
N. Eastern Ave. & East B St.
(Oakley Elementary) J542 Public 3,000 7,650
Malan St.
(Malan Mobile Home Park) J514
Low Density
Residential 1,500 4,239
W. Main St. & S. Las Flores Dr. J248 Commercial 3,000 4,644
US Hwy 78, west of McConnell Rd.
(San Diego State University) J1544 Public 3,000 2,486
Slider Rd., north of airport
(National Beef Plant) J1336
Heavy
Industrial 6,000 8,132
I.V. Housing Authority J610
Medium
Density
Residential
3,000 3,185
(1) Locations with deficient fire flow have the available fire flow in bold italics and are shown on Figure 6-2 as red dots.
Locations that were adequate are listed in regular font and shown on Figure 6-2 as green dots.

September 2012 6-8
6.2.1.3 Maximum Day Extended Period Simulation
The City’s system was evaluated under MDD conditions with an extended period simulation of three (3) days. The extended period simulation used a 24-hour diurnal pattern that repeats each 24-hour period. Two operational conditions were evaluated for the MDD EPS condition. The first assumed the Airport Pump Station operational and the Airport Tank was filling and emptying (active), and a second operational condition assumed the Airport Pump Station was off and the Tank was not filling or emptying (inactive).
The total existing system MDD is approximately 7,850 gpm. During the operational scenario with the Airport Tank active, the tank is refilling and two VFD pumps are on at the WTP. One pump is on at the Airport Pump Station. The pumps at the WTP are controlled by the pressure at the Malan Street/Old Hwy 111 pressure sensing station. The operational scenario with the Airport Tank and Pump Station inactive has two (2) VFD pumps at the WTP operating.
Pipe velocities for both scenarios are within the desired criteria range of less than 7 fps. System pressures are above the minimum service pressure of 40 psi under both operational scenarios, with the exception of the area at the north end of Hwy 111 served by a 6-inch main and discussed previously for the peak hour and fire flow analyses.
Graphs of the pump flows and the pressure at the two pressure sensing stations, for both operational conditions, are included in Appendix D. A graph of the HGL of the two storage facilities when the Airport Tank is active is included as well. The WTP reservoir has the same fixed HGL when the Airport Tank is inactive and, therefore, is not graphed in that scenario.
6.2.1.4 Water Age Analysis Results
Water age analyses were run for the City’s existing system. Two water analyses were run under average day demand (ADD) conditions for a period of 28 days. The 28-day period of time is used in order to allow the system to reach equilibrium.
The water age analyses were run both with and without the Airport Tank and Pump Station active in order to evaluate the impact of that tank on the water age within the distribution system. There is no significant difference in pressure throughout the system between the two scenarios. However, certain areas of the system are noticeably impacted by the Airport Tank being active, resulting in higher water ages. These are described in greater detail later in this section. The two (2) VFD pumps at the WTP were active and the remaining pumps off for both operational scenarios.
Actual operations of the Airport Tank and Pump Station may vary from what was modeled. Different tank mixing and water age may result from different operational conditions.

September 2012 6-9
Airport Tank and Pump Station Active
Figure 6-3 shows the average water age throughout the existing distribution system with the Airport Tank and Pump Station active. Most of the locations shown in red in the figure with water ages greater than five (5) days are on dead-end pipes and locations with no demands in the model. A graph of the Airport Tank water age and tank level is included in Appendix-E. The majority of the system has a water age of a day or less. A few areas have water ages between one and three days and include: near the Airport Tank and Pump Station; in the far southwest portion of the system; the La Paloma development in the southeast; and the Poe Colonia development to the east.
There are a few areas within the City’s distribution system that experience water ages greater than three days with the Airport Tank and Pump Station active. These include:
• San Diego State University (junction J1544) is located at the far eastern end of the system. It is located at the end of a 12-inch pipe, which experiences very low velocities (less than 1 fps). The average water age through the 12-inch main is approximately 3.5 days and at the customer location is over 5 days.
• Luckey Ranch, in the northeastern part of the system, has water age of a day or less throughout much of the development, except at several dead-end lines and at the northern end of the system. At the north end of that development east of Best Road and along Best Road north of River Drive, the average water age reaches eight (8) days by the end of the 28-day run. The spikes of older water correspond to the Airport Tank draining and sending plugs of higher aged water into the system.
• The National Beef Plant is located north of the Airport Tank and Pump Station and is directly impacted by the water age of the Airport Tank with the pump station on and the tank filling. The water age at this customer location has water age up to eight (8) days by the end of the 28-day run, which corresponds to water age in the Airport Tank. Plans for future development in this area would continue the distribution main and pipe looping north of this location, which will improve water age.
Airport Tank and Pump Station Inactive
The water age results with the Airport Tank and Pump Station inactive are similar to the results with these facilities active. Water age in the majority of the system is one day or less. Water age of greater than five (5) days occurs at dead-end pipes and locations with no demands, particularly on the outlying extents of the system. Water age for San Diego University remains higher than three (3) days.
The other locations with water age between one (1) to three (3) days that were already
discussed remain the same. The water age at the National Beef Plant, north of the
Airport Tank, is less than a day old with the tank inactive.
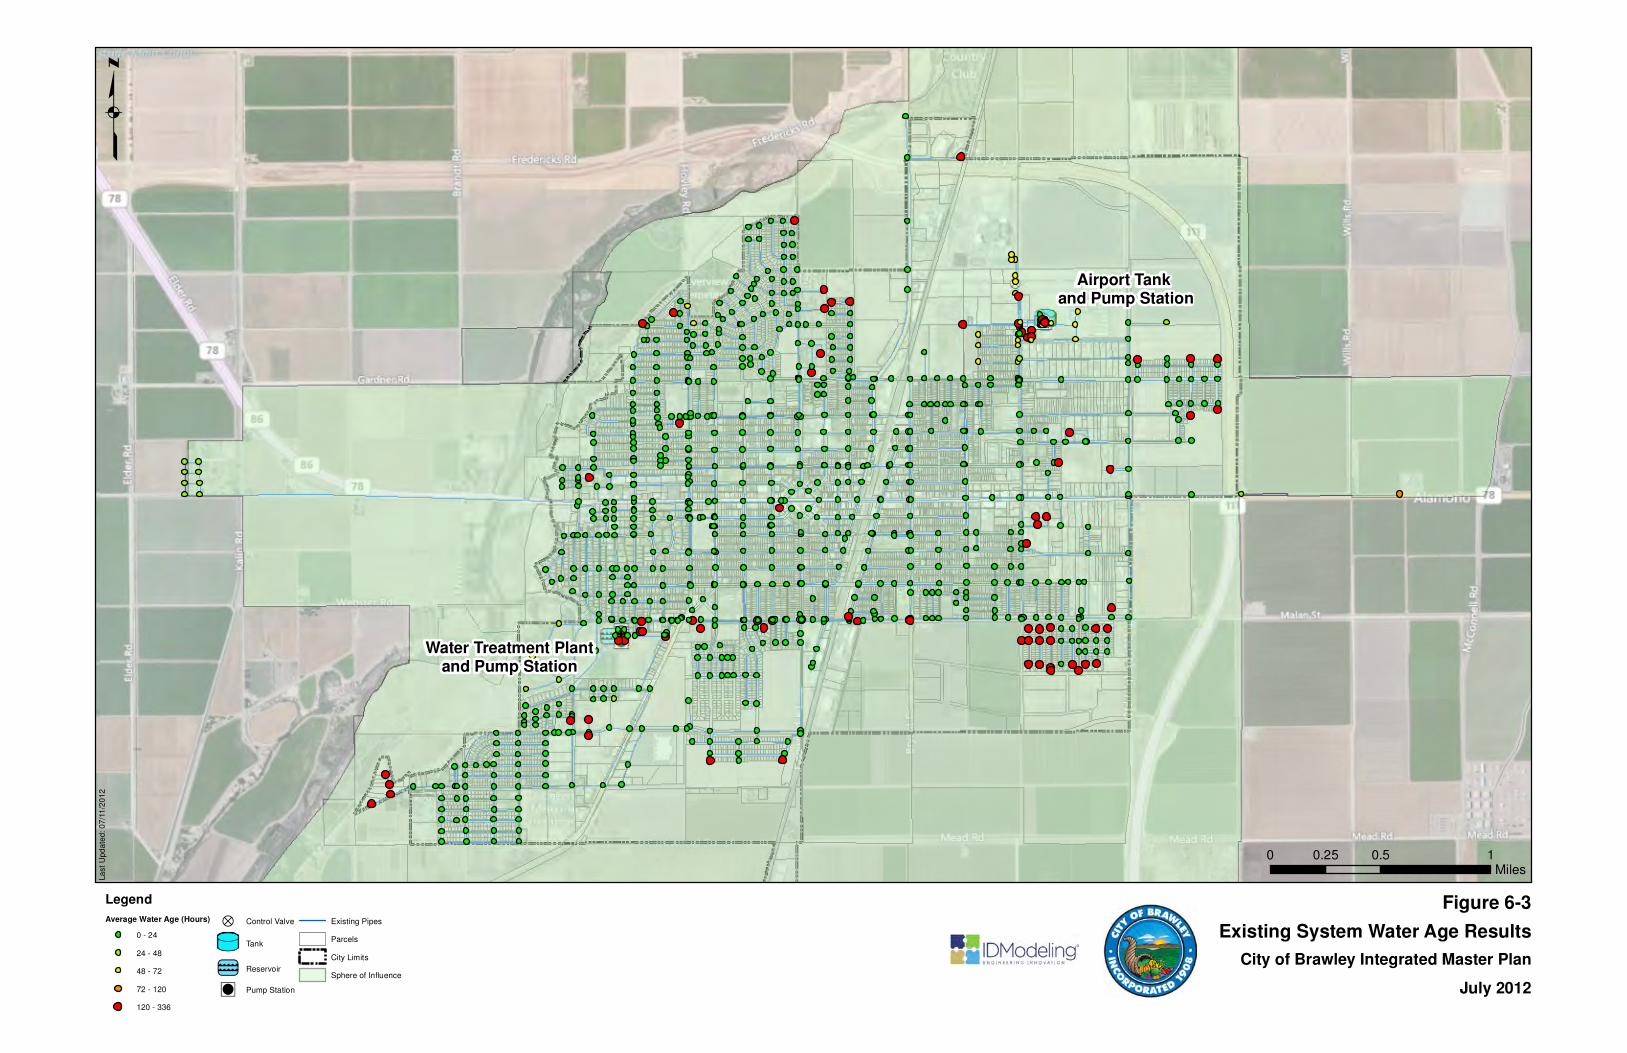
Airport Tank and Pump Station
Water Treatment Plantand Pump Station
0 0.5 10.25Miles
Legend
Average Water Age (Hours)
0 - 24
24 - 48
48 - 72
72 - 120
120 - 336
�? Control Valve
kj Tank
a Reservoir
��! Pump Station
Existing Pipes
Parcels
City Limits
Sphere of Influence
Existing System Water Age Results
Figure 6-3
City of Brawley Integrated Master Plan
July 2012
qLa
st
Up
da
ted:
07
/11
/20
12
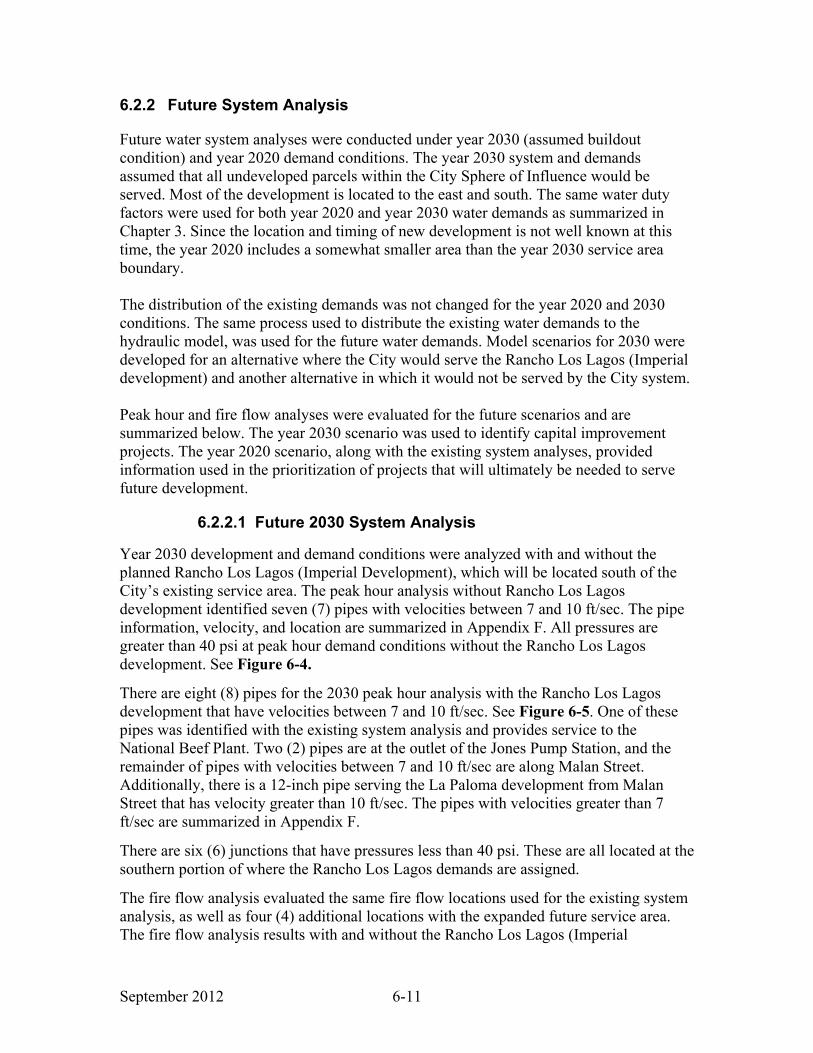
September 2012 6-11
6.2.2 Future System Analysis
Future water system analyses were conducted under year 2030 (assumed buildout condition) and year 2020 demand conditions. The year 2030 system and demands assumed that all undeveloped parcels within the City Sphere of Influence would be served. Most of the development is located to the east and south. The same water duty factors were used for both year 2020 and year 2030 water demands as summarized in Chapter 3. Since the location and timing of new development is not well known at this time, the year 2020 includes a somewhat smaller area than the year 2030 service area boundary. The distribution of the existing demands was not changed for the year 2020 and 2030 conditions. The same process used to distribute the existing water demands to the hydraulic model, was used for the future water demands. Model scenarios for 2030 were developed for an alternative where the City would serve the Rancho Los Lagos (Imperial development) and another alternative in which it would not be served by the City system. Peak hour and fire flow analyses were evaluated for the future scenarios and are summarized below. The year 2030 scenario was used to identify capital improvement projects. The year 2020 scenario, along with the existing system analyses, provided information used in the prioritization of projects that will ultimately be needed to serve future development.
6.2.2.1 Future 2030 System Analysis
Year 2030 development and demand conditions were analyzed with and without the planned Rancho Los Lagos (Imperial Development), which will be located south of the City’s existing service area. The peak hour analysis without Rancho Los Lagos development identified seven (7) pipes with velocities between 7 and 10 ft/sec. The pipe information, velocity, and location are summarized in Appendix F. All pressures are greater than 40 psi at peak hour demand conditions without the Rancho Los Lagos development. See Figure 6-4.
There are eight (8) pipes for the 2030 peak hour analysis with the Rancho Los Lagos development that have velocities between 7 and 10 ft/sec. See Figure 6-5. One of these pipes was identified with the existing system analysis and provides service to the National Beef Plant. Two (2) pipes are at the outlet of the Jones Pump Station, and the remainder of pipes with velocities between 7 and 10 ft/sec are along Malan Street. Additionally, there is a 12-inch pipe serving the La Paloma development from Malan Street that has velocity greater than 10 ft/sec. The pipes with velocities greater than 7 ft/sec are summarized in Appendix F.
There are six (6) junctions that have pressures less than 40 psi. These are all located at the southern portion of where the Rancho Los Lagos demands are assigned.
The fire flow analysis evaluated the same fire flow locations used for the existing system analysis, as well as four (4) additional locations with the expanded future service area. The fire flow analysis results with and without the Rancho Los Lagos (Imperial

September 2012 6-12
Development) are very similar and identified seven (7) locations where the available fire flow is less than the required fire flow. These locations are the same as those identified for the existing system and for the year 2020 demand conditions. The required and available fire flow at all of the fire flow analysis locations is presented in Table 6-3.

Airport Tank and Pump Station
Water Treatment Plantand Pump Station
0 0.5 10.25Miles
Legend
Pressures (psi)
0 - 20
20 - 40
40 - 60
> 60
Velocities (ft/s)
0 - 7
7 - 10
> 10
Sphere of Influence
�? Control Valve
kj Tank
a Reservoir
��! Pump Station
Parcels
City Limits
Year 2030 Peak Hour Resultswithout Imperial Development
Figure 6-4
City of Brawley Integrated Master Plan
July 2012
qLa
st
Up
da
ted:
07
/11
/20
12
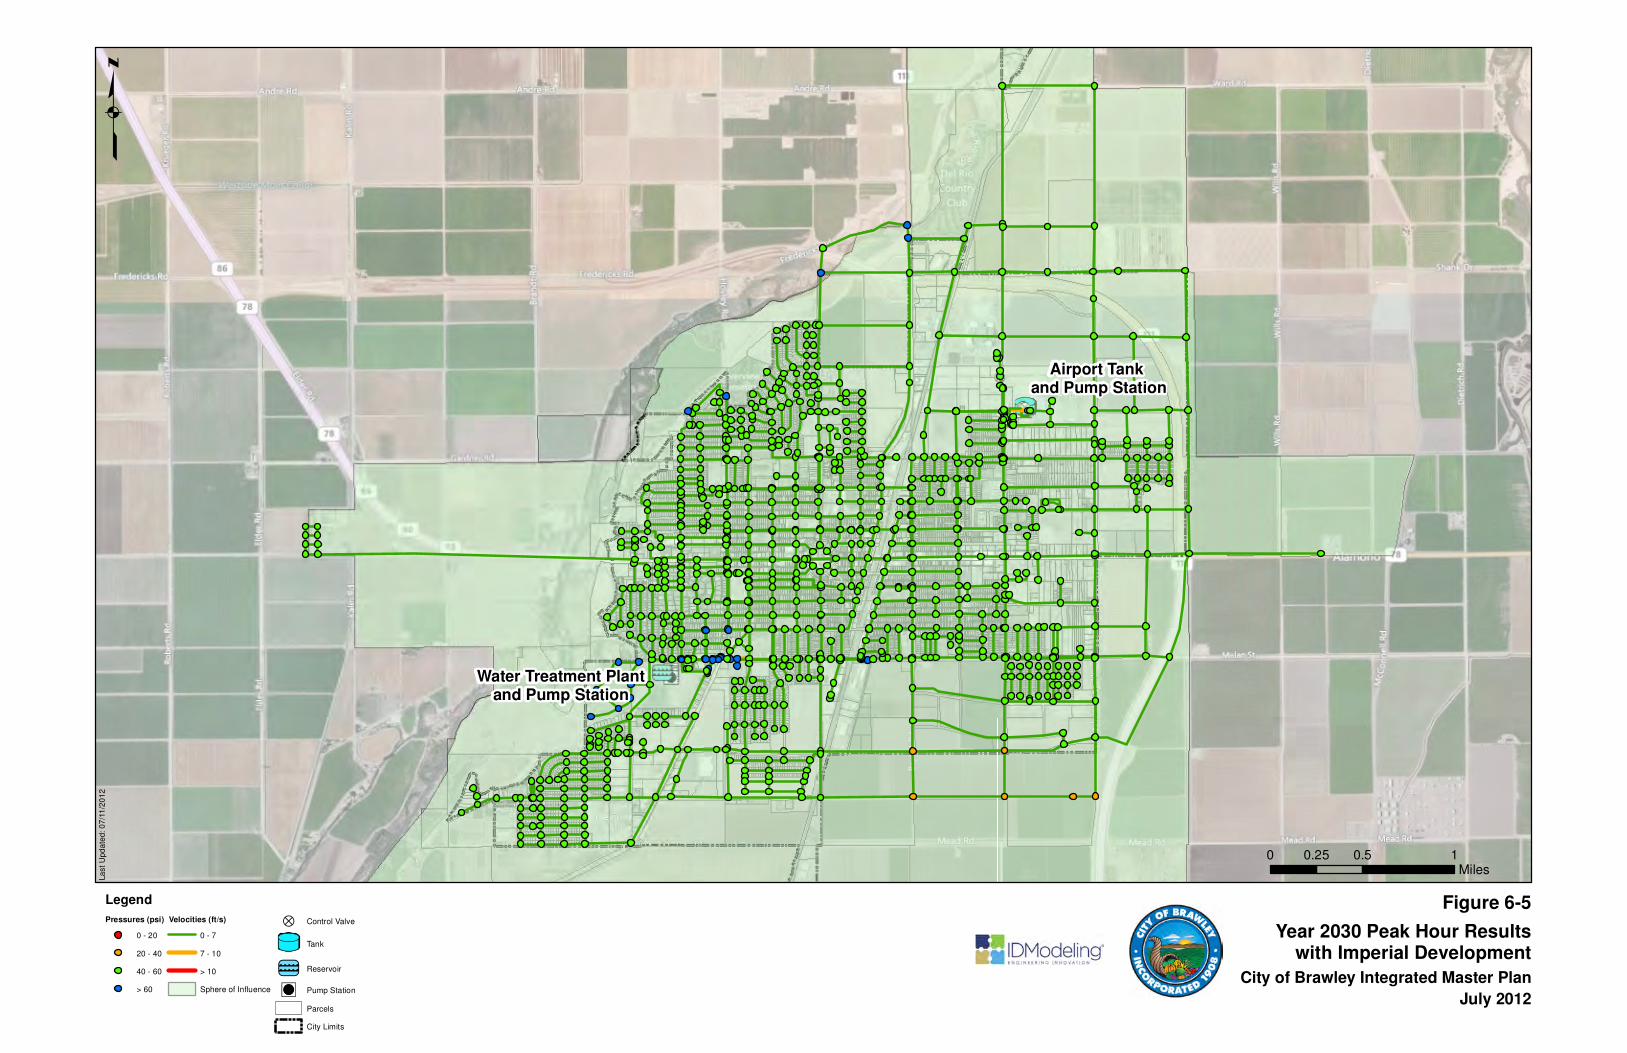
Airport Tank and Pump Station
Water Treatment Plantand Pump Station
0 0.5 10.25Miles
Legend
Pressures (psi)
0 - 20
20 - 40
40 - 60
> 60
Velocities (ft/s)
0 - 7
7 - 10
> 10
Sphere of Influence
�? Control Valve
kj Tank
a Reservoir
��! Pump Station
Parcels
City Limits
Year 2030 Peak Hour Resultswith Imperial Development
Figure 6-5
City of Brawley Integrated Master Plan
July 2012
qLa
st
Up
da
ted:
07
/11
/20
12
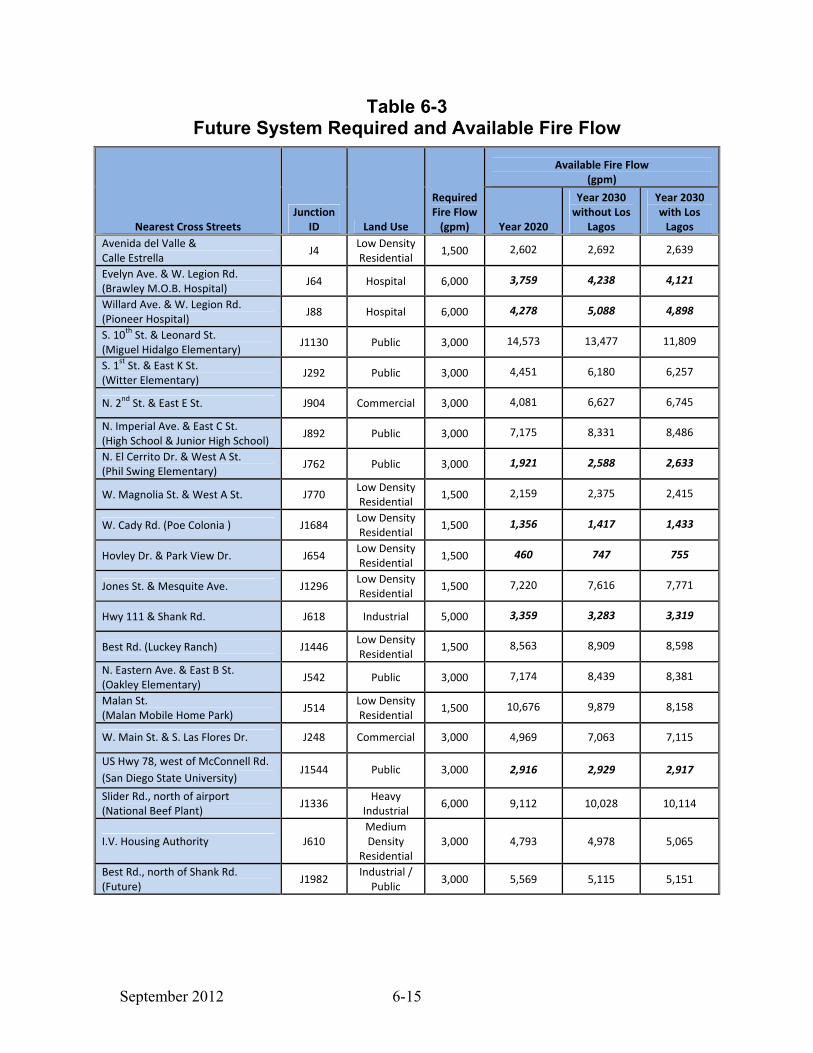
September 2012 6-15
Table 6-3 Future System Required and Available Fire Flow
Nearest Cross Streets
Junction
ID Land Use
Required
Fire Flow
(gpm)
Available Fire Flow
(gpm)
Year 2020
Year 2030
without Los
Lagos
Year 2030
with Los
Lagos
Avenida del Valle &
Calle Estrella J4
Low Density
Residential 1,500 2,602 2,692 2,639
Evelyn Ave. & W. Legion Rd.
(Brawley M.O.B. Hospital) J64 Hospital 6,000 3,759 4,238 4,121
Willard Ave. & W. Legion Rd.
(Pioneer Hospital) J88 Hospital 6,000 4,278 5,088 4,898
S. 10th
St. & Leonard St.
(Miguel Hidalgo Elementary) J1130 Public 3,000 14,573 13,477 11,809
S. 1st
St. & East K St.
(Witter Elementary) J292 Public 3,000 4,451 6,180 6,257
N. 2nd
St. & East E St. J904 Commercial 3,000 4,081 6,627 6,745
N. Imperial Ave. & East C St.
(High School & Junior High School) J892 Public 3,000 7,175 8,331 8,486
N. El Cerrito Dr. & West A St.
(Phil Swing Elementary) J762 Public 3,000 1,921 2,588 2,633
W. Magnolia St. & West A St. J770 Low Density
Residential 1,500 2,159 2,375 2,415
W. Cady Rd. (Poe Colonia ) J1684 Low Density
Residential 1,500 1,356 1,417 1,433
Hovley Dr. & Park View Dr. J654 Low Density
Residential 1,500 460 747 755
Jones St. & Mesquite Ave. J1296 Low Density
Residential 1,500 7,220 7,616 7,771
Hwy 111 & Shank Rd. J618 Industrial 5,000 3,359 3,283 3,319
Best Rd. (Luckey Ranch) J1446 Low Density
Residential 1,500 8,563 8,909 8,598
N. Eastern Ave. & East B St.
(Oakley Elementary) J542 Public 3,000 7,174 8,439 8,381
Malan St.
(Malan Mobile Home Park) J514
Low Density
Residential 1,500 10,676 9,879 8,158
W. Main St. & S. Las Flores Dr. J248 Commercial 3,000 4,969 7,063 7,115
US Hwy 78, west of McConnell Rd.
(San Diego State University) J1544 Public 3,000 2,916 2,929 2,917
Slider Rd., north of airport
(National Beef Plant) J1336
Heavy
Industrial 6,000 9,112 10,028 10,114
I.V. Housing Authority J610
Medium
Density
Residential
3,000 4,793 4,978 5,065
Best Rd., north of Shank Rd.
(Future) J1982
Industrial /
Public 3,000 5,569 5,115 5,151
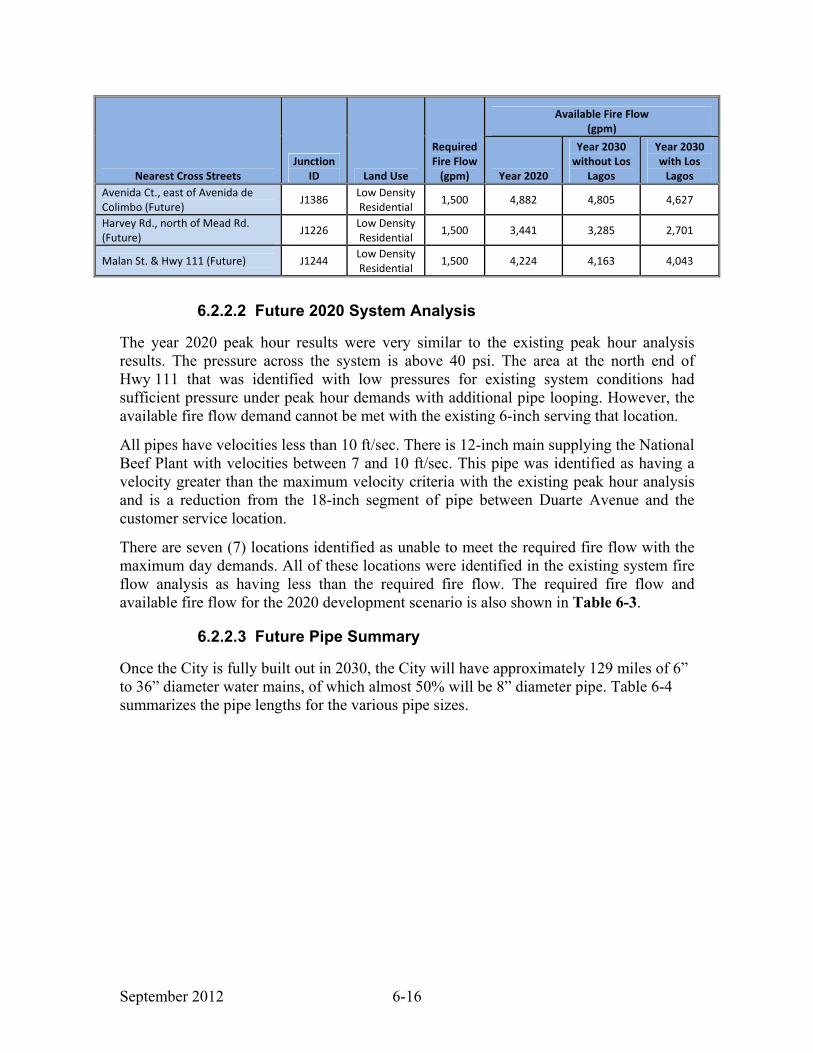
September 2012 6-16
Nearest Cross Streets
Junction
ID Land Use
Required
Fire Flow
(gpm)
Available Fire Flow
(gpm)
Year 2020
Year 2030
without Los
Lagos
Year 2030
with Los
Lagos
Avenida Ct., east of Avenida de
Colimbo (Future) J1386
Low Density
Residential 1,500 4,882 4,805 4,627
Harvey Rd., north of Mead Rd.
(Future) J1226
Low Density
Residential 1,500 3,441 3,285 2,701
Malan St. & Hwy 111 (Future) J1244 Low Density
Residential 1,500 4,224 4,163 4,043
6.2.2.2 Future 2020 System Analysis
The year 2020 peak hour results were very similar to the existing peak hour analysis results. The pressure across the system is above 40 psi. The area at the north end of Hwy 111 that was identified with low pressures for existing system conditions had sufficient pressure under peak hour demands with additional pipe looping. However, the available fire flow demand cannot be met with the existing 6-inch serving that location.
All pipes have velocities less than 10 ft/sec. There is 12-inch main supplying the National Beef Plant with velocities between 7 and 10 ft/sec. This pipe was identified as having a velocity greater than the maximum velocity criteria with the existing peak hour analysis and is a reduction from the 18-inch segment of pipe between Duarte Avenue and the customer service location.
There are seven (7) locations identified as unable to meet the required fire flow with the maximum day demands. All of these locations were identified in the existing system fire flow analysis as having less than the required fire flow. The required fire flow and available fire flow for the 2020 development scenario is also shown in Table 6-3.
6.2.2.3 Future Pipe Summary
Once the City is fully built out in 2030, the City will have approximately 129 miles of 6” to 36” diameter water mains, of which almost 50% will be 8” diameter pipe. Table 6-4 summarizes the pipe lengths for the various pipe sizes.
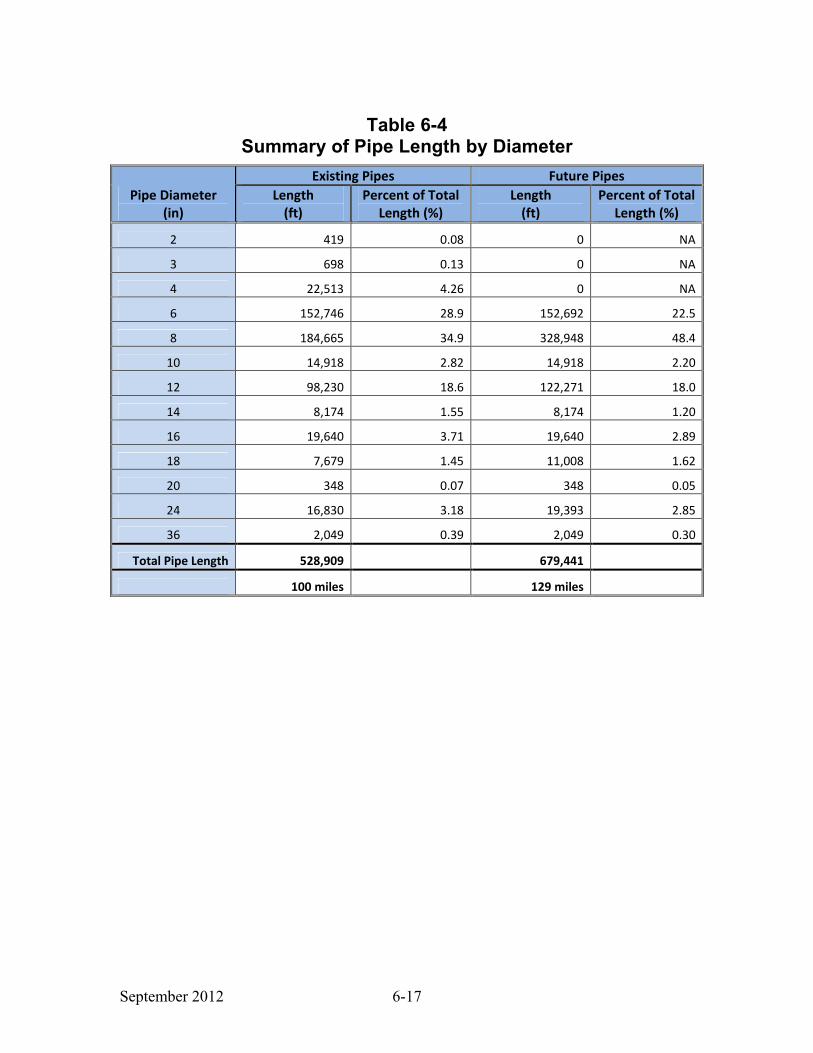
September 2012 6-17
Table 6-4 Summary of Pipe Length by Diameter
Pipe Diameter
(in)
Existing Pipes Future Pipes
Length
(ft)
Percent of Total
Length (%)
Length
(ft)
Percent of Total
Length (%)
2 419 0.08 0 NA
3 698 0.13 0 NA
4 22,513 4.26 0 NA
6 152,746 28.9 152,692 22.5
8 184,665 34.9 328,948 48.4
10 14,918 2.82 14,918 2.20
12 98,230 18.6 122,271 18.0
14 8,174 1.55 8,174 1.20
16 19,640 3.71 19,640 2.89
18 7,679 1.45 11,008 1.62
20 348 0.07 348 0.05
24 16,830 3.18 19,393 2.85
36 2,049 0.39 2,049 0.30
Total Pipe Length 528,909
679,441
100 miles
129 miles

September 2012 7-1
7.0 Other Water Facility Analyses
7.1 Water Storage Analysis
Water distribution systems often rely on stored water to help equalize fluctuations between supply and demand, supply sufficient water for firefighting, and meet demands during an emergency or unplanned outage of a major supply source. Adequate storage requirements include the sum of operational, fire, and emergency storage volumes. The following discusses the ability of the City storage facilities to meet the water system storage requirements.
7.1.1 Raw Water Storage
Based on discussions with IID, the storage required needs to offset the loss of production from the IID connections for six (6) average day demands. (This is the time IID has indicated may be required for taking the canal out of service.) The City currently has 36 MG of storage in open at-grade reservoirs at the Water Treatment Plant. Table 7-1 summarizes the required raw water storage for the existing and future conditions.
Table 7-1 Additional Raw Water Storage Needed
Condition ADD (MGD)
6 days
of ADD
(MG)
Existing
Raw
Water
Storage
(MG)
Additional
Needed
Raw
Water
Storage
(MG)
Existing 7.5 45 36 9
2020 10.6 64 36 28
2030 w/o Rancho Los
Lagos 14.3 86 36 50
2030 with Rancho Los
Lagos 17.6 106
36 70

September 2012 7-2
7.1.2 Treated Water Storage
Treated water storage within the City system for existing and future conditions should meet the following criteria:
• Operational storage shall be at least 30 percent of the maximum day demands (MDD).
• Fire flow storage shall be the largest fire in gpm times its duration: 6,000 gpm x 4 hours
• Emergency storage shall be 100 percent of the maximum day demand (MDD).
Based on these criteria the City needs the treated storage as shown in Table 7-2.
Table 7-2 Treated Water Storage
Condition
MDD
(MGD)
Operational
Storage,
30% of
MDD (MG)
Fire Flow
Storage,
6,000 gpm
x 4 hours
(MG)
Emergency
Storage,
100% of
MDD (MG)
Total
Required
Storage
(MG)
Existing 11.30 3.39 1.44 11.30 16.1
2020 15.93 4.78 1.44 15.93 22.2
2030 w/o Rancho Los
Lagos 21.42 6.43 1.44 21.42 29.3
2030 with Rancho Los
Lagos 26.4 7.92 1.44 26.4 35.8
Table 7-3 summarizes the required treated water storage for the existing and future conditions. The City currently has 9 MG of treated water storage. 6 MG of this storage is located at the WTP and 3 MG is located at the Airport (Jones) Tank. The City needs an additional 7 MG of storage to meet the existing condition storage criteria. A 3 MG above-grade storage tank was designed and approved for construction in the La Paloma development. This tank has not yet been constructed due to the halting of the development construction. Once this tank is constructed, the City’s existing need will decrease to 4 MG.
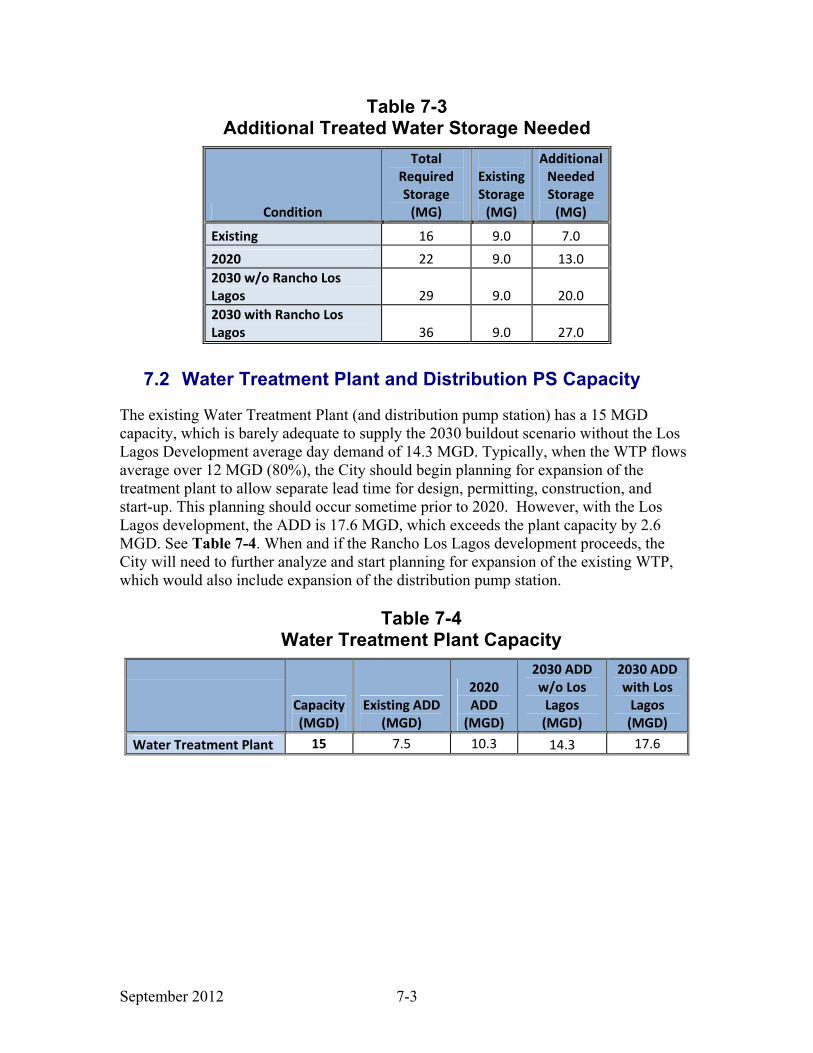
September 2012 7-3
Table 7-3 Additional Treated Water Storage Needed
Condition
Total
Required
Storage
(MG)
Existing
Storage
(MG)
Additional
Needed
Storage
(MG)
Existing 16 9.0 7.0
2020 22 9.0 13.0
2030 w/o Rancho Los
Lagos 29 9.0 20.0
2030 with Rancho Los
Lagos 36 9.0 27.0
7.2 Water Treatment Plant and Distribution PS Capacity
The existing Water Treatment Plant (and distribution pump station) has a 15 MGD capacity, which is barely adequate to supply the 2030 buildout scenario without the Los Lagos Development average day demand of 14.3 MGD. Typically, when the WTP flows average over 12 MGD (80%), the City should begin planning for expansion of the treatment plant to allow separate lead time for design, permitting, construction, and start-up. This planning should occur sometime prior to 2020. However, with the Los Lagos development, the ADD is 17.6 MGD, which exceeds the plant capacity by 2.6 MGD. See Table 7-4. When and if the Rancho Los Lagos development proceeds, the City will need to further analyze and start planning for expansion of the existing WTP, which would also include expansion of the distribution pump station.
Table 7-4 Water Treatment Plant Capacity
Capacity
(MGD)
Existing ADD
(MGD)
2020
ADD
(MGD)
2030 ADD
w/o Los
Lagos
(MGD)
2030 ADD
with Los
Lagos
(MGD)
Water Treatment Plant 15 7.5 10.3 14.3 17.6
September 2012 8-1
8.0 Recommended Capital Improvement Program
A Capital Improvement Program (CIP) will address needed water system capacity and operational improvements. These improvements will increase available fire flows, increase system reliability, and assure future water needs are met. Cost estimates developed for this Master Plan are based on June 2012 dollars. Total project costs include estimates for construction, engineering and technical services, legal, administration, construction management, and contingency. Estimated construction costs are based on historical bids submitted by contractors for similar projects for the City and Psomas. The estimated cost of engineering and technical services was assumed to be 15 percent and legal and administration costs were assumed to be 10 percent of the construction cost. A contingency of 30 percent of the estimated construction cost was also included. The estimates contained herein are planning level cost estimates based on current perceptions of conditions at the project locations. These estimates reflect Psomas’ professional opinion of costs at this time and are subject to change as the project design matures. Psomas cannot and does not warrant or guarantee that proposals, bids or actual construction costs will not vary from the estimated costs presented in this Master Plan. The project costs for water pipelines were estimated using a unit cost per foot of pipe. This unit cost includes valves spaced at a minimum of 250 feet apart and fire hydrants spaced at 500 feet apart. This unit cost was assumed to include the materials and installation. The cost of acquisition of land or easements is not included in the pipeline cost estimates. The unit construction costs used in this Master Plan are shown in Table 8-1. (The future unit pipeline costs (with the exception of replacement of existing facilities) are lower than existing as they do not include removal and replacement costs for items such as existing pipelines and pavement.)

September 2012 8-2
Table 8-1 Unit Construction Costs – Water System Improvements
Pipelines
(Diameter)
Existing
Unit Cost
($/lineal ft)
Future
Unit Cost
($/lineal ft)
6 inches $134 $114
8 inches $143 $122
12 inches $158 $134
14 inches $165 $140
16 inches $200 $170
18 inches $223 $190
24 inches $300 $279
Storage Reservoirs
Including Pump Station
(Volume)
Existing
Unit Cost
($/gallon)
Future
Unit Cost
($/gallon)
3 MG $1.4 $1.4
4 MG $1.4 $1.4
8.1 Recommended Improvement Projects
Several water system improvements were identified based on the existing and future system analyses described previously. The highest priority projects are those that address deficiencies identified with the existing system analyses. All projects are sized to meet the ultimate demand and development conditions of year 2030.
8.1.1 Distribution Pipe Projects
Four areas in the City were identified as having insufficient capacity to supply the required fire flow. These were identified as deficient for both the existing and future system conditions and are being given the highest priority for replacement. A summary of the recommended improvements associated with these is summarized below and shown on Figure 8-1, (located in a pocket at the back of this report).
Project FF-1 HWY 111 and Shank Road
The existing peak hour analyses identified a single area with pressures less than 40 psi, at the north end of Hwy 111. The required fire flow of 5,000 gpm in this area also cannot be met under existing or future demand conditions. The 6-inch pipe (P714, P710, P708, P712, P2738, P2730) serving this area was modeled with an upsized 12-inch pipe under existing conditions. Although this single improvement increases pressures and provides added fire flow, it does not provide sufficient peak hour and fire flow capacity. Minimum pressures of 40 psi are

September 2012 8-3
obtained during peak hour demand conditions and the required fire flow of 5,000 gpm can be met with additional pipe looping of 8-inch and 12-inch pipe in the area for future development. It is recommended that the City collect meter data for the customers at this location prior to design and construction in order to verify required pipe sizes. (7,630 ft of 12-inch PVC)
Project FF-2 Brawley M.O.B. and Pioneer Hospitals
The Brawley M.O.B. and Pioneer Hospitals are located south of the WTP and were identified as having deficient fire flow for both existing and future conditions. Currently, there is not a direct connection from the WTP going south. Three (3) pipeline improvements were identified in order to provide the required fire flow of 6,000 gpm at each hospital. With the improvements below, the available fire flow at Pioneer Hospital is 7,052 gpm and the modeled fire flow at Brawley M.O.B. Hospital is 6,421 gpm at 20 psi residual pressure.
• East of the WTP, going south along S. Brawley Avenue: Replace the existing 6-inch (P2840, 1,430 ft) with 12-inch pipe and connect to the 36-inch from the WTP. Replace the existing 6-inch (P144, 280 ft) with 12-inch along Julia Drive going east to S. Brawley Avenue.
• W. Legion Road between Evelyn Avenue and Willard Avenue: Replace existing 10-inch (P132, 600 ft) with 12-inch.
• Evelyn Avenue between Panno Road and W. Legion Road: Replace existing 8-inch (P110, P112, P114, P70, P72; 1,300 ft) with 12-inch.
Project FF-3, Hovley Drive
The available fire flow at Hovley Drive and Park View Drive is less than the required fire flow of 1,500 gpm for existing and future demand conditions. A 6-inch PVC pipe serves this location. Upsizing this pipe (P862) to an 8-inch provides the sufficient capacity to meet the required fire flow (1,960 ft of 8-inch PVC).
Project FF-4, Phil Swing Elementary School
Phil Swing Elementary on W. A Street west of N. Western Avenue is served by a 6-inch pipe. East of N. Western Avenue there is a 12-inch main along W. A Street, and north along N. Western Avenue up to W. A Street there is a 14-inch pipe. Replacing the existing 6-inch (P992, P2478) pipe with 8-inch pipe along W. A Street interconnected to the 12-inch and 14-inch at N. Western Avenue provides the sufficient capacity for existing and future fire flow at Phil Swing Elementary School (350 ft of 8-inch PVC).
8.1.1.1 Cast Iron Pipe Replacement Project
In addition to improvements at specific locations, all cast iron pipe and pipe 4 inches in diameter and less is identified for replacement. It is assumed that all cast iron pipe will be replaced with minimum 8-inch diameter Polyvinyl Chloride pipe. The existing cast iron
September 2012 8-4
pipe represents the oldest pipe in the system and is located throughout much of the central part of the service area. Due to the age and the build-up in these pipes, they tend to result in hydraulic restrictions as well as a higher incidence of main breaks.
8.1.1.2 Small Diameter Pipe Replacement Projects
Due to the minimal flow capacity and the pipe age, all 4-inch and smaller pipe should be replaced with 8-inch pipe.
8.1.1.3 Other Pipeline Concerns
Fire flow in the Poe Colonia development was slightly less than required for existing and future demand conditions. The existing condition was about 150 gpm less than required and in the future 2030 condition, this improved to only 50 gpm less than required. The development is served by a 16-inch distribution main, but the pipe sizes within the development are 6-inch PVC. Upsizing these pipes to 8-inch provides sufficient capacity to meet the required fire flow. (747 ft of 8-inch PVC) As the fire flow is only slightly less than required, no improvement is recommended for this location at this time.
San Diego State University is served by a 12-inch distribution main of approximately 3,785 ft in length, which is insufficient to meet the required fire flow of 3,000 gpm. The existing condition was about 500 gpm less than required and in the future 2030 condition this improved to only 70 gpm less than required. Replacing this main with a 16-inch pipe provides sufficient capacity to meet the required fire flow. However, this would potentially introduce water quality issues, since the daily demands are sufficiently served by the 12-inch pipe and existing water age analyses show higher water ages along this distribution main. Because the condition will improve as future water mains are installed, and due to the fact that the SDSU buildings likely have sprinkler systems, no improvement is recommended for this location at this time.
In addition to the above locations with recommended improvements, there were a few locations with pipe velocities between 7 and 10 ft/sec. As these velocities are not excessive, there are no improvements recommended for these locations at this time. However, they should be monitored as new development continues, particularly at the southern end of the service area.
8.1.1.4 Future Development Pipelines
To accommodate future buildout of the City by the year 2030, approximately 30 miles of water pipelines will need to be installed. These pipelines range from 6” diameter to 24” diameter and will mostly be required in the south and east parts of the City where the majority of the future development will occur. See Figure 8-1 for the future pipe locations.
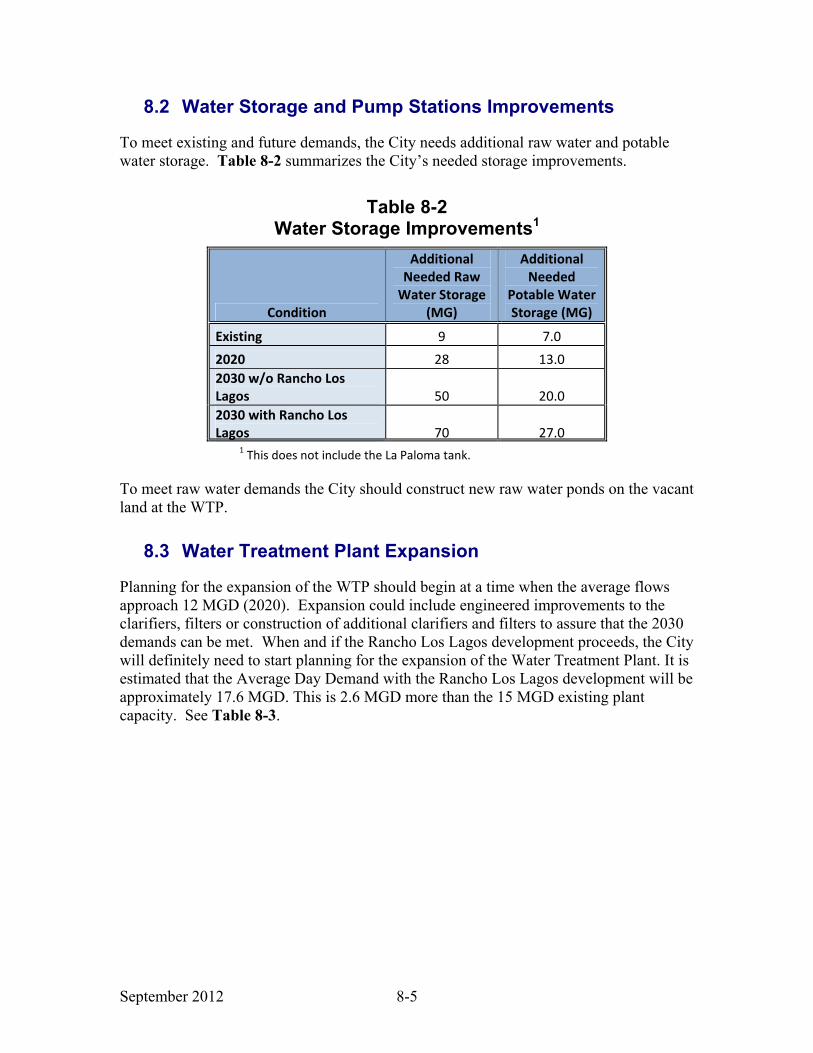
September 2012 8-5
8.2 Water Storage and Pump Stations Improvements
To meet existing and future demands, the City needs additional raw water and potable water storage. Table 8-2 summarizes the City’s needed storage improvements.
Table 8-2 Water Storage Improvements1
Condition
Additional
Needed Raw
Water Storage
(MG)
Additional
Needed
Potable Water
Storage (MG)
Existing 9 7.0
2020 28 13.0
2030 w/o Rancho Los
Lagos 50 20.0
2030 with Rancho Los
Lagos 70 27.0 1 This does not include the La Paloma tank.
To meet raw water demands the City should construct new raw water ponds on the vacant land at the WTP.
8.3 Water Treatment Plant Expansion
Planning for the expansion of the WTP should begin at a time when the average flows approach 12 MGD (2020). Expansion could include engineered improvements to the clarifiers, filters or construction of additional clarifiers and filters to assure that the 2030 demands can be met. When and if the Rancho Los Lagos development proceeds, the City will definitely need to start planning for the expansion of the Water Treatment Plant. It is estimated that the Average Day Demand with the Rancho Los Lagos development will be approximately 17.6 MGD. This is 2.6 MGD more than the 15 MGD existing plant capacity. See Table 8-3.

September 2012 8-6
Table 8-3 Water Treatment Plant Capacity
Existing
Capacity
(MGD)
2030
ADD
w/o Los
Lagos
(MGD)
2030 ADD
with Los
Lagos
(MGD)
Additional WTP
Capacity
Needed w/ Los
Lagos (MGD)
Water Treatment Plant 15 14.3 17.6 2.6
8.4 Water Quality
As noted in the hydraulic analyses, there are areas in the City that have a slightly increased water age. This occurs mostly on the outer edges of the City such as at the La Paloma development and at the SDSU campus. As the City develops and more water demand is placed on these outer areas, and as more looped water pipes are installed, water age will improve. To improve water quality, the City should also consider implementing a plan to operate the existing Airport tank on a daily basis. This will particularly improve water quality in the eastern part of the City.
8.5 Summary of Recommended Water System Improvements
The existing and future recommended water system improvements and associated costs are presented in Table 8-4. The existing water pipe replacements total approximately 27 miles, which includes fire flow capacity improvements, cast iron pipe replacements, and small diameter pipe replacements. The existing system improvements also include 7.0 MG of tank and booster pump station capacity increases at various locations and 9 MG of additional raw water storage at the WTP. See Appendix H for the itemized costs. The future water system improvements include approximately 30 miles of 6” to 24” diameter new pipelines, an additional 13.0 MG of tank and booster pump station capacity, and 41 MG of raw water storage. These future water systems include the existing system improvements described above.
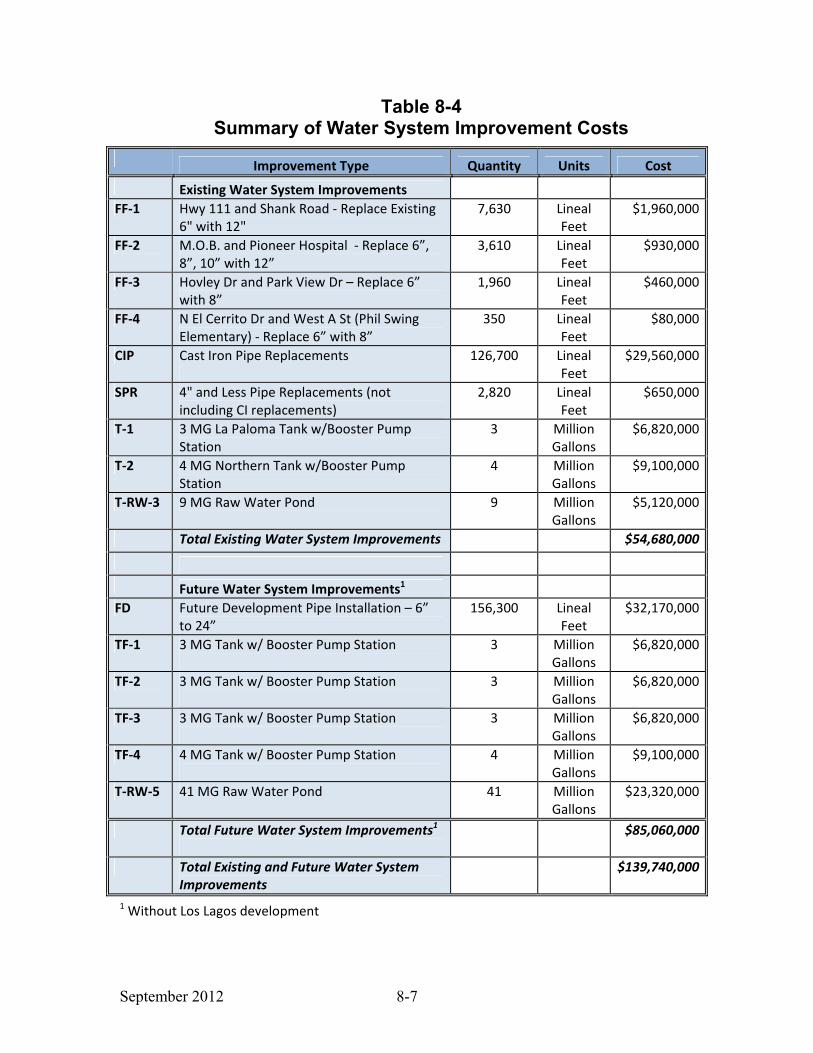
September 2012 8-7
Table 8-4 Summary of Water System Improvement Costs
Improvement Type Quantity Units Cost
Existing Water System Improvements
FF-1 Hwy 111 and Shank Road - Replace Existing
6" with 12"
7,630 Lineal
Feet
$1,960,000
FF-2 M.O.B. and Pioneer Hospital - Replace 6”,
8”, 10” with 12”
3,610 Lineal
Feet
$930,000
FF-3 Hovley Dr and Park View Dr – Replace 6”
with 8”
1,960 Lineal
Feet
$460,000
FF-4 N El Cerrito Dr and West A St (Phil Swing
Elementary) - Replace 6” with 8”
350 Lineal
Feet
$80,000
CIP Cast Iron Pipe Replacements
126,700 Lineal
Feet
$29,560,000
SPR 4" and Less Pipe Replacements (not
including CI replacements)
2,820 Lineal
Feet
$650,000
T-1 3 MG La Paloma Tank w/Booster Pump
Station
3 Million
Gallons
$6,820,000
T-2 4 MG Northern Tank w/Booster Pump
Station
4 Million
Gallons
$9,100,000
T-RW-3 9 MG Raw Water Pond 9 Million
Gallons
$5,120,000
Total Existing Water System Improvements $54,680,000
Future Water System Improvements1
FD Future Development Pipe Installation – 6”
to 24”
156,300 Lineal
Feet
$32,170,000
TF-1 3 MG Tank w/ Booster Pump Station
3 Million
Gallons
$6,820,000
TF-2 3 MG Tank w/ Booster Pump Station
3 Million
Gallons
$6,820,000
TF-3 3 MG Tank w/ Booster Pump Station
3 Million
Gallons
$6,820,000
TF-4 4 MG Tank w/ Booster Pump Station
4 Million
Gallons
$9,100,000
T-RW-5 41 MG Raw Water Pond 41 Million
Gallons
$23,320,000
Total Future Water System Improvements1
$85,060,000
Total Existing and Future Water System
Improvements
$139,740,000
1 Without Los Lagos development
September 2012 8-8
8.6 Capital Improvement Program Costs
Design and construction of the proposed existing water system capital improvements are to be phased over the next 20 years. The prioritized project phasing categories are as follows:
Priority 1: FF-1, 2, 3, and 4 - $3,430,000
Priority 2: CIP Replacement - $29,560,000
Priority 3: SPR Pipe Replacements - $650,000
Priority 4: Raw Water Storage - $5,120,000 Priority 5: Treated Water Storage (T-1 and T-2) - $15,920,000
Notes:
1) Fund CIP Replacements as funds are available. Prioritize in frequent break areas. 2) Fund FF and SPR projects through annual CIP program based on new billing rates and
development impact fees for new connections 3) Fund Raw and Treated Water Storage through CIP funds and development impact fees
and other funding sources. 4) All future storage and pipeline projects should be paid directly by developers.
Reimbursement agreements could be written to share costs amongst developers.

September 2012 9-1
9.0 Funding Mechanisms
This chapter describes financing alternatives for proposed water projects. Funding sources include Federal, State, and local financing programs. Revenue sources include ad valorem taxes, special districts, and developer-imposed impact fees. Funding sources are explored that are not dependent on user charge revenue. The sources of funds for new capital projects are described, but this chapter does not address the amount of funds the City could raise or the repayment impacts. Most of these sources of funding are summarized in Table 9-1.
Federal Programs
The Border Environment Cooperation Commission (BECC), in conjunction with North American Development Bank (NADB), is a source of funding that the City of Brawley has used in the past to fund water and wastewater projects. These two organizations were created in 1994 by the Governments of the United States and Mexico under a side-agreement to the North American Free Trade Agreement (NAFTA). The goal of BECC/NADB is to help improve the environmental conditions of the Mexico–United States border region in order to advance the well-being of residents in both nations. BECC focuses on the technical, environmental, and social aspects of project development, while NADB concentrates on project financing and oversight for project implementation.
State Programs
CDBG
Community Development Block Grants (CDBG) are administered by the State. The primary statutory objective of the CDBG program is to develop viable communities by providing decent housing and a suitable living environment and by expanding economic opportunities, principally for persons of low- and moderate-income. The State must ensure that at least 70 percent of its CDBG grant funds are used for activities that benefit low- and moderate-income persons over a one-, two-, or three-year time period selected by the State. This general objective is achieved by granting “maximum feasible priority” to activities which benefit low- and moderate-income families or aid in the prevention or elimination of slums or blight. Under unique circumstances, States may also use their funds to meet urgent community development needs. A need is considered urgent if it poses a serious and immediate threat to the health or welfare of the community and has arisen in the past 18 months.
Local governments have the responsibility to consider local needs, prepare grant applications for submission to the State, and carry out the funded community development activities. Local governments must comply with Federal and State requirements.

September 2012 9-2
CDPH
The California Department of Public Health (CDPH) implements a number of programs that provide funding opportunities to public water systems. The following was taken from their website:
SDWSRF: The Safe Drinking Water State Revolving Fund (SDWSRF) provides funding to correct public water system deficiencies based upon a prioritized funding approach that addresses the systems’ problems that pose public health risks, systems with needs for funding to comply with requirements of the Safe Drinking Water Act, and systems most in need on a per household affordability basis.
ARRA: Funding from the federal American Recovery and Reinvestment Act of 2009 (ARRA) provides the SDWSRF with ~$160 million. ARRA, which was signed into law in February 2009, provides funding for infrastructure development for California’s drinking water systems.
Proposition 50: Proposition 50, the Water Security, Clean Drinking Water, Coastal and Beach Protection Act of 2002 (Water Code Section 79500, et seq.) was passed by California voters in the November 2002 general election. CDPH is responsible for portions of the Act that deal with water security, safe drinking water, and treatment technology. NOTE: CDPH is no longer
accepting pre-applications for Proposition 50 funding, but the Department of Water Resources
has funding available for certain types of drinking water projects.
Proposition 84: Proposition 84, the Safe Drinking Water, Water Quality and Supply, Flood Control, River and Coastal Protection Act of 2006 (Public Resources Code Section 75001, et seq.), was passed by California voters in the November 2006 general election. CDPH is responsible for portions of the Act that deal with safe drinking water supplies, including emergency and urgent funding, infrastructure improvements, and groundwater quality.
DWTRF: The Drinking Water Treatment and Research Fund addresses drinking water contamination by methyl tertiary butyl ether (MTBE) and other oxygenates.
It should be noted that some of the programs are currently on hold due to the severity of the current State budget crisis.
Local Financing Programs
General Obligation Bonds
General obligation bonds are debt instruments that are backed by the full faith and credit of the issuing municipality. They are generally repaid by ad valorem property taxes and are typically used to fund projects that serve the entire community and are for projects that do not provide direct sources of revenues such as user charges. They must be approved by two-thirds (2/3) of the jurisdiction’s voters.
Districts
Most of the commonly used sources of debt for public facilities involve special districts. The interest rates on these sources of debt are not subsidized, as are some of the State and Federal

September 2012 9-3
loans, and will vary with market conditions and the time of the sale. For the last several years, these rates have been in the range of 5 to 6.5 percent. Several special districts are described below.
Assessment Districts
Assessment Districts formed under the conventional statutes (Improvement Act of 1911, Municipal Improvement Act of 1913, and Improvement Bond Act of 1915) provide some of the less costly development money available because of the real estate security. Assessment Districts do not require an election vote, but a mailed ballot vote. Votes are tabulated at a protest hearing and if more than 50 percent of the property owners vote against the formation of the district (weighted by assessment amount) the proceedings must be halted. Assessment Districts are initiated by petition of the property owners in the proposed district or by action of the City Council.
Mello-Roos Districts
The Mello-Roos Community Facilities Act authorizes cities, counties, and special districts to form “community facilities districts” to finance the construction, improvement or purchase of public facilities that benefit a clearly defined service area. Two or more government agencies may form a community facilities district through a joint financing agreement. All government agencies with jurisdiction in the proposed district boundary must agree to the formation of the district.
The community facilities district may issue bonds, if approved by two-thirds of the voters within the district. Bonds are repaid through special tax assessments. The assessment may not be strictly proportionate to property value. Unlike special assessment districts, the tax does not have to be based directly on benefit derived from the public facilities, although it may be so. Taxes have been based on acreage, street frontage, or square footage of buildings.
Infrastructure Financing Districts
Infrastructure financing districts are formed in proceedings similar to the formation of a Mello-Roos Community Facilities District and, once formed, can use the property tax increment resulting from new development within the district to finance capital facilities. The act to establish these districts became law in 1991. All projects must have community-wide significance, the district must have the consent of affected taxing entities, the district cannot overlap a redevelopment project area, and two-thirds vote is required to create the district. Utility facilities such as water, sewer, and storm drain improvements typically do not increase property tax revenues, so this may not be an appropriate vehicle for these improvements.
Developer Imposed Programs
Developer imposed programs can be used to fund improvements. One approach is for the developer to agree to build the improvements as part of the development. Another approach involves revenues from developer impact fees. This method typically involves pay-as-you-go where impact fees would be collected in a special fund until enough money had accumulated to begin construction. The size of the construction outlay may make pay-as-you-go a difficult approach or, at a minimum, require project phasing.
September 2012 9-4
A third approach would be to issue a revenue bond to obtain upfront construction funding based on the pledge of future impact fees. However, this is unconventional and would require a large reserve fund and may also require a guarantor other than the City. Other options may prove to be more effective.
Revenue Sources
Ad Valorem Taxes
To issue general obligation bonds, a two-thirds majority vote to incur the debt and its repayment is required. This repayment is in the form of ad valorem taxes. The amount of general obligation bonds that can be issued is dependent on the other general obligations outstanding and the total assessed valuation of the City.
Assessment Districts (1911/1913 with 1915 Bond Act and Mello-Roos)
The formation of an assessment district creates its own direct revenue source. The project costs are spread to property owners based on an allocation of costs in proportion to the property’s benefit or on a tax formula based on benefit. The costs and benefits received are used to create an equation that spreads cost equitably among the benefiting properties. This allocation becomes a lien on the property if the assessment is not paid.
Infrastructure Financing District
This district generates revenue on a tax increment basis. Tax increment revenues are calculated as follows: the property taxes collected from properties within the boundaries at the time the district is formed are the frozen base, and the additional amount collected above this amount is the tax increment. Revenue generation will depend on the amount of increased property values resulting from the planned improvements. Tax increment revenue also tends to lag a few years after the improvements are put in place.
Impact Fees
For new development, revenues can be generated by imposing impact fees. The magnitude of these fees is dependent on the costs attributed to new development and the City’s philosophy on collecting these fees. The impact fee calculation will be regulated by Section 66000 of the California Government Code, which governs impact fees from not being more than the costs that can be attributed to each new user.

September 2012 9-5
Table 9-1 Comparison of Financing Alternatives
Name
Type of
Financing
Amount
Available
Terms
Revenue
Sources
Voter
Approval
Required?
Minimum
time to
Implement
Likelihood of
Obtaining
Financing
Other
Comments
Pay-As-You-Go Cash
Depends on
Level of
Charges
None Impact Fees No -
This method will
not generate
sufficient funding
for many
improvements
Revenue Bond City
Obligation
Depends on
revenue
stream
10-30
years Impact Fees No
6-12
months
Low,
Unconventional
Needs
Guarantor
other than City
General
Obligation
Bond
City
Obligation
Dependent
on
other GO
bonds
and total
assessed
valuation
20-30
years
ad valorem
tax Yes, 2/3 24 months
Low (voter
approval)
Infrastructure
Financing
District
District
obligation
Depends on
tax
increment
available
Unknown Tax
Increment
Yes, 2/3
within
District
24 months
Low (voter
approval), not yet
used in California
Cannot overlap
redevelopment
area
Conventional
Assessment
District
(1911, 1913 –
1915 IBA)
District
obligation
Depends on
level of
assessment
10-30
years
Property
Assessments
Property
Owner
Protest
Vote/
Hearing
6 months
OK, should have
diversity of
ownership
Mello-Roos
Community
Facilities
District
District
obligation
Depends on
level of
assessment
10-30
years
Property
Assessments
Property
Owner
Election,
2/3 Vote
12 months
Depends on
stability of
revenue
Timing depends
on election

September 2012
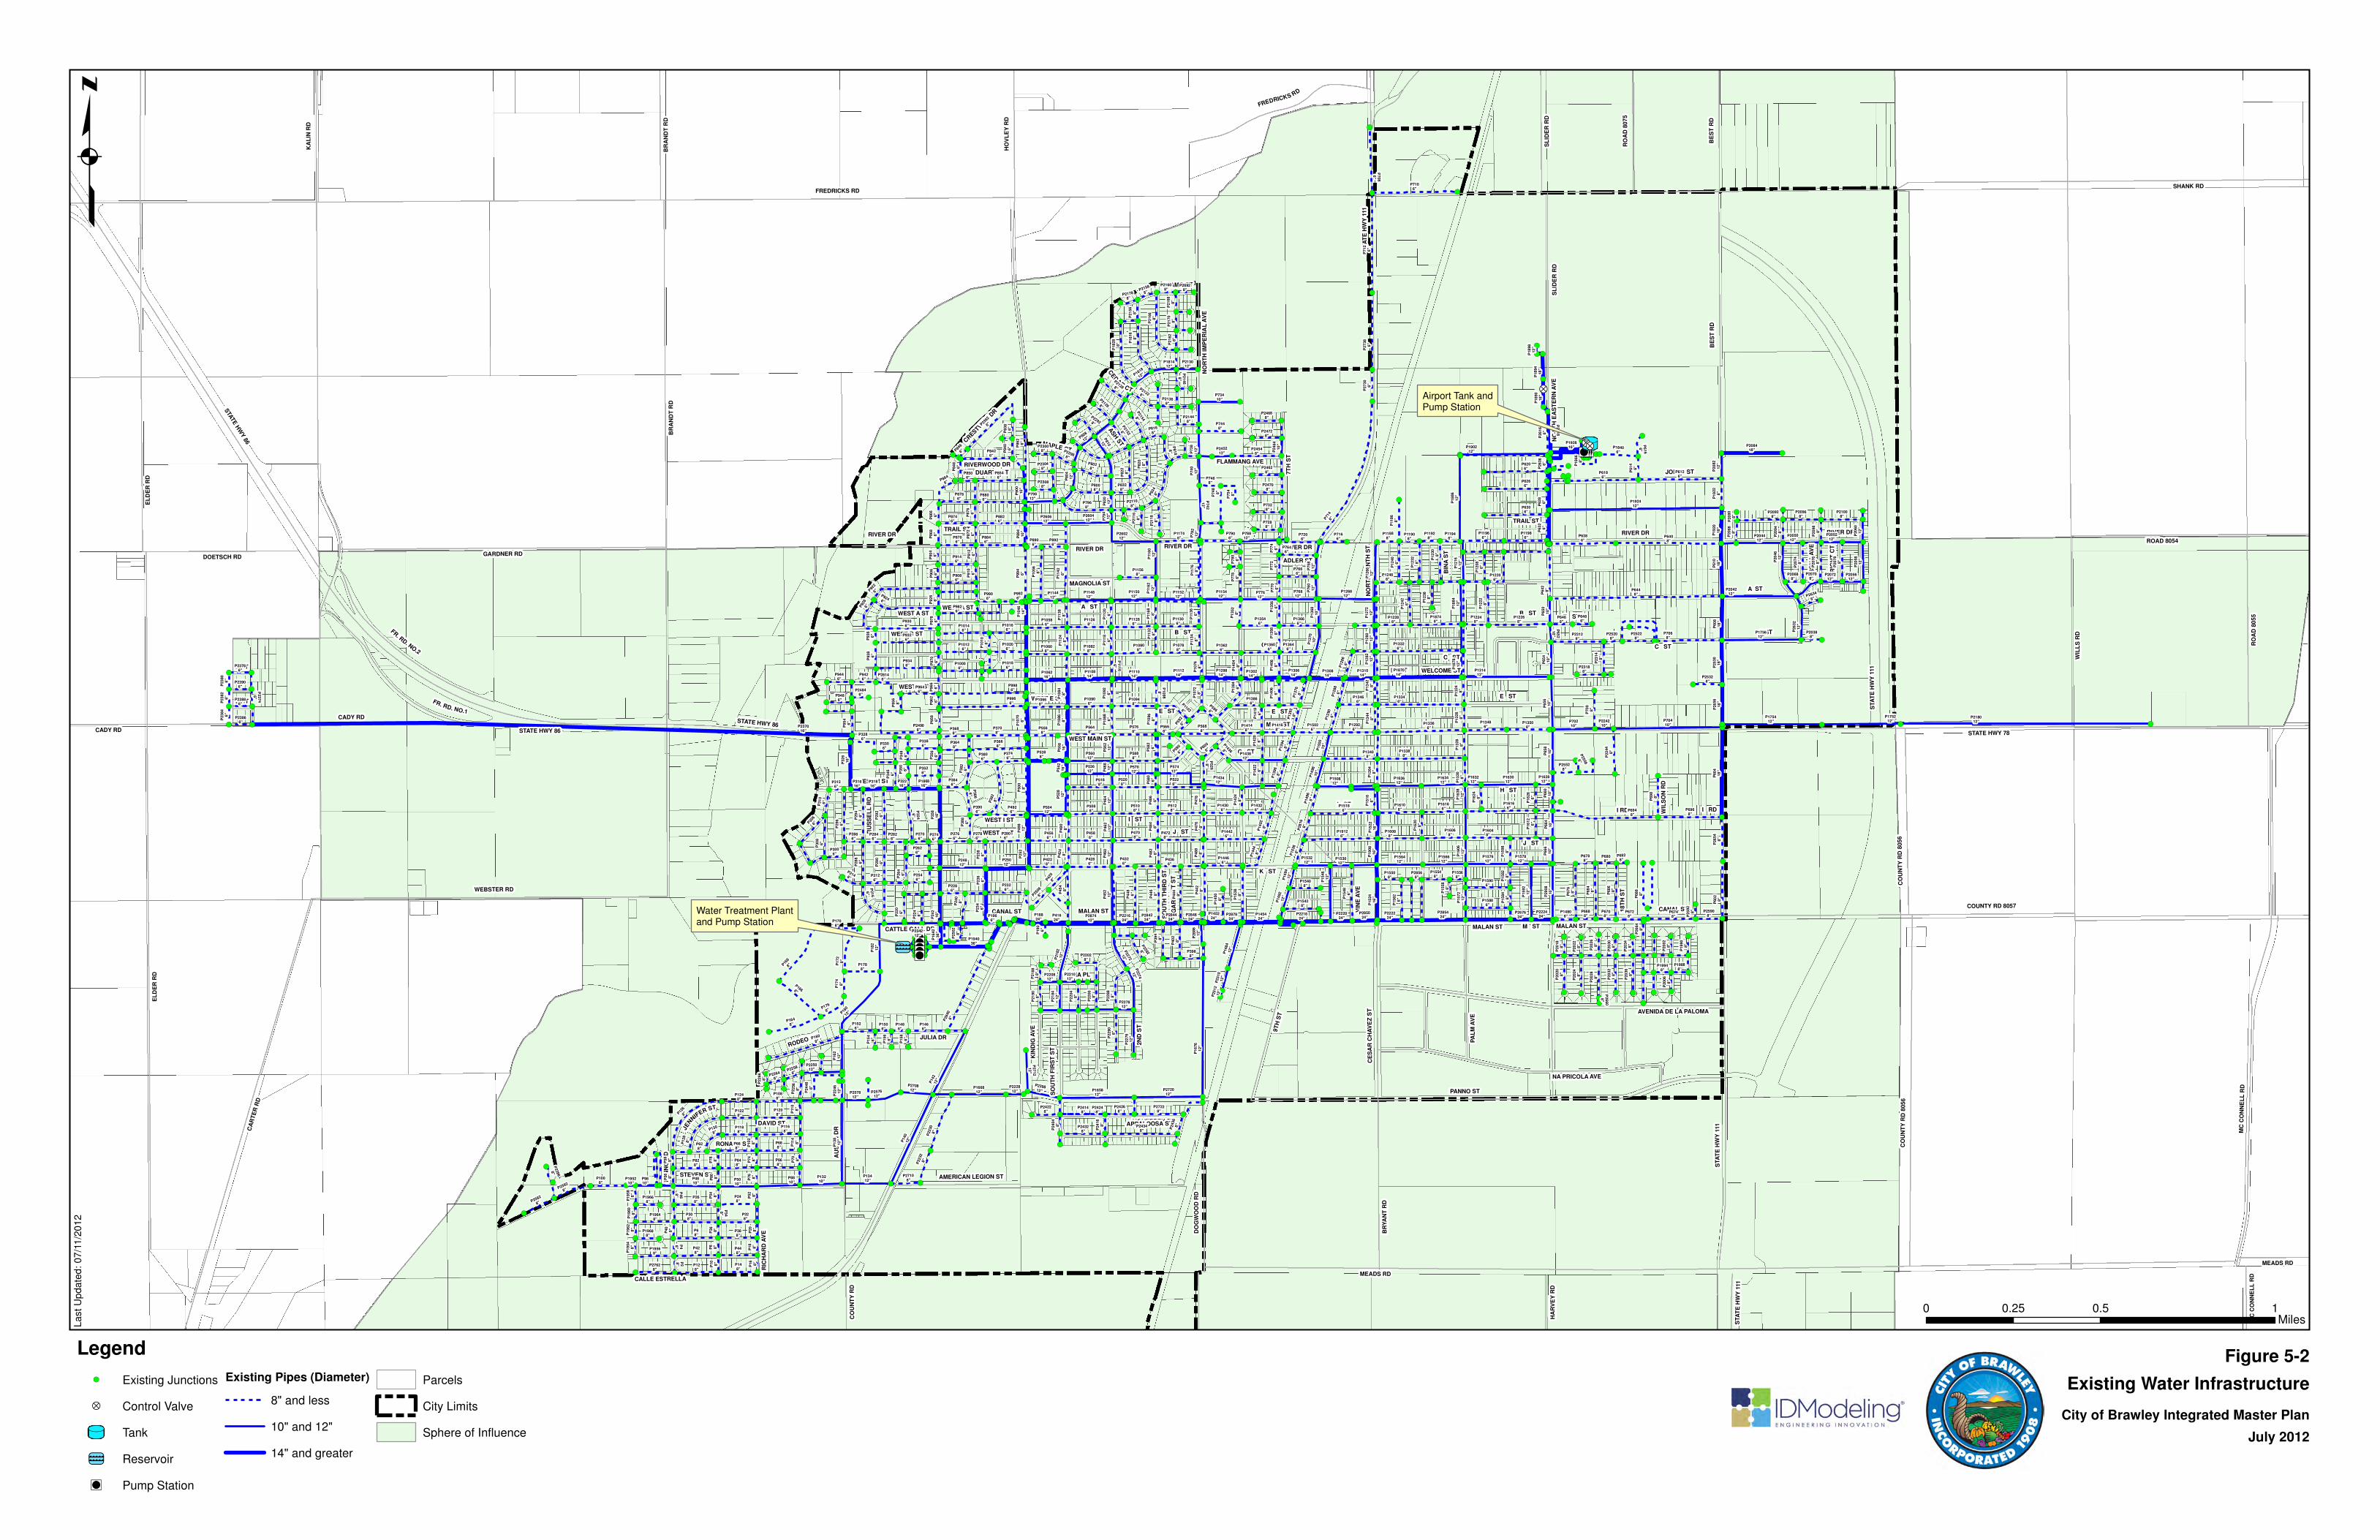
!(
!( !( !(
!(!(!(
!( !( !(
!(!(!(
!( !( !(
!(!(!( !(!(
!( !(
!(!(!(!( !(
!(
!(
!(
!(!(
!(
!(
!(
!( !(
!(
!( !(
!(
!(
!( !(
!(!(
!(
!( !( !( !( !( !(
!( !( !(
!(
!( !(
!(
!(
!(
!(
!(
!( !( !(
!(
!(
!(
!(!( !( !( !( !(
!(
!(!(!(
!( !(
!(
!(
!(!(!(
!(
!( !( !( !( !(
!(
!(!(!(!(!(
!(!(
!(
!(
!(
!(
!(!( !( !( !( !(
!(
!(
!(!(
!(
!(
!(
!(
!(!(
!(
!(
!(
!(!(
!(!(
!(
!(
!(
!(
!(
!( !(
!(!(
!(
!( !(
!(
!(
!(
!(!(
!( !(
!(!(
!(!( !(
!( !(
!(
!(
!(
!( !( !(
!(
!(
!( !(!(
!(!(
!( !(
!(
!(
!(
!(
!( !(
!( !(
!(
!(
!(
!(!(
!(
!(!(!(
!(
!(
!( !(!( !(!(!(
!( !(!(
!(
!(!(
!(
!( !( !(!(
!(
!(
!(
!(
!(
!(
!(
!(
!(
!(
!(!(
!(!(!(!(
!(!(
!(
!(
!(
!( !(
!(!(!(
!(!( !(
!(
!(
!( !(!(
!(
!(!(
!(
!(
!(
!( !( !( !(
!( !( !( !(
!(
!( !(
!(!(!(
!(
!(!(
!(
!( !(!(
!(
!(!(
!(!(!(!(
!( !(!(!(!(
!(
!(!(!(!(!(!( !(
!(
!(!(
!(
!(
!(
!(
!(!(
!(
!(!(
!( !(
!(
!(
!(!(
!(
!(!(!( !(
!(!(
!( !(
!( !(
!(
!( !(
!(
!(!(
!(
!(
!(
!(
!(
!(!(
!(
!(
!(
!(
!(
!(
!(
!( !(
!(
!( !(
!(
!(
!(
!(
!(
!(
!(!(!(!(
!(!(
!(
!( !(
!( !(
!(!(
!(
!( !(!(!(
!(
!(
!(
!(
!( !( !(
!( !(
!(!(
!(!(!(
!(
!( !(!(
!(
!(
!(!(
!(
!(!(!(!(
!(
!( !(
!(
!(
!(
!(
!(
!(!( !(
!(
!(!(
!( !(
!(!(!(
!(
!(
!(
!(!(
!(!( !(
!(
!(
!(
!(
!(
!(!(
!(!(
!(
!(
!( !(!( !(!( !( !(!(!(
!(
!(
!(!(!(!(
!(!(
!(
!( !(
!(
!(
!( !(
!( !(!(
!( !( !(
!(!( !(
!(
!(
!( !( !( !(!(
!( !(
!(
!(
!(
!(
!(!(
!(!(
!(!(
!(!(
!( !(
!( !(!(!(!(
!(!(!(
!(
!(!(
!(
!(!(
!(
!(!( !( !(
!(!(!(
!(!( !(!( !(!( !(!(
!( !( !( !(
!(!(
!( !(!(
!( !(
!(
!( !(
!(
!(
!(
!(
!(!( !( !(
!(
!(
!(!( !(!( !( !(
!( !( !(!(!(
!(!(
!(!(
!(
!(
!(
!(
!(
!(!( !( !(
!( !(
!(
!( !(
!(
!(
!( !(
!(
!(!(
!(
!(
!(
!(!( !(
!( !( !( !(!(
!(
!( !(
!( !(
!(
!(!(
!( !(
!(
!(
!(
!(
!(
!(
!(
!(!(
!(
!(
!(!(!(
!(
!(
!(
!(
!(!(
!(
!(
!(!(
!(
!(
!(
!(
!(
!(
!(
!(
!(
!(
!(
!(
!(
!(
!(
!(
!(
!( !(
!(!(
!(
!( !(
!( !(
!( !(
!( !(
!( !( !( !( !(
!(
!(
!(
!(
!(
!(
!(
!(
!(
!(
!(
!(
!(
!(
!(!(
!( !(
!(
!(
!( !(
!( !( !(
!( !(
!(
!(
!(
!( !(
!(
!(
!(
!( !(
!(
!(
!(!(
!(
!(
!(!(
!(
!(
!(!(
!(
!( !(
!( !(
!(
!(
!(
!( !(
!(
!(
!(
!(
!(
!(
!(
!(
!(
!(
!(!(
!(
!(
!(
!(
!(
!( !(
!(
!(
!( !(
!(
!(
!(
!(
!(!(
!(
!(
!(!(
!(!(
!(
!(
!(
!( !( !(
!(
!(
!( !(
!( !(
!(
!(
!(
!(
!(
!(
!( !(
!(
!(
!(!( !(
!( !(!( !(
!(!(
!( !(!(!(
!(!(
!(
!( !(
!(
!(!(
!(
!(
!(
!(
!(
!(!(
!(
!(
!(
!(
!( !(
!(
!(
!(
!(!( !(
!(
!(!(
!(
!(!(
!(!(
!(
!(
!( !(
!(
!(!(
!(
!(
!(!(
!(
!(
!(
!(!(
!( !(!(
!(
!( !(
!(!(
!(!(!(!(!(
!( !(
!(!(
!( !(
!(
!( !(
!(!(
!(
!(
!(
!(
!(
!(
!(
!(!(
!( !(
!(!(
!(
!(
!(
!(
!(
!(!(!(!(
!(
!(
!( !(
!(
!(
!(
!( !( !(
!(
!(
!(
!(
!(
!(
!(
!(
!(
!(
!(!(
!(!(!(!(
!(
!( !( !(!(
!(
!(!(!(!( !( !( !(
!(
!(!(!( !(!(!(
!(!(!(
!(
��!��!��!
��!��!��!��!��!a
kj
�?
�?�?
MEADS RD
K ST
SHANK RD
KA
LIN
RD
EL
DE
R R
D
WIL
LS
RD
FREDRICKS RD
BE
ST
RD
BR
AN
DT
RD
STATE HWY 78
I ST
J ST
PANNO ST
A ST
H ST
G ST
C ST
CA
RT
ER
RD
E ST
RIVER DR
D ST
MAIN ST
WEST D ST
COUNTY RD 8057
MC
CO
NN
EL
L R
D
STA
TE
HW
Y 86
STA
TE
HW
Y 1
11
CADY RD
9T
H S
T
WEBSTER RD
HO
VL
EY
RD
WEST J ST
GARDNER RD
B ST
SO
UT
H F
IRS
T S
T
WEST MAIN ST
ROAD 8054
CO
UN
TY
RD
805
6
2N
D S
T
7T
H S
T
C ST
I RD
RO
AD
80
55
JONES ST
CANAL ST
NO
RT
H E
AS
TE
RN
AV
E
NA PRICOLA AVE
FR. RD. NO.2
MALAN ST
SL
IDE
R R
D
FR. RD. NO.1
WEST E ST
AU
ST
IN D
R
PA
NN
O R
D
BR
YA
NT
RD
WEST I ST
AVENIDA DE LA PALOMA
A ST
PA
LM
AV
E
ASH
ST
I RD
RIC
HA
RD
AV
E DO
GW
OO
D R
D
NO
RT
H I
MP
ER
IAL
AV
E
DOETSCH RD
STEVEN ST
SO
UT
H T
HIR
D S
T
RO
AD
80
75
RONALD ST
NO
RT
H T
EN
TH
ST
JULIA DR
MONTEREY STDAVID ST
RU
SS
EL
L R
D
TRAIL ST
CE
SA
R C
HA
VE
Z S
T
KIN
DIG
AV
E
JE
N
NIF
ER ST
WEST B ST
CATTLE CALL DR
ALAMO ST
APPALOOSA ST
RODEO DR
CALLE ESTRELLA
M ST
18
TH
ST
DUARTE ST
EMMA PL
VIN
E A
VE
MAGNOLIA ST
WEST A ST
AMERICAN LEGION ST
CE
SS
NA
AV
E
FLAMMANG AVE
BIN
A S
T
HA
RV
EY
RD
CO
UN
TY
RD
CRESTV
IEW
DR
GA
RR
ET
T S
T
B ST
E ST
WEST H ST
MAPLE CT
ADLER ST
WR
IGH
T C
T
WIL
SO
N R
D
RIVERWOOD DR
WELCOME ST
CED
AR CT
BE
ST
RD
CO
UN
TY
RD
805
6
STA
TE
HW
Y 1
11
MC
CO
NN
EL
L R
D
TRAIL ST
B ST
MALAN ST
C ST
RIVER DR
SL
IDE
R R
D
RIVER DR
STA
TE
HW
Y 1
11
J ST
E ST
MEADS RD
STATE HWY 86
EL
DE
R R
D
STA
TE
HW
Y 1
11
E ST
C ST
FREDRICKS RD
B ST
RIVER DR
RIVER DR
I ST
BR
AN
DT
RD
CANAL ST
RIVER DR
MALAN ST
STATE HWY 86
CADY RD
WEST A ST
P237016''
P218012''
P6448''
P71
46'
'
P192412''
P86
26''
P16
76
12
''
P70410''
P6408''
P6948''
P71
26''
P140
12''
P60
418
''
P9966''
P9986''
P7106''
P175412''
P13
812
''
P6126''
P2840
6''
P55
816
' '
P160
8''
P190212''
P145224''
P13388''
P18
86
12
''
P13326''
P13366''
P13346''
P131412''
P187014''
P142
12''
P180
12''
P6186''
P12
68'
'
P68''
P41624''
P175612''
P16
88'
'
P175212''
P708
6''
P7068''
P6386''
P27
38
6''
P9246''
P92
26'
'
P6968''
P165812''
P9326''
P6206''
P9306''
P6306''
P204212''
P9346''
P6266''
P19126''
P24348''
P16166''
P272012''
P3668''
P60
28''
P3708''
P44
86'' P44
28''
P44
68'' P68
68''
P45
212
''
P44
48''
P828''
P68
48''
P67
68''
P4810''
P64
28''
P1668''
P99
46''
P18
28
8''
P308''
P428''
P50
08''
P15186''
P164
8''
P82
08''
P5688''
P268''
P392
8''
P128''
P32
4
6''
P35
816
''
P29
26''
P61
018
''
P8810''
P688''
P29
46''
P868''
P29
66''
P65
610
''
P12268''
P24908''
P8426''
P208418''
P21
66
8''
P2230
8''
P14426''
P11
76
8''
P8826''
P8806''
P7968''
P8846''
P13412''
P8546''
P12
66
12
''
P6748''
P18
212
''
P248''
P148''
P448''
P388''
P29
08
10
''
P15
46
12
''
P57412''
P668''
P128
8''
P15
48
6''
P848''
P15
92
12
''
P32
616
''
P126812''
P328''
P5010''
P15
38
8''
P163012''
P5226''
P166812''
P10
56
8''
P11
42
6''
P2362
8''
P17
28''
P5128''
P24812''
P5108''
P5208''
P13408''
P82
28''
P5888''
P68
88''
P4708''
P4728''
P10
84
8''
P1168''
P53612''
P18
78
12
''
P23128''
P5188''
P4586''
P5088''
P5648''
P18
16
8''
P4286''
P56012''
P60
818
''
P57012''
P1088''
P1208''
P21
82
12
''
P18748''
P10146''
P5768''
P65
810
''
P25012''
P10126''
P2806''
P7448''
P13210''
P70210''
P24548''
P30
86''
P28
86''
P73410''
P69
88''
P27228''
P2326''
P194036''
P29
06''
P260212''
P4566''
P9826''
P111214''
P16
212
''
P83
48'
'
P5388''
P7206''
P1466''
P204412''
P58
26''
P52
812
''
P78812''
P50412''
P7906''
P20928''
P8008''
P156412''
P260412''
P115012''
P77612''
P1708''
P11286''
P22
44
8''
P1108
14''
P115212''
P10948''
P9646''
P1484
12''
P24328''
P15886''
P24148''
P22
76
12
''
P24248''
P9086''
P11268''
P10906''
P70
08''
P111014''
P10808''
P15906''
P114812''
P8706''
P9146''
P22
90
8''
P11966''
P30
66'
'
P287412''
P16088''
P25
30
18
''
P157612''P422
8''
P163612''
P12926''
P16048''
P10828''
P26
54
8''
P74
2
12
''
P4926''
P7646''
P16108''
P163412''
P74
88''
P16068''
P76812''
P8028''
P11746''
P11986''
P26
16
6''
P11306''
P16186''
P285424''
P21
6
6''
P7666''
P8746''
P10788''
P12
22
8''
P156612''
P45
48''
P10006''
P13508''
P13486''
P18
84
12
''
P40
28''
P22
88
8''
P8786''
P12
42
6''
P1008''
P39
48''
P20
28
8''
P11
86
8''
P1788''
P21008''
P2274
12''
P10668''
P13626''
P65
410
''
P27
12
12
''
P106216''
P12
30
8''
P12
40
6''
P26
18
18
''
P260612''
P12
32
8''
P10608''
P10586''
P115412''
P1248''
P221824''
P1188''
P1228''
P15
24
16
''
P15
62
6''
P13666''
P59
06'
'
P13546''
P26
56
18
''
P20
58
12
''
P20
78
8''
P27628''
P1526''
P20
76
8''
P20
74
8''
P77
86''
P19568''
P20
46
12
' '
P14306''
P19648''
P18406''
P143412''
P2392
8''
P14466''
P13606''
P24
48
8''
P129814''
P20968''
P20
24
8''
P145424''
P5568''
P3386''
P11568''
P10206''
P20
32
8''
P20
36
8''
P10186''
P10166''
P15026''
P20
20
8''
P11
60
12
''
P176
8''
P13646''
P13466''
P18824''
P3526''
P15428''
P2272
12''
P79812''
P3688''
P1444
8''
P11026''
P22
46''
P23
46''
P374
6''
P24
08''
P153212''
P24
216
''
P2766''
P92
86'
'
P3648''
P74
012
''
P7328''
P26
64
8''
P12206''
P211
88''
P2562
8''
P42
08'
'
P150812''
P192816''
P2232
8''
P2576
12''
P26
32
12
' '
P130814''
P143812''
P12288''
P14
50
8''
P4
8''
P864
6''
P23
14
8''
P239812''
P22
06''
P38
6
6''
P6728''
P66
410
''
P3846''
P13866''
P8
8''
P270812''
P3806''
P26
46''
P25228''
P46
212
''
P81
8
8''
P131014''
P59
26'
'
P27
30
6''
P48
28''
P21328''
P15408''
P25
212
''
P23
86''
P48
48''
P56
212
''
P52
6
8''
P38
86' '
P42
48''
P9810''
P46
012
' '
P48
66''
P46
412
''
P7288''
P186816''
P14168''
P47
68''
P7166''
P48
88''
P31
06''
P34
66''
P62
86''
P2
8''
P21288''
P3286''
P130614''
P47
88' '
P93
86''
P63
26''
P2152
8''
P12
08
6''
P382
6''
P65
010
''
P12
16
12
''
P14148''
P9486''
P66
610
''
P23
66''
P24728''
P2710
8''
P49
08''
P24688''
P9906''
P73
812
''
P17
48''
P24268''
P2286''
P9446''
P24628''
P13
84
6''
P49
812
''
P8926''
P25328''
P12
90
6''
P19
22
8''
P14326''
P9426''
P13
94
8''
P10
88
6''
P10
72
8' '
P22
04
8''
P1392
8''
P21
84
12
''
P2154
8''
P95
46''
P1376
8''
P1496
8''
P22028''
P10
96
8''
P21
90
8''
P10
70
6''
P2546''
P22
00
8''
P24228''
P1288
6''
P13
28
8''
P14
98
10
''
P11
38
8''
P10
86
8''
P22
56
8' '
P24708''
P21448''
P3988''
P14
20
6''
P15548''
P61
46''
P81
0
12''
P111
86''
P46
8''
P16
12
6''
P13
44
8''P14
18
6''
P28146''
P13
24
8''
P2626''
P1500
10''
P11
34
8''
P77
06''
P13
68
10
''
P1286
6''
P11
24
8''
P23188''
P28
16
8''
P15
16
6''
P12
64
8''
P1536
8''
P19
06
12
''
P13
70
10
''
P14
02
8''
P13
42
8''
P25908''
P1396
8''
P130
8''
P76
8''
P16
38
12
''
P96
66''
P12
82
12
''
P6468''
P4366''
P13
30
8''
P12
72
12
''P
19
08
16
''
P13
52
8' ' P
13
56
6''
P76
012
''
P54
8' '
P80
8''
P13
58
8''
P22
828''
P21268''
P19
20
18
''
P11
68
8''
P11
32
8''
P16
20
8''
P11
20
6''
P16
26
6''
P75
48''
P12
80
12
''
P25528''
P13
26
8''
P15
98
8''
P14
08
8''
P10
92
6''
P20
82
12
''
P34
8' '
P257812''
P84
86''
P14
24
8''
P87
66''
P4326''
P77
26''
P10
46
14
''
P111
6
6''
P56
8''
P10
98
8''
P14
22
6''
P212
6''
P14
04
8''
P12
38
8''
P2146''
P90
010
''
P7468''
P86
86''
P89
410
''
P15
22
16
''
P2846''
P2826''
P75
812
''
P52
8''
P18
8''
P78
8''
P70
8''
P18
94
18
''
P87
26''
P181412''
P31816''
P11
36
6''
P2850
24''
P6808''
P628''
P74
8''
P12248''
P95
86''
P10
76
8''
P222224''
P816
8''
P61
6
6' '
P25
068''
P10
8''
P14
06
6''
P3306''
P15508''
P19668''
P16
24
6''
P20
94
8''
P40
8''
P22928''
P79
212
''
P16
8''
P6708''
P1144
12''
P22988''
P19688''
P211
68''
P6688''
P84
06''
P58
8''
P86
66''
P6788''
P15
82
8''
P23866''
P23886''
P20
8''
P6486''
P12488''
P2842
24''
P300
6''
P91
26''
P90
46''
P20
98
8''
P16
42
36
''
P2510
12''
P20
88
8''
P3906''
P20
60
12
''
P83
86''
P1188
8''
P23786''
P23906''
P2866''
P8328''
P36
8' '
P1492
12''
P11
62
12
''
P28
86
12
''
P221624''
P207212''
P222024''
P80
412
''
P808
12''
P14
94
12
''
P222424''
P213012''
P1818
12''
P20
26
8''
P91
06''
P153012''
P205212''
P21
56
8''
P65
2
10
''
P90
66''
P205612''
P11928''
P95
68''
P267624''
P600
6''
P157812''
P5966''
P66
010
''
P15
84
8''
P20388''
P130214''
P284824''
P11946''
P11908''
P2158
8''
P83
012
''
P15
72
12
''
P2436
8''
P2634
8''
P2452
12''
P23088''
P11
08''
P14808''
P2050
12''
P15
46''
P1486''
P11
48''
P14368''
P225012''
P21368''
P21
46
8''
P21
68
8''
P21
62
8''
P220812''
P20
34
8''
P22
46
12
''
P1506''
P24
16
8''
P19
58
8''
P24
04
8''
P19
90
8''
P20
30
8''
P20
06
8''
P20
02
8''
P21608''
P2706''
P2258
8''
P10
10
6''
P92
66''
P20
18
8''
P21
70
8''
P221012''
P224210''
P97
06''
P15
86''
P15
66''
P10
28''
P20
22
8''
P25208''
P2304
8''
P23008''
P2110
8''
P2786''
P19
54
8''
P26928''
P2264
8''
P23
84
6''
P18
90
18
''
P24
64
10
''
P222812''
P97
86''
P20688''
P19948''
P3126''
P227812''
P2178
8''
P5668''
P78
06''
P20708''
P23
74
6' '
P23
82
6''
P8906''
P19888''
P287824''
P24846''
P19
60
8''
P21
88
8''
P8506''
P2396
8''
P284424''
P162812''
P35
66''
P54
216
' '
P15
58
6''
P19
62
8''
P1966''
P34
86''
P23
80
6''
P26
36
6''
P93
66''
P96
26''
P19
06''
P163212''P
58
06''
P15568''
P25
02
8''
P992
6''
P35
06''
P32216''
P79
412
''
P77
46''
P46
812
''
P25
92
8''
P846
6''
P31616''
P2746''
P18
66
8''
P682
8''
P2556
6''
P28568''
P22
66
8''
P195210''
P20
90
8''
P18
98
12
''
P2512
12''
P26
60
8''
P234212''
0 0.5 10.25Miles
Legend
!( Existing Junctions
�? Control Valve
kj Tank
a Reservoir
��! Pump Station
Existing Pipes (Diameter)
8" and less
10" and 12"
14" and greater
Parcels
City Limits
Sphere of Influence
Existing Water Infrastructure
La
st U
pd
ate
d:
07
/11
/20
12
City of Brawley Integrated Master Plan
Water Treatment Plantand Pump Station
Airport Tank andPump Station
q
July 2012
Figure 5-2
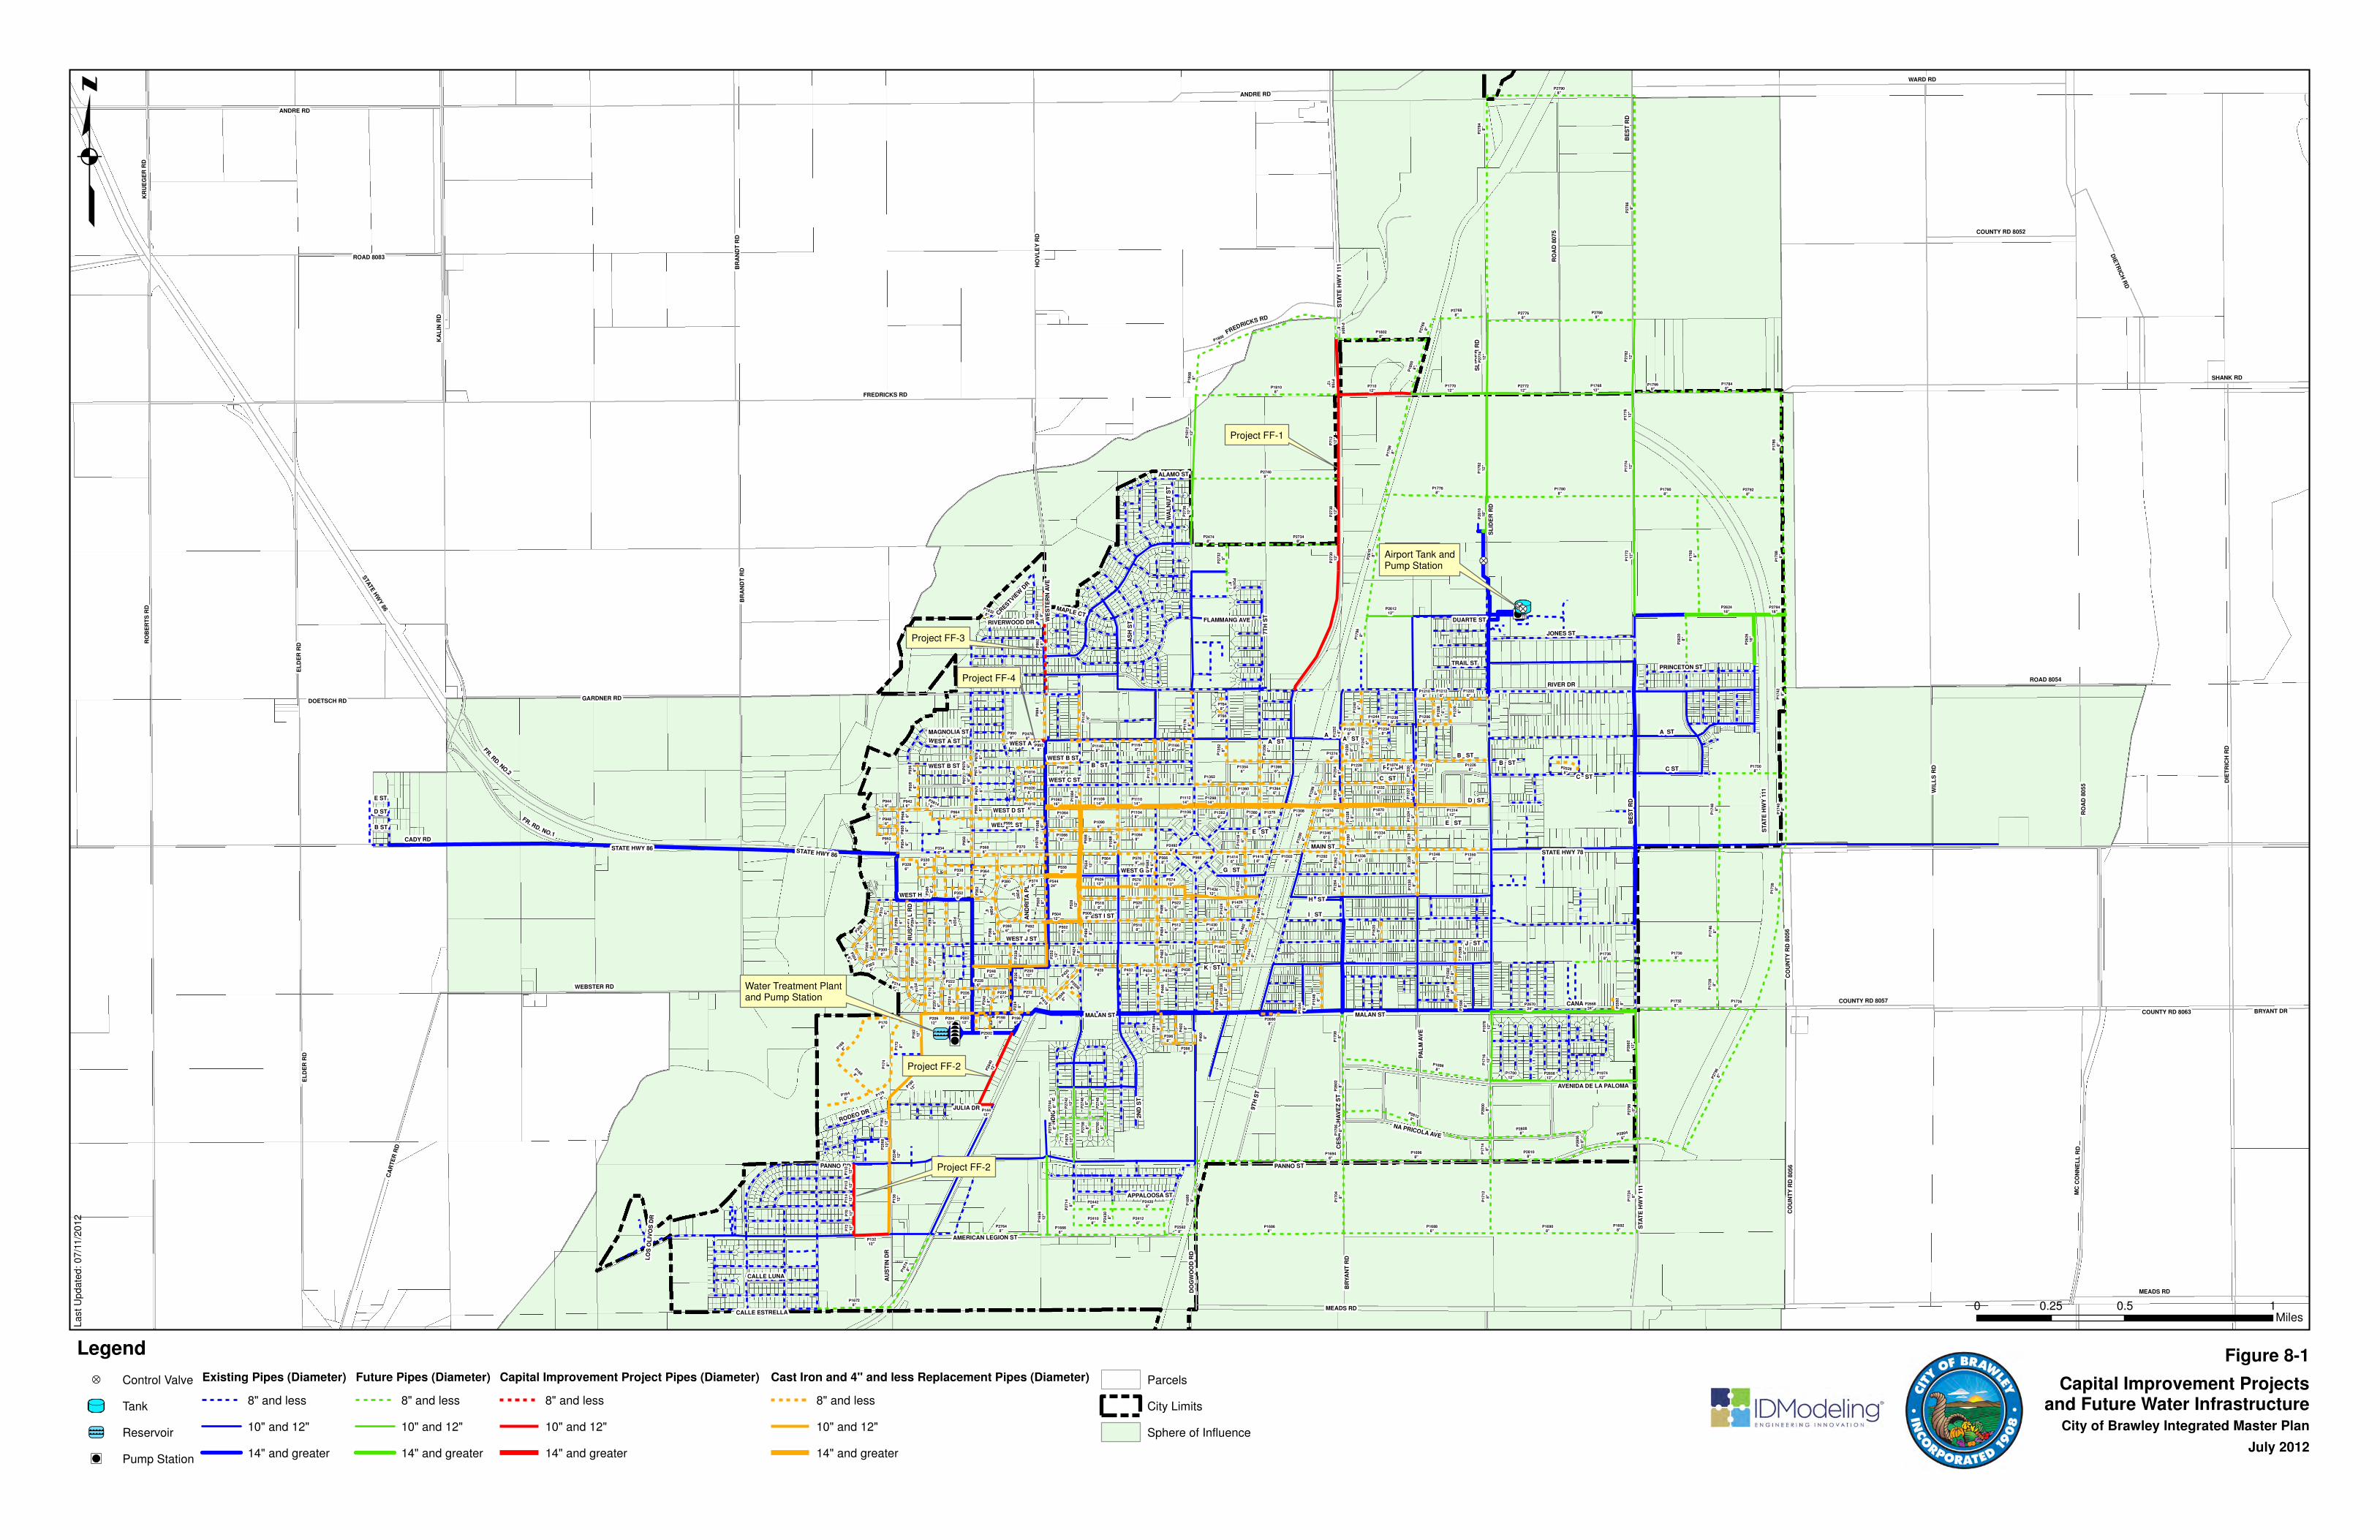
��!��!��!
��!��!��!��!��!a
kj
�?
�?�?
KA
LIN
RD
SHANK RD
ANDRE RD
MEADS RD
RO
BE
RT
S R
D
WIL
LS
RD
K ST
DIE
TR
ICH
RD
STATE HWY 78
FREDRICKS RD
EL
DE
R R
D
BE
ST
RD
STA
TE H
WY
86
WARD RD
I ST
CADY RD
HO
VL
EY
RD
STA
TE
HW
Y 1
11
J ST
PANNO ST
A ST
H ST
G ST
C ST
E ST
RIVER DR
D ST
CA
RT
ER
RD
MAIN ST
WEST D ST
BR
AN
DT
RD
COUNTY RD 8057
MC
CO
NN
EL
L R
D
ROAD 8083
9T
H S
T
WEBSTER RD
WEST J ST
GARDNER RD
RO
AD
80
75
B ST
ROAD 8054
CO
UN
TY
RD
805
6
2N
D S
T
7T
H S
T
C ST
RO
AD
80
55
JONES ST
CANAL ST
KR
UE
GE
R R
D
NA PRICOLA AVE
FR. R
D. N
O.2
MALAN ST
SL
IDE
R R
D
FR. RD. NO.1
WEST E ST
AU
ST
IN D
R
PANNO RD
BR
YA
NT
RD
WEST I ST
AVENIDA DE LA PALOMA
A ST
PA
LM
AV
E
AS
H S
T
DO
GW
OO
D R
D
WE
ST
ER
N A
VE
DOETSCH RD
WA
LN
UT
ST
WEST G ST
COUNTY RD 8052
JULIA DR
RU
SS
EL
L R
D
TRAIL ST
CE
SA
R C
HA
VE
Z S
T
COUNTY RD 8063
KIN
DIG
AV
E
PRINCETON ST
WEST B ST
BRYANT DR
ALAMO ST
APPALOOSA ST
RODEO DR
CALLE ESTRELLA
CALLE LUNA
DUARTE ST
MAGNOLIA ST
WEST A ST
AMERICAN LEGION ST
WEST C ST
FLAMMANG AVE
CRES
TVIEW
DR
AN
DR
ITA
PL
B ST
E ST
PEACH ST
D ST
WEST H ST
MAPLE CT
RIVERWOOD DR
LO
S O
LIV
OS
DR
MEADS RD
C ST
STA
TE
HW
Y 1
11
DIE
TR
ICH
RD
FREDRICKS RD
STATE HWY 86
SL
IDE
R R
D
STATE HWY 86
MALAN ST
BR
AN
DT
RD
WEST A ST
ANDRE RD
STA
TE
HW
Y 1
11
CO
UN
TY
RD
805
6
B STWEST B ST
A ST
EL
DE
R R
D
BE
ST
RD
B ST
A ST
E ST
P86
28''
P71
212
''
P71012''
P2840
12''
P70
8
12
' '
P27
38
12
''
P132
12''
P27
30
12
''
P70
12
''P
72
12
''
P14412''
P11
012
''P
11
212
''P
11
412
''
P9928''
P24788''
P86
28''
P9986''
P13
812
''
P55
816
''
P13326''
P13366''
P13346''
P131412''P1064
8''
P187014''
P18
012
''
P16
88'
'P370
8''
P44
68''
P1668''
P99
46''
P50
08''
P164
8''
P5688''
P39
2
8''
P32
4
6''
P29
26''
P29
46''
P29
66''
P12268''
P14426''
P13826''
P11
76
8''
P11408''
P18
212
''
P57412''
P15
48
6''
P15
38
8''
P5226''
P11
42
6''
P17
28''
P5128''
P24812''
P5108''
P5208''
P10
84
8''
P53612''
P5188''
P5088''
P5648''
P4286''
P57012''
P18748''
P5768''
P25012''
P5026''
P30
86''
P28
86''
P2326''
P29
06''
P111214''
P16
212
''
P5388''
P11068''
P58
26''
P52
812
''
P50412''
P1708''
P36
28''
P1108
14''
P10948''
P11648''
P9646''
P10906''
P111014''
P11048''
P30
66'
'
P12026''
P12926''
P4926''
P21
6
6''
P11668''
P13508''
P13486''
P40
28''
P12
42
6''
P39
48''
P10668''
P13626''
P106216''
P12
40
6''
P10586''
P13666''
P13546''
P14306''
P143412''
P13606''
P129814''
P3386''
P10206''
P10186''
P10166''
P15026''
P176
8''
P13646''
P13466''
P21
06''
P3526''
P3688''
P1444
8''
P22
46''
P23
46''
P374
6''
P24
08''
P3648''
P12
20
6''
P42
08'
'
P130814''
P12288''
P14
50
8''
P22
06''
P38
6
6''
P3806''
P131014''
P48
28''
P25
212
''
P23
86''
P48
48''
P38
86''
P42
48''
P48
66''
P14168''
P31
06''
P34
66''
P9526''
P55
412
''
P3286''
P93
86''
P12
08
6''
P14148''
P9486''
P23
66''
P49
08''
P9906''
P17
48''
P2286''
P9446''
P1290
6''
P9426''
P25288''
P10
88
6''
P95
46''
P10
70
6''
P13
28
8''
P3988''
P12
60
8''
P4346''
P14
18
6''
P28146''
P13
24
8''
P12
86
6''
P12
64
8''
P12
58
8''
P1402
8''
P12
62
8''
P96
66''
P13
22
8''
P4366''
P12
54
8''
P13
30
8''
P1986''
P13
52
8' '
P13
20
8''
P13
56
6''
P4386''
P11
32
8''
P16
20
8''
P12
56
8''
P12
50
8''
P3046''
P13
26
8''
P15
98
8''
P14
24
8''
P4326''
P14
22
6''
P2146''
P12248''
P95
86''
P25
068'
'
P330
6''
P1378
6''
P20612''
P2306''
P25088''
P15
82
8''
P12488''
P300
6''
P3906''
P26908''
P2226''
P20212''
P12106''
P2266''
P12066''
P15
84
8''
P20412''
P1426
12''
P12748''
P3968''
P12126''
P22
46
12
''
P4186''
P54424''
P14
00
8''
P97
06''
P94
66''
P302
6''
P29
86''
P97
86''
P5668''
P13806''
P40
08''
P12
52
6''
P1966''
P93
66''
P25028''
P3346''
P25
92
8''
P7868''
P12348''
P7848''
P97
26''
P15
86
8''
P10
68
6''
P97
46''
P95
06''
P12448''
P15
44
8''
P12368''
P18328''
P97
66''
P25
68
12
''
P24928''
P27
86
8''
P27
84
8''
P2796
8''
P17
38
8' '
P17
42
8''
P16988''
P16868''
P28128''
P16948''
P27908''
P17808''
P16968''
P16888''
P27408''
P18108''
P1806
8''
P26
10
8''
P17
72
12
''
P17
60
8''
P16668''
P17
88
8''
P17
46
8''
P27348''
P16908''
P17848''
P17
86
8''
P1798
8''
P17
82
12
' '
P17788''
P28108''
P2808
8''
P17
24
8''
P27648''
P18028''
P27928''
P18
12
12
''
P1674
8''
P17328''
P17308''
P16
56
12
''
P267024''
P177012''
P27808''
P16728''
P17
12
8''
P27
82
12
' '
P17
04
8''
P176812''
P277212''
P27
74
12
''
P17
48
8''
P27768''
P17
40
8''
P16
60
8''
P26
62
12
''
P197412''
P266824''
P17508''
P27
36
12
''
P17908''
P17
74
12
''
P17368''
P27
98
8''
P28
00
8' '
P24208''
P1800
8''
P262418''
P2768
8''
P28
02
8''
P2804
8''
P24128''
P26
26
18
''
P17
06
8''
P26
20
8''
P17
28
8''
P17
08
8''
P261212''
P16
70
12
''
P17
76
12
''
P17668''
P170012''
P18
08
8''
P17
16
12
''
P17
96
8''
P24428''
P24108''
P17268''
P265812''
P16928''
P24748''
P28
18
18
''
P279418''
P27
48
8''
P27
44
8''
P27
46
8''
P27
42
12
''
P25828''
P19
78
12
''
P27
32
8''
P24
76
8' '
P17
14
8''
P2766
8''
P18
04
8' '
P27
56
8''
P27
60
8''
P27
58
8''
P28
06
8''
P24
30
8''
P27
14
8''
0 0.5 10.25Miles
Legend
�? Control Valve
kj Tank
a Reservoir
��! Pump Station
Existing Pipes (Diameter)
8" and less
10" and 12"
14" and greater
Future Pipes (Diameter)
8" and less
10" and 12"
14" and greater
Capital Improvement Project Pipes (Diameter)
8" and less
10" and 12"
14" and greater
Cast Iron and 4" and less Replacement Pipes (Diameter)
8" and less
10" and 12"
14" and greater
Parcels
City Limits
Sphere of Influence
Capital Improvement Projectsand Future Water Infrastructure
La
st U
pd
ate
d:
07
/11
/20
12
City of Brawley Integrated Master Plan
Water Treatment Plantand Pump Station
Airport Tank andPump Station
q
July 2012
Project FF-1
Project FF-2
Figure 8-1
Project FF-4
Project FF-3
Project FF-2