Embed Size (px)
Citation preview


CITY OF BREA, CALIFORNIA
COMPREHENSIVE ANNUAL FINANCIAL REPORT
FOR THE FISCAL PERIOD ENDED JUNE 30, 2012
PREPARED BY: ADMINISTRATIVE SERVICES DEPARTMENT
WILLIAM GALLARDO
ADMINISTRATIVE SERVICE DIRECTOR
LEE SQUIRE FINANCIAL SERVICES MANAGER

THIS PAGE INTENTIONALLY LEFT BLANK

i
CITY OF BREA
COMPREHENSIVE ANNUAL FINANCIAL REPORT
JUNE 30, 2012
TABLE OF CONTENTS Page Number INTRODUCTORY SECTION
Table of Contents .............................................................................................................................. i Letter of Transmittal .......................................................................................................................... v Organizational Chart ......................................................................................................................... xv GFOA Certificate of Achievement for Excellence in Financial Reporting......................................... xvi
FINANCIAL SECTION INDEPENDENT AUDITORS' REPORT .................................................................................................. 1 MANAGEMENT'S DISCUSSION AND ANALYSIS ................................................................................ 3 BASIC FINANCIAL STATEMENTS Government-Wide Financial Statements:
Statement of Net Assets ................................................................................................................... 17
Statement of Activities ...................................................................................................................... 18 Fund Financial Statements:
Balance Sheet - Governmental Funds ............................................................................................. 22 Reconciliation of the Balance Sheet of Governmental Funds to the Statement of Net Assets ......................................................................................................... 24 Statement of Revenues, Expenditures and Changes in Fund Balances - Governmental Funds ...................................................................................................... 26 Reconciliation of the Statement of Revenues, Expenditures and Changes in Fund Balances of Governmental Funds to the Statement of Activities ...................................................................................................................... 28 Budgetary Comparison Statement by Department - General Fund ............................................................................................................................. 29 Statement of Net Assets - Proprietary Funds ................................................................................... 32 Statement of Revenues, Expenses and Changes in Fund Net Assets - Proprietary Funds ............................................................................................................... 33 Statement of Cash Flows - Proprietary Funds ................................................................................. 34 Statement of Fiduciary Net Assets - Fiduciary Funds ...................................................................... 36 Statement of Changes in Fiduciary Net Assets – Fiduciary Funds .................................................. 37

ii
CITY OF BREA
COMPREHENSIVE ANNUAL FINANCIAL REPORT
JUNE 30, 2012
TABLE OF CONTENTS Page Number FINANCIAL SECTION (Continued)
Notes to Financial Statements ............................................................................................................. 38
COMBINING AND INDIVIDUAL FUND STATEMENTS AND SCHEDULES
Combining Balance Sheet - Nonmajor Governmental Funds .......................................................... 87 Combining Statement of Revenues, Expenditures and Changes in Fund Balances - Nonmajor Governmental Funds ......................................................... 91
Budgetary Comparison Schedules:
Gas Tax ...................................................................................................................................... 94 Narcotics Enforcement Asset Seizure ....................................................................................... 95 Air Quality Improvement ............................................................................................................. 96 Park Development ...................................................................................................................... 97 Measure M ................................................................................................................................. 98 Affordable Housing Trust ........................................................................................................... 99 Community Development Block Grant ....................................................................................... 100 Capital Improvements ................................................................................................................ 101 Solar Energy Project .................................................................................................................. 102 Capital and Mitigation Improvement .......................................................................................... 103 Storm Drain………… .................................................................................................................. 104 Midbury………………… ............................................................................................................. 105 Combining Statement of Net Assets – Nonmajor Proprietary Funds ............................................... 108
Combining Statement of Revenues, Expenses and Changes in Fund Net Assets - Nonmajor Proprietary Funds........................................................................................ 109
Combining Statement of Cash Flows - Nonmajor Proprietary Funds .............................................. 110 Combining Statement of Net Assets - Internal Service Funds ......................................................... 112 Combining Statement of Revenues, Expenses and Changes in Fund Net Assets - Internal Service Funds ........................................................................................ 113 Combining Statement of Cash Flows - Internal Service Funds ........................................................ 114 Combining Balance Sheet - All Agency Funds ................................................................................. 118 Combining Statement of Changes in Assets and Liabilities - All Agency Funds .............................................................................................................................. 120

iii
CITY OF BREA
COMPREHENSIVE ANNUAL FINANCIAL REPORT
JUNE 30, 2012
TABLE OF CONTENTS Page Number STATISTICAL SECTION Net Assets by Component ................................................................................................................ 125 Changes in Net Assets ..................................................................................................................... 126 Fund Balances – Governmental Funds ............................................................................................ 128 Changes in Fund Balances – Governmental Funds ......................................................................... 129 Assessed Value and Estimated Actual Value of Taxable Property .................................................. 130 Direct and Overlapping Property Tax Rates ..................................................................................... 131
Principal Property Tax Payers .......................................................................................................... 132
Property Tax Levies and Collections ................................................................................................ 133
Ratio of Outstanding Debt by Type ................................................................................................... 134 Ratio of Net General Bonded Debt Outstanding .............................................................................. 135 Direct and Overlapping Governmental Activities Debt ..................................................................... 136 Legal Debt Margin Information ......................................................................................................... 137 Pledged Revenue Coverage ............................................................................................................. 138 Demographic and Economic Statistics ............................................................................................. 139 Principal Employers .......................................................................................................................... 140 Full-Time Equivalent City Employees by Function ........................................................................... 141 Operating Indicators by Function ...................................................................................................... 142 Capital Asset Statistics by Function .................................................................................................. 143

THIS PAGE INTENTIONALLY LEFT BLANK
iv

December 19, 2012
Honorable Mayor, Members of the City Council, and Citizens of the City of Brea:
We are pleased to submit to you the Comprehensive Annual Financial Report (CAFR) of the City of Brea for the Fiscal Year ended June 30, 2012. This report is published in accordance with local ordinance and state law requirements that financial statements be presented in conformity with accounting principles generally accepted in the United States of America and audited in accordance with auditing standards generally accepted in the United States of America by a firm of licensed certified public accountants.
This report consists of management’s representations concerning the finances of the City of Brea. Consequently, management assumes full responsibility for the completeness and reliability of all of the information presented in this report. To provide a reasonable basis for making these representations, management of the City of Brea has established a comprehensive internal control framework that is designed both to protect the government’s assets from loss, theft, or misuse and to compile sufficient reliable information for the preparation of the City of Brea’s financial statements. Because the cost of internal controls should not outweigh their benefits, the City of Brea’s comprehensive framework of internal controls has been designed to provide reasonable rather than absolute assurance that the financial statements will be free from material misstatement.
As management, we assert that, to the best of our knowledge and belief, the enclosed data is accurate in all material respects and is reported in a manner designed to present fairly the financial position and results of operations of the various funds and component units of the City of Brea. All disclosures necessary to enable the reader to gain an understanding of the City’s financial activities have been included.
Lance, Soll & Lunghard, LLP, a firm of licensed certified public accountants, has audited the City of Brea’s financial statements. The goal of the independent audit was to provide reasonable assurance that the financial statements of the City of Brea for the Fiscal Year ended June 30, 2012, are free of material misstatement. The independent audit involved examining, on a test basis, evidence supporting the amounts and disclosures in the financial statements; assessing the accounting principles used and significant estimates made by management; and evaluating the overall financial statement presentation.
The independent auditor concluded that there was a reasonable basis for rendering an unqualified opinion that the City of Brea’s financial statements for the Fiscal Year ended June 30, 2012, are fairly presented in all material respects in conformity with accounting principles generally accepted in the United States of America. The independent auditors’ report is presented as the first component of the financial section of this report.
The City of Brea is required to undergo an annual single audit in conformity with the provisions of the Single Audit Act of 1984 and the U.S. Office of Management and Budget’s Circular A-133, Audits of State and Local Governments. Information related to this single audit, including a schedule of expenditures of federal awards assistance, the independent auditors’ reports on the internal controls and compliance with applicable laws and regulations, and a schedule of findings and questioned costs is available in the City of Brea’s separately issued Single Audit Report.
v

Generally Accepted Accounting Principles (GAAP) requires that management provide a narrative introduction, overview, and analysis to accompany the basic financial statements in the form of Management’s Discussion and Analysis (MD&A). This letter of transmittal is designed to complement MD&A and should be read in conjunction with it. The City of Brea’s MD&A can be found immediately following the report of the independent auditors.
CITY OF BREA PROFILE
The City of Brea, a diverse residential and business community is located at the most northern tip of Orange County at the juncture of three counties with access to major airports, popular regional attractions, beaches, deserts and mountains. Nestled among the hillsides, just 25 miles southeast of Los Angeles, Brea is home to more than 40,000 residents and hosts a daytime working population of more than 100,000.
The long-term economic condition and outlook of Brea and Orange County is trending upward. The City is a major retail center featuring the county’s fourth largest shopping center, the Brea Mall; the Brea Union Plaza; Brea’s Downtown; and a host of other retail and service businesses. Brea is also a center for big businesses such as Albertson Market Distribution Center, Bank of America, Beckman-Coulter, Bristol Industries, Esterline Kirkhill, Evangelical Christian Credit Union, Kaiser Permanente, Kindred Hospital, Nature’s Best, Veterinary Pet Insurance Company. Several companies’ corporate headquarters are located within Brea, including American Suzuki, Krystal Infinity, Mercury Insurance, Nestle Waters/Arrowhead Water, Avery-Dennison Office Products, and Harte-Hanks Publishing. Although Brea is a major retail and business hub, it maintains a balance with nature, preserving its hillside and canyon areas, which also contribute to Brea’s quality of life. Brea is home to one of the nation’s largest outdoor sculpture collections,with 156 pieces of sculpture created to date, an art gallery and a performing arts theatre. Brea has long been recognized for its vision and innovation. It possesses a focused economic development strategy, designed to ensure a well balanced, economically viable community which includes a wide range of housing, beautiful parks and excellent schools.
Brea provides an excellent portfolio of responsive municipal services. The City operates as a “full service city,” providing a full range of services including police and fire protection, water and sanitation services, construction and maintenance of streets and infrastructure, recreational and cultural services. Besides serving its own residential and business customers, Brea has a tradition of entrepreneurial ventures providing services to numerous other public agencies such as police, information technology, printing and public information.
The City of Brea operates under the Council-Manager form of government, and is governed by a five member City Council elected at large, serving staggered four-year terms. Council elections are held in November of even-numbered years in conjunction with statewide general elections.
The annual budget serves as the foundation for the City of Brea’s financial planning and control. The budget is adopted on an annual basis by the City Council in June of each year. The budget team, with the approval of the City Manager, develops budget guidelines in January. The various City departments then submit revenue estimates and expenditure appropriation requests for the one-year period that begins July 1. Departmental hearings are held with each department, which leads to the development of the proposed budget. The City Manager then presents the proposed budget document to the City Council, which is discussed with the City Council in public workshops in mid-May. Formal public hearings are held in early June. The City Council adopts the annual budget on or before June 30 of each year. At the conclusion of the first six months, the budget team prepares a report of the progress of the first half of the budget cycle. The City Manager formally reviews the report with the City Council. The City Council adopts mid-term budget modifications as required. The level of budgetary control is established at the department level within the General Fund and at the fund level of all other funds.
vi

LOCAL ECONOMIC FACTORS
Brea’s physical setting encompasses about 7,955 acres or 12.43 square miles of land. Brea’s land use is distributed as follows:
LAND USE DISTRIBUTION
The current land use mix produces General Fund revenues of approximately $58 million. The top five revenue sources include sales tax, charges for providing police services to City of Yorba Linda, property taxes, vehicle license taxes, and franchise taxes. These revenue sources account for 71.7% of the total amount of General Fund revenues. The remaining revenues account for 28.3% of the total, and are represented by a broad range of sources.
Sales Tax: Sales tax represents the single largest source of General Fund revenue at $19 million. It is derived from six major economic categories as listed in the chart on the following page. The retail category, including department stores, apparel stores and general merchandise, makes up 46.7% of the total sales tax generated. This sector includes the regional Brea Mall, which is the fourth largest mall in sales tax volume in Orange County. The second largest economic sector is the business-to-business category at 18.4%. During Fiscal Year 2011-12, the City’s sales tax consultant MuniServices reported that the sales tax receipts grew and improved every quarter throughout the State. In the final quarter of Fiscal Year 2011-12, Brea experienced a 4.4% increase in sales tax compared to the final quarter of Fiscal Year 2010-11 and
32.6%
19.2% 11.9%
5.0%
3.0%
28.3%
General Fund Revenues by Revenue SourceFiscal Year Ended June 30, 2012
Sales tax
Yorba Linda police services
Property taxes
Vehicle license fees
Franchise taxes
Other
Land Use Distribution PercentResidential (single-family, multi-family, and mobile homes) 26%Commercial and Office 5Industrial 12Parks and Open Space 14Public Facilities (City facilities, schools, drainage
channels, and fire stations)4
Carbon Canyon Hillsides Areas and Vacant Lands 21Agriculture 1Vacant 2Other (streets) 15
Total 100%
Source: City of Brea General Plan (2003)
vii

a year-over-year annual increase of 3.5%. Overall, Brea’s sales tax on a per capita basis consistentlyoutperforms other municipalities, a strong indicator that the City imports sales tax dollars from surrounding communities.
Charges for Police Services: Beginning in 1970, the adjacent City of Yorba Linda entered into a contract with the City of Brea for law enforcement services. This contractual relationship has existed for the past 42 years and is currently in the last year of a five-year agreement. Around the clock patrol services, traffic officer services, investigation services, patrol and investigative supervision, and non-sworn community service officer services are provided to this city of over 68,000 people.
The City of Brea received $11.2 million in Fiscal Year 2011-12 from the City of Yorba Linda for police services. Both cities receive a significant financial benefit from this long-term relationship, as the cost of one agency providing services to two cities is significantly less than the cost of operating two separate departments.
Property Taxes: Brea is a very diverse community as previously indicated in the land use chart. General Fund property taxes represent $6.9 million or 11.9% of General Fund revenues. Assessed valuation of all property (including the Redevelopment Agency) in Brea is $7.3 billion, a slight decrease of 0.5% over the prior fiscal year. The valuation is split between residential at 50%, commercial/industrial at 36.9%, and the remaining 13.1% for other miscellaneous uses. Of the City’s 15,272 dwelling units, 65% are single-family units, 28% are multi-family units and 7% are mobile homes. Housing costs in Brea continue to rank among the highest in North Orange County. Brea, like all cities nationwide, is experiencing a reduction in housing prices. The median price of a single-family home marginally decreased from $445,000 to $442,500 in Brea from the prior fiscal year.
Vehicle License Fees (VLF): When a vehicle is registered in California, a license fee is charged by the State of California. This fee includes a small administrative fee and a property tax in lieu fee. The in lieu fee is based on depreciated value of the vehicle and declines over the useful life of the vehicle. The in lieu fee, while collected by the State Department of Motor Vehicles, belongs to local government (cities and counties). It is allocated based on a per capita basis.
Beginning in January 2005, the Vehicle License Fee was permanently reduced to 0.65% from 2.0% of the vehicle’s fair market value. Any loss to cities by this rate reduction will be made up, dollar for dollar, with an allocation from the County’s Educational Revenue Augmentation Fund (ERAF) account with two payments, due on or before January 31st and May 1st of each year. This allocation will grow with any corresponding growth in the City’s secured property tax valuation.
46.7%
18.4%
15.1%8.5%
10.5%
0.8%
Sales Tax by Economic CategoriesFiscal Year ended June 30, 2012
General Retail
Business to Business
Food Products
Transportation
Construction
Miscellaneous
viii

Franchise Taxes: The franchise revenue accrues to the City based on adopted City ordinances and contractual agreements. Public utilities (electric and gas) account for 46.2% of the $1.7 million in annual franchise tax revenue. The remaining 53.8% of this revenue includes franchise fees for oil pipelines, cable television, and other non-city utilities.
Franchise TaxesFiscal Year Ended June 30, 2012
Annual PercentRevenue of Total
Public Utilities $ 787,724 46.2%All Others 918,907 53.8%
Totals $ 1,706,631 100.0%
ECONOMIC OUTLOOK
The City Council and staff have taken proactive measures, rather than reactive, to weather through these tough economic times. Brea’s excellent financial condition is not only the result of the City’s efforts during Fiscal Year 2011-12, but the result of fiscally conservative organizational decisions made over the past five years, which include City-wide reorganization, increasing employee retirement contributions, and other reductions, all of which total nearly $7 million in savings since Fiscal Year 2007-08.
Despite overcoming past budget woes, the City of Brea continues to face new challenges. On February 1, 2012, the State eliminated all redevelopment agencies. Due to advanced planning, the City has been able to adjust to the reduction of funding. However, uncertainty remains on whether the City will have access to unspent bond proceeds generated by the former Brea Redevelopment Agency. Also, in April 2012, the Yorba Linda City Council voted to enter into a new police services contract with the Orange County Sheriff, ending a 42-year relationship with the City of Brea. The police services contract expires in May 2013 and staff are diligently working across departments to develop a Brea Police Department reorganization plan.
Overall, Fiscal Year 2012-13 budget is balanced due to a solid foundation of fiscally conservative practices combined with innovative solutions on tough strategic decisions. Revenues for Fiscal Year 2012-13 are projected to be slightly lower due to the elimination of the Yorba Linda Police Services Contract. However, the Five-Year Projections show positive signs for Brea with revenues exceeding expenditures through Fiscal Year 2016-17.
It is important to understand why the City of Brea (and all local government) is impacted from the recession. The primary funding source for City operations such as Police, Fire, and Community Services, is the City’s General Fund. Unlike the State Government, the City does not exert control over the two primary sources of revenue for the General Fund - property taxes and sales taxes. As was the case last year, the State legislature and the Governor are dealing with a multi-billion dollar deficit and, as usual, are looking to local government revenues to help balance their budget.
The following regional factors, along with the State and National economic issues, will continue to have a negative impact on Brea’s revenues and expenditures:
An anticipated slow recovery from the economic recession will impact sales tax revenues,transient occupancy tax, business license tax, and interest earnings
ix

The housing downturn will continue to keep property tax revenues flat in Brea The State budget crisis which puts City revenues at risk of being “borrowed” to help solve Sacramento’s fiscal problemsThe fiscal losses of the Public Employees’ Retirement System will be passed to cities in the form of higher costs for retirement in future budgets.
It is expected that these factors will continue to have a negative impact on the City’s revenues for many years. Therefore, other costs such as energy, water, and equipment are being diligently managed in an effort to minimize the need for additional service reductions. Going forward, during Fiscal Year 2012-13,City staff will continue to be diligent in monitoring economic factors and seek additional budget solutions to structurally balance the budget.
Locally, geographic and socio-economic conditions in Orange County and the City of Brea remain desirable. Property values in the region are projected to remain fairly stable, and the City’s tax base is expected to continue its favorable trend for the foreseeable future. Brea’s assessed valuation for Fiscal Year 2011-12 decreased slightly by 0.5% from the prior year, but has averaged an increase of 1.46% over the past five years. Brea’s sales tax increased and did so by $2,328,958, or approximately 14%, in Fiscal Year 2011-12,compared to the prior fiscal year. Based on economic data trends and projections, sales tax is projected to increase 4.5% for Fiscal Year 2012-13 compared to Fiscal Year 2011-12.
Highlights for the State of California from the UCLA Anderson Forecast on December 5, 2012 include the following:
California’s forecast reflects a slightly slower gain than the national forecast in employment through 2013, with faster-paced growth through 2014.
The State will see employment growth of 1.3% in 2013 and 2.4% in 2014. Unemployment will fall through 2013 and will average approximately 9.7% for the year. In 2014, it
is expected that the unemployment rate will drop to 8.4% on average, a percent higher than the U.S. forecast.
Real personal income growth will be 1.8% in 2013 and 3.1% in 2014.
On the national front, the Gross Domestic Project (GDP) growth will grow at less than a 2% annual rate through mid-2013. After that, the forecast expects growth to pick up and exceed 3% for most of 2014 with housing activity leading the way. However, if Congress and the President fail to agree to an end of year compromise on taxes and spending, the economy could fall off the “fiscal cliff”, leading to a downturn in 2013.
LONG-TERM FINANICAL PLANNING
Brea Engagement & Strategy Team (formally known as Budget Strategic Planning): Representatives from all City departments began meeting since late 2005 to discuss budget strategic planning issues. Over 40 City staff members work collaboratively on an ongoing basis. Originally, these meetings focused on identifying and evaluating changing City needs, a significant amount of which is spurred by future development. Likewise, in years past this included identification of capital project needs across all departments, as well as associated staffing and supplies needs which are anticipated for those projects. Additionally, staff explored various revenue generating options. In Fiscal Year 2009-10, the focus shifted to tackling economic impacts to the City’s budget, including state revenue takeaways and revenue deferrals. The financial decisions reached as a result of the City’s collaborative budget strategic planning process are reflected in the Fiscal Year 2011-12 financials. The Brea Engagement & Strategy Team (BEST) group implemented previously recommended stop-gap measures including expenditure reductions, revenue enhancements, and also which City needs would remain unmet. The BEST group continues to meet to focus on addressing the structural changes to the budget necessary to sustain the City over the course of the next several fiscal years and beyond.
x

Capital Improvement Program (CIP) Budget: The goal of the seven-year CIP is to enhance the quality of life in the community, ensure a safe environment and to promote transportation improvement in the City. The CIP for Fiscal Year 2011-12, the first one of the seven years, reflects the City Council’s commitment to this goal by enhancing existing infrastructure and providing new infrastructure to aid in service delivery to the community. The remaining six years of the CIP are not a commitment of actual funds, but rather a long-range planning tool for subsequent investments in the City’s infrastructure. The CIP is divided into seven categories: downtown, streets, traffic safety enhancements, water, storm drain, sewer, and facility improvements.
Community Center Reserves: Funds are set aside annually for the future replacement of the Community Center facility and equipment. Ongoing review of facility and equipment needs allows the City to manage and plan for expenditures in a more proactive manner. The balance in Community Center Reserves at June 30, 2012 was $590,613.
Capital Asset Reserves: Funds are set aside annually for the replacement of City-owned infrastructure, facilities and capital assets. In addition to a fixed annual contribution, an assessment is made at the end of each fiscal year to determine whether an additional contribution can be made based upon a review of General Fund excess revenues over expenditures. The balance in Capital Asset Reserves at June 30, 2012 was $6,546,809.
Relevant Financial Policies
Dissolution of the Brea Redevelopment Agency
During the year, per AB 1X 26, the Brea Redevelopment Agency, a component unit of the City, was dissolved effective February 1, 2012. Prior to that date, the final seven months of the activity of the redevelopment agency continued to be reported in the governmental funds of the City. After the dissolution, the City of Brea elected to become the Successor Agency for the former Brea Redevelopment Agency. The remaining five months of the fiscal year of the dissolved redevelopment agency were reported in a fiduciary fund (private-purpose trust fund) in the financial statements of the City.
Major Initiatives
Pension Reform
Starting in Fiscal Year 2011-12, the City of Brea began the first year of pension reform for both safety and non-safety employees by requiring employees to contribute toward their retirement and instituting a second retirement tier for new employees. Current safety employees will begin to pay toward their retirement costs over the term of the bargaining unit memorandums of understanding (MOUs) in two steps; on July 1, 2011, they will begin to pay 2.25% of salary; plus an additional 2.25% of salary on July 1, 2012, for a total of 4.5% of their base pay toward their retirement costs. Safety employees hired after July 1, 2011 will contribute 9% of their base pay toward their retirement. In addition, the MOUs for sworn safety employees that include fire, police and police management contain provisions to change the current retirement formula for new hires from the 3% @ age 50 CalPERS formula to the 2% @ age 50 CalPERS retirement formula.
Non-safety employees will also begin to contribute toward their retirement in two steps; on July 1, 2011, they will begin to pay 1.125% of salary plus an additional 1.125% of salary on July 1, 2012, for a total of 2.25% of their base pay over the term of the bargaining unit memorandums of understanding (MOUs). Non-safety employees hired after July 1, 2011 will contribute 7% of their base pay toward their retirement. The retirement formula for non-safety employees remains unchanged from 2% @ age 55 CalPERS formula.
At the end of Fiscal Year 2011-12, the total employee contributions were expected to be $655,000. In addition, the implementation of a two-tiered retirement system is a long-term savings measure whereby savings are not fully realized for many years in the future.
xi

Water Rights Acquisition from California Domestic Water Company
The City of Brea currently imports 100% of its water from two major suppliers: California Domestic Water Company (Cal Domestic) and the Metropolitan Water District of Orange County (MWDOC). In December 2011, the City approved the purchase of additional water rights (“shares”) from Cal Domestic to secure the purchase of water at a discounted rate known as an a “entitlement” rate each year from the Main San Gabriel Basin. Currently, a share of Cal Domestic stock represents the right to purchase approximately 1.4 acre feet (ac/ft) of water. The City acquired 665 ac/ft of water rights at a cost not to exceed $12,259 per ac/ft for a total of $8.15 million. The purchase was paid by a combination of proceeds from the 2009 water bonds ($2.5 million) and interfund loans of $4 million from the Risk Management Fund and $1.65 million from the General Fund. The Water Fund will repay the interfund loans with interest within the next seven years. In addition to short-term cost savings, owning water rights will significantly improve the City’s control over its future and places the City in a desirable position should water scarcity continue in the future.
Olinda Alpha Landfill Agreement
In July 2009, the City of Brea entered in to the cooperative agreement with the County of Orange regarding the Olinda Alpha Landfill. The Olinda Alpha Landfill is located in the City of Brea, but operated by the County of Orange. The agreement extended the operations of the landfill through 2021 and provided the City $10.5 million for use by the City to benefit community amenities and transportation improvements. The $10.5 million will be paid over three installments of $3.5 million each. The first $3.5 million was used for the Valencia Avenue Road Project. The remaining $7 million will provide funding for projects at the City’s discretion ($3.5 million paid in Fiscal Year 2009-10 and 2011-12). In addition, from 2014 through the closure of the landfill, the County will pay the City $1.50 per ton on waste accepted at the Landfill. This is expected to generate approximately $2 million per year through 2021.
AWARDS
The Government Finance Officers Association of the United States and Canada (GFOA) awarded a Certificate of Achievement for Excellence in Financial Reporting to the City of Brea for its Comprehensive Annual Financial Report for the Fiscal Year ended June 30, 2011. This was the twenty-second (22nd)consecutive year that the government has achieved this prestigious award. In order to be awarded a Certificate of Achievement, a government must publish an easily readable and efficiently organized comprehensive annual financial report. This report must satisfy both generally accepted accounting principles and applicable legal requirements.
A Certificate of Achievement is valid for a period of one year only. We believe our current comprehensive annual financial report continues to conform to the Certificate of Achievement Program’s requirements and we are submitting it to GFOA to determine its eligibility for another certificate.
xii
xiii

THIS PAGE INTENTIONALLY LEFT BLANK
xiv

CITY�O
RGANIZATIO
N�CHART�
Brea�Residen
ts
City�Com
mission
s
City�Attorne
y*C
ity�Co
uncil
�
Police
Adm
inis
trat
ive�
and�
Cont
ract
�Ser
vice
s
Inve
stig
ativ
e�an
d�Su
ppor
t�Ser
vice
s
Uni
form
�Ser
vice
s
Fire
Fire
�Ope
ratio
ns
Fire
�Pre
vent
ion
Adm
inistrative�
Services
Reve
nue�
and�
Budg
et
Aud
iting
�and
�A
ccou
ntin
g
Purc
hasi
ng
Info
rmat
ion�
Tech
nolo
gy
Hum
an�R
esou
rces
City
�Cle
rk
Commun
ity�
Services
Recr
eatio
n�Se
rvic
es��
Art
s�an
d�H
uman
�Se
rvic
es
Com
mun
ity�C
ente
r
Commun
ity�
Develop
men
t
Plan
ning
Build
ing�
and�
Safe
ty
Econ
omic
�D
evel
opm
ent
Aff
orda
ble�
Hou
sing
Public�W
orks
Engi
neer
ing
Stre
ets�
and�
Sani
tatio
n
Wat
er�O
pera
tions
Equi
pmen
t�M
aint
enan
ce
Park
s�an
d�Tr
ees
Build
ing�
Mai
nten
ance
Com
mun
icat
ions
�an
d�M
arke
ting
City�M
anager
*City�Treasurer
�
*Elected�
xv

xvi

INDEPENDENT AUDITORS’ REPORT
To the Honorable Mayor and Members of City Council City of Brea, California We have audited the accompanying financial statements of the governmental activities, the business-type activities, each major fund, and the aggregate remaining fund information of the City of Brea, California, as of and for the year ended June 30, 2012, which collectively comprise the City's basic financial statements as listed in the table of contents. These financial statements are the responsibility of City’s management. Our responsibility is to express opinions on these financial statements based on our audit. We conducted our audit in accordance with auditing standards generally accepted in the United States of America and the standards applicable to financial audits contained in Government Auditing Standards, issued by the Comptroller General of the United States. Those standards require that we plan and perform the audit to obtain reasonable assurance about whether the financial statements are free of material misstatement. An audit includes examining, on a test basis, evidence supporting the amounts and disclosures in the financial statements. An audit also includes assessing the accounting principles used and the significant estimates made by management, as well as evaluating the overall financial statement presentation. We believe that our audit provides a reasonable basis for our opinion. In our opinion, the financial statements referred to above present fairly, in all material respects, the respective financial position of the governmental activities, the business-type activities, each major fund, and the aggregate remaining fund information of City as of June 30, 2012, and the respective changes in financial position, and cash flows, where applicable, thereof and the respective budgetary comparison for the General Fund for the year then ended in conformity with accounting principles generally accepted in the United States of America. In accordance with Government Auditing Standards, we have also issued our report dated December 21, 2012, on our consideration of the City’s internal control over financial reporting and on our tests of its compliance with certain provisions of laws, regulations, contracts, and grant agreements and other matters. The purpose of that report is to describe the scope of our testing of internal control over financial reporting and compliance and the results of that testing, and not to provide an opinion on internal control over financial reporting or on compliance. That report is an integral part of an audit performed in accordance with Government Auditing Standards and should be considered in assessing the results of our audit.
Lance, Soll & Lunghard, LLP 203 North Brea Boulevard • Suite 203 • Brea, CA 92821 • TEL: 714.672.0022 • Fax: 714.672.0331 www.lslcpas.comOrange County Temecula Valley Silicon Valley
Brandon W. Burrows, CPADavid E. Hale, CPA, CFP A Professional CorporationDonald G. Slater, CPARichard K. Kikuchi, CPASusan F. Matz, CPAShelly K. Jackley, CPABryan S. Gruber, CPADeborah A. Harper, CPA

To the Honorable Mayor and Members of City Council City of Brea, California Accounting principles generally accepted in the United States of America require that the management's discussion and analysis as listed in the table of contents be presented to supplement the basic financial statements. Such information, although not a part of the basic financial statements, is required by the Governmental Accounting Standards Board, who considers it to be an essential part of financial reporting for placing the basic financial statements in an appropriate operational, economic, or historical context. We have applied certain limited procedures to the required supplementary information in accordance with auditing standards generally accepted in the United States of America, which consisted of inquiries of management about the methods of preparing the information and comparing the information for consistency with management's responses to our inquiries, the basic financial statements, and other knowledge we obtained during our audit of the basic financial statements. We do not express an opinion or provide any assurance on the information because the limited procedures do not provide us with sufficient evidence to express an opinion or provide any assurance. Our audit was conducted for the purpose of forming opinions on the financial statements that collectively comprise City’s financial statements as a whole. The introductory section, combining and individual nonmajor fund financial statements and schedules, and statistical section, are presented for purposes of additional analysis and are not a required part of the financial statements. The combining and individual nonmajor fund financial statements and schedules are the responsibility of management and were derived from and relate directly to the underlying accounting and other records used to prepare the financial statements. The information has been subjected to the auditing procedures applied in the audit of the financial statements and certain additional procedures, including comparing and reconciling such information directly to the underlying accounting and other records used to prepare the financial statements or to the financial statements themselves, and other additional procedures in accordance with auditing standards generally accepted in the United States of America. In our opinion, the information is fairly stated in all material respects in relation to the financial statements as a whole. The introductory and statistical sections have not been subjected to the auditing procedures applied in the audit of the basic financial statements and, accordingly, we do not express an opinion or provide any assurance on them.
Brea, California December 21, 2012
2

MANAGEMENT’S DISCUSSION AND ANALYSIS
This section of the City of Brea’s Comprehensive Annual Financial Report (CAFR) presents management’s discussion and analysis of the City’s financial performance during the fiscal year that ended on June 30, 2012. This analysis should be read in conjunction with the Transmittal Letter at the front of this report and the accompanying Basic Financial Statements. FINANCIAL HIGHLIGHTS Long-Term Economic Resource (Government-wide) Focus – Economic resources are differentiated from financial resources in that the economic measurement focus measures changes in net assets as soon as the event occurs regardless of the timing of related cash flows. Therefore, this measurement focus includes both current spendable resources and fixed non-spendable assets, and long-term claims against these assets. The resulting net asset utilizing this measurement focus provides one measure of the City’s overall long-term financial condition. • The assets of the City exceeded its liabilities at the close of the most recent fiscal year by $269.6
million. • The City’s total net assets increased $139.8 million to $269.6 million as a result of current year
operations and the extraordinary gain from the dissolution of the Brea Redevelopment Agency. • The City’s non-current liabilities of $55.2 million include $45.2 million of outstanding bonded debt and
capital leases, which was used to finance the acquisition of capital assets and to fund capital improvements. Total capital assets, net of depreciation represent $181.9 million of the $335.6 million in total assets. A significant portion of the capital assets have been funded through bond financing from the former Brea Redevelopment Agency.
Short-Term Financial Resource (Fund) Focus – The financial resources focus measures inflows of current spendable assets. The resulting net difference between current financial assets and current financial liabilities otherwise known as fund balance (or net working capital in the private sector) is to measure the City’s ability to finance activities in the near term. • At the close of the current fiscal year, the City’s Governmental Funds reported a combined ending
fund balance of $58 million, a decrease of $69.6 million. Of the total combined fund balance of $58 million for governmental funds, $1.58 million is nonspendable, $26.6 million is restricted, $6.5 million is committed, $2.3 million is assigned, and $21 million is unassigned. The decrease of $69.6 million is due to the dissolution of the Brea Redevelopment Agency on February 1, 2012.
• The General Fund reported an increase of $4.6 million in fund balance resulting in total ending fund balance of $30.7 million. Of total ending fund balance, $1.58 million is nonspendable, $926,483 is restricted, $6.5 million is committed, $590,613 is assigned, and $21 million is unassigned. The unassigned balance is available for future appropriations.
OVERVIEW OF THE FINANCIAL STATEMENTS The financial section of the comprehensive annual financial report contains the following information: Independent Auditor’s Report, Management’s Discussion and Analysis (this section), the Basic Financial Statements, and the Supplementary Information section, an optional section that presents combining and budgetary schedules for individual non-major funds. The Basic Financial Statements are comprised of three components: 1) Government-wide Financial Statements, 2) Fund Financial Statements and 3) Notes to the Financial Statements. The Management’s Discussion and Analysis is intended to be an introduction to the Basic Financial Statements.
3

BASIC FINANCIAL STATEMENTS Government-wide Financial Statements – The Government-wide Financial Statements are intended to provide a “Big Picture” view of the City as a whole using accounting methods similar to those used by private sector companies. The statement of net assets includes all of the City’s assets (including non-spendable assets like streets and roads) and liabilities (including long-term liabilities that may be paid over twenty or more years). All of the current year revenues and expenses are accounted for in the statement of activities regardless of when cash is received or paid. During the year, per AB1X 26 and the California Supreme Court ruling, the Brea Redevelopment Agency, a component unit of the City, was dissolved effective February 1, 2012. Prior to this date, the final seven months of the activity of the redevelopment agency continued to be reported in the governmental funds of the City. After the dissolution, the City of Brea elected to become the Successor Agency for the former Brea Redevelopment Agency and the remaining assets and activities of the dissolved redevelopment agency were reported in a fiduciary fund (private-purpose trust fund) in the financial statements of the City. The two Government-wide Financial Statements report the City’s net assets and how they have changed. Net assets – the difference between the City’s assets and liabilities – is one way to measure the City’s financial health, or position. Over time, increases or decreases in the City’s net assets are an indicator of whether its financial health is improving or deteriorating, respectively. To assess the overall health of the City, one should also consider additional non-financial factors such as changes in the City’s property tax base and the condition of the City’s roads. The Government-wide Financial Statements of the City are divided into two categories:
Governmental Activities – This statement depicts the extent to which programs are self-supporting and the net amount provided by property taxes and other general revenues. Most of the City’s basic services are included in this category, such as public safety, development services, community services, maintenance services, and general administration. Taxes and charges for services finance most of these activities.
Business-type Activities – The City’s business enterprises include urban runoff, water utility, sewer utility, sanitation, and information technology external support. The City charges fees to customers to recover the cost of providing these services.
Fund Financial Statements – Funds are accounting devices that the City uses to track and control resources intended for specific purposes. The Fund Financial Statements provide more detailed information about the City’s most significant funds (major funds) but not the City as a whole. Some funds are required by State and Federal law or by bond covenants. Other funds are utilized simply to control and manage resources intended for particular purposes. The City utilizes three broad categories of funds:
Governmental Funds – Governmental Funds are used to account for essentially the same functions reported as Government Activities in the Government-wide Financial Statements. However, unlike the Government-wide Financial Statements, Governmental Fund Financial Statements utilize the financial resources measurement focus and thus concentrate on near-term inflows and outflows of spendable resources, as well as on balances of spendable resources available at the end of the fiscal year. Consequently, the Governmental Fund Financial Statements provide a detailed short-term view that helps a reader determine whether there are more or fewer financial resources that can be spent in the near future to finance City programs. Proprietary Funds – Services for which the City charges customers a fee are generally reported in Proprietary Funds (Enterprise Funds and Internal Service Funds). Like the Government-wide Financial Statements, these funds provide both long and short-term financial information utilizing
4

the economic resources measurement focus. The City’s Enterprise Funds (urban runoff, water, utility, sewer utility, sanitation, and information technology external support) are individual funds represented in the combined presentation of Business-type Activities in the Government-wide Financial Statements. The individual fund presentation provides more detailed information about each business segment, its operating statements, and statements of cash flow. The City also uses Internal Service Funds that are utilized to report and allocate the cost of certain centrally managed and operated activities (risk management, equipment replacement, and building occupancy). Because the Internal Service Funds primarily serve the government, they are reported with Governmental Activities rather than the Business-type Activities in the Government-wide Financial Statements. Fiduciary Funds – The City utilizes Fiduciary Funds to account for assets held by the City in a trustee capacity, or as an agent for other governmental entities, private organizations, or individuals. All of the City’s fiduciary activities are reported in a separate statement of fiduciary net assets and a statement of changes in fiduciary net assets. We exclude these activities from the City’s Government-wide Financial Statements because the City cannot use these assets to finance its operations. Upon the dissolution of the Brea Redevelopment Agency effective on February 1, 2012, the remaining balances of the assets and obligations were transferred to a private purpose trust fund, which will account for all the financial transactions of the dissolved redevelopment agency.
Notes to the Financial Statements – The financial statements also include the Notes to the Financial Statements that provide important narrative details about the information contained in the financial statements. Information contained in the Notes to the Financial Statements is critical to a reader’s full understanding of the Government-wide and Fund Financial Statements. Supplementary Information – In addition to the required elements of the Basic Financial Statements, we have also included a Supplementary Information section, which includes budgetary and combining schedules that provide additional details about the City’s non-major Governmental Funds, Enterprise Funds, Internal Service Funds, and Fiduciary Funds.
5

GOVERNMENT-WIDE FINANCIAL ANALYSIS Net Assets – Net assets may serve over time as a useful indicator of a government’s financial position. The City’s combined net assets for the year ended June 30, 2012, as shown in Table 1, were $269.6 million.
2012 2011 2012 2011 2012 2011
Current and other assets 74,432$ 155,233$ 24,231$ 24,469$ 98,663$ 179,702 Capital assets 172,479 172,088 64,478 63,739 236,957 235,827
Total assets 246,911 327,321 88,709 88,208 335,620 415,529
Noncurrent liabilities 19,470 230,248 35,750 36,037 55,220 266,285 Other liabilities 6,869 15,777 3,938 3,680 10,807 19,457
Total liabilities 26,339 246,025 39,688 39,717 66,027 285,742
Net assetsInvested in capital assets, net 36,846 40,774 36,108 34,898 72,954 75,672
of related debtRestricted 26,597 74,671 5,217 5,065 31,814 79,736 Unrestricted 157,129 (34,148) 7,695 8,527 164,824 (25,621)
Total net assets 220,572$ 81,297$ 49,020$ 48,490$ 269,592$ 129,787$
Governmental Activities Business-Type ActivitiesTotal
Activities
Table 1Net Assets
Fiscal Year Ended June 30, 2012(in thousands)
Invested in Capital Assets – The largest component of total assets, $237 million (70.6%), reflects the City’s investment in capital assets (e.g., land, buildings, infrastructure, and equipment). Of the $55.2 million in long-term (Noncurrent) liabilities, $45.2 million represents outstanding bonded debt and capital leases. The proceeds from this debt were used to finance the acquisition of capital assets and to fund capital improvements. Total capital assets, net of depreciation represent $237 million of the $335.6 million in total assets. A significant portion of the capital assets have been funded through bond financing from the former Brea Redevelopment Agency. Restricted Assets – An additional portion of the City’s net assets, $31.8 million, represents resources that are subject to external restrictions on how they may be used. The decrease from the prior fiscal year was primarily due to the transfer of assets and activities to a fiduciary fund (private-purpose trust fund) as a result of the dissolution of the Brea Redevelopment Agency. Unrestricted Assets – The $164.8 million in unrestricted net assets was an overall increase of $190.4 million from the prior fiscal year. The increase from the prior fiscal year was primarily due to the transfer of assets, liabilities and activities to a fiduciary fund (private-purpose trust fund) as a result of the dissolution of the Brea Redevelopment Agency. Overall the City’s net assets increased $139.8 million during the current fiscal year primarily due to extraordinary gain from the dissolution of the Brea Redevelopment Agency.
6

2012 2011 2012 2011 2012 2011
Revenues:Program Revenues:
Charges for services 19,609$ 18,391$ 21,230$ 18,975$ 40,839$ 37,366$ Operating grants and contributions 6,364 3,543 11 11 6,375 3,554 Capital grants and contributions 8,473 4,502 - - 8,473 4,502
General Revenues:Taxes:
Property taxes 31,974 35,480 - - 31,974 35,480 Sales taxes 19,249 16,919 - - 19,249 16,919 Transient occupancy taxes 1,281 1,227 - - 1,281 1,227 Franchise taxes 1,707 1,707 - - 1,707 1,707 Business license taxes 976 948 - - 976 948 Other taxes 555 380 - - 555 380
Motor vehicle in lieu 70 184 - - 70 184 Use of money and property 1,242 4,055 415 1,053 1,657 5,108 Other 2,500 1,675 952 - 3,452 1,675 Extraordinary gain/(loss) on dissolution of redevelopment agency 119,687 - - - 119,687 -
Total Revenues 213,687 89,011 22,608$ 20,039 236,296 109,050
Expenses:General government 9,748 7,531 - - 9,748 7,531 Public safety 39,167 36,221 - - 39,167 36,221 Community development 2,313 11,056 - - 2,313 11,056 Community services 6,623 6,106 - - 6,623 6,106 Public works 15,241 19,991 - - 15,241 19,991 Interest on long-term debt 2,414 9,228 - - 2,414 9,228 Urban runoff - - 270 244 270 244 Water utility - - 15,513 14,068 15,513 14,068 Sewer utility - - 1,227 1,080 1,227 1,080 Sanitation - - 2,707 2,565 2,707 2,565 Information Technology External Support - - 1,270 1,231 1,270 1,231
Total Expenses 75,505 90,133 20,986 19,188 96,491 109,322
Change in net assets before transfers 138,181 (1,122) 1,622 851 139,804 (271)
Transfers 1,093 5,154 (1,093) (5,154) - -
Change in net assets 139,274 4,031 529 (4,303) 139,804 (271)
Net assets at beginning of year81,297 77,266 48,490 52,793 129,787 130,059
Net assets at end of year 220,572$ 81,297$ 49,019$ 48,490$ 269,591$ 129,787$
Governmental Activities Business-Type Activities Total Activities
Table 2Change in Net Assets
Fiscal Year Ended June 30, 2012(in thousands)
7

Governmental Activities – The cost of all Governmental Activities in the current fiscal year was $75.5 million. As shown on the statement of activities, $19.6 million of the cost was paid by those who directly benefited from the programs, $14.8 million was financed by contributions and grants received from other governmental organizations, developers, and property owners for both capital and operating activities, and $180.3 million was subsidized through general city revenues. The City reported program revenues of $34.4 million and general revenues, extraordinary items and transfers of $180.3 million. Expenses for all Governmental Activities for the year totaled $75.5 million. Therefore, as a result of operations, the City’s change in net assets before transfers increased by $138.2 million in comparison with the prior fiscal year. Property tax revenues for Fiscal Year 2011-12 posted a decrease of $3.5 million when compared to Fiscal Year 2010-11. This is a significant difference from the increase of $3.7 million in property tax revenues reported for Fiscal Year 2010-11 in comparison to Fiscal Year 2009-10. The decrease in property tax revenues is primarily due to the dissolution of the Brea Redevelopment Agency which resulted in $3.5 million being held by the County of Orange to be distributed to other taxing entities. Sales tax revenues for Fiscal Year 2011-12 were $2.3 million more when compared to Fiscal Year 2010-11. The increase in sales tax revenues is reflective of the economy beginning to stabilize from its large decline. Total expenses for Fiscal Year 2011-12 were $75.5 million, a decrease of $14.6 million when compared to Fiscal Year 2010-11. This was primarily due to the reduction of community development expenses and a decrease in interest expenses due to the dissolution of the redevelopment agency. As a result, a portion of these expenses were reported in the private-purpose trust fund in the financial statements of the City. Brea is a full service city providing residents, businesses and visitors with the following functional services: General Government is comprised of two departments (City Council/City Manager and Administrative Services) providing general governance, executive management, legal services, communication and marketing, human resources, records management, information technology, accounting, budget, treasury, utility billing, purchasing and reprographics. Public Safety is comprised of two departments (Police Services and Fire Services) providing general law enforcement and public safety dispatch for the City of Brea and neighboring City of Yorba Linda, fire suppression, fire prevention, paramedic services and emergency preparedness. Community Development is comprised of two divisions (Planning & Building Services and Economic Development Services) providing planning, zoning and building services, redevelopment services, economic development and housing services. Community Services is overseen by one department and includes recreation, arts and human services, and the community center. Public Works is overseen by one department and includes engineering and construction of public facilities, parks, streets and related infrastructure, traffic engineering as well as the maintenance of all public facilities, parks, streets and related infrastructure. Business-type activities is comprised of two departments (Public Works and Administrative Services) providing five activities to residential and business customers (urban runoff, water utility, sewer utility, sanitation services) and information technology external support to public agencies. Each programs’ net cost (total cost less revenues generated by the activities) is presented below. The net cost shows the extent to which the City’s general taxes support each of the City’s programs.
8

2012 2011 2012 2011
General government 9,748$ 7,531$ 3,152$ 1,635$ Public safety 39,167 36,221 14,181 14,290 Community development 2,313 11,056 2,343 1,793 Community services 6,623 6,106 1,766 2,255 Public works 15,240 19,991 13,004 6,462 Interest on long-term debt 2,414 9,228 - -
Totals 75,505$ 90,133$ 34,446$ 26,435$
Table 3
Fiscal Year Ended June 30, 2012(in thousands)
Governmental Activities
ProgramExpenses
ProgramRevenues
Of the $34.4 million in program revenues that financed the Governmental Activities, 41.2% was utilized for Public Safety, 37.7% was utilized for Public Works, 5.1% was utilized for Community Services, and the remaining 16% supplemented Community Development, General Government, and Interest.
$‐
$5
$10
$15
$20
$25
$30
$35
$40
General government
Public safety Community development
Community services
Public works Interest
Table 4Program Expenses and Revenues - Governmental Activities
Fiscal Year Ended June 30, 2012(in millions)
Program Expenses Program Revenues
9

Table 5 Governmental Activities
Fiscal Year Ended June 30, 2012 Revenues by Source Functional Expense
9.1%6.9%
26.5%
57.5%Charges for Services
Contributions
Taxes & Transfers
Other
12.9%
51.9%
3.0%
8.8%
20.2%
3.2% General Government
Public Safety
Community Development
Community Services
Public Works
Interest Major Governmental Activities in the current fiscal year included the following: Revenues • The City’s combined amount of program revenues, general revenues, extraordinary gain and
transfers were $214.8 million. This amount includes operating and capital contributions and grants of $14.8 million and $119.7 million due to the dissolution of the Brea Redevelopment Agency.
• Of the $214.8 million in total governmental revenues, extraordinary gain and transfers, 16%
represents Program Revenues and 26.5% represents taxes & transfers. Other revenues that include the transfer of activities from the former Brea Redevelopment Agency to fiduciary fund held in trust by the City makes up the largest percent with 57.5%.
• Program revenues include $13.2 million in charges for services for public safety. The amount
includes $11.2 million to provide police services to the City of Yorba Linda. Expenses • In the current year, expenses for all Governmental Activities were $75.5 million. See Table 5 for an
analysis of the expenses by function/program.
10

Business-type Activities – Business-type Activities increased the City’s net assets by $529,931 which was comprised of various changes in the net assets of the urban runoff, water utility, sewer utility, sanitation and information technology external support activities. Business-type Activities are financed primarily by fees charged to external parties for goods and services.
Table 6 Program Expense & Revenue – Business-type Activities
Fiscal Year Ended June 30, 2012 (in millions)
Business-type Activities in the current fiscal year included the following: The water utility activity had a decrease in net assets of $419,554. The decrease in net assets was primarily due to an increase in the cost of purchased water. Of the $13.2 million in water related expenses, 52.2% was from the purchase of water, 13.8% was from maintenance and other operating expenses, 14.9% was from depreciation, and 19.1% covered personnel costs. Water rates were adjusted effective on January 1, 2012, to fund on-going operations, recapture the bond coverage ratio and provide funding for planned capital improvements to the water utility system. The sewer utility activity had an increase in net assets of $658,561. The increase in net assets was primarily due to charges for services exceeding operating expenses. Of the $1.2 million in sewer related expenses, 10.2% was from maintenance and other operating expenses, 27.8% from depreciation and 62% from personnel costs. The urban runoff activity had an increase in net assets of $87,354. This increase was due to revenues of $377,950, and expenses of $267,097. Operating expenses, which included maintenance and operation costs of $153,376, personnel costs of $112,783, and depreciation of $938, totaled $267,097 while operating revenues were $377,950. This resulted in a net operating income of $110,853 and interest revenues of $9,067, resulting in the increase in net assets stated above.
11

The sanitation utility activity had an increase in net assets of $52,133. The increase in net assets was due to revenues of $3,158,430, and expenses of $2,648,903. Operating expenses, which included maintenance and operation costs of $2,232,978 and personnel costs of $415,925, totaled $2,648,903 while revenues were $3,158,430. This resulted in a net operating income of $509,527 and non operating revenues of $7,705, resulting in the increase in net assets stated above. The information technology external support activity had an increase in net assets of $380,334. The increase in net assets was primarily due to operating revenues of $1,676,577 exceeding operating expenses of $1,239,283 by a total of $437,294. FINANCIAL ANALYSIS OF THE CITY’S FUNDS As noted earlier, the City uses fund accounting to highlight available financial resources and to ensure and demonstrate compliance with finance-related legal requirements. Governmental Funds – Utilizing the financial resources measurement focus, the City’s Governmental Funds provide information on near-term inflows and outflows, and balances of spendable resources. This information is useful in assessing the City’s financing requirements. In particular, unreserved fund balance may serve as a useful measure of a government’s net resources available for spending at the end of the fiscal year. At the end of the current fiscal year, the City’s governmental funds reported a combined ending fund balance of $58 million, a decrease of $69.6 million. The decrease is due to the dissolution of the Brea Redevelopment Agency and the City of Brea’s election to become the Successor Agency to the former Brea Redevelopment Agency. The remaining assets and activities after February 1, 2012 were reported in a fiduciary fund (private-purpose trust fund) in the financial statements of the City. Restricted fund balances total $26.6 million, legally restricted by external parties, primarily for capital projects ($25.8 million). Committed fund balance total $6.5 million which was for capital asset replacement. Assigned fund balances total $2.3 million which was primarily for community center replacement. Unassigned fund balances total $21 million. The General Fund ended the fiscal year with a $30.7 million fund balance, a net increase of $4.6 million. Nonspendable fund balance of $1.58 million was primarily from an advance made to the water utility fund for a portion of the purchase of water rights from the California Domestic Water Company. Restricted fund balance of $926,483 was for such items as debt service funds with trustee and for lighting and landscape districts. Committed fund balance of $6.5 million was for capital asset replacement. Assigned fund balance of $590,613 was primarily for community center replacement. Unassigned fund balance of $21.1 million is available for future appropriations. The Redevelopment Agency’s Special Revenue Fund ended the fiscal year with a zero fund balance due to the State’s elimination of redevelopment agencies on February 1, 2012 and therefore reported an extraordinary loss in the amount of $30.9 million. The City’s Capital Projects Fund ended the fiscal year with a fund balance of $11.6 million, a decrease of $296,871. Restricted fund balance of $11.6 million is for impact fees. The City’s Capital and Mitigation Projects Fund ended the fiscal year with a fund balance of $8.5 million. Restricted fund balance of $6.8 million is for capital projects. Assigned fund balance of $1.7 million is to reimburse the general fund for annual debt service payments. The Redevelopment Agency’s Capital Projects Fund ended the fiscal year with a zero fund balance due to the State’s elimination of redevelopment agencies on February 1, 2012 and therefore reported an extraordinary loss in the amount of $29.2 million.
12

The Redevelopment Agency’s Debt Service Fund ended the fiscal year with a zero fund balance due to the State’s elimination of redevelopment agencies on February 1, 2012 and therefore reported an extraordinary loss in the amount of $22 million. Proprietary Funds – The City’s Proprietary Funds (Enterprise and Internal Service Funds) presented in the Fund Financial Statements section basically provide the same type of information in the Government-wide Financial Statements, but include individual segment information. The Water Utility Fund net assets decreased by $419,554 to $31.9 million (net of related debt) for the fiscal year ended June 30, 2012. Of that amount, $24.7 million is invested in capital assets, and $5.2 million is restricted for debt payments. The remaining $2.0 million is unrestricted and is available for the cost of operations and capital facilities. Total revenues of $15 million exceeded total expenditures by $1.8 million, primarily due to the planned accumulation of resources for future infrastructure improvements. The Sewer Utility Fund net assets increased by $658,561 to $16.2 million for the fiscal year ended June 30, 2012. Of that amount, $11.4 million is invested in capital assets (net of related debt) and $4.8 million is unrestricted and is available for the cost of operations and upgrading the City’s sewer system. The increase in net assets was primarily due to the planned accumulation of resources for future infrastructure improvements. GENERAL FUND BUDGETARY HIGHLIGHTS The final budgeted revenues for the General Fund at fiscal year end were $168,203 more than the original budget and total actual revenues were $3,522,152 more than the final budget. The final appropriations for the General Fund at fiscal year end were $3,631,184 more than the original budget and total actual expenditures were $4,387,277 less than the final budget. Several factors contributed to the final variance and are briefly summarized as follows: Changes to Original Budget Resources (Inflows): • An increase of $440,000 in Recovery of Salaries & Wages revenues was primarily due to the Fire
Command Staff Sharing Agreement with the City of Fullerton.
Changes to Appropriation (Outflows): • The variance between original budget and final budget for public safety was primarily due to the Fire
Command Staff Sharing Agreement with the City of Fullerton, the Fire Prevention reorganization and unanticipated legal service costs.
Variances with Final Budget Resources (Inflows): • The variance between budgeted and actual Taxes was $3.4 million. This was primarily due to some
early signs of some stabilization in the economy, causing taxes to be higher than anticipated. Charges to Appropriation (Outflows): • The variance between budgeted and actual for Public Safety was $953,722 and was primarily due to
salary savings from vacancies.
13

CAPITAL ASSETS AND DEBT ADMINISTRATION
Capital Assets The City’s investment in capital assets for governmental and business-type activities as of June 30, 2012, amounts to $237 million (net of accumulated depreciation). This investment in a broad range of capital assets includes land, structures and improvements, furniture, machinery and equipment, park facilities, roads, sidewalks, water system, storm drains, sound walls, and bridges. The total net increase (including additions and deletions) of $1.1 million represents a 0.5% increase from last year.
2012 2011 2012 2011 2012 2011
Land 45,416$ 42,603$ 2,075$ 2,075$ 47,491$ 44,678$ Structures and improvements 50,391 51,159 - - 50,391 51,159 Equipment 6,821 6,982 2 76 6,823 7,058 Infrastructure 67,423 66,960 57,215 56,626 124,638 123,586 Construction-in-progress 2,428 4,384 5,186 4,962 7,614 9,346
Totals 172,479$ 172,088$ 64,478$ 63,739$ 236,957$ 235,827$
Total
Table 7Capital Assets as of June 30, 2012
(net of depreciation)(in thousands)
GovernmentalActivities
Business-TypeActivities
The net decrease to construction-in-progress totaled $2 million, as noted above. This was primarily due to the completion of various capital improvement projects. The following significant capital asset and infrastructure projects were completed in 2011-12:
• Associated Road and Imperial Highway Intersection • Elm Street Resurfacing and Water Main Replacement • Residential Street Rehabilitation • Puente Street Rehabilitation • Ash Street Alley Improvements • Country Road Townhomes Curb Access Ramps • State College Rehabilitation • Midbury Tract Street and Water Main Improvements • Laurel School Alley • Safe Routes to School Project • Birch Street and Voyager Avenue Traffic Signal • Birch Street Water Main Replacement, Phase I & II • Bandstand Improvements at City Hall Park • Tracks at Brea, Phase I • City Entry Signs • Carbon Canyon Reservoirs Slope Stabilization • Shade Structure at Sports Park Tot Lot
14

Additional information on the City’s capital assets can be found in Note (6) of the Notes to the Financial Statements. Long-Term Debt At the end of the current fiscal year, the City had total long-term debt outstanding for bonds and leases of $45.2 million for all governmental and business-type activities.
2012 2011 2012 2011 2012 2011
Tax allocation bonds -$ 197,968$ -$ -$ -$ 197,968$ Lease revenue bonds 2,760 15,360 - - 2,760 15,360 Water revenue bonds - - 37,265 37,760 37,265 37,760 Capital leases 5,162 6,106 - - 5,162 6,106
Totals 7,922$ 219,434$ 37,265$ 37,760$ 45,187$ 257,194$
Business-TypeActivities Total
Table 8Outstanding Debt as of June 30, 2012
(in thousands)
GovernmentalActivities
Bonds and Capital Leases
For fiscal year 2011-12, outstanding debt (tax allocation bonds and lease revenue bonds) of the former Brea Redevelopment Agency was transferred to a fiduciary fund (private-purpose trust fund) and is reported in the financial statements of the City. Additional information on the City’s long-term debt can be found in Note (7) of the Notes to the Financial Statements. FACTORS EFFECTING NEXT YEAR’S BUDGET The Fiscal Year 2012-13 General Fund budgeted expenditures increased by approximately 0.2%. Budgeted expenditures for all other funds, excluding capital improvement projects, debt service and internal charges, decreased 22% overall from the fiscal year 2011-12 estimated expenditures. A brief summary of the factors considered when preparing the fiscal year 2012-13 budget are as follows: • Sales tax represents the single largest source of General Fund revenue, budgeted at $18.3 million for
fiscal year 2012-13. Based on economic data trends and projections, sales tax is projected to grow 4.5% for fiscal year 2012-13. Brea’s sales tax on a per capita basis consistently outperforms other municipalities, a strong indicator that the City imports sales tax dollars from surrounding communities.
• General Fund property taxes are projected to be relatively flat and represent $6.9 million of General Fund revenues.
• Due to the adoption of Assembly Bill 1484 (“AB 1484”) in June 2012 that required all successor agencies to the former redevelopment agencies to pay the counties its unobligated cash. These payments to the counties are to be allocated to taxing entities, such that, the City of Brea as a taxing entity anticipates to receive a one-time payment of $1.5 million.
15

• While acknowledging that the cost of materials, supplies and contract services do increase,
department operating expenditures were held relatively flat or reduced wherever possible.
• Due to pension reform within the City of Brea, employees will continue to contribute toward their retirement in accordance with the provision of memorandums of understanding (MOU’s), negotiated in 2011. In fact, the existing employee contribution rate will double on July 1, 2012, and new full-time employees now contribute 100% of the employee costs of retirement.
• The Yorba Linda City Council voted to enter into a new police services contract with the Orange
County Sheriff, ending a 42-year relationship with the City of Brea. The police services contract expires in May 2013 and staff are diligently working across departments to develop a Brea Police Department reorganization plan.
• Uncertainty of the current State of California budget and the State’s continued propensity to balance
its budget on the backs of local government.
• Overall, Fiscal Year 2012-13 General Fund revenues are projected to be relatively the same in comparison to revenues in Fiscal Year 2011-12 due to a slow economic recovery and the elimination of the Yorba Linda Police Services Contract in May 2013.
CONTACTING THE CITY’S FINANCIAL MANAGEMENT This financial report is designed to provide our citizens, taxpayers, customers, and investors and creditors with a general overview of the City’s finances and to demonstrate the City’s accountability for the money it receives. If you have any questions about this report or need additional financial information, contact the City’s Administrative Services Department, 1 Civic Center Circle, Brea, CA 92821, at (714) 990-7676.
16

CITY OF BREA
STATEMENT OF NET ASSETS
Governmental Business-TypeActivities Activities Total
Assets:Cash and investments 56,540,116$ 7,691,164$ 64,231,280$ Receivables: Accounts 1,207,157 2,908,543 4,115,700 Taxes 304,460 - 304,460 Notes and loans 1,890,086 - 1,890,086 Accrued interest 322,942 - 322,942 Internal balances 5,590,453 (5,590,453) - Prepaid costs 423,609 - 423,609 Due from other governments 6,799,093 274,474 7,073,567 Due from Successor Agency 236,337 - 236,337 Deferred charges - 256,384 256,384 Other investments - 11,224,928 11,224,928 Investment in joint venture 815,226 - 815,226 Restricted assets: Cash and investments - 2,248,086 2,248,086 Cash with fiscal agent 301,972 5,217,299 5,519,271 Capital assets not being depreciated 47,843,783 7,260,640 55,104,423 Capital assets, net of depreciation 124,635,648 57,217,611 181,853,259
Total Assets 246,910,882 88,708,676 335,619,558
Liabilities:Accounts payable 2,863,409 2,648,662 5,512,071 Accrued liabilities 482,603 81,494 564,097 Accrued interest 129,474 1,031,863 1,161,337 Unearned revenue 749,132 - 749,132 Deposits 617,223 176,560 793,783 Due to other governments 1,899,140 - 1,899,140 Due to Successor Agency 127,698 - 127,698 Noncurrent liabilities: Due within one year 5,412,635 1,101,818 6,514,453 Due in more than one year 14,057,276 34,648,094 48,705,370
Total Liabilities 26,338,590 39,688,491 66,027,081
Net Assets:Invested in capital assets, net of related debt 36,846,317 36,107,809 72,954,126 Restricted for: Affordable housing 1,807,951 - 1,807,951 Debt service 301,972 - 301,972 Public safety 2,127,549 - 2,127,549 Public works 1,756,863 - 1,756,863 Capital projects 20,602,461 5,217,299 25,819,760 Unrestricted 157,129,179 7,695,077 164,824,256
Total Net Assets 220,572,292$ 49,020,185$ 269,592,477$
JUNE 30, 2012
Primary Government
See Notes to Financial Statements 17

CITY OF BREA
STATEMENT OF ACTIVITIESYEAR ENDED JUNE 30, 2012
Operating CapitalCharges for Contributions Contributions
Expenses Services and Grants and Grants
Functions/ProgramsPrimary Government:Governmental Activities:
General government 9,747,589$ 2,177,602$ 974,502$ -$ Public safety 39,166,833 13,155,339 1,025,745 - Community development 2,312,830 583,339 826,418 933,625 Community services 6,623,220 1,737,725 27,881 - Public works 15,240,604 1,955,188 3,509,568 7,539,153 Interest on long-term debt 2,414,053 - - -
Total Governmental Activities 75,505,129 19,609,193 6,364,114 8,472,778
Business-Type Activities:Urban Runoff 269,518 377,950 - -
Water Utility 15,512,551 14,085,133 - - Sewer Utility 1,227,087 1,932,161 - - Sanitation 2,706,954 3,158,430 11,323 - Information Technology External Support 1,269,800 1,676,577 - -
Total Business-Type Activities 20,985,910 21,230,251 11,323 -
Total Primary Government 96,491,039$ 40,839,444$ 6,375,437$ 8,472,778$
General Revenues:Taxes: Property taxes, levied for general purpose Transient occupancy taxes Sales taxes Franchise taxes Business licenses taxes Other taxesMotor vehicle in lieu - unrestrictedInvestment earningsContributions to permanent fundsOtherGain on sale of capital asset
Extraordinary gain/(loss) on dissolutionof redevelopment agency (Note 16)
Transfers
Total General Revenues, Extraordinary Items and Transfers
Change in Net Assets
Net Assets at Beginning of Year
Net Assets at End of Year
Program Revenues
See Notes to Financial Statements 18

Primary Government
Governmental Business-TypeActivities Activities Total
(6,595,485)$ -$ (6,595,485)$ (24,985,749) - (24,985,749)
30,552 - 30,552 (4,857,614) - (4,857,614) (2,236,695) - (2,236,695) (2,414,053) - (2,414,053)
(41,059,044) - (41,059,044)
- 108,432 108,432 - (1,427,418) (1,427,418) - 705,074 705,074 - 462,799 462,799 - 406,777 406,777
- 255,664 255,664
(41,059,044) 255,664 (40,803,380)
31,974,080 - 31,974,080 1,280,631 - 1,280,631
19,248,771 - 19,248,771 1,706,631 - 1,706,631
975,742 - 975,742 555,291 - 555,291
70,227 - 70,227 1,200,921 415,256 1,616,177 1,322,891 - 1,322,891 1,177,781 952,030 2,129,811
41,263 - 41,263
119,686,954 - 119,686,954 1,093,019 (1,093,019) -
180,334,202 274,267 180,608,469
139,275,158 529,931 139,805,089
81,297,134 48,490,254 129,787,388
220,572,292$ 49,020,185$ 269,592,477$
Net (Expenses) Revenues and Changes in Net Assets
See Notes to Financial Statements 19

THIS PAGE INTENTIONALLY LEFT BLANK
20
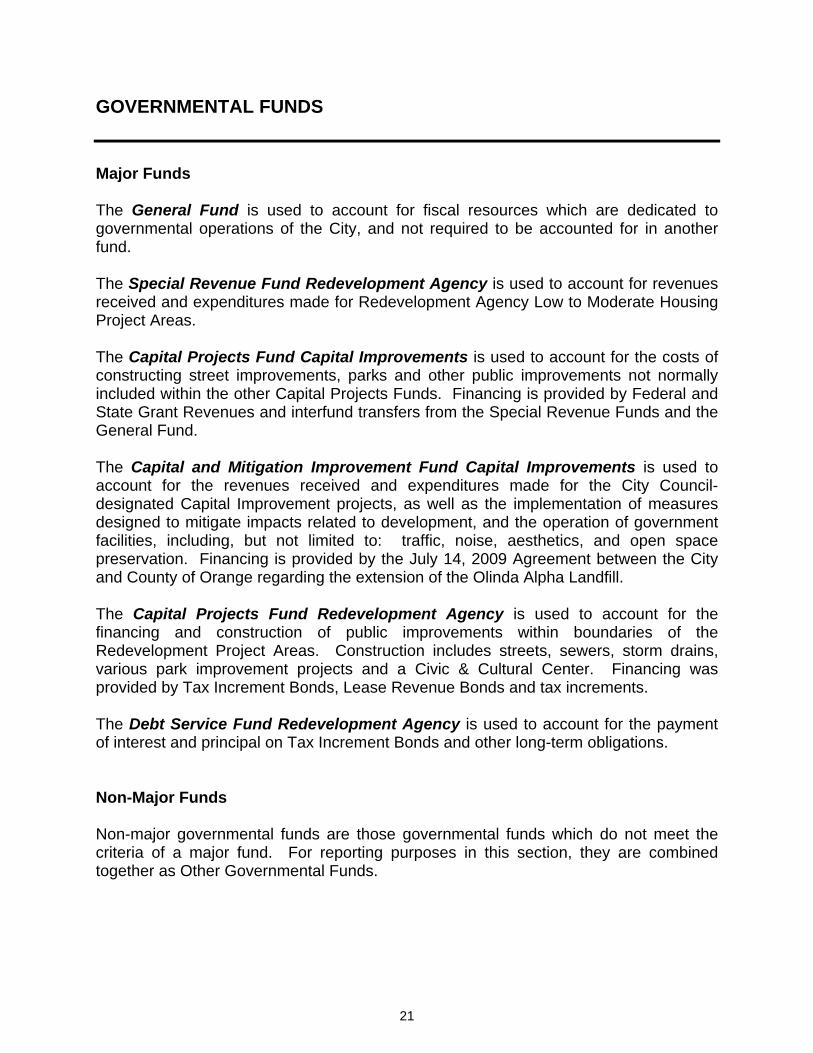
GOVERNMENTAL FUNDS Major Funds The General Fund is used to account for fiscal resources which are dedicated to governmental operations of the City, and not required to be accounted for in another fund. The Special Revenue Fund Redevelopment Agency is used to account for revenues received and expenditures made for Redevelopment Agency Low to Moderate Housing Project Areas. The Capital Projects Fund Capital Improvements is used to account for the costs of constructing street improvements, parks and other public improvements not normally included within the other Capital Projects Funds. Financing is provided by Federal and State Grant Revenues and interfund transfers from the Special Revenue Funds and the General Fund. The Capital and Mitigation Improvement Fund Capital Improvements is used to account for the revenues received and expenditures made for the City Council-designated Capital Improvement projects, as well as the implementation of measures designed to mitigate impacts related to development, and the operation of government facilities, including, but not limited to: traffic, noise, aesthetics, and open space preservation. Financing is provided by the July 14, 2009 Agreement between the City and County of Orange regarding the extension of the Olinda Alpha Landfill. The Capital Projects Fund Redevelopment Agency is used to account for the financing and construction of public improvements within boundaries of the Redevelopment Project Areas. Construction includes streets, sewers, storm drains, various park improvement projects and a Civic & Cultural Center. Financing was provided by Tax Increment Bonds, Lease Revenue Bonds and tax increments. The Debt Service Fund Redevelopment Agency is used to account for the payment of interest and principal on Tax Increment Bonds and other long-term obligations. Non-Major Funds Non-major governmental funds are those governmental funds which do not meet the criteria of a major fund. For reporting purposes in this section, they are combined together as Other Governmental Funds.
21

CITY OF BREA
BALANCE SHEETGOVERNMENTAL FUNDS JUNE 30, 2012
Special Revenue Fund
GeneralAssets:Cash and investments 25,382,783$ -$ 13,783,508$ 8,475,608$ Receivables:
Accounts 911,897 - 207,750 - Taxes 304,285 - - - Notes and loans - - - - Interest 322,942 - - -
Prepaid items 6,689 - - - Due from other funds 160,931 - - - Due from other governments 4,729,202 - 1,605,093 - Due from Successor Agency 236,337 - - - Advances to other funds 1,574,089 - - - Restricted assets:
Cash and investments with fiscal agents 301,972 - - -
Total Assets 33,931,127$ -$ 15,596,351$ 8,475,608$
Liabilities and Fund Balances:Liabilities:Accounts payable 840,585$ -$ 1,842,465$ -$ Accrued liabilities 444,262 - 7,959 - Deferred revenue 753,536 - 1,800,093 - Unearned revenues 552,576 - 196,556 - Deposits payable 617,223 - - - Due to other funds - - - - Due to other governments 2,003 - - - Advances from other funds - - - - Due to Successor Agency 498 - 110,200 -
Total Liabilities 3,210,683 - 3,957,273 -
Fund Balances: Nonspendable 1,580,778 - - - Restricted 926,483 - 11,639,078 6,770,195 Committed 6,546,809 - - - Assigned 590,613 - - 1,705,413 Unassigned 21,075,761 - - -
Total Fund Balances 30,720,444 - 11,639,078 8,475,608
Total Liabilities and Fund Balances 33,931,127$ -$ 15,596,351$ 8,475,608$
Redevelopment Agency
Capital Improvements
Capital and Mitigation
Improvement
Capital Projects Funds
See Notes to Financial Statements 22
CITY OF BREA
BALANCE SHEETGOVERNMENTAL FUNDSJUNE 30, 2012
Assets:Cash and investmentsReceivables:
AccountsTaxesNotes and loansInterest
Prepaid itemsDue from other fundsDue from other governmentsDue from Successor AgencyAdvances to other fundsRestricted assets:
Cash and investments with fiscal agents
Total Assets
Liabilities and Fund Balances:Liabilities:Accounts payableAccrued liabilitiesDeferred revenueUnearned revenuesDeposits payableDue to other fundsDue to other governmentsAdvances from other fundsDue to Successor Agency
Total Liabilities
Fund Balances: Nonspendable Restricted Committed Assigned Unassigned
Total Fund Balances
Total Liabilities and Fund Balances
Capital Projects Fund
Other TotalGovernmental Governmental
Funds Funds
-$ -$ 6,964,814$ 54,606,713$
- - - 1,119,647 - - 175 304,460 - - 1,890,086 1,890,086 - - - 322,942 - - - 6,689 - - - 160,931 - - 368,517 6,702,812 - - - 236,337 - - - 1,574,089
- - - 301,972
-$ -$ 9,223,592$ 67,226,678$
-$ -$ 7,577$ 2,690,627$ - - 3,716 455,937 - - - 2,553,629 - - - 749,132 - - - 617,223 - - 43,156 43,156 - - 1,897,137 1,899,140 - - 48,107 48,107 - - 17,000 127,698
- - 2,016,693 9,184,649
- - - 1,580,778 - - 7,261,040 26,596,796 - - - 6,546,809 - - - 2,296,026 - - (54,141) 21,021,620
- - 7,206,899 58,042,029
-$ -$ 9,223,592$ 67,226,678$
Debt Service Fund
Redevelopment
Agency Redevelopment
Agency
See Notes to Financial Statements 23

CITY OF BREA
RECONCILIATION OF THE BALANCE SHEET OF GOVERNMENTAL FUNDSTO THE STATEMENT OF NET ASSETSJUNE 30, 2012
Fund balances of governmental funds 58,042,029$
Amounts reported for governmental activities in the statement of net assets are different because:
Governmental funds report capital outlays as expenditures. However, in the statement of activities, the cost of those assets is allocated over their estimated useful lives as depreciation expense. This is the amount by which capital outlay exceeded depreciation in the current period.
Capital outlay 258,141,812$ Depreciation (90,467,786) 167,674,026
Investment in joint venture have not been included as financial resources in governmental fund activity. 815,226
Long-term liabilities were not due and payable in the current period. Therefore, they were not reported in the governmental funds:
Lease revenue bondsong-term liabilities (2,760,000) Capital leases payable (4,258,454) Compensated Absences (2,896,165) Other post employment benefits obligation (3,142,728) (13,057,347)
Accrued interest payable for the current portion of interest due on Bonds has not been reported in the governmental funds. (115,182)
Revenues reported as deferred revenue in the governmental funds and recognized in the statement of activities. These are included in the intergovernmental revenues in the governmental fund activity. 2,553,629
Internal service funds are used by management to charge the costs of certain activities, such as equipment management and self-insurance, to individual funds. The assets and liabilities of the internal service funds must be added to the statement of net assets. 4,659,911
Net assets of governmental activities 220,572,292$
See Notes to Financial Statements 24

THIS PAGE INTENTIONALLY LEFT BLANK
25

CITY OF BREA
STATEMENT OF REVENUES,EXPENDITURES AND CHANGES IN FUND BALANCESGOVERNMENTAL FUNDSYEAR ENDED JUNE 30, 2012
Special Revenue Fund
General Revenues:Taxes 32,428,203$ 3,956,140$ -$ -$ Licenses and permits 468,154 - - - Intergovernmental 3,540,656 - 3,858,254 - Charges for services 15,407,354 - 934,542 - Investment income 803,045 67,776 318,011 - Fines and forfeitures 1,266,372 - - - Contributions - - 2,355,584 3,500,000 Rental income 1,175,614 100,004 - - Miscellaneous 3,049,895 82,609 1,127,253 -
Total Revenues 58,139,293 4,206,529 8,593,644 3,500,000
Expenditures:Current: General government 4,420,534 263,630 93,372 - Public safety 36,475,131 - 16,923 - Community development 2,017,344 - 4,852 - Community services 5,930,685 - - - Public works 4,689,769 - 13,589 - Capital outlay 591,818 - 12,310,001 - Debt service: Principal retirement 1,911,235 - - - Interest and fiscal charges 485,778 - - - Pass-through agreement payments - - - -
Total Expenditures 56,522,294 263,630 12,438,737 -
Excess (Deficiency) of Revenues Over (Under) Expenditures 1,616,999 3,942,899 (3,845,093) 3,500,000
Other Financing Sources (Uses):Transfers in 3,525,075 - 3,686,222 - Transfers out (499,540) (3,805,958) (138,000) (844,787)
Total Other Financing Sources (Uses) 3,025,535 (3,805,958) 3,548,222 (844,787)
Extraordinary gain/(loss) on dissolutionof redevelopment agency (Note 16) - (30,944,818) - -
Net Change in Fund Balances 4,642,534 (30,807,877) (296,871) 2,655,213
Fund Balances, Beginning of Year 26,077,910 30,807,877 11,935,949 5,820,395
Fund Balances, End of Year 30,720,444$ -$ 11,639,078$ 8,475,608$
Capital and Mitigation
Improvement Redevelopment
Agency Capital
Improvements
Capital Projects Funds
See Notes to Financial Statements 26

CITY OF BREA
STATEMENT OF REVENUES,EXPENDITURES AND CHANGES IN FUND BALANCESGOVERNMENTAL FUNDSYEAR ENDED JUNE 30, 2012
Revenues:TaxesLicenses and permitsIntergovernmentalCharges for servicesInvestment incomeFines and forfeituresContributionsRental incomeMiscellaneous
Total Revenues
Expenditures:Current: General government Public safety Community development Community services Public worksCapital outlayDebt service: Principal retirement Interest and fiscal charges Pass-through agreement payments
Total Expenditures
Excess (Deficiency) of Revenues Over (Under) Expenditures
Other Financing Sources (Uses):Transfers inTransfers out
Total Other Financing Sources (Uses)
Extraordinary gain/(loss) on dissolutionof redevelopment agency (Note 16)
Net Change in Fund Balances
Fund Balances, Beginning of Year
Fund Balances, End of Year
Capital Projects Fund
Debt Service Fund
Other TotalGovernmental Governmental
Funds Funds
-$ 15,824,559$ 756,259$ 52,965,161$ - - - 468,154 - - 1,658,244 9,057,154 - - 41,789 16,383,685
70,900 134,876 187,083 1,581,691 - - 545,557 1,811,929 - - 156,440 6,012,024
355,554 - - 1,631,172 757,289 2,547 12,437 5,032,030
1,183,743 15,961,982 3,357,809 94,943,000
1,581,831 529,716 500 6,889,583 - - 433,632 36,925,686 - - 191,306 2,213,502 - - - 5,930,685 - - 12,401 4,715,759 - - - 12,901,819
- 7,110,000 - 9,021,235 - 3,760,344 - 4,246,122 - 457,812 - 457,812
1,581,831 11,857,872 637,839 83,302,203
(398,088) 4,104,110 2,719,970 11,640,797
491,965 3,371,559 - 11,074,821 (155,469) (1,626,154) (3,137,205) (10,207,113)
336,496 1,745,405 (3,137,205) 867,708
(29,187,204) (21,959,659) - (82,091,681)
(29,248,796) (16,110,144) (417,235) (69,583,176)
29,248,796 16,110,144 7,624,134 127,625,205
-$ -$ 7,206,899$ 58,042,029$
Redevelopment Agency
Redevelopment Agency
See Notes to Financial Statements 27
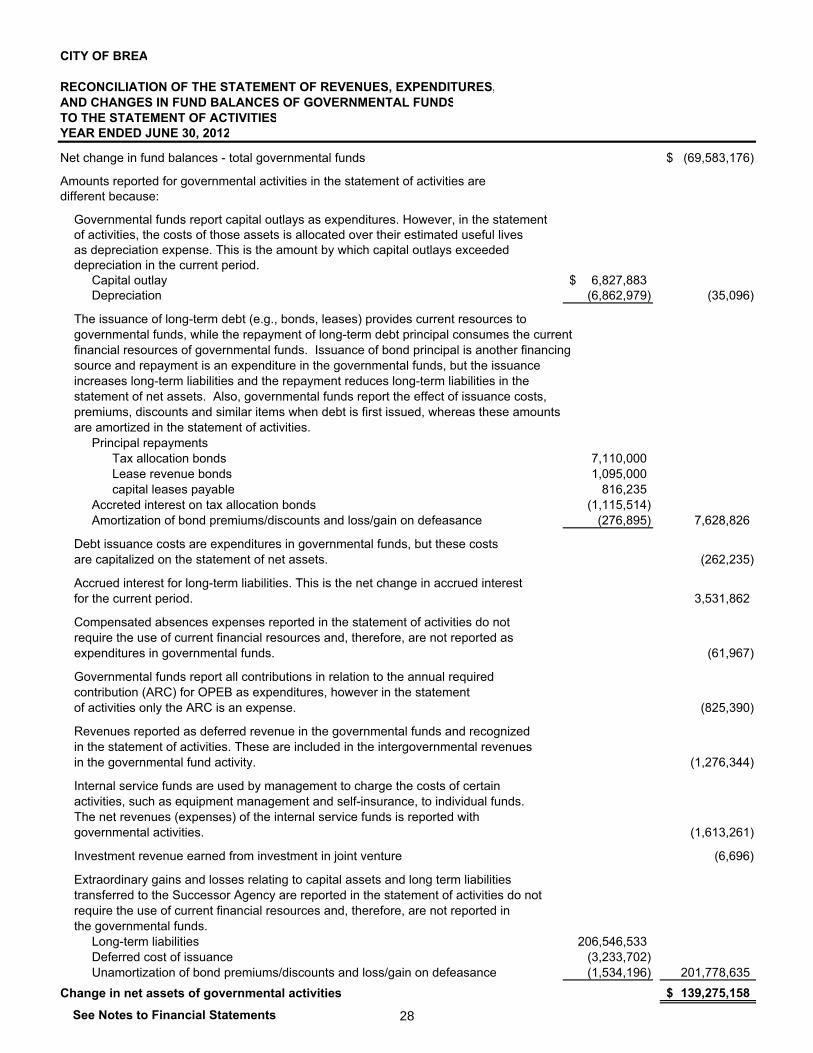
CITY OF BREA
RECONCILIATION OF THE STATEMENT OF REVENUES, EXPENDITURES,AND CHANGES IN FUND BALANCES OF GOVERNMENTAL FUNDSTO THE STATEMENT OF ACTIVITIESYEAR ENDED JUNE 30, 2012
Net change in fund balances - total governmental funds (69,583,176)$
Amounts reported for governmental activities in the statement of activities aredifferent because:
Governmental funds report capital outlays as expenditures. However, in the statement of activities, the costs of those assets is allocated over their estimated useful lives as depreciation expense. This is the amount by which capital outlays exceeded depreciation in the current period.
Capital outlay 6,827,883$ Depreciation (6,862,979) (35,096)
The issuance of long-term debt (e.g., bonds, leases) provides current resources to governmental funds, while the repayment of long-term debt principal consumes the current financial resources of governmental funds. Issuance of bond principal is another financing source and repayment is an expenditure in the governmental funds, but the issuance increases long-term liabilities and the repayment reduces long-term liabilities in the statement of net assets. Also, governmental funds report the effect of issuance costs, premiums, discounts and similar items when debt is first issued, whereas these amounts are amortized in the statement of activities.
Principal repaymentsTax allocation bonds 7,110,000 Lease revenue bonds 1,095,000 capital leases payable 816,235
Accreted interest on tax allocation bonds (1,115,514) Amortization of bond premiums/discounts and loss/gain on defeasance (276,895) 7,628,826
Debt issuance costs are expenditures in governmental funds, but these costs are capitalized on the statement of net assets. (262,235)
Accrued interest for long-term liabilities. This is the net change in accrued interest for the current period. 3,531,862
Compensated absences expenses reported in the statement of activities do not require the use of current financial resources and, therefore, are not reported as expenditures in governmental funds. (61,967)
Governmental funds report all contributions in relation to the annual required contribution (ARC) for OPEB as expenditures, however in the statement of activities only the ARC is an expense. (825,390)
Revenues reported as deferred revenue in the governmental funds and recognized in the statement of activities. These are included in the intergovernmental revenues in the governmental fund activity. (1,276,344)
Internal service funds are used by management to charge the costs of certain activities, such as equipment management and self-insurance, to individual funds. The net revenues (expenses) of the internal service funds is reported with governmental activities. (1,613,261)
Investment revenue earned from investment in joint venture (6,696)
Extraordinary gains and losses relating to capital assets and long term liabilities transferred to the Successor Agency are reported in the statement of activities do not require the use of current financial resources and, therefore, are not reported in the governmental funds.
Long-term liabilities 206,546,533 Deferred cost of issuance (3,233,702) Unamortization of bond premiums/discounts and loss/gain on defeasance (1,534,196) 201,778,635
Change in net assets of governmental activities 139,275,158$
See Notes to Financial Statements 28

CITY OF BREA
BUDGETARY COMPARISON STATEMENT BY DEPARTMENTGENERAL FUNDYEAR ENDED JUNE 30, 2012
Variance with Final Budget
Budget Amounts Actual PositiveOriginal Final Amounts (Negative)
Budgetary Fund Balance, July 1 26,077,910$ 26,077,910$ 26,077,910$ -$ Resources (Inflows):Taxes 29,073,006 29,073,006 32,428,203 3,355,197 Licenses and permits 531,400 531,400 468,154 (63,246) Intergovernmental 3,441,760 3,552,599 3,540,656 (11,943) Charges for services 14,771,753 14,811,753 15,407,354 595,601 Use of money and property 1,840,874 1,840,874 1,978,659 137,785 Fines and forfeitures 1,259,500 1,259,500 1,266,372 6,872 Miscellaneous 2,448,756 3,211,648 3,049,895 (161,753) Transfers in 4,606,964 3,861,436 3,525,075 (336,361)
Amounts Available for Appropriation 84,051,923 84,220,126 87,742,278 3,522,152 Charges to Appropriation (Outflow):General government
Management services 1,674,353 2,270,037 2,049,909 220,128 Administrative services 3,242,439 3,098,837 2,370,625 728,212
Public safetyPolice 26,122,089 26,471,690 25,752,171 719,519 Fire 10,328,035 10,957,163 10,722,960 234,203
Community development 1,809,189 2,129,072 2,017,344 111,728 Community services 5,850,835 6,129,127 5,930,685 198,442 Public works 5,763,287 5,251,806 4,689,769 562,037 Capital outlay 97,000 586,004 591,818 (5,814) Debt service: Principal retirement 1,095,000 1,911,235 1,911,235 - Interest and fiscal charges 473,700 485,889 485,778 111 Transfers out 1,322,000 2,118,251 499,540 1,618,711
Total Charges to Appropriation 57,777,927 61,409,111 57,021,834 4,387,277
Budgetary Fund Balance, June 30 26,273,996$ 22,811,015$ 30,720,444$ 7,909,429$
See Notes to Financial Statements 29

THIS PAGE INTENTIONALLY LEFT BLANK
30

PROPRIETARY FUNDS Business-type Activities The Water Utility Fund is a Major Fund used to account for the operations of the City’s water utility, which are operated in a manner similar to a private enterprise. The costs (expenses, including depreciation) of providing these services to the general public on a continuing basis are financed or recovered primarily through user charges. The Sewer Utility Fund is a Major Fund used to account for the operations of the City’s sewer distribution lines, which are operated in a manner similar to a private enterprise. The costs (expenses, including depreciation) of providing these services to the general public on a continuing basis are financed or recovered primarily through user charges. Non-Major Funds Non-major proprietary funds are those proprietary funds which do not meet the criteria of a major fund. For reporting purposes in this section, they are combined together as Other Enterprise Funds. Governmental Activities The Internal Service Funds are used to allocate the cost of providing goods and services by one department to other departments on a cost reimbursement basis.
31

CITY OF BREA
STATEMENT OF NET ASSETSPROPRIETARY FUNDS JUNE 30, 2012
GovernmentalOther Activities-
Enterprise InternalFunds Total Service Funds
Assets:Current:
Cash and investments 2,474,783$ 4,498,099$ 718,282 $ 7,691,164$ 1,933,403 $ Accounts receivable 1,997,841 306,148 604,554 2,908,543 87,510 Prepaid costs - - - - 416,920 Due from other governments - - 274,474 274,474 96,281
Restricted:Cash and investments 2,248,086 - - 2,248,086 - Cash and investments with fiscal agent 5,217,299 - - 5,217,299 -
Total Current Assets 11,938,009 4,804,247 1,597,310 18,339,566 2,534,114 Noncurrent:
Capital assets - net of accumulated depreciation 53,015,834 11,448,767 13,650 64,478,251 4,805,405 Deferred Charges 256,384 - - 256,384 - Other investments 11,224,928 - - 11,224,928 - Advances to other funds - - - - 3,717,799
Total Noncurrent Assets 64,497,146 11,448,767 13,650 75,959,563 8,523,204 Total Assets 76,435,155$ 16,253,014$ 1,610,960$ 94,299,129$ 11,057,318$
Liabilities and Net Assets:Liabilities:Current:
Accounts payable 2,458,794$ 4,186$ 185,682$ 2,648,662$ 172,782$ Accrued liabilities 39,306 11,141 31,047 81,494 26,666 Accrued interest 1,031,863 - - 1,031,863 14,292 Deposits payable 176,560 - - 176,560 - Due to other funds - - 117,775 117,775 - Accrued compensated absences, due within one year 63,550 20,169 78,099 161,818 50,779 Accrued claims and judgments, due within one year - - - - 2,289,366 Bonds and capital leases, due within one year 940,000 - - 940,000 133,884
Total Current Liabilities 4,710,073 35,496 412,603 5,158,172 2,687,769 Noncurrent:
Advances from other funds 5,243,781 - - 5,243,781 - Accrued compensated absences, due in more than one year 21,183 6,723 26,033 53,939 16,925 Accrued claims and judgments, due in more than one year - - - - 3,152,046 Bonds and capital leases, due in more than one year 34,594,155 - - 34,594,155 769,564
Total Noncurrent Liabilities 39,859,119 6,723 26,033 39,891,875 3,938,535 Total Liabilities 44,569,192 42,219 438,636 45,050,047 6,626,304
Net Assets:Invested in capital assets, net of related debt 24,645,392 11,448,767 13,650 36,107,809 3,901,957 Restricted for debt service 5,217,299 - - 5,217,299 - Unrestricted 2,003,272 4,762,028 1,158,674 7,923,974 529,057
Total Net Assets 31,865,963 16,210,795 1,172,324 49,249,082 4,431,014 Total Liabilities and Net Assets 76,435,155$ 16,253,014$ 1,610,960$ 94,299,129$ 11,057,318$ Reconciliation of Net Assets to the Statement of Net Assets Net Assets per Statement of Net Assets - Proprietary Funds 49,249,082$
Current year adjustment to reflect the consolidation of internal service activities related to enterprise funds (228,897) Net Assets per Statement of Net Assets 49,020,185$
Water Utility Sewer Utility
Business Type Activities - Enterprise Funds
See Notes to Financial Statements 32

CITY OF BREA
STATEMENT OF REVENUES, EXPENSESAND CHANGES IN FUND NET ASSETSPROPRIETARY FUNDS YEAR ENDED JUNE 30, 2012
GovernmentalOther Activities-
Enterprise InternalFunds Total Service Funds
Operating Revenues:Charges for services 12,713,447$ 1,939,397$ 5,053,709$ 19,706,553$ 6,578,952$ Connection fees 1,041,014 - - 1,041,014 - Miscellaneous 1,192,151 - 159,248 1,351,399 179,414
Total Operating Revenues 14,946,612 1,939,397 5,212,957 22,098,966 6,758,366 Operating Expenses:Personnel Services 2,515,278 747,564 1,701,555 4,964,397 1,234,752 Maintenance and operation 1,812,177 123,585 2,450,801 4,386,563 4,132,675 Cost of purchased water 6,868,916 - - 6,868,916 - Claims and judgments - - - - 2,988,053 Depreciation expense 1,959,461 335,696 2,927 2,298,084 765,560
Total Operating Expenses 13,155,832 1,206,845 4,155,283 18,517,960 9,121,040 Operating Income (Loss) 1,790,780 732,552 1,057,674 3,581,006 (2,362,674)
Nonoperating Revenues (Expenses):Intergovernmental - - 11,323 11,323 91,318 Interest revenue 280,946 123,321 10,989 415,256 91,487 Interest expense (2,246,289) - - (2,246,289) (45,149) Contributions - - - - 130,000 Gain (loss) on disposal of capital assets 90,551 - - 90,551 27,548
Total Nonoperating Revenues (Expenses) (1,874,792) 123,321 22,312 (1,729,159) 295,204 Income (Loss) Before Transfers (84,012) 855,873 1,079,986 1,851,847 (2,067,470)
Transfers in - - - - 525,312 Transfers out (335,542) (197,312) (560,165) (1,093,019) (300,000)
Changes in Net Assets (419,554) 658,561 519,821 758,828 (1,842,158) Net Assets:Beginning of Year 32,285,517 15,552,234 652,503 48,490,254 6,273,172
End of Fiscal Year 31,865,963$ 16,210,795$ 1,172,324$ 49,249,082$ 4,431,014$
Reconciliation of Changes in Net Assets to the Statement of Activities:
Changes in Net Assets, per the Statement of Revenues,Expenses and Changes in Fund Net Assets - Proprietary Funds 758,828$
Adjustment to reflect the consolidation of current fiscal yearinternal service funds activities related to enterprise funds (228,897)
Changes in Net Assets of Business-Type Activities per Statement of Activities 529,931$
Water Utility Sewer Utility
Business Type Activities - Enterprise Funds
See Notes to Financial Statements 33

CITY OF BREA
STATEMENT OF CASH FLOWSPROPRIETARY FUNDS YEAR ENDED JUNE 30, 2012
GovernmentalOther Activities-
Enterprise InternalFunds Total Service Funds
Cash Flows from Operating Activities:Cash received from customers 14,734,568$ 1,935,037$ 5,227,208$ 21,896,813$ 6,673,303$ Cash paid to suppliers for goods and services (8,450,487) (124,072) (2,645,337) (11,219,896) (4,602,353) Cash paid to employees for services (2,486,301) (734,079) (1,676,197) (4,896,577) (4,218,196) Insurance premium and settlements - - - - 1,099,349
Net Cash Provided (Used) by Operating Activities 3,797,780 1,076,886 905,674 5,780,340 (1,047,897)
Cash Flows from Non-CapitalFinancing Activities:
Cash transfers out for noncapital financing activities - - (560,165) (560,165) (300,000) Cash transfers in for noncapital financing activities (335,542) (197,312) - (532,854) 525,312 Interest subsidy on debt - - - - - Miscellaneous refunds - - - - - Advance from other funds 5,243,781 - - 5,243,781 - Advance to other funds - - - - (3,717,799) Contributions - - 11,323 11,323 130,000 Grant subsidy - - - - 91,318
Net Cash Provided (Used) by Non-Capital Financing Activities 4,908,239 (197,312) (548,842) 4,162,085 (3,271,169)
Cash Flows from Capital and Related Financing Activities:
Acquisition and construction of capital assets (1,978,856) (1,057,997) - (3,036,853) (1,191,756) Proceeds from sales of capital assets 90,551 - - 90,551 27,548 Principal paid on capital debt (495,000) - - (495,000) (127,894) Interest paid on capital debt (2,092,889) - - (2,092,889) (50,280)
Net Cash Provided (Used) by Capital and Related Financing Activities (4,476,194) (1,057,997) - (5,534,191) (1,342,382)
Cash Flows from Investing Activities:Purchase of other investments (8,141,812) - (8,141,812) - Interest received 280,946 123,321 10,989 415,256 91,490
Net Cash Provided (Used) byInvesting Activities (7,860,866) 123,321 10,989 (7,726,556) 91,490
Net Increase (Decrease) in Cashand Cash Equivalents (3,631,041) (55,102) 367,821 (3,318,322) (5,569,958)
Cash and Cash Equivalents at Beginning of Year 13,571,209 4,553,201 350,461 18,474,871 7,503,361
Cash and Cash Equivalents at End of Year 9,940,168$ 4,498,099$ 718,282$ 15,156,549$ 1,933,403$
Reconciliation of Operating Income to Net CashProvided (Used) by Operating Activities:Operating income (loss) 1,790,780$ 732,552$ 1,057,674$ 3,581,006$ (2,362,674)$ Adjustments to reconcile operating income (loss) net cash provided (used) by operating activities:
Depreciation 1,959,461 335,696 2,927 2,298,084 765,560 Amortization of deferred charges 13,064 - - 13,064 - (Increase) decrease in accounts receivable (223,054) (4,360) 14,251 (213,163) (85,063) (Increase) decrease in due from other governments - - (126,068) (126,068) (95,046) (Increase) decrease in prepaid expense - - - - (416,920) Increase (decrease) in accounts payable 217,542 (487) 16,942 233,997 33,442 Increase (decrease) in accrued liabilities 10,498 3,151 4,976 18,625 8,846 Increase (decrease) in deposits 11,010 - - 11,010 - Increase (decrease) in due to other funds - - (85,410) (85,410) - Increase (decrease) in claims and judgments - - - - 1,099,349 Increase (decrease) in compensated absences 18,479 10,334 20,382 49,195 4,609
Total Adjustments 2,007,000 344,334 (152,000) 2,199,334 1,314,777 Net Cash Provided (Used) by Operating Activities 3,797,780$ 1,076,886$ 905,674$ 5,780,340$ (1,047,897)$
Water Utility Sewer Utility
Business Type Activities - Enterprise Funds
See Notes to Financial Statements 34

FIDUCIARY FUNDS Agency Funds, a type of Fiduciary Fund, are used to account for assets held by the City as an agent for other governmental entities, private organizations, or individuals. Private-Purpose Trust Fund, a type of Fiduciary Fund, is used to account for assets held by the City as Successor Agency of the former Brea Redevelopment Agency.
35

CITY OF BREA
STATEMENT OF FIDUCIARY NET ASSETSFIDUCIARY FUNDSJUNE 30, 2012
AgencyFunds
Assets:Cash and investments 3,718,637$ 25,271,308$ Receivables:
Accounts 46,495 11,204 Taxes 13,426 - Accrued interest - 583,053 Deferred loans - 19,373,852
Prepaid costs 950 - Due from other governments 990,900 - Due from City - 243,621 Land held for resale - 6,675,355 Deferred charges - 3,046,391 Restricted assets:
Cash and investments - 1,787,877 Cash and investments with fiscal agents 1,790,920 21,681,771
Total Assets 6,561,328$ 78,674,432
Liabilities:Accounts payable 694,112$ 855,742 Accrued liabilities 796,050 - Accrued interest - 3,515,183 Unearned revenues - 1,443,715 Deposits payable - 14,331 Due to other governments 46,495 - Due to City - 352,260 Due to external parties/other agencies 5,024,671 - Long-term liabilities:
Due in one year - 8,380,000 Due in more than one year - 196,609,494
Total Liabilities 6,561,328$ 211,170,725
Net Assets:Held in trust for other purposes (132,496,293)
Total Net Assets (132,496,293)$
Private-Purpose Trust
Fund Successor
Agency of the Former RDA
See Notes to Financial Statements 36

CITY OF BREA
STATEMENT OF CHANGES IN FIDUCIARY NET ASSETSFIDUCIARY FUNDSYEAR ENDED JUNE 30, 2012
Additions:Interest and change in fair value of investments (25,758)$ Rental income 107,019 Contributions from City 57,564 Miscellaneous 49,378
Total Additions 188,203
Deductions:Administrative expenses 2,130,213 Contractual services 276,806 Interest expense 7,863,535 Contributions to other governments 2,726,988
Total Deductions 12,997,542
Extraordinary gain/(loss) on dissolutionof redevelopment agency (Note 16) (119,686,954)
Changes in Net Assets (132,496,293)
Net Assets - Beginning of the Year -
Net Assets - End of the Year (132,496,293)$
Private-Purpose Trust
Fund Successor
Agency of the Former RDA
See Notes to Financial Statements 37

CITY OF BREA NOTES TO THE BASIC FINANCIAL STATEMENTS FOR THE YEAR ENDED JUNE 30, 2012
I. SIGNIFICANT ACCOUNTING POLICIES
Note 1: Summary of Significant Accounting Policies
The financial statements of the City of Brea, California (City) have been prepared in conformity with generally accepted accounting principles (GAAP) as applied to government units. The Governmental Accounting Standards Board (GASB) is the accepted standard-setting body for establishing governmental accounting and financial reporting principles. The significant accounting policies of the City of Brea are described below:
a. Description of the Reporting Entity
The City of Brea was incorporated on February 23, 1917, under the general laws of the State of California. The City operates under the Council-Manager form of government and provides the following services: public safety (police and fire), highways and streets, cultural recreation, public improvements, planning and zoning, and general administrative services.
The accounting policies of the City conform to accounting principles generally accepted in the United States of America as applicable to governments.
As required by accounting principles generally accepted in the United States of America, these financial statements present the City of Brea and its component units, entities for which the City is considered to be financially accountable. The City is considered to be financially accountable for an organization if the City appoints a voting majority of that organization's governing body and the City is able to impose its will on that organization, or there is a potential for that organization to provide specific financial benefits to or impose specific financial burdens on the City. The City is also considered to be financially accountable for an organization if that organization is fiscally dependent (i.e., it is unable to adopt its budget, levy taxes, set rates or charges, or issue bonded debt without approval from the City). In certain cases, other organizations are included as component units if the nature and significance of their relationship with the City are such that their exclusion would cause the City's financial statements to be misleading or incomplete.
Based upon the above criteria, the component units of the City are the Brea Redevelopment Agency, the Brea Public Financing Authority, and the Midbury Assessment Authority. Since City Council serves as the governing board for these component units, all of the City's component units are considered to be blended component units. Blended component units, although legally separate entities, are in substance, part of the City's operations, so data from these units is combined therein. A brief description of each component unit follows: Brea Redevelopment Agency
The Redevelopment Agency's financial activity commenced on May 24, 1971. The primary purpose of the Agency is to eliminate blighted areas by encouraging development of residential, commercial, industrial, recreational and public facilities. The City Council appoints the Agency director and has full accountability for the Agency's fiscal matters. Revenues of the Agency consist primarily of property tax allocations on the incremental increase of property values in the redevelopment area and revenues from the use of money and property.
38

CITY OF BREA NOTES TO THE BASIC FINANCIAL STATEMENTS (CONTINUED) FOR THE YEAR ENDED JUNE 30, 2012
Note 1: Summary of Significant Accounting Policies (Continued) The Redevelopment Agency was dissolved as of January 31, 2012 through the Supreme Court decision on Assembly Bill 1X 26. See Note 15 for more information on the dissolution.
City of Brea Public Financing Authority
The City of Brea Public Financing Authority was created by a joint exercise of joint powers agreement between the City of Brea and the Redevelopment Agency of the City of Brea on November 17, 1987. In April 1988, the Brea-Olinda Unified School District became an associate member of the Authority. The purpose of the Authority is to provide, through the issuance of debt, financing necessary for various capital improvements. The Authority is administered by the Board who are the members of the City Council and the Mayor. The Authority's primary source of income will be installment sale, loan and lease payments received from the City and Redevelopment Agency, which will be used to meet the debt service requirements on debt issues. The Authority does not have taxing power. The Brea Public Financing Authority issue separate component unit financial statements. Upon completion, these component unit financial statements can be obtained at City Hall.
Midbury Assessment Authority
The Midbury Assessment Authority was created by a joint exercise of joint powers agreement between the City of Brea, Los Angeles County, and Orange County on May 18, 1999. The purpose of the authority is to provide a means for each party to the agreement to contribute money to street improvement projects, to form an assessment district and to levy an assessment to finance the balance of the projects. The Authority is administered by the Board who are the members of the City Council and the Mayor. The Authority’s primary source of income will be from new assessments that result in additional taxes. Separate financial statements are not prepared for the Midbury Assessment Authority.
b. Government-Wide and Fund Financial Statements The government-wide financial statements (i.e., the statement of net assets and the statement of activities) report information on all of the nonfiduciary activities of the primary government and its component units. All fiduciary activities are reported only in the fund financial statements. For the most part, the effect of interfund activity has been removed from these statements. Governmental activities, which normally are supported by taxes and intergovernmental revenues, are reported separately from business-type activities, which rely to a significant extent on fees and charges for support. The statement of activities demonstrates the degree to which the direct expenses of a given function or segment is offset by program revenues. Direct expenses are those that are clearly identifiable with a specific function or segment. Program revenues include: 1) charges to customers or applicants who purchase, use or directly benefit from goods, services or privileges provided by a given function or segment, and 2) grants and contributions that are restricted to meeting the operational or capital requirements of a particular function or segment. Taxes and other items not properly included among program revenues are reported instead as general revenues.
39

CITY OF BREA NOTES TO THE BASIC FINANCIAL STATEMENTS (CONTINUED) FOR THE YEAR ENDED JUNE 30, 2012
Note 1: Summary of Significant Accounting Policies (Continued) Separate financial statements are provided for governmental funds, proprietary funds and fiduciary funds, even though the latter are excluded from the government-wide financial statements. Major individual governmental funds and major individual enterprise funds are reported as separate columns in the fund financial statements.
c. Measurement Focus, Basis of Accounting and Financial Statement Presentation
The government-wide financial statements are reported using the economic resources measurement focus and the accrual basis of accounting, as are the proprietary fund financial statements. Revenues are recorded when earned and expenses are recorded when a liability is incurred, regardless of the timing of related cash flows. Property taxes are recognized as revenues in the year for which they are levied. Grants and similar items are recognized as revenue as soon as all eligibility requirements imposed by the provider have been met.
The fund financial statements provide information about the government’s funds,
including its fiduciary funds and blended component units. Separate statements for each fund category – governmental, proprietary, and fiduciary – are presented.
Governmental fund financial statements are reported using the current financial
resources measurement focus and the modified accrual basis of accounting. Revenues are recognized as soon as they are both measurable and available. Revenues are considered to be available when they are collectible within the current period or soon enough thereafter to pay liabilities of the current period. For this purpose, the government considers revenues to be available if they are collected within 60 days of the end of the current fiscal period, with the exception of sales tax revenue, which are considered available if collected within 90 days of year end. Expenditures generally are recorded when a liability is incurred, as under accrual accounting. However, debt service expenditures, as well as expenditures related to compensated absences and claims and judgments, are recorded only when payment is due.
Property taxes, franchise taxes, licenses and interest associated with the current fiscal period are all considered to be susceptible to accrual and so have been recognized as revenues of the current fiscal period. Only the portion of special assessments receivable due within the current fiscal period is considered to be susceptible to accrual as revenue of the current period. All other revenue items are considered to be measurable and available only when cash is received by the government. The City’s fiduciary funds consist of agency funds and a private purpose trust fund. Agency funds are custodial in nature (assets equal liabilities) and do not involve measurement of results of operations. Private purpose trust fund funds are accounted for using the “economic resources” measurement focus and the accrual basis of accounting. Under the accrual basis of accounting, revenues are recognized in the period in which they are earned while expenses are recognized in the period in which the liability is incurred.
40

CITY OF BREA NOTES TO THE BASIC FINANCIAL STATEMENTS (CONTINUED) FOR THE YEAR ENDED JUNE 30, 2012
Note 1: Summary of Significant Accounting Policies (Continued) The City reports the following major governmental funds: The General Fund is the City's primary operating fund. It accounts for all general
revenues of the City not specifically levied or collected for other City funds, and for expenditures related to the rendering of general services by the City. The General Fund is used to account for all resources not required to be accounted for in another fund.
The Redevelopment Agency Special Revenue Fund accounts for revenues received and expenditures made for the Redevelopment Agency’s Low and Moderate Income Housing Programs. The Redevelopment Agency was dissolved as of January 31, 2012 through the Supreme Court decision on Assembly Bill 1X 26. See Note 15 for more information.
The Capital Improvements Capital Projects Fund accounts for the costs of
constructing street improvements, parks and other public improvements not normally included within the other Capital Projects Funds. Financing is provided by federal, state and county grant revenues and interfund transfers from the General Fund, and Special Revenue Funds.
The Capital and Mitigation Improvement Fund accounts for the revenues received
and expenditures made for the City Council-designated Capital Improvement projects, as well as the implementation of measures designed to mitigate impacts related to development, and the operation of government facilities, including, but not limited to: traffic, noise, aesthetics, and open space preservation. Financing is provided by the July 14, 2009 Agreement between the City and County of Orange regarding the extension of the Olinda Alpha Landfill.
The Redevelopment Agency Capital Projects Fund accounts for the financing and construction within boundaries of the redevelopment projects areas. Construction includes streets, sewers, storm drains, various park improvement projects and a civic and cultural center. Financing is provided by tax increment bonds and lease revenue bonds. The Redevelopment Agency was dissolved as of January 31, 2012 through the Supreme Court decision on Assembly Bill 1X 26. See Note 15 for more information.
The Redevelopment Agency Debt Service Fund accounts for the accumulation of resources for payment of interest and principal on the long-term debt of the Redevelopment Agency. The Redevelopment Agency was dissolved as of January 31, 2012 through the Supreme Court decision on Assembly Bill 1X 26. See Note 16 for more information.
The City reports the following major proprietary funds:
The Water Utility Fund accounts for the City’s water utility operations, which are financed and operated in a manner similar to a private enterprise. The cost (expenses, including depreciation) of providing these services to the general public on a continuing basis is financed or recovered primarily through user charges.
41

CITY OF BREA NOTES TO THE BASIC FINANCIAL STATEMENTS (CONTINUED) FOR THE YEAR ENDED JUNE 30, 2012
Note 1: Summary of Significant Accounting Policies (Continued)
The Sewer Utility Fund accounts for the operations of the City’s sewer distribution lines, which are operated in a manner similar to a private enterprise. The costs (expenses, including depreciation) of providing these services to the general public on a continuing basis are financed or recovered primarily through user charges.
Additionally, the City reports the following fund types:
Internal Service Funds account for financial transactions related to repair, replacement and maintenance of City-owned buildings and vehicles and to account for the City's self-insurance programs. These services are provided to other departments or agencies of the City on a cost reimbursement basis.
Agency Funds account for assets held by the City in a custodial capacity as a trustee or as an agent. These assets include deposits from assessment district’s property owners. Agency funds are custodial in nature (assets equal liabilities) and do not involve measurement of results of operations.
Private-Purpose Trust Fund accounts for the assets and liabilities of the former
redevelopment agency and the allocated revenue to pay estimated installment payments of enforceable obligations until the obligations of the former redevelopment agency are paid in full and assets have been liquidated.
Private-sector standards of accounting and financial reporting issued prior to December 1989, generally are followed in both the government-wide and proprietary fund financial statements to the extent that those standards do not conflict with or contradict guidance of the Governmental Accounting Standards Board. Governments also have the option of following subsequent private-sector guidance for their business-type activities and enterprise funds, subject to this same limitation. The government has elected not to follow subsequent private-sector guidance. As a general rule, the effect of interfund activity has been eliminated from the government-wide financial statements. Residual net asset balances in internal service funds are allocated back to the governmental and enterprise funds that they originally charged. Amounts reported as program revenues include: 1) charges to customers or applicants for goods, services or privileges provided, 2) operating grants and contributions, and 3) capital grants and contributions, including special assessments. Internally dedicated resources are reported as general revenues rather than as program revenues. Likewise, general revenues include all taxes. Proprietary funds distinguish operating revenues and expenses from non-operating items. Operating revenues and expenses generally result from providing services and producing and delivering goods in connection with a proprietary fund's principal ongoing operations. The principal operating revenues of the Enterprise Funds and of the Internal Service Funds are charges to customers for sales and services. Operating expenses for Enterprises Funds and Internal Service Funds include the cost of sales and services, administrative expenses and depreciation on capital assets. All revenues and expenses not meeting this definition are reported as non-operating revenues and expenses.
42

CITY OF BREA NOTES TO THE BASIC FINANCIAL STATEMENTS (CONTINUED) FOR THE YEAR ENDED JUNE 30, 2012
Note 1: Summary of Significant Accounting Policies (Continued) d. Assets, Liabilities and Net Assets or Equity Cash and Investments
Cash includes demand deposits, certificates of deposits and savings account balances. The California Government Code and the City of Brea's investment policy permit the City of Brea to invest in various instruments and pools. Investments are reported in the accompanying balance sheet at fair value, except for investment contracts that are reported at cost because they are not transferable and they have terms that are not affected by changes in market interest rates. The State Treasurer's Investment Pool operates in accordance with appropriate state laws and regulations. The reported value of the pool is the same as the fair value of the pool shares. The City reports its investments at fair value in the balance sheet according to GASB Statement No. 31, Accounting and Financial Reporting for Certain Investments and for External Investment Pools. Interest earnings, realized gains and losses and, changes in the fair value of investments are recognized as revenue from the use of money and property in the operating statement. The City pools cash and investments of all funds except for assets held by fiscal agents. Each fund's share in this pool is displayed in the accompanying financial statements as cash and investments. Investment income earned by the pooled investments is allocated to the various funds based on each fund's average cash and investment balance. For purposes of the statement of cash flows, cash equivalents are defined as short-term, highly liquid investments that are both readily convertible to known amounts of cash or so near their maturity that they present insignificant risk of changes in value because of changes in interest rates. Cash equivalents also represent the proprietary funds' share in the cash and investment pool of the City of Brea. Cash equivalents have an original maturity date of three months or less from the date of purchase. For financial statement presentation purposes, cash and cash equivalents are shown as both restricted and unrestricted cash.
Restricted Cash and Investments
Certain proceeds of debt issues, as well as certain resources set aside for their repayment, are classified as restricted assets on the balance sheet because their use is limited by applicable bond covenants. In addition, funds have been restricted for future capital improvements by City resolution.
Receivables and Payables
Activity between funds that are representative of lending/borrowing arrangements outstanding at the end of the fiscal year are referred to as either "due to/from other funds" (i.e., the current portion of interfund loans) or "advances to/from other funds" (i.e., the non-current portion of interfund loans). All other outstanding balances between funds are reported as "due to/from other funds." Any residual balances outstanding between the governmental activities and business-type activities are reported in the government-wide financial statements as "internal balances."
43

CITY OF BREA NOTES TO THE BASIC FINANCIAL STATEMENTS (CONTINUED) FOR THE YEAR ENDED JUNE 30, 2012
Note 1: Summary of Significant Accounting Policies (Continued) The amounts recorded as a receivable due from other governments include sales taxes, property taxes and grant revenues collected or provided by federal, state, County and City governments and unremitted to the City as of June 30, 2012. The County of Orange assesses bills and collects property taxes for the City. All trade and tax receivables are shown net of an allowance for uncollectibles.
Prepaid Items
Certain payments to vendors reflect costs applicable to future accounting periods and are recorded as prepaid items in both government-wide and fund financial statements.
Inventories
Inventories of materials and supplies are carried at cost. The City records inventory using a first-in-first-out (FIFO) basis and the consumption method.
Land Held for Resale
The former Brea Redevelopment Agency has acquired land as part of its primary purpose to develop blighted properties. The Successor Agency to the former Brea Redevelopment Agency records these parcels as land held for resale in its financial statements. The property is being carried in the Private Purpose Trust Fund at cost or, if lower, the estimated net realizable value upon entering into an agreement to sell the property. Values recorded on the balance sheet are net of allowances for decline in value.
Capital Assets
Capital assets, which include property, plant, equipment and infrastructure assets (e.g., roads, bridges, sidewalks and similar items), are reported in the applicable governmental or business-type activities columns in the government-wide financial statements. Capital assets are defined by the City as assets with an initial, individual cost of more than $3,000 (amount not rounded) and an estimated useful life in excess of two years. Such assets are recorded at historical cost or estimated historical cost if purchased or constructed. Donated capital assets are recorded at estimated fair market value at the date of donation.
Infrastructure assets, once determined that they are not ordinary maintenance, are capitalized in their entirety and do not have a set capitalization threshold. The City elected to use the Basic Approach as defined by GASB Statement No. 34 for infrastructure reporting.
The costs of normal maintenance and repairs that do not add to the value of the assets or materially extend assets lives are not capitalized.
Major outlays for capital assets and improvements are capitalized as projects are constructed. Interest incurred during the construction phase of capital assets of business-type activities is included as part of the capitalized value of the assets
44

CITY OF BREA NOTES TO THE BASIC FINANCIAL STATEMENTS (CONTINUED) FOR THE YEAR ENDED JUNE 30, 2012
Note 1: Summary of Significant Accounting Policies (Continued) constructed. The amount of interest to be capitalized is calculated by offsetting interest expense incurred from the date of the borrowing until completion of the project with interest earned on invested proceeds over the same period. Property, plant and equipment of the primary government and its component units are depreciated using the straight-line method over the following estimated useful lives:
Asset Years Structures and improvements 30 - 50 Equipment Infrastructure
5 - 10 50 - 99
Compensated Absences
It is the government’s policy to permit employees to accumulate earned but unused vacation and sick benefits. Permanent City employees earn from 10 to 20 vacation days a year, depending upon their length of employment, and 12 sick days a year. Employees can carry forward unused sick leave indefinitely. Upon termination or retirement, permanent employees are entitled to receive compensation at their current base salary for all unused vacation leave. Any unused sick leave is forfeited upon termination of employment. All vacation pay is accrued when incurred in the government-wide and proprietary fund financial statements. A liability for these amounts is reported in governmental funds only if they have matured, for example, as a result of employee resignations and retirements.
Long-Term Obligations
In the government-wide financial statements, proprietary fund types in the fund financial statements and in the fiduciary financial statements, long-term debt and other long-term obligations are reported as liabilities in the applicable governmental activities, business-type activities, proprietary fund type statement of net assets, or the statement of fiduciary net assets. Bond premiums and discounts, as well as issuance costs, are deferred and amortized over the life of the bonds using the effective interest method. Bonds payable are reported net of the applicable bond premium or discount. Bond issuance costs are reported as deferred charges and amortized over the term of the related debt.
In the fund financial statements, governmental fund types recognize bond premiums and discounts, as well as bond issuance costs, during the current period. The face amount of debt issued is reported as other financing sources. Premiums received on debt issuances are reported as other financing sources while discounts on debt issuances are reported as other financing uses. Issuance costs, whether or not withheld from the actual debt proceeds received, are reported as debt service expenditures.
Claims and Judgments
The City records a liability for litigation, judgments and claims when it is probable that an asset has been impaired or a liability has been incurred prior to year-end and the
45

CITY OF BREA NOTES TO THE BASIC FINANCIAL STATEMENTS (CONTINUED) FOR THE YEAR ENDED JUNE 30, 2012
Note 1: Summary of Significant Accounting Policies (Continued) probable amount of loss (net of any insurance coverage) can be reasonably estimated. This liability is recorded in the Internal Service Funds that account for the City's self-insurance activities.
Fund Balances In the governmental fund financial statements, fund balances are classified as follows:
Nonspendable Fund Balance – This amount indicates the portion of funds balances which cannot be spent because they are either not in spendable form, such as prepaid items, inventories, land held for resale or loans/notes receivable, or legally or contractually required to be maintained intact, such as the principal portion of an endowment.
Restricted Fund Balance – This amount indicates the portion of fund balances which has been restricted a) externally imposed by creditors (such as through debt covenants), grantors, contributors, or laws or regulations of other governments; or b) imposed by law through constitutional provisions or enabling legislation. Committed Fund Balance – This amount indicates the portion of fund balances which can only be used for specific purposes pursuant to formal resolution or ordinance of the City Council. Assigned Fund Balance – This amount indicates the portion of fund balances which is constrained by the City’s intent to be used for specific purpose, but is neither restricted nor committed. The Administrative Services Director is authorized to determine and define the amount of assigned fund balances. Unassigned Fund Balance – This amount indicates the portion of fund balances that do not fall into one of the above categories.
When expenditures are incurred for purposes for which both restricted and unrestricted fund balances are available, the City’s policy is to apply restricted fund balances first, then unrestricted fund balances as they are needed. When expenditures are incurred for purposes where only unrestricted fund balances are available, the City uses the unrestricted resources in the following order: committed, assigned, and unassigned. The City Council, as the City's highest level of decision-making authority, may commit fund balance for specific purposes pursuant to constraints imposed by formal actions taken, such as adoption of an ordinance or resolution. These committed amounts cannot be used for any other purpose unless the City Council removes or changes the specified use through the same type of formal action taken to establish the commitment. City Council action to commit fund balance needs to occur within the fiscal reporting period; however the amount can be determined subsequently.
46

CITY OF BREA NOTES TO THE BASIC FINANCIAL STATEMENTS (CONTINUED) FOR THE YEAR ENDED JUNE 30, 2012
Note 1: Summary of Significant Accounting Policies (Continued) Net Assets
In the governmental-wide financial statements and proprietary fund financial statements, net assets are classified as follows:
Invested in Capital Assets, Net of Related Debt – This amount consists of capital assets net of accumulated depreciation and reduced by outstanding debt that attributed to the acquisition, construction, or improvement of the assets. Restricted Net Assets – This amount is restricted by external creditors, grantors, contributors, or laws or regulations of other governments. Unrestricted Net Assets – This amount is all net assets that do not meet the definition of “invested in capital assets, net of related debt” or “restricted net assets.”
When expenses are incurred for purposes for which both restricted and unrestricted net assets are available, the City’s policy is to apply restricted net assets first, then unrestricted net assets as they are needed.
e. Property Tax Property tax revenue is recognized on the modified accrual basis, that is, in the fiscal year for which the taxes have been levied providing they become available. Available means when due, or past due and receivable within the current period and collected within the current period or expected to be collected soon enough thereafter to be used to pay liabilities of the current period. The County of Orange collects property taxes for the City. Tax liens attach annually as of 12:01 A.M. on the first day in January preceding the fiscal year for which the taxes are levied. Taxes are levied on both real and personal property, as it exists on that date. The tax levy covers the fiscal period July 1 to June 30. All secured personal property taxes and one-half of the taxes on real property are due November 1; the second installment is due February 1. All taxes are delinquent, if unpaid, on December 10 and April 10, respectively. Unsecured personal property taxes become due on the first of March each year and are delinquent, if unpaid, on August 31.
f. Use of Estimates The preparation of financial statements in conformity with accounting principles generally accepted in the United States of America requires management to make estimates and assumptions that affect the reported amounts of assets and liabilities and disclosures of contingent assets and liabilities at the date of the financial statements and the reported amounts of revenues and expenses during the reporting period. Actual results could differ from those estimates.
47

CITY OF BREA NOTES TO THE BASIC FINANCIAL STATEMENTS (CONTINUED) FOR THE YEAR ENDED JUNE 30, 2012
II. STEWARDSHIP
Note 2: Stewardship, Compliance and Accountability a. General Budget Policies
The City adheres to the following procedures in establishing the budgetary data reflected in its financial statements: 1. In May of each year, the City Manager submits to the City Council a proposed
financial plan with an annual operating budget for the upcoming fiscal year commencing July 1. The operating budget includes proposed expenditures and the sources of financing.
2. Public hearings are conducted at City Council meetings to obtain taxpayer
comments. 3. On or before July 1, the financial plan for the fiscal year is adopted by Council action. 4. The City Manager is authorized to transfer funds appropriated with respect to those
classifications designated as other services and material and supplies within the same department. The City Manager may transfer appropriated funds from any classification within other expenditure categories to the capital outlay classification within the same department only; however, any revisions that alter the total expenditures of any department must be approved by the City Council. Activities of the General Fund, Special Revenue Funds, Capital Projects Funds and Debt Service Funds are included in the annual appropriated budget. As an additional internal control mechanism, project-length financial plans are adopted for the Capital Improvement Program. The level of budgetary control (that is, the level at which expenditures cannot legally exceed the appropriated amount) is established at the department level within the General Fund and at the fund level for total expenditures and transfers out for all other budgeted funds.
5. Formal budgetary integration is employed as a management control device during
the year for the governmental funds.
6. Legally adopted budgets for all governmental funds are established on a basis consistent with generally accepted accounting principles (GAAP). For the current fiscal year, the HOME Program special revenue fund had no adopted budget.
7. As a result of the dissolution of the former Redevelopment Agency as of
January 31, 2012, the City has elected not to show budget to actual comparisons for the Redevelopment Agency Special Revenue Fund, the Redevelopment Agency Capital Projects Fund, or the Redevelopment Agency Debt Service Fund as these comparison schedules show a full year of budget activity and only seven months of actual activity during the year.
48

CITY OF BREA NOTES TO THE BASIC FINANCIAL STATEMENTS (CONTINUED) FOR THE YEAR ENDED JUNE 30, 2012
Note 2: Stewardship, Compliance and Accountability (Continued)
b. Excess of Expenditures Over Appropriation
For purposes of evaluating legal compliance at the budgetary level of control (that is, the level at which expenditures cannot legally exceed the appropriated amount), control is established at the department level within the General Fund and at the fund level for total expenditures and transfers out for all other budgeted funds.
III. DETAILED NOTES ON ALL FUNDS
Note 3: Cash and Investments
As of June 30, 2012, cash and investments are classified in the accompanying financial statements as follows:
Statement of Net Assets
Statement of Fiduciary Net
Assets TotalCash and Investments 64,231,280$ 28,989,945 93,221,225$ Restricted assets:
Cash and Investments 2,248,086 1,787,877 4,035,963 Cash and Investments with Fiscal Agents 5,519,271 23,472,691 28,991,962
Total Cash and Investments 71,998,637$ 54,250,513 126,249,150$
Cash and investments as of June 30, 2012 consist of the following:
Cash on Hand 10,577$ Deposits with Financial Institutions 5,345,925 Investments 91,900,686 Cash and Investments with Fiscal Agent 28,991,962
Total Cash and Investments 126,249,150$
The City of Brea maintains a cash and investment pool that is available for use for all funds. Each fund type's position in the pool is reported on the combined balance sheet as cash and investments. The City has adopted an investment policy, which authorizes it to invest in various investments. a. Cash Deposits
The carrying amount of the City’s cash deposits was $5,345,925 at June 30, 2012. Bank balances were $6,778,420 at that date. The $1,432,495 difference represents outstanding checks and other reconciling items. The total amount of which was collateralized or insured with securities held by the pledging financial institutions in the City’s name as discussed below: The California Government Code requires California banks and savings and loan associations to secure a City’s deposits by pledging government securities with a value of 110% of a City’s deposits. California law also allows financial institutions to secure a City’s deposits by pledging first trust deed mortgage notes having a value of 150% of a
49

CITY OF BREA NOTES TO THE BASIC FINANCIAL STATEMENTS (CONTINUED) FOR THE YEAR ENDED JUNE 30, 2012
Note 3: Cash and Investments (Continued)
City’s total deposits. The City Treasurer may waive the collateral requirement for deposits that are fully insured up to $250,000 by the FDIC. The collateral for deposits in federal and state chartered banks is held in safekeeping by an authorized Agent of Depository recognized by the State of California Department of Banking. The collateral for deposits with savings and loan associations is generally held in safekeeping by the Federal Home Loan Bank in San Francisco, California as an Agent of Depository. These securities are physically held in an undivided pool for all California public agency depositors. Under Government Code Section 53655, the placement of securities by a bank or savings and loan association with an “Agent of Depository” has the effect of perfecting the security interest in the name of the local governmental agency. Accordingly, all collateral held by California Agents of Depository are considered to be held for, and in the name of, the local governmental agency. A provision of the Dodd-Frank Wall Street Reform and Consumer Protection Act provides temporary unlimited deposit insurance coverage for noninterest-bearing transaction account at all FDIC-insured institutions. This provision was effective from December 31, 2010 and will remain effective until December 31, 2012. Noninterest-bearing transaction accounts is defined as an account (1) with respect to which interest is neither accrued nor paid; (2) on which the depositor or account holder is permitted to make withdrawals by negotiable or transferable instrument, payment orders of withdrawal, telephone or other electronic media transfers, or other similar items for the purpose of making payments or transfers to third parties or others; and (3) on which the FDIC-insured depository institutions does not reserve the right to require advance notice of an intended withdrawal. As of June 30, 2012, the City maintains cash deposits that are temporary covered by this provision.
b. Investments
Investments Authorized by the California Government Code and the City’s Investment Policy Under provision of the City’s investment policy, and in accordance with the California Government Code, the following investments are authorized: Funds of the City, other than bond proceeds held in restricted accounts, may be invested in any instrument allowable under current legislation of the State of California (Government Code Section 53600 et sec.) so long as the investment is appropriate and consistent with its Investment Policy taking into consideration the City’s investment objectives. Investment instruments may include:
U.S. Treasury Obligations (Bills, Notes and Bonds) U.S. Government Agency Securities and Instrumentalities of Government
Sponsored Corporations, including a maximum of 5% in callable bonds issued by such agencies
Banker’s Acceptances Commercial Paper Repurchase Agreements Certificates of Deposit Negotiable Certificates of Deposit Passbook Savings Accounts
50

CITY OF BREA NOTES TO THE BASIC FINANCIAL STATEMENTS (CONTINUED) FOR THE YEAR ENDED JUNE 30, 2012
Note 3: Cash and Investments (Continued)
Interest Bearing Investment Accounts Medium Term Corporate Notes Bank Money Market Accounts Local Agency Investment Fund (State Pool) County of Orange Investment Fund (County Pool) ● Other investments that are, or may become, legal investments through the State
of California Government Code
Provisions of Government Code Section 53601 are to be adhered to at all times. This includes, but is not limited to, the following restrictions:
Bankers Acceptances cannot exceed 40% of the portfolio nor exceed 180 days; Commercial Paper cannot exceed 25% of the portfolio. Commercial Paper must
be rated P-1 (Moody’s), A-1 (Standard & Poor’s) and cannot exceed 270 days; Money Market Funds cannot exceed 20% of the portfolio; Medium Term Corporate Notes cannot exceed 30% of the portfolio and must
carry a minimum A rating; Pass-through securities including Collateralized Mortgage Obligations cannot exceed 20% of the portfolio and must pass the Federal Financial Institution Examination Council (FFIEC) liquidity test; Additionally, the City will use the guidelines established by the joint committee of
the California Municipal Treasurers Association and the California Society of Municipal Finance Officers as the basis for investing in government investment pools.
For purposes of complying with legal investment limitations, the percentage referenced in the preceding paragraph refers to the maturity value of the portfolio at the time of purchase.
Prohibited Investments The City does not invest any funds in derivatives, inverse floaters, range notes, or interest-only strips that are derived from a pool of mortgages. The City does not invest any funds in any security that could result in a zero interest accrual if held to maturity. Investments Authorized by Debt Agreements The above investments do not address investment of debt proceeds held by a bond trustee. Investments of debt proceeds held by a bond trustee are governed by provisions of the debt agreements rather than the general provisions of the California Government Code or the City’s investment policy.
Investments in State Investment Pool
The City is a voluntary participant in the Local Agency Investment Fund (LAIF) that is regulated by California Government Code Section 16429 under the oversight of the Treasurer of the State of California. LAIF is overseen by the Local Agency Investment Advisory Board, which consists of five members, in accordance with State statute. The State Treasurer’s Office audits the fund annually. The fair value of the position in the investment pool is the same as the value of the pool shares.
51

CITY OF BREA NOTES TO THE BASIC FINANCIAL STATEMENTS (CONTINUED) FOR THE YEAR ENDED JUNE 30, 2012
Note 3: Cash and Investments (Continued) GASB Statement No. 31
The City adopted GASB Statement No. 31, Accounting and Financial Reporting for certain investments and for External Investment Pools, as of July 1, 1997. GASB Statement No. 31 establishes fair value standards for investments in participating interest earning investment contracts, external investment pools, equity securities, option contracts, stock warrants and stock rights that have readily determinable fair values. Accordingly, the City reports its investments at fair value in the balance sheet. All investment income, including changes in the fair value of investments, is recognized as revenue in the operating statement.
c. Risk Disclosures
Disclosures Relating to Credit Risk Generally, credit risk is the risk that an issuer of an investment will not fulfill its obligation to the holder of the investment. This is measured by the assignment of a rating by a nationally recognized statistical rating organization. Presented below is the minimum rating required by (where applicable) the California Government Code, the City’s investment policy, or debt agreements, and the actual rating as of year-end for each investment type.
Minimum
legal TotalInvestment Type rating Not Rated AAA AA A Market Value
U.S. Treasury obligations N/A -$ 14,581,792$ -$ -$ 14,581,792$ U.S. government sponsored enterprise securities N/A - - 29,467,534 - 29,467,534 Corporate bonds A - 3,441,612 10,965,771 9,845,513 24,252,896 Money market mutual funds N/A 125,508 - - - 125,508 California local agency investment fund N/A 23,472,956 - - - 23,472,956 Cash and investments with fiscal agents:
Money market mutual funds N/A 19,015,822 - - - 19,015,822 U.S. Treasury obligations N/A - 2,370,304 - - 2,370,304 U.S. government sponsored enterprise securities N/A - - 7,062,404 - 7,062,404 Corporate Bonds A - - 543,432 - 543,432
Total 42,614,286$ 20,393,708$ 48,039,141$ 9,845,513$ 120,892,648$
Rating as of Year-End
Custodial Credit Risk
The custodial credit risk for deposits is the risk that, in the event of the failure of a depository financial institution, a government will not be able to recover deposits or will not be able to recover collateral securities that are in the possession of an outside party. The custodial credit risk for investments is the risk that, in the event of the failure of the counterparty to a transaction, a government will not be able to recover the value of investment or collateral securities that are in the possession of an outside party. The City uses a third party investment manager to manage their investments. The third party investment manager has authority from City Council to execute purchases and sales of investments according to the parameters in their investment policy without the approval of management.
52

CITY OF BREA NOTES TO THE BASIC FINANCIAL STATEMENTS (CONTINUED) FOR THE YEAR ENDED JUNE 30, 2012
Note 3: Cash and Investments (Continued) Concentration of Credit Risk
The City’s investment policy imposes restrictions for certain types of investments with any one issuer. In addition, GASB 40 requires a separate disclosure if any single issuer comprises more than 5% of the total investment value. Investments in any one issuer that represents 5% or more of the total City’s investments are as follows:
Issuer Investment Type Amount
FFCB U.S. Government Sponsored Enterprise Securities 6,675,091$ FHLB U.S. Government Sponsored Enterprise Securities 7,716,306 FHLMC U.S. Government Sponsored Enterprise Securities 11,607,287 FNMA U.S. Government Sponsored Enterprise Securities 10,531,254
Interest Rate Risk The City's investment policy limits investment maturities as a means of managing its exposure to fair value losses arising from increasing interest rates. The City’s investment policy states that at least 25% of the City’s portfolio will mature in one year or less. The only exception to these maturity limits will be the investment for the bond proceeds for the Reserve Fund, and funded/ capitalized interest fund. The City has elected to use the segmented time distribution method of disclosure for its interest rate risk.
As of June 30, 2012, the City had the following investments and original maturities:
12 months 13 to 24 25 to 60 Totalor less Months Months Market Value
U.S. Treasury obligations 4,516,172$ -$ 10,065,620$ 14,581,792$ U.S. government sponsored enterprise securities 7,523,878 6,084,239 15,859,417 29,467,534 Corporate bonds 8,084,129 7,846,613 8,322,154 24,252,896 Money market mutual funds 125,508 - - 125,508 California local agency investment fund 23,472,956 23,472,956 Cash and investments with fiscal agents:
Money market mutual funds 19,015,822 - - 19,015,822 U.S. Treasury obligations - - 2,370,304 2,370,304 U.S. government sponsored enterprise securities - 316,292 6,746,112 7,062,404 Corporate Bonds 543,432 - - 543,432
63,281,897$ 14,247,144$ 43,363,607$ 120,892,648$
Investment Maturities (in Years)
53
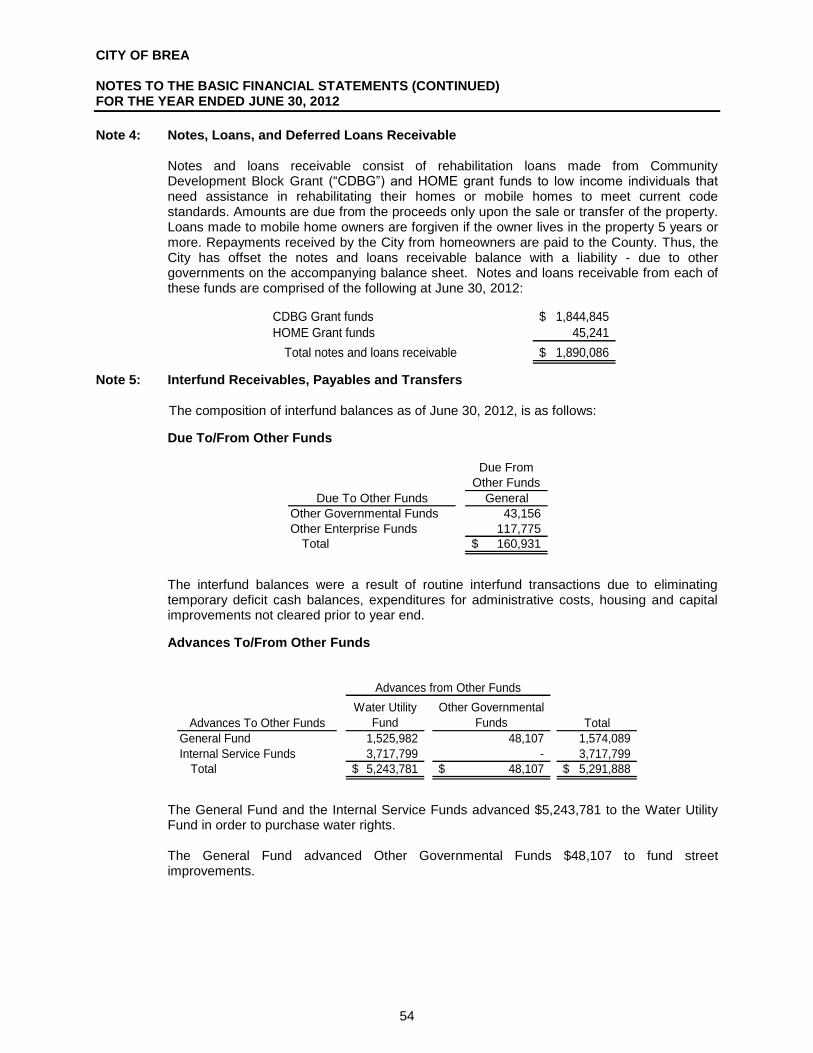
CITY OF BREA NOTES TO THE BASIC FINANCIAL STATEMENTS (CONTINUED) FOR THE YEAR ENDED JUNE 30, 2012
Note 4: Notes, Loans, and Deferred Loans Receivable
Notes and loans receivable consist of rehabilitation loans made from Community Development Block Grant (“CDBG”) and HOME grant funds to low income individuals that need assistance in rehabilitating their homes or mobile homes to meet current code standards. Amounts are due from the proceeds only upon the sale or transfer of the property. Loans made to mobile home owners are forgiven if the owner lives in the property 5 years or more. Repayments received by the City from homeowners are paid to the County. Thus, the City has offset the notes and loans receivable balance with a liability - due to other governments on the accompanying balance sheet. Notes and loans receivable from each of these funds are comprised of the following at June 30, 2012:
CDBG Grant funds 1,844,845$ HOME Grant funds 45,241
Total notes and loans receivable 1,890,086$
Note 5: Interfund Receivables, Payables and Transfers
The composition of interfund balances as of June 30, 2012, is as follows: Due To/From Other Funds
Due From Other Funds
GeneralOther Governmental Funds 43,156 Other Enterprise Funds 117,775
Total 160,931$
Due To Other Funds
The interfund balances were a result of routine interfund transactions due to eliminating temporary deficit cash balances, expenditures for administrative costs, housing and capital improvements not cleared prior to year end.
Advances To/From Other Funds
Water Utility Fund
Other Governmental Funds Total
General Fund 1,525,982 48,107 1,574,089 Internal Service Funds 3,717,799 - 3,717,799
Total 5,243,781$ 48,107$ 5,291,888$
Advances To Other Funds
Advances from Other Funds
The General Fund and the Internal Service Funds advanced $5,243,781 to the Water Utility Fund in order to purchase water rights. The General Fund advanced Other Governmental Funds $48,107 to fund street improvements.
54
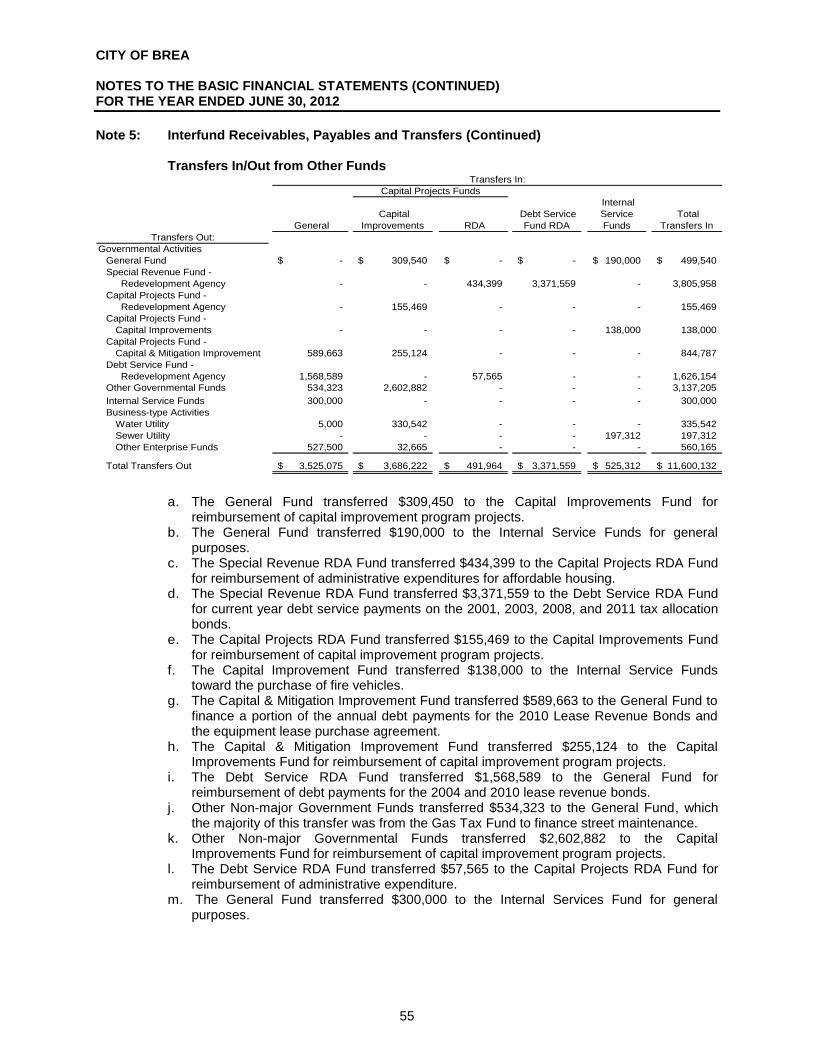
CITY OF BREA NOTES TO THE BASIC FINANCIAL STATEMENTS (CONTINUED) FOR THE YEAR ENDED JUNE 30, 2012
Note 5: Interfund Receivables, Payables and Transfers (Continued)
Transfers In/Out from Other Funds
General Capital
Improvements RDA Debt Service
Fund RDA
Internal Service Funds
Total Transfers In
Governmental ActivitiesGeneral Fund -$ 309,540$ -$ -$ 190,000$ 499,540$ Special Revenue Fund -
Redevelopment Agency - - 434,399 3,371,559 - 3,805,958 Capital Projects Fund -
Redevelopment Agency - 155,469 - - - 155,469 Capital Projects Fund -
Capital Improvements - - - - 138,000 138,000 Capital Projects Fund -
Capital & Mitigation Improvement 589,663 255,124 - - - 844,787 Debt Service Fund -
Redevelopment Agency 1,568,589 - 57,565 - - 1,626,154 Other Governmental Funds 534,323 2,602,882 - - - 3,137,205 Internal Service Funds 300,000 - - - - 300,000 Business-type Activities
Water Utility 5,000 330,542 - - - 335,542 Sewer Utility - - - - 197,312 197,312 Other Enterprise Funds 527,500 32,665 - - - 560,165
Total Transfers Out 3,525,075$ 3,686,222$ 491,964$ 3,371,559$ 525,312$ 11,600,132$
Transfers In:Capital Projects Funds
Transfers Out:
a. The General Fund transferred $309,450 to the Capital Improvements Fund for
reimbursement of capital improvement program projects. b. The General Fund transferred $190,000 to the Internal Service Funds for general
purposes. c. The Special Revenue RDA Fund transferred $434,399 to the Capital Projects RDA Fund
for reimbursement of administrative expenditures for affordable housing. d. The Special Revenue RDA Fund transferred $3,371,559 to the Debt Service RDA Fund
for current year debt service payments on the 2001, 2003, 2008, and 2011 tax allocation bonds.
e. The Capital Projects RDA Fund transferred $155,469 to the Capital Improvements Fund for reimbursement of capital improvement program projects.
f. The Capital Improvement Fund transferred $138,000 to the Internal Service Funds toward the purchase of fire vehicles.
g. The Capital & Mitigation Improvement Fund transferred $589,663 to the General Fund to finance a portion of the annual debt payments for the 2010 Lease Revenue Bonds and the equipment lease purchase agreement.
h. The Capital & Mitigation Improvement Fund transferred $255,124 to the Capital Improvements Fund for reimbursement of capital improvement program projects.
i. The Debt Service RDA Fund transferred $1,568,589 to the General Fund for reimbursement of debt payments for the 2004 and 2010 lease revenue bonds.
j. Other Non-major Government Funds transferred $534,323 to the General Fund, which the majority of this transfer was from the Gas Tax Fund to finance street maintenance.
k. Other Non-major Governmental Funds transferred $2,602,882 to the Capital Improvements Fund for reimbursement of capital improvement program projects.
l. The Debt Service RDA Fund transferred $57,565 to the Capital Projects RDA Fund for reimbursement of administrative expenditure.
m. The General Fund transferred $300,000 to the Internal Services Fund for general purposes.
55

CITY OF BREA NOTES TO THE BASIC FINANCIAL STATEMENTS (CONTINUED) FOR THE YEAR ENDED JUNE 30, 2012
Note 5: Interfund Receivables, Payables and Transfers (Continued)
n. The Water Utility Fund transferred $330,542 to reimburse the Capital Improvements Fund for capital improvement program projects that are not subject to being capitalized.
o. The Other Enterprise Funds transferred $527,500 to the General Fund which the majority of this transfer was from the Sanitation Fund for franchise fees collected from our contract refuse hauling company.
p. The Sewer Utility Fund transferred $197,3012 to the Internal Services Fund for the purchases of a sewer related vehicle.
Note 6: Capital Assets Summary of changes in capital assets for the governmental activities for the year ended June 30, 2012, is as follows:
Beginning Balance Adjustments Transfers Additions Disposals
Ending Balance
Governmental Activities:
Capital assets, not being depreciated: Land 42,603,225$ -$ -$ 2,813,010$ -$ 45,416,235$ Construction-in-progress 4,383,522 42,232 (5,762,433) 3,764,227 - 2,427,548
Total Capital Assets, not being depreciated 46,986,747 42,232 (5,762,433) 6,577,237 - 47,843,783
Capital assets, being depreciated: Structures and improvements 81,274,260 - 2,109,941 106,072 - 83,490,273 Equipment 25,050,394 65,505 - 1,515,606 (2,331,121) 24,300,384 Infrastructure 109,693,709 (149,367) 3,652,492 - - 113,196,834
Total Capital Assets, being depreciated 216,018,363 (83,862) 5,762,433 1,621,678 (2,331,121) 220,987,491
Less accumulated depreciation: Structures and improvements (30,115,362) (92,933) - (2,891,208) - (33,099,503) Equipment (18,068,302) (12,737) - (1,697,953) 2,299,145 (17,479,847) Infrastructure (42,733,115) - - (3,039,378) - (45,772,493) Total Accumulated depreciation (90,916,779) (105,670) - (7,628,539) 2,299,145 (96,351,843)
Total capital assets, being depreciated, net 125,101,584 (189,532) 5,762,433 (6,006,861) (31,976) 124,635,648
Governmental Activities Capital Assets, Net 172,088,331$ (147,300)$ -$ 570,376$ (31,976)$ 172,479,431$
Business-Type Activities:
Capital assets, not being depreciated: Land 2,074,537$ -$ -$ -$ -$ 2,074,537$ Construction-in-progress 4,962,443 (417,106) (2,816,641) 3,457,407 - 5,186,103
Total Capital Assets, not being depreciated 7,036,980 (417,106) (2,816,641) 3,457,407 - 7,260,640
Capital assets, being depreciated: Equipment 368,615 - (33,764) - (41,419) 293,432 Infrastructure 96,187,418 - 2,850,405 - - 99,037,823
Total Capital Assets, being depreciated 96,556,033 - 2,816,641 - (41,419) 99,331,255
Less accumulated depreciation: Equipment (292,264) - - (36,925) 37,971 (291,218) Infrastructure (39,561,267) - - (2,261,159) - (41,822,426)
Total Accumulated depreciation (39,853,531) - - (2,298,084) 37,971 (42,113,644)
Total capital assets, being depreciated, net 56,702,502 - 2,816,641 (2,298,084) (3,448) 57,217,611
Business-Type Activities Capital Assets, Net 63,739,482$ (417,106)$ -$ 1,159,323$ (3,448)$ 64,478,251$
56

CITY OF BREA NOTES TO THE BASIC FINANCIAL STATEMENTS (CONTINUED) FOR THE YEAR ENDED JUNE 30, 2012
Note 6: Capital Assets (Continued)
Depreciation expense was charged to functions/programs of the primary government as follows:
Governmental Activities:City:
General government 1,426,954$ Public safety 570,662 Community development 20,845 Community services 555,430 Public works 4,289,088
Total City 6,862,979 Internal service:
Vehicle maintenance 674,645 Building occupancy 90,915
Total internal service 765,560 Total Govermental Activities 7,628,539$
Business-Type Activities:Water utility 1,959,461$ Sewer utility 335,696 Urban runoff 938 Information Technology External Support 1,989
Total Business-Type Activities 2,298,084$
57

CITY OF BREA NOTES TO THE BASIC FINANCIAL STATEMENTS (CONTINUED) FOR THE YEAR ENDED JUNE 30, 2012
Note 7: Long-Term Debt
a. Governmental Activities Long-Term Debt
A summary of changes in governmental activities long-term debt for the year ended June 30, 2012, is noted below:
Transfer to the
Balance at Successor Balance at Due WithinJuly 1, 2011 Additions Deletions Agency * June 30, 2012 One Year
Tax Allocation Bonds2001 tax allocation refunding bonds, series A 43,435,000$ -$ 2,300,000$ (41,135,000)$ -$ -$ 2003 tax allocation bonds 106,203,304 462,073 4,010,000 (102,655,377) - - 2008 tax allocation bonds, series A 17,305,000 - 740,000 (16,565,000) - - 2008 tax allocation bonds, series B 1,890,000 - 60,000 (1,830,000) - - 2011 tax allocation bonds, series A 18,839,323 653,441 - (19,492,764) - - 2011 taxable tax allocation housing bonds series B 10,295,000 - - (10,295,000) - -
Lease Revenue Bonds2004 lease revenue refunding bonds 3,140,000 - 230,000 (2,910,000) - - 2010 lease revenue bonds 2,760,000 - - - 2,760,000 - 2010 refunding lease revenue bonds 9,460,000 - 865,000 (8,595,000) - -
Capital leases payable 6,106,031 - 944,129 - 5,161,902 502,338
Compensated absences payable 2,897,293 3,852,346 3,785,770 - 2,963,869 2,620,931
Other post employment benefits obligation 2,317,338 1,523,000 697,610 - 3,142,728 -
Claims and Judgments 4,342,063 2,926,186 1,826,837 - 5,441,412 2,289,366
228,990,352$ 9,417,046$ 15,459,346$ (203,478,141)$ 19,469,911$ 5,412,635$
*As a result of the dissolution of the Redevelopment Agency, indebtedness of the former Redevelopment Agency was transferred to the Successor Agency. See Note 16 for disclosures for indebtedness of the Successor Agency.
Lease Revenue Bonds 2010 Lease Revenue Bonds
The $2,835,000 principal amount of the 2010 Lease Revenue Bonds was issued by the Brea Public Financing Authority in April 2010. The proceeds will be used to finance a portion of the costs of the installation of photovoltaic energy systems and energy efficient improvements on city property. The Authority elected to treat the bonds as “Build America Bonds” under Section 54AA(g)(2) of the Tax Code which made the Authority eligible for cash subsidy payments from the United States Treasury equal to 35% of the interest payable on the bonds. These are referred to as “refundable credits” in the bond indenture and are recorded as intergovernmental revenue in the accompanying basic financial statements. These refundable credits are pledged for the payment of the bonds. Bonds maturing on April 1, 2011 are serial bonds payable in one annual installment of $75,000 bearing interest of 1.31 %. Bonds maturing on April 1, 2030, in the amount of $1,260,000 are term bonds and bear interest at 6.734%. Installments are $380,000, $420,000 and $460,000 and are due in 2028, 2029 and 2030. Bonds maturing on April 1, 2036, in the amount of $1,500,000, are term bonds and bear
58

CITY OF BREA NOTES TO THE BASIC FINANCIAL STATEMENTS (CONTINUED) FOR THE YEAR ENDED JUNE 30, 2012
Note 7: Long-Term Debt (Continued)
interest at 6.884%. Installments range from $165,000 to $510,000 every year from 2031 to 2036.
Bonds are payable from the lease payments to be made by the City of Brea for the leasing of certain real property pursuant to the lease agreement dated April 1, 2010. The required reserve for the 2010 lease revenue bonds is $261,807 As of June 30, 2012, the reserve amount was $269,052. The outstanding balance at June 30, 2012, was $2,760,000.
The debt service schedule of the 2010 Lease Revenue Bonds are as follows:
Fiscal Year Ending June 30 Principal Interest Total
2013 -$ 188,108$ 188,108$ 2014 - 188,108 188,108 2015 - 188,108 188,108 2016 - 188,108 188,108 2017 - 188,108 188,108
2018-2022 - 940,540 940,540 2023-2027 - 940,540 940,540 2028-2032 1,935,000 656,276 2,591,276 2033-2037 825,000 148,351 973,351
Total 2,760,000$ 3,626,247$ 6,386,247$
Capital Leases
In March 2007, the City entered into a lease agreement with LaSalle Bank National Association to acquire a computer aided dispatch and records management system in the police department. Per the lease agreement, the semi annual payments of $199,371 are due in March and September of each year with the final payment due in March 2012. The outstanding balance was paid off during the year ended June 30, 2012. In November 2008, The City entered into a lease agreement with Hewlett-Packard Financial Services to acquire new computers. Per the lease agreement, the quarterly annual payments of $22,016 are due in March, June, September, and December of each year with the final payment due in December 2012. The outstanding balance at June 30, 2012, was $43,454. In April 2010, the City entered into Equipment Lease Purchase Agreement with Banc of America Leasing & Capital, LLC to finance the Brea Civic and Cultural Center Project, the Brea Community Center Project and Berry Street Reservoir Project. Per the lease agreement, semi annual payments ranging from $11,467 to $492,288 are due in April and October with the final payment due in April 2027. The outstanding balance at June 30, 2012, was $4,215,000.
59

CITY OF BREA NOTES TO THE BASIC FINANCIAL STATEMENTS (CONTINUED) FOR THE YEAR ENDED JUNE 30, 2012
Note 7: Long-Term Debt (Continued)
In February 2006, the City entered into a lease agreement with LaSalle National Leasing Corporation to acquire new energy management equipment. Per the lease agreement, the semi annual payments of $87,091 are due in February and August of each year with the final payment due in February 2018. The outstanding balance at June 30, 2012 was $903,448. The gross amount of assets acquired through capital lease is as follows:
Land 924,850$ Equipment 9,549,414
Total 10,474,264$
Total capital leases payable outstanding at June 30, 2012, was $5,161,902. The debt service schedules of these leases are as follows:
Fiscal Year Ending June 30,2013 815,498$ 2014 775,476 2015 772,866 2016 773,964 2017 488,447
2018-2022 1,921,591 2023-2027 1,960,105
Total minimum lease payments 7,507,947
Less: amount representing interest (2,346,045)
Present value of minimum lease payment 5,161,902$
Compensated Absences
The City's policies relating to compensated absences are described in Note 1. The Governmental Activities’ liability, at June 30, 2012, will be paid in future years from the General Fund, Vehicle Maintenance Fund, and Building Occupancy Fund in amounts of $2,896,165, $31,718 and $35,986, respectively. Total compensated absences at June 30, 2012, were $2,963,869.
Other Post Employment Benefits Obligation
Other post employment benefits obligation will be repaid in future years from the general fund. See Note 9 for more information. The amount of other post employment benefits obligation at June 30, 2012, was $3,142,728.
60

CITY OF BREA NOTES TO THE BASIC FINANCIAL STATEMENTS (CONTINUED) FOR THE YEAR ENDED JUNE 30, 2012
Note 7: Long-Term Debt (Continued)
b. Business-Type Activities Long-Term Debt
A summary of changes in business-type activities long-term debt for the year ended June 30, 2012, is noted below:
Balance at Balance at Due Within
July 1, 2011 Additions Deletions June 30, 2012 One Year
Compensated absences payable 166,562$ 319,503$ (270,308)$ 215,757$ 161,818$ 2009 Water Revenue Bonds 25,465,000 - (495,000) 24,970,000 510,000 2010 Water Revenue Bonds 12,295,000 - - 12,295,000 430,000
Totals 37,926,562 319,503 (765,308) 37,480,757 1,101,818
Bond discount (350,244) 14,858 - (335,386) - Bond premium 98,470 - (19,694) 78,776 - Loss on advance refunding (1,638,040) 163,805 - (1,474,235) -
Total long-term debt 36,036,748$ 498,166$ (785,002)$ 35,749,912$ 1,101,818$
Compensated Absences
The City's policies relating to compensated absences are described in Note 1. This liability at June 30, 2012, will be paid in future years by the enterprise funds. Total compensated absences at June 30, 2012, were $215,757.
Water Revenue Bonds Payable 2009 Water Revenue Bonds
In May of 2009, the Brea Public Financing Authority issued $25,800,000 of 2009 Water Revenue Bonds structured into two series. The $12,855,000 2009 Water Revenue Refunding Bond Series A and the $12,945,000 2009 Water Revenue Bonds, Series B. The proceeds from Series A bonds was used to current refund all of the remaining outstanding 1998 Water Revenue Bonds and proceeds from the Series B Bonds financed the acquisition of additional water rights and various capital projects relating to the Water System. Proceeds were also used to fund a debt service reserve fund and pay cost of issuance expenses.
Series A bonds consist of $12,855,000 serial bonds and term bonds. Bonds maturing in the years 2010 through 2027 are serial bonds payable in annual installments of $335,000 to $885,000 and bear interest at 2.0% to 4.75%. Bonds maturing July 1, 2029, in the amount of $1,375,000 are term bonds and bear interest at 4.75%. Series B bonds consist of $12,945,000 term bonds. Bonds mature from 2029 through 2039 in annual installments of $525,000 to $1,495,000 and bear interest at 6.75%. The required reserve for the 2009 Water Revenue Bonds is $1,869,075. As of June 30, 2012, the reserve was $1,950,227 being held in the Water Fund of the City of Brea. The outstanding balance at June 30, 2012, was $24,970,000.
61
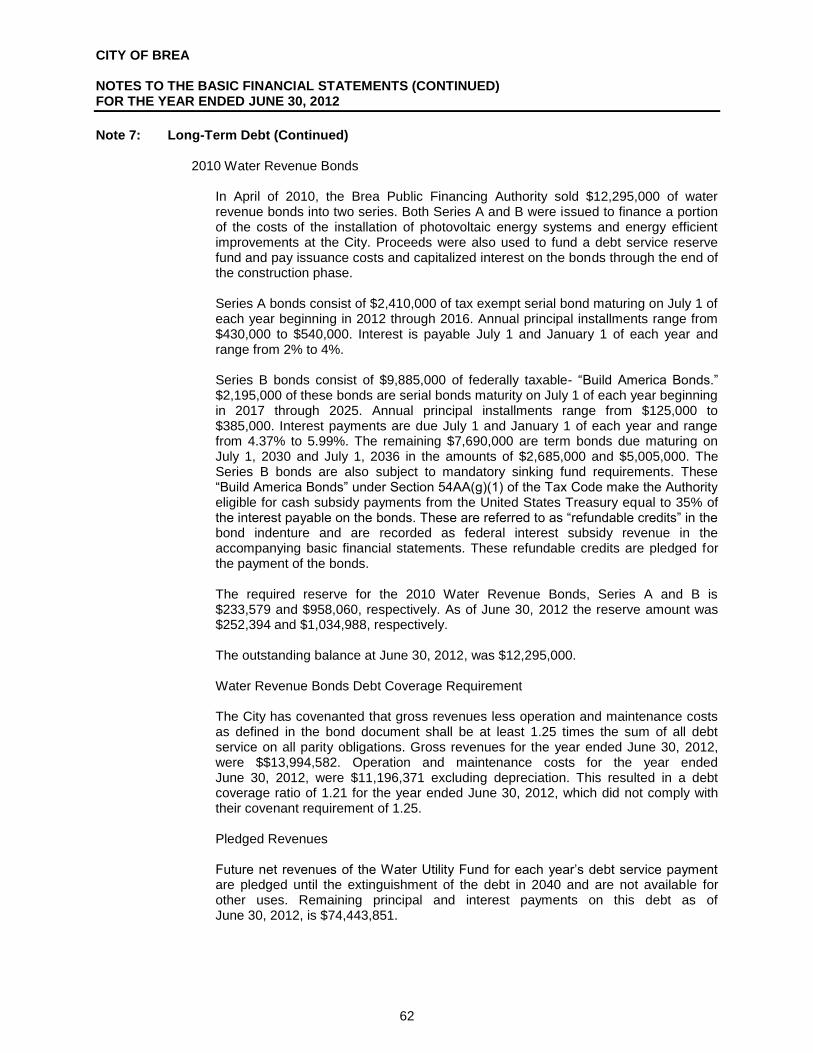
CITY OF BREA NOTES TO THE BASIC FINANCIAL STATEMENTS (CONTINUED) FOR THE YEAR ENDED JUNE 30, 2012
Note 7: Long-Term Debt (Continued) 2010 Water Revenue Bonds
In April of 2010, the Brea Public Financing Authority sold $12,295,000 of water revenue bonds into two series. Both Series A and B were issued to finance a portion of the costs of the installation of photovoltaic energy systems and energy efficient improvements at the City. Proceeds were also used to fund a debt service reserve fund and pay issuance costs and capitalized interest on the bonds through the end of the construction phase. Series A bonds consist of $2,410,000 of tax exempt serial bond maturing on July 1 of each year beginning in 2012 through 2016. Annual principal installments range from $430,000 to $540,000. Interest is payable July 1 and January 1 of each year and range from 2% to 4%. Series B bonds consist of $9,885,000 of federally taxable- “Build America Bonds.” $2,195,000 of these bonds are serial bonds maturity on July 1 of each year beginning in 2017 through 2025. Annual principal installments range from $125,000 to $385,000. Interest payments are due July 1 and January 1 of each year and range from 4.37% to 5.99%. The remaining $7,690,000 are term bonds due maturing on July 1, 2030 and July 1, 2036 in the amounts of $2,685,000 and $5,005,000. The Series B bonds are also subject to mandatory sinking fund requirements. These “Build America Bonds” under Section 54AA(g)(1) of the Tax Code make the Authority eligible for cash subsidy payments from the United States Treasury equal to 35% of the interest payable on the bonds. These are referred to as “refundable credits” in the bond indenture and are recorded as federal interest subsidy revenue in the accompanying basic financial statements. These refundable credits are pledged for the payment of the bonds. The required reserve for the 2010 Water Revenue Bonds, Series A and B is $233,579 and $958,060, respectively. As of June 30, 2012 the reserve amount was $252,394 and $1,034,988, respectively. The outstanding balance at June 30, 2012, was $12,295,000. Water Revenue Bonds Debt Coverage Requirement
The City has covenanted that gross revenues less operation and maintenance costs as defined in the bond document shall be at least 1.25 times the sum of all debt service on all parity obligations. Gross revenues for the year ended June 30, 2012, were $$13,994,582. Operation and maintenance costs for the year ended June 30, 2012, were $11,196,371 excluding depreciation. This resulted in a debt coverage ratio of 1.21 for the year ended June 30, 2012, which did not comply with their covenant requirement of 1.25. Pledged Revenues Future net revenues of the Water Utility Fund for each year’s debt service payment are pledged until the extinguishment of the debt in 2040 and are not available for other uses. Remaining principal and interest payments on this debt as of June 30, 2012, is $74,443,851.
62

CITY OF BREA NOTES TO THE BASIC FINANCIAL STATEMENTS (CONTINUED) FOR THE YEAR ENDED JUNE 30, 2012
Note 7: Long-Term Debt (Continued)
The debt service schedules of these Water Revenue Bonds are as follows:
Fiscal Year Ending June 30 Principal Interest Total
2013 940,000$ 2,053,051$ 2,993,051$ 2014 975,000 2,030,026 3,005,026 2015 1,015,000 2,003,651 3,018,651 2016 1,060,000 1,970,507 3,030,507 2017 1,110,000 1,930,613 3,040,613
2018-2022 4,075,000 9,155,661 13,230,661 2023-2027 5,625,000 8,078,535 13,703,535 2028-2032 7,830,000 6,258,612 14,088,612 2033-2037 10,330,000 3,254,213 13,584,213 2038-2042 4,305,000 443,982 4,748,982
Total 37,265,000$ 37,178,851$ 74,443,851$
c. Debt Without Government Commitment Assessment District Bonds
The special assessment bonds are secured by valid assessment liens upon certain lands within the special assessment district and are not direct liabilities of the City and, accordingly, are not included in the accompanying general purpose financial statements. The City has no obligation beyond the balances in the designated agency funds for any delinquent assessment district bond payments. If delinquencies occur beyond the amounts held in the reserve funds created from bond proceeds, the City has no duty to pay the delinquency out of any available funds of the City. Neither the full faith and credit nor taxing power of the City is pledged to the payment of the bonds. The City acts solely as an agent for those paying assessments and for the bondholders. In December 1997, the City issued for and on behalf of the Community Facilities District No. 1996-1 (Downtown Brea Public Improvements) $3,235,000 aggregate principal amount of 1997 Special Tax Bonds to finance the acquisition of certain public improvements with appurtenant work and incidental expenses within the District. The Bonds were issued pursuant to the Mello-Roos Community Facilities Act of 1982 and are payable from proceeds of annual special tax levied on property within the District. Bonds maturing in the years 1999 to 2012 are serial bonds payable in annual installments of $60,000 to $145,000 while bonds maturing in the year 2016, in the amount of $670,000, and in the year 2021, in the amount of $1,095,000 are term bonds. The interest rates on the bonds range from 4.20% to 6.00%. The outstanding balance at June 30, 2012, was $1,910,000.
In December 1999, the City borrowed for and on behalf of the Community Facilities District No. 1990-1 (Imperial Center East) $1,478,000 principal amount of 1999 Special Tax Refunding Note to current refund the District's 1990 Special Tax Bonds. The money borrowed was pursuant to the Mello-Roos Community Facilities Act of 1982 and is payable from the proceeds of an annual special tax levied on the property within the District. The note matures from 2000 to 2015, with annual installments ranging from $99,000 to $122,000 per year. The interest rate on the note is 5.780%. The outstanding balance at June 30, 2012, was $463,000.
63

CITY OF BREA NOTES TO THE BASIC FINANCIAL STATEMENTS (CONTINUED) FOR THE YEAR ENDED JUNE 30, 2012
Note 7: Long-Term Debt (Continued)
In September 2003, the City issued for and on In behalf of the Community Facilities District No. 1988-1 (Fairway Center) $2,580,000 aggregate principal amount of 2003 Special Tax Refunding Bonds to current refund in full the Community Facilities District No. 1988-1 (Fairway Center) 1997 Special Tax Refunding Bonds. The bonds were issued pursuant to the Mello-Roos Community Facilities Act of 1982 and are payable from the proceeds of an annual special tax levied on property within the District. The bonds mature from 2004 through 2026, with annual installments ranging from $65,000 to $190,000 per year. The interest rates on the bonds range from 1.75% to 6.10%. The outstanding balance at June 30, 2012, was $1,990,000. In June 2005, the Brea Public Financing Authority issued $15,405,000 Brea Public Financing Authority 2005 Series A Local Agency Revenue Bonds for and on behalf of the City of Brea Community Facilities District No. 1997-1 (Olinda Heights Public Improvements) and the Brea Olinda Unified School District Community Facilities District No. 95-1 (Olinda Heights). The Brea Olinda Unified School District Community Facilities District Bonds are not part of the City; therefore, additional information is not provided. $6,665,000 of the City of Brea Community Facilities District Bonds were to current refund in full of the Community facilities District No. 1997-1 (Olinda Heights Public Improvements) 1998 Special Tax Bonds. The bonds were issued pursuant to the Mello-Roos Community Facilities Act of 1982, and are payable from the proceeds of annual special tax to be levied on property. The bonds mature from 2006 to 2024, with annual installments ranging from $385,000 to $715,000 per year. The interest rates on the bonds range from 2.500% to 4.125%. The outstanding balance at June 30, 2012, was $5,400,000. In December 2009, the City of Brea on behalf of the City of Brea Community Facilities District No. 2008- 2 issued $8,145,000 in bonds known as the Brea Plaza Area Public Improvements 2009 Special Tax Bonds to finance acquisition and construction of certain public capital improvements in Brea Plaza. Proceeds will also be used to pay administrative expenses of the Community Facilities District, bond issuance costs, and capitalized interest on the bonds through the end of the construction. These bonds are not obligations of the City and will be paid solely from special tax revenues levied on certain property within the Community Facilities District. The bonds mature from 2012 to 2039, with annual installments including sinking fund requirements range from $50,000 to $765,000 per year. The interest rates on the bonds range from 4% to 7%. The outstanding balance at June 30, 2012, was $8,145,000.
Multifamily Housing Revenue Bonds
In July 2010, the Agency on behalf of Tonner Hills Housing Partners, LP (the “Borrower”), was authorized to issue $5,858,319 and $7,741,681 Brea Redevelopment Agency Multifamily Housing Revenue Bonds (Tonner Hills Apartment Homes) 2010 Series A-1 and A-2, respectively, for the purpose of providing funding necessary for the acquisition, construction and equipping of a 94-unit multifamily rental housing project in the City. The Agency and the Borrower also entered into a non-interest bearing loan agreement in amount of $1,200,000 (See Note 3). These bonds are not the obligations of the Agency and will be paid solely from future rent revenue. The outstanding balance is determined when a construction draw
64

CITY OF BREA NOTES TO THE BASIC FINANCIAL STATEMENTS (CONTINUED) FOR THE YEAR ENDED JUNE 30, 2012
Note 7: Long-Term Debt (Continued)
requisition is submitted to the bank for payment, limited up to the authorized amounts for each of the series. Currently, the bonds are only paying interest to bondholder for debt service payment. When the bonds are converted, then the Borrower will pay principal and interest per bond conversion. The outstanding balance at June 30, 2012, was $1,376,810 and $0 for Series A-1 and Series A-2, respectively.
Note 8: Defined Benefit Pension Plan Plan Description The City of Brea contributes to the California Public Employees Retirement System (“PERS”), an agent multiple-employer public employee defined benefit pension plan. PERS provides retirement and disability benefits, annual cost-of-living adjustments and death benefits to plan members and beneficiaries. PERS acts as a common investment and administrative agent for participating public entities within the State of California. Benefit provisions and all other requirements are established by state statutes and City ordinance. Copies of PERS' annual financial report may be obtained from their executive office: 400 P Street, Sacramento, California 95814. Funding Policy Participants are required to contribute 7% (9% for safety employees) of their annual covered salary. As of July 1, 2011, employees covered under the miscellaneous plan and the safety plan were required to contribute 1.125% and 2.250%, respectively, of the required employee contributions. The City contributes the remaining employee portions on behalf of employees covered under the safety and miscellaneous plans of 5.875%, and 6.750%, respectively. For the year ended June 30, 2012, the amount contributed by the City on behalf of the employees was $2,426,214. The City is required to contribute at an actuarially determined rate calculated as a percentage of covered payroll. The employer’s required contribution rate for the year ended June 30, 2012, was 11.219% for miscellaneous employees and 30.347% for safety employees. Separately funded plans have been established for each employee group. Benefit provisions and all other requirements are established by state statute and City contract with employee bargaining groups. Required Contribution For the year ended June 30, 2012, the City's annual pension cost (employer contribution) of $4,588,911 for safety and $1,673,190 for miscellaneous employees was equal to the City's required and actual contributions. The required contribution was determined as part of the June 30, 2009, actuarial valuation using the entry age normal actuarial cost method.
65

CITY OF BREA NOTES TO THE BASIC FINANCIAL STATEMENTS (CONTINUED) FOR THE YEAR ENDED JUNE 30, 2012
Note 8: Defined Benefit Pension Plan (Continued)
A summary of principle assumptions and methods used to determine the annual required contribution is shown below:
Valuation Date June 30, 2009Actuarial Cost Method Entry Age Normal Cost MethodAmortization Method Level Percent of PayrollAverage Remaining Period 22 Years as of the Valuation Date
for Miscellaneous Employees29 Years as of the Valuation Date for Safety Employees
Asset Valuation Method 15 Year Smoothed MarketActurial Assumptions
Investment Rate of Return 7.75% (net of administrative expense)Projected Salary Increases 3.55% to 14.45% depending on age, service
and type of employmentInflation 3.00%Payroll Growth 3.25%Individual Salary Growth A merit scale varying by duration of
employment coupled with an assumed annual inflation component of 3.00% and an annual production growth of 0.25%
Initial unfunded liabilities are amortized over a closed period that depends on the plan's date of entry into CalPERS. Subsequent plan amendments are amortized as a level percent of pay over a closed 20-year period. Gains and losses that occur in the operation of the plan are amortized over a 30 year rolling period, which results in an amortization of 6% of unamortized gains and losses each year. If the plan's accrued liability exceeds the actuarial value of plan assets, the amortization payment on the total unfunded liability may not be lower than the payment calculated over a 30-year amortization period.
Fiscal Net PensionYear Obligation
6/30/2010 3,814,056$ -$ 6/30/2011 3,905,652 - 6/30/2012 4,588,912 -
Safety Plan
100%100%100%
Annual Pension Cost (APC)(Employer Contribution)
Three-Year Trend InformationPercentage of
APC Contributed
Fiscal Net PensionYear Obligation
6/30/2010 1,365,462$ -$ 6/30/2011 1,404,049 - 6/30/2012 1,673,190 -
Miscellaneous Plan
100%100%100%
Annual Pension Cost (APC)(Employer Contribution)
Three-Year Trend InformationPercentage of
APC Contributed
66
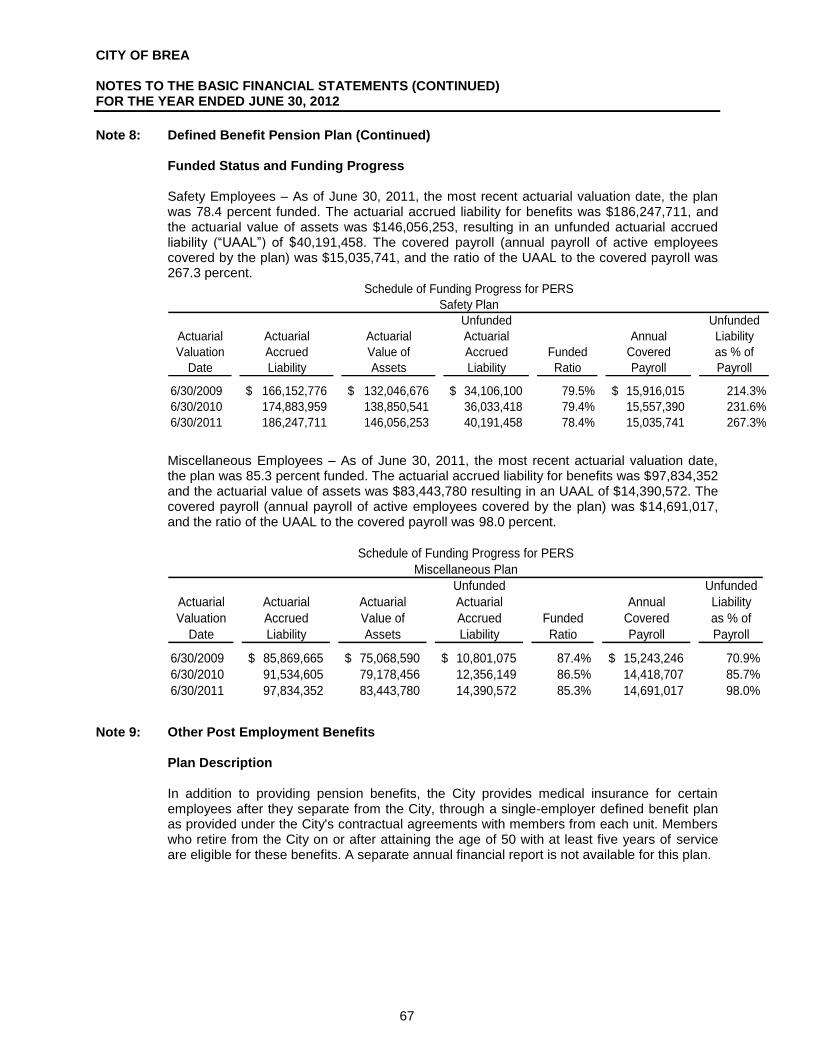
CITY OF BREA NOTES TO THE BASIC FINANCIAL STATEMENTS (CONTINUED) FOR THE YEAR ENDED JUNE 30, 2012
Note 8: Defined Benefit Pension Plan (Continued)
Funded Status and Funding Progress Safety Employees – As of June 30, 2011, the most recent actuarial valuation date, the plan was 78.4 percent funded. The actuarial accrued liability for benefits was $186,247,711, and the actuarial value of assets was $146,056,253, resulting in an unfunded actuarial accrued liability (“UAAL”) of $40,191,458. The covered payroll (annual payroll of active employees covered by the plan) was $15,035,741, and the ratio of the UAAL to the covered payroll was 267.3 percent.
Unfunded UnfundedActuarial Actuarial Actuarial Actuarial Annual LiabilityValuation Accrued Value of Accrued Funded Covered as % of
Date Liability Assets Liability Ratio Payroll Payroll
6/30/2009 166,152,776$ 132,046,676$ 34,106,100$ 79.5% 15,916,015$ 214.3%6/30/2010 174,883,959 138,850,541 36,033,418 79.4% 15,557,390 231.6%6/30/2011 186,247,711 146,056,253 40,191,458 78.4% 15,035,741 267.3%
Schedule of Funding Progress for PERSSafety Plan
Miscellaneous Employees – As of June 30, 2011, the most recent actuarial valuation date, the plan was 85.3 percent funded. The actuarial accrued liability for benefits was $97,834,352 and the actuarial value of assets was $83,443,780 resulting in an UAAL of $14,390,572. The covered payroll (annual payroll of active employees covered by the plan) was $14,691,017, and the ratio of the UAAL to the covered payroll was 98.0 percent.
Unfunded UnfundedActuarial Actuarial Actuarial Actuarial Annual LiabilityValuation Accrued Value of Accrued Funded Covered as % of
Date Liability Assets Liability Ratio Payroll Payroll
6/30/2009 85,869,665$ 75,068,590$ 10,801,075$ 87.4% 15,243,246$ 70.9%6/30/2010 91,534,605 79,178,456 12,356,149 86.5% 14,418,707 85.7%6/30/2011 97,834,352 83,443,780 14,390,572 85.3% 14,691,017 98.0%
Schedule of Funding Progress for PERSMiscellaneous Plan
Note 9: Other Post Employment Benefits
Plan Description In addition to providing pension benefits, the City provides medical insurance for certain employees after they separate from the City, through a single-employer defined benefit plan as provided under the City's contractual agreements with members from each unit. Members who retire from the City on or after attaining the age of 50 with at least five years of service are eligible for these benefits. A separate annual financial report is not available for this plan.
67

CITY OF BREA NOTES TO THE BASIC FINANCIAL STATEMENTS (CONTINUED) FOR THE YEAR ENDED JUNE 30, 2012
Note 9: Other Post Employment Benefits (Continued) Funding Policy Currently the City funds retiree healthcare benefits on a pay-as-you-go basis, paying a maximum of $350 per month for retiree benefits from the City funds as they are due with no pre-funding for future years. The City recognizes expenditure for its share of the annual premiums as these benefits become due. For fiscal year ended June 30, 2012, the City paid $697,610 for benefits of 194 retired employees. Annual OPEB Cost and Net OPEB Obligation The City’s annual other post-employment benefit (“OPEB”) cost is calculated based on the annual required contribution of the employer (“ARC”), an amount actuarially determined in accordance with the parameters of GASB Statement 45. The ARC represents a level of funding that, if paid on an ongoing basis, is projected to cover normal cost each year and amortize any unfunded actuarial liabilities over a period not to exceed thirty years. The following table shows the components of the City’s annual OPEB cost for the year, the amount actually contributed to the plan, and changes in the City’s net OPEB obligation:
Annual required contribution (ARC) 1,617,000$ Interest on net pension obligation 91,000 Adjustment to ARC (185,000)
Annual OPEB cost 1,523,000 Contribution made 697,610
Increase (decrease) in net OPEB obligation 825,390 Net OPEB obligation - July 1, 2011 2,317,338 Net OPEB obligation - June 30, 2012 3,142,728$
The City’s annual OPEB cost, the percentage of annual OPEB cost contributed to the plan, and the net OPEB obligation for the year ended June 30, 2012, and the two preceding years were as follows:
Fiscal Annual OPEB OPEB CostYear Cost Contributed
6/30/2010 1,852,913$ 653,442$ 35.27% 1,687,247$ 6/30/2011 1,447,000 816,909 56.46% 2,317,338 6/30/2012 1,523,000 697,610 45.80% 3,142,728
Percentage of Annual OPEB Cost
ContributedNet OPEB Obligation
Funded Status and Funding Progress The required contribution is based on projected pay-as-you-go financing requirements with additional amount to prefund benefits as determined annually by the City under an actuarial valuation.
68
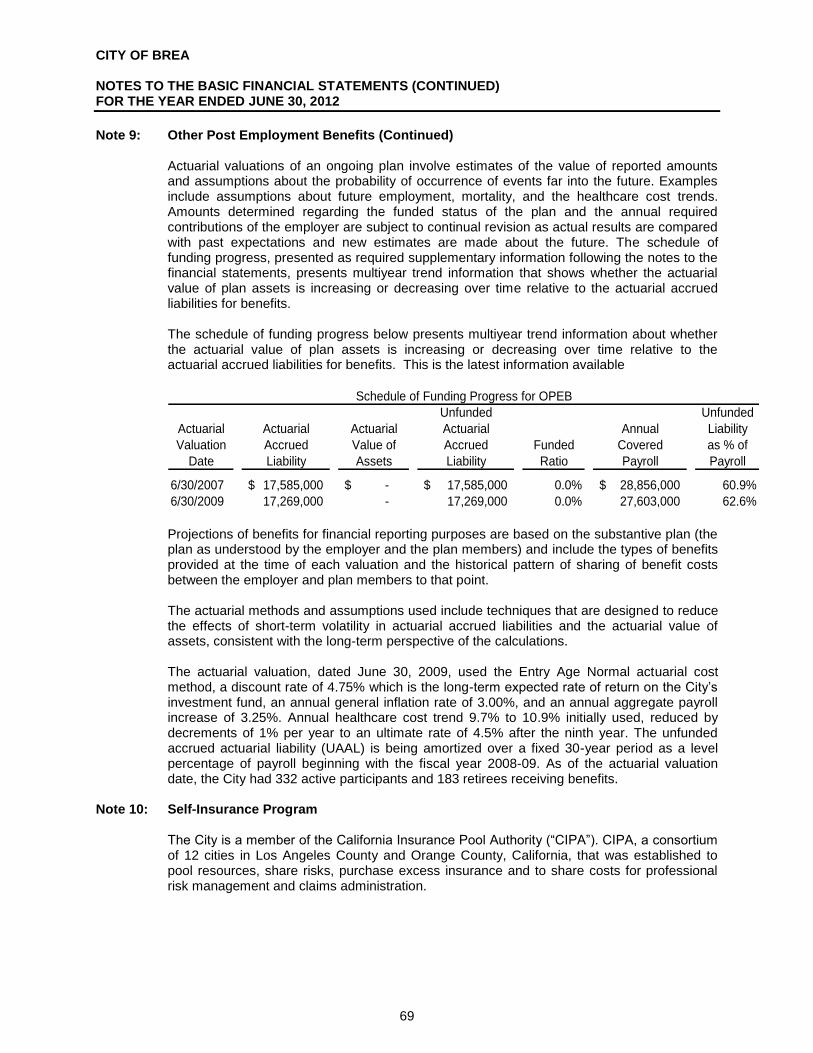
CITY OF BREA NOTES TO THE BASIC FINANCIAL STATEMENTS (CONTINUED) FOR THE YEAR ENDED JUNE 30, 2012
Note 9: Other Post Employment Benefits (Continued) Actuarial valuations of an ongoing plan involve estimates of the value of reported amounts and assumptions about the probability of occurrence of events far into the future. Examples include assumptions about future employment, mortality, and the healthcare cost trends. Amounts determined regarding the funded status of the plan and the annual required contributions of the employer are subject to continual revision as actual results are compared with past expectations and new estimates are made about the future. The schedule of funding progress, presented as required supplementary information following the notes to the financial statements, presents multiyear trend information that shows whether the actuarial value of plan assets is increasing or decreasing over time relative to the actuarial accrued liabilities for benefits. The schedule of funding progress below presents multiyear trend information about whether the actuarial value of plan assets is increasing or decreasing over time relative to the actuarial accrued liabilities for benefits. This is the latest information available
Unfunded UnfundedActuarial Actuarial Actuarial Actuarial Annual LiabilityValuation Accrued Value of Accrued Funded Covered as % of
Date Liability Assets Liability Ratio Payroll Payroll
6/30/2007 17,585,000$ -$ 17,585,000$ 0.0% 28,856,000$ 60.9%6/30/2009 17,269,000 - 17,269,000 0.0% 27,603,000 62.6%
Schedule of Funding Progress for OPEB
Projections of benefits for financial reporting purposes are based on the substantive plan (the plan as understood by the employer and the plan members) and include the types of benefits provided at the time of each valuation and the historical pattern of sharing of benefit costs between the employer and plan members to that point. The actuarial methods and assumptions used include techniques that are designed to reduce the effects of short-term volatility in actuarial accrued liabilities and the actuarial value of assets, consistent with the long-term perspective of the calculations. The actuarial valuation, dated June 30, 2009, used the Entry Age Normal actuarial cost method, a discount rate of 4.75% which is the long-term expected rate of return on the City’s investment fund, an annual general inflation rate of 3.00%, and an annual aggregate payroll increase of 3.25%. Annual healthcare cost trend 9.7% to 10.9% initially used, reduced by decrements of 1% per year to an ultimate rate of 4.5% after the ninth year. The unfunded accrued actuarial liability (UAAL) is being amortized over a fixed 30-year period as a level percentage of payroll beginning with the fiscal year 2008-09. As of the actuarial valuation date, the City had 332 active participants and 183 retirees receiving benefits.
Note 10: Self-Insurance Program
The City is a member of the California Insurance Pool Authority (“CIPA”). CIPA, a consortium of 12 cities in Los Angeles County and Orange County, California, that was established to pool resources, share risks, purchase excess insurance and to share costs for professional risk management and claims administration.
69
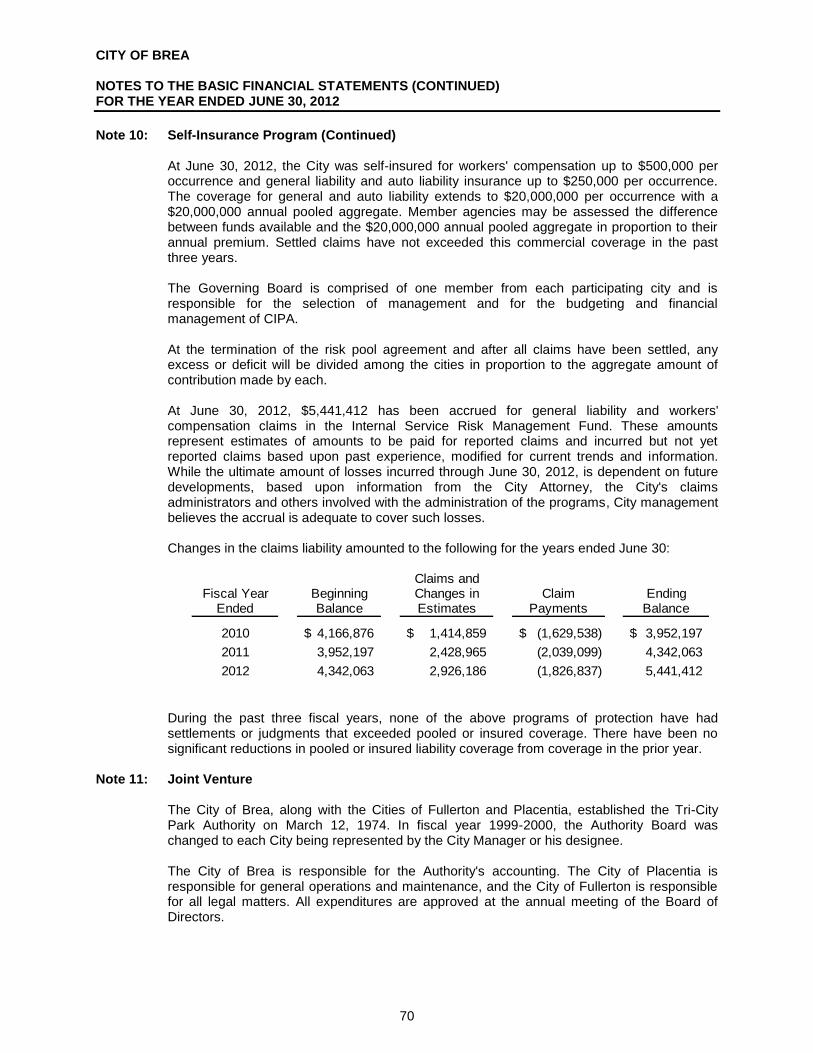
CITY OF BREA NOTES TO THE BASIC FINANCIAL STATEMENTS (CONTINUED) FOR THE YEAR ENDED JUNE 30, 2012
Note 10: Self-Insurance Program (Continued) At June 30, 2012, the City was self-insured for workers' compensation up to $500,000 per occurrence and general liability and auto liability insurance up to $250,000 per occurrence. The coverage for general and auto liability extends to $20,000,000 per occurrence with a $20,000,000 annual pooled aggregate. Member agencies may be assessed the difference between funds available and the $20,000,000 annual pooled aggregate in proportion to their annual premium. Settled claims have not exceeded this commercial coverage in the past three years.
The Governing Board is comprised of one member from each participating city and is responsible for the selection of management and for the budgeting and financial management of CIPA. At the termination of the risk pool agreement and after all claims have been settled, any excess or deficit will be divided among the cities in proportion to the aggregate amount of contribution made by each. At June 30, 2012, $5,441,412 has been accrued for general liability and workers' compensation claims in the Internal Service Risk Management Fund. These amounts represent estimates of amounts to be paid for reported claims and incurred but not yet reported claims based upon past experience, modified for current trends and information. While the ultimate amount of losses incurred through June 30, 2012, is dependent on future developments, based upon information from the City Attorney, the City's claims administrators and others involved with the administration of the programs, City management believes the accrual is adequate to cover such losses. Changes in the claims liability amounted to the following for the years ended June 30:
Claims andFiscal Year Beginning Changes in Claim Ending
Ended Balance Estimates Payments Balance
2010 4,166,876$ 1,414,859$ (1,629,538)$ 3,952,197$ 2011 3,952,197 2,428,965 (2,039,099) 4,342,063 2012 4,342,063 2,926,186 (1,826,837) 5,441,412
During the past three fiscal years, none of the above programs of protection have had settlements or judgments that exceeded pooled or insured coverage. There have been no significant reductions in pooled or insured liability coverage from coverage in the prior year.
Note 11: Joint Venture The City of Brea, along with the Cities of Fullerton and Placentia, established the Tri-City Park Authority on March 12, 1974. In fiscal year 1999-2000, the Authority Board was changed to each City being represented by the City Manager or his designee. The City of Brea is responsible for the Authority's accounting. The City of Placentia is responsible for general operations and maintenance, and the City of Fullerton is responsible for all legal matters. All expenditures are approved at the annual meeting of the Board of Directors.
70

CITY OF BREA NOTES TO THE BASIC FINANCIAL STATEMENTS (CONTINUED) FOR THE YEAR ENDED JUNE 30, 2012
Note 11: Joint Venture (Continued)
The Tri-City Park Authority prepares an annual budget, which is submitted for approval to each of the three cities. Each city's share of the annual budget is based on a population formula. The City of Brea has an ongoing financial responsibility equal to 21.6% of Tri-City Park Authority's budget. For the year ended June 30, 2012, this ongoing responsibility amounted to an investment of $815,226, which was a financial benefit for the City. At the termination of the joint venture agreement, the assets of the Tri-City Park Authority will be divided among the three cities in proportion to the aggregate amount of contributions made by each. The financial statements of the Tri-City Park Authority can be obtained at the City of Brea, 1 Civic Center Circle, Brea, CA 92821.
Assets
Current assets 555,965$ Capital assets 3,277,319
Total assets 3,833,284 Liabilities
Current liabilities 59,089 Total liabilities 59,089
Net Assets
Invested in capital assets, net of related debt 3,277,319 Unrestricted 496,876
Total net assets 3,774,195 Total liabilities and net assets 3,833,284$
Statement of Net Assets (Unaudited)
June 30, 2012
Revenues
Intergovernmental 345,440$ Investment income 13,658
Total revenues 359,098
Expenses
Parks and recreation 401,978 Total expenses 401,978
Changes in net assets (42,880)
Net Assets
Beginning of year 3,817,075 End of year 3,774,195$
Statement of Activities (Unaudited)
June 30, 2012
71

CITY OF BREA NOTES TO THE BASIC FINANCIAL STATEMENTS (CONTINUED) FOR THE YEAR ENDED JUNE 30, 2012
Note 12: Fund Balance Classifications
Fund balances in the governmental funds at June 30, 2012, have been classified as follows:
GeneralCapital
Improvements
Capital and Mitigation
Improvement
Other Governmenta
l Funds Total
Nonspendable:
Prepaid items 6,689$ -$ -$ -$ 6,689$ Advances to other funds 1,574,089 - - - 1,574,089
Total nonspendable 1,580,778 - - - 1,580,778
Restricted:
Debt services 301,972 - - - 301,972 Prop 172 272,439 - - - 272,439 COPS 7,800 - - - 7,800
344,272 - - - 344,272 Capital projects - 11,639,078 6,770,195 - 18,409,273 Gas tax - - - 1,316,528 1,316,528 Narcotic enforcement - - - 1,847,310 1,847,310 Air quality improvement - - - 96,063 96,063 Park development - - - 348,622 348,622 Measure M - - - 708,562 708,562 Affordable housing trust - - - 1,807,951 1,807,951 Storm drain - - - 1,136,004 1,136,004
Total restricted 926,483 11,639,078 6,770,195 7,261,040 26,596,796
Committed:
Asset replacement 6,546,809 - - - 6,546,809 Total assigned 6,546,809 - - - 6,546,809
Assigned:
Debt service - - 1,705,413 - 1,705,413 Community center 590,613 - - - 590,613 Redevelopment projects - - - - -
Total assigned 590,613 - 1,705,413 - 2,296,026
Unassigned:
General Fund 21,075,761 - - - 21,075,761 Other Governmental Funds - - - (54,141) (54,141)
Total unassigned 21,075,761 - - (54,141) 21,021,620 Total 30,720,444$ 11,639,078$ 8,475,608$ 7,206,899$ 58,042,029$
Capital Projects Funds
Lighting and maintenance districts
72

CITY OF BREA NOTES TO THE BASIC FINANCIAL STATEMENTS (CONTINUED) FOR THE YEAR ENDED JUNE 30, 2012
Note 13: Construction and Other Significant Commitments The following material construction commitments existed at June 30, 2012:
Project Name Contract Amount
Expenditures to date as of June
30, 2012 Remaining
Commitments
Carbon Canyon Road Waterline Upgrade 842,471$ $ 675,355 167,116$ Sewer Master Plan Upgrade Phase IV 1,091,062 - 1,091,062 Birch Street Median Enhancement Phase I 608,427 - 608,427 Birch Street Median Enhancement Phase II 727,864 - 727,864
Totals 2,594,469$
Note 14: Contingencies
The City is a defendant in several pending lawsuits of a nature common to many similar jurisdictions. City management estimates that the potential claims against the City not covered by insurance resulting from such litigation would not materially affect the financial position of the City. The City incurs various costs under federal and state grant reimbursement programs and records the related revenue and receivables for grant claims. Such grant claims are subject to final audit by federal and state agencies.
Note 15: California Redevelopment Agency Dissolution
On July 18, 2011, the California Redevelopment Association (“CRA”) and the League of California Cities (“League”) filed a petition for writ of mandate with the California Supreme Court, requesting the Court to declare unconstitutional two bills that were passed as part of the 2011-12 State Budget, AB 1X 26 and 27 (California Redevelopment Association v. Matosantos). AB 1X 26 dissolves redevelopment agencies effective October 1, 2011. AB 1X 27 gave redevelopment agencies an option to avoid dissolution if it commits to making defined payments for the benefit of the State, school districts and certain special districts. In 2011-12, these payments amounted to a state-wide total of $1.7 billion. In 2012-13 and subsequent years, the payments totaled $400 million, annually. Each city or county’s share of these payments was determined based on its proportionate share of state-wide tax increment. On August 17, 2011 the Supreme Court issued a stay of the implementation of AB 1X 26 and 27 which allowed a redevelopment agency to continue if it adopted an AB 1X 27 ordinance. However, because of the effect of the stay order, the authority for the Redevelopment Agency to engage in most activities was suspended. The Supreme Court heard oral arguments on November 10, 2011 and on December 29, 2011 announced its decision in California Redevelopment Association v. Matosantos. The court upheld AB 1X 26 which dissolves redevelopment agencies, but invalidated in its entirety AB 1X 27 which allowed redevelopment agencies to continue as long as they made the required payments. AB 1X 26 established deadlines for the process of Redevelopment Agency dissolution and the handling of existing obligations. The full text of AB 1X 26 may be obtained from the California legislative information website maintained by the Legislative Counsel of the State of California at: http://www.leginfo.ca.gov/bilinfo.html.
73
CITY OF BREA NOTES TO THE BASIC FINANCIAL STATEMENTS (CONTINUED) FOR THE YEAR ENDED JUNE 30, 2012
Note 15: California Redevelopment Agency Dissolution (Continued) As of January 31, 2012 the Redevelopment Agency has been dissolved and the City of Brea has elected to become the Successor Agency. The Successor Agency will be responsible for winding down the remaining activities of the dissolved Redevelopment Agency.
Note 16: Successor Agency Trust for Assets of Former Redevelopment Agency
On December 29, 2011, the California Supreme Court upheld Assembly Bill 1X 26 (“the Bill”) that provides for the dissolution of all redevelopment agencies in the State of California. This action impacted the reporting entity of the City of Brea that previously had reported a redevelopment agency within the reporting entity of the City as a blended component unit. The Bill provides that upon dissolution of a redevelopment agency, either the city or another unit of local government will agree to serve as the “successor agency” to hold the assets until they are distributed to other units of state and local government. On August 25, 2011, the City Council elected to become the Successor Agency for the former redevelopment agency in accordance with the Bill as part of City resolution number 2011-085. After enactment of the law, which occurred on June 28, 2011, redevelopment agencies in the State of California cannot enter into new projects, obligations or commitments. Subject to the control of a newly established oversight board, remaining assets can only be used to pay enforceable obligations in existence at the date of dissolution (including the completion of any unfinished projects that were subject to legally enforceable contractual commitments). In future fiscal years, successor agencies will only be allocated revenue in the amount that is necessary to pay the estimated annual installment payments on enforceable obligations of the former redevelopment agency until all enforceable obligations of the prior redevelopment agency have been paid in full and all assets have been liquidated. The Bill directs the State Controller of the State of California to review the propriety of any transfers of assets between redevelopment agencies and other public bodies that occurred after January 1, 2011. If the public body that received such transfers is not contractually committed to a third party for the expenditure or encumbrance of those assets, the State Controller is required to order the available assets to be transferred to the public body designated as the successor agency by the Bill. Management believes, in consultation with legal counsel, that the obligations of the former redevelopment agency due to the City are valid enforceable obligations payable by the successor agency trust under the requirements of the Bill. The City’s position on this issue is not a position of settled law and there is considerable legal uncertainty regarding this issue. It is reasonably possible that a legal determination may be made at a later date by an appropriate judicial authority that would resolve this issue unfavorably to the City. In accordance with the timeline set forth in the Bill (as modified by the California Supreme Court on December 29, 2011) all redevelopment agencies in the State of California were dissolved and ceased to operate as a legal entity as of February 1, 2012. Prior to that date, the final seven months of the activity of the redevelopment agency continued to be reported in the governmental funds of the City. After the date of dissolution, the assets and activities of the dissolved redevelopment agency are reported in a fiduciary fund (private-purpose trust fund) in the financial statements of the City.
74

CITY OF BREA NOTES TO THE BASIC FINANCIAL STATEMENTS (CONTINUED) FOR THE YEAR ENDED JUNE 30, 2012
Note 16: Successor Agency Trust for Assets of Former Redevelopment Agency (Continued) The transfer of the assets and liabilities of the former redevelopment agency as of February 1, 2012 (effectively the same date as January 31, 2012) from governmental funds of the City to fiduciary funds was reported in the governmental funds as an extraordinary loss (or gain) in the governmental fund financial statements. The receipt of these assets and liabilities as of January 31, 2012 was reported in the private-purpose trust fund as an extraordinary gain (or loss). Because of the different measurement focus of the governmental funds (current financial resources measurement focus) and the measurement focus of the trust funds (economic resources measurement focus), the extraordinary loss (gain) recognized in the governmental funds was not the same amount as the extraordinary gain (loss) that was recognized in the fiduciary fund financial statements. The difference between the extraordinary loss recognized in the fund financial statements and the extraordinary gain recognized in the fiduciary fund financial statements is reconciled as follows:
Total extraordinary loss reported in the governmental funds - increase to net assets of the Succesory Agency Trust Fund (82,091,681)$
Long-term debt reported in the government-wide financial statements - decrease to net assets of the Successor Agency Trust Fund 205,012,337
Deferred charges reported in the government-wide financial statement - increase to net assets in the Successor Agency Trust Fund (3,233,702)
Net decrease to net assets of the Successor Agency Trust Fund as a result of initial transfers (equal to amount of extraordinary gain reported in the government-wide financial statements of the City) 119,686,954$
a. Cash and investments
Cash and investments reported in the accompanying financial statements consisted of the following:
Cash and investments 25,271,308$ Restricted cash and investments 1,787,877 Cash and investments with fiscal agent 21,681,771
48,740,956$
b. Loans Receivable
The City through the former redevelopment agency has made long term loans to various developers and organizations to stimulate development in the City and remove blight in designated project areas. In addition, the City through the former redevelopment agency has made several long term loans to low or moderate income individuals to rehabilitate their homes to meet current code standards or to assist them in purchasing a home. Some assistance given gave the City rights to receive “silent seconds” on property when sold to a
75

CITY OF BREA NOTES TO THE BASIC FINANCIAL STATEMENTS (CONTINUED) FOR THE YEAR ENDED JUNE 30, 2012
Note 16: Successor Agency Trust for Assets of Former Redevelopment Agency (Continued) low and moderate income individual. These “silent seconds” gave the City the right to a portion of the proceeds from the sale of the property. In these cases, if the property has been sold by the developer, the Successor Agency has recorded their portion of the proceeds as notes receivable and deferred revenue. Collection terms of these loans vary and range from 5 years to 55 years. The majority of loans made to developers will be repaid from residual receipts from monies earned on the property once they are built. Home buyer assistance loans begin repayment after 5 years and will be repaid over a 30 year period. For the remainder of loans and notes receivable, the Agency has classified fund balance as “nonspendable” indicating that these resources are not current available resources. The outstanding balance of these notes and loans are comprised of the following at June 30, 2012:
Home Buyer Assistance Loans 5,976,478$ Rehabilitation Loans 339,949 Developer/ Organization Loans:
Brea Improv 470,976 Cox Communications -Water’s Edge 127,493 Bonterra Apartments 1,200,000 KDF Communities- Imperial Parks Apartments 2,853,000 Neighborhood Housing Services- La Habra Housing 637,000 Peter Beard- South Walnut Bungalows 826,000 Brea Olinda Unified School District 2,648,833 Olen Point Properties- The Pointe Apartments 1,332,000 Jamboree Housing - Birch Hills Affordable Apartments 2,962,123
Total notes, loans and deferred loans receivable 19,373,852$
c. Long-Term Debt The following debts were transferred from the Redevelopment Agency to the Successor Agency as of February 1, 2012 as a result of the dissolution. A description of long-term debt outstanding (excluding defeased debt) of the Successor Agency as of June 30, 2012, follows:
Balance Transfer from Balance Due WithinJuly 1, 2011 former RDA * Additions Repayments June 30, 2012 One Year
Tax Allocation Bonds 2001 Tax Allocation Refunding Bonds, Series A -$ 41,135,000$ -$ -$ 41,135,000$ 2,400,000$ 2003 Tax Allocation Bonds - 102,655,377 - - 102,655,377 4,175,000 2008 Tax Allocation Bonds Series A - 16,565,000 - - 16,565,000 775,000 2008 Tax Allocation Bonds Series B - 1,830,000 - - 1,830,000 65,000 2011 Tax Allocation Bonds Series A - 19,492,764 - - 19,492,764 - 2011 Tax Allocation Bonds Series B - 10,295,000 - - 10,295,000 - Lease Revenue Bonds 2004 Lease Revenue Refunding Bond - 2,910,000 - - 2,910,000 240,000 2010 Lease Revenue Refunding Bond - 8,595,000 - - 8,595,000 725,000
-$ 203,478,141$ -$ -$ 203,478,141 8,380,000$
Unamortized bond discounts (372,731) Unamortized bond premium 1,738,105
Unamortized gain on defeasance 145,979
204,989,494$
76

CITY OF BREA NOTES TO THE BASIC FINANCIAL STATEMENTS (CONTINUED) FOR THE YEAR ENDED JUNE 30, 2012
Note 16: Successor Agency Trust for Assets of Former Redevelopment Agency (Continued) Tax Allocation Bonds
2001 Tax Allocation Refunding Bonds, Series A
In June 2001, the Brea Redevelopment Agency issued $56,170,000 principal amount of Brea Redevelopment Agency 2001 Tax Allocation Refunding Bonds, Series A. The proceeds were used in the aggregate to: 1) repay a portion of a loan made to the Agency by the Brea Public Financing Authority in connection with the 1991 Tax Allocation Revenue Bonds, Series A issued by the Authority and to defease a corresponding portion of such bonds, and 2) repay a loan made to the Agency by the Brea Public Financing Authority in connection with the 1991 Tax Allocation Revenue Bonds, Series C and to defease the corresponding outstanding bonds. The bonds consist of $41,375,000 serial bonds maturing in the years 2002 to 2020, payable August 1 in annual installments of $710,000 to $3,535,000. The bonds bear interest at 4.0% to 5.5%. Bonds maturing after August 1, 2020, in the amount of $14,795,000 are term bonds and bear interest at 5.0%. Serial bonds maturing on or after August 1, 2012, are subject to redemption in whole or in part at the option of the Agency from any available source of funds. Term bonds maturing on August 1, 2023, are subject to mandatory redemption in part by lot on August 1, 2021, August 1, 2022 and August 1, 2023, in the amounts of $3,730,000, $3,400,000 and $7,665,000, respectively, from sinking fund payments made by the Agency. The bonds are secured by a first pledge on all of the tax revenues on parity with the 2003 and 2011 Tax Allocation Bonds. Bonds are further secured by a financial guarantee insurance policy in an amount equal to the Series A bond reserve requirement; no cash reserve is required to be established. The outstanding balance at June 30, 2012, was $41,135,000.
2003 Tax Allocation Bonds
In July 2003, the Brea Redevelopment Agency issued $120,497,866 principal amount of 2003 Redevelopment Project AB Tax Allocation Bonds. The proceeds were used to: 1) current refund the Agency’s Brea Redevelopment Agency 1993 Tax Allocation Refunding Bonds, 2) pay the costs of additional redevelopment activities with respect to Project Area AB, 3) pay the cost of a reserve fund security instrument, and 4) pay costs of issuance related to the bonds. Bonds maturing in the years 2004 to 2026, are current interest bonds payable August 1 in annual installments of $875,000 to $7,695,000, while bonds maturing in the years 2028 to 2030, are capital appreciation bonds payable August 1 in annual installments of $2,151,714 to $1,801,707. Bonds maturing in the years 2027 to 2032, in the amount of $16,475,000 are term bonds. The current interest bonds bear interest at 2.00% to 4.40% due February 1 and August 1, of each year. The term bonds bear interest at 4.45% and are due August 1, 2032. The capital appreciation bonds have a face value of $22,640,000. By their nature, there is no regular interest payments associated with capital appreciation bonds. The "interest" on the debt results from the difference between
77

CITY OF BREA NOTES TO THE BASIC FINANCIAL STATEMENTS (CONTINUED) FOR THE YEAR ENDED JUNE 30, 2012
Note 16: Successor Agency Trust for Assets of Former Redevelopment Agency (Continued)
the amounts paid by the investors when the debt was issued and the significantly larger value at maturity. The $22,640,000 of face value capital appreciation bonds were initially recorded at the amount of proceeds received, $5,987,866. Each year, the outstanding balance is increased for the accretion of interest associated with the bonds.
A financial guaranty insurance policy has been issued and, accordingly, no cash reserve balance is required. Bond payments are secured by a first pledge on all of the tax revenues on parity with the 2001 and 2011 bonds. The outstanding balance at June 30, 2012, was $102,655,377.
2008 Tax Allocation Revenue Bonds, Series A and B
In October 2008, the Brea Public Financing Authority issued its 2008 Tax Allocation Revenue Bonds, Series A and 2008 Tax Allocation Revenue Bonds, Series B in the amount of $18,900,000 and $2,025,000 respectively to make three separate loans to the Brea Redevelopment Agency pursuant to three loan agreements dated November 1, 2008. The proceeds of the loans were used to current refund the Agency’s outstanding 1997 Senior Lien Tax Allocation Bonds in the amount of $9,825,000, to current refund the 1997 Subordinate Lien Tax Allocation Bonds in the amount of $2,235,000, to finance additional projects benefiting the Agency’s Project Area C including low and moderate income housing programs. The Series A Serial Bonds totaling $9,715,000 have principal repayments ranging from $710,000 to $1,070,000 with interest rates ranging from 4.25% to 6.5%. The Series A Term Bonds totaling $4,710,000 due September 1, 2023, have sinking fund maturities ranging from $1,060,000 to $1,300,000 with interest at 7.0%. The Series A Term Bonds totaling $4,475,000 due September 1, 2026, have sinking fund maturities ranging from $1,390,000 to $1,595,000 with interest at 7.125%. The outstanding balance at June 30, 2012 was $16,565,000. The Series B Term Bonds totaling $330,000 due September 1, 2013, have sinking fund maturities ranging from $55,000 to $80,000 with interest at 7.25%; the Series B Term Bonds totaling $445,000 due September 1, 2018, have sinking fund maturities ranging from $75,000 to $105,000 with interest at 8.375%; and the Series B Term Bonds totaling $1,250,000 due September 1, 2026, have sinking fund maturities ranging from $115,000 to $205,000 with interest at 9.0%. The outstanding balance at June 30, 2012, was $1,830,000. The required reserve for the Series A and Series B bonds is $1,836,444 and $202,500, respectively. As of June 30, 2012, the reserve amount was $1,927,141 and $210,427, respectively. Total Tax Allocation Bonds outstanding at June 30, 2012, was $18,395,000
78

CITY OF BREA NOTES TO THE BASIC FINANCIAL STATEMENTS (CONTINUED) FOR THE YEAR ENDED JUNE 30, 2012
Note 16: Successor Agency Trust for Assets of Former Redevelopment Agency (Continued)
2011 Tax Allocation Bonds, Series A
In June 2011, the Brea Redevelopment Agency issued $18,839,323 principal amount of Brea Redevelopment Agency 2011 Tax Allocation Bonds, Series A. The proceeds were used to: 1) refund all of the Agency’s remaining outstanding 2001 Subordinate Tax Allocation Refunding Bonds, Series B, 2) finance projects benefiting the Agency’s Redevelopment Project AB, 3) fund a reserve account, and 4) pay costs of issuance. Bonds maturing in the years 2031 are current interest bonds payable August 1 in one installment of $4,315,000, while bonds maturing in the years 2013 to 2036, are capital appreciation bonds payable August 1 in annual installments of $28,489 to $1,958,307. The Series A Capital Appreciation Bonds maturing on August 1, 2025 and August 1, 2034 are subject to special mandatory redemption in whole by the Agency on July 1, 2025 and May 15, 2034, respectively, at redemption price equal to 100 percent of the accreted value of the Series A Capital Appreciation Bonds to be redeemed, without premium. The current interest bonds maturing on August 1, 2031, are subject to redemption in whole or in part at the option of the Agency from any available source of funds. The capital appreciation bonds maturing on or after August 1, 2022, are subject to redemption in whole or in part at the option of the Agency, from any available source of funds. The current interest bonds bear interest at 5.00% due February 1 and August 1, of each year. The capital appreciation bonds have a face value of $57,725,000. By their nature, there is no regular interest payments associated with capital appreciation bonds. The "interest" on the debt results from the difference between the amounts paid by the investors when the debt was issued and the significantly larger value at maturity. The $57,725,000 of face value capital appreciation bonds were initially recorded at the amount of proceeds received, $14,524,323. Each year, the outstanding balance is increased for the accretion of interest associated with the bonds. Series A bonds are secured by a pledge of and lien on all the surplus tax revenues. The bonds are further secured by a required cash reserve of $1,883,932 deposited with the trustee. As of June 30, 2012, the reserve was $1,929,325. The outstanding balance at June 30, 2012, was $19,492,764.
2011 Taxable Tax Allocation Housing Bonds, Series B
In June 2011, the Brea Redevelopment Agency issued $10,295,000 principal amount of Brea Redevelopment Agency 2011 Taxable Tax Allocation Housing Bonds, Series B. The proceeds were used to: 1) finance projects in the Agency’s low and moderating income housing program of benefit to the project area, 2) fund a reserve account, and 3) pay costs of issuance. Series B bonds consist of $5,045,000 serial bonds maturing in the years 2013 to 2025, payable August 1 in annual installments of $85,000 to $1,735,000. The bonds bear interest at 2.126% to 6.862%. Bonds maturing in the year 2026 to 2029, in the
79

CITY OF BREA NOTES TO THE BASIC FINANCIAL STATEMENTS (CONTINUED) FOR THE YEAR ENDED JUNE 30, 2012
Note 16: Successor Agency Trust for Assets of Former Redevelopment Agency (Continued)
amount of $5,250,000 are term bonds and bear interest at 7.392%. The Series B Bonds maturing on August 1, 2025 are subjected to special mandatory redemption in whole by the Agency on July 1, 2025, at redemption price equal to 100 percent of the principal amount, together with accrued interest, without premium.
Serial bonds maturing on or after August 1, 2022, are subject to redemption in whole or in part at the option of the Agency from any available source of funds. Term bonds are subject to mandatory redemption in part by lot on August 1, 2026, August 1, 2027, August 1, 2028 and August 1, 2029, in the amount of $1,410,000, $1,515,000 $1,625,000, $700,000, respectively, from sinking fund payments made by the Agency.
Series B bonds are secured by a pledge of and lien on housing tax revenues. The bonds are further secured by a required cash reserve of $1,029,500 deposited with the trustee. As of June 30, 2012, the reserve was $1,053,594. The outstanding balance at June 30, 2012, was $10,295,000. Total Tax Allocation Bonds outstanding at June 30, 2012 was $191,973,141. The debt service schedules of these Lease Revenue Bonds are as follows:
Fiscal Year Ending June 30 Principal Interest Total
2013 7,415,000$ 7,978,494$ 15,393,494$ 2014 7,868,924 7,639,779 15,508,703 2015 8,198,236 7,292,560 15,490,796 2016 8,557,187 6,924,185 15,481,372 2017 8,941,133 6,537,900 15,479,033
2018-2022 50,238,384 26,518,595 76,756,979 2023-2027 57,877,405 19,819,284 77,696,689 2028-2032 33,454,124 23,706,475 57,160,599 2033-2037 9,422,748 28,513,335 37,936,083
Total 191,973,141$ 134,930,607$ 326,903,748$
On June 14, 2012, Moody’s Investors Service (“Moody’s”) downgraded all California tax allocation bonds rated ‘Baa3’ and above. As such, the Bonds’ insured rating was downgraded from ‘A3’ to ‘Ba1’ and underlying rating was downgraded from ‘A3’ to ‘Ba1’. According to Moody’s, all California tax allocation bond ratings remain on review for possible withdrawal.
Pledged Revenues
The City pledged, as security for bonds issued, either directly or through the Financing Authority, a portion of tax increment revenue (including Low and Moderate Income Housing set-aside and pass through allocations) that it receives. The bonds issued were to provide financing for various capital projects, accomplish Low and Moderate Income Housing projects and to defease previously issued bonds. Assembly Bill 1X 26 provided that upon dissolution of the Redevelopment Agency, property taxes allocated to redevelopment agencies no longer are deemed tax increment but rather property tax revenues and will be allocated first to successor agencies to make payments on the indebtedness incurred by the dissolved redevelopment agency. Total principal and interest remaining on the debt is $326,903,748, with annual debt service requirements as
80
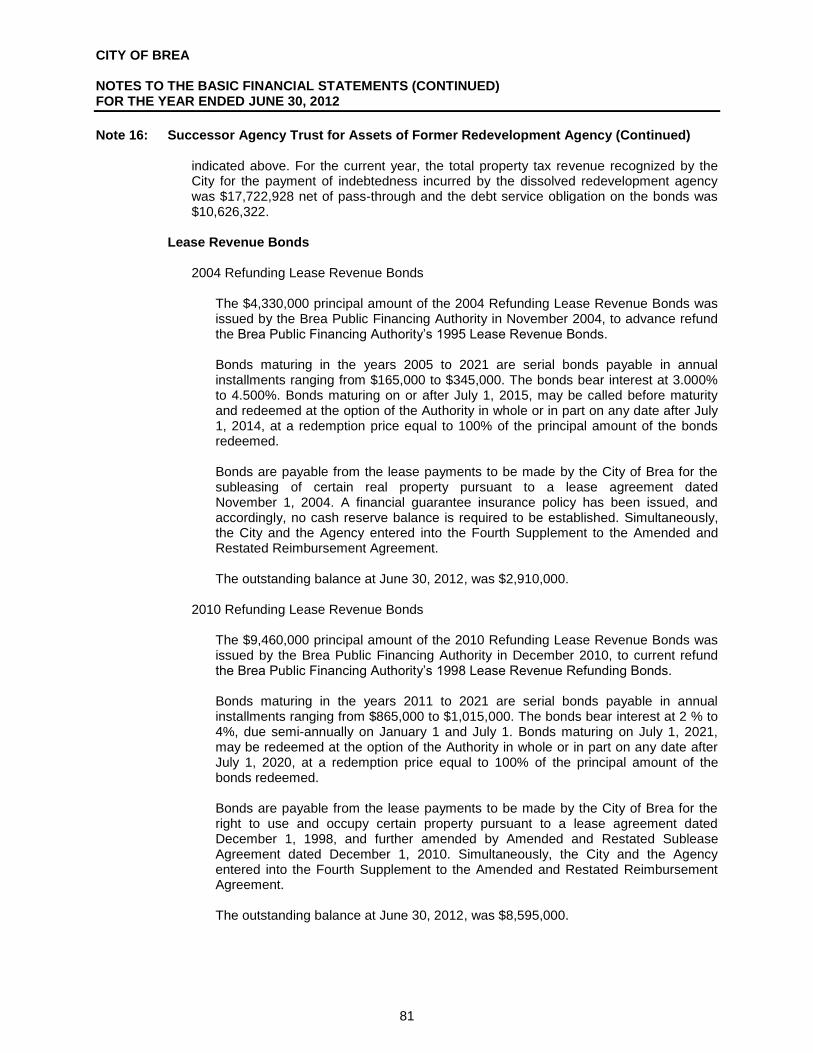
CITY OF BREA NOTES TO THE BASIC FINANCIAL STATEMENTS (CONTINUED) FOR THE YEAR ENDED JUNE 30, 2012
Note 16: Successor Agency Trust for Assets of Former Redevelopment Agency (Continued)
indicated above. For the current year, the total property tax revenue recognized by the City for the payment of indebtedness incurred by the dissolved redevelopment agency was $17,722,928 net of pass-through and the debt service obligation on the bonds was $10,626,322.
Lease Revenue Bonds
2004 Refunding Lease Revenue Bonds The $4,330,000 principal amount of the 2004 Refunding Lease Revenue Bonds was issued by the Brea Public Financing Authority in November 2004, to advance refund the Brea Public Financing Authority’s 1995 Lease Revenue Bonds. Bonds maturing in the years 2005 to 2021 are serial bonds payable in annual installments ranging from $165,000 to $345,000. The bonds bear interest at 3.000% to 4.500%. Bonds maturing on or after July 1, 2015, may be called before maturity and redeemed at the option of the Authority in whole or in part on any date after July 1, 2014, at a redemption price equal to 100% of the principal amount of the bonds redeemed. Bonds are payable from the lease payments to be made by the City of Brea for the subleasing of certain real property pursuant to a lease agreement dated November 1, 2004. A financial guarantee insurance policy has been issued, and accordingly, no cash reserve balance is required to be established. Simultaneously, the City and the Agency entered into the Fourth Supplement to the Amended and Restated Reimbursement Agreement. The outstanding balance at June 30, 2012, was $2,910,000.
2010 Refunding Lease Revenue Bonds
The $9,460,000 principal amount of the 2010 Refunding Lease Revenue Bonds was issued by the Brea Public Financing Authority in December 2010, to current refund the Brea Public Financing Authority’s 1998 Lease Revenue Refunding Bonds. Bonds maturing in the years 2011 to 2021 are serial bonds payable in annual installments ranging from $865,000 to $1,015,000. The bonds bear interest at 2 % to 4%, due semi-annually on January 1 and July 1. Bonds maturing on July 1, 2021, may be redeemed at the option of the Authority in whole or in part on any date after July 1, 2020, at a redemption price equal to 100% of the principal amount of the bonds redeemed. Bonds are payable from the lease payments to be made by the City of Brea for the right to use and occupy certain property pursuant to a lease agreement dated December 1, 1998, and further amended by Amended and Restated Sublease Agreement dated December 1, 2010. Simultaneously, the City and the Agency entered into the Fourth Supplement to the Amended and Restated Reimbursement Agreement. The outstanding balance at June 30, 2012, was $8,595,000.
81

CITY OF BREA NOTES TO THE BASIC FINANCIAL STATEMENTS (CONTINUED) FOR THE YEAR ENDED JUNE 30, 2012
Note 16: Successor Agency Trust for Assets of Former Redevelopment Agency (Continued)
Total Lease Revenue Bonds outstanding at June 30, 2012, was $11,505,000. The debt service schedules of these Lease Revenue Bonds are as follows:
Fiscal Year Ending June 30 Principal Interest Total
2013 965,000$ 406,932$ 1,371,932$ 2014 1,005,000 369,145 1,374,145 2015 1,035,000 327,270 1,362,270 2016 1,075,000 284,972 1,359,972 2017 1,120,000 240,669 1,360,669
2018-2022 6,305,000 483,670 6,788,670
Total 11,505,000$ 2,112,658$ 13,617,658$
d. Insurance
The Successor Agency of the former Redevelopment Agency is covered under the insurance policy of the City of Brea at June 30, 2012.
e. Construction and Other Significant Commitments Owner Participation Agreements
In 1987, the Brea Redevelopment Agency entered into an owner participation agreement with the owners of the Brea Mall. This agreement obligates the Agency to pay the owners 80% of the tax increment revenues generated by the Brea Mall above the 1987-1988 base year tax increment, plus $15,000. The agreement's term is for 33 years beginning the year ended June 30, 1990. The tax increment revenue sharing payments are senior to bond payments. The amount paid by the Agency as a result of this agreement was $1,107,287 for the year ended June 30, 2012.
Future minimum payments for the next 5 years and thereafter are estimated as follows:
2013 1,107,287$ 2014 1,107,287 2015 1,107,287 2016 1,107,287 2017 1,107,287
Amount due thereafter 6,643,722 Total 12,180,157$
Note 17: Subsequent Events
a. Assembly Bill 1484 Due Diligence Review
Assembly Bill 1484 established a requirement for the successor agency to remit to the County auditor-controller three payments as determined by the auditor-controller which consist of a payment to be made in July 2012 for taxing entities’ share of December 2011 property tax distribution to redevelopment agency/successor
82

CITY OF BREA NOTES TO THE BASIC FINANCIAL STATEMENTS (CONTINUED) FOR THE YEAR ENDED JUNE 30, 2012
Note 17: Subsequent Events (Continued)
agency, a payment to be made in November 2012 related to Low-Moderate Income Housing Fund Due Diligence Review for unencumbered cash, and a payment to be made in April 2013 related to the other Redevelopment Funds Due Diligence Review for unencumbered cash. As of the date of the report the payment in July 2012 was made in the amount of $831,385, the Low-Moderate Income Housing Due Diligence Review currently resulted in an amount due of $3,343,997, which has been confirmed by the Department of Finance and is currently in dispute, and the other Redevelopment Funds Due Diligence Review currently resulted in an amount due of $7,153,976, which has not been confirmed by the Department of Finance.
b. Assignment of Former Redevelopment Agency Low and Moderate Housing Assets
On December 4, 2012, the Successor Agency of the Brea Redevelopment Agency assigned to the City of Brea the housing assets, rights, powers and obligations of the Former Brea Redevelopment Agency.
c. Termination of the joint venture in the Tri-City Park Authority
On December 18, 2012, the County Board of Supervisor approved the transfer of the Tri-City Park to the County of Orange terminating the joint venture agreement between the cities of Placentia, Fullerton and Brea.
d. Contract for Police Services The City of Yorba Linda will not renew its contract for police services with the City of Brea after a 42-year relationship. The contract is set to expire in May 2013. The City of Brea received $11.2 million in fiscal year 2011-12 from the City of Yorba Linda for police services.
83

THIS PAGE INTENTIONALLY LEFT BLANK
84
NON-MAJOR GOVERNMENTAL FUNDS Non-major Special Revenue Funds The Gas Tax Fund is used to account for revenues received and expenditures made for street improvements and street maintenance. Financing is provided by the City’s share of State gasoline taxes made pursuant to the California State Constitution and authorized by the State Legislature. The Narcotics Enforcement Asset Seizure Fund is used to account for revenues seized by the Police Department during narcotic investigations. The Air Quality Improvement Fund is used to account for revenues received from vehicle registration fees and restricted for improvement of air quality. The Park Development Fund is used to account for revenues received and expenditures made for park development and improvement. The primary source of revenue is park development fees collected from developers under the State of California’s Quimby Act. The Measure M Fund is used to account for ½ ¢ sales tax restricted for expenditure for road maintenance and street expenditures. The Affordable Housing Trust Fund is used to account for revenues received and expenditures made for the development of low to moderate income housing. The primary source of revenue is fees collected from developers. The Community Development Block Grant Fund is used to account for the revenues received and expenditures made for the City’s Community Development Block Grant Program. Financing is provided under an agreement with the County of Orange whereby the City is a secondary recipient of funds made available from the U.S. Department of Housing and Urban Development under the Housing and Community Development Act of 1974 and 1977. The HOME Program Fund is used to account for the revenues received and expenditures made for housing rehabilitation. Financing is provided under an agreement with the County of Orange whereby the City is a secondary recipient of funds made available from the U.S. Department of Housing and Urban Development.
85

NON-MAJOR GOVERNMENTAL FUNDS Non-major Capital Projects Funds The Solar Energy and Efficiency Projects Fund is used to account for the revenues received and expenditures made from the net bond proceeds of the $2,835,000 Brea Public Financing Authority 2010 Lease Revenue Bonds and the $4,580,000 City of Brea 2010 Clean Renewable Energy Bonds. The Storm Drain Fund is used to account for the financing and construction of storm drains throughout the City. Financing is provided by storm drain assessment fees. The Midbury Assessment Authority Fund is an Agency Fund used to account for the collection and payment of neighborhood street improvements.
86

CITY OF BREA
COMBINING BALANCE SHEETNONMAJOR GOVERNMENTAL FUNDS JUNE 30, 2012
Assets:Cash and investments 1,199,982$ 1,797,500$ 83,658$ 348,622$ Receivables:
Taxes - - - - Notes and loans - - - -
Due from other governments 116,546 58,022 12,405 -
Total Assets 1,316,528$ 1,855,522$ 96,063$ 348,622$
Liabilities and Fund Balances:Liabilities:Accounts payable -$ 4,677$ -$ -$ Accrued liabilities - 3,535 - - Due to other governments - - - - Due to other funds - - - - Advances from other funds - - - - Due to Successor Agency - - - -
Total Liabilities - 8,212 - -
Fund Balances: Restricted for: Community development projects - - - 348,622 Public safety - 1,847,310 - - Public works 1,316,528 - 96,063 - Capital Projects - - - - Unassigned - - - -
Total Fund Balances 1,316,528 1,847,310 96,063 348,622
Total Liabilities and Fund Balances 1,316,528$ 1,855,522$ 96,063$ 348,622$
Gas Tax
Narcotics Enforcement Asset Seizure
Air Quality Improvement
Park Development
Special Revenue Funds
87

CITY OF BREA
COMBINING BALANCE SHEETNONMAJOR GOVERNMENTAL FUNDSJUNE 30, 2012
Assets:Cash and investmentsReceivables:
TaxesNotes and loans
Due from other governments
Total Assets
Liabilities and Fund Balances:Liabilities:Accounts payableAccrued liabilitiesDue to other governmentsDue to other fundsAdvances from other fundsDue to Successor Agency
Total Liabilities
Fund Balances: Restricted for: Community development projects Public safety Public works Capital Projects Unassigned
Total Fund Balances
Total Liabilities and Fund Balances
(Continued)
574,097$ 1,824,951$ -$ -$
- - - - - - 1,844,845 45,241
134,646 - 46,898 -
708,743$ 1,824,951$ 1,891,743$ 45,241$
-$ -$ 2,900$ -$ 181 - - -
- - 1,851,896 45,241 - - 43,156 - - - - - - 17,000 - -
181 17,000 1,897,952 45,241
- 1,807,951 - - - - - -
708,562 - - - - - - - - - (6,209) -
708,562 1,807,951 (6,209) -
708,743$ 1,824,951$ 1,891,743$ 45,241$
Community Development Block Grant
HOME Program Measure M
Affordable Housing Fund
Special Revenue Funds
88

CITY OF BREA
COMBINING BALANCE SHEETNONMAJOR GOVERNMENTAL FUNDSJUNE 30, 2012
Assets:Cash and investmentsReceivables:
TaxesNotes and loans
Due from other governments
Total Assets
Liabilities and Fund Balances:Liabilities:Accounts payableAccrued liabilitiesDue to other governmentsDue to other fundsAdvances from other fundsDue to Successor Agency
Total Liabilities
Fund Balances: Restricted for: Community development projects Public safety Public works Capital Projects Unassigned
Total Fund Balances
Total Liabilities and Fund Balances
Total NonmajorGovernmental
Funds
-$ 1,136,004$ -$ 6,964,814$
- - 175 175 - - - 1,890,086 - - - 368,517
-$ 1,136,004$ 175$ 9,223,592$
-$ -$ -$ 7,577$ - - - 3,716 - - - 1,897,137 - - - 43,156 - - 48,107 48,107 - - - 17,000
- - 48,107 2,016,693
- - - 2,156,573 - - - 1,847,310 - - - 2,121,153 - 1,136,004 - 1,136,004 - - (47,932) (54,141)
- 1,136,004 (47,932) 7,206,899
-$ 1,136,004$ 175$ 9,223,592$
Solar Energy Projects Storm Drain Midbury
Capital Projects Funds
89

THIS PAGE INTENTIONALLY LEFT BLANK
90

CITY OF BREA
COMBINING STATEMENT OF REVENUES,EXPENDITURES AND CHANGES IN FUND BALANCESNONMAJOR GOVERNMENTAL FUNDSYEAR ENDED JUNE 30, 2012
Revenues:Taxes -$ -$ -$ -$ Intergovernmental 1,129,970 - 50,252 - Charges for services - - - 39,272 Investment income 24,014 45,454 2,388 9,781 Fines and forfeitures - 545,557 - - Contributions - - - - Miscellaneous - 12,437 - -
Total Revenues 1,153,984 603,448 52,640 49,053
Expenditures:Current: General government - - - - Public safety - 433,632 - - Community development - - - - Public works - - - -
Total Expenditures - 433,632 - -
Excess (Deficiency) of Revenues Over (Under) Expenditures 1,153,984 169,816 52,640 49,053
Other Financing Sources (Uses):Transfers out (985,504) - (28,251) (106,072)
Total Other Financing Sources (Uses) (985,504) - (28,251) (106,072)
Net Change in Fund Balances 168,480 169,816 24,389 (57,019)
Fund Balances, Beginning of Year 1,148,048 1,677,494 71,674 405,641
Fund Balances, End of Year 1,316,528$ 1,847,310$ 96,063$ 348,622$
Special Revenue Funds
Gas Tax
Narcotics Enforcement Asset Seizure
Air Quality Improvement
Park Development
91

CITY OF BREA
COMBINING STATEMENT OF REVENUES,EXPENDITURES AND CHANGES IN FUND BALANCESNONMAJOR GOVERNMENTAL FUNDSYEAR ENDED JUNE 30, 2012
Revenues:TaxesIntergovernmentalCharges for servicesInvestment incomeFines and forfeituresContributionsMiscellaneous
Total Revenues
Expenditures:Current: General government Public safety Community development Public works
Total Expenditures
Excess (Deficiency) of Revenues Over (Under) Expenditures
Other Financing Sources (Uses):Transfers out
Total Other Financing Sources (Uses)
Net Change in Fund Balances
Fund Balances, Beginning of Year
Fund Balances, End of Year
(Continued)
748,931$ -$ -$ -$ - - 478,022 - - - - -
27,103 43,810 - - - - - - - - - - - - - -
776,034 43,810 478,022 -
- - - - - - - - - - 191,306 -
10,177 - - -
10,177 - 191,306 -
765,857 43,810 286,716 -
(1,465,666) - (220,193) -
(1,465,666) - (220,193) -
(699,809) 43,810 66,523 -
1,408,371 1,764,141 (72,732) -
708,562$ 1,807,951$ (6,209)$ -$
Special Revenue Funds
Measure M Affordable
Housing Fund
Community Development Block Grant
HOME Program
92

CITY OF BREA
COMBINING STATEMENT OF REVENUES,EXPENDITURES AND CHANGES IN FUND BALANCESNONMAJOR GOVERNMENTAL FUNDSYEAR ENDED JUNE 30, 2012
Revenues:TaxesIntergovernmentalCharges for servicesInvestment incomeFines and forfeituresContributionsMiscellaneous
Total Revenues
Expenditures:Current: General government Public safety Community development Public works
Total Expenditures
Excess (Deficiency) of Revenues Over (Under) Expenditures
Other Financing Sources (Uses):Transfers out
Total Other Financing Sources (Uses)
Net Change in Fund Balances
Fund Balances, Beginning of Year
Fund Balances, End of Year
Total NonmajorGovernmental
Funds
-$ -$ 7,328$ 756,259$ - - - 1,658,244 - 2,517 - 41,789
2,942 29,616 1,975 187,083 - - - 545,557 - - 156,440 156,440 - - - 12,437
2,942 32,133 165,743 3,357,809
- - 500 500 - - - 433,632 - - - 191,306 - 2,224 - 12,401
- 2,224 500 637,839
2,942 29,909 165,243 2,719,970
(55,096) (63,248) (213,175) (3,137,205)
(55,096) (63,248) (213,175) (3,137,205)
(52,154) (33,339) (47,932) (417,235)
52,154 1,169,343 - 7,624,134
-$ 1,136,004$ (47,932)$ 7,206,899$
Capital Projects Funds
Solar Energy Projects Storm Drain Midbury
93

CITY OF BREA
BUDGETARY COMPARISON SCHEDULEGAS TAXYEAR ENDED JUNE 30, 2012
Variance with Final Budget
Budget Amounts Actual PositiveOriginal Final Amounts (Negative)
Budgetary Fund Balance, July 1 1,148,048$ 1,148,048$ 1,148,048$ -$ Resources (Inflows):Intergovernmental 1,045,100 1,045,100 1,129,970 84,870 Investment income 10,000 10,000 24,014 14,014
Amounts Available for Appropriation 2,203,148 2,203,148 2,302,032 98,884
Charges to Appropriation (Outflow):Transfers out 1,570,270 2,180,594 985,504 1,195,090
Total Charges to Appropriation 1,570,270 2,180,594 985,504 1,195,090
Budgetary Fund Balance, June 30 632,878$ 22,554$ 1,316,528$ 1,293,974$
94

CITY OF BREA
BUDGETARY COMPARISON SCHEDULENARCOTICS ENFORCEMENT ASSET SEIZUREYEAR ENDED JUNE 30, 2012
Variance with Final Budget
Budget Amounts Actual PositiveOriginal Final Amounts (Negative)
Budgetary Fund Balance, July 1 1,677,494$ 1,677,494$ 1,677,494$ -$ Resources (Inflows):Investment income 15,000 15,000 45,454 30,454 Fines and forfeitures 175,000 175,000 545,557 370,557 Miscellaneous 21,608 21,608 12,437 (9,171)
Amounts Available for Appropriation 1,889,102 1,889,102 2,280,942 391,840
Charges to Appropriation (Outflow):Public safety 408,761 416,641 433,632 (16,991) Transfers out 8,000 8,000 - 8,000
Total Charges to Appropriation 416,761 424,641 433,632 (8,991)
Budgetary Fund Balance, June 30 1,472,341$ 1,464,461$ 1,847,310$ 382,849$
95

CITY OF BREA
BUDGETARY COMPARISON SCHEDULEAIR QUALITY IMPROVEMENTYEAR ENDED JUNE 30, 2012
Variance with Final Budget
Budget Amounts Actual PositiveOriginal Final Amounts (Negative)
Budgetary Fund Balance, July 1 71,674$ 71,674$ 71,674$ -$ Resources (Inflows):Intergovernmental 44,000 44,000 50,252 6,252 Investment income 900 900 2,388 1,488
Amounts Available for Appropriation 116,574 116,574 124,314 7,740
Charges to Appropriation (Outflow):Transfers out 52,000 52,000 28,251 23,749
Total Charges to Appropriation 52,000 52,000 28,251 23,749
Budgetary Fund Balance, June 30 64,574$ 64,574$ 96,063$ 31,489$
96

CITY OF BREA
BUDGETARY COMPARISON SCHEDULEPARK DEVELOPMENTYEAR ENDED JUNE 30, 2012
Variance with Final Budget
Budget Amounts Actual PositiveOriginal Final Amounts (Negative)
Budgetary Fund Balance, July 1 405,641$ 405,641$ 405,641$ -$ Resources (Inflows):Charges for services 400,000 400,000 39,272 (360,728) Investment income 5,000 5,000 9,781 4,781
Amounts Available for Appropriation 810,641 810,641 454,694 (355,947)
Charges to Appropriation (Outflow):Transfers out - 106,072 106,072 -
Total Charges to Appropriation - 106,072 106,072 -
Budgetary Fund Balance, June 30 810,641$ 704,569$ 348,622$ (355,947)$
97

CITY OF BREA
BUDGETARY COMPARISON SCHEDULEMEASURE MYEAR ENDED JUNE 30, 2012
Variance with Final Budget
Budget Amounts Actual PositiveOriginal Final Amounts (Negative)
Budgetary Fund Balance, July 1 1,408,371$ 1,408,371$ 1,408,371$ -$ Resources (Inflows):Taxes 545,101 545,101 748,931 203,830 Investment income 12,000 12,000 27,103 15,103
Amounts Available for Appropriation 1,965,472 1,965,472 2,184,405 218,933
Charges to Appropriation (Outflow):Public works 15,459 25,459 10,177 15,282 Transfers out 1,190,000 2,424,080 1,465,666 958,414
Total Charges to Appropriation 1,205,459 2,449,539 1,475,843 973,696
Budgetary Fund Balance, June 30 760,013$ (484,067)$ 708,562$ 1,192,629$
98
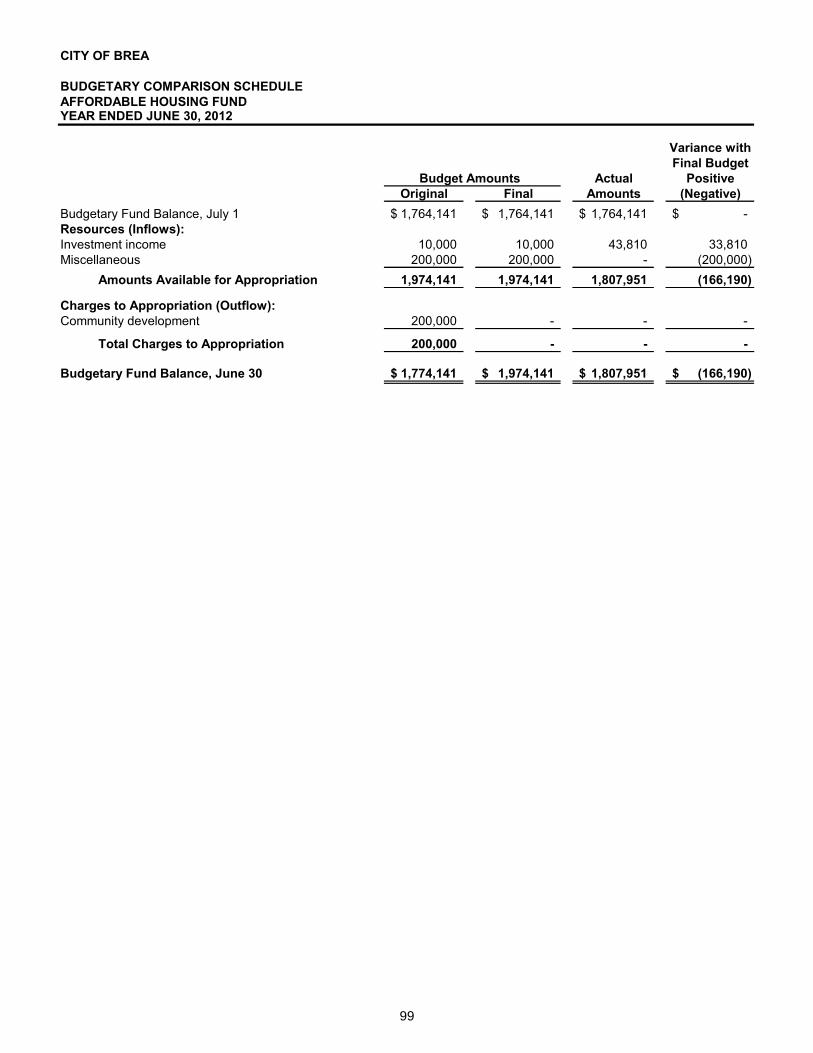
CITY OF BREA
BUDGETARY COMPARISON SCHEDULEAFFORDABLE HOUSING FUNDYEAR ENDED JUNE 30, 2012
Variance with Final Budget
Budget Amounts Actual PositiveOriginal Final Amounts (Negative)
Budgetary Fund Balance, July 1 1,764,141$ 1,764,141$ 1,764,141$ -$ Resources (Inflows):Investment income 10,000 10,000 43,810 33,810 Miscellaneous 200,000 200,000 - (200,000)
Amounts Available for Appropriation 1,974,141 1,974,141 1,807,951 (166,190)
Charges to Appropriation (Outflow):Community development 200,000 - - -
Total Charges to Appropriation 200,000 - - -
Budgetary Fund Balance, June 30 1,774,141$ 1,974,141$ 1,807,951$ (166,190)$
99

CITY OF BREA
BUDGETARY COMPARISON SCHEDULECOMMUNITY DEVELOPMENT BLOCK GRANTYEAR ENDED JUNE 30, 2012
Variance with Final Budget
Budget Amounts Actual PositiveOriginal Final Amounts (Negative)
Budgetary Fund Balance, July 1 (72,732)$ (72,732)$ (72,732)$ -$ Resources (Inflows):Intergovernmental 314,263 402,880 478,022 75,142
Amounts Available for Appropriation 241,531 330,148 405,290 75,142
Charges to Appropriation (Outflow):Community development 170,000 170,000 191,306 (21,306) Transfers out 144,263 232,880 220,193 12,687
Total Charges to Appropriation 314,263 402,880 411,499 (8,619)
Budgetary Fund Balance, June 30 (72,732)$ (72,732)$ (6,209)$ 66,523$
100

CITY OF BREA
BUDGETARY COMPARISON SCHEDULECAPITAL IMPROVEMENTSYEAR ENDED JUNE 30, 2012
Variance with Final Budget
Budget Amounts Actual PositiveOriginal Final Amounts (Negative)
Budgetary Fund Balance, July 1 11,935,949$ 11,935,949$ 11,935,949$ -$ Resources (Inflows):Intergovernmental 5,739,830 19,774,214 3,858,254 (15,915,960) Charges for services 75,000 75,000 934,542 859,542 Investment income 210,000 210,000 318,011 108,011 Contributions 300,000 330,447 2,355,584 2,025,137 Miscellaneous - - 1,127,253 1,127,253 Transfers in 28,808,433 19,647,436 3,686,222 (15,961,214)
Amounts Available for Appropriation 47,069,212 51,973,046 24,215,815 (27,757,231)
Charges to Appropriation (Outflow):General government 116,719 116,719 93,372 23,347 Public safety 16,900 16,900 16,923 (23) Community development 11,945 11,945 4,852 7,093 Public works 195,436 195,436 13,589 181,847 Capital outlay 34,848,263 42,845,360 12,310,001 30,535,359 Transfers out 2,012,900 798,000 138,000 660,000
Total Charges to Appropriation 37,202,163 43,984,360 12,576,737 31,407,623
Budgetary Fund Balance, June 30 9,867,049$ 7,988,686$ 11,639,078$ 3,650,392$
101

CITY OF BREA
BUDGETARY COMPARISON SCHEDULESOLAR ENERGY PROJECTSYEAR ENDED JUNE 30, 2012
Variance with Final Budget
Budget Amounts Actual PositiveOriginal Final Amounts (Negative)
Budgetary Fund Balance, July 1 52,154$ 52,154$ 52,154$ -$ Resources (Inflows):Investment income 3,000 3,000 2,942 (58)
Amounts Available for Appropriation 55,154 55,154 55,096 (58)
Charges to Appropriation (Outflow):Transfers out - 66,357 55,096 11,261
Total Charges to Appropriation - 66,357 55,096 11,261
Budgetary Fund Balance, June 30 55,154$ (11,203)$ -$ 11,203$
102

CITY OF BREA
BUDGETARY COMPARISON SCHEDULECAPITAL AND MITIGATION IMPROVEMENTYEAR ENDED JUNE 30, 2012
Variance with Final Budget
Budget Amounts Actual PositiveOriginal Final Amounts (Negative)
Budgetary Fund Balance, July 1 5,820,395$ 5,820,395$ 5,820,395$ -$ Resources (Inflows):Contributions 3,500,000 3,500,000 3,500,000 -
Amounts Available for Appropriation 9,320,395 9,320,395 9,320,395 -
Charges to Appropriation (Outflow):Transfers out 4,009,264 4,804,498 844,787 3,959,711
Total Charges to Appropriation 4,009,264 4,804,498 844,787 3,959,711
Budgetary Fund Balance, June 30 5,311,131$ 4,515,897$ 8,475,608$ 3,959,711$
103

CITY OF BREA
BUDGETARY COMPARISON SCHEDULESTORM DRAINYEAR ENDED JUNE 30, 2012
Variance with Final Budget
Budget Amounts Actual PositiveOriginal Final Amounts (Negative)
Budgetary Fund Balance, July 1 1,169,343$ 1,169,343$ 1,169,343$ -$ Resources (Inflows):Charges for services - - 2,517 2,517 Investment income 20,000 20,000 29,616 9,616
Amounts Available for Appropriation 1,189,343 1,189,343 1,201,476 12,133
Charges to Appropriation (Outflow):Public works 10,000 10,000 2,224 7,776 Transfers out - 332,034 63,248 268,786
Total Charges to Appropriation 10,000 342,034 65,472 276,562
Budgetary Fund Balance, June 30 1,179,343$ 847,309$ 1,136,004$ 288,695$
104
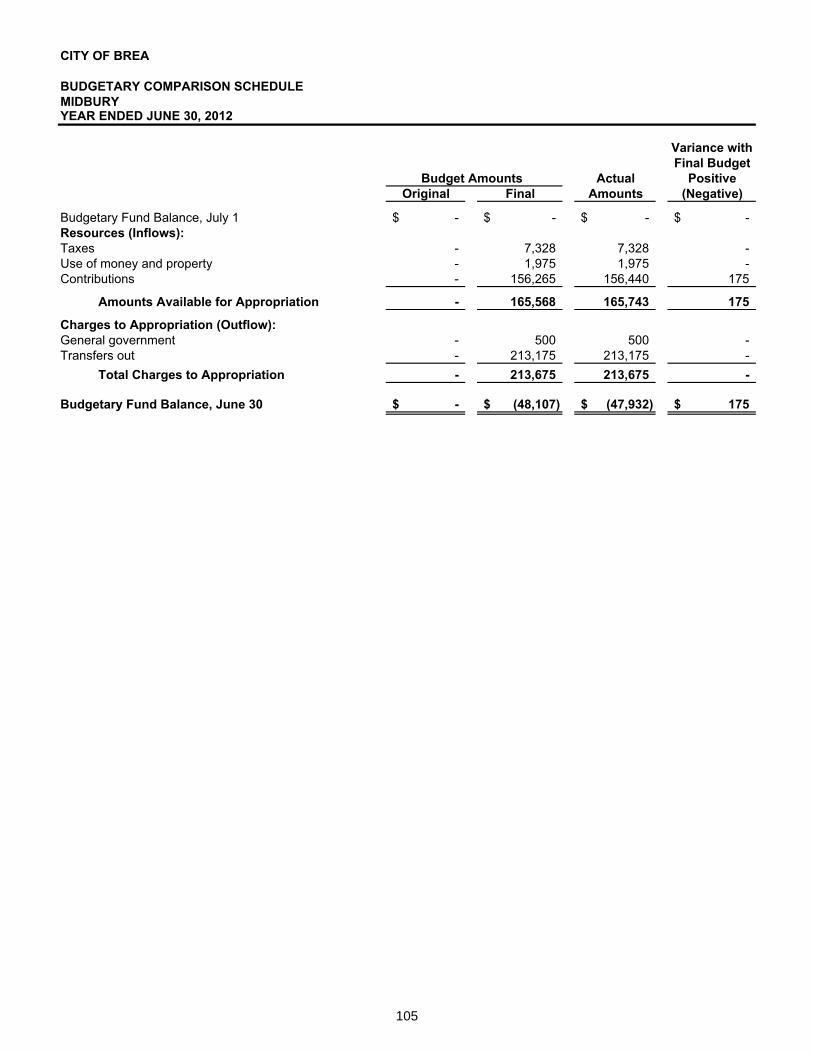
CITY OF BREA
BUDGETARY COMPARISON SCHEDULEMIDBURYYEAR ENDED JUNE 30, 2012
Variance with Final Budget
Budget Amounts Actual PositiveOriginal Final Amounts (Negative)
Budgetary Fund Balance, July 1 -$ -$ -$ -$ Resources (Inflows):Taxes - 7,328 7,328 - Use of money and property - 1,975 1,975 - Contributions - 156,265 156,440 175
Amounts Available for Appropriation - 165,568 165,743 175
Charges to Appropriation (Outflow):General government - 500 500 - Transfers out - 213,175 213,175 -
Total Charges to Appropriation - 213,675 213,675 -
Budgetary Fund Balance, June 30 -$ (48,107)$ (47,932)$ 175$
105

THIS PAGE INTENTIONALLY LEFT BLANK
106

NON-MAJOR PROPRIETARY FUNDS The Urban Runoff Fund is used to account for the City’s urban runoff operations, which are financed and operated in a manner similar to a private enterprise. The costs (expenses, including depreciation) of providing these services to the general public on a continuing basis are financed or recovered primarily through user charges. The Sanitation Fund is used to account for the City’s refuse collection and street sweeping operations, which are operated in a manner similar to a private enterprise. User charges finance the operations of this fund. The Information Technology External Support Fund is used to account for the operations of the Information Technology Division’s contractual information technology services to other agencies. The costs (expenses including depreciation) of providing these services to member cities on a continuing basis are financed or recovered primarily through user charges.
107

CITY OF BREA
COMBINING STATEMENT OF NET ASSETSNON-MAJOR PROPRIETARY FUNDS JUNE 30, 2012
TotalAssets:Current:
Cash and investments 400,008$ -$ 318,274$ 718,282$ Accounts receivable 50,920 553,634 - 604,554 Due from other governments - 11,323 263,151 274,474
Total Current Assets 450,928 564,957 581,425 1,597,310
Noncurrent:Capital assets - net of accumulated depreciation 6,953 - 6,697 13,650
Total Noncurrent Assets 6,953 - 6,697 13,650
Total Assets 457,881$ 564,957$ 588,122$ 1,610,960$
Liabilities and Net Assets:Liabilities:Current:
Accounts payable 3,527$ 179,497$ 2,658$ 185,682$ Accrued liabilities 2,063 7,506 21,478 31,047 Due to other funds - 117,775 - 117,775
2,405 12,222 63,472 78,099
Total Current Liabilities 7,995 317,000 87,608 412,603
Noncurrent:
802 4,074 21,157 26,033
Total Noncurrent Liabilities 802 4,074 21,157 26,033
Total Liabilities 8,797 321,074 108,765 438,636
Net Assets:Invested in capital assets 6,953 - 6,697 13,650 Unrestricted 442,131 243,883 472,660 1,158,674
Total Net Assets 449,084 243,883 479,357 1,172,324
Total Liabilities and Net Assets 457,881$ 564,957$ 588,122$ 1,610,960$
more than one year
within one yearAccrued compensated absences, due
Accrued compensated absences, due in
Urban Runoff Sanitation
Information Technology
External Support
108

CITY OF BREA
COMBINING STATEMENT OF REVENUES, EXPENSESAND CHANGES IN FUND NET ASSETSNON-MAJOR PROPRIETARY FUNDS YEAR ENDED JUNE 30, 2012
TotalOperating Revenues:Charges for services 344,415$ 3,032,717$ 1,676,577$ 5,053,709$ Miscellaneous 33,535 125,713 - 159,248
Total Operating Revenues 377,950 3,158,430 1,676,577 5,212,957
Operating Expenses:Personnel services 112,783 415,925 1,172,847 1,701,555 Maintenance and operation 153,376 2,232,978 64,447 2,450,801 Depreciation expense 938 - 1,989 2,927
Total Operating Expenses 267,097 2,648,903 1,239,283 4,155,283
Operating Income (Loss) 110,853 509,527 437,294 1,057,674
Nonoperating Revenues (Expenses):Intergovernmental - 11,323 - 11,323 Interest revenue 9,067 (3,618) 5,540 10,989
Total Nonoperating Revenues (Expenses) 9,067 7,705 5,540 22,312
Income (Loss) Before Transfers 119,920 517,232 442,834 1,079,986
Transfers out (32,566) (465,099) (62,500) (560,165)
Changes in Net Assets 87,354 52,133 380,334 519,821
Net Assets:Beginning of Year 361,730 191,750 99,023 652,503
End of Fiscal Year 449,084$ 243,883$ 479,357$ 1,172,324$
Information Technology
External Support Urban Runoff Sanitation
109

CITY OF BREA
COMBINING STATEMENT OF CASH FLOWSNON-MAJOR PROPRIETARY FUNDS YEAR ENDED JUNE 30, 2012
TotalCash Flows from Operating Activities:Cash received from customers 378,908$ 3,171,243$ 1,677,057$ 5,227,208$ Cash paid to suppliers for goods and services (150,909) (2,304,162) (190,266) (2,645,337) Cash paid to employees for services (109,963) (409,687) (1,156,547) (1,676,197)
Net Cash Provided (Used) by Operating Activities 118,036 457,394 330,244 905,674
Cash Flows from Non-CapitalFinancing Activities:
Cash transfers out for noncapital financing activities (32,566) (465,099) (62,500) (560,165) Grant subsidy 11,323 11,323
Net Cash Provided (Used) by Non-Capital Financing Activities (32,566) (453,776) (62,500) (548,842)
Cash Flows from Investing Activities:Interest received 9,067 (3,618) 5,540 10,989
Net Cash Provided (Used) byInvesting Activities 9,067 (3,618) 5,540 10,989
Net Increase (Decrease) in Cashand Cash Equivalents 94,537 - 273,284 367,821
Cash and Cash Equivalents at Beginning of Year 305,471 - 44,990 350,461
Cash and Cash Equivalents at End of Year 400,008$ -$ 318,274$ 718,282$
Reconciliation of Operating Income to Net CashProvided (Used) by Operating Activities:Operating income (loss) 110,853$ 509,527$ 437,294$ 1,057,674$ Adjustments to reconcile operating income (loss) net cash provided (used) by operating activities:
Depreciation 938 - 1,989 2,927 (Increase) decrease in accounts receivable 958 12,813 480 14,251 (Increase) decrease in due from other governments - - (126,068) (126,068) Increase (decrease) in accounts payable 2,467 14,226 249 16,942 Increase (decrease) in accrued liabilities (387) 1,560 3,803 4,976 Increase (decrease) in due to other funds - (85,410) - (85,410) Increase (decrease) in compensated absences 3,207 4,678 12,497 20,382
Total Adjustments 7,183 (52,133) (107,050) (152,000) Net Cash Provided (Used) by Operating Activities 118,036$ 457,394$ 330,244$ 905,674$
Non-Cash Investing, Capital, and Financing Activities:There was no non-cash investing, capital or financing activities during fiscal year 2011-2012.
Information Technology
External Support Urban Runoff Sanitation
110

INTERNAL SERVICE FUNDS The Risk Management Fund is used to account for costs of operating a self-insurance program for general liability, workers’ compensation, long-term disability and unemployment compensation. Such costs to other departments are billed at a predetermined rate set annually during the budget process. The Vehicle Maintenance Fund is used to account for the costs of operating a maintenance facility for automotive equipment used by other City departments. Such costs to other departments are billed at a predetermined cost per mile charge that includes depreciation. This charge is set annually during the budget process. The Vehicle Maintenance Fund is responsible for financing replacement vehicles, as necessary. The Building Occupancy Fund is used to account for costs of operating a building maintenance program for City facilities. Such costs to other departments are billed at a predetermined rate set annually during the budget process.
111
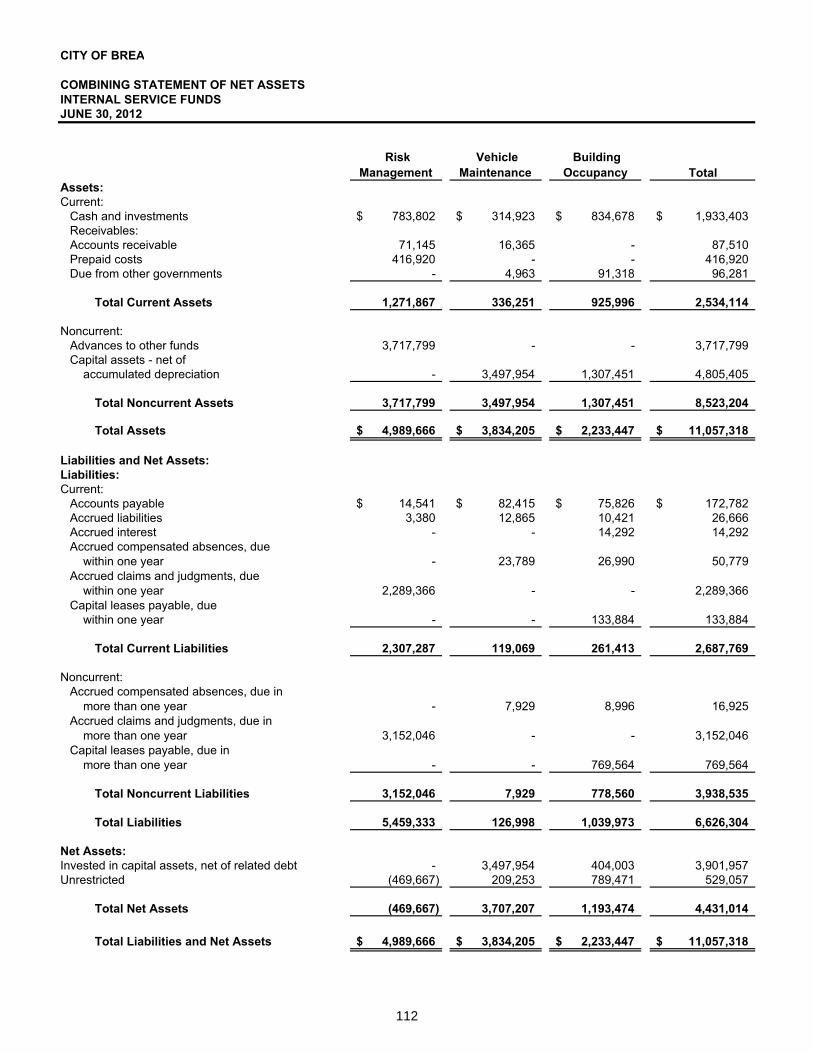
CITY OF BREA
COMBINING STATEMENT OF NET ASSETSINTERNAL SERVICE FUNDSJUNE 30, 2012
TotalAssets:Current:
Cash and investments 783,802$ 314,923$ 834,678$ 1,933,403$ Receivables:Accounts receivable 71,145 16,365 - 87,510 Prepaid costs 416,920 - - 416,920 Due from other governments - 4,963 91,318 96,281
Total Current Assets 1,271,867 336,251 925,996 2,534,114
Noncurrent:Advances to other funds 3,717,799 - - 3,717,799 Capital assets - net of accumulated depreciation - 3,497,954 1,307,451 4,805,405
Total Noncurrent Assets 3,717,799 3,497,954 1,307,451 8,523,204
Total Assets 4,989,666$ 3,834,205$ 2,233,447$ 11,057,318$
Liabilities and Net Assets:Liabilities:Current:
Accounts payable 14,541$ 82,415$ 75,826$ 172,782$ Accrued liabilities 3,380 12,865 10,421 26,666 Accrued interest - - 14,292 14,292
- 23,789 26,990 50,779
2,289,366 - - 2,289,366 Capital leases payable, due within one year - - 133,884 133,884
Total Current Liabilities 2,307,287 119,069 261,413 2,687,769
Noncurrent:
- 7,929 8,996 16,925
3,152,046 - - 3,152,046 Capital leases payable, due in more than one year - - 769,564 769,564
Total Noncurrent Liabilities 3,152,046 7,929 778,560 3,938,535
Total Liabilities 5,459,333 126,998 1,039,973 6,626,304
Net Assets:Invested in capital assets, net of related debt - 3,497,954 404,003 3,901,957 Unrestricted (469,667) 209,253 789,471 529,057
Total Net Assets (469,667) 3,707,207 1,193,474 4,431,014
Total Liabilities and Net Assets 4,989,666$ 3,834,205$ 2,233,447$ 11,057,318$
more than one year
more than one year
within one year
within one year
Accrued compensated absences, due
Accrued claims and judgments, due
Accrued compensated absences, due in
Accrued claims and judgments, due in
Risk Management
Vehicle Maintenance
Building Occupancy
112

CITY OF BREA
COMBINING STATEMENT OF REVENUES, EXPENSESAND CHANGES IN FUND NET ASSETSINTERNAL SERVICE FUNDSYEAR ENDED JUNE 30, 2012
TotalOperating Revenues:Charges for services 2,400,012$ 2,101,524$ 2,077,416$ 6,578,952$ Miscellaneous 133,862 45,483 69 179,414
Total Operating Revenues 2,533,874 2,147,007 2,077,485 6,758,366
Operating Expenses:Personnel services 172,393 528,129 534,230 1,234,752 Maintenance and operation 1,004,110 1,631,504 1,497,061 4,132,675 Claims and judgments 2,988,053 - - 2,988,053 Depreciation expense - 674,645 90,915 765,560
Total Operating Expenses 4,164,556 2,834,278 2,122,206 9,121,040
Operating Income (Loss) (1,630,682) (687,271) (44,721) (2,362,674)
Nonoperating Revenues (Expenses):Intergovernmental - - 91,318 91,318 Interest revenue 59,198 10,106 22,183 91,487 Interest expense - (884) (44,265) (45,149) Contributions - 130,000 - 130,000 Gain (loss) on disposal of fixed assets - 27,548 - 27,548
Total Nonoperating Revenues (Expenses) 59,198 166,770 69,236 295,204
Income (Loss) Before Transfers (1,571,484) (520,501) 24,515 (2,067,470)
Transfers in - 335,312 190,000 525,312 Transfers out - - (300,000) (300,000)
Changes in Net Assets (1,571,484) (185,189) (85,485) (1,842,158)
Net Assets:Beginning of Year 1,101,817 3,892,396 1,278,959 6,273,172
End of Fiscal Year (469,667)$ 3,707,207$ 1,193,474$ 4,431,014$
Risk Management
Vehicle Maintenance
Building Occupancy
113

CITY OF BREA
COMBINING STATEMENT OF CASH FLOWSINTERNAL SERVICE FUNDSYEAR ENDED JUNE 30, 2012
TotalCash Flows from Operating Activities:Cash received from customers and users 2,462,729$ 2,133,089$ 2,077,485$ 6,673,303$ Cash paid to suppliers for goods and services (1,410,708) (1,648,690) (1,542,955) (4,602,353) Cash paid to employees for services (3,160,446) (527,982) (529,768) (4,218,196) Insurance premium and settlements 1,099,349 - - 1,099,349
Net Cash Provided (Used) by Operating Activities (1,009,076) (43,583) 4,762 (1,047,897)
Cash Flows from Non-CapitalFinancing Activities:
Cash transfers out for noncapital financing activities - - (300,000) (300,000) Cash transfers in for noncapital financing activities - 335,312 190,000 525,312 Advance to other funds (3,717,799) - - (3,717,799) Contributions - 130,000 - 130,000 Grant subsidy - - 91,318 91,318
Net Cash Provided (Used) by Non-Capital Financing Activities (3,717,799) 465,312 (18,682) (3,271,169)
Cash Flows from Capital and Related Financing Activities:
Acquisition and construction of capital assets - (1,174,089) (17,667) (1,191,756) Proceeds from sales of capital assets - 27,548 - 27,548 Principal paid on capital debt - - (127,894) (127,894) Interest paid on capital debt - (3,992) (46,288) (50,280)
Net Cash Provided (Used) by Capital and Related Financing Activities - (1,150,533) (191,849) (1,342,382)
Cash Flows from Investing Activities:Interest received 59,201 10,106 22,183 91,490
Net Cash Provided (Used) byInvesting Activities 59,201 10,106 22,183 91,490
Net Increase (Decrease) in Cashand Cash Equivalents (4,667,674) (718,698) (183,586) (5,569,958)
Cash and Cash Equivalents at Beginning of Year 5,451,476 1,033,621 1,018,264 7,503,361
Cash and Cash Equivalents at End of Year 783,802$ 314,923$ 834,678$ 1,933,403$
Risk Management
Vehicle Maintenance
Building Occupancy
114

CITY OF BREA
COMBINING STATEMENT OF CASH FLOWSINTERNAL SERVICE FUNDSYEAR ENDED JUNE 30, 2012
Total Risk
Management Vehicle
Maintenance Building
Occupancy
Reconciliation of Operating Income to Net CashProvided (Used) by Operating Activities:Operating income (loss) (1,630,682)$ (687,271)$ (44,721)$ (2,362,674)$ Adjustments to reconcile operating income (loss) net cash provided (used) by operating activities:
Depreciation - 674,645 90,915 765,560 (Increase) decrease in accounts receivable (71,145) (13,918) - (85,063) (Increase) decrease in due from other governments - (3,728) (91,318) (95,046) (Increase) decrease in prepaid expense (416,920) - - (416,920) Increase (decrease) in accounts payable 9,024 (18,257) 42,675 33,442 Increase (decrease) in accrued liabilities 1,298 4,799 2,749 8,846 Increase (decrease) in claims and judgments 1,099,349 - - 1,099,349 Increase (decrease) in compensated absences - 147 4,462 4,609
Total Adjustments 621,606 643,688 49,483 1,314,777 Net Cash Provided (Used) by Operating Activities (1,009,076)$ (43,583)$ 4,762$ (1,047,897)$
Non-Cash Investing, Capital, and Financing Activities:There was no non-cash investing, capital or financing activities during fiscal year 2011-2012.
115

THIS PAGE INTENTIONALLY LEFT BLANK
116

FIDUCIARY FUNDS
The Fairway Center Community Facilities District 1988-1 Fund is an Agency Fund used to account for the collection and payment to the holders of the 1997 Special Tax Refunding Bonds. The Bexley Assessment District 2001-1 Fund is an Agency Fund used to account for the collection and payment of neighborhood sewer improvements. The Hillside Open Space Education Coalition is an Agency Fund used to account for the funds received to educate the public as to the importance of hillside preservation. The Imperial Center East Community Facilities District 1990-1 Fund is an Agency Fund used to account for the collection and payment to the holders of the 1999 Special Tax Note. The Downtown Community Facilities District 1996-1 Fund is an Agency Fund used to account for the collection and payment to the holders of the 1997 Special Tax Bonds. The Olinda Heights Community Facilities District 1997-1 Fund is an Agency Fund used to account for the collection and payment to the holders of the 2005 Special Tax Bonds. The Brea Plaza Community Facilities District 2008-02 Fund is an Agency Fund used to account for the collection and payment to the holders of the 2009 Special Tax Bonds. The Integrated Law and Justice Agency of Orange County (ILJAOC) Fund is an Agency Fund used to account for the collection and payment related to a joint venture agreement with several other public agencies of Orange County. The City acts as a treasurer for the ILJAOC.
117

CITY OF BREA
COMBINING BALANCE SHEETALL AGENCY FUNDSJUNE 30, 2012
Assets:Cash and investments 151,207$ -$ 512,982$ 281,757$ Receivables:Accounts - 46,495 - - Taxes - - - -
Prepaid items - - - - Due from other governments - - - - Restricted assets:Cash and investments with fiscal agents 207,809 - - -
Total Assets 359,016$ 46,495$ 512,982$ 281,757$
Liabilities:Accounts payable 19$ -$ -$ -$ Accrued liabilities 211 - 512,982 281,757 Due to City of Brea - 46,495 - - Due to external parties/other agencies 358,786 - - -
Total Liabilities 359,016 $ 46,495 $ 512,982 $ 281,757 $
Fairway Center Bexley
Hillside Open Space
Education Coalition
Imperial Center East
118
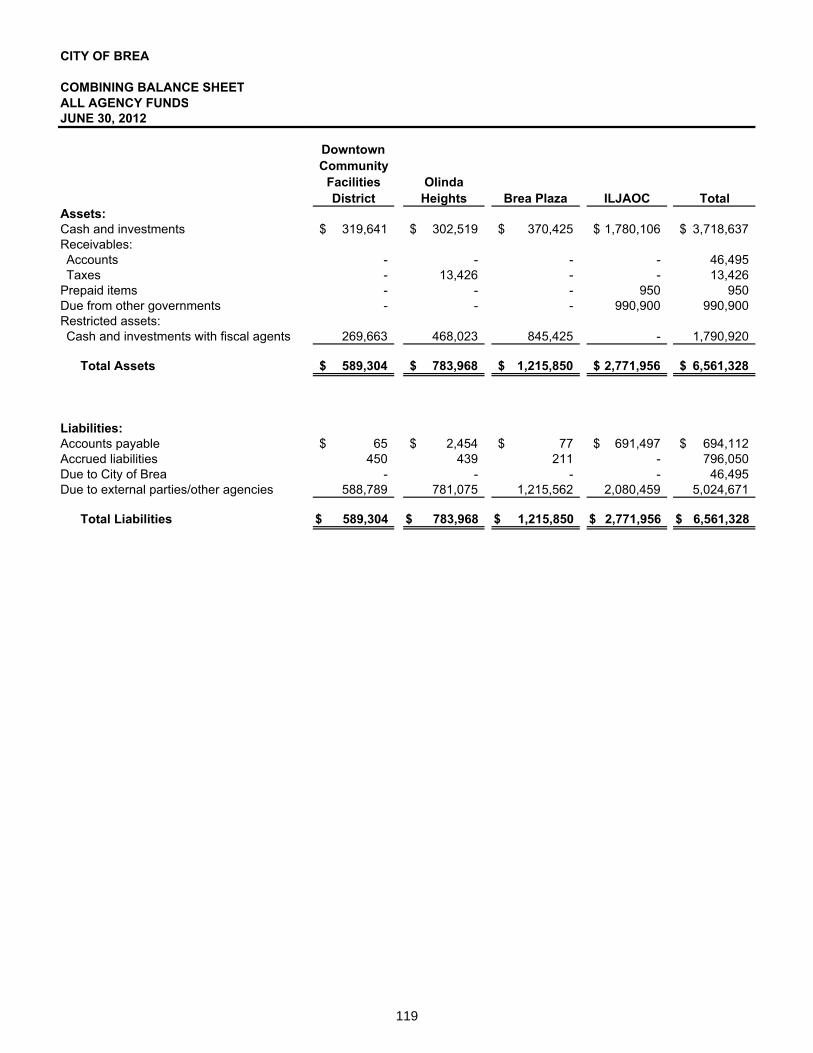
CITY OF BREA
COMBINING BALANCE SHEETALL AGENCY FUNDSJUNE 30, 2012
Assets:Cash and investmentsReceivables:AccountsTaxes
Prepaid itemsDue from other governmentsRestricted assets:Cash and investments with fiscal agents
Total Assets
Liabilities:Accounts payableAccrued liabilitiesDue to City of BreaDue to external parties/other agencies
Total Liabilities
Total
319,641$ 302,519$ 370,425$ 1,780,106$ 3,718,637$
- - - - 46,495 - 13,426 - - 13,426 - - - 950 950 - - - 990,900 990,900
269,663 468,023 845,425 - 1,790,920
589,304$ 783,968$ 1,215,850$ 2,771,956$ 6,561,328$
65$ 2,454$ 77$ 691,497$ 694,112$ 450 439 211 - 796,050
- - - - 46,495 588,789 781,075 1,215,562 2,080,459 5,024,671
589,304 $ 783,968 $ 1,215,850 $ 2,771,956 $ 6,561,328 $
Downtown Community
Facilities District
Olinda Heights Brea Plaza ILJAOC
119

CITY OF BREA
COMBINING STATEMENT OF CHANGES IN ASSETS AND LIABILITIESALL AGENCY FUNDSYEAR ENDED JUNE 30, 2012
Balance Balance7/1/2011 Additions Deductions 6/30/2012
Midbury
Assets:Cash and investments 156,265$ -$ 156,265$ -$ Receivables:
Taxes 175 - 175 - Total Assets 156,440$ -$ 156,440$ -$
Liabilities:Accrued liabilities 156,440$ -$ 156,440$ -$
Total Liabilities 156,440$ -$ 156,440$ -$
Fairway Center
Assets:Cash and investments 154,296$ 606,326$ 609,415$ 151,207$ Restricted assets:
Cash and investments with fiscal agents 209,293 201,265 202,749 207,809
Total Assets 363,589$ 807,591$ 812,164$ 359,016$
Liabilities:Accounts payable 19$ 5,430$ 5,430$ 19$ Accrued liabilities 211 422 422 211 Due to external parties/other agencies 363,359 581,250 585,823 358,786
Total Liabilities 363,589 $ 587,102 $ 591,675 $ 359,016 $
Bexley
Assets:Cash and investments -$ 23,353$ 23,353$ -$ Receivables:
Accounts 53,412 150,533 157,450 46,495
Total Assets 53,412$ 173,886$ 180,803$ 46,495$
Liabilities:Due to City of Brea 53,412$ 15,717$ 22,634$ 46,495$
Total Liabilities 53,412 $ 15,717 $ 22,634 $ 46,495 $
Hillside Open Space Education Coalition
Assets:Cash and investments 500,235$ 12,834$ 87$ 512,982$
Total Assets 500,235$ 12,834$ 87$ 512,982$
Liabilities:Accrued liabilities 500,235$ 21,655$ 8,908$ 512,982$
Total Liabilities 500,235 $ 21,655 $ 8,908 $ 512,982 $
120

CITY OF BREA
COMBINING STATEMENT OF CHANGES IN ASSETS AND LIABILITIESALL AGENCY FUNDSYEAR ENDED JUNE 30, 2012
Balance Balance7/1/2011 Additions Deductions 6/30/2012
Imperial Center East
Assets:Cash and investments 115,428$ 577,891$ 411,562$ 281,757$ Restricted assets:
Cash and investments 165,665 112,155 277,820 -
Total Assets 281,093$ 690,046$ 689,382$ 281,757$
Liabilities:Accrued liabilities 281,093 264,408 263,744 281,757
Total Liabilities 281,093 $ 264,408 $ 263,744 $ 281,757 $
Downtown Community Facilities District
Assets:Cash and investments 365,457$ 921,815$ 967,631$ 319,641$ Restricted assets:
Cash and investments with fiscal agents 268,063 253,909 252,309 269,663
Total Assets 633,520$ 1,175,724$ 1,219,940$ 589,304$
Liabilities:Accounts payable 1,089$ 21,087$ 22,111$ 65$ Accrued liabilities 424 492 466 450 Due to external parties/other agencies 632,007 258,293 301,511 588,789
Total Liabilities 633,520 $ 279,872 $ 324,088 $ 589,304 $
Olinda Heights
Assets:Cash and investments 313,335$ 1,308,084$ 1,318,900$ 302,519$ Receivables:
Taxes 9,394 13,426 9,394 13,426 Restricted assets:
Cash and investments with fiscal agents 465,910 445,421 443,308 468,023
Total Assets 788,639$ 1,766,931$ 1,771,602$ 783,968$
Liabilities:Accounts payable 42$ 9,502$ 7,090$ 2,454$ Accrued liabilities 424 481 466 439 Due to external parties/other agencies 788,173 473,543 480,641 781,075
Total Liabilities 788,639 $ 483,526 $ 488,197 $ 783,968 $
121

CITY OF BREA
COMBINING STATEMENT OF CHANGES IN ASSETS AND LIABILITIESALL AGENCY FUNDSYEAR ENDED JUNE 30, 2012
Balance Balance7/1/2011 Additions Deductions 6/30/2012
Brea Plaza
Assets:Cash and investments 317,568$ 1,514,925$ 1,462,068$ 370,425$ Restricted assets:
Cash and investments with fiscal agents 842,990 577,555 575,120 845,425
Total Assets 1,160,558$ 2,092,480$ 2,037,188$ 1,215,850$
Liabilities:Accounts payable 75$ 3,223$ 3,221$ 77$ Accrued liabilities 211 210 210 211 Due to external parties/other agencies 1,160,272 647,613 592,323 1,215,562
Total Liabilities 1,160,558 $ 651,046 $ 595,754 $ 1,215,850 $
ILJAOC
Assets:Cash and investments -$ 5,602,450$ 3,822,344$ 1,780,106$ Prepaid costs - 48,469 47,519 950 Due from other governments - 1,980,237 989,337 990,900
Total Assets -$ 7,631,156$ 4,859,200$ 2,771,956$
Liabilities:Accounts payable -$ 1,685,161$ 993,664$ 691,497$ Due to external parties/other agencies - 3,674,889 1,594,430 2,080,459
Total Liabilities - $ 5,360,050 $ 2,588,094 $ 2,771,956 $
Totals - All Agency Funds
Assets:Pooled cash and investments 1,922,584$ 10,567,678$ 8,771,625$ 3,718,637$ Receivables:
Accounts 53,412 150,533 157,450 46,495 Taxes 9,569 13,426 9,569 13,426
Prepaid costs - 48,469 47,519 950 Due from other governments - 1,980,237 989,337 990,900 Restricted assets:
Cash and investments 165,665 112,155 277,820 - Cash and investments with fiscal agents 1,786,256 1,478,150 1,473,486 1,790,920
Total Assets 3,937,486$ 14,350,648$ 11,726,806$ 6,561,328$
Liabilities:Accounts payable 1,225$ 1,724,403$ 1,031,516$ 694,112$ Accrued liabilities 939,038 287,668 430,656 796,050 Due to City of Brea 53,412 15,717 22,634 46,495 Due to external parties/other agencies 2,943,811 5,635,588 3,554,728 5,024,671
Total Liabilities 3,937,486 $ 7,663,376 $ 5,039,534 $ 6,561,328 $
122

STATISTICAL SECTION
This part of the City of Brea’s comprehensive annual financial report presents detailed information as a context for understanding what the information in the financial statements, note disclosures, and required supplementary information says about the City's overall financial health. Contents Page Financial Trends 125 These schedules contain trend information to help the reader understand how the city's financial performance and well-being have changed over time. Revenue Capacity 130 These schedules contain information to help the reader assess the factors affecting the city's ability to generate its property and sales taxes. Debt Capacity 134 These schedules present information to help the reader assess the affordability of the city's current levels of outstanding debt and the city's ability to issue additional debt in the future. Demographic and Economic Information 139 These schedules offer demographic and economic indicators to help the reader understand the environment within which the city's financial activities take place. Operating Information 141 These schedules contain information about the city's operations and resources to help the reader understand how the city's financial information relates to the services the city provides and the activities it performs. Sources: Unless otherwise noted, the information in these schedules is derived from the comprehensive annual financial reports for the relevant year.
123

THIS PAGE INTENTIONALLY LEFT BLANK
124

CIT
Y O
F B
REA
NET
ASS
ETS
BY
CO
MPO
NEN
TLA
ST S
EVEN
FIS
CA
L YE
AR
S(A
ccru
al b
asis
of a
ccou
ntin
g)
Fisc
al Y
ear
Fisc
al Y
ear
Fisc
al Y
ear
Fisc
al Y
ear
Fisc
al Y
ear
Fisc
al Y
ear
Fisc
al Y
ear
2005
-06
2006
-07
2007
-08
2008
-09
2009
-10
2010
-11
2011
-12
1
Gov
ernm
enta
l Act
iviti
es
Inve
sted
in c
apita
l ass
ets,
net
of r
elat
ed d
ebt
39,5
35,6
24$
43,1
21,2
85$
44,7
51,7
94$
43,3
50,9
36$
49
,313
,284
$
40
,774
,347
$
36,8
46,3
17$
Res
trict
ed38
,280
,689
39
,185
,059
43
,477
,959
46
,271
,092
62,3
25,3
48
73,8
00,7
55
26
,596
,796
U
nres
trict
ed(4
5,11
8,15
9)
(3
5,24
9,89
2)
(2
5,45
9,51
9)
(2
1,20
3,64
2)
(3
4,37
2,60
2)
(33,
277,
968)
157,
129,
179
Tota
l gov
ernm
enta
l act
iviti
es n
et a
sset
s32
,698
,154
$
47
,056
,452
$
62
,770
,234
$
68
,418
,386
$
77,2
66,0
30$
81,2
97,1
34$
22
0,57
2,29
2$
Bus
ines
s-ty
pe A
ctiv
ities
In
vest
ed in
cap
ital a
sset
s, n
et o
f rel
ated
deb
t36
,503
,262
$
39
,952
,397
$
42
,960
,060
$
44
,774
,355
$
45,6
90,8
42
27,8
69,2
96
36
,107
,809
R
estri
cted
2,59
7,92
5
2,61
3,59
2
2,62
3,07
1
1,88
5,57
3
-
7,
028,
848
5,
217,
299
Unr
estri
cted
9,25
1,05
1
7,45
7,41
6
6,93
0,52
7
6,36
8,11
2
7,10
1,98
7
13
,592
,110
7,69
5,07
7
Tota
l bus
ines
s-ty
pe a
ctiv
ities
net
ass
ets
48,3
52,2
38$
50,0
23,4
05$
52,5
13,6
58$
53,0
28,0
40$
52
,792
,829
$
48
,490
,254
$
49,0
20,1
85$
Prim
ary
Gov
ernm
ent
In
vest
ed in
cap
ital a
sset
s, n
et o
f rel
ated
deb
t76
,038
,886
$
83
,073
,682
$
87
,711
,854
$
88
,125
,291
$
95,0
04,1
26$
68,6
43,6
43$
72
,954
,126
$
R
estri
cted
40,8
78,6
14
41,7
98,6
51
46,1
01,0
30
48,1
56,6
65
62
,325
,348
80
,829
,603
31,8
14,0
95
Unr
estri
cted
(35,
867,
108)
(27,
792,
476)
(18,
528,
992)
(14,
835,
530)
(27,
270,
615)
(1
9,68
5,85
8)
16
4,82
4,25
6
To
tal p
rimar
y go
vern
men
t net
ass
ets
81,0
50,3
92$
97,0
79,8
57$
115,
283,
892
$
121,
446,
426
$
130,
058,
859
$
12
9,78
7,38
8$
269,
592,
477
$
As
prov
ided
inG
AS
BS
tate
men
t44
the
City
ofB
rea
has
elec
ted
tore
port
fisca
lyea
rsbe
ginn
ing
2005
-06
and
forw
ard
As
prov
ided
inG
AS
BS
tate
men
t44,
the
City
ofB
rea
has
elec
ted
tore
port
fisca
lyea
rsbe
ginn
ing
2005
-06
and
forw
ard.
1 Dur
ing
the
fisca
l yea
r end
ed J
une
30, 2
012,
the
asse
ts, l
iabi
litie
s (c
urre
nt a
nd lo
ng-te
rm d
ebt o
blig
atio
ns) a
nd fu
nd b
alan
ces
of t
he B
rea
Red
evel
opm
ent A
genc
y w
ere
trans
ferr
ed to
the
Suc
cess
or A
genc
y on
Feb
ruar
y 1,
201
2, a
s a
resu
lt of
the
diss
olut
ion
of t
he R
edev
elop
men
t Age
ncie
s in
Cal
iforn
ia.
125

CIT
Y O
F B
REA
CH
AN
GES
IN N
ET A
SSET
SLA
ST S
EVEN
FIS
CA
L YE
AR
S(A
ccru
al b
asis
of a
ccou
ntin
g)Fi
scal
Yea
rFi
scal
Yea
rFi
scal
Yea
rFi
scal
Yea
rFi
scal
Yea
rFi
scal
Yea
rFi
scal
Yea
r20
05-0
620
06-0
720
07-0
820
08-0
920
09-1
020
10-1
120
11-1
2Ex
pens
es:
Gov
ernm
enta
l act
iviti
es:
Gen
eral
gov
ernm
ent
15,9
21,2
16$
12
,437
,009
$
10,1
79,9
67$
11,5
01,6
16$
8,
516,
391
$
7,53
0,94
8$
9,
747,
589
$
Pub
lic s
afet
y29
,615
,376
30,7
85,3
79
34
,611
,575
36
,993
,799
35,7
56,8
11
36
,221
,221
39
,166
,833
Com
mun
ity D
evel
opm
ent
11,2
35,0
23
10
,488
,918
7,62
3,15
8
9,
214,
020
17,2
13,9
48
11
,056
,047
2,
312,
830
Com
mun
ity s
ervi
ces
5,37
4,16
3
6,31
6,66
5
6,65
9,38
6
6,
907,
228
6,15
4,49
5
6,
106,
128
6,62
3,22
0
P
ublic
Wor
ks3,
782,
973
4,
033,
064
8,
836,
925
10,6
08,0
01
7,
075,
398
19,9
91,0
34
15,2
40,6
04
In
tere
st o
n lo
ng-te
rm d
ebt
9,79
5,46
3
9,37
9,80
8
9,14
2,55
1
8,
779,
300
9,60
7,50
4
9,
228,
093
2,41
4,05
3
To
tal g
over
nmen
tal a
ctiv
ities
exp
ense
s75
,724
,214
73,4
40,8
43
77
,053
,562
84
,003
,964
84,3
24,5
47
90
,133
,471
75
,505
,129
Bus
ines
s-ty
pe a
ctiv
ities
:U
rban
run-
off
-
20
0,15
8
17
4,30
2
226,
256
28
4,69
2
244,
479
26
9,51
8
Wat
er u
tility
9,85
4,57
2
11,2
20,5
38
11
,195
,152
11
,272
,767
14,0
25,3
54
14
,067
,772
15
,512
,551
Sew
er u
tility
674,
799
698,
152
758,
958
1,
307,
733
1,07
3,77
5
1,
080,
134
1,22
7,08
7
S
anita
tion
2,20
1,66
8
2,28
9,88
8
2,34
8,28
1
2,
444,
076
2,48
6,58
8
2,
565,
324
2,70
6,95
4
In
form
atio
n Te
chno
logy
Ext
erna
l Sup
port
1,24
5,05
4
898,
850
979,
157
1,
329,
165
1,95
8,14
0
1,
230,
704
1,26
9,80
0
To
tal b
usin
ess-
type
act
iviti
es e
xpen
ses
13,9
76,0
93
15
,307
,586
15,4
55,8
50
16,5
79,9
97
19
,828
,549
19,1
88,4
13
20,9
85,9
10
To
talp
rimar
ygo
vern
men
texp
ense
s89
,700
,307
$88
,748
,429
$92
,509
,412
$10
0,58
3,96
1$
104,
153,
096
$10
9,32
1,88
4$
96,4
91,0
39$
Tota
lprim
ary
gove
rnm
ente
xpen
ses
89,7
00,3
07$
88,7
48,4
29$
92,5
09,4
12$
100,
583,
961
$10
4,15
3,09
6$
109,
321,
884
$96
,491
,039
$
Prog
ram
Rev
enue
s:G
over
nmen
tal a
ctiv
ities
:C
harg
es fo
r ser
vice
s:G
ener
al g
over
nmen
t33
0,73
6$
60
4,85
6$
1,
036,
421
$
1,01
3,98
5$
73
0,87
5$
433,
932
$
2,
177,
602
$
Pub
lic s
afet
y10
,955
,628
11,1
92,2
57
12
,201
,407
12
,624
,891
13,6
51,0
52
12
,878
,402
13
,155
,339
Com
mun
ity D
evel
opm
ent
861,
624
1,04
1,27
5
783,
633
21
,926
604,
565
56
7,23
7
583,
339
C
omm
unity
ser
vice
s2,
833,
247
2,
856,
575
3,
015,
379
3,07
4,71
7
3,
304,
933
2,24
8,60
3
1,
737,
725
Pub
lic W
orks
686,
196
553,
802
484,
085
49
0,30
2
469,
533
2,
262,
329
1,95
5,18
8
O
pera
ting
cont
ribut
ions
and
gra
nts
4,93
8,36
0
6,97
2,24
9
8,27
9,19
0
6,
362,
517
5,11
1,92
3
3,
542,
733
6,36
4,11
4
C
apita
l con
tribu
tions
and
gra
nts
5,06
2,63
1
5,48
0,87
9
6,94
1,24
9
6,
761,
134
15,6
40,5
54
4,
501,
863
8,47
2,77
8
To
tal g
over
nmen
tal a
ctiv
ities
pro
gram
reve
nues
25,6
68,4
22
28
,701
,893
32,7
41,3
64
30,3
49,4
72
39
,513
,435
26,4
35,0
99
34,4
46,0
85
Bus
ines
s-ty
pe a
ctiv
ities
:C
harg
es fo
r ser
vice
s:U
rban
run-
off
-
19
6,79
9
31
4,76
2
329,
143
33
3,76
0
351,
123
37
7,95
0
Wat
er u
tilit y
8,71
7,63
910
,302
,495
10,4
56,5
0710
,565
,259
11,3
44,6
9711
,834
,601
14,0
85,1
33S
ewer
util
ity40
2,53
2
1,
443,
307
1,
776,
075
1,87
5,01
4
1,
894,
176
2,00
8,50
7
1,
932,
161
San
itatio
n2,
666,
432
2,
734,
180
2,
844,
356
2,95
9,53
6
3,
037,
508
3,13
8,12
5
3,
158,
430
Info
rmat
ion
Tech
nolo
gy E
xter
nal S
uppo
rt76
2,23
4
75
9,96
7
1,
026,
609
1,67
9,24
9
1,
546,
020
1,64
2,75
6
1,
676,
577
Ope
ratin
g co
ntrib
utio
ns a
nd g
rant
s10
,648
--
--
11,3
23
11,3
23
126

Cap
ital c
ontri
butio
ns a
nd g
rant
s76
3,92
4
35
8,24
0
19
2,52
7
214,
182
38
9,90
5
Tota
l bus
ines
s-ty
pe a
ctiv
ities
pro
gram
reve
nues
13,3
23,4
09
15
,794
,988
16,6
10,8
36
17,6
22,3
83
18
,546
,066
18,9
86,4
35
21,2
41,5
74
P
rimar
y go
vern
men
t pro
gram
reve
nues
38,9
91,8
31$
44
,496
,881
$
49,3
52,2
00$
47,9
71,8
55$
58
,059
,501
$
45,4
21,5
34$
55,6
87,6
59$
Net
(Exp
ense
)/Rev
enue
:G
over
nmen
tal a
ctiv
ities
(50,
055,
792)
$
(44,
738,
950)
$
(44,
312,
198)
$
(5
3,65
4,49
2)$
(44,
811,
112)
$
(6
3,69
8,37
2)$
(41,
059,
044)
$
B
usin
ess-
type
act
iviti
es(6
52,6
84)
48
7,40
2
1,
154,
986
1,04
2,38
6
(1
,282
,483
)
(2
01,9
78)
255,
664
To
tal p
rimar
y go
vern
men
t net
exp
ense
(50,
708,
476)
$
(44,
251,
548)
$
(43,
157,
212)
$
(5
2,61
2,10
6)$
(46,
093,
595)
$
(6
3,90
0,35
0)$
(40,
803,
380)
$
Gen
eral
Rev
enue
s an
d O
ther
Cha
nges
in N
et A
sset
s:G
over
nmen
tal a
ctiv
ities
:Ta
xes P
rope
rty ta
xes
31,3
03,3
42$
31
,394
,371
$
34,2
87,2
89$
34,5
80,1
06$
31
,765
,514
$
35,4
80,2
31$
31,9
74,0
80$
Tr
ansi
ent o
ccup
ancy
taxe
s1,
299,
306
1,
251,
177
1,
313,
822
1,21
3,36
2
1,
176,
279
1,22
7,16
8
1,
280,
631
Sal
es ta
xes
18,4
72,3
70
18
,539
,330
18,0
82,9
88
16,4
92,2
09
15
,065
,207
16,9
18,5
23
19,2
48,7
71
Fr
anch
ise
taxe
s1,
341,
242
1,
481,
163
1,
454,
010
1,51
3,46
8
1,
480,
286
1,70
7,49
7
1,
706,
631
Bus
ines
s lic
ense
s ta
xes
1,00
7,76
3
1,02
8,94
3
1,07
1,52
8
1,
079,
260
1,03
5,03
2
94
8,18
4
975,
742
O
ther
taxe
s2,
116,
492
2,
156,
450
42
8,93
3
371,
063
39
6,67
6
379,
639
55
5,29
1
Mot
or v
ehic
le in
lieu
320,
531
261,
414
224,
381
18
3,02
616
3,47
5
184,
311
70
,227
Use
of m
oney
and
pro
perty
200,
149
1,11
3,89
7
1,66
3,41
8
1,
425,
966
2,01
2,56
5
4,
054,
982
1,24
2,18
4
G
ain
on s
ale
of a
sset
s95
6,68
2
-
--
--
-C
ontri
butio
ns to
per
man
ent f
unds
--
--
--
1,32
2,89
1
O
ther
1,
115,
642
2,
014,
354
1,
756,
352
1,68
7,27
8
56
7,31
0
1,67
5,42
8
1,
177,
781
Ext
raor
dina
ryga
in o
n di
ssol
utio
n of
Red
evel
opm
ent
Age
ncy1
--
--
--
119,
686,
954
gy
119,
686,
954
Tran
sfer
s72
9,37
2
(1
43,8
51)
(169
,931
)
92
0,55
7
(3,5
88)
5,15
3,51
4
1,
093,
019
Tota
l gov
ernm
enta
l act
iviti
es
58,8
62,8
91
59
,097
,248
60,1
12,7
90
59,4
66,2
95
53
,658
,756
67,7
29,4
77
180,
334,
202
Bus
ines
s-ty
pe a
ctiv
ities
:U
se o
f mon
ey a
nd p
rope
rty26
6,60
5
59
4,26
8
48
5,07
0
392,
553
97
2,85
4
1,05
2,91
6
41
5,25
6
Oth
er34
0,05
3
44
5,64
6
68
0,26
6
-70
,830
-95
2,03
0
Tran
sfer
s(7
29,3
72)
14
3,85
1
16
9,93
1
(920
,557
)
3,58
8
(5,1
53,5
14)
(1
,093
,019
)
To
tal b
usin
ess-
type
act
iviti
es(1
22,7
14)
1,
183,
765
1,
335,
267
(528
,004
)
1,04
7,27
2
(4
,100
,598
)
274,
267
To
tal p
rimar
y go
vern
men
t58
,740
,177
$
60,2
81,0
13$
61
,448
,057
$
58
,938
,291
$
54,7
06,0
28$
63
,628
,879
$
18
0,60
8,46
9$
Cha
nge
in N
et A
sset
s:G
over
nmen
tal a
ctiv
ities
8,80
7,09
9$
14,3
58,2
98$
15
,800
,592
$
5,
811,
803
$
8,84
7,64
4$
4,
031,
105
$
139,
275,
158
$
B
usin
ess-
type
act
iviti
es(7
75,3
98)
1,
671,
167
2,
490,
253
514,
382
(2
35,2
11)
(4
,302
,576
)
529,
931
To
tal p
rimar
y go
vern
men
t8,
031,
701
$
16
,029
,465
$
18,2
90,8
45$
6,32
6,18
5$
8,
612,
433
$
(271
,471
)$
13
9,80
5,08
9$
1 Dur
ing
the
fisca
l yea
r end
ed J
une
30, 2
012,
the
asse
ts, l
iabi
litie
s an
d fu
nd b
alan
ces
of th
e B
rea
Red
evel
opm
ent A
genc
y w
ere
trans
ferr
ed to
the
Suc
cess
or A
genc
y on
Feb
ruar
y 1,
201
2, a
s a
resu
lt of
127

CIT
Y O
F B
REA
FUN
D B
ALA
NC
ES -
GO
VER
NM
ENTA
L FU
ND
SLA
ST S
EVEN
FIS
CA
L YE
AR
S(M
odifi
ed a
ccru
al b
asis
of a
ccou
ntin
g) Fisc
al Y
ear
Fisc
al Y
ear
Fisc
al Y
ear
Fisc
al Y
ear
Fisc
al Y
ear
Fisc
al Y
ear
Fisc
al Y
ear
2005
-06
2006
-07
2007
-08
2008
-09
2009
-10
2010
-111
2011
-122
Gen
eral
Fun
d
Res
erve
d1,
984,
229
$
2,
669,
465
$
2,
322,
137
$
1,
380,
677
$
78
5,54
5$
-
-
Unr
eser
ved
18,2
03,8
68
19
,727
,910
19
,831
,412
20
,855
,888
21,3
39,1
80
-
-
Non
spen
dabl
e-
-
-
-
-
362,
049
1,58
0,77
8
Res
trict
ed-
-
-
-
-
870,
294
926,
483
C
omm
itted
-
-
-
-
-
7,
048,
285
6,
546,
809
A
ssig
ned
-
-
-
-
-
79
8,91
5
59
0,61
3
Una
ssig
ned
-
-
-
-
-
16
,998
,367
21,0
75,7
61
To
tal g
ener
al fu
nd20
,188
,097
$
22,3
97,3
75$
22
,153
,549
$
22,2
36,5
65$
22
,124
,725
$
26,0
77,9
10$
30
,720
,444
$
All
Oth
er G
over
nmen
tal F
unds
R
eser
ved
18,5
39,6
91$
39
,552
,796
$
38
,414
,600
$
28
,011
,213
$
47,4
77,0
75
-
-
Unr
eser
ved,
repo
rted
in:
Spe
cial
reve
nue
fund
s14
,873
,497
13,3
00,4
81
8,44
1,72
9
10
,753
,310
9,62
3,24
5
-
-
Cap
ital p
roje
cts
fund
s41
,527
,667
22,0
22,4
16
17,8
93,7
45
32,3
41,6
56
22
,796
,432
-
-
Deb
t ser
vice
fund
s16
,200
,927
16,6
67,7
90
18,4
83,2
72
17,9
27,2
43
12
,049
,980
-
-
Non
spen
dabl
e-
-
-
-
-
21,7
11,0
76
-
R
estri
cted
-
-
-
-
-
70
,255
,597
25,6
70,3
13
A
ssig
ned
-
-
-
-
-
9,
915,
996
1,
705,
413
Una
ssig
ned
-
-
-
-
-
(3
35,3
74)
(54,
141)
Tota
lall
othe
rgov
ernm
enta
lfun
ds91
141
782
$91
543
483
$83
233
346
$89
033
422
$91
946
732
$10
154
729
5$
2732
158
5$
Tota
l all
othe
r gov
ernm
enta
lfun
ds91
,141
,782
$
91,5
43,4
83$
83,2
33,3
46$
89,0
33,4
22$
91,9
46,7
32$
101,
547,
295
$27
,321
,585
$
1D
urin
g th
e fis
cal y
ear e
nded
Jun
e 30
, 201
1, th
e C
ity a
dopt
ed G
AS
B S
tate
men
t 54
whi
ch e
stab
lishe
d ne
w c
ateg
orie
s fo
r fun
d ba
lanc
e.
2 Dur
ing
the
fisca
l yea
r end
ed J
une
30, 2
012,
the
asse
ts, l
iabi
litie
s (c
urre
nt a
nd lo
ng-te
rm d
ebt o
blig
atio
ns) a
nd fu
nd b
alan
ces
of th
e B
rea
Red
evel
opm
ent A
genc
y w
ere
trans
ferr
ed t
o th
e S
ucce
ssor
Age
ncy
on F
ebru
ary
1, 2
012,
as
a re
sult
of th
e di
ssol
utio
n of
Red
evel
opm
ent A
genc
ies
in C
alifo
rnia
.
As
prov
ided
in G
AS
B S
tate
men
t 44,
the
City
of B
rea
has
elec
ted
to re
port
fisca
l yea
rs b
egin
ning
200
5-06
and
forw
ard.
128
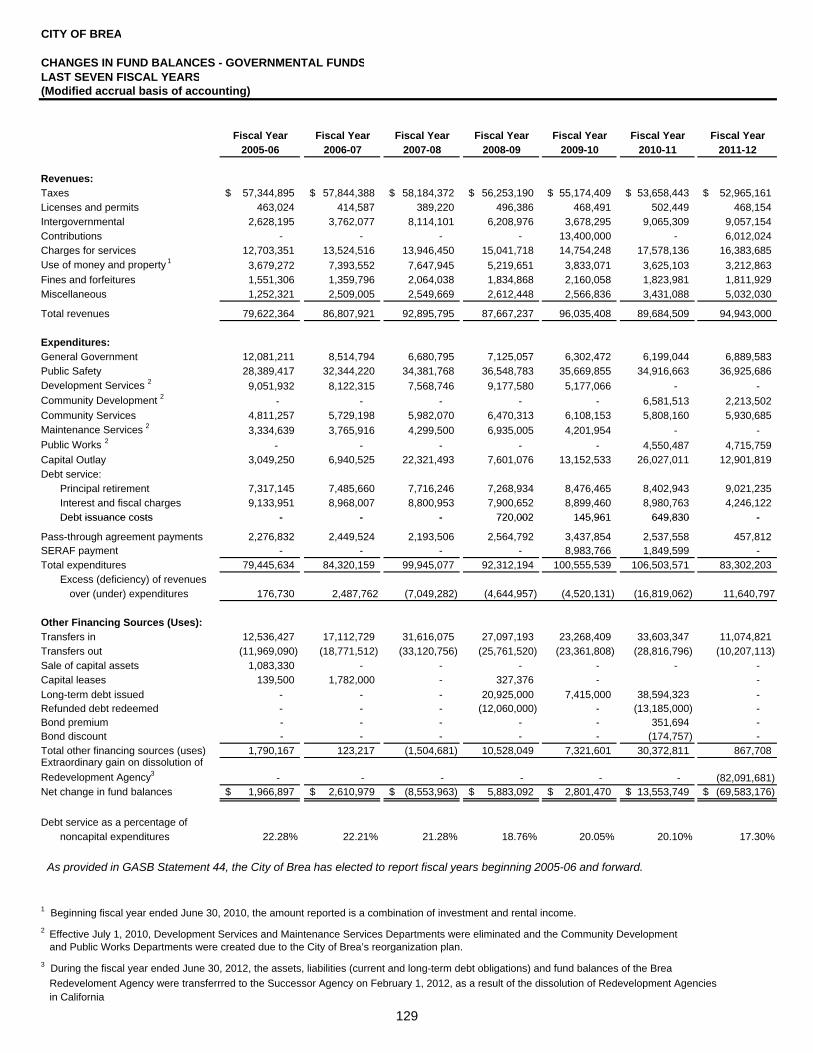
CITY OF BREA
CHANGES IN FUND BALANCES - GOVERNMENTAL FUNDSLAST SEVEN FISCAL YEARS(Modified accrual basis of accounting)
Fiscal Year Fiscal Year Fiscal Year Fiscal Year Fiscal Year Fiscal Year Fiscal Year2005-06 2006-07 2007-08 2008-09 2009-10 2010-11 2011-12
Revenues:Taxes 57,344,895$ 57,844,388$ 58,184,372$ 56,253,190$ 55,174,409$ 53,658,443$ 52,965,161$ Licenses and permits 463,024 414,587 389,220 496,386 468,491 502,449 468,154 Intergovernmental 2,628,195 3,762,077 8,114,101 6,208,976 3,678,295 9,065,309 9,057,154 Contributions - - - - 13,400,000 - 6,012,024 Charges for services 12,703,351 13,524,516 13,946,450 15,041,718 14,754,248 17,578,136 16,383,685 Use of money and property 1 3,679,272 7,393,552 7,647,945 5,219,651 3,833,071 3,625,103 3,212,863 Fines and forfeitures 1,551,306 1,359,796 2,064,038 1,834,868 2,160,058 1,823,981 1,811,929 Miscellaneous 1,252,321 2,509,005 2,549,669 2,612,448 2,566,836 3,431,088 5,032,030
Total revenues 79,622,364 86,807,921 92,895,795 87,667,237 96,035,408 89,684,509 94,943,000
Expenditures:General Government 12,081,211 8,514,794 6,680,795 7,125,057 6,302,472 6,199,044 6,889,583 Public Safety 28,389,417 32,344,220 34,381,768 36,548,783 35,669,855 34,916,663 36,925,686 Development Services 2 9,051,932 8,122,315 7,568,746 9,177,580 5,177,066 - - Community Development 2 - - - - - 6,581,513 2,213,502 Community Services 4,811,257 5,729,198 5,982,070 6,470,313 6,108,153 5,808,160 5,930,685 Maintenance Services 2 3,334,639 3,765,916 4,299,500 6,935,005 4,201,954 - - Public Works 2 - - - - - 4,550,487 4,715,759 Capital Outlay 3,049,250 6,940,525 22,321,493 7,601,076 13,152,533 26,027,011 12,901,819 Debt service:
Principal retirement 7,317,145 7,485,660 7,716,246 7,268,934 8,476,465 8,402,943 9,021,235 Interest and fiscal charges 9,133,951 8,968,007 8,800,953 7,900,652 8,899,460 8,980,763 4,246,122 Debt issuance costs - - - 720 002 145 961 649 830 -Debt issuance costs - - - 720,002 145,961 649,830 -
Pass-through agreement payments 2,276,832 2,449,524 2,193,506 2,564,792 3,437,854 2,537,558 457,812 SERAF payment - - - - 8,983,766 1,849,599 - Total expenditures 79,445,634 84,320,159 99,945,077 92,312,194 100,555,539 106,503,571 83,302,203
Excess (deficiency) of revenues over (under) expenditures 176,730 2,487,762 (7,049,282) (4,644,957) (4,520,131) (16,819,062) 11,640,797
Other Financing Sources (Uses):Transfers in 12,536,427 17,112,729 31,616,075 27,097,193 23,268,409 33,603,347 11,074,821 Transfers out (11,969,090) (18,771,512) (33,120,756) (25,761,520) (23,361,808) (28,816,796) (10,207,113) Sale of capital assets 1,083,330 - - - - - - Capital leases 139,500 1,782,000 - 327,376 - - Long-term debt issued - - - 20,925,000 7,415,000 38,594,323 - Refunded debt redeemed - - - (12,060,000) - (13,185,000) - Bond premium - - - - - 351,694 - Bond discount - - - - - (174,757) - Total other financing sources (uses) 1,790,167 123,217 (1,504,681) 10,528,049 7,321,601 30,372,811 867,708 Extraordinary gain on dissolution of Redevelopment Agency3 - - - - - - (82,091,681) Net change in fund balances 1,966,897$ 2,610,979$ (8,553,963)$ 5,883,092$ 2,801,470$ 13,553,749$ (69,583,176)$
Debt service as a percentage of noncapital expenditures 22.28% 22.21% 21.28% 18.76% 20.05% 20.10% 17.30%
1 Beginning fiscal year ended June 30, 2010, the amount reported is a combination of investment and rental income.2 Effective July 1, 2010, Development Services and Maintenance Services Departments were eliminated and the Community Development and Public Works Departments were created due to the City of Brea’s reorganization plan.3 During the fiscal year ended June 30, 2012, the assets, liabilities (current and long-term debt obligations) and fund balances of the Brea Redeveloment Agency were transferrred to the Successor Agency on February 1, 2012, as a result of the dissolution of Redevelopment Agencies in California
As provided in GASB Statement 44, the City of Brea has elected to report fiscal years beginning 2005-06 and forward.
129

CITY OF BREA
ASSESSED VALUE AND ESTIMATED ACTUAL VALUE OF TAXABLE PROPERTYLAST TEN FISCAL YEARS
Fiscal TotalYear Taxable Total
Ended Residential Commercial Industrial Other Assessed DirectJune 30 Property Property Property Property 1 Value 2 Tax Rate
2003 2,041,958,478 938,867,240 690,177,536 904,264,629 4,575,267,883 0.59430%
2004 2,356,336,585 1,220,027,729 864,750,739 480,714,590 4,921,829,643 0.58398%
2005 2,583,635,646 991,557,410 647,793,880 1,160,480,511 5,383,467,447 0.57347%
2006 2,859,164,791 997,440,500 673,513,691 1,260,261,500 5,790,380,482 0.56960%
2007 3,150,677,401 1,121,437,204 725,636,109 1,503,284,513 6,501,035,227 0.58614%
2008 3,369,302,387 1,178,077,438 730,088,623 1,528,851,283 6,806,319,731 0.57900%
2009 3,420,432,796 1,535,537,061 1,161,803,074 917,687,313 7,035,460,244 0.58067%
2010 3,319,962,213 1,554,892,370 1,199,008,537 905,419,292 6,979,282,412 0.58885%
2011 3,579,683,419 1,548,534,540 1,135,559,625 753,830,318 7,017,607,902 0.58723%
2012 3,637,044,394 1,543,677,299 1,077,624,463 723,537,802 6,981,883,958 0.58355%
1 Other property includes recreational, institutional, vacant, and miscellaneous property.2 Tax-exempt property is excluded from the total taxable assessed value.
NOTE:
Sources: HdL Coren & Cone; Orange County Assessor
In 1978 the voters of the State of California passed Proposition 13 which limited property taxes to a total maximum rate of 1%based upon the assessed value of the property being taxed. Each year, the assessed value of property may be increased byan "inflation factor" (limited to a maximum increase of 2%). With few exceptions, property is only reassessed at the time thatit is sold to a new owner. At that point, the new assessed value is reassessed at the purchase price of the property sold.The assessed valuation data shown above represents the only data currently available with respect to the actual marketvalue of taxable property and is subject to the limitations described above.
130

CIT
Y O
F B
REA
DIR
ECT
AN
D O
VER
LAPP
ING
PR
OPE
RTY
TA
X R
ATE
SLA
ST S
EVEN
FIS
CA
L YE
AR
S
Fisc
al Y
ear
Fisc
al Y
ear
Fisc
al Y
ear
Fisc
al Y
ear
Fisc
al Y
ear
Fisc
al Y
ear
Fisc
al Y
ear
2005
-06
2006
-07
2007
-08
2008
-09
2009
-10
2010
-11
2011
-12
City
Dire
ct R
ates
:C
ity o
f Bre
a0.
1290
2$
0.12
902
$
0.
1290
2$
0.12
902
$
0.
1290
2$
0.
1290
2$
0.
1290
2$
City
of B
rea
Par
amed
ics
Tax
10.
0450
0
0.04
500
0.
0450
0
0.04
500
0.
0450
0
0.
0450
0
0.
0450
0
Tota
l City
Dire
ct R
ate
0.17
402
0.
1740
2
0.17
402
0.
1740
2
0.17
402
0.17
402
0.17
402
Ove
rlapp
ing
Rat
es:
Bre
a-O
linda
Uni
fied
Sch
ool D
istri
ct G
ener
al F
und
0.43
988
0.
4398
8
0.44
000
0.
4399
0
0.43
990
0.43
990
0.43
990
B
rea-
Olin
da U
nifie
d S
choo
l Dis
trict
Bon
ds0.
0243
6
0.02
183
0.
0224
1
0.02
270
0.
0228
5
0.
0242
6
0.
0236
7
NO
C C
omm
unity
Col
lege
Gen
eral
Fun
d0.
0666
3
0.06
663
0.
0670
0
0.06
660
0.
0666
0
0.
0666
0
0.
0666
0
NO
C C
omm
unity
Col
lege
Bon
ds0.
0166
6
0.01
444
0.
0150
2
0.01
493
0.
0166
2
0.
0175
8
0.
0174
2
Edu
catio
nal R
even
ue A
ugm
enta
tion
Fund
0.18
261
0.
1826
1
0.18
300
0.
1826
0
0.18
260
0.18
260
0.18
260
O
rang
e C
ount
y D
epar
tmen
t of E
duca
tion
0.03
908
0.
0390
8
0.03
900
0.
0391
0
0.03
910
0.03
910
0.03
910
O
rang
e C
ount
y Fl
ood
Con
trol D
istri
ct
0.01
888
0.
0188
8
0.01
900
0.
0188
8
0.01
880
0.01
880
0.01
880
O
rang
e C
ount
y G
ener
al F
und
0.05
885
0.
0588
5
0.05
900
0.
0589
0
0.05
890
0.05
890
0.05
890
O
rang
e C
ount
y H
arbo
rs, B
each
es &
Par
ks
0.01
459
0.
0145
9
0.01
460
0.
0145
9
0.01
459
0.01
459
0.01
459
O
rang
e C
ount
y Li
brar
y D
istri
ct
0.01
592
0.
0159
2
0.01
590
0.
0159
2
0.01
592
0.01
592
0.01
592
O
rang
e C
ount
y S
anita
tion
Dis
trict
Tw
o O
pera
ting
0.03
080
0.
0308
0
0.03
100
0.
0308
0
0.03
080
0.03
080
0.03
080
O
rang
e C
ount
y Tr
ansp
orta
tion
Aut
horit
y0.
0026
8
0.00
268
0.
0027
0
0.00
268
0.
0026
8
0.
0026
8
0.
0026
8
Ora
nge
Cou
nty
Vec
tor C
ontro
l0.
0010
6
0.00
107
0.
0011
0
0.00
107
0.
0010
7
0.
0010
7
0.
0010
7
Met
ropo
litan
Wat
erD
istri
ct0
0052
00
0047
00
0045
00
0043
00
0043
00
0037
00
0037
0M
etro
polit
an W
ater
Dis
trict
0.
0052
0
0.
0047
0
0.
0045
0
0.
0043
0
0.
0043
0
0.
0037
0
0.
0037
0
Tota
l Dire
ct R
ate
1.09
122
$
1.08
598
$ 1.
0882
5$
1.08
699
$ 1.
0887
5$
1.
0905
2$
1.
0897
7$
1 NO
TES
:
Sou
rce:
HdL
Cor
en &
Con
e, O
rang
e C
ount
y A
sses
sor C
ombi
ned
Tax
Rol
ls
In19
78,
Cal
iforn
iavo
ters
pass
edP
ropo
sitio
n13
whi
chse
tsth
epr
oper
tyta
xra
teat
a1.
00%
fixed
amou
nt.
This
1.00
%is
shar
edby
allt
axin
gag
enci
esfo
rwhi
chth
esu
bjec
tpro
perty
resi
des
with
in.
Inad
ditio
nto
the
1.00
%fix
edam
ount
,pro
perty
owne
rsar
ech
arge
dta
xes
asa
perte
ncag
eof
asse
ssed
prop
erty
valu
esfo
rthe
paym
ento
fbon
ded
debt
and
prop
erty
tax
over
rides
.
The
Red
evel
opm
entA
genc
yta
xra
teis
notp
rese
nted
abov
ein
that
prop
erty
with
inth
epr
ojec
tare
ais
subj
ectt
oa
tax
rate
of1.
0495
%,w
hich
incl
udes
the
Pro
posi
tion
13pr
oper
tyta
xra
teof
1.00
%an
dth
e
The
City
of B
rea
Par
amed
ic T
ax ra
te is
per
$10
0 of
ass
esse
d va
lue.
In19
78,C
alifo
rnia
vote
rspa
ssed
Pro
posi
tion
13w
hich
sets
the
prop
erty
tax
rate
ata
1.00
%fix
edam
ount
.Th
is1.
00%
issh
ared
byal
ltax
ing
agen
cies
forw
hich
the
subj
ect
prop
erty
resi
des
with
in.
Inad
ditio
nto
the
1.00
%fix
edam
ount
,pr
oper
tyow
ners
are
char
ged
taxe
sas
ape
rcen
tage
ofas
sess
edpr
oper
tyva
lues
for
the
paym
ento
fbon
ded
debt
and
prop
erty
tax
over
rides
.
The
Red
evel
opm
ent
Age
ncy
tax
rate
isno
tpr
esen
ted
abov
ein
that
prop
erty
with
inth
epr
ojec
tar
eais
subj
ect
toa
tax
rate
of1.
0495
%,
whi
chin
clud
esth
eP
ropo
sitio
n13
prop
erty
tax
rate
of1.
00%
and
the
appl
icab
levo
tera
ppro
ved
debt
.
The
City
of B
rea
Par
amed
ic T
ax ra
te is
per
$10
0 of
ass
esse
d va
lue.
In19
78,C
alifo
rnia
vote
rspa
ssed
Pro
posi
tion
13w
hich
sets
the
prop
erty
tax
rate
ata
1.00
%fix
edam
ount
.Th
is1.
00%
issh
ared
byal
ltax
ing
agen
cies
forw
hich
the
subj
ect
prop
erty
resi
des
with
in.
Inad
ditio
nto
the
1.00
%fix
edam
ount
,pr
oper
tyow
ners
are
char
ged
taxe
sas
ape
rcen
tage
ofas
sess
edpr
oper
tyva
lues
for
the
paym
ento
fbon
ded
debt
and
prop
erty
tax
over
rides
.
As
prov
ided
inG
AS
BS
tate
men
t44,
the
City
ofB
rea
has
elec
ted
tore
port
fisca
lyea
rsbe
ginn
ing
2005
-06
and
forw
ard.
The
Red
evel
opm
entA
genc
yta
xra
teis
notp
rese
nted
abov
ein
that
prop
erty
with
inth
epr
ojec
tare
ais
subj
ectt
oa
tax
rate
of1.
0495
%,w
hich
incl
udes
the
Pro
posi
tion
13pr
oper
tyta
xra
teof
1.00
%an
dth
eap
plic
able
vote
rapp
rove
dde
bt.
The
City
of B
rea
Par
amed
ic T
ax ra
te is
per
$10
0 of
ass
esse
d va
lue.
131
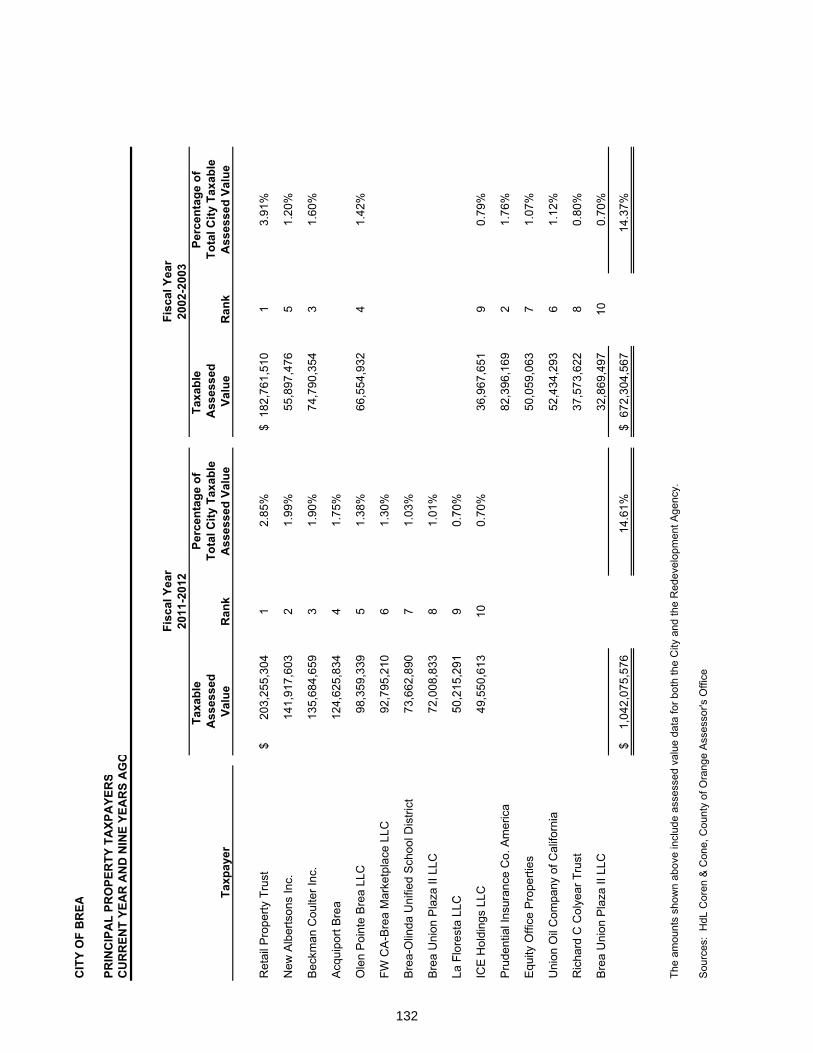
CIT
Y O
F B
REA
PRIN
CIP
AL
PRO
PER
TY T
AXP
AYE
RS
CU
RR
ENT
YEA
R A
ND
NIN
E YE
AR
S A
GO
3E+0
9
Taxa
ble
Taxa
ble
Ass
esse
dA
sses
sed
Taxp
ayer
Valu
eR
ank
Valu
eR
ank
Ret
ail P
rope
rty T
rust
203,
255,
304
$
12.
85%
182,
761,
510
$
13.
91%
New
Alb
erts
ons
Inc.
141,
917,
603
21.
99%
55,8
97,4
76
51.
20%
Bec
kman
Cou
lter I
nc.
135,
684,
659
31.
90%
74,7
90,3
54
31.
60%
Acq
uipo
rt B
rea
124,
625,
834
41.
75%
Ole
n P
oint
e B
rea
LLC
98,3
59,3
39
5
1.38
%66
,554
,932
4
1.42
%
FW C
A-B
rea
Mar
ketp
lace
LLC
92,7
95,2
10
6
1.30
%
Bre
a-O
linda
Uni
fied
Sch
ool D
istri
ct73
,662
,890
71.
03%
Bre
a U
nion
Pla
za II
LLC
72,0
08,8
33
8
1.01
%
LFl
tLL
C50
215
291
90
70%
Tota
l City
Tax
able
Ass
esse
d Va
lue
Perc
enta
ge o
fTo
tal C
ity T
axab
leA
sses
sed
Valu
e
Fisc
al Y
ear
2011
-201
2Fi
scal
Yea
r20
02-2
003
Perc
enta
ge o
f
La F
lore
sta
LLC
50,2
15,2
91
9
0.70
%
ICE
Hol
ding
s LL
C
49,5
50,6
13
10
0.70
%36
,967
,651
9
0.79
%
Pru
dent
ial I
nsur
ance
Co.
Am
eric
a82
,396
,169
2
1.76
%
Equ
ity O
ffice
Pro
perti
es50
,059
,063
7
1.07
%
Uni
on O
il C
ompa
ny o
f Cal
iforn
ia52
,434
,293
6
1.12
%
Ric
hard
C C
olye
ar T
rust
37,5
73,6
22
80.
80%
Bre
a U
nion
Pla
za II
LLC
32,8
69,4
97
100.
70%
1,04
2,07
5,57
6$
14.6
1%67
2,30
4,56
7$
14
.37%
The
amou
nts
show
n ab
ove
incl
ude
asse
ssed
val
ue d
ata
for b
oth
the
City
and
the
Red
evel
opm
ent A
genc
y.
Sou
rces
: H
dL C
oren
& C
one,
Cou
nty
of O
rang
e A
sses
sor's
Offi
ce
132

CITY OF BREA
PROPERTY TAX LEVIES AND COLLECTIONSLAST TEN FISCAL YEARS
FiscalYear Taxes Levied Collections
Ended for the Percentage in Subsequent PercentageJune 30 Fiscal Year Amount of Levy Years Amount of Levy
2003 26,712,287 26,256,854 98.30% 154,561 26,411,415 98.87%
2004 27,537,089 27,234,459 98.90% 134,349 27,368,808 99.39%
2005 28,660,066 28,835,353 100.61% 220,797 29,056,150 101.38%
2006 28,914,427 30,893,196 106.84% 410,146 31,303,342 108.26%
2007 31,242,316 30,996,950 99.21% 397,421 31,394,371 100.49%
2008 34,675,457 34,287,289 98.88% 370,616 34,657,905 99.95%
2009 34,655,751 34,504,139 99.56% 354,837 34,858,976 100.59%
2010 33,304,101 32,620,080 97.95% 252,721 32,872,801 98.70%
2011 34,970,273 35,335,027 101.04% 145,204 35,480,231 101.46%
2012 32,242,292 31,678,555 98.25% 295,525 31,974,080 99.17%
NOTE:
The amounts presented include property taxes and Redevelopment Agency tax increment. This schedule also
Collected within theFiscal Year of the Levy Total Collections to Date
The amounts presented include property taxes and Redevelopment Agency tax increment. This schedule alsoincludes amounts collected by the City and Redevelopment Agency that were passed-through to other agencies.
Source: County of Orange Auditor Controller's Office
133

CIT
Y O
F B
REA
RA
TIO
OF
OU
TSTA
ND
ING
DEB
T B
Y TY
PELA
ST T
EN F
ISC
AL
YEA
RS
Bus
ines
s-Ty
peFi
scal
Act
iviti
esYe
arTa
xLe
ase
Tota
lW
ater
Tota
lPe
rcen
tage
Deb
tEn
ded
Allo
catio
nR
even
ueC
apita
l G
over
nmen
tal
Rev
enue
Prim
ary
of P
erso
nal
Per
June
30
Bon
ds 1
,7,8
Bon
ds8
Leas
es2,
3,5
Act
iviti
esB
onds
4,6
Gov
ernm
ent
Inco
me
9C
apita
9
2003
179,
449,
432
18,5
70,0
00
1,52
7,78
5
199,
547,
217
18,5
25,0
00
218,
072,
217
14.6
3%5,
553
2004
204,
624,
895
17,9
30,0
00
1,23
1,69
3
223,
786,
588
17,8
65,0
00
241,
651,
588
14.8
1%5,
772
2005
199,
366,
857
17,5
60,0
00
1,69
1,03
4
218,
617,
891
17,1
80,0
00
235,
797,
891
14.2
2%5,
608
2006
193,
810,
364
16,8
50,0
00
3,16
4,38
7
213,
824,
751
16,4
75,0
00
230,
299,
751
12.3
4%4,
883
2007
187,
943,
944
16,0
95,0
00
4,35
6,39
9
208,
395,
343
15,7
40,0
00
224,
135,
343
11.9
1%4,
748
2008
181,
975,
649
15,3
10,0
00
3,55
2,17
5
200,
837,
824
14,9
75,0
00
215,
812,
824
11.1
7%4,
477
2009
188,
442,
073
14,4
95,0
00
2,99
3,62
4
205,
930,
697
25,8
00,0
00
231,
730,
697
11.4
3%4,
592
2010
178,
909,
196
16,4
85,0
00
6,71
6,14
6
202,
110,
342
38,0
95,0
00
240,
205,
342
11.4
6%4,
629
Gov
ernm
enta
l Act
iviti
es
2011
197,
967,
628
15,3
60,0
00
6,10
6,03
1
219,
433,
659
37,7
60,0
00
257,
193,
659
13.1
0%5,
247
2012
-
2,76
0,00
0
5,
161,
902
7,
921,
902
37,2
65,0
00
45,1
86,9
02
2.21
%90
6
8Fo
r the
fisc
al y
ear e
nded
Jun
e 30
, 201
2, o
utst
andi
ng lo
ng te
rm d
ebts
of t
he B
rea
Red
evel
opm
ent A
genc
y w
ere
trans
ferr
ed to
the
Suc
cess
or A
genc
y on
Feb
ruar
y 1,
201
2, a
s a
resu
lt of
dis
solu
tion
of R
edev
elop
men
t Age
ncie
s in
Cal
iforn
ia.
NO
TE:
Det
ails
rega
rdin
g th
e ou
tsta
ndin
g de
bt c
an b
e fo
und
in th
e no
tes
ot th
e fin
anci
al s
tate
men
ts.
6Fo
r the
fisc
al y
ear e
nded
Jun
e 30
, 201
0, th
e B
rea
Pub
lic F
inan
cing
Aut
horit
y is
sued
over
$12
mill
ion
of w
ater
reve
nue
bond
s.
7Fo
r the
fisc
al y
ear e
nded
Jun
e 30
, 201
1, th
e B
rea
Red
evel
opm
ent A
genc
y is
sued
ove
r $29
mill
ion
of ta
x al
loca
tion
bond
s.
9S
ee th
e S
ched
ule
of D
emog
raph
ic a
nd E
cono
mic
Sta
tistic
s fo
r per
sona
l inc
ome
and
popu
latio
n da
ta.
1Fo
r the
fisc
al y
ear e
nded
Jun
e 30
, 200
4, th
e R
edev
elop
men
t Age
ncy
issu
ed o
ver $
120
mill
ion
of ta
x al
loca
tion
refu
ndin
g bo
nds
in J
uly,
200
3, w
hich
2Fo
r the
fisc
al y
ear e
nded
Jun
e 30
, 200
6, th
e C
ity o
f Bre
a en
tere
d in
to tw
o le
ase-
purc
hase
agr
eem
ents
tota
ling
$1,7
29,0
833
For t
he fi
scal
yea
r end
ed J
une
30, 2
007,
the
City
of B
rea
ente
red
into
a le
ase-
purc
hase
agr
eem
ent f
or $
1,78
2,00
04
For t
he fi
scal
yea
r end
ed J
une
30, 2
009,
the
Bre
a P
ublic
Fin
anci
ng A
utho
rity
issu
ed o
ver $
25 m
illio
n of
wat
er re
venu
e re
fund
ing
bond
s.5
For t
he fi
scal
yea
r end
ed J
une
30, 2
010,
the
City
of B
rea
ente
red
into
a le
ase-
purc
hase
agr
eem
ent f
or $
4,58
0,00
0.
in
clud
ed o
ver $
26 m
illio
n in
new
bon
ds, r
esul
ting
in th
e in
crea
se.
134
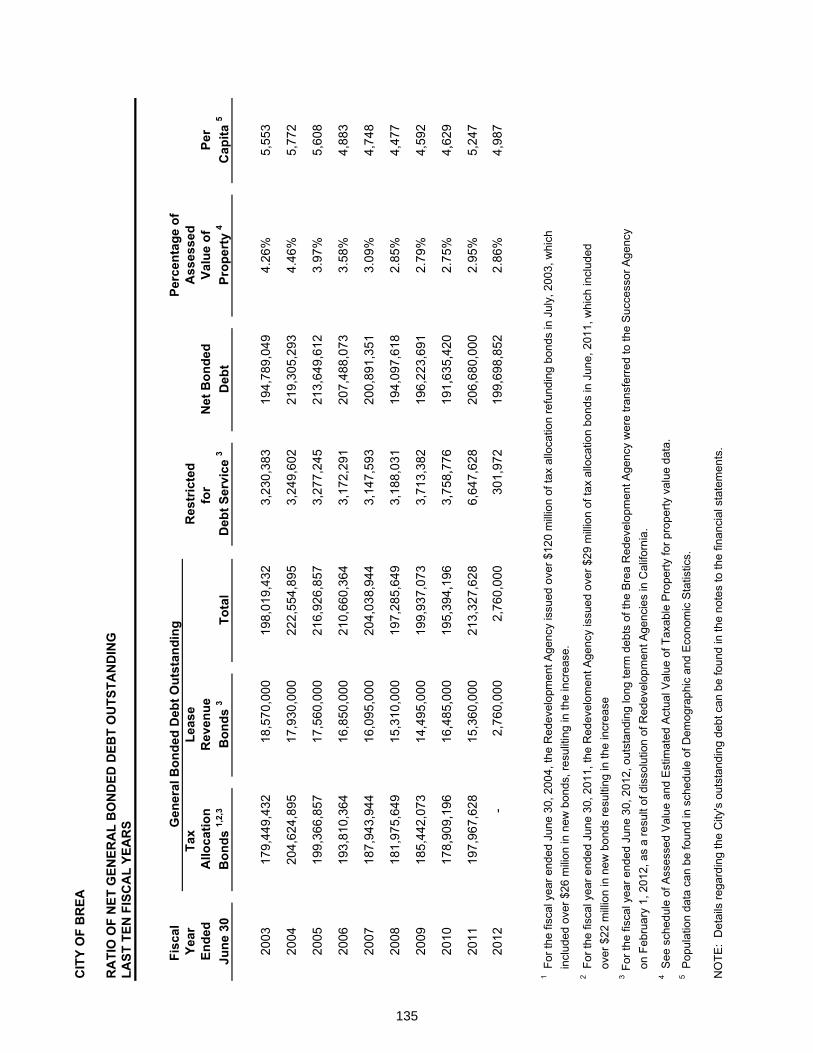
CIT
Y O
F B
REA
RA
TIO
OF
NET
GEN
ERA
L B
ON
DED
DEB
T O
UTS
TAN
DIN
GLA
ST T
EN F
ISC
AL
YEA
RS
Fisc
alPe
rcen
tage
of
Year
Tax
Leas
eR
estr
icte
dA
sses
sed
Ende
dA
lloca
tion
Rev
enue
for
Net
Bon
ded
Valu
e of
Per
June
30
Bon
ds1,
2,3
Bon
ds3
Tota
lD
ebt S
ervi
ce 3
Deb
tPr
oper
ty4
Cap
ita5
2003
179,
449,
432
18,5
70,0
00
198,
019,
432
3,23
0,38
3
19
4,78
9,04
9
4.
26%
5,55
3
2004
204,
624,
895
17,9
30,0
00
222,
554,
895
3,24
9,60
2
21
9,30
5,29
3
4.
46%
5,77
2
2005
199,
366,
857
17,5
60,0
00
216,
926,
857
3,27
7,24
5
21
3,64
9,61
2
3.
97%
5,60
8
2006
193,
810,
364
16,8
50,0
00
210,
660,
364
3,17
2,29
1
20
7,48
8,07
3
3.
58%
4,88
3
2007
187,
943,
944
16,0
95,0
00
204,
038,
944
3,14
7,59
3
20
0,89
1,35
1
3.
09%
4,74
8
2008
181,
975,
649
15,3
10,0
00
197,
285,
649
3,18
8,03
1
19
4,09
7,61
8
2.
85%
4,47
7
2009
185,
442,
073
14,4
95,0
00
199,
937,
073
3,71
3,38
2
19
6,22
3,69
1
2.
79%
4,59
2
2010
178,
909,
196
16,4
85,0
00
195,
394,
196
3,75
8,77
6
191,
635,
420
2.75
%4,
629
Gen
eral
Bon
ded
Deb
t Out
stan
ding
00
8,90
9,96
6,85
,000
95,3
9,
963,
58,
69
,635
,0
5%,6
9
2011
197,
967,
628
15,3
60,0
00
213,
327,
628
6,64
7,62
8
20
6,68
0,00
0
2.
95%
5,24
7
2012
-
2,76
0,00
0
2,
760,
000
301,
972
19
9,69
8,85
2
2.
86%
4,98
7
in
clud
ed o
ver $
26 m
ilion
in n
ew b
onds
, res
uliti
ng in
the
incr
ease
. 2 F
or th
e fis
cal y
ear e
nded
Jun
e 30
, 201
1, th
e R
edev
elom
ent A
genc
y is
sued
ove
r $29
mill
ion
of ta
x al
loca
tion
bond
s in
Jun
e, 2
011,
whi
ch in
clud
ed
over
$22
mill
ion
in n
ew b
onds
resu
lting
in th
e in
crea
se3
For t
he fi
scal
yea
r end
ed J
une
30, 2
012,
out
stan
ding
long
term
deb
ts o
f the
Bre
a R
edev
elop
men
t Age
ncy
wer
e tra
nsfe
rred
to th
e S
ucce
ssor
Age
ncy
on
Feb
ruar
y 1,
201
2, a
s a
resu
lt of
dis
solu
tion
of R
edev
elop
men
t Age
ncie
s in
Cal
iforn
ia.
4 See
sch
edul
e of
Ass
esse
d V
alue
and
Est
imat
ed A
ctua
l Val
ue o
f Tax
able
Pro
perty
for p
rope
rty v
alue
dat
a.5 P
opul
atio
n da
ta c
an b
e fo
und
in s
ched
ule
of D
emog
raph
ic a
nd E
cono
mic
Sta
tistic
s.
NO
TE:
Det
ails
rega
rdin
g th
e C
ity's
out
stan
ding
deb
t can
be
foun
d in
the
note
s to
the
finan
cial
sta
tem
ents
.
1Fo
r the
fisc
al y
ear e
nded
Jun
e 30
, 200
4, th
e R
edev
elop
men
t Age
ncy
issu
ed o
ver $
120
mill
ion
of ta
x al
loca
tion
refu
ndin
g bo
nds
in J
uly,
200
3, w
hich
135
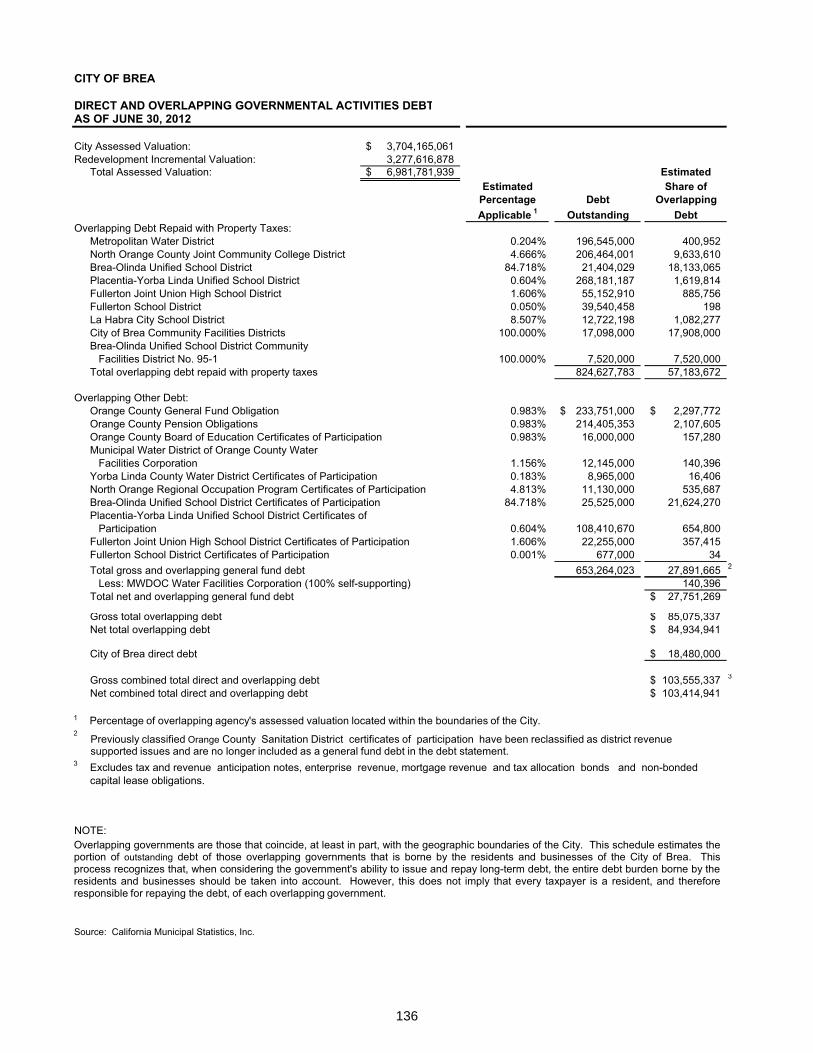
CITY OF BREA
DIRECT AND OVERLAPPING GOVERNMENTAL ACTIVITIES DEBTAS OF JUNE 30, 2012
City Assessed Valuation: 3,704,165,061$ Redevelopment Incremental Valuation: 3,277,616,878
Total Assessed Valuation: 6,981,781,939$ EstimatedEstimated Share of
Percentage Debt OverlappingApplicable 1 Outstanding Debt
Overlapping Debt Repaid with Property Taxes:Metropolitan Water District 0.204% 196,545,000 400,952 North Orange County Joint Community College District 4.666% 206,464,001 9,633,610 Brea-Olinda Unified School District 84.718% 21,404,029 18,133,065 Placentia-Yorba Linda Unified School District 0.604% 268,181,187 1,619,814 Fullerton Joint Union High School District 1.606% 55,152,910 885,756 Fullerton School District 0.050% 39,540,458 198 La Habra City School District 8.507% 12,722,198 1,082,277 City of Brea Community Facilities Districts 100.000% 17,098,000 17,908,000 Brea-Olinda Unified School District Community
Facilities District No. 95-1 100.000% 7,520,000 7,520,000 Total overlapping debt repaid with property taxes 824,627,783 57,183,672
Overlapping Other Debt:Orange County General Fund Obligation 0.983% 233,751,000$ 2,297,772$ Orange County Pension Obligations 0.983% 214,405,353 2,107,605 Orange County Board of Education Certificates of Participation 0.983% 16,000,000 157,280 Municipal Water District of Orange County Water
Facilities Corporation 1.156% 12,145,000 140,396 Yorba Linda County Water District Certificates of Participation 0.183% 8,965,000 16,406 North Orange Regional Occupation Program Certificates of Participation 4.813% 11,130,000 535,687 Brea-Olinda Unified School District Certificates of Participation 84.718% 25,525,000 21,624,270 Placentia-Yorba Linda Unified School District Certificates of
Participation 0.604% 108,410,670 654,800 Fullerton Joint Union High School District Certificates of Participation 1.606% 22,255,000 357,415 Fullerton School District Certificates of Participation 0.001% 677,000 34
2Total gross and overlapping general fund debt 653,264,023 27,891,665 2
Less: MWDOC Water Facilities Corporation (100% self-supporting) 140,396 Total net and overlapping general fund debt 27,751,269$
Gross total overlapping debt 85,075,337$Net total overlapping debt 84,934,941$
City of Brea direct debt 18,480,000$
Gross combined total direct and overlapping debt 103,555,337$ 3
Net combined total direct and overlapping debt 103,414,941$
1
2
3
capital lease obligations.
NOTE:
Source: California Municipal Statistics, Inc.
Excludes tax and revenue anticipation notes, enterprise revenue, mortgage revenue and tax allocation bonds and non-bonded
Percentage of overlapping agency's assessed valuation located within the boundaries of the city.
Overlapping governments are those that coincide, at least in part, with the geographic boundaries of the City. This schedule estimatesthe portion of outstanding debt of those overlapping governments that is borne by the residents and businesses of the City of Brea.This process recognizes that, when considering the government's ability to issue and repay long-term debt, the entire debt burdenborne by the residents and businesses should be taken into account. However, this does not imply that every taxpayer is a resident,and therefore responsible for repaying the debt, of each overlapping government.
Percentage of overlapping agency's assessed valuation located within the boundaries of the city.Previously classified Orange County Sanitation District certificates of participation have been reclassified asdistrict revenue supported issues and are no longer included as a general fund debt in the debt statement.Percentage of overlapping agency's assessed valuation located within the boundaries of the city.Percentage of overlapping agency's assessed valuation located within the boundaries of the city.Previously classified Orange County Sanitation District certificates of participation have been reclassified asdistrict revenue supported issues and are no longer included as a general fund debt in the debt statement.Percentage of overlapping agency's assessed valuation located within the boundaries of the city.Percentage of overlapping agency's assessed valuation located within the boundaries of the City.
Overlapping governments are those that coincide, at least in part, with the geographic boundaries of the City. This schedule estimates theportion of outstanding debt of those overlapping governments that is borne by the residents and businesses of the City of Brea. Thisprocess recognizes that, when considering the government's ability to issue and repay long-term debt, the entire debt burden borne by theresidents and businesses should be taken into account. However, this does not imply that every taxpayer is a resident, and thereforeresponsible for repaying the debt, of each overlapping government.
Previously classified Orange County Sanitation District certificates of participation have been reclassified as district revenuesupported issues and are no longer included as a general fund debt in the debt statement.Percentage of overlapping agency's assessed valuation located within the boundaries of the city.
Overlapping governments are those that coincide, at least in part, with the geographic boundaries of the City. This schedule estimatesthe portion of outstanding debt of those overlapping governments that is borne by the residents and businesses of the City of Brea.This process recognizes that, when considering the government's ability to issue and repay long-term debt, the entire debt burdenborne by the residents and businesses should be taken into account. However, this does not imply that every taxpayer is a resident,and therefore responsible for repaying the debt, of each overlapping government.
Percentage of overlapping agency's assessed valuation located within the boundaries of the City.
Overlapping governments are those that coincide, at least in part, with the geographic boundaries of the City. This schedule estimates theportion of outstanding debt of those overlapping governments that is borne by the residents and businesses of the City of Brea. Thisprocess recognizes that, when considering the government's ability to issue and repay long-term debt, the entire debt burden borne by theresidents and businesses should be taken into account. However, this does not imply that every taxpayer is a resident, and thereforeresponsible for repaying the debt, of each overlapping government.
Previously classified Orange County Sanitation District certificates of participation have been reclassified as district revenuesupported issues and are no longer included as a general fund debt in the debt statement.
136
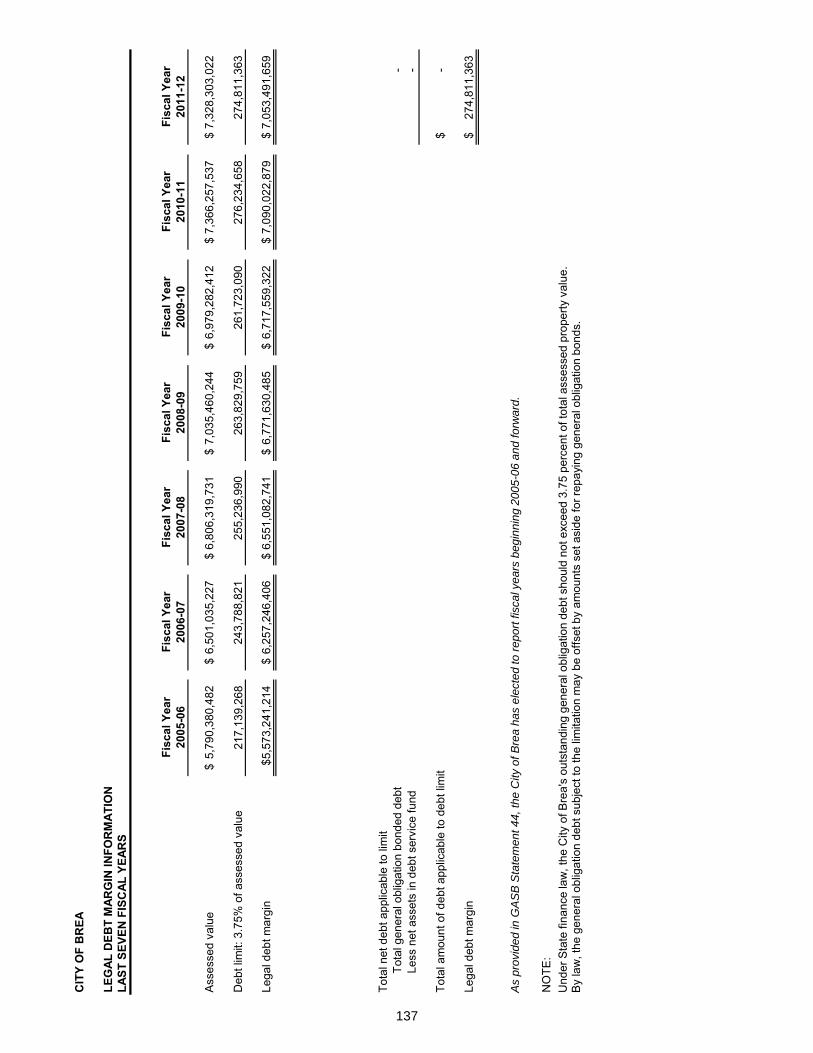
CIT
Y O
F B
REA
LEG
AL D
EBT
MAR
GIN
INFO
RM
ATIO
NLA
ST S
EVEN
FIS
CAL
YEA
RS
Fisc
al Y
ear
Fisc
al Y
ear
Fisc
al Y
ear
Fisc
al Y
ear
Fisc
al Y
ear
Fisc
al Y
ear
Fisc
al Y
ear
2005
-06
2006
-07
2007
-08
2008
-09
2009
-10
2010
-11
2011
-12
Ass
esse
d va
lue
5,79
0,38
0,48
2$
6,
501,
035,
227
$
6,80
6,31
9,73
1$
7,
035,
460,
244
$
6,97
9,28
2,41
2$
7,
366,
257,
537
$
7,32
8,30
3,02
2$
Deb
t lim
it: 3
.75%
of a
sses
sed
valu
e21
7,13
9,26
824
3,78
8,82
1
255,
236,
990
26
3,82
9,75
9
261,
723,
090
27
6,23
4,65
8
274,
811,
363
Lega
l deb
t mar
gin
$5,5
73,2
41,2
146,
257,
246,
406
$ 6,
551,
082,
741
$ 6,
771,
630,
485
$ 6,
717,
559,
322
$ 7,
090,
022,
879
$ 7,
053,
491,
659
$
Tota
l net
deb
t app
licab
le to
lim
itTo
tal g
ener
al o
blig
atio
n bo
nded
deb
t-
Less
net
ass
ets
in d
ebt s
ervi
ce fu
nd-
Tota
l am
ount
of d
ebt a
pplic
able
to d
ebt l
imit
-$
Lega
l deb
t mar
gin
274,
811,
363
$
NO
TE:
Und
erst
ate
finan
cela
w,t
heC
ityof
Bre
a's
outs
tand
ing
gene
ralo
blig
atio
nde
btsh
ould
note
xcee
d3.
75pe
rcen
tof
tota
lass
esse
dpr
oper
tyva
lue.
By
law
,th
ege
nera
lobl
igat
ion
debt
subj
ect
toth
elim
itatio
nm
aybe
offs
etby
amou
nts
seta
side
forr
epay
ing
gene
ralo
blig
atio
nbo
nds.
As
prov
ided
inG
AS
BS
tate
men
t44,
the
City
ofB
rea
has
elec
ted
tore
port
fisca
lyea
rsbe
ginn
ing
2005
-06
and
forw
ard.
Und
erst
ate
finan
cela
w,t
heC
ityof
Bre
a's
outs
tand
ing
gene
ralo
blig
atio
nde
btsh
ould
note
xcee
d3.
75pe
rcen
toft
otal
asse
ssed
prop
erty
valu
e.B
yla
w,t
hege
nera
lobl
igat
ion
debt
subj
ectt
oth
elim
itatio
nm
aybe
offs
etby
amou
nts
seta
side
forr
epay
ing
gene
ralo
blig
atio
nbo
nds.
Und
erS
tate
finan
cela
w,t
heC
ityof
Bre
a's
outs
tand
ing
gene
ralo
blig
atio
nde
btsh
ould
note
xcee
d3.
75pe
rcen
toft
otal
asse
ssed
prop
erty
valu
e.B
yla
w,t
hege
nera
lobl
igat
ion
debt
subj
ectt
oth
elim
itatio
nm
aybe
offs
etby
amou
nts
seta
side
forr
epay
ing
gene
ralo
blig
atio
nbo
nds.
137

CIT
Y O
F B
REA
PLED
GED
REV
ENU
E C
OVE
RA
GE
LAST
TEN
FIS
CA
L YE
AR
S
Fisc
alYe
arLe
ss:
Net
Ende
dTa
xG
ross
Ope
ratin
gA
vaila
ble
June
30
Incr
emen
t5, 6
Prin
cipa
l6In
tere
st6
Cov
erag
e6
Rev
enue
s1
Expe
nses
2R
even
uePr
inci
pal3
Inte
rest
4C
over
age
2003
23,1
85,6
56
5,
225,
000
9,98
0,94
3
1.
52
8,
793,
728
6,69
1,21
6
2,
102,
512
635,
000
83
7,11
5
1.
43
2004
23,7
80,1
88
5,
220,
000
7,32
2,03
3
1.
90
9,
238,
292
6,64
3,53
1
2,
594,
761
660,
000
81
4,12
2
1.
76
2005
24,9
13,5
84
6,
165,
000
9,21
4,51
7
1.
62
8,
560,
029
6,63
4,53
9
1,
925,
490
685,
000
78
9,57
0
1.
31
2006
24,8
05,3
08
6,
260,
000
8,92
3,68
0
1.
63
8,
717,
639
7,37
6,31
1
1,
341,
328
705,
000
76
3,50
3
0.
91
2007
23,5
00,0
01
6,
350,
000
8,61
0,25
6
1.
57
10
,302
,495
8,
800,
006
1,50
2,48
9
73
5,00
0
735,
775
1.02
2008
23,5
00,0
00
6,
345,
000
7,94
7,20
7
1.
64
10
,410
,074
8,
774,
941
1,63
5,13
3
76
5,00
0
816,
508
1.03
2009
23,5
00,0
00
5,
795,
000
7,13
2,48
1
1.
82
10
,344
,771
9,
123,
214
1,22
1,55
7
79
0,00
0
552,
885
0.91
2010
20,0
62,1
46
6,
950,
000
8,18
2,91
6
1.
33
11
,563
,325
10
,471
,557
1,
091,
768
-
1,35
9,10
5
0.80
2011
19,8
54,1
55
6,
960,
000
7,89
5,70
4
1.
34
11
,874
,613
10
,510
,821
1,
363,
792
335,
000
1,
291,
835
0.
84
2012
-
-
-
-
13
,659
,142
11
,196
,371
2,
462,
771
49
5,00
0
1,
536,
324
1.21
Wat
er R
even
ue B
onds
Tax
Allo
catio
n B
onds
Deb
t Ser
vice
Deb
t Ser
vice
,,
,,
,,
,,
,
1 2 3 4 5 6
Gro
ssre
venu
esex
clud
eco
nnec
tion
fees
.
Ope
ratin
gex
pens
esdo
noti
nclu
dein
tere
stor
depr
ecia
tion.
InM
ay20
09,t
heB
rea
Pub
licFi
nanc
ing
Aut
horit
yis
sued
over
$25
mill
ion
ofw
ater
reve
nue
refu
ndin
gbo
nds,
whi
chcu
rrent
refu
nded
the
1998
Wat
erR
even
ueR
efun
ding
Bon
dsre
sulti
ngin
nopr
inci
palp
aym
entd
uein
July
1,20
09.
Inte
rest
expe
nse
isne
toft
heB
uild
Am
eric
aB
onds
inte
rest
refu
ndcr
edits
.
Beg
inni
ngfis
caly
eare
nded
June
30,2
010,
tax
incr
emen
tis
neto
ftax
incr
emen
trev
enue
shar
ing
paym
ents
.
Fort
hefis
caly
eare
nded
June
30,2
012,
outs
tand
ing
long
term
debt
sof
the
Bre
aR
edev
elop
men
tAge
ncy
wer
etra
nsfe
rred
toth
eS
ucce
ssor
Age
ncy
onFe
brua
ry1,
2012
,as
are
sult
ofdi
ssol
utio
nof
Red
evel
opm
entA
genc
ies
inC
alifo
rnia
.
138

CITY OF BREA
DEMOGRAPHIC AND ECONOMIC STATISTICSLAST TEN FISCAL YEARS
Fiscal Year Personal Per Capita Ended Income Personal Unemployment
June 30 Population 1 (in thousands) Income 2 Rate 3
2003 37,962 1,490,692 39,268 5.0%
2004 38,960 1,631,177 41,868 4.6%
2005 39,441 1,658,494 42,050 4.0%
2006 39,560 1,865,689 47,161 3.6%
2007 39,870 1,882,223 47,209 3.9%
2008 40,081 1,932,265 48,209 4.1%
2009 40,176 2,027,401 50,463 7.2%
2010 40,377 2,095,324 51,894 6.2%
2011 40,065 1,963,986 49,020 6.6%
2012 40,932 2,040,992 49,863 6.0%
Sources:1 City Community Development, Planning Division2 Per capita income for Orange County; U S Department of Commerce Bureau of Economic Analysis 2010Per capita income for Orange County; U.S. Department of Commerce, Bureau of Economic Analysis, 20103 State of California Employment Development Department - Labor Market Information DivisionState of California Employment Development Department - Labor Market Information Division State of California Employment Development Department - Labor Market Information Division
139

CITY OF BREA
PRINCIPAL EMPLOYERSCURRENT FISCAL YEAR AND NINE YEARS AGO
Percent of Percent ofTotal City Total City
Employer Employees Rank Employment 1 Employees2 Rank Employment 3
Bank of America 4 1,500 1 7.50% 1,500 4 7.37%
Mercury Insurance Group 1,400 2 7.00% 3,000 2 14.74%
Beckman Coulter, Inc. 1,200 3 6.00% 3,000 1 14.74%
Albertson's, Inc. 750 4 3.75% 1,200 5 5.89%
Kirkhill - TA Company 700 5 3.57% 550 8 2.70%
Brea Olinda Unified School District 640 6 3.20% 895 6 4.40%
Veterinary Pet Insurance Co. 480 7 2.40%
Bristol Industries 400 8 2.00%
Avery Dennison Administrative 360 9 1.80%
Peterson Brothers Construction 360 10 1.80% 600 7 2.95%
Harte-Hanks Communications 500 10 2.46%
FiscalYear
2011-12
FiscalYear
2002-2003
Capital Group 1,600 3 7.86%
RSKCo 500 9 2.46%
Total 7,790 38.95% 13,345 65.55%
1 Based upon the Employment Development Department's estimate of 21,300 residents employed in 2011 out of a total population of 40,932.2 Information from Annual Report for the 1997 Area C Senior Lien Bonds.
3 Based upon the Employment Development Department's total Orange County employment, and the assumption that a similar ratio of Brea residents was employed in 2002 as in 2011, the estimated number of employed residents used was 20,358. Note: this methodology was used because City-specific data was not available. for this period.
4 Number of Employees for FY 2011-12 came from data provided by the City's Business License Software
Source: City of Brea
140
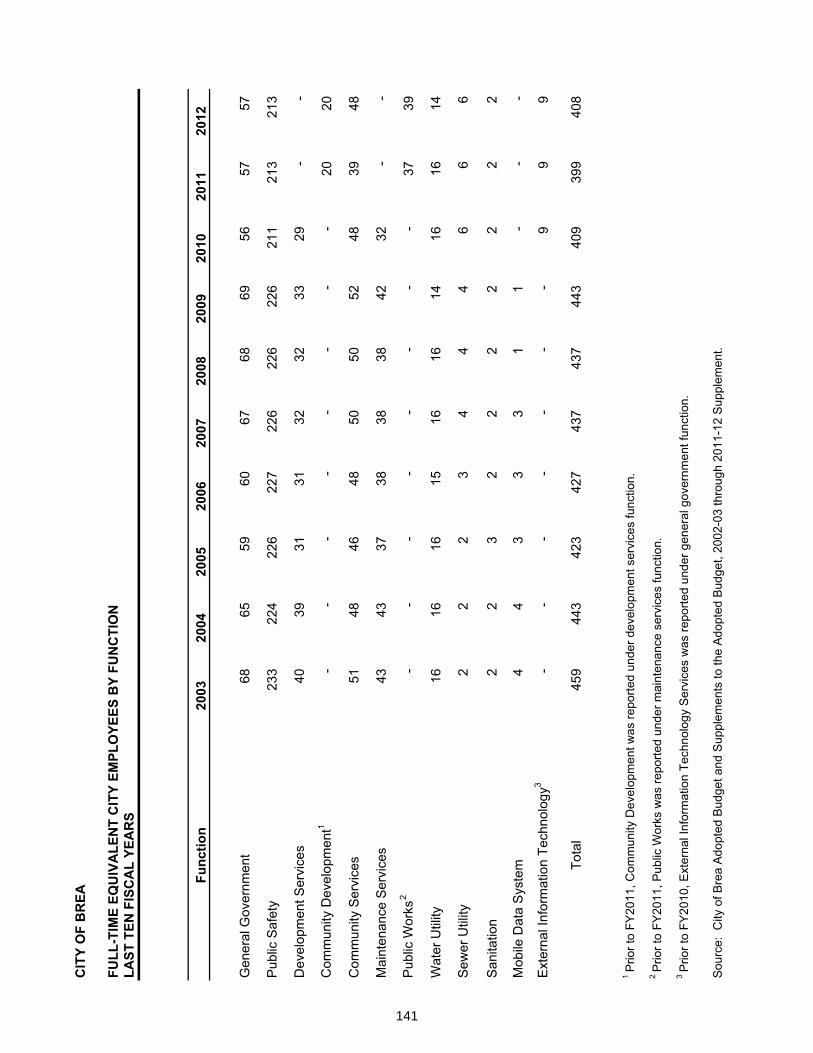
CIT
Y O
F B
REA
FULL
-TIM
E EQ
UIV
ALE
NT
CIT
Y EM
PLO
YEES
BY
FUN
CTI
ON
LAST
TEN
FIS
CA
L YE
AR
S
Func
tion
2003
2004
2005
2006
2007
2008
2009
2010
2011
2012
Gen
eral
Gov
ernm
ent
68
65
59
60
67
68
69
56
57
57
Pub
lic S
afet
y23
3
22
4
226
22
7
226
22
6
226
21
1
213
21
3
Dev
elop
men
t Ser
vice
s40
39
31
31
32
32
33
29
-
-
Com
mun
ity D
evel
opm
ent1
--
--
--
--
20
20
Com
mun
ity S
ervi
ces
51
48
46
48
50
50
52
48
39
48
Mai
nten
ance
Ser
vice
s43
43
37
38
38
38
42
32
-
-
Pub
lic W
orks
2-
--
--
--
-37
39
Wat
er U
tility
16
16
16
15
16
16
14
16
16
14
Sew
er U
tility
2
2
2
3
4
4
4
6
6
6
San
itatio
n2
2
3
2
2
2
2
2
2
2
Mob
ile D
ata
Sys
tem
4
4
3
3
3
1
1
-
--
Ext
erna
l Inf
orm
atio
n Te
chno
logy
3-
--
--
--
9
9
9
Tota
l45
9
44
3
423
42
7
437
43
7
443
40
9
399
40
8
1P
rior t
o FY
2011
, Com
mun
ity D
evel
opm
ent w
as re
porte
d un
der d
evel
opm
ent s
ervi
ces
func
tion.
2P
rior t
o FY
2011
, Pub
lic W
orks
was
repo
rted
unde
r mai
nten
ance
ser
vice
s fu
nctio
n.
3P
rior t
o FY
2010
, Ext
erna
l Inf
orm
atio
n Te
chno
logy
Ser
vice
s w
as re
porte
d un
der g
ener
al g
over
nmen
t fun
ctio
n.
Sou
rce:
City
of B
rea
Ado
pted
Bud
get a
nd S
uppl
emen
ts to
the
Ado
pted
Bud
get,
2002
-03
thro
ugh
2011
-12
Sup
plem
ent.
141

CITY OF BREA
OPERATING INDICATORS BY FUNCTIONLAST SEVEN FISCAL YEARS
Fiscal Year Fiscal Year Fiscal Year Fiscal Year Fiscal Year Fiscal Year Fiscal Year2005-06 2006-07 2007-08 2008-09 2009-10 2010-11 2011-12
Function:Police
Calls dispatched 32,043 20,700 19,334 22,232 22,231 23,071 24,650 Crime reports 6,620 9,882 5,585 1 7,076 5,475 4,726 4,491 Moving citations 10,827 16,289 8,335 1 7,123 9,192 9,024 8,215 Parking citations 15,853 14,504 14,836 14,118 20,639 15,469 16,034
WaterNumber of customer accounts 11,763 11,893 11,842 11,863 11,953 11,878 12,095 Average daily consumption (millions of gallons) 9.87 10.12 10.79 9.26 8.83 8.53 9.39 Water samples taken 672 1,830 1,753 624 624 627 672
SewersFeet of sewer mains root cut/chemically treated 600 4,825 2,410 - - - -
Development Services 5
Permits issued 1,505 1,249 1,096 1,218 979 - -Inspections conducted 5,808 3,994 4,945 4,850 4,628 - -Traffic signals maintained 50 50 50 51 2 51 - -Infrastructure improvement projects administered 6 9 14 12 13 - -
Community DevelopmentPermits issued - - - - - 1,097 1,180 Inspections conducted - - - - - 4,316 5,030
Maintenance 5
Square feet of graffiti removal 66,000 7,675 11,232 12,755 15,048 - -Streetsweeping miles 18,304 20,618 26,341 3 22,943 20,777 - -Streetsweeping miles 18,304 20,618 26,341 22,943 20,777 Trees pruned per year 2,880 2,322 2,642 2,706 2,906 - -
Public WorksSquare feet of graffiti removal - - - - - 12,528 9,576 Streetsweeping miles - - - - - 20,609 18,398 Trees pruned per year - - - - - 2,702 2,806 Traffic signals maintained - - - - - 51 4 52 4
Infrastructure improvement projects administered - - - - - 9 17
Culture and RecreationGallery promotions and mailings 55,815 46,582 42,151 43,962 21,647 26,903 22,934 Gallery attendance 6,650 6,624 6,004 7,495 6,934 7,081 11,693 Theatre annual program brochures mailed 22,000 20,000 23,313 24,532 35,053 37,848 37,843 Theatre attendance 16,956 16,986 16,419 17,742 13,964 11,983 12,829
General governmentAccounts payable warrants issued 8,318 8,493 8,624 7,772 6,233 6,043 8,182
As provided in GASB Statement 44, the City of Brea has elected to report fiscal years beginning 2005-06 and forward.
of comparability.
prior fiscal year.
Source: City of Brea
5 Beginning in fiscal year 2010-11, function classified as Public Works or Community Development.
1 The reporting methodology employed beginning fiscal year 2007-08 was changed; going forward, this methodology will remain consistent for the sake
2 Figure corrected with fiscal year 2011-12 CAFR.3 Beginning in fiscal year 2007-08, the reported streetsweeping miles included curb miles from the City's backup sweeper which was not included in the prior fiscal
4 Doesn't include five flashing beacons the City maintains
142

CIT
Y O
F B
REA
CA
PITA
L A
SSET
STA
TIST
ICS
BY
FUN
CTI
ON
LAST
TEN
FIS
CA
L YE
AR
S
2003
2004
2005
2006
2007
2008
2009
2010
2011
2012
Func
tion:
Pub
lic S
afet
y Pol
ice
stat
ions
1
1
1
1
1
1
1
1
1
1
Fi
re s
tatio
ns4
4
4
4
4
4
4
4
4
4
Hig
hway
s an
d st
reet
sM
iles
of s
treet
s11
5
115
11
8
118
11
9
119
11
9
119
11
9
119
S
treet
ligh
ts3,
071
3,17
7
3,
301
3,30
1
3,
388
3,38
8
3,
388
3,38
8
3,
388
3,38
8
Wat
erN
umbe
r of w
ater
wel
ls1
1
1
1
1
1
1
1
1
1
Num
ber o
f res
ervo
irs6
6
6
6
6
6
6
6
6
6
Mile
s of
line
s &
mai
ns16
2
162
16
2
162
16
7
167
16
7
167
16
7
167
Sew
erM
iles
of s
anita
ry s
ewer
s10
8.50
10
8.50
10
8.50
10
8.50
11
0.00
11
0.00
11
0.00
11
0.00
110.
00
11
0.00
Mile
s of
sto
rm d
rain
s24
.00
24.0
0
24
.00
24.0
0
25
.00
25.0
0
25
.00
25.0
0
25
.00
25.0
0
Cul
ture
and
Rec
reat
ion
Num
ber o
f par
ks9
10
10
10
10
10
11
11
11
11
N
umbe
r of o
ther
faci
litie
s7
7
7
7
7
7
7
7
7
7
Sou
rce:
City
of B
rea
143