Embed Size (px)
Citation preview
CITY OF CASTLE ROCK
COMPREHENSIVE PLAN
JANUARY 2006
City of Castle Rock
Comprehensive Plan
January, 2006
City of Castle Rock Comprehensive Plan, 2006
ACKNOWLEDGEMENTS
The City of Castle Rock expresses its appreciation to the citizens participating in the public meetings, hearings, and workshops held to update the Castle Rock Comprehensive Plan and to the following people and organizations who devoted time and effort in the Plan’s preparation.
Castle Rock Planning Commission
Gwen Boss Richard Heltemes Mari Hodges Brenda Hornbuckle Leah Medina Nancy Murphy Gordon Snyder
Castle Rock City Council
Barbara Larsen Julie Bean Greg Marcil Jeff Skeie Ed Smith Khembar Yund
Castle Rock Staff
Ryana Covington, City Clerk/Treasurer Public Works Director, Dave Vorse City Clerk, Joanne Purvis Bob Heuer, Police Chief Eric Koreis, Fire Chief Tom O’Neill, City Attorney Michael B. Johnson, PE, Engineer
Cowlitz-Wahkiakum Council of Governments
Erin Erdman, City Planner Stephen H. Harvey, Director Nancy Harris, Adm. Secretary Don Mathison, former City Planner
Others
Castle Rock School District No. 401 Castle Rock Chamber of Commerce
Castle Rock Senior Center Castle Rock Exhibit Hall Ministerial Association
City of Castle Rock Comprehensive Plan, 2006
Table of Contents
C
HAPTERS I. INTRODUCTION Purpose .............................................................................................................. I-1 The Planning Process........................................................................................... I-1 The Study Area .................................................................................................... I-2
Relationship to the 1986 Plan .............................................................................. I-2 Use of the Comprehensive Plan........................................................................... I-4 Comprehensive Plan Amendments...................................................................... I-4 Visioning.............................................................................................................. I-5 Public Participation.............................................................................................. I-6 Comprehensive Plan Organization ...................................................................... I-6 II. ENVIRONMENT Purpose ................................................................................................................ II-1 General Environmental Information ................................................................... II-2 Shoreline Considerations ..................................................................................... II-5 Critical Areas Ordinance .................................................................................... II-5 Open Space ......................................................................................................... II-8 III. LAND USE Land Use Goal .................................................................................................... III-1 Purpose ................................................................................................................ III-1 A Brief History of Castle Rock .......................................................................... III-2 Population ........................................................................................................... III-4 Land Use Classifications and Distribution ......................................................... III-5 Residential Development .................................................................................... III-10 Land Development/Subdivision ......................................................................... III-12 Commercial Development .................................................................................. III-13 Industrial Development ...................................................................................... III-14 Urban Growth ..................................................................................................... III-15 Historic and Cultural Resources ......................................................................... III-16 IV. HOUSING Purpose ............................................................................................................... IV-1 Housing Demographics ....................................................................................... IV-1 Trends in Housing ............................................................................................... IV-3 Housing Forecasts ............................................................................................... IV-7 Historic Preservation .......................................................................................... IV-9 Housing Goals ..................................................................................................... IV-10
Housing Policies ................................................................................................. IV-10 V. TRANSPORTATION Purpose ............................................................................................................... V-1 Local Policy/Regional Coordination ................................................................... V-1 Existing Transportation System .......................................................................... V-2 Future Transportation Needs .............................................................................. V-8 Six-Year Plan ...................................................................................................... V-10
City of Castle Rock Comprehensive Plan, 2006
Table of Contents, continued . . . CHAPTERS Funding Sources ................................................................................................ V-10 Transportation Goals .......................................................................................... V-10 Transportation Policies ....................................................................................... V-10 VI. CAPITAL FACILITIES Purpose ............................................................................................................... VI-1 City Facilities ...................................................................................................... VI-1 Castle Rock School District ................................................................................ VI-1 City Services ....................................................................................................... VI-2 City Utilities ........................................................................................................ VI-4 Capital Facility Goals ......................................................................................... VI-10 Capital Facility Policies ...................................................................................... VI-11 VII. ECONOMIC DEVELOPMENT Purpose ............................................................................................................... VII-1 Supplemental Plans ............................................................................................. VII-1 Existing Conditions & Information .................................................................... VII-4 Future Economic Development .......................................................................... VII-10 Economic Development Goals ........................................................................... VII-12 Economic Development Policies ........................................................................ VII-12 VIII. PARKS, RECREATION & OPEN SPACE ............................................................. VIII-1 FIGURES 1-1 Comprehensive Plan Study Area Map ...................................................................... I-3 3-1: Future Land Use Map ............................................................................................... III-7 3-2: Vacant Land Inventory ............................................................................................. III-9 5-1: Existing Transportation Network ............................................................................. V-3 5-2: Functional Classification of Public Roads................................................................. V-4 5-3: Sidewalk Inventory ................................................................................................... V-7 6-1: Age Distribution of Castle Rock Residences............................................................. VI-2 7-1: Income Levels in Cowlitz County, Castle Rock and WA State (1980-2000) ........... VII-5 7-2: Unemployment Rates (1980-2000) ........................................................................... VII-7 7-3: Cowlitz County Employment Trends (1970-2000) .................................................. VII-8 7-4: Economic Development Areas ................................................................................. VII-11 TABLES 3-1: Population Changes in Cowlitz County..................................................................... III-4 3-2: Estimated Post-Census Population Growth in Castle Rock ..................................... III-4 3-3: Estimated Post-Census Population Growth for Cowlitz County .............................. III-5 3-4: Land Use Classifications .......................................................................................... III-5 3-5: Existing Land Use Classifications by Acres ............................................................. III-6 3-6: Existing Land Use Comprehensive Plan Survey 2005 ............................................. III-6 3-7: Existing Land Use Comprehensive Plan Survey 1986 ............................................. III-6
City of Castle Rock Comprehensive Plan, 2006
Table of Contents, continued . . . TABLES 3-8: Vacant Land .............................................................................................................. III-10 3-9: Projected Acreage Needed for Residential Development ........................................ III-11 4-1: Population Growth .................................................................................................... IV-2 4-2: Castle Rock Housing Trends by Type (1970-2000) ................................................. IV-2 4-3: Year Structures Built ................................................................................................ IV-3 4-4: Average Household Size by Jurisdiction (1970-2000).............................................. IV-4 4-5: Household Population by Tenure ............................................................................. IV-5 4-6: Housing Occupancy .................................................................................................. IV-5 4-7: Residential Sales in Castle Rock .............................................................................. IV-6 4-8: Income by Household in 1999 .................................................................................. IV-7 4-9: Projected Housing Needs .......................................................................................... IV-8 4-10: Existing Land by Zone .............................................................................................. IV-8 4-11: Projected Multi-family Housing Needs .................................................................... IV-9 4-12: Historic Site Inventory .............................................................................................. IV-10 7-1: Marketing Plan Chart ................................................................................................ VII-2 7-2: Median Household Income for Selected Cities and Cowlitz County ....................... VII-5 7-3: Place of Employment ................................................................................................ VII-5 7-4: Labor Force and Unemployment .............................................................................. VII-6 7-5: Major Employment Sectors of Cowlitz County, March 2005 .................................. VII-6 7-6: Castle Rock Employment Trends ............................................................................. VII-6 7-7: Length of Commute to Work .................................................................................... VII-7 7-8: Educational Attainment ............................................................................................ VII-8 7-9: Businesses within Castle Rock Area (zip code) ....................................................... VII-9 APPENDICES A Six-Year Transportation Improvement Program (TIP) B Public Participation C City of Castle Rock Parks and Recreation Plan 441 TOC EE10-05
City of Castle Rock Comprehensive Plan, 2006
Chapter I Introduction
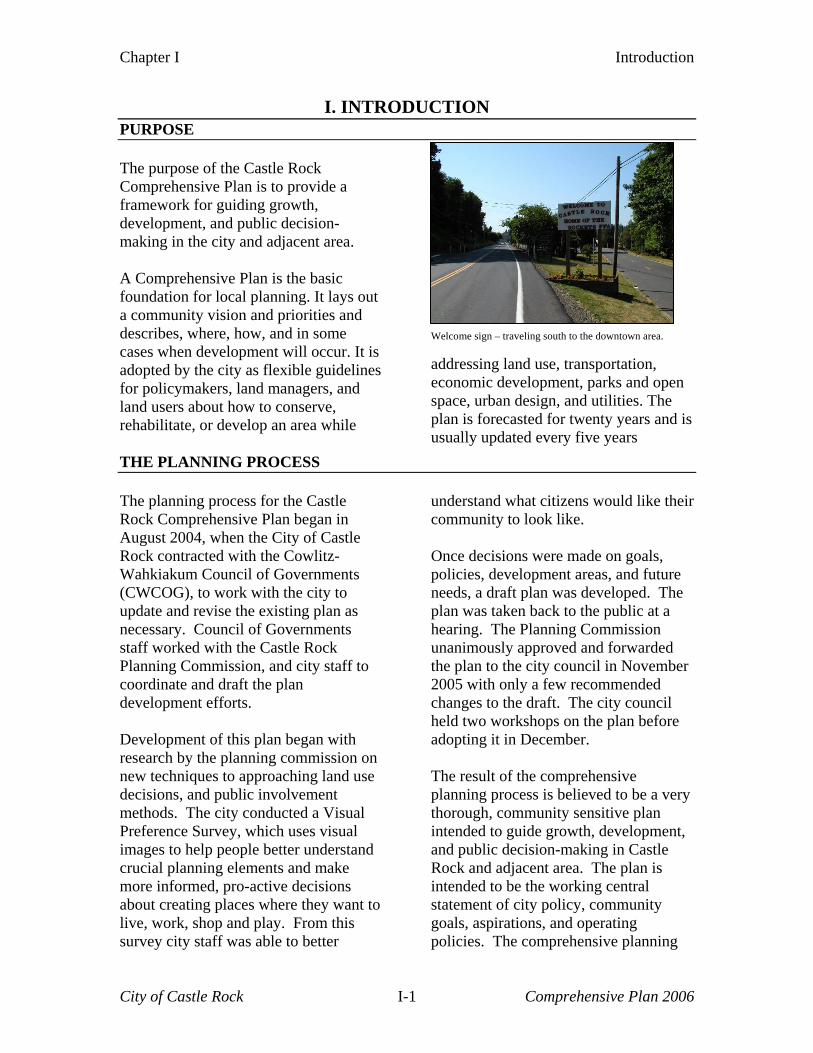
I. INTRODUCTION PURPOSE The purpose of the Castle Rock Comprehensive Plan is to provide a framework for guiding growth, development, and public decision-making in the city and adjacent area. A Comprehensive Plan is the basic foundation for local planning. It lays out a community vision and priorities and describes, where, how, and in some cases when development will occur. It is adopted by the city as flexible guidelines for policymakers, land managers, and land users about how to conserve, rehabilitate, or develop an area while
Welcome sign – traveling south to the downtown area. addressing land use, transportation, economic development, parks and open space, urban design, and utilities. The plan is forecasted for twenty years and is usually updated every five years
THE PLANNING PROCESS The planning process for the Castle Rock Comprehensive Plan began in August 2004, when the City of Castle Rock contracted with the Cowlitz-Wahkiakum Council of Governments (CWCOG), to work with the city to update and revise the existing plan as necessary. Council of Governments staff worked with the Castle Rock Planning Commission, and city staff to coordinate and draft the plan development efforts. Development of this plan began with research by the planning commission on new techniques to approaching land use decisions, and public involvement methods. The city conducted a Visual Preference Survey, which uses visual images to help people better understand crucial planning elements and make more informed, pro-active decisions about creating places where they want to live, work, shop and play. From this survey city staff was able to better
understand what citizens would like their community to look like. Once decisions were made on goals, policies, development areas, and future needs, a draft plan was developed. The plan was taken back to the public at a hearing. The Planning Commission unanimously approved and forwarded the plan to the city council in November 2005 with only a few recommended changes to the draft. The city council held two workshops on the plan before adopting it in December. The result of the comprehensive planning process is believed to be a very thorough, community sensitive plan intended to guide growth, development, and public decision-making in Castle Rock and adjacent area. The plan is intended to be the working central statement of city policy, community goals, aspirations, and operating policies. The comprehensive planning
City of Castle Rock I-1 Comprehensive Plan 2006
Chapter I Introduction
process is only the first part of a continuing planning process that includes the adoption of the plan, implementation of the plan through
ordinances, and revisions to the plan as needs arise.
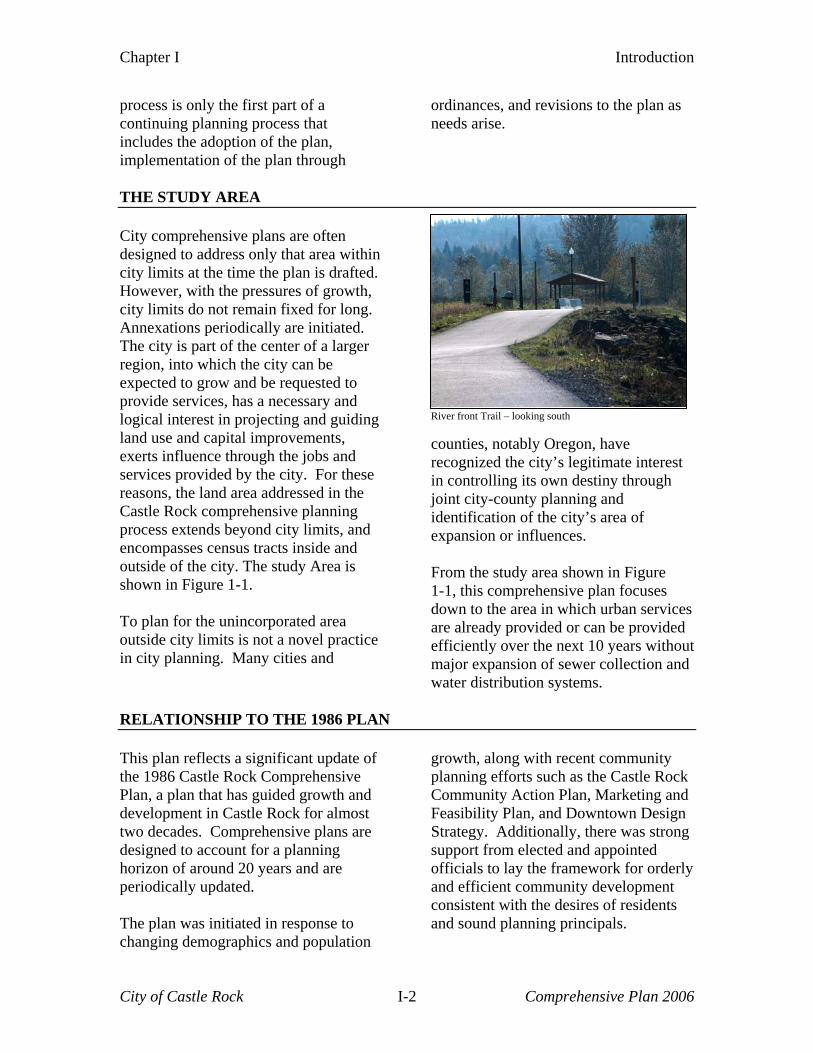
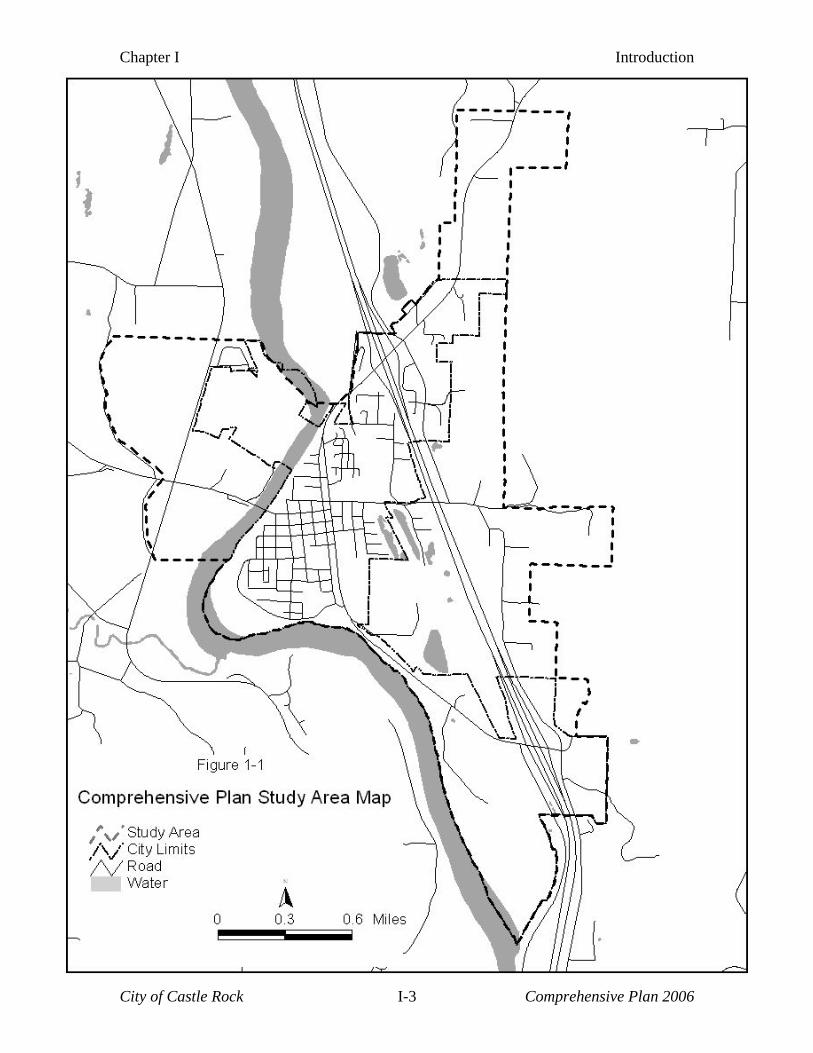
THE STUDY AREA City comprehensive plans are often designed to address only that area within city limits at the time the plan is drafted. However, with the pressures of growth, city limits do not remain fixed for long. Annexations periodically are initiated. The city is part of the center of a larger region, into which the city can be expected to grow and be requested to provide services, has a necessary and logical interest in projecting and guiding land use and capital improvements, exerts influence through the jobs and services provided by the city. For these reasons, the land area addressed in the Castle Rock comprehensive planning process extends beyond city limits, and encompasses census tracts inside and outside of the city. The study Area is shown in Figure 1-1. To plan for the unincorporated area outside city limits is not a novel practice in city planning. Many cities and
River front Trail – looking south counties, notably Oregon, have recognized the city’s legitimate interest in controlling its own destiny through joint city-county planning and identification of the city’s area of expansion or influences. From the study area shown in Figure 1-1, this comprehensive plan focuses down to the area in which urban services are already provided or can be provided efficiently over the next 10 years without major expansion of sewer collection and water distribution systems.
RELATIONSHIP TO THE 1986 PLAN This plan reflects a significant update of the 1986 Castle Rock Comprehensive Plan, a plan that has guided growth and development in Castle Rock for almost two decades. Comprehensive plans are designed to account for a planning horizon of around 20 years and are periodically updated. The plan was initiated in response to changing demographics and population
growth, along with recent community planning efforts such as the Castle Rock Community Action Plan, Marketing and Feasibility Plan, and Downtown Design Strategy. Additionally, there was strong support from elected and appointed officials to lay the framework for orderly and efficient community development consistent with the desires of residents and sound planning principals.
City of Castle Rock I-2 Comprehensive Plan 2006
Chapter I Introduction
City of Castle Rock I-3 Comprehensive Plan 2006
Chapter I Introduction
While much of the content of this plan, including many goals and policies are very similar to the 1986 document, the overall format and specific wording has been substantially altered. This plan was
also designed to more closely mirror the requirements of state planning statues along with applicable trends and newer concepts in the field of city planning.
USE OF THE COMPREHENSIVE PLAN The comprehensive plan will be utilized in a variety of ways in the years to come. First, the plan creates a framework for making decisions concerning the future of Castle Rock, guiding the investment of public funds and services. Second, it sets a policy directive based on the expressed community vision as gleaned through input from citizens, state and local agencies, stakeholders and locally elected and appointed officials. Zoning, subdivision and other regulations should embody policies generated by the comprehensive planning process. Proposed code changes affecting land use, including rezones and annexations will be reviewed to determine their general consistency with the plan. Likewise, efforts to initiate changes to rules and regulations may also be instigated by the plan. At the same time, it is important to recognize the intended limitations of the comprehensive plan. The plan is not a specific regulation or law that controls the use of land, nor does it change
existing zoning. However, appropriate city regulations should be consistent with the broad goals and policies of the plan. Furthermore, it is not a document designed to be the determining factor for site-specific projects. In some cases though, such as with rezone requests, substantial weight will be place on conformance with the comprehensive plan. Land use decisions, projects and proposals do need to conform to the plan in a general sense, but conformance is mostly reflected in how a given project compiles with city code. Mechanisms for implementing the plan include zoning and subdivision ordinances and other rules and documents that guide and direct land use. In other circumstances, the plan simply calls for future research and consideration of specific factors that may or may not lead to rule changes. Conditional uses and other applicable permits will also be reviewed for their conformance with the plan.
COMPREHENSIVE PLAN AMENDMENTS The Castle Rock Comprehensive Plan should be updated every five to seven years or sooner if necessary. The 2010 Census and accompanying data due out thereafter, provide an ideal time frame to begin and complete the first major update of this plan. Relatively minor updates to text or the future land use
map should be limited to once a year as directed by the City Council, unless emergency situations arise and/or to protect the health, safety and well being of the public. Amendments may be proposed by the city or by an individual applicant seeking consideration of a specific proposal.
City of Castle Rock I-4 Comprehensive Plan 2006
Chapter I Introduction
The Planning Commission should consider all amendment proposals on an annual basis at the same time so that their cumulative effects can be ascertained. Proposed zoning changes should be coupled with simultaneous comprehensive plan amendments to ensure consistency between the comprehensive plan and development regulations. In reviewing proposed changes to the Castle Rock Comprehensive Plan, the planning commission and City Council shall place substantial weight on the following approval criteria: 1. The proposal is consistent with the
provisions of state planning statutes and will not result in comprehensive plan or regulatory conflicts;
2. The proposal will change the development or use potential of a site or area without creating significant adverse impacts on existing uses and critical areas;
3. The proposed amendment will be
adequately served by applicable services, facilities, and utilities, including transportation;
4. The proposal will help implement
city goals and/or policies contained within the plan;
5. If the proposal could have substantial
impacts beyond incorporated city limits, it has been distributed to all appropriate bodies and agencies for review and comment including Cowlitz County.
VISIONING Visioning is a process that helps to determine core values and ideals for a community and transform them into feasible community goals and policy. It is a citizen-driven approach that seeks to broadly define a preferred future for a given area. The general goals and policies of the Comprehensive Plan should be compatible with the vision statement for the City of Castle Rock. In 2002, A Community Action Plan (CAP) was completed in collaboration with the city, stakeholders, citizens, and the United States Forest Service. Outside consultants where hired to provide technical assistance with the plan. Members of the Action Plan committee represented a broad range of businesses, citizens and governmental interests.
While the Community action plan was focused on the economic vitality, social networks, favorable business conditions, and cultural and recreational opportunities for the City of Castle Rock, it has helped shape ideas for the city overall, due to the intense citizen involvement process. Citizens went through an extensive visioning process associated with the Action Plan, and the city has chosen to adopt the same vision statement for the Comprehensive Plan. The Vision Statement is stated below; Castle Rock: Where Past, Present and
Future Come Together Castle Rock is a wonderful place to live, work and play. It’s a community where the people are as resilient and vibrant as the natural features that surrounds their home; a place where life-long residents
City of Castle Rock I-5 Comprehensive Plan 2006
Chapter I Introduction
and visitors alike feel they are part of the same tight-knit family. Castle Rock values and celebrates its historical roots, while always planning for and embracing its future. Over the years, community organizations and volunteers have joined forces with local governments to create an impressive menu of year-round recreational activities, town festivals and cultural attractions. They have helped make Castle Rock a place where people not only want to come…but a place people want to stay. Citizens and government work in partnership with business and industry to support and enhance the city’s diverse economic base. The fruit of their efforts can be seen in a thriving downtown core,
bustling I-5 business district and an ever expanding mix of employment opportunities. People in Castle Rock understand that a balanced, prosperous economy fuels a healthy social environment. The community places a premium on life-long learning. Schools enjoy strong public support, and extended education opportunities – from specialized vocational training to personal-enrichment courses – are available to people of all ages. Castle Rock is a place people are proud to call home; a place where each generation works to pass along to their children the sense of safety and comfort provided by their own parents. It’s a place where the past, present and future come together.
PUBLIC PARTICIPATION The public was notified and informed of the comprehensive plan update process in a variety of ways. Early in the update process, a letter was sent to key groups, organizations, individuals and governmental entities notifying them of the plan revision, associated timeline,
and requested them to participate in the visual preference survey. Additional notice was provided via newspaper articles published in the Valley Bugler and the Daily News, and draft elements, meeting announcements, and information were posted on the City’s website.
COMPREHENSIVE PLAN ORGANIZATION The comprehensive plan is divided into eight (8) main sections that correspond to the following elements. Chapter 1: Introduction Chapter 2: Environment Chapter 3: Land Use
Chapter 4: Housing Chapter 5: Transportation Chapter 6: Capital Facilities & Utilities Chapter 7: Economic Development Chapter 8: Parks, Recreation & Open Space
City of Castle Rock I-6 Comprehensive Plan 2006
Chapter I Introduction
For the most part, each chapter contains the same basic components, a brief introduction, purpose of the element, relative background information, facts, future needs, and goals and policies. Goals represent the general aspiration and direction of the city, while policies are meant to be more detailed operational actions that likely require a specific action by the city, possibly within a give timeframe. Data and information presented add context to goal and policy directives and inform elected and appointed city
officials and the general public of various topic. The supporting existing conditions provide direction and identify issues, trends and possibly needed improvements. As a note of caution, maps, tables, figures and other data within each section may not be updated regularly and anyone seeking specific information on zoning or other matters should contact the city. Background information and data should be updated only at major plan revisions (approximately every five to seven years).
City of Castle Rock I-7 Comprehensive Plan 2006
Chapter II Environment
II. ENVIRONMENT
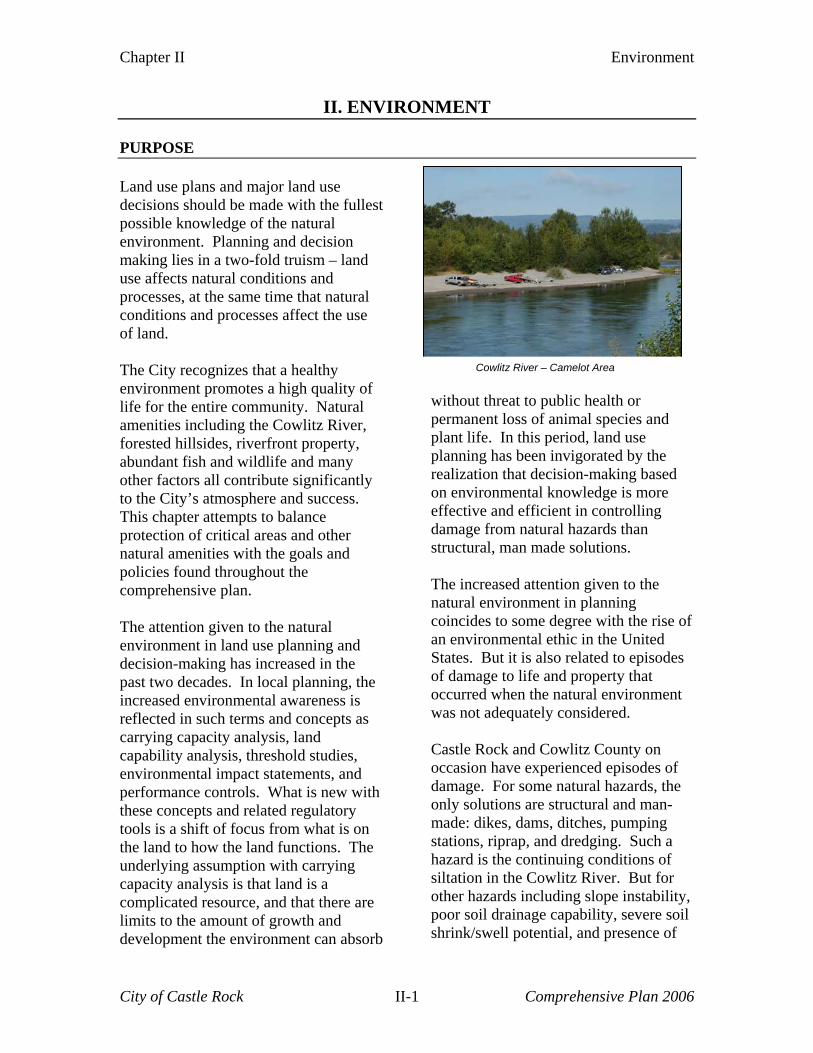
PURPOSE Land use plans and major land use decisions should be made with the fullest possible knowledge of the natural environment. Planning and decision making lies in a two-fold truism – land use affects natural conditions and processes, at the same time that natural conditions and processes affect the use of land. The City recognizes that a healthy environment promotes a high quality of life for the entire community. Natural amenities including the Cowlitz River, forested hillsides, riverfront property, abundant fish and wildlife and many other factors all contribute significantly to the City’s atmosphere and success. This chapter attempts to balance protection of critical areas and other natural amenities with the goals and policies found throughout the comprehensive plan. The attention given to the natural environment in land use planning and decision-making has increased in the past two decades. In local planning, the increased environmental awareness is reflected in such terms and concepts as carrying capacity analysis, land capability analysis, threshold studies, environmental impact statements, and performance controls. What is new with these concepts and related regulatory tools is a shift of focus from what is on the land to how the land functions. The underlying assumption with carrying capacity analysis is that land is a complicated resource, and that there are limits to the amount of growth and development the environment can absorb
Cowlitz River – Camelot Area
without threat to public health or permanent loss of animal species and plant life. In this period, land use planning has been invigorated by the realization that decision-making based on environmental knowledge is more effective and efficient in controlling damage from natural hazards than structural, man made solutions. The increased attention given to the natural environment in planning coincides to some degree with the rise of an environmental ethic in the United States. But it is also related to episodes of damage to life and property that occurred when the natural environment was not adequately considered. Castle Rock and Cowlitz County on occasion have experienced episodes of damage. For some natural hazards, the only solutions are structural and man-made: dikes, dams, ditches, pumping stations, riprap, and dredging. Such a hazard is the continuing conditions of siltation in the Cowlitz River. But for other hazards including slope instability, poor soil drainage capability, severe soil shrink/swell potential, and presence of
City of Castle Rock II-1 Comprehensive Plan 2006
Chapter II Environment
faults – non-structural solutions to prevent damage are desirable and available through planning and informed decision-making. The Castle Rock Comprehensive Plan falls on the heels of the Castle Rock Critical Areas Ordinance completed in 2002. The Critical Areas ordinance identifies and maps sensitive areas that are in need of special consideration, analyzes the natural processes associated with sensitive areas, and provides tools
for maintaining sensitive areas all while allowing compatible development. The purpose of the natural environment background section is to provide necessary environmental information to City decision-makers, to alert property owners and developers to special problems, to lay groundwork for regulatory tools, and to indicate the basis for the plan’s goals, and policies relating to the natural environment.
GENERAL ENVIRONMENTAL INFORMATION It is advocated that land use plans and decisions should be made with the fullest possible knowledge of the natural environment and processes that are involved. Until recently, the consideration of the natural environment in the development of urban areas has been sorely neglected. Besides the obvious damage wrought by catastrophic natural disasters (floods, earthquakes), less spectacular but far more costly is damage due to such natural hazards as erosion, landslides, and expansive soils.
There are many costly examples of ignoring environmental factors in Cowlitz County as well: flooded basements and entire houses, damage to housing built in geologically unstable areas, wall and foundation damage from expansive soils, septic tank failures, etc. In the final analysis, we all pay for these damages directly as property owners or indirectly as taxpayers. The Aldercrest landslide in Kelso in 1998 (which destroyed around 128 homes) underscores the importance of assessing potential natural hazards and planning accordingly.
Geology Geologic Hazards pose a risk to public and private property and to the natural systems that make up the city’s environment. These lands are susceptible to slides, erosion, seismic effects, and volcanic and mining hazards. The bedrock geology of the study area is varied and complex and only generalized geologic mapping has been done of the area. The surface and near-surface composition of the study area has been formed and modified over time by glaciation, volcanism, faulting,
folding, deposition of sediments by rising and falling water bodies, and erosion. The primary geologic functions in the area are: Alluvium – Consists of sand, gravel, and silt underlying floodplains, valley floors, and low terraces. Most of Castle Rock and the low-lying area along the Cowlitz River and Salmon Creek are alluvium. Wilkes Formation – Consists of nonmarine semiconsolidated claystone,
City of Castle Rock II-2 Comprehensive Plan 2006
Chapter II Environment
siltstone, sandstone, and conglomerate. Most of the material in the Wilkes Formation was derived from explosive volcanoes and erosion of volcanic flows. It is seen around water bodies in the study area. Terrace deposits – Composed of pebbles, cobbles, and boulders in a poorly sorted sandy matrix. Most of the deposit is partly cemented with limonite derived from ground water. East of Castle Rock along Interstate-5 the terraces are believed to have been formed by continental glaciations which brought material down the ancient Cowlitz. South and east of Salmon Creek the terrace has been reduced to an erosional feature marked by thin patches of gravel a few feet or less in thickness. Logan Hill Formation – Consists of deposits of gravel and sand with minor amounts of silt and clay. In the study
area, the formation is found adjacent to the terrace deposits and runs in a north-south direction east of Interstate-5. Cowlitz Formation – Composed of marine sandstone and siltstone; brackish water siltstone and sandstone; and nonmarine sandstone and siltstone, and coal beds. In the study area, the formation lies east of Interestate-5 intermingled with the terrace deposits and the Logan Hill Formation. Hatchet Mountain Formation – The ridge line (Newell Ridge or Ubheloe Hill) that basically separates Castle Rock, Interstate-5, and the terrace hillside along I-5 from Silver Lake is characterized as Hatchet Mountain Formation. The rugged ridges and mountains are formed of lava flows, flow breccias, pyroclastic rocks, and sedimentary rocks overlying the Cowlitz Formation.
Topography Much of Castle Rock is located along the Cowlitz River floodplain which is very flat. The hillsides immediately west and southwest of Castle Rock have slopes up to 30 percent.
Elevation in the study area varies from 40 feet above sea level at Castle Rock and the Cowlitz River Valley to approximately 1,000 feet at Newell Ridge.
Climate The climate of the study area is mid-latitude, West Coast marine type with moist air and a small daily range in temperature. The major climate influences are the position and intensity of large high and low pressure centers in the North Pacific Ocean. The average maximum temperature in the summer exceeds 75 degrees for July and August, while the average minimum
temperature in January, the coldest month, has a low just below freezing at 31.8 degrees and a high of 44.5 degrees. There are approximately 175 frost-free days annually. Humidity is rarely a problem, but sometimes reaches uncomfortable levels in the summer. Annual precipitation in nearby Longview averages above 46 inches, while the Castle Rock area receives closer to 60 inches of precipitation
City of Castle Rock II-3 Comprehensive Plan 2006
Chapter II Environment
annually. Around 80% of the precipitation occurs between the month of October and March. Snowfall is light in the study area, although increases in higher areas. Average annual evaporation is 25 inches. Undeveloped
areas in and around the city are generally forested. The predominant tree species growing in the region are Douglas fir, maple, hemlock, alder, cottonwood and other deciduous trees. Some wetlands and scrub are also in the vicinity.
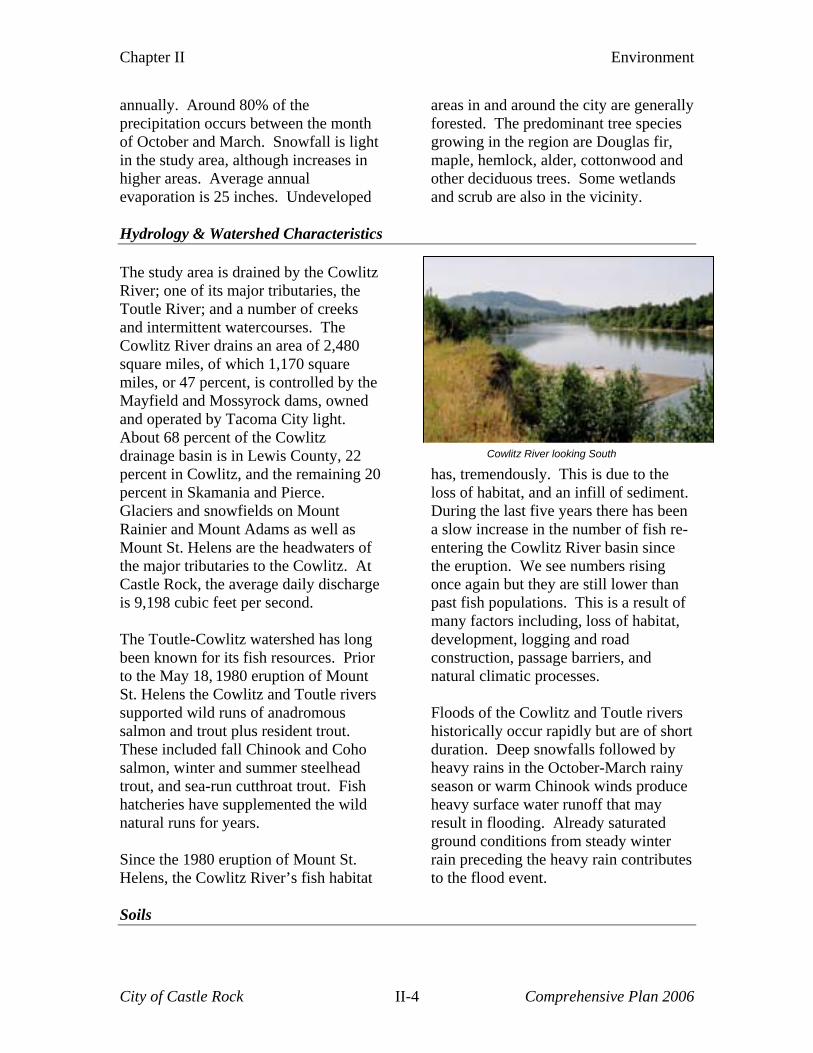
Hydrology & Watershed Characteristics The study area is drained by the Cowlitz River; one of its major tributaries, the Toutle River; and a number of creeks and intermittent watercourses. The Cowlitz River drains an area of 2,480 square miles, of which 1,170 square miles, or 47 percent, is controlled by the Mayfield and Mossyrock dams, owned and operated by Tacoma City light. About 68 percent of the Cowlitz drainage basin is in Lewis County, 22 percent in Cowlitz, and the remaining 20 percent in Skamania and Pierce. Glaciers and snowfields on Mount Rainier and Mount Adams as well as Mount St. Helens are the headwaters of the major tributaries to the Cowlitz. At Castle Rock, the average daily discharge is 9,198 cubic feet per second. The Toutle-Cowlitz watershed has long been known for its fish resources. Prior to the May 18, 1980 eruption of Mount St. Helens the Cowlitz and Toutle rivers supported wild runs of anadromous salmon and trout plus resident trout. These included fall Chinook and Coho salmon, winter and summer steelhead trout, and sea-run cutthroat trout. Fish hatcheries have supplemented the wild natural runs for years. Since the 1980 eruption of Mount St. Helens, the Cowlitz River’s fish habitat
has, tremendously. This is due to the loss of habitat, and an infill of sediment. During the last five years there has been a slow increase in the number of fish re-entering the Cowlitz River basin since the eruption. We see numbers rising once again but they are still lower than past fish populations. This is a result of many factors including, loss of habitat, development, logging and road construction, passage barriers, and natural climatic processes.
Cowlitz River looking South
Floods of the Cowlitz and Toutle rivers historically occur rapidly but are of short duration. Deep snowfalls followed by heavy rains in the October-March rainy season or warm Chinook winds produce heavy surface water runoff that may result in flooding. Already saturated ground conditions from steady winter rain preceding the heavy rain contributes to the flood event.
Soils
City of Castle Rock II-4 Comprehensive Plan 2006
Chapter II Environment
The Soil Conservation Service (now Natural Resource Conservation Service) published the soil survey for Cowlitz County in 1974. The majority of the City of Castle Rock, especially along the Cowlitz River, is classified as part of the Caples-Clato-Newberg Soils Association. These soils are primarily sand, sandy loam and silty loam. They form on the alluvium of flood plains. To the east of Interstate-5, the more upland area is part of the Bear Prairie-Loper Association, consisting of volcanic ash, basalt, and andesite. These soils form on ridge tops and mountainsides. Each type of soil has a set of characteristics that determine whether that particular soil type is suitable for development. These characteristics
consist of percent of slope, depth of bedrock, depth of seasonally high water table, shrink/swell potential, bearing strength, agricultural capability class, and natural hazard (soil slippage potential). In order to facilitate use of the soil-characteristics information in planning, National Resource Conservation Service has developed a table on the suitability of the various soils for specific uses. The soils are rated as having low, moderate, or severe limitations for the specific use based on one or more of the soil characteristics. The three uses used in the rating system include septic drain fields, foundation for low buildings, and secondary roads and trails.
SHORELINE CONSIDERATIONS The City of Castle Rock has approximately 3.4 miles of shoreline within the city limits. For the most part, the land that falls in the jurisdiction of state Shoreline Management Act is occupied by open space and recreation, and is diked along the city limits. There are no other rivers or lakes of sufficient
size within the city limits that are subject to the shoreline rules. The City has adopted by ordinance, Cowlitz County’s Shoreline Master Program, which was adopted in 1977. Cowlitz County is not required to update their Master Program until 2012.
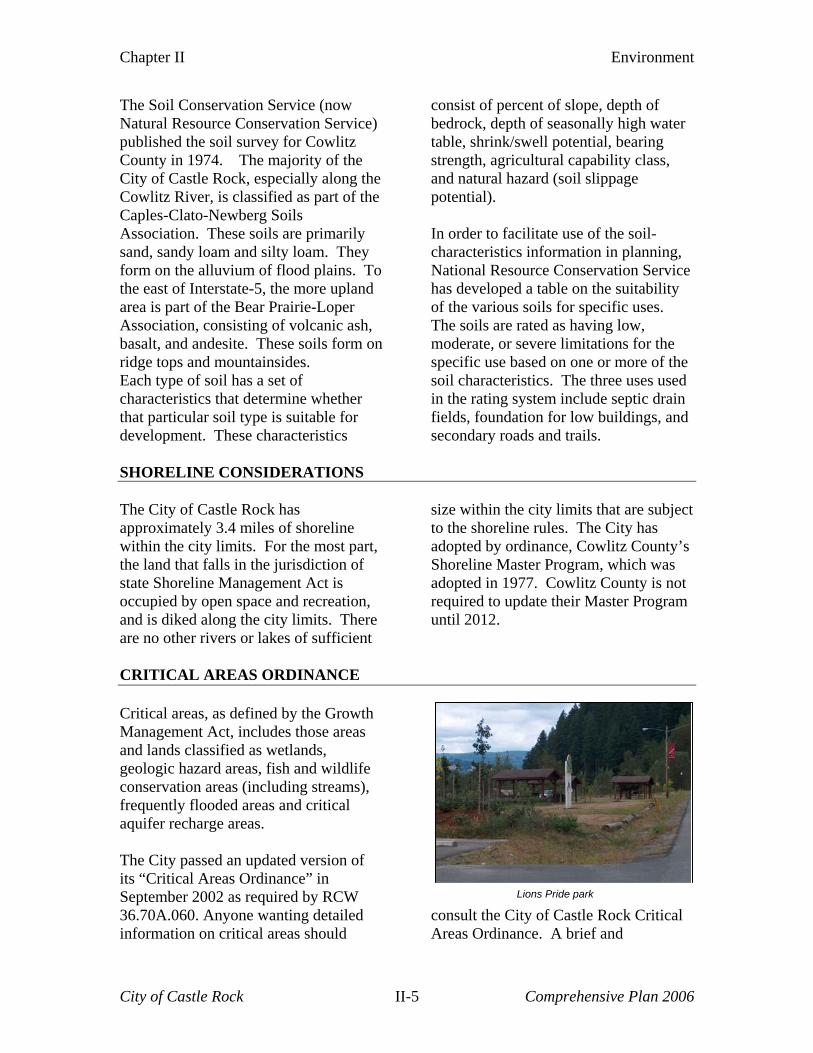
CRITICAL AREAS ORDINANCE Critical areas, as defined by the Growth Management Act, includes those areas and lands classified as wetlands, geologic hazard areas, fish and wildlife conservation areas (including streams), frequently flooded areas and critical aquifer recharge areas. The City passed an updated version of its “Critical Areas Ordinance” in September 2002 as required by RCW 36.70A.060. Anyone wanting detailed information on critical areas should
consult the City of Castle Rock Critical Areas Ordinance. A brief and
Lions Pride park
City of Castle Rock II-5 Comprehensive Plan 2006
Chapter II Environment
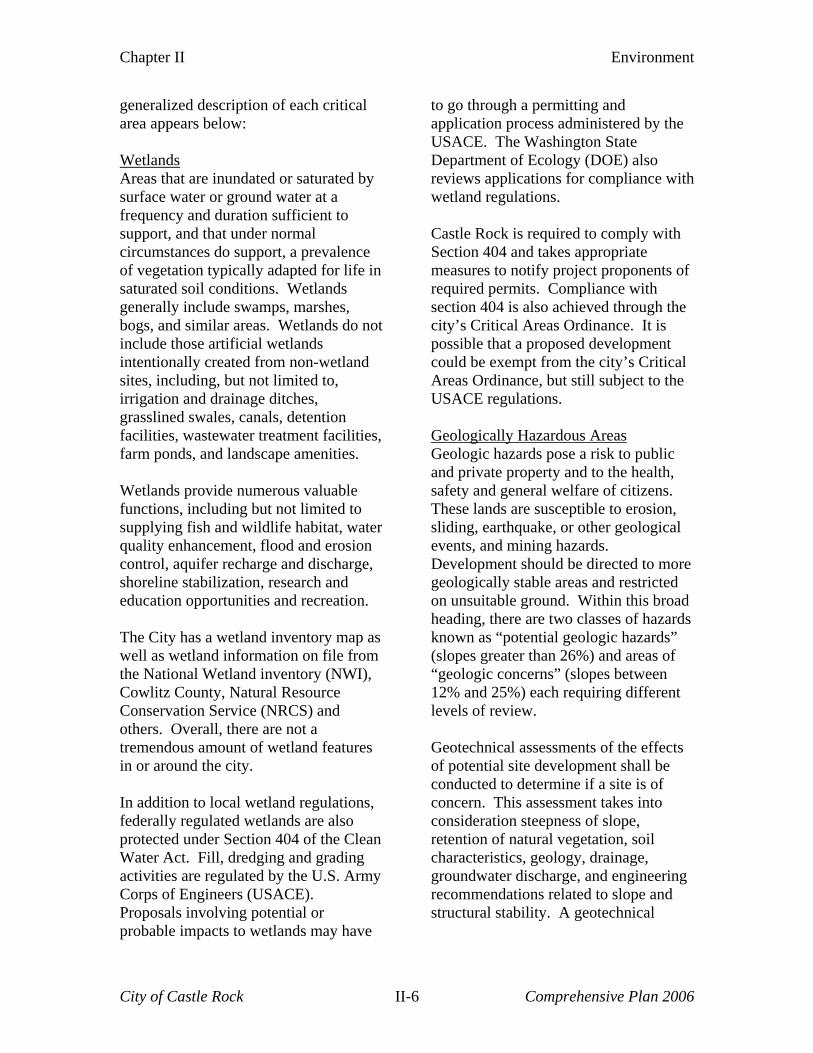
generalized description of each critical area appears below: Wetlands Areas that are inundated or saturated by surface water or ground water at a frequency and duration sufficient to support, and that under normal circumstances do support, a prevalence of vegetation typically adapted for life in saturated soil conditions. Wetlands generally include swamps, marshes, bogs, and similar areas. Wetlands do not include those artificial wetlands intentionally created from non-wetland sites, including, but not limited to, irrigation and drainage ditches, grasslined swales, canals, detention facilities, wastewater treatment facilities, farm ponds, and landscape amenities. Wetlands provide numerous valuable functions, including but not limited to supplying fish and wildlife habitat, water quality enhancement, flood and erosion control, aquifer recharge and discharge, shoreline stabilization, research and education opportunities and recreation. The City has a wetland inventory map as well as wetland information on file from the National Wetland inventory (NWI), Cowlitz County, Natural Resource Conservation Service (NRCS) and others. Overall, there are not a tremendous amount of wetland features in or around the city. In addition to local wetland regulations, federally regulated wetlands are also protected under Section 404 of the Clean Water Act. Fill, dredging and grading activities are regulated by the U.S. Army Corps of Engineers (USACE). Proposals involving potential or probable impacts to wetlands may have
to go through a permitting and application process administered by the USACE. The Washington State Department of Ecology (DOE) also reviews applications for compliance with wetland regulations. Castle Rock is required to comply with Section 404 and takes appropriate measures to notify project proponents of required permits. Compliance with section 404 is also achieved through the city’s Critical Areas Ordinance. It is possible that a proposed development could be exempt from the city’s Critical Areas Ordinance, but still subject to the USACE regulations. Geologically Hazardous Areas Geologic hazards pose a risk to public and private property and to the health, safety and general welfare of citizens. These lands are susceptible to erosion, sliding, earthquake, or other geological events, and mining hazards. Development should be directed to more geologically stable areas and restricted on unsuitable ground. Within this broad heading, there are two classes of hazards known as “potential geologic hazards” (slopes greater than 26%) and areas of “geologic concerns” (slopes between 12% and 25%) each requiring different levels of review. Geotechnical assessments of the effects of potential site development shall be conducted to determine if a site is of concern. This assessment takes into consideration steepness of slope, retention of natural vegetation, soil characteristics, geology, drainage, groundwater discharge, and engineering recommendations related to slope and structural stability. A geotechnical
City of Castle Rock II-6 Comprehensive Plan 2006
Chapter II Environment
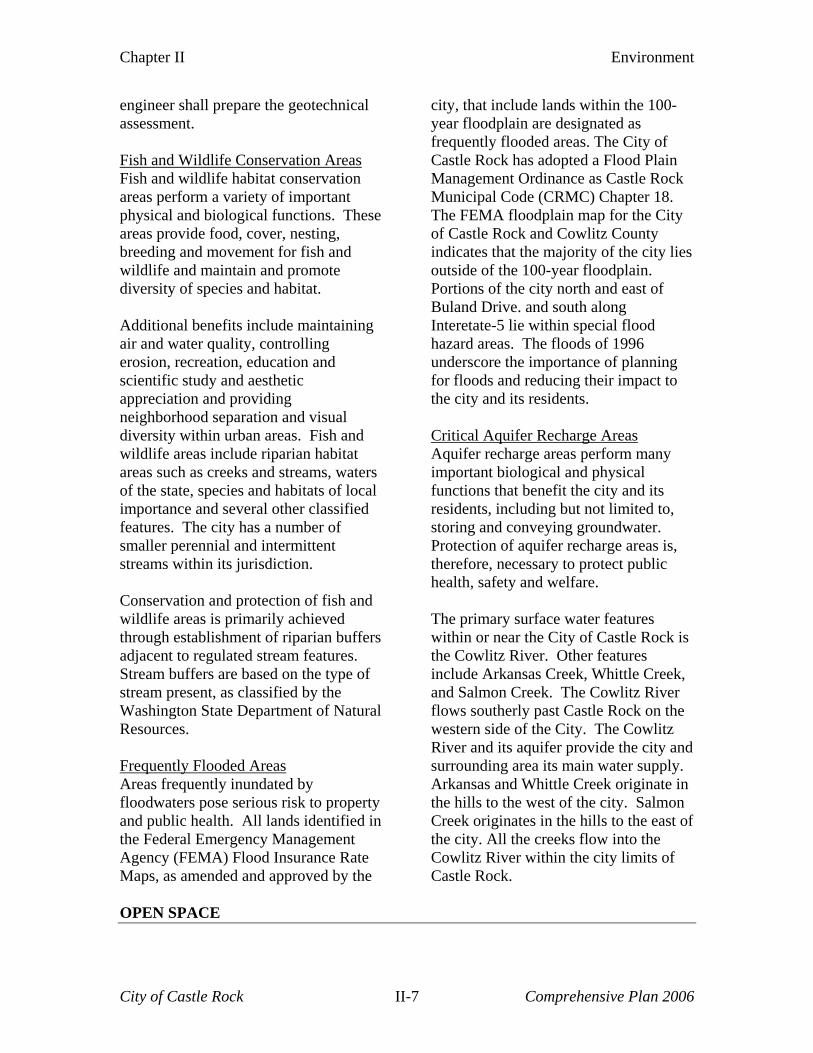
engineer shall prepare the geotechnical assessment. Fish and Wildlife Conservation Areas Fish and wildlife habitat conservation areas perform a variety of important physical and biological functions. These areas provide food, cover, nesting, breeding and movement for fish and wildlife and maintain and promote diversity of species and habitat. Additional benefits include maintaining air and water quality, controlling erosion, recreation, education and scientific study and aesthetic appreciation and providing neighborhood separation and visual diversity within urban areas. Fish and wildlife areas include riparian habitat areas such as creeks and streams, waters of the state, species and habitats of local importance and several other classified features. The city has a number of smaller perennial and intermittent streams within its jurisdiction. Conservation and protection of fish and wildlife areas is primarily achieved through establishment of riparian buffers adjacent to regulated stream features. Stream buffers are based on the type of stream present, as classified by the Washington State Department of Natural Resources. Frequently Flooded Areas Areas frequently inundated by floodwaters pose serious risk to property and public health. All lands identified in the Federal Emergency Management Agency (FEMA) Flood Insurance Rate Maps, as amended and approved by the
city, that include lands within the 100-year floodplain are designated as frequently flooded areas. The City of Castle Rock has adopted a Flood Plain Management Ordinance as Castle Rock Municipal Code (CRMC) Chapter 18. The FEMA floodplain map for the City of Castle Rock and Cowlitz County indicates that the majority of the city lies outside of the 100-year floodplain. Portions of the city north and east of Buland Drive. and south along Interetate-5 lie within special flood hazard areas. The floods of 1996 underscore the importance of planning for floods and reducing their impact to the city and its residents. Critical Aquifer Recharge Areas Aquifer recharge areas perform many important biological and physical functions that benefit the city and its residents, including but not limited to, storing and conveying groundwater. Protection of aquifer recharge areas is, therefore, necessary to protect public health, safety and welfare. The primary surface water features within or near the City of Castle Rock is the Cowlitz River. Other features include Arkansas Creek, Whittle Creek, and Salmon Creek. The Cowlitz River flows southerly past Castle Rock on the western side of the City. The Cowlitz River and its aquifer provide the city and surrounding area its main water supply. Arkansas and Whittle Creek originate in the hills to the west of the city. Salmon Creek originates in the hills to the east of the city. All the creeks flow into the Cowlitz River within the city limits of Castle Rock.
OPEN SPACE
City of Castle Rock II-7 Comprehensive Plan 2006
Chapter II Environment
The City of Castle Rock seeks to preserve open space in an effort to protect vital habitat, improve the quality of life for residents and to buffer various land uses. Open space may occur in all land use classifications, but is particularly prevalent in the public/quasi public and open space recreation areas, which occupy significant areas of the city. Designated open space includes all environmentally sensitive areas (e.g. wetlands, stream buffers, steep slopes, etc.) and any other protective measures
required by the Critical Areas Ordinance. The city maintains various maps identifying wetlands and steep slopes. A large majority of the land outside of the City is managed forestland, which will be preserved as open space, unless the market crashes and the larger companies transform the property for a different use. The City is also very conscious about providing parks and trails for its residents.
City of Castle Rock II-8 Comprehensive Plan 2006
Chapter III Land Use
III. LAND USE
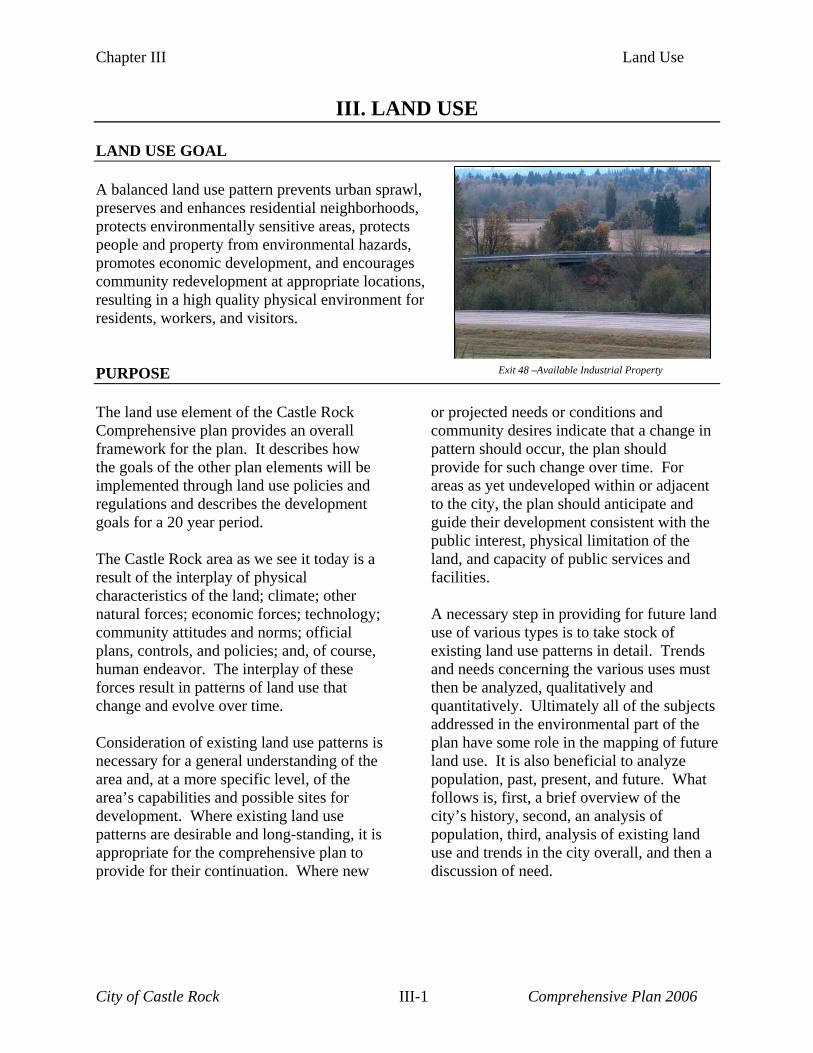
LAND USE GOAL A balanced land use pattern prevents urban sprawl, preserves and enhances residential neighborhoods, protects environmentally sensitive areas, protects people and property from environmental hazards, promotes economic development, and encourages community redevelopment at appropriate locations, resulting in a high quality physical environment for residents, workers, and visitors. PURPOSE Exit 48 –Available Industrial Property
The land use element of the Castle Rock Comprehensive plan provides an overall framework for the plan. It describes how the goals of the other plan elements will be implemented through land use policies and regulations and describes the development goals for a 20 year period. The Castle Rock area as we see it today is a result of the interplay of physical characteristics of the land; climate; other natural forces; economic forces; technology; community attitudes and norms; official plans, controls, and policies; and, of course, human endeavor. The interplay of these forces result in patterns of land use that change and evolve over time. Consideration of existing land use patterns is necessary for a general understanding of the area and, at a more specific level, of the area’s capabilities and possible sites for development. Where existing land use patterns are desirable and long-standing, it is appropriate for the comprehensive plan to provide for their continuation. Where new
or projected needs or conditions and community desires indicate that a change in pattern should occur, the plan should provide for such change over time. For areas as yet undeveloped within or adjacent to the city, the plan should anticipate and guide their development consistent with the public interest, physical limitation of the land, and capacity of public services and facilities. A necessary step in providing for future land use of various types is to take stock of existing land use patterns in detail. Trends and needs concerning the various uses must then be analyzed, qualitatively and quantitatively. Ultimately all of the subjects addressed in the environmental part of the plan have some role in the mapping of future land use. It is also beneficial to analyze population, past, present, and future. What follows is, first, a brief overview of the city’s history, second, an analysis of population, third, analysis of existing land use and trends in the city overall, and then a discussion of need.
City of Castle Rock III-1 Comprehensive Plan 2006
Chapter III Land Use
A BRIEF HISTORY OF CASTLE ROCK The history of Castle Rock begins with the history of the Cowlitz River Corridor. The Indians had used the Cowlitz River (Cowlitsk) for many years prior to it being recognized by white soldiers. The river was used for commercial purposes, such as, trading woven baskets, dog-hair blankets, cooked camas roots, and slaves for the Indian trading post above The Dalles on the Columbia River. Other tribes besides the Cowlitz also used the river for activities such as trading salmon for camas root, and as a route to bartering with other coastal tribes. Many expeditions explored parts of the Cowlitz River and discovered the name but the first person to make peace with the Indians on the river was Gabriel Franchere, a member of the John Jacob Astor expedition. The economic attraction of the Cowlitz River corridor seemed obvious to the officers of the Hudson’s Bay Company, the monolithic British fur trading operation that dominated the Pacific Northwest until the 1840’s. The company’s decision to expand into other commodities than furs led to milling, timber, fishing, and farming. Agricultural activities, buoyed by a contact with the Russian American Company in Alaska, led to creation of the independent Puget Sound Agricultural Company in 1838 and the breaking of sod a year later at the mammoth Cowlitz Farms in present Lewis County on a prairie five miles east of Cowlitz Landing, the point where weary travelers picked up the overland route to Puget Sound. Early settlements in Cowlitz County, as throughout the Pacific Northwest, were influenced by the desire for a source of water, transportation, and arable land. The Columbia River served as a great
transportation artery while its many tributaries, including the Cowlitz, allowed pioneers to penetrate deeper into the interior. With more and more settlers arriving along the Cowlitz River, it became an attraction. In 1852, the Huntington Party arrived in the Cowlitz Valley. The party found that the majority of the land along the lower river had already been staked out in donation land claims, so they followed the river north to find better prospects. The members of the Huntington Party (family) filed for a 500-acre donation land claim on the east side of the Cowlitz River (now makes up much of the community of Castle Rock), a claim at Sandy Bend on the west side of the Cowlitz River, and a claim south of Castle Rock on the east side of the river. The name Castle Rock came to be commonly known in 1854 when William Huntington established a post office in his home located south of the rocky knob that river boatmen called Castle Rock. This location is now within the Cowlitz River channel. In spite of the post office’s being on the east side, it was the west side of the river that developed first. No town on the east side would grow up until 25 years later. The small unincorporated village of Jackson, Washington Territory, grew up on the west side opposite the William Huntington Property around what was called Fort Cagle. Fort Cagle, on the William Cagle Donation Land Claim, was built to protect settlers from the considerable Indian disturbances that had been known in the area (the part of the Cagle land where the fort was built is presently the home located at 155 Delameter Lane). A school started in the Cagle home in 1858. A separate school building was built to
City of Castle Rock III-2 Comprehensive Plan 2006
Chapter III Land Use
procure in 1859. Two sawmills were soon built on Arkansas Creek and a third on the Sandy Bend land claim. These were the first mills in Cowlitz County except for the large mill at Oak Point on the Columbia. After the mills were established, many other local businesses came into play, such as a blacksmith shop, vehicle repair shop, harness shop, and an inn. By the early 1860’s, outlying land was being developed and the river boats were calling at Jackson as they ferried lumber, grain, vegetables, hay and cured meats downriver. This community was doomed in the early 1870’s when the Northern Pacific Railroad began construction up the east bank of the river where Huntington Avenue is now. The effect of the railroad was not immediately felt, but when it became transcontinental and the train ferry “Tacoma” at Kalama became operative about 1884, the town of Castle Rock on the east bank began to grow. With the railroad distributing loads of literature back east praising Western Washington, people began to arrive. The Northern Pacific was to receive nearly 300,000 acres of grant land to sell in Cowlitz County alone, much of it east of Castle Rock. With the people coming, the 1880’s were a time of intense building of homes and business establishments. Hotels were built in order to take care of the newcomers, transients, and laborers. A ferry also came into operation that brought goods across the east and west banks of the Cowlitz River. The first school went up in 1880, and the first issue of the Cowlitz County Advocate was published on July 3, 1886. At the advent of the Twentieth Century, Castle Rock was a town of wooden buildings and unpaved streets. There was a water system but many residents still had wells and hand pumps. There was yet no
unified sewer system. Despite the electric plant, coal oil was the dependable source of illumination. Most streets were graveled but some still had no ballasting or foundation. In 1903, the bridge was built across the Cowlitz. It was the first vehicular bridge to span the Cowlitz River. Around 1911, a major change to the physical configuration of the town came when the Northern Pacific Railroad abandoned its roadbed for new right-of-way five to six blocks east, where it now lies. The reason was lying of new double track age from Tacoma to Vancouver. The roadbed that had served as the eastern demarcation for the town stood vacant until Huntington Avenue was paved as part of the new Highway 99 in 1923. As was the case in the time of early settlement, Castle Rock’s fortunes since the boom years of the 1880’s, 1890’s and the early 1900’s have closely followed developments in the Cowlitz River corridor as a whole. Demise of the Cowlitz as an important transportation artery and changes in commercial and personal travel modes brought changes. Founding of Longview and opening of the major Columbia River front mills shifted many employment opportunities south, while the city remained the base for logging, retail and service commercial activity, and recreation. The interstate-5 corridor, with two interchanges at Castle Rock, has transcended the Cowlitz River corridor as the developmental force, although the Cowlitz River continues to shape life in the Castle Rock area. The town today has lost a lot of the milling and logging industry and has begun to focus itself on tourism for Mount St. Helens, history of the town, and retail sales. Castle Rock’s economy and way of life have changed each decade, some for better and
City of Castle Rock III-3 Comprehensive Plan 2006
Chapter III Land Use
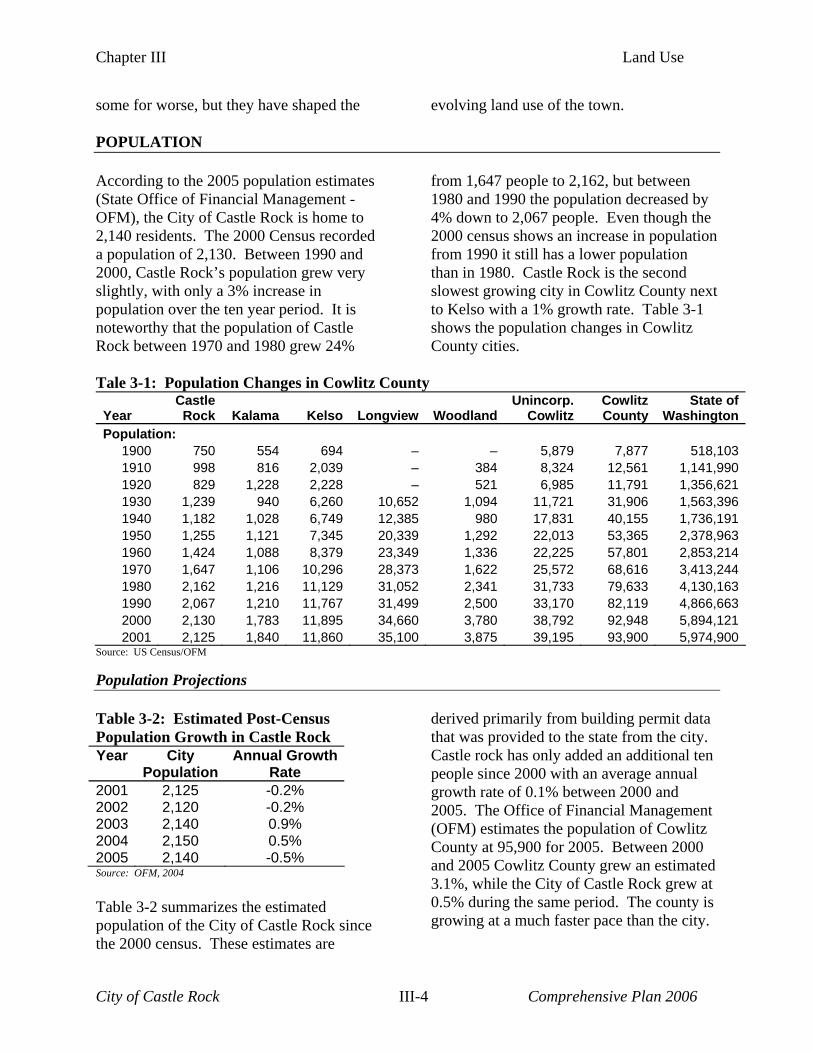
some for worse, but they have shaped the evolving land use of the town. POPULATION According to the 2005 population estimates (State Office of Financial Management -OFM), the City of Castle Rock is home to 2,140 residents. The 2000 Census recorded a population of 2,130. Between 1990 and 2000, Castle Rock’s population grew very slightly, with only a 3% increase in population over the ten year period. It is noteworthy that the population of Castle Rock between 1970 and 1980 grew 24%
from 1,647 people to 2,162, but between 1980 and 1990 the population decreased by 4% down to 2,067 people. Even though the 2000 census shows an increase in population from 1990 it still has a lower population than in 1980. Castle Rock is the second slowest growing city in Cowlitz County next to Kelso with a 1% growth rate. Table 3-1 shows the population changes in Cowlitz County cities.
Tale 3-1: Population Changes in Cowlitz County
Year Castle Rock Kalama Kelso Longview Woodland
Unincorp. Cowlitz
Cowlitz County
State of Washington
Population: 1900 750 554 694 – – 5,879 7,877 518,1031910 998 816 2,039 – 384 8,324 12,561 1,141,9901920 829 1,228 2,228 – 521 6,985 11,791 1,356,6211930 1,239 940 6,260 10,652 1,094 11,721 31,906 1,563,3961940 1,182 1,028 6,749 12,385 980 17,831 40,155 1,736,1911950 1,255 1,121 7,345 20,339 1,292 22,013 53,365 2,378,9631960 1,424 1,088 8,379 23,349 1,336 22,225 57,801 2,853,2141970 1,647 1,106 10,296 28,373 1,622 25,572 68,616 3,413,2441980 2,162 1,216 11,129 31,052 2,341 31,733 79,633 4,130,1631990 2,067 1,210 11,767 31,499 2,500 33,170 82,119 4,866,6632000 2,130 1,783 11,895 34,660 3,780 38,792 92,948 5,894,1212001 2,125 1,840 11,860 35,100 3,875 39,195 93,900 5,974,900
Source: US Census/OFM
Population Projections Table 3-2: Estimated Post-Census Population Growth in Castle Rock Year City
Population Annual Growth
Rate 2001 2,125 -0.2% 2002 2,120 -0.2% 2003 2,140 0.9% 2004 2,150 0.5% 2005 2,140 -0.5% Source: OFM, 2004 Table 3-2 summarizes the estimated population of the City of Castle Rock since the 2000 census. These estimates are
derived primarily from building permit data that was provided to the state from the city. Castle rock has only added an additional ten people since 2000 with an average annual growth rate of 0.1% between 2000 and 2005. The Office of Financial Management (OFM) estimates the population of Cowlitz County at 95,900 for 2005. Between 2000 and 2005 Cowlitz County grew an estimated 3.1%, while the City of Castle Rock grew at 0.5% during the same period. The county is growing at a much faster pace than the city.
City of Castle Rock III-4 Comprehensive Plan 2006
Chapter III Land Use
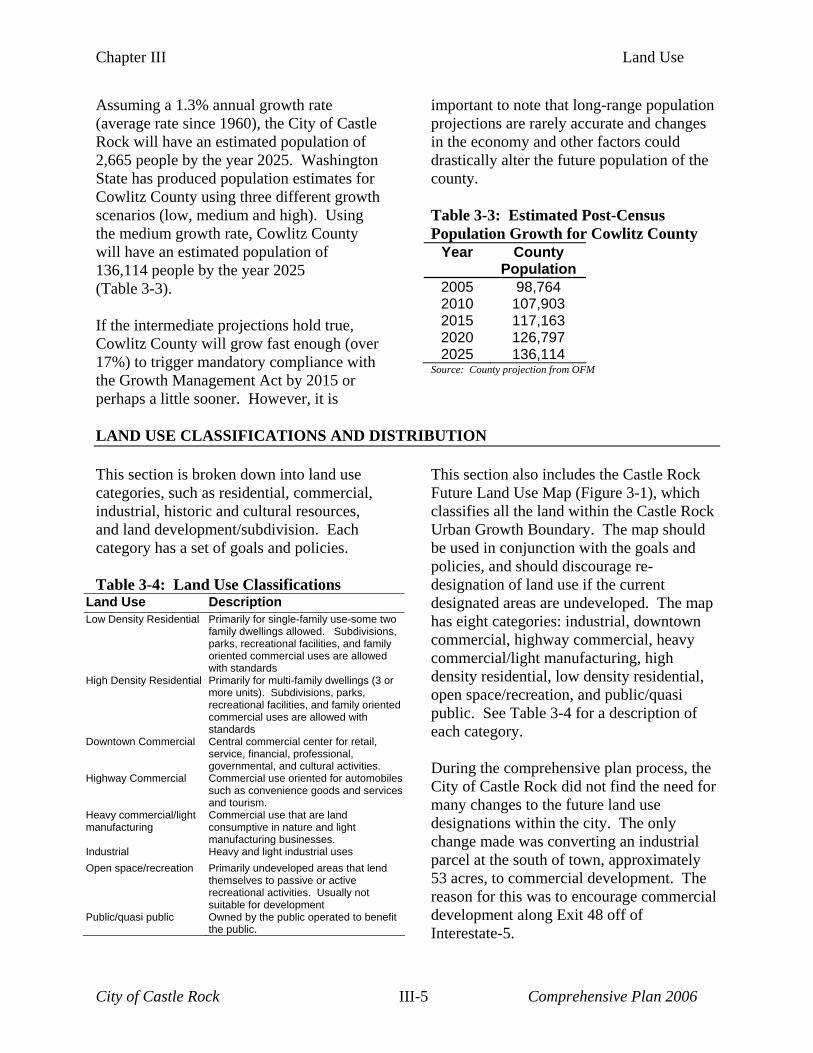
Assuming a 1.3% annual growth rate (average rate since 1960), the City of Castle Rock will have an estimated population of 2,665 people by the year 2025. Washington State has produced population estimates for Cowlitz County using three different growth scenarios (low, medium and high). Using the medium growth rate, Cowlitz County will have an estimated population of 136,114 people by the year 2025 (Table 3-3). If the intermediate projections hold true, Cowlitz County will grow fast enough (over 17%) to trigger mandatory compliance with the Growth Management Act by 2015 or perhaps a little sooner. However, it is
important to note that long-range population projections are rarely accurate and changes in the economy and other factors could drastically alter the future population of the county. Table 3-3: Estimated Post-Census Population Growth for Cowlitz County
Year County Population
2005 98,764 2010 107,903 2015 117,163 2020 126,797 2025 136,114
Source: County projection from OFM
LAND USE CLASSIFICATIONS AND DISTRIBUTION This section is broken down into land use categories, such as residential, commercial, industrial, historic and cultural resources, and land development/subdivision. Each category has a set of goals and policies. Table 3-4: Land Use Classifications
Land Use Description Low Density Residential Primarily for single-family use-some two
family dwellings allowed. Subdivisions, parks, recreational facilities, and family oriented commercial uses are allowed with standards
High Density Residential Primarily for multi-family dwellings (3 or more units). Subdivisions, parks, recreational facilities, and family oriented commercial uses are allowed with standards
Downtown Commercial Central commercial center for retail, service, financial, professional, governmental, and cultural activities.
Highway Commercial Commercial use oriented for automobiles such as convenience goods and services and tourism.
Heavy commercial/light manufacturing
Commercial use that are land consumptive in nature and light manufacturing businesses.
Industrial Heavy and light industrial uses Open space/recreation Primarily undeveloped areas that lend
themselves to passive or active recreational activities. Usually not suitable for development
Public/quasi public Owned by the public operated to benefit the public.
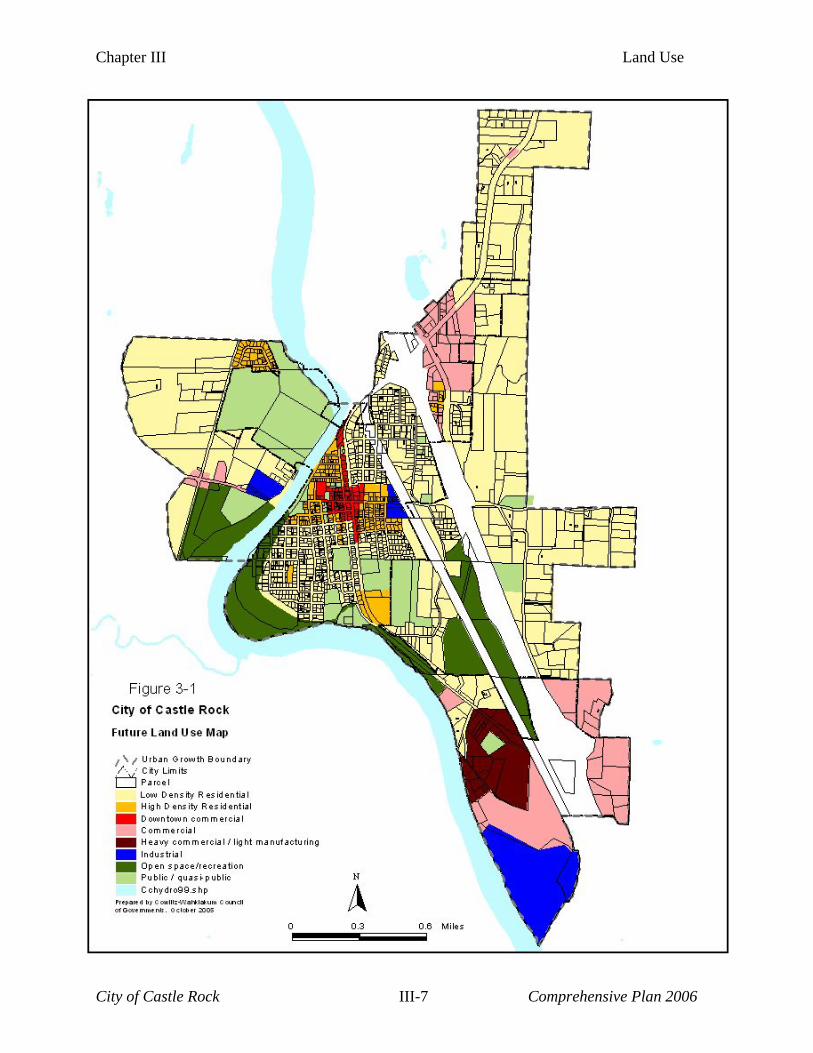
This section also includes the Castle Rock Future Land Use Map (Figure 3-1), which classifies all the land within the Castle Rock Urban Growth Boundary. The map should be used in conjunction with the goals and policies, and should discourage re-designation of land use if the current designated areas are undeveloped. The map has eight categories: industrial, downtown commercial, highway commercial, heavy commercial/light manufacturing, high density residential, low density residential, open space/recreation, and public/quasi public. See Table 3-4 for a description of each category. During the comprehensive plan process, the City of Castle Rock did not find the need for many changes to the future land use designations within the city. The only change made was converting an industrial parcel at the south of town, approximately 53 acres, to commercial development. The reason for this was to encourage commercial development along Exit 48 off of Interestate-5.
City of Castle Rock III-5 Comprehensive Plan 2006
Chapter III Land Use
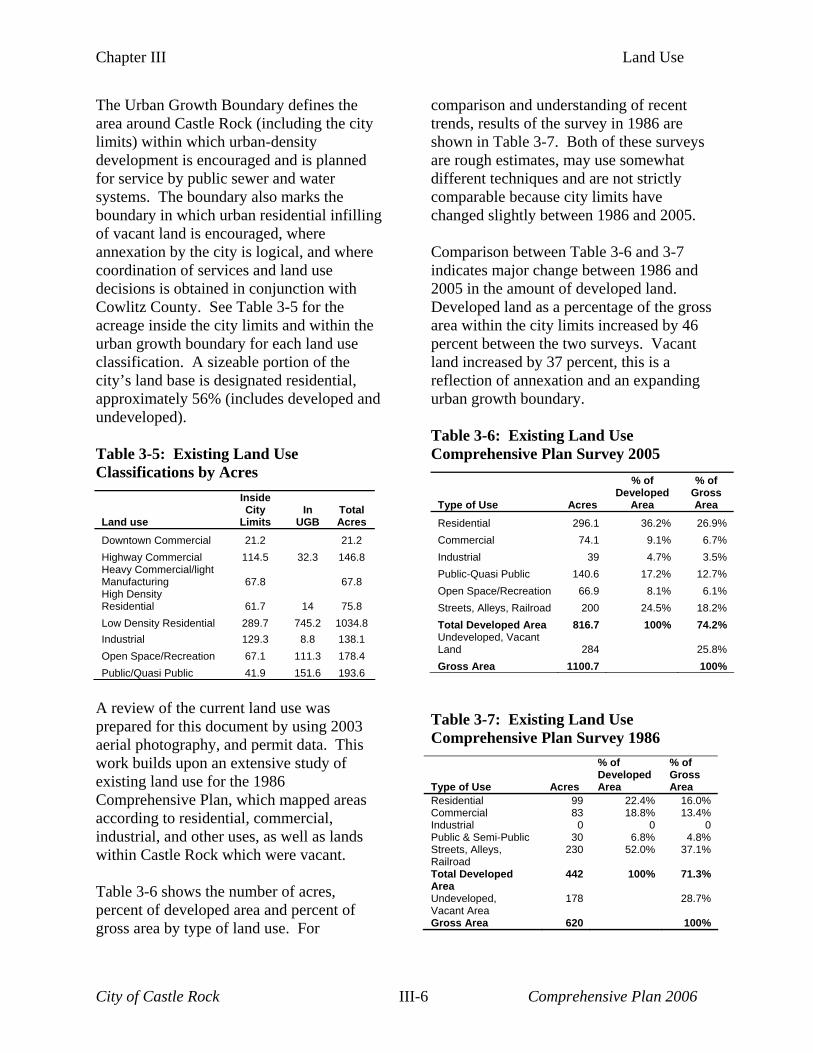
The Urban Growth Boundary defines the area around Castle Rock (including the city limits) within which urban-density development is encouraged and is planned for service by public sewer and water systems. The boundary also marks the boundary in which urban residential infilling of vacant land is encouraged, where annexation by the city is logical, and where coordination of services and land use decisions is obtained in conjunction with Cowlitz County. See Table 3-5 for the acreage inside the city limits and within the urban growth boundary for each land use classification. A sizeable portion of the city’s land base is designated residential, approximately 56% (includes developed and undeveloped). Table 3-5: Existing Land Use Classifications by Acres Land use
Inside City
Limits In
UGB Total Acres
Downtown Commercial 21.2 21.2 Highway Commercial 114.5 32.3 146.8 Heavy Commercial/light Manufacturing 67.8 67.8 High Density Residential 61.7 14 75.8 Low Density Residential 289.7 745.2 1034.8 Industrial 129.3 8.8 138.1 Open Space/Recreation 67.1 111.3 178.4 Public/Quasi Public 41.9 151.6 193.6
A review of the current land use was prepared for this document by using 2003 aerial photography, and permit data. This work builds upon an extensive study of existing land use for the 1986 Comprehensive Plan, which mapped areas according to residential, commercial, industrial, and other uses, as well as lands within Castle Rock which were vacant. Table 3-6 shows the number of acres, percent of developed area and percent of gross area by type of land use. For
comparison and understanding of recent trends, results of the survey in 1986 are shown in Table 3-7. Both of these surveys are rough estimates, may use somewhat different techniques and are not strictly comparable because city limits have changed slightly between 1986 and 2005. Comparison between Table 3-6 and 3-7 indicates major change between 1986 and 2005 in the amount of developed land. Developed land as a percentage of the gross area within the city limits increased by 46 percent between the two surveys. Vacant land increased by 37 percent, this is a reflection of annexation and an expanding urban growth boundary. Table 3-6: Existing Land Use
omprehensive Plan Survey 2005 C
Type of Use Acres
% of Developed
Area
% of Gross Area
Residential 296.1 36.2% 26.9% Commercial 74.1 9.1% 6.7% Industrial 39 4.7% 3.5% Public-Quasi Public 140.6 17.2% 12.7% Open Space/Recreation 66.9 8.1% 6.1% Streets, Alleys, Railroad 200 24.5% 18.2% Total Developed Area 816.7 100% 74.2% Undeveloped, Vacant Land 284 25.8% Gross Area 1100.7 100%
Table 3-7: Existing Land Use
omprehensive Plan Survey 1986 C Type of Use
Acres
% of Developed Area
% of Gross Area
Residential 99 22.4% 16.0% Commercial 83 18.8% 13.4% Industrial 0 0 0 Public & Semi-Public 30 6.8% 4.8% Streets, Alleys, Railroad
230 52.0% 37.1%
Total Developed Area
442 100% 71.3%
Undeveloped, Vacant Area
178 28.7%
Gross Area 620 100%
City of Castle Rock III-6 Comprehensive Plan 2006
Chapter III Land Use
City of Castle Rock III-7 Comprehensive Plan 2006
Chapter III Land Use
City of Castle Rock III-8 Comprehensive Plan 2006
Chapter III Land Use
City of Castle Rock III-9 Comprehensive Plan 2006
Chapter III Land Use
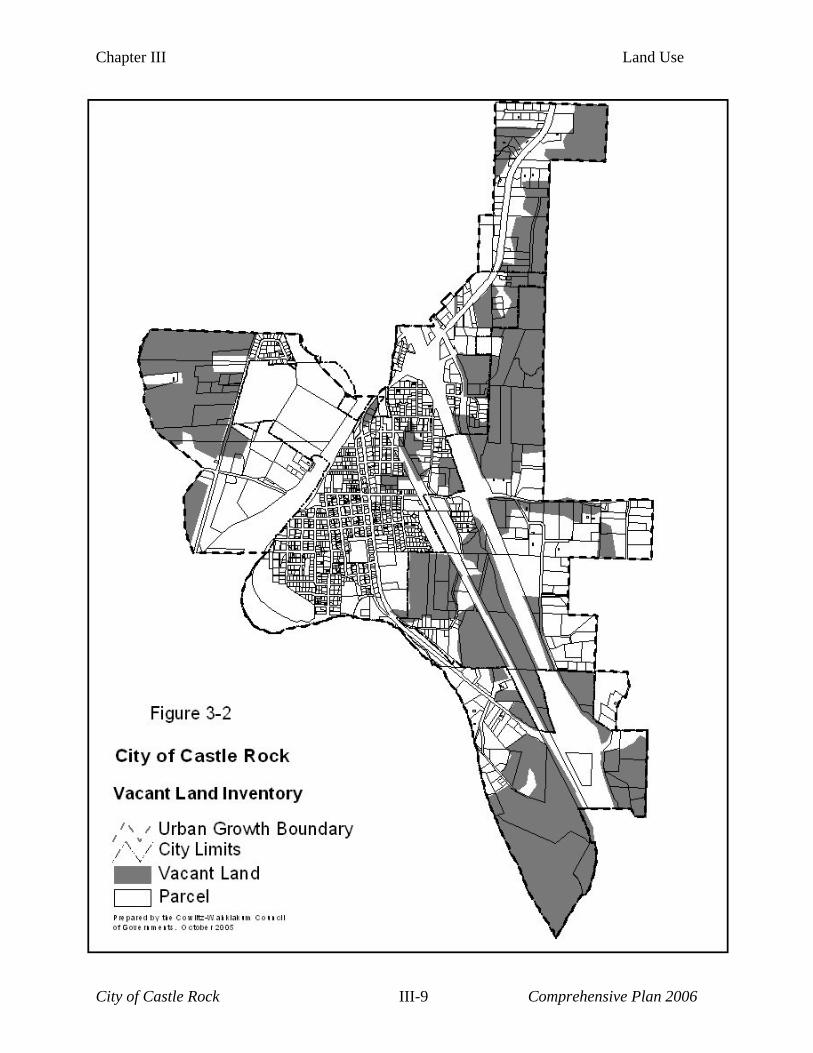
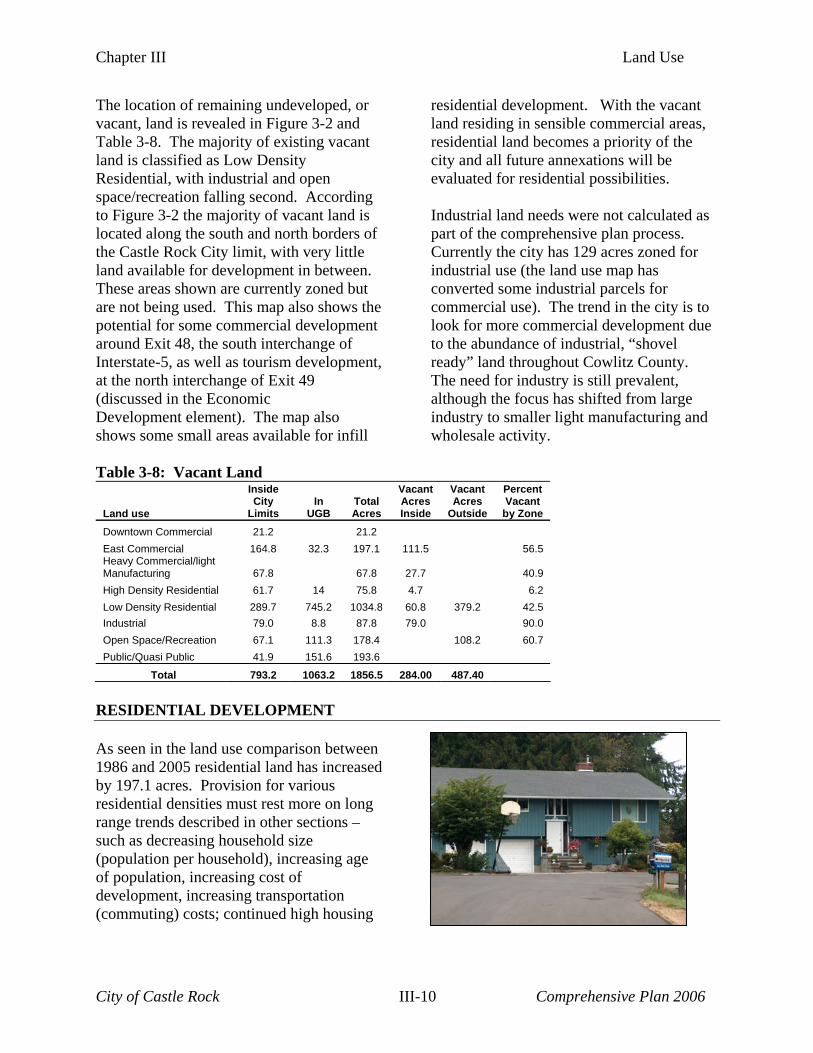
The location of remaining undeveloped, or vacant, land is revealed in Figure 3-2 and Table 3-8. The majority of existing vacant land is classified as Low Density Residential, with industrial and open space/recreation falling second. According to Figure 3-2 the majority of vacant land is located along the south and north borders of the Castle Rock City limit, with very little land available for development in between. These areas shown are currently zoned but are not being used. This map also shows the potential for some commercial development around Exit 48, the south interchange of Interstate-5, as well as tourism development, at the north interchange of Exit 49 (discussed in the Economic Development element). The map also shows some small areas available for infill
residential development. With the vacant land residing in sensible commercial areas, residential land becomes a priority of the city and all future annexations will be evaluated for residential possibilities. Industrial land needs were not calculated as part of the comprehensive plan process. Currently the city has 129 acres zoned for industrial use (the land use map has converted some industrial parcels for commercial use). The trend in the city is to look for more commercial development due to the abundance of industrial, “shovel ready” land throughout Cowlitz County. The need for industry is still prevalent, although the focus has shifted from large industry to smaller light manufacturing and wholesale activity.
Table 3-8: Vacant Land
Land use
Inside City
Limits In
UGB Total Acres
Vacant Acres Inside
Vacant Acres
Outside
Percent Vacant
by Zone Downtown Commercial 21.2 21.2 East Commercial 164.8 32.3 197.1 111.5 56.5 Heavy Commercial/light Manufacturing 67.8 67.8 27.7 40.9 High Density Residential 61.7 14 75.8 4.7 6.2 Low Density Residential 289.7 745.2 1034.8 60.8 379.2 42.5 Industrial 79.0 8.8 87.8 79.0 90.0 Open Space/Recreation 67.1 111.3 178.4 108.2 60.7 Public/Quasi Public 41.9 151.6 193.6
Total 793.2 1063.2 1856.5 284.00 487.40
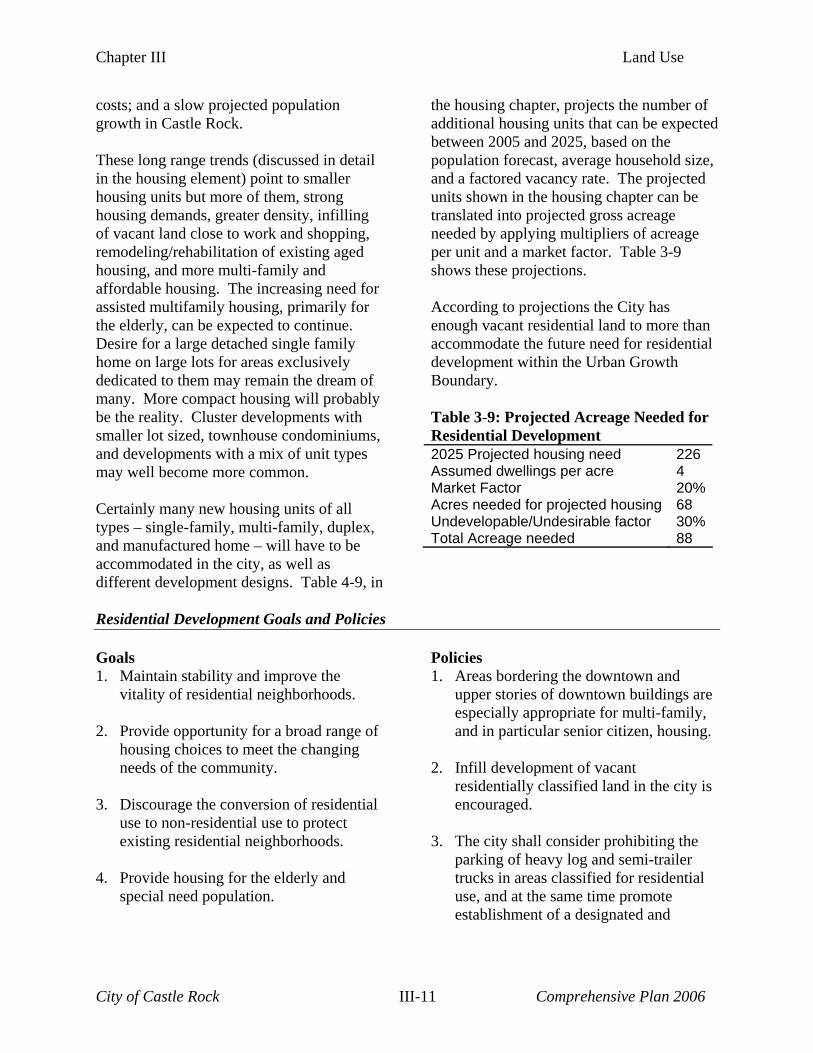
RESIDENTIAL DEVELOPMENT As seen in the land use comparison between 1986 and 2005 residential land has increased by 197.1 acres. Provision for various residential densities must rest more on long range trends described in other sections – such as decreasing household size (population per household), increasing age of population, increasing cost of development, increasing transportation (commuting) costs; continued high housing
City of Castle Rock III-10 Comprehensive Plan 2006
Chapter III Land Use
costs; and a slow projected population growth in Castle Rock. These long range trends (discussed in detail in the housing element) point to smaller housing units but more of them, strong housing demands, greater density, infilling of vacant land close to work and shopping, remodeling/rehabilitation of existing aged housing, and more multi-family and affordable housing. The increasing need for assisted multifamily housing, primarily for the elderly, can be expected to continue. Desire for a large detached single family home on large lots for areas exclusively dedicated to them may remain the dream of many. More compact housing will probably be the reality. Cluster developments with smaller lot sized, townhouse condominiums, and developments with a mix of unit types may well become more common. Certainly many new housing units of all types – single-family, multi-family, duplex, and manufactured home – will have to be accommodated in the city, as well as different development designs. Table 4-9, in
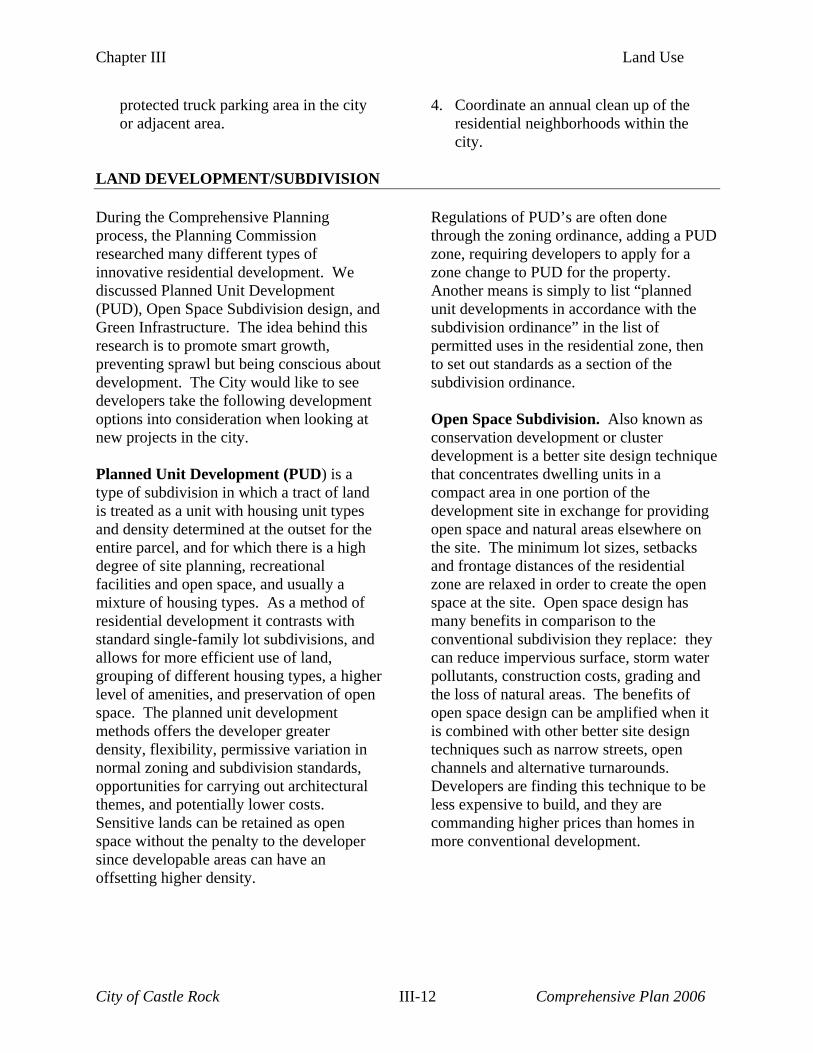
the housing chapter, projects the number of additional housing units that can be expected between 2005 and 2025, based on the population forecast, average household size, and a factored vacancy rate. The projected units shown in the housing chapter can be translated into projected gross acreage needed by applying multipliers of acreage per unit and a market factor. Table 3-9 shows these projections. According to projections the City has enough vacant residential land to more than accommodate the future need for residential development within the Urban Growth Boundary. Table 3-9: Projected Acreage Needed for Residential Development 2025 Projected housing need 226 Assumed dwellings per acre 4 Market Factor 20%Acres needed for projected housing 68 Undevelopable/Undesirable factor 30%Total Acreage needed 88
Residential Development Goals and Policies Goals 1. Maintain stability and improve the
vitality of residential neighborhoods. 2. Provide opportunity for a broad range of
housing choices to meet the changing needs of the community.
3. Discourage the conversion of residential
use to non-residential use to protect existing residential neighborhoods.
4. Provide housing for the elderly and
special need population.
Policies 1. Areas bordering the downtown and
upper stories of downtown buildings are especially appropriate for multi-family, and in particular senior citizen, housing.
2. Infill development of vacant
residentially classified land in the city is encouraged.
3. The city shall consider prohibiting the
parking of heavy log and semi-trailer trucks in areas classified for residential use, and at the same time promote establishment of a designated and
City of Castle Rock III-11 Comprehensive Plan 2006
Chapter III Land Use
protected truck parking area in the city or adjacent area.
4. Coordinate an annual clean up of the residential neighborhoods within the city.
LAND DEVELOPMENT/SUBDIVISION During the Comprehensive Planning process, the Planning Commission researched many different types of innovative residential development. We discussed Planned Unit Development (PUD), Open Space Subdivision design, and Green Infrastructure. The idea behind this research is to promote smart growth, preventing sprawl but being conscious about development. The City would like to see developers take the following development options into consideration when looking at new projects in the city. Planned Unit Development (PUD) is a type of subdivision in which a tract of land is treated as a unit with housing unit types and density determined at the outset for the entire parcel, and for which there is a high degree of site planning, recreational facilities and open space, and usually a mixture of housing types. As a method of residential development it contrasts with standard single-family lot subdivisions, and allows for more efficient use of land, grouping of different housing types, a higher level of amenities, and preservation of open space. The planned unit development methods offers the developer greater density, flexibility, permissive variation in normal zoning and subdivision standards, opportunities for carrying out architectural themes, and potentially lower costs. Sensitive lands can be retained as open space without the penalty to the developer since developable areas can have an offsetting higher density.
Regulations of PUD’s are often done through the zoning ordinance, adding a PUD zone, requiring developers to apply for a zone change to PUD for the property. Another means is simply to list “planned unit developments in accordance with the subdivision ordinance” in the list of permitted uses in the residential zone, then to set out standards as a section of the subdivision ordinance. Open Space Subdivision. Also known as conservation development or cluster development is a better site design technique that concentrates dwelling units in a compact area in one portion of the development site in exchange for providing open space and natural areas elsewhere on the site. The minimum lot sizes, setbacks and frontage distances of the residential zone are relaxed in order to create the open space at the site. Open space design has many benefits in comparison to the conventional subdivision they replace: they can reduce impervious surface, storm water pollutants, construction costs, grading and the loss of natural areas. The benefits of open space design can be amplified when it is combined with other better site design techniques such as narrow streets, open channels and alternative turnarounds. Developers are finding this technique to be less expensive to build, and they are commanding higher prices than homes in more conventional development.
City of Castle Rock III-12 Comprehensive Plan 2006
Chapter III Land Use
Land Development/Subdivision Goals and Policies Goals 1. Ensure that subdivisions and necessary
public facilities are designed and constructed to meet existing and future needs.
2. Encourage innovative techniques to
residential and commercial land development that will be beneficial to the community and reflect sound planning.
3. Ensure adequate provisions of public
utilities, transportation facilities, and pedestrian facilities, as an integral part of the land subdivision and development process.
4. Maintain the “small town” feeling that
makes it enjoyable to live in Castle Rock 5. Incorporate the following principals into
subdivision design; a sense of place, walkable, mixed transportation and housing, and affordability.
Policies 1. If a preliminary subdivision plat
represents a phase of a potentially larger
development, the city should require that a master plan showing all phases of the development be submitted concurrently.
2. Alternative land development
approaches including “green infrastructure,” “low-impact development,” and other similar techniques should be strongly encouraged by the zoning, subdivision codes and public works standards.
3. Subdivisions should be site designed,
and constructed to preserve and enhance natural features and be compatible with aesthetic values of the area.
4. In order to accommodate future usage
and development, subdivision streets, alleys, water lines, sewer lines, and other utilities and facilities shall be designed, sized and constructed in accordance with the comprehensive plan, and subdivision ordinance.
5. Vehicle and pedestrian circulation
patterns should be considered in the design of the subdivision for future connections.
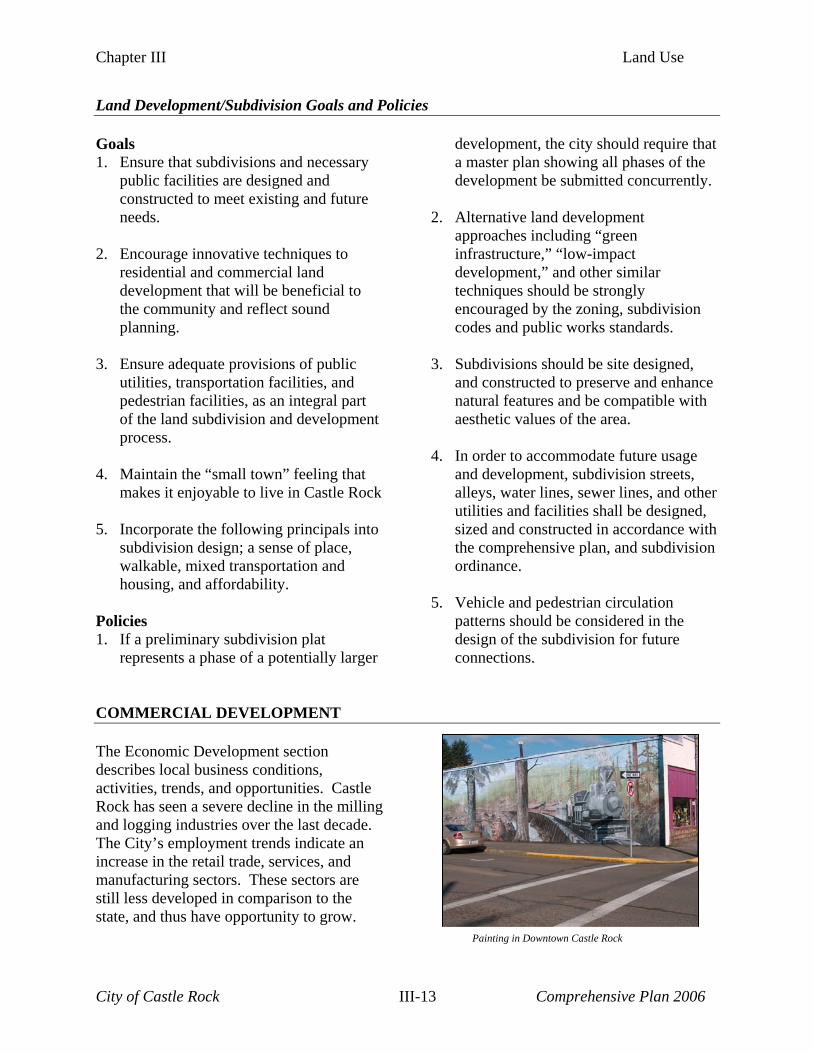
COMMERCIAL DEVELOPMENT The Economic Development section describes local business conditions, activities, trends, and opportunities. Castle Rock has seen a severe decline in the milling and logging industries over the last decade. The City’s employment trends indicate an increase in the retail trade, services, and manufacturing sectors. These sectors are still less developed in comparison to the state, and thus have opportunity to grow.
Painting in Downtown Castle Rock
City of Castle Rock III-13 Comprehensive Plan 2006
Chapter III Land Use
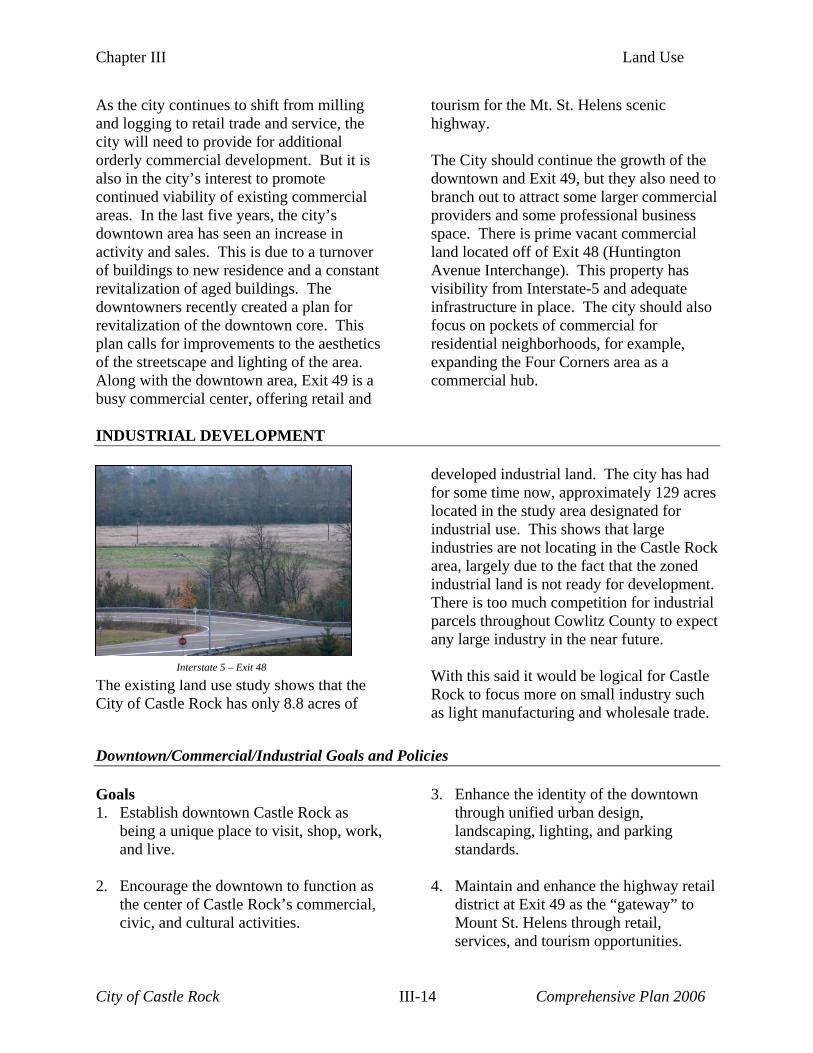
As the city continues to shift from milling and logging to retail trade and service, the city will need to provide for additional orderly commercial development. But it is also in the city’s interest to promote continued viability of existing commercial areas. In the last five years, the city’s downtown area has seen an increase in activity and sales. This is due to a turnover of buildings to new residence and a constant revitalization of aged buildings. The downtowners recently created a plan for revitalization of the downtown core. This plan calls for improvements to the aesthetics of the streetscape and lighting of the area. Along with the downtown area, Exit 49 is a busy commercial center, offering retail and
tourism for the Mt. St. Helens scenic highway. The City should continue the growth of the downtown and Exit 49, but they also need to branch out to attract some larger commercial providers and some professional business space. There is prime vacant commercial land located off of Exit 48 (Huntington Avenue Interchange). This property has visibility from Interstate-5 and adequate infrastructure in place. The city should also focus on pockets of commercial for residential neighborhoods, for example, expanding the Four Corners area as a commercial hub.
INDUSTRIAL DEVELOPMENT
The existing land use study shows that the City of Castle Rock has only 8.8 acres of
developed industrial land. The city has had for some time now, approximately 129 acres located in the study area designated for industrial use. This shows that large industries are not locating in the Castle Rock area, largely due to the fact that the zoned industrial land is not ready for development. There is too much competition for industrial parcels throughout Cowlitz County to expect any large industry in the near future.
Interstate 5 – Exit 48 With this said it would be logical for Castle Rock to focus more on small industry such as light manufacturing and wholesale trade.
Downtown/Commercial/Industrial Goals and Policies Goals 1. Establish downtown Castle Rock as
being a unique place to visit, shop, work, and live.
2. Encourage the downtown to function as
the center of Castle Rock’s commercial, civic, and cultural activities.
3. Enhance the identity of the downtown through unified urban design, landscaping, lighting, and parking standards.
4. Maintain and enhance the highway retail
district at Exit 49 as the “gateway” to Mount St. Helens through retail, services, and tourism opportunities.
City of Castle Rock III-14 Comprehensive Plan 2006
Chapter III Land Use
5. Encourage mixed uses in the commercial
areas to help with revitalization. 6. Encourage the establishment of new
commercial and industrial enterprises that will bring services and jobs to the community.
Policies 1. The area classified as highway
commercial will provide for commercial uses that are automobile-oriented, tourist-serving, and that provide convenience goods and services.
2. Vacant sites classified for industrial use
by the land use map should not be encroached upon by incompatible non-industrial uses.
3. Encourage the rehabilitation and
preservation of historic buildings, signs and other structures; consider establishing a Historic Preservation District downtown.
4. Continue coordinating and planning
community events that bring the residents of Castle Rock together and invite visitors in.
URBAN GROWTH Goals 1. Achieve orderly and efficient patterns of
growth within the city of Castle Rock and adjacent unincorporated area.
2. Continue coordinated planning and
decision-making with Cowlitz County about future development within the Castle Rock Urban Growth Boundary with respect to urban services.
3. Ensure cost-effective growth by guiding
development to areas were public services are readily available.
4. Identify areas where future growth may
occur and apply zoning that encourages high density development to prevent urban sprawl.
5. Use innovative planning techniques such
as “smart growth,” and “open space design” to reduce sprawl and promote pedestrian activity.
Policies 1. After the adoption of the Comprehensive
Plan, the city should review and revise the zoning code and subdivision ordinance where necessary.
2. Primary responsibility for extension of
sewer or water lines within the Urban Growth Area should be with the development applicant and not the City or County.
3. All proposed development within the
Urban Growth Area should connect to the City or County sewer and water systems, with some exceptions for interim on-site or approved alternative systems when connection is not possible.
4. Work jointly with Cowlitz County to
develop a logical Urban Growth Boundary to ensure orderly land development.
5. Encourage annexations to the city of
Castle Rock that meet the development
City of Castle Rock III-15 Comprehensive Plan 2006
Chapter III Land Use
policies of the City, create reasonable service areas for city services, form logical extensions of city boundaries, and are consistent with the Urban Growth Management Program.
6. Ensure developers reserve a sufficient amount of land for public facilities in proposed developments.
HISTORIC AND CULTURAL RESOURCES Goals 1. Preserve and enhance buildings, objects,
sites, and other properties of historic significance, architecture or archeological importance in Castle Rock
2. Take steps to further awareness and
interest among residents and visitors to the origins and historical development of Castle Rock.
Policies 1. The city should encourage owners of
notable historic properties to preserve, maintain and rehabilitate their properties and should assist them in applying for listing on the State and National Registers of Historic places.
2. The identification and rehabilitation of
historically significant buildings in a manner that respects their architectural integrity should be a feature of the downtown renewal program
City of Castle Rock III-16 Comprehensive Plan 2006
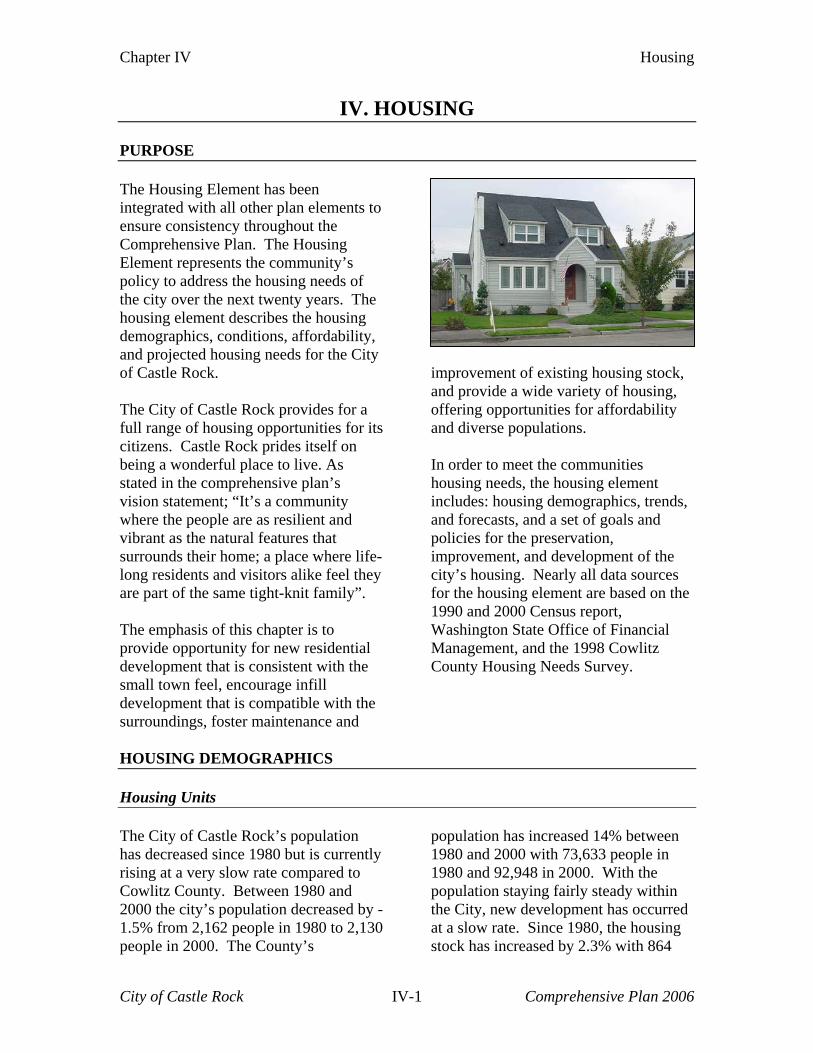
Chapter IV Housing
IV. HOUSING PURPOSE The Housing Element has been integrated with all other plan elements to ensure consistency throughout the Comprehensive Plan. The Housing Element represents the community’s policy to address the housing needs of the city over the next twenty years. The housing element describes the housing demographics, conditions, affordability, and projected housing needs for the City of Castle Rock. The City of Castle Rock provides for a full range of housing opportunities for its citizens. Castle Rock prides itself on being a wonderful place to live. As stated in the comprehensive plan’s vision statement; “It’s a community where the people are as resilient and vibrant as the natural features that surrounds their home; a place where life-long residents and visitors alike feel they are part of the same tight-knit family”. The emphasis of this chapter is to provide opportunity for new residential development that is consistent with the small town feel, encourage infill development that is compatible with the surroundings, foster maintenance and
improvement of existing housing stock, and provide a wide variety of housing, offering opportunities for affordability and diverse populations. In order to meet the communities housing needs, the housing element includes: housing demographics, trends, and forecasts, and a set of goals and policies for the preservation, improvement, and development of the city’s housing. Nearly all data sources for the housing element are based on the 1990 and 2000 Census report, Washington State Office of Financial Management, and the 1998 Cowlitz County Housing Needs Survey.
HOUSING DEMOGRAPHICS Housing Units The City of Castle Rock’s population has decreased since 1980 but is currently rising at a very slow rate compared to Cowlitz County. Between 1980 and 2000 the city’s population decreased by -1.5% from 2,162 people in 1980 to 2,130 people in 2000. The County’s
population has increased 14% between 1980 and 2000 with 73,633 people in 1980 and 92,948 in 2000. With the population staying fairly steady within the City, new development has occurred at a slow rate. Since 1980, the housing stock has increased by 2.3% with 864
City of Castle Rock IV-1 Comprehensive Plan 2006
Chapter IV Housing
total structures in 1980 and 885 structures in 2000. The City’s goal is to see that the population growth occurs at a steady rate in the future and with this will also come a need for an increase in housing. Housing is generally categorized into four “unit types”-single-family, duplex, multifamily, and manufactured homes, with duplexes sometimes put into the multifamily category. Table 4-2 compares the number of housing units by housing type in Castle Rock from 1970-2000. This table shows that the total housing stock in Castle Rock increased by 27% from 1970 to 1980 (from 627 to 864 units) but only 2.4% from 1980 to 2000 (from 864 to 885 units). Looking at Table 4-1, we can see that the population increase is consistent with the housing increase,
Table 4-1: Population Growth
Source: US. Census with the majority of the activity taking place between 1970 and 1980 and slowly increasing from there. We can also see from Table 4-2 the percent distribution of single family units is decreasing and the percent distribution of other is increasing. Building permit data shows that the majority of new housing units in Castle Rock have been manufactured homes.
Table 4-2: Castle Rock Housing Trends by Type (1970-2000) Year Single-Family Multi-Family Other (MH, TT, etc Total # of Units:
1970 505 98 24 627 1980 657 173 34 864 1990 599 177 66 842 2000 591 198 96 885
% Distribution: 1970 80.50% 15.60% 3.80% 100.00% 1980 76.00% 20.00% 3.90% 100.00% 1990 71.10% 21.00% 7.80% 100.00% 2000 66.80% 22.40% 10.80% 100.00%
Source: Cowlitz-Wahkiakum Council of Governments and Washington State Office of Financial Management Note: MH=Manufactured Home, TT= Travel Trailer
Housing Conditions Another factor to be considered is the condition, or state of repair, of the housing stock. The best available
information of this sort is the “Cowlitz County Housing Needs Survey”. The survey was a questionnaire that was delivered by mail in three cycles,
Year Population Annual Growth
1960 1424 17 1970 1647 22 1980 2162 52 1990 2067 -10 2000 2130 6 2001 2125 -5 2002 2120 -5 2003 2140 20 2004 2150 10
City of Castle Rock IV-2 Comprehensive Plan 2006
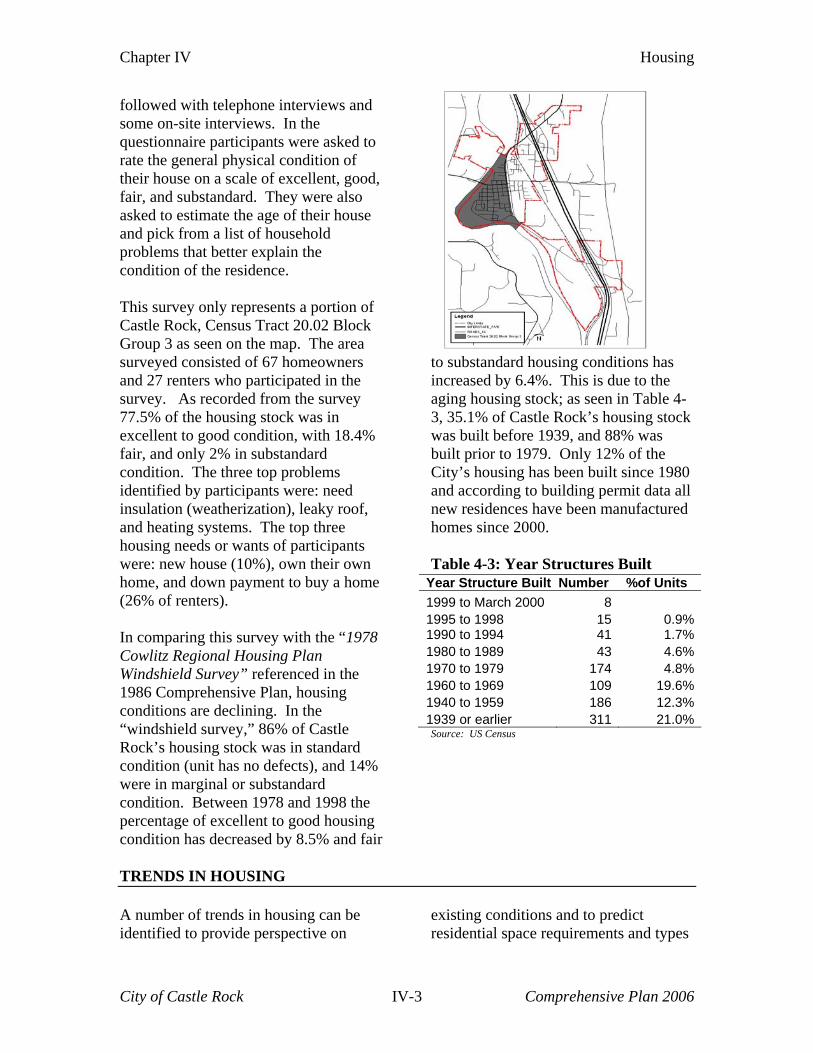
Chapter IV Housing
followed with telephone interviews and some on-site interviews. In the questionnaire participants were asked to rate the general physical condition of their house on a scale of excellent, good, fair, and substandard. They were also asked to estimate the age of their house and pick from a list of household problems that better explain the condition of the residence. This survey only represents a portion of Castle Rock, Census Tract 20.02 Block Group 3 as seen on the map. The area surveyed consisted of 67 homeowners and 27 renters who participated in the survey. As recorded from the survey 77.5% of the housing stock was in excellent to good condition, with 18.4% fair, and only 2% in substandard condition. The three top problems identified by participants were: need insulation (weatherization), leaky roof, and heating systems. The top three housing needs or wants of participants were: new house (10%), own their own home, and down payment to buy a home (26% of renters). In comparing this survey with the “1978 Cowlitz Regional Housing Plan Windshield Survey” referenced in the 1986 Comprehensive Plan, housing conditions are declining. In the “windshield survey,” 86% of Castle Rock’s housing stock was in standard condition (unit has no defects), and 14% were in marginal or substandard condition. Between 1978 and 1998 the percentage of excellent to good housing condition has decreased by 8.5% and fair
to substandard housing conditions has increased by 6.4%. This is due to the aging housing stock; as seen in Table 4-3, 35.1% of Castle Rock’s housing stock was built before 1939, and 88% was built prior to 1979. Only 12% of the City’s housing has been built since 1980 and according to building permit data all new residences have been manufactured homes since 2000. Table 4-3: Year Structures Built
Source: US Census
TRENDS IN HOUSING A number of trends in housing can be identified to provide perspective on
existing conditions and to predict residential space requirements and types
Year Structure Built Number %of Units 1999 to March 2000 8 1995 to 1998 15 0.9%1990 to 1994 41 1.7%1980 to 1989 43 4.6%1970 to 1979 174 4.8%1960 to 1969 109 19.6%1940 to 1959 186 12.3%1939 or earlier 311 21.0%
City of Castle Rock IV-3 Comprehensive Plan 2006
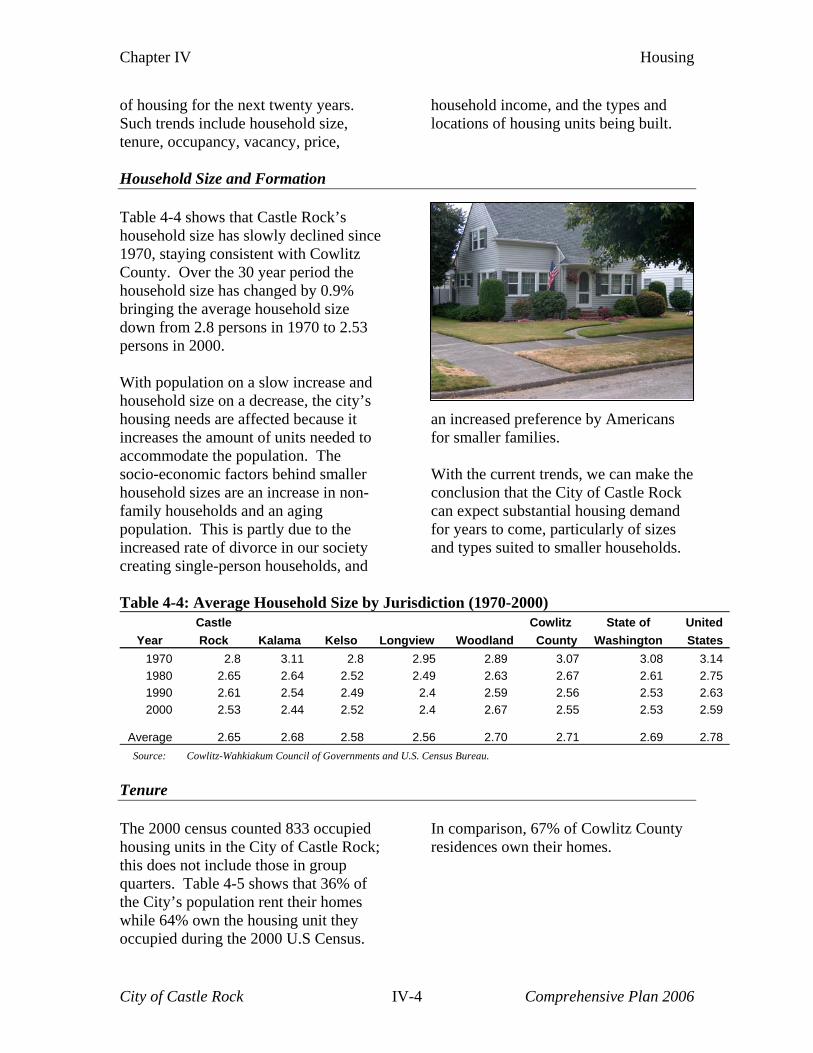
Chapter IV Housing
of housing for the next twenty years. Such trends include household size, tenure, occupancy, vacancy, price,
household income, and the types and locations of housing units being built.
Household Size and Formation Table 4-4 shows that Castle Rock’s household size has slowly declined since 1970, staying consistent with Cowlitz County. Over the 30 year period the household size has changed by 0.9% bringing the average household size down from 2.8 persons in 1970 to 2.53 persons in 2000. With population on a slow increase and household size on a decrease, the city’s housing needs are affected because it increases the amount of units needed to accommodate the population. The socio-economic factors behind smaller household sizes are an increase in non-family households and an aging population. This is partly due to the increased rate of divorce in our society creating single-person households, and
an increased preference by Americans for smaller families. With the current trends, we can make the conclusion that the City of Castle Rock can expect substantial housing demand for years to come, particularly of sizes and types suited to smaller households.
Table 4-4: Average Household Size by Jurisdiction (1970-2000)
Castle Cowlitz State of United Year Rock Kalama Kelso Longview Woodland County Washington States
1970 2.8 3.11 2.8 2.95 2.89 3.07 3.08 3.14 1980 2.65 2.64 2.52 2.49 2.63 2.67 2.61 2.75 1990 2.61 2.54 2.49 2.4 2.59 2.56 2.53 2.63 2000 2.53 2.44 2.52 2.4 2.67 2.55 2.53 2.59
Average 2.65 2.68 2.58 2.56 2.70 2.71 2.69 2.78 Source: Cowlitz-Wahkiakum Council of Governments and U.S. Census Bureau.
Tenure The 2000 census counted 833 occupied housing units in the City of Castle Rock; this does not include those in group quarters. Table 4-5 shows that 36% of the City’s population rent their homes while 64% own the housing unit they occupied during the 2000 U.S Census.
In comparison, 67% of Cowlitz County residences own their homes.
City of Castle Rock IV-4 Comprehensive Plan 2006
Chapter IV Housing
Table 4-5: Household Pop. By Tenure
Source: Census 2000
Occupancy As seen in Table 4-6, there are a total of 890 housing units in the City of Castle Rock, of these 833 or 93.6% are occupied, 6.4% or 57 units are vacant and 4 units are used for seasonal or occasional use. The City is very
comparable to Cowlitz County’s occupancy rates with 38,850 or 92.8% of the housing units occupied with only 2,774 or 7.2% of the units vacant.
Table 4-6: Housing Occupancy
Housing Occupancy Castle Rock
% units
Cowlitz County
% Units
Housing units 890 100% 38,624 100%Occupied units 833 93.6% 35,850 92.8%Vacant units 57 6.4% 2,774 7.2%For seasonal, or occasional use 4 0.4% 373 1.0%
Homeowner Vacancy Rate = 1.5% Rental Vacancy Rate = 7.2% Source: US Census 2000
Vacancy The City of Castle Rock has slightly lower vacancy rates than Cowlitz County. The City averages a 1.5% vacancy rate for owned residences and 7.2% vacancy rate for rental units. During the 2000 census, the city had 57 total vacant units. Of the total vacant units 24 (42.1%) were for rent, 8 (14%) were for sale, and 11 (19.3%) were rented or sold but not occupied. Four of the vacant units were for seasonal, recreational or occasional use, and 10
(17.5%) of the units are vacant for other purposes. Cowlitz County has a 2.2% vacancy rate for owned housing units and 9.2% vacancy rate for rental units. In comparison to Washington State, Cowlitz County and Castle Rock’s vacancy rates are higher. The State of Washington homeowner vacancy rate is 1.8% and the rental vacancy rate is 5.9%. This is a reflection of the economic downturn in Cowlitz County over the past five years.
Household Population in
Castle Rock
% Pop.
Cowlitz County % Pop.
Owner Occupied Units 524 64% 24,250 67%Renter-occupied units 309 36% 11,600 32%
City of Castle Rock IV-5 Comprehensive Plan 2006
Chapter IV Housing
Housing Prices Household prices have steadily risen in both Cowlitz County and the City of Castle Rock over the last decade. According to the U.S Census Bureau, from 1990 to 2000 the median value of owner-occupied units went from $48,400 to $98,100, an increase of 51%. In Cowlitz County, the median value of owner-occupied units also increased by 51% going from $61,300 in 1990 to $129,900 in 2000. Both the City and the County have a lower median value than the State of Washington at $168,300. During the same time period Castle Rock’s median household income rose 31% from $29,745 to $41,497 (Office of Financial Management). Income levels are rising along with property values but not at comparable rates, with income increase equaling 31% and median value increase equaling 51%. Table 4-7: Residential Sales
Year Average
Sale Price Median
Sale Price
2001 $79,732 $84,000 2002 $124,682 $98,000 2003 $95,781 $94,800 2004 $97,679 $94,000
Source: Northwest Properties local real estate data The median value for contract rent in the City of Castle Rock has also been on the rise from $270 in 1990 to $521 in 2000, increasing by 48%. Cowlitz County’s median rent value has increased by 43%
since 1990. However, 33% of all renters pay over 35% of their income for housing costs, compared with 14.6% of homeowners paying over 35%. The majority of homeowners (37.6%) pay less than 15% of their household income on housing costs. These figures indicate there is a need for affordable rental housing within the City of Castle Rock. To get a picture of the more current sales trends for housing in Castle Rock, see Table 4-7; Residential Sales in Castle Rock. The median sale price of homes between 2001-2002 jumped by 14.3% and then decreased from 2002-2004 by 4%. Cowlitz County as whole was on a steady increase during the years of 2001-2004. This is another reflection of the aging housing stock within the city, and the continued state of the economy. The increase median value on property and income over the last 20 years and the recent decrease in median sale price is noteworthy. With values and income on a consistent climb within Cowlitz County and the city, we should see an increase in home sale prices as well. The rest of Cowlitz County is seeing slight increases as the city is seeing a decrease on the median sale price. This is a good indication that the City is prime for growth, and development within the near future.
Affordable Housing According to federal guidelines, housing is affordable only when it is 30% or less of a household’s gross income. As stated above 33% of all renters in Castle
City of Castle Rock IV-6 Comprehensive Plan 2006
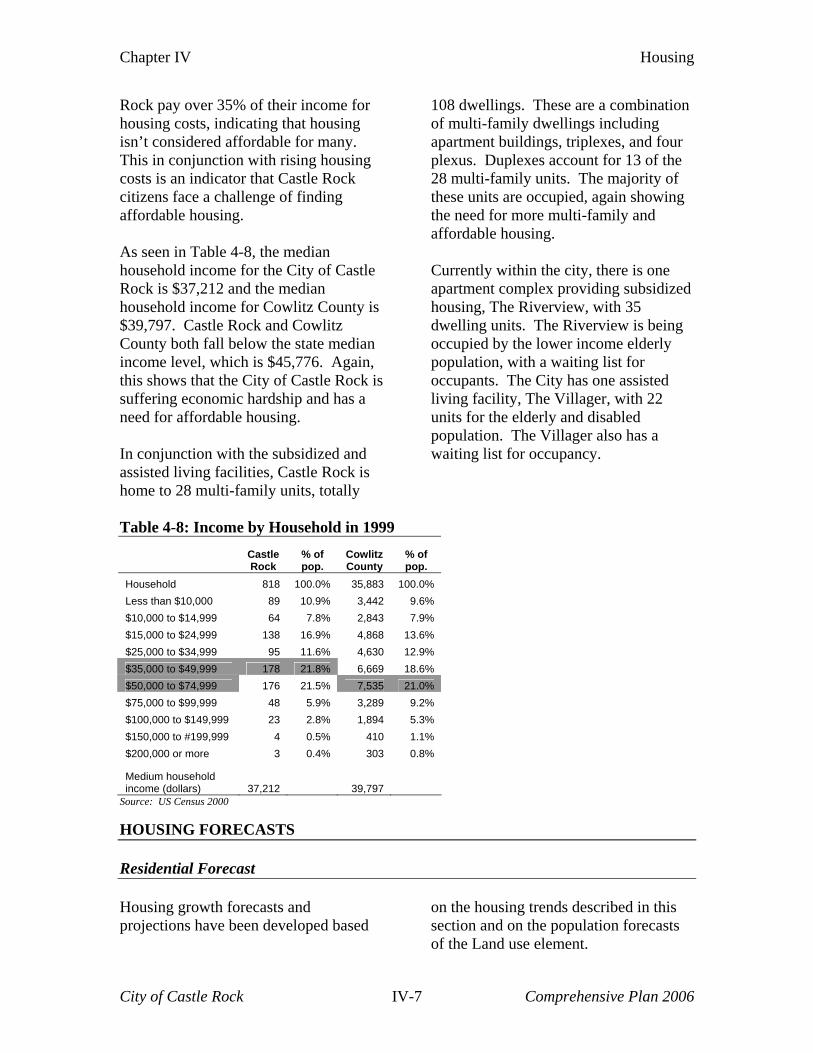
Chapter IV Housing
Rock pay over 35% of their income for housing costs, indicating that housing isn’t considered affordable for many. This in conjunction with rising housing costs is an indicator that Castle Rock citizens face a challenge of finding affordable housing. As seen in Table 4-8, the median household income for the City of Castle Rock is $37,212 and the median household income for Cowlitz County is $39,797. Castle Rock and Cowlitz County both fall below the state median income level, which is $45,776. Again, this shows that the City of Castle Rock is suffering economic hardship and has a need for affordable housing. In conjunction with the subsidized and assisted living facilities, Castle Rock is home to 28 multi-family units, totally
108 dwellings. These are a combination of multi-family dwellings including apartment buildings, triplexes, and four plexus. Duplexes account for 13 of the 28 multi-family units. The majority of these units are occupied, again showing the need for more multi-family and affordable housing. Currently within the city, there is one apartment complex providing subsidized housing, The Riverview, with 35 dwelling units. The Riverview is being occupied by the lower income elderly population, with a waiting list for occupants. The City has one assisted living facility, The Villager, with 22 units for the elderly and disabled population. The Villager also has a waiting list for occupancy.
Table 4-8: Income by Household in 1999
Castle Rock
% of pop.
Cowlitz County
% of pop.
Household 818 100.0% 35,883 100.0% Less than $10,000 89 10.9% 3,442 9.6% $10,000 to $14,999 64 7.8% 2,843 7.9% $15,000 to $24,999 138 16.9% 4,868 13.6% $25,000 to $34,999 95 11.6% 4,630 12.9% $35,000 to $49,999 178 21.8% 6,669 18.6% $50,000 to $74,999 176 21.5% 7,535 21.0% $75,000 to $99,999 48 5.9% 3,289 9.2% $100,000 to $149,999 23 2.8% 1,894 5.3% $150,000 to #199,999 4 0.5% 410 1.1% $200,000 or more 3 0.4% 303 0.8%
Medium household income (dollars) 37,212 39,797
Source: US Census 2000
HOUSING FORECASTS Residential Forecast Housing growth forecasts and projections have been developed based
on the housing trends described in this section and on the population forecasts of the Land use element.
City of Castle Rock IV-7 Comprehensive Plan 2006
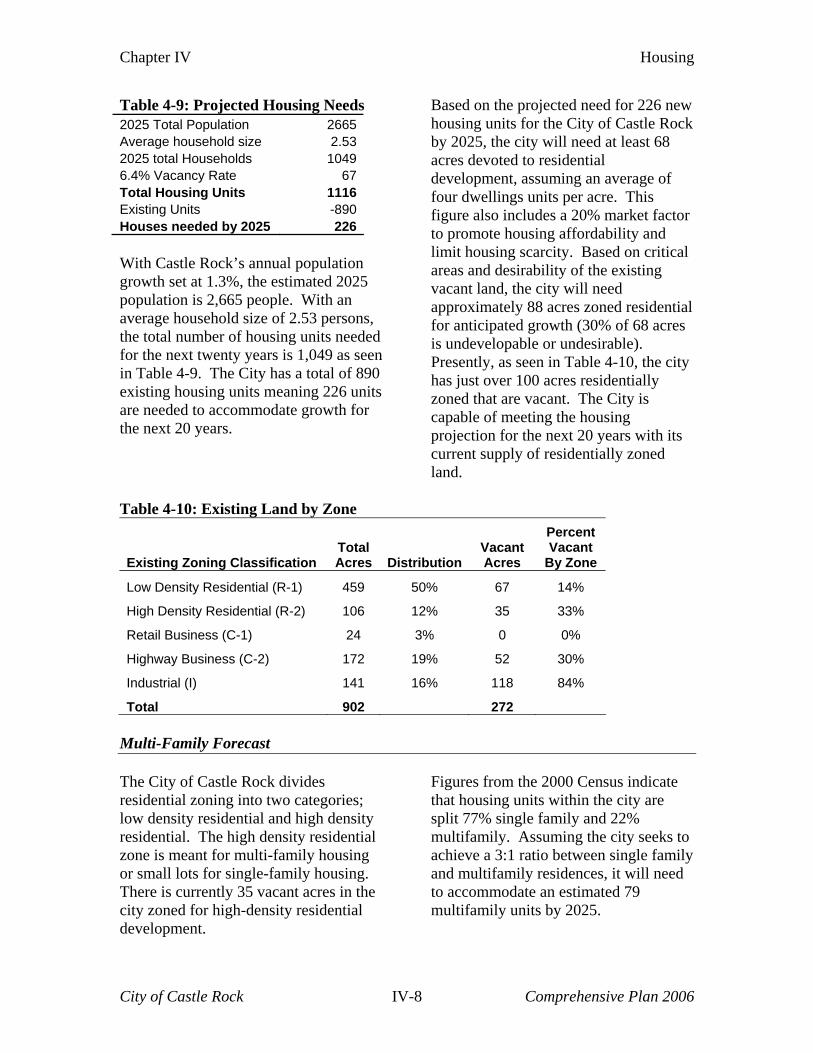
Chapter IV Housing
Table 4-9: Projected Housing Needs 2025 Total Population 2665Average household size 2.532025 total Households 10496.4% Vacancy Rate 67Total Housing Units 1116Existing Units -890Houses needed by 2025 226 With Castle Rock’s annual population growth set at 1.3%, the estimated 2025 population is 2,665 people. With an average household size of 2.53 persons, the total number of housing units needed for the next twenty years is 1,049 as seen in Table 4-9. The City has a total of 890 existing housing units meaning 226 units are needed to accommodate growth for the next 20 years.
Based on the projected need for 226 new housing units for the City of Castle Rock by 2025, the city will need at least 68 acres devoted to residential development, assuming an average of four dwellings units per acre. This figure also includes a 20% market factor to promote housing affordability and limit housing scarcity. Based on critical areas and desirability of the existing vacant land, the city will need approximately 88 acres zoned residential for anticipated growth (30% of 68 acres is undevelopable or undesirable). Presently, as seen in Table 4-10, the city has just over 100 acres residentially zoned that are vacant. The City is capable of meeting the housing projection for the next 20 years with its current supply of residentially zoned land.
Table 4-10: Existing Land by Zone
Existing Zoning Classification Total Acres Distribution
Vacant Acres
Percent Vacant
By Zone
Low Density Residential (R-1) 459 50% 67 14%
High Density Residential (R-2) 106 12% 35 33%
Retail Business (C-1) 24 3% 0 0%
Highway Business (C-2) 172 19% 52 30%
Industrial (I) 141 16% 118 84%
Total 902 272 Multi-Family Forecast The City of Castle Rock divides residential zoning into two categories; low density residential and high density residential. The high density residential zone is meant for multi-family housing or small lots for single-family housing. There is currently 35 vacant acres in the city zoned for high-density residential development.
Figures from the 2000 Census indicate that housing units within the city are split 77% single family and 22% multifamily. Assuming the city seeks to achieve a 3:1 ratio between single family and multifamily residences, it will need to accommodate an estimated 79 multifamily units by 2025.
City of Castle Rock IV-8 Comprehensive Plan 2006
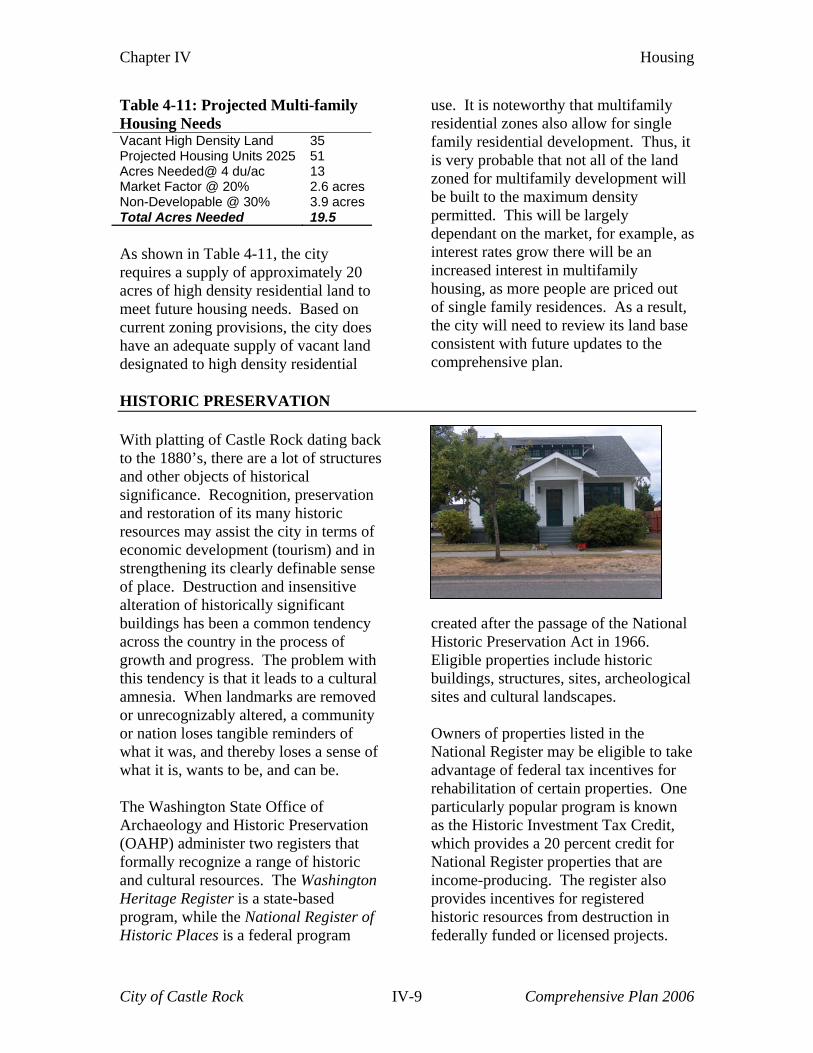
Chapter IV Housing
Table 4-11: Projected Multi-family Housing Needs Vacant High Density Land 35 Projected Housing Units 2025 51 Acres Needed@ 4 du/ac 13 Market Factor @ 20% 2.6 acresNon-Developable @ 30% 3.9 acresTotal Acres Needed 19.5 As shown in Table 4-11, the city requires a supply of approximately 20 acres of high density residential land to meet future housing needs. Based on current zoning provisions, the city does have an adequate supply of vacant land designated to high density residential
use. It is noteworthy that multifamily residential zones also allow for single family residential development. Thus, it is very probable that not all of the land zoned for multifamily development will be built to the maximum density permitted. This will be largely dependant on the market, for example, as interest rates grow there will be an increased interest in multifamily housing, as more people are priced out of single family residences. As a result, the city will need to review its land base consistent with future updates to the comprehensive plan.
HISTORIC PRESERVATION With platting of Castle Rock dating back to the 1880’s, there are a lot of structures and other objects of historical significance. Recognition, preservation and restoration of its many historic resources may assist the city in terms of economic development (tourism) and in strengthening its clearly definable sense of place. Destruction and insensitive alteration of historically significant buildings has been a common tendency across the country in the process of growth and progress. The problem with this tendency is that it leads to a cultural amnesia. When landmarks are removed or unrecognizably altered, a community or nation loses tangible reminders of what it was, and thereby loses a sense of what it is, wants to be, and can be. The Washington State Office of Archaeology and Historic Preservation (OAHP) administer two registers that formally recognize a range of historic and cultural resources. The Washington Heritage Register is a state-based program, while the National Register of Historic Places is a federal program
created after the passage of the National Historic Preservation Act in 1966. Eligible properties include historic buildings, structures, sites, archeological sites and cultural landscapes. Owners of properties listed in the National Register may be eligible to take advantage of federal tax incentives for rehabilitation of certain properties. One particularly popular program is known as the Historic Investment Tax Credit, which provides a 20 percent credit for National Register properties that are income-producing. The register also provides incentives for registered historic resources from destruction in federally funded or licensed projects.
City of Castle Rock IV-9 Comprehensive Plan 2006
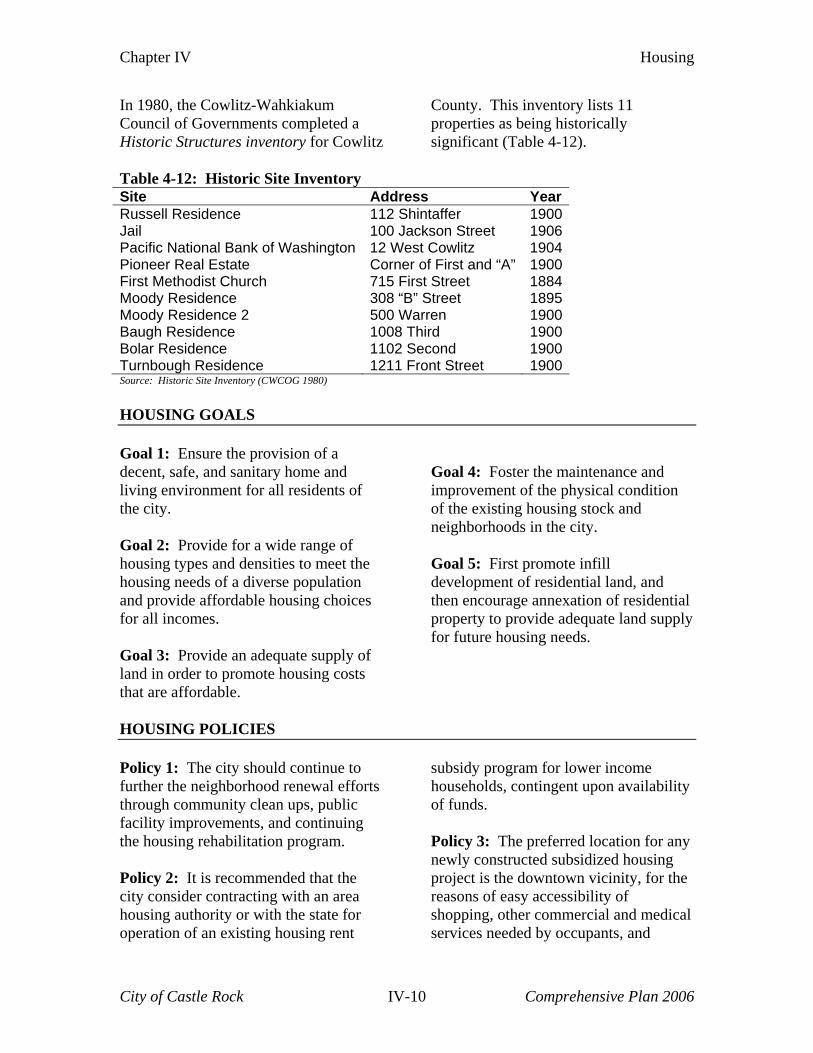
Chapter IV Housing
In 1980, the Cowlitz-Wahkiakum Council of Governments completed a Historic Structures inventory for Cowlitz
County. This inventory lists 11 properties as being historically significant (Table 4-12).
Table 4-12: Historic Site Inventory Site Address YearRussell Residence 112 Shintaffer 1900Jail 100 Jackson Street 1906Pacific National Bank of Washington 12 West Cowlitz 1904Pioneer Real Estate Corner of First and “A” 1900First Methodist Church 715 First Street 1884Moody Residence 308 “B” Street 1895Moody Residence 2 500 Warren 1900Baugh Residence 1008 Third 1900Bolar Residence 1102 Second 1900Turnbough Residence 1211 Front Street 1900Source: Historic Site Inventory (CWCOG 1980) HOUSING GOALS Goal 1: Ensure the provision of a decent, safe, and sanitary home and living environment for all residents of the city. Goal 2: Provide for a wide range of housing types and densities to meet the housing needs of a diverse population and provide affordable housing choices for all incomes. Goal 3: Provide an adequate supply of land in order to promote housing costs that are affordable.
Goal 4: Foster the maintenance and improvement of the physical condition of the existing housing stock and neighborhoods in the city. Goal 5: First promote infill development of residential land, and then encourage annexation of residential property to provide adequate land supply for future housing needs.
HOUSING POLICIES Policy 1: The city should continue to further the neighborhood renewal efforts through community clean ups, public facility improvements, and continuing the housing rehabilitation program. Policy 2: It is recommended that the city consider contracting with an area housing authority or with the state for operation of an existing housing rent
subsidy program for lower income households, contingent upon availability of funds. Policy 3: The preferred location for any newly constructed subsidized housing project is the downtown vicinity, for the reasons of easy accessibility of shopping, other commercial and medical services needed by occupants, and
City of Castle Rock IV-10 Comprehensive Plan 2006
Chapter IV Housing
development of the Downtown area customer/activity base. Policy 4: Due to minimal land supply, the City should discourage the conversion of residential areas to non-residential uses. Policy 5: Ensure that City policies, codes, and regulations do not restrict, prohibit or substantially increase the cost of establishing a variety of housing types or impede the goals, and policies of this housing element. Policy 6: Provide incentives and guidelines for efficient development patterns that preserve and enhance
scenic open space, reduce urban sprawl and encourage development in activity centers through innovative site planning techniques which minimize road, sewer, water, and other infrastructure costs (provide standards for cluster developments, small lot districts, manufactured housing, and planned unit development). Policy 7: Support annexation of residential property within the urban growth boundary to stay consistent with projected housing needs. Make sure the Urban Growth Boundary is of sufficient size to accommodate population growth that is 20% greater than projected.
City of Castle Rock IV-11 Comprehensive Plan 2006
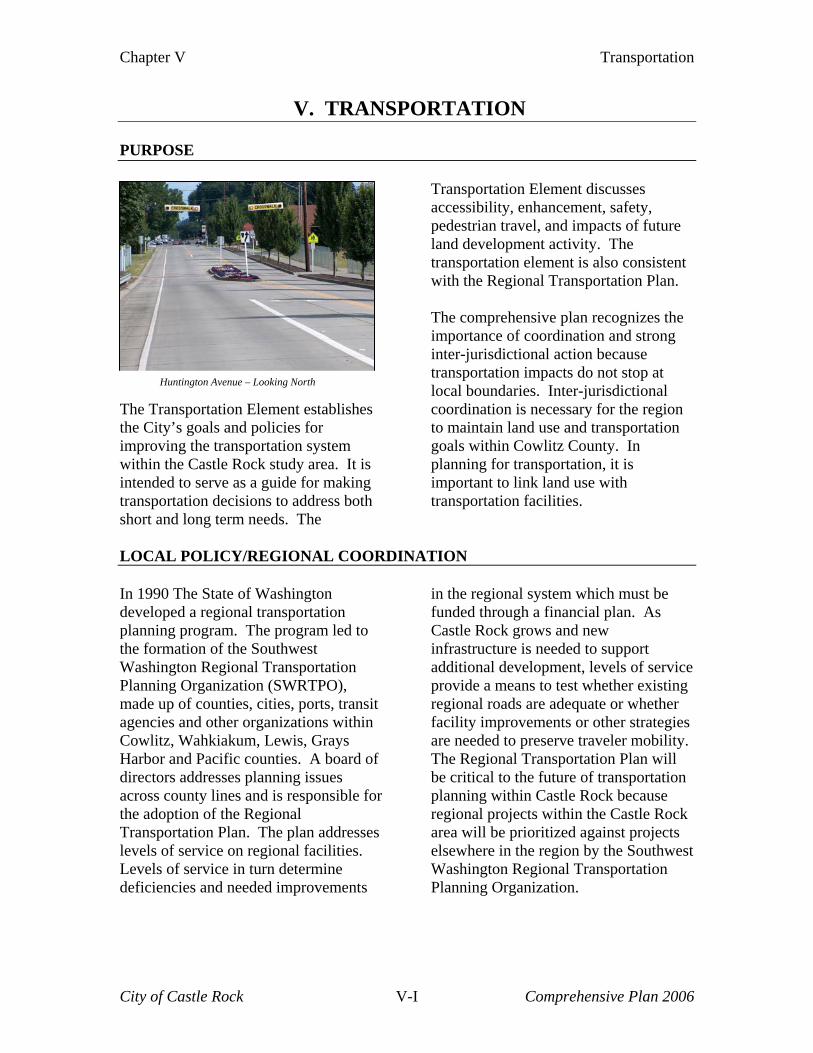
Chapter V Transportation
V. TRANSPORTATION
PURPOSE
The Transportation Element establishes the City’s goals and policies for improving the transportation system within the Castle Rock study area. It is intended to serve as a guide for making transportation decisions to address both short and long term needs. The
Transportation Element discusses accessibility, enhancement, safety, pedestrian travel, and impacts of future land development activity. The transportation element is also consistent with the Regional Transportation Plan. The comprehensive plan recognizes the importance of coordination and strong inter-jurisdictional action because transportation impacts do not stop at local boundaries. Inter-jurisdictional coordination is necessary for the region to maintain land use and transportation goals within Cowlitz County. In planning for transportation, it is important to link land use with transportation facilities.
Huntington Avenue – Looking North
LOCAL POLICY/REGIONAL COORDINATION In 1990 The State of Washington developed a regional transportation planning program. The program led to the formation of the Southwest Washington Regional Transportation Planning Organization (SWRTPO), made up of counties, cities, ports, transit agencies and other organizations within Cowlitz, Wahkiakum, Lewis, Grays Harbor and Pacific counties. A board of directors addresses planning issues across county lines and is responsible for the adoption of the Regional Transportation Plan. The plan addresses levels of service on regional facilities. Levels of service in turn determine deficiencies and needed improvements
in the regional system which must be funded through a financial plan. As Castle Rock grows and new infrastructure is needed to support additional development, levels of service provide a means to test whether existing regional roads are adequate or whether facility improvements or other strategies are needed to preserve traveler mobility. The Regional Transportation Plan will be critical to the future of transportation planning within Castle Rock because regional projects within the Castle Rock area will be prioritized against projects elsewhere in the region by the Southwest Washington Regional Transportation Planning Organization.
City of Castle Rock V-I Comprehensive Plan 2006
Chapter V Transportation
EXISTING TRANSPORTATION SYSTEM This section provides an inventory of the existing transportation system in the Castle Rock area. Data sources in this element consist of documents from Castle Rock planning, Cowlitz County,
Federal Highway Administration, Washington State Department of Transportation, and the Southwest Washington Regional Transportation Planning Organization.
Land Transportation The existing street system for the City of Castle Rock is shown in Figure 5-1. The transportation network not only provides for movement of residents and goods, but it also serves as the major conduit for essential urban services (e.g., electric, water, sewer, drainage, communications, etc.) generally located above or below ground within the rights-of-way (ROW). Castle Rock is served by a network of roads, totaling approximately 18 miles. Most of the arterials are built to an acceptable standard, in terms of lane widths and surface conditions, for their intended use. However, many of the older local access streets are narrow, have deteriorating pavement or are
gravel, and are built on narrow right-of-way. The basic roadway system providing circulation to and from Castle Rock is the federal and state highway system, Interstate-5, State Route 411 and State Route 504. The interstate links Castle Rock and surrounding areas to Portland to the south, and Olympia and Seattle to the north. State Route 411 is also a north south connection, although connecting to smaller urban areas such as Longview/Kelso to the south. State Route 504 is an east-west connection linking the Castle Rock community to Mount St. Helens, and the Community of Toutle.
Functional Classification: Functional classification is the process by which streets and highways are grouped into classes, according to the character of service they are intended to provide, as defined by the Federal Highway Administration. Transportation planning uses functional classification to determine how travel should be channelized within the overall road network. For example, roadways provide two functions, to provide mobility and to provide access. Higher speeds and fewer intersections are
preferred for mobility, while lower speeds and more frequent intersections support access. In this sense, functional classification defines the part that any particular route should play in servicing the flow of trips through a highway network. The City of Castle Rock’s functional classification map is shown in Figure 5-2. The map is produced and updated by the Washington State Department of Transportation (WSDOT), who has ay
City of Castle Rock V-2 Comprehensive Plan 2006
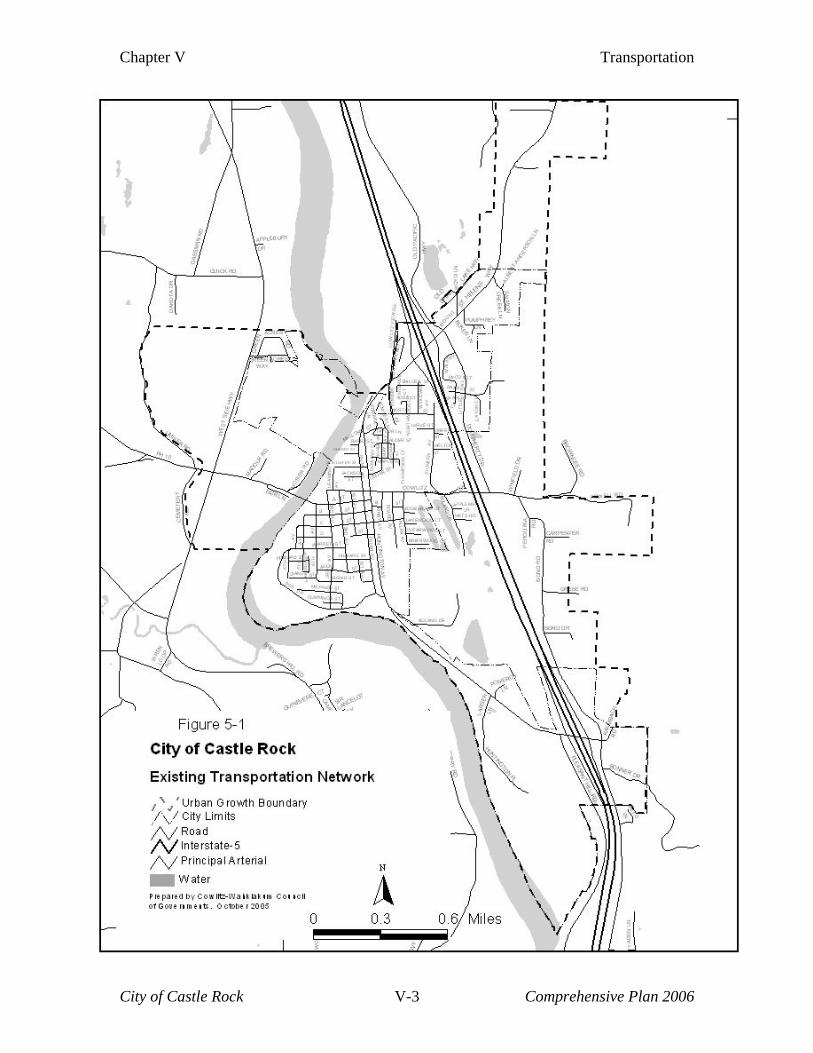
Chapter V Transportation
City of Castle Rock V-3 Comprehensive Plan 2006
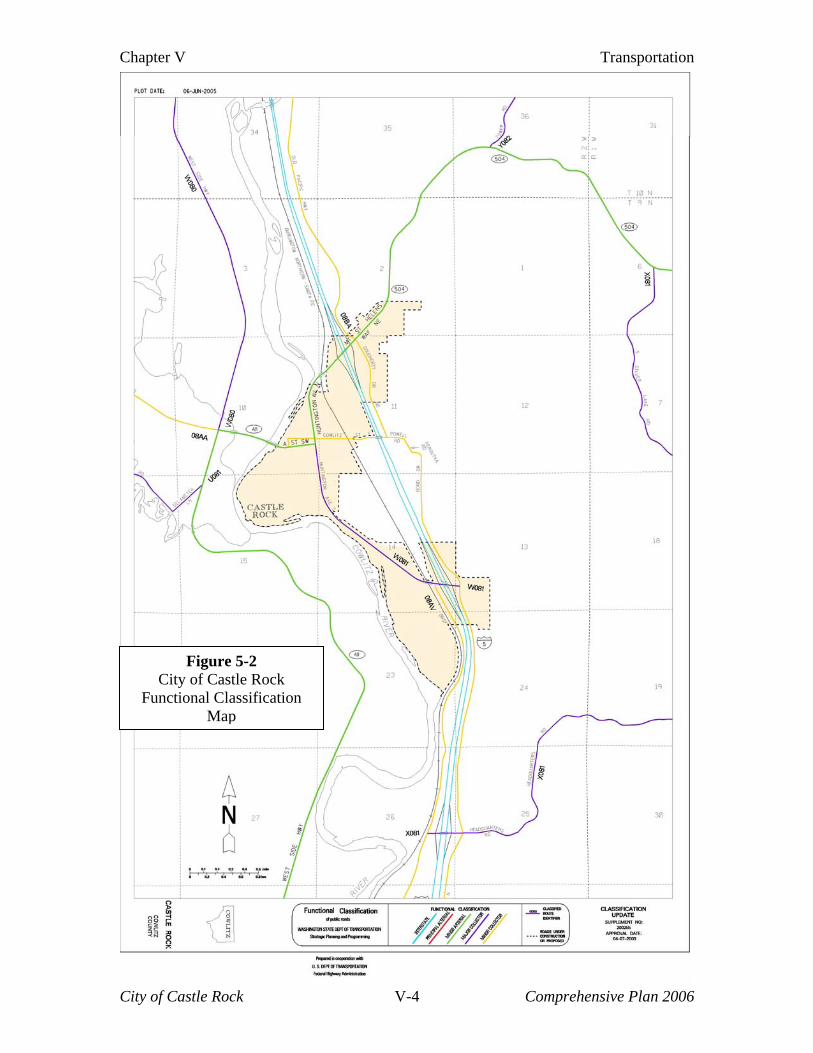
Chapter V Transportation
City of Castle Rock V-4 Comprehensive Plan 2006
Figure 5-2 City of Castle Rock
Functional Classification Map
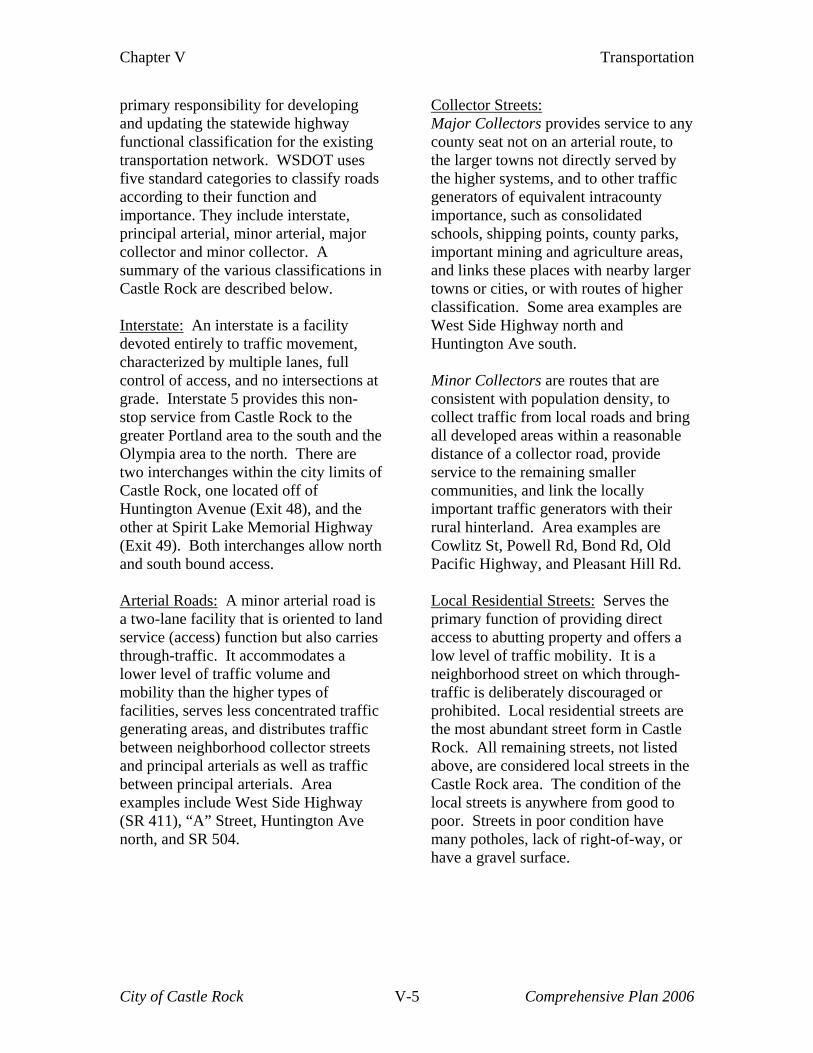
Chapter V Transportation
primary responsibility for developing and updating the statewide highway functional classification for the existing transportation network. WSDOT uses five standard categories to classify roads according to their function and importance. They include interstate, principal arterial, minor arterial, major collector and minor collector. A summary of the various classifications in Castle Rock are described below. Interstate: An interstate is a facility devoted entirely to traffic movement, characterized by multiple lanes, full control of access, and no intersections at grade. Interstate 5 provides this non-stop service from Castle Rock to the greater Portland area to the south and the Olympia area to the north. There are two interchanges within the city limits of Castle Rock, one located off of Huntington Avenue (Exit 48), and the other at Spirit Lake Memorial Highway (Exit 49). Both interchanges allow north and south bound access. Arterial Roads: A minor arterial road is a two-lane facility that is oriented to land service (access) function but also carries through-traffic. It accommodates a lower level of traffic volume and mobility than the higher types of facilities, serves less concentrated traffic generating areas, and distributes traffic between neighborhood collector streets and principal arterials as well as traffic between principal arterials. Area examples include West Side Highway (SR 411), “A” Street, Huntington Ave north, and SR 504.
Collector Streets: Major Collectors provides service to any county seat not on an arterial route, to the larger towns not directly served by the higher systems, and to other traffic generators of equivalent intracounty importance, such as consolidated schools, shipping points, county parks, important mining and agriculture areas, and links these places with nearby larger towns or cities, or with routes of higher classification. Some area examples are West Side Highway north and Huntington Ave south. Minor Collectors are routes that are consistent with population density, to collect traffic from local roads and bring all developed areas within a reasonable distance of a collector road, provide service to the remaining smaller communities, and link the locally important traffic generators with their rural hinterland. Area examples are Cowlitz St, Powell Rd, Bond Rd, Old Pacific Highway, and Pleasant Hill Rd. Local Residential Streets: Serves the primary function of providing direct access to abutting property and offers a low level of traffic mobility. It is a neighborhood street on which through-traffic is deliberately discouraged or prohibited. Local residential streets are the most abundant street form in Castle Rock. All remaining streets, not listed above, are considered local streets in the Castle Rock area. The condition of the local streets is anywhere from good to poor. Streets in poor condition have many potholes, lack of right-of-way, or have a gravel surface.
City of Castle Rock V-5 Comprehensive Plan 2006
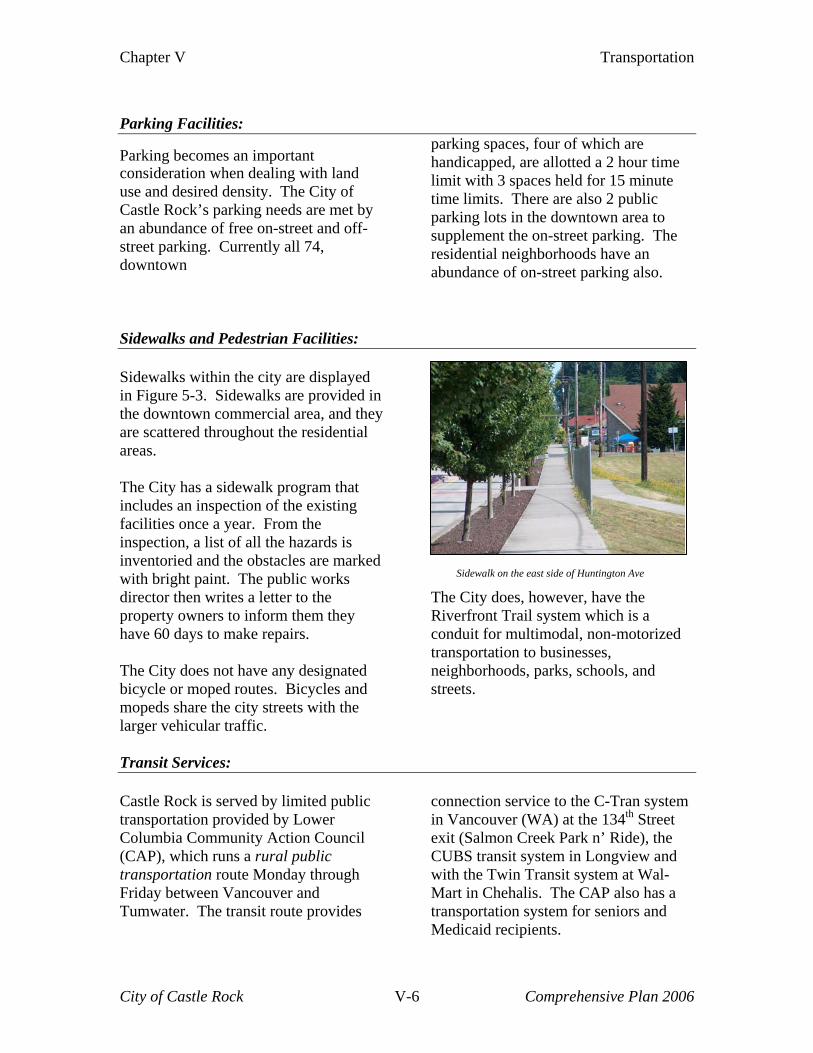
Chapter V Transportation
Parking Facilities: Parking becomes an important consideration when dealing with land use and desired density. The City of Castle Rock’s parking needs are met by an abundance of free on-street and off-street parking. Currently all 74, downtown
parking spaces, four of which are handicapped, are allotted a 2 hour time limit with 3 spaces held for 15 minute time limits. There are also 2 public parking lots in the downtown area to supplement the on-street parking. The residential neighborhoods have an abundance of on-street parking also.
Sidewalks and Pedestrian Facilities: Sidewalks within the city are displayed in Figure 5-3. Sidewalks are provided in the downtown commercial area, and they are scattered throughout the residential areas. The City has a sidewalk program that includes an inspection of the existing facilities once a year. From the inspection, a list of all the hazards is inventoried and the obstacles are marked with bright paint. The public works director then writes a letter to the property owners to inform them they have 60 days to make repairs. The City does not have any designated bicycle or moped routes. Bicycles and mopeds share the city streets with the larger vehicular traffic.
The City does, however, have the Riverfront Trail system which is a conduit for multimodal, non-motorized transportation to businesses, neighborhoods, parks, schools, and streets.
Sidewalk on the east side of Huntington Ave
Transit Services: Castle Rock is served by limited public transportation provided by Lower Columbia Community Action Council (CAP), which runs a rural public transportation route Monday through Friday between Vancouver and Tumwater. The transit route provides
connection service to the C-Tran system in Vancouver (WA) at the 134th Street exit (Salmon Creek Park n’ Ride), the CUBS transit system in Longview and with the Twin Transit system at Wal-Mart in Chehalis. The CAP also has a transportation system for seniors and Medicaid recipients.
City of Castle Rock V-6 Comprehensive Plan 2006
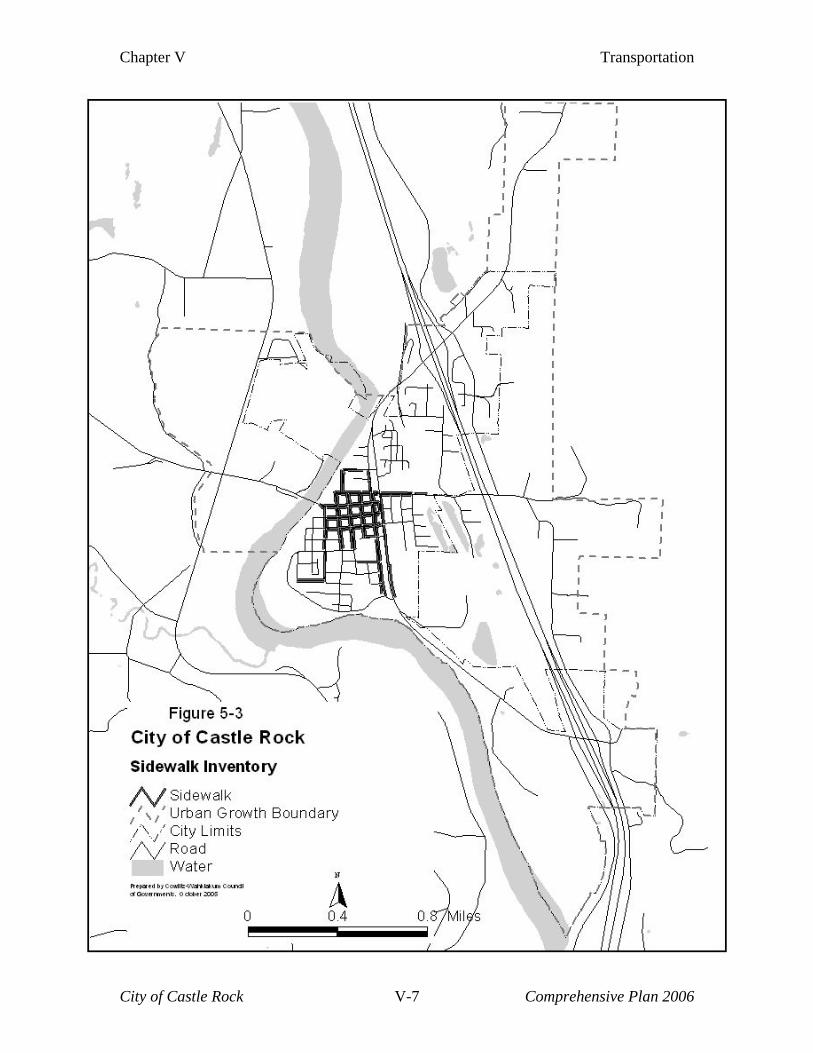
Chapter V Transportation
City of Castle Rock V-7 Comprehensive Plan 2006
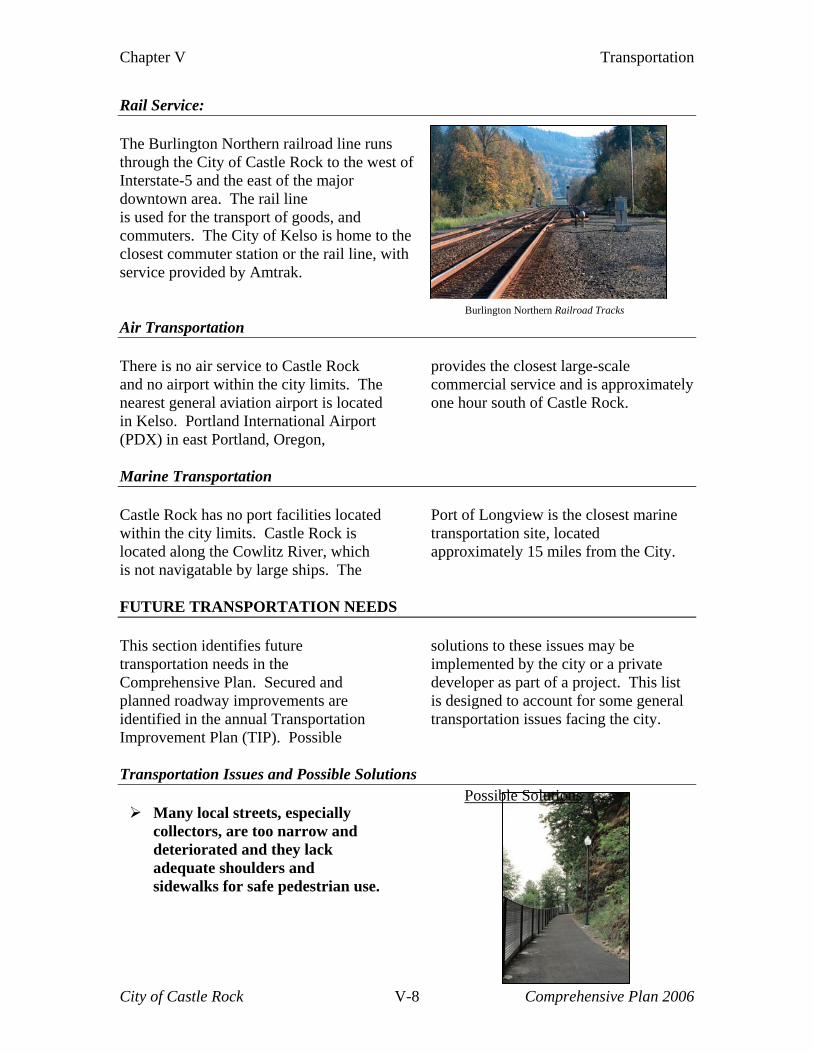
Chapter V Transportation
Rail Service: The Burlington Northern railroad line runs through the City of Castle Rock to the west of Interstate-5 and the east of the major downtown area. The rail line is used for the transport of goods, and commuters. The City of Kelso is home to the closest commuter station or the rail line, with service provided by Amtrak. Burlington Northern Railroad Tracks Air Transportation There is no air service to Castle Rock and no airport within the city limits. The nearest general aviation airport is located in Kelso. Portland International Airport (PDX) in east Portland, Oregon,
provides the closest large-scale commercial service and is approximately one hour south of Castle Rock.
Marine Transportation Castle Rock has no port facilities located within the city limits. Castle Rock is located along the Cowlitz River, which is not navigatable by large ships. The
Port of Longview is the closest marine transportation site, located approximately 15 miles from the City.
FUTURE TRANSPORTATION NEEDS This section identifies future transportation needs in the Comprehensive Plan. Secured and planned roadway improvements are identified in the annual Transportation Improvement Plan (TIP). Possible
solutions to these issues may be implemented by the city or a private developer as part of a project. This list is designed to account for some general transportation issues facing the city.
Transportation Issues and Possible Solutions
Many local streets, especially collectors, are too narrow and deteriorated and they lack adequate shoulders and sidewalks for safe pedestrian use.
Possible Solutions
City of Castle Rock V-8 Comprehensive Plan 2006
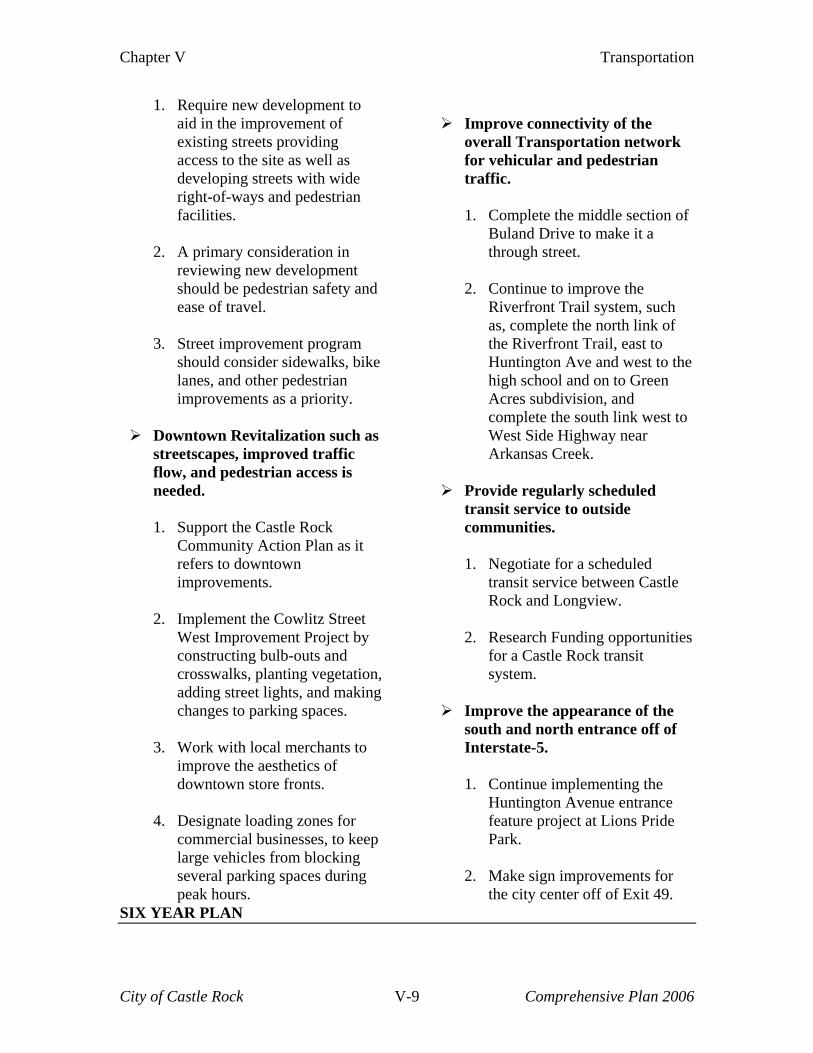
Chapter V Transportation
1. Require new development to aid in the improvement of existing streets providing access to the site as well as developing streets with wide right-of-ways and pedestrian facilities.
2. A primary consideration in
reviewing new development should be pedestrian safety and ease of travel.
3. Street improvement program
should consider sidewalks, bike lanes, and other pedestrian improvements as a priority.
Downtown Revitalization such as
streetscapes, improved traffic flow, and pedestrian access is needed.
1. Support the Castle Rock
Community Action Plan as it refers to downtown improvements.
2. Implement the Cowlitz Street
West Improvement Project by constructing bulb-outs and crosswalks, planting vegetation, adding street lights, and making changes to parking spaces.
3. Work with local merchants to
improve the aesthetics of downtown store fronts.
4. Designate loading zones for
commercial businesses, to keep large vehicles from blocking several parking spaces during peak hours.
Improve connectivity of the
overall Transportation network for vehicular and pedestrian traffic.
1. Complete the middle section of
Buland Drive to make it a through street.
2. Continue to improve the
Riverfront Trail system, such as, complete the north link of the Riverfront Trail, east to Huntington Ave and west to the high school and on to Green Acres subdivision, and complete the south link west to West Side Highway near Arkansas Creek.
Provide regularly scheduled
transit service to outside communities.
1. Negotiate for a scheduled
transit service between Castle Rock and Longview.
2. Research Funding opportunities
for a Castle Rock transit system.
Improve the appearance of the
south and north entrance off of Interstate-5.
1. Continue implementing the
Huntington Avenue entrance feature project at Lions Pride Park.
2. Make sign improvements for
the city center off of Exit 49.SIX YEAR PLAN
City of Castle Rock V-9 Comprehensive Plan 2006
Chapter V Transportation
As mandated by law, the City of Castle Rock creates a six-year Transportation Improvement Plan (TIP) annually. The plan lists all of the projects with secured local, state, and federal funding for a three year window as well as all of the planned projects without secured funding within a six year window. This six-year funding plan includes an analysis of the city’s funding capabilities, and is compatible with the city’s growth and development.
The City of Castle Rock’s TIP is adopted by City Council for approval and then included in the Southwest Washington Regional Transportation Improvement Organization’s TIP, where the projects are prioritized against other regional projects for funding purposes. The city’s projects are also included in the State Transportation Improvement Plan (STIP) which is adopted by the Washington State Department of Transportation (see Appendix A).
FUNDING SOURCES Funding sources for the city’s transportation system are listed under the
Capital Facilities element of the Comprehensive Plan.
TRANSPORTATION GOALS Goal 1: Provide for a convenient, safe, and efficient transportation/circulation network.
Goal 2: Ensure pedestrian safety and convenience in the transportation/circulation system and further the use of alternative travel modes. Goal 3: Establish sufficient funding to implement planned transportation
projects and services. This plan gives high priority to maintenance, preservation and safety improvements. Goal 4: Ensure that an adequate transportation network exists to support future development. Goal 5: Provide a higher level of transit services to the citizens of Castle Rock.
TRANSPORTATION POLICIES Policy 1: Sidewalks or at least wide, paved shoulders for pedestrian movement should be integral parts of new or improved streets and highways in the Castle Rock Urban Area.
Policy 2: Prohibit on-street parking of large recreational vehicles, semi trucks and trailers, and logging trucks in residential areas.
Policy 3: Integrate land use and transportation decisions to ensure that the transportation system supports the community land use vision. Policy 4: Provide attractive streetscapes through design standards that encourage appropriate traffic volumes, speeds, and pedestrian safety in the downtown area.
City of Castle Rock V-10 Comprehensive Plan 2006
Chapter V Transportation
Policy 5: Encourage street networks in new development that create circulation between neighborhoods and subdivisions. Policy 6: Bicycle and jogging trails identified in the Parks, Recreation and Open Space Element of this plan and their maintenance should be
incorporated into the transportation improvement programs of the city, county, and state. Policy 7: Develop new public works standards for construction and maintenance of the transportation system.
City of Castle Rock V-11 Comprehensive Plan 2006
Chapter VI Capital Facilities
VI. CAPITAL FACILITIES & UTILITIES PURPOSE The Capital Facilities and Utilities Element is intended to address the capital facilities and utilities needs in Castle Rock and its urban growth area and represents the community’s policy plan for the next 20 years. This element is integrated with all other plan elements to ensure consistency throughout the comprehensive plan. The elements of a community that are necessary for its citizens’ health, safety, welfare and education, or that provide recreational opportunity, are called
public facilities and services. Usually the provisions of these facilities and services are the responsibility of government. Additionally, some services that can be provided by private enterprise, such as solid waste collection and disposal, are also considered a public service. The following pages of the plan discuss these elements, including water services, sewer services, solid waste disposal, police and fire protection, educational services and recreational facilities.
CITY FACILITIES The following services are provided in the City of Castle Rock and are discussed in this section: • Schools • City Facilities and Services
o Fire Protection and Emergency Medical services
o Police Protection o Library
• City Utilities o Water o Sewer o Water and Sewer policies o Storm Water Drainage o Solid Waste Disposal
• Other utilities
o Electric o Natural Gas o Telecommunications
• Capital Facility Goals and Policies Castle Rock also provides streets and parks and recreational services; these are discussed separately in the Transportation and Park, Recreation & Open Space Elements. Most of these services are provided only within the Castle Rock city limits and a few of these services have specific plans for serving the entire study area at this time.
CASTLE ROCK SCHOOL DISTRICT The Castle Rock School District has had a decrease in class size over the last couple of years. As seen in Table 6-1, the population between the ages of 0-34 has decreased rapidly over the last 20 years. This has an effect on classroom
size. The average size is 125 cohorts in grades 8-12, 100 in grades 3-7, and 80 in grades K-2. Permits for subdivided property within the city and in the school district
City of Castle Rock VI-1 Comprehensive Plan 2006
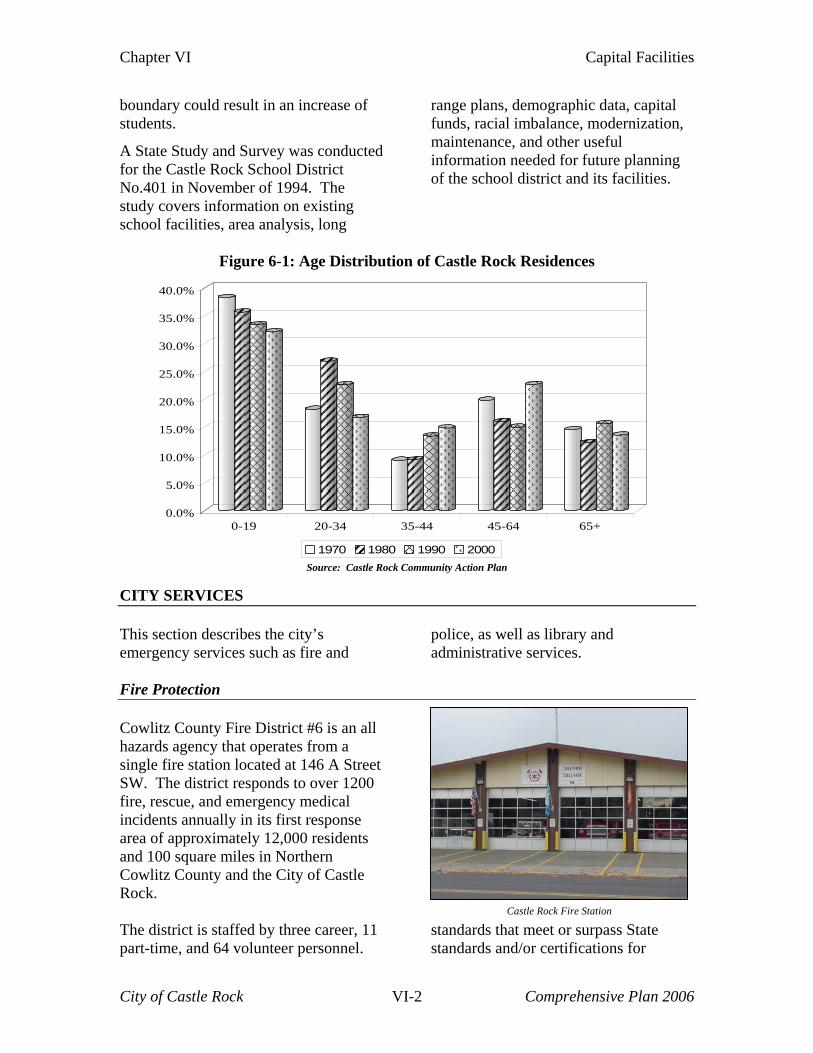
Chapter VI Capital Facilities
boundary could result in an increase of tudents. s
A State Study and Survey was conducted for the Castle Rock School District No.401 in November of 1994. The study covers information on existing school facilities, area analysis, long
range plans, demographic data, capital funds, racial imbalance, modernization, maintenance, and other useful information needed for future planning of the school district and its facilities.
Figure 6-1: Age Distribution of Castle Rock Residences
0.0%
5.0%
10.0%
15.0%
20.0%
25.0%
30.0%
35.0%
40.0%
0-19 20-34 35-44 45-64 65+
1970 1980 1990 2000 Source: Castle Rock Community Action Plan
CITY SERVICES This section describes the city’s emergency services such as fire and
police, as well as library and administrative services.
Fire Protection Cowlitz County Fire District #6 is an all hazards agency that operates from a single fire station located at 146 A Street SW. The district responds to over 1200 fire, rescue, and emergency medical incidents annually in its first response area of approximately 12,000 residents and 100 square miles in Northern Cowlitz County and the City of Castle Rock. The district is staffed by three career, 11 part-time, and 64 volunteer personnel. standards and/or certifications for
All field personnel are trained to district standards that meet or surpass State
Castle Rock Fire Station
City of Castle Rock VI-2 Comprehensive Plan 2006
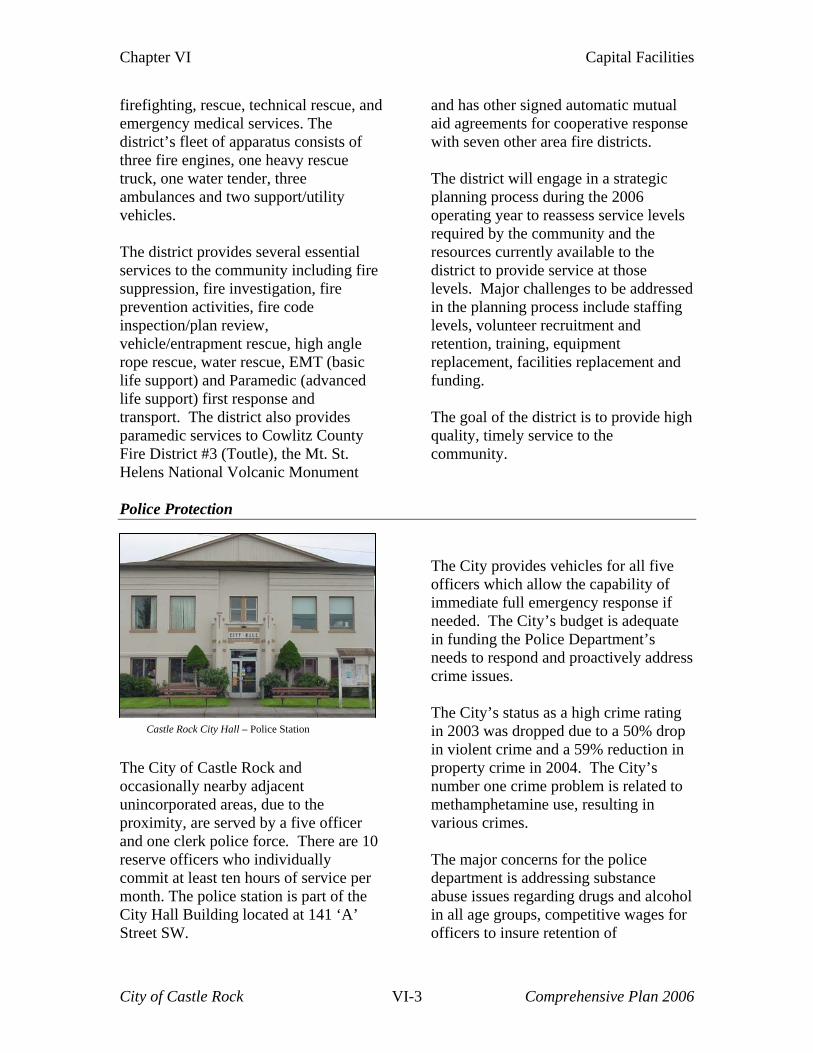
Chapter VI Capital Facilities
firefighting, rescue, technical rescue, andemergency medical services. The district’s fleet of apparatus consiststhree fire engines, one heavy rescue truck, one water tender, three ambulances and two support/utility vehicles. The district provides several essentiaservices to t
of
l he community including fire
ppression, fire investigation, fire
le (basic
dic (advanced
. St.
l e
anning process during the 2006
ls
ssed fing
t and
the district is to provide high ality, timely service to the
olice Protection
suprevention activities, fire code inspection/plan review, vehicle/entrapment rescue, high angrope rescue, water rescue, EMTlife support) and Paramelife support) first response and transport. The district also provides paramedic services to Cowlitz County Fire District #3 (Toutle), the MtHelens National Volcanic Monument
and has other signed automatic mutuaaid agreements for cooperative responswith seven other area fire districts. The district will engage in a strategic
ploperating year to reassess service leverequired by the community and theresources currently available to the district to provide service at those levels. Major challenges to be addrein the planning process include staflevels, volunteer recruitment and retention, training, equipment replacement, facilities replacemenfunding. The goal ofqucommunity.
P
he City of Castle Rock and
e ficer
0
e per
Street SW.
h allow the capability of mediate full emergency response if
ss
pped due to a 50% drop violent crime and a 59% reduction in
ressing substance buse issues regarding drugs and alcohol
s for
Toccasionally nearby adjacent unincorporated areas, due to thproximity, are served by a five ofand one clerk police force. There are 1reserve officers who individually commit at least ten hours of servicmonth. The police station is part of the City Hall Building located at 141 ‘A’
The City provides vehicles for all five officers whicimneeded. The City’s budget is adequate in funding the Police Department’s needs to respond and proactively addrecrime issues. The City’s status as a high crime rating in 2003 was dro Castle Rock City Hall – Police Station inproperty crime in 2004. The City’s number one crime problem is related to methamphetamine use, resulting in various crimes. The major concerns for the police department is addain all age groups, competitive wageofficers to insure retention of
City of Castle Rock VI-3 Comprehensive Plan 2006
Chapter VI Capital Facilities
experienced employees, and fulfilling the needs to provide community oriented
policing for the southwest neighborhoods and schools
Castle Rock Public Library
.
The Castle Rock Library is located in a ity-owned building at 309 West
p.m.,
m. time
Rock residents without charge and to people who live outside the city limits
e ity of Castle Rock until 2000. Now the
g a grant finish the back portion of the library
cCowlitz Street. Its hours of operation are Monday and Wednesdays 12-7Tuesday 10a.m-5p.m, Closed on Thursday, Friday 10a.m.-5 p.m., Saturday and Sunday 12 p.m.-4 p.The library which employs 2 partemployees, houses over 17,000 books.There is no schedule for the purchase ofnew books each year; they are bought atthe end of the year depending on budget, but the majority of the books coming are donated. Books are loaned to Castle
for $25 per year or $15 for 6 months. The library budget was provided by th
CITY UTILITIES
Clibrary posts an excess tax levy on the ballot each year for funding. Staff is in the process of writintobuilding to extend library space, and adda computer center and community meeting space.
Water System The City’s water system is described in a
port titled the City of Castle Rock
rving the
escription of the system
ter tility is a regional system within
p 7,000
fire hydrants, main line valves, and approximately 938 metered
he
R -
ater system, which consists of
e
reRegional Water System, Comprehensive Water System Plan. This report replaces the 1999 Castle Rock/Toutle Regional Water system plan. The report describes the existing water supply and distribution system as well as proposed improvements necessary for seland within the city and urban service area.
D
The City of Castle Rock wauthe State of Washington, whichserves approximately 1,564 customers. The system is made uof approximately 16 miles (8feet) of 2-inch to16-inch water distribution mains with associated
services. The regional water source is six wells and one surface source, the Cowlitz River which runs north to south through tcity. The wells are clustered around the Interstate-5 interchange and Huntington Avenue North (S504), and are approximately 115120 feet deep. The Castle Rock/Toutle Regional Water System is made up of threeseparate systems: the regional wraw water intake, water treatment plant (WTP), main transmission lines, well facilities, and the SR504 reservoir; the City’s water distribution system which consistsof the Bond Road reservoir and th
City of Castle Rock VI-4 Comprehensive Plan 2006
Chapter VI Capital Facilities
distribution system primarily within the city limits (east of theCowlitz River) which provides 238gallons per capita per day; and finally the Cowlitz County distribution system, comprised of two distribution systems; one system west of Castle Rock (weof Cowlitz River) provides 3gallons per capita per day, and second the distribution system to the Toutle Community Regional Water System yields 192 gallonsper capita per day.
Surface Water The surface water su
st 40
pply is the Cowlitz River, approximately 2.5
rom the onfluence with the Toutle River
hed
uare
1/8 inch slots. The take structure is protected by a
the
ing
18-
t
rocess. Treatment of the surface
ear
ted near Cowlitz View ; Well 142
ated on 0
tz gpm.
or
ater System Plan update, along with
and andards, are used in the design
2005
The current water system of Castle el of
forth in the 2005 omprehensive Water System
mping g
miles upstream fcand 4.5 miles from the water treatment plant at River Mile 22.4.The Cowlitz River watersabove the city water intake has a drainage estimated at 1,400 sqmiles. Water is withdrawn from the Cowlitz River through a 24-inch pipe withinberm, located just upstream ofstructure. The water runs by gravity into a raw water pumpstation and then is pumped to the water treatment plant through approximately 25,000 feet of inch ductile iron water main. The water treatment plant is a direct filtration plant, meaning thait does not use a sedimentationpwater consists of chemical addition, static mixers, flocculation
basins, four rapid sand filters, clwell, and finished water pumping.
Ground Water Wells The City currently operates six groundwater wells. Wells number 141 is locaDr. and pumps 80 gpmis located on the north side of SR504 west of I-5 near the southbound I-5 off ramp and pumps 70 gpm; Well 144 is locatednear Papa Pete’s and pumps 110-120 gpm; Well 145 is locPioneer Avenue and pumps 10gpm; Well 146 is located southwest of the I-5-SR504 interchange and pumps 45 gpm; and well 147 is located on CowliView Drive and pumps 40Wells 146 and 147 are used femergency purposes only.
Level of service criteria The Castle Rock Regional W
other adopted guidelines stand construction of the water system. For specific design or system standards, refer to the Comprehensive Water System Plan.
Current Deficiencies/Excess Capacity
Rock meets or exceeds the levservice setCPlan, with limited exceptions. Replacement of some water lines would help improve flow, puand filtration, and reduce leakin
City of Castle Rock VI-5 Comprehensive Plan 2006
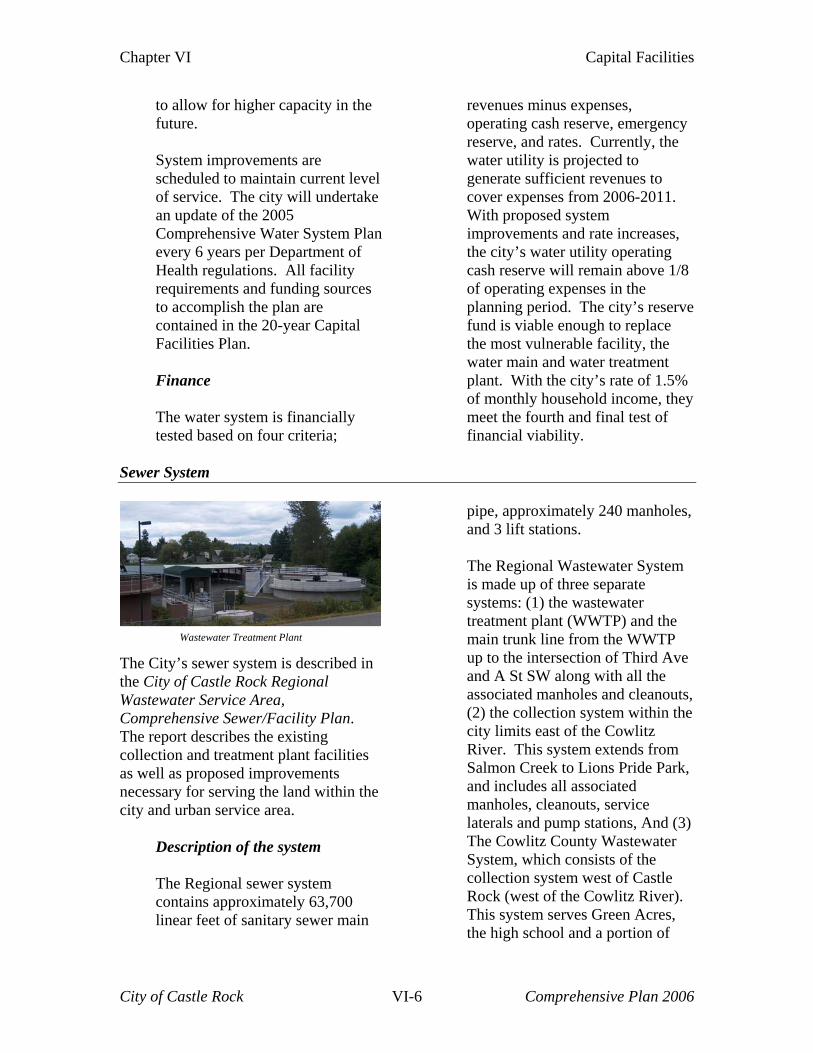
Chapter VI Capital Facilities
to allow for higher capacity in tfuture. System improvements are scheduled to maintain current level of service
he
. The city will undertake n update of the 2005
em Plan
ng sources
is financially ed on four criteria;
ency ly, the
011.
perating
ce
ey
Sewer System
aComprehensive Water Systevery 6 years per Department of Health regulations. All facility requirements and fundito accomplish the plan are contained in the 20-year Capital Facilities Plan.
Finance The water systemtested bas
revenues minus expenses, operating cash reserve, emergreserve, and rates. Currentwater utility is projected to generate sufficient revenues to cover expenses from 2006-2With proposed system improvements and rate increases, the city’s water utility ocash reserve will remain above 1/8of operating expenses in the planning period. The city’s reserve fund is viable enough to replathe most vulnerable facility, the water main and water treatment plant. With the city’s rate of 1.5%of monthly household income, thmeet the fourth and final test of financial viability.
The City’s sewer system is described in
nal
n. isting
m
ontains approximately 63,700
ain
pipe, approximately 240 manholes, and 3 lift stations.
eparate stems: (1) the wastewater
TP Ave
s,
ater
s,
the City of Castle Rock RegioWastewater Service Area, Comprehensive Sewer/Facility PlaThe report describes the excollection and treatment plant facilitiesas well as proposed improvementsnecessary for serving the land within thecity and urban service area.
Description of the syste
The Regional sewer systemclinear feet of sanitary sewer m
The Regional Wastewater System is made up of three ssytreatment plant (WWTP) and the main trunk line from the WWup to the intersection of Thirdand A St SW along with all the associated manholes and cleanout(2) the collection system within the city limits east of the Cowlitz River. This system extends from Salmon Creek to Lions Pride Park, and includes all associated manholes, cleanouts, service laterals and pump stations, And (3) The Cowlitz County WastewSystem, which consists of thecollection system west of Castle Rock (west of the Cowlitz River). This system serves Green Acrethe high school and a portion of
Wastewater Treatment Plant
City of Castle Rock VI-6 Comprehensive Plan 2006
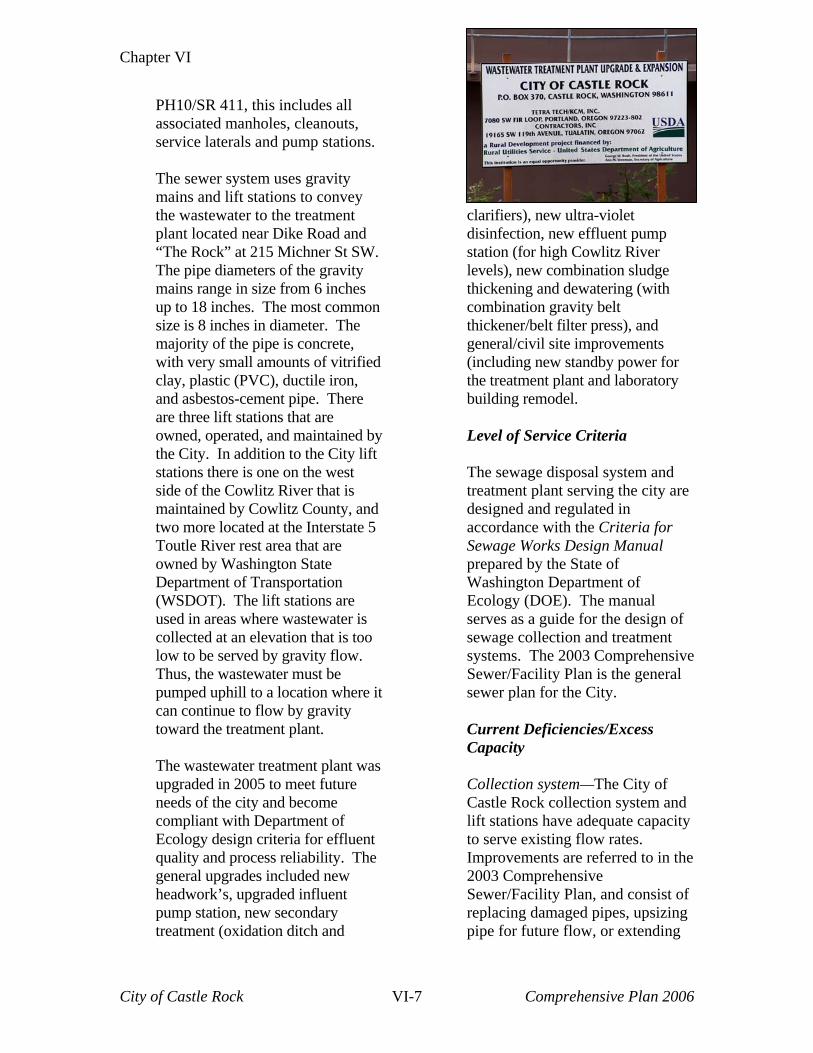
Chapter VI Capital Facilities
PH10/SR 411, this includes all associated manholes, cleanouts, service laterals and pump station
The sewer system uses gravity mains and lift stations to convey
s.
the wastewater to the treatment d
.
by
st
5
e er is
too
t
as re
eeds of the city and become
t The
clarifiers), new ultra-violet disinfection, new effluent pump station (for high Cowlitz River
th
nd
or
ated in
accordance with the Criteria for nual
repared by the State of
sign of
ive l
and lift stations have adequate capacity
ents are referred to in the 003 Comprehensive
of
plant located near Dike Road an“The Rock” at 215 Michner St SWThe pipe diameters of the gravitymains range in size from 6 inches up to 18 inches. The most common size is 8 inches in diameter. The majority of the pipe is concrete, with very small amounts of vitrified clay, plastic (PVC), ductile iron, and asbestos-cement pipe. Thereare three lift stations that are owned, operated, and maintained the City. In addition to the City lift stations there is one on the weside of the Cowlitz River that is maintained by Cowlitz County, and two more located at the InterstateToutle River rest area that are owned by Washington State Department of Transportation (WSDOT). The lift stations arused in areas where wastewatcollected at an elevation that is low to be served by gravity flow.Thus, the wastewater must be pumped uphill to a location where ican continue to flow by gravity toward the treatment plant. The wastewater treatment plant wupgraded in 2005 to meet futuncompliant with Department of Ecology design criteria for effluenquality and process reliability.general upgrades included new headwork’s, upgraded influent pump station, new secondary treatment (oxidation ditch and
levels), new combination sludgethickening and dewatering (wicombination gravity belt thickener/belt filter press), ageneral/civil site improvements (including new standby power fthe treatment plant and laboratorybuilding remodel.
Level of Service Criteria The sewage disposal system and treatment plant serving the city aredesigned and regul
Sewage Works Design MapWashington Department of Ecology (DOE). The manual serves as a guide for the desewage collection and treatment systems. The 2003 ComprehensSewer/Facility Plan is the generasewer plan for the City.
Current Deficiencies/Excess Capacity Collection system—The City of Castle Rock collection system
to serve existing flow rates. Improvem2Sewer/Facility Plan, and consist replacing damaged pipes, upsizing pipe for future flow, or extending
City of Castle Rock VI-7 Comprehensive Plan 2006
Chapter VI Capital Facilities
the system as required to redmaintenance and liabilities, and to provide for system exp Waste Water Treatment Plant—The WWTP underwent an extensive upgrade from 2004-2005, expanding the capacity to meet the 2020 population
uce
ansions.
rojections. The 2003
at have
lysis
of ground water into the sewer
lement to control and reduce
e . six
ter, ther
e 03
r system, system revenue requirements, projected expenses,
s sewer rates based on eed. Rate changes are presented
to the city council for approval
olicies for water and Sewer
r and sewer systems; and discourage
lls nd subsurface sewage disposal
pment; n of
r
If they are required to onnect and are outside of the city
ice no
ell and
ublic utility services shall be planned so that service provisions
pComprehensive Sewer/Facility Plan details the upgrades thoccurred to the plant and futureneeds as the system expands.
Infiltration/Inflow Ana An infiltration/inflow analysis was conducted in the 2003 plan to identify and prioritize the inflow
system. This is an important ehydraulic flows due to rainfall or high ground water. The extra water robs capacity of the treatment plant and makes thinfluent more difficult to treatBase flow rates can jump up totimes the dry weather values in response to elevated groundwaand four times the dry weapeaks due to heavy rainfall. Thplanned improvements in the 20Plan will eliminate these increased levels.
Financing Sewer rates are reviewed on an annual basis. The study reviews the sewe
and developn
each year. The most financially conservative scenario is to pay forall improvements using revenue from utility rates and impact fees, and fund major upgrades and additions with loan funds. The city also has a rate fee for connecting new developments to the system. The fees are divided by single-family, multi-family, andcommercial/industrial.
P Do work in urban areas to eliminate private water and sewer/septic systems; encourage connection to public wate
construction of new private weasites systems in new develoand minimize the introductioground water into the sewer system. Within the urban service area, citizens are provided urban services. If new development occurs within 200 feet of the sewesystem, they are required to connect. climits but within the urban servarea, they must enter into a “contest” annexation agreement. Currently there are private wseptic systems located within the urban service area and a minimal number located within the City limits of Castle Rock. P
City of Castle Rock VI-8 Comprehensive Plan 2006
Chapter VI Capital Facilities
maximize efficiency and cost effectiveness. If the size of a facility required tserve future developmen
o t, or other
ize a proposed
evelopment, the City will pay the
Storm
City needs, is greater than the srequired to serve
Water Drainage
dadditional cost.
A system that collects runoff from rain
orms or melting snow and carries the der developed
reas is called a storm drainage or storm
le
m
elopment and reet repairs.
orthern outfall, which as a diameter of 12 inches and is
ont
tment
This outfall has a pumping station. The third outfall is 18-inchs in diameter and is located opposite “B” Street in the central part of town. The fourth outfall
or
ton
owlitz
ater Management Manual for estern Washington. The program
uild
stwater safely around or unasewer system. Such a system is usually comprised of open ditches, catch basins or underground collection pipes, transmission pipes, a water treatment system (seldom), and an outfall or discharge system. Except for a treatment system, the City of CastRock uses all of these components to control storm water. The Castle Rock storm drainage systeis in fairly good condition and is upgraded with new devst The City’s storm drain outfalls arerouted into the Cowlitz River at five locations. The nhgravity fed, is located west of the FrStreet and Huntington Avenue intersection. The second outfall is an 18-inch line opposite the water treaplant north of the Cowlitz River Bridge.
is a 36-inch facility located near the sewage treatment plant in the south part of town. This facility can be pumpedgravity fed. The fifth outfall is located south of Lions Pride Park on HuntingAve S. This outfall is gravity fed and receives water from the Huntington Ave S area, south of the rock. The Huntington Avenue S entrance feature incorporates low areas which serve as retention/detention ponds to defer the impact of storm water into the CRiver. The city maintains a storm water management program that follows the Storm w
Solid Waste
Whelps maintain dikes and levees, bbudget for capital improvements, follows rate guidelines for new impervious surfaces, and requires on-site detention for large developments.
The collection and disposal of residential and commercial solid waste is
either by private ollector/hauler or by the home or
in Castle t with the
city. Such service is voluntary. Otherwise, it is up to the home and businesses owner to dispose of solid waste at the sanitary landfill operated by
ated
accomplishedcbusiness owner. On-site collection by private sanitation trucks occursRock under franchise agreemen
Cowlitz County. The landfill is locnear Longview southwest of the Harry
City of Castle Rock VI-9 Comprehensive Plan 2006
Chapter VI Capital Facilities
Morgan Bridge (SR 432 crossing of the Cowlitz River). A local committee is in the process ofdrafting the 2005 Regional Solid Waste Plan for guidelines in collection and transfer of solid waste. The plan states that all local cities and counties should require mandatory
service when feasible.
ock and its urban service area. There s as
The plan also talks about the future transfer of solid waste once the Cowlitzcounty landfill reaches capacity. Currently Waste Control Inc is the largest provider within the City of Castle
Other Utilities
Rare still some smaller private haulerwell.
This section discusses privately provided
tilities within the urban service area l lines,
lecommunication lines, cable lines, and
pment plans and
tility istrict No. 1. The PUD indicates
ample capacity to meet
an
rrounding area is rovided by Cascade Natural Gas.
f natural gas is
governed by the Federal Emergency Regulatory Commission, the National Office of Pipeline safety, and Washington
n
f local es to the City of
Castle Rock and its urban service
ere are a
nt
lines
CAP
usuch as electricatenatural gas lines. It should be noted that the City and utility providers should coordinate future develoenergy conservation efforts.
Electrical Electrical facilities are provided by Cowlitz County Public UDthat there isexisting demand for both the incorporated city limits and urbservice area. Natural Gas Delivery of natural gas to Castle Rock and its supThe delivery o
Utilities and TransportatioCommission.
Telecommunications MCI is the largest provider otelephone servic
ITAL FACILITY GOALS
area. Many of the telecommunication facilities, both aerial and underground, are co-located with those of the electricalpower provider. Thnumber of providers with fiber optic lines in Castle Rock. Spriand Williams have lines along Dougherty Drive; AT&T has along the railroad; and Adelphiaand Qwest have lines along A St SW.
Goal ll
ublic resources and maintain a high es,
orm drainage, and flood protection in
n city government
Goal 3: Balance capital facility service levels with resident’s income levels, coordinating the ability to provide
1: Maximize efficient use of apstandard of sewer and water servicstthe City. Goal 2: Further citizen participation i
services with the citizen’s abilities to payfor services.
City of Castle Rock VI-10 Comprehensive Plan 2006
Chapter VI Capital Facilities
CAPITAL FACILITY POLICIES Policy 1: Public facilities and services
aintenance and repair costs.
ment.
lated
should be the responsibility of the developer or, in some cases, a joint cost between developer and the City.
olicy 5: The city should apply for all
facilities.
should be designed and constructed to handle the anticipated growth of the
development
service area, and to minimize future m Policy 2: The ability of the city to maintain public facilities and servicesadequately should be evaluated in thereview of proposed new develop Policy 3: Sewer, water lines and refacilities needed to serve new
Policy 4: The City should update the Water and Sewer Comprehensive facility plans every five years. Pavailable state and federal grants and other funds to assist development and improvement of capital
City of Castle Rock VI-11 Comprehensive Plan 2006
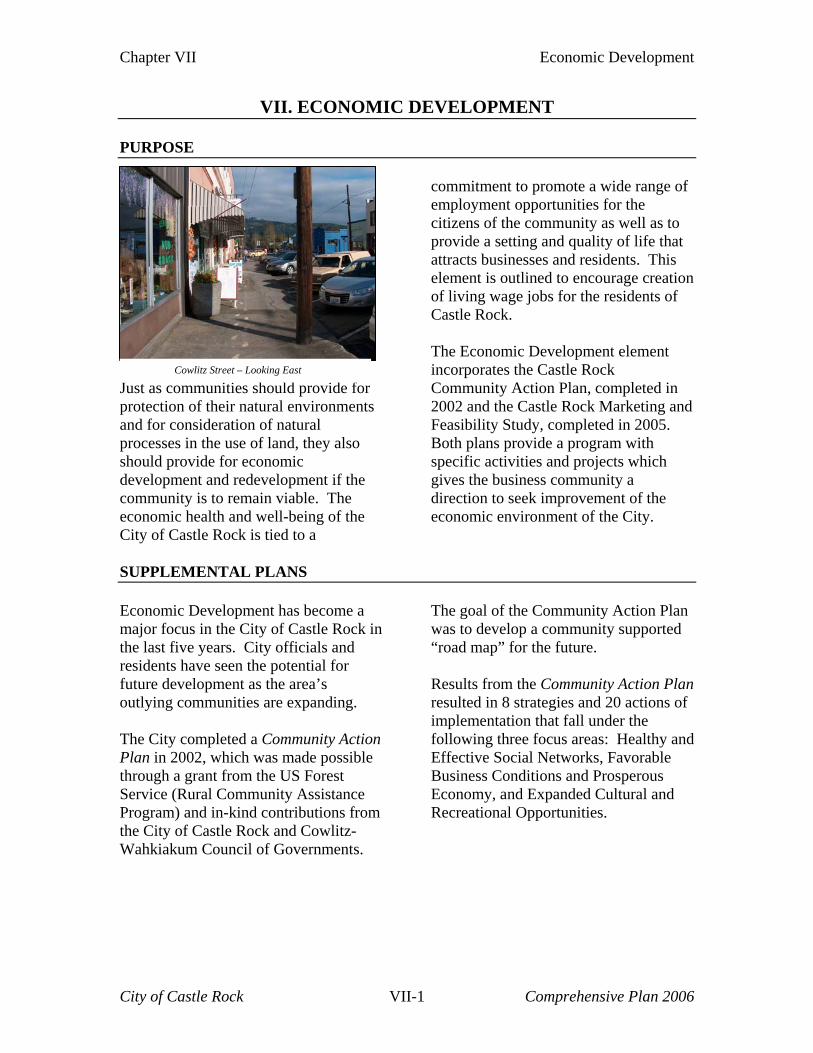
Chapter VII Economic Development
VII. ECONOMIC DEVELOPMENT PURPOSE
Just as communities should provide for protection of their natural environments and for consideration of natural processes in the use of land, they also should provide for economic development and redevelopment if the community is to remain viable. The economic health and well-being of the City of Castle Rock is tied to a
commitment to promote a wide range of employment opportunities for the citizens of the community as well as to provide a setting and quality of life that attracts businesses and residents. This element is outlined to encourage creation of living wage jobs for the residents of Castle Rock. The Economic Development element incorporates the Castle Rock Community Action Plan, completed in 2002 and the Castle Rock Marketing and Feasibility Study, completed in 2005. Both plans provide a program with specific activities and projects which gives the business community a direction to seek improvement of the economic environment of the City.
Cowlitz Street – Looking East
SUPPLEMENTAL PLANS Economic Development has become a major focus in the City of Castle Rock in the last five years. City officials and residents have seen the potential for future development as the area’s outlying communities are expanding. The City completed a Community Action Plan in 2002, which was made possible through a grant from the US Forest Service (Rural Community Assistance Program) and in-kind contributions from the City of Castle Rock and Cowlitz-Wahkiakum Council of Governments.
The goal of the Community Action Plan was to develop a community supported “road map” for the future. Results from the Community Action Plan resulted in 8 strategies and 20 actions of implementation that fall under the following three focus areas: Healthy and Effective Social Networks, Favorable Business Conditions and Prosperous Economy, and Expanded Cultural and Recreational Opportunities.
City of Castle Rock VII-1 Comprehensive Plan 2006
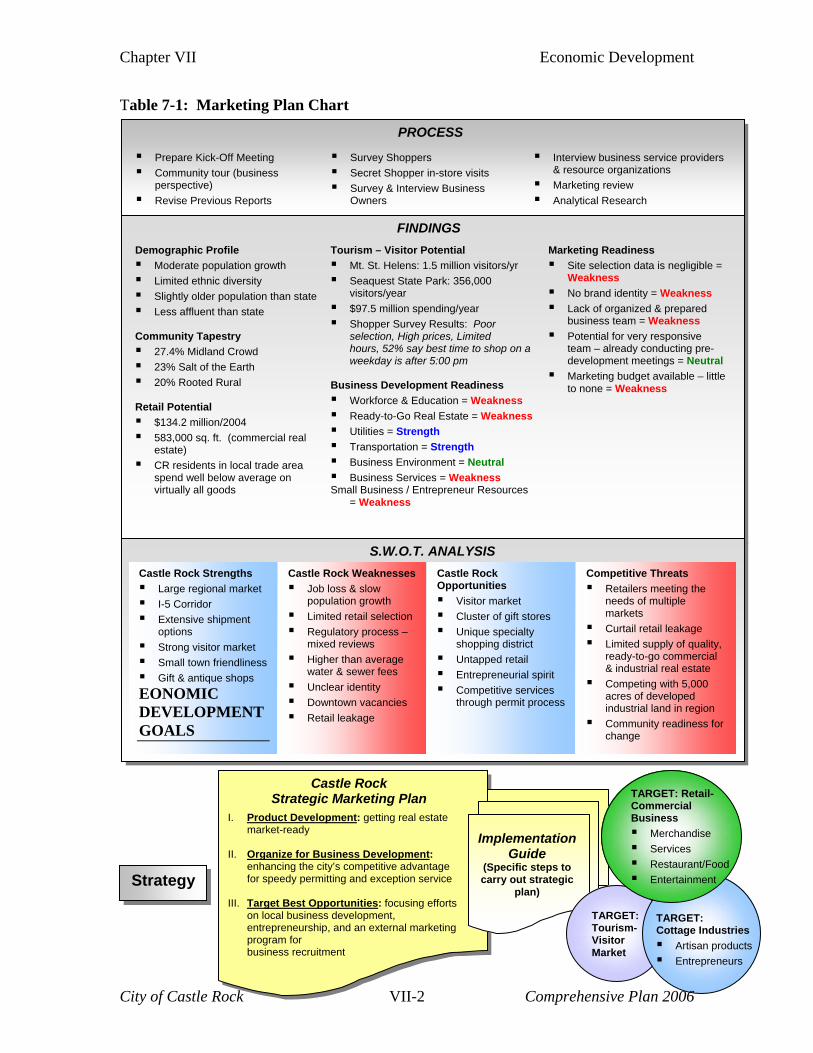
Chapter VII Economic Development
Table 7-1: Marketing Plan Chart
Prepare Kick-Off Meeting Community tour (business
perspective) Revise Previous Reports
Survey Shoppers Secret Shopper in-store visits Survey & Interview Business
Owners
Interview business service providers & resource organizations
Marketing review Analytical Research
PROCESS
FINDINGS Demographic Profile Moderate population growth Limited ethnic diversity Slightly older population than state Less affluent than state
Community Tapestry 27.4% Midland Crowd 23% Salt of the Earth 20% Rooted Rural
Retail Potential $134.2 million/2004 583,000 sq. ft. (commercial real
estate) CR residents in local trade area
spend well below average on virtually all goods
Tourism – Visitor Potential Mt. St. Helens: 1.5 million visitors/yr Seaquest State Park: 356,000
visitors/year $97.5 million spending/year Shopper Survey Results: Poor
selection, High prices, Limited hours, 52% say best time to shop on a weekday is after 5:00 pm
Business Development Readiness
eakness
ength
usiness Ser
Site selection datWeakness
Weaknessd & prepare
budget ava
Workforce & Education = W Ready-to-Go Real Estate = Weakness Utilities = Strength Transportation = Str Business Environment = Neutral B vices = Weakness
Small Business / Entrepreneur Resources = Weakness
Marketing Readiness a is negligible =
No brand identity = Lack of organize d
business team = Weakness Potential for very responsive
team – already conducting pre-development meetings = Neutral
Marketing ilable – little to none = Weakness
S.W.O.T. ANALYSIS Castle Rock Strengths Large regional market I-5 Corridor Extensive shipment
options Strong visitor market Small town friendliness Gift & antique shops
EONOMIC DEVELOPMENT GOALS
Castle Rock Weaknesses Job loss & slow
population growth Limited retail selection Regulatory process –
mixed reviews Higher than average
water & sewer fees Unclear identity Downtown vacancies Retail leakage
Castle Rock Opportunities Visitor market Cluster of gift stores Unique specialty
shopping district Untapped retail Entrepreneurial spirit Competitive services
through permit process
Competitive Threats Retailers meeting the
needs of multiple markets
Curtail retail leakage Limited supply of quality,
ready-to-go commercial & industrial real estate
Competing with 5,000 acres of developed industrial land in region
Community readiness for change
Castle Rock Strategic Marketing Plan
I. Product Development: getting real estate market-ready
II. Organize for Business Development:
enhancing the city’s competitive advantage for speedy permitting and exception service
III. Target Best Opportunities: focusing efforts
on local business development, entrepreneurship, and an external marketing program for business recruitment
Implementation Guide
(Specific steps to carry out strategic
plan)
TARGET: Tourism-Visitor Market
TARGET: Retail-Commercial Business Merchandise Services Restaurant/Food EntertainmentStrategy
TARGET: Cottage Industries Artisan products Entrepreneurs
City of Castle Rock VII-2 Comprehensive Plan 2006
Chapter VII Economic Development
In implementing the Community Action Plan, the Castle Rock City Council identified the focus areas of “Favorable Business Conditions and Prosperous Economy” as the top priority. As a result, grants were procured from the Washington State Department of Trade and Economic Development (CTED) and the United States Department of Agriculture (USDA) Forest Service to fund a Business Feasibility Analysis and Marketing Plan. The Business Feasibility Analysis and Marketing Plan assessed Castle Rock’s readiness for business development, shown in Table 7-1, which was categorized into strengths or advantages, weaknesses or disadvantages, and opportunities and potential threats that would impede success. From this analysis of business feasibility a Strategic Marketing Plan was created. The Marketing Plan recommends three strategic initiatives for Castle Rock to successfully achieve their goals; Produce Readiness, Organize for Business Development, and Target Best Opportunities. Strategic Initiative 1: Product Readiness
• Make Castle Rock’s industrial and commercial real estate product offerings market-ready and enable Castle Rock to effectively compete for targeted businesses.
• Present a welcoming and inviting image for visitors and tourists
This initiative addresses necessary improvements to enhance industrial and commercial real estate and buildings in
order to make Castle Rock competitive in the regional market. Additional actions are directed to upgrading Castle Rock’s image in the eye of visitors and tourists. The community needs adequate physical locations to accommodate new businesses. Currently the City only has one industrial site, the Hornstra property, for major industrial development. There are no industrial or business parks and no industrial buildings available for lease. Regionally, there is much competition for industrial sites, with other areas having ready-to-go sites. Office space is limited and selected retail/commercial spaces are for rent but are not in ready-for-market condition. Strategic Initiative 2; Organize for Business Development
• Ensure the City’s development review, fee schedule and other regulatory processes, are streamlined and clearly articulated with a reputation for exceptional service, such that businesses and developers will say: “Castle Rock is a little city with the best development process and location assistance in the state; there were no surprises”
• Mobilize a proactive Business Team to facilitate positive business climate and support business recruitment and expansion efforts.
This initiative deals with assisting businesses seeking a location, as well as presenting a clear and consistent permitting process with competitive fee schedules.
City of Castle Rock VII-3 Comprehensive Plan 2006
Chapter VII Economic Development
Currently the City offers pre-development meetings with businesses to review projects, discuss options, answer questions and present anticipated fees and costs for development. This is a cost to developers, and the water and sewer rates of the city come in higher than the state average. Strategic Initiative 3: Target Best Opportunities
• Support local businesses to prosper and expand
• Encourage entrepreneurship to strengthen the business community and engage Castle Rock’s youth
• Augment Castle Rock’s retail and service offering to reduce sales leakage and increase sales tax revenues
• Implement a focused external marketing program to recruit a campground or recreational vehicle park developer and operator
• Create awareness of Castle Rock in the minds of commercial and industrial targets
This initiative will help to cultivate the best opportunities to grow business, jobs and wealth creation in Castle Rock. It is focused on the greatest impact for your investment of time and money. The actions associated with this strategic initiative will promote local business development, spur entrepreneurship, and recruit targeted businesses to Castle Rock. Currently Castle Rock’s businesses are underserved with business resources. Employers have no where to seek resources such as business counseling, financing tools, and hiring/training services. There are also no networking groups within the City or surrounding areas. The City’s goal is to continue working toward implementation of the above ideas, improving the local economy as they go. For more information, refer to the Castle Rock Community Action Plan and the Castle Rock Business Feasibility Analysis and Marketing Plan.
EXISTING CONDITIONS & INFORMATION This section provides an analysis of current trends in population and employment. The purpose of this analysis is to establish a baseline understanding of the character and direction of Castle Rock’s economy, including demographic turns, spending patterns, labor force composition, and industries which are prevalent. All of these features viewed together provide a broad overview of Castle Rock’s economy, upon which policies and programs related to economic development should be based.
For most of Castle Rock’s history, its economic health has been tied directly to the timber industry. Logging has been the mainstay of the city’s economy, focusing on the processing and exporting of forest resources. With timber practices being dominant in Castle Rock and Cowlitz County, the recent downturn in the industry has hurt local economies. Castle Rock has expanded its employment opportunities for services, retail, and wholesale and needs to continue exploring new economic mainstays for the community.
City of Castle Rock VII-4 Comprehensive Plan 2006
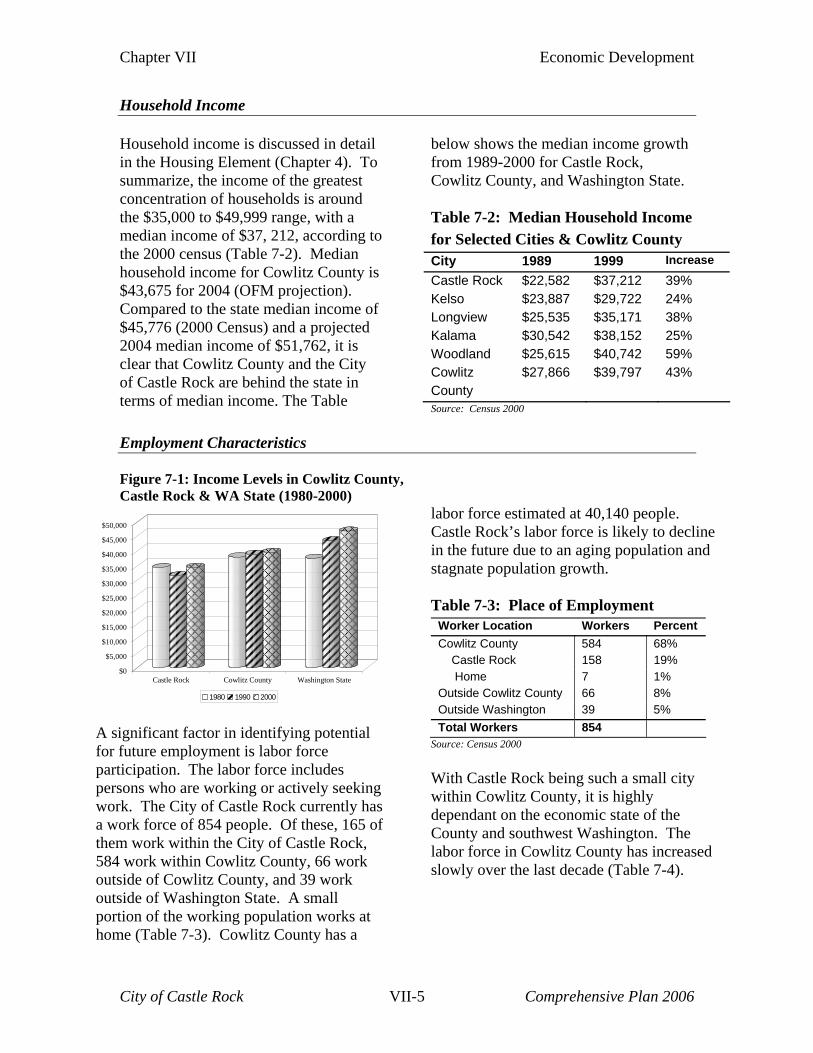
Chapter VII Economic Development
Household Income Household income is discussed in detail in the Housing Element (Chapter 4). To summarize, the income of the greatest concentration of households is around the $35,000 to $49,999 range, with a median income of $37, 212, according to the 2000 census (Table 7-2). Median household income for Cowlitz County is $43,675 for 2004 (OFM projection). Compared to the state median income of $45,776 (2000 Census) and a projected 2004 median income of $51,762, it is clear that Cowlitz County and the City of Castle Rock are behind the state in terms of median income. The Table
below shows the median income growth from 1989-2000 for Castle Rock, Cowlitz County, and Washington State. Table 7-2: Median Household Income for Selected Cities & Cowlitz County City 1989 1999 Increase
Castle Rock $22,582 $37,212 39% Kelso $23,887 $29,722 24% Longview $25,535 $35,171 38% Kalama $30,542 $38,152 25% Woodland $25,615 $40,742 59% Cowlitz County
$27,866 $39,797 43%
Source: Census 2000 Employment Characteristics Figure 7-1: Income Levels in Cowlitz County, Castle Rock & WA State (1980-2000)
A significant factor in identifying potential for future employment is labor force participation. The labor force includes persons who are working or actively seeking work. The City of Castle Rock currently has a work force of 854 people. Of these, 165 of them work within the City of Castle Rock, 584 work within Cowlitz County, 66 work outside of Cowlitz County, and 39 work outside of Washington State. A small portion of the working population works at home (Table 7-3). Cowlitz County has a
labor force estimated at 40,140 people. Castle Rock’s labor force is likely to decline in the future due to an aging population and stagnate population growth.
$0
$5,000
$10,000
$15,000
$20,000
$25,000
$30,000
$35,000
$40,000
$45,000
$50,000
Castle Rock Cowlitz County Washington State
1980 1990 2000
Table 7-3: Place of Employment
Worker Location Workers Percent Cowlitz County 584 68% Castle Rock 158 19% Home 7 1% Outside Cowlitz County 66 8% Outside Washington 39 5% Total Workers 854
Source: Census 2000 With Castle Rock being such a small city within Cowlitz County, it is highly dependant on the economic state of the County and southwest Washington. The labor force in Cowlitz County has increased slowly over the last decade (Table 7-4).
City of Castle Rock VII-5 Comprehensive Plan 2006
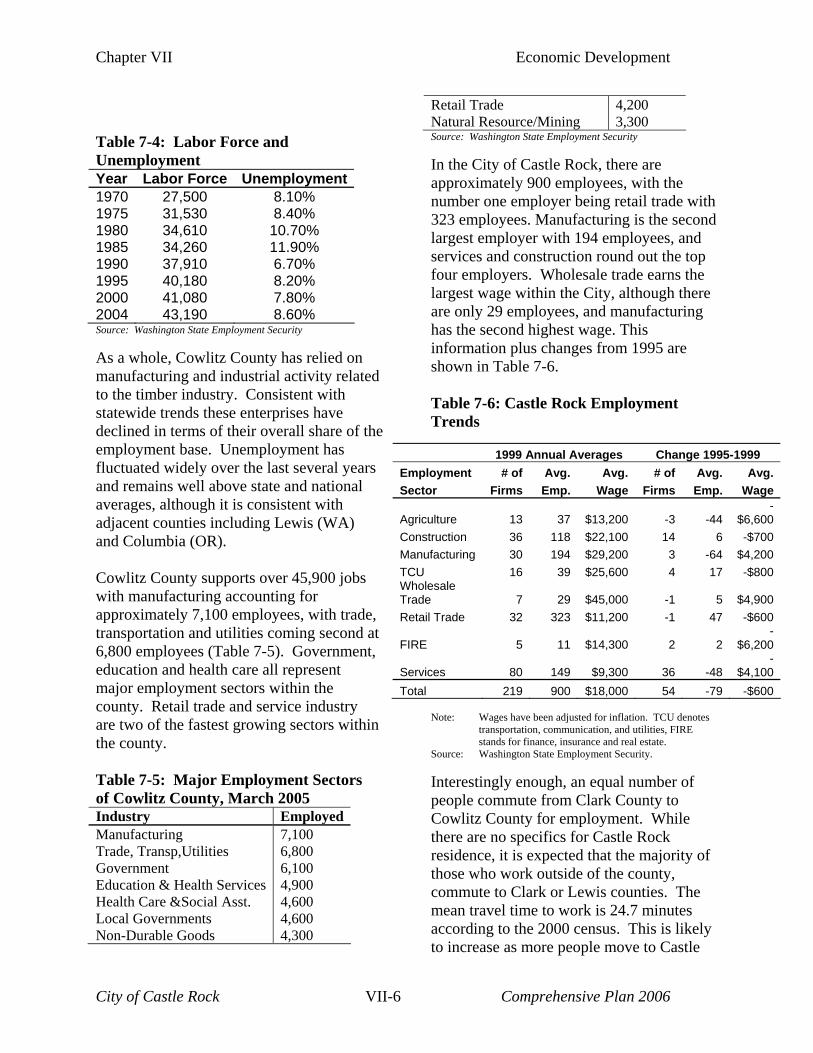
Chapter VII Economic Development
Table 7-4: Labor Force and Unemployment Year Labor Force Unemployment1970 27,500 8.10% 1975 31,530 8.40% 1980 34,610 10.70% 1985 34,260 11.90% 1990 37,910 6.70% 1995 40,180 8.20% 2000 41,080 7.80% 2004 43,190 8.60% Source: Washington State Employment Security As a whole, Cowlitz County has relied on manufacturing and industrial activity related to the timber industry. Consistent with statewide trends these enterprises have declined in terms of their overall share of the employment base. Unemployment has fluctuated widely over the last several years and remains well above state and national averages, although it is consistent with adjacent counties including Lewis (WA) and Columbia (OR). Cowlitz County supports over 45,900 jobs with manufacturing accounting for approximately 7,100 employees, with trade, transportation and utilities coming second at 6,800 employees (Table 7-5). Government, education and health care all represent major employment sectors within the county. Retail trade and service industry are two of the fastest growing sectors within the county. Table 7-5: Major Employment Sectors of Cowlitz County, March 2005 Industry EmployedManufacturing 7,100 Trade, Transp,Utilities 6,800 Government 6,100 Education & Health Services 4,900 Health Care &Social Asst. 4,600 Local Governments 4,600 Non-Durable Goods 4,300
Retail Trade 4,200 Natural Resource/Mining 3,300 Source: Washington State Employment Security In the City of Castle Rock, there are approximately 900 employees, with the number one employer being retail trade with 323 employees. Manufacturing is the second largest employer with 194 employees, and services and construction round out the top four employers. Wholesale trade earns the largest wage within the City, although there are only 29 employees, and manufacturing has the second highest wage. This information plus changes from 1995 are shown in Table 7-6. Table 7-6: Castle Rock Employment Trends
Note: Wages have been adjusted for inflation. TCU denotes
transportation, communication, and utilities, FIRE stands for finance, insurance and real estate.
Source: Washington State Employment Security. Interestingly enough, an equal number of people commute from Clark County to Cowlitz County for employment. While there are no specifics for Castle Rock residence, it is expected that the majority of those who work outside of the county, commute to Clark or Lewis counties. The mean travel time to work is 24.7 minutes according to the 2000 census. This is likely to increase as more people move to Castle
1999 Annual Averages Change 1995-1999 Employment # of Avg. Avg. # of Avg. Avg. Sector Firms Emp. Wage Firms Emp. Wage
Agriculture 13 37 $13,200 -3 -44 -
$6,600 Construction 36 118 $22,100 14 6 -$700 Manufacturing 30 194 $29,200 3 -64 $4,200 TCU 16 39 $25,600 4 17 -$800 Wholesale Trade 7 29 $45,000 -1 5 $4,900 Retail Trade 32 323 $11,200 -1 47 -$600
FIRE 5 11 $14,300 2 2 -
$6,200
Services 80 149 $9,300 36 -48 -
$4,100 Total 219 900 $18,000 54 -79 -$600
City of Castle Rock VII-6 Comprehensive Plan 2006
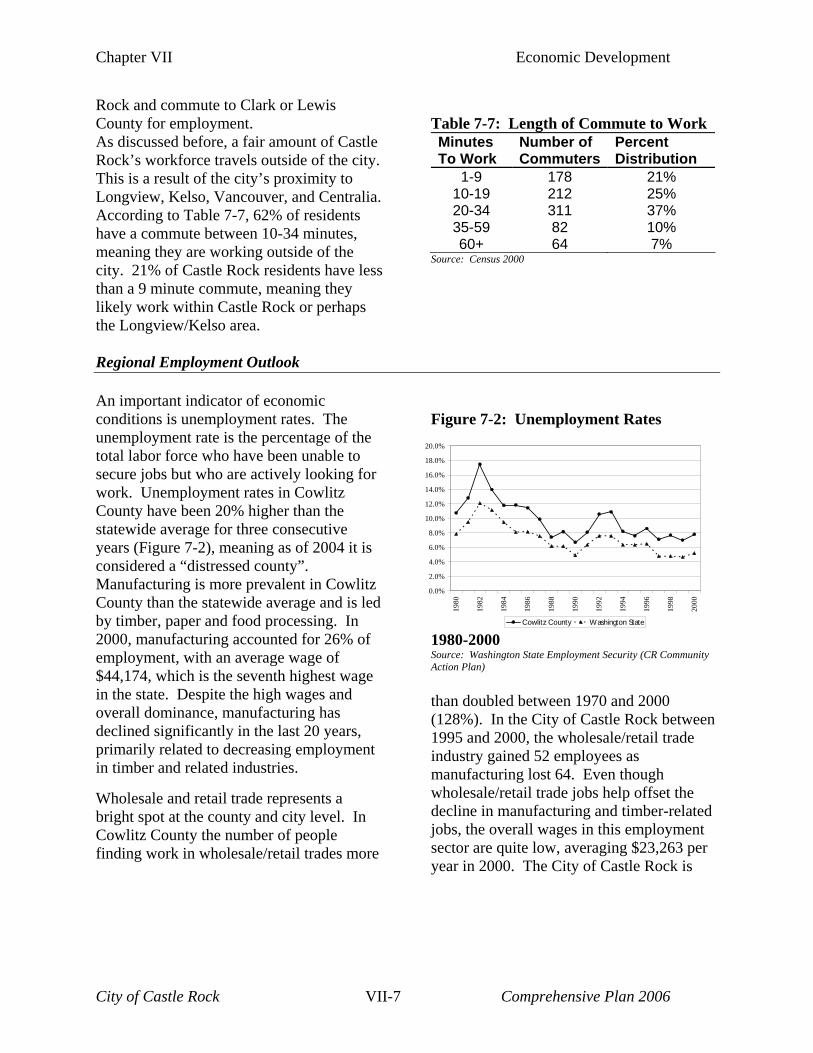
Chapter VII Economic Development
Rock and commute to Clark or Lewis County for employment. As discussed before, a fair amount of Castle Rock’s workforce travels outside of the city. This is a result of the city’s proximity to Longview, Kelso, Vancouver, and Centralia. According to Table 7-7, 62% of residents have a commute between 10-34 minutes, meaning they are working outside of the city. 21% of Castle Rock residents have less than a 9 minute commute, meaning they likely work within Castle Rock or perhaps the Longview/Kelso area.
Table 7-7: Length of Commute to Work Minutes To Work
Number of Commuters
Percent Distribution
1-9 178 21% 10-19 212 25% 20-34 311 37% 35-59 82 10% 60+ 64 7%
Source: Census 2000
Regional Employment Outlook An important indicator of economic conditions is unemployment rates. The unemployment rate is the percentage of the total labor force who have been unable to secure jobs but who are actively looking for work. Unemployment rates in Cowlitz County have been 20% higher than the statewide average for three consecutive years (Figure 7-2), meaning as of 2004 it is considered a “distressed county”. Manufacturing is more prevalent in Cowlitz County than the statewide average and is led by timber, paper and food processing. In 2000, manufacturing accounted for 26% of employment, with an average wage of $44,174, which is the seventh highest wage in the state. Despite the high wages and overall dominance, manufacturing has declined significantly in the last 20 years, primarily related to decreasing employment in timber and related industries.
0.0%
2.0%
4.0%
6.0%
8.0%
10.0%
12.0%
14.0%
16.0%
18.0%
20.0%19
80
1982
1984
1986
1988
1990
1992
1994
1996
1998
2000
Cowlitz County Washington State
Wholesale and retail trade represents a bright spot at the county and city level. In Cowlitz County the number of people finding work in wholesale/retail trades more
Figure 7-2: Unemployment Rates
1980-2000 Source: Washington State Employment Security (CR Community Action Plan) than doubled between 1970 and 2000 (128%). In the City of Castle Rock between 1995 and 2000, the wholesale/retail trade industry gained 52 employees as manufacturing lost 64. Even though wholesale/retail trade jobs help offset the decline in manufacturing and timber-related jobs, the overall wages in this employment sector are quite low, averaging $23,263 per year in 2000. The City of Castle Rock is
City of Castle Rock VII-7 Comprehensive Plan 2006
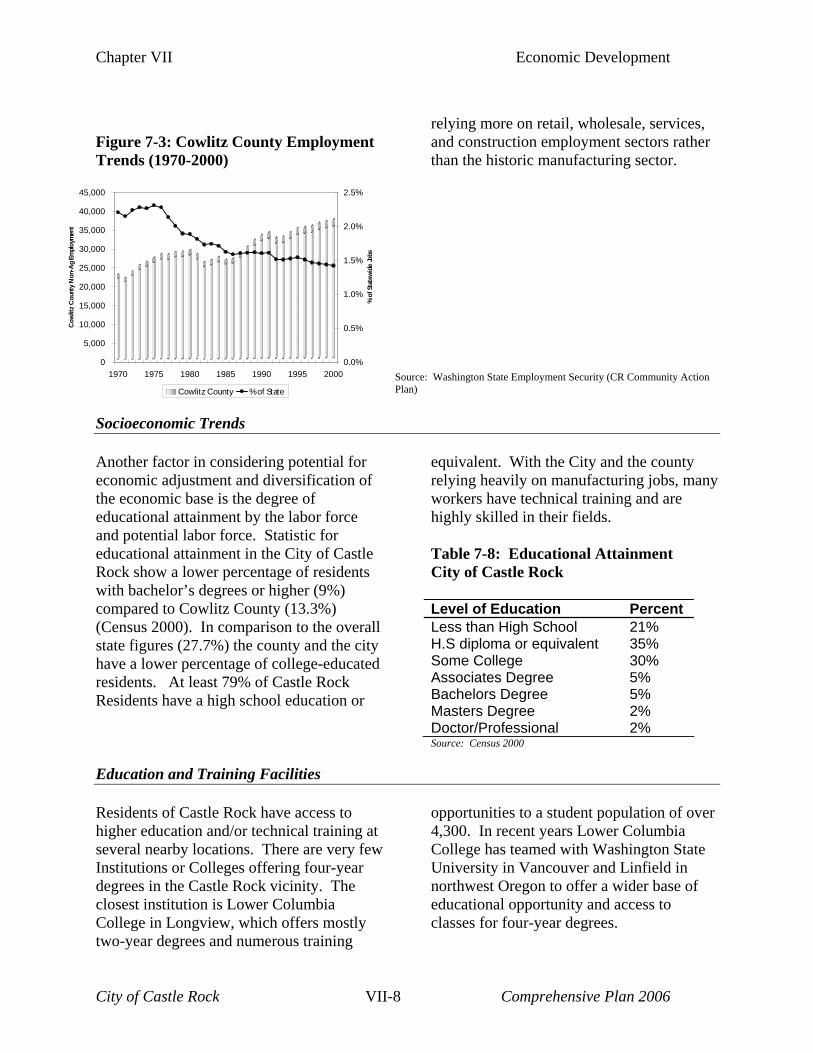
Chapter VII Economic Development
Figure 7-3: Cowlitz County Employment Trends (1970-2000)
relying more on retail, wholesale, services, and construction employment sectors rather than the historic manufacturing sector.
0
5,000
10,000
15,000
20,000
25,000
30,000
35,000
40,000
45,000
1970 1975 1980 1985 1990 1995 2000
Cow
litz C
ount
y N
on-A
g Em
ploy
men
t
0.0%
0.5%
1.0%
1.5%
2.0%
2.5%
% of
Sta
tew
ide
Jobs
Cowlitz County % of State
Source: Washington State Employment Security (CR Community Action Plan)
Socioeconomic Trends Another factor in considering potential for economic adjustment and diversification of the economic base is the degree of educational attainment by the labor force and potential labor force. Statistic for educational attainment in the City of Castle Rock show a lower percentage of residents with bachelor’s degrees or higher (9%) compared to Cowlitz County (13.3%) (Census 2000). In comparison to the overall state figures (27.7%) the county and the city have a lower percentage of college-educated residents. At least 79% of Castle Rock Residents have a high school education or
equivalent. With the City and the county relying heavily on manufacturing jobs, many workers have technical training and are highly skilled in their fields. Table 7-8: Educational Attainment City of Castle Rock Level of Education Percent Less than High School 21% H.S diploma or equivalent 35% Some College 30% Associates Degree 5% Bachelors Degree 5% Masters Degree 2% Doctor/Professional 2% Source: Census 2000
Education and Training Facilities Residents of Castle Rock have access to higher education and/or technical training at several nearby locations. There are very few Institutions or Colleges offering four-year degrees in the Castle Rock vicinity. The closest institution is Lower Columbia College in Longview, which offers mostly two-year degrees and numerous training
opportunities to a student population of over 4,300. In recent years Lower Columbia College has teamed with Washington State University in Vancouver and Linfield in northwest Oregon to offer a wider base of educational opportunity and access to classes for four-year degrees.
City of Castle Rock VII-8 Comprehensive Plan 2006
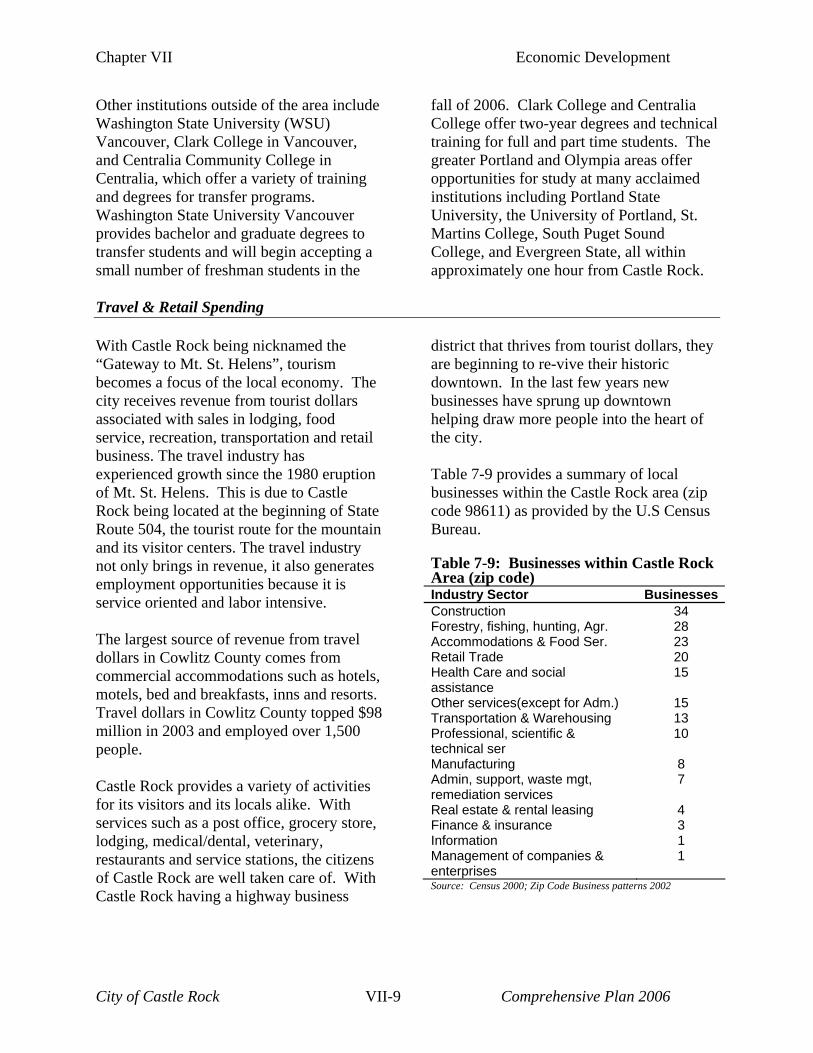
Chapter VII Economic Development
Other institutions outside of the area include Washington State University (WSU) Vancouver, Clark College in Vancouver, and Centralia Community College in Centralia, which offer a variety of training and degrees for transfer programs. Washington State University Vancouver provides bachelor and graduate degrees to transfer students and will begin accepting a small number of freshman students in the
fall of 2006. Clark College and Centralia College offer two-year degrees and technical training for full and part time students. The greater Portland and Olympia areas offer opportunities for study at many acclaimed institutions including Portland State University, the University of Portland, St. Martins College, South Puget Sound College, and Evergreen State, all within approximately one hour from Castle Rock.
Travel & Retail Spending With Castle Rock being nicknamed the “Gateway to Mt. St. Helens”, tourism becomes a focus of the local economy. The city receives revenue from tourist dollars associated with sales in lodging, food service, recreation, transportation and retail business. The travel industry has experienced growth since the 1980 eruption of Mt. St. Helens. This is due to Castle Rock being located at the beginning of State Route 504, the tourist route for the mountain and its visitor centers. The travel industry not only brings in revenue, it also generates employment opportunities because it is service oriented and labor intensive. The largest source of revenue from travel dollars in Cowlitz County comes from commercial accommodations such as hotels, motels, bed and breakfasts, inns and resorts. Travel dollars in Cowlitz County topped $98 million in 2003 and employed over 1,500 people. Castle Rock provides a variety of activities for its visitors and its locals alike. With services such as a post office, grocery store, lodging, medical/dental, veterinary, restaurants and service stations, the citizens of Castle Rock are well taken care of. With Castle Rock having a highway business
district that thrives from tourist dollars, they are beginning to re-vive their historic downtown. In the last few years new businesses have sprung up downtown helping draw more people into the heart of the city. Table 7-9 provides a summary of local businesses within the Castle Rock area (zip code 98611) as provided by the U.S Census Bureau. Table 7-9: Businesses within Castle Rock Area (zip code) Industry Sector BusinessesConstruction 34 Forestry, fishing, hunting, Agr. 28 Accommodations & Food Ser. 23 Retail Trade 20 Health Care and social assistance
15
Other services(except for Adm.) 15 Transportation & Warehousing 13 Professional, scientific & technical ser
10
Manufacturing 8 Admin, support, waste mgt, remediation services
7
Real estate & rental leasing 4 Finance & insurance 3 Information 1 Management of companies & enterprises
1
Source: Census 2000; Zip Code Business patterns 2002
City of Castle Rock VII-9 Comprehensive Plan 2006
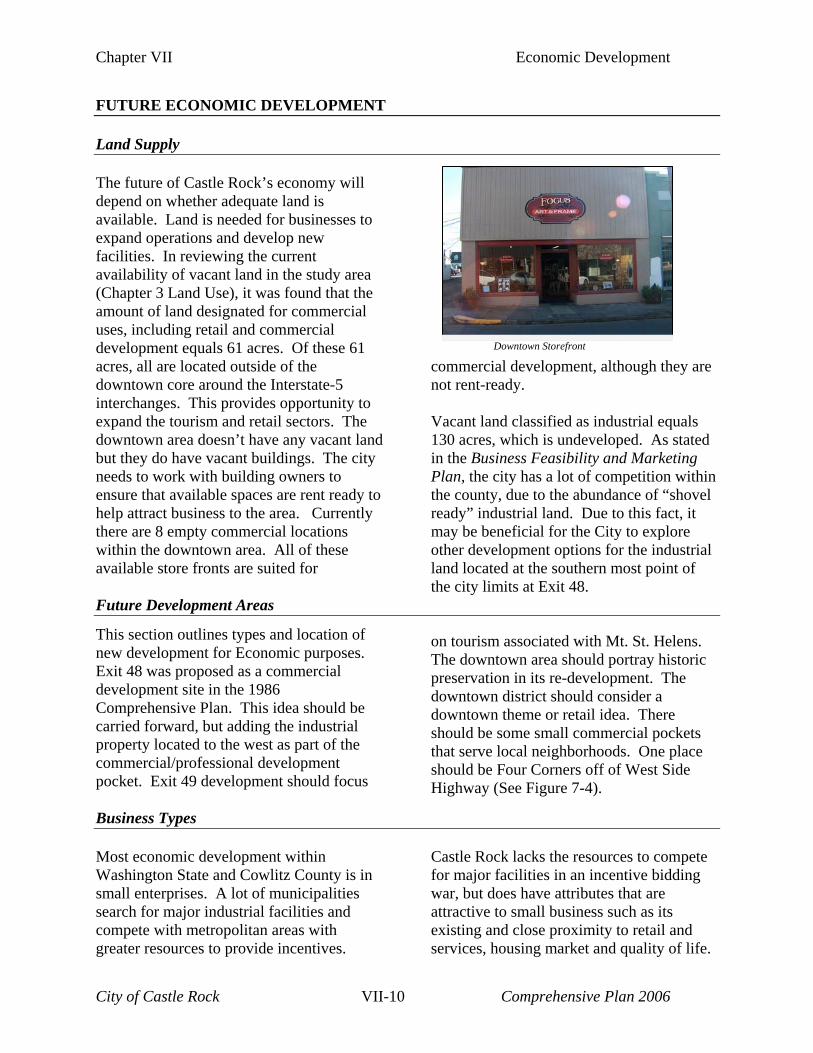
Chapter VII Economic Development
FUTURE ECONOMIC DEVELOPMENT Land Supply The future of Castle Rock’s economy will depend on whether adequate land is available. Land is needed for businesses to expand operations and develop new facilities. In reviewing the current availability of vacant land in the study area (Chapter 3 Land Use), it was found that the amount of land designated for commercial uses, including retail and commercial development equals 61 acres. Of these 61 acres, all are located outside of the downtown core around the Interstate-5 interchanges. This provides opportunity to expand the tourism and retail sectors. The downtown area doesn’t have any vacant land but they do have vacant buildings. The city needs to work with building owners to ensure that available spaces are rent ready to help attract business to the area. Currently there are 8 empty commercial locations within the downtown area. All of these available store fronts are suited for
commercial development, although they are not rent-ready.
Downtown Storefront
Vacant land classified as industrial equals 130 acres, which is undeveloped. As stated in the Business Feasibility and Marketing Plan, the city has a lot of competition within the county, due to the abundance of “shovel ready” industrial land. Due to this fact, it may be beneficial for the City to explore other development options for the industrial land located at the southern most point of the city limits at Exit 48.
Future Development Areas This section outlines types and location of new development for Economic purposes. Exit 48 was proposed as a commercial development site in the 1986 Comprehensive Plan. This idea should be carried forward, but adding the industrial property located to the west as part of the commercial/professional development pocket. Exit 49 development should focus
on tourism associated with Mt. St. Helens. The downtown area should portray historic preservation in its re-development. The downtown district should consider a downtown theme or retail idea. There should be some small commercial pockets that serve local neighborhoods. One place should be Four Corners off of West Side Highway (See Figure 7-4).
Business Types Most economic development within Washington State and Cowlitz County is in small enterprises. A lot of municipalities search for major industrial facilities and compete with metropolitan areas with greater resources to provide incentives.
Castle Rock lacks the resources to compete for major facilities in an incentive bidding war, but does have attributes that are attractive to small business such as its existing and close proximity to retail and services, housing market and quality of life.
City of Castle Rock VII-10 Comprehensive Plan 2006
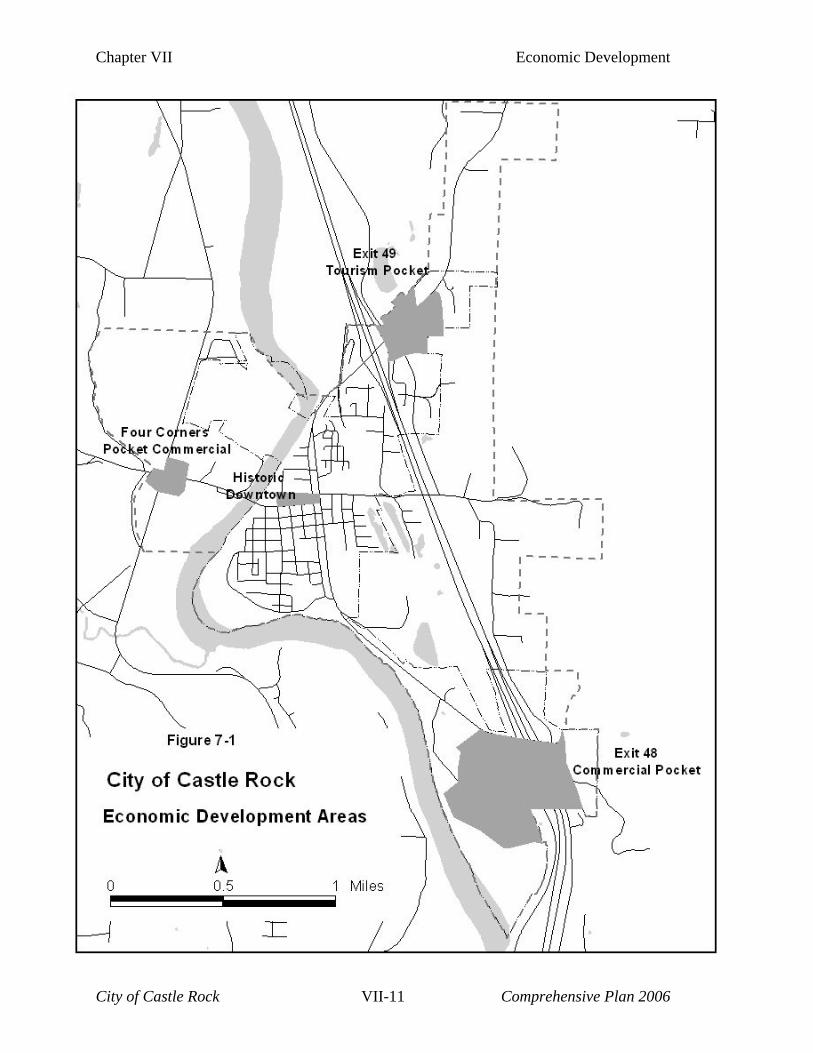
Chapter VII Economic Development
City of Castle Rock VII-11 Comprehensive Plan 2006
Chapter VII Economic Development
Rather than pursuing big new developments, the City should build on economic clusters and develop a program to attract new and fast growing small businesses. Not only would this bring in new business, it would help existing businesses expand. There are several advantages to maintaining a small business network. Small businesses value a
supportive city environment and hire locally, while many large employers bring in employees from outside the area. Small local businesses support the local economy. Their wages and profits tend to be circulated locally, producing a local effect for retail and services.
EONOMIC DEVELOPMENT GOALS Goal 1: Take steps to be the “gateway”, “staging area”, and shopping and supply base for tourists embarking up the Spirit Lake Highway corridor to Mount St. Helens related attractions. Goal 2: Ensure sustained economic growth, and increase employment opportunities. Goal 3: Ensure that the public facilities and services necessary to attract and support economic development are available and adequate. Goal 4: Develop and secure Castle Rock’s position as the commercial center serving northern Cowlitz County. Goal 5: Bring about redevelopment of Downtown Castle Rock in a partnership of the City, downtown business, property owners, and community interest groups.
Goal 6: Encourage a regional economic development strategy. Goal 7: Work toward implementation of the Castle Rock Community Action Plan (2002) and the Business Feasibility and Marketing Plan (2004). Goal 8: Encourage the creation of family-wage jobs in and around Castle Rock. Goal 9: Attain an improved level of commercial and service activities in the City. Goal 10: Make Castle Rock’s industrial and commercial real estate product offerings market ready, enabling Castle Rock to effectively compete for targeted businesses. Goal 11: Encourage entrepreneurship to strengthen the business community and engage Castle Rock’s youth.
ECONOMIC DEVELOPMENT POLICIES Policy 1: The city should work with Washington State Department of Transportation to ensure adequate signage is in place to alert visitors of the amenities provided. Policy 2: Work closely with Castle Rock Chamber of Commerce, and the Castle Rock
Community Action Plan Implementation Committee to implement economic development strategies specified in the Action Plan and Marketing Plan. Policy 3: Research and structure an array of new incentives to help recruit desired
City of Castle Rock VII-12 Comprehensive Plan 2006
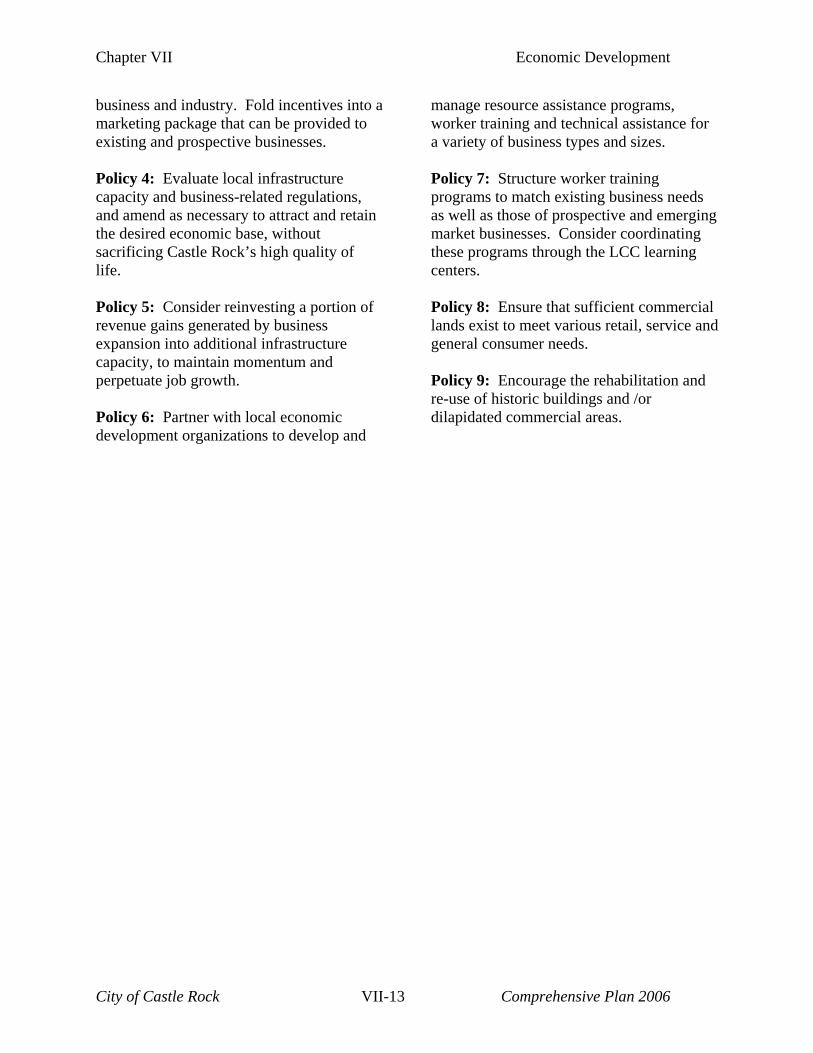
Chapter VII Economic Development
business and industry. Fold incentives into a marketing package that can be provided to existing and prospective businesses. Policy 4: Evaluate local infrastructure capacity and business-related regulations, and amend as necessary to attract and retain the desired economic base, without sacrificing Castle Rock’s high quality of life. Policy 5: Consider reinvesting a portion of revenue gains generated by business expansion into additional infrastructure capacity, to maintain momentum and perpetuate job growth. Policy 6: Partner with local economic development organizations to develop and
manage resource assistance programs, worker training and technical assistance for a variety of business types and sizes. Policy 7: Structure worker training programs to match existing business needs as well as those of prospective and emerging market businesses. Consider coordinating these programs through the LCC learning centers. Policy 8: Ensure that sufficient commercial lands exist to meet various retail, service and general consumer needs. Policy 9: Encourage the rehabilitation and re-use of historic buildings and /or dilapidated commercial areas.
City of Castle Rock VII-13 Comprehensive Plan 2006
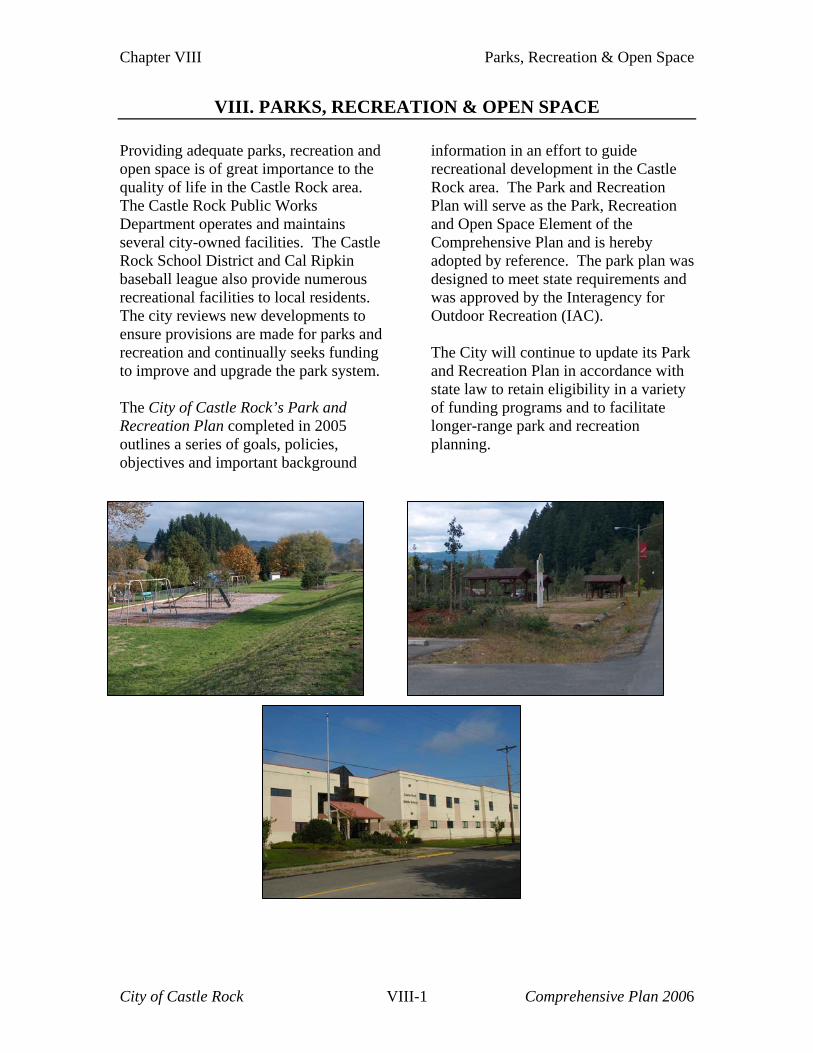
Chapter VIII Parks, Recreation & Open Space
VIII. PARKS, RECREATION & OPEN SPACE Providing adequate parks, recreation and open space is of great importance to the quality of life in the Castle Rock area. The Castle Rock Public Works Department operates and maintains several city-owned facilities. The Castle Rock School District and Cal Ripkin baseball league also provide numerous recreational facilities to local residents. The city reviews new developments to ensure provisions are made for parks and recreation and continually seeks funding to improve and upgrade the park system. The City of Castle Rock’s Park and Recreation Plan completed in 2005 outlines a series of goals, policies, objectives and important background
information in an effort to guide recreational development in the Castle Rock area. The Park and Recreation Plan will serve as the Park, Recreation and Open Space Element of the Comprehensive Plan and is hereby adopted by reference. The park plan was designed to meet state requirements and was approved by the Interagency for Outdoor Recreation (IAC). The City will continue to update its Park and Recreation Plan in accordance with state law to retain eligibility in a variety of funding programs and to facilitate longer-range park and recreation planning.
City of Castle Rock VIII-1 Comprehensive Plan 2006