Embed Size (px)
Citation preview
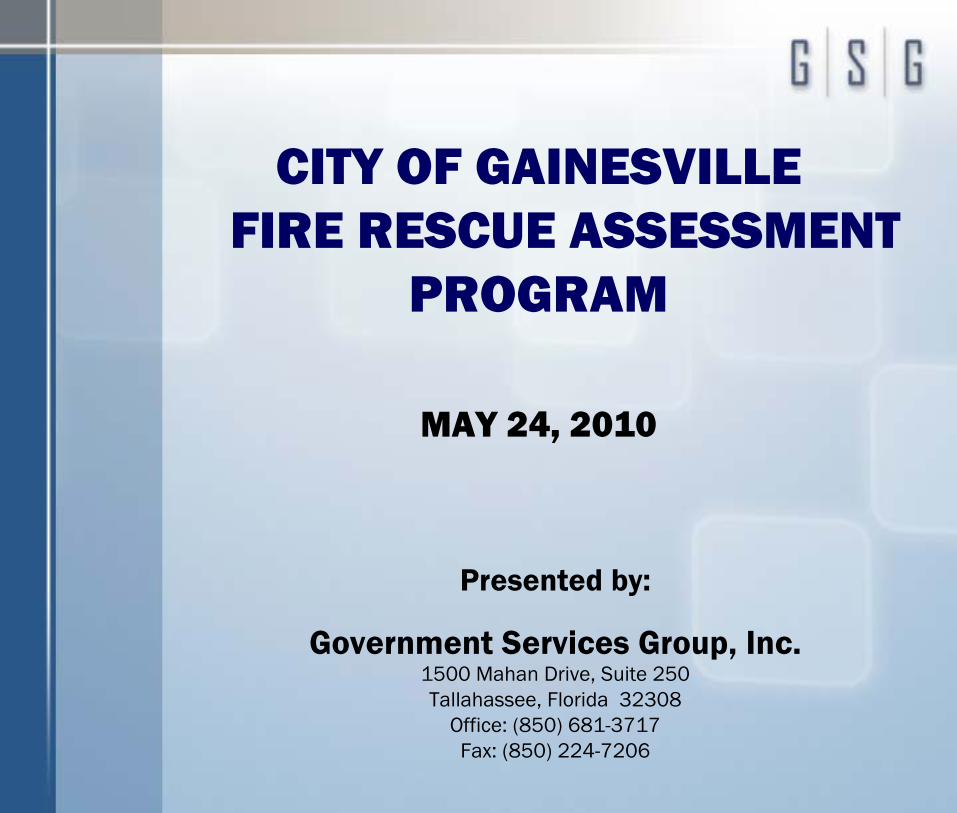
Presented by:
Government Services Group, Inc.1500 Mahan Drive, Suite 250Tallahassee, Florida 32308
Office: (850) 681-3717Fax: (850) 224-7206
CITY OF GAINESVILLE FIRE RESCUE ASSESSMENT
PROGRAM
MAY 24, 2010
2
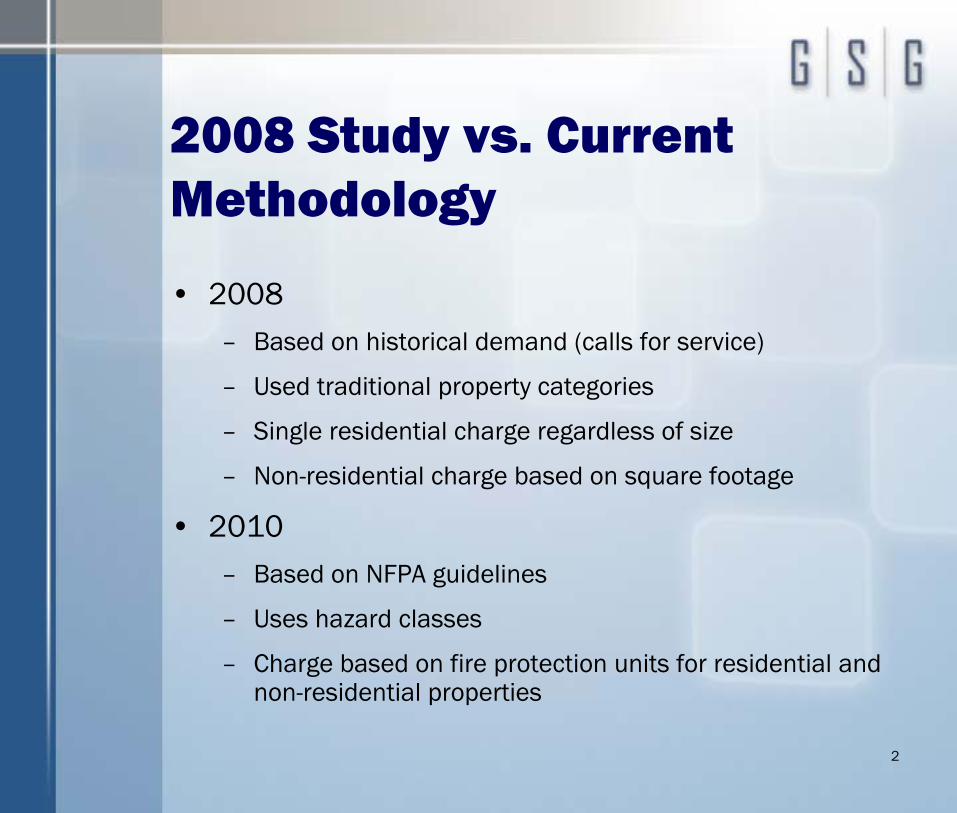
2008 Study vs. Current Methodology
• 2008– Based on historical demand (calls for service)
– Used traditional property categories
– Single residential charge regardless of size
– Non-residential charge based on square footage
• 2010– Based on NFPA guidelines
– Uses hazard classes
– Charge based on fire protection units for residential and non-residential properties
3
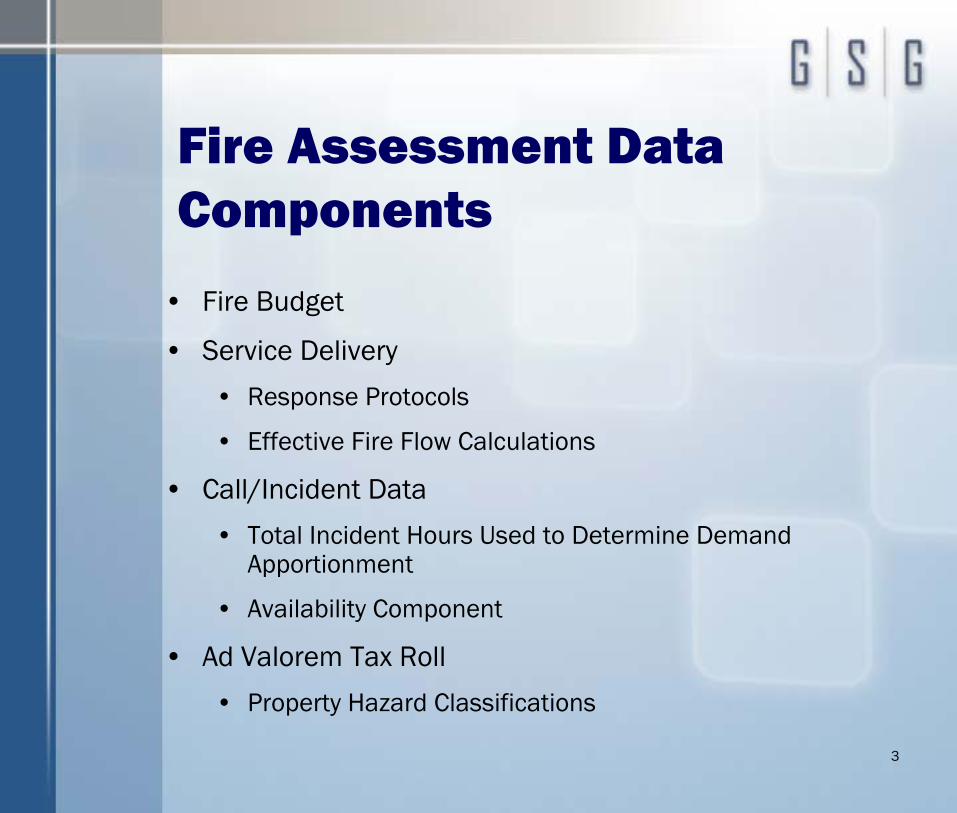
Fire Assessment Data Components
• Fire Budget
• Service Delivery
• Response Protocols
• Effective Fire Flow Calculations
• Call/Incident Data
• Total Incident Hours Used to Determine Demand Apportionment
• Availability Component
• Ad Valorem Tax Roll
• Property Hazard Classifications
4
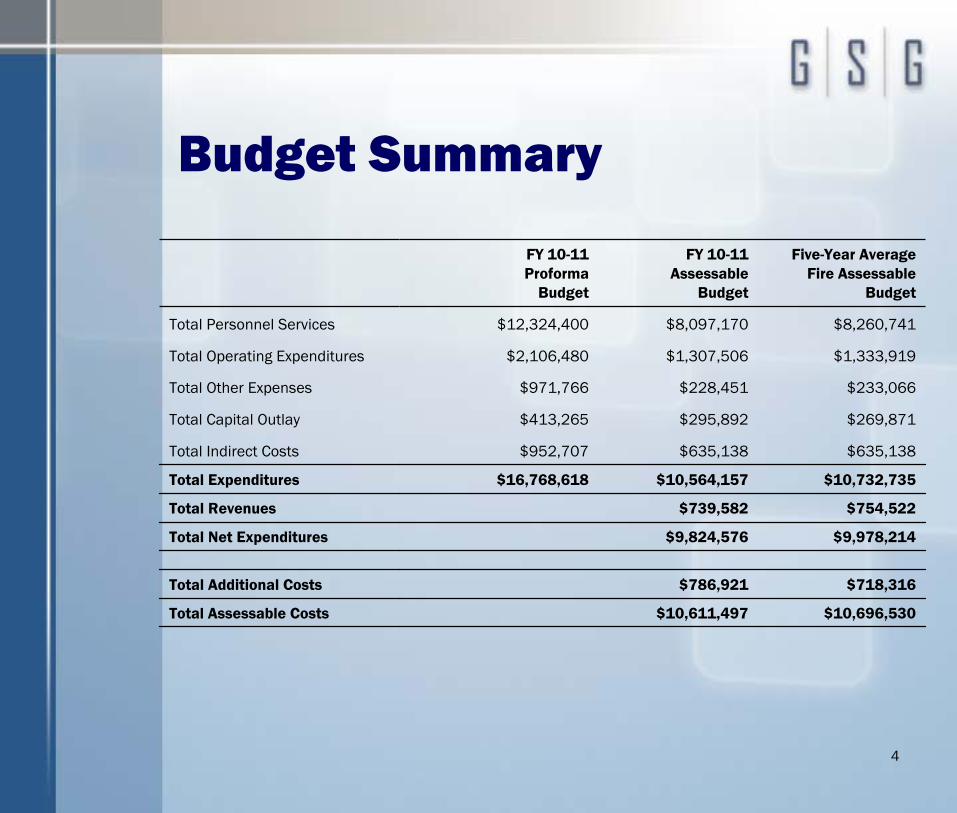
Budget Summary
FY 10-11 Proforma
Budget
FY 10-11Assessable
Budget
Five-Year Average Fire Assessable
Budget
Total Personnel Services $12,324,400 $8,097,170 $8,260,741
Total Operating Expenditures $2,106,480 $1,307,506 $1,333,919
Total Other Expenses $971,766 $228,451 $233,066
Total Capital Outlay $413,265 $295,892 $269,871
Total Indirect Costs $952,707 $635,138 $635,138
Total Expenditures $16,768,618 $10,564,157 $10,732,735
Total Revenues $739,582 $754,522
Total Net Expenditures $9,824,576 $9,978,214
Total Additional Costs $786,921 $718,316
Total Assessable Costs $10,611,497 $10,696,530
55
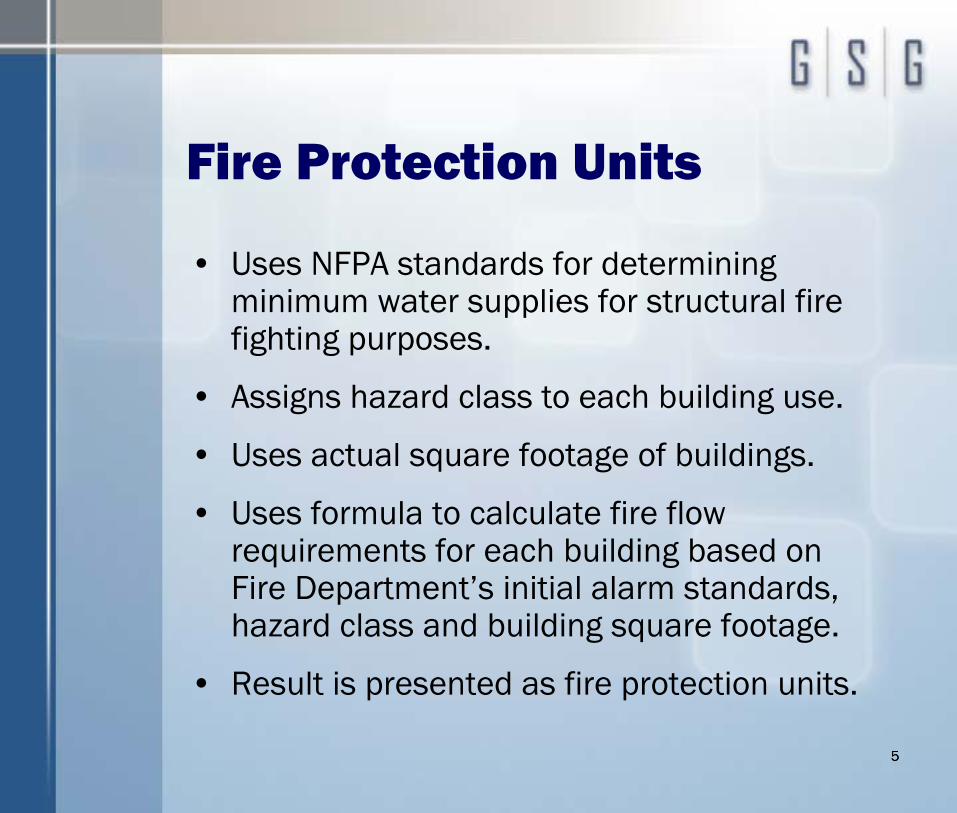
Fire Protection Units
• Uses NFPA standards for determining minimum water supplies for structural fire fighting purposes.
• Assigns hazard class to each building use.
• Uses actual square footage of buildings.
• Uses formula to calculate fire flow requirements for each building based on Fire Department’s initial alarm standards, hazard class and building square footage.
• Result is presented as fire protection units.
6
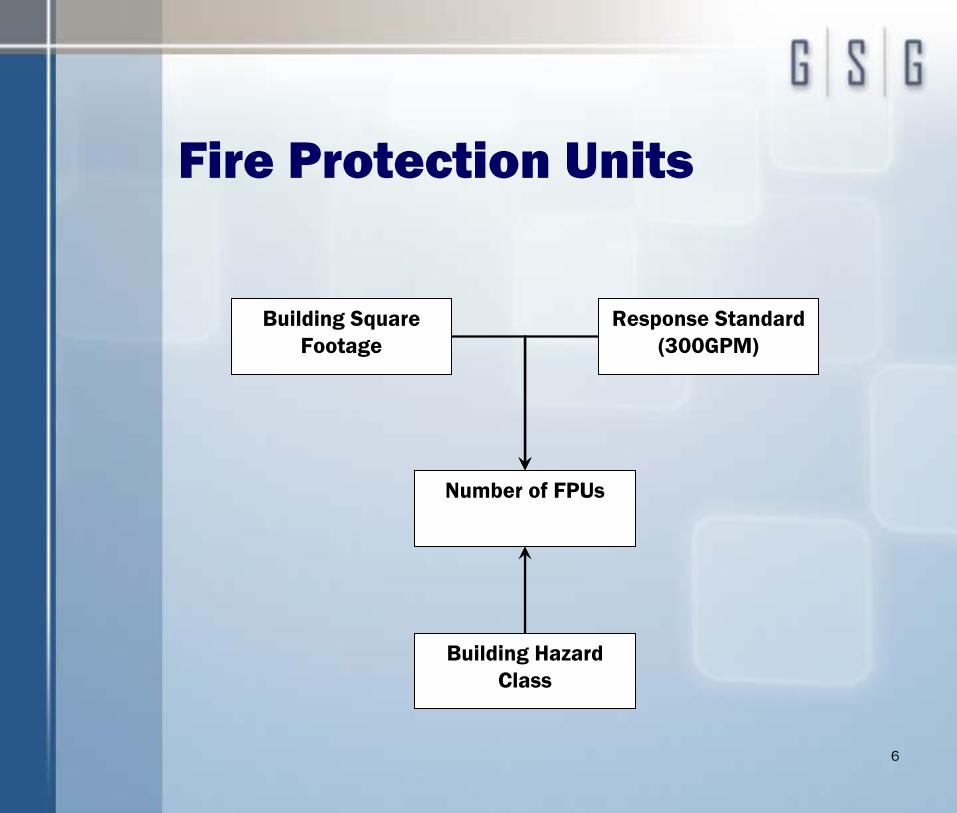
Fire Protection Units
Building Square Footage
Response Standard (300GPM)
Number of FPUs
Building Hazard Class
77
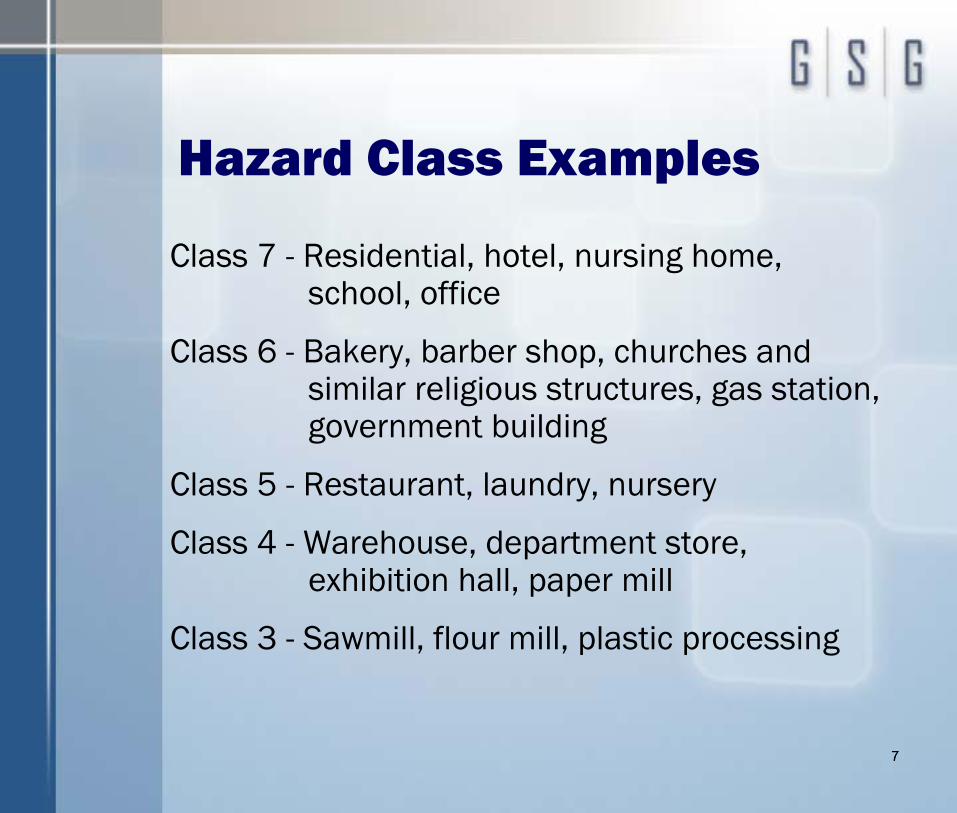
Hazard Class Examples
Class 7 - Residential, hotel, nursing home, school, office
Class 6 - Bakery, barber shop, churches and similar religious structures, gas station, government building
Class 5 - Restaurant, laundry, nursery
Class 4 - Warehouse, department store, exhibition hall, paper mill
Class 3 - Sawmill, flour mill, plastic processing
8
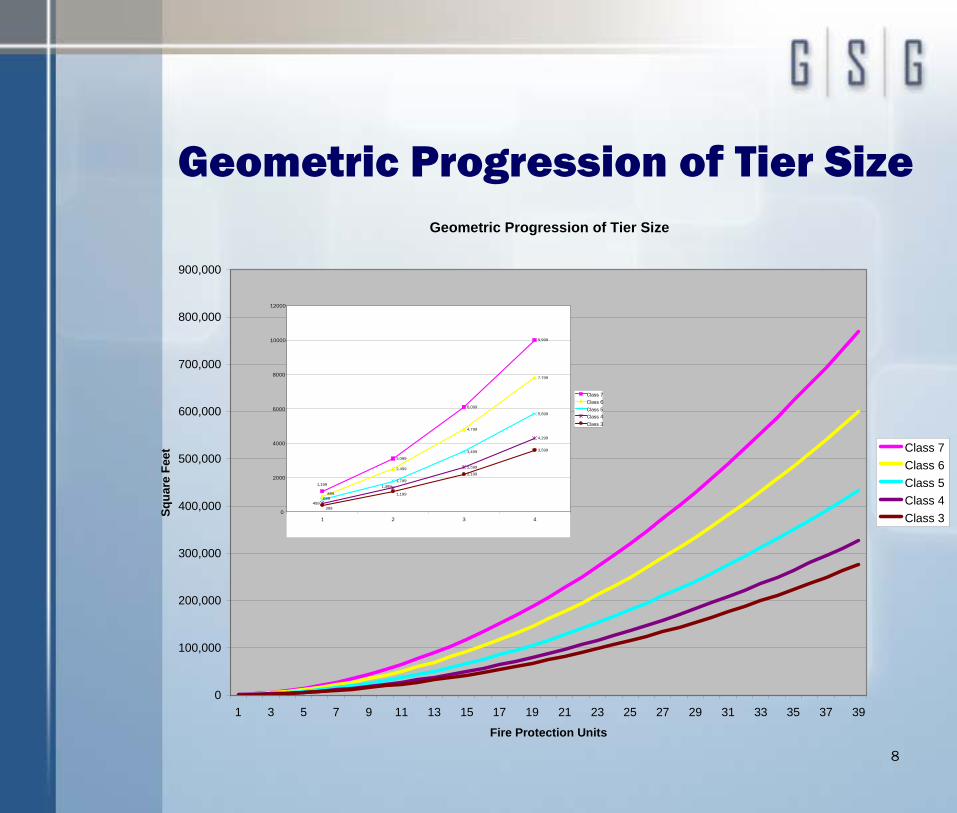
Geometric Progression of Tier SizeGeometric Progression of Tier Size
0
100,000
200,000
300,000
400,000
500,000
600,000
700,000
800,000
900,000
1 3 5 7 9 11 13 15 17 19 21 23 25 27 29 31 33 35 37 39
Fire Protection Units
Squa
re F
eet Class 7
Class 6Class 5Class 4Class 3
3,099
6,099
9,999
2,499
4,799
7,799
1,799
3,499
5,699
2,599
4,299
2,199
3,599
1,199
899699
1,399
499
1,199
3990
2000
4000
6000
8000
10000
12000
1 2 3 4
Class 7Class 6Class 5Class 4Class 3
9
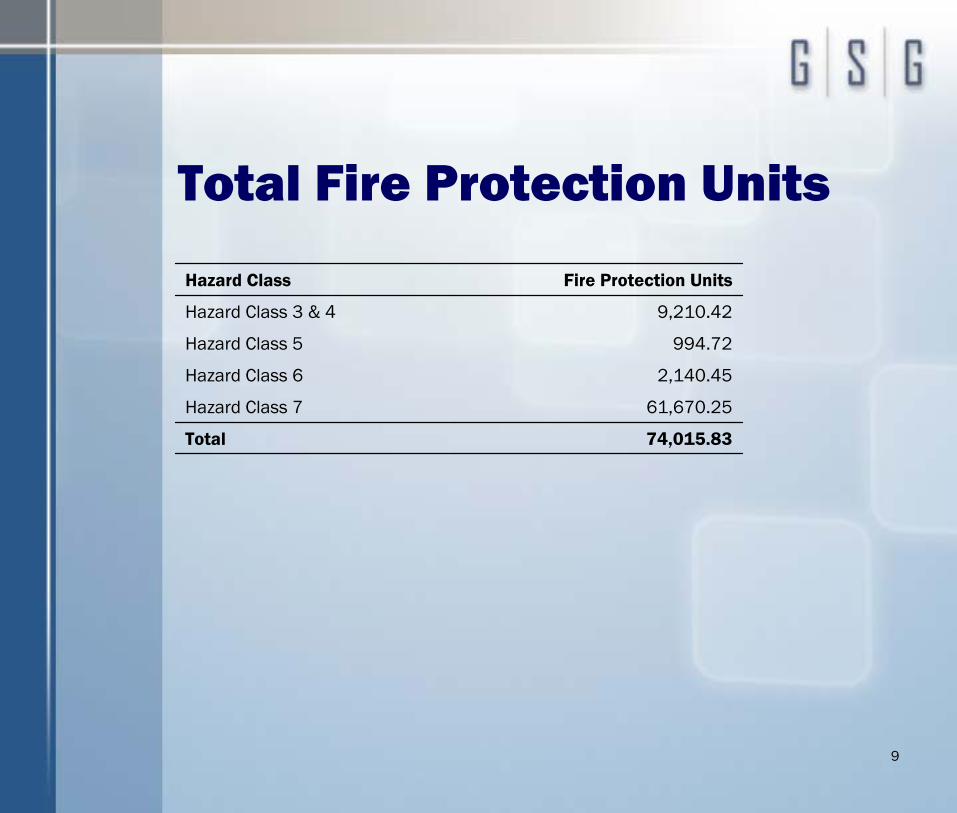
Total Fire Protection Units
Hazard Class Fire Protection Units
Hazard Class 3 & 4 9,210.42
Hazard Class 5 994.72
Hazard Class 6 2,140.45
Hazard Class 7 61,670.25
Total 74,015.83
10
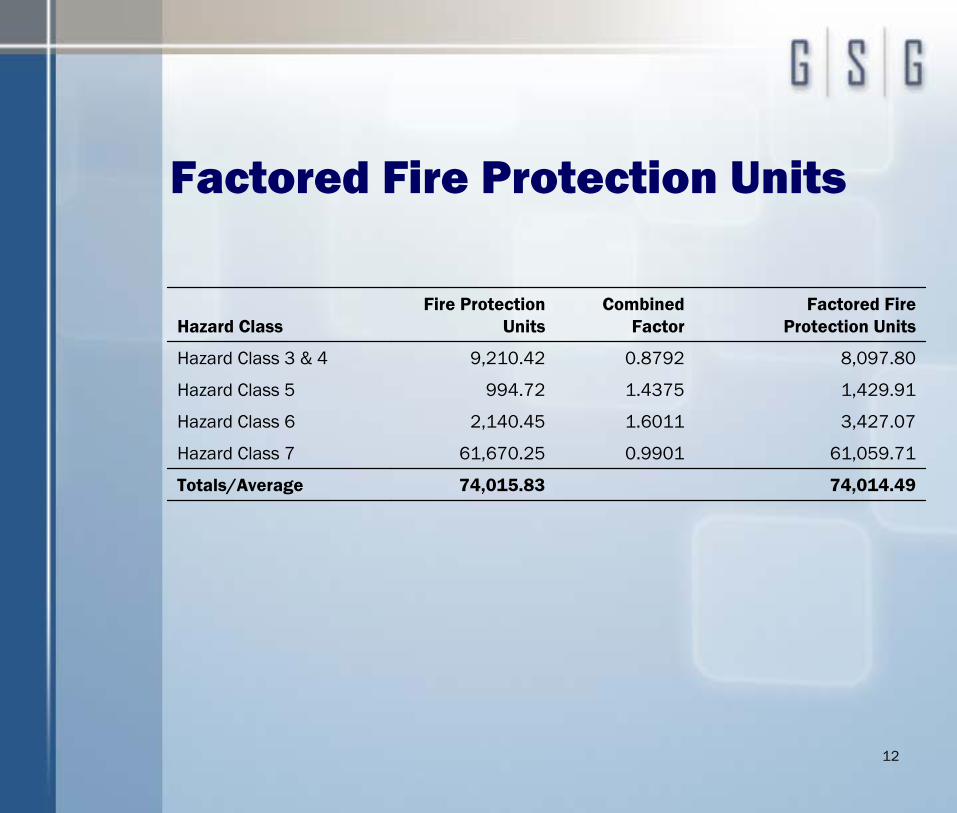
Factored Fire Protection Units
• Develops relationship between the hazard classes to account for the historical demand for fire services
– Adds probability for fire protection units within hazard classes to require fire services
• Two Factors:
– Demand Component Factor
– Availability Component Factor
• Determine proportion of person-hours attributable to the Demand and Availability Components
11
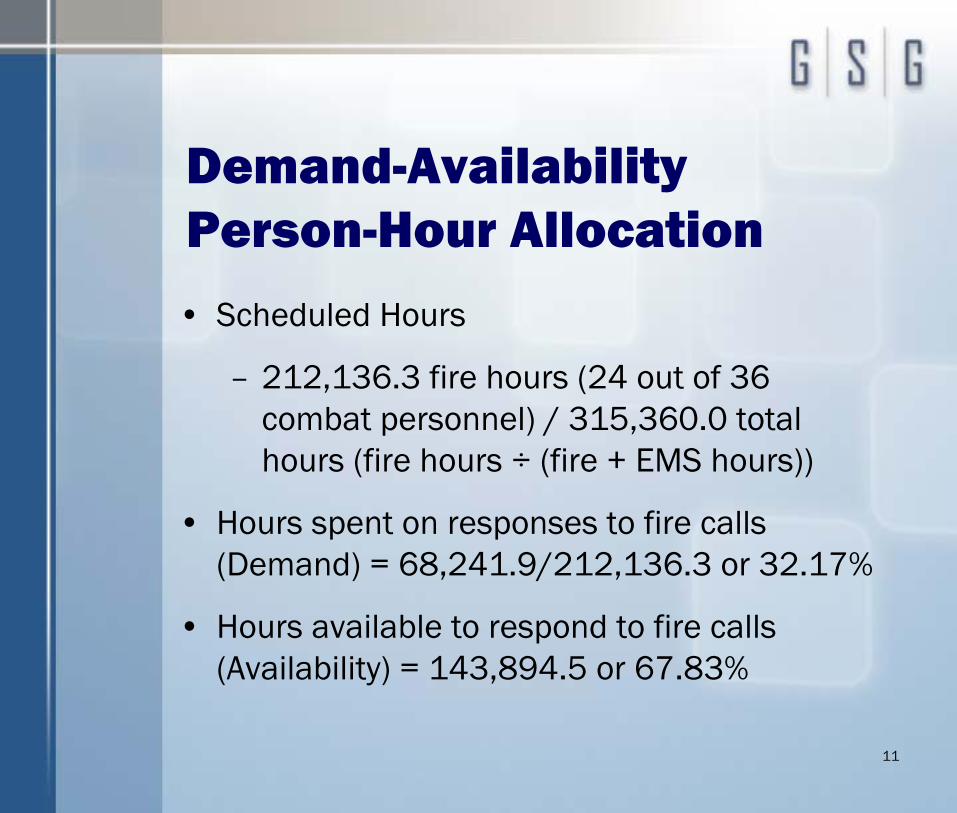
Demand-Availability Person-Hour Allocation
• Scheduled Hours
– 212,136.3 fire hours (24 out of 36 combat personnel) / 315,360.0 total hours (fire hours ÷ (fire + EMS hours))
• Hours spent on responses to fire calls (Demand) = 68,241.9/212,136.3 or 32.17%
• Hours available to respond to fire calls (Availability) = 143,894.5 or 67.83%
12
Factored Fire Protection Units
Hazard ClassFire Protection
UnitsCombined
FactorFactored Fire
Protection Units
Hazard Class 3 & 4 9,210.42 0.8792 8,097.80
Hazard Class 5 994.72 1.4375 1,429.91
Hazard Class 6 2,140.45 1.6011 3,427.07
Hazard Class 7 61,670.25 0.9901 61,059.71
Totals/Average 74,015.83 74,014.49
13
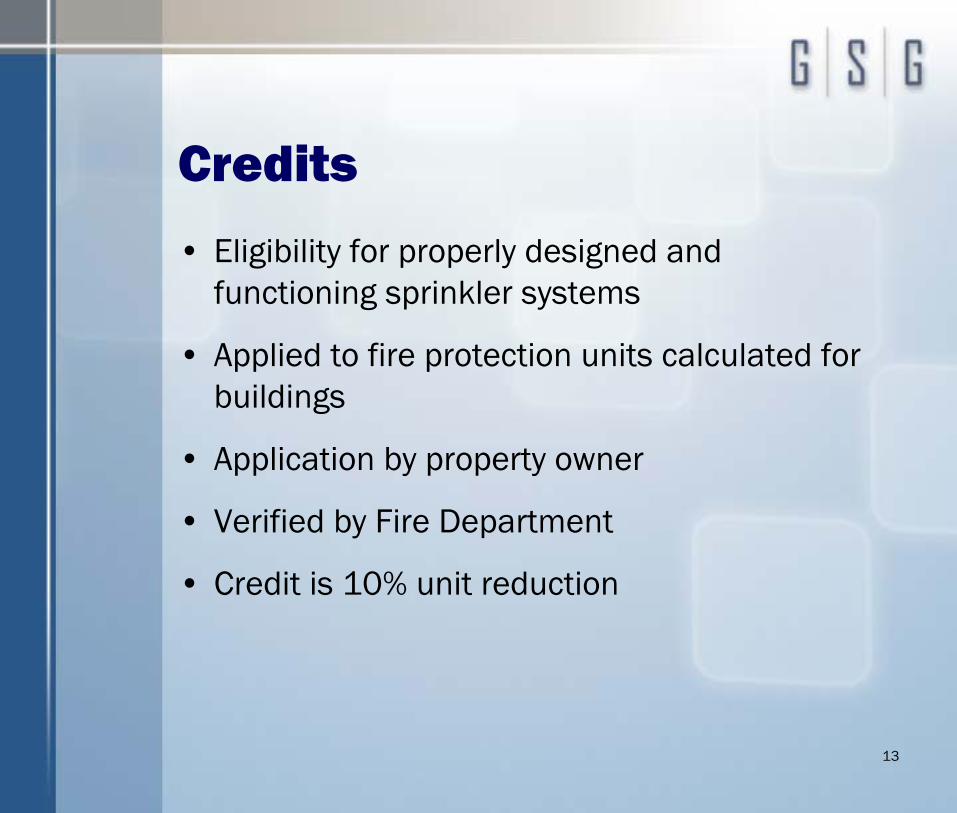
Credits
• Eligibility for properly designed and functioning sprinkler systems
• Applied to fire protection units calculated for buildings
• Application by property owner
• Verified by Fire Department
• Credit is 10% unit reduction
14
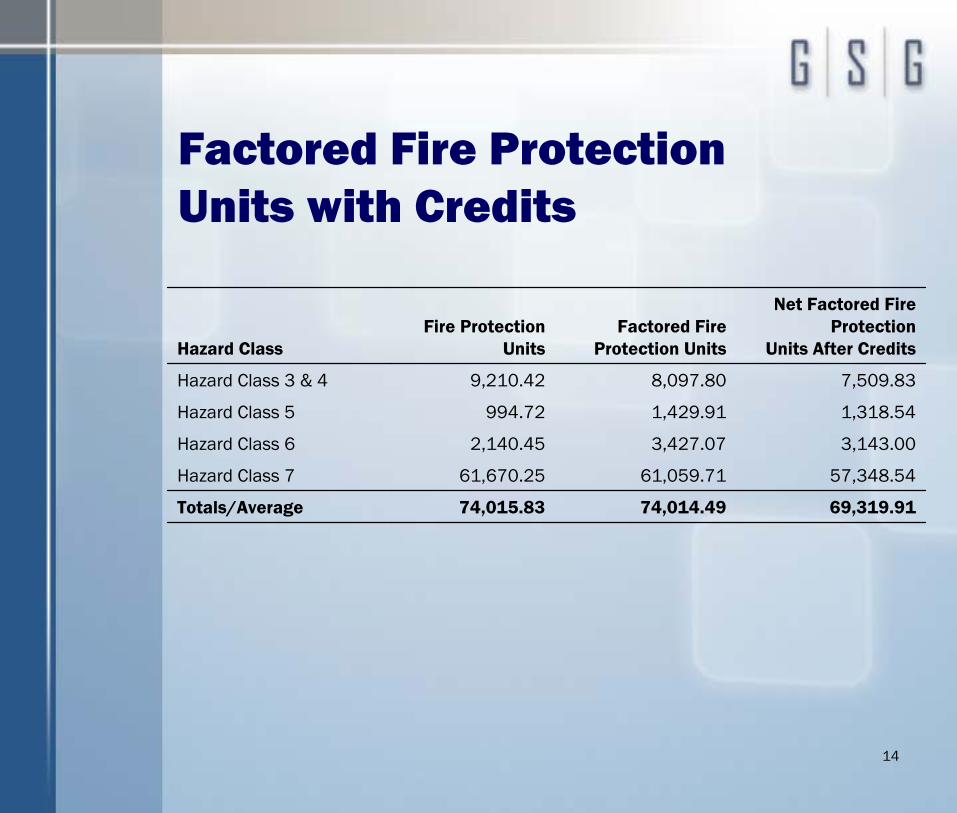
Factored Fire Protection Units with Credits
Hazard ClassFire Protection
UnitsFactored Fire
Protection Units
Net Factored Fire Protection
Units After Credits
Hazard Class 3 & 4 9,210.42 8,097.80 7,509.83
Hazard Class 5 994.72 1,429.91 1,318.54
Hazard Class 6 2,140.45 3,427.07 3,143.00
Hazard Class 7 61,670.25 61,059.71 57,348.54
Totals/Average 74,015.83 74,014.49 69,319.91
15
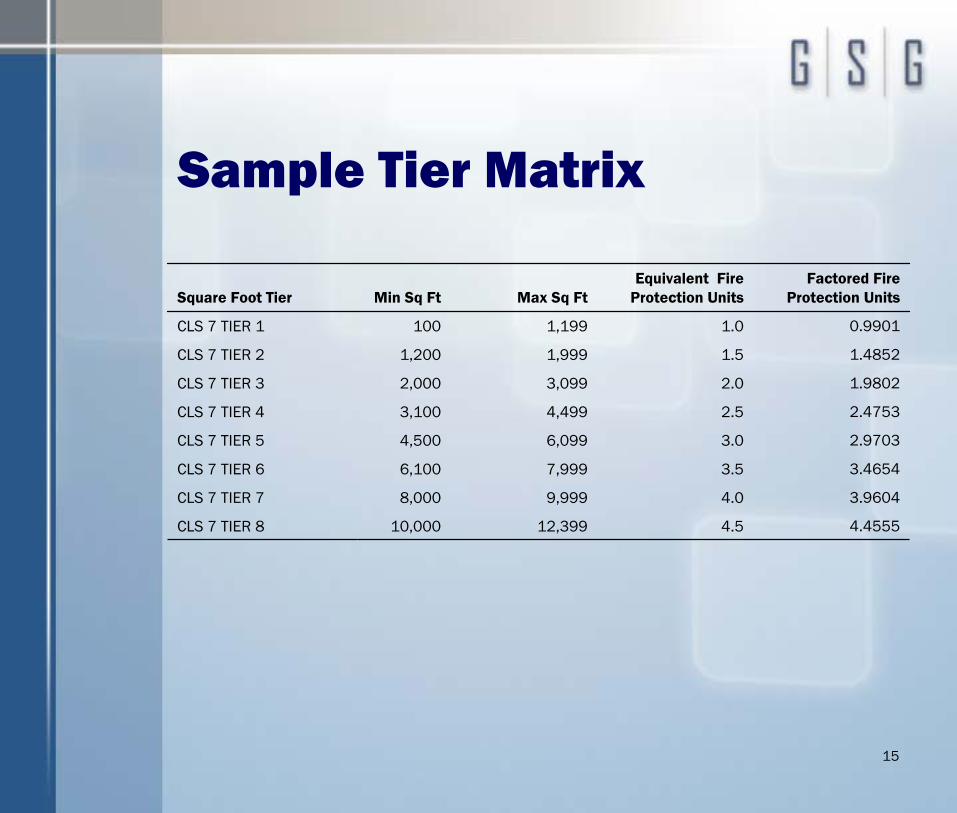
Sample Tier Matrix
Square Foot Tier Min Sq Ft Max Sq FtEquivalent Fire
Protection UnitsFactored Fire
Protection Units
CLS 7 TIER 1 100 1,199 1.0 0.9901
CLS 7 TIER 2 1,200 1,999 1.5 1.4852
CLS 7 TIER 3 2,000 3,099 2.0 1.9802
CLS 7 TIER 4 3,100 4,499 2.5 2.4753
CLS 7 TIER 5 4,500 6,099 3.0 2.9703
CLS 7 TIER 6 6,100 7,999 3.5 3.4654
CLS 7 TIER 7 8,000 9,999 4.0 3.9604
CLS 7 TIER 8 10,000 12,399 4.5 4.4555
16
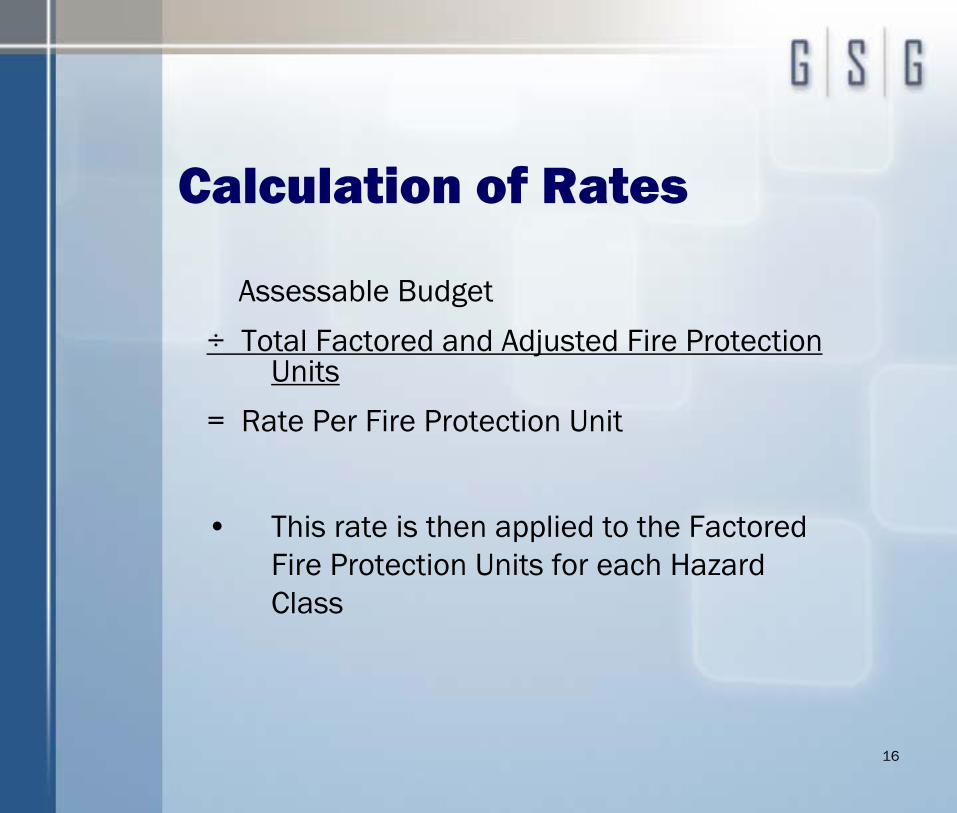
Calculation of Rates
Assessable Budget
÷ Total Factored and Adjusted Fire Protection Units
= Rate Per Fire Protection Unit
• This rate is then applied to the Factored Fire Protection Units for each Hazard Class
1717
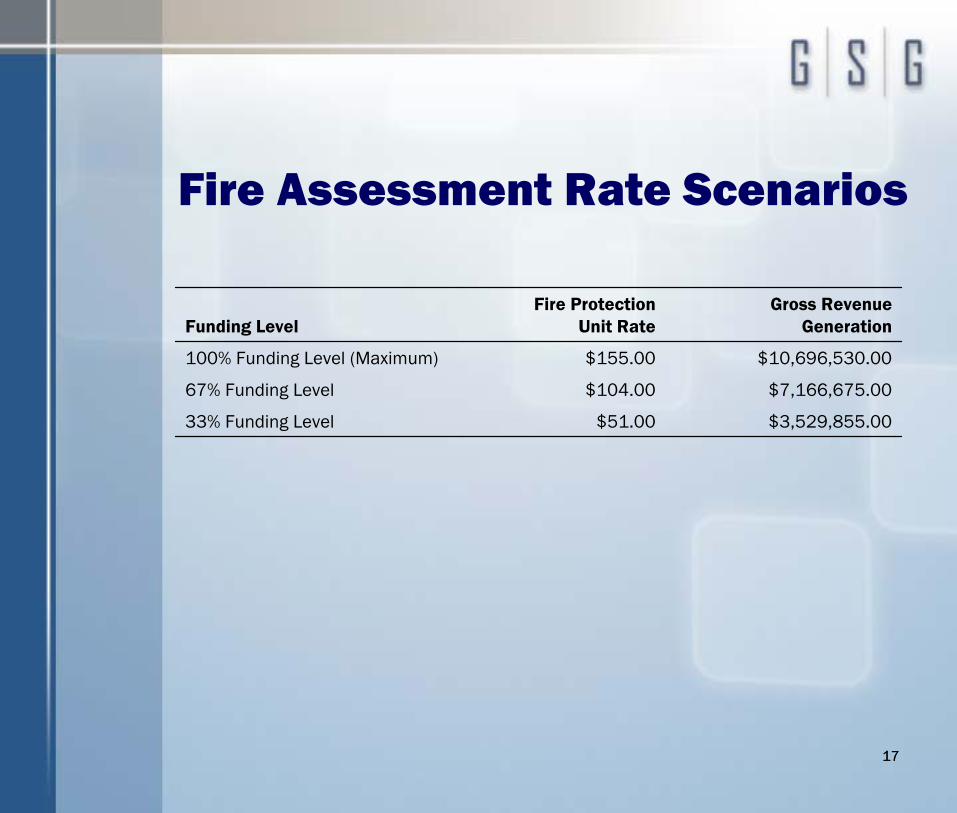
Fire Assessment Rate Scenarios
Funding LevelFire Protection
Unit RateGross Revenue
Generation
100% Funding Level (Maximum) $155.00 $10,696,530.00
67% Funding Level $104.00 $7,166,675.00
33% Funding Level $51.00 $3,529,855.00
18
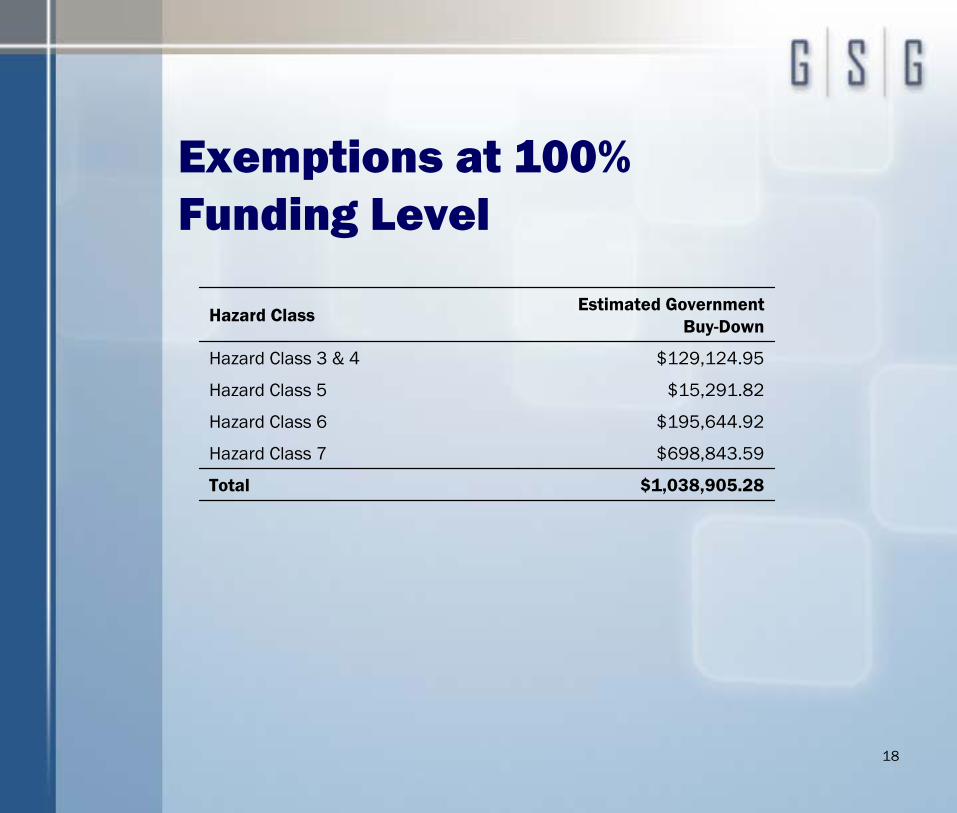
Exemptions at 100% Funding Level
Hazard Class Estimated Government Buy-Down
Hazard Class 3 & 4 $129,124.95
Hazard Class 5 $15,291.82
Hazard Class 6 $195,644.92
Hazard Class 7 $698,843.59
Total $1,038,905.28
19
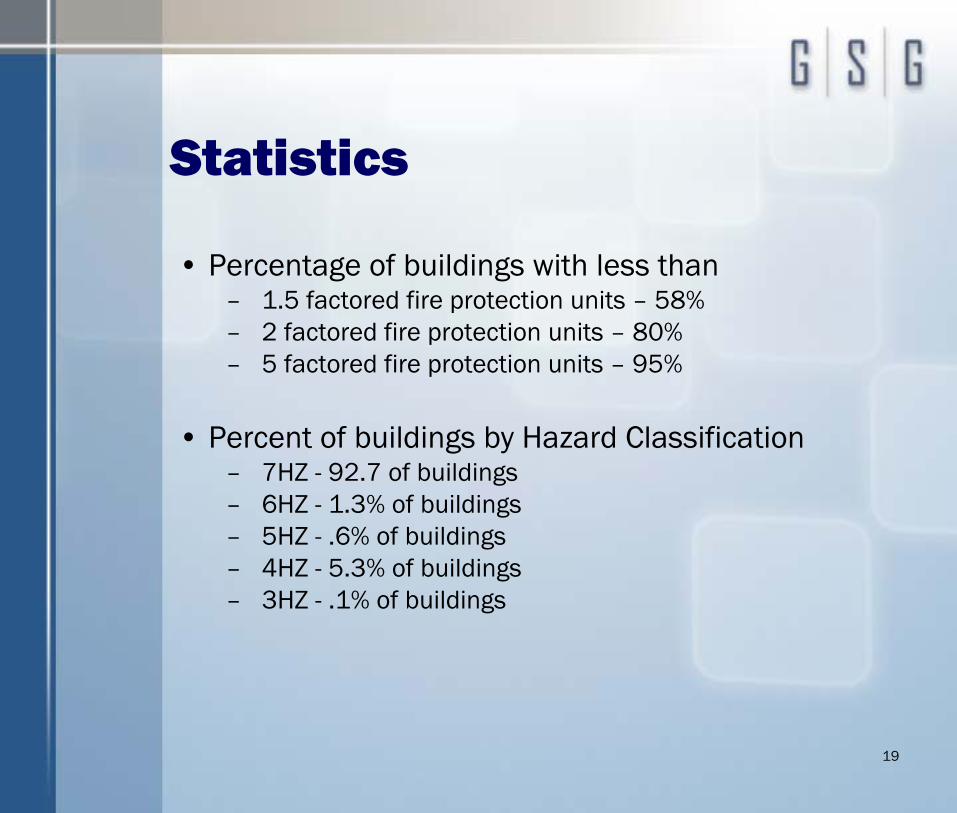
Statistics
• Percentage of buildings with less than – 1.5 factored fire protection units – 58%– 2 factored fire protection units – 80%– 5 factored fire protection units – 95%
• Percent of buildings by Hazard Classification– 7HZ - 92.7 of buildings– 6HZ - 1.3% of buildings– 5HZ - .6% of buildings– 4HZ - 5.3% of buildings– 3HZ - .1% of buildings
20
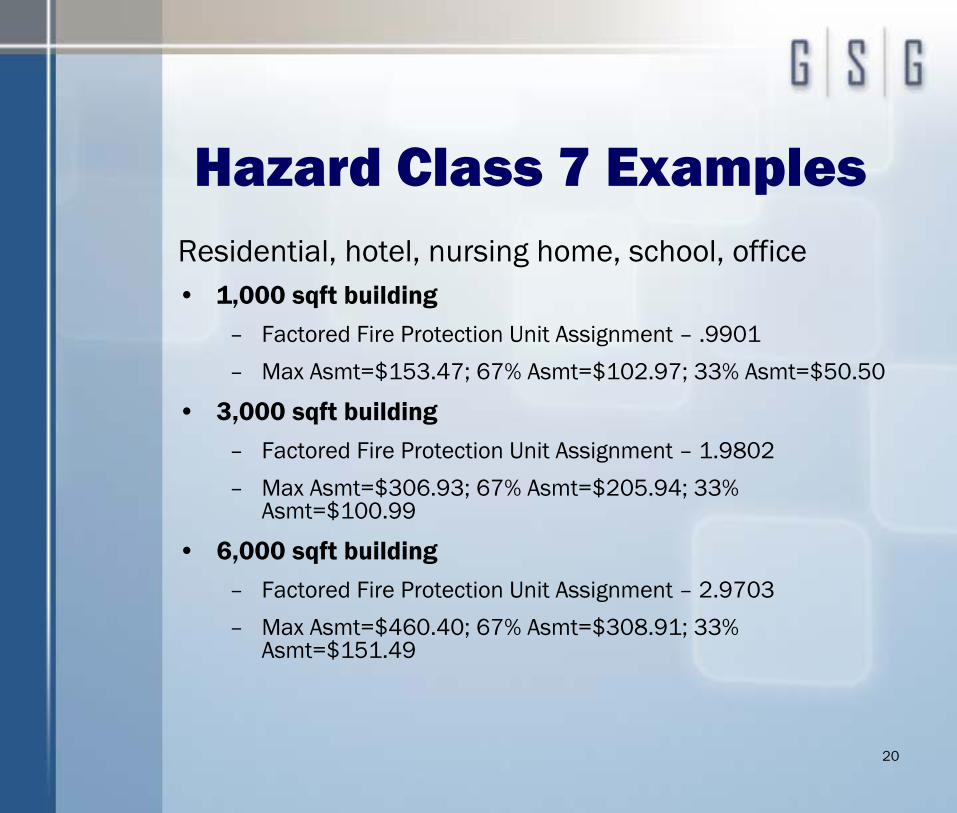
Hazard Class 7 ExamplesResidential, hotel, nursing home, school, office• 1,000 sqft building
– Factored Fire Protection Unit Assignment – .9901
– Max Asmt=$153.47; 67% Asmt=$102.97; 33% Asmt=$50.50
• 3,000 sqft building – Factored Fire Protection Unit Assignment – 1.9802
– Max Asmt=$306.93; 67% Asmt=$205.94; 33% Asmt=$100.99
• 6,000 sqft building– Factored Fire Protection Unit Assignment – 2.9703
– Max Asmt=$460.40; 67% Asmt=$308.91; 33% Asmt=$151.49
21
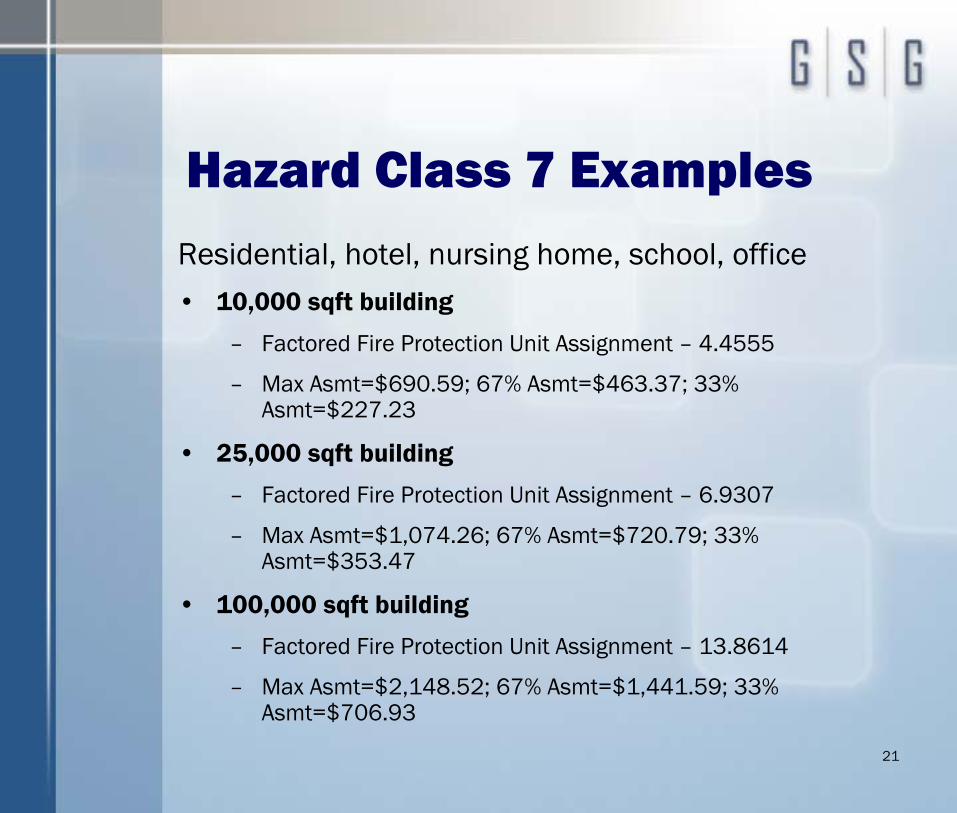
Hazard Class 7 ExamplesResidential, hotel, nursing home, school, office• 10,000 sqft building
– Factored Fire Protection Unit Assignment – 4.4555
– Max Asmt=$690.59; 67% Asmt=$463.37; 33% Asmt=$227.23
• 25,000 sqft building
– Factored Fire Protection Unit Assignment – 6.9307
– Max Asmt=$1,074.26; 67% Asmt=$720.79; 33% Asmt=$353.47
• 100,000 sqft building
– Factored Fire Protection Unit Assignment – 13.8614
– Max Asmt=$2,148.52; 67% Asmt=$1,441.59; 33% Asmt=$706.93

22
Hazard Class 6 Examples
• 4,000 sqft building
– Factored Fire Protection Unit Assignment – 4.8033
– Max Asmt=$744.51; 67% Asmt=$499.54; 33% Asmt=$244.97
• 10,000 sqft building
– Factored Fire Protection Unit Assignment – 8.0055
– Max Asmt=$1,240.85; 67% Asmt=$832.57; 33% Asmt=$408.28
• 20,000 sqft building
– Factored Fire Protection Unit Assignment – 11.2077
– Max Asmt=$1,737.19; 67% Asmt=$1,165.60; 33% Asmt=$571.59
Bakery, barber shop, churches and similar religious structures, gas station, government building
23
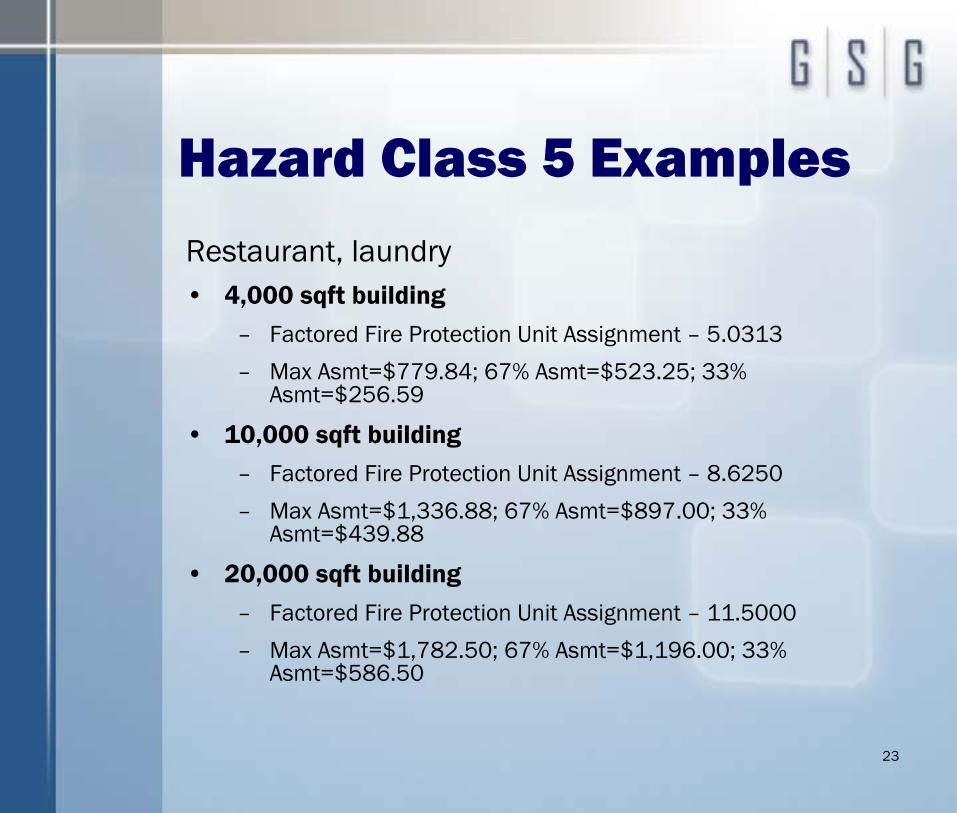
Hazard Class 5 Examples
Restaurant, laundry• 4,000 sqft building
– Factored Fire Protection Unit Assignment – 5.0313
– Max Asmt=$779.84; 67% Asmt=$523.25; 33% Asmt=$256.59
• 10,000 sqft building – Factored Fire Protection Unit Assignment – 8.6250
– Max Asmt=$1,336.88; 67% Asmt=$897.00; 33% Asmt=$439.88
• 20,000 sqft building – Factored Fire Protection Unit Assignment – 11.5000
– Max Asmt=$1,782.50; 67% Asmt=$1,196.00; 33% Asmt=$586.50
24
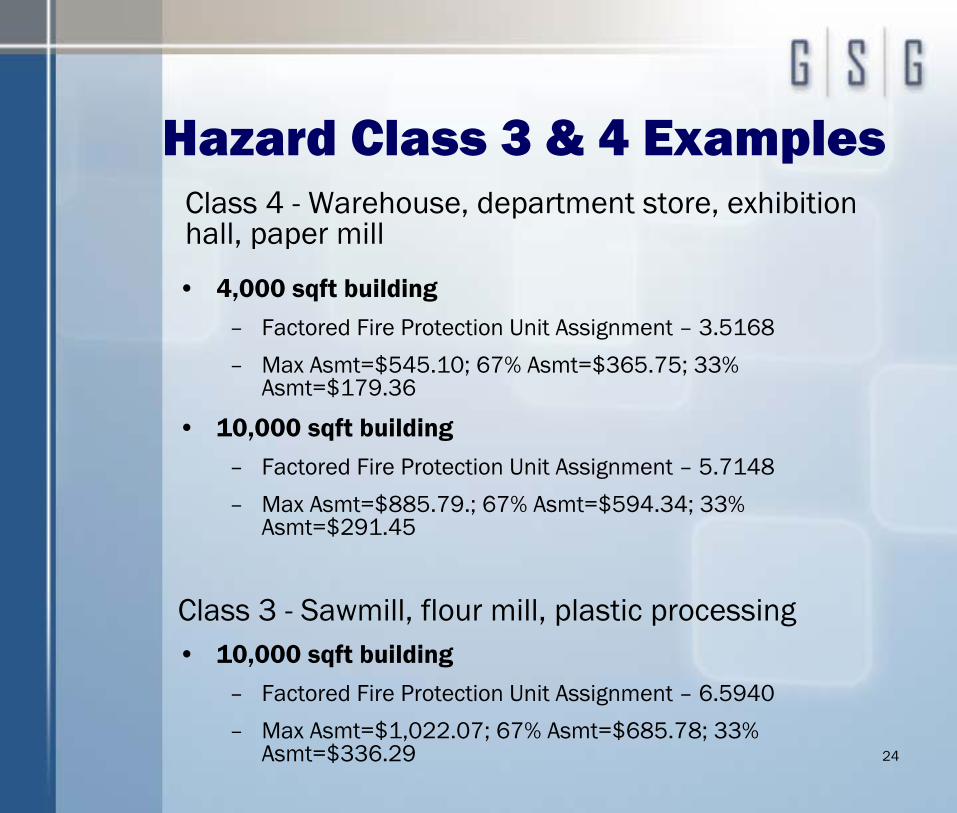
Hazard Class 3 & 4 Examples
• 4,000 sqft building – Factored Fire Protection Unit Assignment – 3.5168
– Max Asmt=$545.10; 67% Asmt=$365.75; 33% Asmt=$179.36
• 10,000 sqft building – Factored Fire Protection Unit Assignment – 5.7148
– Max Asmt=$885.79.; 67% Asmt=$594.34; 33% Asmt=$291.45
Class 3 - Sawmill, flour mill, plastic processing• 10,000 sqft building
– Factored Fire Protection Unit Assignment – 6.5940
– Max Asmt=$1,022.07; 67% Asmt=$685.78; 33% Asmt=$336.29
Class 4 - Warehouse, department store, exhibition hall, paper mill
2525
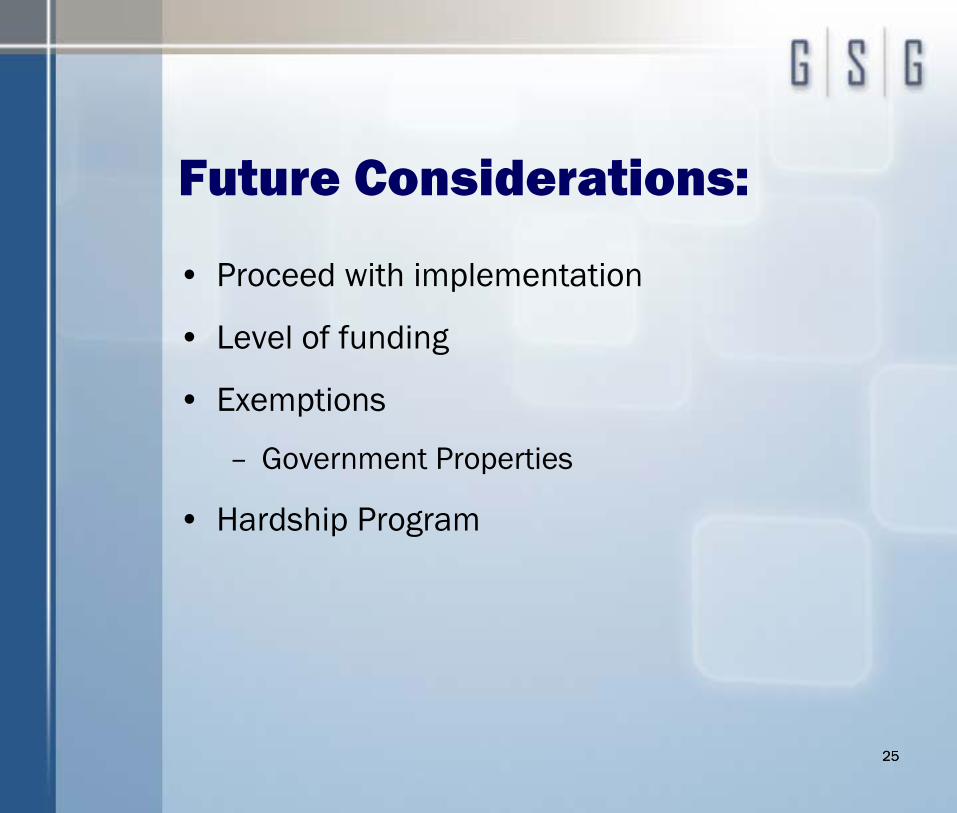
Future Considerations:
• Proceed with implementation
• Level of funding
• Exemptions
– Government Properties
• Hardship Program
2626
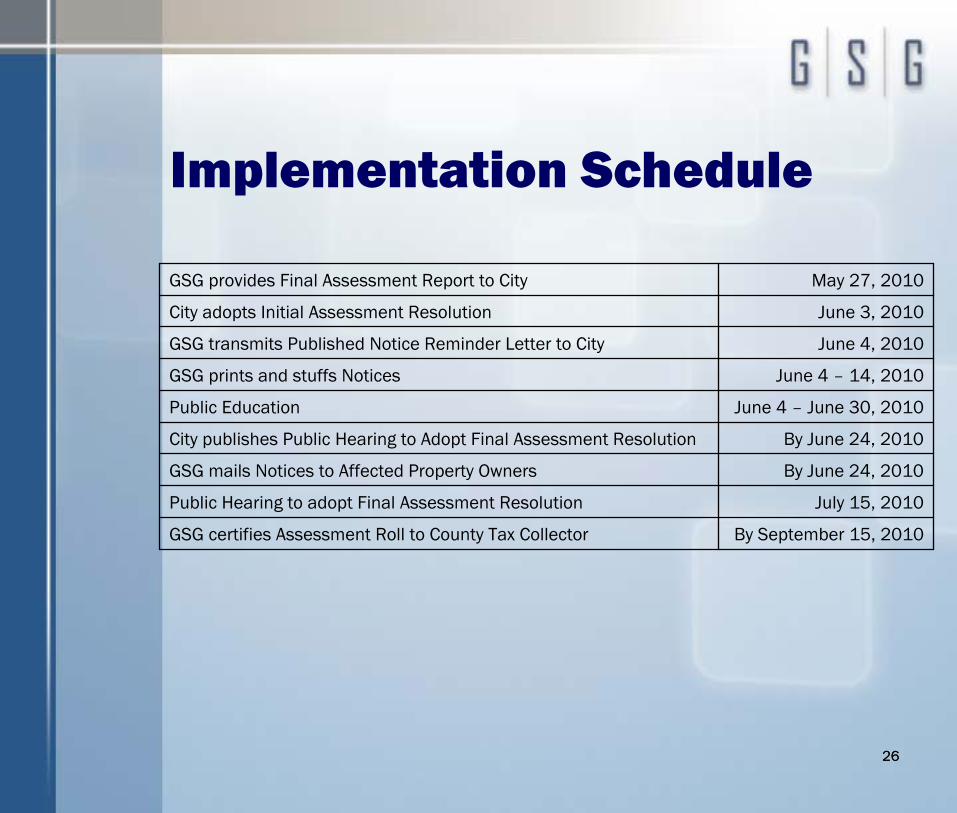
Implementation Schedule
GSG provides Final Assessment Report to City May 27, 2010
City adopts Initial Assessment Resolution June 3, 2010
GSG transmits Published Notice Reminder Letter to City June 4, 2010
GSG prints and stuffs Notices June 4 – 14, 2010
Public Education June 4 – June 30, 2010
City publishes Public Hearing to Adopt Final Assessment Resolution By June 24, 2010
GSG mails Notices to Affected Property Owners By June 24, 2010
Public Hearing to adopt Final Assessment Resolution July 15, 2010
GSG certifies Assessment Roll to County Tax Collector By September 15, 2010