Embed Size (px)
Citation preview
Comprehensive Annual Financial Report
City of Hartford, Connecticut Mayor-Council Form of Government
For the Fiscal Year
July 1, 2013 to June 30, 2014
PREPARED BY:
Department of Finance
Leigh Ann Ralls, CPA Acting Director of Finance

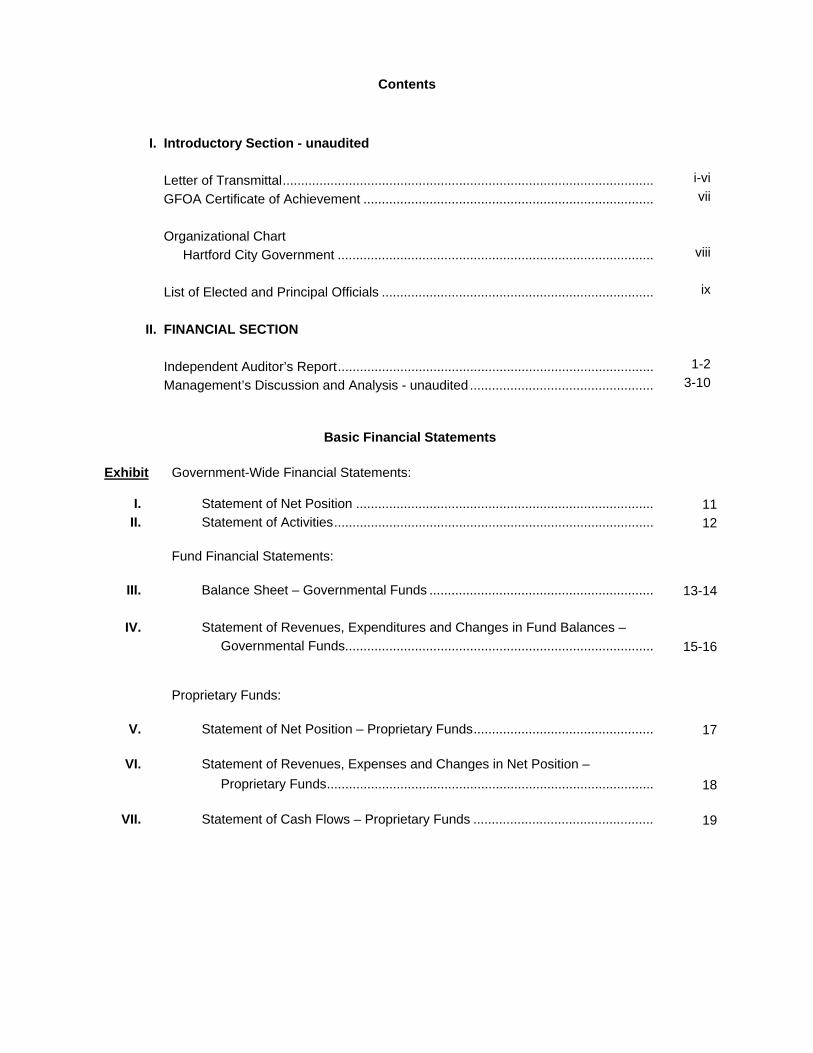
Contents
I. Introductory Section - unaudited
Letter of Transmittal ..................................................................................................... i-vi
GFOA Certificate of Achievement ............................................................................... vii
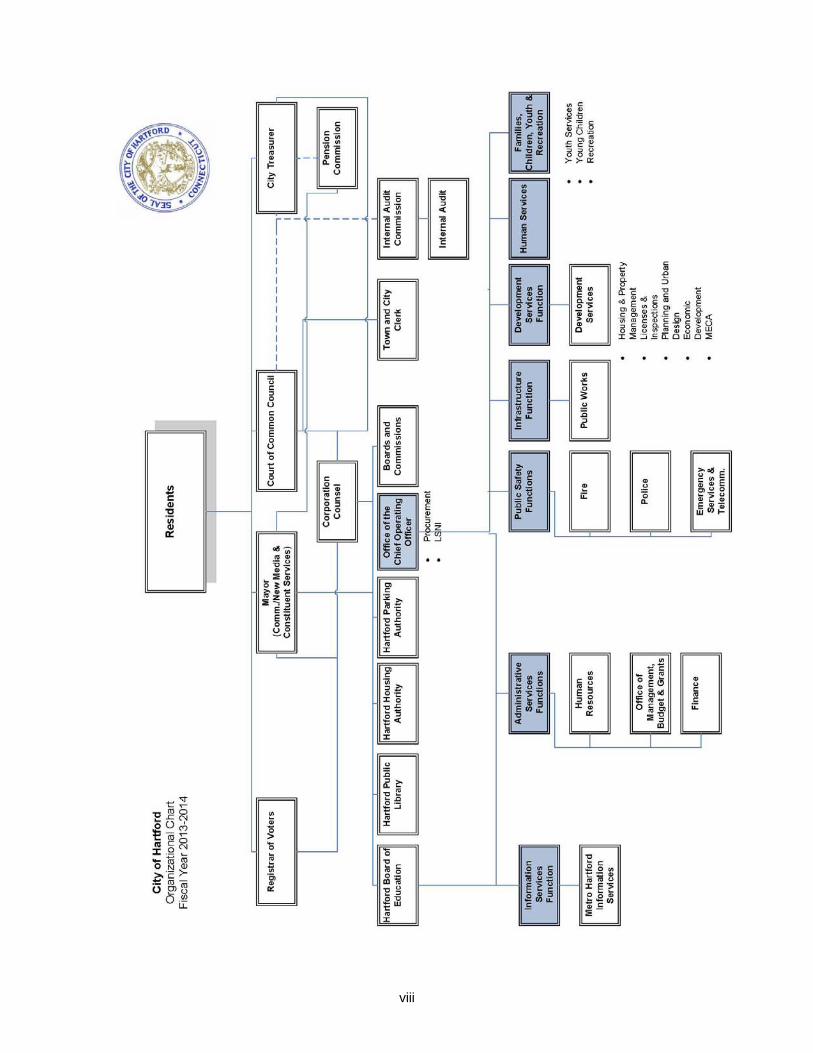
Organizational Chart
Hartford City Government ...................................................................................... viii
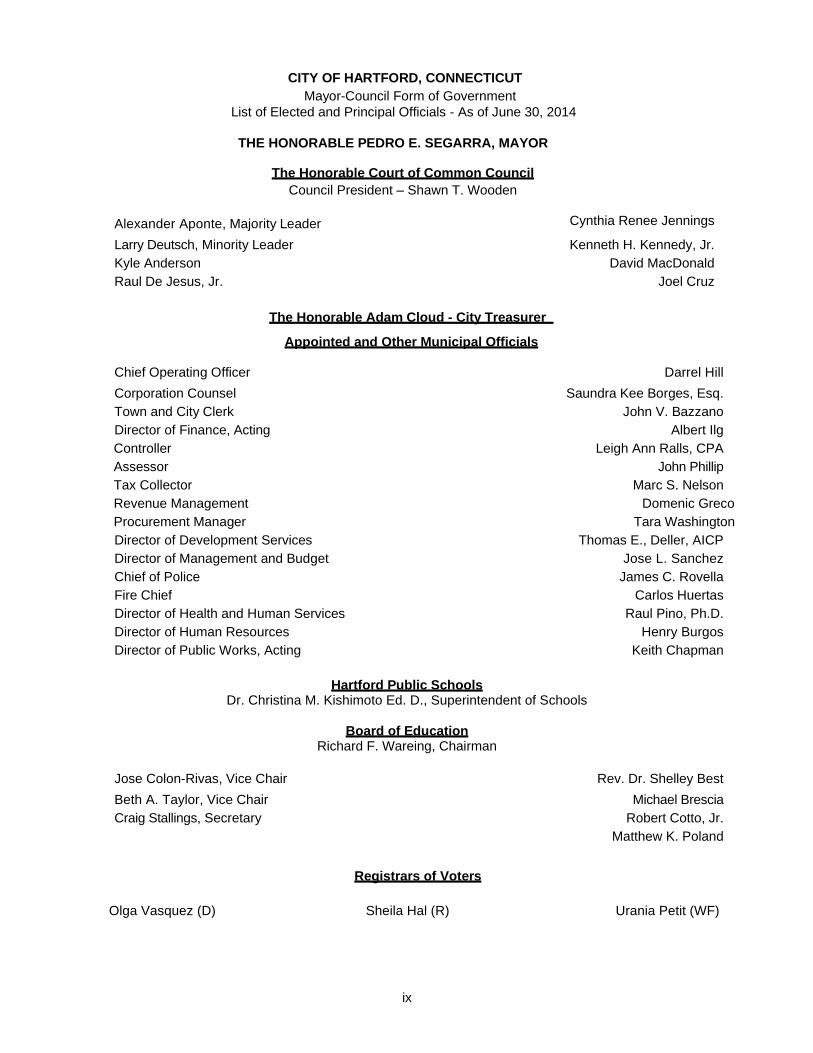
List of Elected and Principal Officials .......................................................................... ix
II. FINANCIAL SECTION
Independent Auditor’s Report ...................................................................................... 1-2
Management’s Discussion and Analysis - unaudited .................................................. 3-10
Basic Financial Statements
Exhibit Government-Wide Financial Statements:
I. Statement of Net Position ................................................................................. 11 II. Statement of Activities ....................................................................................... 12
Fund Financial Statements:
III. Balance Sheet – Governmental Funds ............................................................. 13-14
IV. Statement of Revenues, Expenditures and Changes in Fund Balances –
Governmental Funds.................................................................................... 15-16
Proprietary Funds:
V. Statement of Net Position – Proprietary Funds ................................................. 17
VI. Statement of Revenues, Expenses and Changes in Net Position –
Proprietary Funds ......................................................................................... 18
VII. Statement of Cash Flows – Proprietary Funds ................................................. 19
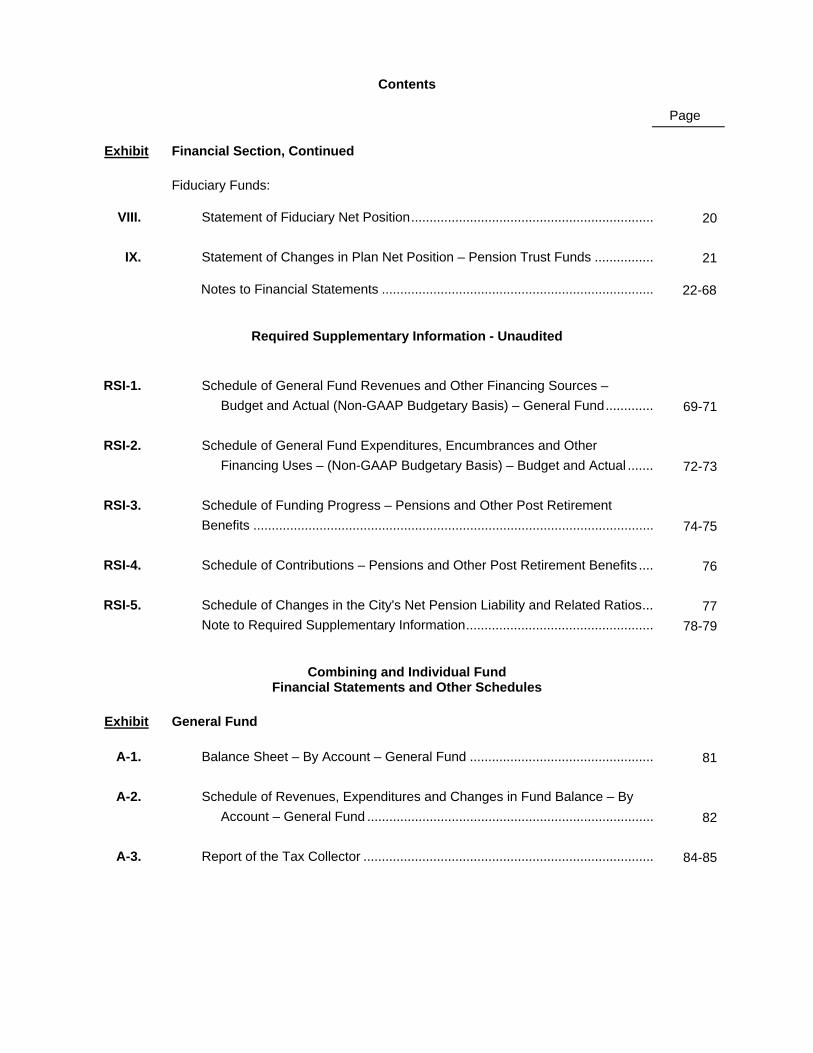
Contents
Page
Exhibit Financial Section, Continued
Fiduciary Funds:
VIII. Statement of Fiduciary Net Position .................................................................. 20
IX. Statement of Changes in Plan Net Position – Pension Trust Funds ................ 21
Notes to Financial Statements .......................................................................... 22-68
Required Supplementary Information - Unaudited
RSI-1.
Schedule of General Fund Revenues and Other Financing Sources –
Budget and Actual (Non-GAAP Budgetary Basis) – General Fund ............. 69-71
RSI-2. Schedule of General Fund Expenditures, Encumbrances and Other
Financing Uses – (Non-GAAP Budgetary Basis) – Budget and Actual ....... 72-73
RSI-3. Schedule of Funding Progress – Pensions and Other Post Retirement
Benefits ............................................................................................................. 74-75
RSI-4. Schedule of Contributions – Pensions and Other Post Retirement Benefits .... 76
RSI-5. Schedule of Changes in the City's Net Pension Liability and Related Ratios ... 77
Note to Required Supplementary Information ................................................... 78-79
Combining and Individual Fund Financial Statements and Other Schedules
Exhibit General Fund
A-1. Balance Sheet – By Account – General Fund .................................................. 81
A-2. Schedule of Revenues, Expenditures and Changes in Fund Balance – By
Account – General Fund .............................................................................. 82
A-3. Report of the Tax Collector ............................................................................... 84-85
Contents
Page
Exhibit Nonmajor Governmental Funds
B-1. Combining Balance Sheet ................................................................................. 88-91
B-2. Combining Statement of Revenues, Expenditures and Changes in Fund
Balances (Deficits) ....................................................................................... 92-95
Capital Improvement Fund
C. Schedule of Expenditures and Encumbrances Compared with
Appropriations, Etc. – Capital Improvement Fund ....................................... 97-109
Internal Service Funds
D-1. Combining Statement of Net Position (Deficit) .................................................. 112-113
D-2. Combining Statement of Revenues, Expenses and Changes in Net Position
(Deficit) ......................................................................................................... 114-115
D-3. Combining Statement of Cash Flows ................................................................ 116-117
Agency Funds
E-1. Combining Balance Sheet ................................................................................. 119
E-2. Combining Statement of Changes in Assets and Liabilities .............................. 120
Capital Assets Used in the Operation of
Governmental Funds
F-1. Schedule by Source .......................................................................................... 121
Contents
Page
TABLE Statistical Section - Unaudited
Financial Trends
1. Net Position by Component ......................................................................................... 124-125
2. Changes in Net Position .............................................................................................. 126-129
3. Fund Balances of Governmental Funds ...................................................................... 130-131
4. Changes in Fund Balances of Governmental Funds ................................................... 132-133
Revenue Capacity
5. Assessed Value and Estimated Actual Value of Taxable Property ............................. 134
6. Principal Taxpayers ...................................................................................................... 135
7. Property Tax Levies and Collections ........................................................................... 136
Debt Capacity
8. Ratios of Outstanding Debt by Type ............................................................................ 137
9. Statement of Debt Limitation ........................................................................................ 138
10. Legal Debt Margin Information ..................................................................................... 139
11. Statement of Direct and Overlapping Debt .................................................................. 140
Demographics and Employment Statistics
12. Demographic and Employment Statistics .................................................................... 141
13. Principal Employers – Hartford’s Major Employers ..................................................... 142
Operating Information
14. Budgeted Full-Time Equivalent Employees ................................................................. 143
15. Operating Indicators by Function ................................................................................. 144-145
16. Capital Asset Statistics by Function/Program .............................................................. 146

Introductory Section

i
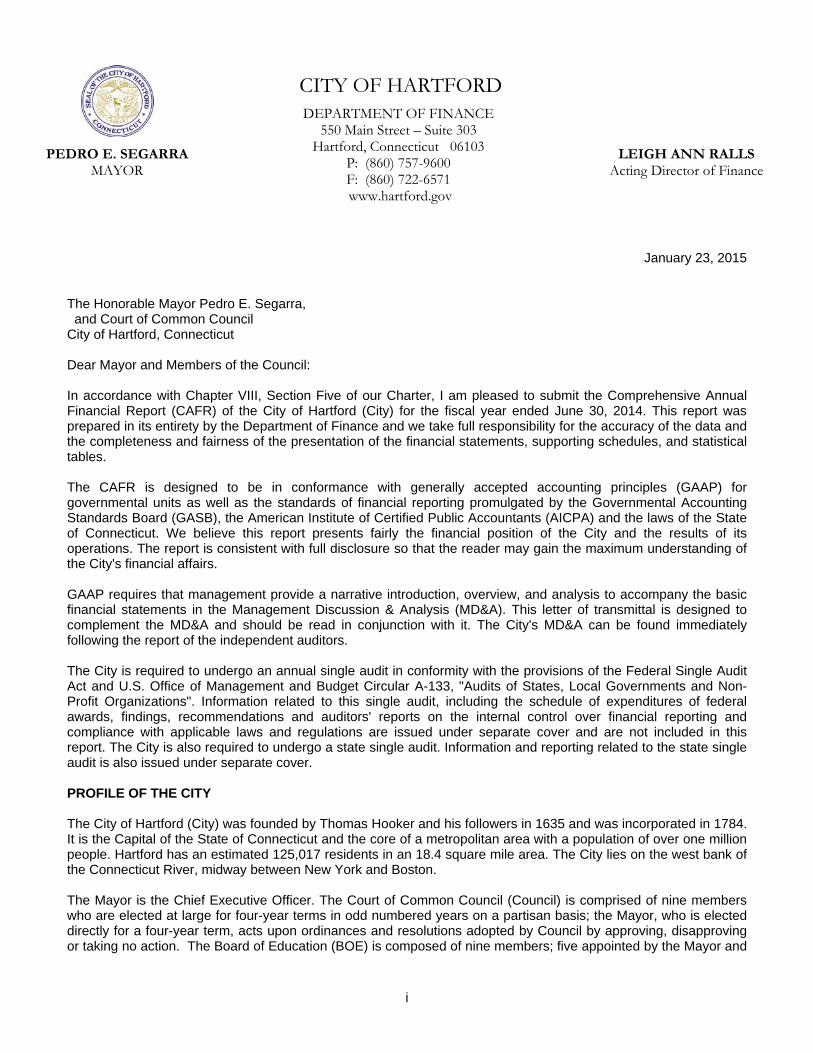
CITY OF HARTFORD DEPARTMENT OF FINANCE
550 Main Street – Suite 303 Hartford, Connecticut 06103
P: (860) 757-9600 F: (860) 722-6571 www.hartford.gov
PEDRO E. SEGARRA MAYOR
LEIGH ANN RALLS Acting Director of Finance
January 23, 2015 The Honorable Mayor Pedro E. Segarra, and Court of Common Council City of Hartford, Connecticut Dear Mayor and Members of the Council: In accordance with Chapter VIII, Section Five of our Charter, I am pleased to submit the Comprehensive Annual Financial Report (CAFR) of the City of Hartford (City) for the fiscal year ended June 30, 2014. This report was prepared in its entirety by the Department of Finance and we take full responsibility for the accuracy of the data and the completeness and fairness of the presentation of the financial statements, supporting schedules, and statistical tables. The CAFR is designed to be in conformance with generally accepted accounting principles (GAAP) for governmental units as well as the standards of financial reporting promulgated by the Governmental Accounting Standards Board (GASB), the American Institute of Certified Public Accountants (AICPA) and the laws of the State of Connecticut. We believe this report presents fairly the financial position of the City and the results of its operations. The report is consistent with full disclosure so that the reader may gain the maximum understanding of the City's financial affairs. GAAP requires that management provide a narrative introduction, overview, and analysis to accompany the basic financial statements in the Management Discussion & Analysis (MD&A). This letter of transmittal is designed to complement the MD&A and should be read in conjunction with it. The City's MD&A can be found immediately following the report of the independent auditors. The City is required to undergo an annual single audit in conformity with the provisions of the Federal Single Audit Act and U.S. Office of Management and Budget Circular A-133, "Audits of States, Local Governments and Non-Profit Organizations". Information related to this single audit, including the schedule of expenditures of federal awards, findings, recommendations and auditors' reports on the internal control over financial reporting and compliance with applicable laws and regulations are issued under separate cover and are not included in this report. The City is also required to undergo a state single audit. Information and reporting related to the state single audit is also issued under separate cover. PROFILE OF THE CITY The City of Hartford (City) was founded by Thomas Hooker and his followers in 1635 and was incorporated in 1784. It is the Capital of the State of Connecticut and the core of a metropolitan area with a population of over one million people. Hartford has an estimated 125,017 residents in an 18.4 square mile area. The City lies on the west bank of the Connecticut River, midway between New York and Boston. The Mayor is the Chief Executive Officer. The Court of Common Council (Council) is comprised of nine members who are elected at large for four-year terms in odd numbered years on a partisan basis; the Mayor, who is elected directly for a four-year term, acts upon ordinances and resolutions adopted by Council by approving, disapproving or taking no action. The Board of Education (BOE) is composed of nine members; five appointed by the Mayor and
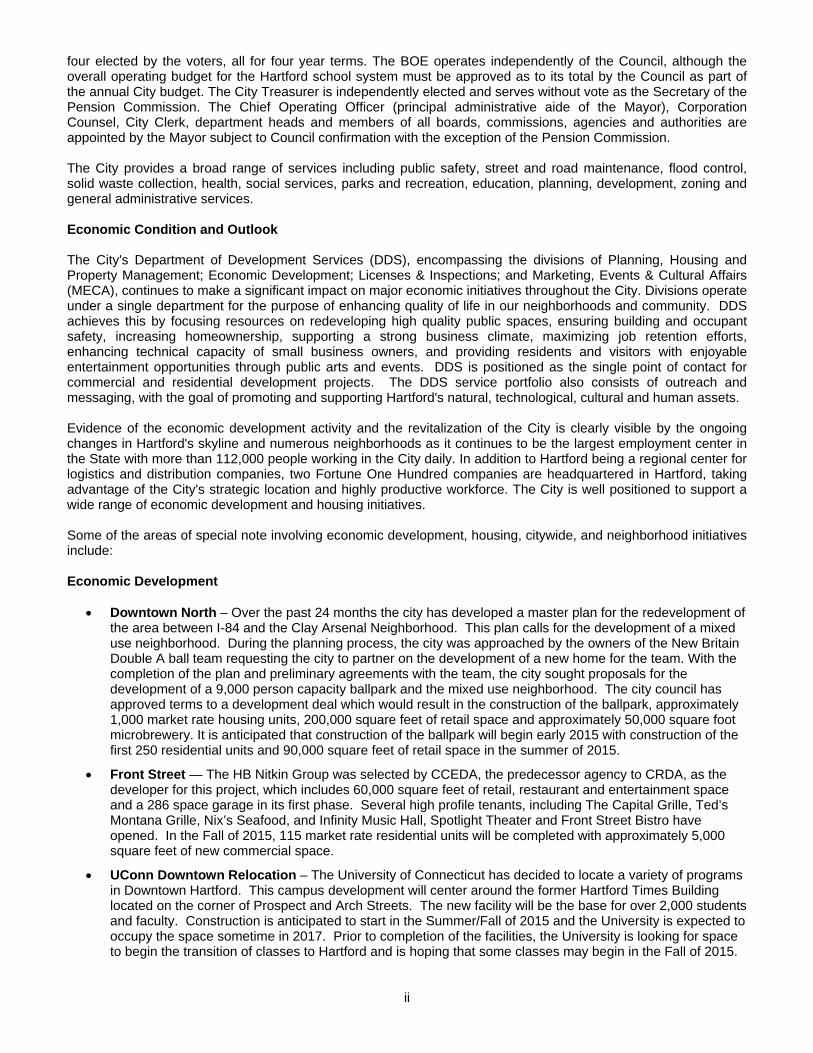
ii
four elected by the voters, all for four year terms. The BOE operates independently of the Council, although the overall operating budget for the Hartford school system must be approved as to its total by the Council as part of the annual City budget. The City Treasurer is independently elected and serves without vote as the Secretary of the Pension Commission. The Chief Operating Officer (principal administrative aide of the Mayor), Corporation Counsel, City Clerk, department heads and members of all boards, commissions, agencies and authorities are appointed by the Mayor subject to Council confirmation with the exception of the Pension Commission. The City provides a broad range of services including public safety, street and road maintenance, flood control, solid waste collection, health, social services, parks and recreation, education, planning, development, zoning and general administrative services. Economic Condition and Outlook The City's Department of Development Services (DDS), encompassing the divisions of Planning, Housing and Property Management; Economic Development; Licenses & Inspections; and Marketing, Events & Cultural Affairs (MECA), continues to make a significant impact on major economic initiatives throughout the City. Divisions operate under a single department for the purpose of enhancing quality of life in our neighborhoods and community. DDS achieves this by focusing resources on redeveloping high quality public spaces, ensuring building and occupant safety, increasing homeownership, supporting a strong business climate, maximizing job retention efforts, enhancing technical capacity of small business owners, and providing residents and visitors with enjoyable entertainment opportunities through public arts and events. DDS is positioned as the single point of contact for commercial and residential development projects. The DDS service portfolio also consists of outreach and messaging, with the goal of promoting and supporting Hartford's natural, technological, cultural and human assets. Evidence of the economic development activity and the revitalization of the City is clearly visible by the ongoing changes in Hartford's skyline and numerous neighborhoods as it continues to be the largest employment center in the State with more than 112,000 people working in the City daily. In addition to Hartford being a regional center for logistics and distribution companies, two Fortune One Hundred companies are headquartered in Hartford, taking advantage of the City's strategic location and highly productive workforce. The City is well positioned to support a wide range of economic development and housing initiatives. Some of the areas of special note involving economic development, housing, citywide, and neighborhood initiatives include: Economic Development
Downtown North – Over the past 24 months the city has developed a master plan for the redevelopment of the area between I-84 and the Clay Arsenal Neighborhood. This plan calls for the development of a mixed use neighborhood. During the planning process, the city was approached by the owners of the New Britain Double A ball team requesting the city to partner on the development of a new home for the team. With the completion of the plan and preliminary agreements with the team, the city sought proposals for the development of a 9,000 person capacity ballpark and the mixed use neighborhood. The city council has approved terms to a development deal which would result in the construction of the ballpark, approximately 1,000 market rate housing units, 200,000 square feet of retail space and approximately 50,000 square foot microbrewery. It is anticipated that construction of the ballpark will begin early 2015 with construction of the first 250 residential units and 90,000 square feet of retail space in the summer of 2015.
Front Street — The HB Nitkin Group was selected by CCEDA, the predecessor agency to CRDA, as the developer for this project, which includes 60,000 square feet of retail, restaurant and entertainment space and a 286 space garage in its first phase. Several high profile tenants, including The Capital Grille, Ted’s Montana Grille, Nix’s Seafood, and Infinity Music Hall, Spotlight Theater and Front Street Bistro have opened. In the Fall of 2015, 115 market rate residential units will be completed with approximately 5,000 square feet of new commercial space.
UConn Downtown Relocation – The University of Connecticut has decided to locate a variety of programs in Downtown Hartford. This campus development will center around the former Hartford Times Building located on the corner of Prospect and Arch Streets. The new facility will be the base for over 2,000 students and faculty. Construction is anticipated to start in the Summer/Fall of 2015 and the University is expected to occupy the space sometime in 2017. Prior to completion of the facilities, the University is looking for space to begin the transition of classes to Hartford and is hoping that some classes may begin in the Fall of 2015.
iii
TIGER/Intermodal Triangle The goal of this project is to strengthen the Capital Region’s economic and
employment core by improving downtown intermodal connections within the Union Station-to-Main Street triangle through creating transit hubs, complete green streets, and the innovative iQuilt pedestrian network. As part of the City’s TIGER Intermodal Triangle project, the following initiatives will be undertaken:
Narrowing of Ford, Jewell, Wells to create a promenade along Bushnell Park North Improvements to Union Station and Union Place to accommodate increased transit. Streetscape improvements along Asylum and Pearl Streets. Plaza improvements around State House Square.
A groundbreaking was held on June 27, 2014. Construction of the Intermodal Triangle is underway.
Downtown Revitalization Plan- DDS has contracted with the University of Hartford to complete a revitalization plan for the downtown that will consist of a highly illustrative vision for the future of the downtown. Project initiation and public outreach is scheduled to begin in January 2015.
HOUSING The City of Hartford is committed to creating a livable and sustainable capital city and has experienced tremendous progress in the last two decades in the area of residential development. More recently, under the direction of Mayor Pedro Segarra, the City has adopted and actively pursued three major housing objectives — reconstructing or renovating antiquated public housing; residential development in the City’s downtown; and increased mixed-income homeownership and rental opportunities. A housing strategy has been initiated with both public and private partners that will grow the city’s tax base, lead to increased economic activity, and encourage residential development that supports a variety of income, age, and ethnic demographics. The City, led by DDS, is working on a City-wide Housing plan that will result in empirical data-driven residential development 3-10 years out. CITYWIDE
Zone Hartford - This project consists of a rewrite of the zoning regulations to create more user friendly regulations and to facilitate the type of development that will enhance the quality of life of our neighborhoods. Although the use of land will still play a significant role in zoning, more significance will be placed on building form and scale. Through this transition in zoning, we hope to influence the creation of walkable mixed use neighborhoods with highly functional nodes of economic activity. Zone Hartford is well underway. A Diagnostic phase analyzing existing conditions in the neighborhoods is 95% complete. A public outreach strategy has been employed for this project that consist of a series of public meetings with the neighborhoods, the formation of a zoning advisory group with community stakeholders and the engagement of a partnership with the Planning and Zoning Commission.
NEIGHBORHOOD
Blue Hills Master Plan – The DDS is partnering with the Blue Hills neighborhood to develop a master plan that will communicate the vision of the neighborhood with a focus centered around housing (homeownership), education and recreation. As part of this master plan DDS will also assist the neighborhood with determining the feasibility of retail in targeted areas of the neighborhood.
Dillon Stadium in CSS/CON – The Council has appropriated $12 million for improvements to be made at the existing Dillon Stadium site. The city selected a firm to work with North American Soccer League for the purpose of establishing a Hartford franchise. Preliminary plans will redevelop the facility into a 9,000 seat premier sports stadium. Plans call to activate the site year-round with entertainment and community venues. The City is working closely with the Sheldon-Charter Oak neighborhood associations to ensure any impacts caused by the stadium’s redevelopment will be resolved. The inaugural season of competition is intended to begin in the spring of 2016.
Coltsville – In July 2010, Colt Gateway LLC took over site control as developer. All 50 completed residential lofts are leased. In addition, the campus is home to two CREC Regional Magnet Schools and Insurity, a software company. In the summer of 2012, Insurity extended the term of its lease at this facility by another seven years. Environmental remediation of the courtyard is scheduled and a new streetscape is
iv
being funded with federal dollars, City funds and State of Connecticut Department of Transportation assistance. The National Trust Community Investment Corporation provided a portion of its New Market Tax Credit (“NMTC”) allocation to Chevron TCI, the historic tax credit investor, resulting in a combined $23 million historic NMTC investment. The City also committed $5 million in funding to assist with the ongoing renovation of 79 apartments within this complex. Coltsville itself was just designated a National Historic Park by Congress.
Swift Factory in the Northeast — Revitalization of the former Swift Factory gold leafing complex in the Northeast neighborhood is underway. The property consists of a 65,000 square foot manufacturing factory, two houses and vacant land. The project will offer affordable workspaces for occupancy by small manufacturing enterprises that will employ Northeast residents, and an urban farm employing and teaching local adults and youth farming skills. This development is one of the major projects listed in the regional Comprehensive Economic Development Strategy (CEDS).
Albany Avenue Streetscape and Safety Improvement Project in Upper Albany -This consist of a 1.1 mile arterial street project involving one of the city’s primary commercial thoroughfares. The project consists of roadway safety improvements, streetscape and pedestrian amenities including sidewalk repairs, curb bump-outs, cross-walks, and traffic signal equipment from Westbourne Parkway to Bedford Street. This project is in the design phase. Construction on this project is anticipated in the Fall of 2016.
REDEVELOPMENT North Meadows IBD Project Area (Block VI) - Block VI in the North Meadows Industrial Business District (IBD) Project Area is comprised of approximately six acres of unimproved land on Leibert Road. Pride Companies, a leading independent retail store chain in Western Massachusetts, has submitted a proposal to the City to develop the Property into a Travel Center for both local and highway motorists. The development would consist of fueling stations and an approximately 12,000 square foot building. Pride is currently completing its due diligence of the site in advance of the City seeking approval for the disposition of the property. Livable and Sustainable Neighborhoods Initiative The Mayor's Livable and Sustainable Neighborhoods Initiative (LSNI) is an interdepartmental effort to improve Hartford's neighborhoods by enforcing the Anti-Blight Ordinance, implementing community development projects, coordinating capital improvements, and engaging neighborhood stakeholders. Among the numerous projects and activities are the Hartford Restoration Project which is a housing program providing financial assistance in the form of deferred loans for to moderate income property owners, Rebuilding Together Day, a partnership to assist the City’s senior citizens and veterans with free home repairs, Community Clean-Up Days where the City partners with community organizations and volunteers in cleaning the neighborhoods of litter, overgrown vegetation and other forms of blight conditions. LSNI sponsors these clean-up day events that are community-based with the goals of (1) cleaning our environment (2) raising community awareness (3) inspiring and empowering our citizenry to conserve our environment.).In collaboration with Keep America Beautiful (KAB) the City has implemented an Education & Prevention pilot program to incorporate litter prevention & solid waste management curriculum into Hartford Public Schools. LONG TERM FINANCIAL PLANNING The City's long-term financial planning is carried out along six primary dimensions: Capital Planning, Debt Planning, Vehicle & Heavy Equipment Replacement, General Fund, Pension Planning and Internal Service Funds. Capital planning and debt planning are by nature closely tied together with future capital needs and ongoing construction providing the input for the debt planning process. Large public works projects are identified and tracked using a five-year Capital Improvement Plan. Projects are selected and reviewed by a capital planning committee led by the Planning Director and comprised of department heads and their designees. The capital plan and projects undergo the annual budget review process and approval of both the Mayor and the Court of Common Council. Once approved the Capital Improvement Program is tracked and monitored by the DPW's Capital Project Director, and a quarterly report is prepared and submitted to the Mayor and Council. Along with the selection of capital projects, sources of funding are identified; state and federal grants as well as bonding or City contributions. Based upon the cumulative cash flow projections of the approved capital plan, bond issuance is planned and debt service requirements quantified.
v
In addition to a 10-year capital and debt service plan, a ten-year vehicle and equipment replacement plan is formulated and reviewed annually. The requested items are reviewed and approved by committee and the appropriate funding sources are identified: City contributions, capital leases or bonding. These discrete planning cycles provide inputs to the General Fund long-term planning process. General Fund revenues and expenditures are forecast over five years by both function and category. The long-term planning process is driven by the City's core strategy to increase long-term economic growth, to promote education, safety and health, and to nurture the City's cultural vitality through the implementation of the Mayor's goals and objectives. In addition, the City continually strives to secure a stronger bond rating through strong fiscal administration and the maintenance of an adequate fund balance. The City is working closely with financial advisors on a plan to improve its bond rating over the near-term and long-term horizons and has contracted with an outside actuarial firm to assist in pension planning. RELEVANT FINANCIAL POLICIES The Department of Finance is organized into four divisions: Administration, Accounting and Control, Revenue (tax assessment, tax collection and revenue control) and Risk Management. The department's major responsibilities include general accounting and financial reporting, accounts payable, risk management (other than employee benefits), property assessment, tax collection, debt administration, revenue management, payroll and revenue budget preparation in conjunction with the Mayor's Office. The Director of Finance is the chief financial officer of the City and is an appointee of the Mayor, subject to confirmation by the Council. Internal Controls All financial transactions are subject to pre-audit before processing as well as to an annual audit by an independent auditing firm selected by the Council. The independent auditor and staff from the department's Accounting and Control Division monitor financial policies and procedures prescribed by the Director of Finance for various departments. Within this framework, we believe that the City's internal accounting controls adequately safeguard assets and provide reasonable assurance of proper recording and reporting of financial activity. Budgetary Control Centralized budgetary control of disbursements and encumbrances against appropriations is maintained by department, by major program or activity and by principal object of expenditure. The Hartford Board of Education (BOE) budget is controlled only as to its total appropriation. The objective of these budgetary controls is to ensure compliance with legal provisions embodied in the annual appropriated budget approved by the Council. Cash Management During the fiscal year, idle cash was invested in legally permitted investments on a short-term basis. Connecticut Statutes restrict the investment of municipal funds to direct and indirect securities of the United States Government and certificates of deposit issued by commercial banks located within the State. Bank CD's are a component of the City's short-term investment portfolio. However, money market fund investments in a portfolio of U.S. Treasury securities, and the Short Term Investment Fund (STIF) operated by the Office of the State Treasurer comprise the major share of the City's short-term investments. Risk Management The City has established a risk management program to account for and finance risk of loss for employee benefits, workers' compensation, and general liability, including property damage. Commercial insurance is purchased for claims in excess of amounts determined to be self-insured under the program. Internal service funds are maintained for each of the three risk management programs and funding is received from the participating funds and functions of the City. Settlement claims have not exceeded either the self-insured retention or the commercial coverage in any of the past three fiscal years.
vi
AWARDS AND ACKNOWLEDGEMENTS The Government Finance Officers Association of the United States and Canada (GFOA) awarded the Certificate of Achievement for Excellence in Financial Reporting to the City for its comprehensive annual financial report (CAFR) for the fiscal year ended June 30, 2013. In order to be awarded a Certificate of Achievement, the government had to publish an easily readable and efficiently organized CAFR that satisfied both generally accepted accounting principles and applicable legal requirements. A Certificate of Achievement is valid for a period of one year only. We believe that our current CAFR continues to meet the Certificate of Achievement Program's requirements and we are submitting it to the GFOA to determine its eligibility for another certificate. The preparation of this report would not have been possible without the efforts of the entire staff of the Finance Department. I would like to express my appreciation to all the members of the Finance Department, especially Rajpaul Singh, Acting Controller, as well as the Accounting and Control Division personnel who assisted and contributed to the preparation of this report. I would also like to acknowledge the efforts of the Office of Management & Budget, Office of the City Treasurer, Department of Development Services, Hartford Public Schools, Hartford Public Library, and the Hartford Parking Authority. Finally, thanks are extended to the City's independent auditors, McGladrey LLP, for their efforts and counsel during the audit and CAFR preparation process. Respectfully submitted,
Leigh Ann Ralls, CPA Acting Director of Finance
vii
viii
ix
CITY OF HARTFORD, CONNECTICUT Mayor-Council Form of Government
List of Elected and Principal Officials - As of June 30, 2014
THE HONORABLE PEDRO E. SEGARRA, MAYOR
The Honorable Court of Common Council Council President – Shawn T. Wooden
Alexander Aponte, Majority Leader Cynthia Renee Jennings
Larry Deutsch, Minority Leader Kenneth H. Kennedy, Jr.Kyle Anderson David MacDonaldRaul De Jesus, Jr. Joel Cruz
The Honorable Adam Cloud - City Treasurer
Appointed and Other Municipal Officials
Chief Operating Officer Darrel Hill
Corporation Counsel Saundra Kee Borges, Esq.Town and City Clerk John V. BazzanoDirector of Finance, Acting Albert IlgController Leigh Ann Ralls, CPAAssessor John PhillipTax Collector Marc S. NelsonRevenue Management Domenic GrecoProcurement Manager Tara WashingtonDirector of Development Services Thomas E., Deller, AICP Director of Management and Budget Jose L. SanchezChief of Police James C. RovellaFire Chief Carlos HuertasDirector of Health and Human Services Raul Pino, Ph.D.Director of Human Resources Henry BurgosDirector of Public Works, Acting Keith Chapman
Hartford Public Schools
Dr. Christina M. Kishimoto Ed. D., Superintendent of Schools
Board of Education Richard F. Wareing, Chairman
Jose Colon-Rivas, Vice Chair Rev. Dr. Shelley Best
Beth A. Taylor, Vice Chair Michael BresciaCraig Stallings, Secretary Robert Cotto, Jr. Matthew K. Poland
Registrars of Voters
Olga Vasquez (D) Sheila Hal (R) Urania Petit (WF)

x
This page intentionally left blank.

Financial Section

1
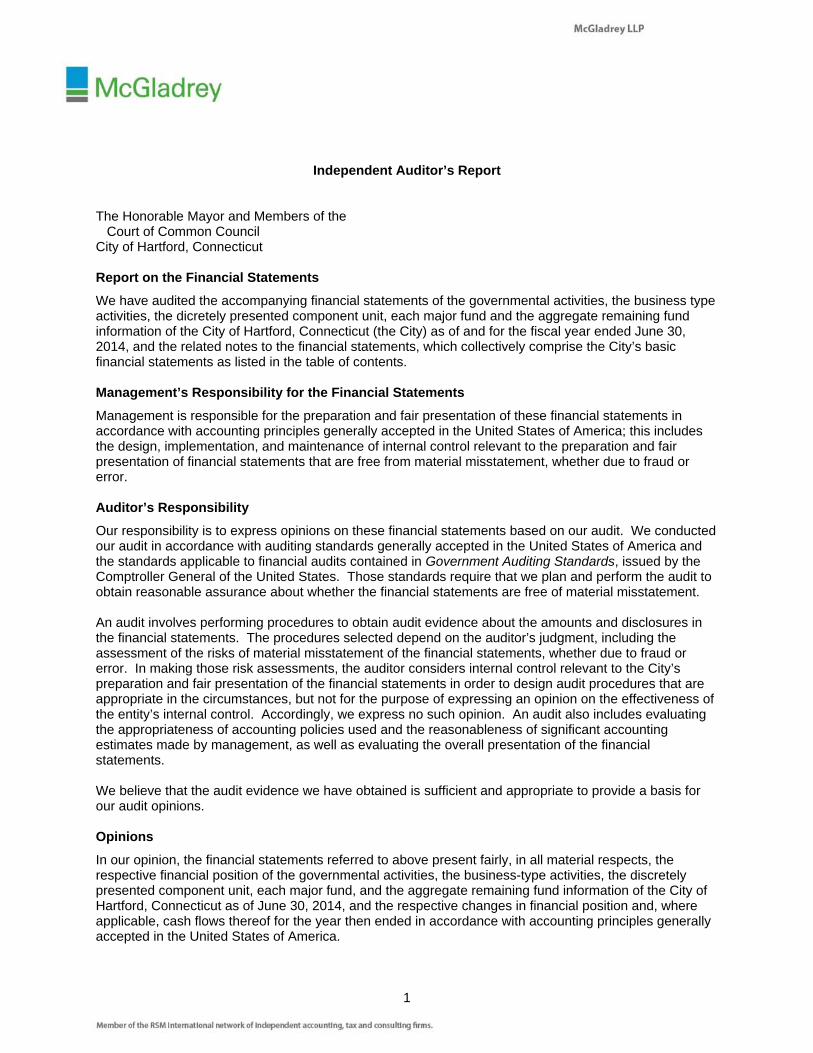
Independent Auditor’s Report The Honorable Mayor and Members of the Court of Common Council City of Hartford, Connecticut Report on the Financial Statements
We have audited the accompanying financial statements of the governmental activities, the business type activities, the dicretely presented component unit, each major fund and the aggregate remaining fund information of the City of Hartford, Connecticut (the City) as of and for the fiscal year ended June 30, 2014, and the related notes to the financial statements, which collectively comprise the City’s basic financial statements as listed in the table of contents. Management’s Responsibility for the Financial Statements
Management is responsible for the preparation and fair presentation of these financial statements in accordance with accounting principles generally accepted in the United States of America; this includes the design, implementation, and maintenance of internal control relevant to the preparation and fair presentation of financial statements that are free from material misstatement, whether due to fraud or error. Auditor’s Responsibility
Our responsibility is to express opinions on these financial statements based on our audit. We conducted our audit in accordance with auditing standards generally accepted in the United States of America and the standards applicable to financial audits contained in Government Auditing Standards, issued by the Comptroller General of the United States. Those standards require that we plan and perform the audit to obtain reasonable assurance about whether the financial statements are free of material misstatement. An audit involves performing procedures to obtain audit evidence about the amounts and disclosures in the financial statements. The procedures selected depend on the auditor’s judgment, including the assessment of the risks of material misstatement of the financial statements, whether due to fraud or error. In making those risk assessments, the auditor considers internal control relevant to the City’s preparation and fair presentation of the financial statements in order to design audit procedures that are appropriate in the circumstances, but not for the purpose of expressing an opinion on the effectiveness of the entity’s internal control. Accordingly, we express no such opinion. An audit also includes evaluating the appropriateness of accounting policies used and the reasonableness of significant accounting estimates made by management, as well as evaluating the overall presentation of the financial statements. We believe that the audit evidence we have obtained is sufficient and appropriate to provide a basis for our audit opinions. Opinions
In our opinion, the financial statements referred to above present fairly, in all material respects, the respective financial position of the governmental activities, the business-type activities, the discretely presented component unit, each major fund, and the aggregate remaining fund information of the City of Hartford, Connecticut as of June 30, 2014, and the respective changes in financial position and, where applicable, cash flows thereof for the year then ended in accordance with accounting principles generally accepted in the United States of America.
2
Other Matters
Required Supplementary Information
Accounting principles generally accepted in the United States of America require that the management discussion and analysis on pages 3-10, the budgetary comparison information on pages 69-73, the schedules of funding progress and employee contributions on pages 74-76, the schedule of changes in the City’s net pension liability and related ratios on page 77 be presented to supplement the basic financial statements. Such information, although not a part of the basic financial statements, is required by the Governmental Accounting Standards Board who considers it to be an essential part of financial reporting for placing the basic financial statements in an appropriate operational, economic, or historical context. We have applied certain limited procedures to the required supplementary information in accordance with auditing standards generally accepted in the United States of America, which consisted of inquiries of management about the methods of preparing the information and comparing the information for consistency with management’s responses to our inquiries, the basic financial statements, and other knowledge we obtained during our audit of the basic financial statements. We do not express an opinion or provide any assurance on the information because the limited procedures do not provide us with sufficient evidence to express an opinion or provide any assurance. Supplementary and Other Information
Our audit was conducted for the purpose of forming opinions on the financial statements that collectively comprise the City of Hartford Connecticut’s basic financial statements. The introductory section, the individual and combining fund financial statements and other schedules, and statistical section are presented for purposes of additional analysis and are not a required part of the basic financial statements. The combining and individual fund financial statements and other schedules are the responsibility of management and were derived from and relates directly to the underlying accounting and other records used to prepare the basic financial statements. Such information has been subjected to the auditing procedures applied in the audit of the basic financial statements and certain additional procedures, including comparing and reconciling such information directly to the underlying accounting and other records used to prepare the basic financial statements or to the basic financial statements themselves, and other additional procedures in accordance with auditing standards generally accepted in the United States of America. In our opinion, the combining and individual fund financial statements and other schedules are fairly stated, in all material respects, in relation to the basic financial statements as a whole. The introductory section and statistical section have not been subjected to the auditing procedures applied in the audit of the basic financial statements and, accordingly, we do not express an opinion or provide any assurance on them. Other Reporting Required by Government Auditing Standards
In accordance with Government Auditing Standards, we have also issued our report dated January 23, 2015, on our consideration of the City’s internal control over financial reporting and on our tests of its compliance with certain provisions of laws, regulations, contracts, and grant agreements and other matters. The purpose of that report is to describe the scope of our testing of internal control over financial reporting and compliance and the results of that testing, and not to provide an opinion on internal control over financial reporting or on compliance. That report is an integral part of an audit performed in accordance with Government Auditing Standards in considering the Authority’s internal control over financial reporting and compliance.
New Haven, Connecticut January 23, 2015
3
City of Hartford, Connecticut Management’s Discussion and Analysis - Unaudited
June 30, 2014 This discussion and analysis of the City of Hartford, Connecticut's (City) financial performance is provided by management to provide an overview of the City's financial activities for the fiscal year ended June 30, 2014. Please read this MD&A in conjunction with the transmittal letter beginning on page i and the City's financial statements, Exhibits I to IX.
Financial Highlights
The City's total net position decreased $39.0 million as a result of this year's operations. The net position of our governmental activities decreased by $30.9 million, or nearly 2.8%. The net position of our business-type activities decreased by $8.2 million.
The City received $18.6 million in capital grants and contributions related to school building construction grants from the State in support of the City's school renovation and construction projects, and for various public works projects.
The total cost of the City's programs for the year was $902.5 million with no new programs added.
The General Fund reported a fund balance this year of $16.9 million including an assignment of $3.9 million.
The revenues available for appropriation and other financing sources were $2.6 million more than budgeted for the General Fund and expenditures and other financing sources were $3.9 million less than budgeted amount of $551.4 million. The unassigned balance of $13.0 million decreased $14.5 million, which represents in part a planned use of fund balance of $9.4 million.
Major items that contributed to the revenue surplus are: increased amount received from intergovernmental revenues, which were a favorable variance of $5.8 million. This is partially offset by an unfavorable variance in tax revenue of $.7 million and an unfavorable variance of $2.6 million in premiums from bond sales.
Major items that contributed to the expenditure surplus of $3.9 million are favorable surpluses in benefits and insurance of $1.3 million, debt service of $0.6 million, and health and human services of $0.5 million.
Overview of the Financial Statements This annual report consists of a series of financial statements. The statement of net position and the statement of activities (Exhibits I and II, respectively) provide information about the activities of the City as a whole and present a longer-term view of the City's finances. Fund financial statements are presented in Exhibits III to IX. For governmental activities, these statements tell how these services were financed in the short term as well as what remains for future spending. Fund financial statements also report the City's operations in more detail than the government-wide statements by providing information about the City's most significant funds. The remaining statements provide financial information about activities for which the City acts solely as a trustee or agent for the benefit of those outside of the government. Government-Wide Financial Statements The analysis of the City as a whole begins on Exhibits I and II. The statement of net position and the statement of activities report information about the City as a whole and about its activities for the current period. These statements include all assets and liabilities using the accrual basis of accounting, which is similar to the accounting used by most private-sector companies. All of the current year's revenues and expenses are taken into account regardless of when cash is received or paid.
4
These two statements report the City's net position and changes in them. The City's net position, the difference between assets and liabilities, is one way to measure the City's financial health, or financial position. Over time, increases or decreases in the City's net position are one indicator of whether its financial health is improving or deteriorating. The reader needs to consider other non-financial factors, however, such as changes in the City's property tax base and the condition of the City's capital assets, to assess the overall health of the City. In the statement of net position and the statement of activities, we divide the City into three types of activities:
Governmental activities - Most of the City's basic services are reported here, including education, public safety, public works, development and community affairs, human services, recreation and culture, and general administration. Property taxes, charges for services, and state and federal grants finance most of these activities.
Business - type activities - The City charges a fee to customers to help it cover all or most of the cost of certain services it provides. The City's Hartford Parking Facilities Fund is reported here.
Component units - The City includes a separate legal entity in its report; the Hartford Parking Authority. Although legally separate, this "component unit" is reported because the City is financially accountable for them.
Fund Financial Statements The fund financial statements begin with Exhibit III and provide detailed information about the most significant funds - not the City as a whole. Some funds are required to be established by Charter. However, the City Council establishes many other funds to help control and manage financial activities for particular purposes (like the Capital Improvement Fund) or to show that it is meeting legal responsibilities for using grants, and other money (like grants received from the Educational Grants, Health Grants and Miscellaneous Grants Funds). The City's funds are divided into three categories; governmental, proprietary and fiduciary.
Governmental funds (Exhibits III and IV) - Most of the City's basic services are reported in governmental funds, which focus on how money flows into and out of those funds and the balances left at year-end that are available for spending. These funds are reported using an accounting method called modified accrual accounting, which measures cash and all other financial assets that can readily be converted to cash. The governmental fund statements provide a detailed short-term view of the City's general government operations and the basic services it provides. Governmental fund information helps you determine whether there are more or fewer financial resources that can be spent in the near future to finance the City's programs. The relationship (or differences) between governmental activities (reported in the statement of net position and the statement of activities) and governmental funds is described in a reconciliation at the bottom of the fund financial statements.
Proprietary funds (Exhibits V, VI, and VII) - When the City charges customers for the services it provides, whether to outside customers or to other units of the City, these services are generally reported in proprietary funds. Proprietary funds are reported in the same way that all activities are reported in the statement of net position and the statement of activities. In fact the City's enterprise funds (a component of proprietary funds) are the same as the business-type activities reported in the government-wide statements, but provide more detail and additional information, such as cash flows, for proprietary funds. Internal service funds (the other component of proprietary funds) are used to report activities that provide supplies and services for the City's other programs and activities - such as the City's Self-Insurance Internal Service Funds and the City's Metro Hartford Information Services Fund.
Fiduciary funds (Exhibits VIII and IX) - The City is the trustee, or fiduciary, for its employees' pension plans. It is also responsible for other assets that, because of a trust arrangement, can be used only for the trust beneficiaries. All of the City's fiduciary activities are reported in separate
5
statements of fiduciary net position and changes in fiduciary net position. These activities are excluded from the City's other financial statements because the City cannot use these assets to finance its operations. The City is responsible for ensuring that the assets reported in these funds are used for their intended purposes.
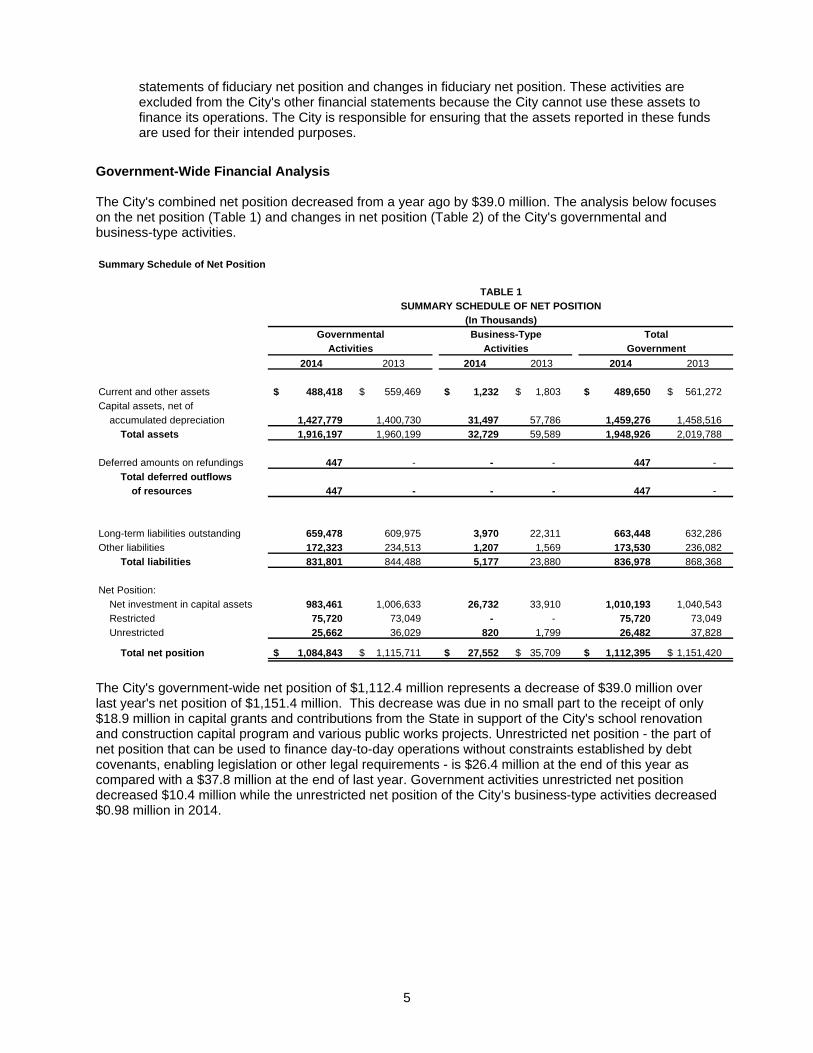
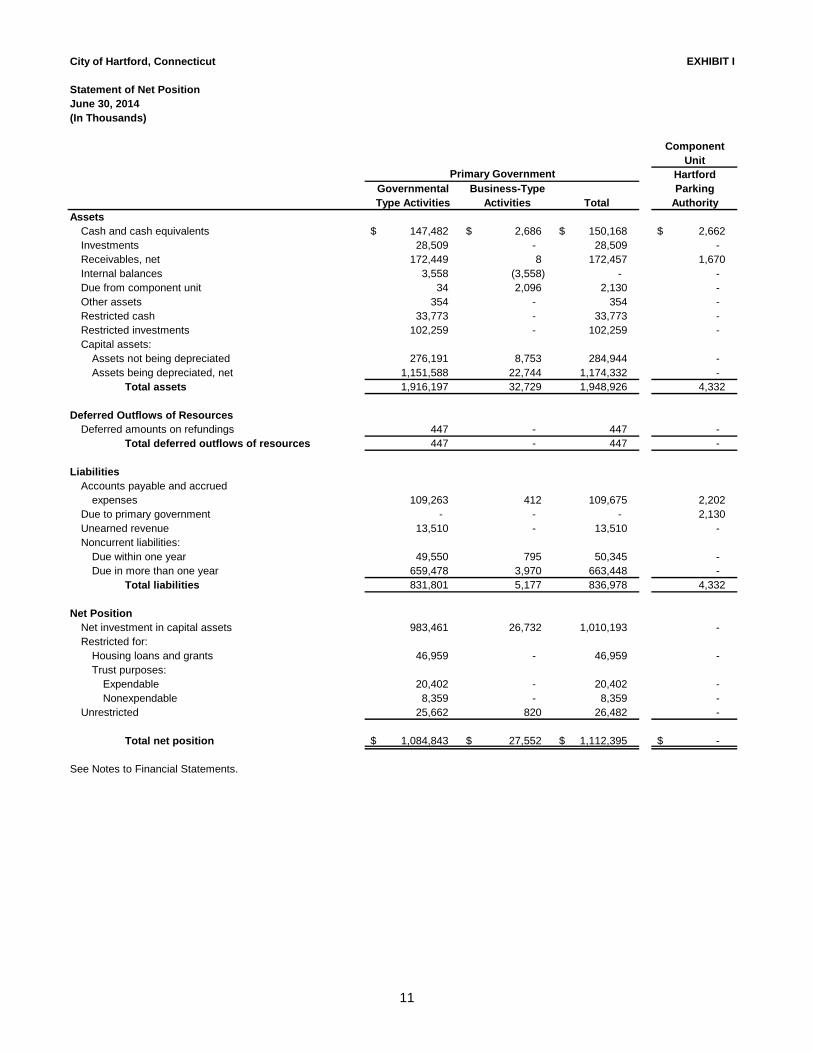
Government-Wide Financial Analysis The City's combined net position decreased from a year ago by $39.0 million. The analysis below focuses on the net position (Table 1) and changes in net position (Table 2) of the City's governmental and business-type activities. Summary Schedule of Net Position
2014 2013 2014 2013 2014 2013
Current and other assets 488,418 $ 559,469 $ 1,232 $ 1,803 $ 489,650 $ 561,272 $
Capital assets, net of
accumulated depreciation 1,427,779 1,400,730 31,497 57,786 1,459,276 1,458,516
Total assets 1,916,197 1,960,199 32,729 59,589 1,948,926 2,019,788
Deferred amounts on refundings 447 - - - 447 -
Total deferred outflows
of resources 447 - - - 447 -
Long-term liabilities outstanding 659,478 609,975 3,970 22,311 663,448 632,286
Other liabilities 172,323 234,513 1,207 1,569 173,530 236,082
Total liabilities 831,801 844,488 5,177 23,880 836,978 868,368
Net Position:
Net investment in capital assets 983,461 1,006,633 26,732 33,910 1,010,193 1,040,543
Restricted 75,720 73,049 - - 75,720 73,049
Unrestricted 25,662 36,029 820 1,799 26,482 37,828
Total net position 1,084,843 $ 1,115,711 $ 27,552 $ 35,709 $ 1,112,395 $ 1,151,420 $
Activities Activities Government
TABLE 1
SUMMARY SCHEDULE OF NET POSITION
(In Thousands)
Governmental Business-Type Total
The City's government-wide net position of $1,112.4 million represents a decrease of $39.0 million over last year's net position of $1,151.4 million. This decrease was due in no small part to the receipt of only $18.9 million in capital grants and contributions from the State in support of the City's school renovation and construction capital program and various public works projects. Unrestricted net position - the part of net position that can be used to finance day-to-day operations without constraints established by debt covenants, enabling legislation or other legal requirements - is $26.4 million at the end of this year as compared with a $37.8 million at the end of last year. Government activities unrestricted net position decreased $10.4 million while the unrestricted net position of the City’s business-type activities decreased $0.98 million in 2014.
6
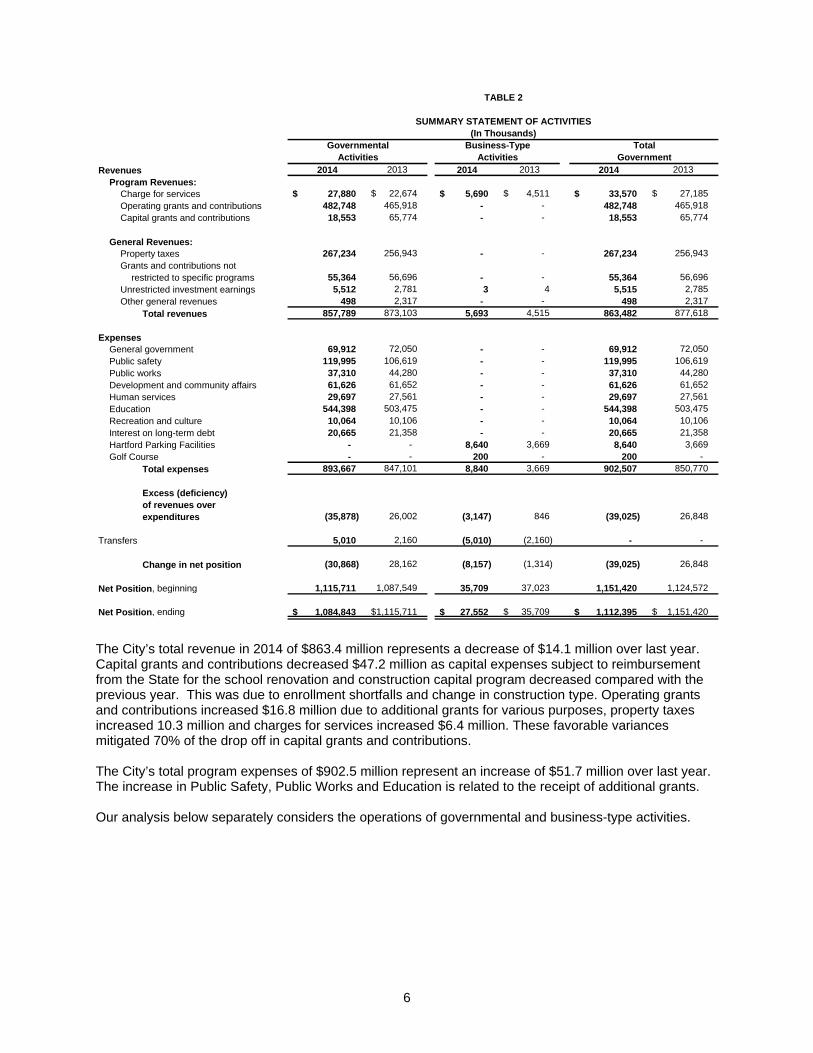
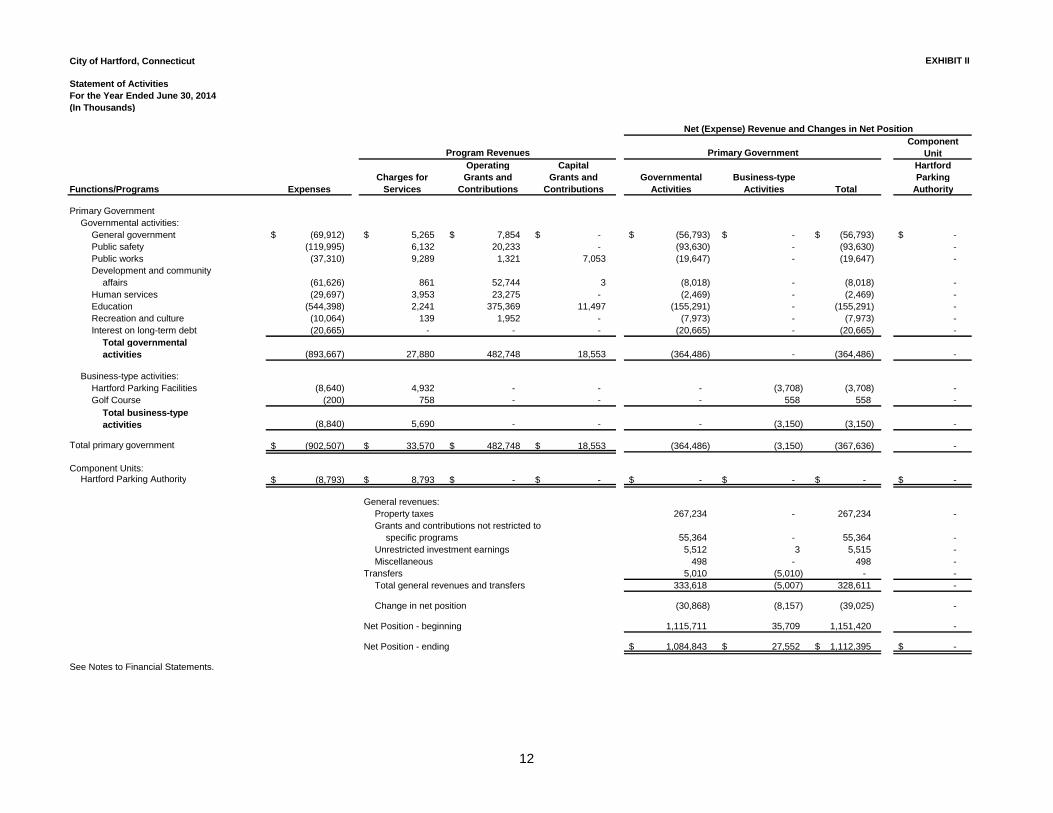
Revenues 2014 2013 2014 2013 2014 2013Program Revenues:
Charge for services 27,880 $ 22,674 $ 5,690 $ 4,511 $ 33,570 $ 27,185 $ Operating grants and contributions 482,748 465,918 - - 482,748 465,918 Capital grants and contributions 18,553 65,774 - - 18,553 65,774
General Revenues:Property taxes 267,234 256,943 - - 267,234 256,943 Grants and contributions not
restricted to specific programs 55,364 56,696 - - 55,364 56,696 Unrestricted investment earnings 5,512 2,781 3 4 5,515 2,785 Other general revenues 498 2,317 - - 498 2,317
Total revenues 857,789 873,103 5,693 4,515 863,482 877,618
ExpensesGeneral government 69,912 72,050 - - 69,912 72,050 Public safety 119,995 106,619 - - 119,995 106,619 Public works 37,310 44,280 - - 37,310 44,280 Development and community affairs 61,626 61,652 - - 61,626 61,652 Human services 29,697 27,561 - - 29,697 27,561 Education 544,398 503,475 - - 544,398 503,475 Recreation and culture 10,064 10,106 - - 10,064 10,106 Interest on long-term debt 20,665 21,358 - - 20,665 21,358 Hartford Parking Facilities - - 8,640 3,669 8,640 3,669 Golf Course - - 200 - 200 -
Total expenses 893,667 847,101 8,840 3,669 902,507 850,770
Excess (deficiency) of revenues overexpenditures (35,878) 26,002 (3,147) 846 (39,025) 26,848
Transfers 5,010 2,160 (5,010) (2,160) - -
Change in net position (30,868) 28,162 (8,157) (1,314) (39,025) 26,848
Net Position, beginning 1,115,711 1,087,549 35,709 37,023 1,151,420 1,124,572
Net Position, ending 1,084,843 $ 1,115,711 $ 27,552 $ 35,709 $ 1,112,395 $ 1,151,420 $
Activities Activities Government
TABLE 2
SUMMARY STATEMENT OF ACTIVITIES(In Thousands)
Governmental Business-Type Total
The City’s total revenue in 2014 of $863.4 million represents a decrease of $14.1 million over last year. Capital grants and contributions decreased $47.2 million as capital expenses subject to reimbursement from the State for the school renovation and construction capital program decreased compared with the previous year. This was due to enrollment shortfalls and change in construction type. Operating grants and contributions increased $16.8 million due to additional grants for various purposes, property taxes increased 10.3 million and charges for services increased $6.4 million. These favorable variances mitigated 70% of the drop off in capital grants and contributions. The City’s total program expenses of $902.5 million represent an increase of $51.7 million over last year. The increase in Public Safety, Public Works and Education is related to the receipt of additional grants. Our analysis below separately considers the operations of governmental and business-type activities.
7
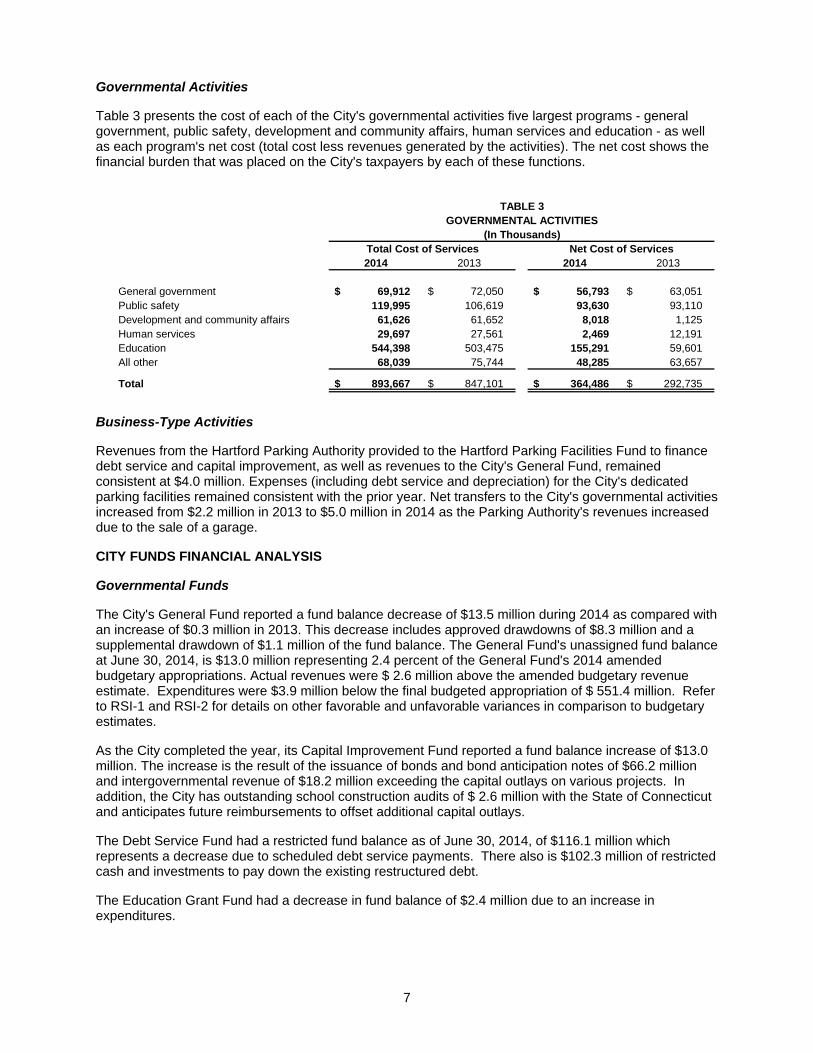
Governmental Activities Table 3 presents the cost of each of the City's governmental activities five largest programs - general government, public safety, development and community affairs, human services and education - as well as each program's net cost (total cost less revenues generated by the activities). The net cost shows the financial burden that was placed on the City's taxpayers by each of these functions.
2014 2013 2014 2013
General government 69,912 $ 72,050 $ 56,793 $ 63,051 $ Public safety 119,995 106,619 93,630 93,110 Development and community affairs 61,626 61,652 8,018 1,125 Human services 29,697 27,561 2,469 12,191 Education 544,398 503,475 155,291 59,601 All other 68,039 75,744 48,285 63,657
Total 893,667 $ 847,101 $ 364,486 $ 292,735 $
TABLE 3GOVERNMENTAL ACTIVITIES
(In Thousands)Total Cost of Services Net Cost of Services
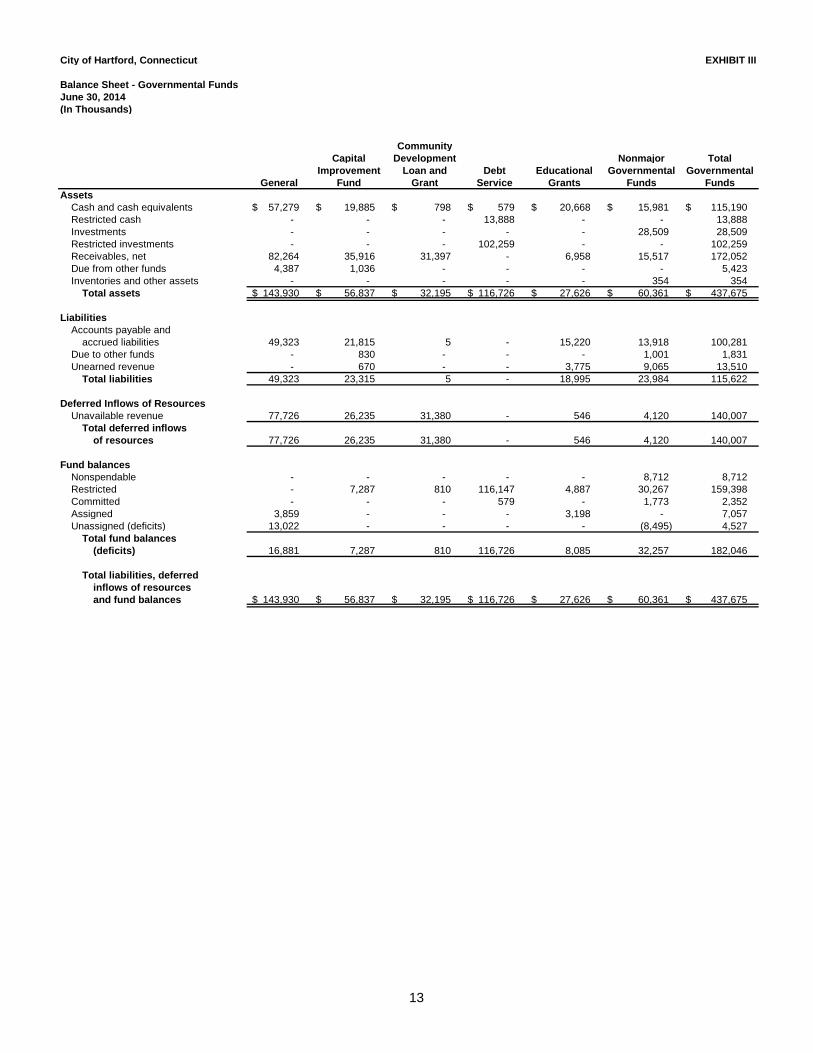
Business-Type Activities Revenues from the Hartford Parking Authority provided to the Hartford Parking Facilities Fund to finance debt service and capital improvement, as well as revenues to the City's General Fund, remained consistent at $4.0 million. Expenses (including debt service and depreciation) for the City's dedicated parking facilities remained consistent with the prior year. Net transfers to the City's governmental activities increased from $2.2 million in 2013 to $5.0 million in 2014 as the Parking Authority's revenues increased due to the sale of a garage. CITY FUNDS FINANCIAL ANALYSIS Governmental Funds The City's General Fund reported a fund balance decrease of $13.5 million during 2014 as compared with an increase of $0.3 million in 2013. This decrease includes approved drawdowns of $8.3 million and a supplemental drawdown of $1.1 million of the fund balance. The General Fund's unassigned fund balance at June 30, 2014, is $13.0 million representing 2.4 percent of the General Fund's 2014 amended budgetary appropriations. Actual revenues were $ 2.6 million above the amended budgetary revenue estimate. Expenditures were $3.9 million below the final budgeted appropriation of $ 551.4 million. Refer to RSI-1 and RSI-2 for details on other favorable and unfavorable variances in comparison to budgetary estimates. As the City completed the year, its Capital Improvement Fund reported a fund balance increase of $13.0 million. The increase is the result of the issuance of bonds and bond anticipation notes of $66.2 million and intergovernmental revenue of $18.2 million exceeding the capital outlays on various projects. In addition, the City has outstanding school construction audits of $ 2.6 million with the State of Connecticut and anticipates future reimbursements to offset additional capital outlays. The Debt Service Fund had a restricted fund balance as of June 30, 2014, of $116.1 million which represents a decrease due to scheduled debt service payments. There also is $102.3 million of restricted cash and investments to pay down the existing restructured debt. The Education Grant Fund had a decrease in fund balance of $2.4 million due to an increase in expenditures.
8
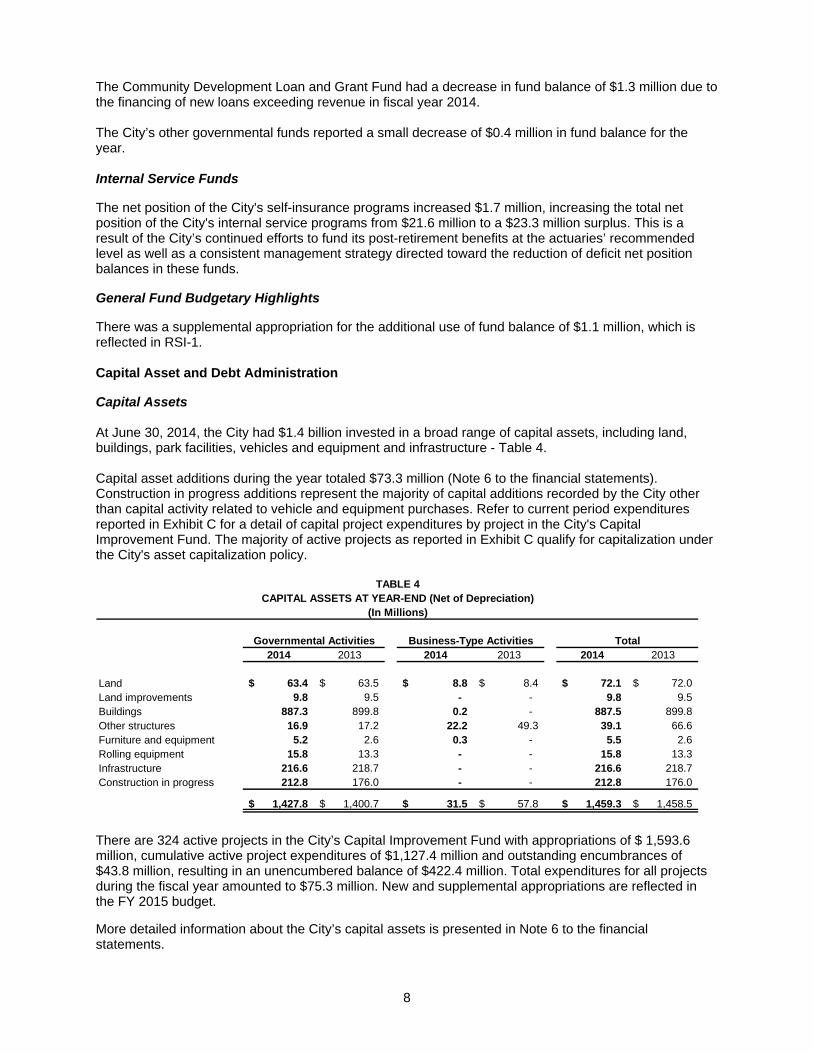
The Community Development Loan and Grant Fund had a decrease in fund balance of $1.3 million due to the financing of new loans exceeding revenue in fiscal year 2014. The City’s other governmental funds reported a small decrease of $0.4 million in fund balance for the year. Internal Service Funds The net position of the City's self-insurance programs increased $1.7 million, increasing the total net position of the City's internal service programs from $21.6 million to a $23.3 million surplus. This is a result of the City’s continued efforts to fund its post-retirement benefits at the actuaries’ recommended level as well as a consistent management strategy directed toward the reduction of deficit net position balances in these funds. General Fund Budgetary Highlights There was a supplemental appropriation for the additional use of fund balance of $1.1 million, which is reflected in RSI-1. Capital Asset and Debt Administration Capital Assets At June 30, 2014, the City had $1.4 billion invested in a broad range of capital assets, including land, buildings, park facilities, vehicles and equipment and infrastructure - Table 4. Capital asset additions during the year totaled $73.3 million (Note 6 to the financial statements). Construction in progress additions represent the majority of capital additions recorded by the City other than capital activity related to vehicle and equipment purchases. Refer to current period expenditures reported in Exhibit C for a detail of capital project expenditures by project in the City's Capital Improvement Fund. The majority of active projects as reported in Exhibit C qualify for capitalization under the City's asset capitalization policy.
TABLE 4CAPITAL ASSETS AT YEAR-END (Net of Depreciation)
(In Millions)
2014 2013 2014 2013 2014 2013
Land 63.4$ 63.5$ 8.8$ 8.4$ 72.1$ 72.0$ Land improvements 9.8 9.5 - - 9.8 9.5 Buildings 887.3 899.8 0.2 - 887.5 899.8 Other structures 16.9 17.2 22.2 49.3 39.1 66.6 Furniture and equipment 5.2 2.6 0.3 - 5.5 2.6 Rolling equipment 15.8 13.3 - - 15.8 13.3 Infrastructure 216.6 218.7 - - 216.6 218.7 Construction in progress 212.8 176.0 - - 212.8 176.0
1,427.8$ 1,400.7$ 31.5$ 57.8$ 1,459.3$ 1,458.5$
Governmental Activities Business-Type Activities Total
There are 324 active projects in the City’s Capital Improvement Fund with appropriations of $ 1,593.6 million, cumulative active project expenditures of $1,127.4 million and outstanding encumbrances of $43.8 million, resulting in an unencumbered balance of $422.4 million. Total expenditures for all projects during the fiscal year amounted to $75.3 million. New and supplemental appropriations are reflected in the FY 2015 budget. More detailed information about the City’s capital assets is presented in Note 6 to the financial statements.
9
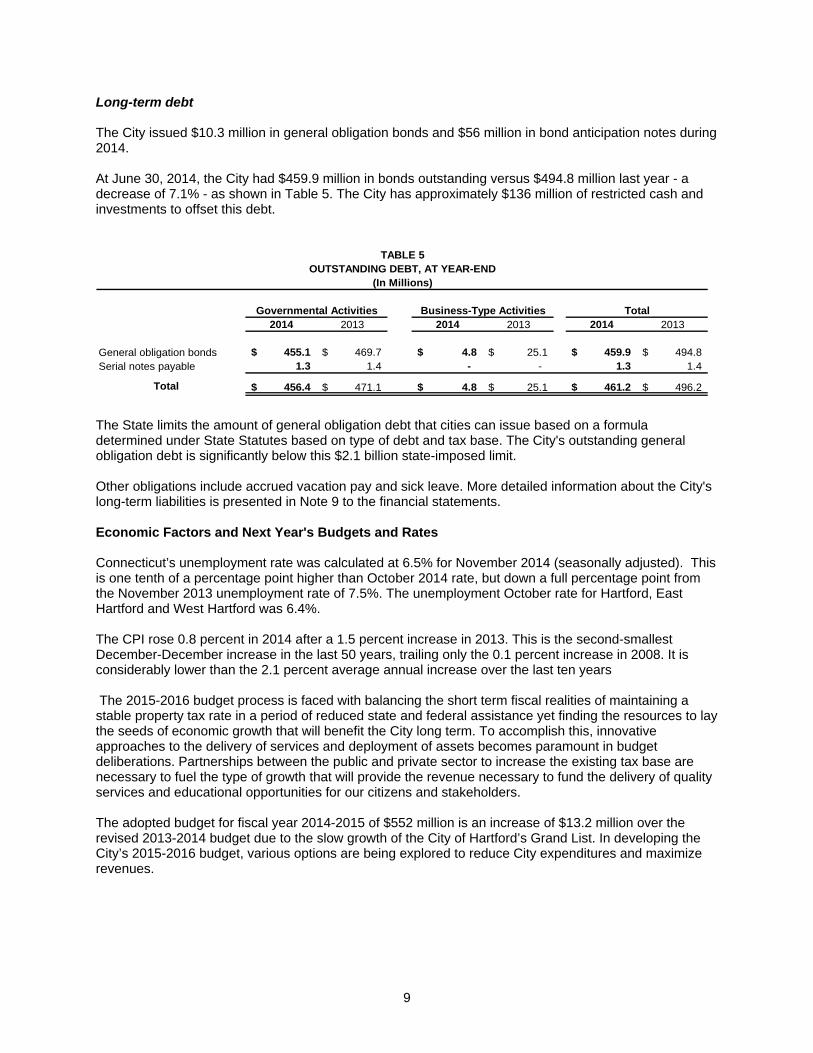
Long-term debt The City issued $10.3 million in general obligation bonds and $56 million in bond anticipation notes during 2014. At June 30, 2014, the City had $459.9 million in bonds outstanding versus $494.8 million last year - a decrease of 7.1% - as shown in Table 5. The City has approximately $136 million of restricted cash and investments to offset this debt.
TABLE 5OUTSTANDING DEBT, AT YEAR-END
(In Millions)
2014 2013 2014 2013 2014 2013
General obligation bonds 455.1$ 469.7$ 4.8$ 25.1$ 459.9$ 494.8$ Serial notes payable 1.3 1.4 - - 1.3 1.4
Total 456.4$ 471.1$ 4.8$ 25.1$ 461.2$ 496.2$
Governmental Activities Business-Type Activities Total
The State limits the amount of general obligation debt that cities can issue based on a formula determined under State Statutes based on type of debt and tax base. The City's outstanding general obligation debt is significantly below this $2.1 billion state-imposed limit. Other obligations include accrued vacation pay and sick leave. More detailed information about the City's long-term liabilities is presented in Note 9 to the financial statements. Economic Factors and Next Year's Budgets and Rates Connecticut’s unemployment rate was calculated at 6.5% for November 2014 (seasonally adjusted). This is one tenth of a percentage point higher than October 2014 rate, but down a full percentage point from the November 2013 unemployment rate of 7.5%. The unemployment October rate for Hartford, East Hartford and West Hartford was 6.4%. The CPI rose 0.8 percent in 2014 after a 1.5 percent increase in 2013. This is the second-smallest December-December increase in the last 50 years, trailing only the 0.1 percent increase in 2008. It is considerably lower than the 2.1 percent average annual increase over the last ten years The 2015-2016 budget process is faced with balancing the short term fiscal realities of maintaining a stable property tax rate in a period of reduced state and federal assistance yet finding the resources to lay the seeds of economic growth that will benefit the City long term. To accomplish this, innovative approaches to the delivery of services and deployment of assets becomes paramount in budget deliberations. Partnerships between the public and private sector to increase the existing tax base are necessary to fuel the type of growth that will provide the revenue necessary to fund the delivery of quality services and educational opportunities for our citizens and stakeholders. The adopted budget for fiscal year 2014-2015 of $552 million is an increase of $13.2 million over the revised 2013-2014 budget due to the slow growth of the City of Hartford’s Grand List. In developing the City’s 2015-2016 budget, various options are being explored to reduce City expenditures and maximize revenues.
10
Contacting the City’s Financial Management This financial report is designed to provide citizens, taxpayers, customers, investors, and creditors with a general overview of the City’s finances and to show the City’s accountability for the money it receives. If you have questions about this report or need additional financial information, contact the Finance Department, City of Hartford, 550 Main Street, Hartford, Connecticut 06103, or by telephone (860) 757-9600.

Basic Financial Statements

11
City of Hartford, Connecticut EXHIBIT I
Statement of Net PositionJune 30, 2014(In Thousands)
ComponentUnit
HartfordGovernmental Business-Type ParkingType Activities Activities Total Authority
AssetsCash and cash equivalents 147,482 $ 2,686 $ 150,168 $ 2,662 $ Investments 28,509 - 28,509 - Receivables, net 172,449 8 172,457 1,670 Internal balances 3,558 (3,558) - - Due from component unit 34 2,096 2,130 - Other assets 354 - 354 - Restricted cash 33,773 - 33,773 - Restricted investments 102,259 - 102,259 - Capital assets:
Assets not being depreciated 276,191 8,753 284,944 - Assets being depreciated, net 1,151,588 22,744 1,174,332 -
Total assets 1,916,197 32,729 1,948,926 4,332
Deferred Outflows of ResourcesDeferred amounts on refundings 447 - 447 -
Total deferred outflows of resources 447 - 447 -
LiabilitiesAccounts payable and accrued
expenses 109,263 412 109,675 2,202 Due to primary government - - - 2,130 Unearned revenue 13,510 - 13,510 - Noncurrent liabilities:
Due within one year 49,550 795 50,345 - Due in more than one year 659,478 3,970 663,448 -
Total liabilities 831,801 5,177 836,978 4,332
Net PositionNet investment in capital assets 983,461 26,732 1,010,193 - Restricted for:
Housing loans and grants 46,959 - 46,959 - Trust purposes:
Expendable 20,402 - 20,402 - Nonexpendable 8,359 - 8,359 -
Unrestricted 25,662 820 26,482 -
Total net position 1,084,843 $ 27,552 $ 1,112,395 $ -$
See Notes to Financial Statements.
Primary Government
12
City of Hartford, Connecticut EXHIBIT II
For the Year Ended June 30, 2014(In Thousands)
ComponentUnit
Operating Capital HartfordCharges for Grants and Grants and Governmental Business-type Parking
Functions/Programs Expenses Services Contributions Contributions Activities Activities Total Authority
Primary GovernmentGovernmental activities:
General government (69,912) $ 5,265 $ 7,854 $ -$ (56,793) $ -$ (56,793) $ -$ Public safety (119,995) 6,132 20,233 - (93,630) - (93,630) - Public works (37,310) 9,289 1,321 7,053 (19,647) - (19,647) - Development and community
affairs (61,626) 861 52,744 3 (8,018) - (8,018) - Human services (29,697) 3,953 23,275 - (2,469) - (2,469) - Education (544,398) 2,241 375,369 11,497 (155,291) - (155,291) - Recreation and culture (10,064) 139 1,952 - (7,973) - (7,973) - Interest on long-term debt (20,665) - - - (20,665) - (20,665) -
Total governmental activities (893,667) 27,880 482,748 18,553 (364,486) - (364,486) -
Business-type activities:Hartford Parking Facilities (8,640) 4,932 - - - (3,708) (3,708) - Golf Course (200) 758 - - - 558 558 -
Total business-typeactivities (8,840) 5,690 - - - (3,150) (3,150) -
Total primary government (902,507) $ 33,570 $ 482,748 $ 18,553 $ (364,486) (3,150) (367,636) -
Component Units:Hartford Parking Authority (8,793) $ 8,793 $ -$ -$ -$ -$ -$ -$
General revenues:Property taxes 267,234 - 267,234 - Grants and contributions not restricted to
specific programs 55,364 - 55,364 - Unrestricted investment earnings 5,512 3 5,515 - Miscellaneous 498 - 498 -
Transfers 5,010 (5,010) - - Total general revenues and transfers 333,618 (5,007) 328,611 -
Change in net position (30,868) (8,157) (39,025) -
Net Position - beginning 1,115,711 35,709 1,151,420 -
Net Position - ending 1,084,843 $ 27,552 $ 1,112,395 $ -$
See Notes to Financial Statements.
Statement of Activities
Program Revenues Primary Government
Net (Expense) Revenue and Changes in Net Position
13
City of Hartford, Connecticut EXHIBIT III
Balance Sheet - Governmental FundsJune 30, 2014(In Thousands)
CommunityCapital Development Nonmajor Total
Improvement Loan and Debt Educational Governmental GovernmentalGeneral Fund Grant Service Grants Funds Funds
AssetsCash and cash equivalents 57,279 $ 19,885 $ 798 $ 579 $ 20,668 $ 15,981 $ 115,190 $ Restricted cash - - - 13,888 - - 13,888 Investments - - - - - 28,509 28,509 Restricted investments - - - 102,259 - - 102,259 Receivables, net 82,264 35,916 31,397 - 6,958 15,517 172,052 Due from other funds 4,387 1,036 - - - - 5,423 Inventories and other assets - - - - - 354 354
Total assets 143,930 $ 56,837 $ 32,195 $ 116,726 $ 27,626 $ 60,361 $ 437,675 $
LiabilitiesAccounts payable and
accrued liabilities 49,323 21,815 5 - 15,220 13,918 100,281 Due to other funds - 830 - - - 1,001 1,831 Unearned revenue - 670 - - 3,775 9,065 13,510
Total liabilities 49,323 23,315 5 - 18,995 23,984 115,622
Deferred Inflows of ResourcesUnavailable revenue 77,726 26,235 31,380 - 546 4,120 140,007
Total deferred inflows of resources 77,726 26,235 31,380 - 546 4,120 140,007
Fund balancesNonspendable - - - - - 8,712 8,712 Restricted - 7,287 810 116,147 4,887 30,267 159,398 Committed - - - 579 - 1,773 2,352 Assigned 3,859 - - - 3,198 - 7,057 Unassigned (deficits) 13,022 - - - - (8,495) 4,527
Total fund balances (deficits) 16,881 7,287 810 116,726 8,085 32,257 182,046
Total liabilities, deferred inflows of resources and fund balances 143,930 $ 56,837 $ 32,195 $ 116,726 $ 27,626 $ 60,361 $ 437,675 $
14
City of Hartford, Connecticut EXHIBIT III
Reconciliation of Fund Balance to Net Position of Governmental Activities June 30, 2014(In Thousands)
Reconciliation of the Balance Sheet - Governmental Funds to the Statement of Net Position:Amounts reported for governmental activities in the statement of net position (Exhibit I) are
different because of the following:
Fund balances - total governmental funds (Exhibit III) 182,046 $
Capital assets used in governmental activities are not financialresources and, therefore, are not reported in the funds:
Governmental capital assets 2,133,731 $ Less accumulated depreciation (705,952) Net capital assets 1,427,779
Assets not available to pay for current-period expenditures and,therefore, are recorded as unavailable revenue in the funds:
Property tax receivables 49,952 Interest receivable on property taxes 17,154 Receivable from the State for school construction projects 7,424 Housing loans 31,380 Other receivables 34,097
Internal service funds are used by management to charge the costs ofrisk management to individual funds. The assets and liabilities ofthe internal service funds are reported with governmental activitiesin the statement of net position. 23,268
Long-term liabilities, including bonds payable, are not due and payablein the current period and, therefore, are not reported in the funds:
Bonds and notes payable (511,100) Interest payable on bonds and notes (6,535) Compensated absences (36,036) HUD loans (7,610) Capital leases (7,879) Clean Water Fund serial note (1,322) Net OPEB obligation (72,892) Net pension obligation (3,843) Claims and judgments (2,600) Bond premium (38,887) Deferred charges on refunding 447
Net Position of Governmental Activities (Exhibit I) 1,084,843 $
See Notes to Financial Statements.
15
City of Hartford, Connecticut EXHIBIT IV
Statement of Revenues, Expenditures and Changes in Fund Balances -Governmental FundsFor the Year Ended June 30, 2014(In Thousands)
CommunityCapital Development Nonmajor Total
Improvement Loan and Debt Educational Governmental GovernmentalGeneral Fund Grant Service Grants Funds Funds
RevenuesProperty taxes 256,765 $ -$ -$ -$ -$ -$ 256,765 $ Licenses, permits, and other charges 6,555 - - - - - 6,555 Intergovernmental revenues 286,236 18,229 - - 115,422 119,533 539,420 Charges for services 3,589 - - - - 14,238 17,827 Use of property 3,227 - - - - - 3,227 Investment income 489 - 159 - - 4,864 5,512 Miscellaneous 498 169 982 - 11,690 1,954 15,293
Total revenues 557,359 18,398 1,141 - 127,112 140,589 844,599
ExpendituresCurrent:
General government 19,384 - - - - 8,462 27,846 Public safety 74,778 - - - - 21,917 96,695 Public works 13,761 (1,560) - - - 128 12,329 Development and community affairs 4,739 - 2,406 - - 53,010 60,155 Human services 4,441 - - - - 24,128 28,569 Education 321,535 - - - 131,614 17,296 470,445 Recreation and culture 7,863 - - - - 2,264 10,127 Benefits and insurance 86,898 - - - - - 86,898 Other 21,019 - - - - - 21,019
Capital outlay - 71,730 - - - 4,549 76,279 Debt service - 1,480 - 46,851 - 5,987 54,318
Total expenditures 554,418 71,650 2,406 46,851 131,614 137,741 944,680
Excess (deficiency) of revenuesover expenditures 2,941 (53,252) (1,265) (46,851) (4,502) 2,848 (100,081)
Other Financing Sources (Uses)Transfers in 10,430 - - 25,360 2,074 1,108 38,972 Transfers out (26,868) - - - - (7,094) (33,962) Lease proceeds - - - - - 2,758 2,758 Issuance of bonds - 10,250 - - - - 10,250 Issuance of bond anticipation notes - 56,000 - - - - 56,000
Total other financingsources (uses) (16,438) 66,250 - 25,360 2,074 (3,228) 74,018
Net change in fund balances (13,497) 12,998 (1,265) (21,491) (2,428) (380) (26,063)
Fund Balances, beginningof year 30,378 (5,711) 2,075 138,217 10,513 32,637 208,109
Fund Balances, end of year 16,881 $ 7,287 $ 810 $ 116,726 $ 8,085 $ 32,257 $ 182,046 $
16
City of Hartford, Connecticut EXHIBIT IV
Reconciliation of the Statement of Revenues, Expenditures and Changes in Fund BalancesGovernmental Funds to the Statement of Activities For the Year Ended June 30, 2014(In Thousands)
Amounts reported for governmental activities in the statement of activities are different because:
Net change in fund balances - total governmental funds (Exhibit IV) (26,063) $
Governmental funds report capital outlays as expenditures. In the statement of activities, the cost of those assets is allocated over their estimated useful lives and reported as depreciation expense:
Capital outlay 73,293 Loss on disposal (427) Depreciation expense (45,817)
Changes in some revenues in the statement of activities that do not provide current financialresources are not reported as revenues in the funds.
School building grant (1,785) Property tax receivable 7,737 Property tax interest and lien revenue 2,732 Housing loans 637 Intergovernmental revenue on school bonds and other 3,870
The issuance of long-term debt (e.g., bonds, leases) provides current financial resources to governmental funds, while the repayment of the principal of long-term debt consumes the current financial resources of governmental funds. Neither transaction has any effect on net position. Also, governmental funds report the effect of premiums, discounts and similar items when debt is first issued, whereas these amounts are amortized and deferred in the statement of activities.
Bond and series note principal payments 24,835 Issuance of bonds (66,250) Lease proceeds (4,780) Accrued interest on bonds - accrual basis change 136 HUD loan principal payments 4,658 CWF serial note 90 Capital lease payments 1,082 Amortization of deferred charge on refunding (183) Amortization of bond premium 2,457
Changes in some expenses reported in the statement of activities do not require the use of current financial resources and, therefore, are not reported as expenditures in the governmental funds.
Compensated absences (362) Change in pension and other postemployment benefit liabilities (8,382)
Internal service funds are used by management to charge costs to individual funds. The net revenue of certain activities of internal services funds is reported with governmental activities 1,654
Change in Net Position of Governmental Activities (Exhibit II) (30,868) $
See Notes to Financial Statements.
17
City of Hartford, Connecticut EXHIBIT V
Statement of Net Position - Proprietary FundsJune 30, 2014(In Thousands)
GovernmentalActivities
Hartford InternalParking Golf Service
Facilities Course Total FundsAssets
Current AssetsCash and cash equivalents 2,383 $ 303 $ 2,686 $ 52,177 $ Receivables, net - 8 8 397 Due from component unit 2,096 - 2,096 -
Total current assets 4,479 311 4,790 52,574
Capital Assets, Net 30,815 682 31,497 -
Total assets 35,294 993 36,287 52,574
Liabilities
Current LiabilitiesAccounts payable and other payables 377 35 412 2,447 Due to other funds 3,558 - 3,558 - Risk management claims - - - 17,659 Bonds payable 795 - 795 -
Total current liabilities 4,730 35 4,765 20,106
Noncurrent LiabilitiesRisk management claims - - - 9,200 Bonds payable 3,970 - 3,970 -
Total noncurrent liabilities 3,970 - 3,970 9,200
Total liabilities 8,700 35 8,735 29,306
Net PositionNet investment in capital assets 26,050 682 26,732 - Unrestricted 544 276 820 23,268
Total net position 26,594 $ 958 $ 27,552 $ 23,268 $
See Notes to Financial Statements.
Business-Type Activities
18
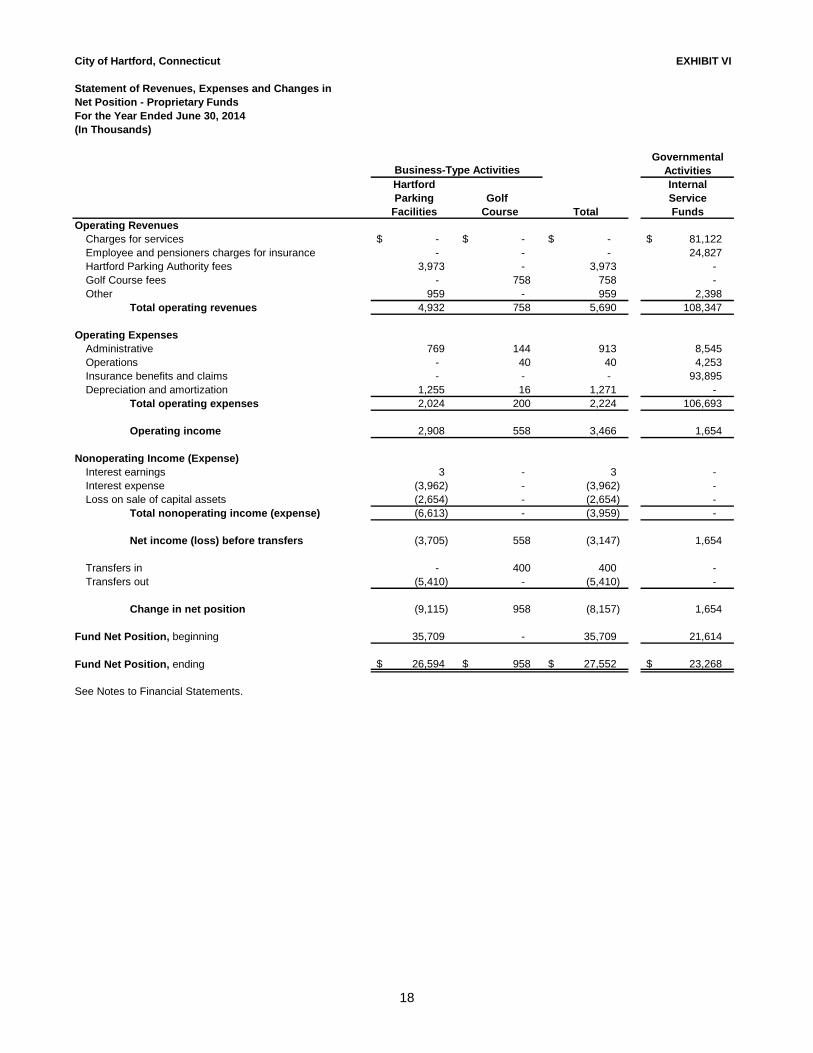
City of Hartford, Connecticut EXHIBIT VI
Statement of Revenues, Expenses and Changes inNet Position - Proprietary FundsFor the Year Ended June 30, 2014(In Thousands)
GovernmentalActivities
Hartford InternalParking Golf Service
Facilities Course Total FundsOperating Revenues
Charges for services -$ -$ -$ 81,122 $ Employee and pensioners charges for insurance - - - 24,827 Hartford Parking Authority fees 3,973 - 3,973 - Golf Course fees - 758 758 - Other 959 - 959 2,398
Total operating revenues 4,932 758 5,690 108,347
Operating ExpensesAdministrative 769 144 913 8,545 Operations - 40 40 4,253 Insurance benefits and claims - - - 93,895 Depreciation and amortization 1,255 16 1,271 -
Total operating expenses 2,024 200 2,224 106,693
Operating income 2,908 558 3,466 1,654
Nonoperating Income (Expense)Interest earnings 3 - 3 - Interest expense (3,962) - (3,962) - Loss on sale of capital assets (2,654) - (2,654) -
Total nonoperating income (expense) (6,613) - (3,959) -
Net income (loss) before transfers (3,705) 558 (3,147) 1,654
Transfers in - 400 400 - Transfers out (5,410) - (5,410) -
Change in net position (9,115) 958 (8,157) 1,654
Fund Net Position, beginning 35,709 - 35,709 21,614
Fund Net Position, ending 26,594 $ 958 $ 27,552 $ 23,268 $
See Notes to Financial Statements.
Business-Type Activities
19
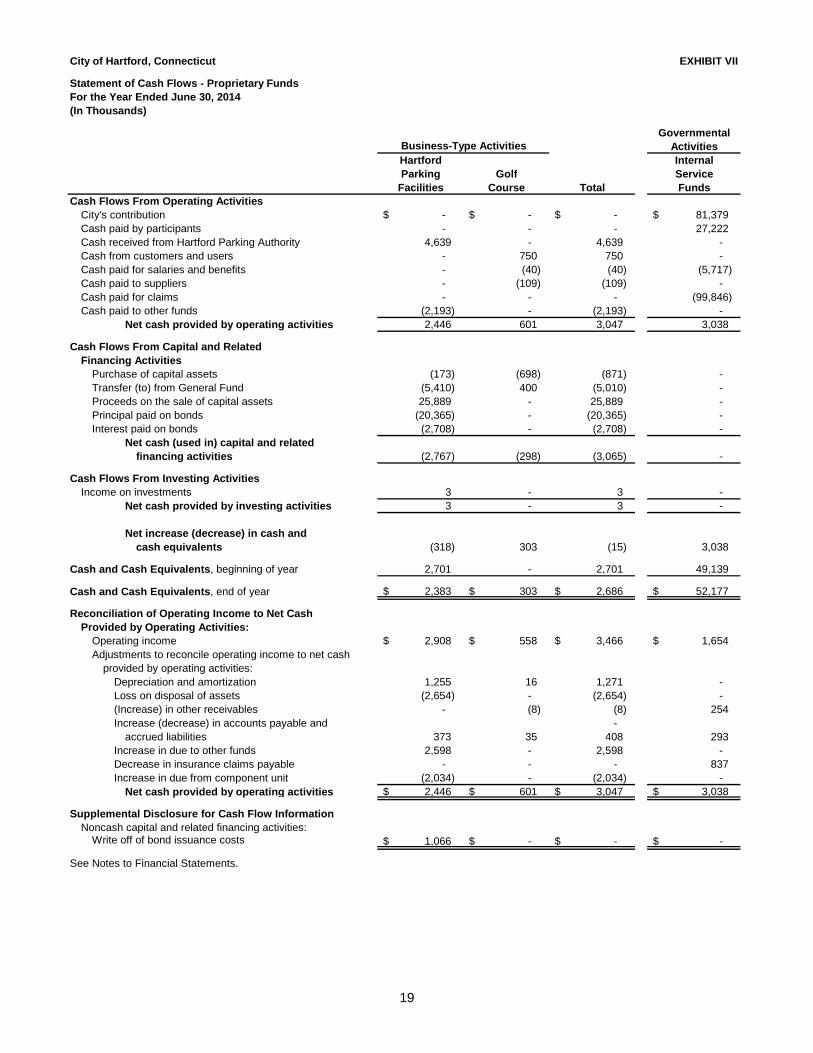
City of Hartford, Connecticut EXHIBIT VII
Statement of Cash Flows - Proprietary FundsFor the Year Ended June 30, 2014(In Thousands)
GovernmentalActivities
Hartford InternalParking Golf Service
Facilities Course Total FundsCash Flows From Operating Activities
City's contribution -$ -$ -$ 81,379 $ Cash paid by participants - - - 27,222 Cash received from Hartford Parking Authority 4,639 - 4,639 - Cash from customers and users - 750 750 - Cash paid for salaries and benefits - (40) (40) (5,717) Cash paid to suppliers - (109) (109) - Cash paid for claims - - - (99,846) Cash paid to other funds (2,193) - (2,193) -
Net cash provided by operating activities 2,446 601 3,047 3,038
Cash Flows From Capital and Related Financing Activities
Purchase of capital assets (173) (698) (871) - Transfer (to) from General Fund (5,410) 400 (5,010) - Proceeds on the sale of capital assets 25,889 - 25,889 - Principal paid on bonds (20,365) - (20,365) - Interest paid on bonds (2,708) - (2,708) -
Net cash (used in) capital and relatedfinancing activities (2,767) (298) (3,065) -
Cash Flows From Investing ActivitiesIncome on investments 3 - 3 -
Net cash provided by investing activities 3 - 3 -
Net increase (decrease) in cash and cash equivalents (318) 303 (15) 3,038
Cash and Cash Equivalents, beginning of year 2,701 - 2,701 49,139
Cash and Cash Equivalents, end of year 2,383 $ 303 $ 2,686 $ 52,177 $
Reconciliation of Operating Income to Net Cash Provided by Operating Activities:
Operating income 2,908 $ 558 $ 3,466 $ 1,654 $ Adjustments to reconcile operating income to net cash
provided by operating activities:Depreciation and amortization 1,255 16 1,271 - Loss on disposal of assets (2,654) - (2,654) - (Increase) in other receivables - (8) (8) 254 Increase (decrease) in accounts payable and -
accrued liabilities 373 35 408 293 Increase in due to other funds 2,598 - 2,598 - Decrease in insurance claims payable - - - 837 Increase in due from component unit (2,034) - (2,034) -
Net cash provided by operating activities 2,446 $ 601 $ 3,047 $ 3,038 $
Supplemental Disclosure for Cash Flow InformationNoncash capital and related financing activities:
Write off of bond issuance costs 1,066 $ -$ -$ -$
See Notes to Financial Statements.
Business-Type Activities
20
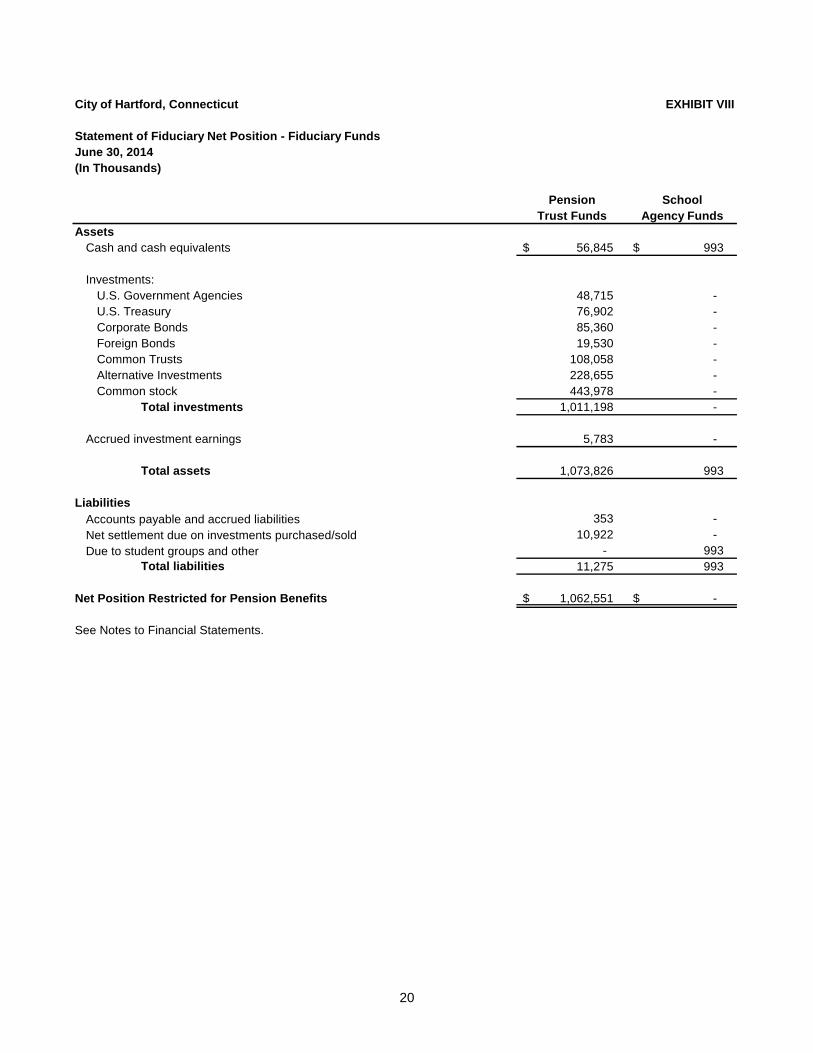
City of Hartford, Connecticut EXHIBIT VIII
Statement of Fiduciary Net Position - Fiduciary FundsJune 30, 2014(In Thousands)
Pension SchoolTrust Funds Agency Funds
AssetsCash and cash equivalents 56,845 $ 993 $
Investments:U.S. Government Agencies 48,715 - U.S. Treasury 76,902 - Corporate Bonds 85,360 - Foreign Bonds 19,530 - Common Trusts 108,058 - Alternative Investments 228,655 - Common stock 443,978 -
Total investments 1,011,198 -
Accrued investment earnings 5,783 -
Total assets 1,073,826 993
LiabilitiesAccounts payable and accrued liabilities 353 - Net settlement due on investments purchased/sold 10,922 - Due to student groups and other - 993
Total liabilities 11,275 993
Net Position Restricted for Pension Benefits 1,062,551 $ -$
See Notes to Financial Statements.
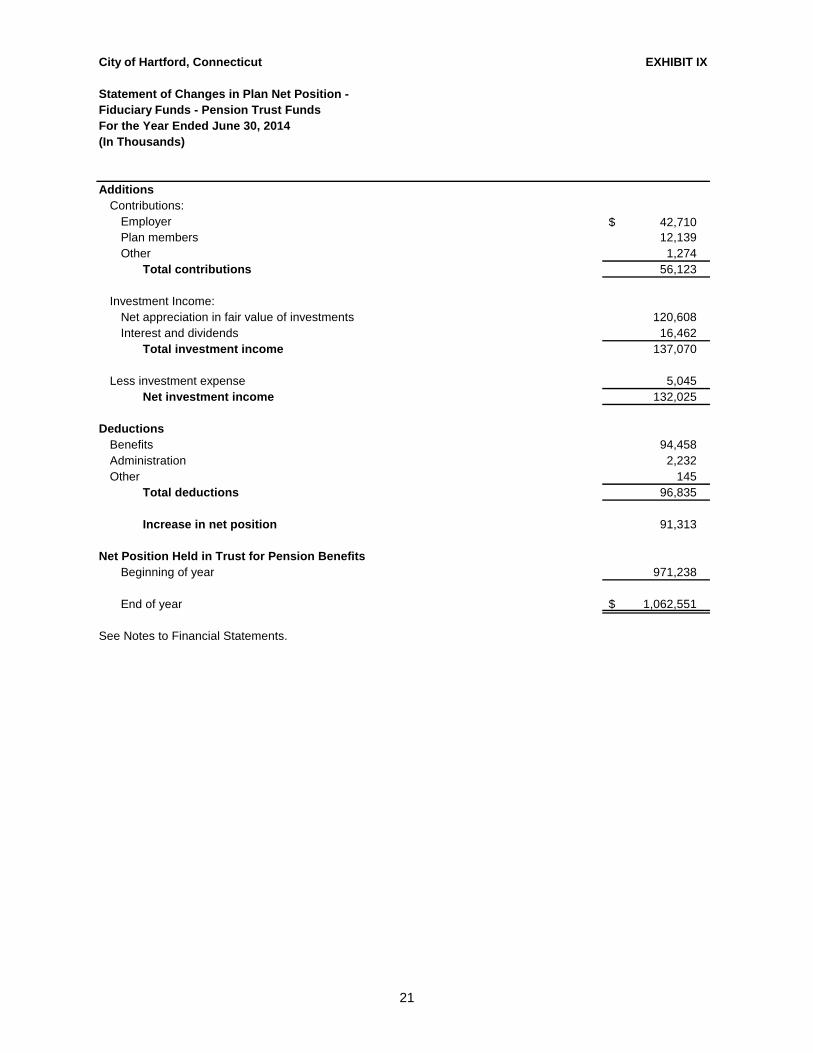
21
City of Hartford, Connecticut EXHIBIT IX
Statement of Changes in Plan Net Position -Fiduciary Funds - Pension Trust FundsFor the Year Ended June 30, 2014(In Thousands)
AdditionsContributions:
Employer 42,710 $ Plan members 12,139 Other 1,274
Total contributions 56,123
Investment Income:Net appreciation in fair value of investments 120,608 Interest and dividends 16,462
Total investment income 137,070
Less investment expense 5,045 Net investment income 132,025
DeductionsBenefits 94,458 Administration 2,232 Other 145
Total deductions 96,835
Increase in net position 91,313
Net Position Held in Trust for Pension Benefits Beginning of year 971,238
End of year 1,062,551 $
See Notes to Financial Statements.
City of Hartford, Connecticut Notes to Financial Statements (In Thousands)
22
Note 1. Summary of Significant Accounting Policies
The financial statements of the City of Hartford, Connecticut (the City) have been prepared in conformity with accounting principles generally accepted in the United States of America (GAAP) as applied to government units. The Governmental Accounting Standards Board (GASB) is the accepted standard setting body for establishing governmental accounting and financial reporting principles. The more significant policies of the City are described below. Reporting Entity: The City of Hartford, Connecticut was incorporated May 29, 1784, and the City consolidated in April, 1896. The City operates under a Mayor-Council form of government and provides a full range of services including public safety, roads, solid waste collection, health, social services, culture and recreation, education, planning, development, zoning and general administrative services. Accounting principles generally accepted in the United States of America require that the reporting entity include (1) the primary government; (2) organizations for which the primary government is financially accountable; and (3) other organizations for which the nature and significance of their relationship with the primary government are such that exclusion would cause the reporting entity's financial statements to be misleading or incomplete. The criteria provided in Government Accounting Standards Board Codification 2100 have been considered, as a result, the component unit discussed below is included in the City's reporting entity because of its operational significance or financial relationship with the City. Discretely Presented Component Unit: Discretely presented component units are reported in a separate column in the government-wide financial statements to emphasize that they are legally separate from the City. They are financially accountable to the City, or have relationships with the City such that exclusion would cause the reporting entity's financial statements to be misleading or incomplete. For each discretely presented component unit the potential exists for a financial burden or benefit to be imposed on the City as a result of the existence of the component unit. For the discretely presented component units included in the City’s financial statements, the City, generally acting through the Mayor, appoints a voting majority of the component units’ governing boards. The Hartford Parking Authority (the Authority) was created pursuant to Chapter 100 of the General Statutes of Connecticut and is governed by five members appointed by the Mayor. The purpose of the Authority is to create, establish, finance, maintain, and operate the City of Hartford’s dedicated parking facilities, and regulate the uses and parking rates to be charged at other regulated parking facilities. The Authority is reported as a component unit as the Mayor appoints and the City Council approves its governing board of 5 members. Accounting Standards Adopted in the Current Year: GASB Statement No. 65, Items Previously Reported as Assets and Liabilities, was implemented as July 1, 2013. This statement clarified the appropriate reporting of deferred outflows of resources and deferred inflows of resources to ensure consistency in financial reporting. As a result of the adoption of this standard, deferred amounts on refundings were required to be reclassified to Deferred Outflows of Resources. In addition, amounts previously classified as deferred revenue were reclassified as deferred inflows of resources.
City of Hartford, Connecticut Notes to Financial Statements (In Thousands)
23
Note 1. Summary of Significant Accounting Policies (Continued)
GASB Statement No. 67, Financial Reporting for Pension Plans an amendment of GASB Statement No. 25, issued in June 2012, was effective for the City as of July 1, 2013 as the plans are part of the City’s financial statements. This Statement replaces the requirements of Statements No. 25, Financial Reporting for Defined Benefit Pension Plans and Note Disclosures for Defined Contribution Plans, and Statement No. 50, Pension Disclosures, as they relate to pension plans that are administered through trusts or equivalent arrangements (hereafter jointly referred to as trusts) that meet certain criteria. The implementation of this statement had a material impact on the City’s financial statements due to the significant new disclosures. GASB Statement No. 70, Accounting and Financial Reporting for Nonexchange Financial Guarantees, became effective on July 1, 2013. This statement provides guidance to governments that extend and receive nonexchange financial guarantees. The implementation of this statement had no impact on the City’s financial statements.
Government-wide and Fund Financial Statements: The government-wide financial statements (i.e., the statement of net position and the statement of activities) report information on all of the nonfiduciary activities of the City and its component unit. For the most part, the effect of interfund activity has been removed from these statements. Governmental activities, which normally are supported by taxes and intergovernmental revenues, are reported separately from business-type activities, which rely to a significant extent on fees and charges for support. Likewise, the City is reported separately from certain legally separate component units for which the primary government is financially accountable. The statement of activities demonstrates the degree to which the direct expenses of a given function or segment are offset by program revenues. Direct expenses are those that are clearly identifiable with a specific function or segment. Program revenues include 1) charges to customers or applicants who purchase, use, or directly benefit from goods, services, or privileges provided by a given function or segment and 2) grants and contributions that are restricted to meeting the operational or capital requirements of a particular function or segment. Taxes and other items not properly included among program revenues are reported instead as general revenues. Separate financial statements are provided for governmental funds, proprietary funds, and fiduciary funds, even though the latter are excluded from the government-wide financial statements. Major individual governmental funds and major individual enterprise funds are reported as separate columns in the fund financial statements. The various fund types included in the financial statements are described below: Governmental Funds: Governmental Funds are those through which most governmental functions typically are financed.
General Fund - the primary operating fund of the City. This fund is used to account for all financial transactions and resources except those required to be accounted for in another fund. Revenues are derived primarily from property taxes, state and federal grants, licenses, permits, charges for service, and interest income. Special Revenue Funds - accounts for specific revenue sources that are restricted or committed to expenditures for specific purposes other than debt service of capital projects. Debt Service Fund - accounts for the payment of principal and interest on general long-term debt of the City.
City of Hartford, Connecticut Notes to Financial Statements (In Thousands)
24
Note 1. Summary of Significant Accounting Policies (Continued)
Capital Project Funds - accounts for all financial resources used for the acquisition or construction of major capital facilities not being financed by proprietary funds. Permanent Funds - used to report resources that are legally restricted to the extent that only earnings, and not principal, may be used for purposes that support the City’s programs.
Proprietary Funds: Proprietary funds are used to account for activities that are similar to those often found in the private sector. These funds are accounted for on the flow of economic resources measurement focus and use the accrual basis of accounting. The following are the City’s proprietary funds:
Enterprise Funds - account for operations that are financed in a manner similar to private business enterprises, where the intent is that costs of providing goods or services to the general public on a continuing basis be financed or recovered primarily through user charges. The reported enterprise funds of the City accounts for activities of the Hartford Parking Facilities and the Golf Course. Internal Service Funds - account for the financing of goods or services provided by one department to other departments or agencies of the City on a cost-reimbursement basis. The reported internal service funds of the City include self-insured funds for Employee Benefits, Workers’ Compensation, and Liability and Property Damage and a fund used to account for the centralized operations of the Metro Hartford Information Services.
Fiduciary Funds: Fiduciary Funds are used to account for assets held by the City in a trustee capacity or as an agent for individuals, private organizations, and other governments. Fiduciary funds are not included in the government-wide statements. The fiduciary funds are as follows:
Pension Trust Funds - account for the Municipal Employees’ Retirement System.
Agency Funds - are custodial in nature (assets equal liabilities). Agency Funds apply the accrual basis of accounting but do not involve measurement of results of operation. The School System Student Activity Fund and Adult Education Book Fund are the City’s only agency funds.
Measurement Focus, Basis of Accounting, and Financial Statement Presentation: The government-wide financial statements are reported using the economic resources measurement focus and the accrual basis of accounting, as are the proprietary fund and fiduciary fund financial statements (except for agency funds which have no measurement focus). Revenues are recorded when earned and expenses are recorded when a liability is incurred, regardless of the timing of related cash flows. Property taxes are recognized as revenues in the year for which they are levied for. Grants and similar items are recognized as revenue as soon as all eligibility requirements imposed by the provider have been met. Governmental fund financial statements are reported using the current financial resources measurement focus and the modified accrual basis of accounting. Revenues are recognized as soon as they are both measurable and available. Revenues are considered to be available when they are collectible within the current period or soon enough thereafter to pay liabilities of the current period (generally 90 days). A 180 day availability period is used for revenue recognition for all construction grants. Expenditures generally are recorded when a liability is incurred, as under accrual accounting. However, debt service expenditures, as well as expenditures related to compensated absences, pension obligations, other post-employment obligations, and claims and judgments, are recorded only when payment is due (matured).
City of Hartford, Connecticut Notes to Financial Statements (In Thousands)
25
Note 1. Summary of Significant Accounting Policies (Continued)
Property taxes, when levied for, intergovernmental revenues, when eligibility requirements are met, charges for services, and interest associated with the current fiscal period are all considered to be measurable and so have been recognized as revenues of the current fiscal period, if available. Only the portion of special assessments receivable due within the current fiscal period is considered to be susceptible to accrual as revenue of the current period. All other revenue items, primarily licenses and fees, are considered to be available only when cash is received. The City reports the following major governmental funds:
The General Fund is the City’s primary operating fund. It accounts for all financial resources of the City, except those required to be accounted for in another fund. The Capital Improvement Fund accounts for the proceeds of general obligation bonds and grants for various construction and reconstruction projects. The Community Development Loan and Grant Fund accounts for loan and grant activities associated with the housing and development program. The Debt Service Fund accounts for the payment of principal and interest on general long-term debt of the City. The Educational Grants Fund accounts for State and Federal grants received and expended for educational purposes.
The City reports the following major enterprise fund:
The Hartford Parking Facilities Fund accounts for the operations of the City’s dedicated parking facilities in conjunction with the Hartford Parking Authority.
Additionally, the City reports the following fund types:
The Internal Service Funds account for the risk management program of the City and the centralized operations of the Metro Hartford Information Services. The Pension Trust Funds, fiduciary funds, account for the activities of the Hartford Retirement System, which accumulates resources for pension benefit payments to qualified City employees. The Agency Funds, fiduciary fund, account for monies held as a custodian for outside student groups.
As a general rule the effect of interfund activity has been eliminated from the government-wide financial statements. Amounts reported as program revenues include 1) charges to customers or applicants for goods, services, or privileges provided, 2) operating grants and contributions, and 3) capital grants and contributions, including special assessments. Internally dedicated resources are reported as general revenues rather than as program revenues. Likewise, general revenues include property taxes. Proprietary funds are financed and operated in a manner similar to private business enterprises.
City of Hartford, Connecticut Notes to Financial Statements (In Thousands)
26
Note 1. Summary of Significant Accounting Policies (Continued)
Proprietary funds distinguish operating revenues and expenses from nonoperating items. Operating revenues and expenses generally result from providing services and producing and delivering goods in connection with a proprietary fund’s principal ongoing operations. The principal operating revenues of the City’s enterprise fund is net revenues from operations of the parking facilities and of the City’s internal service funds are charges from participants and premiums from the City. Operating expenses for the enterprise fund include operating expenses, administrative expenses, and depreciation on capital assets. For the internal service funds, expenses represent claims paid. All revenues and expenses not meeting this definition are reported as nonoperating revenues and expenses. When both restricted and unrestricted resources are available for use, it is the City’s policy to use restricted resources first, then unrestricted resources as they are needed. Accounting Estimates: The preparation of financial statements in conformity with accounting principles generally accepted in the United States of America requires management to make estimates and assumptions that affect the reported amounts of assets and liabilities and disclosure of contingent assets and liabilities at the date of the financial statements and the reported amounts of revenues and expenses during the reporting period. Actual results could differ from those estimates. Cash and Cash Equivalents: The City’s cash and cash equivalents are considered to be cash on hand, demand deposits, and short-term investments with original maturities of three months or less from the date of acquisition. Restricted Cash and Investments: Certain assets are classified as restricted because their use is limited. Restricted asset cash and investments are to be used for construction purposes and the repayment of the 2013 Refunded Bonds. Investments: Investments are stated at fair value, based on quoted market prices, except as disclosed below. The pension fund allows for investments in certain alternative investments. Alternative investments may include private equity partnerships, hedge and absolute return funds for which there may be no ready market to determine fair value. These investments are valued using the most recent valuation available from the external fund manager that represents the net asset value of these funds. These estimated values do not necessarily represent the amounts that will ultimately be realized upon the disposition of those assets, which may be materially higher or lower than values determined if a ready market for the securities existed. The Connecticut State Treasurer’s Short-Term Investment Fund (STIF) and the State Tax Exempt Proceeds Fund (TEPF) are investment pools managed by the State of Connecticut Office of the State Treasurer. Investments must be made in instruments authorized by Connecticut General Statutes 3-27c through 3-27e. Investment guidelines are adopted by the State Treasurer. Investments in 2a7 like pools are stated at the position in the pool, and are the same as the value of the pool shares, amortized cost. Due to/from Other Funds: Activity between funds that are representative of lending/borrowing arrangements outstanding at the end of the fiscal year are referred to as either “due to/from other funds” (i.e., the current portion of interfund loans). Any residual balances outstanding between the governmental activities and business-type activities are reported in the government-wide financial statements as “internal balances”.
City of Hartford, Connecticut Notes to Financial Statements (In Thousands)
27
Note 1. Summary of Significant Accounting Policies (Continued)
Receivables: All trade and property tax receivables, including those for component units, are reported net of an allowance for uncollectibles. The property tax receivable allowance of $8.2 million is equal to approximately 14.5% of outstanding property taxes at June 30, 2014. The City’s property tax is levied each May on the assessed value listed as of the prior October 1 for all taxable real and personal property located in the City. The lien date is July 1 on the May 1 levy. Assessed values are established by the City Assessor at 70% of fair market value for all properties on the grand list as of October 1 each year. Taxes under $100 (amount not rounded) are due in one installment July 1; real and personal property taxes of over $100 (amount not rounded) are due in two installments July 1 and January 1. Motor vehicle taxes in excess of $100 (amount not rounded) are due in two installments July 1 and January 1. Delinquent taxes are assessed interest of 1.5% per month. The City has also entered into various loan agreements with third parties related to its public housing programs. These loan agreements have been recorded as notes receivable within the Community Development Loan and Grant Fund. Under these agreements, the City has loaned money for the purpose of establishing and/or improving public housing units. The loans are secured by an interest in the property being acquired and/or improved. The programs consist of the House Hartford Program, the Home Ownership Appraisal GAP Financing Program, Home Program, Lead Abatement Program, Façade Program, Anti-Blight Program and the Housing Preservation Loan Program. In addition, the City has two outstanding loans under the HUD Section 108 Program. The City develops an allowance for uncollectible amounts on a loan-by-loan basis. All other receivables, including intergovernmental receivables, are reported net of an allowance for uncollectibles. Allowances for Doubtful Accounts: Accounts including property taxes and notes receivable for the primary government are reported net of allowance for doubtful accounts. The allowance for doubtful accounts represents those accounts which are deemed uncollectible based upon collection history and analysis of creditor’s ability to pay. The majority of amount relates to taxes receivable, housing loans and police special duty fees. Inventories: All inventories are valued at cost using the first-in/first-out (FIFO) method. Inventories of governmental funds are recorded as expenditures when consumed rather than when purchased. Capital Assets: Capital assets, which include land, buildings, equipment, and infrastructure assets, (e.g., roads, bridges, sidewalks, and similar items), are reported in the applicable governmental or business-type activities columns in the government-wide financial statements and proprietary fund financial statements. Capital assets are defined by the government as assets with an initial, individual cost of more than $5,000 (amount not rounded) and an estimated useful life in excess of one year. Such assets are recorded at historical cost or estimated historical cost if purchased or constructed. Donated capital assets are recorded at estimated fair market value at the date of donation. The costs of normal maintenance and repairs that do not add to the value of the asset or materially extend assets lives are not capitalized. Major outlays for capital assets and improvements are capitalized as projects are constructed. Interest is capitalized in accordance with related guidance on enterprise and business-type capital assets.
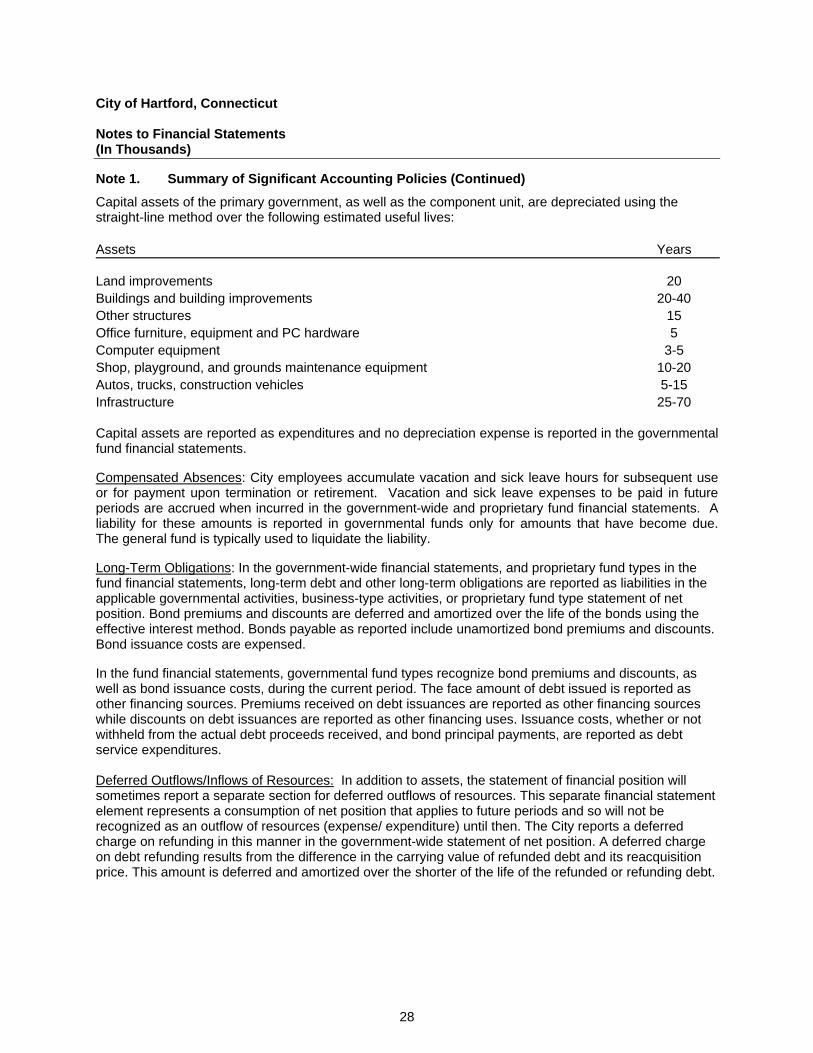
City of Hartford, Connecticut Notes to Financial Statements (In Thousands)
28
Note 1. Summary of Significant Accounting Policies (Continued)
Capital assets of the primary government, as well as the component unit, are depreciated using the straight-line method over the following estimated useful lives: Assets Years Land improvements 20 Buildings and building improvements 20-40 Other structures 15 Office furniture, equipment and PC hardware 5 Computer equipment 3-5 Shop, playground, and grounds maintenance equipment 10-20 Autos, trucks, construction vehicles 5-15 Infrastructure 25-70 Capital assets are reported as expenditures and no depreciation expense is reported in the governmental fund financial statements. Compensated Absences: City employees accumulate vacation and sick leave hours for subsequent use or for payment upon termination or retirement. Vacation and sick leave expenses to be paid in future periods are accrued when incurred in the government-wide and proprietary fund financial statements. A liability for these amounts is reported in governmental funds only for amounts that have become due. The general fund is typically used to liquidate the liability. Long-Term Obligations: In the government-wide financial statements, and proprietary fund types in the fund financial statements, long-term debt and other long-term obligations are reported as liabilities in the applicable governmental activities, business-type activities, or proprietary fund type statement of net position. Bond premiums and discounts are deferred and amortized over the life of the bonds using the effective interest method. Bonds payable as reported include unamortized bond premiums and discounts. Bond issuance costs are expensed. In the fund financial statements, governmental fund types recognize bond premiums and discounts, as well as bond issuance costs, during the current period. The face amount of debt issued is reported as other financing sources. Premiums received on debt issuances are reported as other financing sources while discounts on debt issuances are reported as other financing uses. Issuance costs, whether or not withheld from the actual debt proceeds received, and bond principal payments, are reported as debt service expenditures. Deferred Outflows/Inflows of Resources: In addition to assets, the statement of financial position will sometimes report a separate section for deferred outflows of resources. This separate financial statement element represents a consumption of net position that applies to future periods and so will not be recognized as an outflow of resources (expense/ expenditure) until then. The City reports a deferred charge on refunding in this manner in the government-wide statement of net position. A deferred charge on debt refunding results from the difference in the carrying value of refunded debt and its reacquisition price. This amount is deferred and amortized over the shorter of the life of the refunded or refunding debt.
City of Hartford, Connecticut Notes to Financial Statements (In Thousands)
29
Note 1. Summary of Significant Accounting Policies (Continued)
In addition to liabilities, the statement of net position will sometimes report a separate section for deferred inflows of resources. This separate financial statement element, deferred inflows of resources, represents an acquisition of net position or fund balance that applies to a future period or periods and so will not be recognized as an inflow of resources (revenue) until that time. Also, for governmental funds, the City reports unavailable revenue, which arises only under the modified accrual basis of accounting. The governmental funds report unavailable revenues from several sources: property taxes, grants and charges for services. These amounts are deferred and recognized as an inflow of resources (revenue) in the period in which the amounts become available. Fund Equity and Net Position: In the government-wide and proprietary fund financial statements, net position are classified in the following categories:
Net Investment in Capital Assets – The net investment in capital assets component of net position consists of capital assets, net of accumulated depreciation, reduced by the outstanding balances of bonds, notes, or other borrowings that are attributable to the acquisition, construction or improvement of those assets. Deferred outflows of resources and deferred inflows of resources that are attributable to the acquisition, construction, or improvement of those assets or related debt are included in this component of net position.
Restricted Net Position – These amounts are restricted to specific purposes when constraints placed on the use of resources are either (a) externally imposed by creditors (such as debt covenants), grantors, contributors, or laws or regulations of other governments; or (b) imposed by law through constitutional provisions or enabling legislations.
Unrestricted Net Position or (Deficit) – This category represents the net position of the City, not included in the other two categories, which are not restricted. A deficit will require future funding.
In the fund financial statements, the City reported the following governmental fund balance categories:
Nonspendable Fund Balance – These amounts cannot be spent because they are not in spendable form, or because they are legally or contractually required to be maintained intact.
Restricted Fund Balance – These amounts are restricted to specific purposes when constraints placed on the use of resources are either (a) externally imposed by creditors (such as debt covenants), grantors, contributors, or laws or regulations of other governments; or (b) imposed by law through constitutional provisions or enabling legislations.
Committed Fund Balance – This represents amounts constrained prior to year-end for a specific purpose by the City using its highest level of decision-making authority (City of Hartford Court of Common Council). Amounts remain committed until action, in the form of a Resolution, is taken by the Court of Common Council to remove or revise the limitations.
Assigned Fund Balance – For all governmental funds other than the General Fund, this represents any remaining positive amounts not classified as restricted or committed. For the General Fund, this includes amounts constrained for the intent to be used for a specific purpose by the Court of Common Council and finance department, which have been delegated to assign amounts by the City Charter.
Unassigned Fund Balance – includes residual positive fund balance within the General Fund which has not been classified within the other abovementioned categories. Unassigned fund balance may also include negative balances for any governmental fund if expenditures exceed amounts restricted, committed, or assigned for those specific purposes.
City of Hartford, Connecticut Notes to Financial Statements (In Thousands)
30
Note 1. Summary of Significant Accounting Policies (Continued)
When both restricted and unrestricted amounts are available for use, it is the City’s practice to use restricted resources first. Additionally, the City would first use committed, then assigned, and lastly unassigned amounts of unrestricted fund balance. Pension Accounting: Pension Trust Funds: Employee contributions are recognized in the period in which the contributions are due. Employer contributions to the plan are recognized when due and the City has made a formal commitment to provide the contributions. Benefits and refunds are recognized when due and payable in accordance with the terms of each plan.
Governmental Funds and Governmental Activities: In governmental funds, expenditures are recognized when they are paid or are expected to be paid with current available resources. In governmental activities, expense is recognized based on actuarially required contributions. The net pension obligation, the cumulative difference between annual pension cost and the City's contributions to the plans since 1986, is calculated on an actuarial basis consistent with the requirements of Government Accounting Standards Board Statement No. 27. The pension obligation is recorded as a noncurrent liability in the government-wide financial statements.
Funding Policy: The City makes annual contributions based on the Common Council’s decisions using actuaries’ recommendation. The net pension obligation is paid from the General Fund.
Other Post Employment Obligations (OPEB) Accounting: Governmental Funds and Governmental Activities: In governmental funds, expenditures are recognized when they are paid or are expected to be paid with current available resources. In governmental activities, expense is recognized based on actuarially required contributions. The net OPEB obligation, the cumulative difference between annual OPEB cost and the City’s contributions to the plan since July 1, 2007, is calculated on an actuarial basis consistent with the requirements of Government Accounting Standards Board Statement No. 45. The OPEB obligation is recorded as a noncurrent liability in the government-wide financial statements.
Funding Policy: The City makes annual contributions based on the Common Council’s decisions using the actuaries’ recommendation. The post employment benefits are paid from the City’s internal service funds.
Note 2. Cash, Cash Equivalents and Investments
The deposit of public funds is controlled by the Connecticut General Statutes (Section 7-402). Deposits may be made in a “qualified public depository” as defined by Statute, or, in amounts not exceeding the Federal Deposit Insurance Corporation insurance limit, in an “out of state bank,” as defined by the Statutes, which is not a “qualified public depository.”
City of Hartford, Connecticut Notes to Financial Statements (In Thousands)
31
Note 2. Cash, Cash Equivalents and Investments
The Connecticut General Statutes (Section 7-400) permit municipalities to invest in: 1) obligations of the United States and its agencies, 2) highly rated obligations of any state of the United States or of any political subdivision, authority or agency thereof, and 3) shares or other interests in custodial arrangements or pools maintaining constant net asset values and in highly rated no-load open end money market and mutual funds (with constant or fluctuating net asset values) whose portfolios are limited to obligations of the United States and its agencies, and repurchase agreements fully collateralized by such obligations. Other provisions of the Statutes cover specific municipal funds with particular investment authority. The provisions of the Statutes regarding the investment of municipal pension funds do not specify permitted investments. Therefore, investment of such funds is generally controlled by the laws applicable to fiduciaries and the provisions of the applicable plan. The Statutes (Sections 3-24f and 3-27f) also provide for investment in shares of the State Short-Term Investment Fund (STIF) and the State Tax Exempt Proceeds Fund (TEPF). These investment funds are under the control of the State Treasurer, with oversight provided by the Treasurer’s Cash Management Advisory Board, and are regulated under the State Statutes and subject to annual audit by the Auditors of Public Accounts. Investment yields are accounted for on an amortized-cost basis with an investment portfolio that is designed to attain a market-average rate of return throughout budgetary and economic cycles. Investors accrue interest daily based on actual earnings, less expenses and transfers to the designated surplus reserve, and the value of the position in the pool is the same as the value of the pool shares. The City’s MERF Plan has additional commitments to invest in certain alternative investments of approximately $48.8 million at June 30, 2014. Deposits: City Custodial Credit Risk: – Custodial credit risk is the risk that in the event of a bank failure, the City’s deposits may not be returned to it. The City’s deposit policy includes policies on the safety of principal, prudence, and financial dealings with institutions designed to mitigate custodial credit risk. As of June 30, 2014, $209.7 of the City’s bank balance of $235.6 was uninsured and uncollateralized. Hartford Parking Authority Deposits: Custodial Credit Risk: – Custodial credit risk is the risk that in the event of a bank failure, the Authority’s deposits may not be returned to it. The Authority’ follows the City’s deposit policies which include policies on the safety of principal, prudence, and financial dealings with institutions to mitigate custodial credit risk. As of June 30, 2014, $1,823 of the Authority’s bank balance of $2,526 was uninsured and uncollateralized.
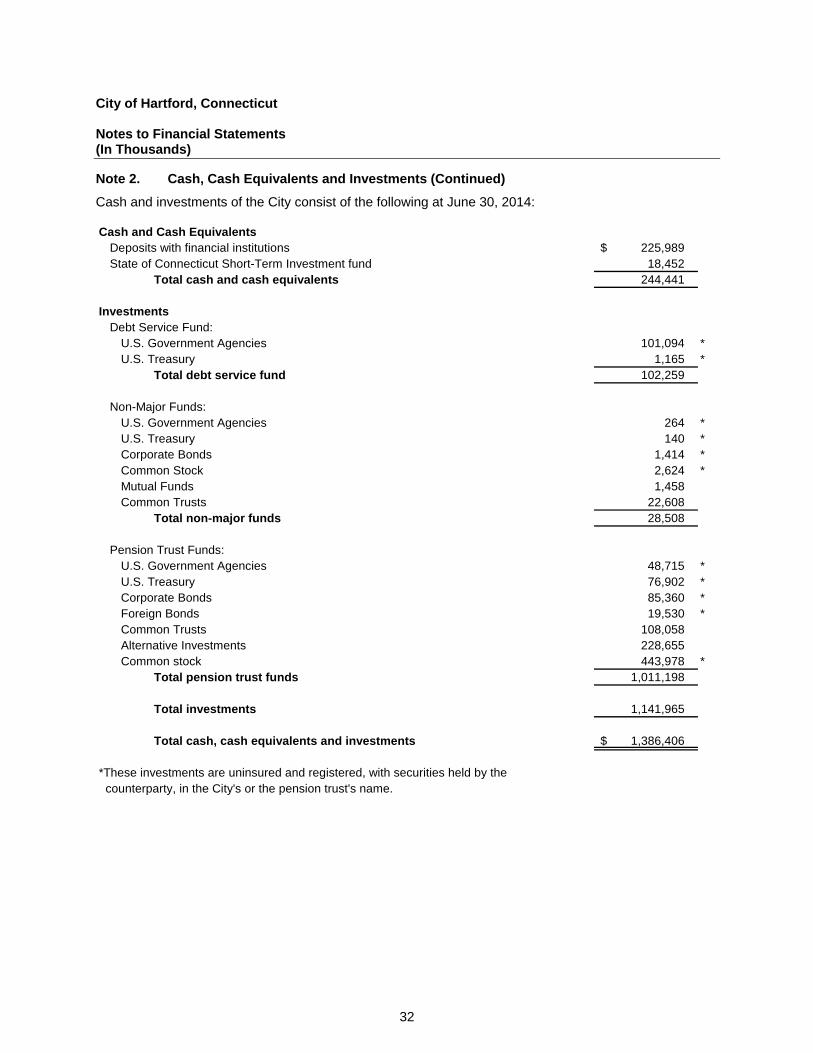
City of Hartford, Connecticut Notes to Financial Statements (In Thousands)
32
Note 2. Cash, Cash Equivalents and Investments (Continued)
Cash and investments of the City consist of the following at June 30, 2014: Cash and Cash Equivalents
Deposits with financial institutions 225,989 $ State of Connecticut Short-Term Investment fund 18,452
Total cash and cash equivalents 244,441
InvestmentsDebt Service Fund:
U.S. Government Agencies 101,094 *U.S. Treasury 1,165 *
Total debt service fund 102,259
Non-Major Funds:U.S. Government Agencies 264 *U.S. Treasury 140 *Corporate Bonds 1,414 *Common Stock 2,624 *Mutual Funds 1,458 Common Trusts 22,608
Total non-major funds 28,508
Pension Trust Funds:U.S. Government Agencies 48,715 *U.S. Treasury 76,902 *Corporate Bonds 85,360 *Foreign Bonds 19,530 *Common Trusts 108,058 Alternative Investments 228,655 Common stock 443,978 *
Total pension trust funds 1,011,198
Total investments 1,141,965
Total cash, cash equivalents and investments 1,386,406 $
*These investments are uninsured and registered, with securities held by the counterparty, in the City's or the pension trust's name.
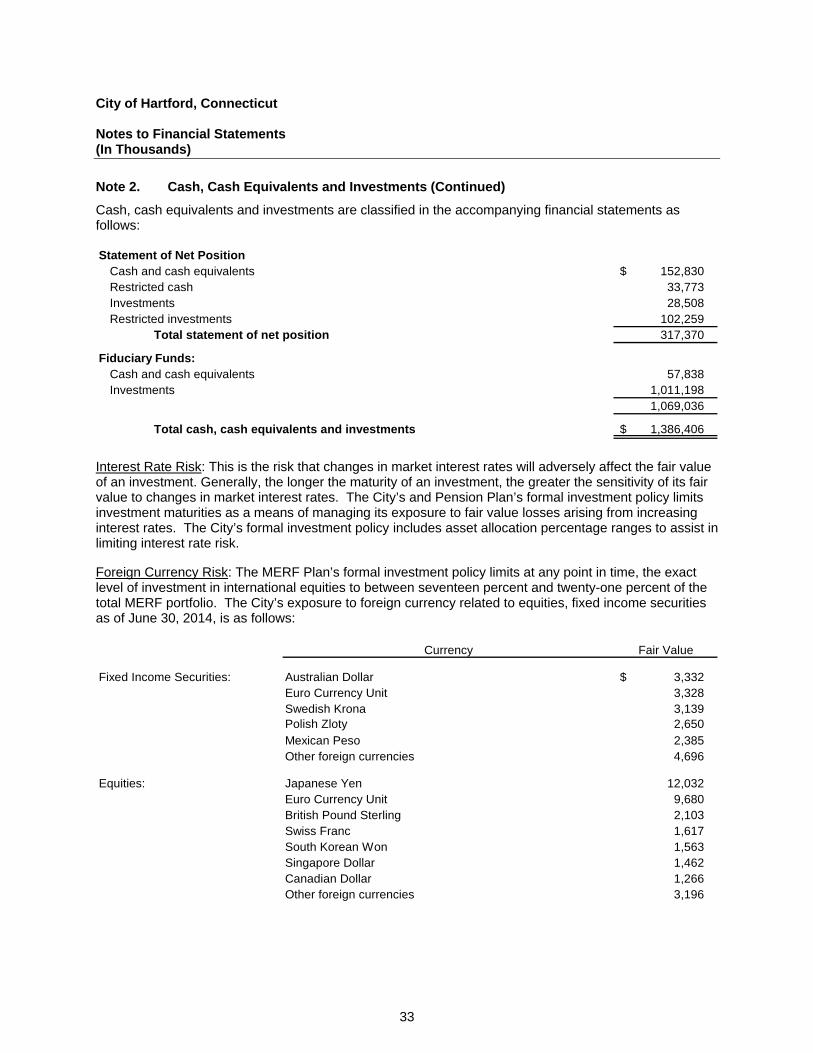
City of Hartford, Connecticut Notes to Financial Statements (In Thousands)
33
Note 2. Cash, Cash Equivalents and Investments (Continued)
Cash, cash equivalents and investments are classified in the accompanying financial statements as follows: Statement of Net Position
Cash and cash equivalents 152,830 $ Restricted cash 33,773 Investments 28,508 Restricted investments 102,259
Total statement of net position 317,370
Fiduciary Funds:Cash and cash equivalents 57,838 Investments 1,011,198
1,069,036
Total cash, cash equivalents and investments 1,386,406 $
Interest Rate Risk: This is the risk that changes in market interest rates will adversely affect the fair value of an investment. Generally, the longer the maturity of an investment, the greater the sensitivity of its fair value to changes in market interest rates. The City’s and Pension Plan’s formal investment policy limits investment maturities as a means of managing its exposure to fair value losses arising from increasing interest rates. The City’s formal investment policy includes asset allocation percentage ranges to assist in limiting interest rate risk. Foreign Currency Risk: The MERF Plan’s formal investment policy limits at any point in time, the exact level of investment in international equities to between seventeen percent and twenty-one percent of the total MERF portfolio. The City’s exposure to foreign currency related to equities, fixed income securities as of June 30, 2014, is as follows:
Currency Fair Value
Fixed Income Securities: Australian Dollar 3,332 $ Euro Currency Unit 3,328 Swedish Krona 3,139 Polish Zloty 2,650 Mexican Peso 2,385 Other foreign currencies 4,696
Equities: Japanese Yen 12,032 Euro Currency Unit 9,680 British Pound Sterling 2,103 Swiss Franc 1,617 South Korean Won 1,563 Singapore Dollar 1,462 Canadian Dollar 1,266 Other foreign currencies 3,196
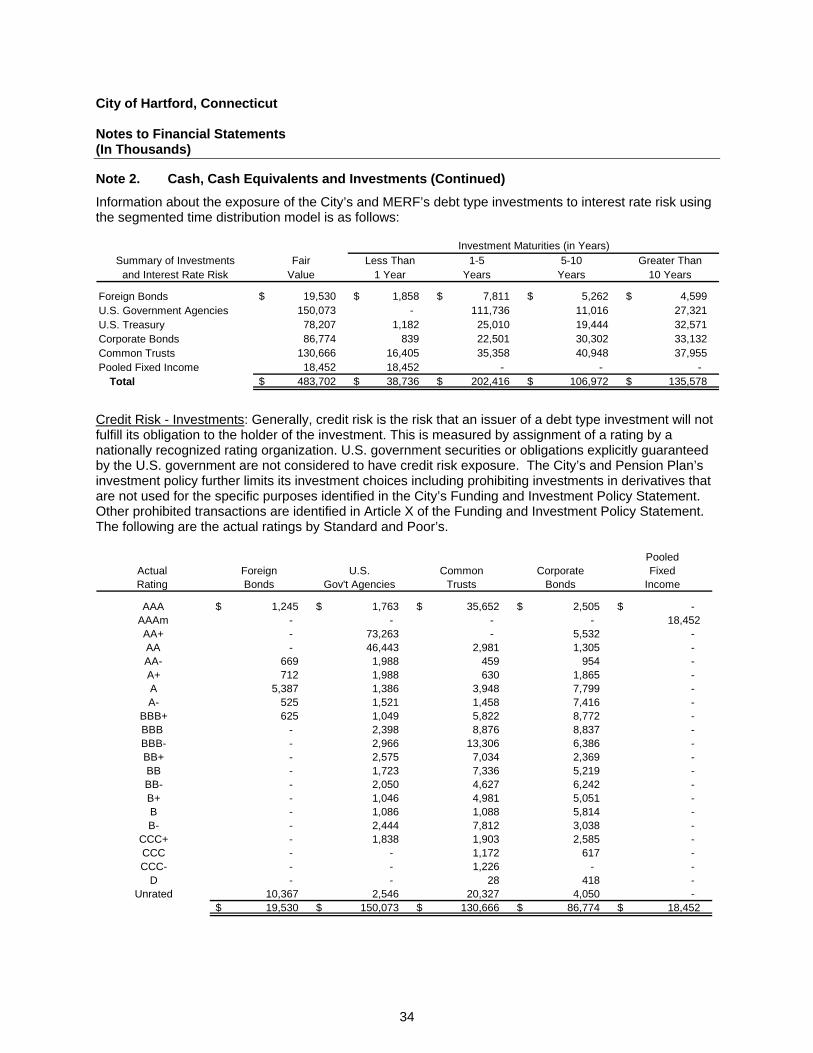
City of Hartford, Connecticut Notes to Financial Statements (In Thousands)
34
Note 2. Cash, Cash Equivalents and Investments (Continued)
Information about the exposure of the City’s and MERF’s debt type investments to interest rate risk using the segmented time distribution model is as follows:
Summary of Investments Fair Less Than 1-5 5-10 Greater Thanand Interest Rate Risk Value 1 Year Years Years 10 Years
Foreign Bonds 19,530 $ 1,858 $ 7,811 $ 5,262 $ 4,599 $ U.S. Government Agencies 150,073 - 111,736 11,016 27,321 U.S. Treasury 78,207 1,182 25,010 19,444 32,571 Corporate Bonds 86,774 839 22,501 30,302 33,132 Common Trusts 130,666 16,405 35,358 40,948 37,955 Pooled Fixed Income 18,452 18,452 - - -
Total 483,702 $ 38,736 $ 202,416 $ 106,972 $ 135,578 $
Investment Maturities (in Years)
Credit Risk - Investments: Generally, credit risk is the risk that an issuer of a debt type investment will not fulfill its obligation to the holder of the investment. This is measured by assignment of a rating by a nationally recognized rating organization. U.S. government securities or obligations explicitly guaranteed by the U.S. government are not considered to have credit risk exposure. The City’s and Pension Plan’s investment policy further limits its investment choices including prohibiting investments in derivatives that are not used for the specific purposes identified in the City’s Funding and Investment Policy Statement. Other prohibited transactions are identified in Article X of the Funding and Investment Policy Statement. The following are the actual ratings by Standard and Poor’s.
PooledActual Foreign U.S. Common Corporate FixedRating Bonds Gov't Agencies Trusts Bonds Income
AAA 1,245 $ 1,763 $ 35,652 $ 2,505 $ -$ AAAm - - - - 18,452 AA+ - 73,263 - 5,532 - AA - 46,443 2,981 1,305 - AA- 669 1,988 459 954 - A+ 712 1,988 630 1,865 - A 5,387 1,386 3,948 7,799 - A- 525 1,521 1,458 7,416 -
BBB+ 625 1,049 5,822 8,772 - BBB - 2,398 8,876 8,837 - BBB- - 2,966 13,306 6,386 - BB+ - 2,575 7,034 2,369 - BB - 1,723 7,336 5,219 - BB- - 2,050 4,627 6,242 - B+ - 1,046 4,981 5,051 - B - 1,086 1,088 5,814 - B- - 2,444 7,812 3,038 -
CCC+ - 1,838 1,903 2,585 - CCC - - 1,172 617 - CCC- - - 1,226 - -
D - - 28 418 - Unrated 10,367 2,546 20,327 4,050 -
19,530 $ 150,073 $ 130,666 $ 86,774 $ 18,452 $
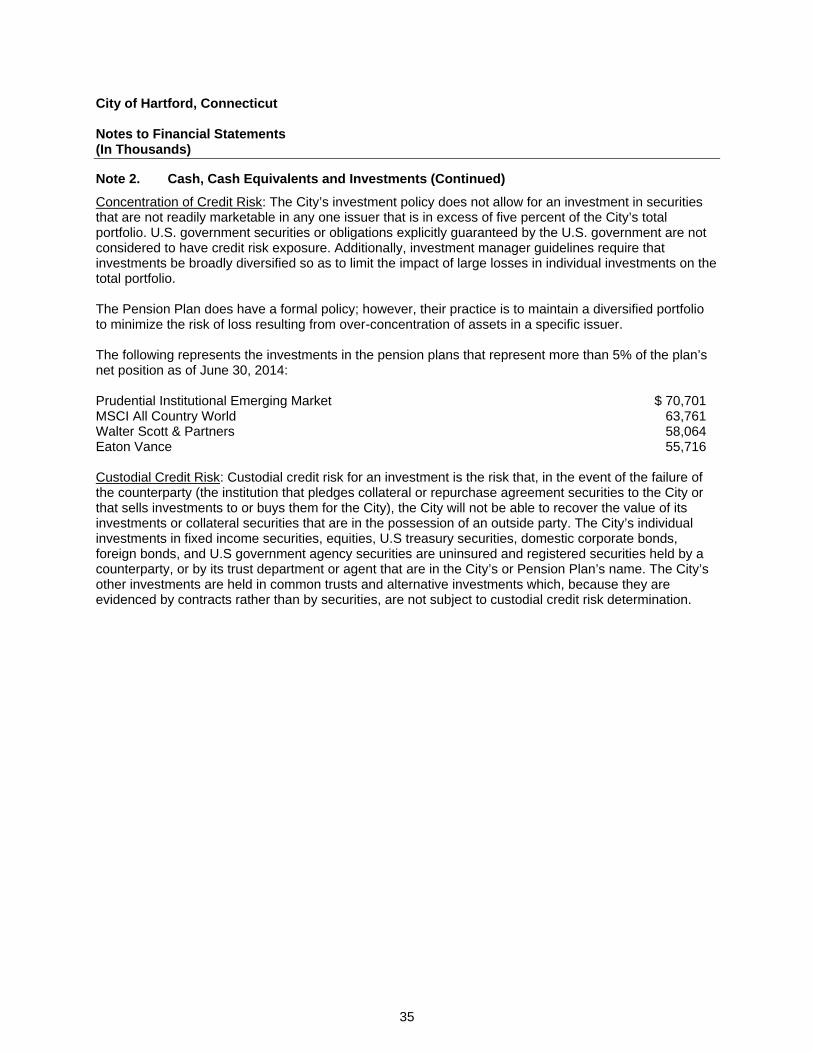
City of Hartford, Connecticut Notes to Financial Statements (In Thousands)
35
Note 2. Cash, Cash Equivalents and Investments (Continued)
Concentration of Credit Risk: The City’s investment policy does not allow for an investment in securities that are not readily marketable in any one issuer that is in excess of five percent of the City’s total portfolio. U.S. government securities or obligations explicitly guaranteed by the U.S. government are not considered to have credit risk exposure. Additionally, investment manager guidelines require that investments be broadly diversified so as to limit the impact of large losses in individual investments on the total portfolio. The Pension Plan does have a formal policy; however, their practice is to maintain a diversified portfolio to minimize the risk of loss resulting from over-concentration of assets in a specific issuer. The following represents the investments in the pension plans that represent more than 5% of the plan’s net position as of June 30, 2014: Prudential Institutional Emerging Market $ 70,701 MSCI All Country World 63,761 Walter Scott & Partners 58,064 Eaton Vance 55,716 Custodial Credit Risk: Custodial credit risk for an investment is the risk that, in the event of the failure of the counterparty (the institution that pledges collateral or repurchase agreement securities to the City or that sells investments to or buys them for the City), the City will not be able to recover the value of its investments or collateral securities that are in the possession of an outside party. The City’s individual investments in fixed income securities, equities, U.S treasury securities, domestic corporate bonds, foreign bonds, and U.S government agency securities are uninsured and registered securities held by a counterparty, or by its trust department or agent that are in the City’s or Pension Plan’s name. The City’s other investments are held in common trusts and alternative investments which, because they are evidenced by contracts rather than by securities, are not subject to custodial credit risk determination.
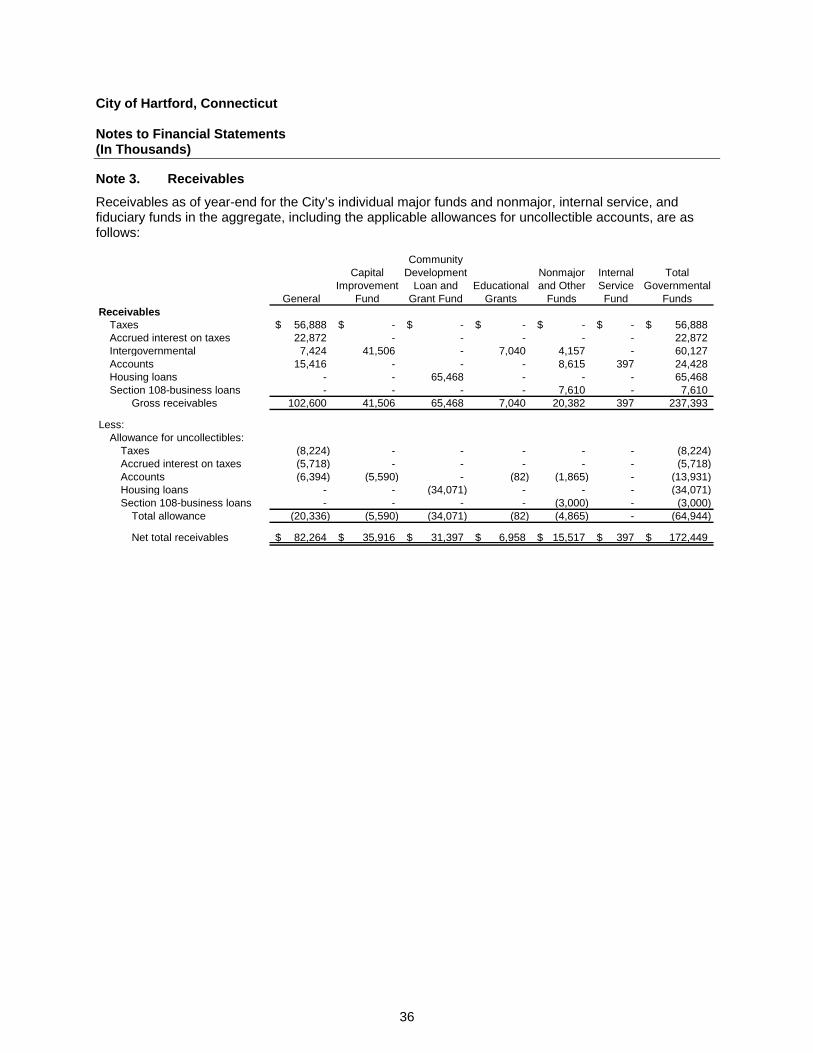
City of Hartford, Connecticut Notes to Financial Statements (In Thousands)
36
Note 3. Receivables
Receivables as of year-end for the City’s individual major funds and nonmajor, internal service, and fiduciary funds in the aggregate, including the applicable allowances for uncollectible accounts, are as follows:
CommunityCapital Development Nonmajor Internal Total
Improvement Loan and Educational and Other Service GovernmentalGeneral Fund Grant Fund Grants Funds Fund Funds
ReceivablesTaxes 56,888$ -$ -$ -$ -$ -$ 56,888$ Accrued interest on taxes 22,872 - - - - - 22,872 Intergovernmental 7,424 41,506 - 7,040 4,157 - 60,127 Accounts 15,416 - - - 8,615 397 24,428 Housing loans - - 65,468 - - - 65,468 Section 108-business loans - - - - 7,610 - 7,610
Gross receivables 102,600 41,506 65,468 7,040 20,382 397 237,393
Less:Allowance for uncollectibles:
Taxes (8,224) - - - - - (8,224) Accrued interest on taxes (5,718) - - - - - (5,718) Accounts (6,394) (5,590) - (82) (1,865) - (13,931) Housing loans - - (34,071) - - - (34,071) Section 108-business loans - - - - (3,000) - (3,000)
Total allowance (20,336) (5,590) (34,071) (82) (4,865) - (64,944)
Net total receivables 82,264$ 35,916$ 31,397$ 6,958$ 15,517$ 397$ 172,449$
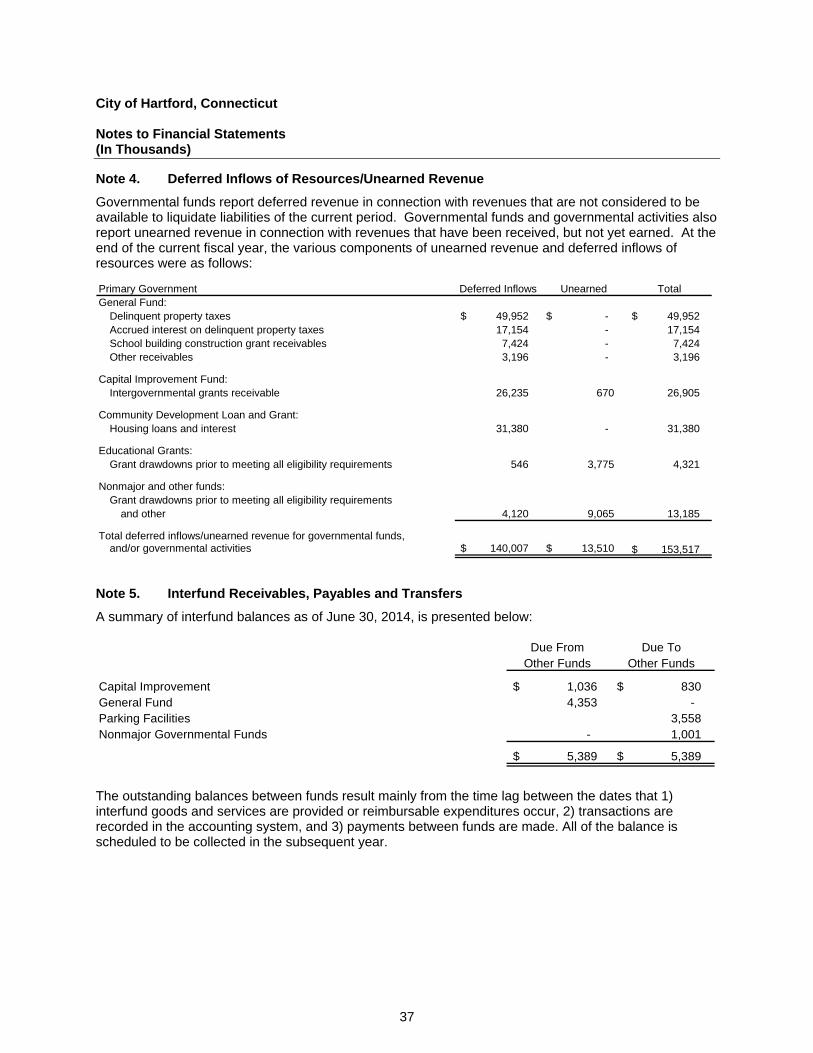
City of Hartford, Connecticut Notes to Financial Statements (In Thousands)
37
Note 4. Deferred Inflows of Resources/Unearned Revenue
Governmental funds report deferred revenue in connection with revenues that are not considered to be available to liquidate liabilities of the current period. Governmental funds and governmental activities also report unearned revenue in connection with revenues that have been received, but not yet earned. At the end of the current fiscal year, the various components of unearned revenue and deferred inflows of resources were as follows:
Primary Government Deferred Inflows Unearned TotalGeneral Fund:
Delinquent property taxes 49,952 $ -$ 49,952 $ Accrued interest on delinquent property taxes 17,154 - 17,154 School building construction grant receivables 7,424 - 7,424 Other receivables 3,196 - 3,196
Capital Improvement Fund:Intergovernmental grants receivable 26,235 670 26,905
Community Development Loan and Grant:Housing loans and interest 31,380 - 31,380
Educational Grants:Grant drawdowns prior to meeting all eligibility requirements 546 3,775 4,321
Nonmajor and other funds:Grant drawdowns prior to meeting all eligibility requirements
and other 4,120 9,065 13,185
Total deferred inflows/unearned revenue for governmental funds,and/or governmental activities 140,007 $ 13,510 $ 153,517 $
Note 5. Interfund Receivables, Payables and Transfers
A summary of interfund balances as of June 30, 2014, is presented below:
Due From Due To Other Funds Other Funds
Capital Improvement 1,036 $ 830 $ General Fund 4,353 - Parking Facilities 3,558 Nonmajor Governmental Funds - 1,001
5,389 $ 5,389 $
The outstanding balances between funds result mainly from the time lag between the dates that 1) interfund goods and services are provided or reimbursable expenditures occur, 2) transactions are recorded in the accounting system, and 3) payments between funds are made. All of the balance is scheduled to be collected in the subsequent year.
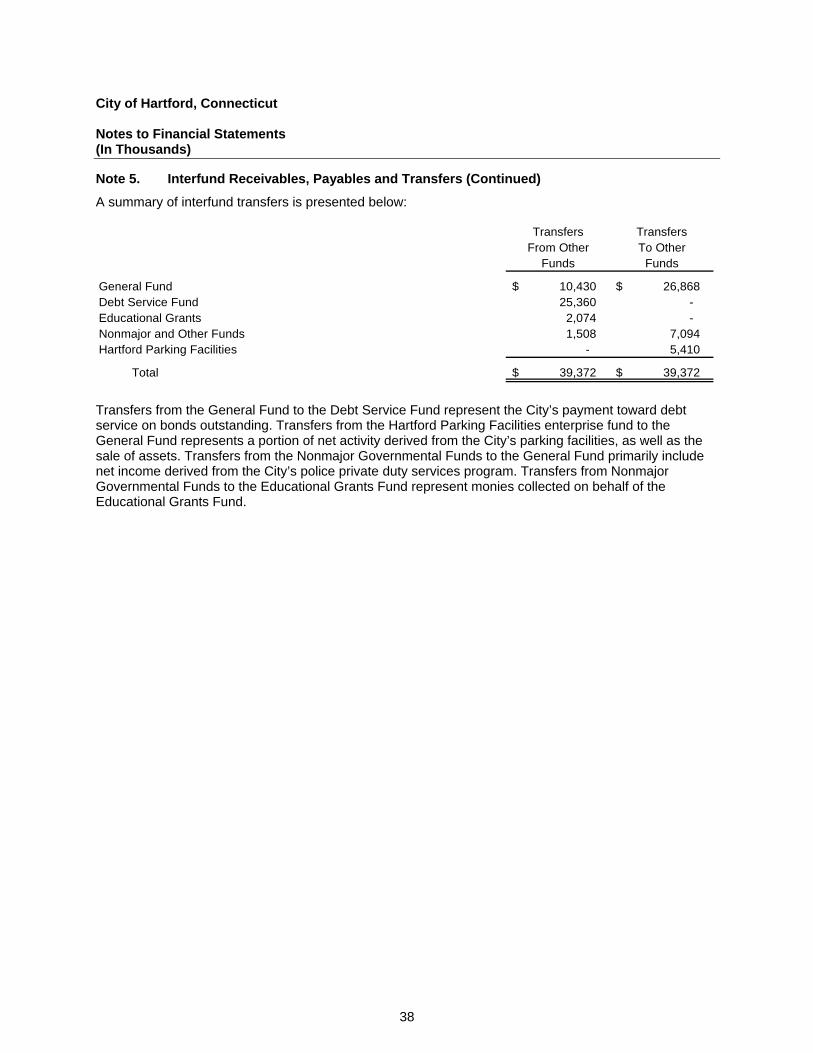
City of Hartford, Connecticut Notes to Financial Statements (In Thousands)
38
Note 5. Interfund Receivables, Payables and Transfers (Continued)
A summary of interfund transfers is presented below:
Transfers TransfersFrom Other To Other
Funds Funds
General Fund 10,430 $ 26,868 $ Debt Service Fund 25,360 - Educational Grants 2,074 - Nonmajor and Other Funds 1,508 7,094 Hartford Parking Facilities - 5,410
Total 39,372 $ 39,372 $
Transfers from the General Fund to the Debt Service Fund represent the City’s payment toward debt service on bonds outstanding. Transfers from the Hartford Parking Facilities enterprise fund to the General Fund represents a portion of net activity derived from the City’s parking facilities, as well as the sale of assets. Transfers from the Nonmajor Governmental Funds to the General Fund primarily include net income derived from the City’s police private duty services program. Transfers from Nonmajor Governmental Funds to the Educational Grants Fund represent monies collected on behalf of the Educational Grants Fund.
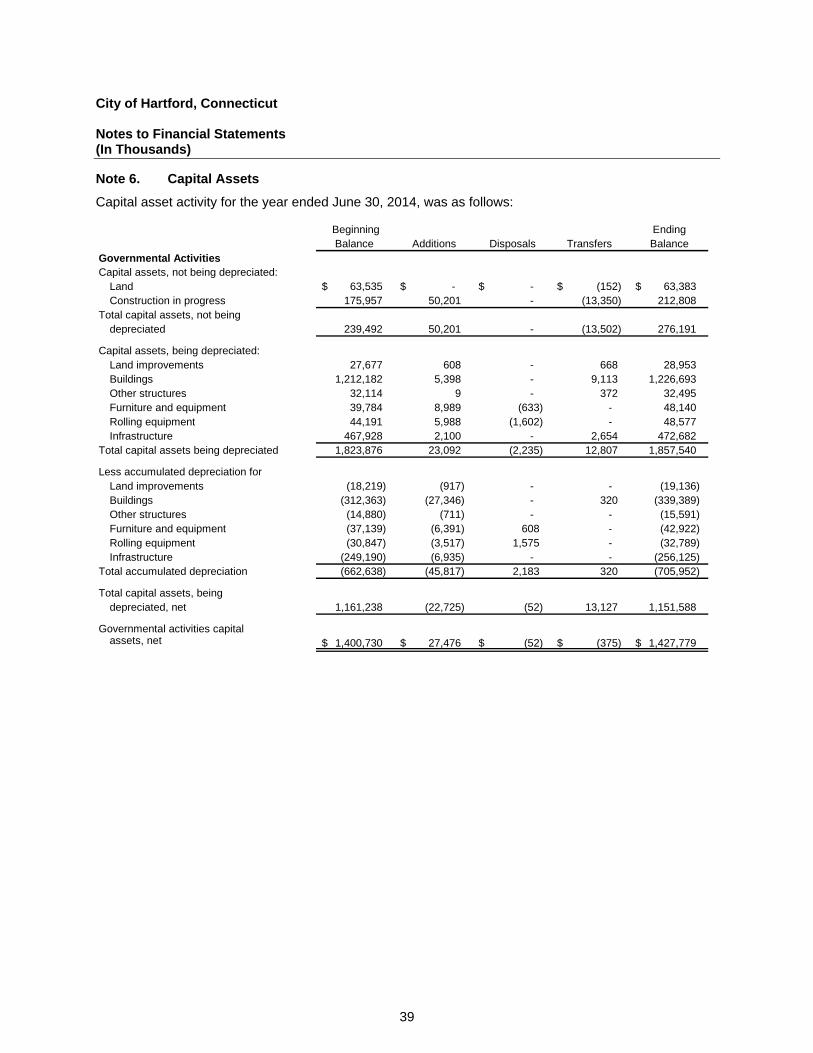
City of Hartford, Connecticut Notes to Financial Statements (In Thousands)
39
Note 6. Capital Assets
Capital asset activity for the year ended June 30, 2014, was as follows:
Beginning EndingBalance Additions Disposals Transfers Balance
Governmental ActivitiesCapital assets, not being depreciated:
Land 63,535 $ -$ -$ (152) $ 63,383 $ Construction in progress 175,957 50,201 - (13,350) 212,808
Total capital assets, not beingdepreciated 239,492 50,201 - (13,502) 276,191
Capital assets, being depreciated:Land improvements 27,677 608 - 668 28,953 Buildings 1,212,182 5,398 - 9,113 1,226,693 Other structures 32,114 9 - 372 32,495 Furniture and equipment 39,784 8,989 (633) - 48,140 Rolling equipment 44,191 5,988 (1,602) - 48,577 Infrastructure 467,928 2,100 - 2,654 472,682
Total capital assets being depreciated 1,823,876 23,092 (2,235) 12,807 1,857,540
Less accumulated depreciation forLand improvements (18,219) (917) - - (19,136) Buildings (312,363) (27,346) - 320 (339,389) Other structures (14,880) (711) - - (15,591) Furniture and equipment (37,139) (6,391) 608 - (42,922) Rolling equipment (30,847) (3,517) 1,575 - (32,789) Infrastructure (249,190) (6,935) - - (256,125)
Total accumulated depreciation (662,638) (45,817) 2,183 320 (705,952)
Total capital assets, beingdepreciated, net 1,161,238 (22,725) (52) 13,127 1,151,588
Governmental activities capital assets, net 1,400,730 $ 27,476 $ (52) $ (375) $ 1,427,779 $
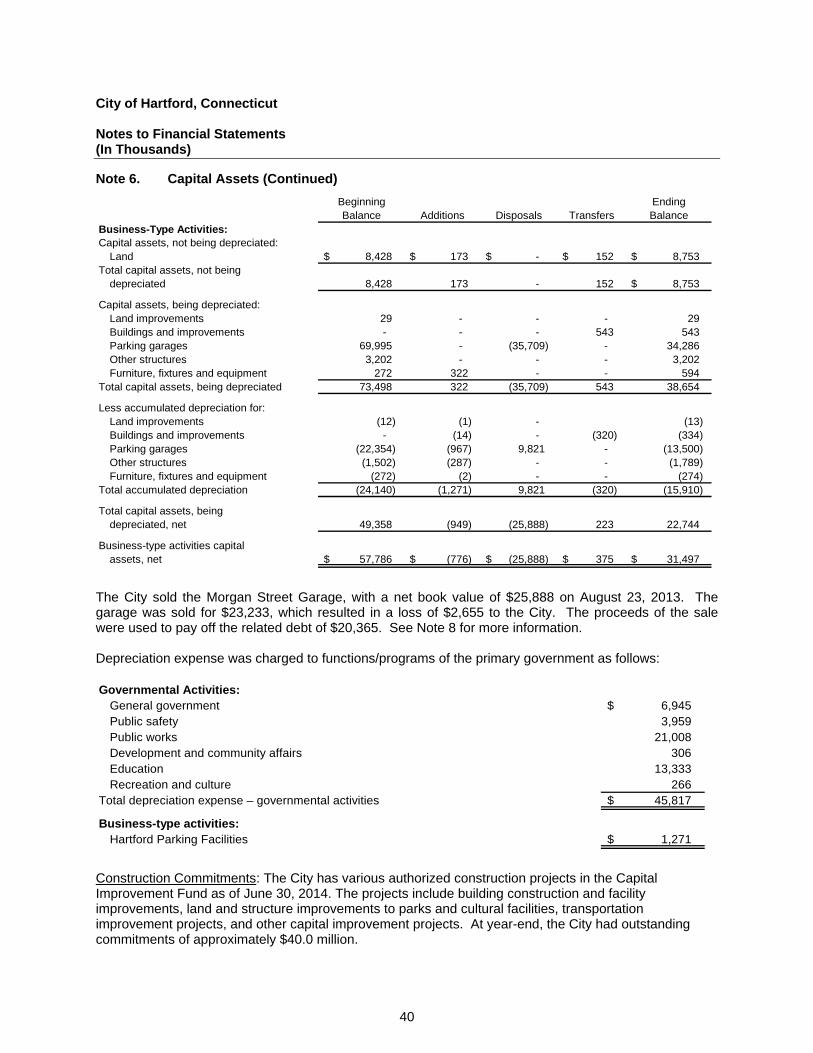
City of Hartford, Connecticut Notes to Financial Statements (In Thousands)
40
Note 6. Capital Assets (Continued)
Beginning EndingBalance Additions Disposals Transfers Balance
Business-Type Activities:Capital assets, not being depreciated:
Land 8,428 $ 173 $ -$ 152 $ 8,753 $ Total capital assets, not being
depreciated 8,428 173 - 152 8,753 $
Capital assets, being depreciated:Land improvements 29 - - - 29 Buildings and improvements - - - 543 543 Parking garages 69,995 - (35,709) - 34,286 Other structures 3,202 - - - 3,202 Furniture, fixtures and equipment 272 322 - - 594
Total capital assets, being depreciated 73,498 322 (35,709) 543 38,654
Less accumulated depreciation for:Land improvements (12) (1) - (13) Buildings and improvements - (14) - (320) (334) Parking garages (22,354) (967) 9,821 - (13,500) Other structures (1,502) (287) - - (1,789) Furniture, fixtures and equipment (272) (2) - - (274)
Total accumulated depreciation (24,140) (1,271) 9,821 (320) (15,910)
Total capital assets, beingdepreciated, net 49,358 (949) (25,888) 223 22,744
Business-type activities capitalassets, net 57,786 $ (776) $ (25,888) $ 375 $ 31,497 $
The City sold the Morgan Street Garage, with a net book value of $25,888 on August 23, 2013. The garage was sold for $23,233, which resulted in a loss of $2,655 to the City. The proceeds of the sale were used to pay off the related debt of $20,365. See Note 8 for more information. Depreciation expense was charged to functions/programs of the primary government as follows: Governmental Activities:
General government 6,945 $ Public safety 3,959 Public works 21,008 Development and community affairs 306 Education 13,333 Recreation and culture 266
Total depreciation expense – governmental activities 45,817 $
Business-type activities:Hartford Parking Facilities 1,271 $
Construction Commitments: The City has various authorized construction projects in the Capital Improvement Fund as of June 30, 2014. The projects include building construction and facility improvements, land and structure improvements to parks and cultural facilities, transportation improvement projects, and other capital improvement projects. At year-end, the City had outstanding commitments of approximately $40.0 million.
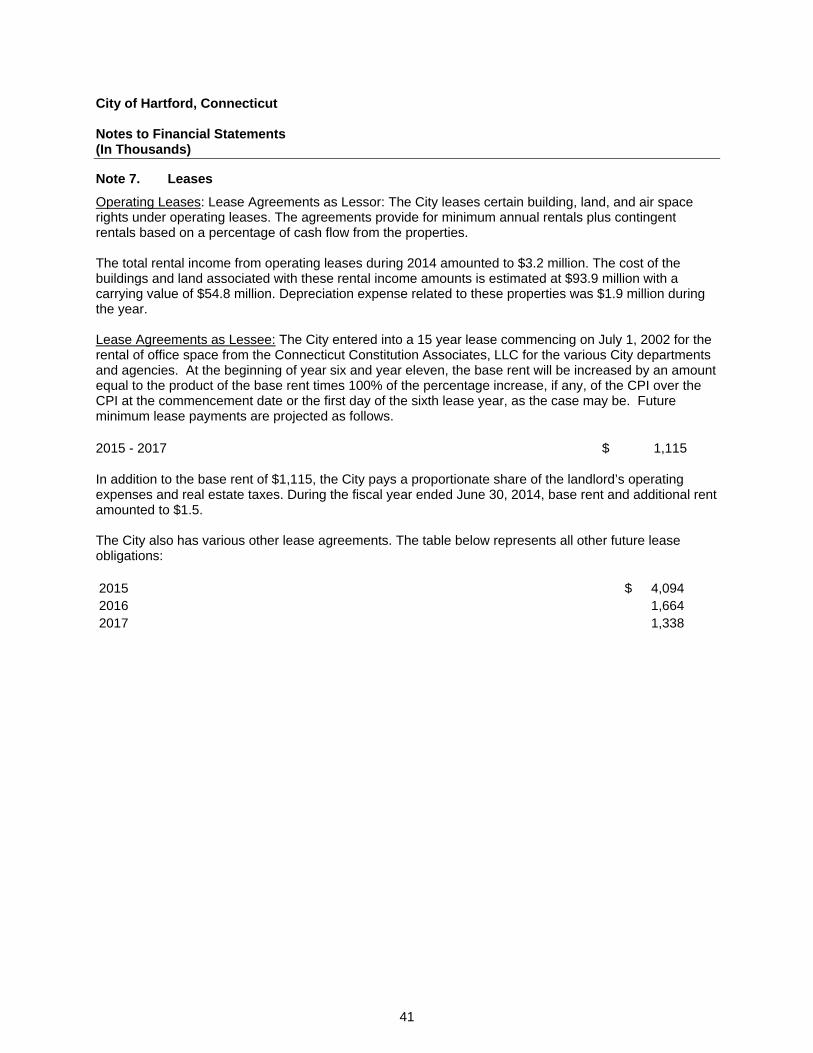
City of Hartford, Connecticut Notes to Financial Statements (In Thousands)
41
Note 7. Leases
Operating Leases: Lease Agreements as Lessor: The City leases certain building, land, and air space rights under operating leases. The agreements provide for minimum annual rentals plus contingent rentals based on a percentage of cash flow from the properties. The total rental income from operating leases during 2014 amounted to $3.2 million. The cost of the buildings and land associated with these rental income amounts is estimated at $93.9 million with a carrying value of $54.8 million. Depreciation expense related to these properties was $1.9 million during the year. Lease Agreements as Lessee: The City entered into a 15 year lease commencing on July 1, 2002 for the rental of office space from the Connecticut Constitution Associates, LLC for the various City departments and agencies. At the beginning of year six and year eleven, the base rent will be increased by an amount equal to the product of the base rent times 100% of the percentage increase, if any, of the CPI over the CPI at the commencement date or the first day of the sixth lease year, as the case may be. Future minimum lease payments are projected as follows. 2015 - 2017 $ 1,115 In addition to the base rent of $1,115, the City pays a proportionate share of the landlord’s operating expenses and real estate taxes. During the fiscal year ended June 30, 2014, base rent and additional rent amounted to $1.5. The City also has various other lease agreements. The table below represents all other future lease obligations: 2015 4,094 $ 2016 1,664 2017 1,338
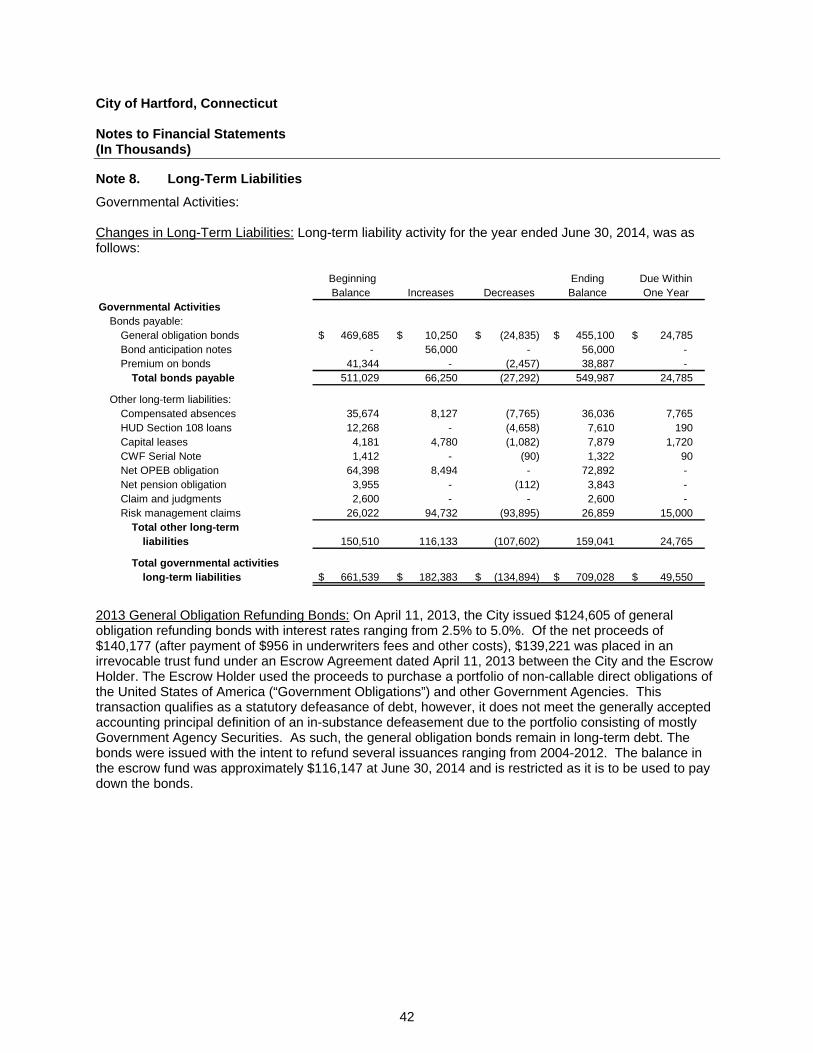
City of Hartford, Connecticut Notes to Financial Statements (In Thousands)
42
Note 8. Long-Term Liabilities
Governmental Activities: Changes in Long-Term Liabilities: Long-term liability activity for the year ended June 30, 2014, was as follows:
Beginning Ending Due WithinBalance Increases Decreases Balance One Year
Governmental ActivitiesBonds payable:
General obligation bonds 469,685 $ 10,250 $ (24,835) $ 455,100 $ 24,785 $ Bond anticipation notes - 56,000 - 56,000 - Premium on bonds 41,344 - (2,457) 38,887 -
Total bonds payable 511,029 66,250 (27,292) 549,987 24,785
Other long-term liabilities:Compensated absences 35,674 8,127 (7,765) 36,036 7,765 HUD Section 108 loans 12,268 - (4,658) 7,610 190 Capital leases 4,181 4,780 (1,082) 7,879 1,720 CWF Serial Note 1,412 - (90) 1,322 90 Net OPEB obligation 64,398 8,494 - 72,892 - Net pension obligation 3,955 - (112) 3,843 - Claim and judgments 2,600 - - 2,600 - Risk management claims 26,022 94,732 (93,895) 26,859 15,000
Total other long-termliabilities 150,510 116,133 (107,602) 159,041 24,765
Total governmental activitieslong-term liabilities 661,539 $ 182,383 $ (134,894) $ 709,028 $ 49,550 $
2013 General Obligation Refunding Bonds: On April 11, 2013, the City issued $124,605 of general obligation refunding bonds with interest rates ranging from 2.5% to 5.0%. Of the net proceeds of $140,177 (after payment of $956 in underwriters fees and other costs), $139,221 was placed in an irrevocable trust fund under an Escrow Agreement dated April 11, 2013 between the City and the Escrow Holder. The Escrow Holder used the proceeds to purchase a portfolio of non-callable direct obligations of the United States of America (“Government Obligations”) and other Government Agencies. This transaction qualifies as a statutory defeasance of debt, however, it does not meet the generally accepted accounting principal definition of an in-substance defeasement due to the portfolio consisting of mostly Government Agency Securities. As such, the general obligation bonds remain in long-term debt. The bonds were issued with the intent to refund several issuances ranging from 2004-2012. The balance in the escrow fund was approximately $116,147 at June 30, 2014 and is restricted as it is to be used to pay down the bonds.
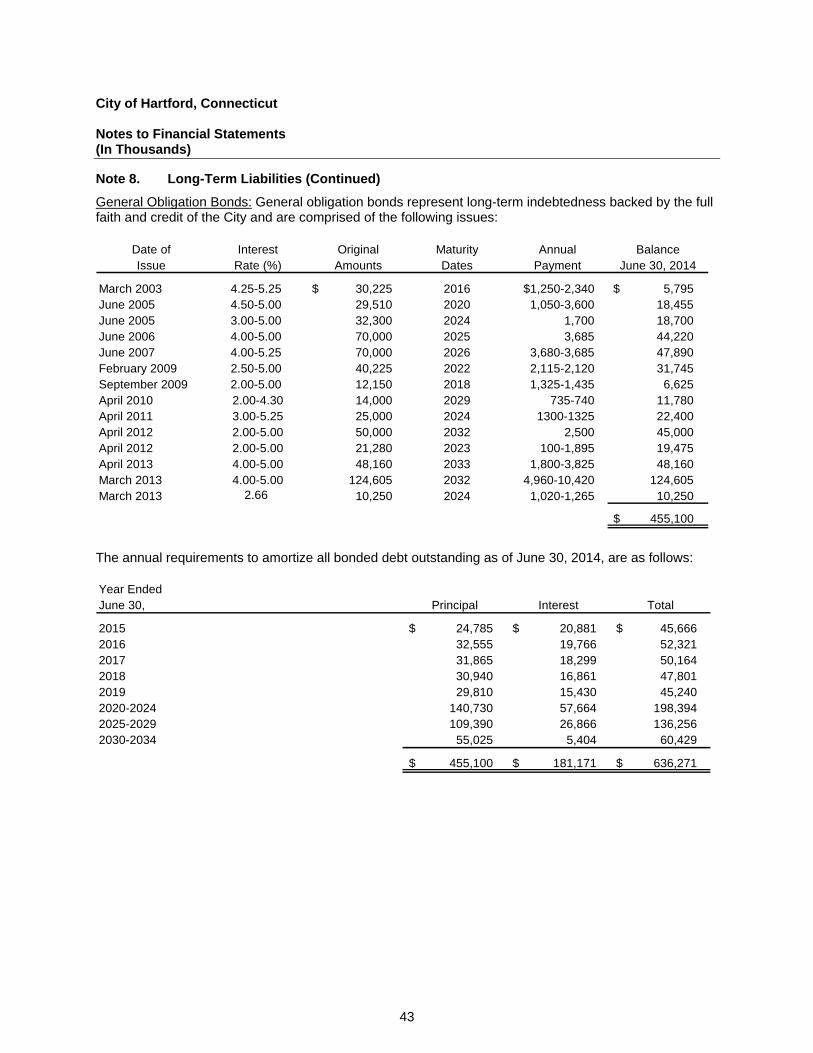
City of Hartford, Connecticut Notes to Financial Statements (In Thousands)
43
Note 8. Long-Term Liabilities (Continued)
General Obligation Bonds: General obligation bonds represent long-term indebtedness backed by the full faith and credit of the City and are comprised of the following issues:
Date of Interest Original Maturity Annual BalanceIssue Rate (%) Amounts Dates Payment June 30, 2014
March 2003 4.25-5.25 $ 30,225 2016 $1,250-2,340 $ 5,795 June 2005 4.50-5.00 29,510 2020 1,050-3,600 18,455 June 2005 3.00-5.00 32,300 2024 1,700 18,700 June 2006 4.00-5.00 70,000 2025 3,685 44,220 June 2007 4.00-5.25 70,000 2026 3,680-3,685 47,890 February 2009 2.50-5.00 40,225 2022 2,115-2,120 31,745 September 2009 2.00-5.00 12,150 2018 1,325-1,435 6,625 April 2010 2.00-4.30 14,000 2029 735-740 11,780 April 2011 3.00-5.25 25,000 2024 1300-1325 22,400 April 2012 2.00-5.00 50,000 2032 2,500 45,000 April 2012 2.00-5.00 21,280 2023 100-1,895 19,475 April 2013 4.00-5.00 48,160 2033 1,800-3,825 48,160 March 2013 4.00-5.00 124,605 2032 4,960-10,420 124,605 March 2013 2.66 10,250 2024 1,020-1,265 10,250
$ 455,100
The annual requirements to amortize all bonded debt outstanding as of June 30, 2014, are as follows: Year EndedJune 30, Principal Interest Total
2015 24,785 $ 20,881 $ 45,666 $ 2016 32,555 19,766 52,321 2017 31,865 18,299 50,164 2018 30,940 16,861 47,801 2019 29,810 15,430 45,240 2020-2024 140,730 57,664 198,394 2025-2029 109,390 26,866 136,256 2030-2034 55,025 5,404 60,429
455,100 $ 181,171 $ 636,271 $
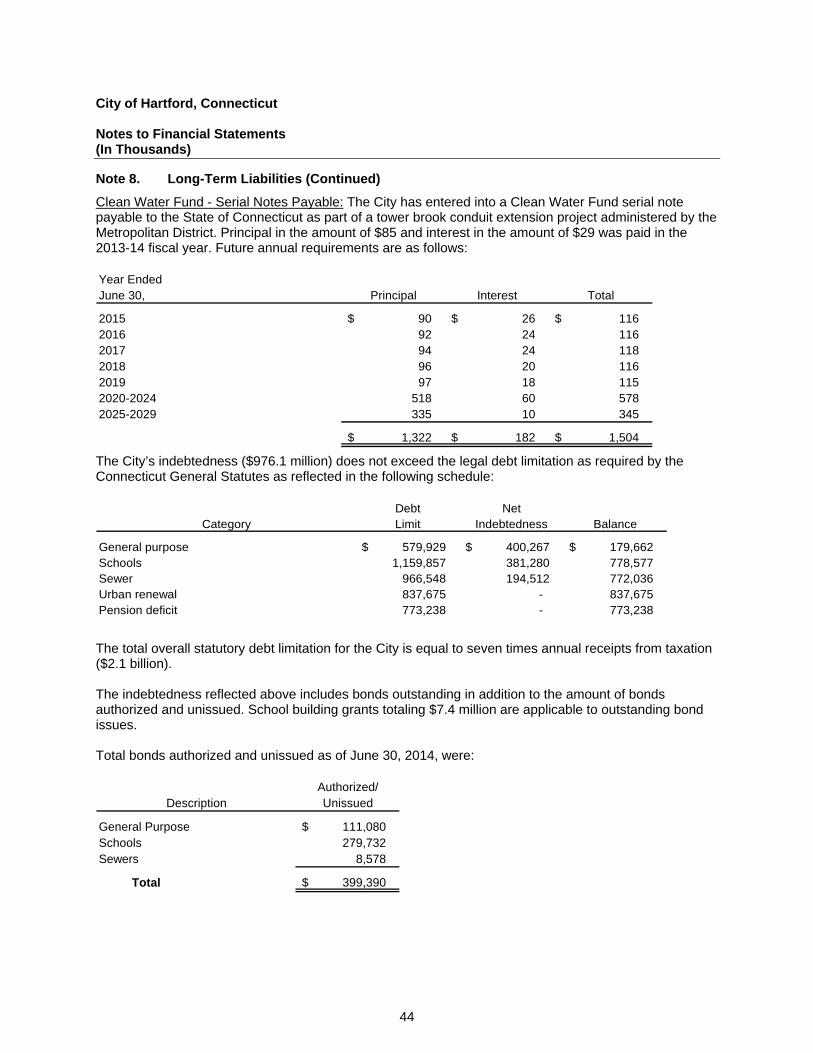
City of Hartford, Connecticut Notes to Financial Statements (In Thousands)
44
Note 8. Long-Term Liabilities (Continued)
Clean Water Fund - Serial Notes Payable: The City has entered into a Clean Water Fund serial note payable to the State of Connecticut as part of a tower brook conduit extension project administered by the Metropolitan District. Principal in the amount of $85 and interest in the amount of $29 was paid in the 2013-14 fiscal year. Future annual requirements are as follows: Year EndedJune 30, Principal Interest Total
2015 90 $ 26 $ 116 $ 2016 92 24 116 2017 94 24 118 2018 96 20 116 2019 97 18 115 2020-2024 518 60 578 2025-2029 335 10 345
1,322 $ 182 $ 1,504 $
The City’s indebtedness ($976.1 million) does not exceed the legal debt limitation as required by the Connecticut General Statutes as reflected in the following schedule:
Debt NetCategory Limit Indebtedness Balance
General purpose 579,929 $ 400,267 $ 179,662 $ Schools 1,159,857 381,280 778,577 Sewer 966,548 194,512 772,036 Urban renewal 837,675 - 837,675 Pension deficit 773,238 - 773,238
The total overall statutory debt limitation for the City is equal to seven times annual receipts from taxation ($2.1 billion). The indebtedness reflected above includes bonds outstanding in addition to the amount of bonds authorized and unissued. School building grants totaling $7.4 million are applicable to outstanding bond issues. Total bonds authorized and unissued as of June 30, 2014, were:
Authorized/Description Unissued
General Purpose 111,080 $ Schools 279,732 Sewers 8,578
Total 399,390 $
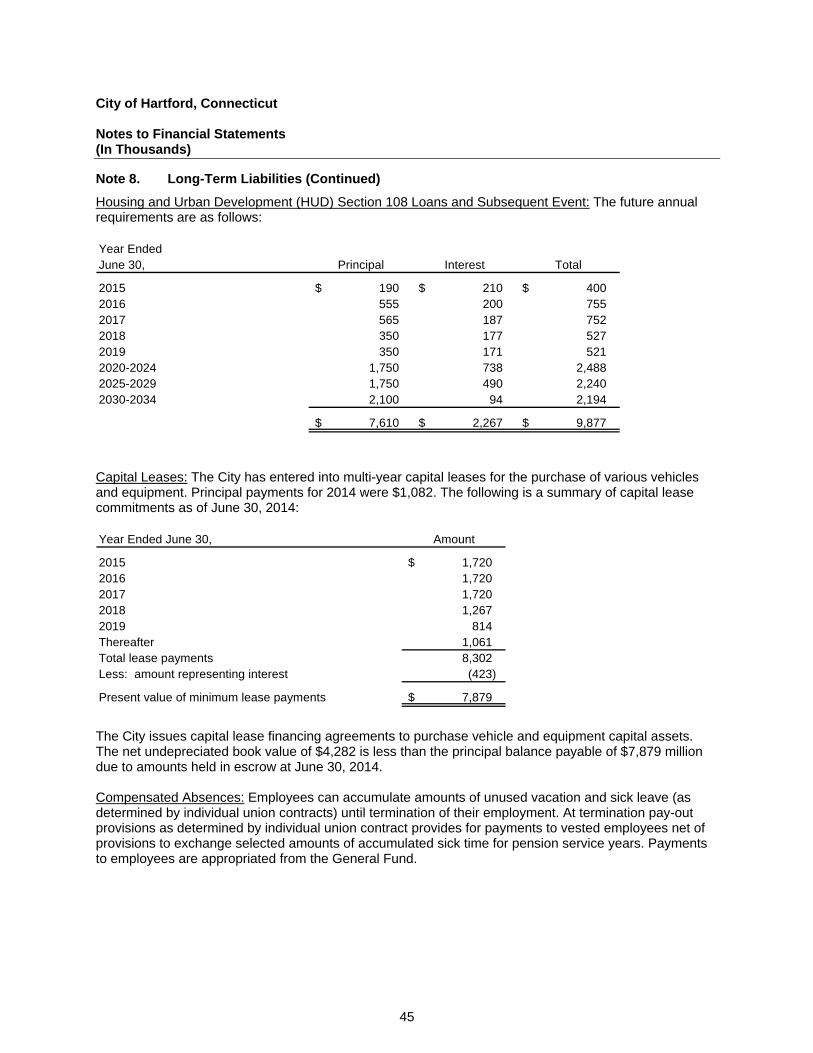
City of Hartford, Connecticut Notes to Financial Statements (In Thousands)
45
Note 8. Long-Term Liabilities (Continued)
Housing and Urban Development (HUD) Section 108 Loans and Subsequent Event: The future annual requirements are as follows: Year EndedJune 30, Principal Interest Total
2015 190 $ 210 $ 400 $ 2016 555 200 755 2017 565 187 752 2018 350 177 527 2019 350 171 521 2020-2024 1,750 738 2,488 2025-2029 1,750 490 2,240 2030-2034 2,100 94 2,194
7,610 $ 2,267 $ 9,877 $
Capital Leases: The City has entered into multi-year capital leases for the purchase of various vehicles and equipment. Principal payments for 2014 were $1,082. The following is a summary of capital lease commitments as of June 30, 2014: Year Ended June 30, Amount
2015 1,720 $ 2016 1,720 2017 1,720 2018 1,267 2019 814 Thereafter 1,061 Total lease payments 8,302 Less: amount representing interest (423)
Present value of minimum lease payments 7,879 $
The City issues capital lease financing agreements to purchase vehicle and equipment capital assets. The net undepreciated book value of $4,282 is less than the principal balance payable of $7,879 million due to amounts held in escrow at June 30, 2014. Compensated Absences: Employees can accumulate amounts of unused vacation and sick leave (as determined by individual union contracts) until termination of their employment. At termination pay-out provisions as determined by individual union contract provides for payments to vested employees net of provisions to exchange selected amounts of accumulated sick time for pension service years. Payments to employees are appropriated from the General Fund.
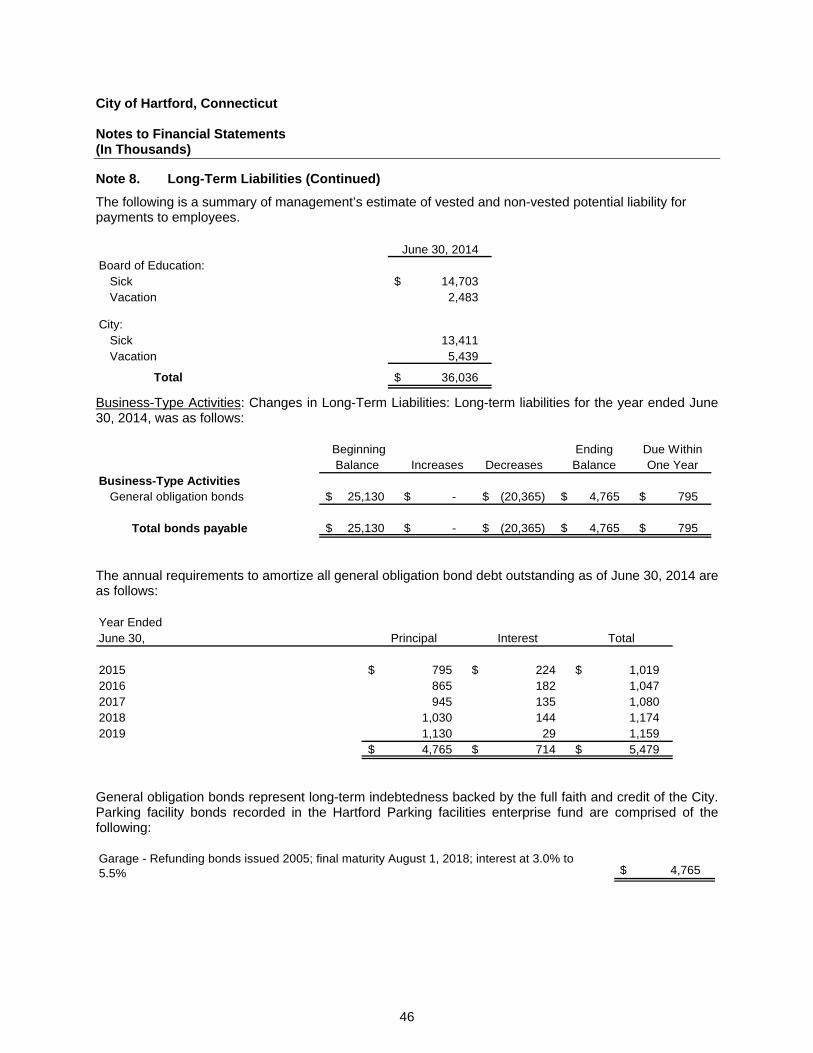
City of Hartford, Connecticut Notes to Financial Statements (In Thousands)
46
Note 8. Long-Term Liabilities (Continued)
The following is a summary of management’s estimate of vested and non-vested potential liability for payments to employees.
June 30, 2014Board of Education:
Sick 14,703 $ Vacation 2,483
City:Sick 13,411 Vacation 5,439
Total 36,036 $
Business-Type Activities: Changes in Long-Term Liabilities: Long-term liabilities for the year ended June 30, 2014, was as follows:
Beginning Ending Due WithinBalance Increases Decreases Balance One Year
Business-Type ActivitiesGeneral obligation bonds 25,130 $ -$ (20,365) $ 4,765 $ 795 $
Total bonds payable 25,130 $ -$ (20,365) $ 4,765 $ 795 $
The annual requirements to amortize all general obligation bond debt outstanding as of June 30, 2014 are as follows: Year EndedJune 30, Principal Interest Total
2015 795 $ 224 $ 1,019 $ 2016 865 182 1,047 2017 945 135 1,080 2018 1,030 144 1,174 2019 1,130 29 1,159
4,765 $ 714 $ 5,479 $
General obligation bonds represent long-term indebtedness backed by the full faith and credit of the City. Parking facility bonds recorded in the Hartford Parking facilities enterprise fund are comprised of the following: Garage - Refunding bonds issued 2005; final maturity August 1, 2018; interest at 3.0% to 5.5% $ 4,765
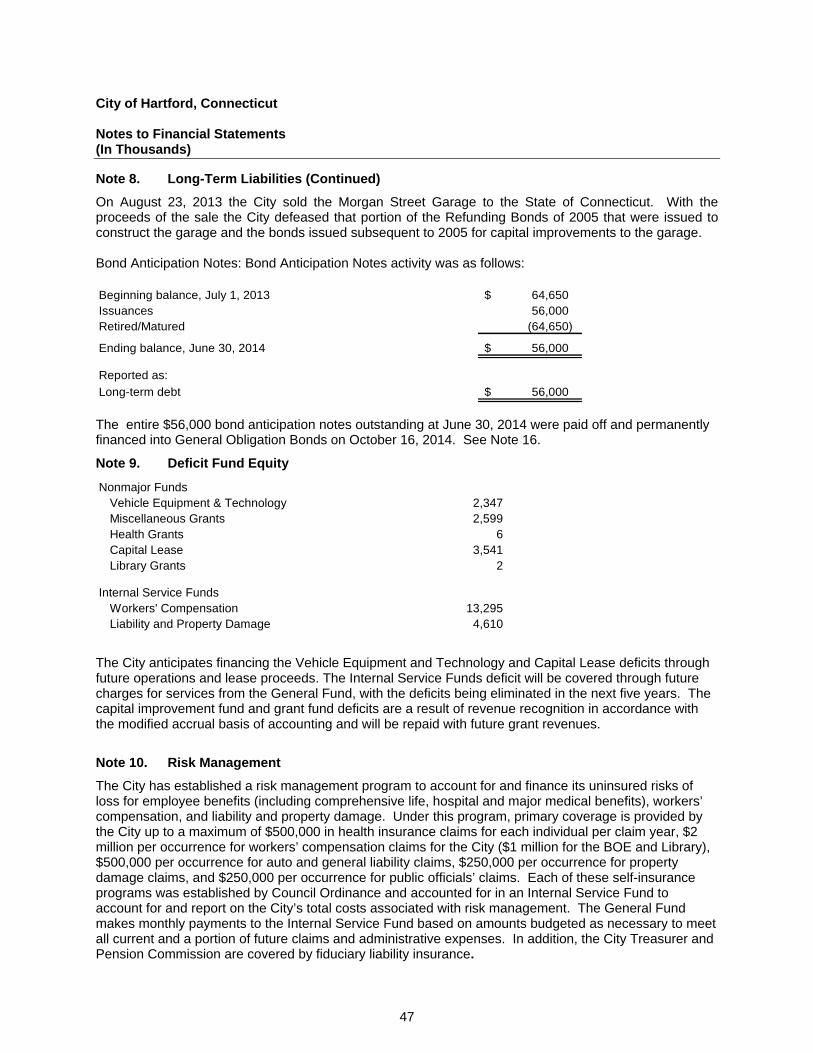
City of Hartford, Connecticut Notes to Financial Statements (In Thousands)
47
Note 8. Long-Term Liabilities (Continued)
On August 23, 2013 the City sold the Morgan Street Garage to the State of Connecticut. With the proceeds of the sale the City defeased that portion of the Refunding Bonds of 2005 that were issued to construct the garage and the bonds issued subsequent to 2005 for capital improvements to the garage. Bond Anticipation Notes: Bond Anticipation Notes activity was as follows: Beginning balance, July 1, 2013 64,650 $ Issuances 56,000 Retired/Matured (64,650)
Ending balance, June 30, 2014 56,000 $
Reported as:
Long-term debt 56,000 $
The entire $56,000 bond anticipation notes outstanding at June 30, 2014 were paid off and permanently financed into General Obligation Bonds on October 16, 2014. See Note 16.
Note 9. Deficit Fund Equity
Nonmajor FundsVehicle Equipment & Technology 2,347 Miscellaneous Grants 2,599 Health Grants 6 Capital Lease 3,541 Library Grants 2
Internal Service FundsWorkers' Compensation 13,295 Liability and Property Damage 4,610
The City anticipates financing the Vehicle Equipment and Technology and Capital Lease deficits through future operations and lease proceeds. The Internal Service Funds deficit will be covered through future charges for services from the General Fund, with the deficits being eliminated in the next five years. The capital improvement fund and grant fund deficits are a result of revenue recognition in accordance with the modified accrual basis of accounting and will be repaid with future grant revenues.
Note 10. Risk Management
The City has established a risk management program to account for and finance its uninsured risks of loss for employee benefits (including comprehensive life, hospital and major medical benefits), workers’ compensation, and liability and property damage. Under this program, primary coverage is provided by the City up to a maximum of $500,000 in health insurance claims for each individual per claim year, $2 million per occurrence for workers’ compensation claims for the City ($1 million for the BOE and Library), $500,000 per occurrence for auto and general liability claims, $250,000 per occurrence for property damage claims, and $250,000 per occurrence for public officials’ claims. Each of these self-insurance programs was established by Council Ordinance and accounted for in an Internal Service Fund to account for and report on the City’s total costs associated with risk management. The General Fund makes monthly payments to the Internal Service Fund based on amounts budgeted as necessary to meet all current and a portion of future claims and administrative expenses. In addition, the City Treasurer and Pension Commission are covered by fiduciary liability insurance.
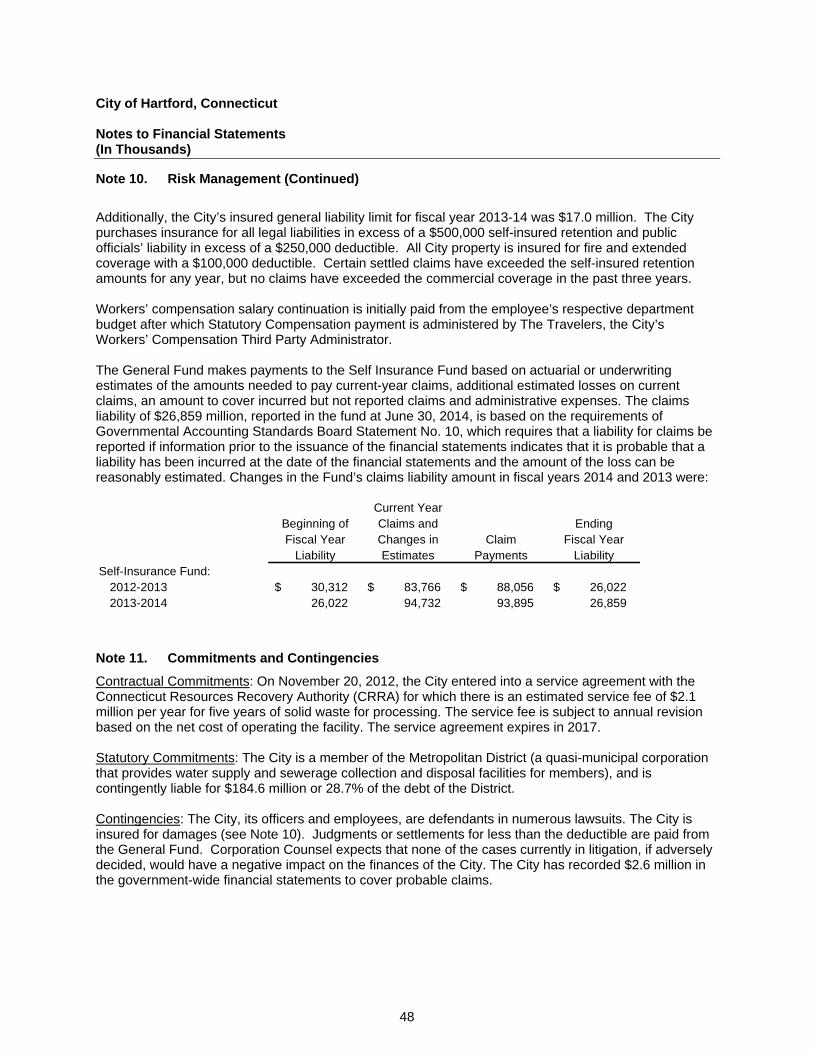
City of Hartford, Connecticut Notes to Financial Statements (In Thousands)
48
Note 10. Risk Management (Continued)
Additionally, the City’s insured general liability limit for fiscal year 2013-14 was $17.0 million. The City purchases insurance for all legal liabilities in excess of a $500,000 self-insured retention and public officials’ liability in excess of a $250,000 deductible. All City property is insured for fire and extended coverage with a $100,000 deductible. Certain settled claims have exceeded the self-insured retention amounts for any year, but no claims have exceeded the commercial coverage in the past three years. Workers’ compensation salary continuation is initially paid from the employee’s respective department budget after which Statutory Compensation payment is administered by The Travelers, the City’s Workers’ Compensation Third Party Administrator. The General Fund makes payments to the Self Insurance Fund based on actuarial or underwriting estimates of the amounts needed to pay current-year claims, additional estimated losses on current claims, an amount to cover incurred but not reported claims and administrative expenses. The claims liability of $26,859 million, reported in the fund at June 30, 2014, is based on the requirements of Governmental Accounting Standards Board Statement No. 10, which requires that a liability for claims be reported if information prior to the issuance of the financial statements indicates that it is probable that a liability has been incurred at the date of the financial statements and the amount of the loss can be reasonably estimated. Changes in the Fund’s claims liability amount in fiscal years 2014 and 2013 were:
Current YearBeginning of Claims and EndingFiscal Year Changes in Claim Fiscal Year
Liability Estimates Payments LiabilitySelf-Insurance Fund:
2012-2013 30,312 $ 83,766 $ 88,056 $ 26,022 $ 2013-2014 26,022 94,732 93,895 26,859
Note 11. Commitments and Contingencies
Contractual Commitments: On November 20, 2012, the City entered into a service agreement with the Connecticut Resources Recovery Authority (CRRA) for which there is an estimated service fee of $2.1 million per year for five years of solid waste for processing. The service fee is subject to annual revision based on the net cost of operating the facility. The service agreement expires in 2017. Statutory Commitments: The City is a member of the Metropolitan District (a quasi-municipal corporation that provides water supply and sewerage collection and disposal facilities for members), and is contingently liable for $184.6 million or 28.7% of the debt of the District. Contingencies: The City, its officers and employees, are defendants in numerous lawsuits. The City is insured for damages (see Note 10). Judgments or settlements for less than the deductible are paid from the General Fund. Corporation Counsel expects that none of the cases currently in litigation, if adversely decided, would have a negative impact on the finances of the City. The City has recorded $2.6 million in the government-wide financial statements to cover probable claims.
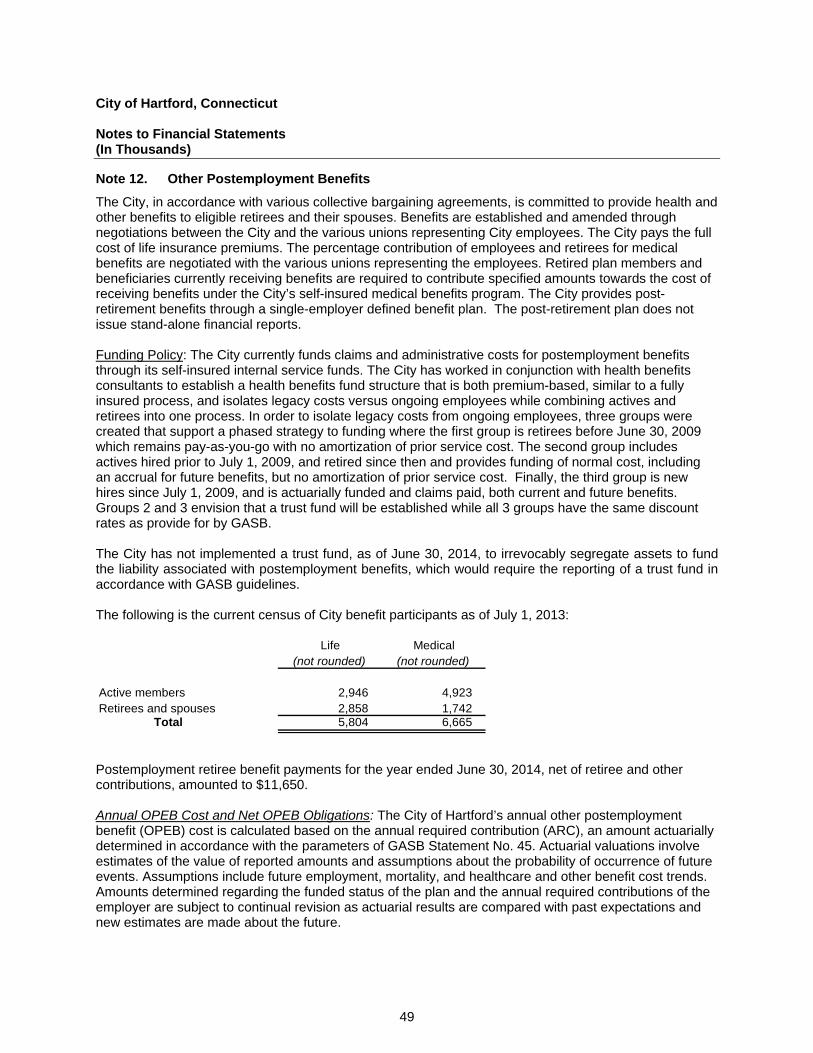
City of Hartford, Connecticut Notes to Financial Statements (In Thousands)
49
Note 12. Other Postemployment Benefits
The City, in accordance with various collective bargaining agreements, is committed to provide health and other benefits to eligible retirees and their spouses. Benefits are established and amended through negotiations between the City and the various unions representing City employees. The City pays the full cost of life insurance premiums. The percentage contribution of employees and retirees for medical benefits are negotiated with the various unions representing the employees. Retired plan members and beneficiaries currently receiving benefits are required to contribute specified amounts towards the cost of receiving benefits under the City’s self-insured medical benefits program. The City provides post-retirement benefits through a single-employer defined benefit plan. The post-retirement plan does not issue stand-alone financial reports. Funding Policy: The City currently funds claims and administrative costs for postemployment benefits through its self-insured internal service funds. The City has worked in conjunction with health benefits consultants to establish a health benefits fund structure that is both premium-based, similar to a fully insured process, and isolates legacy costs versus ongoing employees while combining actives and retirees into one process. In order to isolate legacy costs from ongoing employees, three groups were created that support a phased strategy to funding where the first group is retirees before June 30, 2009 which remains pay-as-you-go with no amortization of prior service cost. The second group includes actives hired prior to July 1, 2009, and retired since then and provides funding of normal cost, including an accrual for future benefits, but no amortization of prior service cost. Finally, the third group is new hires since July 1, 2009, and is actuarially funded and claims paid, both current and future benefits. Groups 2 and 3 envision that a trust fund will be established while all 3 groups have the same discount rates as provide for by GASB. The City has not implemented a trust fund, as of June 30, 2014, to irrevocably segregate assets to fund the liability associated with postemployment benefits, which would require the reporting of a trust fund in accordance with GASB guidelines. The following is the current census of City benefit participants as of July 1, 2013:
Life Medical(not rounded) (not rounded)
Active members 2,946 4,923 Retirees and spouses 2,858 1,742
Total 5,804 6,665
Postemployment retiree benefit payments for the year ended June 30, 2014, net of retiree and other contributions, amounted to $11,650. Annual OPEB Cost and Net OPEB Obligations: The City of Hartford’s annual other postemployment benefit (OPEB) cost is calculated based on the annual required contribution (ARC), an amount actuarially determined in accordance with the parameters of GASB Statement No. 45. Actuarial valuations involve estimates of the value of reported amounts and assumptions about the probability of occurrence of future events. Assumptions include future employment, mortality, and healthcare and other benefit cost trends. Amounts determined regarding the funded status of the plan and the annual required contributions of the employer are subject to continual revision as actuarial results are compared with past expectations and new estimates are made about the future.
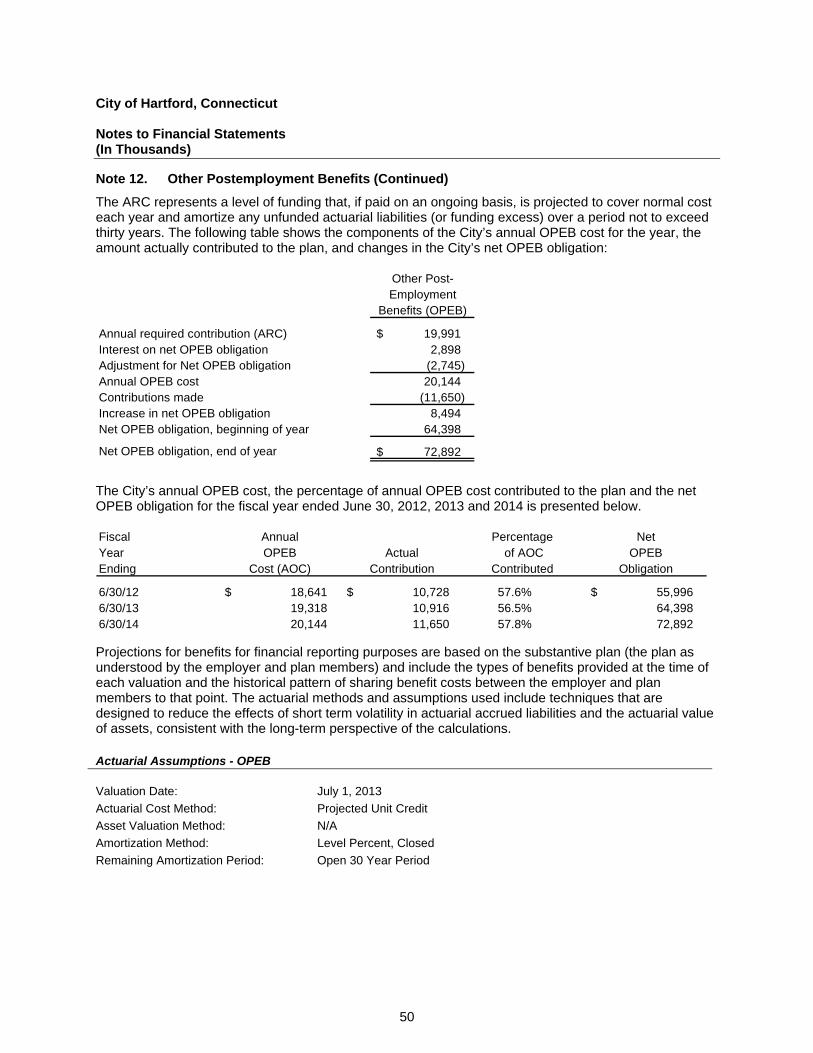
City of Hartford, Connecticut Notes to Financial Statements (In Thousands)
50
Note 12. Other Postemployment Benefits (Continued)
The ARC represents a level of funding that, if paid on an ongoing basis, is projected to cover normal cost each year and amortize any unfunded actuarial liabilities (or funding excess) over a period not to exceed thirty years. The following table shows the components of the City’s annual OPEB cost for the year, the amount actually contributed to the plan, and changes in the City’s net OPEB obligation:
Other Post-Employment
Benefits (OPEB)
Annual required contribution (ARC) 19,991 $ Interest on net OPEB obligation 2,898 Adjustment for Net OPEB obligation (2,745) Annual OPEB cost 20,144 Contributions made (11,650) Increase in net OPEB obligation 8,494 Net OPEB obligation, beginning of year 64,398
Net OPEB obligation, end of year 72,892 $
The City’s annual OPEB cost, the percentage of annual OPEB cost contributed to the plan and the net OPEB obligation for the fiscal year ended June 30, 2012, 2013 and 2014 is presented below. Fiscal Annual Percentage NetYear OPEB Actual of AOC OPEBEnding Cost (AOC) Contribution Contributed Obligation
6/30/12 18,641 $ 10,728 $ 57.6% 55,996 $ 6/30/13 19,318 10,916 56.5% 64,398 6/30/14 20,144 11,650 57.8% 72,892
Projections for benefits for financial reporting purposes are based on the substantive plan (the plan as understood by the employer and plan members) and include the types of benefits provided at the time of each valuation and the historical pattern of sharing benefit costs between the employer and plan members to that point. The actuarial methods and assumptions used include techniques that are designed to reduce the effects of short term volatility in actuarial accrued liabilities and the actuarial value of assets, consistent with the long-term perspective of the calculations. Actuarial Assumptions - OPEB
Valuation Date: July 1, 2013
Actuarial Cost Method: Projected Unit Credit
Asset Valuation Method: N/A
Amortization Method: Level Percent, Closed
Remaining Amortization Period: Open 30 Year Period
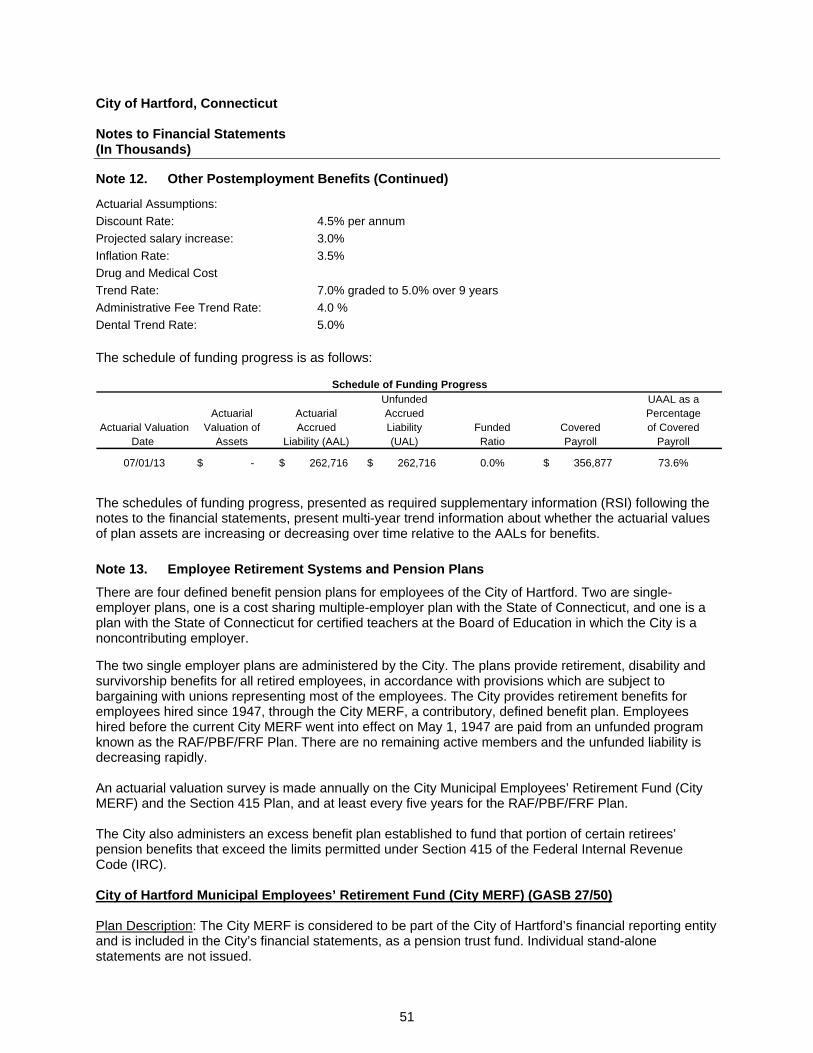
City of Hartford, Connecticut Notes to Financial Statements (In Thousands)
51
Note 12. Other Postemployment Benefits (Continued)
Actuarial Assumptions:
Discount Rate: 4.5% per annum
Projected salary increase: 3.0%
Inflation Rate: 3.5%
Drug and Medical Cost
Trend Rate:
Administrative Fee Trend Rate:
Dental Trend Rate:
7.0% graded to 5.0% over 9 years
4.0 %
5.0%
The schedule of funding progress is as follows:
Unfunded UAAL as aActuarial Actuarial Accrued Percentage
Actuarial Valuation Valuation of Accrued Liability Funded Covered of CoveredDate Assets Liability (AAL) (UAL) Ratio Payroll Payroll
07/01/13 -$ 262,716 $ 262,716 $ 0.0% 356,877 $ 73.6%
Schedule of Funding Progress
The schedules of funding progress, presented as required supplementary information (RSI) following the notes to the financial statements, present multi-year trend information about whether the actuarial values of plan assets are increasing or decreasing over time relative to the AALs for benefits.
Note 13. Employee Retirement Systems and Pension Plans
There are four defined benefit pension plans for employees of the City of Hartford. Two are single-employer plans, one is a cost sharing multiple-employer plan with the State of Connecticut, and one is a plan with the State of Connecticut for certified teachers at the Board of Education in which the City is a noncontributing employer. The two single employer plans are administered by the City. The plans provide retirement, disability and survivorship benefits for all retired employees, in accordance with provisions which are subject to bargaining with unions representing most of the employees. The City provides retirement benefits for employees hired since 1947, through the City MERF, a contributory, defined benefit plan. Employees hired before the current City MERF went into effect on May 1, 1947 are paid from an unfunded program known as the RAF/PBF/FRF Plan. There are no remaining active members and the unfunded liability is decreasing rapidly. An actuarial valuation survey is made annually on the City Municipal Employees’ Retirement Fund (City MERF) and the Section 415 Plan, and at least every five years for the RAF/PBF/FRF Plan. The City also administers an excess benefit plan established to fund that portion of certain retirees’ pension benefits that exceed the limits permitted under Section 415 of the Federal Internal Revenue Code (IRC). City of Hartford Municipal Employees’ Retirement Fund (City MERF) (GASB 27/50) Plan Description: The City MERF is considered to be part of the City of Hartford’s financial reporting entity and is included in the City’s financial statements, as a pension trust fund. Individual stand-alone statements are not issued.
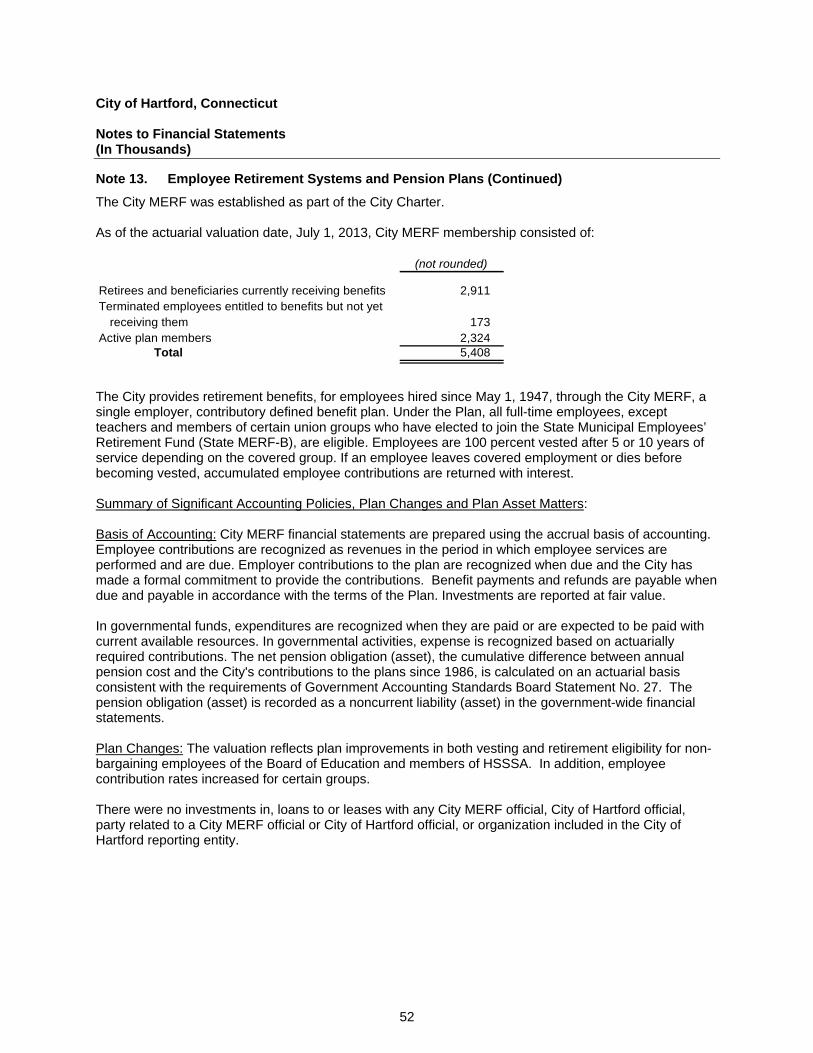
City of Hartford, Connecticut Notes to Financial Statements (In Thousands)
52
Note 13. Employee Retirement Systems and Pension Plans (Continued)
The City MERF was established as part of the City Charter. As of the actuarial valuation date, July 1, 2013, City MERF membership consisted of:
(not rounded)
Retirees and beneficiaries currently receiving benefits 2,911 Terminated employees entitled to benefits but not yet
receiving them 173 Active plan members 2,324
Total 5,408
The City provides retirement benefits, for employees hired since May 1, 1947, through the City MERF, a single employer, contributory defined benefit plan. Under the Plan, all full-time employees, except teachers and members of certain union groups who have elected to join the State Municipal Employees’ Retirement Fund (State MERF-B), are eligible. Employees are 100 percent vested after 5 or 10 years of service depending on the covered group. If an employee leaves covered employment or dies before becoming vested, accumulated employee contributions are returned with interest. Summary of Significant Accounting Policies, Plan Changes and Plan Asset Matters: Basis of Accounting: City MERF financial statements are prepared using the accrual basis of accounting. Employee contributions are recognized as revenues in the period in which employee services are performed and are due. Employer contributions to the plan are recognized when due and the City has made a formal commitment to provide the contributions. Benefit payments and refunds are payable when due and payable in accordance with the terms of the Plan. Investments are reported at fair value. In governmental funds, expenditures are recognized when they are paid or are expected to be paid with current available resources. In governmental activities, expense is recognized based on actuarially required contributions. The net pension obligation (asset), the cumulative difference between annual pension cost and the City's contributions to the plans since 1986, is calculated on an actuarial basis consistent with the requirements of Government Accounting Standards Board Statement No. 27. The pension obligation (asset) is recorded as a noncurrent liability (asset) in the government-wide financial statements. Plan Changes: The valuation reflects plan improvements in both vesting and retirement eligibility for non-bargaining employees of the Board of Education and members of HSSSA. In addition, employee contribution rates increased for certain groups. There were no investments in, loans to or leases with any City MERF official, City of Hartford official, party related to a City MERF official or City of Hartford official, or organization included in the City of Hartford reporting entity.
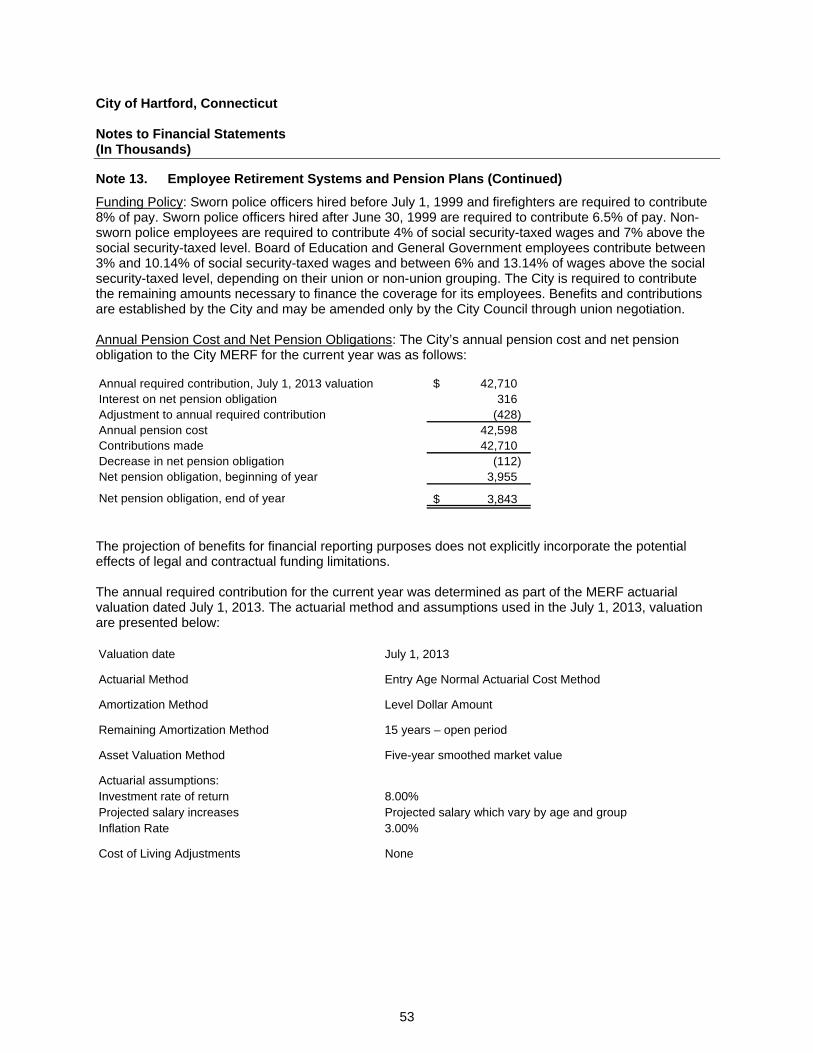
City of Hartford, Connecticut Notes to Financial Statements (In Thousands)
53
Note 13. Employee Retirement Systems and Pension Plans (Continued)
Funding Policy: Sworn police officers hired before July 1, 1999 and firefighters are required to contribute 8% of pay. Sworn police officers hired after June 30, 1999 are required to contribute 6.5% of pay. Non-sworn police employees are required to contribute 4% of social security-taxed wages and 7% above the social security-taxed level. Board of Education and General Government employees contribute between 3% and 10.14% of social security-taxed wages and between 6% and 13.14% of wages above the social security-taxed level, depending on their union or non-union grouping. The City is required to contribute the remaining amounts necessary to finance the coverage for its employees. Benefits and contributions are established by the City and may be amended only by the City Council through union negotiation. Annual Pension Cost and Net Pension Obligations: The City’s annual pension cost and net pension obligation to the City MERF for the current year was as follows:
Annual required contribution, July 1, 2013 valuation 42,710 $ Interest on net pension obligation 316 Adjustment to annual required contribution (428) Annual pension cost 42,598 Contributions made 42,710 Decrease in net pension obligation (112) Net pension obligation, beginning of year 3,955
Net pension obligation, end of year 3,843 $
The projection of benefits for financial reporting purposes does not explicitly incorporate the potential effects of legal and contractual funding limitations. The annual required contribution for the current year was determined as part of the MERF actuarial valuation dated July 1, 2013. The actuarial method and assumptions used in the July 1, 2013, valuation are presented below: Valuation date July 1, 2013 Actuarial Method Entry Age Normal Actuarial Cost Method Amortization Method Level Dollar Amount Remaining Amortization Method 15 years – open period Asset Valuation Method Five-year smoothed market value Actuarial assumptions: Investment rate of return 8.00% Projected salary increases Projected salary which vary by age and group Inflation Rate 3.00% Cost of Living Adjustments None
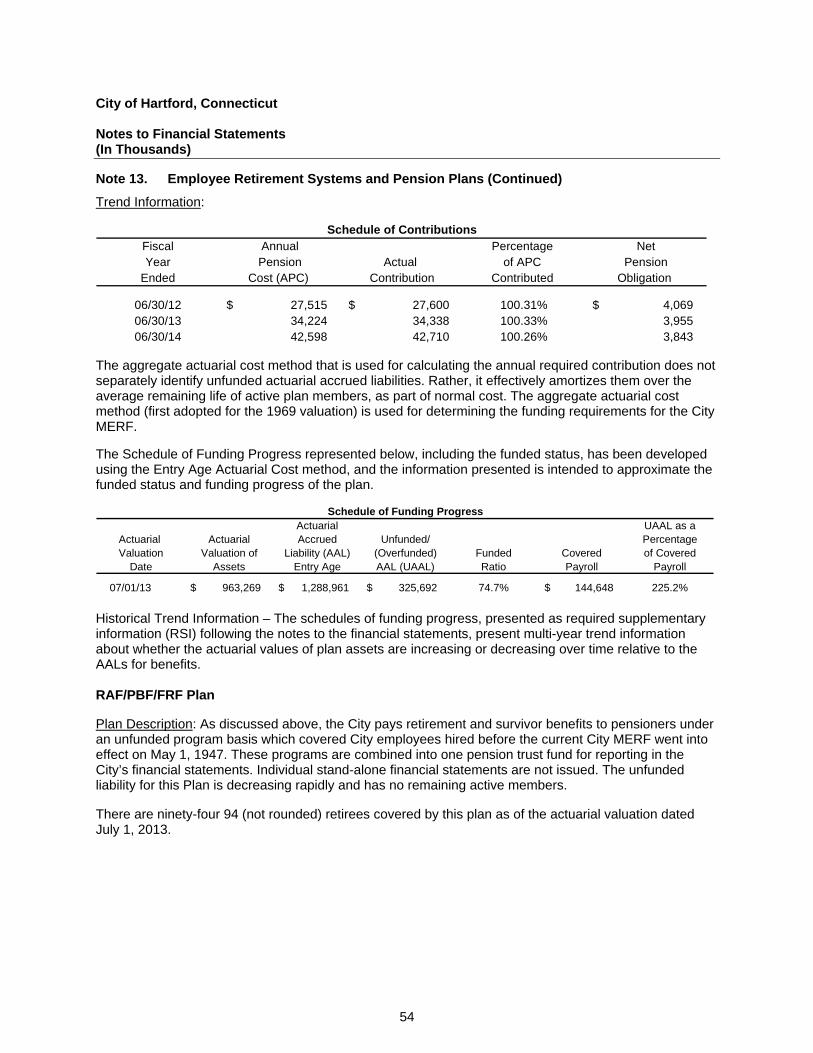
City of Hartford, Connecticut Notes to Financial Statements (In Thousands)
54
Note 13. Employee Retirement Systems and Pension Plans (Continued)
Trend Information:
Fiscal Annual Percentage NetYear Pension Actual of APC Pension
Ended Cost (APC) Contribution Contributed Obligation
06/30/12 27,515 $ 27,600 $ 100.31% 4,069 $ 06/30/13 34,224 34,338 100.33% 3,955 06/30/14 42,598 42,710 100.26% 3,843
Schedule of Contributions
The aggregate actuarial cost method that is used for calculating the annual required contribution does not separately identify unfunded actuarial accrued liabilities. Rather, it effectively amortizes them over the average remaining life of active plan members, as part of normal cost. The aggregate actuarial cost method (first adopted for the 1969 valuation) is used for determining the funding requirements for the City MERF. The Schedule of Funding Progress represented below, including the funded status, has been developed using the Entry Age Actuarial Cost method, and the information presented is intended to approximate the funded status and funding progress of the plan.
Actuarial UAAL as aActuarial Actuarial Accrued Unfunded/ PercentageValuation Valuation of Liability (AAL) (Overfunded) Funded Covered of Covered
Date Assets Entry Age AAL (UAAL) Ratio Payroll Payroll
07/01/13 963,269 $ 1,288,961 $ 325,692 $ 74.7% 144,648 $ 225.2%
Schedule of Funding Progress
Historical Trend Information – The schedules of funding progress, presented as required supplementary information (RSI) following the notes to the financial statements, present multi-year trend information about whether the actuarial values of plan assets are increasing or decreasing over time relative to the AALs for benefits. RAF/PBF/FRF Plan Plan Description: As discussed above, the City pays retirement and survivor benefits to pensioners under an unfunded program basis which covered City employees hired before the current City MERF went into effect on May 1, 1947. These programs are combined into one pension trust fund for reporting in the City’s financial statements. Individual stand-alone financial statements are not issued. The unfunded liability for this Plan is decreasing rapidly and has no remaining active members. There are ninety-four 94 (not rounded) retirees covered by this plan as of the actuarial valuation dated July 1, 2013.
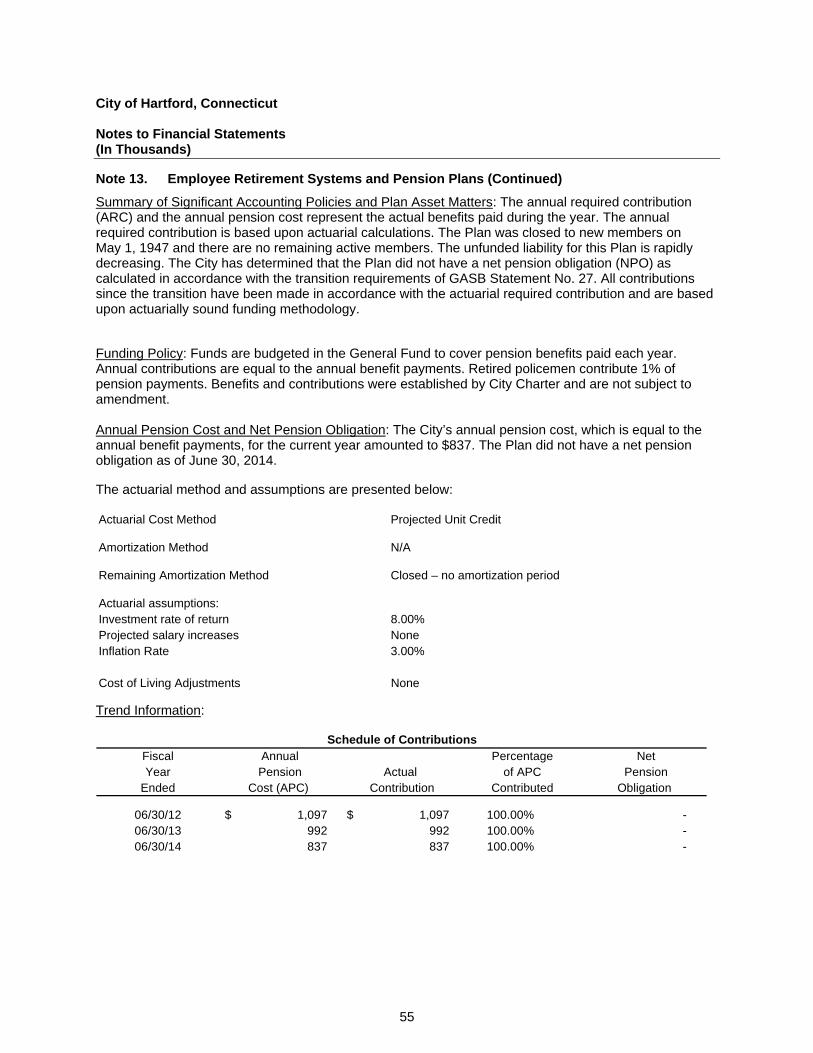
City of Hartford, Connecticut Notes to Financial Statements (In Thousands)
55
Note 13. Employee Retirement Systems and Pension Plans (Continued)
Summary of Significant Accounting Policies and Plan Asset Matters: The annual required contribution (ARC) and the annual pension cost represent the actual benefits paid during the year. The annual required contribution is based upon actuarial calculations. The Plan was closed to new members on May 1, 1947 and there are no remaining active members. The unfunded liability for this Plan is rapidly decreasing. The City has determined that the Plan did not have a net pension obligation (NPO) as calculated in accordance with the transition requirements of GASB Statement No. 27. All contributions since the transition have been made in accordance with the actuarial required contribution and are based upon actuarially sound funding methodology. Funding Policy: Funds are budgeted in the General Fund to cover pension benefits paid each year. Annual contributions are equal to the annual benefit payments. Retired policemen contribute 1% of pension payments. Benefits and contributions were established by City Charter and are not subject to amendment. Annual Pension Cost and Net Pension Obligation: The City’s annual pension cost, which is equal to the annual benefit payments, for the current year amounted to $837. The Plan did not have a net pension obligation as of June 30, 2014. The actuarial method and assumptions are presented below: Actuarial Cost Method Projected Unit Credit Amortization Method N/A Remaining Amortization Method Closed – no amortization period Actuarial assumptions: Investment rate of return 8.00% Projected salary increases None Inflation Rate 3.00% Cost of Living Adjustments None Trend Information:
Fiscal Annual Percentage NetYear Pension Actual of APC Pension
Ended Cost (APC) Contribution Contributed Obligation
06/30/12 1,097 $ 1,097 $ 100.00% - 06/30/13 992 992 100.00% - 06/30/14 837 837 100.00% -
Schedule of Contributions
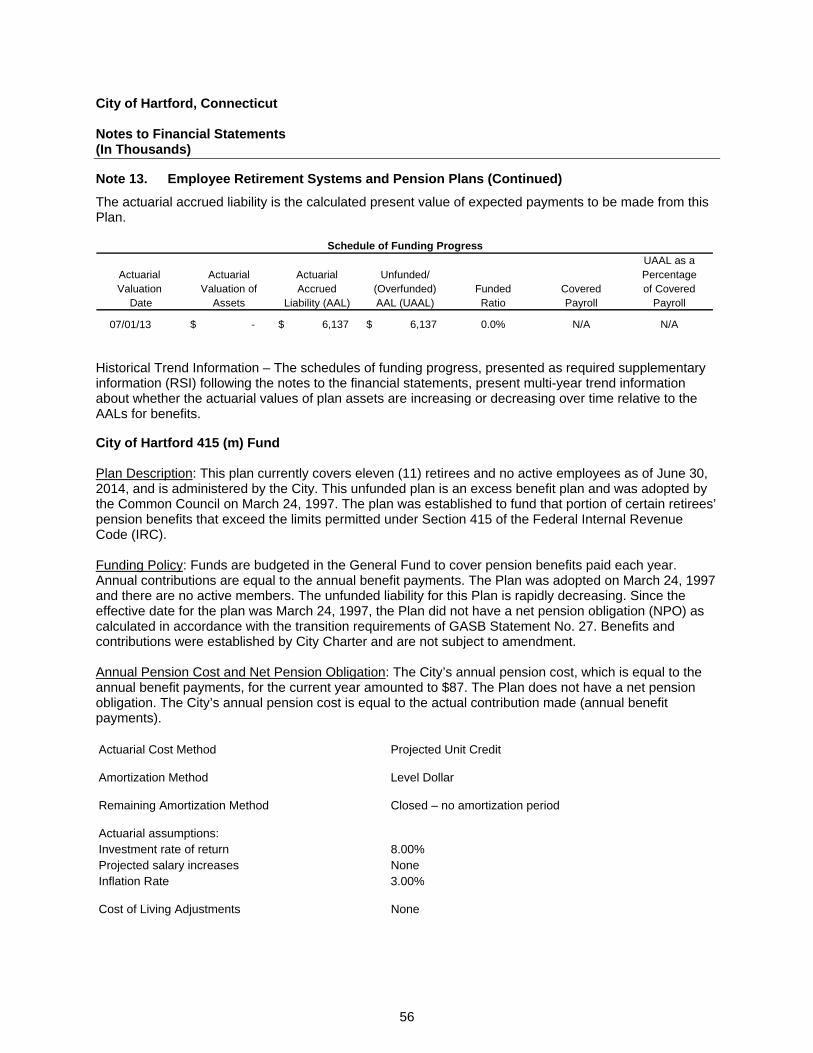
City of Hartford, Connecticut Notes to Financial Statements (In Thousands)
56
Note 13. Employee Retirement Systems and Pension Plans (Continued)
The actuarial accrued liability is the calculated present value of expected payments to be made from this Plan.
UAAL as aActuarial Actuarial Actuarial Unfunded/ PercentageValuation Valuation of Accrued (Overfunded) Funded Covered of Covered
Date Assets Liability (AAL) AAL (UAAL) Ratio Payroll Payroll
07/01/13 -$ 6,137 $ 6,137 $ 0.0% N/A N/A
Schedule of Funding Progress
Historical Trend Information – The schedules of funding progress, presented as required supplementary information (RSI) following the notes to the financial statements, present multi-year trend information about whether the actuarial values of plan assets are increasing or decreasing over time relative to the AALs for benefits. City of Hartford 415 (m) Fund Plan Description: This plan currently covers eleven (11) retirees and no active employees as of June 30, 2014, and is administered by the City. This unfunded plan is an excess benefit plan and was adopted by the Common Council on March 24, 1997. The plan was established to fund that portion of certain retirees’ pension benefits that exceed the limits permitted under Section 415 of the Federal Internal Revenue Code (IRC). Funding Policy: Funds are budgeted in the General Fund to cover pension benefits paid each year. Annual contributions are equal to the annual benefit payments. The Plan was adopted on March 24, 1997 and there are no active members. The unfunded liability for this Plan is rapidly decreasing. Since the effective date for the plan was March 24, 1997, the Plan did not have a net pension obligation (NPO) as calculated in accordance with the transition requirements of GASB Statement No. 27. Benefits and contributions were established by City Charter and are not subject to amendment. Annual Pension Cost and Net Pension Obligation: The City’s annual pension cost, which is equal to the annual benefit payments, for the current year amounted to $87. The Plan does not have a net pension obligation. The City’s annual pension cost is equal to the actual contribution made (annual benefit payments). Actuarial Cost Method Projected Unit Credit Amortization Method Level Dollar Remaining Amortization Method Closed – no amortization period Actuarial assumptions: Investment rate of return 8.00% Projected salary increases None Inflation Rate 3.00% Cost of Living Adjustments None
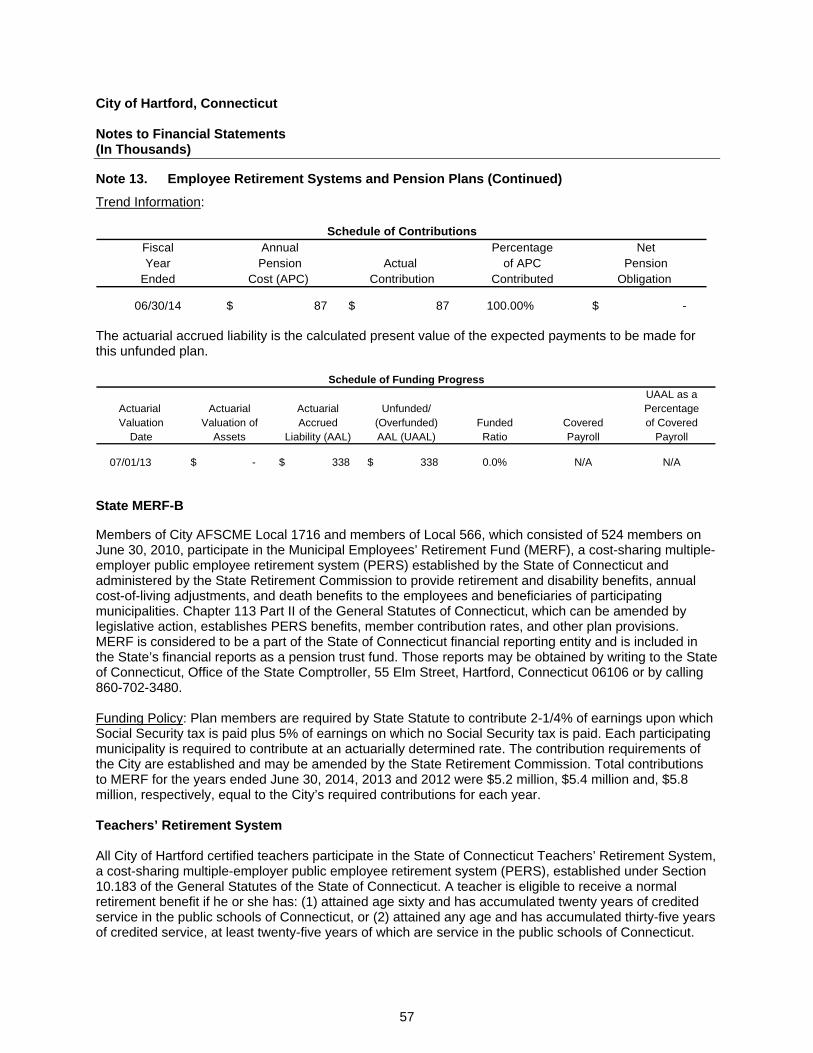
City of Hartford, Connecticut Notes to Financial Statements (In Thousands)
57
Note 13. Employee Retirement Systems and Pension Plans (Continued)
Trend Information:
Fiscal Annual Percentage NetYear Pension Actual of APC Pension
Ended Cost (APC) Contribution Contributed Obligation
06/30/14 87 $ 87 $ 100.00% -$
Schedule of Contributions
The actuarial accrued liability is the calculated present value of the expected payments to be made for this unfunded plan.
UAAL as aActuarial Actuarial Actuarial Unfunded/ PercentageValuation Valuation of Accrued (Overfunded) Funded Covered of Covered
Date Assets Liability (AAL) AAL (UAAL) Ratio Payroll Payroll
07/01/13 -$ 338 $ 338 $ 0.0% N/A N/A
Schedule of Funding Progress
State MERF-B Members of City AFSCME Local 1716 and members of Local 566, which consisted of 524 members on June 30, 2010, participate in the Municipal Employees’ Retirement Fund (MERF), a cost-sharing multiple-employer public employee retirement system (PERS) established by the State of Connecticut and administered by the State Retirement Commission to provide retirement and disability benefits, annual cost-of-living adjustments, and death benefits to the employees and beneficiaries of participating municipalities. Chapter 113 Part II of the General Statutes of Connecticut, which can be amended by legislative action, establishes PERS benefits, member contribution rates, and other plan provisions. MERF is considered to be a part of the State of Connecticut financial reporting entity and is included in the State’s financial reports as a pension trust fund. Those reports may be obtained by writing to the State of Connecticut, Office of the State Comptroller, 55 Elm Street, Hartford, Connecticut 06106 or by calling 860-702-3480. Funding Policy: Plan members are required by State Statute to contribute 2-1/4% of earnings upon which Social Security tax is paid plus 5% of earnings on which no Social Security tax is paid. Each participating municipality is required to contribute at an actuarially determined rate. The contribution requirements of the City are established and may be amended by the State Retirement Commission. Total contributions to MERF for the years ended June 30, 2014, 2013 and 2012 were $5.2 million, $5.4 million and, $5.8 million, respectively, equal to the City’s required contributions for each year. Teachers’ Retirement System All City of Hartford certified teachers participate in the State of Connecticut Teachers’ Retirement System, a cost-sharing multiple-employer public employee retirement system (PERS), established under Section 10.183 of the General Statutes of the State of Connecticut. A teacher is eligible to receive a normal retirement benefit if he or she has: (1) attained age sixty and has accumulated twenty years of credited service in the public schools of Connecticut, or (2) attained any age and has accumulated thirty-five years of credited service, at least twenty-five years of which are service in the public schools of Connecticut.
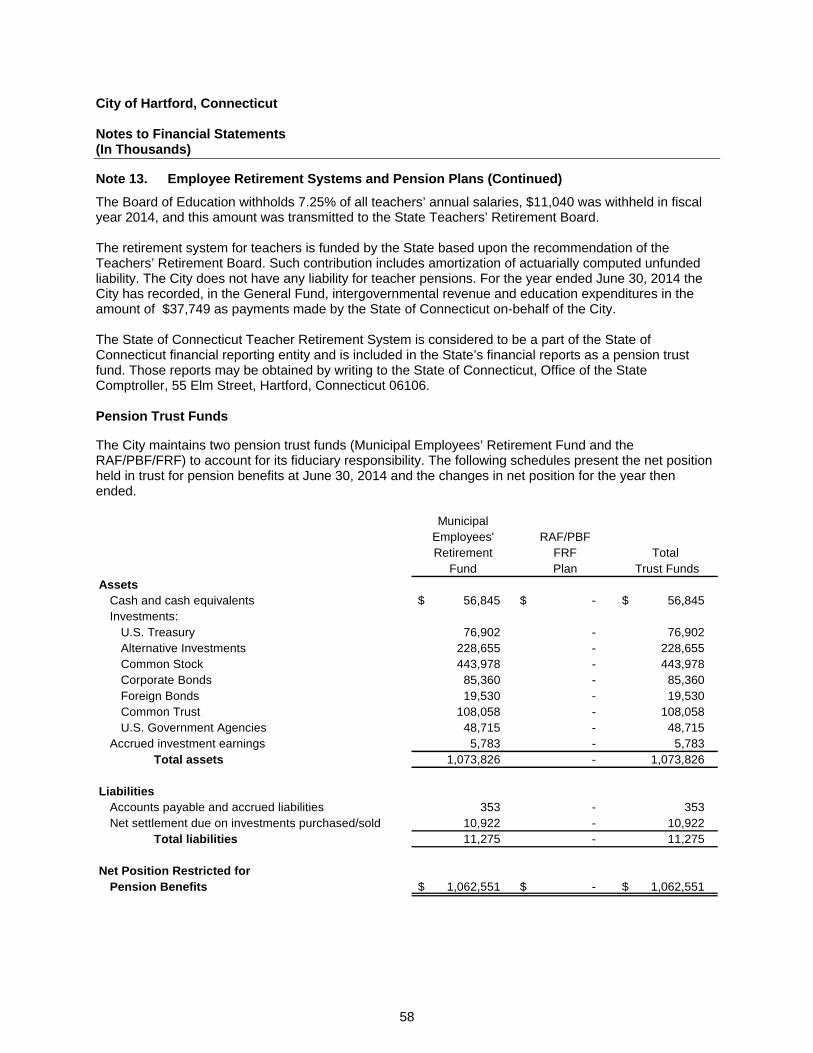
City of Hartford, Connecticut Notes to Financial Statements (In Thousands)
58
Note 13. Employee Retirement Systems and Pension Plans (Continued)
The Board of Education withholds 7.25% of all teachers’ annual salaries, $11,040 was withheld in fiscal year 2014, and this amount was transmitted to the State Teachers’ Retirement Board. The retirement system for teachers is funded by the State based upon the recommendation of the Teachers’ Retirement Board. Such contribution includes amortization of actuarially computed unfunded liability. The City does not have any liability for teacher pensions. For the year ended June 30, 2014 the City has recorded, in the General Fund, intergovernmental revenue and education expenditures in the amount of $37,749 as payments made by the State of Connecticut on-behalf of the City. The State of Connecticut Teacher Retirement System is considered to be a part of the State of Connecticut financial reporting entity and is included in the State’s financial reports as a pension trust fund. Those reports may be obtained by writing to the State of Connecticut, Office of the State Comptroller, 55 Elm Street, Hartford, Connecticut 06106. Pension Trust Funds The City maintains two pension trust funds (Municipal Employees’ Retirement Fund and the RAF/PBF/FRF) to account for its fiduciary responsibility. The following schedules present the net position held in trust for pension benefits at June 30, 2014 and the changes in net position for the year then ended.
MunicipalEmployees' RAF/PBFRetirement FRF Total
Fund Plan Trust FundsAssets
Cash and cash equivalents 56,845 $ -$ 56,845 $ Investments:
U.S. Treasury 76,902 - 76,902 Alternative Investments 228,655 - 228,655 Common Stock 443,978 - 443,978 Corporate Bonds 85,360 - 85,360 Foreign Bonds 19,530 - 19,530 Common Trust 108,058 - 108,058 U.S. Government Agencies 48,715 - 48,715
Accrued investment earnings 5,783 - 5,783 Total assets 1,073,826 - 1,073,826
LiabilitiesAccounts payable and accrued liabilities 353 - 353 Net settlement due on investments purchased/sold 10,922 - 10,922
Total liabilities 11,275 - 11,275
Net Position Restricted forPension Benefits 1,062,551 $ -$ 1,062,551 $
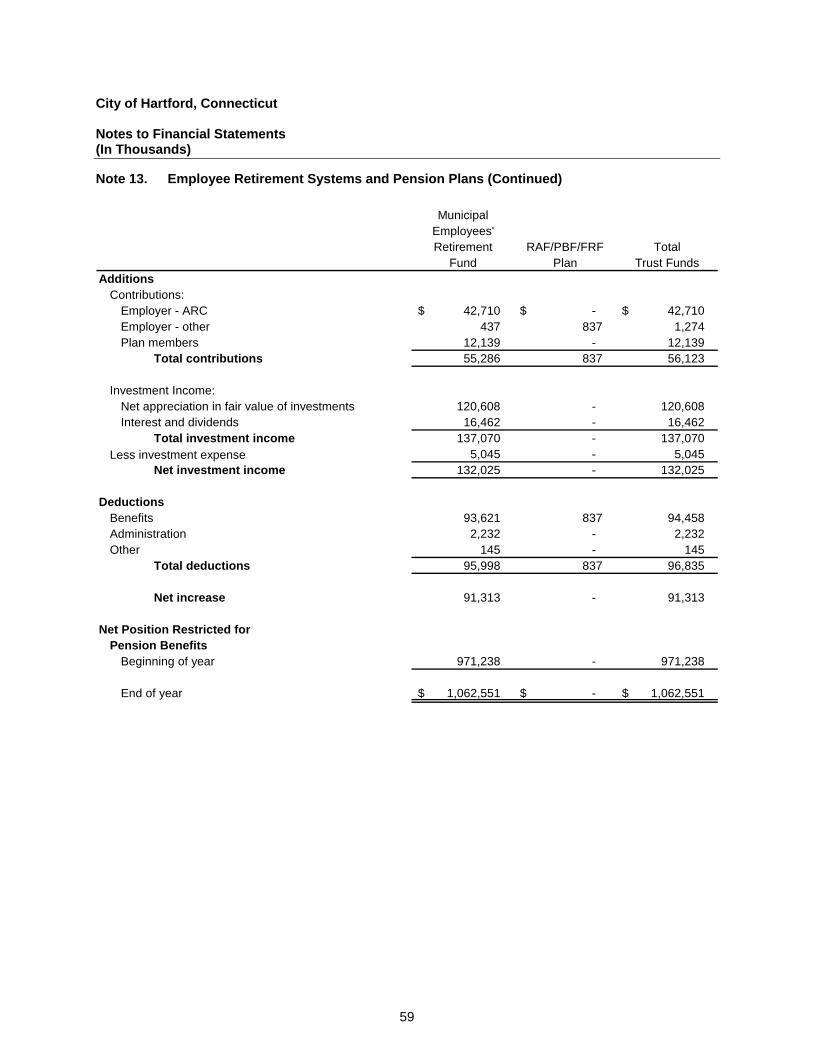
City of Hartford, Connecticut Notes to Financial Statements (In Thousands)
59
Note 13. Employee Retirement Systems and Pension Plans (Continued)
MunicipalEmployees'Retirement RAF/PBF/FRF Total
Fund Plan Trust FundsAdditions
Contributions:Employer - ARC 42,710 $ -$ 42,710 $ Employer - other 437 837 1,274 Plan members 12,139 - 12,139
Total contributions 55,286 837 56,123
Investment Income:Net appreciation in fair value of investments 120,608 - 120,608 Interest and dividends 16,462 - 16,462
Total investment income 137,070 - 137,070 Less investment expense 5,045 - 5,045
Net investment income 132,025 - 132,025
DeductionsBenefits 93,621 837 94,458 Administration 2,232 - 2,232 Other 145 - 145
Total deductions 95,998 837 96,835
Net increase 91,313 - 91,313
Net Position Restricted forPension Benefits
Beginning of year 971,238 - 971,238
End of year 1,062,551 $ -$ 1,062,551 $
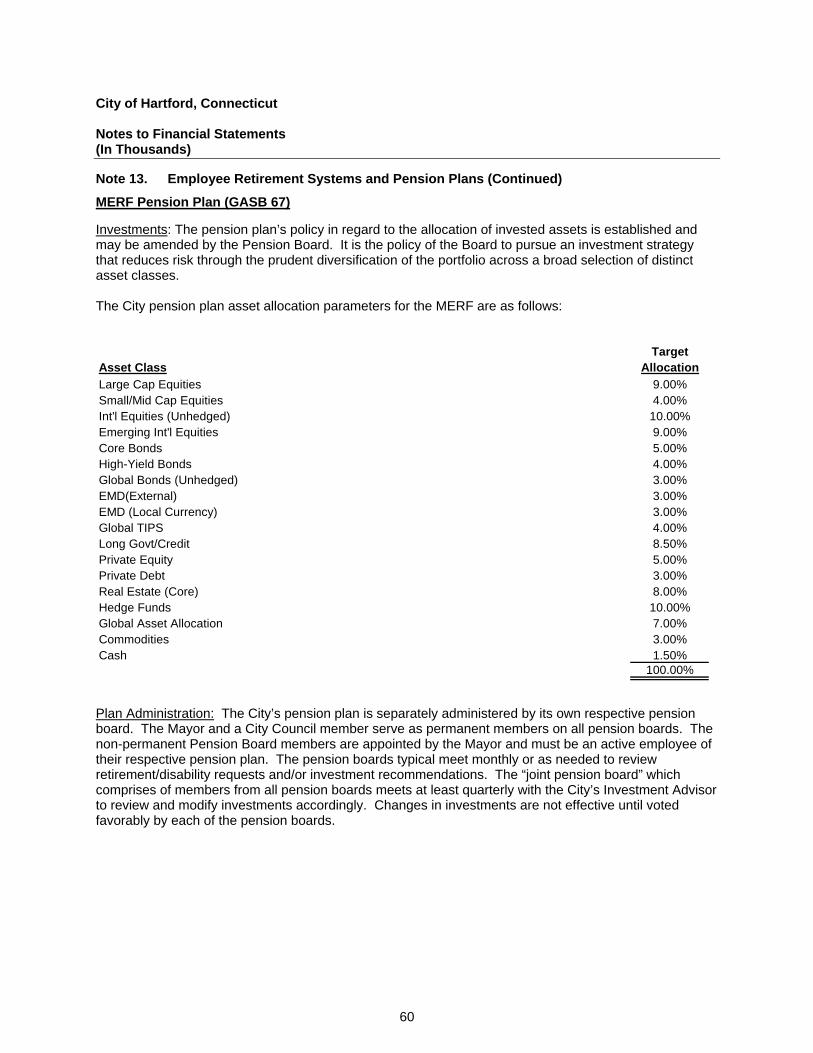
City of Hartford, Connecticut Notes to Financial Statements (In Thousands)
60
Note 13. Employee Retirement Systems and Pension Plans (Continued)
MERF Pension Plan (GASB 67) Investments: The pension plan’s policy in regard to the allocation of invested assets is established and may be amended by the Pension Board. It is the policy of the Board to pursue an investment strategy that reduces risk through the prudent diversification of the portfolio across a broad selection of distinct asset classes. The City pension plan asset allocation parameters for the MERF are as follows:
TargetAsset Class Allocation
Large Cap Equities 9.00%Small/Mid Cap Equities 4.00%Int'l Equities (Unhedged) 10.00%Emerging Int'l Equities 9.00%Core Bonds 5.00%High-Yield Bonds 4.00%Global Bonds (Unhedged) 3.00%EMD(External) 3.00%EMD (Local Currency) 3.00%Global TIPS 4.00%Long Govt/Credit 8.50%Private Equity 5.00%Private Debt 3.00%Real Estate (Core) 8.00%Hedge Funds 10.00%Global Asset Allocation 7.00%Commodities 3.00%Cash 1.50%
100.00%
Plan Administration: The City’s pension plan is separately administered by its own respective pension board. The Mayor and a City Council member serve as permanent members on all pension boards. The non-permanent Pension Board members are appointed by the Mayor and must be an active employee of their respective pension plan. The pension boards typical meet monthly or as needed to review retirement/disability requests and/or investment recommendations. The “joint pension board” which comprises of members from all pension boards meets at least quarterly with the City’s Investment Advisor to review and modify investments accordingly. Changes in investments are not effective until voted favorably by each of the pension boards.
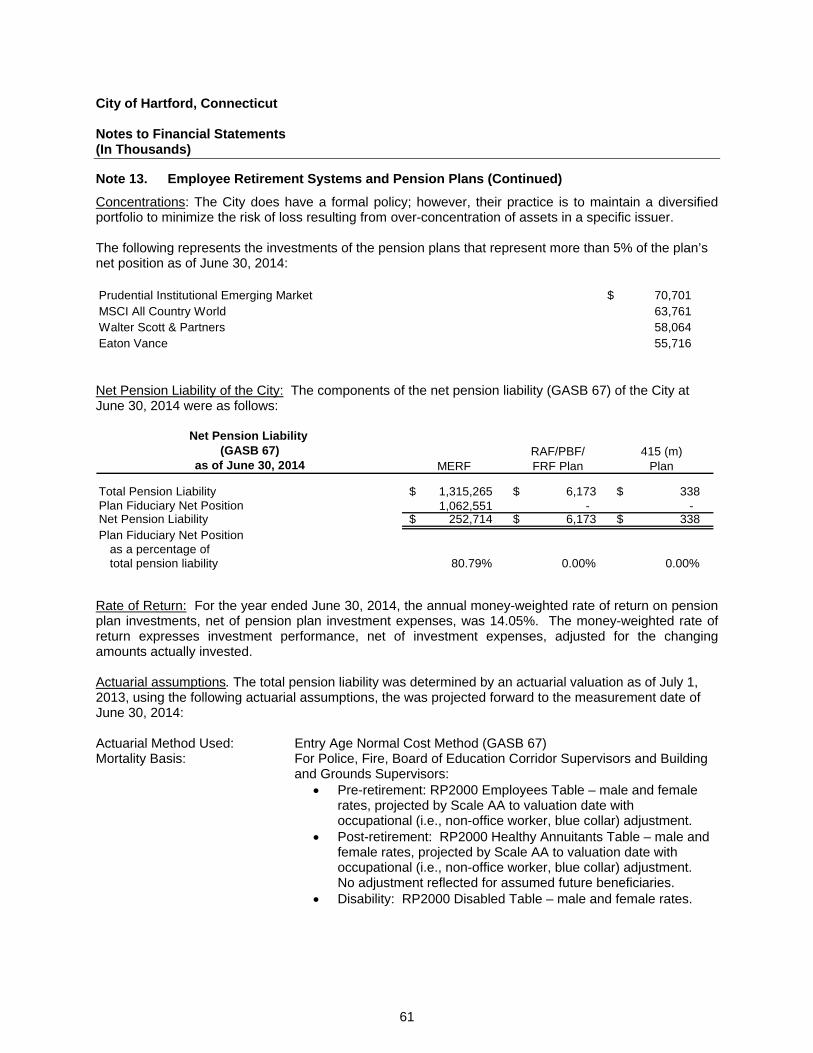
City of Hartford, Connecticut Notes to Financial Statements (In Thousands)
61
Note 13. Employee Retirement Systems and Pension Plans (Continued)
Concentrations: The City does have a formal policy; however, their practice is to maintain a diversified portfolio to minimize the risk of loss resulting from over-concentration of assets in a specific issuer. The following represents the investments of the pension plans that represent more than 5% of the plan’s net position as of June 30, 2014: Prudential Institutional Emerging Market 70,701 $ MSCI All Country World 63,761 Walter Scott & Partners 58,064 Eaton Vance 55,716
Net Pension Liability of the City: The components of the net pension liability (GASB 67) of the City at June 30, 2014 were as follows:
Net Pension Liability (GASB 67) RAF/PBF/ 415 (m)
as of June 30, 2014 MERF FRF Plan Plan
Total Pension Liability 1,315,265 $ 6,173 $ 338 $ Plan Fiduciary Net Position 1,062,551 - - Net Pension Liability 252,714 $ 6,173 $ 338 $ Plan Fiduciary Net Position
as a percentage of total pension liability 80.79% 0.00% 0.00%
Rate of Return: For the year ended June 30, 2014, the annual money-weighted rate of return on pension plan investments, net of pension plan investment expenses, was 14.05%. The money-weighted rate of return expresses investment performance, net of investment expenses, adjusted for the changing amounts actually invested. Actuarial assumptions. The total pension liability was determined by an actuarial valuation as of July 1, 2013, using the following actuarial assumptions, the was projected forward to the measurement date of June 30, 2014: Actuarial Method Used: Entry Age Normal Cost Method (GASB 67) Mortality Basis: For Police, Fire, Board of Education Corridor Supervisors and Building
and Grounds Supervisors: Pre-retirement: RP2000 Employees Table – male and female
rates, projected by Scale AA to valuation date with occupational (i.e., non-office worker, blue collar) adjustment.
Post-retirement: RP2000 Healthy Annuitants Table – male and female rates, projected by Scale AA to valuation date with occupational (i.e., non-office worker, blue collar) adjustment. No adjustment reflected for assumed future beneficiaries.
Disability: RP2000 Disabled Table – male and female rates.
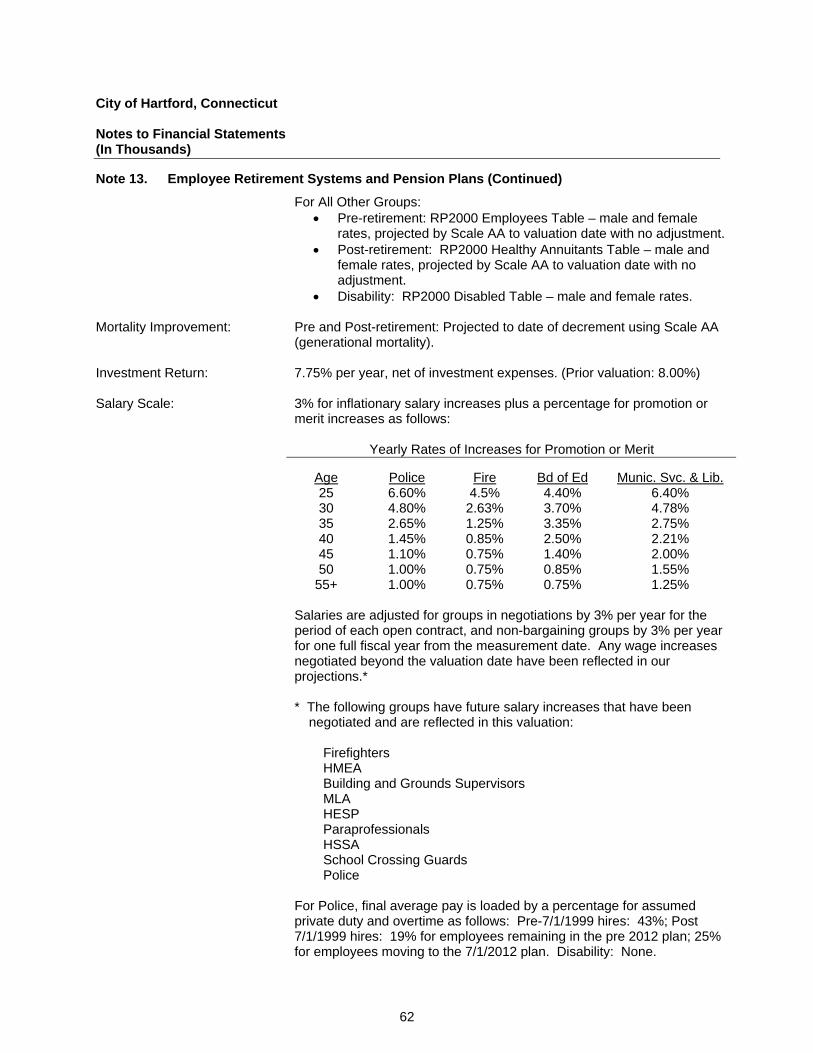
City of Hartford, Connecticut Notes to Financial Statements (In Thousands)
62
Note 13. Employee Retirement Systems and Pension Plans (Continued)
For All Other Groups: Pre-retirement: RP2000 Employees Table – male and female
rates, projected by Scale AA to valuation date with no adjustment. Post-retirement: RP2000 Healthy Annuitants Table – male and
female rates, projected by Scale AA to valuation date with no adjustment.
Disability: RP2000 Disabled Table – male and female rates. Mortality Improvement: Pre and Post-retirement: Projected to date of decrement using Scale AA
(generational mortality). Investment Return: 7.75% per year, net of investment expenses. (Prior valuation: 8.00%) Salary Scale: 3% for inflationary salary increases plus a percentage for promotion or
merit increases as follows:
Yearly Rates of Increases for Promotion or Merit
Age Police Fire Bd of Ed Munic. Svc. & Lib. 25 6.60% 4.5% 4.40% 6.40% 30 4.80% 2.63% 3.70% 4.78% 35 2.65% 1.25% 3.35% 2.75% 40 1.45% 0.85% 2.50% 2.21% 45 1.10% 0.75% 1.40% 2.00% 50 1.00% 0.75% 0.85% 1.55%
55+ 1.00% 0.75% 0.75% 1.25% Salaries are adjusted for groups in negotiations by 3% per year for the
period of each open contract, and non-bargaining groups by 3% per year for one full fiscal year from the measurement date. Any wage increases negotiated beyond the valuation date have been reflected in our projections.*
* The following groups have future salary increases that have been
negotiated and are reflected in this valuation: Firefighters
HMEA Building and Grounds Supervisors MLA HESP Paraprofessionals HSSA School Crossing Guards Police
For Police, final average pay is loaded by a percentage for assumed
private duty and overtime as follows: Pre-7/1/1999 hires: 43%; Post 7/1/1999 hires: 19% for employees remaining in the pre 2012 plan; 25% for employees moving to the 7/1/2012 plan. Disability: None.
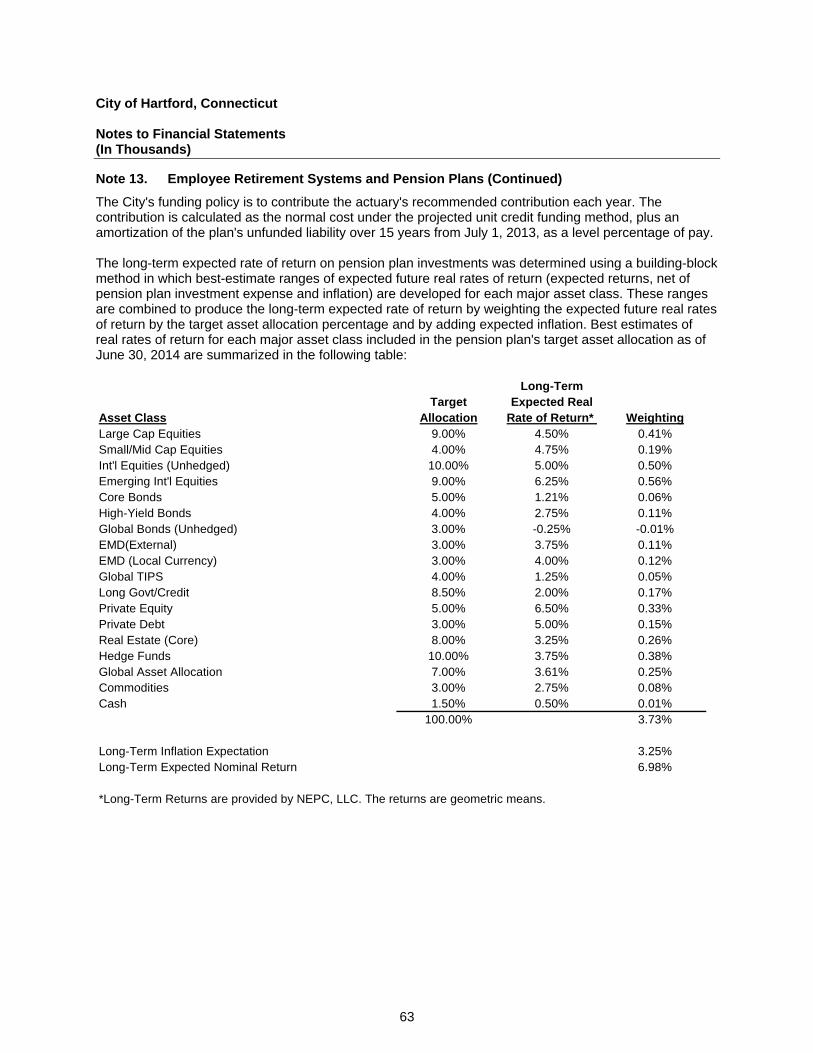
City of Hartford, Connecticut Notes to Financial Statements (In Thousands)
63
Note 13. Employee Retirement Systems and Pension Plans (Continued)
The City's funding policy is to contribute the actuary's recommended contribution each year. The contribution is calculated as the normal cost under the projected unit credit funding method, plus an amortization of the plan's unfunded liability over 15 years from July 1, 2013, as a level percentage of pay. The long-term expected rate of return on pension plan investments was determined using a building-block method in which best-estimate ranges of expected future real rates of return (expected returns, net of pension plan investment expense and inflation) are developed for each major asset class. These ranges are combined to produce the long-term expected rate of return by weighting the expected future real rates of return by the target asset allocation percentage and by adding expected inflation. Best estimates of real rates of return for each major asset class included in the pension plan's target asset allocation as of June 30, 2014 are summarized in the following table:
Long-TermTarget Expected Real
Asset Class Allocation Rate of Return* WeightingLarge Cap Equities 9.00% 4.50% 0.41%Small/Mid Cap Equities 4.00% 4.75% 0.19%Int'l Equities (Unhedged) 10.00% 5.00% 0.50%Emerging Int'l Equities 9.00% 6.25% 0.56%Core Bonds 5.00% 1.21% 0.06%High-Yield Bonds 4.00% 2.75% 0.11%Global Bonds (Unhedged) 3.00% -0.25% -0.01%EMD(External) 3.00% 3.75% 0.11%EMD (Local Currency) 3.00% 4.00% 0.12%Global TIPS 4.00% 1.25% 0.05%Long Govt/Credit 8.50% 2.00% 0.17%Private Equity 5.00% 6.50% 0.33%Private Debt 3.00% 5.00% 0.15%Real Estate (Core) 8.00% 3.25% 0.26%Hedge Funds 10.00% 3.75% 0.38%Global Asset Allocation 7.00% 3.61% 0.25%Commodities 3.00% 2.75% 0.08%Cash 1.50% 0.50% 0.01%
100.00% 3.73%
Long-Term Inflation Expectation 3.25%Long-Term Expected Nominal Return 6.98%
*Long-Term Returns are provided by NEPC, LLC. The returns are geometric means.
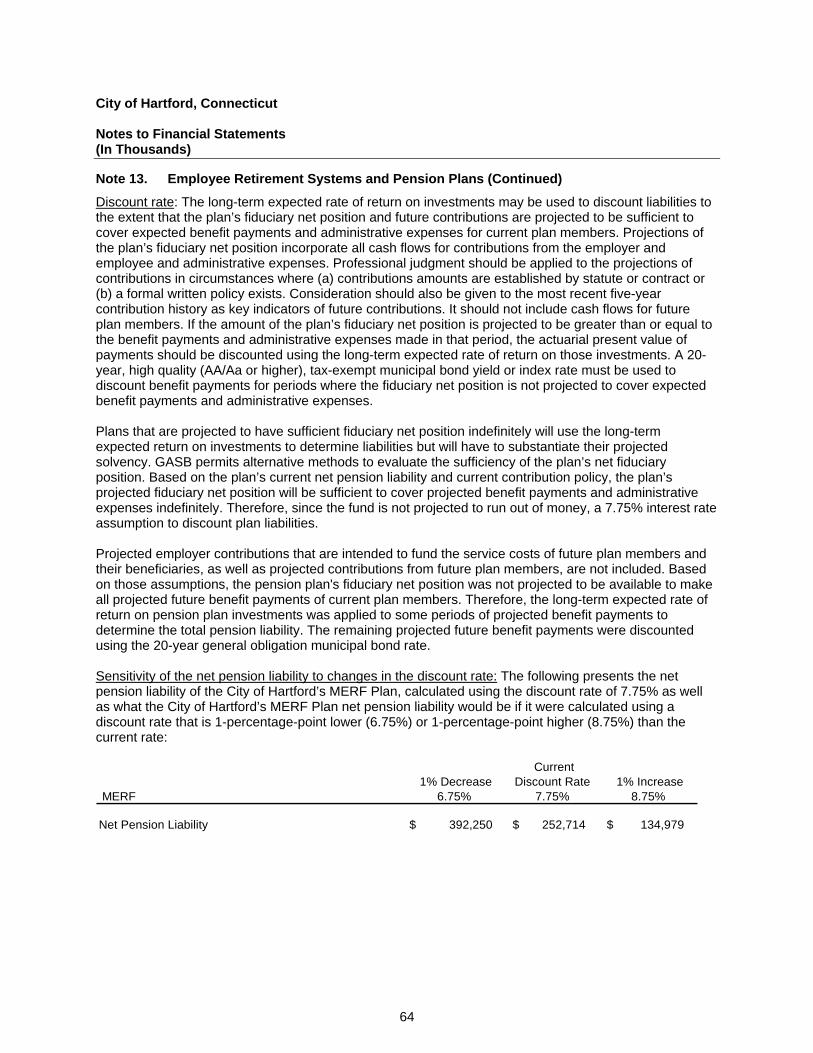
City of Hartford, Connecticut Notes to Financial Statements (In Thousands)
64
Note 13. Employee Retirement Systems and Pension Plans (Continued)
Discount rate: The long-term expected rate of return on investments may be used to discount liabilities to the extent that the plan’s fiduciary net position and future contributions are projected to be sufficient to cover expected benefit payments and administrative expenses for current plan members. Projections of the plan’s fiduciary net position incorporate all cash flows for contributions from the employer and employee and administrative expenses. Professional judgment should be applied to the projections of contributions in circumstances where (a) contributions amounts are established by statute or contract or (b) a formal written policy exists. Consideration should also be given to the most recent five-year contribution history as key indicators of future contributions. It should not include cash flows for future plan members. If the amount of the plan’s fiduciary net position is projected to be greater than or equal to the benefit payments and administrative expenses made in that period, the actuarial present value of payments should be discounted using the long-term expected rate of return on those investments. A 20-year, high quality (AA/Aa or higher), tax-exempt municipal bond yield or index rate must be used to discount benefit payments for periods where the fiduciary net position is not projected to cover expected benefit payments and administrative expenses. Plans that are projected to have sufficient fiduciary net position indefinitely will use the long-term expected return on investments to determine liabilities but will have to substantiate their projected solvency. GASB permits alternative methods to evaluate the sufficiency of the plan’s net fiduciary position. Based on the plan’s current net pension liability and current contribution policy, the plan’s projected fiduciary net position will be sufficient to cover projected benefit payments and administrative expenses indefinitely. Therefore, since the fund is not projected to run out of money, a 7.75% interest rate assumption to discount plan liabilities. Projected employer contributions that are intended to fund the service costs of future plan members and their beneficiaries, as well as projected contributions from future plan members, are not included. Based on those assumptions, the pension plan's fiduciary net position was not projected to be available to make all projected future benefit payments of current plan members. Therefore, the long-term expected rate of return on pension plan investments was applied to some periods of projected benefit payments to determine the total pension liability. The remaining projected future benefit payments were discounted using the 20-year general obligation municipal bond rate. Sensitivity of the net pension liability to changes in the discount rate: The following presents the net pension liability of the City of Hartford’s MERF Plan, calculated using the discount rate of 7.75% as well as what the City of Hartford’s MERF Plan net pension liability would be if it were calculated using a discount rate that is 1-percentage-point lower (6.75%) or 1-percentage-point higher (8.75%) than the current rate:
MERF 1% Decrease
6.75%
Current Discount Rate
7.75% 1% Increase
8.75%
Net Pension Liability 392,250 $ 252,714 $ 134,979 $
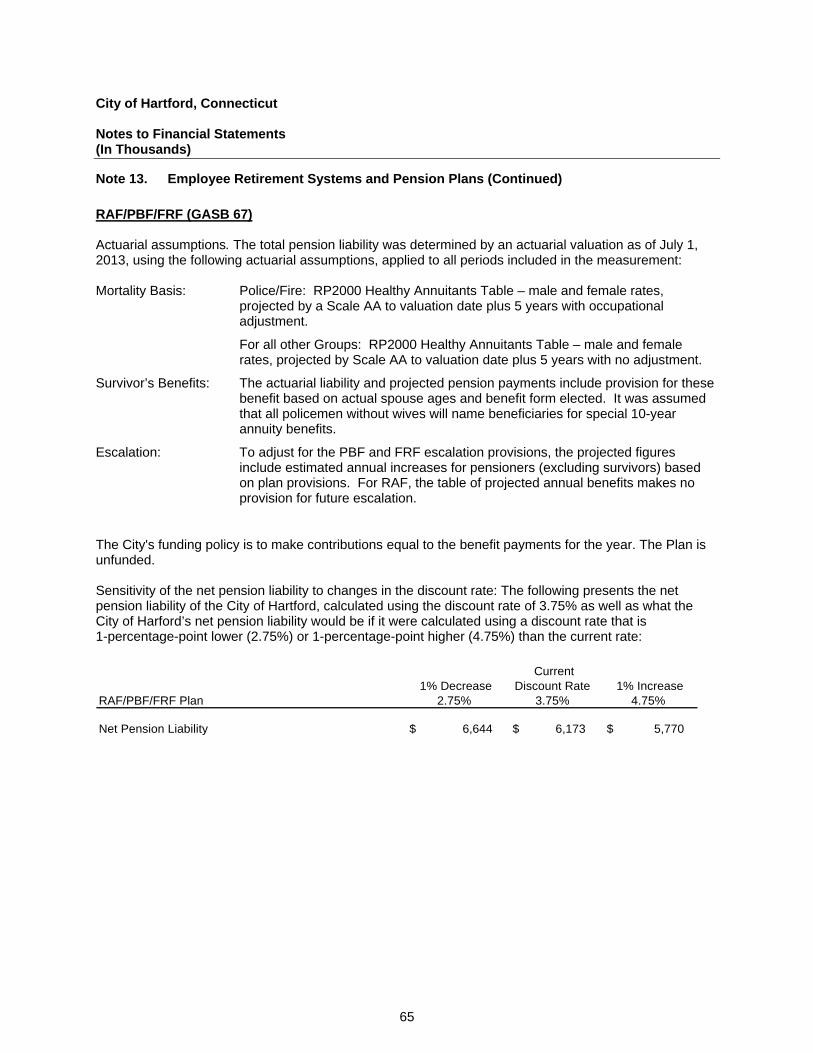
City of Hartford, Connecticut Notes to Financial Statements (In Thousands)
65
Note 13. Employee Retirement Systems and Pension Plans (Continued)
RAF/PBF/FRF (GASB 67) Actuarial assumptions. The total pension liability was determined by an actuarial valuation as of July 1, 2013, using the following actuarial assumptions, applied to all periods included in the measurement: Mortality Basis: Police/Fire: RP2000 Healthy Annuitants Table – male and female rates,
projected by a Scale AA to valuation date plus 5 years with occupational adjustment.
For all other Groups: RP2000 Healthy Annuitants Table – male and female rates, projected by Scale AA to valuation date plus 5 years with no adjustment.
Survivor’s Benefits: The actuarial liability and projected pension payments include provision for these benefit based on actual spouse ages and benefit form elected. It was assumed that all policemen without wives will name beneficiaries for special 10-year annuity benefits.
Escalation: To adjust for the PBF and FRF escalation provisions, the projected figures include estimated annual increases for pensioners (excluding survivors) based on plan provisions. For RAF, the table of projected annual benefits makes no provision for future escalation.
The City's funding policy is to make contributions equal to the benefit payments for the year. The Plan is unfunded. Sensitivity of the net pension liability to changes in the discount rate: The following presents the net pension liability of the City of Hartford, calculated using the discount rate of 3.75% as well as what the City of Harford’s net pension liability would be if it were calculated using a discount rate that is 1-percentage-point lower (2.75%) or 1-percentage-point higher (4.75%) than the current rate:
RAF/PBF/FRF Plan 1% Decrease
2.75%
Current Discount Rate
3.75% 1% Increase
4.75%
Net Pension Liability 6,644 $ 6,173 $ 5,770 $
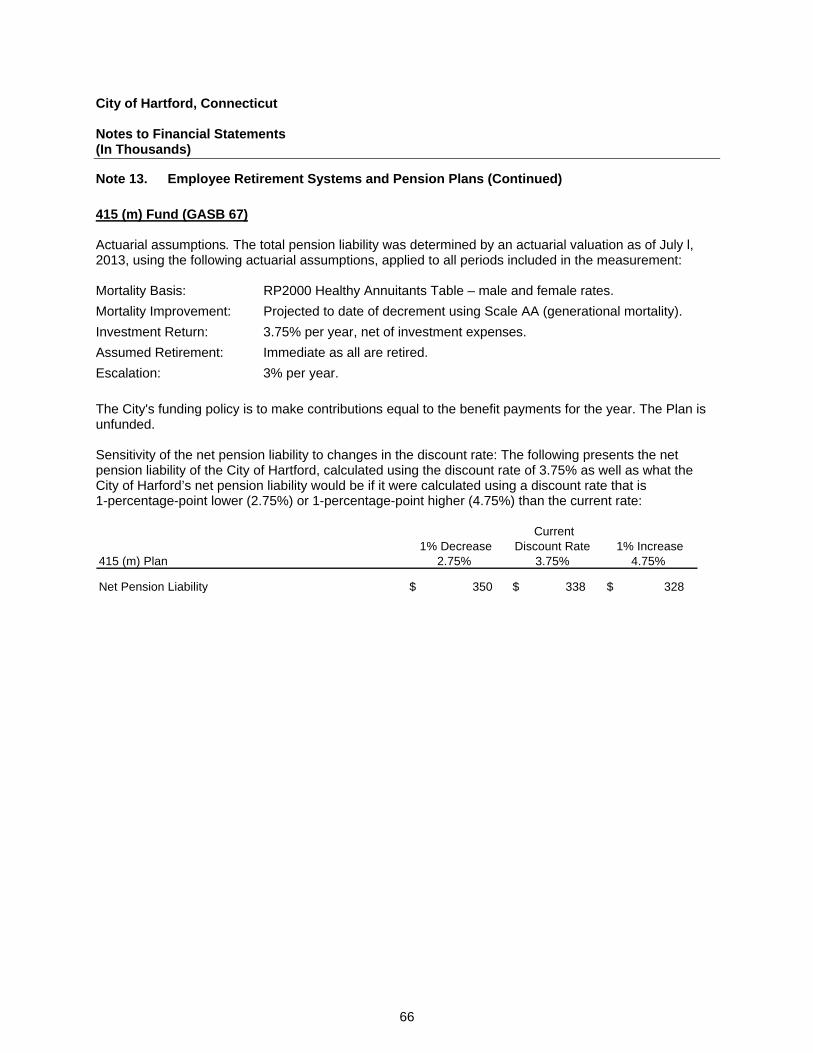
City of Hartford, Connecticut Notes to Financial Statements (In Thousands)
66
Note 13. Employee Retirement Systems and Pension Plans (Continued)
415 (m) Fund (GASB 67) Actuarial assumptions. The total pension liability was determined by an actuarial valuation as of July l, 2013, using the following actuarial assumptions, applied to all periods included in the measurement: Mortality Basis: RP2000 Healthy Annuitants Table – male and female rates.
Mortality Improvement: Projected to date of decrement using Scale AA (generational mortality).
Investment Return: 3.75% per year, net of investment expenses.
Assumed Retirement: Immediate as all are retired.
Escalation: 3% per year.
The City's funding policy is to make contributions equal to the benefit payments for the year. The Plan is unfunded. Sensitivity of the net pension liability to changes in the discount rate: The following presents the net pension liability of the City of Hartford, calculated using the discount rate of 3.75% as well as what the City of Harford’s net pension liability would be if it were calculated using a discount rate that is 1-percentage-point lower (2.75%) or 1-percentage-point higher (4.75%) than the current rate:
415 (m) Plan 1% Decrease
2.75%
Current Discount Rate
3.75% 1% Increase
4.75%
Net Pension Liability 350 $ 338 $ 328 $
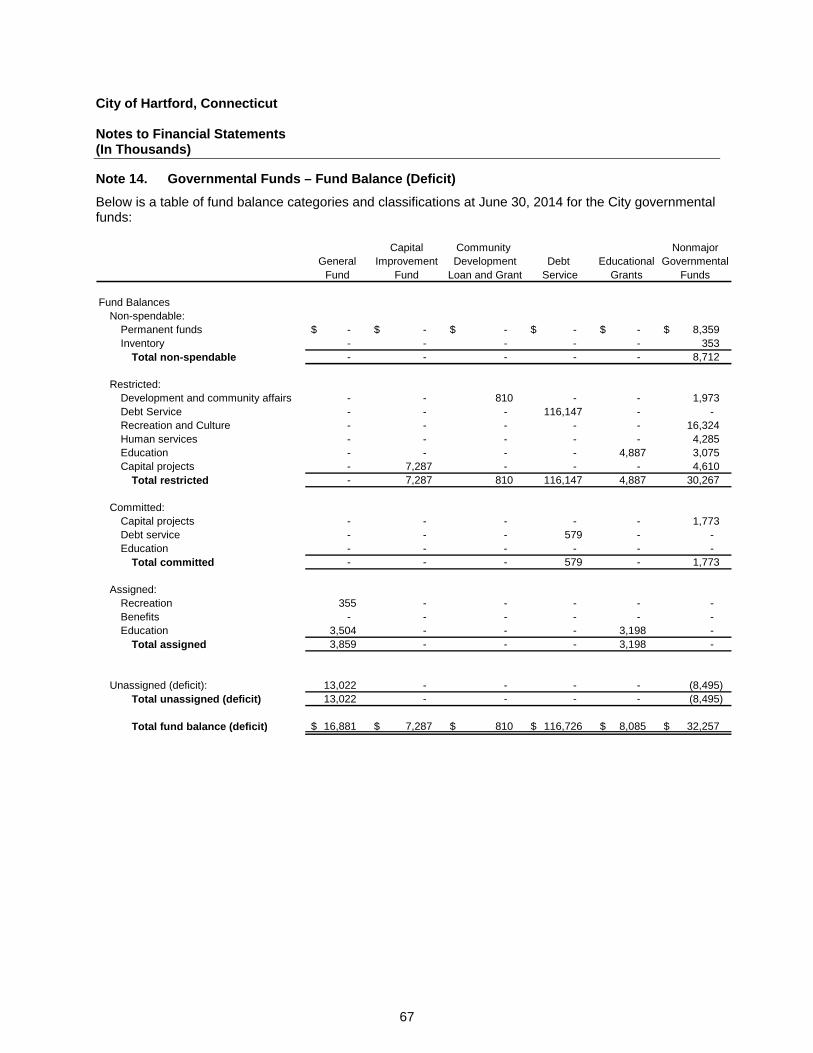
City of Hartford, Connecticut Notes to Financial Statements (In Thousands)
67
Note 14. Governmental Funds – Fund Balance (Deficit)
Below is a table of fund balance categories and classifications at June 30, 2014 for the City governmental funds:
Capital Community NonmajorGeneral Improvement Development Debt Educational Governmental
Fund Fund Loan and Grant Service Grants Funds
Fund BalancesNon-spendable:
Permanent funds -$ -$ -$ -$ -$ 8,359 $ Inventory - - - - - 353
Total non-spendable - - - - - 8,712
Restricted:Development and community affairs - - 810 - - 1,973 Debt Service - - - 116,147 - - Recreation and Culture - - - - - 16,324 Human services - - - - - 4,285 Education - - - - 4,887 3,075 Capital projects - 7,287 - - - 4,610
Total restricted - 7,287 810 116,147 4,887 30,267
Committed:Capital projects - - - - - 1,773 Debt service - - - 579 - - Education - - - - - -
Total committed - - - 579 - 1,773
Assigned:Recreation 355 - - - - - Benefits - - - - - - Education 3,504 - - - 3,198 -
Total assigned 3,859 - - - 3,198 -
Unassigned (deficit): 13,022 - - - - (8,495) Total unassigned (deficit) 13,022 - - - - (8,495)
Total fund balance (deficit) 16,881 $ 7,287 $ 810 $ 116,726 $ 8,085 $ 32,257 $
City of Hartford, Connecticut Notes to Financial Statements (In Thousands)
68
Note 15. Governmental Accounting Standards Board (GASB) Statements
The Governmental Accounting Standards Board (GASB) has issued several pronouncements that have effective dates that may impact future financial presentations. Management has not currently determined what, if any, impact implementation of the following statements may have on the financial statements, except for GASB No. 68 which will have a material effect due to the underfunded pension plan (see Note 13):
GASB Statement No. 68, Accounting and Financial Reporting for Pensions, an amendment of GASB Statement No. 27, was issued in June 2012. The primary objective of this Statement is to improve accounting and financial reporting by state and local governments for pensions. It also improves information provided by state and local governmental employers about financial support for pensions that is provided by other entities. This Statement results from a comprehensive review of the effectiveness of existing standards of accounting and financial reporting for pensions with regard to providing decision-useful information, supporting assessments of accountability and inter-period equity, and creating additional transparency. This Statement is effective for fiscal years beginning after June 15, 2014.
GASB Statement No. 69, Government Combinations and Disposals of Government Operations, was issued in January 2013. This Statement provides guidance for:
Determining whether a specific government combination is a government merger, a government acquisition, or a transfer of operations.
Using carrying values (generally, the amounts recognized in the pre-combination financial statements of the combining governments or operations) to measure the assets, deferred outflows of resources, liabilities, and deferred inflows of resources combined in a government merger or transfer of operations.
Measuring acquired assets, deferred outflows of resources, liabilities, and deferred inflows of resources based on their acquisition values in a government acquisition.
Reporting the disposal of government operations that have been transferred or sold.
The requirements of this Statement are effective for periods beginning after December 15, 2013, and should be applied on a prospective basis.
GASB Statement No. 71, Pension Transition for Contributions Made Subsequent to the Measurement Date—an amendment of GASB Statement No. 68. The objective of this Statement is to address an issue regarding application of the transition provisions of Statement No. 68, Accounting and Financial Reporting for Pensions. The issue relates to amounts associated with contributions, if any, made by a state or local government employer or nonemployer contributing entity to a defined benefit pension plan after the measurement date of the government’s beginning net pension liability. The provisions of this Statement are required to be applied simultaneously with the provisions of Statement 68.
Note 16. Subsequent Events
On October 16, 2014, the City issued $82,000 of general obligation bonds with an interest rate of 5% maturing on October 31, 2034 and $50,000 of general obligation bond anticipation notes with an interest rate of 2% maturing on October 27, 2015. The $56,000 of general obligation bond anticipation notes outstanding at June 30, 2014 were paid off with the issue of the $82,000. The City also issued $36,385 of general obligation refunding bonds with interest rates varying from 2% to 5% maturing on August 15, 2026.

Required Supplementary Information
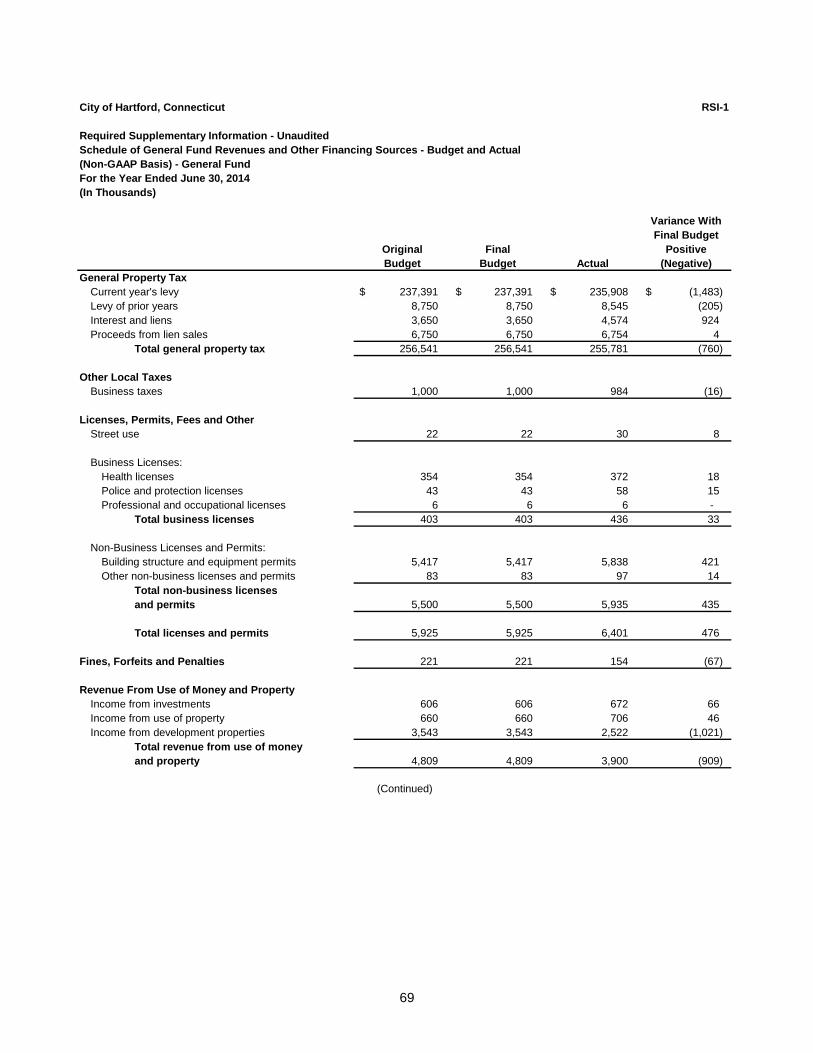
69
City of Hartford, Connecticut RSI-1
Required Supplementary Information - UnauditedSchedule of General Fund Revenues and Other Financing Sources - Budget and Actual(Non-GAAP Basis) - General FundFor the Year Ended June 30, 2014(In Thousands)
Variance WithFinal Budget
Original Final PositiveBudget Budget Actual (Negative)
General Property TaxCurrent year's levy 237,391 $ 237,391 $ 235,908 $ (1,483) $ Levy of prior years 8,750 8,750 8,545 (205) Interest and liens 3,650 3,650 4,574 924 Proceeds from lien sales 6,750 6,750 6,754 4
Total general property tax 256,541 256,541 255,781 (760)
Other Local TaxesBusiness taxes 1,000 1,000 984 (16)
Licenses, Permits, Fees and OtherStreet use 22 22 30 8
Business Licenses:Health licenses 354 354 372 18 Police and protection licenses 43 43 58 15 Professional and occupational licenses 6 6 6 -
Total business licenses 403 403 436 33
Non-Business Licenses and Permits:Building structure and equipment permits 5,417 5,417 5,838 421 Other non-business licenses and permits 83 83 97 14
Total non-business licensesand permits 5,500 5,500 5,935 435
Total licenses and permits 5,925 5,925 6,401 476
Fines, Forfeits and Penalties 221 221 154 (67)
Revenue From Use of Money and PropertyIncome from investments 606 606 672 66 Income from use of property 660 660 706 46 Income from development properties 3,543 3,543 2,522 (1,021)
Total revenue from use of moneyand property 4,809 4,809 3,900 (909)
(Continued)
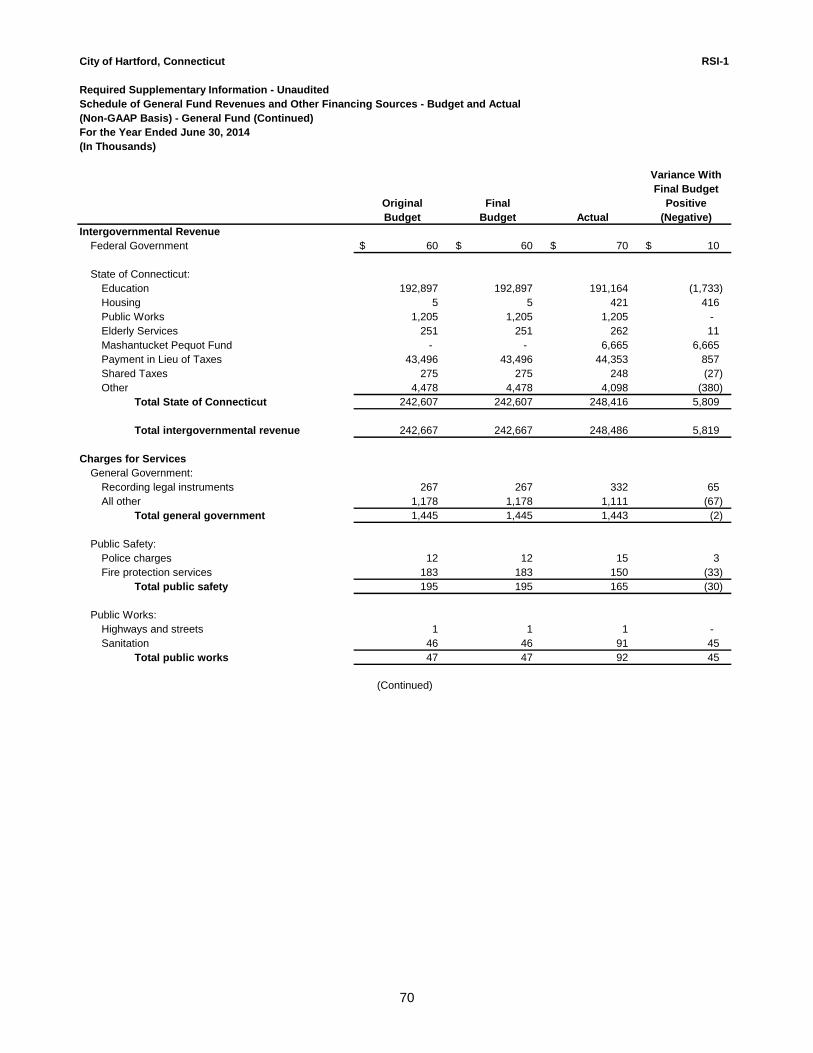
70
City of Hartford, Connecticut RSI-1
Required Supplementary Information - UnauditedSchedule of General Fund Revenues and Other Financing Sources - Budget and Actual(Non-GAAP Basis) - General Fund (Continued)For the Year Ended June 30, 2014(In Thousands)
Variance WithFinal Budget
Original Final PositiveBudget Budget Actual (Negative)
Intergovernmental RevenueFederal Government 60 $ 60 $ 70 $ 10 $
State of Connecticut:Education 192,897 192,897 191,164 (1,733) Housing 5 5 421 416 Public Works 1,205 1,205 1,205 - Elderly Services 251 251 262 11 Mashantucket Pequot Fund - - 6,665 6,665 Payment in Lieu of Taxes 43,496 43,496 44,353 857 Shared Taxes 275 275 248 (27) Other 4,478 4,478 4,098 (380)
Total State of Connecticut 242,607 242,607 248,416 5,809
Total intergovernmental revenue 242,667 242,667 248,486 5,819
Charges for ServicesGeneral Government:
Recording legal instruments 267 267 332 65 All other 1,178 1,178 1,111 (67)
Total general government 1,445 1,445 1,443 (2)
Public Safety:Police charges 12 12 15 3 Fire protection services 183 183 150 (33)
Total public safety 195 195 165 (30)
Public Works:Highways and streets 1 1 1 - Sanitation 46 46 91 45
Total public works 47 47 92 45
(Continued)
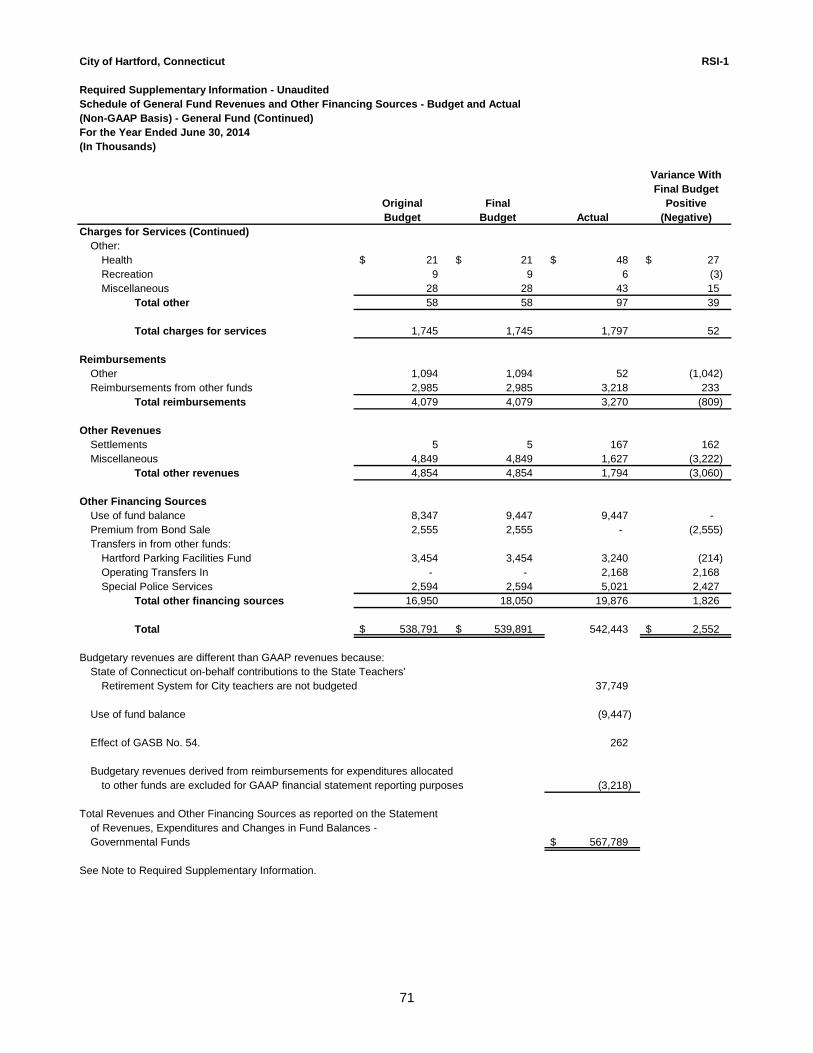
71
City of Hartford, Connecticut RSI-1
Required Supplementary Information - UnauditedSchedule of General Fund Revenues and Other Financing Sources - Budget and Actual(Non-GAAP Basis) - General Fund (Continued)For the Year Ended June 30, 2014(In Thousands)
Variance WithFinal Budget
Original Final PositiveBudget Budget Actual (Negative)
Charges for Services (Continued)Other:
Health 21 $ 21 $ 48 $ 27 $ Recreation 9 9 6 (3) Miscellaneous 28 28 43 15
Total other 58 58 97 39
Total charges for services 1,745 1,745 1,797 52
ReimbursementsOther 1,094 1,094 52 (1,042) Reimbursements from other funds 2,985 2,985 3,218 233
Total reimbursements 4,079 4,079 3,270 (809)
Other RevenuesSettlements 5 5 167 162 Miscellaneous 4,849 4,849 1,627 (3,222)
Total other revenues 4,854 4,854 1,794 (3,060)
Other Financing Sources Use of fund balance 8,347 9,447 9,447 - Premium from Bond Sale 2,555 2,555 - (2,555) Transfers in from other funds:
Hartford Parking Facilities Fund 3,454 3,454 3,240 (214) Operating Transfers In - - 2,168 2,168 Special Police Services 2,594 2,594 5,021 2,427
Total other financing sources 16,950 18,050 19,876 1,826
Total 538,791 $ 539,891 $ 542,443 2,552 $
Budgetary revenues are different than GAAP revenues because:State of Connecticut on-behalf contributions to the State Teachers'
Retirement System for City teachers are not budgeted 37,749
Use of fund balance (9,447)
Effect of GASB No. 54. 262
Budgetary revenues derived from reimbursements for expenditures allocatedto other funds are excluded for GAAP financial statement reporting purposes (3,218)
Total Revenues and Other Financing Sources as reported on the Statementof Revenues, Expenditures and Changes in Fund Balances -Governmental Funds 567,789 $
See Note to Required Supplementary Information.
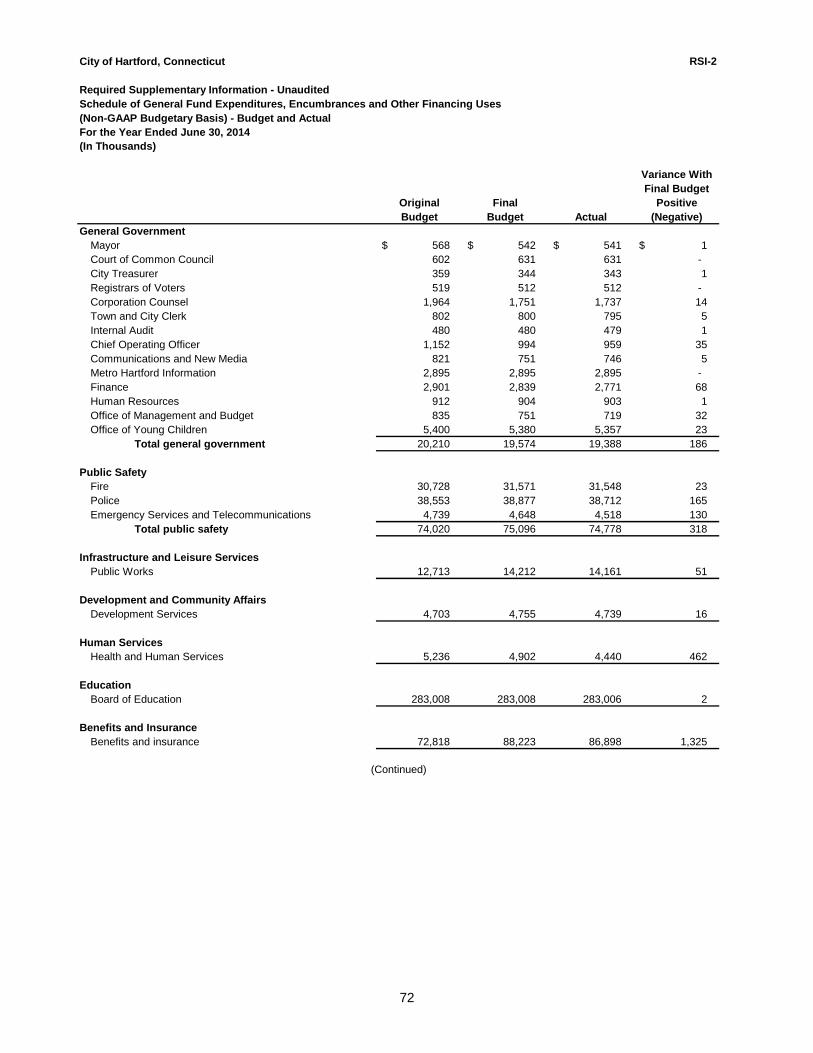
72
City of Hartford, Connecticut RSI-2
Required Supplementary Information - UnauditedSchedule of General Fund Expenditures, Encumbrances and Other Financing Uses(Non-GAAP Budgetary Basis) - Budget and ActualFor the Year Ended June 30, 2014(In Thousands)
Variance WithFinal Budget
Original Final PositiveBudget Budget Actual (Negative)
General GovernmentMayor 568 $ 542 $ 541 $ 1 $ Court of Common Council 602 631 631 - City Treasurer 359 344 343 1 Registrars of Voters 519 512 512 - Corporation Counsel 1,964 1,751 1,737 14 Town and City Clerk 802 800 795 5 Internal Audit 480 480 479 1 Chief Operating Officer 1,152 994 959 35 Communications and New Media 821 751 746 5 Metro Hartford Information 2,895 2,895 2,895 - Finance 2,901 2,839 2,771 68 Human Resources 912 904 903 1 Office of Management and Budget 835 751 719 32 Office of Young Children 5,400 5,380 5,357 23
Total general government 20,210 19,574 19,388 186
Public Safety Fire 30,728 31,571 31,548 23 Police 38,553 38,877 38,712 165 Emergency Services and Telecommunications 4,739 4,648 4,518 130
Total public safety 74,020 75,096 74,778 318
Infrastructure and Leisure ServicesPublic Works 12,713 14,212 14,161 51
Development and Community AffairsDevelopment Services 4,703 4,755 4,739 16
Human Services
Health and Human Services 5,236 4,902 4,440 462
EducationBoard of Education 283,008 283,008 283,006 2
Benefits and InsuranceBenefits and insurance 72,818 88,223 86,898 1,325
(Continued)
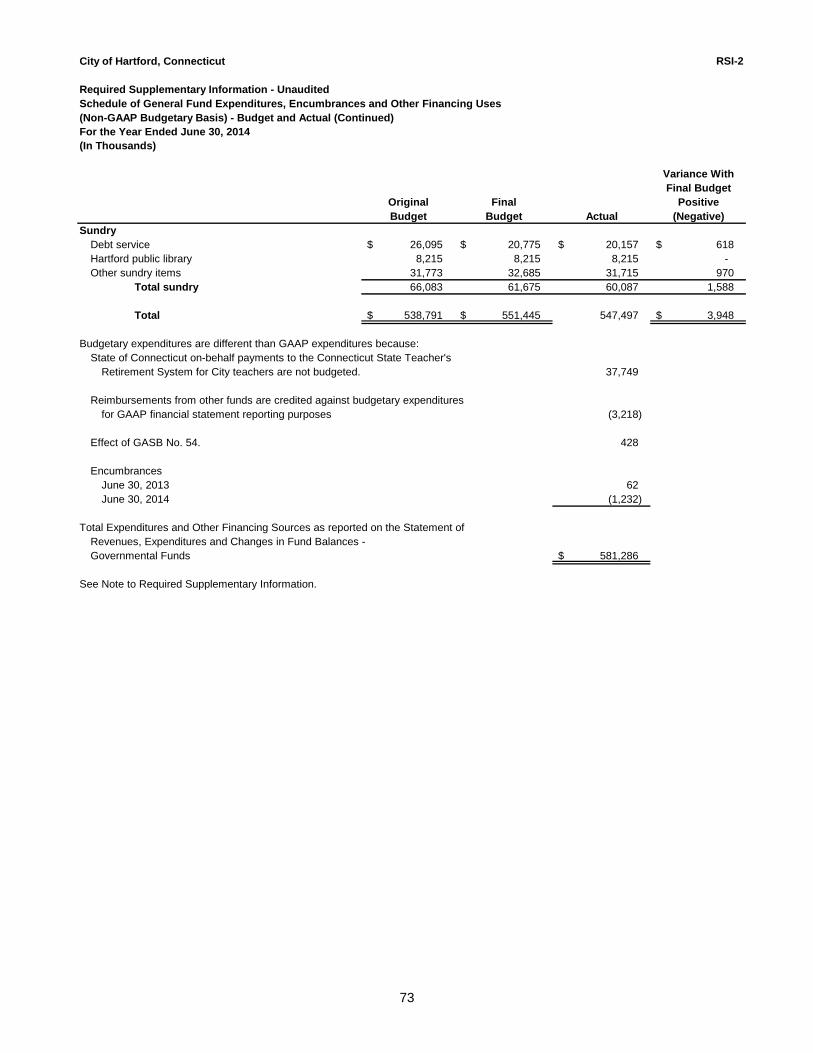
73
City of Hartford, Connecticut RSI-2
Required Supplementary Information - UnauditedSchedule of General Fund Expenditures, Encumbrances and Other Financing Uses(Non-GAAP Budgetary Basis) - Budget and Actual (Continued)For the Year Ended June 30, 2014(In Thousands)
Variance WithFinal Budget
Original Final PositiveBudget Budget Actual (Negative)
SundryDebt service 26,095 $ 20,775 $ 20,157 $ 618 $ Hartford public library 8,215 8,215 8,215 - Other sundry items 31,773 32,685 31,715 970
Total sundry 66,083 61,675 60,087 1,588
Total 538,791 $ 551,445 $ 547,497 3,948 $
Budgetary expenditures are different than GAAP expenditures because:State of Connecticut on-behalf payments to the Connecticut State Teacher's
Retirement System for City teachers are not budgeted. 37,749
Reimbursements from other funds are credited against budgetary expendituresfor GAAP financial statement reporting purposes (3,218)
Effect of GASB No. 54. 428
EncumbrancesJune 30, 2013 62 June 30, 2014 (1,232)
Total Expenditures and Other Financing Sources as reported on the Statement ofRevenues, Expenditures and Changes in Fund Balances -Governmental Funds 581,286 $
See Note to Required Supplementary Information.
74
City of Hartford, Connecticut RSI-3
Required Supplementary Information - UnauditedPensions and Other Post Retirement BenefitsSchedule of Funding ProgressJune 30, 2014(In Thousands)
Schedules of Funding Progress
Actuarial UAALActuarial Actuarial Accrued Unfunded as a % ofValuation Value of Liability (Overfunded) Funded Covered Covered
Date Assets (AAL) AAL (UAAL) Ratio Payroll Payroll
07/01/08 1,123,379 $ 1,099,441 $ (23,938) $ 102.2% 139,243 $ (17.3%)07/01/09 1,089,184 1,126,965 37,781 96.6% 134,143 28.2%07/01/10 1,041,572 1,175,040 133,468 88.6% 132,529 100.7%07/01/11 1,017,602 1,218,900 201,298 83.5% 136,555 147.4%07/01/12 977,146 1,237,136 259,990 79.0% 137,919 188.5%07/01/13 963,269 1,288,961 325,692 74.7% 144,648 225.2%
Actuarial UAALActuarial Actuarial Accrued Unfunded as a % ofValuation Value of Liability (Overfunded) Funded Covered Covered
Date Assets (AAL) AAL (UAAL) Ratio Payroll Payroll
07/01/08 - 7,700 $ 7,700 $ 0.0% N/A N/A07/01/09 - 7,249 7,249 0.0% N/A N/A07/01/10 - 6,155 6,155 0.0% N/A N/A07/01/11 - 6,653 6,653 0.0% N/A N/A07/01/12 - 6,030 6,030 0.0% N/A N/A07/01/13 - 6,137 6,137 0.0% N/A N/A
Actuarial UAALActuarial Actuarial Accrued Unfunded as a % ofValuation Value of Liability (Overfunded) Funded Covered Covered
Date Assets (AAL) AAL (UAAL) Ratio Payroll Payroll
07/01/08 - 213 $ 213 $ 0.0% N/A N/A07/01/09 - 143 143 0.0% N/A N/A07/01/10 - 180 180 0.0% N/A N/A07/01/11 - 521 521 0.0% N/A N/A07/01/12 - 431 431 0.0% N/A N/A07/01/13 - 338 338 0.0% N/A N/A
City of Hartford Municipal Employees' Retirement Fund (City MERF)*
RAF/PBF/FRF Plan
City of Hartford 415(m) Fund
75
City of Hartford, Connecticut RSI-3
Required Supplementary Information - UnauditedPensions and Other Post Retirement BenefitsSchedule of Funding Progress (Continued)June 30, 2014(In Thousands)
Schedules of Funding Progress (Continued)
UAAL as aActuarial Actuarial Actuarial Unfunded PercentageValuation Value of Accrued Accrued Funded Covered of Covered
Date Assets Liability (AAL) Liability (UAL) Ratio Payroll Payroll
07/01/08 - 302,988 $ 302,988 $ 0.0% N/A N/A07/01/09 - 241,511 241,511 0.0% 307,857 78.4%07/01/10 - 247,852 247,852 0.0% 307,857 81.0%07/01/11 - 261,782 261,782 0.0% 326,820 80.1%07/01/12 - 273,326 273,326 0.0% 338,608 80.7%07/01/13 - 262,716 262,716 0.0% 356,877 73.6%
OPEB
76
City of Hartford, Connecticut RSI-4
Required Supplementary Information - Unaudited
Pensions and Other Post Retirement Benefits
Schedule of Contributions
June 30, 2014
(In Thousands)
Actuarially Contributions Actuarially Contributions
Year Determined Actual (Excess) Covered as a Percentage Year Determined Actual (Excess) Covered as a percentage
Emded Contribution Contribution Deficiency Payroll of Covered Payoll Emded Contribution Contribution Deficiency Payroll of covered payroll
06/30/05 14,239 $ 9,207 $ 5,032 $ 107,808 $ 8.54% 06/30/05 2,519 $ 2,519 $ - N/A N/A
06/30/06 16,196 11,948 4,248 117,261 10.19% 06/30/06 1,926 1,926 - N/A N/A
06/30/07 15,463 16,481 (1,018) 124,837 13.20% 06/30/07 1,757 1,757 - N/A N/A
06/30/08 13,253 16,584 (3,331) 133,280 12.44% 06/30/08 1,967 1,967 - N/A N/A
06/30/09 11,797 12,829 (1,032) 139,243 9.21% 06/30/09 1,700 1,700 - N/A N/A
06/30/10 9,602 10,840 (1,238) 134,143 8.08% 06/30/10 1,521 1,521 - N/A N/A
06/30/11 18,846 18,846 - 132,529 14.22% 06/30/11 1,354 1,354 - N/A N/A
06/30/12 27,600 27,600 - 136,555 20.21% 06/30/12 1,097 1,097 - N/A N/A
06/30/13 34,338 34,338 - 137,919 24.90% 06/30/13 992 992 - N/A N/A
06/30/14 42,710 42,710 - 144,648 29.53% 06/30/14 837 837 - N/A N/A
Actuarially Contributions Annual
Year Determined Actual (Excess) Covered as a percentage Year Required Percentage
Emded Contribution Contribution Deficiency Payroll of covered payroll Emded Contribution Contributed
06/30/05 48 $ 48 $ - N/A N/A 06/30/2009 24,500 $ 52.8%
06/30/06 39 39 - N/A N/A 06/30/2010 24,744 41.8%
06/30/07 53 53 - N/A N/A 06/30/2011 15,759 70.3%
06/30/08 61 61 - N/A N/A 06/30/2012 18,322 58.6%
06/30/09 50 50 - N/A N/A 06/30/2013 10,916 54.6%
06/30/10 43 43 - N/A N/A 06/30/2014 11,650 74.7%
06/30/11 84 84 - N/A N/A
06/30/12 121 121 - N/A N/A
06/30/13 102 102 - N/A N/A
06/30/14 87 87 - N/A N/A
City of Hartford Municipal Employees'
Retirement Fund (City MERF) RAF/PBF/FRF Plan
415(M) Fund
City of Hartford
OPEB
77
City of Hartford, Connecticut RSI-5
Required Supplementary Information - UnauditedSchedule of Changes in the City's Net Pension Liability and Related RatiosLast Fiscal YearJune 30, 2014
RAF/PBF/ 415 (m)MERF FRF Plan Plan
Changes in Net PensionLiability
Total Pension LiabilityService cost 21,953 $ -$ -$ Interest on total pension liability 98,034 238 14 Benefit payments (93,683) (837) (87)
Net change in total pension liability 26,304 (599) (73)
Total Pension Liability, beginning 1,288,961 6,772 411
Total pension liability, ending (a) 1,315,265 6,173 338
Fiduciary Net PositionEmployer contributions 42,710 837 87 Member contributions 12,816 - - Investment income net of
investment expenses 133,646 - Benefit payments (93,683) (837) (87) Administrative expenses (2,774) - -
Net change in planfiduciary net position 92,715 - -
Fiduciary Net Position, beginning 969,836 - -
Fiduciary net position,ending (b) 1,062,551 - -
Net pension liability, ending = (a) - (b) 252,714 $ 6,173 $ 338 $
Fiduciary net position as a % oftotal pension liability 80.79% 0.00% 0.00%
Covered payroll 144,648 $ N/A N/A
Net pension liability as a % of covered payroll 174.71% N/A N/A
NOTE: As 2014 is the implementation year, only 2014 information is available.
City of Hartford, Connecticut Required Supplementary Information - Unaudited Note to Required Supplementary Information (In Thousands)
78
Note 1. Stewardship, Compliance and Accountability
Budgetary Information: The City adopted the legal budget for the 2013-2014 General Fund in accordance with the procedures summarized below:
By the third Monday in April, the Mayor must submit to the City Council a recommended operating budget for the fiscal year commencing the following July 1st. The operating budget includes proposed expenditures and the means of financing them. Through direction of the Mayor and the City Council, open meetings and public hearings are held to obtain residents’ and taxpayers’ comments on the recommended budget. The City Council modifies the budget by resolution (except revenues, debt service and pension requirements) and then submits the budget as amended to the Mayor for certification no later than May 21. The Mayor may approve, reduce, and/or disapprove the budget within 48 hours, but no later than May 23. Upon action by the Mayor, Council has until May 31 to adopt the budget, the appropriation ordinance and the tax levy ordinance. If it fails to adopt the budget by that date the budget as certified by the Mayor shall be deemed to be the budget of the City for the ensuing fiscal year and expenditures shall be made in accordance therewith (Hartford Municipal Code Sec. 9). After the budget has been adopted and the new fiscal year begins, an appropriation may be amended. The Mayor may, at any time, transfer any unencumbered balance or portion thereof, from one classification of expenditures to another within the same department. At the request of the Mayor, but only within the last three months of the fiscal year, the Court of Common Council may transfer by resolution, any unencumbered appropriation balance or portion thereof from one department or agency to another. Supplemental appropriations are made on the recommendation of the Mayor upon certification by the Director of Finance that there exists an available general fund cash surplus to meet this appropriation. Budgets for General Fund are presented on a basis consistent with generally accepted accounting principles except that encumbrances and transfers out are shown as budgetary obligations, transfers in are shown as revenues, State of Connecticut on-behalf contributions are shown as revenues and expenses, and reimbursements to and from other funds are shown as reductions of revenues and expenses.
The General Fund budget is the City’s only legally adopted annual budget. Budgets for Special Revenue and Capital Projects Funds are adopted on a project length basis in accordance with related grant or funding agreements. The level of control for the General Fund budget is at the department/major activity level which are authorized by ordinance. The level of control for Capital Projects Funds is appropriations at the project level. Total expenditures cannot exceed total appropriations by project, over the length of the project.
City of Hartford, Connecticut Required Supplementary Information - Unaudited Note to Required Supplementary Information (In Thousands)
79
Note 1. Stewardship, Compliance and Accountability (Continued)
The Community Development Block Grant (Special Revenue) project budgets are approved by City Council. The level of control for all other Special Revenue Funds is at the project or program level in accordance with agreement provisions and various budgetary periods. All unencumbered and unexpended appropriations lapse at year end for the General Fund. Appropriations do not lapse at year end for Special Revenue Funds. Appropriations for capital projects are carried forward until such time as the project is completed or terminated. During the fiscal year ended June 30, 2014 there was a supplemental budget appropriation of $1.1 million for the use of fund balance. There were no additional appropriations against fund balance. Encumbrance accounting is employed in governmental funds. Encumbrances (e.g., purchase orders, contracts) outstanding at year end are reported as assigned fund balances and do not constitute expenditures or liabilities because the commitments will be re-appropriated and honored during the subsequent year.

Combining and Individual Fund Financial Statements and Other Schedules


General Fund

General Fund The General Fund is the City’s primary operating fund. It accounts for all financial resources of the general government, except those required to be accounted for in another fund.
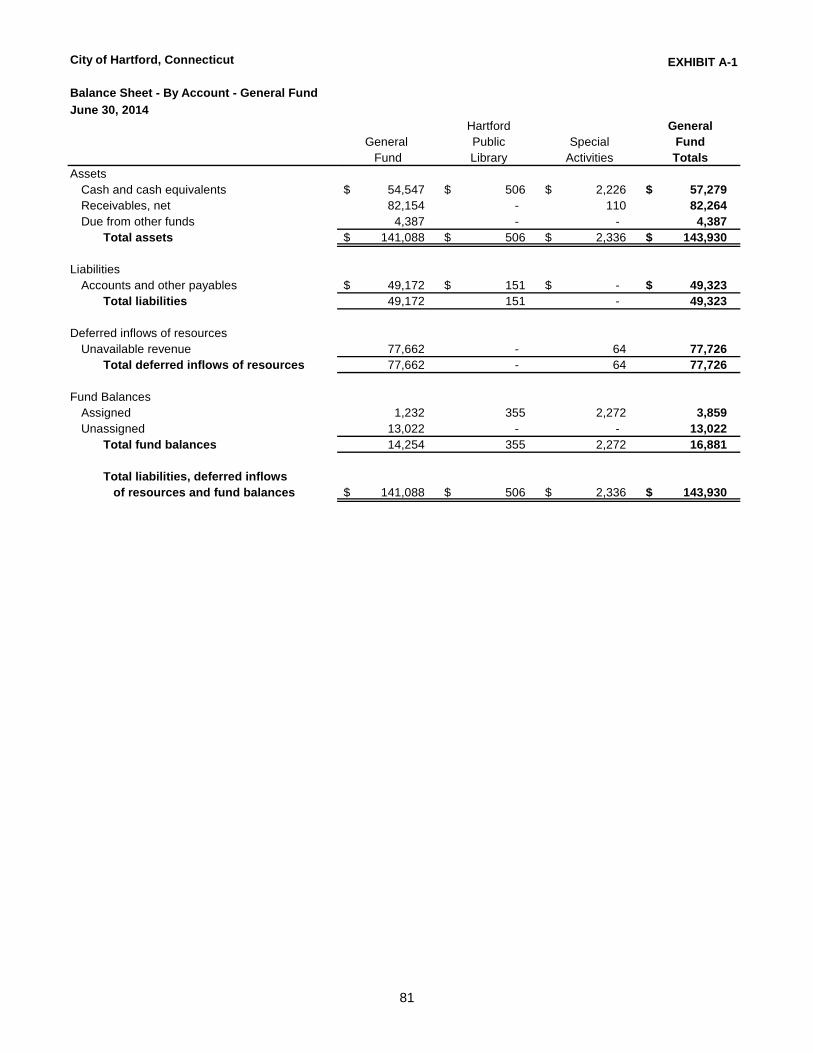
81
City of Hartford, Connecticut EXHIBIT A-1
Balance Sheet - By Account - General Fund
June 30, 2014Hartford General
General Public Special FundFund Library Activities Totals
AssetsCash and cash equivalents 54,547 $ 506 $ 2,226 $ 57,279 $ Receivables, net 82,154 - 110 82,264 Due from other funds 4,387 - - 4,387
Total assets 141,088 $ 506 $ 2,336 $ 143,930 $
LiabilitiesAccounts and other payables 49,172 $ 151 $ -$ 49,323 $
Total liabilities 49,172 151 - 49,323
Deferred inflows of resourcesUnavailable revenue 77,662 - 64 77,726
Total deferred inflows of resources 77,662 - 64 77,726
Fund BalancesAssigned 1,232 355 2,272 3,859 Unassigned 13,022 - - 13,022
Total fund balances 14,254 355 2,272 16,881
Total liabilities, deferred inflows of resources and fund balances 141,088 $ 506 $ 2,336 $ 143,930 $
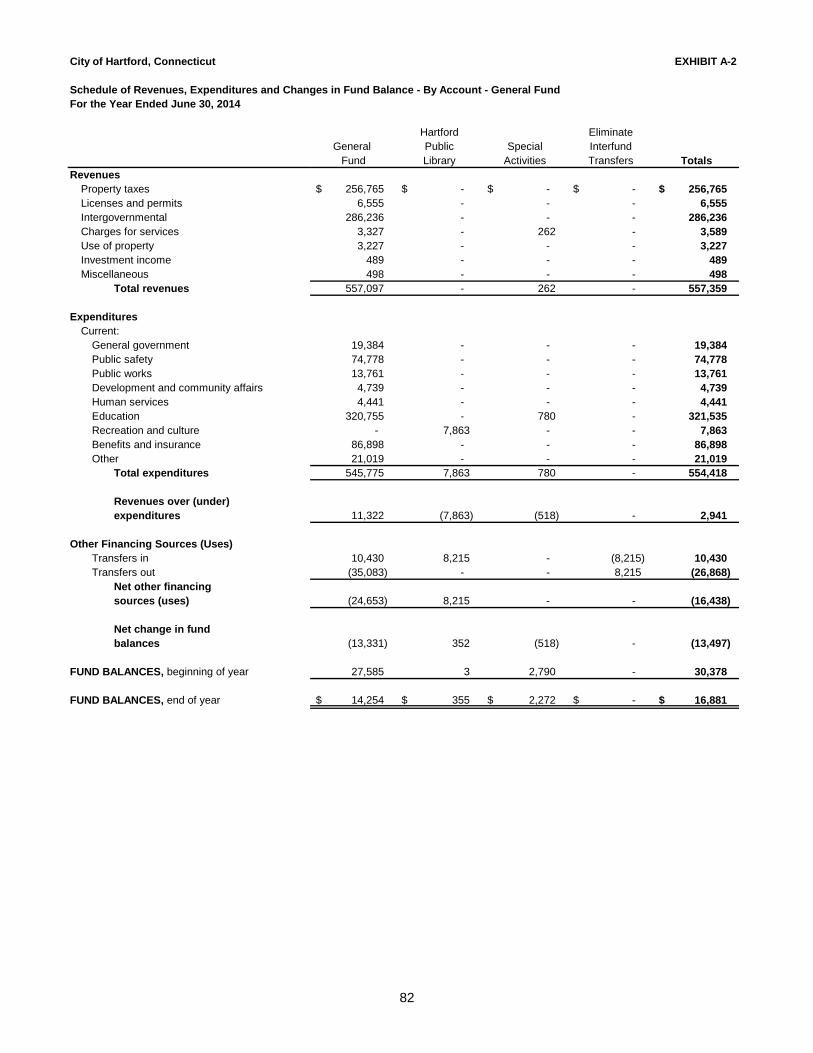
82
City of Hartford, Connecticut EXHIBIT A-2
Schedule of Revenues, Expenditures and Changes in Fund Balance - By Account - General FundFor the Year Ended June 30, 2014
Hartford EliminateGeneral Public Special Interfund
Fund Library Activities Transfers TotalsRevenues
Property taxes 256,765 $ -$ -$ -$ 256,765 $ Licenses and permits 6,555 - - - 6,555 Intergovernmental 286,236 - - - 286,236 Charges for services 3,327 - 262 - 3,589 Use of property 3,227 - - - 3,227 Investment income 489 - - - 489 Miscellaneous 498 - - - 498
Total revenues 557,097 - 262 - 557,359
ExpendituresCurrent:
General government 19,384 - - - 19,384 Public safety 74,778 - - - 74,778 Public works 13,761 - - - 13,761 Development and community affairs 4,739 - - - 4,739 Human services 4,441 - - - 4,441 Education 320,755 - 780 - 321,535 Recreation and culture - 7,863 - - 7,863 Benefits and insurance 86,898 - - - 86,898 Other 21,019 - - - 21,019
Total expenditures 545,775 7,863 780 - 554,418
Revenues over (under) expenditures 11,322 (7,863) (518) - 2,941
Other Financing Sources (Uses)Transfers in 10,430 8,215 - (8,215) 10,430 Transfers out (35,083) - - 8,215 (26,868)
Net other financing sources (uses) (24,653) 8,215 - - (16,438)
Net change in fund balances (13,331) 352 (518) - (13,497)
FUND BALANCES, beginning of year 27,585 3 2,790 - 30,378
FUND BALANCES, end of year 14,254 $ 355 $ 2,272 $ -$ 16,881 $

83
This page intentionally left blank.
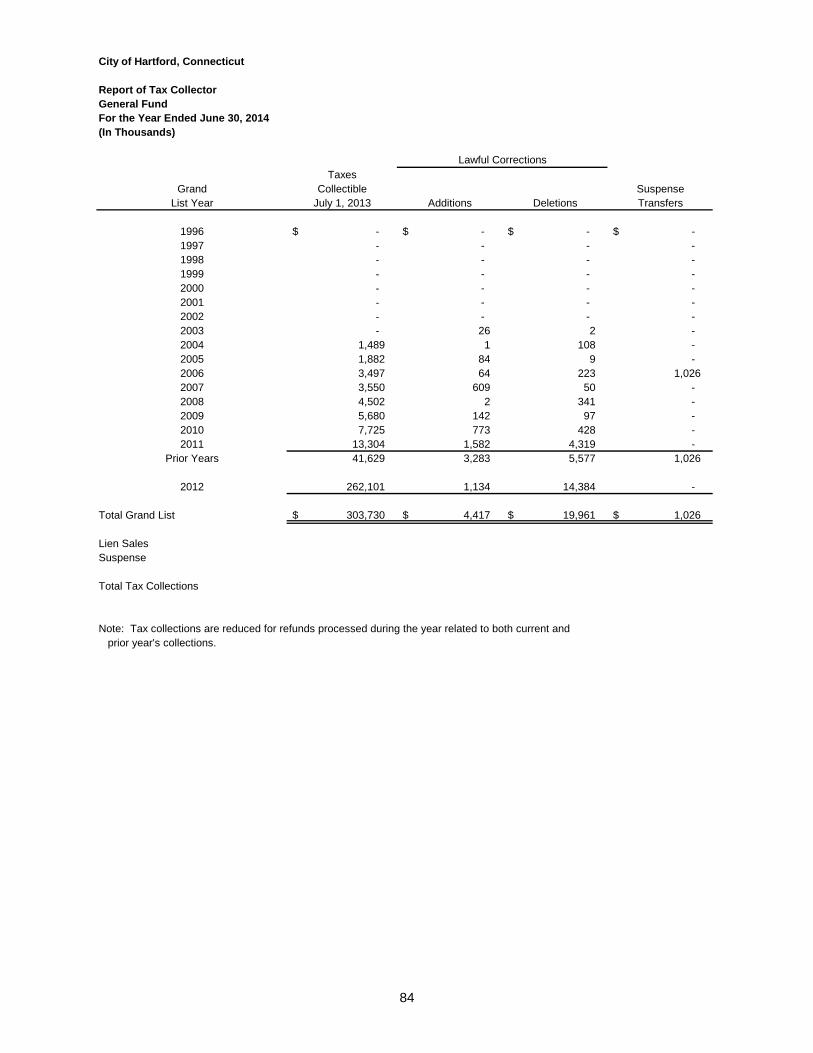
84
City of Hartford, Connecticut
Report of Tax CollectorGeneral FundFor the Year Ended June 30, 2014(In Thousands)
TaxesGrand Collectible Suspense
List Year July 1, 2013 Additions Deletions Transfers
1996 -$ -$ -$ -$ 1997 - - - - 1998 - - - - 1999 - - - - 2000 - - - - 2001 - - - - 2002 - - - - 2003 - 26 2 - 2004 1,489 1 108 - 2005 1,882 84 9 - 2006 3,497 64 223 1,026 2007 3,550 609 50 - 2008 4,502 2 341 - 2009 5,680 142 97 - 2010 7,725 773 428 - 2011 13,304 1,582 4,319 -
Prior Years 41,629 3,283 5,577 1,026
2012 262,101 1,134 14,384 -
Total Grand List 303,730 $ 4,417 $ 19,961 $ 1,026 $
Lien SalesSuspense
Total Tax Collections
Note: Tax collections are reduced for refunds processed during the year related to both current and prior year's collections.
Lawful Corrections
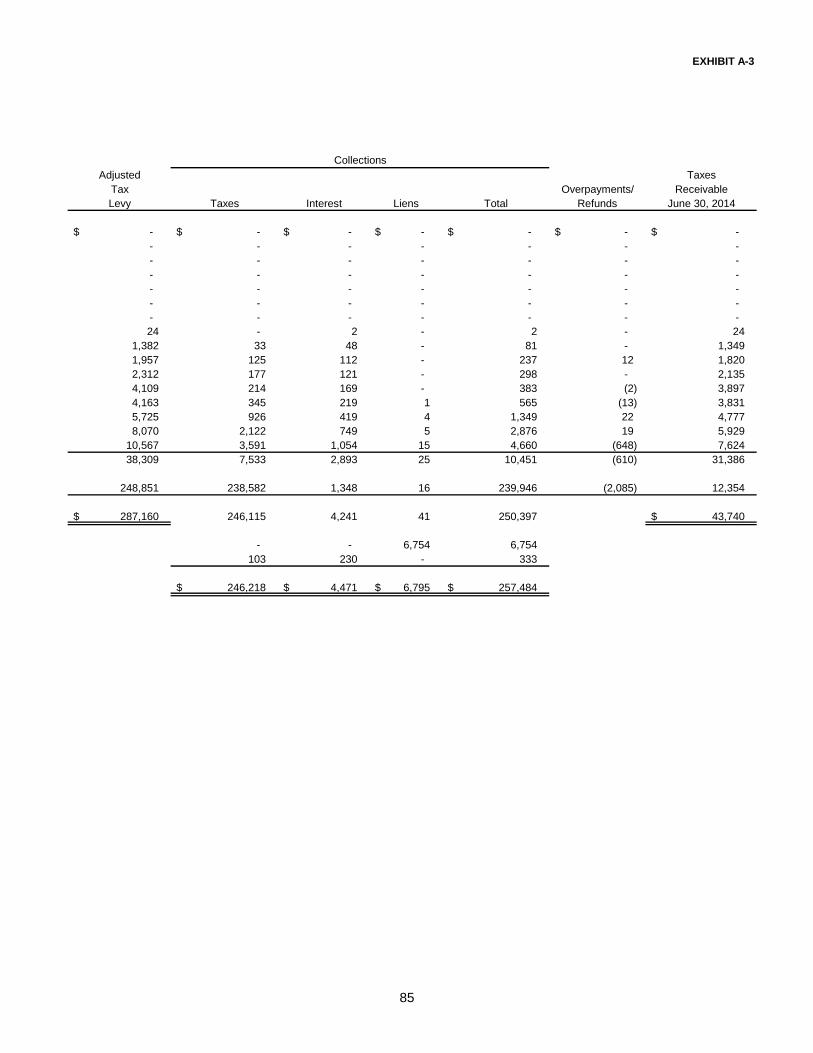
85
EXHIBIT A-3
Adjusted TaxesTax Overpayments/ ReceivableLevy Taxes Interest Liens Total Refunds June 30, 2014
-$ -$ -$ -$ -$ -$ -$ - - - - - - - - - - - - - - - - - - - - - - - - - - - - - - - - - - - - - - - - - - 24 - 2 - 2 - 24
1,382 33 48 - 81 - 1,349 1,957 125 112 - 237 12 1,820 2,312 177 121 - 298 - 2,135 4,109 214 169 - 383 (2) 3,897 4,163 345 219 1 565 (13) 3,831 5,725 926 419 4 1,349 22 4,777 8,070 2,122 749 5 2,876 19 5,929
10,567 3,591 1,054 15 4,660 (648) 7,624 38,309 7,533 2,893 25 10,451 (610) 31,386
248,851 238,582 1,348 16 239,946 (2,085) 12,354
287,160 $ 246,115 4,241 41 250,397 43,740 $
- - 6,754 6,754 103 230 - 333
246,218 $ 4,471 $ 6,795 $ 257,484 $
Collections

86
This page intentionally left blank.

Nonmajor Governmental Funds
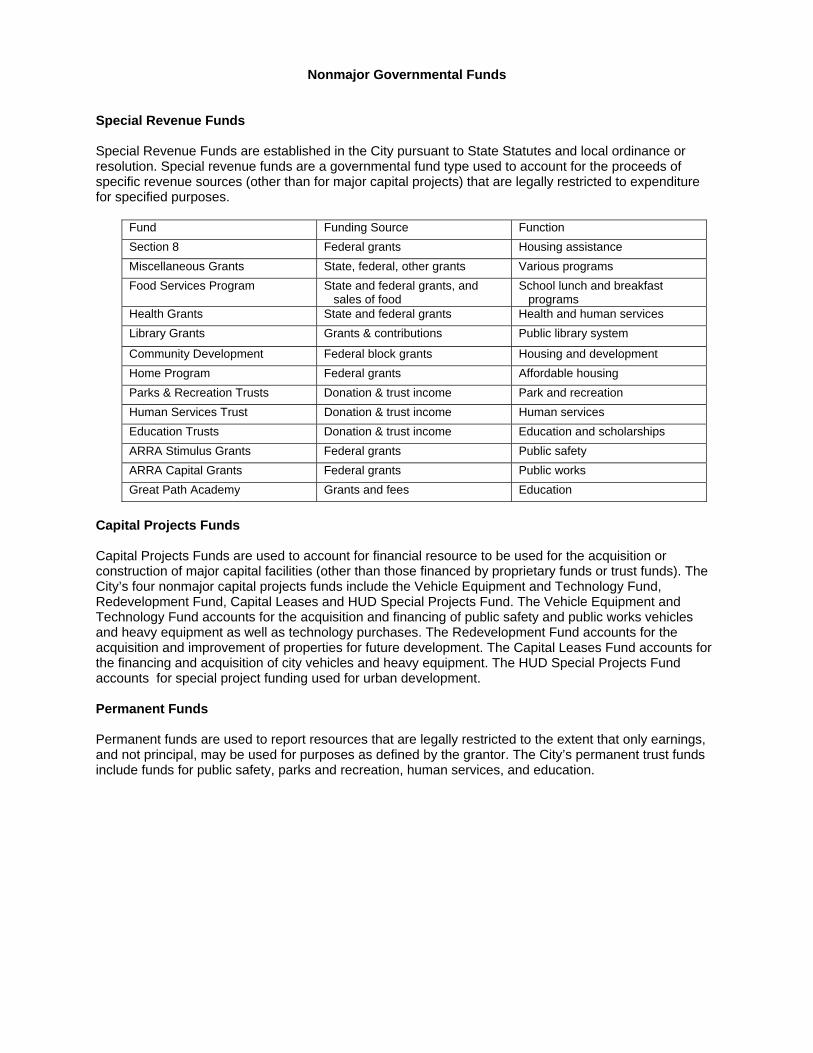
Nonmajor Governmental Funds Special Revenue Funds Special Revenue Funds are established in the City pursuant to State Statutes and local ordinance or resolution. Special revenue funds are a governmental fund type used to account for the proceeds of specific revenue sources (other than for major capital projects) that are legally restricted to expenditure for specified purposes.
Fund Funding Source Function
Section 8 Federal grants Housing assistance
Miscellaneous Grants State, federal, other grants Various programs
Food Services Program State and federal grants, and sales of food
School lunch and breakfast programs
Health Grants State and federal grants Health and human services
Library Grants Grants & contributions Public library system
Community Development Federal block grants Housing and development
Home Program Federal grants Affordable housing
Parks & Recreation Trusts Donation & trust income Park and recreation
Human Services Trust Donation & trust income Human services
Education Trusts Donation & trust income Education and scholarships
ARRA Stimulus Grants Federal grants Public safety
ARRA Capital Grants Federal grants Public works
Great Path Academy Grants and fees Education
Capital Projects Funds Capital Projects Funds are used to account for financial resource to be used for the acquisition or construction of major capital facilities (other than those financed by proprietary funds or trust funds). The City’s four nonmajor capital projects funds include the Vehicle Equipment and Technology Fund, Redevelopment Fund, Capital Leases and HUD Special Projects Fund. The Vehicle Equipment and Technology Fund accounts for the acquisition and financing of public safety and public works vehicles and heavy equipment as well as technology purchases. The Redevelopment Fund accounts for the acquisition and improvement of properties for future development. The Capital Leases Fund accounts for the financing and acquisition of city vehicles and heavy equipment. The HUD Special Projects Fund accounts for special project funding used for urban development. Permanent Funds Permanent funds are used to report resources that are legally restricted to the extent that only earnings, and not principal, may be used for purposes as defined by the grantor. The City’s permanent trust funds include funds for public safety, parks and recreation, human services, and education.

87
This page intentionally left blank.
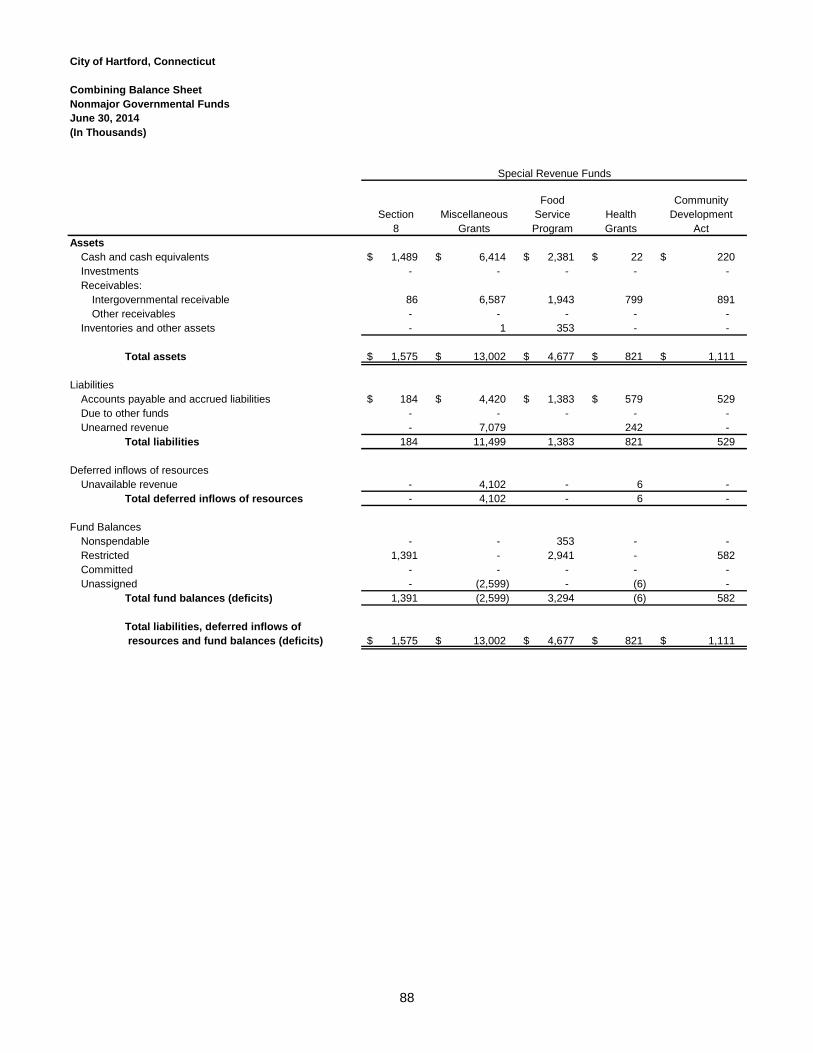
88
City of Hartford, Connecticut
Combining Balance SheetNonmajor Governmental FundsJune 30, 2014(In Thousands)
Food CommunitySection Miscellaneous Service Health Development
8 Grants Program Grants ActAssets
Cash and cash equivalents 1,489 $ 6,414 $ 2,381 $ 22 $ 220 $ Investments - - - - - Receivables:
Intergovernmental receivable 86 6,587 1,943 799 891 Other receivables - - - - -
Inventories and other assets - 1 353 - -
Total assets 1,575 $ 13,002 $ 4,677 $ 821 $ 1,111 $
LiabilitiesAccounts payable and accrued liabilities 184 $ 4,420 $ 1,383 $ 579 $ 529 Due to other funds - - - - - Unearned revenue - 7,079 242 -
Total liabilities 184 11,499 1,383 821 529
Deferred inflows of resourcesUnavailable revenue - 4,102 - 6 -
Total deferred inflows of resources - 4,102 - 6 -
Fund BalancesNonspendable - - 353 - - Restricted 1,391 - 2,941 - 582 Committed - - - - - Unassigned - (2,599) - (6) -
Total fund balances (deficits) 1,391 (2,599) 3,294 (6) 582
Total liabilities, deferred inflows of resources and fund balances (deficits) 1,575 $ 13,002 $ 4,677 $ 821 $ 1,111 $
Special Revenue Funds
89
EXHIBIT B-1
Parksand ARRA Great Vehicle
HOME Library Recreation Capital Path Capital Equipment &Program Grants Trusts Grants Academy Total Lease Technology
-$ 248 $ 70 $ 10 $ 179 $ 11,033 $ -$ -$ - - 257 - - 257 - -
- 1 147 - - - 10,454 - -
- - - - - - 453 - - - - - - 354 - -
1 $ 395 $ 327 $ 10 $ 179 $ 22,098 $ 453 $ -$
1 $ 78 $ -$ -$ 165 $ 7,339 3,994 $ 2,347 $ - - - - - - - - - 317 - - - 7,638 - - 1 395 - - 165 14,977 3,994 2,347
- 2 - 10 - 4,120 - - - 2 - 10 - 4,120 - -
- - - - - 353 - - - - 327 - 14 5,255 - - - - - - - - - - - (2) - - - (2,607) (3,541) (2,347) - (2) 327 - 14 3,001 (3,541) (2,347)
1 $ 395 $ 327 $ 10 $ 179 $ 22,098 $ 453 $ -$
(Continued)
Special Revenue Funds Capital Projects Funds
90
City of Hartford, Connecticut
Combining Balance Sheet Nonmajor Governmental Funds (Continued)June 30, 2014(In Thousands)
HUDRedevelop- Special
ment Projects TotalAssets
Cash and cash equivalents 3,205 $ 233 $ 3,438 $ Investments - - - Receivables:
Intergovernmental receivable - 4,610 4,610 Other receivables - - 453
Inventories and other assets - - -
Total assets 3,205 $ 4,843 $ 8,501 $
LiabilitiesAccounts payable and accrued liabilities 5 233 6,579 Due to other funds - - - Unearned revenue 1,427 - 1,427
Total liabilities 1,432 233 8,006
Deferred inflows of resourcesUnavailable revenue - - -
Total deferred inflows of resources - - -
Fund BalancesNonspendable - - - Restricted - 4,610 4,610 Committed 1,773 - 1,773 Unassigned - - (5,888)
Total fund balances (deficits) 1,773 4,610 495
Total liabilities, deferred inflows of resources and fund balances (deficits) 3,205 $ 4,843 $ 8,501 $
Capital Projects Funds
91
EXHIBIT B-1
Parks and HumanPublic Recreation Services EducationSafety Trusts Trusts Trusts Total Total
-$ 1,337 $ 173 $ -$ 1,510 $ 15,981 $ 1 23,811 4,309 131 28,252 28,509
- - - - - 15,064 - - - - - 453 - - - - - 354
1 $ 25,148 $ 4,482 $ 131 $ 29,762 $ 60,361 $
- - - - - 13,918 $ - 1,001 - - 1,001 1,001 - - - - - 9,065 - 1,001 - - 1,001 23,984
- - - - - 4,120 - - - - - 4,120
1 8,150 197 11 8,359 8,712 - 15,997 4,285 120 20,402 30,267 - - - - - 1,773 - - - - - (8,495) 1 24,147 4,482 131 28,761 32,257
1 $ 25,148 $ 4,482 $ 131 $ 29,762 $ 60,361 $
Permanent Funds
92
City of Hartford, Connecticut
Combining Statement of Revenues, Expenditures and Changes inFund Balances (Deficits) - Nonmajor Governmental FundsFor the Year Ended June 30, 2014(In Thousands)
Food CommunitySection Miscellaneous Service Health Development
8 Grants Program Grants ActRevenues
Intergovernmental revenues 47,421 $ 42,593 $ 11,994 $ 8,952 $ 4,617 $ Charges for services - 12,391 865 - - Investment income (loss) 2 - - 1 Other revenues - 55 614 348 10
Total revenues 47,423 55,039 13,473 9,300 4,628
ExpendituresGeneral government - 7,768 - - 693 Public safety - 21,905 - - 12 Public works - 13 - - 106 Development and community affairs 47,582 2,984 - - 1,777 Human services - 13,075 - 9,296 1,668 Education - - 13,455 - 218 Recreation and culture - 394 - - 223 Capital outlay - 383 - - - Debt service - - - - -
Total expenditures 47,582 46,522 13,455 9,296 4,697
Excess (deficiency) of revenues overexpenditures (159) 8,517 18 4 (69)
Other Financing Sources (Uses)Transfers in - - - - - Transfers out - (7,094) - - - Lease proceeds - - - - -
Total other financing sources (uses) - (7,094) - - -
Changes in fund balance (deficits) (159) 1,423 18 4 (69)
Fund Balance (Deficits), beginning 1,550 (4,022) 3,276 (10) 651
Fund Balance (Deficits), ending 1,391 $ (2,599) $ 3,294 $ (6) $ 582 $
Special Revenue Funds
93
EXHIBIT B-2
Parksand ARRA Great Vehicle
HOME Library Recreation Capital Path Capital Equipment &Program Grants Trusts Grants Academy Total Lease Technology
661 $ 442 $ -$ 152 $ 2,698 $ 119,530 $ -$ -$ - 133 - - 793 14,182 - - - - 30 - - 33 - - - 927 - - - 1,954 - -
661 1,502 30 152 3,491 135,699 - -
- - - - - 8,461 - - - - - - - 21,917 - - - - - 8 - 127 - -
661 - - - - 53,004 - - - - - - - 24,039 - - - - - - 3,623 17,296 - - - 1,496 3 - - 2,116 - - - - - - - 383 4,039 127 - - - - - - 1,104 -
661 1,496 3 8 3,623 127,343 5,143 127
- 6 27 144 (132) 8,356 (5,143) (127)
- - - - - - 1,108 - - - - - - (7,094) - - - - - - - - 2,758 -
- - - - - (7,094) 3,866 -
- 6 27 144 (132) 1,262 (1,277) (127)
- (8) 300 (144) 146 1,739 (2,264) (2,220)
-$ (2) $ 327 $ -$ 14 $ 3,001 $ (3,541) $ (2,347) $
(Continued)
Special Revenue Funds Capital Projects Funds
94
City of Hartford, Connecticut
Combining Statement of Revenues, Expenditures and Changes inFund Balances (Deficits) - Nonmajor Governmental Funds (Continued)For the Year Ended June 30, 2014(In Thousands)
HUDRedevelop- Special
ment Projects Total Revenues
Intergovernmental revenues 3 $ -$ 3 $ Charges for services 56 - 56 Investment income (loss) 2 226 228 Other revenues - - -
Total revenues 61 226 287
ExpendituresGeneral government - - - Public safety - - - Public works - 1 1 Development and community affairs 6 - 6 Human services - - - Education - - - Recreation and culture - - - Capital outlay - - 4,166 Debt service - 4,883 5,987
Total expenditures 6 4,884 10,160
Excess (deficiency) of revenues overexpenditures 55 (4,658) (9,873)
Other Financing Sources (Uses)Transfers in - - 1,108 Transfers out - - - Lease proceeds - - 2,758
Total other financing sources (uses) - - 3,866
Changes in fund balance (deficits) 55 (4,658) (6,007)
Fund Balance (Deficits), beginning 1,718 9,268 6,502
Fund Balance (Deficits), ending 1,773 $ 4,610 $ 495 $
Capital Projects Funds
95
EXHIBIT B-2
Parks and HumanPublic Recreation Services EducationSafety Trusts Trusts Trusts Total Total
-$ -$ -$ -$ -$ 119,533 $ - - - - - 14,238 - 4,101 485 17 4,603 4,864 - - - - - 1,954 - 4,101 485 17 4,603 140,589
- - - 1 1 8,462 - - - - - 21,917 - - - - - 128 - - - - - 53,010 - - 89 - 89 24,128 - - - - - 17,296 - 148 - - 148 2,264 - - - - - 4,549 - - - - - 5,987 - 148 89 1 238 137,741
- 3,953 396 16 4,365 2,848
- - - - - 1,108 - - - - - (7,094) - - - - - 2,758
- - - - - (3,228)
- 3,953 396 16 4,365 (380)
1 20,194 4,086 115 24,396 32,637
1 $ 24,147 $ 4,482 $ 131 $ 28,761 $ 32,257 $
Permanent Funds

96
This page intentionally left blank.

Capital Improvement Fund

Capital Improvement Fund The Capital Improvement Fund accounts for the purchase, construction or renovation of major capital assets. These activities are funded primarily from general obligation bonds and intergovernmental revenues.
City of Hartford, Connecticut Exhibit C Schedule of Expenditures and Encumbrances Compared With Appropriations, Etc. – Capital Improvement Fund For the Year Ended June 30, 2014 (In Thousands)
Appropriations Expenditures Date Prior to Prior to
Project Project July 1, Current Cumulative July 1, Current Cumulative Outstanding Unencumbered Number Description Approved 2013 Period Total 2013 Period Total Encumbrances Balance
97
Facility Services
Public Works Projects:Z5001 Telecommunications Equipment
and Software. Includes the 311System, Tax Collectors System,and Communications and Radiosfor the Police and FireDepartments 03/29/2005 1,000 $ -$ 1,000 $ 944 $ -$ 944 $ -$ 56$
W5265 Roof Replacement at the Public - Works Facilities Building 01/12/2005 325 - 325 171 - 171 - 154
W6263 City Buildings EnvironmentalCompliance 11/12/2005 600 - 600 600 - 600 - -
W6264 City Buildings EnergyConservation, SecurityTechnology and Communication 11/12/2005 600 - 600 599 - 599 - 1
W6269 Municipal Facility Renovationsand Consolidation Study 11/12/2005 1,800 - 1,800 1,744 51 1,795 - 5
W6565 Rising Star Block, PrideBlock, InfrastructureStructural Repairs 01/12/2005 3,000 - 3,000 2,988 - 2,988 - 12
A6501 Church Street FaçadeRestoration 01/12/2005 1,810 - 1,810 1,416 12 1,428 - 382
A6502 MAT Street Garage FaçadeRestoration 01/12/2005 2,300 - 2,300 1,267 32 1,299 29 972
A6503 Remainder of ConstructionContract at Morgan St Garage 01/12/2005 1,590 - 1,590 1,524 - 1,524 - 66
A6504 Remainder of Repair Contractsat MAT Garage 01/12/2005 500 - 500 104 - 104 - 396
A6505 Remainder of Repairs Contractsat Church St Garage 01/12/2005 1,000 - 1,000 853 2 855 5 140
A6506 Streetscape Improvementsat MAT Garage 01/12/2005 125 - 125 - - - - 125
A6507 Streetscape Improvementsat Church St Garage 01/12/2005 280 - 280 213 35 248 10 22
A6508 Landscaping/Lighting Improve-ments opposite Morgan St Garage 01/12/2005 432 - 432 234 28 262 9 161
W7268 Long Term Document Archiveand Storage 07/1/2006 200 - 200 208 (13) 195 - 5
D6576 Acquisition of Land Woodland St./Albany Avenue 11/29/2005 1,325 - 1,325 1,317 2 1,319 - 6
D7576 Economic Development SiteAcquisition 07/1/2006 1,450 - 1,450 617 75 692 2 756
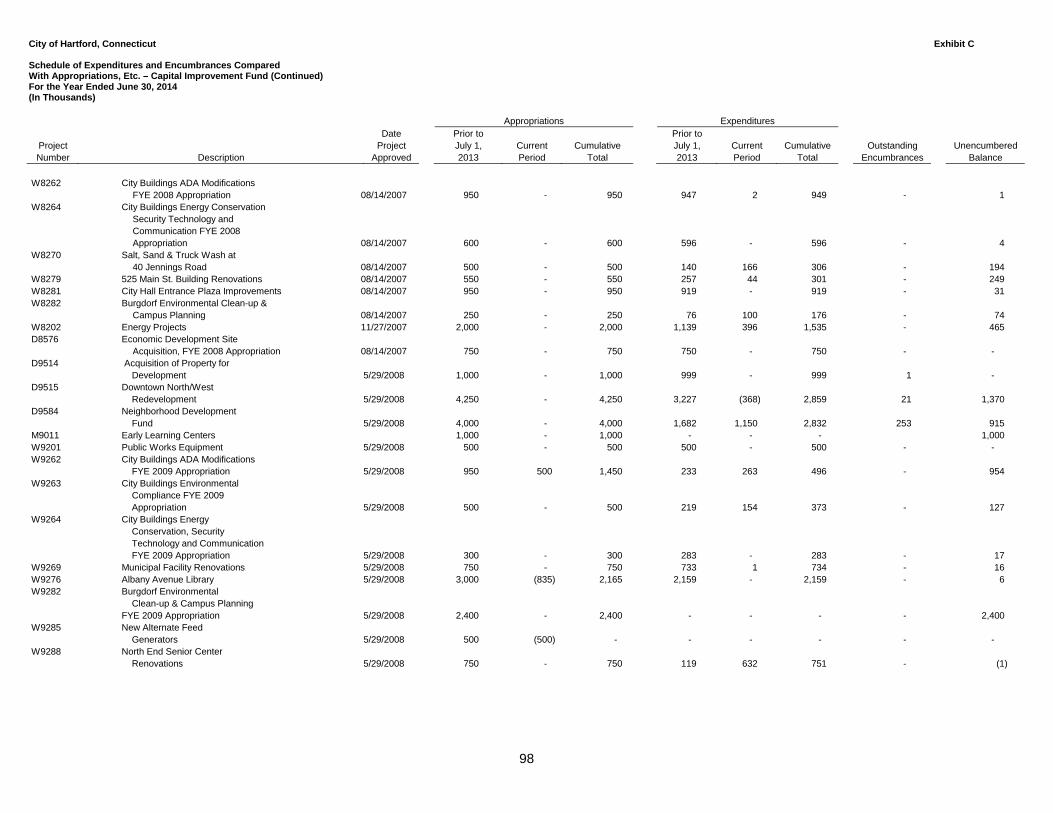
City of Hartford, Connecticut Exhibit C Schedule of Expenditures and Encumbrances Compared With Appropriations, Etc. – Capital Improvement Fund (Continued) For the Year Ended June 30, 2014 (In Thousands)
Appropriations Expenditures Date Prior to Prior to
Project Project July 1, Current Cumulative July 1, Current Cumulative Outstanding Unencumbered Number Description Approved 2013 Period Total 2013 Period Total Encumbrances Balance
98
W8262 City Buildings ADA ModificationsFYE 2008 Appropriation 08/14/2007 950 - 950 947 2 949 - 1
W8264 City Buildings Energy ConservationSecurity Technology and Communication FYE 2008Appropriation 08/14/2007 600 - 600 596 - 596 - 4
W8270 Salt, Sand & Truck Wash at40 Jennings Road 08/14/2007 500 - 500 140 166 306 - 194
W8279 525 Main St. Building Renovations 08/14/2007 550 - 550 257 44 301 - 249 W8281 City Hall Entrance Plaza Improvements 08/14/2007 950 - 950 919 - 919 - 31 W8282 Burgdorf Environmental Clean-up &
Campus Planning 08/14/2007 250 - 250 76 100 176 - 74 W8202 Energy Projects 11/27/2007 2,000 - 2,000 1,139 396 1,535 - 465 D8576 Economic Development Site
Acquisition, FYE 2008 Appropriation 08/14/2007 750 - 750 750 - 750 - - D9514 Acquisition of Property for
Development 5/29/2008 1,000 - 1,000 999 - 999 1 - D9515 Downtown North/West
Redevelopment 5/29/2008 4,250 - 4,250 3,227 (368) 2,859 21 1,370 D9584 Neighborhood Development
Fund 5/29/2008 4,000 - 4,000 1,682 1,150 2,832 253 915 M9011 Early Learning Centers 1,000 - 1,000 - - - 1,000 W9201 Public Works Equipment 5/29/2008 500 - 500 500 - 500 - - W9262 City Buildings ADA Modifications
FYE 2009 Appropriation 5/29/2008 950 500 1,450 233 263 496 - 954 W9263 City Buildings Environmental
Compliance FYE 2009 Appropriation 5/29/2008 500 - 500 219 154 373 - 127
W9264 City Buildings Energy Conservation, Security Technology and Communication FYE 2009 Appropriation 5/29/2008 300 - 300 283 - 283 - 17
W9269 Municipal Facility Renovations 5/29/2008 750 - 750 733 1 734 - 16 W9276 Albany Avenue Library 5/29/2008 3,000 (835) 2,165 2,159 - 2,159 - 6 W9282 Burgdorf Environmental
Clean-up & Campus PlanningFYE 2009 Appropriation 5/29/2008 2,400 - 2,400 - - - - 2,400
W9285 New Alternate Feed Generators 5/29/2008 500 (500) - - - - - -
W9288 North End Senior Center Renovations 5/29/2008 750 - 750 119 632 751 - (1)
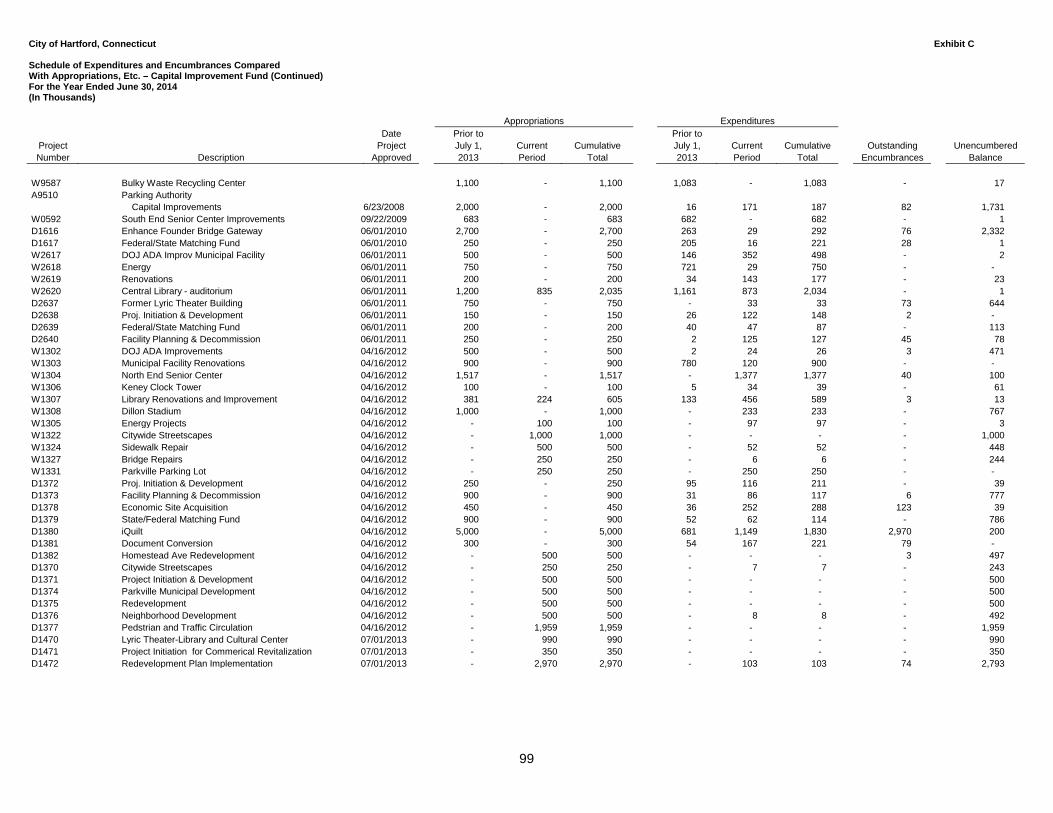
City of Hartford, Connecticut Exhibit C Schedule of Expenditures and Encumbrances Compared With Appropriations, Etc. – Capital Improvement Fund (Continued) For the Year Ended June 30, 2014 (In Thousands)
Appropriations Expenditures Date Prior to Prior to
Project Project July 1, Current Cumulative July 1, Current Cumulative Outstanding Unencumbered Number Description Approved 2013 Period Total 2013 Period Total Encumbrances Balance
99
W9587 Bulky Waste Recycling Center 1,100 - 1,100 1,083 - 1,083 - 17 A9510 Parking Authority
Capital Improvements 6/23/2008 2,000 - 2,000 16 171 187 82 1,731 W0592 South End Senior Center Improvements 09/22/2009 683 - 683 682 - 682 - 1 D1616 Enhance Founder Bridge Gateway 06/01/2010 2,700 - 2,700 263 29 292 76 2,332 D1617 Federal/State Matching Fund 06/01/2010 250 - 250 205 16 221 28 1 W2617 DOJ ADA Improv Municipal Facility 06/01/2011 500 - 500 146 352 498 - 2 W2618 Energy 06/01/2011 750 - 750 721 29 750 - - W2619 Renovations 06/01/2011 200 - 200 34 143 177 - 23 W2620 Central Library - auditorium 06/01/2011 1,200 835 2,035 1,161 873 2,034 - 1 D2637 Former Lyric Theater Building 06/01/2011 750 - 750 - 33 33 73 644 D2638 Proj. Initiation & Development 06/01/2011 150 - 150 26 122 148 2 - D2639 Federal/State Matching Fund 06/01/2011 200 - 200 40 47 87 - 113 D2640 Facility Planning & Decommission 06/01/2011 250 - 250 2 125 127 45 78 W1302 DOJ ADA Improvements 04/16/2012 500 - 500 2 24 26 3 471 W1303 Municipal Facility Renovations 04/16/2012 900 - 900 780 120 900 - - W1304 North End Senior Center 04/16/2012 1,517 - 1,517 - 1,377 1,377 40 100 W1306 Keney Clock Tower 04/16/2012 100 - 100 5 34 39 - 61 W1307 Library Renovations and Improvement 04/16/2012 381 224 605 133 456 589 3 13 W1308 Dillon Stadium 04/16/2012 1,000 - 1,000 - 233 233 - 767 W1305 Energy Projects 04/16/2012 - 100 100 - 97 97 - 3 W1322 Citywide Streetscapes 04/16/2012 - 1,000 1,000 - - - - 1,000 W1324 Sidewalk Repair 04/16/2012 - 500 500 - 52 52 - 448 W1327 Bridge Repairs 04/16/2012 - 250 250 - 6 6 - 244 W1331 Parkville Parking Lot 04/16/2012 - 250 250 - 250 250 - - D1372 Proj. Initiation & Development 04/16/2012 250 - 250 95 116 211 - 39 D1373 Facility Planning & Decommission 04/16/2012 900 - 900 31 86 117 6 777 D1378 Economic Site Acquisition 04/16/2012 450 - 450 36 252 288 123 39 D1379 State/Federal Matching Fund 04/16/2012 900 - 900 52 62 114 - 786 D1380 iQuilt 04/16/2012 5,000 - 5,000 681 1,149 1,830 2,970 200 D1381 Document Conversion 04/16/2012 300 - 300 54 167 221 79 - D1382 Homestead Ave Redevelopment 04/16/2012 - 500 500 - - - 3 497 D1370 Citywide Streetscapes 04/16/2012 - 250 250 - 7 7 - 243 D1371 Project Initiation & Development 04/16/2012 - 500 500 - - - - 500 D1374 Parkville Municipal Development 04/16/2012 - 500 500 - - - - 500 D1375 Redevelopment 04/16/2012 - 500 500 - - - - 500 D1376 Neighborhood Development 04/16/2012 - 500 500 - 8 8 - 492 D1377 Pedstrian and Traffic Circulation 04/16/2012 - 1,959 1,959 - - - - 1,959 D1470 Lyric Theater-Library and Cultural Center 07/01/2013 - 990 990 - - - - 990 D1471 Project Initiation for Commerical Revitalization 07/01/2013 - 350 350 - - - - 350 D1472 Redevelopment Plan Implementation 07/01/2013 - 2,970 2,970 - 103 103 74 2,793
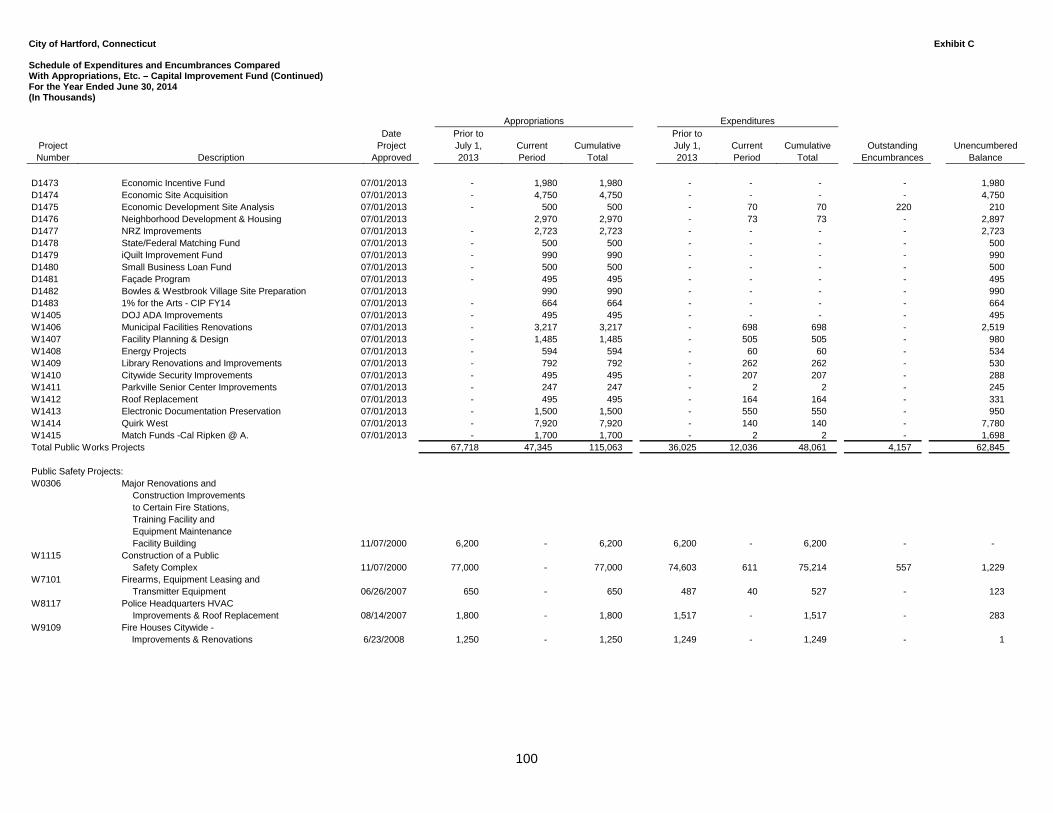
City of Hartford, Connecticut Exhibit C Schedule of Expenditures and Encumbrances Compared With Appropriations, Etc. – Capital Improvement Fund (Continued) For the Year Ended June 30, 2014 (In Thousands)
Appropriations Expenditures Date Prior to Prior to
Project Project July 1, Current Cumulative July 1, Current Cumulative Outstanding Unencumbered Number Description Approved 2013 Period Total 2013 Period Total Encumbrances Balance
100
D1473 Economic Incentive Fund 07/01/2013 - 1,980 1,980 - - - - 1,980 D1474 Economic Site Acquisition 07/01/2013 - 4,750 4,750 - - - - 4,750 D1475 Economic Development Site Analysis 07/01/2013 - 500 500 - 70 70 220 210 D1476 Neighborhood Development & Housing 07/01/2013 2,970 2,970 - 73 73 - 2,897 D1477 NRZ Improvements 07/01/2013 - 2,723 2,723 - - - - 2,723 D1478 State/Federal Matching Fund 07/01/2013 - 500 500 - - - - 500 D1479 iQuilt Improvement Fund 07/01/2013 - 990 990 - - - - 990 D1480 Small Business Loan Fund 07/01/2013 - 500 500 - - - - 500 D1481 Façade Program 07/01/2013 - 495 495 - - - - 495 D1482 Bowles & Westbrook Village Site Preparation 07/01/2013 990 990 - - - - 990 D1483 1% for the Arts - CIP FY14 07/01/2013 - 664 664 - - - - 664 W1405 DOJ ADA Improvements 07/01/2013 - 495 495 - - - - 495 W1406 Municipal Facilities Renovations 07/01/2013 - 3,217 3,217 - 698 698 - 2,519 W1407 Facility Planning & Design 07/01/2013 - 1,485 1,485 - 505 505 - 980 W1408 Energy Projects 07/01/2013 - 594 594 - 60 60 - 534 W1409 Library Renovations and Improvements 07/01/2013 - 792 792 - 262 262 - 530 W1410 Citywide Security Improvements 07/01/2013 - 495 495 - 207 207 - 288 W1411 Parkville Senior Center Improvements 07/01/2013 - 247 247 - 2 2 - 245 W1412 Roof Replacement 07/01/2013 - 495 495 - 164 164 - 331 W1413 Electronic Documentation Preservation 07/01/2013 - 1,500 1,500 - 550 550 - 950 W1414 Quirk West 07/01/2013 - 7,920 7,920 - 140 140 - 7,780 W1415 Match Funds -Cal Ripken @ A. 07/01/2013 - 1,700 1,700 - 2 2 - 1,698 Total Public Works Projects 67,718 47,345 115,063 36,025 12,036 48,061 4,157 62,845
Public Safety Projects:W0306 Major Renovations and
Construction Improvementsto Certain Fire Stations,Training Facility andEquipment MaintenanceFacility Building 11/07/2000 6,200 - 6,200 6,200 - 6,200 - -
W1115 Construction of a PublicSafety Complex 11/07/2000 77,000 - 77,000 74,603 611 75,214 557 1,229
W7101 Firearms, Equipment Leasing andTransmitter Equipment 06/26/2007 650 - 650 487 40 527 - 123
W8117 Police Headquarters HVACImprovements & Roof Replacement 08/14/2007 1,800 - 1,800 1,517 - 1,517 - 283
W9109 Fire Houses Citywide - Improvements & Renovations 6/23/2008 1,250 - 1,250 1,249 - 1,249 - 1
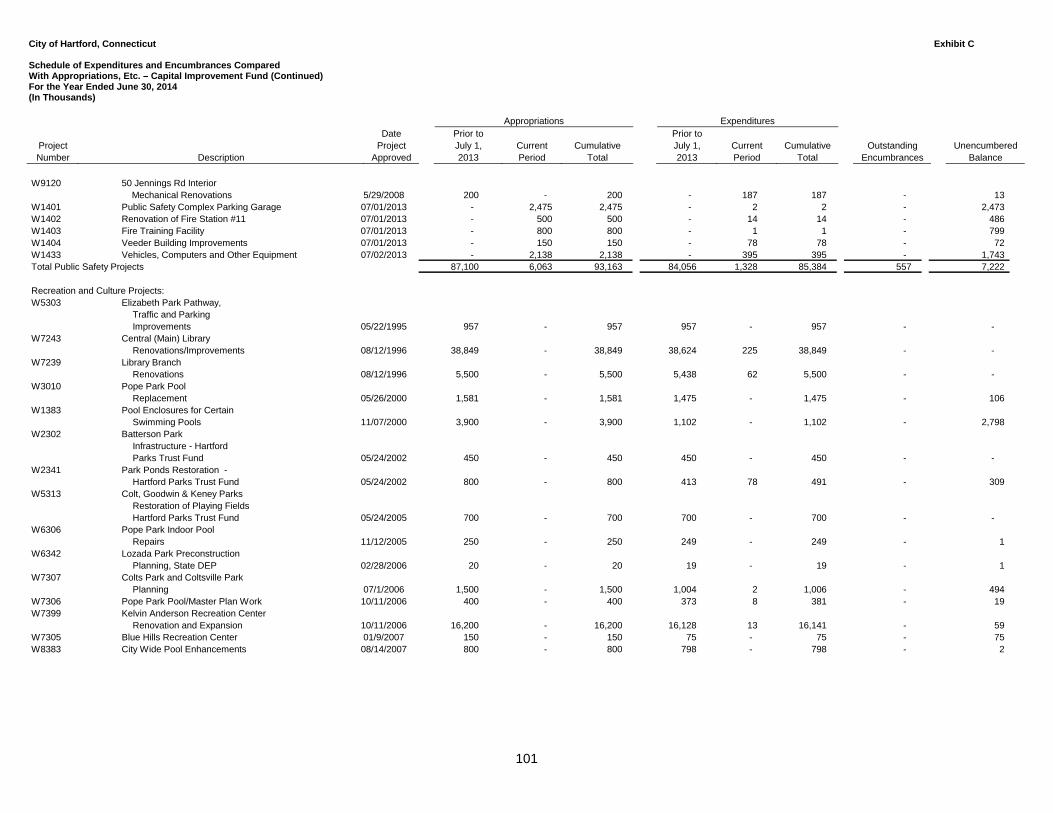
City of Hartford, Connecticut Exhibit C Schedule of Expenditures and Encumbrances Compared With Appropriations, Etc. – Capital Improvement Fund (Continued) For the Year Ended June 30, 2014 (In Thousands)
Appropriations Expenditures Date Prior to Prior to
Project Project July 1, Current Cumulative July 1, Current Cumulative Outstanding Unencumbered Number Description Approved 2013 Period Total 2013 Period Total Encumbrances Balance
101
W9120 50 Jennings Rd Interior Mechanical Renovations 5/29/2008 200 - 200 - 187 187 - 13
W1401 Public Safety Complex Parking Garage 07/01/2013 - 2,475 2,475 - 2 2 - 2,473 W1402 Renovation of Fire Station #11 07/01/2013 - 500 500 - 14 14 - 486 W1403 Fire Training Facility 07/01/2013 - 800 800 - 1 1 - 799 W1404 Veeder Building Improvements 07/01/2013 - 150 150 - 78 78 - 72 W1433 Vehicles, Computers and Other Equipment 07/02/2013 - 2,138 2,138 - 395 395 - 1,743 Total Public Safety Projects 87,100 6,063 93,163 84,056 1,328 85,384 557 7,222
Recreation and Culture Projects:W5303 Elizabeth Park Pathway,
Traffic and ParkingImprovements 05/22/1995 957 - 957 957 - 957 - -
W7243 Central (Main) LibraryRenovations/Improvements 08/12/1996 38,849 - 38,849 38,624 225 38,849 - -
W7239 Library BranchRenovations 08/12/1996 5,500 - 5,500 5,438 62 5,500 - -
W3010 Pope Park PoolReplacement 05/26/2000 1,581 - 1,581 1,475 - 1,475 - 106
W1383 Pool Enclosures for CertainSwimming Pools 11/07/2000 3,900 - 3,900 1,102 - 1,102 - 2,798
W2302 Batterson ParkInfrastructure - Hartford Parks Trust Fund 05/24/2002 450 - 450 450 - 450 - -
W2341 Park Ponds Restoration -Hartford Parks Trust Fund 05/24/2002 800 - 800 413 78 491 - 309
W5313 Colt, Goodwin & Keney ParksRestoration of Playing FieldsHartford Parks Trust Fund 05/24/2005 700 - 700 700 - 700 - -
W6306 Pope Park Indoor PoolRepairs 11/12/2005 250 - 250 249 - 249 - 1
W6342 Lozada Park PreconstructionPlanning, State DEP 02/28/2006 20 - 20 19 - 19 - 1
W7307 Colts Park and Coltsville ParkPlanning 07/1/2006 1,500 - 1,500 1,004 2 1,006 - 494
W7306 Pope Park Pool/Master Plan Work 10/11/2006 400 - 400 373 8 381 - 19 W7399 Kelvin Anderson Recreation Center
Renovation and Expansion 10/11/2006 16,200 - 16,200 16,128 13 16,141 - 59 W7305 Blue Hills Recreation Center 01/9/2007 150 - 150 75 - 75 - 75 W8383 City Wide Pool Enhancements 08/14/2007 800 - 800 798 - 798 - 2
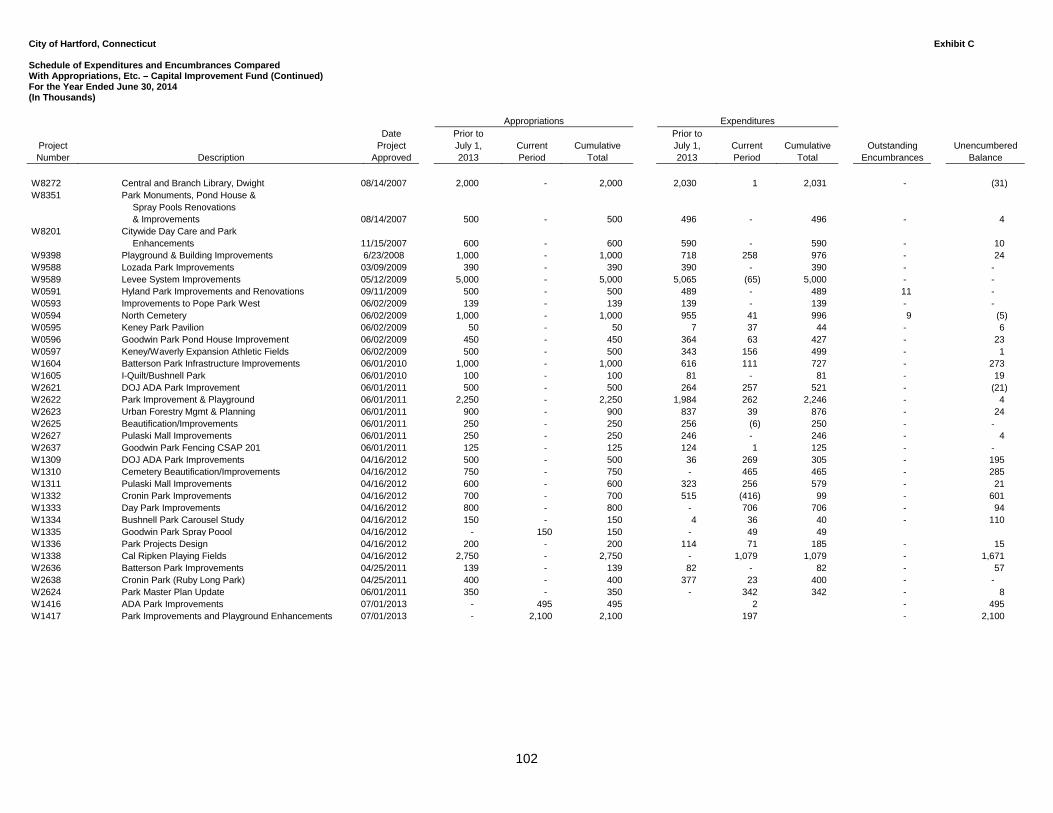
City of Hartford, Connecticut Exhibit C Schedule of Expenditures and Encumbrances Compared With Appropriations, Etc. – Capital Improvement Fund (Continued) For the Year Ended June 30, 2014 (In Thousands)
Appropriations Expenditures Date Prior to Prior to
Project Project July 1, Current Cumulative July 1, Current Cumulative Outstanding Unencumbered Number Description Approved 2013 Period Total 2013 Period Total Encumbrances Balance
102
W8272 Central and Branch Library, Dwight 08/14/2007 2,000 - 2,000 2,030 1 2,031 - (31) W8351 Park Monuments, Pond House &
Spray Pools Renovations & Improvements 08/14/2007 500 - 500 496 - 496 - 4
W8201 Citywide Day Care and ParkEnhancements 11/15/2007 600 - 600 590 - 590 - 10
W9398 Playground & Building Improvements 6/23/2008 1,000 - 1,000 718 258 976 - 24 W9588 Lozada Park Improvements 03/09/2009 390 - 390 390 - 390 - - W9589 Levee System Improvements 05/12/2009 5,000 - 5,000 5,065 (65) 5,000 - - W0591 Hyland Park Improvements and Renovations 09/11/2009 500 - 500 489 - 489 11 - W0593 Improvements to Pope Park West 06/02/2009 139 - 139 139 - 139 - - W0594 North Cemetery 06/02/2009 1,000 - 1,000 955 41 996 9 (5) W0595 Keney Park Pavilion 06/02/2009 50 - 50 7 37 44 - 6 W0596 Goodwin Park Pond House Improvement 06/02/2009 450 - 450 364 63 427 - 23 W0597 Keney/Waverly Expansion Athletic Fields 06/02/2009 500 - 500 343 156 499 - 1 W1604 Batterson Park Infrastructure Improvements 06/01/2010 1,000 - 1,000 616 111 727 - 273 W1605 I-Quilt/Bushnell Park 06/01/2010 100 - 100 81 - 81 - 19 W2621 DOJ ADA Park Improvement 06/01/2011 500 - 500 264 257 521 - (21) W2622 Park Improvement & Playground 06/01/2011 2,250 - 2,250 1,984 262 2,246 - 4 W2623 Urban Forestry Mgmt & Planning 06/01/2011 900 - 900 837 39 876 - 24 W2625 Beautification/Improvements 06/01/2011 250 - 250 256 (6) 250 - - W2627 Pulaski Mall Improvements 06/01/2011 250 - 250 246 - 246 - 4 W2637 Goodwin Park Fencing CSAP 201 06/01/2011 125 - 125 124 1 125 - - W1309 DOJ ADA Park Improvements 04/16/2012 500 - 500 36 269 305 - 195 W1310 Cemetery Beautification/Improvements 04/16/2012 750 - 750 - 465 465 - 285 W1311 Pulaski Mall Improvements 04/16/2012 600 - 600 323 256 579 - 21 W1332 Cronin Park Improvements 04/16/2012 700 - 700 515 (416) 99 - 601 W1333 Day Park Improvements 04/16/2012 800 - 800 - 706 706 - 94 W1334 Bushnell Park Carousel Study 04/16/2012 150 - 150 4 36 40 - 110 W1335 Goodwin Park Spray Poool 04/16/2012 - 150 150 - 49 49 W1336 Park Projects Design 04/16/2012 200 - 200 114 71 185 - 15 W1338 Cal Ripken Playing Fields 04/16/2012 2,750 - 2,750 - 1,079 1,079 - 1,671 W2636 Batterson Park Improvements 04/25/2011 139 - 139 82 - 82 - 57 W2638 Cronin Park (Ruby Long Park) 04/25/2011 400 - 400 377 23 400 - - W2624 Park Master Plan Update 06/01/2011 350 - 350 - 342 342 - 8 W1416 ADA Park Improvements 07/01/2013 - 495 495 2 - 495 W1417 Park Improvements and Playground Enhancements 07/01/2013 - 2,100 2,100 197 - 2,100
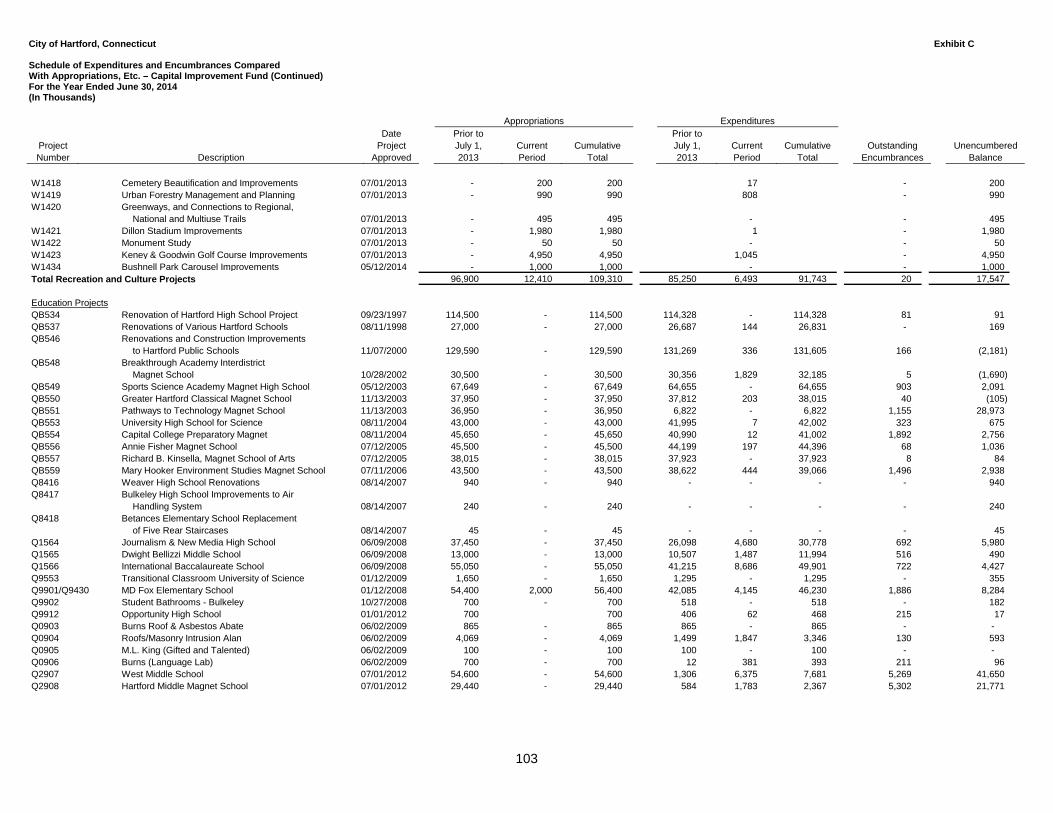
City of Hartford, Connecticut Exhibit C Schedule of Expenditures and Encumbrances Compared With Appropriations, Etc. – Capital Improvement Fund (Continued) For the Year Ended June 30, 2014 (In Thousands)
Appropriations Expenditures Date Prior to Prior to
Project Project July 1, Current Cumulative July 1, Current Cumulative Outstanding Unencumbered Number Description Approved 2013 Period Total 2013 Period Total Encumbrances Balance
103
W1418 Cemetery Beautification and Improvements 07/01/2013 - 200 200 17 - 200 W1419 Urban Forestry Management and Planning 07/01/2013 - 990 990 808 - 990 W1420 Greenways, and Connections to Regional,
National and Multiuse Trails 07/01/2013 - 495 495 - - 495 W1421 Dillon Stadium Improvements 07/01/2013 - 1,980 1,980 1 - 1,980 W1422 Monument Study 07/01/2013 - 50 50 - - 50 W1423 Keney & Goodwin Golf Course Improvements 07/01/2013 - 4,950 4,950 1,045 - 4,950 W1434 Bushnell Park Carousel Improvements 05/12/2014 - 1,000 1,000 - - 1,000 Total Recreation and Culture Projects 96,900 12,410 109,310 85,250 6,493 91,743 20 17,547
Education ProjectsQB534 Renovation of Hartford High School Project 09/23/1997 114,500 - 114,500 114,328 - 114,328 81 91 QB537 Renovations of Various Hartford Schools 08/11/1998 27,000 - 27,000 26,687 144 26,831 - 169 QB546 Renovations and Construction Improvements
to Hartford Public Schools 11/07/2000 129,590 - 129,590 131,269 336 131,605 166 (2,181) QB548 Breakthrough Academy Interdistrict
Magnet School 10/28/2002 30,500 - 30,500 30,356 1,829 32,185 5 (1,690) QB549 Sports Science Academy Magnet High School 05/12/2003 67,649 - 67,649 64,655 - 64,655 903 2,091 QB550 Greater Hartford Classical Magnet School 11/13/2003 37,950 - 37,950 37,812 203 38,015 40 (105) QB551 Pathways to Technology Magnet School 11/13/2003 36,950 - 36,950 6,822 - 6,822 1,155 28,973 QB553 University High School for Science 08/11/2004 43,000 - 43,000 41,995 7 42,002 323 675 QB554 Capital College Preparatory Magnet 08/11/2004 45,650 - 45,650 40,990 12 41,002 1,892 2,756 QB556 Annie Fisher Magnet School 07/12/2005 45,500 - 45,500 44,199 197 44,396 68 1,036 QB557 Richard B. Kinsella, Magnet School of Arts 07/12/2005 38,015 - 38,015 37,923 - 37,923 8 84 QB559 Mary Hooker Environment Studies Magnet School 07/11/2006 43,500 - 43,500 38,622 444 39,066 1,496 2,938 Q8416 Weaver High School Renovations 08/14/2007 940 - 940 - - - - 940 Q8417 Bulkeley High School Improvements to Air
Handling System 08/14/2007 240 - 240 - - - - 240 Q8418 Betances Elementary School Replacement
of Five Rear Staircases 08/14/2007 45 - 45 - - - - 45 Q1564 Journalism & New Media High School 06/09/2008 37,450 - 37,450 26,098 4,680 30,778 692 5,980 Q1565 Dwight Bellizzi Middle School 06/09/2008 13,000 - 13,000 10,507 1,487 11,994 516 490 Q1566 International Baccalaureate School 06/09/2008 55,050 - 55,050 41,215 8,686 49,901 722 4,427 Q9553 Transitional Classroom University of Science 01/12/2009 1,650 - 1,650 1,295 - 1,295 - 355 Q9901/Q9430 MD Fox Elementary School 01/12/2008 54,400 2,000 56,400 42,085 4,145 46,230 1,886 8,284 Q9902 Student Bathrooms - Bulkeley 10/27/2008 700 - 700 518 - 518 - 182 Q9912 Opportunity High School 01/01/2012 700 700 406 62 468 215 17 Q0903 Burns Roof & Asbestos Abate 06/02/2009 865 - 865 865 - 865 - - Q0904 Roofs/Masonry Intrusion Alan 06/02/2009 4,069 - 4,069 1,499 1,847 3,346 130 593 Q0905 M.L. King (Gifted and Talented) 06/02/2009 100 - 100 100 - 100 - - Q0906 Burns (Language Lab) 06/02/2009 700 - 700 12 381 393 211 96 Q2907 West Middle School 07/01/2012 54,600 - 54,600 1,306 6,375 7,681 5,269 41,650 Q2908 Hartford Middle Magnet School 07/01/2012 29,440 - 29,440 584 1,783 2,367 5,302 21,771
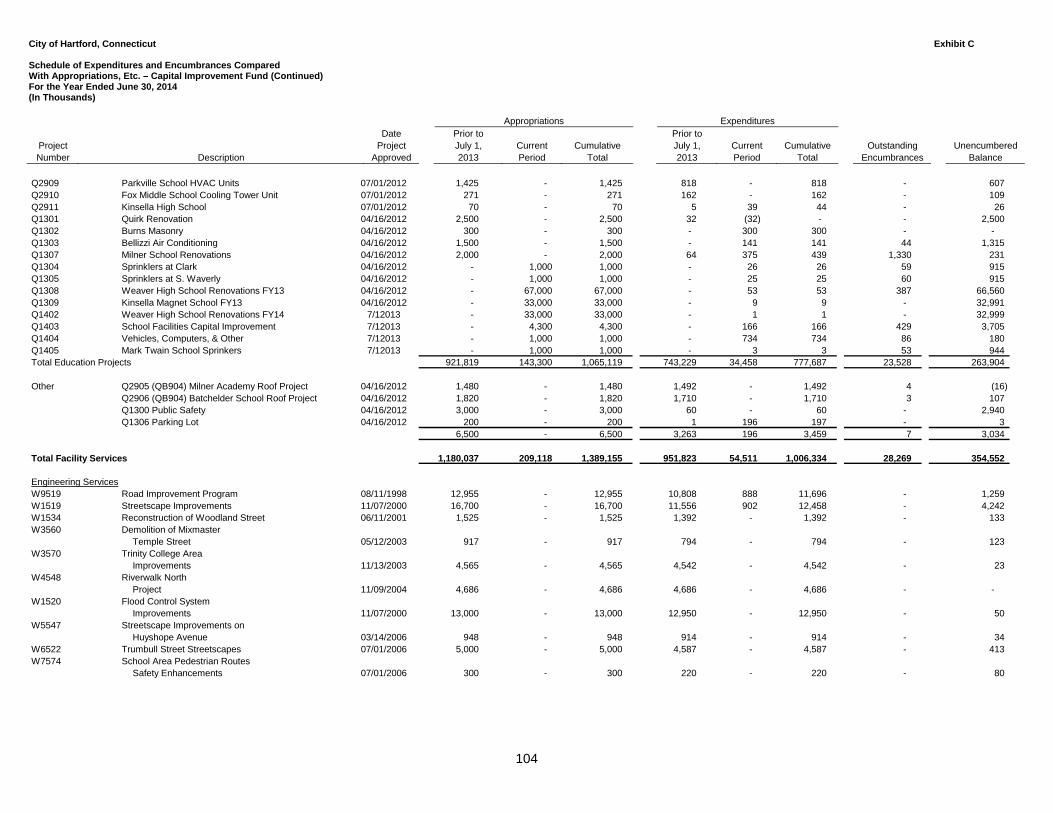
City of Hartford, Connecticut Exhibit C Schedule of Expenditures and Encumbrances Compared With Appropriations, Etc. – Capital Improvement Fund (Continued) For the Year Ended June 30, 2014 (In Thousands)
Appropriations Expenditures Date Prior to Prior to
Project Project July 1, Current Cumulative July 1, Current Cumulative Outstanding Unencumbered Number Description Approved 2013 Period Total 2013 Period Total Encumbrances Balance
104
Q2909 Parkville School HVAC Units 07/01/2012 1,425 - 1,425 818 - 818 - 607 Q2910 Fox Middle School Cooling Tower Unit 07/01/2012 271 - 271 162 - 162 - 109 Q2911 Kinsella High School 07/01/2012 70 - 70 5 39 44 - 26 Q1301 Quirk Renovation 04/16/2012 2,500 - 2,500 32 (32) - - 2,500 Q1302 Burns Masonry 04/16/2012 300 - 300 - 300 300 - - Q1303 Bellizzi Air Conditioning 04/16/2012 1,500 - 1,500 - 141 141 44 1,315 Q1307 Milner School Renovations 04/16/2012 2,000 - 2,000 64 375 439 1,330 231 Q1304 Sprinklers at Clark 04/16/2012 - 1,000 1,000 - 26 26 59 915 Q1305 Sprinklers at S. Waverly 04/16/2012 - 1,000 1,000 - 25 25 60 915 Q1308 Weaver High School Renovations FY13 04/16/2012 - 67,000 67,000 - 53 53 387 66,560 Q1309 Kinsella Magnet School FY13 04/16/2012 - 33,000 33,000 - 9 9 - 32,991 Q1402 Weaver High School Renovations FY14 7/12013 - 33,000 33,000 - 1 1 - 32,999 Q1403 School Facilities Capital Improvement 7/12013 - 4,300 4,300 - 166 166 429 3,705 Q1404 Vehicles, Computers, & Other 7/12013 - 1,000 1,000 - 734 734 86 180 Q1405 Mark Twain School Sprinkers 7/12013 - 1,000 1,000 - 3 3 53 944 Total Education Projects 921,819 143,300 1,065,119 743,229 34,458 777,687 23,528 263,904
Other Q2905 (QB904) Milner Academy Roof Project 04/16/2012 1,480 - 1,480 1,492 - 1,492 4 (16) Q2906 (QB904) Batchelder School Roof Project 04/16/2012 1,820 - 1,820 1,710 - 1,710 3 107 Q1300 Public Safety 04/16/2012 3,000 - 3,000 60 - 60 - 2,940 Q1306 Parking Lot 04/16/2012 200 - 200 1 196 197 - 3
6,500 - 6,500 3,263 196 3,459 7 3,034
Total Facility Services 1,180,037 209,118 1,389,155 951,823 54,511 1,006,334 28,269 354,552
Engineering ServicesW9519 Road Improvement Program 08/11/1998 12,955 - 12,955 10,808 888 11,696 - 1,259 W1519 Streetscape Improvements 11/07/2000 16,700 - 16,700 11,556 902 12,458 - 4,242 W1534 Reconstruction of Woodland Street 06/11/2001 1,525 - 1,525 1,392 - 1,392 - 133 W3560 Demolition of Mixmaster
Temple Street 05/12/2003 917 - 917 794 - 794 - 123 W3570 Trinity College Area
Improvements 11/13/2003 4,565 - 4,565 4,542 - 4,542 - 23 W4548 Riverwalk North
Project 11/09/2004 4,686 - 4,686 4,686 - 4,686 - - W1520 Flood Control System
Improvements 11/07/2000 13,000 - 13,000 12,950 - 12,950 - 50 W5547 Streetscape Improvements on
Huyshope Avenue 03/14/2006 948 - 948 914 - 914 - 34 W6522 Trumbull Street Streetscapes 07/01/2006 5,000 - 5,000 4,587 - 4,587 - 413 W7574 School Area Pedestrian Routes
Safety Enhancements 07/01/2006 300 - 300 220 - 220 - 80
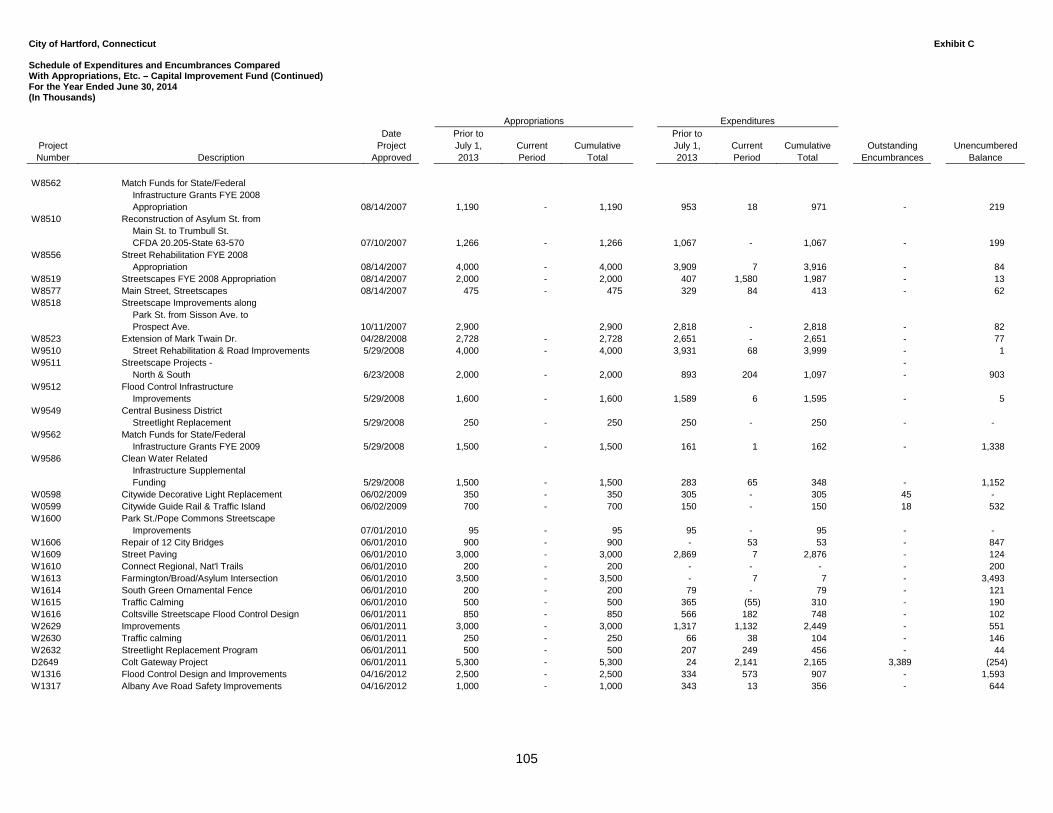
City of Hartford, Connecticut Exhibit C Schedule of Expenditures and Encumbrances Compared With Appropriations, Etc. – Capital Improvement Fund (Continued) For the Year Ended June 30, 2014 (In Thousands)
Appropriations Expenditures Date Prior to Prior to
Project Project July 1, Current Cumulative July 1, Current Cumulative Outstanding Unencumbered Number Description Approved 2013 Period Total 2013 Period Total Encumbrances Balance
105
W8562 Match Funds for State/FederalInfrastructure Grants FYE 2008Appropriation 08/14/2007 1,190 - 1,190 953 18 971 - 219
W8510 Reconstruction of Asylum St. fromMain St. to Trumbull St. CFDA 20.205-State 63-570 07/10/2007 1,266 - 1,266 1,067 - 1,067 - 199
W8556 Street Rehabilitation FYE 2008Appropriation 08/14/2007 4,000 - 4,000 3,909 7 3,916 - 84
W8519 Streetscapes FYE 2008 Appropriation 08/14/2007 2,000 - 2,000 407 1,580 1,987 - 13 W8577 Main Street, Streetscapes 08/14/2007 475 - 475 329 84 413 - 62 W8518 Streetscape Improvements along
Park St. from Sisson Ave. toProspect Ave. 10/11/2007 2,900 2,900 2,818 - 2,818 - 82
W8523 Extension of Mark Twain Dr. 04/28/2008 2,728 - 2,728 2,651 - 2,651 - 77 W9510 Street Rehabilitation & Road Improvements 5/29/2008 4,000 - 4,000 3,931 68 3,999 - 1 W9511 Streetscape Projects - -
North & South 6/23/2008 2,000 - 2,000 893 204 1,097 - 903 W9512 Flood Control Infrastructure
Improvements 5/29/2008 1,600 - 1,600 1,589 6 1,595 - 5 W9549 Central Business District
Streetlight Replacement 5/29/2008 250 - 250 250 - 250 - - W9562 Match Funds for State/Federal
Infrastructure Grants FYE 2009 5/29/2008 1,500 - 1,500 161 1 162 - 1,338 W9586 Clean Water Related
Infrastructure SupplementalFunding 5/29/2008 1,500 - 1,500 283 65 348 - 1,152
W0598 Citywide Decorative Light Replacement 06/02/2009 350 - 350 305 - 305 45 - W0599 Citywide Guide Rail & Traffic Island 06/02/2009 700 - 700 150 - 150 18 532 W1600 Park St./Pope Commons Streetscape
Improvements 07/01/2010 95 - 95 95 - 95 - - W1606 Repair of 12 City Bridges 06/01/2010 900 - 900 - 53 53 - 847 W1609 Street Paving 06/01/2010 3,000 - 3,000 2,869 7 2,876 - 124 W1610 Connect Regional, Nat'l Trails 06/01/2010 200 - 200 - - - - 200 W1613 Farmington/Broad/Asylum Intersection 06/01/2010 3,500 - 3,500 - 7 7 - 3,493 W1614 South Green Ornamental Fence 06/01/2010 200 - 200 79 - 79 - 121 W1615 Traffic Calming 06/01/2010 500 - 500 365 (55) 310 - 190 W1616 Coltsville Streetscape Flood Control Design 06/01/2011 850 - 850 566 182 748 - 102 W2629 Improvements 06/01/2011 3,000 - 3,000 1,317 1,132 2,449 - 551 W2630 Traffic calming 06/01/2011 250 - 250 66 38 104 - 146 W2632 Streetlight Replacement Program 06/01/2011 500 - 500 207 249 456 - 44 D2649 Colt Gateway Project 06/01/2011 5,300 - 5,300 24 2,141 2,165 3,389 (254) W1316 Flood Control Design and Improvements 04/16/2012 2,500 - 2,500 334 573 907 - 1,593 W1317 Albany Ave Road Safety Improvements 04/16/2012 1,000 - 1,000 343 13 356 - 644
City of Hartford, Connecticut Exhibit C Schedule of Expenditures and Encumbrances Compared With Appropriations, Etc. – Capital Improvement Fund (Continued) For the Year Ended June 30, 2014 (In Thousands)
Appropriations Expenditures Date Prior to Prior to
Project Project July 1, Current Cumulative July 1, Current Cumulative Outstanding Unencumbered Number Description Approved 2013 Period Total 2013 Period Total Encumbrances Balance
106
W1318 Traffic Calming 04/16/2012 250 - 250 157 (23) 134 - 116 W1320 Colt Gateway Streetscape Phase 1 04/16/2012 13,900 - 13,900 71 274 345 - 13,555 W1321 Pedestrian Wayfinding Signage Program 04/16/2012 300 - 300 70 - 70 - 230 W1326 City Records - Document Conversion 04/16/2012 300 - 300 117 103 220 - 80 W1329 Roof Replacement 04/16/2012 500 - 500 32 199 231 - 269 W1330 Street Light Replacement Program 04/16/2012 250 - 250 171 - 171 - 79 W1315 Traffic Calming 04/16/2012 - 250 250 4 4 - 246 W1425 Flood Control Design and Improvements 07/01/2013 - 4,200 4,200 84 84 - 4,116 W1432 Citywide Fencing 07/01/2013 - 495 495 128 128 - 367 W1301 Radio Communications 04/16/2012 - 200 200 - 117 117 - 83 Total Engineering Services 124,350 5,145 129,495 79,028 9,049 88,077 3,452 37,966
Transportation Services
Public Works Projects:W0511 Upgrade of Hartford
Traffic Signals 11/23/1999 1,861 - 1,861 1,820 - 1,820 - 41 W6550 Safety Improvements to
Franklin and Benton 08/16/2005 92 - 92 92 - 92 - - W6551 Safety Improvements to
Washington and Ward 08/16/2005 92 - 92 92 - 92 - - W7564 City Sidewalk Replacements 10/11/2006 300 - 300 297 - 297 - 3 W8550 Safety Improvements at the
Intersection of New Britain Ave.and Henry Street. 10/10/2007 87 - 87 25 - 25 - 62
A8509 On-Street Parking Meters 02/13/2008 3,300 - 3,300 3,225 61 3,286 9 5 W1424 Traffic Signalization 07/1/2013 - 1,485 1,485 - - - - 1,485 W1426 Bridge Repairs 07/1/2013 - 500 500 - - - - 500 W1427 Complete Streets 07/1/2013 - 1,000 1,000 - 254 254 - 746 W1428 Complete Streets - repav and repair 07/1/2013 - 8,637 8,637 - 2,805 2,805 - 5,832 W1429 Complete Streets - Streetscape 07/1/2013 - 15,000 15,000 - 1,106 1,106 - 13,894 W1430 Brookfield Street Reconstruction 07/1/2013 - 250 250 - - - - 250 W1431 Street Light Replacement Program 07/1/2013 - 250 250 - - - - 250 Total Transportation Services 5,732 27,122 32,854 5,551 4,226 9,777 9 23,068
Local Capital Improvement Program
Public Works Projects:W5534 LOCIP - Woodland Street
Bridge RehabilitationMatch 10/10/1995 250 - 250 236 - 236 - 14
W7244 Library Renovations 09/11/1996 1,000 - 1,000 988 - 988 - 12
City of Hartford, Connecticut Exhibit C Schedule of Expenditures and Encumbrances Compared With Appropriations, Etc. – Capital Improvement Fund (Continued) For the Year Ended June 30, 2014 (In Thousands)
Appropriations Expenditures Date Prior to Prior to
Project Project July 1, Current Cumulative July 1, Current Cumulative Outstanding Unencumbered Number Description Approved 2013 Period Total 2013 Period Total Encumbrances Balance
107
W0521 STP Federal RoadReconstruction Match - 064-99-030 10/27/1999 400 - 400 388 - 388 12 -
W1263 Municipal BuildingImprovements –064-00-030; 064-01-060 10/11/2000 716 - 716 693 - 693 - 23
W2552 Signalization of FranklinAvenue/Ward Street andWashington/Ward Street- LOCIP project #242 –064-01-010 09/12/2001 20 - 20 20 - 20 - -
W2553 Reconstruction of Broadand/or Vine Street - LOCIP Project #553- 064-01 040 09/12/2001 300 - 300 281 - 281 - 19
W4270 Truck Wash Facility -LOCIP Project #247 -064-03-010 09/15/2003 75 - 75 75 - 75 - -
W4271 Sand/Salt Storage Building -LOCIP Project #248 -064-03-020 09/15/2003 750 - 750 571 108 679 - 71
W4563 City Bridges ConditionStudy - LOCIP Project #536 -064-03-040 09/15/2003 125 - 125 72 4 76 - 49
W4556 Street Resurfacingand Repairs -LOCIP Project #556 -064-03-050,064-05-040&064-06-030 09/15/2003 3,850 - 3,850 3,849 - 3,849 - 1
W4117 Police Headquarters -Heating, Ventilation, andAir Conditioning (HVACImprovements) -LOCIP Project#117-064-03-080&064-05-020 09/15/2003 2,066 - 2,066 2,002 - 2,002 - 64
W4268 Department of Public Works Maps and Storage Facility - LOCIP Project #255 -064-03-070 09/15/2003 100 - 100 4 (4) - - 100
City of Hartford, Connecticut Exhibit C Schedule of Expenditures and Encumbrances Compared With Appropriations, Etc. – Capital Improvement Fund (Continued) For the Year Ended June 30, 2014 (In Thousands)
Appropriations Expenditures Date Prior to Prior to
Project Project July 1, Current Cumulative July 1, Current Cumulative Outstanding Unencumbered Number Description Approved 2013 Period Total 2013 Period Total Encumbrances Balance
108
W4203 Installation of AutomatedFuel Control and AccountingSystem for Vehicle Fueling System -LOCIP Project #561 -064-03-090 09/15/2003 150 - 150 132 - 132 - 18
W5268 City Hall Fourth Floor Improvements -LOCIP Project #260 -064-04-040 10/13/2004 400 - 400 375 - 375 - 25
W5269 Central Business DistrictStreetlight Replacement -LOCIP Project #549064-04-050 10/13/2004 500 - 500 500 - 500 - -
W5383 Colt and Keney Park SwimmingPool Renovations -LOCIP Project #383 -064-04-070 10/13/2004 250 - 250 109 - 109 - 141
W6572 Plan of Conservationand DevelopmentLOCIP Project #572064-05-050 11/29/2005 500 - 500 491 5 496 - 4
W7568 Citywide Neighborhood TrafficCalming Master Plan LOCIPProject #568, 064-05-070 02/16/2006 250 - 250 136 - 136 - 114
W7265 Roof Replacements at VariousCity BuildingsProject #265, 064-06-010 01/30/2007 750 - 750 685 16 701 - 49
W7266 Boiler Replacement at VariousCity BuildingsProject #266, 064-06-020 01/30/2007 250 - 250 250 - 250 - -
W6568 Citywide Neighborhood TrafficCalmingProject #568, 064-06-040 01/30/2007 250 - 250 248 - 248 - 2
W7575 Citywide Decorative LightReplacementsProject #575, 064-06-050 01/30/2007 225 - 225 147 - 147 - 78
W9590 LOCIP Project #581 - 06/09/2009Handicap Ramps 250 - 250 5 (5) - 250
- W1601 Pope Park Recreation Center Building Shell 06/01/2010 1,200 - 1,200 1,218 - 1,218 - (18) W1603 525 Main St. Roof Top Unit Replacement 06/01/2010 500 - 500 79 - 79 - 421 W1607 Sidewalk Replacement 06/01/2010 200 - 200 128 - 128 - 72
City of Hartford, Connecticut Exhibit C Schedule of Expenditures and Encumbrances Compared With Appropriations, Etc. – Capital Improvement Fund (Continued) For the Year Ended June 30, 2014 (In Thousands)
Appropriations Expenditures Date Prior to Prior to
Project Project July 1, Current Cumulative July 1, Current Cumulative Outstanding Unencumbered Number Description Approved 2013 Period Total 2013 Period Total Encumbrances Balance
109
W1608 Traffic Signals and Cameras 06/01/2010 1,500 - 1,500 34 106 140 - 1,360 W1612 Streetlight Replacement 06/01/2010 300 - 300 17 - 17 - 283 W2626 Improvements 06/01/2011 250 - 250 132 6 138 - 112 W2628 Traffic signalization 06/01/2011 750 - 750 98 23 121 - 629 W2631 Citywide Bike Lanes 06/01/2011 50 - 50 - - - - 50 W2633 Street Design & Reconstruction 06/01/2011 900 - 900 - - - - 900 W2634 Sidewalk Replacement 06/01/2011 500 - 500 213 211 424 - 76 W2635 Street Repaving & Repair 06/01/2011 300 - 300 300 - 300 - - D2636 Citywide Streetscapes - Planning 06/01/2011 250 - 250 - - - 247 3 W1325 Street Repaving & Repair 04/16/2012 2,000 - 2,000 548 1,074 1,622 - 378
Total Local Capital Improvement Program 22,127 - 22,127 15,024 1,544 16,568 259 5,300
Non Bonded ProjectsD1363 TIGER GRANT - PROJ MGMT/A&E 07/01/2013 - 1,209 1,209 - 423 423 52.00 734 D1364 TIGER GRANT - UNION STATION HUB 07/01/2013 - 897 897 - - - 897.00 - D1365 TIGER GRANT - BUSHNELL PARK NORTH 07/01/2013 - 5,321 5,321 - 124 124 5,236.00 (39) D1366 TIGER GRANT - ASYLUM/PEARL TRANSIT 07/01/2013 - 2,437 2,437 - 81 81 2,437.00 (81) D1368 BUS LIVABILITY GRANT (GHTD) 07/01/2013 - 1,692 1,692 - 317 317 1,325.00 50 D1390 JOHN E ROGERS - STATE URBAN ACT GRA 07/01/2013 - 1,000 1,000 - 2 2 907.00 91 W1310 Cemetery Beautification and Improve 04/16/2012 - 250 250 - 250 250 - - W1318 Traffic Calming 04/16/2012 - 56 56 - 56 56 - - W1332 Cronin Park Improvements 04/16/2012 - 500 500 - 500 500 - - W1337 Citywide Bike Racks 04/16/2012 - 18 18 - 18 18 - - W1417 Park Improv. & Playground Enhanc. 07/01/2013 - 300 300 - - - - 300 W1418 Cemetery Beautification and Improv. 07/01/2013 - 200 200 - - - - 200 W1433 Vehicles, Computers and Other Equip 07/01/2013 - 3,930 3,930 - 3,585 3,585 296.00 49 W1440 MICROGRID PILOT PROGRAM-PARKVILLE 07/01/2013 2,123 2,123 - 60 60 - 2,063 W1441 MICROGRID-JENNINGS RD PROPOSAL 07/01/2013 - 57 57 - 58 58 - (1) W1615 W1615 Traffic Calming 06/01/2010 - 76 76 - 76 76 - - W9900 TOWN CLERK'S LOCIP ACCOUNT 07/01/2013 - 79 79 - - - - 79
Total Non Bonded Projects - 20,145 20,145 - 5,550 5,550 11,150 3,445
TOTAL CAPITAL IMPROVEMENT FUND 1,332,246 $ 261,530 $ 1,593,776 $ 1,051,426 $ 74,880 1,126,306 $ 43,139 $ 424,331 $
Conversion to GAAP based financial statement reporting:Previous year retainage and off system accrued payables (5,336) (5,336)
Current year retainage and off system accrued payables 2,186 2,186
TOTAL 71,730 $ 39,989 $

110
This page intentionally left blank.

Internal Service Funds
Internal Service Funds Internal service funds are used to report any activity that provides goods or services to other funds, departments, or agencies of the City, or to other governments, on a cost-reimbursement basis. The City maintains seven (7) internal service funds to account for the risk management program for employee benefits including retirees, municipal actives, BOE actives, new hires, VEBA, workers’ compensation, and general liability, including property damage. An internal service fund is also maintained for the Metro Hartford Information Services Fund (MHIS). The accounting and reporting for the centralized computer services, including communication systems, is maintained through this internal service fund.

111
This page intentionally left blank.
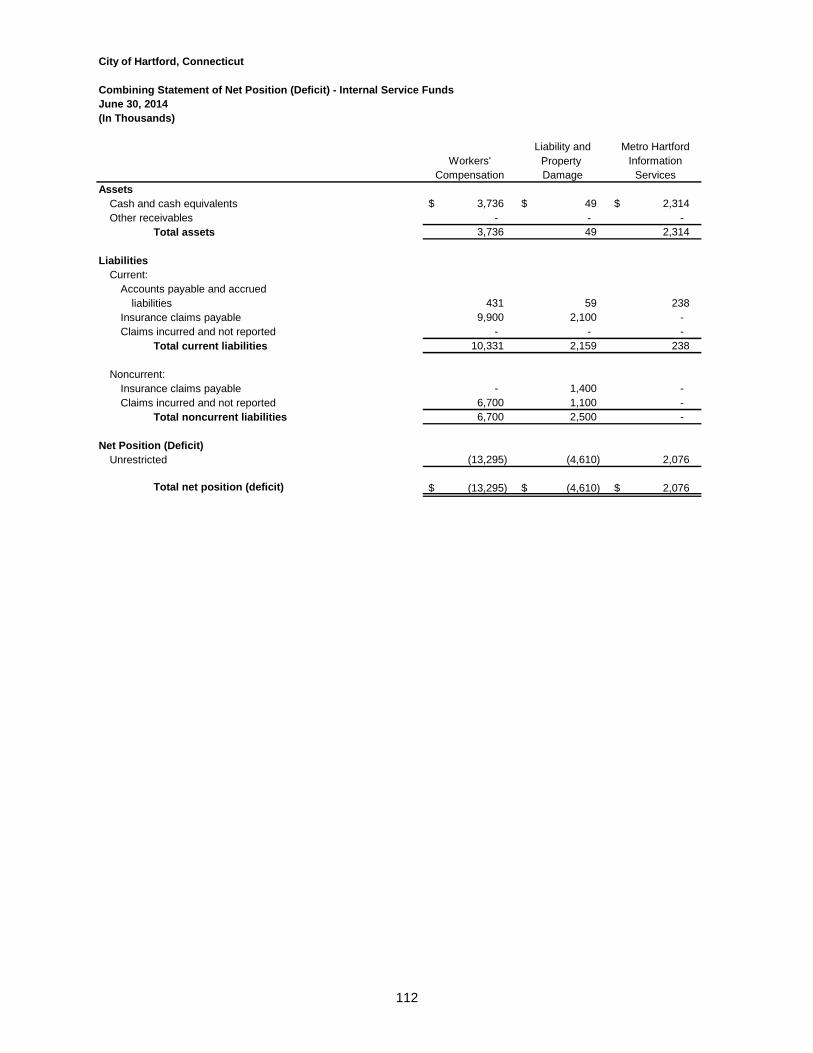
112
City of Hartford, Connecticut
Combining Statement of Net Position (Deficit) - Internal Service FundsJune 30, 2014(In Thousands)
Liability and Metro HartfordWorkers' Property Information
Compensation Damage ServicesAssets
Cash and cash equivalents 3,736 $ 49 $ 2,314 $ Other receivables - - -
Total assets 3,736 49 2,314
LiabilitiesCurrent:
Accounts payable and accruedliabilities 431 59 238
Insurance claims payable 9,900 2,100 - Claims incurred and not reported - - -
Total current liabilities 10,331 2,159 238
Noncurrent:Insurance claims payable - 1,400 - Claims incurred and not reported 6,700 1,100 -
Total noncurrent liabilities 6,700 2,500 -
Net Position (Deficit)Unrestricted (13,295) (4,610) 2,076
Total net position (deficit) (13,295) $ (4,610) $ 2,076 $

113
EXHIBIT D-1
Municipal BOERetirees Actives Actives New Hires VEBA Totals
1,340 $ 1,957 $ 39,826 $ 2,781 $ 174 $ 52,177 $ 188 - 209 - - 397
1,528 1,957 40,035 2,781 174 52,574
471 364 884 - - 2,447 - - - - - 12,000
1,057 1,518 3,084 - - 5,659 1,528 1,882 3,968 - - 20,106
- - - - - 1,400 - - - - - 7,800 - - - - - 9,200
- 75 36,067 2,781 174 23,268
-$ 75 $ 36,067 $ 2,781 $ 174 $ 23,268 $
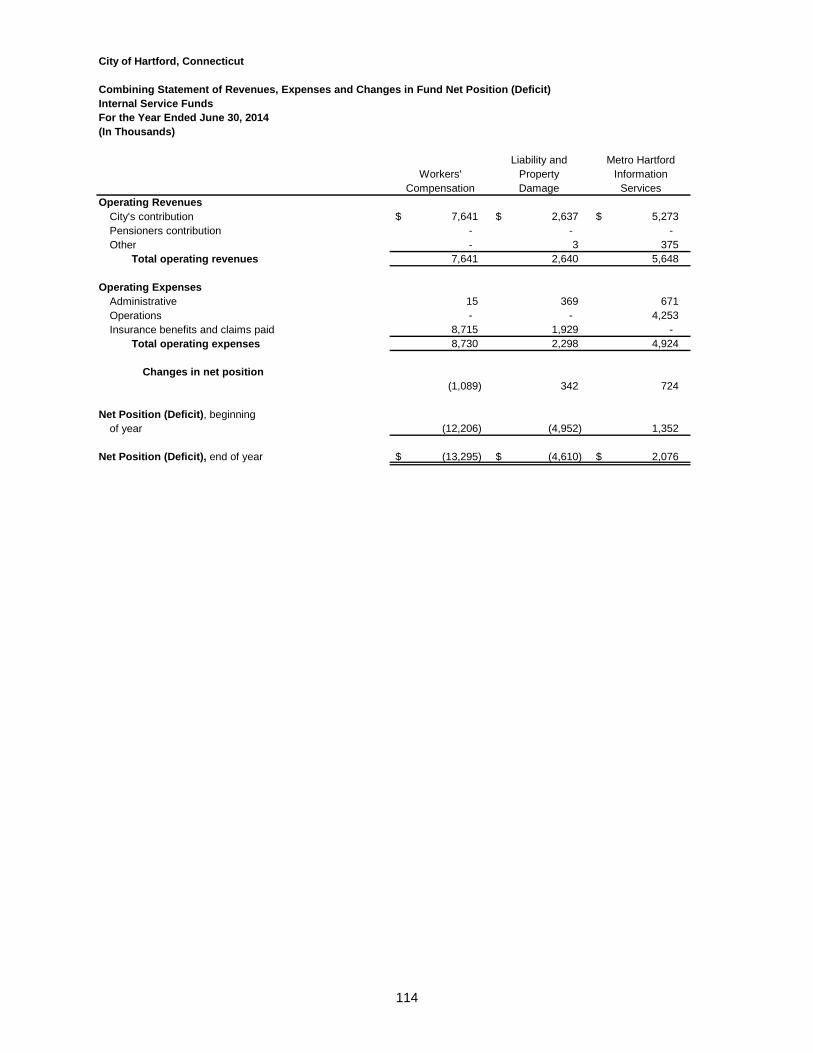
114
City of Hartford, Connecticut
Combining Statement of Revenues, Expenses and Changes in Fund Net Position (Deficit)Internal Service FundsFor the Year Ended June 30, 2014(In Thousands)
Liability and Metro HartfordWorkers' Property Information
Compensation Damage ServicesOperating Revenues
City's contribution 7,641 $ 2,637 $ 5,273 $ Pensioners contribution - - - Other - 3 375
Total operating revenues 7,641 2,640 5,648
Operating ExpensesAdministrative 15 369 671 Operations - - 4,253 Insurance benefits and claims paid 8,715 1,929 -
Total operating expenses 8,730 2,298 4,924
Changes in net position (1,089) 342 724
Net Position (Deficit), beginning of year (12,206) (4,952) 1,352
Net Position (Deficit), end of year (13,295) $ (4,610) $ 2,076 $
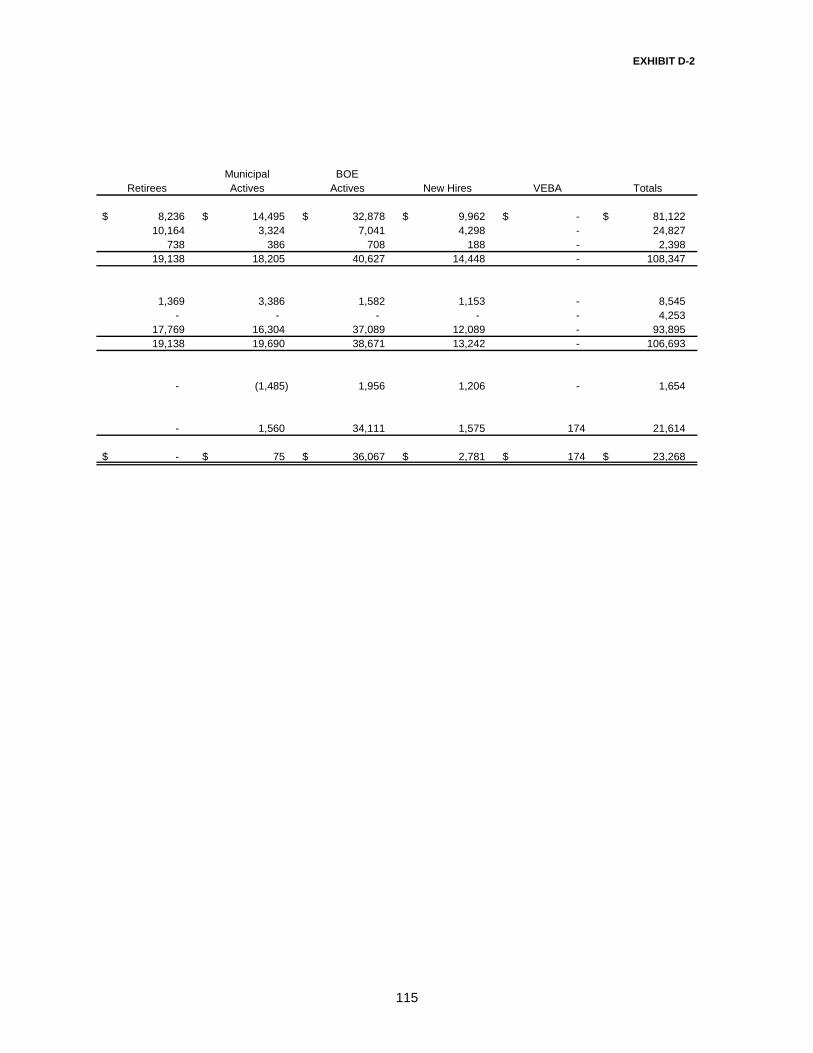
115
EXHIBIT D-2
Municipal BOERetirees Actives Actives New Hires VEBA Totals
8,236 $ 14,495 $ 32,878 $ 9,962 $ -$ 81,122 $ 10,164 3,324 7,041 4,298 - 24,827
738 386 708 188 - 2,398 19,138 18,205 40,627 14,448 - 108,347
1,369 3,386 1,582 1,153 - 8,545 - - - - - 4,253
17,769 16,304 37,089 12,089 - 93,895 19,138 19,690 38,671 13,242 - 106,693
- (1,485) 1,956 1,206 - 1,654
- 1,560 34,111 1,575 174 21,614
-$ 75 $ 36,067 $ 2,781 $ 174 $ 23,268 $
116
City of Hartford, Connecticut
Combining Statement of Cash Flows - Internal Service FundsFor the Year Ended June 30, 2014(In Thousands)
Liability and Metro HartfordWorkers' Property Information
Compensation Damage ServicesCash Flows From Operating Activities
City's contribution 7,641 $ 2,646 $ 5,273 $ Cash received from other - - 375 Cash received from users - - - Cash paid for salaries and benefits - - (671) Cash paid for claims (7,092) (2,797) (4,352)
Net cash provided by(used in) operatingactivities 549 (151) 625
Net increase (decrease)in cash and cash equivalents 549 (151) 625
Cash and Cash Equivalents, beginningof year 3,187 200 1,689
Cash and Cash Equivalents, end of year 3,736 $ 49 $ 2,314 $
Reconciliation of Operating Income (Loss) to Net Cash Provided by (Used in)Operating Activities
Operating income (loss) (1,089) $ 342 $ 724 $ Adjustments to reconcile operating
income (loss) to net cash provided by(used in) operating activities:
(Increase) decrease in other receivables - 6 - (Decrease) increase in accounts payable 338 1 (99) (Decrease) increase in insurance claims
payable 700 (400) - (Decrease) increase in claims incurred
but not reported 600 (100) - Net cash provided by (used in)operating activities 549 $ (151) $ 625 $
117
EXHIBIT D-3
Municipal BOERetirees Actives Actives New Hires VEBA Totals
8,529 $ 14,495 $ 32,833 $ 9,962 $ -$ 81,379 $ 738 386 708 188 - 2,395
10,164 3,324 7,041 4,298 - 24,827 (1,369) (942) (1,582) (1,153) - (5,717)
(17,856) (18,627) (36,660) (12,462) - (99,846)
206 (1,364) 2,340 833 - 3,038
206 (1,364) 2,340 833 - 3,038
1,134 3,321 37,486 1,948 174 49,139
1,340 $ 1,957 $ 39,826 $ 2,781 $ 174 $ 52,177 $
-$ (1,485) $ 1,956 $ 1,206 $ -$ 1,654 $
293 - (45) - - 254 79 (10) (16) - - 293
- - - - - 300
(166) 131 445 (373) - 537
206 $ (1,364) $ 2,340 $ 833 $ -$ 3,038 $

118
This page intentionally left blank.

Agency Funds

Agency Funds Agency funds are used to report resources held by the City in a purely custodial capacity (assets equal liabilities). The City reports student activities, including class events and various other functions of the Hartford Public School System, within the School Agency Funds.
119
City of Hartford, Connecticut EXHIBIT E-1
Combining Balance Sheet - Agency Funds
June 30, 2014(In Thousands)
Student AdultActivity EducationFunds Book Fund Totals
AssetsCash and cash equivalents 984 $ 9 $ 993 $
LiabilitiesDue to student groups and other 984 $ 9 $ 993 $
120
City of Hartford, Connecticut EXHIBIT E-2
Agency FundsFor the Year Ended June 30, 2014(In Thousands)
Balance BalanceJuly 1, 2013 Additions Deletions June 30, 2014
Student Activity FundAssets
Cash and cash equivalents 935 $ 1,182 $ 1,134 $ 984 $
LiabilitiesDue to student groups 935 $ 1,182 $ 1,134 $ 984 $
Adult Education Book FundAssets
Cash 9 $ -$ -$ 9 $
LiabilitiesDue to other 9 $ -$ -$ 9 $
Total All Agency FundsAssets
Cash and cash equivalents 944 $ 1,182 $ 1,134 $ 993 $
LiabilitiesDue to student groups 935 $ 1,182 $ 1,134 $ 984 $ Due to other 9 - - 9
Total 944 $ 1,182 $ 1,134 $ 993 $
Combining Statement of Changes in Assets and Liabilities -

Capital Assets Used in the Operation of Governmental Funds

Capital Assets Used in the Operation of Governmental Funds
Capital asset reporting by function and source is presented in these schedules. Assets are reported primarily at historical cost or estimated historical cost. Current and accumulated provisions for depreciation are not included in the schedules.
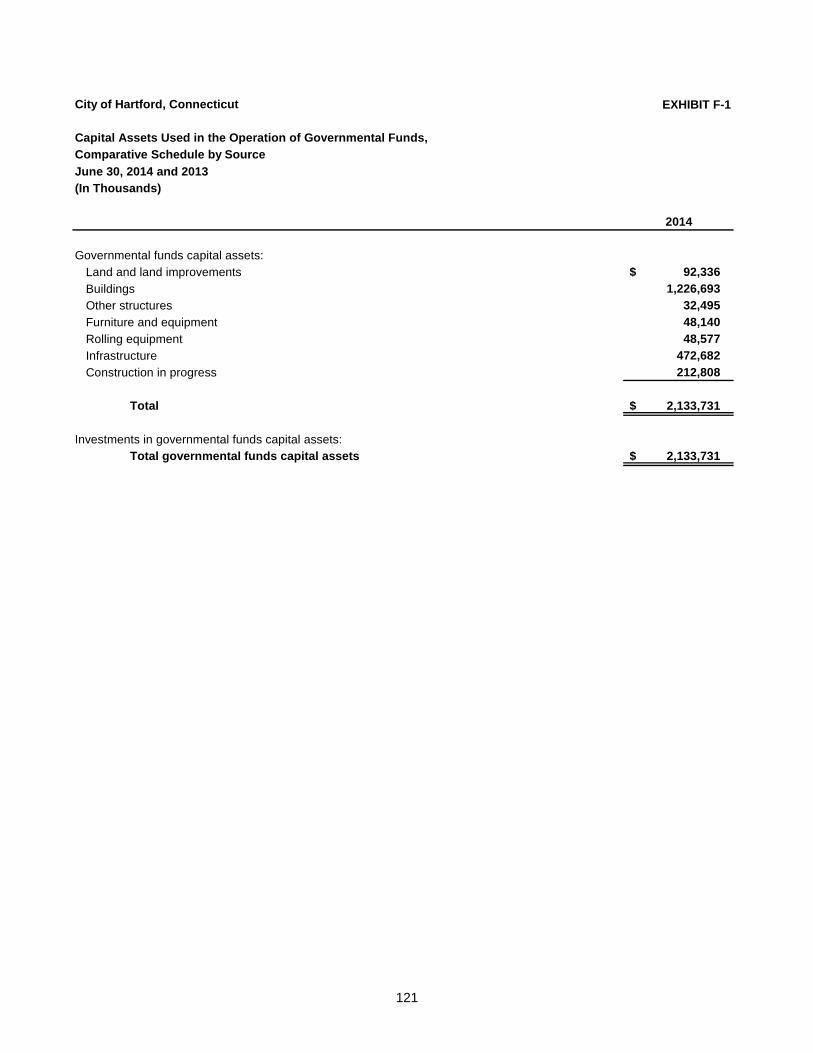
121
City of Hartford, Connecticut EXHIBIT F-1
Capital Assets Used in the Operation of Governmental Funds,
Comparative Schedule by Source
June 30, 2014 and 2013
(In Thousands)
2014
Governmental funds capital assets:
Land and land improvements 92,336 $
Buildings 1,226,693
Other structures 32,495
Furniture and equipment 48,140
Rolling equipment 48,577
Infrastructure 472,682
Construction in progress 212,808
Total 2,133,731 $
Investments in governmental funds capital assets:Total governmental funds capital assets 2,133,731 $

122
This page intentionally left blank.

Statistical Section
Statistical Section Information
The objectives of statistical section information are to provide financial statement users with additional historical perspective, context, and detail to assist in using the information in the financial statements, notes to financial statements, and required supplementary information to understand and assess economic condition. Statistical section information is presented in the following categories:
Financial trends information is intended to assist users in understanding and assessing how financial position has changed over time.
Revenue capacity information is intended to assist users in understanding and assessing the factors affecting the ability to generate own-source revenues (property taxes, charges for services, etc.).
Debt capacity information is intended to assist users in understanding and assessing debt burden and the ability to issue additional debt.
Demographic and economic information is intended (1) to assist users in understanding the socioeconomic environment and (2) to provide information that facilitates comparisons of financial statement information over time and among governments.
Operating information is intended to provide contextual information about operations and resources to assist readers in using financial statement information to understand and assess economic condition.
The accompanying tables are presented in the above order. Refer to the Table of Contents for applicable page number locations. __________ Sources: Unless otherwise noted, the information in the tables is derived from the comprehensive annual financial reports for the relevant year.

123
This page intentionally left blank.
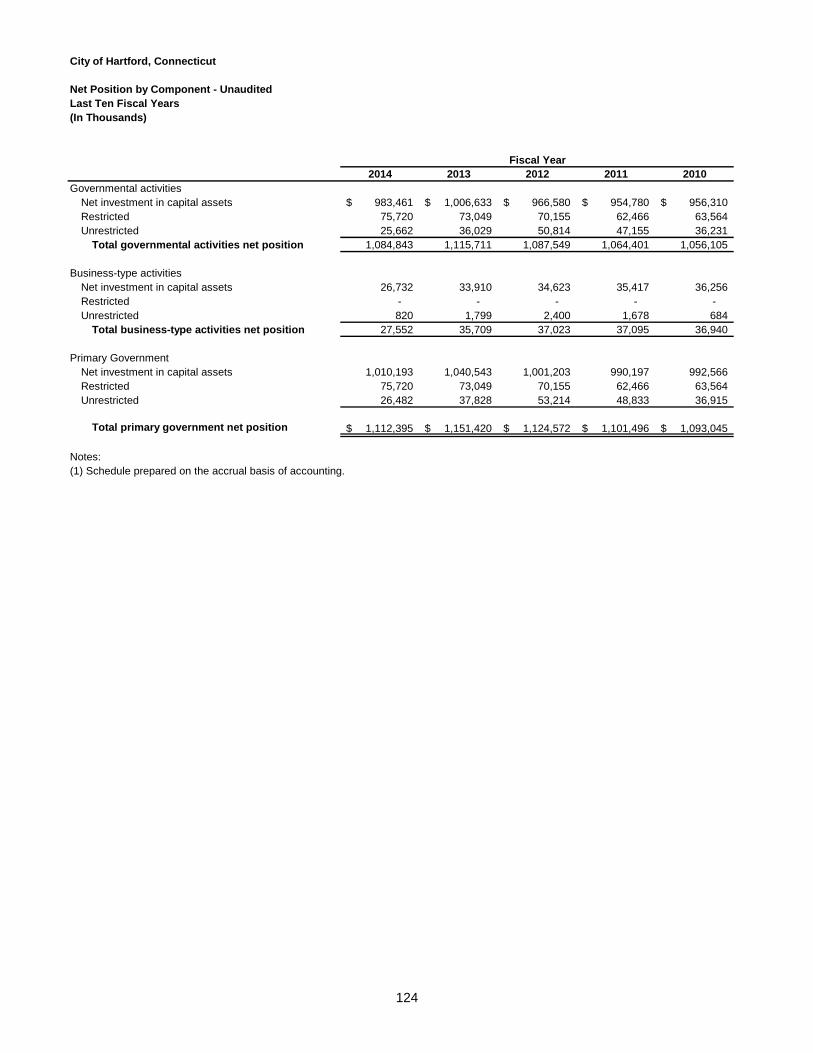
124
City of Hartford, Connecticut
Net Position by Component - UnauditedLast Ten Fiscal Years(In Thousands)
2014 2013 2012 2011 2010Governmental activities
Net investment in capital assets 983,461$ 1,006,633$ 966,580$ 954,780$ 956,310$ Restricted 75,720 73,049 70,155 62,466 63,564 Unrestricted 25,662 36,029 50,814 47,155 36,231
Total governmental activities net position 1,084,843 1,115,711 1,087,549 1,064,401 1,056,105
Business-type activitiesNet investment in capital assets 26,732 33,910 34,623 35,417 36,256 Restricted - - - - - Unrestricted 820 1,799 2,400 1,678 684
Total business-type activities net position 27,552 35,709 37,023 37,095 36,940
Primary GovernmentNet investment in capital assets 1,010,193 1,040,543 1,001,203 990,197 992,566 Restricted 75,720 73,049 70,155 62,466 63,564 Unrestricted 26,482 37,828 53,214 48,833 36,915
Total primary government net position 1,112,395$ 1,151,420$ 1,124,572$ 1,101,496$ 1,093,045$
Notes:(1) Schedule prepared on the accrual basis of accounting.
Fiscal Year
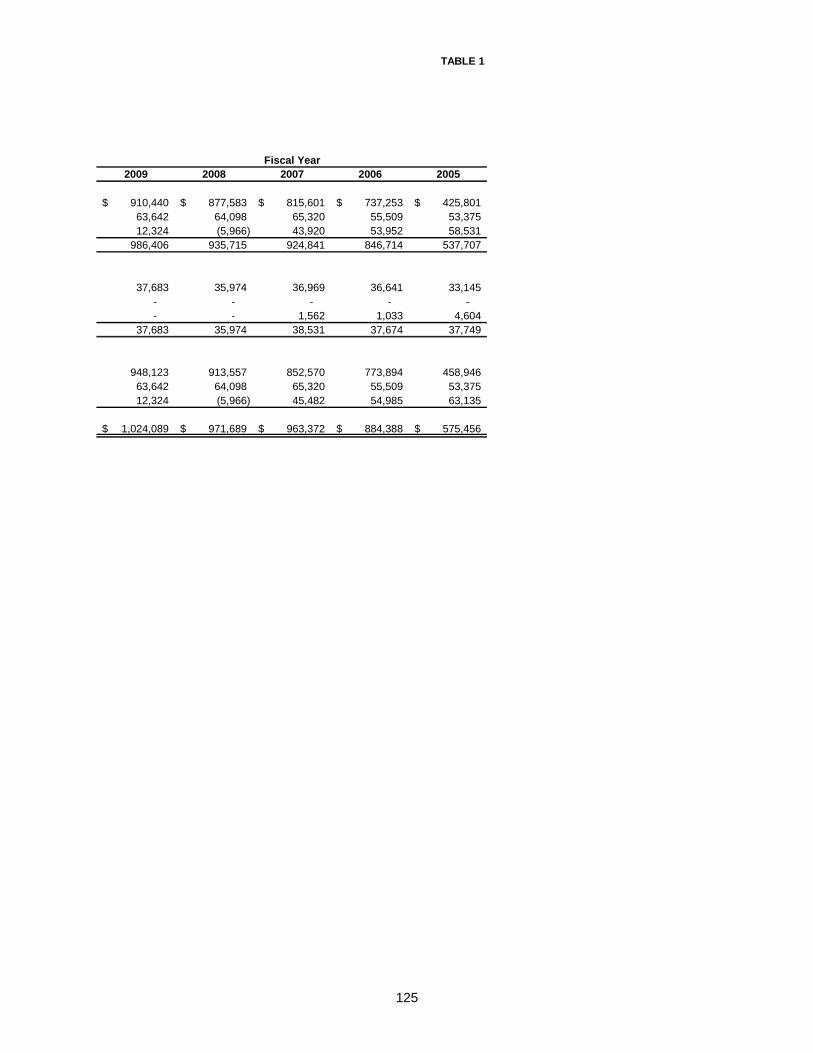
125
TABLE 1
2009 2008 2007 2006 2005
910,440$ 877,583$ 815,601$ 737,253$ 425,801$ 63,642 64,098 65,320 55,509 53,375 12,324 (5,966) 43,920 53,952 58,531
986,406 935,715 924,841 846,714 537,707
37,683 35,974 36,969 36,641 33,145 - - - - - - - 1,562 1,033 4,604
37,683 35,974 38,531 37,674 37,749
948,123 913,557 852,570 773,894 458,946 63,642 64,098 65,320 55,509 53,375 12,324 (5,966) 45,482 54,985 63,135
1,024,089$ 971,689$ 963,372$ 884,388$ 575,456$
Fiscal Year
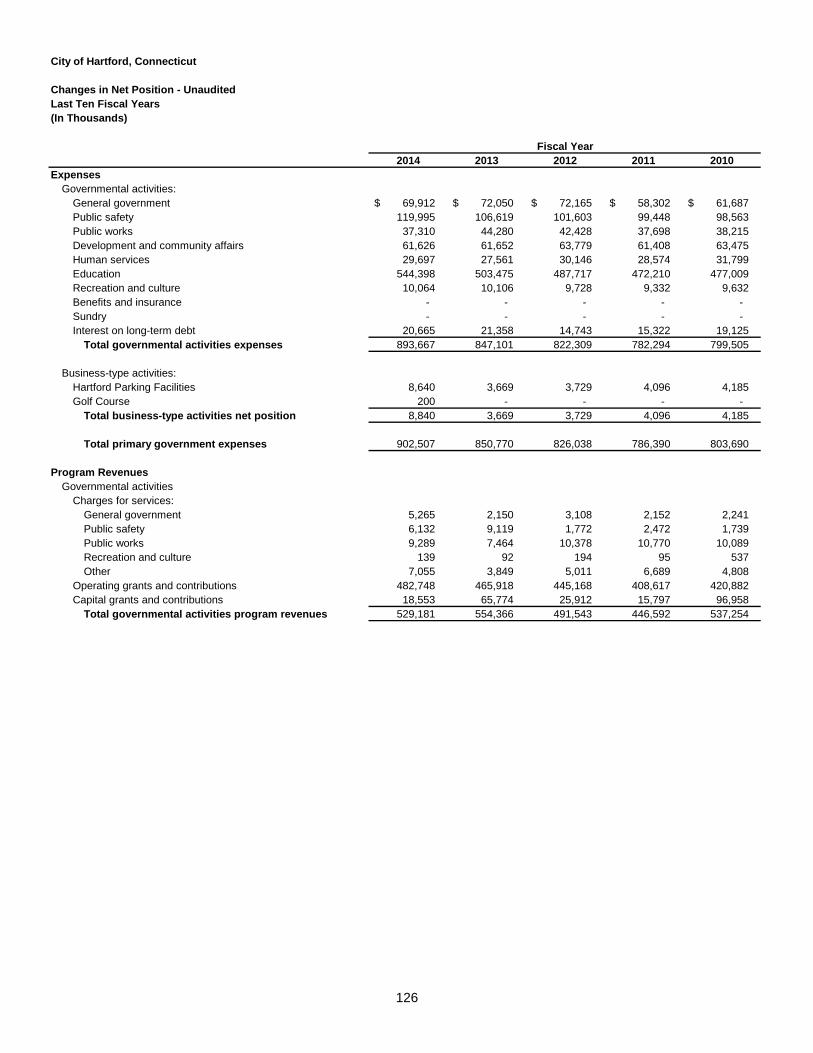
126
City of Hartford, Connecticut
Changes in Net Position - UnauditedLast Ten Fiscal Years(In Thousands)
2014 2013 2012 2011 2010Expenses
Governmental activities:General government 69,912 $ 72,050 $ 72,165 $ 58,302 $ 61,687 $ Public safety 119,995 106,619 101,603 99,448 98,563 Public works 37,310 44,280 42,428 37,698 38,215 Development and community affairs 61,626 61,652 63,779 61,408 63,475 Human services 29,697 27,561 30,146 28,574 31,799 Education 544,398 503,475 487,717 472,210 477,009 Recreation and culture 10,064 10,106 9,728 9,332 9,632 Benefits and insurance - - - - - Sundry - - - - - Interest on long-term debt 20,665 21,358 14,743 15,322 19,125
Total governmental activities expenses 893,667 847,101 822,309 782,294 799,505
Business-type activities:Hartford Parking Facilities 8,640 3,669 3,729 4,096 4,185 Golf Course 200 - - - -
Total business-type activities net position 8,840 3,669 3,729 4,096 4,185
Total primary government expenses 902,507 850,770 826,038 786,390 803,690
Program RevenuesGovernmental activities
Charges for services:General government 5,265 2,150 3,108 2,152 2,241 Public safety 6,132 9,119 1,772 2,472 1,739 Public works 9,289 7,464 10,378 10,770 10,089 Recreation and culture 139 92 194 95 537 Other 7,055 3,849 5,011 6,689 4,808
Operating grants and contributions 482,748 465,918 445,168 408,617 420,882 Capital grants and contributions 18,553 65,774 25,912 15,797 96,958
Total governmental activities program revenues 529,181 554,366 491,543 446,592 537,254
Fiscal Year
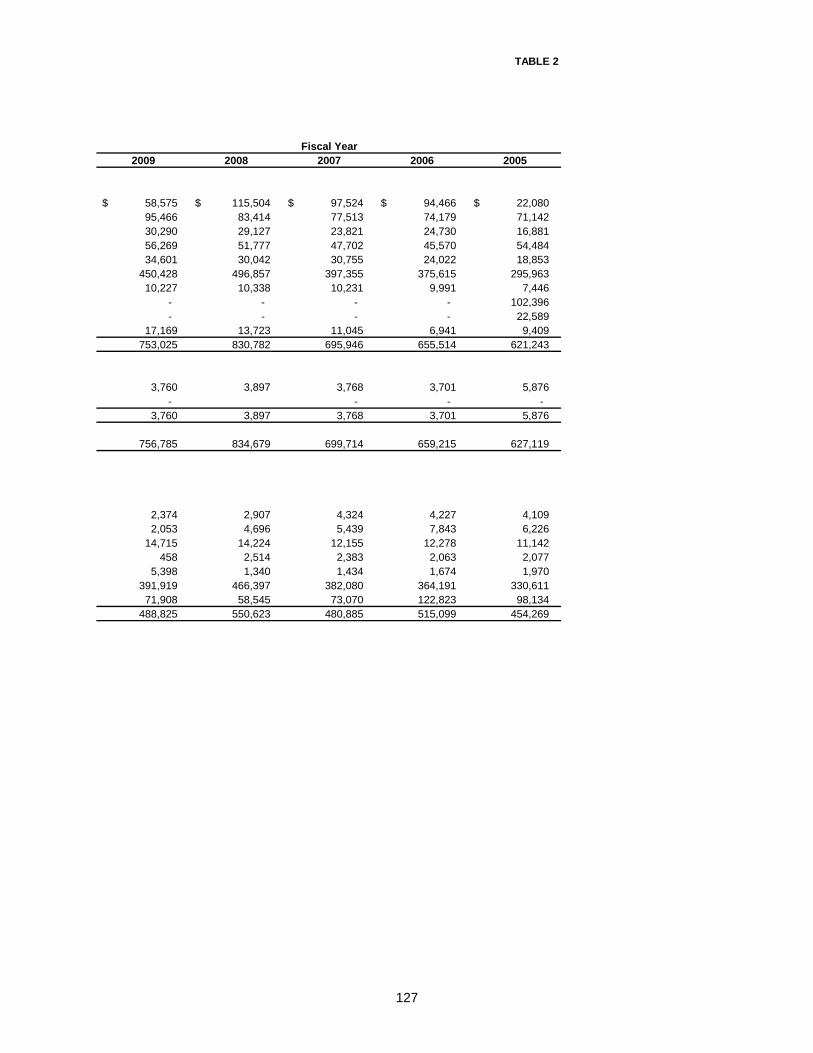
127
TABLE 2
2009 2008 2007 2006 2005
58,575 $ 115,504 $ 97,524 $ 94,466 $ 22,080 $ 95,466 83,414 77,513 74,179 71,142 30,290 29,127 23,821 24,730 16,881 56,269 51,777 47,702 45,570 54,484 34,601 30,042 30,755 24,022 18,853
450,428 496,857 397,355 375,615 295,963 10,227 10,338 10,231 9,991 7,446
- - - - 102,396 - - - - 22,589
17,169 13,723 11,045 6,941 9,409 753,025 830,782 695,946 655,514 621,243
3,760 3,897 3,768 3,701 5,876 - - - -
3,760 3,897 3,768 3,701 5,876
756,785 834,679 699,714 659,215 627,119
2,374 2,907 4,324 4,227 4,109 2,053 4,696 5,439 7,843 6,226
14,715 14,224 12,155 12,278 11,142 458 2,514 2,383 2,063 2,077
5,398 1,340 1,434 1,674 1,970 391,919 466,397 382,080 364,191 330,611 71,908 58,545 73,070 122,823 98,134
488,825 550,623 480,885 515,099 454,269
Fiscal Year
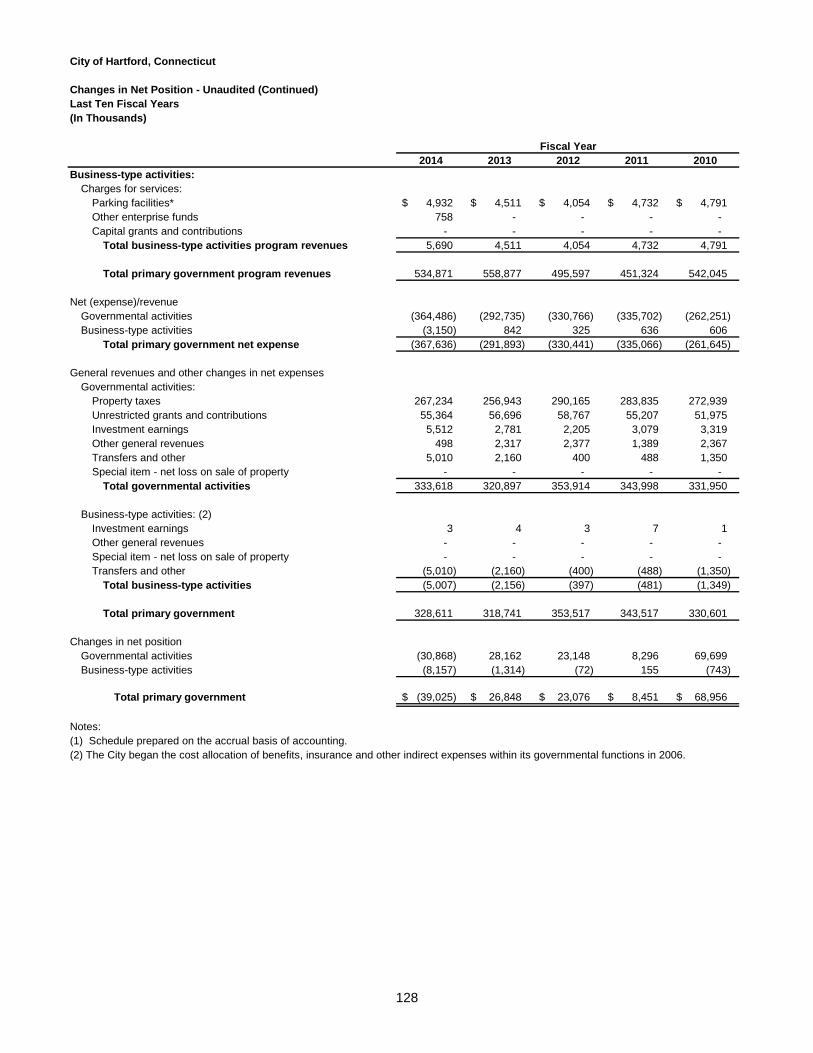
128
City of Hartford, Connecticut
Changes in Net Position - Unaudited (Continued)Last Ten Fiscal Years(In Thousands)
2014 2013 2012 2011 2010Business-type activities:
Charges for services:Parking facilities* 4,932 $ 4,511 $ 4,054 $ 4,732 $ 4,791 $ Other enterprise funds 758 - - - - Capital grants and contributions - - - - -
Total business-type activities program revenues 5,690 4,511 4,054 4,732 4,791
Total primary government program revenues 534,871 558,877 495,597 451,324 542,045
Net (expense)/revenueGovernmental activities (364,486) (292,735) (330,766) (335,702) (262,251) Business-type activities (3,150) 842 325 636 606
Total primary government net expense (367,636) (291,893) (330,441) (335,066) (261,645)
General revenues and other changes in net expensesGovernmental activities:
Property taxes 267,234 256,943 290,165 283,835 272,939 Unrestricted grants and contributions 55,364 56,696 58,767 55,207 51,975 Investment earnings 5,512 2,781 2,205 3,079 3,319 Other general revenues 498 2,317 2,377 1,389 2,367 Transfers and other 5,010 2,160 400 488 1,350 Special item - net loss on sale of property - - - - -
Total governmental activities 333,618 320,897 353,914 343,998 331,950
Business-type activities: (2)Investment earnings 3 4 3 7 1 Other general revenues - - - - - Special item - net loss on sale of property - - - - - Transfers and other (5,010) (2,160) (400) (488) (1,350)
Total business-type activities (5,007) (2,156) (397) (481) (1,349)
Total primary government 328,611 318,741 353,517 343,517 330,601
Changes in net positionGovernmental activities (30,868) 28,162 23,148 8,296 69,699 Business-type activities (8,157) (1,314) (72) 155 (743)
Total primary government (39,025) $ 26,848 $ 23,076 $ 8,451 $ 68,956 $
Notes:(1) Schedule prepared on the accrual basis of accounting.(2) The City began the cost allocation of benefits, insurance and other indirect expenses within its governmental functions in 2006.
Fiscal Year
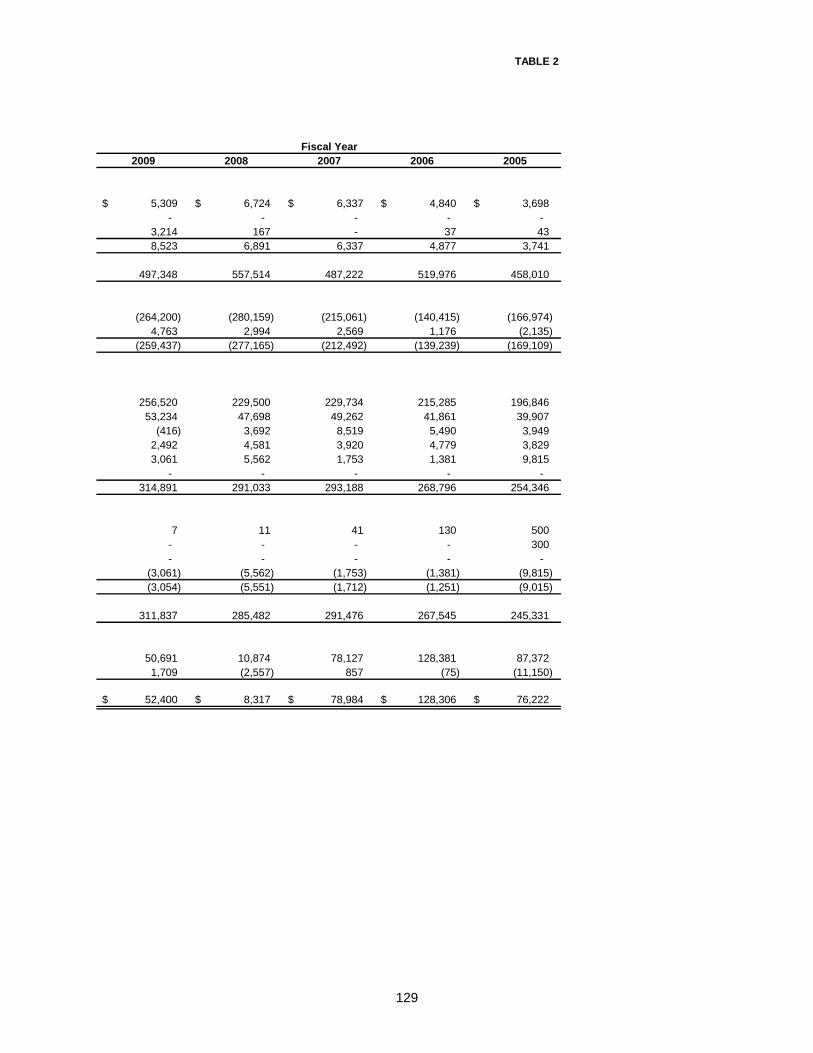
129
TABLE 2
2009 2008 2007 2006 2005
5,309 $ 6,724 $ 6,337 $ 4,840 $ 3,698 $ - - - - -
3,214 167 - 37 43 8,523 6,891 6,337 4,877 3,741
497,348 557,514 487,222 519,976 458,010
(264,200) (280,159) (215,061) (140,415) (166,974) 4,763 2,994 2,569 1,176 (2,135)
(259,437) (277,165) (212,492) (139,239) (169,109)
256,520 229,500 229,734 215,285 196,846 53,234 47,698 49,262 41,861 39,907
(416) 3,692 8,519 5,490 3,949 2,492 4,581 3,920 4,779 3,829 3,061 5,562 1,753 1,381 9,815
- - - - - 314,891 291,033 293,188 268,796 254,346
7 11 41 130 500 - - - - 300 - - - - -
(3,061) (5,562) (1,753) (1,381) (9,815) (3,054) (5,551) (1,712) (1,251) (9,015)
311,837 285,482 291,476 267,545 245,331
50,691 10,874 78,127 128,381 87,372 1,709 (2,557) 857 (75) (11,150)
52,400 $ 8,317 $ 78,984 $ 128,306 $ 76,222 $
Fiscal Year
130
City of Hartford, Connecticut
Fund Balances of Governmental Funds - UnauditedLast Ten Fiscal Years(In Thousands)
2014 2013 2012 2011 2010General fund
Nonspendable -$ -$ -$ -$ -$ Restricted - - - - - Committed - - - - - Assigned 3,859 2,850 4,332 2,525 - Unassigned 13,022 27,528 25,781 22,561 - Reserved - - - - 148 Unreserved - - - - 18,500
Total general fund 16,881 $ 30,378 $ 30,113 $ 25,086 $ 18,648 $
All other governmental fundsNonspendable 8,712 $ 8,772 $ 8,706 $ 18,583 $ -$ Restricted 159,398 171,251 31,782 22,004 - Committed 2,352 2,620 7,663 31,020 - Assigned 3,198 9,467 9,585 - - Unassigned (8,495) (14,379) (7,522) (202) - Reserved - - - - 89,367 Unreserved, reported in:
Debt service funds - - - - 146 Special revenue funds - - - - 12,258 Capital project funds - - - - (9,057)
Total all other governmental funds 165,165 $ 177,731 $ 50,214 $ 71,405 $ 92,714 $
Notes:(1) Schedule prepared on the modified accrual basis of accounting.(2) 2011 first year of fund balance presentation under GASB Statement No. 54.
Fiscal Year
131
TABLE 3
2009 2008 2007 2006 2005
-$ -$ -$ -$ -$ - - - - - - - - - - - - - - - - - - - - 95 - - 246 143
16,218 27,900 34,467 32,969 30,776
16,313 $ 27,900 $ 34,467 $ 33,215 $ 30,919 $
-$ -$ -$ -$ -$ - - - - - - - - - - - - - - - - - - - -
99,213 95,227 81,122 62,397 115,549
146 146 3,238 2,747 1,834 8,748 9,176 17,151 17,771 3,187
(4,404) 8,229 60,226 38,593 (36,609)
103,703 $ 112,778 $ 161,737 $ 121,508 $ 83,961 $
Fiscal Year
132
City of Hartford, Connecticut
Changes in Fund Balances of Governmental Funds - UnauditedLast Ten Fiscal Years(In Thousands)
2014 2013 2012 2011 2010Revenues:
Property taxes 256,765 $ 255,546 $ 277,245 $ 274,013 $ 266,990 $ Licenses, permits, and other charges 6,555 5,661 6,299 4,891 5,608 Intergovernmental revenues 539,420 571,249 509,770 475,622 556,756 Charges for services 17,827 14,538 9,427 10,742 8,777 Use of property 3,227 2,283 4,574 6,354 4,368 Investment income 5,512 2,781 2,204 3,079 3,319 Miscellaneous 15,293 15,927 15,867 13,860 17,449
Total revenues 844,599 867,985 825,386 788,561 863,267
Expenditures:General government 27,846 40,237 30,021 21,547 21,642 Public safety 96,695 85,448 83,308 84,283 79,799 Public works 12,329 15,882 21,804 15,282 20,119 Development and community affairs 60,155 60,544 62,798 60,501 61,857 Human services 28,569 26,702 29,315 27,878 31,256 Education 470,445 447,244 435,301 419,099 421,032 Recreation and culture 10,127 9,852 9,483 9,477 9,145 Benefits and insurance 86,898 66,941 64,501 65,160 55,791 Other 21,019 17,858 29,445 26,637 31,042 Capital outlay 76,279 125,790 92,879 68,018 119,275 Debt Service:
Principal 27,775 27,775 25,100 22,723 20,536 Interest 26,543 17,470 14,547 15,471 16,627
Total expenditures 944,680 941,743 898,502 836,076 888,121
Excess of revenues over (under) expenditures (100,081) (73,758) (73,116) (47,515) (24,854)
Other Financing Sources (Uses)Transfers in 38,972 48,277 44,203 43,780 52,233 Transfers out (33,962) (46,117) (43,803) (43,292) (50,883) Bonds issued 10,250 48,160 71,280 25,000 14,000 Capital leases 2,758 3,990 - - - Bond premium 22,625 7,765 304 1,796 Refunding bonds issued - 124,605 - - 12,150 Payment to refunding bond escrow agent - - (22,493) - (13,244) Section 108 loans and CWF serial notes - - - 7,000 - BANS 56,000 - - - -
Total other financing sources (uses) 74,018 201,540 56,952 32,792 16,052
Net change in fund balances (26,063) 127,782 (16,164) (14,723) (8,802)
Fund Balances, beginning of year 208,109 80,327 96,491 111,214 120,016
Fund Balances, end of year 182,046 $ 208,109 $ 80,327 $ 96,491 $ 111,214 $
Debt Service as a Percentage of Noncapital Expenditures 6.10% 5.83% 4.94% 5.40% 5.40%
Notes:(1) Schedule prepared on the modified accrual basis of accounting.
Fiscal Year
133
TABLE 4
2009 2008 2007 2006 2005
250,668 $ 232,955 $ 231,638 $ 208,241 $ 197,028 $ 8,155 9,850 8,594 10,058 9,681
505,062 567,464 503,669 523,276 454,432 9,353 7,531 8,184 9,734 8,322 4,196 4,294 4,314 4,085 3,925 (416) 3,653 8,452 5,413 3,889
16,733 18,347 15,120 18,805 19,224 793,751 844,094 779,971 779,612 696,501
23,739 25,776 20,487 16,266 14,737 80,388 79,424 77,898 74,519 69,671 17,712 14,998 15,820 15,362 16,729 54,857 52,876 53,441 52,020 63,369 33,786 29,879 30,581 23,867 18,824
400,535 479,031 391,131 368,936 286,985 9,234 9,636 9,401 8,014 6,832
57,985 57,012 54,754 47,348 100,797 28,955 28,122 28,755 26,709 22,589
113,021 101,332 106,647 163,076 136,903
24,590 19,838 16,810 15,901 14,150 15,954 13,063 9,965 9,020 6,037
860,756 910,987 815,690 821,038 757,623
(67,005) (66,893) (35,719) (41,426) (61,122)
56,633 55,761 53,222 40,069 54,881 (53,572) (50,199) (51,469) (36,239) (45,066) 40,225 - 70,000 70,000 66,300 1,700 3,883 3,164 4,526 2,822 1,357 - 2,283 2,913 3,093
- - - - 29,510 - - - - (32,866) - 1,922 - - 1,468 - - - - -
46,343 11,367 77,200 81,269 80,142
(20,662) (55,526) 41,481 39,843 19,020
140,678 196,204 154,723 114,880 95,860
120,016 $ 140,678 $ 196,204 $ 154,723 $ 114,880 $
5.40% 4.06% 3.79% 3.79% 3.25%
Fiscal Year
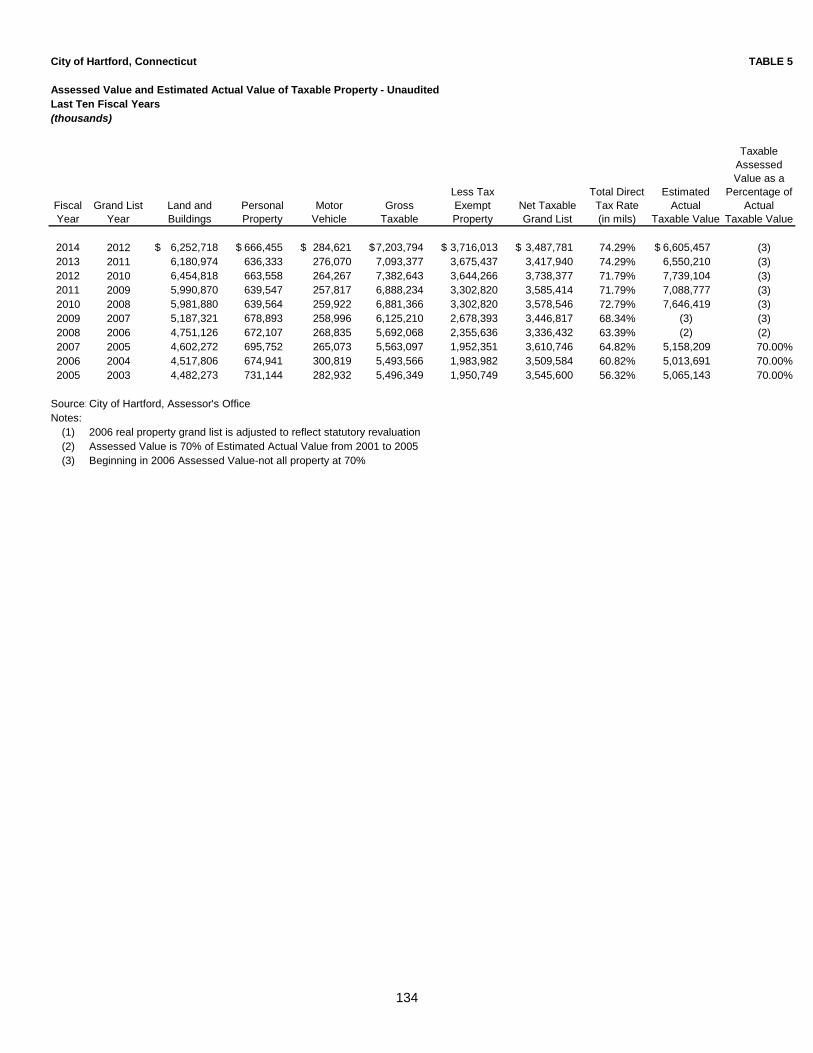
134
City of Hartford, Connecticut TABLE 5
Assessed Value and Estimated Actual Value of Taxable Property - UnauditedLast Ten Fiscal Years(thousands)
Fiscal Year
Grand List Year
Land and Buildings
Personal Property
Motor Vehicle
Gross Taxable
Less Tax Exempt Property
Net Taxable Grand List
Total Direct Tax Rate (in mils)
Estimated Actual
Taxable Value
Taxable Assessed Value as a
Percentage of Actual
Taxable Value
2014 2012 6,252,718 $ 666,455 $ 284,621 $ 7,203,794 $ 3,716,013 $ 3,487,781 $ 74.29% 6,605,457 $ (3)2013 2011 6,180,974 636,333 276,070 7,093,377 3,675,437 3,417,940 74.29% 6,550,210 (3)2012 2010 6,454,818 663,558 264,267 7,382,643 3,644,266 3,738,377 71.79% 7,739,104 (3)2011 2009 5,990,870 639,547 257,817 6,888,234 3,302,820 3,585,414 71.79% 7,088,777 (3)2010 2008 5,981,880 639,564 259,922 6,881,366 3,302,820 3,578,546 72.79% 7,646,419 (3)2009 2007 5,187,321 678,893 258,996 6,125,210 2,678,393 3,446,817 68.34% (3) (3)2008 2006 4,751,126 672,107 268,835 5,692,068 2,355,636 3,336,432 63.39% (2) (2)2007 2005 4,602,272 695,752 265,073 5,563,097 1,952,351 3,610,746 64.82% 5,158,209 70.00%2006 2004 4,517,806 674,941 300,819 5,493,566 1,983,982 3,509,584 60.82% 5,013,691 70.00%2005 2003 4,482,273 731,144 282,932 5,496,349 1,950,749 3,545,600 56.32% 5,065,143 70.00%
Source: City of Hartford, Assessor's OfficeNotes:
(1) 2006 real property grand list is adjusted to reflect statutory revaluation(2) Assessed Value is 70% of Estimated Actual Value from 2001 to 2005(3) Beginning in 2006 Assessed Value-not all property at 70%
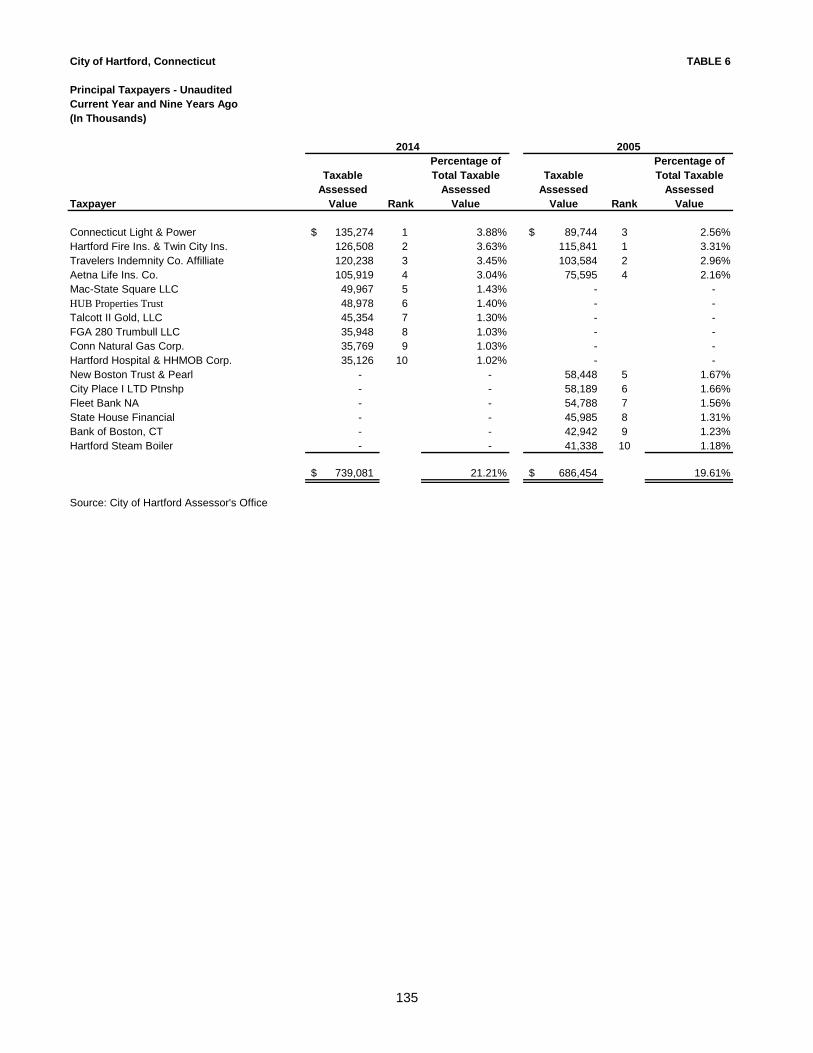
135
City of Hartford, Connecticut TABLE 6
Principal Taxpayers - UnauditedCurrent Year and Nine Years Ago(In Thousands)
Percentage of Percentage ofTaxable Total Taxable Taxable Total Taxable
Assessed Assessed Assessed AssessedTaxpayer Value Rank Value Value Rank Value
Connecticut Light & Power 135,274$ 1 3.88% 89,744$ 3 2.56%Hartford Fire Ins. & Twin City Ins. 126,508 2 3.63% 115,841 1 3.31%Travelers Indemnity Co. Affilliate 120,238 3 3.45% 103,584 2 2.96%Aetna Life Ins. Co. 105,919 4 3.04% 75,595 4 2.16%Mac-State Square LLC 49,967 5 1.43% - - HUB Properties Trust 48,978 6 1.40% - - Talcott II Gold, LLC 45,354 7 1.30% - - FGA 280 Trumbull LLC 35,948 8 1.03% - - Conn Natural Gas Corp. 35,769 9 1.03% - - Hartford Hospital & HHMOB Corp. 35,126 10 1.02% - - New Boston Trust & Pearl - - 58,448 5 1.67%City Place I LTD Ptnshp - - 58,189 6 1.66%Fleet Bank NA - - 54,788 7 1.56%State House Financial - - 45,985 8 1.31%Bank of Boston, CT - - 42,942 9 1.23%Hartford Steam Boiler - - 41,338 10 1.18%
739,081$ 21.21% 686,454$ 19.61%
Source: City of Hartford Assessor's Office
2014 2005
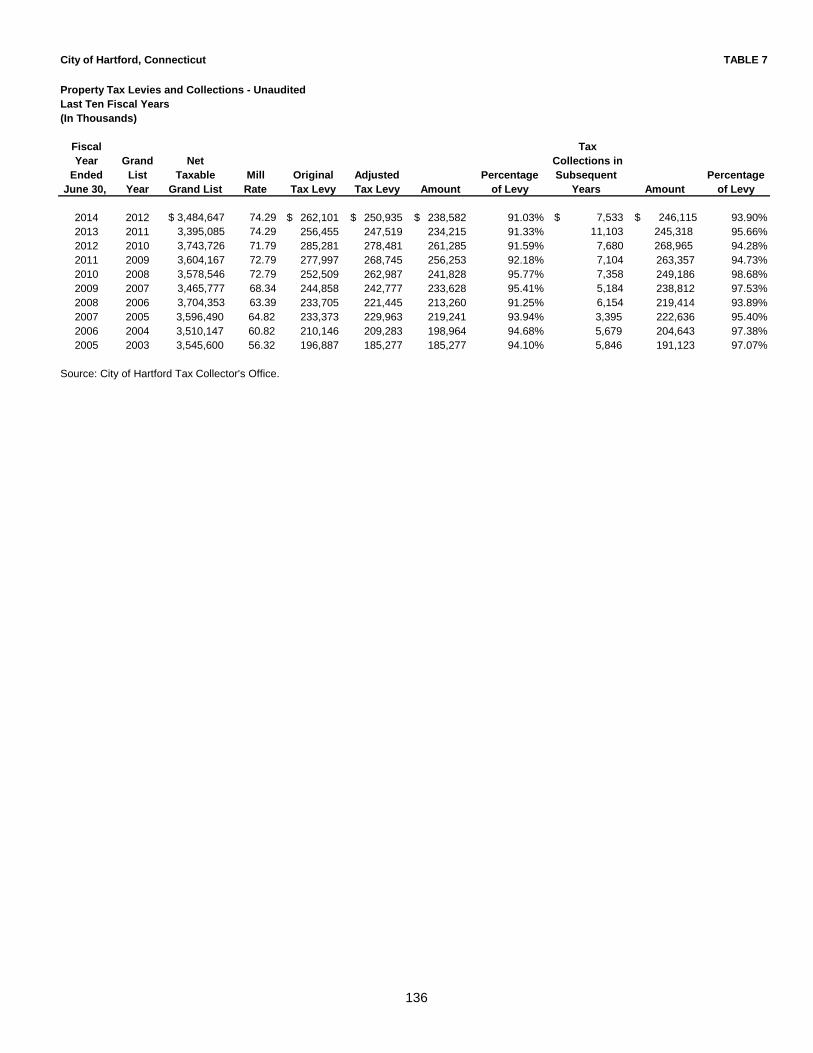
136
TABLE 7
Last Ten Fiscal Years(In Thousands)
Fiscal TaxYear Grand Net Collections in
Ended List Taxable Mill Original Adjusted Percentage Subsequent PercentageJune 30, Year Grand List Rate Tax Levy Tax Levy Amount of Levy Years Amount of Levy
2014 2012 $ 3,484,647 74.29 262,101$ 250,935$ 238,582$ 91.03% $ 7,533 $ 246,115 93.90%2013 2011 3,395,085 74.29 256,455 247,519 234,215 91.33% 11,103 245,318 95.66%2012 2010 3,743,726 71.79 285,281 278,481 261,285 91.59% 7,680 268,965 94.28%2011 2009 3,604,167 72.79 277,997 268,745 256,253 92.18% 7,104 263,357 94.73%2010 2008 3,578,546 72.79 252,509 262,987 241,828 95.77% 7,358 249,186 98.68%2009 2007 3,465,777 68.34 244,858 242,777 233,628 95.41% 5,184 238,812 97.53%2008 2006 3,704,353 63.39 233,705 221,445 213,260 91.25% 6,154 219,414 93.89%2007 2005 3,596,490 64.82 233,373 229,963 219,241 93.94% 3,395 222,636 95.40%2006 2004 3,510,147 60.82 210,146 209,283 198,964 94.68% 5,679 204,643 97.38%2005 2003 3,545,600 56.32 196,887 185,277 185,277 94.10% 5,846 191,123 97.07%
Source: City of Hartford Tax Collector's Office.
City of Hartford, Connecticut
Property Tax Levies and Collections - Unaudited
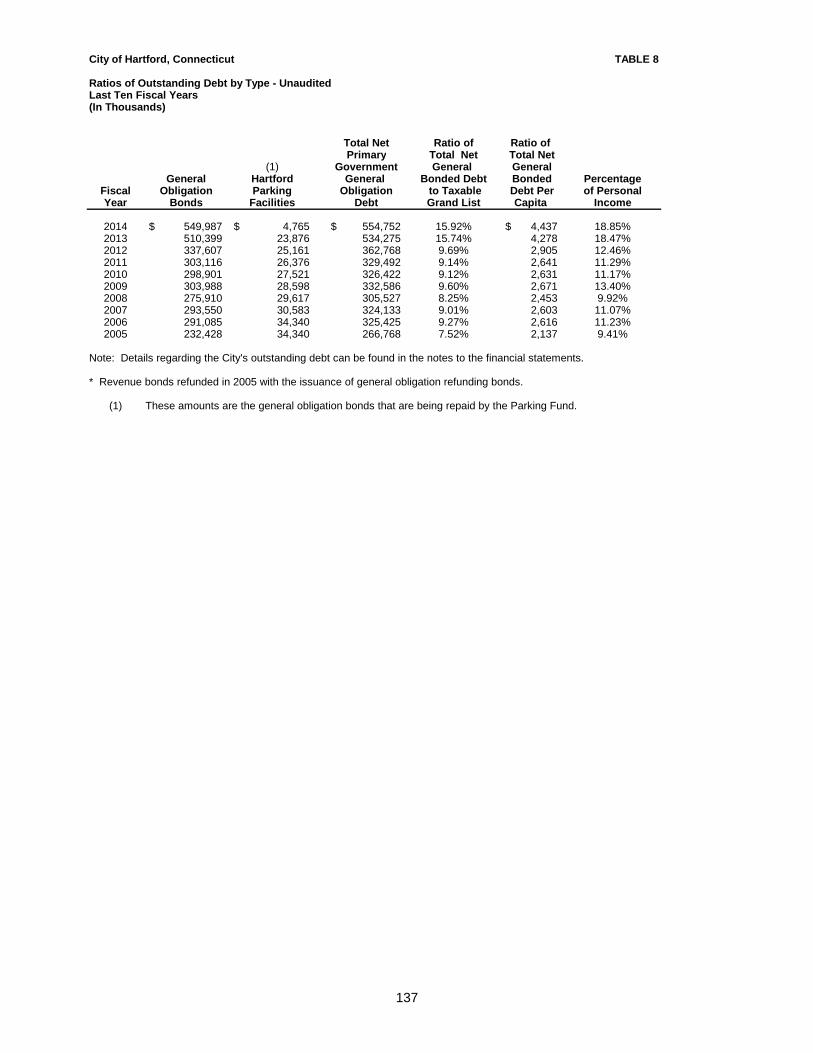
137
City of Hartford, Connecticut TABLE 8
Ratios of Outstanding Debt by Type - UnauditedLast Ten Fiscal Years(In Thousands)
Total Net Ratio of Ratio of Primary Total Net Total Net
(1) Government General GeneralGeneral Hartford General Bonded Debt Bonded Percentage
Fiscal Obligation Parking Obligation to Taxable Debt Per of PersonalYear Bonds Facilities Debt Grand List Capita Income
2014 549,987$ 4,765$ 554,752$ 15.92% 4,437$ 18.85%2013 510,399 23,876 534,275 15.74% 4,278 18.47%2012 337,607 25,161 362,768 9.69% 2,905 12.46%2011 303,116 26,376 329,492 9.14% 2,641 11.29%2010 298,901 27,521 326,422 9.12% 2,631 11.17%2009 303,988 28,598 332,586 9.60% 2,671 13.40%2008 275,910 29,617 305,527 8.25% 2,453 9.92%2007 293,550 30,583 324,133 9.01% 2,603 11.07%2006 291,085 34,340 325,425 9.27% 2,616 11.23%2005 232,428 34,340 266,768 7.52% 2,137 9.41%
Note: Details regarding the City's outstanding debt can be found in the notes to the financial statements.
* Revenue bonds refunded in 2005 with the issuance of general obligation refunding bonds.
(1) These amounts are the general obligation bonds that are being repaid by the Parking Fund.
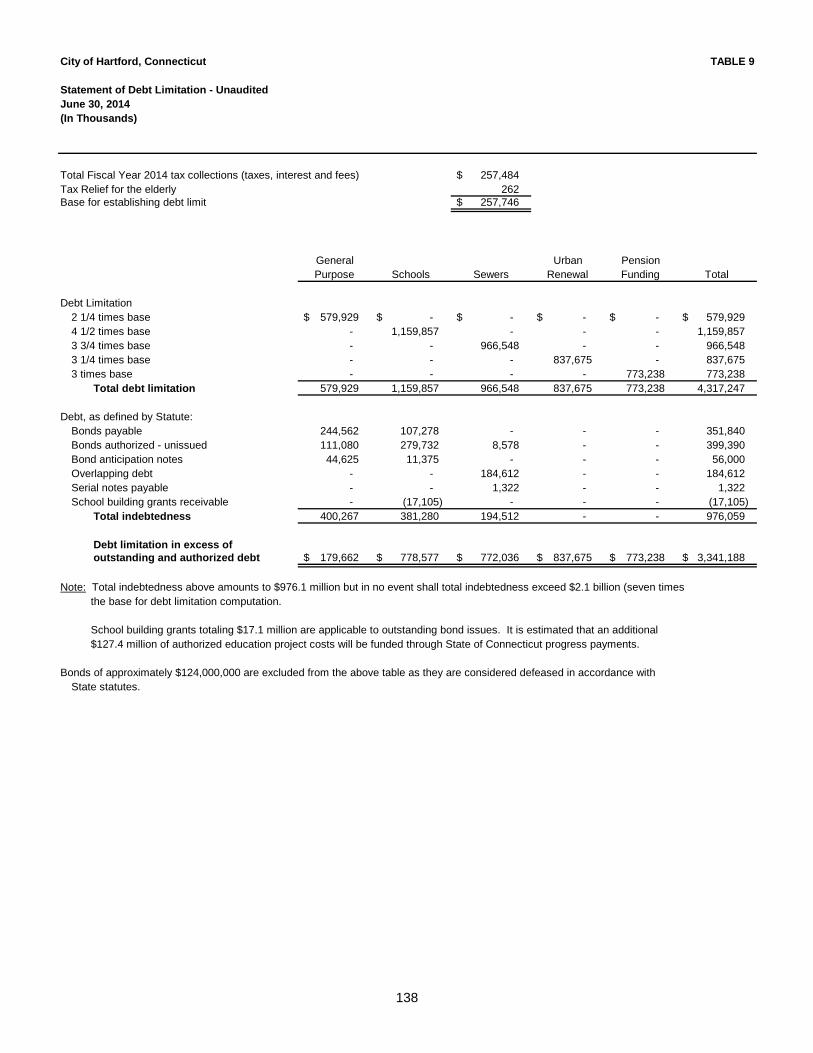
138
City of Hartford, Connecticut TABLE 9
Statement of Debt Limitation - UnauditedJune 30, 2014(In Thousands)
Total Fiscal Year 2014 tax collections (taxes, interest and fees) 257,484 $ Tax Relief for the elderly 262 Base for establishing debt limit 257,746 $
General Urban PensionPurpose Schools Sewers Renewal Funding Total
Debt Limitation2 1/4 times base 579,929 $ -$ -$ -$ -$ 579,929 $ 4 1/2 times base - 1,159,857 - - - 1,159,857 3 3/4 times base - - 966,548 - - 966,548 3 1/4 times base - - - 837,675 - 837,675 3 times base - - - - 773,238 773,238
Total debt limitation 579,929 1,159,857 966,548 837,675 773,238 4,317,247
Debt, as defined by Statute:Bonds payable 244,562 107,278 - - - 351,840 Bonds authorized - unissued 111,080 279,732 8,578 - - 399,390 Bond anticipation notes 44,625 11,375 - - - 56,000 Overlapping debt - - 184,612 - - 184,612 Serial notes payable - - 1,322 - - 1,322 School building grants receivable - (17,105) - - - (17,105)
Total indebtedness 400,267 381,280 194,512 - - 976,059
Debt limitation in excess of outstanding and authorized debt 179,662 $ 778,577 $ 772,036 $ 837,675 $ 773,238 $ 3,341,188 $
Note: Total indebtedness above amounts to $976.1 million but in no event shall total indebtedness exceed $2.1 billion (seven times the base for debt limitation computation.
School building grants totaling $17.1 million are applicable to outstanding bond issues. It is estimated that an additional $127.4 million of authorized education project costs will be funded through State of Connecticut progress payments.
Bonds of approximately $124,000,000 are excluded from the above table as they are considered defeased in accordance with State statutes.
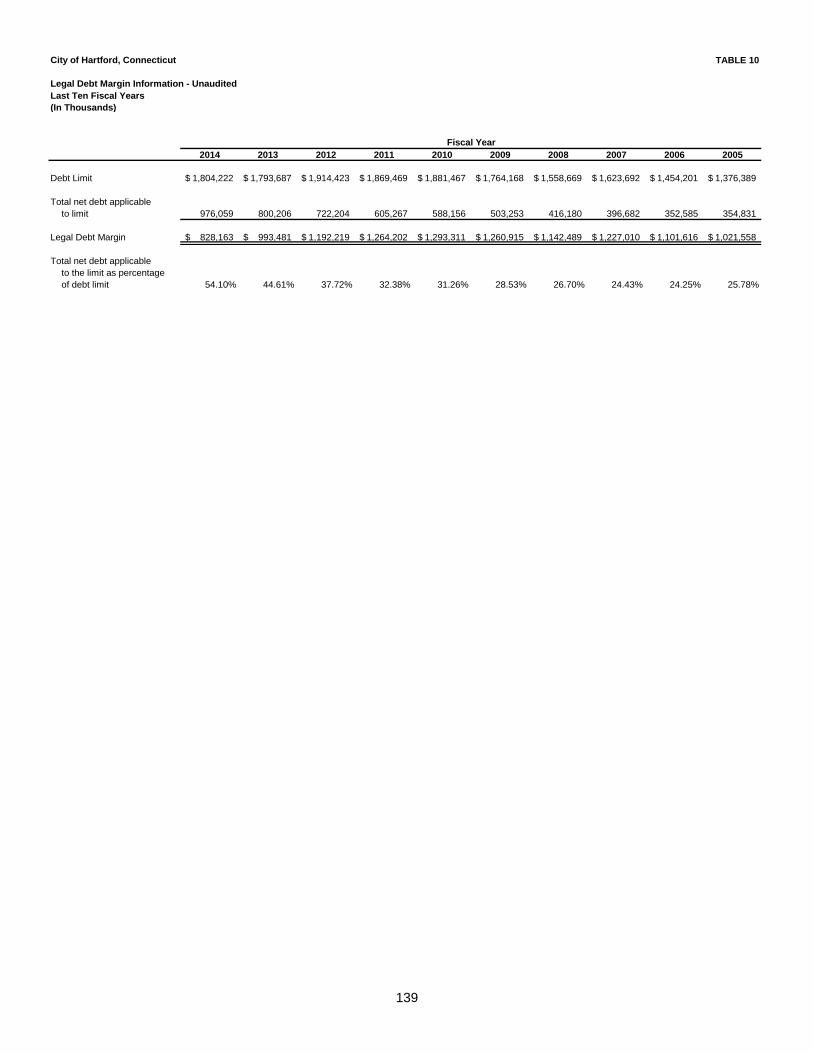
139
TABLE 10
Last Ten Fiscal Years(In Thousands)
2014 2013 2012 2011 2010 2009 2008 2007 2006 2005
Debt Limit 1,804,222$ 1,793,687$ 1,914,423$ 1,869,469$ 1,881,467$ 1,764,168$ 1,558,669$ 1,623,692$ 1,454,201$ 1,376,389$
Total net debt applicableto limit 976,059 800,206 722,204 605,267 588,156 503,253 416,180 396,682 352,585 354,831
Legal Debt Margin 828,163$ 993,481$ 1,192,219$ 1,264,202$ 1,293,311$ 1,260,915$ 1,142,489$ 1,227,010$ 1,101,616$ 1,021,558$
Total net debt applicableto the limit as percentageof debt limit 54.10% 44.61% 37.72% 32.38% 31.26% 28.53% 26.70% 24.43% 24.25% 25.78%
Fiscal Year
City of Hartford, Connecticut
Legal Debt Margin Information - Unaudited
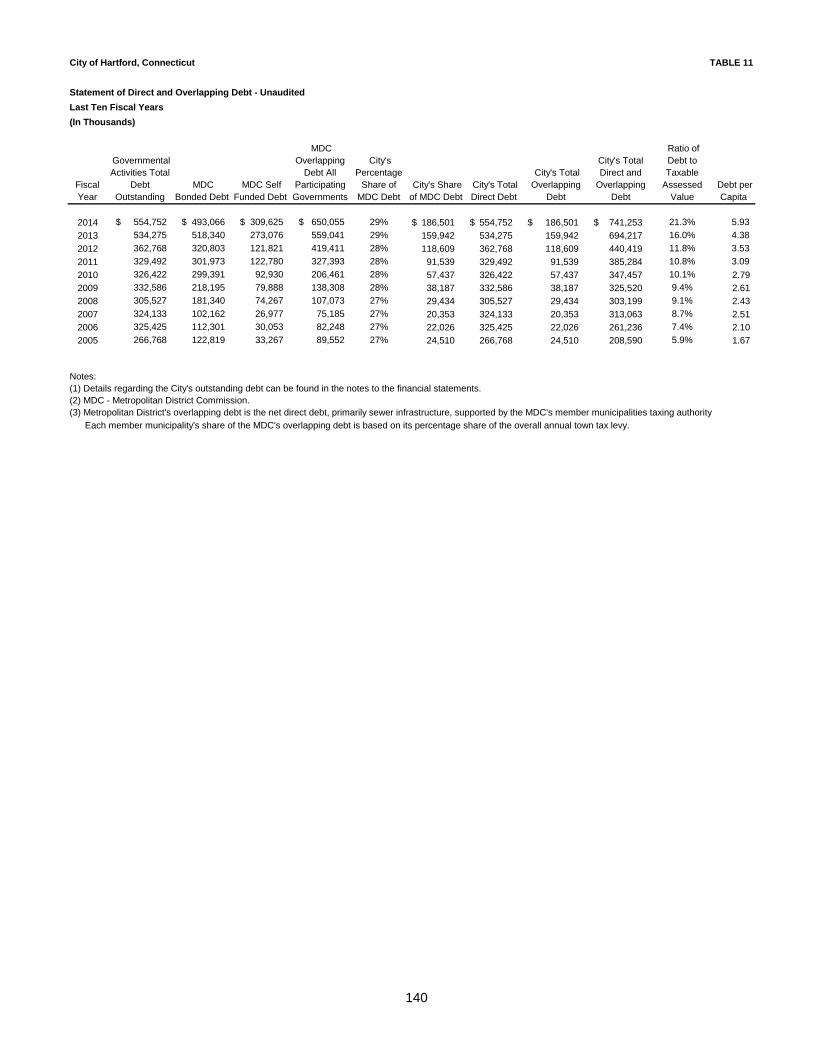
140
TABLE 11
Statement of Direct and Overlapping Debt - Unaudited
Last Ten Fiscal Years
(In Thousands)
Fiscal Year
Governmental Activities Total
Debt Outstanding
MDC Bonded Debt
MDC Self Funded Debt
MDC Overlapping
Debt All Participating Governments
City's Percentage
Share of MDC Debt
City's Share of MDC Debt
City's Total Direct Debt
City's Total Overlapping
Debt
City's Total Direct and
Overlapping Debt
Ratio of Debt to Taxable
Assessed Value
Debt per Capita
2014 $ 554,752 $ 493,066 $ 309,625 $ 650,055 29% 186,501 $ 554,752 $ 186,501 $ 741,253 $ 21.3% 5.93
2013 534,275 518,340 273,076 559,041 29% 159,942 534,275 159,942 694,217 16.0% 4.38
2012 362,768 320,803 121,821 419,411 28% 118,609 362,768 118,609 440,419 11.8% 3.53
2011 329,492 301,973 122,780 327,393 28% 91,539 329,492 91,539 385,284 10.8% 3.09
2010 326,422 299,391 92,930 206,461 28% 57,437 326,422 57,437 347,457 10.1% 2.79
2009 332,586 218,195 79,888 138,308 28% 38,187 332,586 38,187 325,520 9.4% 2.61
2008 305,527 181,340 74,267 107,073 27% 29,434 305,527 29,434 303,199 9.1% 2.43
2007 324,133 102,162 26,977 75,185 27% 20,353 324,133 20,353 313,063 8.7% 2.51
2006 325,425 112,301 30,053 82,248 27% 22,026 325,425 22,026 261,236 7.4% 2.10
2005 266,768 122,819 33,267 89,552 27% 24,510 266,768 24,510 208,590 5.9% 1.67
Notes:(1) Details regarding the City's outstanding debt can be found in the notes to the financial statements.(2) MDC - Metropolitan District Commission.(3) Metropolitan District's overlapping debt is the net direct debt, primarily sewer infrastructure, supported by the MDC's member municipalities taxing authority Each member municipality's share of the MDC's overlapping debt is based on its percentage share of the overall annual town tax levy.
City of Hartford, Connecticut
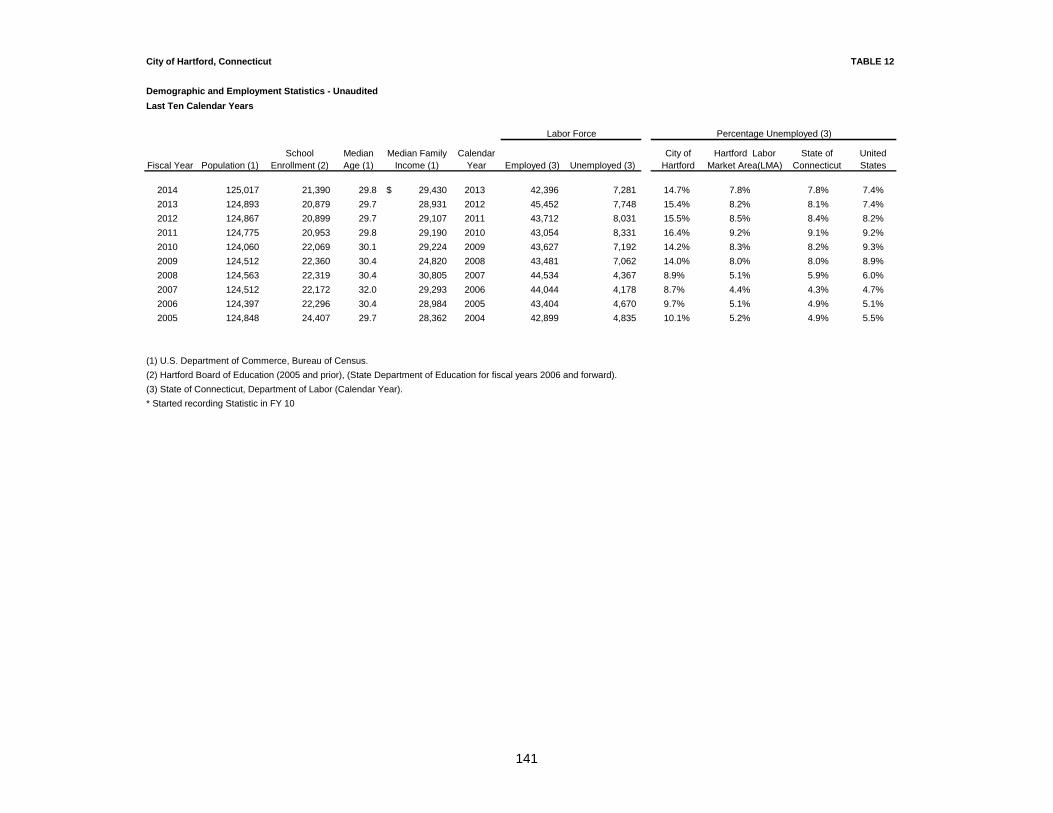
141
TABLE 12
Last Ten Calendar Years
Fiscal Year Population (1)School
Enrollment (2)Median Age (1)
Median Family Income (1)
Calendar Year Employed (3) Unemployed (3)
City of Hartford
Hartford Labor Market Area(LMA)
State of Connecticut
United States
2014 125,017 21,390 29.8 29,430$ 2013 42,396 7,281 14.7% 7.8% 7.8% 7.4%
2013 124,893 20,879 29.7 28,931 2012 45,452 7,748 15.4% 8.2% 8.1% 7.4%
2012 124,867 20,899 29.7 29,107 2011 43,712 8,031 15.5% 8.5% 8.4% 8.2%
2011 124,775 20,953 29.8 29,190 2010 43,054 8,331 16.4% 9.2% 9.1% 9.2%
2010 124,060 22,069 30.1 29,224 2009 43,627 7,192 14.2% 8.3% 8.2% 9.3%
2009 124,512 22,360 30.4 24,820 2008 43,481 7,062 14.0% 8.0% 8.0% 8.9%
2008 124,563 22,319 30.4 30,805 2007 44,534 4,367 8.9% 5.1% 5.9% 6.0%
2007 124,512 22,172 32.0 29,293 2006 44,044 4,178 8.7% 4.4% 4.3% 4.7%
2006 124,397 22,296 30.4 28,984 2005 43,404 4,670 9.7% 5.1% 4.9% 5.1%
2005 124,848 24,407 29.7 28,362 2004 42,899 4,835 10.1% 5.2% 4.9% 5.5%
(1) U.S. Department of Commerce, Bureau of Census.
(2) Hartford Board of Education (2005 and prior), (State Department of Education for fiscal years 2006 and forward).
(3) State of Connecticut, Department of Labor (Calendar Year).
* Started recording Statistic in FY 10
Labor Force Percentage Unemployed (3)
City of Hartford, Connecticut
Demographic and Employment Statistics - Unaudited
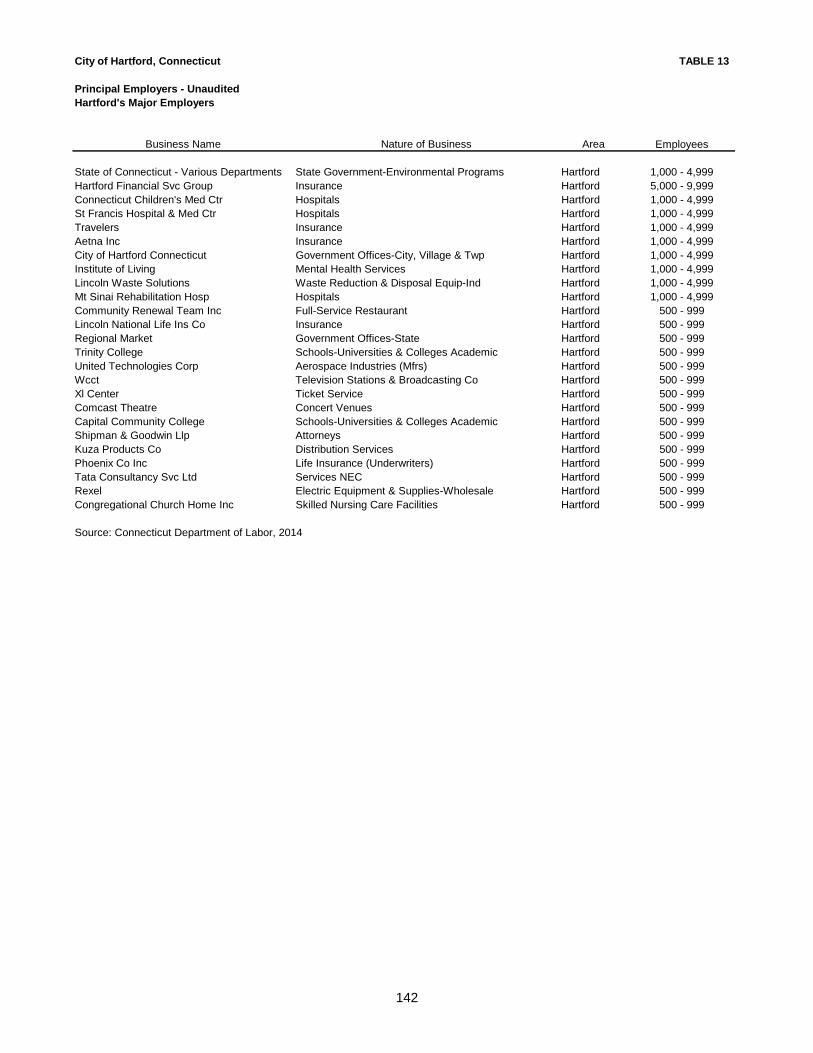
142
City of Hartford, Connecticut TABLE 13
Principal Employers - UnauditedHartford's Major Employers
Business Name Nature of Business Area Employees
State of Connecticut - Various Departments State Government-Environmental Programs Hartford 1,000 - 4,999Hartford Financial Svc Group Insurance Hartford 5,000 - 9,999Connecticut Children's Med Ctr Hospitals Hartford 1,000 - 4,999St Francis Hospital & Med Ctr Hospitals Hartford 1,000 - 4,999Travelers Insurance Hartford 1,000 - 4,999Aetna Inc Insurance Hartford 1,000 - 4,999City of Hartford Connecticut Government Offices-City, Village & Twp Hartford 1,000 - 4,999Institute of Living Mental Health Services Hartford 1,000 - 4,999Lincoln Waste Solutions Waste Reduction & Disposal Equip-Ind Hartford 1,000 - 4,999Mt Sinai Rehabilitation Hosp Hospitals Hartford 1,000 - 4,999Community Renewal Team Inc Full-Service Restaurant Hartford 500 - 999Lincoln National Life Ins Co Insurance Hartford 500 - 999Regional Market Government Offices-State Hartford 500 - 999Trinity College Schools-Universities & Colleges Academic Hartford 500 - 999United Technologies Corp Aerospace Industries (Mfrs) Hartford 500 - 999Wcct Television Stations & Broadcasting Co Hartford 500 - 999Xl Center Ticket Service Hartford 500 - 999Comcast Theatre Concert Venues Hartford 500 - 999Capital Community College Schools-Universities & Colleges Academic Hartford 500 - 999Shipman & Goodwin Llp Attorneys Hartford 500 - 999Kuza Products Co Distribution Services Hartford 500 - 999Phoenix Co Inc Life Insurance (Underwriters) Hartford 500 - 999Tata Consultancy Svc Ltd Services NEC Hartford 500 - 999Rexel Electric Equipment & Supplies-Wholesale Hartford 500 - 999Congregational Church Home Inc Skilled Nursing Care Facilities Hartford 500 - 999
Source: Connecticut Department of Labor, 2014
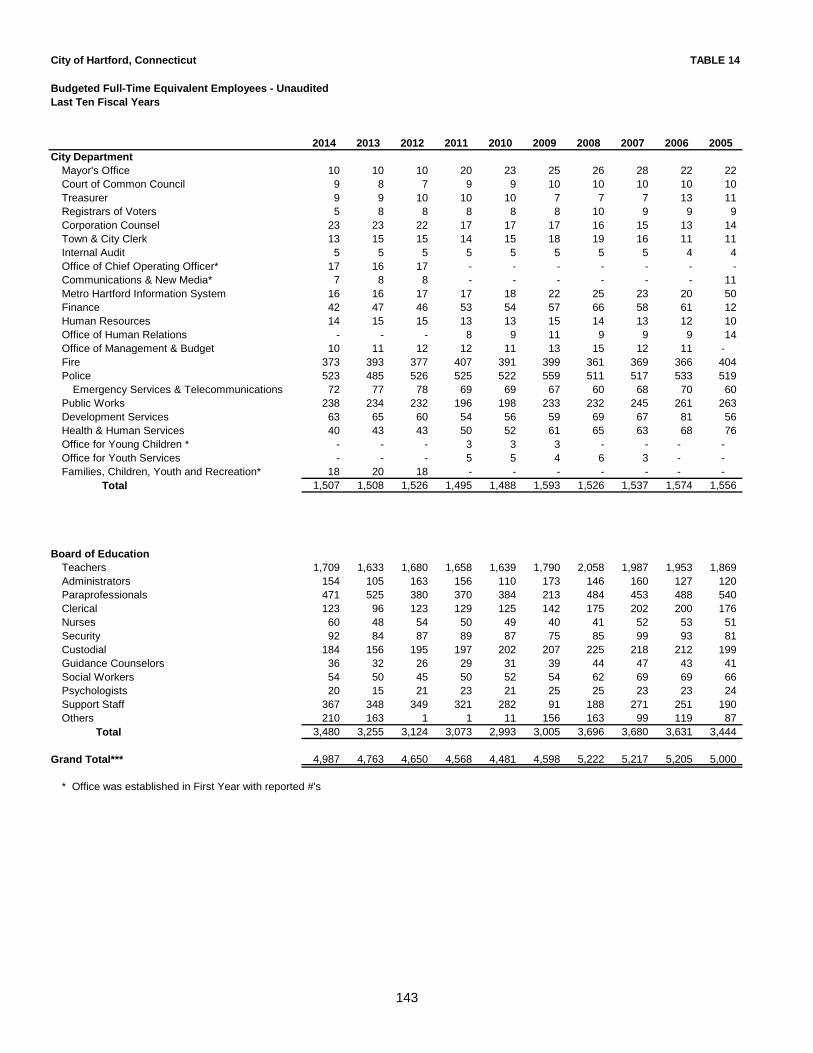
143
City of Hartford, Connecticut TABLE 14
Last Ten Fiscal Years
2014 2013 2012 2011 2010 2009 2008 2007 2006 2005City Department
Mayor's Office 10 10 10 20 23 25 26 28 22 22 Court of Common Council 9 8 7 9 9 10 10 10 10 10 Treasurer 9 9 10 10 10 7 7 7 13 11 Registrars of Voters 5 8 8 8 8 8 10 9 9 9 Corporation Counsel 23 23 22 17 17 17 16 15 13 14 Town & City Clerk 13 15 15 14 15 18 19 16 11 11 Internal Audit 5 5 5 5 5 5 5 5 4 4 Office of Chief Operating Officer* 17 16 17 - - - - - - - Communications & New Media* 7 8 8 - - - - - - 11 Metro Hartford Information System 16 16 17 17 18 22 25 23 20 50 Finance 42 47 46 53 54 57 66 58 61 12 Human Resources 14 15 15 13 13 15 14 13 12 10 Office of Human Relations - - - 8 9 11 9 9 9 14 Office of Management & Budget 10 11 12 12 11 13 15 12 11 - Fire 373 393 377 407 391 399 361 369 366 404 Police 523 485 526 525 522 559 511 517 533 519
Emergency Services & Telecommunications 72 77 78 69 69 67 60 68 70 60 Public Works 238 234 232 196 198 233 232 245 261 263 Development Services 63 65 60 54 56 59 69 67 81 56 Health & Human Services 40 43 43 50 52 61 65 63 68 76 Office for Young Children * - - - 3 3 3 - - - - Office for Youth Services - - - 5 5 4 6 3 - - Families, Children, Youth and Recreation* 18 20 18 - - - - - - -
Total 1,507 1,508 1,526 1,495 1,488 1,593 1,526 1,537 1,574 1,556
Board of EducationTeachers 1,709 1,633 1,680 1,658 1,639 1,790 2,058 1,987 1,953 1,869 Administrators 154 105 163 156 110 173 146 160 127 120 Paraprofessionals 471 525 380 370 384 213 484 453 488 540 Clerical 123 96 123 129 125 142 175 202 200 176 Nurses 60 48 54 50 49 40 41 52 53 51 Security 92 84 87 89 87 75 85 99 93 81 Custodial 184 156 195 197 202 207 225 218 212 199 Guidance Counselors 36 32 26 29 31 39 44 47 43 41 Social Workers 54 50 45 50 52 54 62 69 69 66 Psychologists 20 15 21 23 21 25 25 23 23 24 Support Staff 367 348 349 321 282 91 188 271 251 190 Others 210 163 1 1 11 156 163 99 119 87
Total 3,480 3,255 3,124 3,073 2,993 3,005 3,696 3,680 3,631 3,444
Grand Total*** 4,987 4,763 4,650 4,568 4,481 4,598 5,222 5,217 5,205 5,000
* Office was established in First Year with reported #'s
Budgeted Full-Time Equivalent Employees - Unaudited
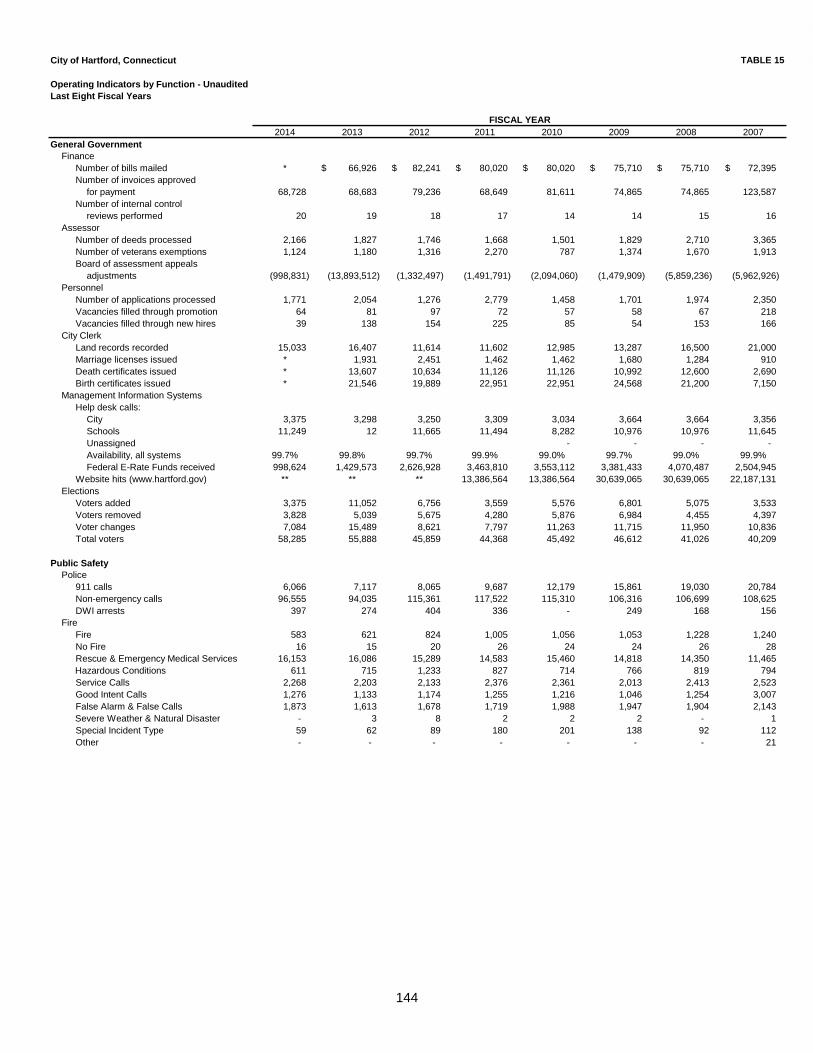
144
City of Hartford, Connecticut TABLE 15
Last Eight Fiscal Years
2014 2013 2012 2011 2010 2009 2008 2007General Government
FinanceNumber of bills mailed * 66,926 $ 82,241 $ 80,020 $ 80,020 $ 75,710 $ 75,710 $ 72,395 $ Number of invoices approved
for payment 68,728 68,683 79,236 68,649 81,611 74,865 74,865 123,587 Number of internal control
reviews performed 20 19 18 17 14 14 15 16 Assessor
Number of deeds processed 2,166 1,827 1,746 1,668 1,501 1,829 2,710 3,365 Number of veterans exemptions 1,124 1,180 1,316 2,270 787 1,374 1,670 1,913 Board of assessment appeals
adjustments (998,831) (13,893,512) (1,332,497) (1,491,791) (2,094,060) (1,479,909) (5,859,236) (5,962,926) Personnel
Number of applications processed 1,771 2,054 1,276 2,779 1,458 1,701 1,974 2,350 Vacancies filled through promotion 64 81 97 72 57 58 67 218 Vacancies filled through new hires 39 138 154 225 85 54 153 166
City ClerkLand records recorded 15,033 16,407 11,614 11,602 12,985 13,287 16,500 21,000 Marriage licenses issued * 1,931 2,451 1,462 1,462 1,680 1,284 910 Death certificates issued * 13,607 10,634 11,126 11,126 10,992 12,600 2,690 Birth certificates issued * 21,546 19,889 22,951 22,951 24,568 21,200 7,150
Management Information SystemsHelp desk calls:
City 3,375 3,298 3,250 3,309 3,034 3,664 3,664 3,356 Schools 11,249 12 11,665 11,494 8,282 10,976 10,976 11,645 Unassigned - - - - Availability, all systems 99.7% 99.8% 99.7% 99.9% 99.0% 99.7% 99.0% 99.9%Federal E-Rate Funds received 998,624 1,429,573 2,626,928 3,463,810 3,553,112 3,381,433 4,070,487 2,504,945
Website hits (www.hartford.gov) ** ** ** 13,386,564 13,386,564 30,639,065 30,639,065 22,187,131 Elections
Voters added 3,375 11,052 6,756 3,559 5,576 6,801 5,075 3,533 Voters removed 3,828 5,039 5,675 4,280 5,876 6,984 4,455 4,397 Voter changes 7,084 15,489 8,621 7,797 11,263 11,715 11,950 10,836 Total voters 58,285 55,888 45,859 44,368 45,492 46,612 41,026 40,209
Public SafetyPolice
911 calls 6,066 7,117 8,065 9,687 12,179 15,861 19,030 20,784 Non-emergency calls 96,555 94,035 115,361 117,522 115,310 106,316 106,699 108,625 DWI arrests 397 274 404 336 - 249 168 156
FireFire 583 621 824 1,005 1,056 1,053 1,228 1,240 No Fire 16 15 20 26 24 24 26 28 Rescue & Emergency Medical Services 16,153 16,086 15,289 14,583 15,460 14,818 14,350 11,465
Hazardous Conditions 611 715 1,233 827 714 766 819 794 Service Calls 2,268 2,203 2,133 2,376 2,361 2,013 2,413 2,523 Good Intent Calls 1,276 1,133 1,174 1,255 1,216 1,046 1,254 3,007 False Alarm & False Calls 1,873 1,613 1,678 1,719 1,988 1,947 1,904 2,143
Severe Weather & Natural Disaster - 3 8 2 2 2 - 1 Special Incident Type 59 62 89 180 201 138 92 112 Other - - - - - - - 21
FISCAL YEAR
Operating Indicators by Function - Unaudited
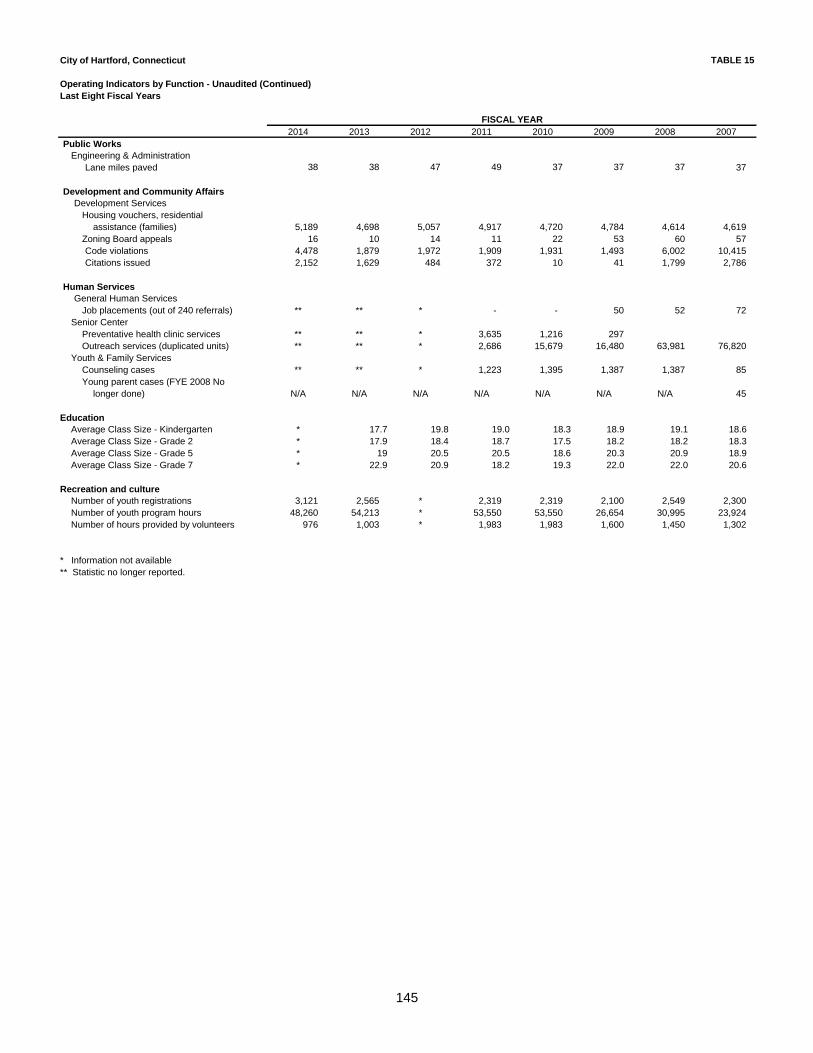
145
City of Hartford, Connecticut TABLE 15
Operating Indicators by Function - Unaudited (Continued)Last Eight Fiscal Years
2014 2013 2012 2011 2010 2009 2008 2007Public Works
Engineering & AdministrationLane miles paved 38 38 47 49 37 37 37 37
Development and Community AffairsDevelopment Services
Housing vouchers, residential assistance (families) 5,189 4,698 5,057 4,917 4,720 4,784 4,614 4,619
Zoning Board appeals 16 10 14 11 22 53 60 57 Code violations 4,478 1,879 1,972 1,909 1,931 1,493 6,002 10,415 Citations issued 2,152 1,629 484 372 10 41 1,799 2,786
Human ServicesGeneral Human Services
Job placements (out of 240 referrals) ** ** * - - 50 52 72 Senior Center
Preventative health clinic services ** ** * 3,635 1,216 297 Outreach services (duplicated units) ** ** * 2,686 15,679 16,480 63,981 76,820
Youth & Family ServicesCounseling cases ** ** * 1,223 1,395 1,387 1,387 85 Young parent cases (FYE 2008 No
longer done) N/A N/A N/A N/A N/A N/A N/A 45
EducationAverage Class Size - Kindergarten * 17.7 19.8 19.0 18.3 18.9 19.1 18.6 Average Class Size - Grade 2 * 17.9 18.4 18.7 17.5 18.2 18.2 18.3 Average Class Size - Grade 5 * 19 20.5 20.5 18.6 20.3 20.9 18.9 Average Class Size - Grade 7 * 22.9 20.9 18.2 19.3 22.0 22.0 20.6
Recreation and cultureNumber of youth registrations 3,121 2,565 * 2,319 2,319 2,100 2,549 2,300 Number of youth program hours 48,260 54,213 * 53,550 53,550 26,654 30,995 23,924 Number of hours provided by volunteers 976 1,003 * 1,983 1,983 1,600 1,450 1,302
* Information not available** Statistic no longer reported.
FISCAL YEAR
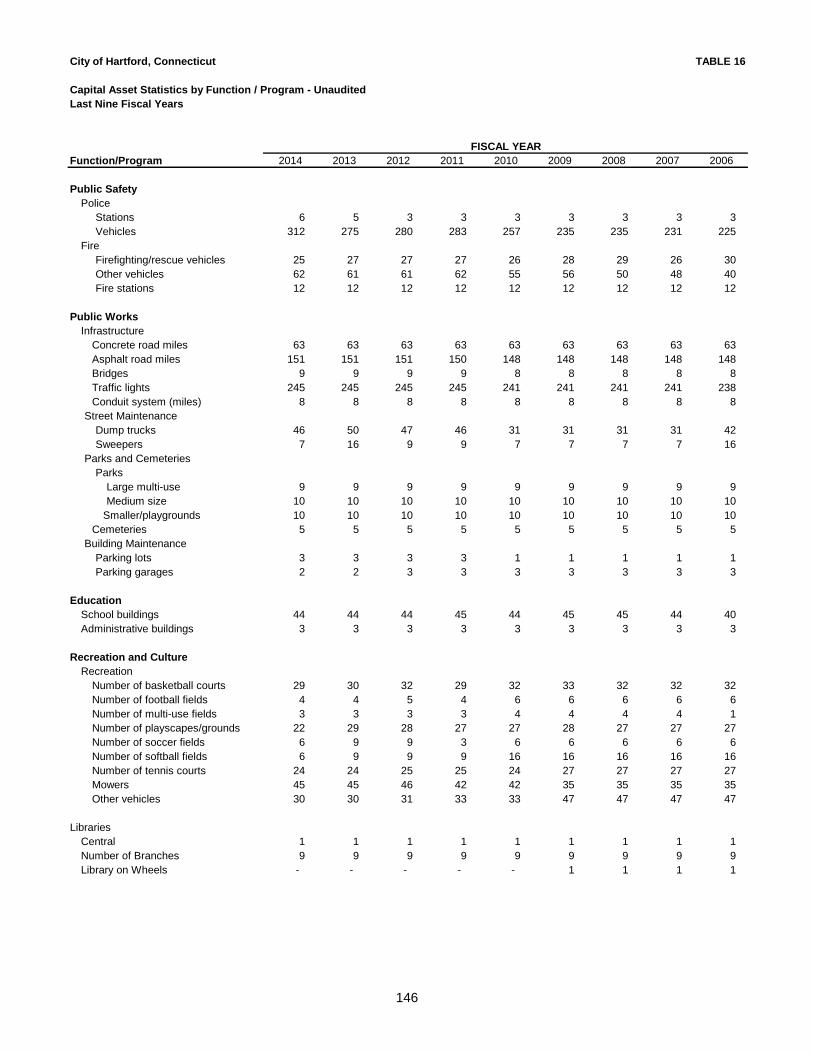
146
City of Hartford, Connecticut TABLE 16
Capital Asset Statistics by Function / Program - UnauditedLast Nine Fiscal Years
Function/Program 2014 2013 2012 2011 2010 2009 2008 2007 2006
Public SafetyPolice
Stations 6 5 3 3 3 3 3 3 3 Vehicles 312 275 280 283 257 235 235 231 225
FireFirefighting/rescue vehicles 25 27 27 27 26 28 29 26 30 Other vehicles 62 61 61 62 55 56 50 48 40 Fire stations 12 12 12 12 12 12 12 12 12
Public WorksInfrastructure
Concrete road miles 63 63 63 63 63 63 63 63 63 Asphalt road miles 151 151 151 150 148 148 148 148 148 Bridges 9 9 9 9 8 8 8 8 8 Traffic lights 245 245 245 245 241 241 241 241 238 Conduit system (miles) 8 8 8 8 8 8 8 8 8
Street MaintenanceDump trucks 46 50 47 46 31 31 31 31 42 Sweepers 7 16 9 9 7 7 7 7 16
Parks and CemeteriesParks
Large multi-use 9 9 9 9 9 9 9 9 9 Medium size 10 10 10 10 10 10 10 10 10
Smaller/playgrounds 10 10 10 10 10 10 10 10 10 Cemeteries 5 5 5 5 5 5 5 5 5
Building MaintenanceParking lots 3 3 3 3 1 1 1 1 1 Parking garages 2 2 3 3 3 3 3 3 3
EducationSchool buildings 44 44 44 45 44 45 45 44 40 Administrative buildings 3 3 3 3 3 3 3 3 3
Recreation and CultureRecreation
Number of basketball courts 29 30 32 29 32 33 32 32 32 Number of football fields 4 4 5 4 6 6 6 6 6 Number of multi-use fields 3 3 3 3 4 4 4 4 1 Number of playscapes/grounds 22 29 28 27 27 28 27 27 27 Number of soccer fields 6 9 9 3 6 6 6 6 6 Number of softball fields 6 9 9 9 16 16 16 16 16 Number of tennis courts 24 24 25 25 24 27 27 27 27 Mowers 45 45 46 42 42 35 35 35 35 Other vehicles 30 30 31 33 33 47 47 47 47
LibrariesCentral 1 1 1 1 1 1 1 1 1 Number of Branches 9 9 9 9 9 9 9 9 9 Library on Wheels - - - - - 1 1 1 1
FISCAL YEAR
City of Hartford, Connecticut Federal and State Financial and Compliance Reports Year Ended June 30, 2014
Contents
Report Required by the Federal Single Audit Act and
OMB Circular A-133 Report on Compliance for Each Major Federal Program; Report on Internal Control
Over Compliance; and Report on Schedule of Expenditures of Federal Awards Required by OMB Circular A-133 .................................................................................... 1-2
Schedule of Expenditures of Federal Awards .................................................................... 3-5
Notes to Schedule of Expenditures of Federal Awards ..................................................... 6
Schedule of Findings and Questioned Costs ..................................................................... 7-8
Summary of Prior Year’s Audit Findings ........................................................................... 9
Report Required by Government Auditing Standards Report on Internal Control Over Financial Reporting and on Compliance and Other
Matters Based on an Audit of Financial Statements Performed in Accordance with Government Auditing Standards ........................................................................................... 10-11
Report Required by the Connecticut State Single Audit Act Report on Compliance for Each Major State Program; Report on Internal Control Over
Compliance; and Report on Schedule of Expenditures of State Financial Assistance Required by the State Single Audit Act ................................................................................ 12-13
Schedule of Expenditures of State Financial Assistance ........................................................ 14-16 Notes to Schedule of Expenditures of State Financial Assistance ......................................... 17 Schedule of State Single Audit Compliance Findings and Questioned Costs ........................ 18-19 Summary of Prior Year Audit Findings .................................................................................... 20
1
Report on Compliance for Each Major Federal Program; Report on Internal Control Over Compliance; and Report on Schedule of Expenditures of Federal Awards
Required by OMB Circular A-133
Independent Auditor’s Report To the Honorable Mayor and Members of the Court of Common Council City of Hartford, Connecticut Report on Compliance for Each Major Federal Program
We have audited the City of Hartford, Connecticut’s (the City) compliance with the types of compliance requirements described in the OMB Circular A-133 Compliance Supplement that could have a direct and material effect on each of the City’s major federal programs for the year ended June 30, 2014. The City’s major federal programs are identified in the summary of auditor’s results section of the accompanying schedule of findings and questioned costs. Management’s Responsibility
Management is responsible for compliance with the requirements of laws, regulations, contracts, and grants applicable to its federal programs. Auditor’s Responsibility
Our responsibility is to express an opinion on compliance for each of the City’s major federal programs based on our audit of the types of compliance requirements referred to above. We conducted our audit of compliance in accordance with auditing standards generally accepted in the United States of America; the standards applicable to financial audits contained in Government Auditing Standards, issued by the Comptroller General of the United States; and OMB Circular A-133, Audits of States, Local Governments, and Non-Profit Organizations. Those standards and OMB Circular A-133 require that we plan and perform the audit to obtain reasonable assurance about whether noncompliance with the types of compliance requirements referred to above that could have a direct and material effect on a major federal program occurred. An audit includes examining, on a test basis, evidence about the City’s compliance with those requirements and performing such other procedures as we considered necessary in the circumstances. We believe that our audit provides a reasonable basis for our opinion on compliance for each major federal program. However, our audit does not provide a legal determination of the City’s compliance. Opinion on Each Major Federal Program
In our opinion, the City complied, in all material respects, with the types of compliance requirements referred to above that could have a direct and material effect on each of its major federal programs for the year ended June 30, 2014.
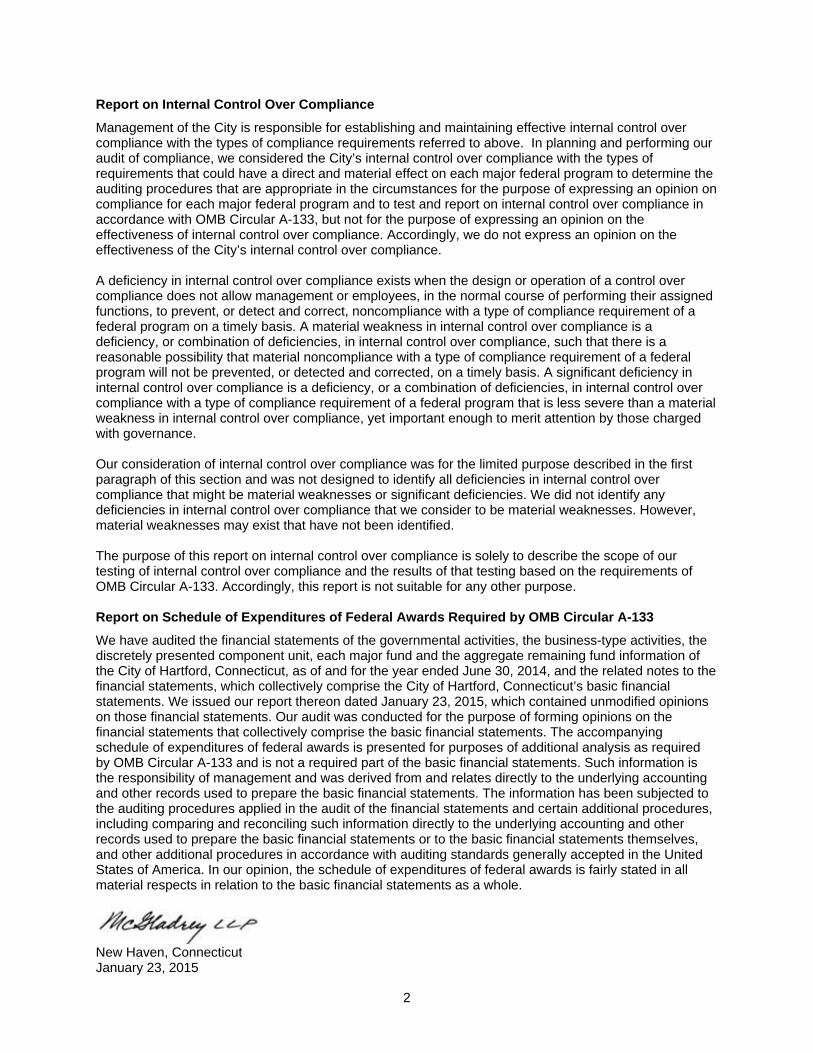
2
Report on Internal Control Over Compliance
Management of the City is responsible for establishing and maintaining effective internal control over compliance with the types of compliance requirements referred to above. In planning and performing our audit of compliance, we considered the City’s internal control over compliance with the types of requirements that could have a direct and material effect on each major federal program to determine the auditing procedures that are appropriate in the circumstances for the purpose of expressing an opinion on compliance for each major federal program and to test and report on internal control over compliance in accordance with OMB Circular A-133, but not for the purpose of expressing an opinion on the effectiveness of internal control over compliance. Accordingly, we do not express an opinion on the effectiveness of the City’s internal control over compliance. A deficiency in internal control over compliance exists when the design or operation of a control over compliance does not allow management or employees, in the normal course of performing their assigned functions, to prevent, or detect and correct, noncompliance with a type of compliance requirement of a federal program on a timely basis. A material weakness in internal control over compliance is a deficiency, or combination of deficiencies, in internal control over compliance, such that there is a reasonable possibility that material noncompliance with a type of compliance requirement of a federal program will not be prevented, or detected and corrected, on a timely basis. A significant deficiency in internal control over compliance is a deficiency, or a combination of deficiencies, in internal control over compliance with a type of compliance requirement of a federal program that is less severe than a material weakness in internal control over compliance, yet important enough to merit attention by those charged with governance. Our consideration of internal control over compliance was for the limited purpose described in the first paragraph of this section and was not designed to identify all deficiencies in internal control over compliance that might be material weaknesses or significant deficiencies. We did not identify any deficiencies in internal control over compliance that we consider to be material weaknesses. However, material weaknesses may exist that have not been identified. The purpose of this report on internal control over compliance is solely to describe the scope of our testing of internal control over compliance and the results of that testing based on the requirements of OMB Circular A-133. Accordingly, this report is not suitable for any other purpose. Report on Schedule of Expenditures of Federal Awards Required by OMB Circular A-133
We have audited the financial statements of the governmental activities, the business-type activities, the discretely presented component unit, each major fund and the aggregate remaining fund information of the City of Hartford, Connecticut, as of and for the year ended June 30, 2014, and the related notes to the financial statements, which collectively comprise the City of Hartford, Connecticut’s basic financial statements. We issued our report thereon dated January 23, 2015, which contained unmodified opinions on those financial statements. Our audit was conducted for the purpose of forming opinions on the financial statements that collectively comprise the basic financial statements. The accompanying schedule of expenditures of federal awards is presented for purposes of additional analysis as required by OMB Circular A-133 and is not a required part of the basic financial statements. Such information is the responsibility of management and was derived from and relates directly to the underlying accounting and other records used to prepare the basic financial statements. The information has been subjected to the auditing procedures applied in the audit of the financial statements and certain additional procedures, including comparing and reconciling such information directly to the underlying accounting and other records used to prepare the basic financial statements or to the basic financial statements themselves, and other additional procedures in accordance with auditing standards generally accepted in the United States of America. In our opinion, the schedule of expenditures of federal awards is fairly stated in all material respects in relation to the basic financial statements as a whole.
New Haven, Connecticut January 23, 2015
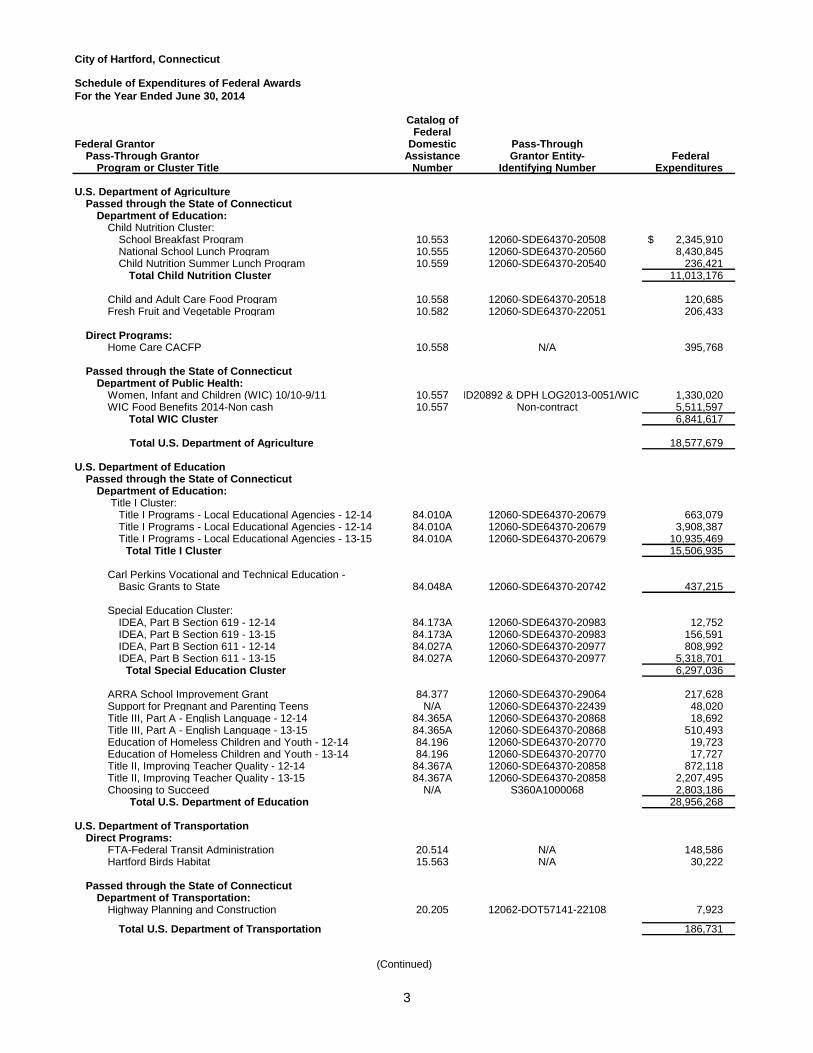
3
City of Hartford, Connecticut
Schedule of Expenditures of Federal AwardsFor the Year Ended June 30, 2014
Catalog ofFederal
Federal Grantor Domestic Pass-ThroughPass-Through Grantor Assistance Grantor Entity- Federal
Program or Cluster Title Number Identifying Number Expenditures
U.S. Department of AgriculturePassed through the State of Connecticut
Department of Education:Child Nutrition Cluster:
School Breakfast Program 10.553 12060-SDE64370-20508 2,345,910 $ National School Lunch Program 10.555 12060-SDE64370-20560 8,430,845 Child Nutrition Summer Lunch Program 10.559 12060-SDE64370-20540 236,421
Total Child Nutrition Cluster 11,013,176
Child and Adult Care Food Program 10.558 12060-SDE64370-20518 120,685 Fresh Fruit and Vegetable Program 10.582 12060-SDE64370-22051 206,433
Direct Programs:Home Care CACFP 10.558 N/A 395,768
Passed through the State of ConnecticutDepartment of Public Health:
Women, Infant and Children (WIC) 10/10-9/11 10.557 ID20892 & DPH LOG2013-0051/WIC 1,330,020 WIC Food Benefits 2014-Non cash 10.557 Non-contract 5,511,597 Total WIC Cluster 6,841,617
Total U.S. Department of Agriculture 18,577,679
U.S. Department of EducationPassed through the State of Connecticut
Department of Education: Title I Cluster:
Title I Programs - Local Educational Agencies - 12-14 84.010A 12060-SDE64370-20679 663,079 Title I Programs - Local Educational Agencies - 12-14 84.010A 12060-SDE64370-20679 3,908,387 Title I Programs - Local Educational Agencies - 13-15 84.010A 12060-SDE64370-20679 10,935,469
Total Title I Cluster 15,506,935
Carl Perkins Vocational and Technical Education -Basic Grants to State 84.048A 12060-SDE64370-20742 437,215
Special Education Cluster:IDEA, Part B Section 619 - 12-14 84.173A 12060-SDE64370-20983 12,752 IDEA, Part B Section 619 - 13-15 84.173A 12060-SDE64370-20983 156,591 IDEA, Part B Section 611 - 12-14 84.027A 12060-SDE64370-20977 808,992 IDEA, Part B Section 611 - 13-15 84.027A 12060-SDE64370-20977 5,318,701
Total Special Education Cluster 6,297,036
ARRA School Improvement Grant 84.377 12060-SDE64370-29064 217,628 Support for Pregnant and Parenting Teens N/A 12060-SDE64370-22439 48,020 Title III, Part A - English Language - 12-14 84.365A 12060-SDE64370-20868 18,692 Title III, Part A - English Language - 13-15 84.365A 12060-SDE64370-20868 510,493 Education of Homeless Children and Youth - 12-14 84.196 12060-SDE64370-20770 19,723 Education of Homeless Children and Youth - 13-14 84.196 12060-SDE64370-20770 17,727 Title II, Improving Teacher Quality - 12-14 84.367A 12060-SDE64370-20858 872,118 Title II, Improving Teacher Quality - 13-15 84.367A 12060-SDE64370-20858 2,207,495 Choosing to Succeed N/A S360A1000068 2,803,186
Total U.S. Department of Education 28,956,268
U.S. Department of TransportationDirect Programs:
FTA-Federal Transit Administration 20.514 N/A 148,586 Hartford Birds Habitat 15.563 N/A 30,222
Passed through the State of ConnecticutDepartment of Transportation:
Highway Planning and Construction 20.205 12062-DOT57141-22108 7,923
Total U.S. Department of Transportation 186,731
(Continued)
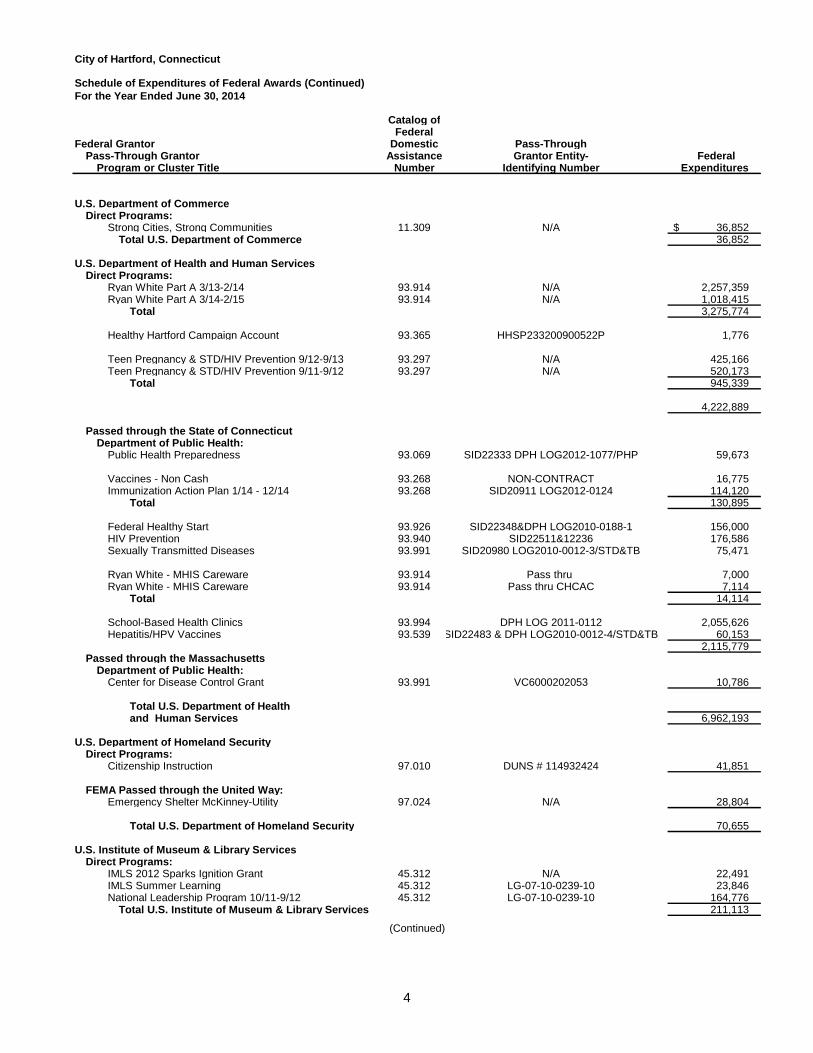
4
City of Hartford, Connecticut
Schedule of Expenditures of Federal Awards (Continued)For the Year Ended June 30, 2014
Catalog ofFederal
Federal Grantor Domestic Pass-ThroughPass-Through Grantor Assistance Grantor Entity- Federal
Program or Cluster Title Number Identifying Number Expenditures
U.S. Department of CommerceDirect Programs:
Strong Cities, Strong Communities 11.309 N/A 36,852 $ Total U.S. Department of Commerce 36,852
U.S. Department of Health and Human ServicesDirect Programs:
Ryan White Part A 3/13-2/14 93.914 N/A 2,257,359 Ryan White Part A 3/14-2/15 93.914 N/A 1,018,415
Total 3,275,774
Healthy Hartford Campaign Account 93.365 HHSP233200900522P 1,776
Teen Pregnancy & STD/HIV Prevention 9/12-9/13 93.297 N/A 425,166 Teen Pregnancy & STD/HIV Prevention 9/11-9/12 93.297 N/A 520,173
Total 945,339
4,222,889
Passed through the State of ConnecticutDepartment of Public Health:
Public Health Preparedness 93.069 SID22333 DPH LOG2012-1077/PHP 59,673
Vaccines - Non Cash 93.268 NON-CONTRACT 16,775 Immunization Action Plan 1/14 - 12/14 93.268 SID20911 LOG2012-0124 114,120
Total 130,895
Federal Healthy Start 93.926 SID22348&DPH LOG2010-0188-1 156,000 HIV Prevention 93.940 SID22511&12236 176,586 Sexually Transmitted Diseases 93.991 SID20980 LOG2010-0012-3/STD&TB 75,471
Ryan White - MHIS Careware 93.914 Pass thru 7,000 Ryan White - MHIS Careware 93.914 Pass thru CHCAC 7,114
Total 14,114
School-Based Health Clinics 93.994 DPH LOG 2011-0112 2,055,626 Hepatitis/HPV Vaccines 93.539 SID22483 & DPH LOG2010-0012-4/STD&TB 60,153
2,115,779 Passed through the Massachusetts
Department of Public Health:Center for Disease Control Grant 93.991 VC6000202053 10,786
Total U.S. Department of Health and Human Services 6,962,193
U.S. Department of Homeland SecurityDirect Programs:
Citizenship Instruction 97.010 DUNS # 114932424 41,851
FEMA Passed through the United Way:Emergency Shelter McKinney-Utility 97.024 N/A 28,804
Total U.S. Department of Homeland Security 70,655
U.S. Institute of Museum & Library ServicesDirect Programs:
IMLS 2012 Sparks Ignition Grant 45.312 N/A 22,491 IMLS Summer Learning 45.312 LG-07-10-0239-10 23,846 National Leadership Program 10/11-9/12 45.312 LG-07-10-0239-10 164,776
Total U.S. Institute of Museum & Library Services 211,113
(Continued)
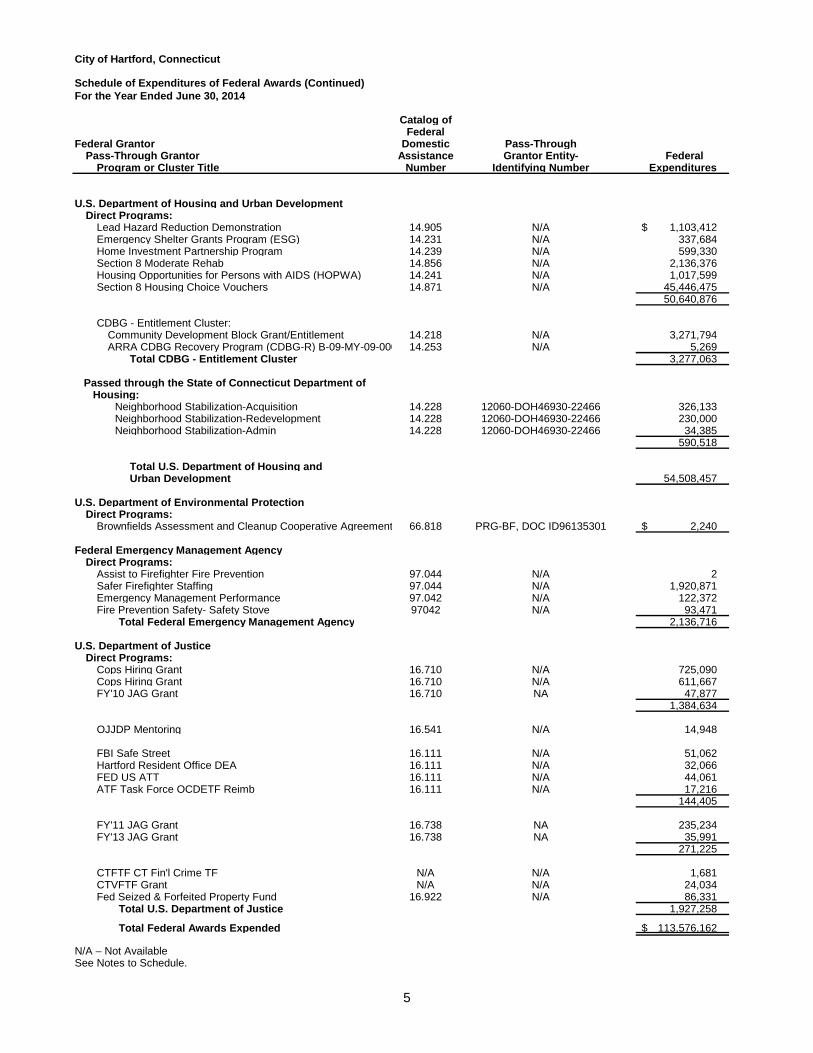
5
City of Hartford, Connecticut
Schedule of Expenditures of Federal Awards (Continued)For the Year Ended June 30, 2014
Catalog ofFederal
Federal Grantor Domestic Pass-ThroughPass-Through Grantor Assistance Grantor Entity- Federal
Program or Cluster Title Number Identifying Number Expenditures
U.S. Department of Housing and Urban DevelopmentDirect Programs:
Lead Hazard Reduction Demonstration 14.905 N/A 1,103,412 $ Emergency Shelter Grants Program (ESG) 14.231 N/A 337,684 Home Investment Partnership Program 14.239 N/A 599,330 Section 8 Moderate Rehab 14.856 N/A 2,136,376 Housing Opportunities for Persons with AIDS (HOPWA) 14.241 N/A 1,017,599 Section 8 Housing Choice Vouchers 14.871 N/A 45,446,475
50,640,876
CDBG - Entitlement Cluster:Community Development Block Grant/Entitlement 14.218 N/A 3,271,794 ARRA CDBG Recovery Program (CDBG-R) B-09-MY-09-000 14.253 N/A 5,269
Total CDBG - Entitlement Cluster 3,277,063
Passed through the State of Connecticut Department of Housing:
Neighborhood Stabilization-Acquisition 14.228 12060-DOH46930-22466 326,133 Neighborhood Stabilization-Redevelopment 14.228 12060-DOH46930-22466 230,000 Neighborhood Stabilization-Admin 14.228 12060-DOH46930-22466 34,385
590,518
Total U.S. Department of Housing andUrban Development 54,508,457
U.S. Department of Environmental ProtectionDirect Programs:
Brownfields Assessment and Cleanup Cooperative Agreement 66.818 PRG-BF, DOC ID96135301 2,240 $
Federal Emergency Management AgencyDirect Programs:
Assist to Firefighter Fire Prevention 97.044 N/A 2 Safer Firefighter Staffing 97.044 N/A 1,920,871 Emergency Management Performance 97.042 N/A 122,372 Fire Prevention Safety- Safety Stove 97042 N/A 93,471
Total Federal Emergency Management Agency 2,136,716
U.S. Department of JusticeDirect Programs:
Cops Hiring Grant 16.710 N/A 725,090 Cops Hiring Grant 16.710 N/A 611,667 FY'10 JAG Grant 16.710 NA 47,877
1,384,634
OJJDP Mentoring 16.541 N/A 14,948
FBI Safe Street 16.111 N/A 51,062 Hartford Resident Office DEA 16.111 N/A 32,066 FED US ATT 16.111 N/A 44,061 ATF Task Force OCDETF Reimb 16.111 N/A 17,216
144,405
FY'11 JAG Grant 16.738 NA 235,234 FY'13 JAG Grant 16.738 NA 35,991
271,225
CTFTF CT Fin'l Crime TF N/A N/A 1,681 CTVFTF Grant N/A N/A 24,034 Fed Seized & Forfeited Property Fund 16.922 N/A 86,331
Total U.S. Department of Justice 1,927,258
Total Federal Awards Expended 113,576,162 $
N/A – Not AvailableSee Notes to Schedule.
City of Hartford, Connecticut Notes to Schedule of Expenditures of Federal Awards
6
Note 1. Basis of Presentation
The accompanying schedule of expenditures of federal awards (the “Schedule”) includes the federal grant activity of the City of Hartford, Connecticut (the “City”) under programs of the federal government for the year ended June 30, 2014. The information in the Schedule is presented in accordance with the requirements of the Office of Management and Budget (OMB) Circular A-133, Audits of States, Local Governments, and Non-Profit Organizations. Because the Schedule presents only a selected portion of the operations of the City, it is not intended to, and does not, present the financial position, changes in net position, changes in fund balances or changes in cash flows of the City.
Note 2. Summary of Significant Accounting Principles
Expenditures reported on the Schedule of are reported using the modified accrual basis of accounting. Such expenditures are recognized following the cost principles contained in OMB Circular A-87, Cost Principles for State, Local, and Indian Tribal Governments, wherein certain types of expenditures are not allowable or are limited as to reimbursement.
Note 3. Contributions
Donated commodities in the amounts of $5,511,597 and $16,775 are included in the Department of Agriculture’s WIC program, CFDA # 10.557 and the Department of Public Health and Human Services’ Vaccine program, CFDA # 93.268, respectively. These amounts represent the market value of commodities received.
Note 4. Subrecipients
Of the expenditures presented in the Schedule of Expenditures of Federal Awards, the City provided the following federal awards to subrecipients: Name of Program CFDA Number Amount Provided to Subrecipient Section 8 Housing Choice Vouchers 14.871 $45,446,475 Section 8 Moderate Rehab 14.856 2,136,376
City of Hartford, Connecticut Schedule of Findings and Questioned Costs For the Year Ended June 30, 2014
7
I. Summary of Independent Auditor’s Results
Financial Statements Type of auditor’s report issued: Unmodified Internal Control over Financial Reporting
Material weakness(es) identified? Yes X No
Significant deficiency(ies)
identified? Yes X None reported
Noncompliance material to financial
statements? Yes X No
Federal Awards Internal control over major programs:
Material weakness(es) identified? Yes X No
Significant deficiency(ies)
identified? Yes X None reported Type of auditor’s report issued on compliance for major programs: unmodified
Any audit findings disclosed that are required to be reported in accordance with Section 510(a) of Circular A-133? Yes X No
Identification of Major Programs
CFDA Numbers Name of Federal Program or Cluster 84.010A Title I Cluster 10.553 / 10.555 / 10.559 Child Nutrition Cluster 10.557 Women, Infant and Children (WIC) 14.871 Section 8: Housing Choice Vouchers 97.044 Safer Firefighter Staffing 93.994 School Based Health Clinics 14.905 Lead Hazard Reduction Demonstration 14.231 Emergency Shelter Grants Program (ESG)
Dollar threshold used to distinguish between type A and type B programs
$ 3,000,000
Auditee qualified as low-risk auditee? X Yes No
City of Hartford, Connecticut Schedule of Findings and Questioned Costs For the Year Ended June 30, 2014
8
II. Financial Statement Findings No matters reported. III. Federal Award Findings and Questioned Costs No matters reported.
City of Hartford, Connecticut Summary of Prior Year Audit Findings For the Year Ended June 30, 2014
9
Summary Schedule of Prior Audit Findings
Finding No. 2013-1 Condition: The City issued checks the day after they were approved to be paid. The City included these checks on its outstanding check list and as a reconciling item on the bank reconciliation. Current Status: The finding has been corrected. Finding No. 2013-2 Condition: The City Treasury department wired funds to an unapproved vendor. Current Status: The finding has been corrected. Finding No. 2013-3 Condition: The City failed to submit certain payroll filings to the IRS on the required dates. Current Status: The finding has been corrected.
10
Report on Internal Control over Financial Reporting and on Compliance and Other Matters Based on an Audit of Financial Statements Performed in Accordance with Government
Auditing Standards
Independent Auditor’s Report To the Honorable Mayor and Members of the Court of Common Council City of Hartford, Connecticut We have audited, in accordance with the auditing standards generally accepted in the United States of America and the standards applicable to financial audits contained in Government Auditing Standards issued by the Comptroller General of the United States, the financial statements of the governmental activities, the business-type activities, each major fund, and the aggregate remaining fund information of the City of Hartford, Connecticut (the City) as of and for the year ended June 30, 2014, and the related notes to the financial statements, which collectively comprise the City’s basic financial statements, and have issued our report thereon dated January 23, 2015. Internal Control Over Financial Reporting
In planning and performing our audit of the financial statements, we considered the City’s internal control over financial reporting (internal control) to determine the audit procedures that are appropriate in the circumstances for the purpose of expressing our opinions on the financial statements, but not for the purpose of expressing an opinion on the effectiveness of the City’s internal control. Accordingly, we do not express an opinion on the effectiveness of the City’s internal control. A deficiency in internal control exists when the design or operation of a control does not allow management or employees, in the normal course of performing their assigned functions, to prevent, or detect and correct, misstatements on a timely basis. A material weakness is a deficiency, or a combination of deficiencies, in internal control, such that there is a reasonable possibility that a material misstatement of the entity’s financial statements will not be prevented, or detected and corrected on a timely basis. A significant deficiency is a deficiency, or a combination of deficiencies, in internal control that is less severe than a material weakness, yet important enough to merit attention by those charged with governance. Our consideration of internal control was for the limited purpose described in the first paragraph of this section and was not designed to identify all deficiencies in internal control that might be material weaknesses or significant deficiencies. Given these limitations, during our audit we did not identify any deficiencies in internal control that we consider to be material weaknesses. However, material weaknesses may exist that have not been identified. Compliance and Other Matters As part of obtaining reasonable assurance about whether the City's financial statements are free from material misstatement, we performed tests of its compliance with certain provisions of laws, regulations, contracts, and grant agreements, noncompliance with which could have a direct and material effect on the determination of financial statement amounts. However, providing an opinion on compliance with those provisions was not an objective of our audit, and accordingly, we do not express such an opinion. The results of our tests disclosed no instances of noncompliance or other matters that are required to be reported under Government Auditing Standards.
11
Purpose of this Report The purpose of this report is solely to describe the scope of our testing of internal control and compliance and the results of that testing, and not to provide an opinion on the effectiveness of the entity’s internal control or on compliance. This report is an integral part of an audit performed in accordance with Government Auditing Standards in considering the entity’s internal control and compliance. Accordingly, this communication is not suitable for any other purpose.
New Haven, Connecticut January 23, 2015
12
Report on Compliance for Each Major State Program; Report on Internal Control over Compliance; and Report on Schedule of Expenditures of State Financial Assistance
Required by the State Single Audit Act
Independent Auditor’s Report To the Honorable Mayor and Members of the Court of Common Council City of Hartford, Connecticut Report on Compliance for Each Major State Program
We have audited the City of Hartford, Connecticut’s (the “City”) compliance with the types of compliance requirements described in the Office of Policy and Management’s Compliance Supplement that could have a direct and material effect on each of the City’s major state programs for the year ended June 30, 2014. The City’s major state programs are identified in the summary of auditor’s results section of the accompanying schedule of findings and questioned costs. Management’s Responsibility
Management is responsible for compliance with the requirements of laws, regulations, contracts, and grants applicable to its state programs. Auditor’s Responsibility
Our responsibility is to express an opinion on compliance for each of the City’s major state programs based on our audit of the types of compliance requirements referred to above. We conducted our audit of compliance in accordance with auditing standards generally accepted in the United States of America; the standards applicable to financial audits contained in Government Auditing Standards, issued by the Comptroller General of the United States; and the State Single Audit Act (C.G.S. Sections 4-230 to 4-236). Those standards and the State Single Audit Act require that we plan and perform the audit to obtain reasonable assurance about whether noncompliance with the types of compliance requirements referred to above that could have a direct and material effect on a major state program occurred. An audit includes examining, on a test basis, evidence about the City’s compliance with those requirements and performing such other procedures as we considered necessary in the circumstances. We believe that our audit provides a reasonable basis for our opinion on compliance for each major state program. However, our audit does not provide a legal determination of the City’s compliance. Opinion on Each Major State Program
In our opinion, the City complied, in all material respects, with the types of compliance requirements referred to above that could have a direct and material effect on each of its major state programs for the year ended June 30, 2014.
13
Report on Internal Control over Compliance
Management of the City is responsible for establishing and maintaining effective internal control over compliance with the types of compliance requirements referred to above. In planning and performing our audit of compliance, we considered the City’s internal control over compliance with the types of requirements that could have a direct and material effect on each major state program to determine the auditing procedures that are appropriate in the circumstances for the purpose of expressing an opinion on compliance for each major state program and to test and report on internal control over compliance in accordance with the State Single Audit Act, but not for the purpose of expressing an opinion on the effectiveness of internal control over compliance. Accordingly, we do not express an opinion on the effectiveness of the City’s internal control over compliance. A deficiency in internal control over compliance exists when the design or operation of a control over compliance does not allow management or employees, in the normal course of performing their assigned functions, to prevent, or detect and correct, noncompliance with a type of compliance requirement of a state program on a timely basis. A material weakness in internal control over compliance is a deficiency, or combination of deficiencies, in internal control over compliance, such that there is a reasonable possibility that material noncompliance with a type of compliance requirement of a state program will not be prevented, or detected and corrected, on a timely basis. A significant deficiency in internal control over compliance is a deficiency, or a combination of deficiencies, in internal control over compliance with a type of compliance requirement of a state program that is less severe than a material weakness in internal control over compliance, yet important enough to merit attention by those charged with governance. Our consideration of internal control over compliance was for the limited purpose described in the first paragraph of this section and was not designed to identify all deficiencies in internal control over compliance that might be material weaknesses or significant deficiencies. We did not identify any deficiencies in internal control over compliance that we consider to be material weaknesses. However, material weaknesses may exist that have not been identified. The purpose of this report on internal control over compliance is solely to describe the scope of our testing of internal control over compliance and the results of that testing based on the requirements of the State Single Audit Act. Accordingly, this report is not suitable for any other purpose. Report on Schedule of Expenditures of State Financial Assistance Required by the State Single Audit Act
We have audited the financial statements of the governmental activities, the business-type activities, the discretely presented component unit, each major fund and the aggregate remaining fund information of the City of Hartford, Connecticut, as of and for the year ended June 30, 2014, and the related notes to the financial statements, which collectively comprise the City of Hartford, Connecticut’s basic financial statements. We issued our report thereon dated January 23, 2015, which contained unmodified opinions on those financial statements. Our audit was conducted for the purpose of forming opinions on the financial statements that collectively comprise the basic financial statements. The accompanying schedule of expenditures of state financial assistance is presented for purposes of additional analysis as required by the State Single Audit Act and is not a required part of the basic financial statements. Such information is the responsibility of management and was derived from and relates directly to the underlying accounting and other records used to prepare the basic financial statements. The information has been subjected to the auditing procedures applied in the audit of the financial statements and certain additional procedures, including comparing and reconciling such information directly to the underlying accounting and other records used to prepare the basic financial statements or to the basic financial statements themselves, and other additional procedures in accordance with auditing standards generally accepted in the United States of America. In our opinion, the schedule of expenditures of state financial assistance is fairly stated in all material respects in relation to the basic financial statements as a whole.
New Haven, Connecticut January 23, 2015
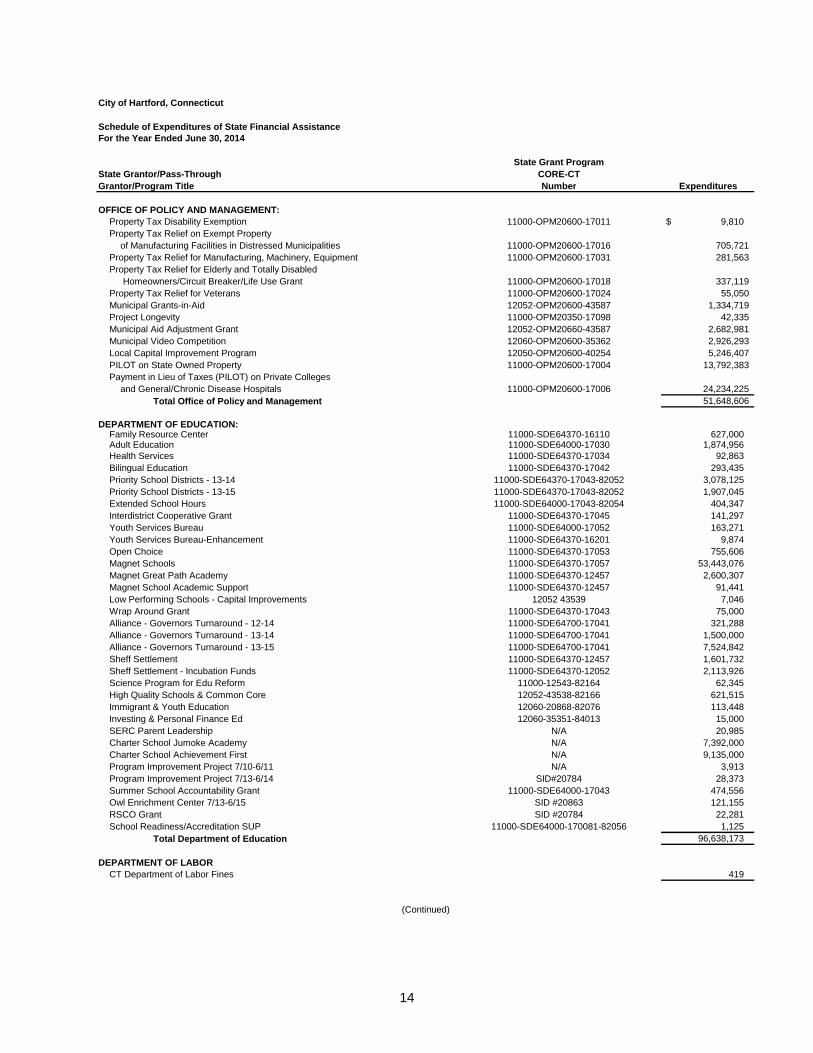
14
City of Hartford, Connecticut
Schedule of Expenditures of State Financial AssistanceFor the Year Ended June 30, 2014
State Grant ProgramState Grantor/Pass-Through CORE-CTGrantor/Program Title Number Expenditures
OFFICE OF POLICY AND MANAGEMENT:Property Tax Disability Exemption 11000-OPM20600-17011 9,810 $ Property Tax Relief on Exempt Property
of Manufacturing Facilities in Distressed Municipalities 11000-OPM20600-17016 705,721 Property Tax Relief for Manufacturing, Machinery, Equipment 11000-OPM20600-17031 281,563 Property Tax Relief for Elderly and Totally Disabled
Homeowners/Circuit Breaker/Life Use Grant 11000-OPM20600-17018 337,119 Property Tax Relief for Veterans 11000-OPM20600-17024 55,050 Municipal Grants-in-Aid 12052-OPM20600-43587 1,334,719 Project Longevity 11000-OPM20350-17098 42,335 Municipal Aid Adjustment Grant 12052-OPM20660-43587 2,682,981 Municipal Video Competition 12060-OPM20600-35362 2,926,293 Local Capital Improvement Program 12050-OPM20600-40254 5,246,407 PILOT on State Owned Property 11000-OPM20600-17004 13,792,383 Payment in Lieu of Taxes (PILOT) on Private Colleges
and General/Chronic Disease Hospitals 11000-OPM20600-17006 24,234,225 Total Office of Policy and Management 51,648,606
DEPARTMENT OF EDUCATION:Family Resource Center 11000-SDE64370-16110 627,000 Adult Education 11000-SDE64000-17030 1,874,956 Health Services 11000-SDE64370-17034 92,863 Bilingual Education 11000-SDE64370-17042 293,435 Priority School Districts - 13-14 11000-SDE64370-17043-82052 3,078,125 Priority School Districts - 13-15 11000-SDE64370-17043-82052 1,907,045 Extended School Hours 11000-SDE64000-17043-82054 404,347 Interdistrict Cooperative Grant 11000-SDE64370-17045 141,297 Youth Services Bureau 11000-SDE64000-17052 163,271 Youth Services Bureau-Enhancement 11000-SDE64370-16201 9,874 Open Choice 11000-SDE64370-17053 755,606 Magnet Schools 11000-SDE64370-17057 53,443,076 Magnet Great Path Academy 11000-SDE64370-12457 2,600,307 Magnet School Academic Support 11000-SDE64370-12457 91,441 Low Performing Schools - Capital Improvements 12052 43539 7,046 Wrap Around Grant 11000-SDE64370-17043 75,000 Alliance - Governors Turnaround - 12-14 11000-SDE64700-17041 321,288 Alliance - Governors Turnaround - 13-14 11000-SDE64700-17041 1,500,000 Alliance - Governors Turnaround - 13-15 11000-SDE64700-17041 7,524,842 Sheff Settlement 11000-SDE64370-12457 1,601,732 Sheff Settlement - Incubation Funds 11000-SDE64370-12052 2,113,926 Science Program for Edu Reform 11000-12543-82164 62,345 High Quality Schools & Common Core 12052-43538-82166 621,515 Immigrant & Youth Education 12060-20868-82076 113,448 Investing & Personal Finance Ed 12060-35351-84013 15,000 SERC Parent Leadership N/A 20,985 Charter School Jumoke Academy N/A 7,392,000 Charter School Achievement First N/A 9,135,000 Program Improvement Project 7/10-6/11 N/A 3,913 Program Improvement Project 7/13-6/14 SID#20784 28,373 Summer School Accountability Grant 11000-SDE64000-17043 474,556 Owl Enrichment Center 7/13-6/15 SID #20863 121,155 RSCO Grant SID #20784 22,281 School Readiness/Accreditation SUP 11000-SDE64000-170081-82056 1,125
Total Department of Education 96,638,173
DEPARTMENT OF LABORCT Department of Labor Fines 419
(Continued)
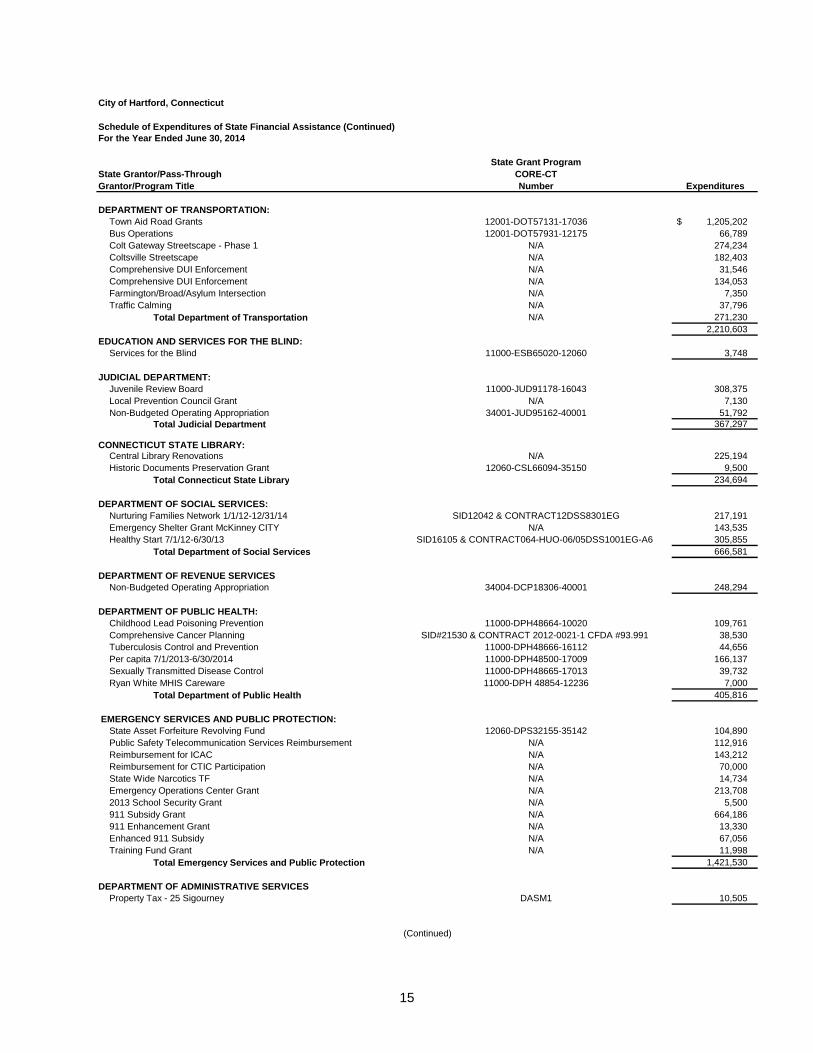
15
City of Hartford, Connecticut
Schedule of Expenditures of State Financial Assistance (Continued)For the Year Ended June 30, 2014
State Grant ProgramState Grantor/Pass-Through CORE-CTGrantor/Program Title Number Expenditures
DEPARTMENT OF TRANSPORTATION:Town Aid Road Grants 12001-DOT57131-17036 1,205,202 $ Bus Operations 12001-DOT57931-12175 66,789 Colt Gateway Streetscape - Phase 1 N/A 274,234 Coltsville Streetscape N/A 182,403 Comprehensive DUI Enforcement N/A 31,546 Comprehensive DUI Enforcement N/A 134,053 Farmington/Broad/Asylum Intersection N/A 7,350 Traffic Calming N/A 37,796
Total Department of Transportation N/A 271,230 2,210,603
EDUCATION AND SERVICES FOR THE BLIND:Services for the Blind 11000-ESB65020-12060 3,748
JUDICIAL DEPARTMENT:Juvenile Review Board 11000-JUD91178-16043 308,375 Local Prevention Council Grant N/A 7,130 Non-Budgeted Operating Appropriation 34001-JUD95162-40001 51,792
Total Judicial Department 367,297
CONNECTICUT STATE LIBRARY:Central Library Renovations N/A 225,194 Historic Documents Preservation Grant 12060-CSL66094-35150 9,500
Total Connecticut State Library 234,694
DEPARTMENT OF SOCIAL SERVICES:Nurturing Families Network 1/1/12-12/31/14 SID12042 & CONTRACT12DSS8301EG 217,191 Emergency Shelter Grant McKinney CITY N/A 143,535 Healthy Start 7/1/12-6/30/13 SID16105 & CONTRACT064-HUO-06/05DSS1001EG-A6 305,855
Total Department of Social Services 666,581
DEPARTMENT OF REVENUE SERVICESNon-Budgeted Operating Appropriation 34004-DCP18306-40001 248,294
DEPARTMENT OF PUBLIC HEALTH:Childhood Lead Poisoning Prevention 11000-DPH48664-10020 109,761 Comprehensive Cancer Planning SID#21530 & CONTRACT 2012-0021-1 CFDA #93.991 38,530 Tuberculosis Control and Prevention 11000-DPH48666-16112 44,656 Per capita 7/1/2013-6/30/2014 11000-DPH48500-17009 166,137 Sexually Transmitted Disease Control 11000-DPH48665-17013 39,732 Ryan White MHIS Careware 11000-DPH 48854-12236 7,000
Total Department of Public Health 405,816
EMERGENCY SERVICES AND PUBLIC PROTECTION:State Asset Forfeiture Revolving Fund 12060-DPS32155-35142 104,890 Public Safety Telecommunication Services Reimbursement N/A 112,916 Reimbursement for ICAC N/A 143,212 Reimbursement for CTIC Participation N/A 70,000 State Wide Narcotics TF N/A 14,734 Emergency Operations Center Grant N/A 213,708 2013 School Security Grant N/A 5,500 911 Subsidy Grant N/A 664,186 911 Enhancement Grant N/A 13,330 Enhanced 911 Subsidy N/A 67,056 Training Fund Grant N/A 11,998
Total Emergency Services and Public Protection 1,421,530
DEPARTMENT OF ADMINISTRATIVE SERVICESProperty Tax - 25 Sigourney DASM1 10,505
(Continued)
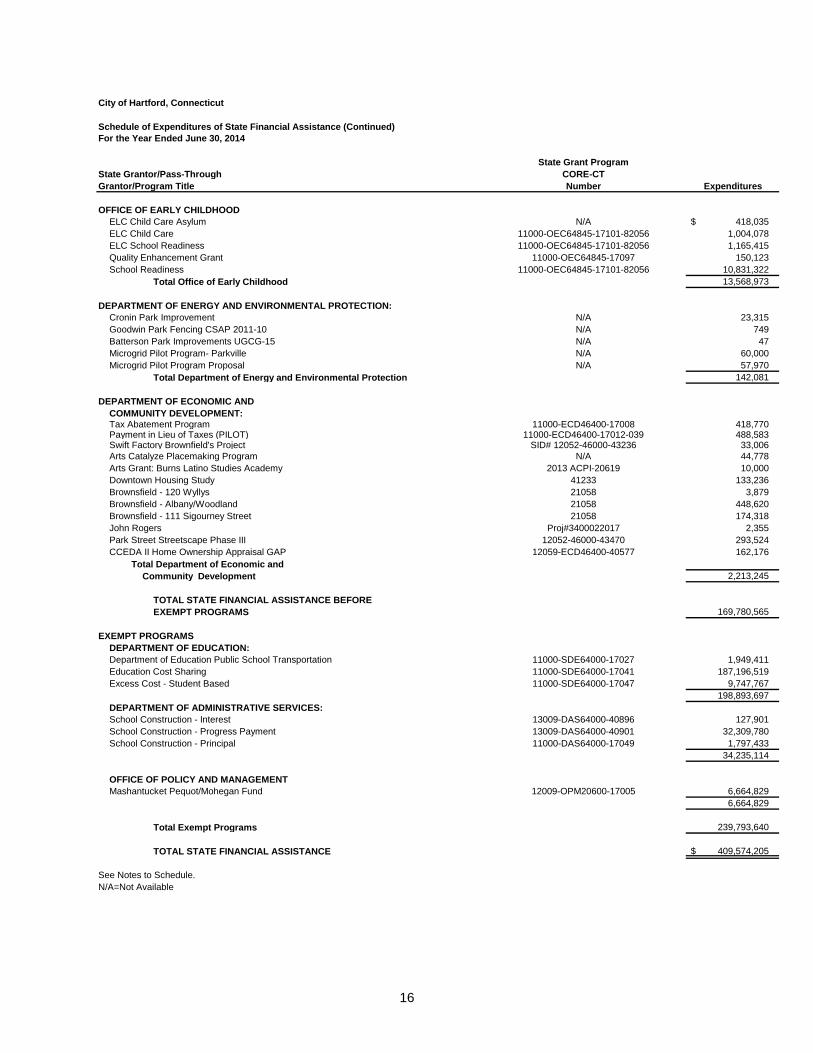
16
City of Hartford, Connecticut
Schedule of Expenditures of State Financial Assistance (Continued)For the Year Ended June 30, 2014
State Grant ProgramState Grantor/Pass-Through CORE-CTGrantor/Program Title Number Expenditures
OFFICE OF EARLY CHILDHOODELC Child Care Asylum N/A 418,035 $ ELC Child Care 11000-OEC64845-17101-82056 1,004,078 ELC School Readiness 11000-OEC64845-17101-82056 1,165,415 Quality Enhancement Grant 11000-OEC64845-17097 150,123 School Readiness 11000-OEC64845-17101-82056 10,831,322
Total Office of Early Childhood 13,568,973
DEPARTMENT OF ENERGY AND ENVIRONMENTAL PROTECTION:Cronin Park Improvement N/A 23,315 Goodwin Park Fencing CSAP 2011-10 N/A 749 Batterson Park Improvements UGCG-15 N/A 47 Microgrid Pilot Program- Parkville N/A 60,000 Microgrid Pilot Program Proposal N/A 57,970
Total Department of Energy and Environmental Protection 142,081
DEPARTMENT OF ECONOMIC AND COMMUNITY DEVELOPMENT:Tax Abatement Program 11000-ECD46400-17008 418,770 Payment in Lieu of Taxes (PILOT) 11000-ECD46400-17012-039 488,583 Swift Factory Brownfield's Project SID# 12052-46000-43236 33,006 Arts Catalyze Placemaking Program N/A 44,778 Arts Grant: Burns Latino Studies Academy 2013 ACPI-20619 10,000 Downtown Housing Study 41233 133,236 Brownsfield - 120 Wyllys 21058 3,879 Brownsfield - Albany/Woodland 21058 448,620 Brownsfield - 111 Sigourney Street 21058 174,318 John Rogers Proj#3400022017 2,355 Park Street Streetscape Phase III 12052-46000-43470 293,524 CCEDA II Home Ownership Appraisal GAP 12059-ECD46400-40577 162,176
Total Department of Economic and Community Development 2,213,245
TOTAL STATE FINANCIAL ASSISTANCE BEFOREEXEMPT PROGRAMS 169,780,565
EXEMPT PROGRAMSDEPARTMENT OF EDUCATION: Department of Education Public School Transportation 11000-SDE64000-17027 1,949,411 Education Cost Sharing 11000-SDE64000-17041 187,196,519 Excess Cost - Student Based 11000-SDE64000-17047 9,747,767
198,893,697 DEPARTMENT OF ADMINISTRATIVE SERVICES: School Construction - Interest 13009-DAS64000-40896 127,901 School Construction - Progress Payment 13009-DAS64000-40901 32,309,780 School Construction - Principal 11000-DAS64000-17049 1,797,433
34,235,114
OFFICE OF POLICY AND MANAGEMENTMashantucket Pequot/Mohegan Fund 12009-OPM20600-17005 6,664,829
6,664,829
Total Exempt Programs 239,793,640
TOTAL STATE FINANCIAL ASSISTANCE 409,574,205 $
See Notes to Schedule.N/A=Not Available
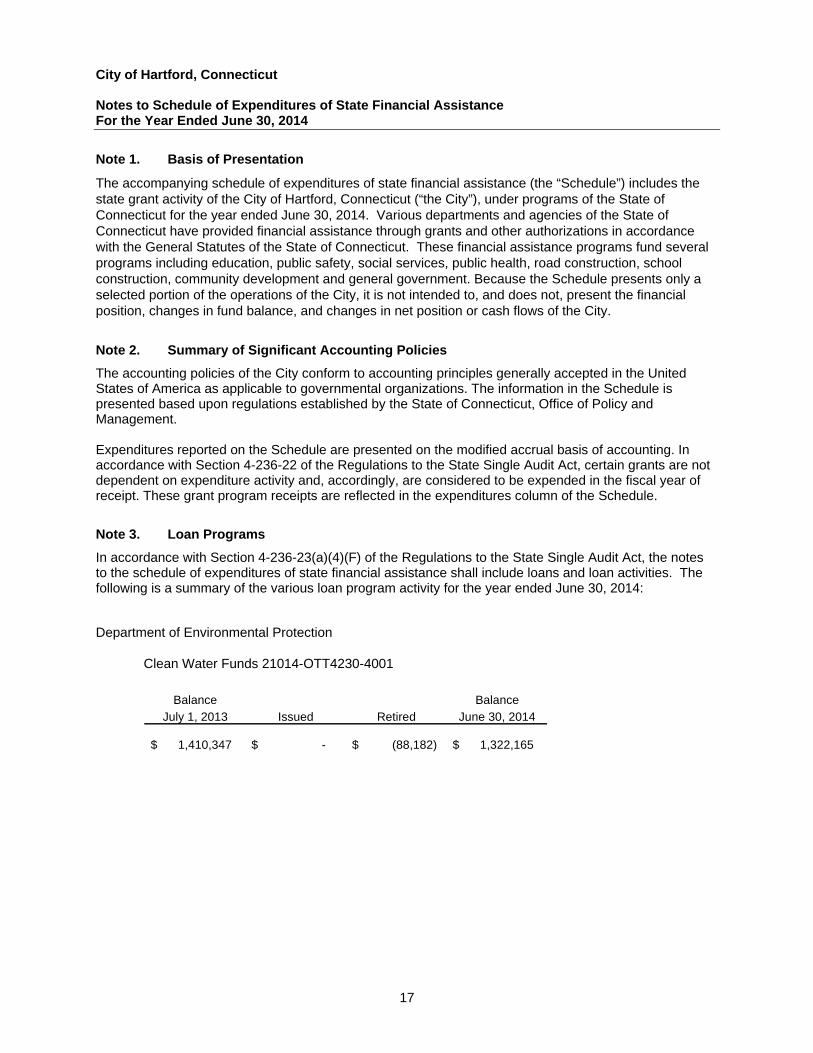
City of Hartford, Connecticut Notes to Schedule of Expenditures of State Financial Assistance For the Year Ended June 30, 2014
17
Note 1. Basis of Presentation
The accompanying schedule of expenditures of state financial assistance (the “Schedule”) includes the state grant activity of the City of Hartford, Connecticut (“the City”), under programs of the State of Connecticut for the year ended June 30, 2014. Various departments and agencies of the State of Connecticut have provided financial assistance through grants and other authorizations in accordance with the General Statutes of the State of Connecticut. These financial assistance programs fund several programs including education, public safety, social services, public health, road construction, school construction, community development and general government. Because the Schedule presents only a selected portion of the operations of the City, it is not intended to, and does not, present the financial position, changes in fund balance, and changes in net position or cash flows of the City.
Note 2. Summary of Significant Accounting Policies
The accounting policies of the City conform to accounting principles generally accepted in the United States of America as applicable to governmental organizations. The information in the Schedule is presented based upon regulations established by the State of Connecticut, Office of Policy and Management. Expenditures reported on the Schedule are presented on the modified accrual basis of accounting. In accordance with Section 4-236-22 of the Regulations to the State Single Audit Act, certain grants are not dependent on expenditure activity and, accordingly, are considered to be expended in the fiscal year of receipt. These grant program receipts are reflected in the expenditures column of the Schedule.
Note 3. Loan Programs
In accordance with Section 4-236-23(a)(4)(F) of the Regulations to the State Single Audit Act, the notes to the schedule of expenditures of state financial assistance shall include loans and loan activities. The following is a summary of the various loan program activity for the year ended June 30, 2014: Department of Environmental Protection
Clean Water Funds 21014-OTT4230-4001
Balance Balance
July 1, 2013 Issued Retired June 30, 2014
1,410,347 $ -$ (88,182) $ 1,322,165 $
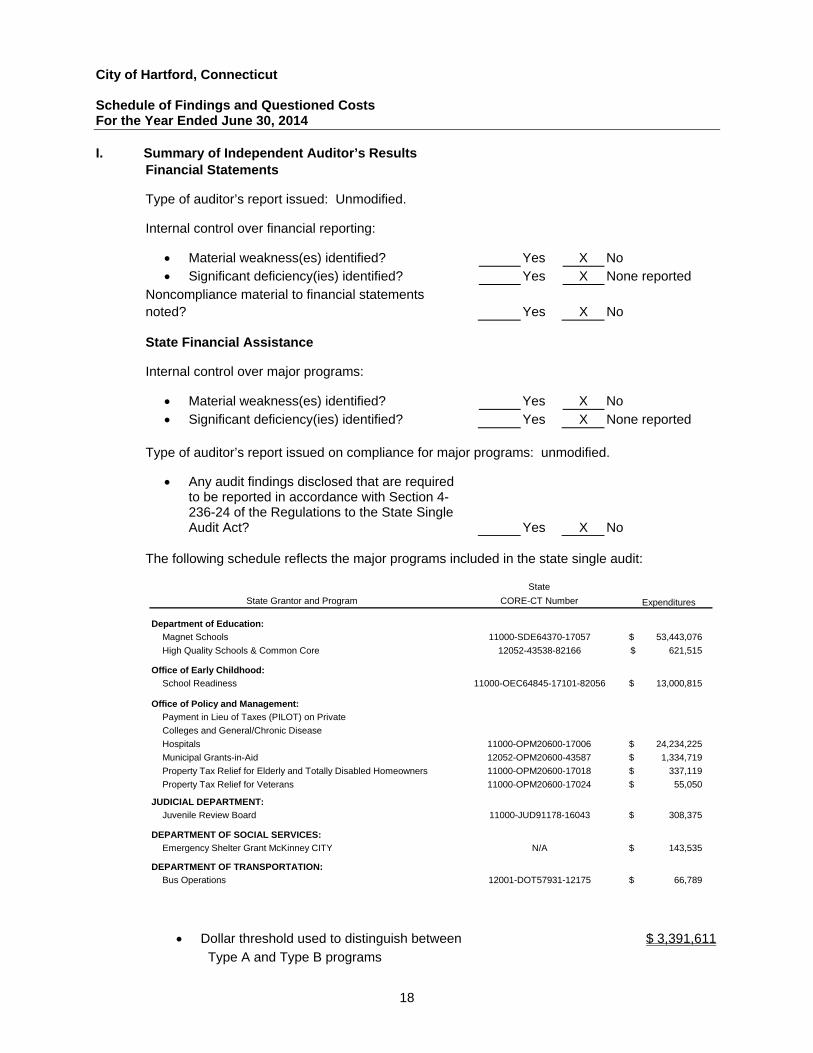
City of Hartford, Connecticut Schedule of Findings and Questioned Costs For the Year Ended June 30, 2014
18
I. Summary of Independent Auditor’s Results Financial Statements Type of auditor’s report issued: Unmodified. Internal control over financial reporting:
Material weakness(es) identified? Yes X No Significant deficiency(ies) identified? Yes X None reported
Noncompliance material to financial statements noted? Yes X No
State Financial Assistance Internal control over major programs:
Material weakness(es) identified? Yes X No Significant deficiency(ies) identified? Yes X None reported
Type of auditor’s report issued on compliance for major programs: unmodified.
Any audit findings disclosed that are required to be reported in accordance with Section 4-236-24 of the Regulations to the State Single Audit Act? Yes X No
The following schedule reflects the major programs included in the state single audit:
State
State Grantor and Program CORE-CT Number Expenditures
Department of Education:
Magnet Schools 11000-SDE64370-17057 53,443,076 $
High Quality Schools & Common Core 12052-43538-82166 621,515 $
Office of Early Childhood:
School Readiness 11000-OEC64845-17101-82056 13,000,815 $
Office of Policy and Management:
Payment in Lieu of Taxes (PILOT) on Private
Colleges and General/Chronic Disease
Hospitals 11000-OPM20600-17006 24,234,225 $
Municipal Grants-in-Aid 12052-OPM20600-43587 1,334,719 $
Property Tax Relief for Elderly and Totally Disabled Homeowners 11000-OPM20600-17018 337,119 $
Property Tax Relief for Veterans 11000-OPM20600-17024 55,050 $
JUDICIAL DEPARTMENT:
Juvenile Review Board 11000-JUD91178-16043 308,375 $
DEPARTMENT OF SOCIAL SERVICES:
Emergency Shelter Grant McKinney CITY N/A 143,535 $
DEPARTMENT OF TRANSPORTATION:
Bus Operations 12001-DOT57931-12175 66,789 $
Dollar threshold used to distinguish between
Type A and Type B programs
$ 3,391,611
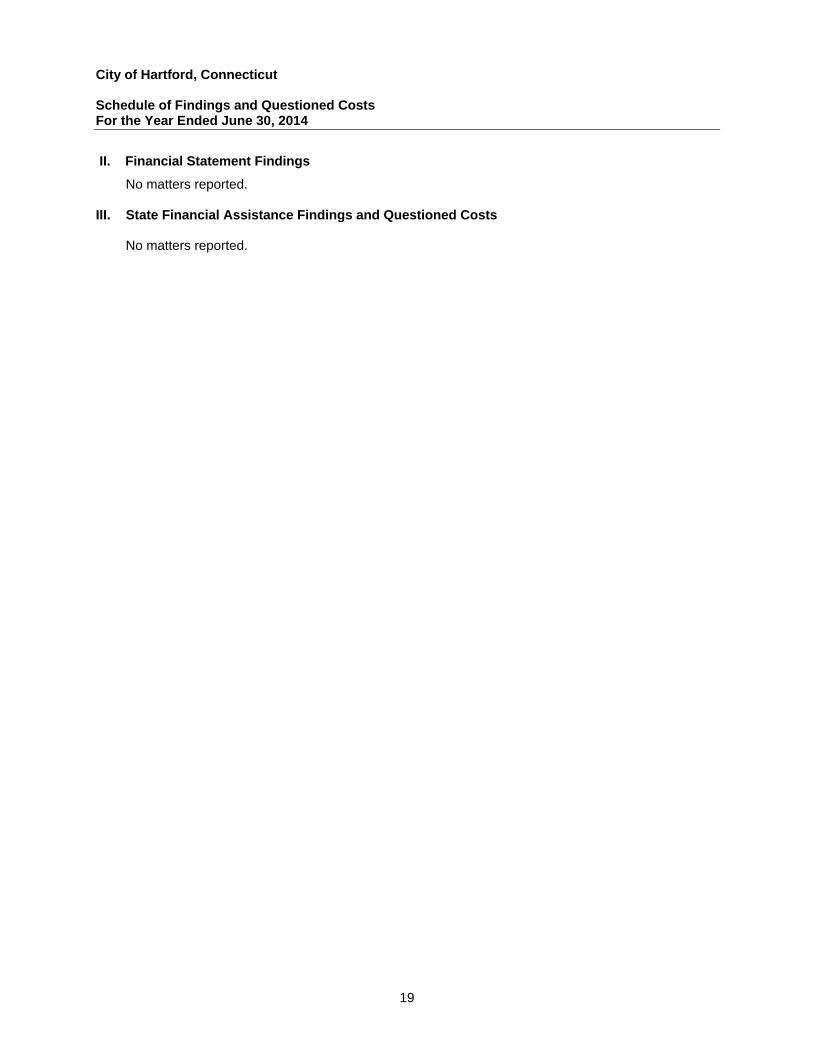
City of Hartford, Connecticut Schedule of Findings and Questioned Costs For the Year Ended June 30, 2014
19
II. Financial Statement Findings
No matters reported. III. State Financial Assistance Findings and Questioned Costs
No matters reported.
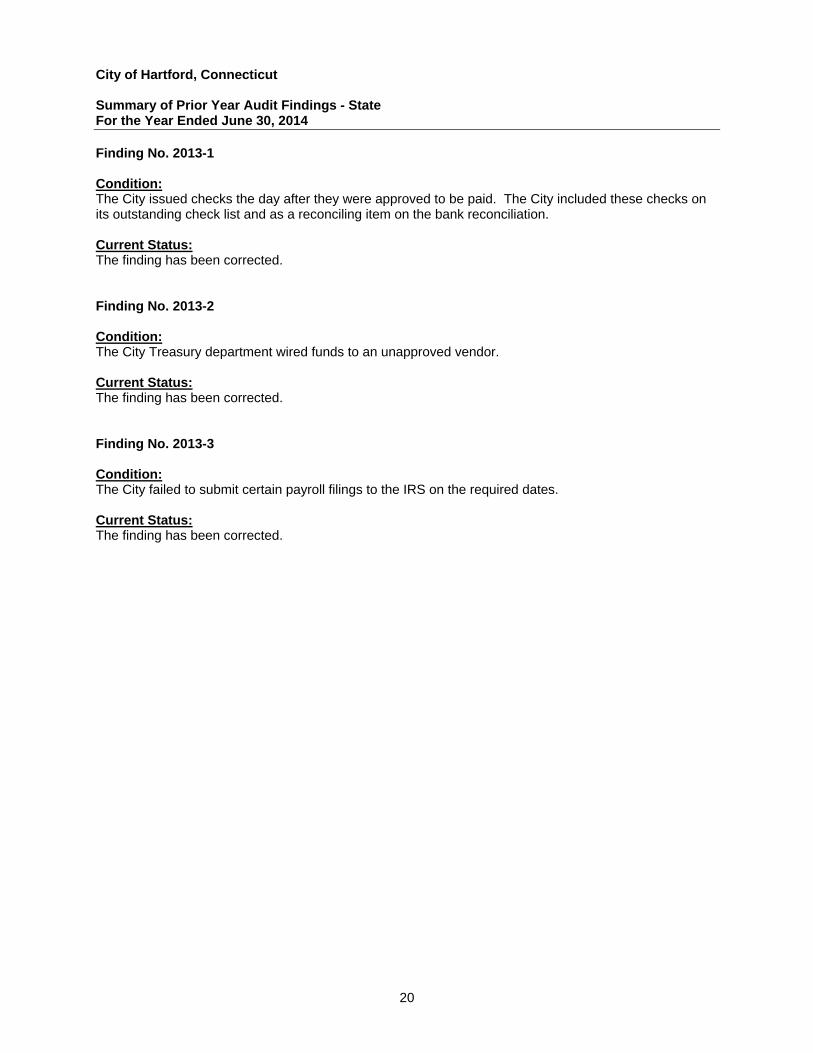
City of Hartford, Connecticut Summary of Prior Year Audit Findings - State For the Year Ended June 30, 2014
20
Finding No. 2013-1 Condition: The City issued checks the day after they were approved to be paid. The City included these checks on its outstanding check list and as a reconciling item on the bank reconciliation. Current Status: The finding has been corrected. Finding No. 2013-2 Condition: The City Treasury department wired funds to an unapproved vendor. Current Status: The finding has been corrected. Finding No. 2013-3 Condition: The City failed to submit certain payroll filings to the IRS on the required dates. Current Status: The finding has been corrected.


![NATIONAL INDEPENDENT AUTOMOBILE DEALERS ASSOCIATION … ン ] ORY Z... · CONNECTICUT CARMAX CONNECTICUT CarMax Hartford 89 Weston St. Hartford, CT 06120 Every Monday at 9:30am](https://img.pdfslide.net/doc/110x75/5f2a309c7fe1a033d770d656/national-independent-automobile-dealers-association-i-ory-z-connecticut.jpg)