Embed Size (px)
Citation preview
1
City of Johannesburg
Annual Report
2017/18
2
Contents
Executive Mayor's Foreword ................................................................................................................ 14
Statement by the City Manager ............................................................................................................ 19
1. Introduction and context .............................................................................................................. 25
1.1 Johannesburg: An overview ................................................................................................. 26
Demographics ............................................................................................................................... 26
Economic overview ....................................................................................................................... 27
Human Development .................................................................................................................... 28
Challenges ..................................................................................................................................... 28
1.2 The City’s strategic direction................................................................................................. 30
1.3 Future Outlook ...................................................................................................................... 32
1.4 Overview of this report ......................................................................................................... 32
2. Governance ................................................................................................................................... 33
2.1 The Legislature ...................................................................................................................... 34
2.1.1 Oversight and Standing Committees ............................................................................ 36
2.2 The Executive ........................................................................................................................ 37
2.2.1 The Administration ....................................................................................................... 39
2.3 Group audit opinions ............................................................................................................ 44
2.4 Group advisory oversight committees .................................................................................. 46
2.5 Insurance Covers ................................................................................................................... 47
2.6 Insurance Claims ................................................................................................................... 48
2.6.1 Group Audit Committee (GAC) ..................................................................................... 48
2.6.2 Group Performance Audit Committee (GPAC) ............................................................. 50
2.6.3 Group Risk Governance Committee (GRGC) ................................................................. 51
2.7 Board of Directors in the Municipal Entities ......................................................................... 53
2.8 Public participation ............................................................................................................... 54
2.8.1 Ward committees ......................................................................................................... 54
2.8.2 IDP Outreach ................................................................................................................. 55
3. Service Delivery Performance ....................................................................................................... 60
3.1 Water Services: Johannesburg Water .................................................................................. 60
Performance highlights ................................................................................................................. 61
Summary of performance ............................................................................................................. 61
Performance against IDP targets .................................................................................................. 65
3
Financial performance .................................................................................................................. 66
Employee relations ....................................................................................................................... 71
3.2 Electricity Services: City Power ............................................................................................ 71
Performance highlights ................................................................................................................. 72
Summary of performance ............................................................................................................. 72
Performance against IDP targets .................................................................................................. 75
Financial performance .................................................................................................................. 76
Employee relations ....................................................................................................................... 81
3.3 Waste Management Services: Pikitup ................................................................................. 81
Performance highlights ................................................................................................................. 82
Summary of performance ............................................................................................................. 82
Performance against IDP targets .................................................................................................. 88
Financial performance ................................................................................................................ 102
Employee relations ..................................................................................................................... 109
3.4 Housing Services: JOSHCO ................................................................................................. 110
Performance highlights ............................................................................................................... 110
Summary of performance ........................................................................................................... 110
Performance against IDP targets ................................................................................................ 121
Financial performance ................................................................................................................ 122
Employee relations ..................................................................................................................... 127
3.5 Municipal Road Services: The Johannesburg Roads Agency.............................................. 128
Performance highlights ............................................................................................................... 129
Summary of performance ........................................................................................................... 130
Financial performance ................................................................................................................ 133
Employee relations ..................................................................................................................... 134
3.6 Economic Services: The Johannesburg Development Agency ........................................... 135
Performance highlights ............................................................................................................... 135
Summary of performance ........................................................................................................... 136
Performance against IDP targets ................................................................................................ 137
Financial performance ................................................................................................................ 139
Employee relations ..................................................................................................................... 139
3.7 Joburg Market ..................................................................................................................... 140
Summary of performance ........................................................................................................... 140
Performance against IDP targets ................................................................................................ 141
Financial performance ................................................................................................................ 141
4
Employee relations ..................................................................................................................... 142
3.8 Joburg City Theatres ........................................................................................................... 142
Summary of performance ........................................................................................................... 142
Financial performance ................................................................................................................ 144
Employee relations ..................................................................................................................... 144
3.9 Joburg Property Company .................................................................................................. 145
Summary of performance ........................................................................................................... 145
Financial performance ................................................................................................................ 146
Employee relations ..................................................................................................................... 146
3.10 Joburg City Parks and Zoo ................................................................................................... 147
Summary of performance ........................................................................................................... 147
Financial performance ................................................................................................................ 149
Employee relations ..................................................................................................................... 149
3.11 Metrobus............................................................................................................................. 149
Summary of performance ........................................................................................................... 150
Financial performance ................................................................................................................ 152
Employee relations ..................................................................................................................... 153
3.12 Metro Trading Company ..................................................................................................... 154
Summary of performance ........................................................................................................... 154
Financial performance ................................................................................................................ 155
Employee relations ..................................................................................................................... 156
3.13 Economic Development Department ................................................................................. 156
Summary of performance ........................................................................................................... 156
Performance against IDP targets ................................................................................................ 157
3.14 Development Planning Department ................................................................................... 158
Summary of performance ........................................................................................................... 158
3.1 Housing Department ........................................................................................................... 161
Summary of performance ........................................................................................................... 161
Performance against IDP targets ................................................................................................ 162
3.2 Department of Social Development ................................................................................... 163
Summary of performance ........................................................................................................... 164
Performance against IDP targets ................................................................................................ 166
3.3 Public Safety ........................................................................................................................ 168
Summary of performance ........................................................................................................... 168
Performance against IDP targets ................................................................................................ 172

5
3.4 Community Development Department .............................................................................. 173
Summary of performance ........................................................................................................... 174
3.5 Health Department ............................................................................................................. 177
Summary of performance ........................................................................................................... 178
3.6 Transport Department ........................................................................................................ 180
Summary of performance ........................................................................................................... 180
3.7 Environment and Infrastructure Services Department ...................................................... 188
Summary of performance ........................................................................................................... 189
Performance against IDP targets ................................................................................................ 196
3.8 Performance against planned targets in 2017/18 .............................................................. 198
4. Organisational Development Performance ................................................................................ 213
4.1 Introduction to the municipal workforce ........................................................................... 213
4.1.1 Job Profiles inclusive of Job description and grading ................................................. 213
4.1.2 Organisation Culture ................................................................................................... 214
4.1.3 Employment Equity ..................................................................................................... 215
4.1.4 Employee Relations and Development ....................................................................... 215
4.2 Employee positioning, vacancies and turnover .................................................................. 216
4.2.1 Vacancies Time and Staff Turnover.......................................................................... 218
4.3 Managing the Municipal Workforce .................................................................................... 220
4.3.1 Group Human Capital Management ......................................................................... 220
4.3.2 Performance Management ................................................................................. 223
4.4 Capacitating the municipal workforce ................................................................................ 225
4.4.1 Competency Development ......................................................................................... 225
4.4.2 Training ....................................................................................................................... 227
4.5 Managing the municipal workforce expenditure ................................................................ 231
4.5.1 Municipal Employee Expenditure ............................................................................... 231
4.5.2 Sick leave ..................................................................................................................... 232
4.5.3 Disciplinary Action ....................................................................................................... 235
5. Group Chief Financial Officer’s Report ....................................................................................... 247
5.1 Introduction ........................................................................................................................ 247
5.2 Financial overview................................................................................................................. 247
5.3 ANALYSIS OF THE ANNUAL FINANCIAL STATEMENTS FOR THE FINANCIAL YEAR 2017/18 ...... 250
5.3.1 Statement of Financial Performance ......................................................................... 250
5.3.2 Statement of Financial Position .................................................................................. 254
5.4. CONSUMER DEBTORS ......................................................................................................... 254
6
5.5 CAPITAL EXPENDITURE ....................................................................................................... 255
5.6. FINANCIAL RATIOS ............................................................................................................. 255
5.7. AUDIT OPINION ................................................................................................................... 255
5.8. CONCLUSION ....................................................................................................................... 256
6. Annual Report of the Group Audit Committee ........................................................................... 257
7. Auditor-General Audit Findings .................................................................................................. 268
7.1 Report on the audit of the financial statements ................................................................ 268
7.2 Report on the audit of the annual performance report ..................................................... 272
7.3 Report on the audit of compliance with legislation ............................................................ 275
7.4 Internal control deficiencies ............................................................................................... 277
7.5 Other reports ...................................................................................................................... 278
Annexure A: Annual Financial Statements .......................................................................................... 279
Annexure B: Auditor-General’s responsibility for the audit .............................................................. 280
Annexure C: Corrective Action Taken / To Be Taken to Resolve Auditor General Findings ............... 282

7
List of tables
Table 1: Section 79 Committee Chairpersons ...................................................................................... 36
Table 2: Group audit opinions .............................................................................................................. 44
Table 3: Group Audit Committee composition .................................................................................... 49
Table 4: Johannesburg Water completed projects .............................................................................. 68
Table 5: Major bulk wastewater capital projects ................................................................................. 69
Table 6: Reservoir projects................................................................................................................... 70
Table 7: Johannesburg Water staff distribution .................................................................................. 71
Table 8: City Power meter reading performance ................................................................................ 73
Table 9: City Power meter reading contribution to estimations ......................................................... 74
Table 10: Improvement plan for meter reading .................................................................................. 74
Table 11: City Power performance against IDP targets ....................................................................... 75
Table 12: City Power revenue .............................................................................................................. 77
Table 213: City Power capital projects ................................................................................................. 79
Table 14: City Power controllable capital projects .............................................................................. 80
Table 15: City Power non-controllable capital projects ....................................................................... 80
Table 16: City Power revised structures .............................................................................................. 81
Table 17: Pikitup waste diversion programme .................................................................................... 83
Table 18: Total tonnages of waste handled and collected by the entity (2013/14 – 2017/18) .......... 85
Table 19: Pikitup fleet complement ..................................................................................................... 87
Table 20: Landfill audits ....................................................................................................................... 88
Table 21: Projects Status Report (Construction) as at 30 June 2018 ................................................. 111
Table 22: JOSHCO maintenance cost as at 30 June 2018 .................................................................. 114
Table 23: JOSHCO planned maintenance ........................................................................................... 114
Table 24: JOSCHO deferred planned maintenance as at 30 June 2018 ............................................. 116
Table 25: JOSCHO service delivery challenges ................................................................................... 119
Table 26: Participatory Site Model: Housing Development as at 30 June 2018 ................................ 120
Table 27: JOSCHO performance against IDP targets .......................................................................... 121
Table 28: JOSCHO Revenue Streams for the Year ended 30 June 2018 ............................................ 122
Table 29: JOSCHO Personnel Cost by Occupational Level ................................................................. 127
Table 30: JRA Capital spending 2017/18 ............................................................................................ 134
Table 31: JRA employee breakdown and vacancy ratio..................................................................... 134
Table 32: JDA performance against IDP targets ................................................................................. 137
Table 33: Joburg Market performance against IDP targets ............................................................... 141
Table 34: Joburg Market staff establishment .................................................................................... 142
Table 35: Metrobus staff establishment and vacancies .................................................................... 153
Table 36: Economic Development Department performance against IDP targets ........................... 157
Table 37: Department of Housing performance against IDP targets ................................................. 162
Table 38: Social Development performance against IDP ................................................................... 166
Table 39: JMPD service delivery ......................................................................................................... 168
Table 40: Fire Services delivery .......................................................................................................... 169
Table 41: Public Safety capital expenditure ....................................................................................... 170
Table 42: Public safety performance against IDP .............................................................................. 172
Table 43: Public safety service objectives performance .................................................................... 173
8
Table 44: Financial performance (clinics) .......................................................................................... 179
Table 45: Capital expenditure 2017/18: Health ................................................................................. 179
Table 46: BRT operational service statistics ....................................................................................... 181
Table 47: Transport Capital expenditure R’000 ................................................................................. 186
Table 48: Waste management ........................................................................................................... 191
Table 49: GHG emissions offset ......................................................................................................... 195
Table 50: EISD performance against IDP ............................................................................................ 196
Table 51: Institutional Service Delivery Budget Implementation Plan 2017/18 ................................ 198
Table 52: Employee positioning for the City of Johannesburg 2017/18 ............................................ 217
Table 53: Vacancy rate for 2017/18 ................................................................................................... 219
Table 54: Turn-over rate comparison per year .................................................................................. 219
Table 55: Human Capital Management Policies and Plans completed and reviewed during 2017/18
............................................................................................................................................................ 222
Table 56: Skills matrix for the City’s employees ................................................................................ 226
Table 57: Skills matrix ........................................................................................................................ 227
Table 58: Expenditure on skills development during 2017/18 .......................................................... 229
Table 59: MFMA Competency Training.............................................................................................. 230
Table 60: Employees whose salaries were increased due to their positions being upgraded during
2017/18 ............................................................................................................................................... 231
Table 61: Number of days and cost of sick leave ............................................................................... 232
Table 62: Number and cost of injuries on duty.................................................................................. 235
Table 63: Number and period of suspension ..................................................................................... 237
Table 64: Disciplinary action taken on cases of financial misconduct ............................................... 244
Table 65: Corrective Action Taken / To Be Taken to Resolve Auditor General Findings ................... 282
List of figures
Figure 1: CoJ strategic planning ........................................................................................................................... 30
Figure 2: Legislative and executive composition of the City of Johannesburg .................................................... 33
Figure 3: Delegations of authority ....................................................................................................................... 34
Figure 4: City organisational structure ................................................................................................................ 37
Figure 5: CoJ Group functions .............................................................................................................................. 41
Figure 6: CoJ departments ................................................................................................................................... 42
Figure 7: Group reporting processes .................................................................................................................... 43
Figure 8: Audit opinion analysis ........................................................................................................................... 45
Figure 9: CoJ regions ............................................................................................................................................ 55
Figure 10: The City’s waste minimisation programme ...................................................................................... 191
Figure 11: Map of stations in network ............................................................................................................... 193
Figure 12: Analysis of skills matrix ..................................................................................................................... 227
Figure 13: Average sick days per employee category ........................................................................................ 233
Figure 14: Average number of days’ sick leave per employee cadre, excluding injuries on duty ..................... 234
Figure 15: Composition of revenue ................................................................................................................... 248
Figure 16: Composition of expenditure ............................................................................................................. 250
Figure 17: Annual generated surplus ................................................................................................................. 252
Figure 18: Net outstanding consumer debtors .................................................................................................. 252
9
Abbreviations
AET Adult Education Training
AFS Annual Financial Statements
AG Auditor-General
ARP Alexandra Renewal Programme
AWTT Alternative Waste Treatment Technologies
BOCA Bus Operating Contract Agreement
BOC Bus Operating Company
BRT Bus Rapid Transit
CAPEX Capital expenditure
CBD Central Business District
CEO Chief Executive Officer
CIO Chief Information Officer
COGTA Cooperative Development and Traditional Affairs
CPF Community policing forum
CRO Chief Risk Officer
CM City Manager
CoJ City of Johannesburg
DEA Department of Environmental Affairs
DDI Domestic Direct Investment
DWS Department of Water and Sanitation
EAP Employee Assistance Programme
ECD Early Childhood Development
ECDC Early Childhood Development Centre
EEA Environmental Education and Awareness
EISD Environment and Infrastructure Services
EMS Emergency Management Services
EMT Executive Management Team
EPWP Expanded Public Works Programme
ESP Expanded Social Package
FBS Free Basic Services
FTC Fixed Term Contract
GAC Group Audit Committee
GDARD Gauteng Department of Agriculture and Rural Development
GDP Gross Domestic Product
GDS Growth and Development Strategy
GFIP Gauteng Freeway Improvement Programme
GHCM Group Human Capital Management
GHG Greenhouse Gas
10
GPAC Group Performance Audit Committee
GRAP Generally Recognized Accounting Practice
GRGC Group Risk Governance Committee
GVA Gross Value Added
ICT Information and Communication Technology
IDP Integrated Development Plan
IIRF International Integrated Reporting Framework
ILP Individual Learning Plan
IMATU Independent Municipal Allied Trade Union
IT Information Technology
ITS Intelligent Transport Systems
IWMP Integrated Waste Management Plan
JCPZ Johannesburg City Parks and Zoo
JCT Joburg City Theatres
JDA Johannesburg Development Agency
JITI Johannesburg International Transport Interchange
JMPD Johannesburg Metro Police Department
JOSCHO Johannesburg Social Housing Company
JPC Joburg Property Company
JRA Johannesburg Roads Agency
JW Johannesburg Water
KPI Key Performance Indicators
LIS Library and Information Services Directorate
MFMA Municipal Finance Management Act
MPAC Municipal Public Accounts Committee
MFMA Municipal Finance Management Act
MSA Municipal Systems Act
MTC Metro Trading Company
NMT Non-motorised Transit
NT National Treasury
OHS Occupational Health and Safety
OOC Out of Commission
OPCA Operation Clean Audit
Opex Operating Expenditure
PAAZA Pan African Association of Zoos and Aquaria
PAIA Public Access to Information Act
PSHB Polyphagous shot-hole borer
PWD People with disabilities
RCR Round Collected Refuse
REMCO Remuneration Committee
ROI Return on Investment

11
SADC Southern African Development Community
SALGA South African Local Government Association
SALGBC South African Local Government Bargaining Council
SAMWU South African Municipal Workers Union
SANDF South African National Defence Force
SAPS South African Police Service
SDBIP Service Delivery and Budget Implementation Plan
SHRA Social Housing Regulatory Authority
SLA Service Level Agreement
TOD Transit Oriented Development
TOR Terms of Reference
UDF Urban Development Framework
UN United Nations
UPS Uninterrupted Power Supply
USDG Urban Settlement Development Grant
VIP Ventilated improved pit
WBOT Ward-based outreach teams
WIMS Waste Information Management System
WMU Water Management Units
WSP Workplace Skills Plan
WWTW Wastewater Treatment Works
12
About this report
Statutory annual reporting process
The Municipal Finance Management Act (MFMA), the Municipal Systems Act (Section 46) and
National Treasury's MFMA Annual Report Circular 63 require the City of Johannesburg (also
referenced as 'the City' or 'CoJ') and its municipal entities to prepare an annual report for each
financial year covering both financial and non-financial performance. The report is informed
by guidelines provided by National Treasury Circular 63. This report is structured as follows;
Executive Mayor's Foreword
Statement by the City Manager
Chapter 1: Introduction and context
Chapter 2: Governance
Chapter 3: Service Delivery Performance
Chapter 4: Organisational Development Performance
Chapter 5: Group Chief Financial Officer’s Report
Chapter 6: Annual Report of the Group Audit Committee
Chapter 7: Auditor-General Audit Findings
Annexures
Referencing content online
The City of Johannesburg’s 2017/18 Integrated Annual Report is available on
www.joburg.org.za.
Scope and Boundary of the Integrated Report
The boundary of this report is limited to performance reporting as it relates to the City of
Johannesburg during 2017/18. The City’s Integrated Report will be considered by Council in
January 2019 for the period 1 July 2017 to 30 June 2018.
Feedback
13
The City of Johannesburg aims to establish and maintain constructive and informed
relationships with its stakeholders. Accordingly, please direct any feedback on this report to
Assurance
The integrity of the Integrated Annual Report is overseen by the City's independent oversight
committees (Group Performance Audit Committee and Group Audit Committee) and the
City’s Municipal Public Accounts Committee. The Auditor-General (South Africa) audited the
City's reported financial and non-financial performance.
Contact at the City of Johannesburg
1st Floor, A Block P.O. Box 1049
Metropolitan Centre Johannesburg
158 Loveday Street South Africa
Braamfontein 2000
Tel: +27 (0) 11 407 7356
Fax: +27 (0) 11 403 7372
Website: www.joburg.org.za
14
Executive Mayor's Foreword
The 2017/18 financial year was a year of truly new beginnings. The multi-party government passed its
first budget and IDP, after inheriting a budget that paid little attention to the real challenges affecting
the City, and its people.
Our multi-party government’s budget ensured that the City was able to direct substantial resources
away from luxury, nice-to-have expenditure items towards more critical service delivery initiatives
aimed at improving the lives of our residents.
Challenges remain but decisive action by the multi-party government has put the City on a path
towards financial sustainability, leading to improved revenue collection and job creation.
All of this was made possible by a stable management, under the stewardship of City Manager, Dr
Ndivhoniswani Lukhwareni and his very capable senior management team.
The year under review thus bore witness to a City steadily rebuilding itself following years of
stagnation.
The year under review
Although major successes have been registered, some of the challenges we faced during our first year
in government still remain.
The City’s inherited infrastructure backlog of R170 billion continues to grow owing to historic
underspending in this regard. The tremendous strain on the City’s infrastructure is worsened by an
inward migration of approximately 3 000 people a month, which also affects the City’s already high
unemployment.
The City of Joburg is home to about 5 million residents, more than 800 000 of whom are unemployed.
Housing in the City is a priority area that will require a substantial cash injection from National
Government, if is to be resolved adequately. The City is faced with a housing backlog, conservatively
estimated to exceed 300 000 units, forcing a number of residents to reside across Johannesburg’s
almost 200 informal settlements.
15
Enter the Inner City Revitalisation Project - an ambitious, potentially multi-billion Rand project aimed
at turning the Joburg Inner City into a construction site by offering a number of buildings to the private
sector, to be renovated and turned into affordable, low-cost housing, student accommodation and
rental space for small businesses based in the Inner City.
The project really took off in the financial year under review, with the first batch of 84 properties
approved by Council to be offered to the private sector for development. More buildings will be
offered in the coming financial year.
Be that as it may, for this project to have any reasonable chance of success, the City must continue to
pay careful attention to the Rule of Law in the Inner City, and surrounding areas. To this extent, the
JMPD recruited 1500 new officers who began their training in November 2017 and are expected begin
patrolling the City’s streets in 2019. They were recruited to bolster an under-capacitated JMPD.
These new officers will be guided by our equally new Chief of Police, David Tembe, who has managed
to energise the JMPD and turn it into a respectable policing unit.
The Rule of Law also extends to the corridors of power, where the City’s newly created anti-corruption
unit, the Group Forensic and Investigation Services (GFIS) has unearthed more than 4000 cases of
corruption and maladministration, involving transactions totaling R24 billion.
In addition to this achievement, the City conducted a skills audit of top management in order to ensure
that our employees possess the right skills for the appropriate positions. The audit was hugely
successful and revealed that we are on the right track to creating a professional civil service in
Johannesburg.
Above all, my administration introduced Diphetogo – an initiative aimed at ensuring that the City
directs the majority of its financial resources to those projects that are urgent, and which will have the
biggest and most immediate material impact on our people. This initiative – aimed at driving real,
transformational change in the City - has seen us direct more money to the things that matter most,
including basic services, infrastructure, housing and public safety.
This initiative has enabled the City to extend operating hours at 13 of our clinics. In the 2018/19
financial year, additional financial resources will be deployed to extend operating hours at more
clinics.
16
Still on healthcare, the City launched a number of substance abuse treatment centres to equip the
City in its fight against a drugs scourge that threatens to get out of control. Alongside this initiative, is
another that is meant to empower our young people.
The creation of Opportunity Centres is a direct response against high unemployment in the City,
especially among the youth. In these centres, entrepreneurs across the City have spaces in which to
seek information to help build their companies and create jobs.
Financial Performance
The 2017/18 financial year had its challenges. The City functioned within a constrained environment,
with a national economy that grew at less than 1%. This situation worsened the country’s
unemployment and hampered residents’ ability to pay for services.
But, even in the midst of struggle, there was victory.
Against the backdrop in which our Country continued to hemorrhage jobs, Johannesburg achieved an
additional 109 000 jobs in the first two quarters of 2018 dropping unemployment levels by 1.5%. Even
as the economic engine, the ranks of the unemployed in Gauteng swelled by 115 000.
In assessing the socio-economic landscape of South Africa no single issue has greater importance than
jobs.
At the centre of so many of our problems, whether it be landlessness or crime or housing, lies the fact
that millions of South Africans do not have work.
Despite the prevailing negative environment, the City of Johannesburg’s job increase was backed by a
record R8.7 Billion rand in facilitated external investment in 2017/18.
This exceeded any prior year’s achievement by over R3 Billion.
In the previous financial year, the City embarked on a painful but necessary exercise to drastically cut
wasteful expenditure through the introduction of austerity measures. Items affected included self-
promoting advertising; marketing; domestic and international travel; consulting and professional fees;
and conferences and seminars.
17
This important exercise netted the City a saving of approximately R500 million.
Armed with this additional cash, the City spent on critical service delivery areas such as the
maintenance of traffic and street lights, repair of potholes, upgrade of informal settlements, including
on the electrification of Slovo Park, and the capacitation of key City departments such as Development
Planning and the Valuations Unit.
At the end of the 2017/18 financial year, the City achieved 93% capital expenditure and 99%
expenditure of the Urban Settlements Development Grant.
Future Outlook
The 2017/18 financial year allowed the multi-party government to assume the reins of the City, in the
truest way possible. We passed our first budget and IDP and put into motion a programme designed
to redirect spending away from nice-to-have items towards critical service delivery projects. With an
eye to the future, the multi-party government, comprising the various political parties that make up
the coalition that governs the City of Joburg, through the Integrated Development Plan (IDP), evolved
its 10-Point Plan into the mayoral 9 priorities, which read as follows:
1. Promote economic development and attract investment towards achieving 5%
economic growth that reduces unemployment by 2021;
2. Ensure pro-poor development that addresses inequality and poverty and provides
meaningful redress;
3. Create a culture of enhanced service delivery with pride;
4. Create a sense of security through improved public safety;
5. Create an honest and transparent City that fights corruption;
6. Create a City that responds to the needs of citizens, customers, stakeholders and
businesses;
7. Enhance our financial sustainability;
8. Encourage innovation and efficiency through the Smart City programme; and
9. Preserve our resources for future generations.
In line with these priorities, the City undertakes that, in the 2018/19 financial year, we will expand on
the Diphetogo programme in order to accelerate the pace of change and improve the quality of life of
residents.
18
Gratitude
I would like to thank the City Manager, Dr Lukhwareni, and the countless other employees of the City
who have embraced the notion of Service with Pride.
I would also like to express my appreciation to the Members of the Mayoral Committee for working
tirelessly to deliver on our changed mandate in the respective City departments and entities.
I would like to pay tribute to my coalition partners for their significant contribution to this multi-party
government and the delivery of change to the residents of Johannesburg. Similarly, the role played by
the EFF and their demonstrable commitment to change requires acknowledgement.
Finally, I must thank the Speaker of Council for his ongoing support and the leading role he plays in
ensuring that Council fulfills its important oversight function.
In the 2018/19 financial year, I look forward to continued progress in restoring the City of Joburg as a
beacon of opportunity. I maintain my belief that a Johannesburg that works is a South Africa that
works.
Cllr Herman Mashaba
Executive Mayor
19
Statement by the City Manager
The 2017/18 financial year has seen significant strides made in the delivery of services, and the
ongoing realisation of a new vision for Johannesburg, that of a ‘City that Works’.
Johannesburg is a global, competitive city, and while it remains the economic engine of South Africa,
and a place of vibrant diversity, like other global cities, it faces ongoing challenges around employment
growth and job creation, sustainable development and the creation of a resilient city.
Addressing these challenges remains a key focus in the work of the City. To this end, nine strategic
priorities were identified for the 2016/21 term of office, to ensure focused and effective service
delivery that prioritises the needs of our residents. While detailed performance information is
contained later in this report, here I highlight some of the key successes towards the achievement of
these nine priorities.
Priority 1: Promote economic development and attract investment towards achieving 5% economic
growth that reduces unemployment by 2021
The first priority identified for this IDP cycle is that of the promotion of economic development.
Specifically, the City aims to create an enabling environment that supports job creation. It will also
ensure optimally managed job opportunities within its own institutional framework – with an
awareness of additional long-term spin-off prospects of these opportunities, into the wider city
environment. By 2021, the City aims to have achieved 5% economic growth.
In 2017/18, departments and entities continued to ensure that wherever possible, procurement and
spending targeted small and medium owned enterprises, black owned and women owned companies.
Major service delivery entities such as City Power achieved a 40% spend on black owned companies
in 2017/18, while the Joburg Property Company supported over 1200 SMMEs through property
transactions.
R1.4 billion cumulative rand value (for the financial year under review) attraction of investment in the
City’s property transactions was achieved, although construction has not yet started on these. The
construction value on the ground totalled R1.1 billion.
The Expanded Public Works Programme was another key deliverable under this priority, with entities
ensuring that job opportunities for the unemployed are provided through projects in order to ensure
the transfer of skills and poverty and income relief. The City created 21 696 EPWP jobs in 2017/18.
The regeneration of CBDs, and the development of areas to attract investment saw significant success,
with the Johannesburg Development Agency (JDA) formalising area-based partnerships, completing
regeneration plans and awarding contracts. These are concentrated in areas of need, and potential
investment. Twelve projects are at a practical completion stage with highlights including the Great
20
Walk pedestrian bridge and sidewalk, the construction of new sports centres, and the Hillbrow Tower
precinct.
Joburg Market saw an 8.71% increase in the tonnage traded in 2017/18, while programmes focused
on youth development had Joburg City Theatres providing music and drama tuition programmes to
almost 2 000 youths.
JRA’s rehabilitation designs were completed and planned for implementation during the coming
financial years. Four new pedestrian bridges will improve pedestrian safety and mobility.
Priority 2: Ensure pro-poor development that addresses inequality and poverty and provides
meaningful redress
The second priority is focused on redress, development and the upliftment of poor communities. Pro-
poor development means ensuring that the City's resources and funds are focused on addressing
spatial and all forms of income inequality, in order to ensure inclusive and diverse communities.
Numerous City Power programmes are linked to achieving the priority of pro-poor development.
These include job creation programmes, SMME and BBBEE support programmes, a skills development
programme, as well as the electrification of informal settlement programme.
Other pro-poor initiatives include the delivery of basic sanitation to 620 households and the provision
of 1 159 social housing units for the disadvantaged. A total of 3 597 title deeds were issued to
beneficiaries. In 2017/18 numerous groups were given free, or discounted, theatre tickets; this
included: almost 35 000 tickets were provided to school learners, over 13 000 to various communities
and over 4 500 to senior citizens.
Metrobus provided discounts on coupon fares or multi-journey fares, students and pensioners.
Almost 80% of commuters are using coupons for trips bought in advance at a discount of 25%.
Priority 3: Create a culture of enhanced service delivery with pride
Improving the quality of services received by the residents of Johannesburg is the key focus of the
third priority. This requires developing a culture of enhanced service-delivery and instilling a sense of
pride in the City's employees, especially with regards to the manner in which they interact with the
public on a daily basis.
A prerequisite is ensuring that all employees of the City uphold the motto of ‘service with pride’. A
professional, committed and responsive civil service will help to attract investment, which will in turn
stimulate economic growth and job creation.
In 2017/18, City Power successfully launched the LIGHTS ON! Campaign to support the organisation’s
efforts in acquiring and retaining the right people. Customer responsiveness is also a key aspect of
21
Johannesburg Water’s programmes. In the year under review, the response time to water bursts
restored within 48 hours of notification was 89.09% against a target of 95%, and for sewer blockages
cleared within 24 hours of notification: 94.94% against a target of 96%. Continued efforts were made
to reduce the number of bursts outstanding for longer than seven days. To this end, the number of
outstanding works order longer than seven days decreased by 53% year on year. Minimum services
standards are being implemented which will improve response times even further.
Johannesburg City Parks and Zoo distributed 901 fruit trees and 3 064 ornamental trees were planted.
The entity also achieved 100% compliance against its grass cutting schedule, and 100% adherence to
animal management practices.
Metrobus took 47 drivers through a structured Driver Development Programme focusing on customer
centricity, health and safety, fire-fighting and specialised operations training.
Priority 4: Create a sense of security through improved public safety
The focus of this priority is on the need for more visible policing in the city, in order to improve public
safety and develop a greater sense of security for the residents of Johannesburg. This will be achieved
by deploying additional JMPD personnel on the ground to fight crime. This priority also intends to
provide equal access to quality police services and safety support across the entire city.
City Power’s focus on combatting cable theft saw seven suspects sentenced to ten years imprisonment
each. Safety initiatives were implemented in 11 new parks in 2017/18, bring the total number of parks
with such initiatives to 100. These initiatives include park ranger patrols and special blitz operations
with SAPS and JMPD.
The City held 6 059 traffic enforcement operations in 2017/18. Other achievements include: 84% of
Priority 1 medical calls were responded to within 15 minutes, while 74% of Priority 2 fire calls were
responded to within 15 minutes.
Priority 5: Create an honest and transparent City that fights corruption
The fifth priority is critical – continuing the fight against corruption. To this end, the City's newly
appointed corruption-fighting team is engaging in active investigations to identify areas of
mismanagement and maladministration with the objective of creating an honest and transparent City
that serves the poor and fights corruption.
In 2017/18, 16 preventative measures were implemented across all departments and entities, and
99.9% of reported matters were investigated. There were 245 by-law enforcement operations.
22
Priority 6: Create a City that responds to the needs of citizens, customers, stakeholders and
businesses
Priority 6 ensures that customers and citizens feel acknowledged, through the operationalisation of a
refined, shared and comprehensive customer care charter that puts people first. Customers will see
clear evidence of the care the City takes in responding to queries and delivering quality services. They
will experience responsiveness and a proactive stance from all who work within the City, regardless of
the mechanism or platform through which the City is engaged.
This priority emphasises the need for efficiency and productivity with the demonstration of
‘appropriate leadership and delivery by example’ expected of all who those work within and deliver
for the City. The needs of stakeholders are also being prioritised to create a more resilient, responsive
city.
Priority 7: Enhance our financial sustainability
The City’s ability to generate and collect revenue, and enforce a level of financial accountability, is key
to its long-term financial stability and to attracting financing and investment in the future. Through
this priority, the City will work to improve investor confidence and mobilise financial resources from
public and private partnerships, in order to continue to support service delivery and improve the
quality of life.
In 2017/18, the City spent 91% of its capital budget, and achieved a surplus of R2.9 billion. Revenue
collection was 91%, with the City improving data management for more accurate billing. It also
reduced the backlog of queries especially around high estimations on electricity and water readings.
The City received an unqualified audit in 2017/18, a reflection of clean administration. In addition,
clean audits were achieved by four municipal entities.
Priority 8: Encourage innovation and efficiency through the Smart City programme
Priority 8 is focused on the development of a Smart City, that is conducive to the development of
innovative small businesses, and the creation of access to market opportunities. The City’s Smart City
programme will link its capabilities and create a better-performing government. Partnerships with
knowledge partners, technology companies, research institutes and universities that are at the
forefront of research and development are being set up, and improved service delivery will take place
through real-time monitoring and information management, and optimal management of resources.
Priority 9: Preserve our resources for future generations
23
The final priority looks at the preservation of the city’s resources for future generations. This will
foster economic growth, promote social and human development, make sure that there is good
governance and do no harm to the environment. Johannesburg will be able to provide a clean,
healthy, safe environment to our children’s generation and for generations after that.
The City plays an important role in ensuring the preservation of good quality water and clean air, the
management of land, and ensuring by-law enforcement regarding the exploitation of natural
resources. To this end, a number of waste minimisation initiatives are proposed such as the rollout of
separation at source throughout the city and the development of waste management infrastructure
supportive of waste minimisation and recycling.
Pikitup ensured the diversion of 94 355 tons of total waste away from landfills. Pikitup provides a
waste collection service to 858 313 formal households on a weekly basis. Over 25 000 240L bins were
delivered in the period under review. The majority of new bins were rolled out to formalised areas as
well as providing replacements on backlogs associated with stolen or damaged bins.
In 2017/18, 41 355.5 tons CO₂ in greenhouse gas emissions was offset. Johannesburg City Parks and
Zoo also has a number of programmes linked to environmental management in the City. 210 hectares
of alien vegetation were cleared in 2017/18, five wetlands were rehabilitated, four areas were cleaned
of invasive plants from water bodies and four areas of reeds were controlled. The entity also cleared
25 hectares of river trails.
In 2017/18, the JRA resurfaced approximately 301.12 lane km against an annual target of 250 lane km,
across the city (key roads include Jan Smuts Avenue, Rivonia Road, Republic Road, 20th Avenue in
Alexandra). The City is also focused on upgrading of road infrastructure, in particular the upgrading
of gravel roads to tar roads.
These performance highlights are evidence of a municipal workforce that is delivering services to the
City’s communities. In 2018/19, the City will continue to improve on its delivery, focusing on the
stabilisation of City’s finances and fiscal discipline, the implementation of minimum service delivery
standards, and the resolution of issues around contracts impacting areas of delivery such as waste
management, development initiatives etc.
In conclusion, let me thank the Executive Mayor, Members of the Mayoral Committee and other
political leadership for their support over the past financial year. The Speaker of Council, Section 79
Committees and the City’s advisory committees have also played critical roles in supporting and
monitoring delivery in the City.
On the administrative side, I am grateful to the Chief Operations Officer, Group Chief Financial Officer,
Group Heads, Cluster Conveners, Executive Heads, Boards of Directors, Managing Directors and the
entire staff of the City and its entities for their support in ensuring effective service delivery and the
24
achievement of the City’s goals, especially in so far as they related to ongoing clean governance and a
professional civil service.
As we continue to emphasise in all of our programmes and projects, we aim to establish an honest
and responsive government; that listens to the people and prioritises their needs. 2017/18 has seen
significant progress in this regard, and I remain committed to our leadership’s goals of delivering
services to the people of Johannesburg with pride and dignity, and ensuring that we always put the
residents of our city first.
Dr Ndivhoniswani Lukhwareni
City Manager
25
1. Introduction and context
On an annual basis, the City of Johannesburg prepares an Annual Report, to provide an overview of
its performance in the previous financial year. This is based on the requirements of the Municipal
Systems Act (MSA), 32 of 2000, Section 46(2), as well as the MFMA Circular 63 on annual reporting.
The report reflects the City’s governance arrangements, its performance against the indicators and
targets contained in the annual review of the Integrated Development Plan, financial information
including the report of the Auditor-General, and detailed financial statements.
The municipality and municipal entities prepare an annual Integrated Report (IR) in accordance with
the International Integrated Reporting Framework (IIRF) as well as Treasury Regulations, King IV on
Corporate Governance, the Municipal Finance Management Act (MFMA) (Act No. 56 of 2003), Circular
63, the Municipal Systems Act (MSA) (Act No. 32 of 2000) and the Companies Act (Act No. 71 of 2008).
It is the cornerstone of the City of Joburg Municipality to structure and manage its administration,
budgeting and planning process to give priority to basic needs of the community, and to promote the
social and economic development of the community; and participate in the National and Provincial
development programmes as required by Section 153 of the Constitution.
The City of Joburg has made commendable strides in ensuring that public administration is governed
by the democratic values and principles enshrined in the Constitution. These include the following
principles:
A high standard of professional ethics must be promoted and maintained;
Efficient, economic and effective use of resources must be promoted;
Public administration must be development-orientated;
Services must be provided impartially, fairly, equitably and without bias;
People’s needs must be responded to, and the public must be encouraged to participate in policy-
making;
Transparency must be fostered by providing the public with timely, accessible and accurate
information;
Good human-resource management and career-development practices, to maximise human
potential, must be cultivated; and
Public administration must be broadly representative of the South African people , with
employment and personnel management practices based on ability, objectivity, fairness, and the
need to redress the imbalances of the past to achieve broad representation.
The City of Johannesburg has a clear vision and mission:
Vision: A Joburg that works, is a South Africa that works!
26
Mission: To create an enabling economic environment by making Joburg more responsive in
the delivery of quality services.
In reflecting on this vision and mission, and to provide context for the detailed performance
assessment which follows in Chapter 3, it is useful to review the city’s demographic and socio-
economic position.
1.1 Johannesburg: An overview
Johannesburg is the largest metropolitan municipality in South Africa, home to approximately
5.4 million people1. It is the economic and financial hub of the country, with an average annual
population growth rate of 3.01% between 2007 and 2017. It is projected that the population could
increase to 7.6 million in the next 20 years2, providing both opportunities for the City, as well as
challenges, in planning for the delivery of services, infrastructure and other key considerations.
While the city experiences substantial economic migration, it has committed itself to bringing about
change and opportunities to the current population, and to create an environment where the growing
population can prosper3.
Demographics
Johannesburg residents make up 36% of Gauteng’s population and 8% of the population of South
Africa. Population density in the city has increased from 1 962 persons per kilometre squared in 2001,
to 2 698 persons / km2 in 2017.
There has been little change in the broad age structure of the City’s population between 1996 and
2016. The population pyramid reflects a large youth population (persons aged 14 to 35 years) which
constitutes over 33.2% of the total population. The proportion of the population aged 65 years and
older also increased between 1996 and 2016.
In addition to the age distribution, the overall age dependency burden in the CoJ declined from about
41 dependents for every 100 persons in the working age group (2001) to 31 dependents for every 100
persons in the working age group (2016). The overall age dependency burden is lower in the CoJ than
in Gauteng and nationally in 2016. This is primarily owing to marked differences in child dependency
between the CoJ and the national population relative to differences in elderly dependency between
the CoJ and the national population.
1 2017/18 Annual performance review 2 2017/18 Annual performance review 3 CoJ 2016/21 IDP
27
The total number of households in Johannesburg is currently estimated at 1.85 million; 62% of them
male-headed and 36% female-headed. The number of households could increase from about
1.85 million in mid-2016 to about 2.16 million in 2021. This implies an annual growth rate of 3.5% to
3.9% during this period. It is also projected that household size could become smaller over time in the
city4.
Household size in Johannesburg has remained quite stable over the last ten years (2007 to 2017) with
about three individuals per household. Given Johannesburg’s expanding population however, this
means that there are more and more households that the municipality needs to cater for in terms of
service delivery5.
Economic overview
Johannesburg, with a current average GDP per capita of R117 251 , is categorised as an upper-middle
income economy (World Bank, 2016). However, the Quarterly Labour Survey indicated in June 2017
that the overall unemployment level, using the narrow definition, was 28.3% while the broader
definition of unemployment levels was at 30.2%6. Of those employed, 78% are occupied in the formal
sector, 8% in the informal sector and 13% in private households7.
Johannesburg is also one of the cities with the highest levels of inequality in the world. Poverty and
inequality remain one of the city’s biggest challenges influenced largely by factors such as spatial
inequality and jobless growth, reinforced by low skills levels. 37% of people are still living below the
poverty line and approximately 610 000 households are considered poor8.
Linked to the challenge of unemployment are the high levels of youth unemployment (approximately
40%). This has been identified in the City’s IDP as one of the most pressing socio-economic challenges,
and a major obstacle to transformation growth, opportunity and development.
Even though Johannesburg faces a number of economic challenges, the city has made great progress
in social and economic issues9.
In examining Johannesburg’s economic sectors, it is noted that most of Johannesburg’s GVA is
concentrated in the tertiary sector which consists of four broad economic sectors namely the trade,
transport, finance and the community services sector. The finance sector accounts for 29.6% of the
City’s GVA and remains the biggest employer in Johannesburg accounting for 27.3% of total
employment, followed by the trade sector which employs 21.4% of the formal sector workers. The
4 CoJ 2016/21 IDP 5 2017/18 Annual performance review 6 2017/18 Annual performance review 7 CoJ 2016/21 IDP 8 2017/18 Annual performance review 9 CoJ 2016/21 IDP
28
electricity and agriculture sector employ the smallest share of the formal sector workers at only 0.5%
and 0.7% respectively, while the informal economy accounts for 14.3% of the total employment in
Johannesburg. The structure of the economy, which is mostly confined to the service sector,
influences employment patterns in the City creating a need to rejuvenate primary and manufacturing
sectors of the Johannesburg economy as well as capitalising on ICT and the fourth industrial
revolution10.
Human Development
Over the last decade, the region experienced an 8% increase in the level of human development
(currently rated 0.71). This can be attributed to improvements in living standards and specifically
health, education and income. Human development will continue to positively respond as the city
continues to target the reduction of, and education about, HIV prevalence, and the reduction of infant
mortality rates11.
Approximately 42% of the city's poor population are considered food insecure. The effects of
inequality and marginalisation further exacerbate the inability of Joburg’s poor to participate in the
economy and, subsequently, their inability to access food. Food insecurity also has a ripple effect on
health and nutrition.
Challenges
In the 2017/18 IDP review, the City identified a number of key challenges for the city. These include:
Slow economic growth: Since then new structural weaknesses in the global economy have
become apparent, the Rand has weakened significantly against the Dollar, and interest rates
are starting to increase. Structural inequalities in the economy have not been addressed and
the persistence of youth unemployment, income inequality and poverty remain. The
unemployment rate is estimated at 25% (official definition) and 40% (broader definition); with
youth most affected.
Service delivery: The City experiences a number of service delivery breakdowns. Some of these
breakdowns are due to a lack of infrastructure maintenance. Lack of direct infrastructure
departmental/municipal entities coordination and planning for the short to medium term has
resulted in the decay of infrastructure, which contributes to the slow pace of service delivery.
10 2017/18 Annual performance review 11 CoJ 2016/21 IDP
29
Poverty and inequality: The very poor (survivalist) spend over 50% on food and 20% on
transportation. The “working poor” earning under R2 500 monthly spend over 35% on
transport and 20% on food. The city’s Gini coefficient (income inequality) is one of the highest
in the world at over 0.66 well above the distress level of 0.4 identified by the UN. Furthermore,
food security (and the linked question of food resilience) is a citywide challenge; with
estimates of the proportion of food insecure residents running as high as 41% in acutely
deprived areas. Johannesburg’s post-apartheid spatial patterns reinforce the apartheid
development trajectory. Poor people are densely populated on the periphery.
Environmental decay: Climate change: Joburg ranked 13th in the world in terms of GHG
emitters and is the largest GHG emitting city in South Africa. Other climate risks include heat
wave related deaths; flood risks; water and energy demand, disease vectors. Natural
resources scarcity: there are water shortages projections by 2019; acid mine drainage also
poses further risks to already polluted resources; infrastructure and health of citizens is a
concern. The City produces approximately 1.8 million tons of garbage each year, the bulk of
which ends up in landfills, however the City is running out of landfill sites.
Corruption: Corruption continues to rob the poor. According to the Gauteng City Region
Observatory, 89% of sampled research participants agree that corruption has a negative
impact on democracy and 78% of research participants, believe that public servants are not
adhering to Batho Pele principles.
Inadequate police visibility: Currently, there is a perception that residents in Joburg have
severe safety concerns. While many of these can only be addressed by the SAPS, there is work
that the City government can do in terms of its metro police, law enforcement and emergency
services to increase safety. The city is still experiencing a social disconnect and a decline in
social connectiveness. This is seen, for example, with xenophobic attacks and increasing levels
of crime. A great deal of work remains for the CoJ in terms of building a cohesive and inclusive
community.
Informal economy: The informal economy is providing goods and services to the people of
Johannesburg which they would otherwise not have been able to afford. This, in turn, makes
them part of the formal economy as additional money can be spent on formal (and legal)
goods and services. The informal economy also provides many people with a job, and
therefore releases pressure on state to provide via welfare. The challenge is to engage and
include the informal economy, and to establish those involved as legal entities.
Despite these challenges, the City of Johannesburg remains an opportunity-rich and vibrant city, that
continues to engage with the typical concerns associated with developing cities; challenges of
migration, infrastructure backlogs and city rejuvenation, the need for improvement in residents’
welfare, increased job opportunities, and capital formation. These informed the development of City
strategies and plans for 2017/18.
30
1.2 The City’s strategic direction
Given these challenges and opportunities, the City has developed a series of strategic plans, that will
respond to, and achieve, its outcomes and vision. These include:
Long-term plans in the form of the Growth and Development Strategy (GDS);
Medium-term planning i.e. the City’s regular five-year Integrated Development Plans (IDP);
and
Short-terms plans which are contained in the annual Service Delivery and Budget
Implementation Plan (SDBIP) and annual IDP reviews, as well as in the annual business plans
of departments and municipal entities.
The long-term strategy identifies five key growth and development outcomes for the City:
A growing, diverse and competitive economy that creates jobs;
An inclusive society with enhanced quality of life that provides meaningful redress
through pro-poor development;
Enhanced, quality services and sustainable environmental practices;
Caring, safe and secure communities; and
An honest, transparent and responsive local government that prides itself on service
excellence.
In addition, nine strategic priorities were identified as key for this term of office. These are detailed
in the figure below.
Figure 1: CoJ strategic planning
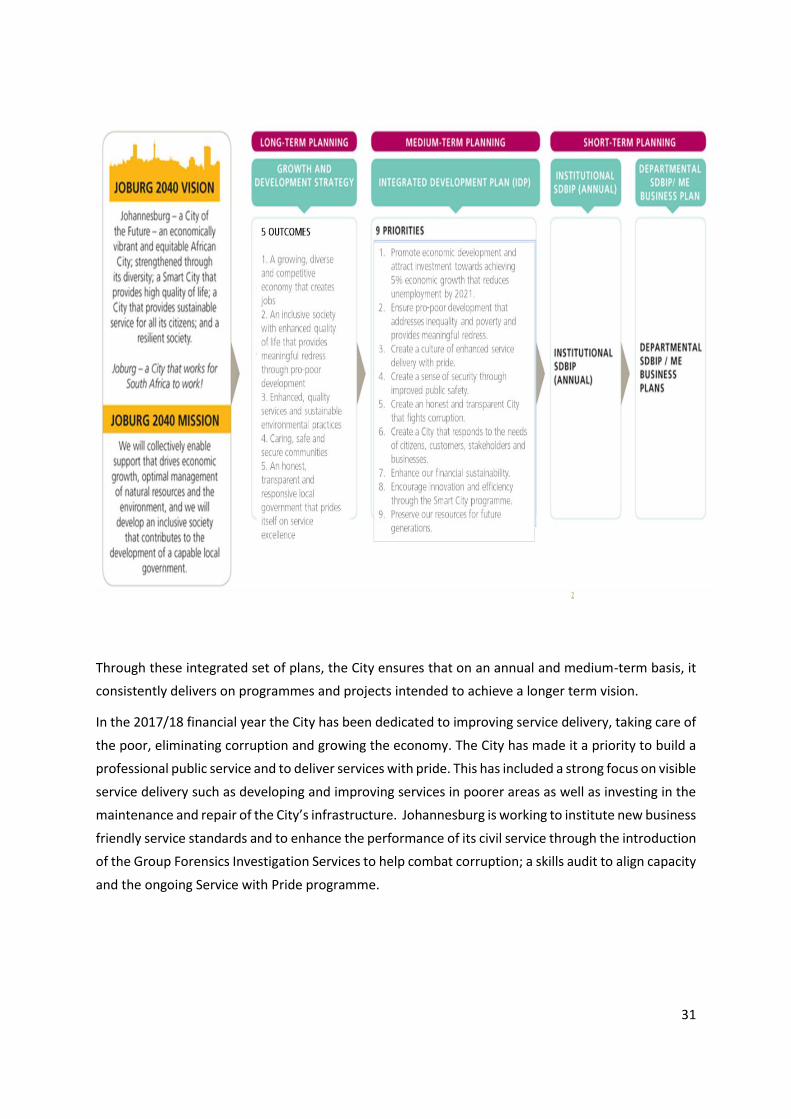
31
Through these integrated set of plans, the City ensures that on an annual and medium-term basis, it
consistently delivers on programmes and projects intended to achieve a longer term vision.
In the 2017/18 financial year the City has been dedicated to improving service delivery, taking care of
the poor, eliminating corruption and growing the economy. The City has made it a priority to build a
professional public service and to deliver services with pride. This has included a strong focus on visible
service delivery such as developing and improving services in poorer areas as well as investing in the
maintenance and repair of the City’s infrastructure. Johannesburg is working to institute new business
friendly service standards and to enhance the performance of its civil service through the introduction
of the Group Forensics Investigation Services to help combat corruption; a skills audit to align capacity
and the ongoing Service with Pride programme.
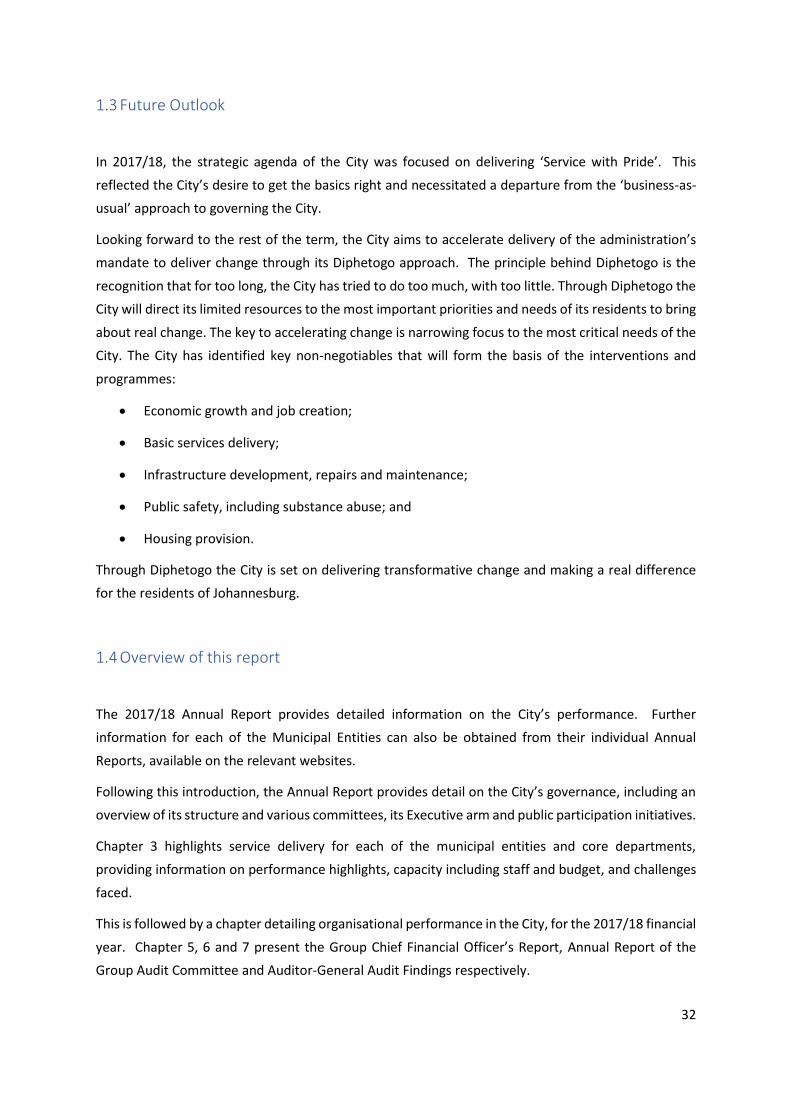
32
1.3 Future Outlook
In 2017/18, the strategic agenda of the City was focused on delivering ‘Service with Pride’. This
reflected the City’s desire to get the basics right and necessitated a departure from the ‘business-as-
usual’ approach to governing the City.
Looking forward to the rest of the term, the City aims to accelerate delivery of the administration’s
mandate to deliver change through its Diphetogo approach. The principle behind Diphetogo is the
recognition that for too long, the City has tried to do too much, with too little. Through Diphetogo the
City will direct its limited resources to the most important priorities and needs of its residents to bring
about real change. The key to accelerating change is narrowing focus to the most critical needs of the
City. The City has identified key non-negotiables that will form the basis of the interventions and
programmes:
Economic growth and job creation;
Basic services delivery;
Infrastructure development, repairs and maintenance;
Public safety, including substance abuse; and
Housing provision.
Through Diphetogo the City is set on delivering transformative change and making a real difference
for the residents of Johannesburg.
1.4 Overview of this report
The 2017/18 Annual Report provides detailed information on the City’s performance. Further
information for each of the Municipal Entities can also be obtained from their individual Annual
Reports, available on the relevant websites.
Following this introduction, the Annual Report provides detail on the City’s governance, including an
overview of its structure and various committees, its Executive arm and public participation initiatives.
Chapter 3 highlights service delivery for each of the municipal entities and core departments,
providing information on performance highlights, capacity including staff and budget, and challenges
faced.
This is followed by a chapter detailing organisational performance in the City, for the 2017/18 financial
year. Chapter 5, 6 and 7 present the Group Chief Financial Officer’s Report, Annual Report of the
Group Audit Committee and Auditor-General Audit Findings respectively.
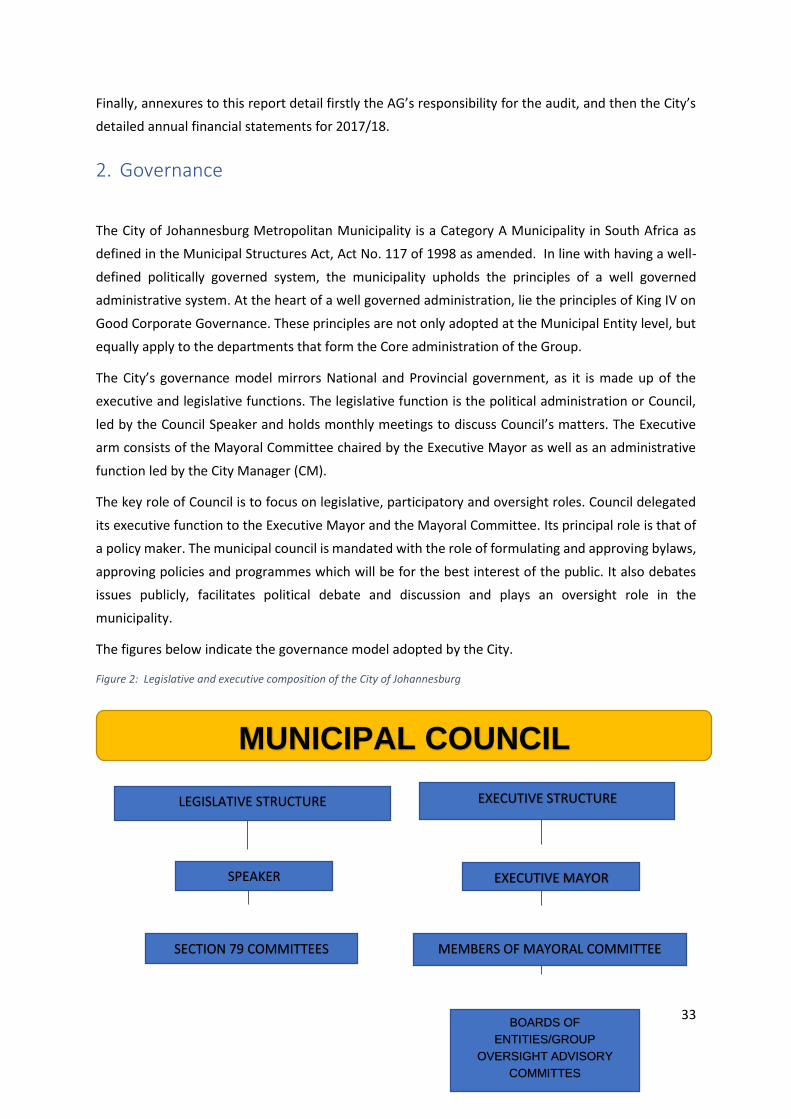
33
Finally, annexures to this report detail firstly the AG’s responsibility for the audit, and then the City’s
detailed annual financial statements for 2017/18.
2. Governance
The City of Johannesburg Metropolitan Municipality is a Category A Municipality in South Africa as
defined in the Municipal Structures Act, Act No. 117 of 1998 as amended. In line with having a well-
defined politically governed system, the municipality upholds the principles of a well governed
administrative system. At the heart of a well governed administration, lie the principles of King IV on
Good Corporate Governance. These principles are not only adopted at the Municipal Entity level, but
equally apply to the departments that form the Core administration of the Group.
The City’s governance model mirrors National and Provincial government, as it is made up of the
executive and legislative functions. The legislative function is the political administration or Council,
led by the Council Speaker and holds monthly meetings to discuss Council’s matters. The Executive
arm consists of the Mayoral Committee chaired by the Executive Mayor as well as an administrative
function led by the City Manager (CM).
The key role of Council is to focus on legislative, participatory and oversight roles. Council delegated
its executive function to the Executive Mayor and the Mayoral Committee. Its principal role is that of
a policy maker. The municipal council is mandated with the role of formulating and approving bylaws,
approving policies and programmes which will be for the best interest of the public. It also debates
issues publicly, facilitates political debate and discussion and plays an oversight role in the
municipality.
The figures below indicate the governance model adopted by the City.
Figure 2: Legislative and executive composition of the City of Johannesburg
MUNICIPAL COUNCIL
LEGISLATIVE STRUCTURE EXECUTIVE STRUCTURE
EXECUTIVE MAYOR SPEAKER
SECTION 79 COMMITTEES MEMBERS OF MAYORAL COMMITTEE
BOARDS OF
ENTITIES/GROUP
OVERSIGHT ADVISORY
COMMITTES
34
In relation to the structures in the Municipality, delegations of authority are indicated in the figure
below. The Executive sphere of the municipality is headed by the Executive Mayor who is responsible
for performing functions and exercising powers delegated by the municipal council. The administrative
structure led by the City Manager is responsible for the ensuring administrative performance in the
rendering of services to the public.
Figure 3: Delegations of authority
2.1 The Legislature
The legislative function of the Council is implemented by the Council and its committees (Standing
Committees and the Section 79 committees), led by the Speaker of the Council, supported by the Chief
Whip of Council. Legislature’s mandate is focused around five themes:
Accountability, oversight and scrutiny;
Strengthening capacity of the Legislative Arm of Council;
Public participation;
Monitoring and evaluation; and
Sound financial management.

35
COUNCIL LEGISLATURE
Speaker of Council
Cllr Vasco da Gama
Chief Whip of Council
Cllr Dr Kevin Wax
Chair of Chairpersons
Section 79 Committee, Cllr Alex
Christians
Speaker of Council, Cllr Vasco da Gama
The Speaker is the promoter and protector of democracy, facilitating debate and arrival at consensus
within the Standing Rules of Council and ensuring ethical conduct by councillors. The Speaker is also
the head of the legislative arm of the council, playing two important roles within the Council, and in
building democracy.
The Speaker of Council’s roles and responsibilities are to:
Be responsible for Section 79 oversight committees;
Convene, preside over Council meetings and uphold Council standing rules and orders;
Capacitate councillors on political governance; and
Promote community participation and consultation in local government and ensure functional
ward committees.
Chief Whip, Cllr Kevin Wax
The Chief Whip is an official office bearer, who is a member of the governing party and also Chief Whip
of the governing party. As such, the Chief Whip's role is a political appointment to maintain cohesion
within the governing party and build relationships with other political parties. Other tasks include:
Making sure that each of the political parties are properly represented on the various committees
of Council; and
Maintaining sound relations between the various political parties by attending to disputes
between political parties.
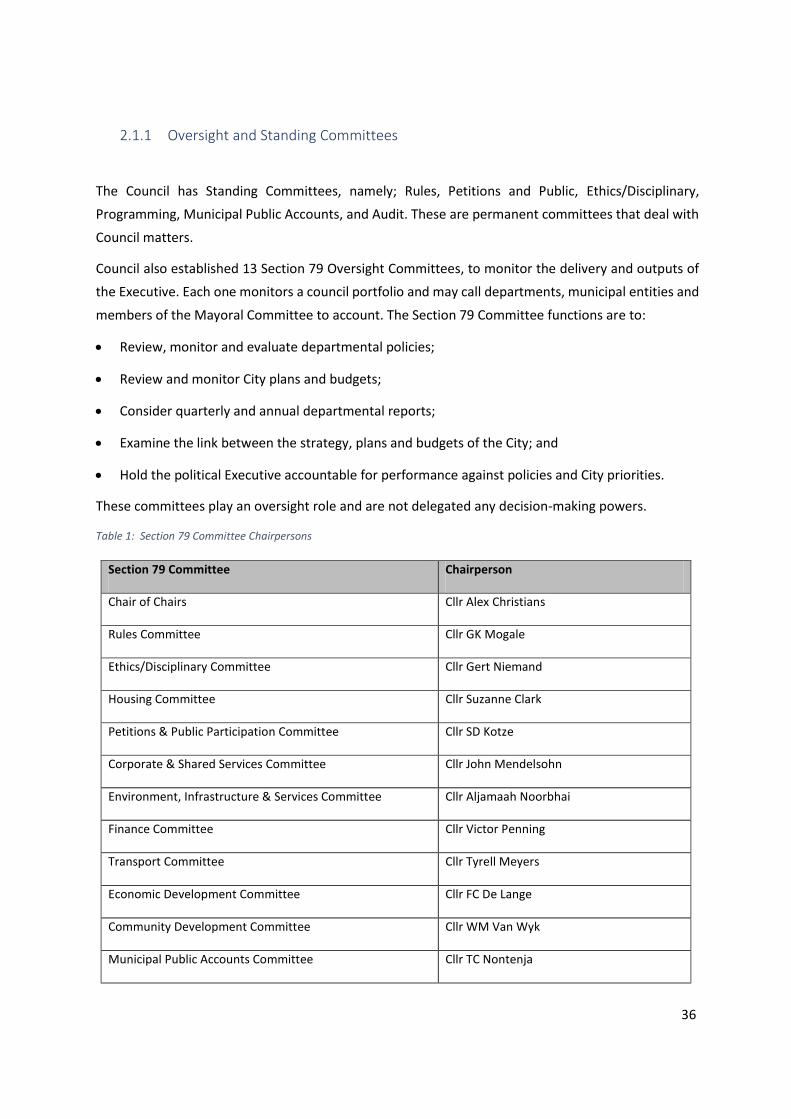
36
2.1.1 Oversight and Standing Committees
The Council has Standing Committees, namely; Rules, Petitions and Public, Ethics/Disciplinary,
Programming, Municipal Public Accounts, and Audit. These are permanent committees that deal with
Council matters.
Council also established 13 Section 79 Oversight Committees, to monitor the delivery and outputs of
the Executive. Each one monitors a council portfolio and may call departments, municipal entities and
members of the Mayoral Committee to account. The Section 79 Committee functions are to:
Review, monitor and evaluate departmental policies;
Review and monitor City plans and budgets;
Consider quarterly and annual departmental reports;
Examine the link between the strategy, plans and budgets of the City; and
Hold the political Executive accountable for performance against policies and City priorities.
These committees play an oversight role and are not delegated any decision-making powers.
Table 1: Section 79 Committee Chairpersons
Section 79 Committee Chairperson
Chair of Chairs Cllr Alex Christians
Rules Committee Cllr GK Mogale
Ethics/Disciplinary Committee Cllr Gert Niemand
Housing Committee Cllr Suzanne Clark
Petitions & Public Participation Committee Cllr SD Kotze
Corporate & Shared Services Committee Cllr John Mendelsohn
Environment, Infrastructure & Services Committee Cllr Aljamaah Noorbhai
Finance Committee Cllr Victor Penning
Transport Committee Cllr Tyrell Meyers
Economic Development Committee Cllr FC De Lange
Community Development Committee Cllr WM Van Wyk
Municipal Public Accounts Committee Cllr TC Nontenja
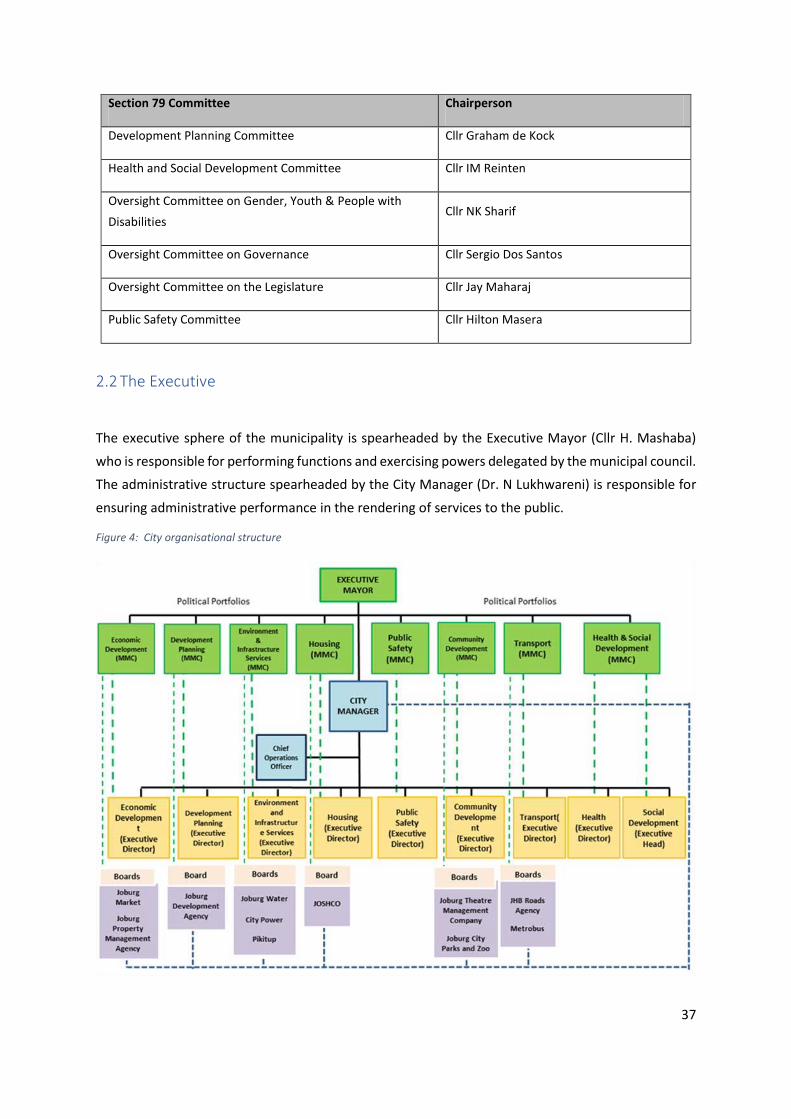
37
Section 79 Committee Chairperson
Development Planning Committee Cllr Graham de Kock
Health and Social Development Committee Cllr IM Reinten
Oversight Committee on Gender, Youth & People with
Disabilities Cllr NK Sharif
Oversight Committee on Governance Cllr Sergio Dos Santos
Oversight Committee on the Legislature Cllr Jay Maharaj
Public Safety Committee Cllr Hilton Masera
2.2 The Executive
The executive sphere of the municipality is spearheaded by the Executive Mayor (Cllr H. Mashaba)
who is responsible for performing functions and exercising powers delegated by the municipal council.
The administrative structure spearheaded by the City Manager (Dr. N Lukhwareni) is responsible for
ensuring administrative performance in the rendering of services to the public.
Figure 4: City organisational structure

38
The Executive Mayor and Members of the Mayoral Committee are detailed in the image below.
Executive Mayor
Cllr Herman Mashaba
MMC Finance
Cllr Funzela Ngobeni replaced
Dr Rabelani Dagada
MMC Corporate and Shared Services
Cllr Dr Valencia Ntombi Khumalo
MMC Community Development
Cllr Nonhlanhla Sifumba
MMC Health & Social Development
Cllr Dr Mpho Phalatse
MMC Environment, Infrastructure & Services
Cllr Nico De Jager
MMC Public Safety
Cllr Yao- Heng Michael Sun
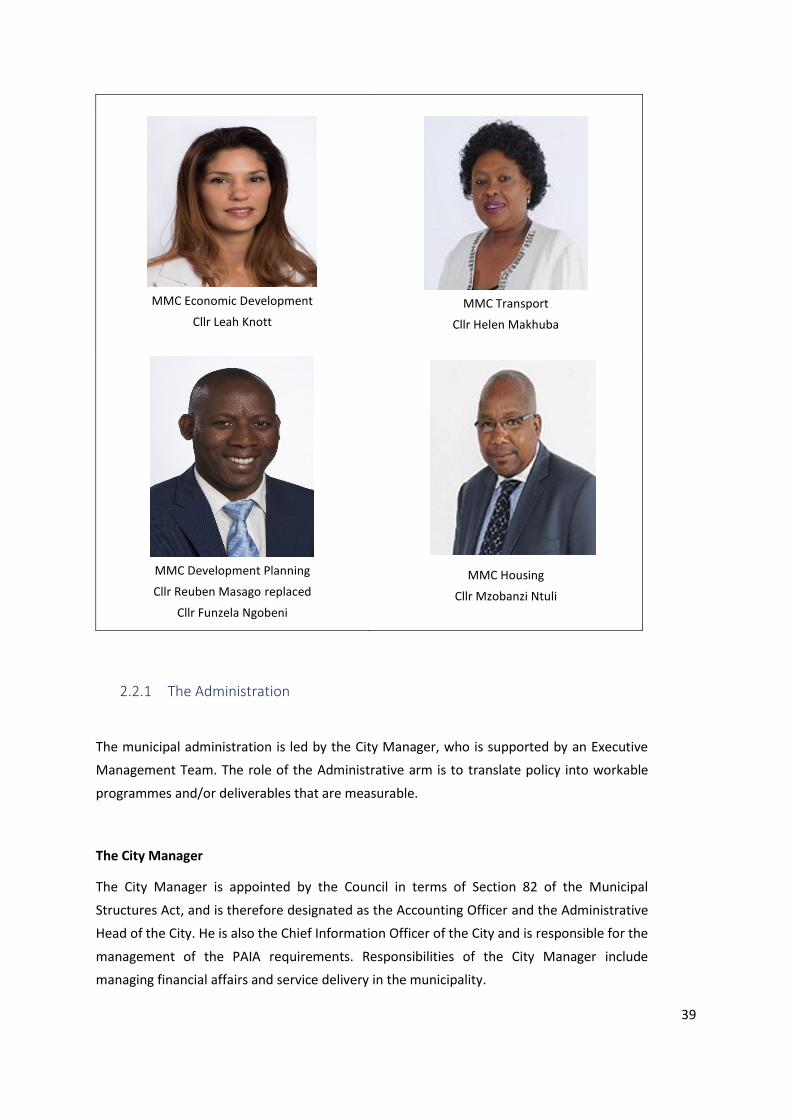
39
MMC Economic Development
Cllr Leah Knott
MMC Transport
Cllr Helen Makhuba
MMC Development Planning
Cllr Reuben Masago replaced
Cllr Funzela Ngobeni
MMC Housing
Cllr Mzobanzi Ntuli
2.2.1 The Administration
The municipal administration is led by the City Manager, who is supported by an Executive
Management Team. The role of the Administrative arm is to translate policy into workable
programmes and/or deliverables that are measurable.
The City Manager
The City Manager is appointed by the Council in terms of Section 82 of the Municipal
Structures Act, and is therefore designated as the Accounting Officer and the Administrative
Head of the City. He is also the Chief Information Officer of the City and is responsible for the
management of the PAIA requirements. Responsibilities of the City Manager include
managing financial affairs and service delivery in the municipality.
40
Executive Management Team
Under the leadership of the City Manager, the Executive Management Team (EMT) works to
achieve the strategic objectives, as outlined in the SDBIP and IDP each year. The EMT is made
up of Executive Heads, Group Heads, Managing Directors and Chief Executive Officers of the
City’s departments and entities.
Group Functions
The role of the Group Functions is to ensure that there is alignment and consistency in the
strategic approach and implementation of the respective discipline across the entire City of
Johannesburg Group i.e. both Core Departments and Municipal Entities. This is done in a
manner that provides the required flexibility within the system to meet the specific needs of
the Municipal Entities.
The City of Johannesburg Group Functions are:
Group Strategy, Policy Coordination and Relations, which includes Innovation
and Knowledge Management, Corporate Strategy and Research, International
and Intergovernmental Relations, Integrated and Community-Based Planning,
and Monitoring and Evaluation.
Group Finance, which includes Revenue Shared Services, Treasury, Group
Accounting, Core Accounting, and Supply Chain Management.
Group Corporate and Shared Services, which includes Group Human Capital
Management, Group Information and Communication Technology, Safety,
Occupational Health, Occupational Environment, Logistics and Administration,
and Group Management Support Services
Group Communications and Marketing, which includes Strategic
Communications, Marketing and Events, Tourism, Group Legal and Contracts,
Contract Administration and Monitoring, Legal Support and Legal Advocacy.
Group Governance, which includes Committee Support, Shareholder Services
and Group Governance.
Group Risk Assurance Services, which includes Group Risk Services, Group
Compliance and Monitoring, and Combined Assurance and Business Process
Excellence.
Group Audit, which includes Group Internal Audit, Group Forensic Services, and
Regulatory, Compliance and Special Investigations.
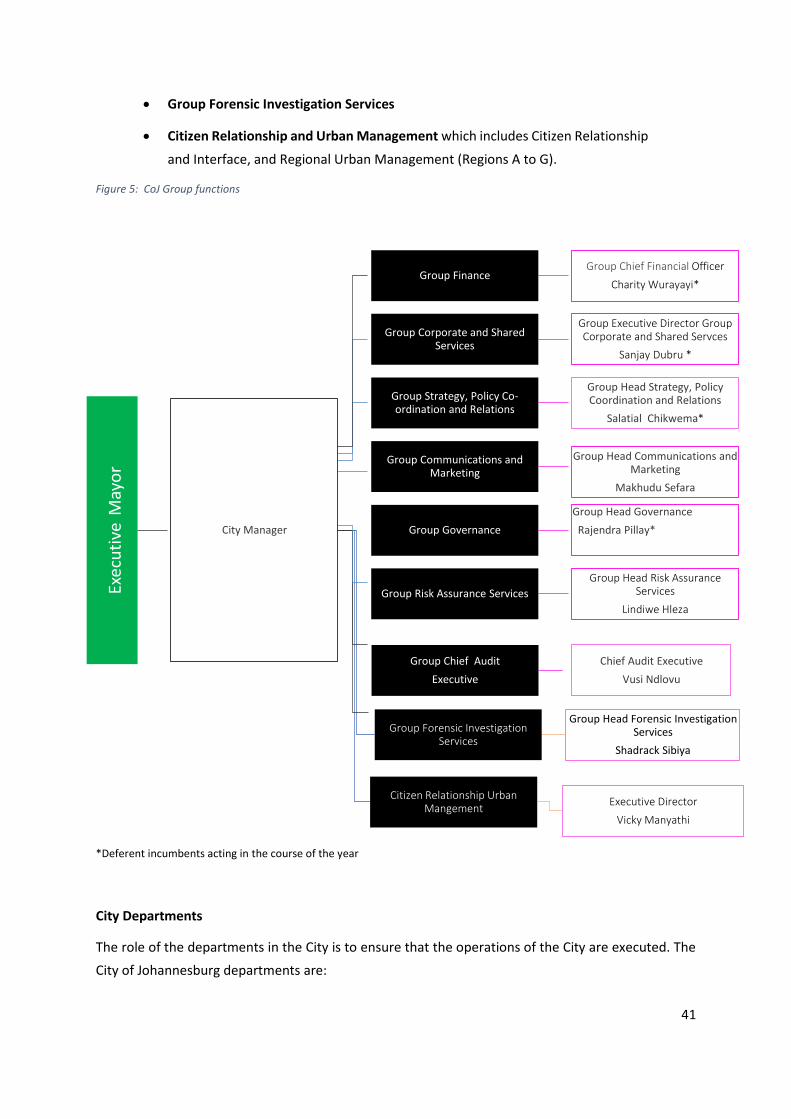
41
Group Forensic Investigation Services
Citizen Relationship and Urban Management which includes Citizen Relationship
and Interface, and Regional Urban Management (Regions A to G).
Figure 5: CoJ Group functions
*Deferent incumbents acting in the course of the year
City Departments
The role of the departments in the City is to ensure that the operations of the City are executed. The
City of Johannesburg departments are:
Exec
uti
veM
ayo
r
City Manager
Group FinanceGroup Chief Financial Officer
Charity Wurayayi*
Group Corporate and SharedServices
Group Executive Director Group Corporate and Shared Servces
Sanjay Dubru *
Group Strategy, Policy Co-ordination and Relations
Group Head Strategy, Policy Coordination and Relations
Salatial Chikwema*
Group Communications and Marketing
Group Head Communications and Marketing
Makhudu Sefara
Group Governance
Group Head Governance
Rajendra Pillay*
Group Risk Assurance Services
Group Head Risk Assurance Services
Lindiwe Hleza
Group Chief Audit
Executive
Chief Audit Executive
Vusi Ndlovu
Group Forensic Investigation Services
Group Head Forensic Investigation Services
Shadrack Sibiya
Citizen Relationship Urban Mangement
Executive Director
Vicky Manyathi
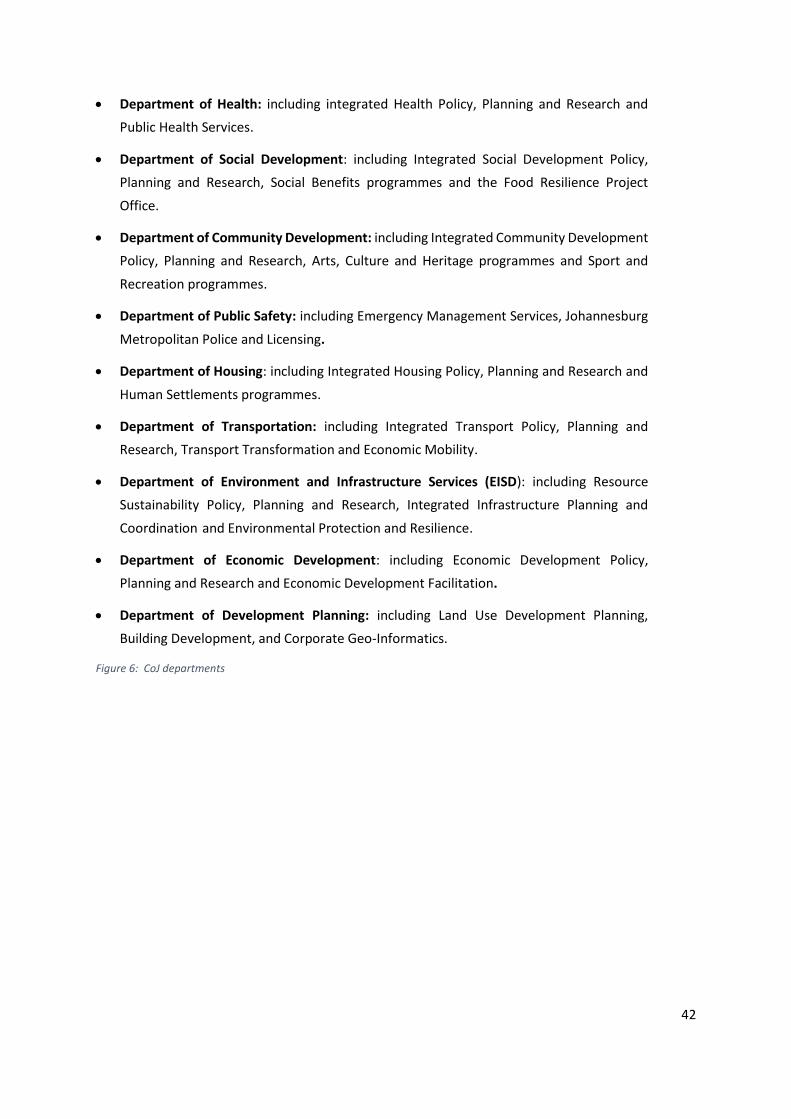
42
Department of Health: including integrated Health Policy, Planning and Research and
Public Health Services.
Department of Social Development: including Integrated Social Development Policy,
Planning and Research, Social Benefits programmes and the Food Resilience Project
Office.
Department of Community Development: including Integrated Community Development
Policy, Planning and Research, Arts, Culture and Heritage programmes and Sport and
Recreation programmes.
Department of Public Safety: including Emergency Management Services, Johannesburg
Metropolitan Police and Licensing.
Department of Housing: including Integrated Housing Policy, Planning and Research and
Human Settlements programmes.
Department of Transportation: including Integrated Transport Policy, Planning and
Research, Transport Transformation and Economic Mobility.
Department of Environment and Infrastructure Services (EISD): including Resource
Sustainability Policy, Planning and Research, Integrated Infrastructure Planning and
Coordination and Environmental Protection and Resilience.
Department of Economic Development: including Economic Development Policy,
Planning and Research and Economic Development Facilitation.
Department of Development Planning: including Land Use Development Planning,
Building Development, and Corporate Geo-Informatics.
Figure 6: CoJ departments
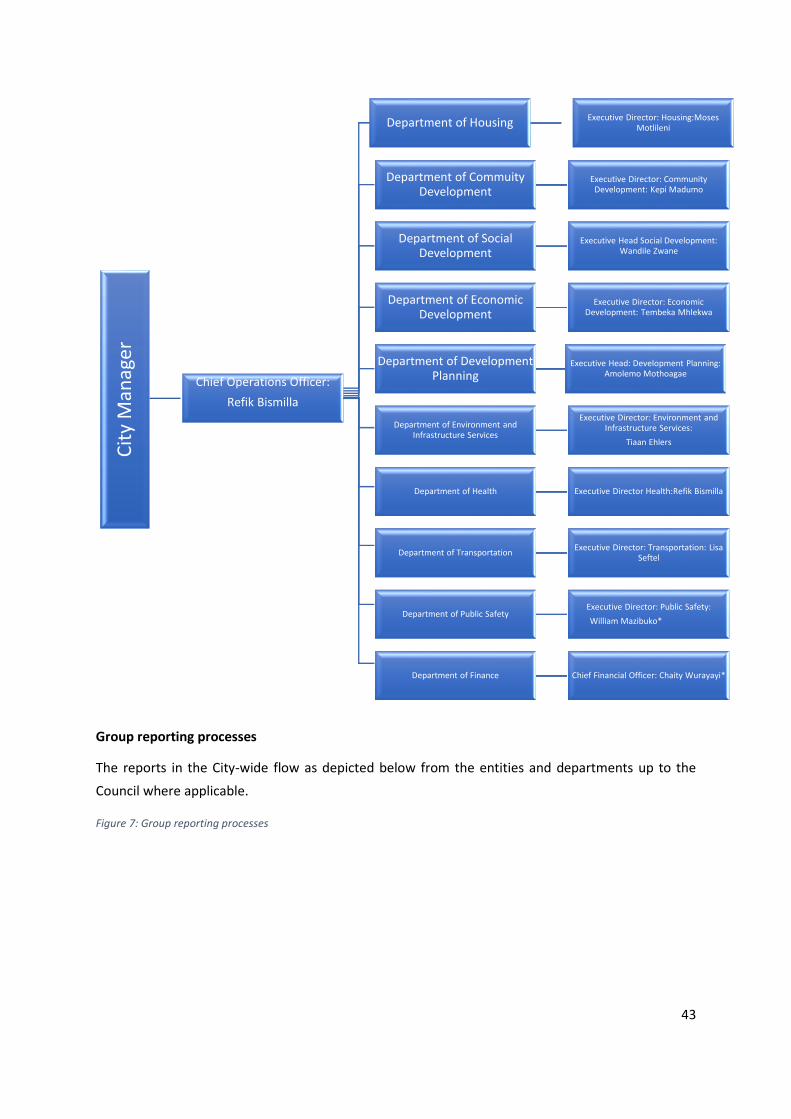
43
Group reporting processes
The reports in the City-wide flow as depicted below from the entities and departments up to the
Council where applicable.
Figure 7: Group reporting processes
Cit
yM
anag
er
Chief Operations Officer:
Refik Bismilla
Department of Housing Executive Director: Housing:Moses Motlileni
Department of Commuity Development
Executive Director: Community Development: Kepi Madumo
Department of Social Development
Executive Head Social Development: Wandile Zwane
Department of Economic Development
Executive Director: Economic Development: Tembeka Mhlekwa
Department of Development Planning
Executive Head: Development Planning: Amolemo Mothoagae
Department of Environment and Infrastructure Services
Executive Director: Environment and Infrastructure Services:
Tiaan Ehlers
Department of Health Executive Director Health:Refik Bismilla
Department of TransportationExecutive Director: Transportation: Lisa
Seftel
Department of Public SafetyExecutive Director: Public Safety:
William Mazibuko*
Department of Finance Chief Financial Officer: Chaity Wurayayi*
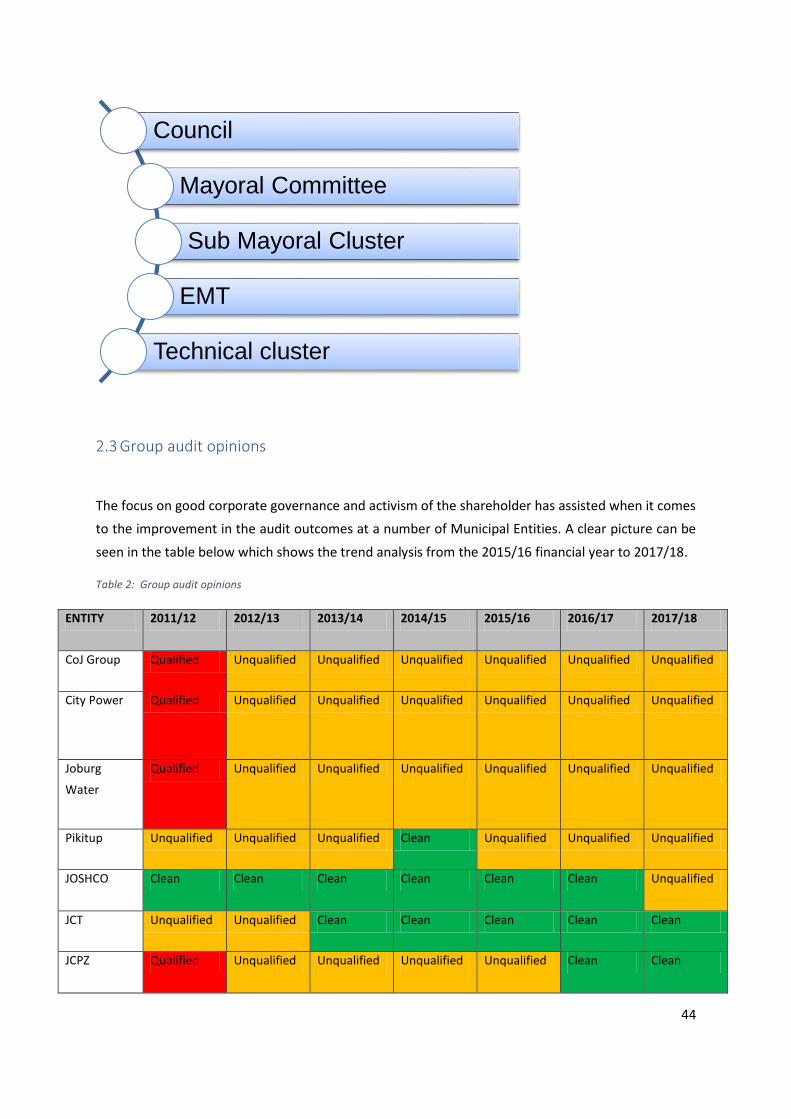
44
2.3 Group audit opinions
The focus on good corporate governance and activism of the shareholder has assisted when it comes
to the improvement in the audit outcomes at a number of Municipal Entities. A clear picture can be
seen in the table below which shows the trend analysis from the 2015/16 financial year to 2017/18.
Table 2: Group audit opinions
ENTITY 2011/12 2012/13 2013/14 2014/15 2015/16 2016/17 2017/18
CoJ Group Qualified Unqualified Unqualified Unqualified Unqualified Unqualified Unqualified
City Power Qualified Unqualified Unqualified Unqualified Unqualified Unqualified Unqualified
Joburg
Water
Qualified Unqualified Unqualified Unqualified Unqualified Unqualified Unqualified
Pikitup Unqualified Unqualified Unqualified Clean Unqualified Unqualified Unqualified
JOSHCO Clean Clean Clean Clean Clean Clean Unqualified
JCT Unqualified Unqualified Clean Clean Clean Clean Clean
JCPZ Qualified Unqualified Unqualified Unqualified Unqualified Clean Clean
Council
Mayoral Committee
Sub Mayoral Cluster
EMT
Technical cluster
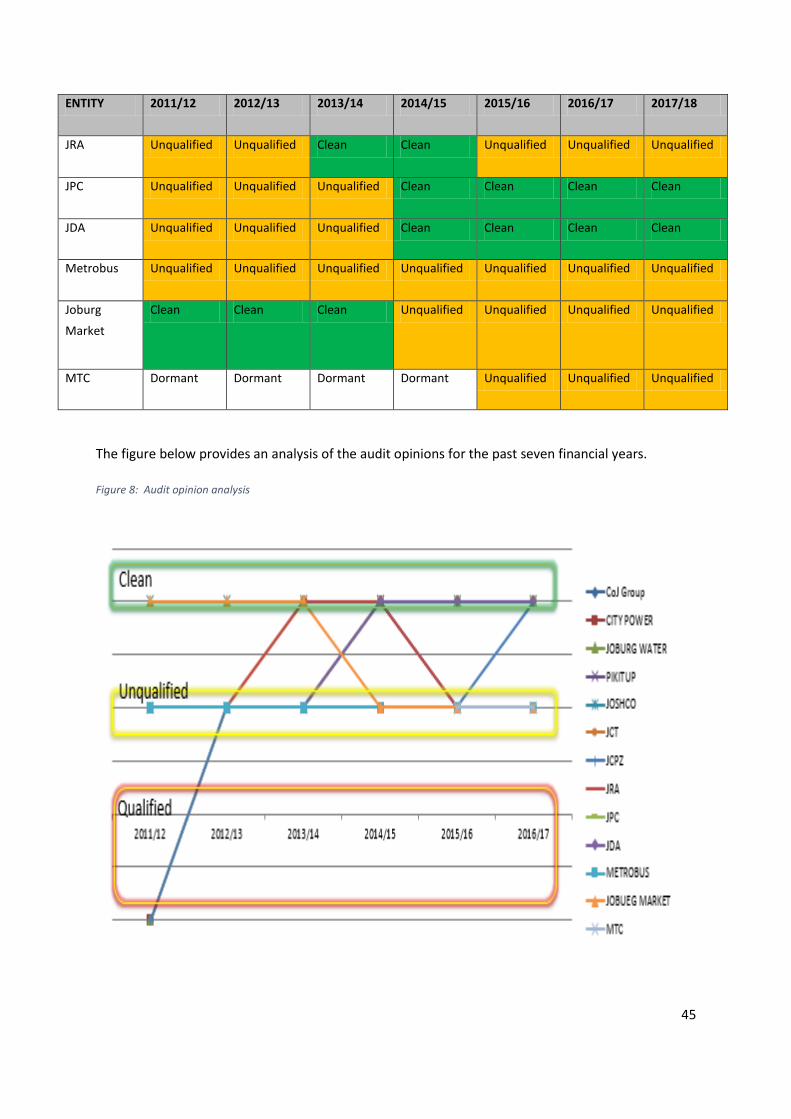
45
ENTITY 2011/12 2012/13 2013/14 2014/15 2015/16 2016/17 2017/18
JRA Unqualified Unqualified Clean Clean Unqualified Unqualified Unqualified
JPC Unqualified Unqualified Unqualified Clean Clean Clean Clean
JDA Unqualified Unqualified Unqualified Clean Clean Clean Clean
Metrobus Unqualified Unqualified Unqualified Unqualified Unqualified Unqualified Unqualified
Joburg
Market
Clean Clean Clean Unqualified Unqualified Unqualified Unqualified
MTC Dormant Dormant Dormant Dormant Unqualified Unqualified Unqualified
The figure below provides an analysis of the audit opinions for the past seven financial years.
Figure 8: Audit opinion analysis
46
The City of Johannesburg’s audit outcomes have remained constant in the past six years as the group
achieved an unqualified audit. To date, four of the 12 municipal entities achieved clean audit
outcomes and eight, including Joburg Water and City Power, achieved unqualified audit outcomes.
Based on the analysis, of the seven financial years the only entity that remained consistent with a
clean audit opinion is JCT which has achieved a clean audit in the past five financial years. Then
followed by Metrobus with a consistent unqualified opinion. Pikitup and JRA regressed from a clean
audit opinion to an unqualified audit opinion.
The CoJ Group, City Power and Joburg Water were on qualified audits in 2011/12 and improved to
unqualified audits. They have been in the same position for the past five financial years.
JCPZ was qualified in 2011/12, the following four years were unqualified, and the entity in 2016/17
then received a clean audit opinion.
JOSCHO, which had previously achieved six consecutive clean audits in the previous seven financial
years, has regressed to an unqualified audit opinion in the 2017/18 financial year.
2.4 Group advisory oversight committees
In order to adequately carry out the above-mentioned values, the City has in line with applicable
legislation and best practice, formed independent structures which are Oversight Advisory
Committees that serve the objective of giving an unbiased opinion and advice to Council. These
include the following:
Group Audit Committee;
Group Performance Audit Committee;
Group Risk Governance Committee;
Municipal Entity Board of Directors;
Municipal Entity Audit and Risk Committee;
Municipal Entity Social & Ethics Committee; and
Municipal Entity Human Resources and Remuneration Committee (REMCO)
These committees are capacitated by individuals who are not employees of the City. The skills of the
committee members are wide, and include specialised fields of Strategy, Institutional Performance,
Finance, Accounting, Legal, Risk Management, ICT Governance, Engineering, and Human Resources.

47
Group Advisory Committees have Terms of Reference (ToRs) which provides assistance in delivering
their legislative and advisory mandate. The ToRs are reviewed annually by the Committees and
recommended to Mayoral Committee for approval.
The City’s top risks were monitored for improvement on a quarterly basis. Below provides risk matrix
as per the approved Risk Management Framework.
Table 3: Risk Matrix
2.5 Insurance Covers
The City’s insurance programme was renewed for the 2017/18 financial year. All key categories of
risks were covered for the period.
High (15)Very High
= 20
Very High
= 25
lik
elih
oo
d o
f o
cc
urre
nc
e
alm
ost
certain
5 Low Moderate
Very High
= 20
High
(12)
High
= 16
lik
elih
oo
d o
f o
cc
urre
nc
e
likely 4 Low Moderate
High(15)High
(12)Moderate
lik
elih
oo
d o
f o
cc
urre
nc
e
possible 3 Low Moderate
lik
elih
oo
d o
f o
cc
urre
nc
e
Moderateunlikely 2 Low Low Moderate Moderate
1 2 3 4 5
minor moderate major severe
1
lik
elih
oo
d o
f o
cc
urre
nc
e
insignificant
remote Low Low Low Low Low
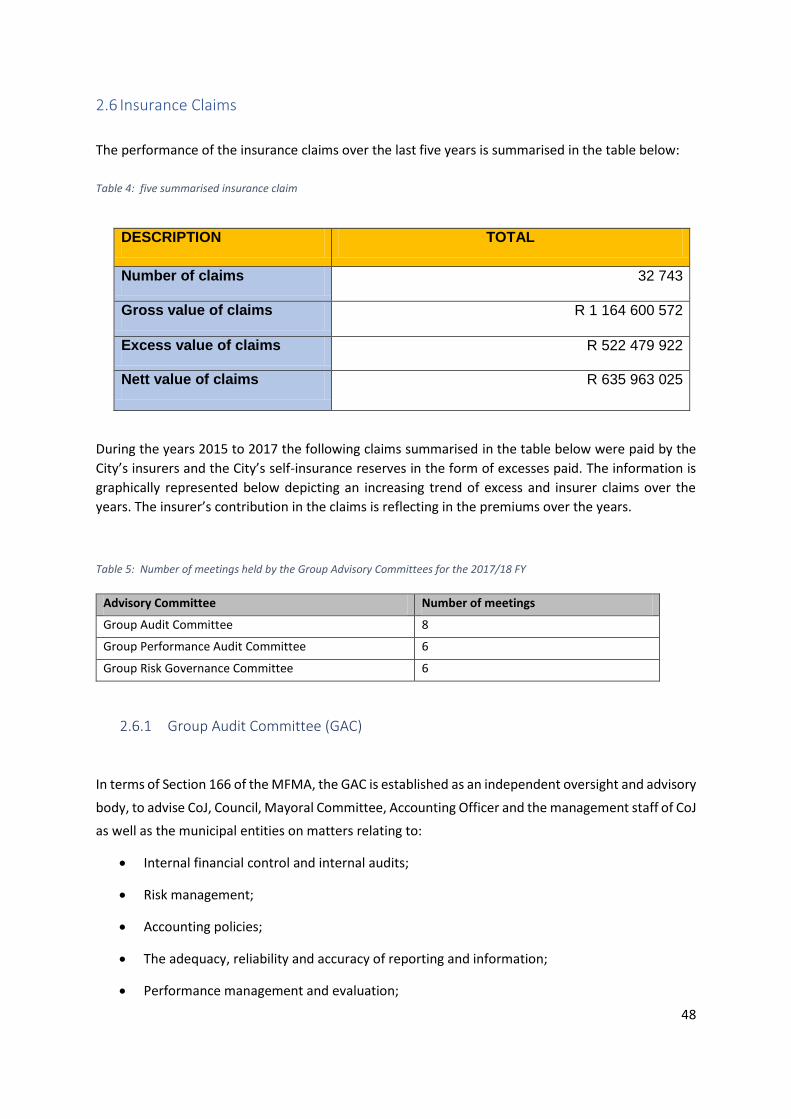
48
2.6 Insurance Claims
The performance of the insurance claims over the last five years is summarised in the table below:
Table 4: five summarised insurance claim
DESCRIPTION TOTAL
Number of claims 32 743
Gross value of claims R 1 164 600 572
Excess value of claims R 522 479 922
Nett value of claims R 635 963 025
During the years 2015 to 2017 the following claims summarised in the table below were paid by the
City’s insurers and the City’s self-insurance reserves in the form of excesses paid. The information is
graphically represented below depicting an increasing trend of excess and insurer claims over the
years. The insurer’s contribution in the claims is reflecting in the premiums over the years.
Table 5: Number of meetings held by the Group Advisory Committees for the 2017/18 FY
Advisory Committee Number of meetings
Group Audit Committee 8
Group Performance Audit Committee 6
Group Risk Governance Committee 6
2.6.1 Group Audit Committee (GAC)
In terms of Section 166 of the MFMA, the GAC is established as an independent oversight and advisory
body, to advise CoJ, Council, Mayoral Committee, Accounting Officer and the management staff of CoJ
as well as the municipal entities on matters relating to:
Internal financial control and internal audits;
Risk management;
Accounting policies;
The adequacy, reliability and accuracy of reporting and information;
Performance management and evaluation;
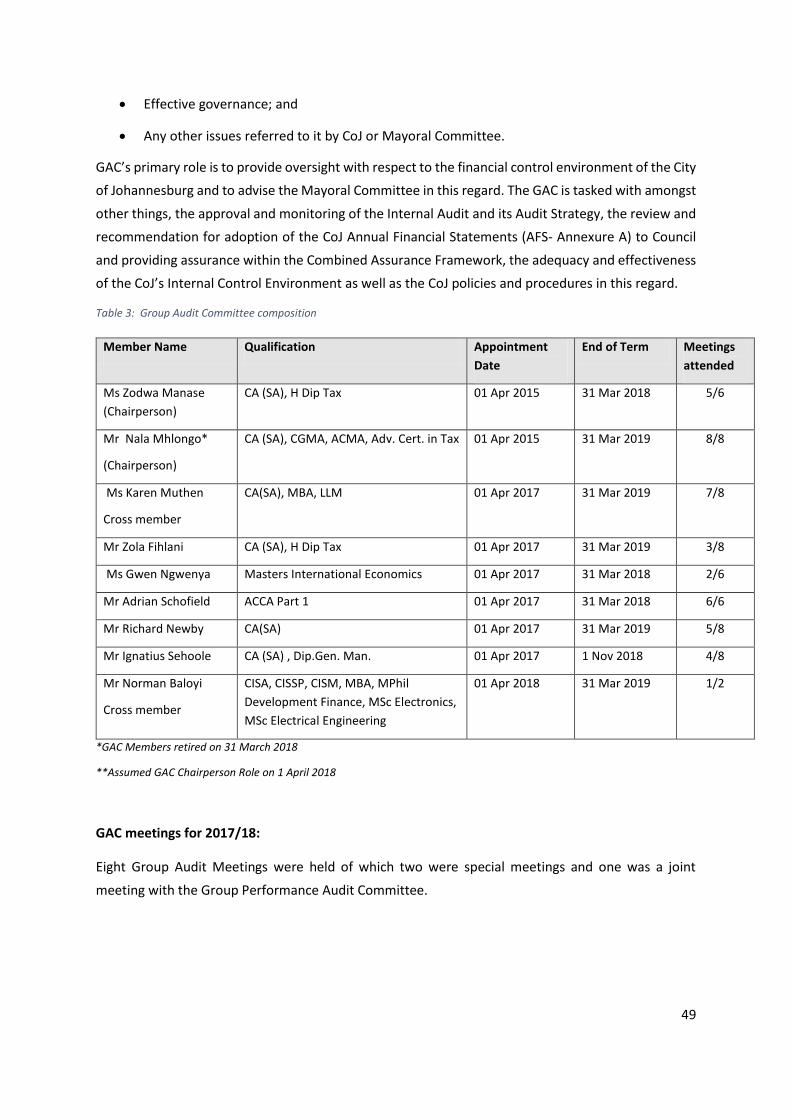
49
Effective governance; and
Any other issues referred to it by CoJ or Mayoral Committee.
GAC’s primary role is to provide oversight with respect to the financial control environment of the City
of Johannesburg and to advise the Mayoral Committee in this regard. The GAC is tasked with amongst
other things, the approval and monitoring of the Internal Audit and its Audit Strategy, the review and
recommendation for adoption of the CoJ Annual Financial Statements (AFS- Annexure A) to Council
and providing assurance within the Combined Assurance Framework, the adequacy and effectiveness
of the CoJ’s Internal Control Environment as well as the CoJ policies and procedures in this regard.
Table 3: Group Audit Committee composition
Member Name Qualification Appointment
Date
End of Term Meetings
attended
Ms Zodwa Manase
(Chairperson)
CA (SA), H Dip Tax 01 Apr 2015 31 Mar 2018 5/6
Mr Nala Mhlongo*
(Chairperson)
CA (SA), CGMA, ACMA, Adv. Cert. in Tax 01 Apr 2015 31 Mar 2019 8/8
Ms Karen Muthen
Cross member
CA(SA), MBA, LLM 01 Apr 2017 31 Mar 2019 7/8
Mr Zola Fihlani CA (SA), H Dip Tax 01 Apr 2017 31 Mar 2019 3/8
Ms Gwen Ngwenya Masters International Economics 01 Apr 2017 31 Mar 2018 2/6
Mr Adrian Schofield ACCA Part 1 01 Apr 2017 31 Mar 2018 6/6
Mr Richard Newby CA(SA) 01 Apr 2017 31 Mar 2019 5/8
Mr Ignatius Sehoole CA (SA) , Dip.Gen. Man. 01 Apr 2017 1 Nov 2018 4/8
Mr Norman Baloyi
Cross member
CISA, CISSP, CISM, MBA, MPhil
Development Finance, MSc Electronics,
MSc Electrical Engineering
01 Apr 2018 31 Mar 2019 1/2
*GAC Members retired on 31 March 2018
**Assumed GAC Chairperson Role on 1 April 2018
GAC meetings for 2017/18:
Eight Group Audit Meetings were held of which two were special meetings and one was a joint
meeting with the Group Performance Audit Committee.
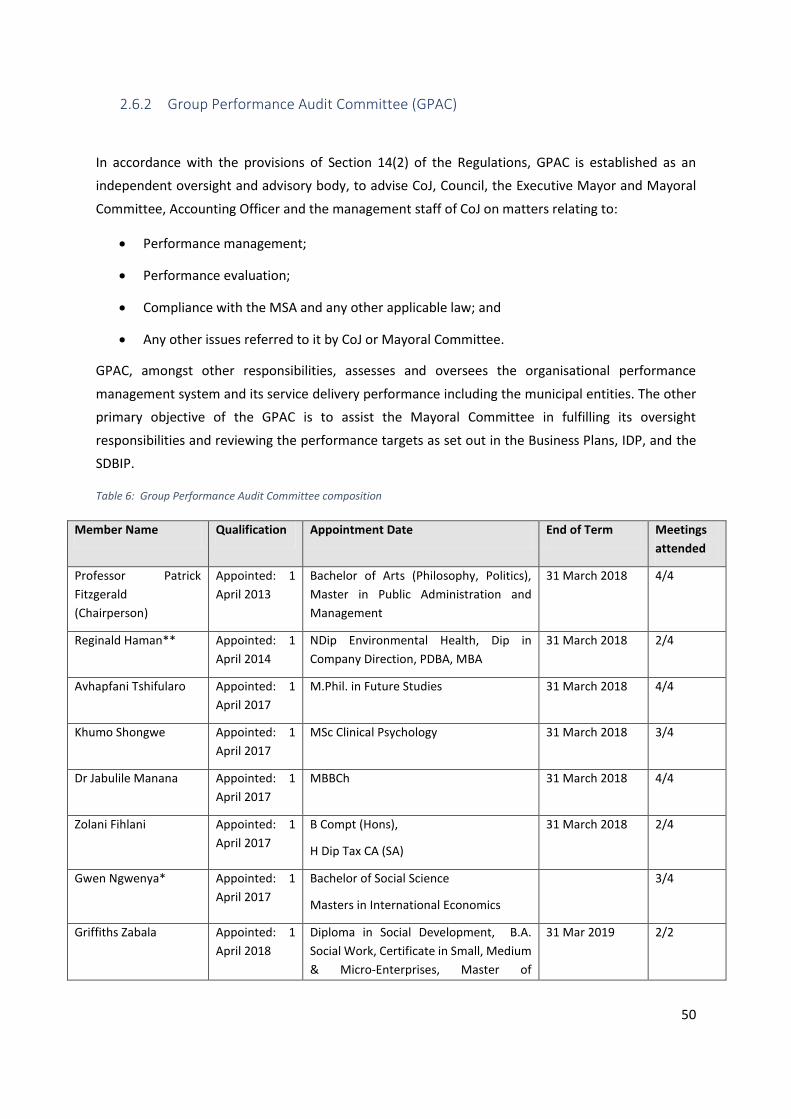
50
2.6.2 Group Performance Audit Committee (GPAC)
In accordance with the provisions of Section 14(2) of the Regulations, GPAC is established as an
independent oversight and advisory body, to advise CoJ, Council, the Executive Mayor and Mayoral
Committee, Accounting Officer and the management staff of CoJ on matters relating to:
Performance management;
Performance evaluation;
Compliance with the MSA and any other applicable law; and
Any other issues referred to it by CoJ or Mayoral Committee.
GPAC, amongst other responsibilities, assesses and oversees the organisational performance
management system and its service delivery performance including the municipal entities. The other
primary objective of the GPAC is to assist the Mayoral Committee in fulfilling its oversight
responsibilities and reviewing the performance targets as set out in the Business Plans, IDP, and the
SDBIP.
Table 6: Group Performance Audit Committee composition
Member Name Qualification Appointment Date End of Term Meetings
attended
Professor Patrick
Fitzgerald
(Chairperson)
Appointed: 1
April 2013
Bachelor of Arts (Philosophy, Politics),
Master in Public Administration and
Management
31 March 2018 4/4
Reginald Haman** Appointed: 1
April 2014
NDip Environmental Health, Dip in
Company Direction, PDBA, MBA
31 March 2018 2/4
Avhapfani Tshifularo Appointed: 1
April 2017
M.Phil. in Future Studies 31 March 2018 4/4
Khumo Shongwe Appointed: 1
April 2017
MSc Clinical Psychology 31 March 2018 3/4
Dr Jabulile Manana Appointed: 1
April 2017
MBBCh 31 March 2018 4/4
Zolani Fihlani Appointed: 1
April 2017
B Compt (Hons),
H Dip Tax CA (SA)
31 March 2018 2/4
Gwen Ngwenya* Appointed: 1
April 2017
Bachelor of Social Science
Masters in International Economics
3/4
Griffiths Zabala Appointed: 1
April 2018
Diploma in Social Development, B.A.
Social Work, Certificate in Small, Medium
& Micro-Enterprises, Master of
31 Mar 2019 2/2
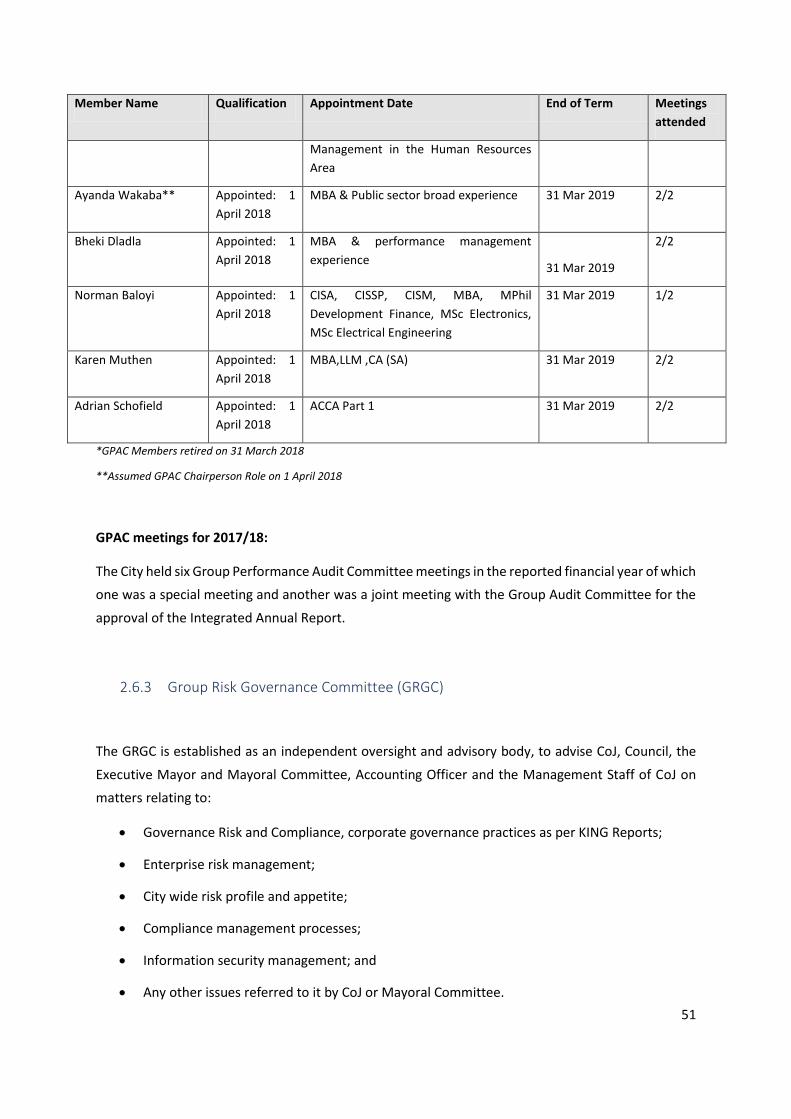
51
Member Name Qualification Appointment Date End of Term Meetings
attended
Management in the Human Resources
Area
Ayanda Wakaba** Appointed: 1
April 2018
MBA & Public sector broad experience 31 Mar 2019 2/2
Bheki Dladla Appointed: 1
April 2018
MBA & performance management
experience
31 Mar 2019
2/2
Norman Baloyi Appointed: 1
April 2018
CISA, CISSP, CISM, MBA, MPhil
Development Finance, MSc Electronics,
MSc Electrical Engineering
31 Mar 2019 1/2
Karen Muthen Appointed: 1
April 2018
MBA,LLM ,CA (SA) 31 Mar 2019 2/2
Adrian Schofield Appointed: 1
April 2018
ACCA Part 1 31 Mar 2019 2/2
*GPAC Members retired on 31 March 2018
**Assumed GPAC Chairperson Role on 1 April 2018
GPAC meetings for 2017/18:
The City held six Group Performance Audit Committee meetings in the reported financial year of which
one was a special meeting and another was a joint meeting with the Group Audit Committee for the
approval of the Integrated Annual Report.
2.6.3 Group Risk Governance Committee (GRGC)
The GRGC is established as an independent oversight and advisory body, to advise CoJ, Council, the
Executive Mayor and Mayoral Committee, Accounting Officer and the Management Staff of CoJ on
matters relating to:
Governance Risk and Compliance, corporate governance practices as per KING Reports;
Enterprise risk management;
City wide risk profile and appetite;
Compliance management processes;
Information security management; and
Any other issues referred to it by CoJ or Mayoral Committee.
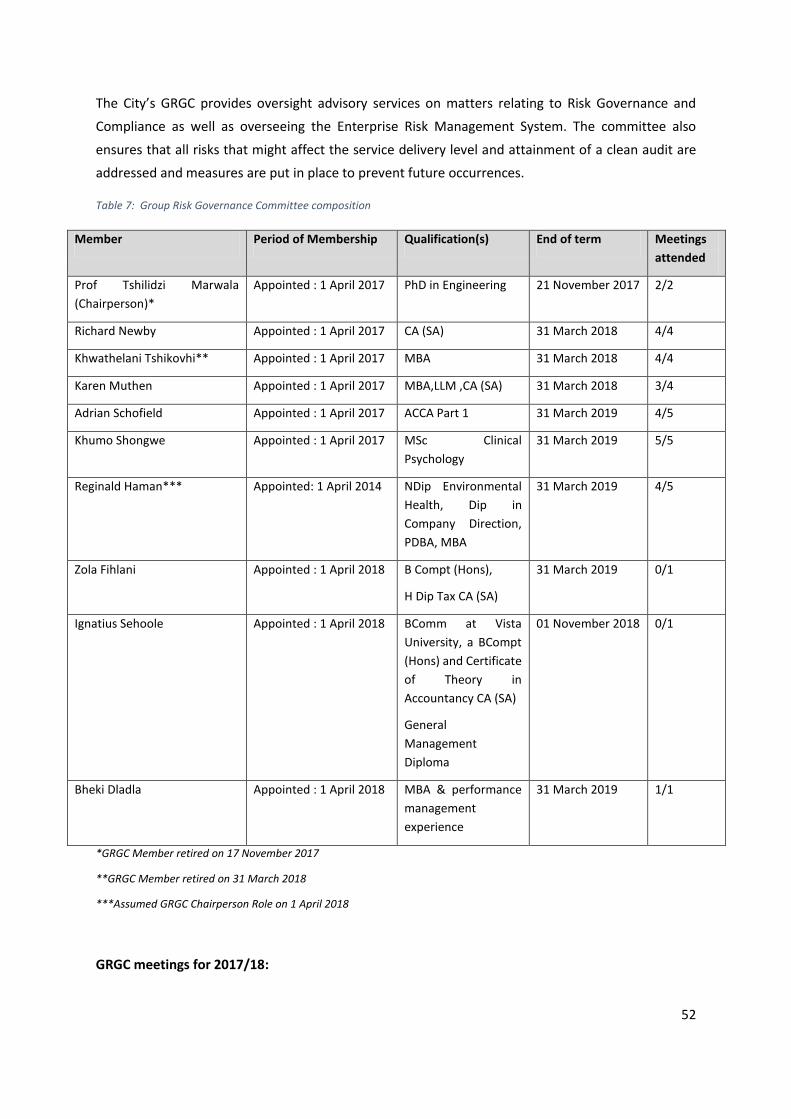
52
The City’s GRGC provides oversight advisory services on matters relating to Risk Governance and
Compliance as well as overseeing the Enterprise Risk Management System. The committee also
ensures that all risks that might affect the service delivery level and attainment of a clean audit are
addressed and measures are put in place to prevent future occurrences.
Table 7: Group Risk Governance Committee composition
Member Period of Membership Qualification(s) End of term Meetings
attended
Prof Tshilidzi Marwala
(Chairperson)*
Appointed : 1 April 2017 PhD in Engineering 21 November 2017 2/2
Richard Newby Appointed : 1 April 2017 CA (SA) 31 March 2018 4/4
Khwathelani Tshikovhi** Appointed : 1 April 2017 MBA 31 March 2018 4/4
Karen Muthen Appointed : 1 April 2017 MBA,LLM ,CA (SA) 31 March 2018 3/4
Adrian Schofield Appointed : 1 April 2017 ACCA Part 1 31 March 2019 4/5
Khumo Shongwe Appointed : 1 April 2017 MSc Clinical
Psychology
31 March 2019 5/5
Reginald Haman*** Appointed: 1 April 2014 NDip Environmental
Health, Dip in
Company Direction,
PDBA, MBA
31 March 2019 4/5
Zola Fihlani Appointed : 1 April 2018 B Compt (Hons),
H Dip Tax CA (SA)
31 March 2019 0/1
Ignatius Sehoole Appointed : 1 April 2018 BComm at Vista
University, a BCompt
(Hons) and Certificate
of Theory in
Accountancy CA (SA)
General
Management
Diploma
01 November 2018 0/1
Bheki Dladla Appointed : 1 April 2018 MBA & performance
management
experience
31 March 2019 1/1
*GRGC Member retired on 17 November 2017
**GRGC Member retired on 31 March 2018
***Assumed GRGC Chairperson Role on 1 April 2018
GRGC meetings for 2017/18:
53
During the reported financial year, six Group Risk Governance Committee meetings were convened of
which none were special meetings.
2.7 Board of Directors in the Municipal Entities
The City has ensured the stability of the Entity Boards and Group Advisory Committees in 2017/18.This
was done through retaining experienced members to ensure that strategic direction is uninterrupted.
The City under the new political administration elected on 3 August 2016, appointed new members
to the Entity Boards and Group Advisory Committees on 1 April 2018.
The City continued its developmental approach to capacitate the boards and Oversight Committees,
where the annual rotation of seasoned members creates a balance and opportunity for new and less
experienced individuals to serve with experienced members in the boards and committees. This
creates an enormous platform for growth of young professionals. The focus on good corporate
governance and activism of the shareholder has seen sustained and improved performance in the
audit outcomes at a number of Municipal Entities as well as at core.
Role and Responsibilities of the Board of Directors
The Directors shall be appointed in accordance with the City Group Policy or any other policy
determined by the Shareholder from time to time. The Board of Directors is mandated to manage the
affairs and the business of the Company and is accountable to the Shareholder for compliance with
the applicable legal framework. The Board shall further ensure that the Company complies with the
provisions of the Companies Act, MFMA, the Systems Act and other applicable legislations, regulations
and/or guidelines issued by the National Treasury and/or any other document or agreement governing
the relationship between the parties.
Role and Responsibilities of the Chairperson of the Board
The Board must be led by a chairperson, who shall be independent non- executive director duly
appointed in terms of the City’s Group Policy. The Chairperson of the Board of the Company together
with the CEO shall be the point of contact in dealings with the Shareholder unless otherwise delegated.
The chairperson’s responsibilities must be separate from those of management led by the CEO.
Role and Responsibilities of the CEO or MD
The Board shall in consultation with the City procure the appointment of the CEO and who shall be
appointed as a full-time employee of the Company and manager of the Company’s office. The CEO
54
shall be a member of the Board and is accountable to the Board for the management of the Company.
The CEO must ensure that the operations of the Company, ensuring that the Company are run
effectively and effectively in accordance with the strategic decisions of the Board. The CEO shall be
responsible for the day to day management of the Company and to provide the Board with accurate
and relevant information provided to the Board timeously.
Term of office and removal
The term of office of each Director shall be determined by the City Group Policy or any policy
determined by the City from time to time. A member may resign by giving three months’ notice to the
City or such notice as determined by the City from time to time. The resigning director must promptly
return to the Company all confidential information and other documentation, which may have been
given to him as a result of his position as director of the Company. The City shall have sole and absolute
discretion to remove or recall one or more Directors of the Company without giving reason thereof.
2.8 Public participation
2.8.1 Ward committees
Ward councillors are responsible for representing the needs and interests of their constituents. Linked
to this is the establishment of ward committees in terms of the Local Government Act, 1998, and
Section 72 of the Municipal Structures Act, 1998. These committees intend to enhance participatory
democracy in local government by assisting ward councillors in carrying out their mandate.
Specifically, ward committees should boost the participation of the public in the affairs of Council.
They also advise and make recommendations to ward councillors on matters that are affecting the
ward.
Ward committees are constituted by portfolios including Housing, Transport, Public Safety, Finance
and Economic Development, Infrastructure and Services, Community Development, Health and Social
Development, Development Planning and Urban Management. Meetings are held monthly to discuss
issues raised within the community and to obtain feedback from the ward councillor on significant
issues and decisions reached at council.
The Speaker of the Council manages the effective functioning of ward committees, in order to ensure
ongoing and improved community participation in local government.
55
2.8.2 IDP Outreach
The City held eight Regional Summits to respond to community issues raised during the analysis phase
of the City’s IDP Process and to present the 2018/19 draft IDP/budget to the public. These public
engagement sessions presented the opportunity to communities to review the service delivery needs
and priorities of the ward in which they reside, ultimately shaping the IDP according to their needs and
interests. The City communicated these meetings to the public by using appropriate communication
methods i.e. community newspapers, community radio stations and commercial radio stations.
The target audience for these regional summits were community members, NGOs, CBOs, Councillors
and other interested stakeholders.
The main issues raised which the City should address through the implementation of the 2018/19 IDP
and the Budget are:
Access to basic services: water, electricity and waste removal especially in informal
settlements;
Housing and land: RDP houses, renovation of council flats, formalising of informal
settlements and issuing of title deeds;
Access to public facilities: community halls, parks, libraries;
Public participation: frequent community meeting and more access to councilors;
Good governance: fighting corruption;
Local economic development: poverty, unemployment, SMME infrastructure;
Health and safety: building of clinics in areas where clinics are too far, police visibility and by-
law enforcement;
Roads and transport: access to public transport, tarring of roads in informal settlements,
resurfacing of roads and dealing with potholes; and
Cross-cutting issues: land use, spatial planning, and the environment.
For administrative purposes, the City of Johannesburg is divided into seven regions. The map below
details the regions.
Figure 9: CoJ regions
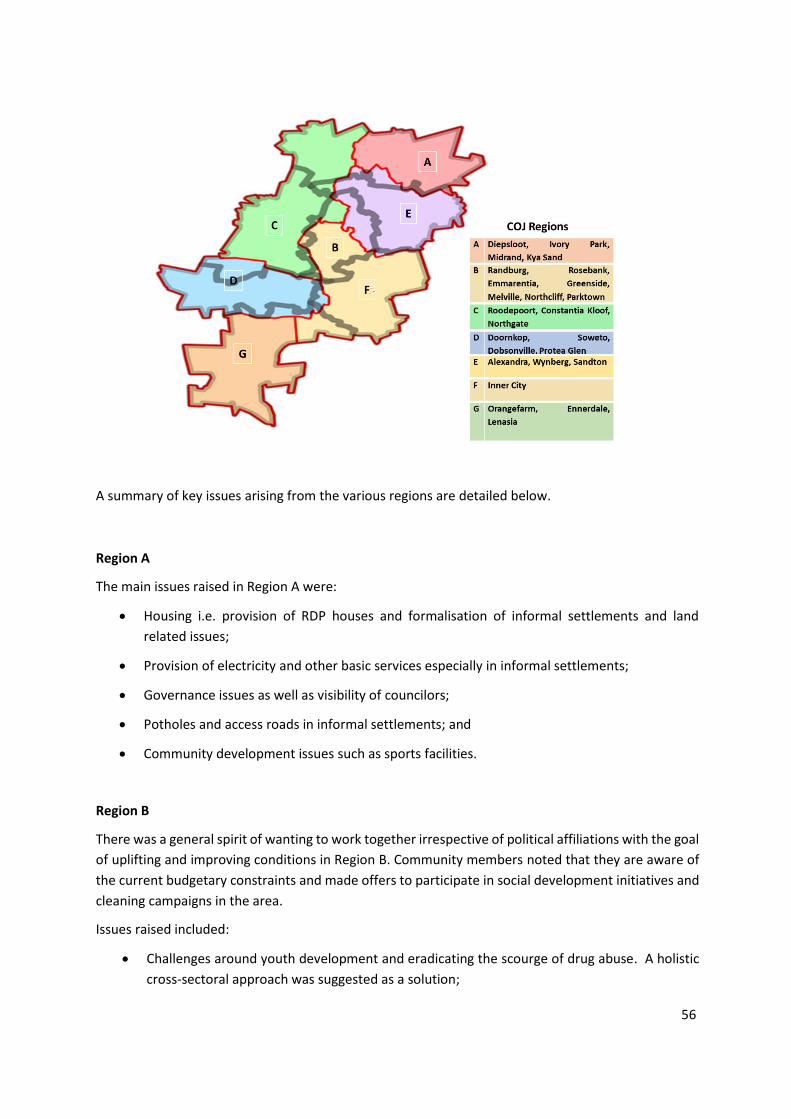
56
A summary of key issues arising from the various regions are detailed below.
Region A
The main issues raised in Region A were:
Housing i.e. provision of RDP houses and formalisation of informal settlements and land
related issues;
Provision of electricity and other basic services especially in informal settlements;
Governance issues as well as visibility of councilors;
Potholes and access roads in informal settlements; and
Community development issues such as sports facilities.
Region B
There was a general spirit of wanting to work together irrespective of political affiliations with the goal
of uplifting and improving conditions in Region B. Community members noted that they are aware of
the current budgetary constraints and made offers to participate in social development initiatives and
cleaning campaigns in the area.
Issues raised included:
Challenges around youth development and eradicating the scourge of drug abuse. A holistic
cross-sectoral approach was suggested as a solution;
57
High unemployment rate;
Housing challenges mostly with 2 room houses – a meeting with the EM and MMC: Housing
was requested;
Grass cutting;
Riverlea’s gas emissions;
The Ward Councillor is not visible in the ward;
Sand street challenges as result of flooding, water going over electricity boxes if it rains;
Illegal mining activities;
Kathrada Park, by-law violations, storm water systems are defunct, no proper roads mostly
due to encroachment;
Coronation, bad road infrastructure, stalled Slovo projects, illegal electricity connections,
burning electricity cables in most cases;
Need for housing policy review, formalisation of informal settlements;
Poor project management by JDA, no housekeeping, appointment of incompetent
contractors, irregularities on appointment;
JPC repairs and maintenance, flats not maintained, facilities management;
Overloaded clinics due to under staffing, unfriendly staff;
Policing not effective (JMPD);
Unavailability of housing, planning and building control;
Zamimpilo: Gas pipes from Sasol, all mining must stop in the area. Shacks are built every day.
Sites being sold at Zamimpilo. Housing project earmarked for Riverlea must stop as it poses
risk to lives;
Ward 82. MMC’s must come to wards with ward councillors. Reckless spinning of vehicles,
implementation of by-laws, illegal business, visibility of JMPD. Request commitment from EM
of a response on their MEMO;
SMMEs must be treated fairly.;
Ward 82: economic development, remove overtime from Pikitup they are not giving good
service, rather create permanent jobs, replace people employed in Waterfall with local people
as those employed start working at 09h00 and an hour later they are gone;
Ward 117: entities not responsive, quality of work done especially on potholes is appalling, lot
of partnership not embraced by the city, e.g. City Power, no communication between entities,
proper communication with communities is essential; and
Ward 82: maintenance programme, JPC people renting out rooms for R1000, Pikitup not doing
their work, sport development, e.g. hockey.
58
Region D1
While many issues were discussed, the following were most key:
High unemployment rate and a lack of employment in the city. This challenge is seen as the
catalyst to drugs and alcohol abuse.
Lack of proper housing was seen as a big problem in the townships and the community of
Region D is highly affected by this phenomenon.
Safety and security, the community requested the city to deploy more JMPD officials to assist
in addressing this challenge.
Health – the community requested more clinics to be built in their region and more nurses be
deployed at the clinics that are currently operating in their region. The community also raised
the issue of lack of ambulances in their region.
Reliable electricity – there are continuous outages which City Power take too long to fix. Street
lights do not work, with some not working for the past year or so.
Lack of maintenance of sports facilities.
Cemeteries with the community pleading with the City to reduce the R1800 fee payable
through City Parks for a gravesite.
Potholes, water and sanitation as well as traffic lights were also raised as issues that needed
urgent attention.
Region D2
Issues included:
Housing and land issues especially from communities in Freedom Park and Elias Motsoaledi;
Grading of roads in informal settlements and resurfacing of roads around Orlando and
Diepkloof;
Provision of bulk infrastructure in informal settlements;
Lack of economic opportunities;
Need for transparent RDP housing allocations; and
Not enough sporting facilities in Riverlea, especially cricket facilities.
Region E
Issues raised included:
Land expropriation with the community highlighting various vacant pieces of land that they
believed can be turned to housing projects.
59
Residents from Marlboro expressed concerns regarding illegal occupation of land as this may
have negative impact on their properties.
Communities have sensitive relationships with foreigner nationals as they were blamed for
taking business, buying their land and houses that should be provided by the City to them.
Region F
Issues related to:
Housing and disruption of electricity supply;
Continuous evictions that are taking place in the Inner City without being provided with alternative accommodation;
Potholes in the region;
Waste removal; and
Safety and Security concerns were also raised as needing more and intense intervention.
Region G
Session was disrupted but issues from written submissions were received. These included:
Housing and land being sold illegally;
Wards underdeveloped;
Safety and Security;
There are not enough health facilities; and
Economic development opportunities.
60
3. Service Delivery Performance
Service delivery is at the heart of the City’s programmes and priorities. The City has a mandate to
provide basic services to its communities, including the delivery of water, sanitation, electricity, roads,
housing and waste collection. However, given the City’s commitment to improving the quality of life
of its residents and stakeholders, it has expanded this mandate to cover delivery of additional services
including economic development initiatives such as the Johannesburg Development Agency and
Joburg Market, community development including City Parks and Zoo and Joburg Theatres, social
development and health, and a number of other key focus areas aimed at ensuring a liveable and
sustainable city.
In the current term of office the City has identified nine strategic priorities to drive delivery. These
are listed in Chapter 1. Every one of the City’s departments and municipal entities has aligned their
delivery to these priorities, in order to ensure that the City’s medium term, and then long term, goals
are realised.
In this chapter, the performance of the City’s municipal entities and departments is summarised. For
more detailed information on municipal entity performance, individual annual reports for each of the
entities are available on the relevant websites.
3.1 Water Services: Johannesburg Water
Water and sanitation services in the city are provided by the municipal entity, Johannesburg Water.
The entity provides water and sanitation services to an area stretching from Orange Farm in the south,
to Midrand in the north, Roodepoort in the west and Alexandra in the east. It supplies approximately
833 004 domestic, commercial and industrial customers and serves an estimated consumer base of
about 5.1 million people Johannesburg Water supplies 1 553 ML/day of potable drinking water,
procured from Rand Water, through a water distribution network of 12 069 km, 127 reservoirs and
water towers, and 37 water pump stations. Spent wastewater is collected and reticulated via 11 621
km of wastewater networks and 38 sewer pump stations. Johannesburg Water treats 925 ML/day of
sewerage at its six wastewater treatment works (WWTW), which includes two of its biogas-to-energy
plants where methane gas is converted to energy.
The entity employs 2 645 people and has ten network depots and six wastewater treatment plants.
61
Performance highlights
Performance highlights in 2017/18 include:
Revenue increased from R8.6 million in 2016/17 to over R10 billion;
BBBEE recognition of 126%;
99.9% compliance with drinking water quality;
Water consumption decreased to 284.92 litres per person per day from a baseline of 287.70
litres per person per day in 2016/17;
100% compliance to sludge breakage;
Replaced 45.4 kilometres of sewer pipes against a target of 33.5 kilometres, translating to
135.5% over-achievement;
For water networks, a total of 29.4 kilometres was replaced against a target of 67 kilometres;
995 Expanded Public Works Programme job opportunities were created;
In providing services to informal settlements, an additional 620 informal dwellings were
provided with access to basic sanitation;
R603 million was spent on capital projects (84.3% against a target of 95%);
Over 330 000 de-sludging services were carried out on ventilated improved pit latrines; and
151 million litres of water were transported to tanks in informal settlements in the year under
review.
Summary of performance
During 2017/18, an average of 1.55 billion litres of water, complying with acceptable drinking water
standards (SANS 241), was distributed to the households within the city on a daily basis. This is an
increase of 2.5% in the daily volume compared to the 2016/17 financial year. Water restrictions from
September 2016 till March 2017 had a positive impact on the water demand of the city.
Daily sampling and testing were completed at four laboratories to ensure the quality of water.
Sewerage is collected through a total network of 11 621 kilometres of sewer pipes and treated at six
wastewater treatment plants situated around the city. During the 2017/18 financial year an average
of 925 million litres of sewerage per day was treated. The treated effluent was then discharged back
into the river system, complying 72% with the Department of Water and Sanitation standards.
62
As part of the wastewater process, sludge is produced that needs to be disposed of within the required
guidelines. Daily, the sludge is transported to contracted famers who use it as fertiliser. During the
2017/18 financial year, JW transported 132 820 cubic metres of sludge to farms.
The water and sewer network infrastructure is operated and maintained, daily, by teams based in ten
network depots and four Electro-Mechanical depots. The lifespan of this network is 100 years, with
45 years left. During the 2017/18 financial year, 33 856 water pipes burst and 59 892 metres and
connection failures were dealt with by these teams. During the same period 62 363 sewer blockages
were cleared.
Johannesburg Water also provides onsite water and sanitation services to households residing in
informal settlements. These services include desludging of VIP toilets, providing and servicing
chemical toilets and transporting drinking water. During the year under review, over 57 000 ventilated
improved pit toilets were de-sludged, 7 178 chemical toilets were provided and serviced (twice weekly
on average) and 151 million litres of water was transported to stationary tanks in the informal
settlements.
The response time to water bursts restored within 48 hours of notification was 89.09% against a target
of 95%, and for sewer blockages cleared within 24 hours of notification – 94.94% against a target of
96%. Although the failure rate of water infrastructure decreased slightly during the year, the response
times reduced when compared to the 2016/17 financial year. Continued efforts were made to reduce
the number of bursts (minor and major) outstanding for longer than seven days. Positive
improvements were evident in the number of outstanding works order longer than seven days
decreasing by 53% year on year. This is a positive continuation from last year’s reduction of 50%.
Response times on water bursts will improve further since minimum standards of at least three major
bursts and three other water related jobs per team per day are being implemented. Water teams are
completing 4.10 jobs per day on average which demonstrates a 1.7% improvement in productivity
from the 2016/17 financial year. It must be noted that water infrastructure renewal needs to be
accelerated to contribute positively to the response times. The target for sewers was almost achieved
but will improve going forward. The number of sewer blockages experienced however still increased
during the 2017/18 financial year (8.8% increase from the previous year). This will improve going
forward due to the increased capital investment - especially with regard to the renewal of old sewer
infrastructure. Minimum standards of at least five sewer blockages per team per day are being
implemented. Sewer teams are completing 4.49 jobs per day on average (a 15% improvement in
productivity from the 2016/17 financial year). Continued education campaigns in respect of the
incorrect use of sewer infrastructure will also have a positive impact on reducing the failure rate.
The number of bursts experienced per 100 km of pipe length was 358.77 against a target of 391 whilst
the corresponding sewer blockages experienced per 100 km was 540.72 against a target of 504. The
trend for infrastructure failure rate on water pipes is currently stable and above target when
compared to the previous financial year but still remains high which is a major concern. This is mainly
63
due to aging pipe infrastructure. The rate of infrastructure replacement has once again been
negatively impacted by budget deferments which may stimulate a further deterioration in
performance. In mitigation of this, the implementation of an improved pressure management system
had a positive impact in this regard.
The measurement on the number of sewer blockages per 100 km relates directly to the incorrect use
of the sewer infrastructure in hotspot areas including Ivory Park, Alexandra, Diepsloot and Orange
Farm which cause recurring blockages. The continued sewer utilisation education campaign in these
areas is vital to reduce re-occurring blockages.
Preventative maintenance through hydro-jetting is in progress in all six operational regions and during
this financial year 1 126km was covered. This will be increased with manual preventative cleaning
once the IT work scheduling system is operational at regional level during quarter 1 of the 2018/19
financial year. This will assist in terms of improving performance.
The percentage compliance with drinking water quality standard (SANS 241) on E-Coli was 99.9%
against a target of 99%. This positive achievement will enable the City of Johannesburg to retain its
Blue Drop Status.
The final effluent compliance from WWTW was 72% (slightly down from the 74% in the previous year)
against a target of 90%.
The new Water Use Licences with more stringent limits cannot currently be achieved with the existing
wastewater treatment works infrastructure for Driefontein, Ennerdale, Bushkoppie and Northern
Wastewater Works. These are having a negative impact on the effluent compliance. The entity
submitted an objection report against these limits in March 2016.
Bushkoppie Works received an amended licence on the requested parameters with the exception of
E. coli. JW was requested to submit further motivation for the relaxation of the 0 cfu/100ml limit for
E. coli for Ennerdale and Bushkoppie Works. An amended licence was also received for Northern
Works in May 2018 with more attainable parameters. Johannesburg Water is currently following up
with DWS on the signing of the Driefontein license.
The operational failures at Northern Works (sand blockages, dewatering, power failures, Unit 3
clarifier flow distribution structure failure, PSTs, ETs and Unit 3), Bushkoppie (Power failures, sand
blockages, aeration failures), Goudkoppies (ageing infrastructure, clarifier siphon failures, power
failures, disinfection failure and belt press failure) and Ennerdale (power failures, sudden high inflows
and disinfection failure) contributed in the non-achievement of the target on effluent compliance.
Operational failures of equipment at the WWTW have increased as a result of deferred capital budget
over the last few years and this contributed to continued infrastructure deterioration which led to
operational non-compliance with regulatory requirements. In mitigating the situation, the mechanical
64
failures at the WWTW are being addressed as a priority through the replacement or refurbishment of
old electrical and mechanical equipment.
Refurbishment of electrical and mechanical equipment at Northern Works is taking place via contracts.
The refurbishment of Unit 3 reactors, clarifiers, electrical and mechanical equipment as well as the
balancing tank mixers are completed.
Refurbishment of the failing solids treatment equipment (belt presses) at Goudkoppies Works is being
done on an emergency basis and work that commenced in 2017 should be completed by the end of
quarter 1 of the 2018/19 financial year. This will have a positive impact on the quality of effluent
discharged.
The water consumption per capita per day was 284.92 litres per person per day (l/c/d) against a target
of 299 l/c/d. Johannesburg Water is continuing to implement projects such as Pressure Management,
Soweto Infrastructure Upgrade and Renewal Project as well as Mains Replacement to reduce the
water demand. A positive impact is made through Pressure Management and the Soweto
Infrastructure Upgrade and Renewal Project in areas where they are being implemented.
Soweto Infrastructure Upgrade and Renewal
No meters were rolled out for the year.
Basic Services
Johannesburg Water continually provides basic water and sanitation to communities living within the
informal settlements. Progress was limited during the year mainly due to procurement challenges
after both basic water and sanitation procurement processes had to be re-tendered after the first
tenders were non-awarded in the beginning of the 2017/18 financial year.
The plan was to provide access to basic water to 2 290 households however due to delay in
procurement process no services were provided. The plan for 2017/18 is to provide access to basic
sanitation to 2 640 households. 620 households were provided with access to basic sanitation.
Pipe Replacement
The Water Pipe Replacement Programme is geared towards the reduction of physical losses within
the City of Johannesburg. The water network has consumed 45% of its design life.
In order to improve the water network’s remaining useful life, Johannesburg Water had planned to
replace a total of 67 km of old water pipes in the financial year. Out of a total of 19 water pipe
replacement projects under construction in the financial year, 16 projects were completed
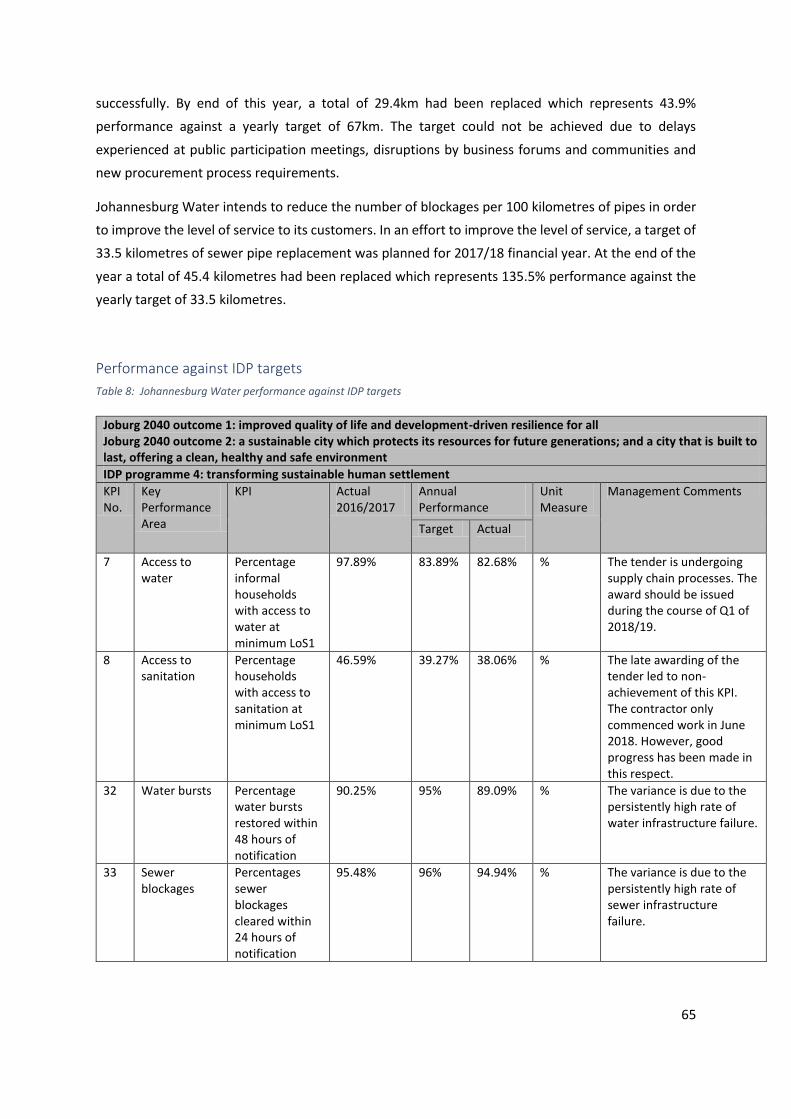
65
successfully. By end of this year, a total of 29.4km had been replaced which represents 43.9%
performance against a yearly target of 67km. The target could not be achieved due to delays
experienced at public participation meetings, disruptions by business forums and communities and
new procurement process requirements.
Johannesburg Water intends to reduce the number of blockages per 100 kilometres of pipes in order
to improve the level of service to its customers. In an effort to improve the level of service, a target of
33.5 kilometres of sewer pipe replacement was planned for 2017/18 financial year. At the end of the
year a total of 45.4 kilometres had been replaced which represents 135.5% performance against the
yearly target of 33.5 kilometres.
Performance against IDP targets
Table 8: Johannesburg Water performance against IDP targets
Joburg 2040 outcome 1: improved quality of life and development-driven resilience for all Joburg 2040 outcome 2: a sustainable city which protects its resources for future generations; and a city that is built to last, offering a clean, healthy and safe environment
IDP programme 4: transforming sustainable human settlement
KPI No.
Key Performance Area
KPI Actual 2016/2017
Annual Performance
Unit Measure
Management Comments
Target Actual
7 Access to water
Percentage informal households with access to water at minimum LoS1
97.89% 83.89% 82.68% % The tender is undergoing supply chain processes. The award should be issued during the course of Q1 of 2018/19.
8 Access to sanitation
Percentage households with access to sanitation at minimum LoS1
46.59% 39.27% 38.06% % The late awarding of the tender led to non-achievement of this KPI. The contractor only commenced work in June 2018. However, good progress has been made in this respect.
32 Water bursts Percentage water bursts restored within 48 hours of notification
90.25% 95% 89.09% % The variance is due to the persistently high rate of water infrastructure failure.
33 Sewer blockages
Percentages sewer blockages cleared within 24 hours of notification
95.48% 96% 94.94% % The variance is due to the persistently high rate of sewer infrastructure failure.
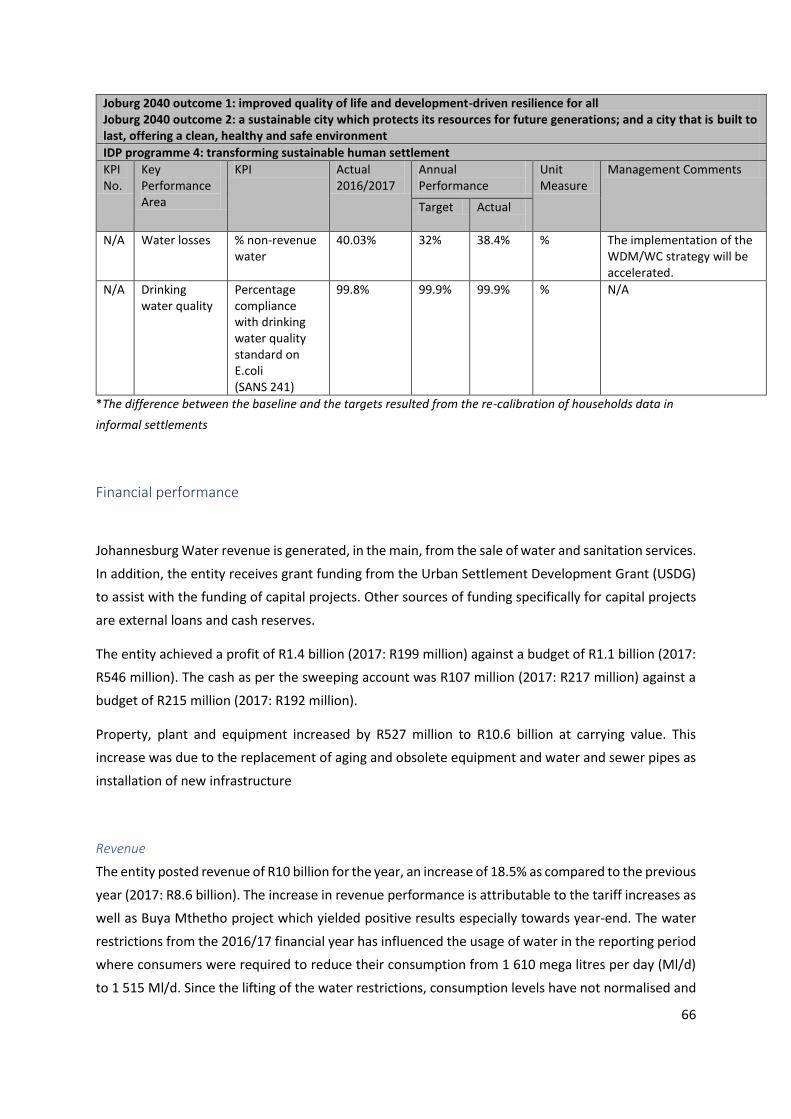
66
Joburg 2040 outcome 1: improved quality of life and development-driven resilience for all Joburg 2040 outcome 2: a sustainable city which protects its resources for future generations; and a city that is built to last, offering a clean, healthy and safe environment
IDP programme 4: transforming sustainable human settlement
KPI No.
Key Performance Area
KPI Actual 2016/2017
Annual Performance
Unit Measure
Management Comments
Target Actual
N/A Water losses % non-revenue water
40.03% 32% 38.4% % The implementation of the WDM/WC strategy will be accelerated.
N/A Drinking water quality
Percentage compliance with drinking water quality standard on E.coli (SANS 241)
99.8% 99.9% 99.9% % N/A
*The difference between the baseline and the targets resulted from the re-calibration of households data in
informal settlements
Financial performance
Johannesburg Water revenue is generated, in the main, from the sale of water and sanitation services.
In addition, the entity receives grant funding from the Urban Settlement Development Grant (USDG)
to assist with the funding of capital projects. Other sources of funding specifically for capital projects
are external loans and cash reserves.
The entity achieved a profit of R1.4 billion (2017: R199 million) against a budget of R1.1 billion (2017:
R546 million). The cash as per the sweeping account was R107 million (2017: R217 million) against a
budget of R215 million (2017: R192 million).
Property, plant and equipment increased by R527 million to R10.6 billion at carrying value. This
increase was due to the replacement of aging and obsolete equipment and water and sewer pipes as
installation of new infrastructure
Revenue
The entity posted revenue of R10 billion for the year, an increase of 18.5% as compared to the previous
year (2017: R8.6 billion). The increase in revenue performance is attributable to the tariff increases as
well as Buya Mthetho project which yielded positive results especially towards year-end. The water
restrictions from the 2016/17 financial year has influenced the usage of water in the reporting period
where consumers were required to reduce their consumption from 1 610 mega litres per day (Ml/d)
to 1 515 Ml/d. Since the lifting of the water restrictions, consumption levels have not normalised and
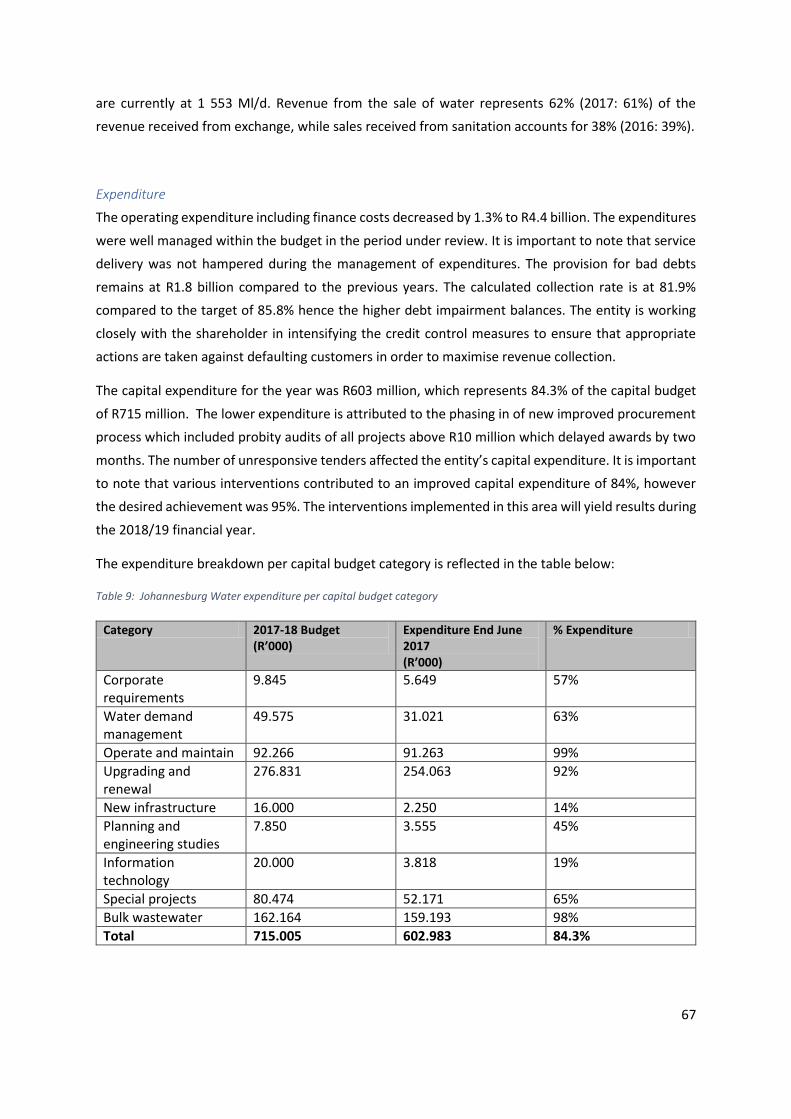
67
are currently at 1 553 Ml/d. Revenue from the sale of water represents 62% (2017: 61%) of the
revenue received from exchange, while sales received from sanitation accounts for 38% (2016: 39%).
Expenditure
The operating expenditure including finance costs decreased by 1.3% to R4.4 billion. The expenditures
were well managed within the budget in the period under review. It is important to note that service
delivery was not hampered during the management of expenditures. The provision for bad debts
remains at R1.8 billion compared to the previous years. The calculated collection rate is at 81.9%
compared to the target of 85.8% hence the higher debt impairment balances. The entity is working
closely with the shareholder in intensifying the credit control measures to ensure that appropriate
actions are taken against defaulting customers in order to maximise revenue collection.
The capital expenditure for the year was R603 million, which represents 84.3% of the capital budget
of R715 million. The lower expenditure is attributed to the phasing in of new improved procurement
process which included probity audits of all projects above R10 million which delayed awards by two
months. The number of unresponsive tenders affected the entity’s capital expenditure. It is important
to note that various interventions contributed to an improved capital expenditure of 84%, however
the desired achievement was 95%. The interventions implemented in this area will yield results during
the 2018/19 financial year.
The expenditure breakdown per capital budget category is reflected in the table below:
Table 9: Johannesburg Water expenditure per capital budget category
Category 2017-18 Budget (R’000)
Expenditure End June 2017 (R’000)
% Expenditure
Corporate requirements
9.845 5.649 57%
Water demand management
49.575 31.021 63%
Operate and maintain 92.266 91.263 99%
Upgrading and renewal
276.831 254.063 92%
New infrastructure 16.000 2.250 14%
Planning and engineering studies
7.850 3.555 45%
Information technology
20.000 3.818 19%
Special projects 80.474 52.171 65%
Bulk wastewater 162.164 159.193 98%
Total 715.005 602.983 84.3%
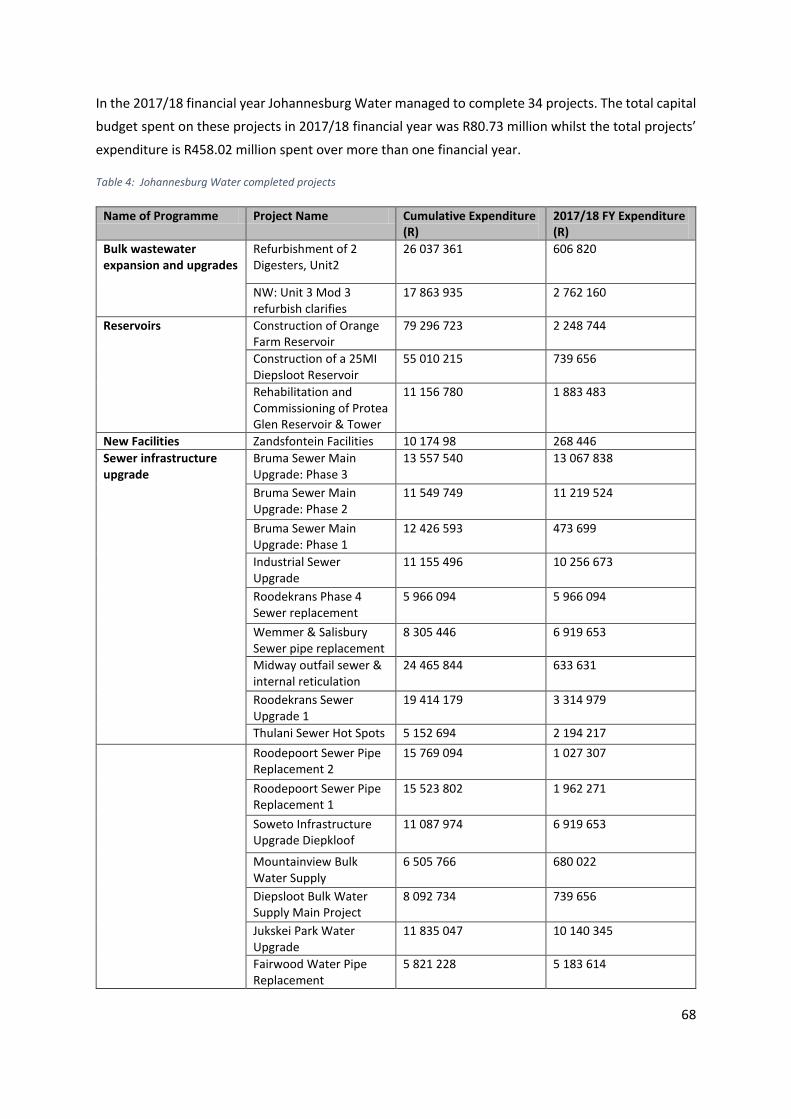
68
In the 2017/18 financial year Johannesburg Water managed to complete 34 projects. The total capital
budget spent on these projects in 2017/18 financial year was R80.73 million whilst the total projects’
expenditure is R458.02 million spent over more than one financial year.
Table 4: Johannesburg Water completed projects
Name of Programme Project Name Cumulative Expenditure (R)
2017/18 FY Expenditure (R)
Bulk wastewater expansion and upgrades
Refurbishment of 2 Digesters, Unit2
26 037 361 606 820
NW: Unit 3 Mod 3 refurbish clarifies
17 863 935 2 762 160
Reservoirs Construction of Orange Farm Reservoir
79 296 723 2 248 744
Construction of a 25MI Diepsloot Reservoir
55 010 215 739 656
Rehabilitation and Commissioning of Protea Glen Reservoir & Tower
11 156 780 1 883 483
New Facilities Zandsfontein Facilities 10 174 98 268 446
Sewer infrastructure upgrade
Bruma Sewer Main Upgrade: Phase 3
13 557 540 13 067 838
Bruma Sewer Main Upgrade: Phase 2
11 549 749 11 219 524
Bruma Sewer Main Upgrade: Phase 1
12 426 593 473 699
Industrial Sewer Upgrade
11 155 496 10 256 673
Roodekrans Phase 4 Sewer replacement
5 966 094 5 966 094
Wemmer & Salisbury Sewer pipe replacement
8 305 446 6 919 653
Midway outfail sewer & internal reticulation
24 465 844 633 631
Roodekrans Sewer Upgrade 1
19 414 179 3 314 979
Thulani Sewer Hot Spots 5 152 694 2 194 217
Roodepoort Sewer Pipe Replacement 2
15 769 094 1 027 307
Roodepoort Sewer Pipe Replacement 1
15 523 802 1 962 271
Soweto Infrastructure Upgrade Diepkloof
11 087 974 6 919 653
Mountainview Bulk Water Supply
6 505 766 680 022
Diepsloot Bulk Water Supply Main Project
8 092 734 739 656
Jukskei Park Water Upgrade
11 835 047 10 140 345
Fairwood Water Pipe Replacement
5 821 228 5 183 614
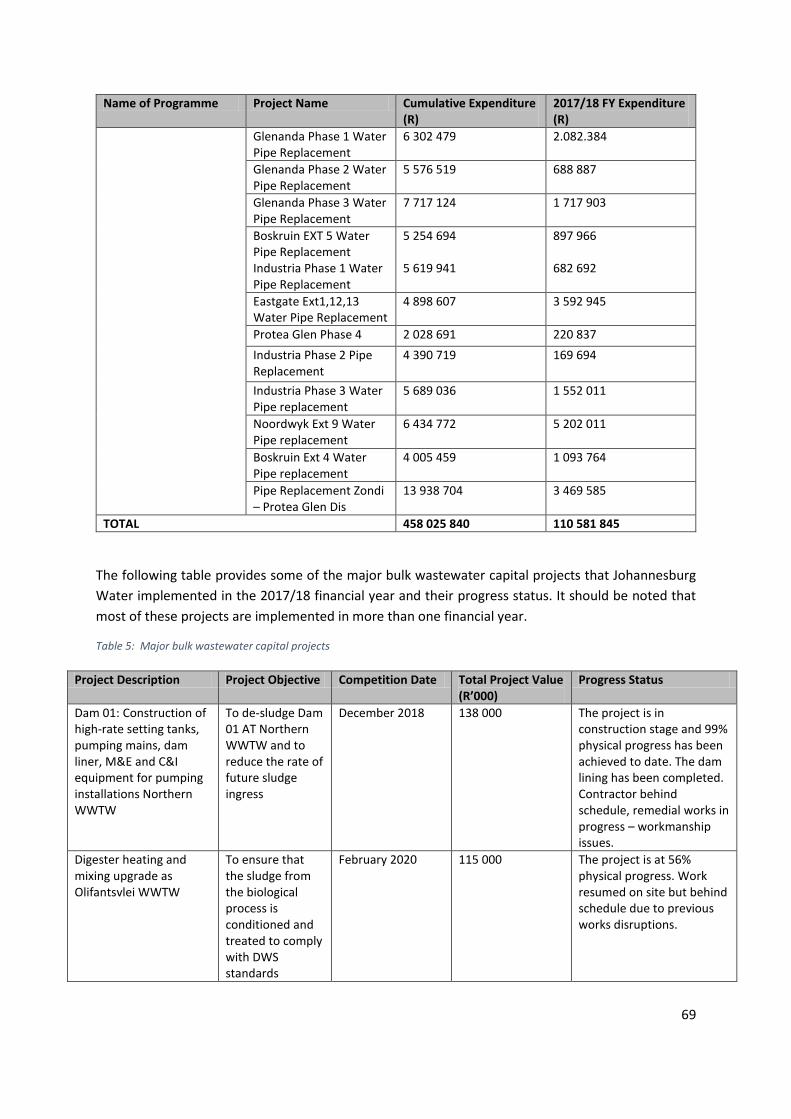
69
Name of Programme Project Name Cumulative Expenditure (R)
2017/18 FY Expenditure (R)
Glenanda Phase 1 Water Pipe Replacement
6 302 479 2.082.384
Glenanda Phase 2 Water Pipe Replacement
5 576 519 688 887
Glenanda Phase 3 Water Pipe Replacement
7 717 124 1 717 903
Boskruin EXT 5 Water Pipe Replacement Industria Phase 1 Water Pipe Replacement
5 254 694 5 619 941
897 966 682 692
Eastgate Ext1,12,13 Water Pipe Replacement
4 898 607 3 592 945
Protea Glen Phase 4 2 028 691 220 837
Industria Phase 2 Pipe Replacement
4 390 719 169 694
Industria Phase 3 Water Pipe replacement
5 689 036 1 552 011
Noordwyk Ext 9 Water Pipe replacement
6 434 772 5 202 011
Boskruin Ext 4 Water Pipe replacement
4 005 459 1 093 764
Pipe Replacement Zondi – Protea Glen Dis
13 938 704 3 469 585
TOTAL 458 025 840 110 581 845
The following table provides some of the major bulk wastewater capital projects that Johannesburg
Water implemented in the 2017/18 financial year and their progress status. It should be noted that
most of these projects are implemented in more than one financial year.
Table 5: Major bulk wastewater capital projects
Project Description Project Objective Competition Date Total Project Value (R’000)
Progress Status
Dam 01: Construction of high-rate setting tanks, pumping mains, dam liner, M&E and C&I equipment for pumping installations Northern WWTW
To de-sludge Dam 01 AT Northern WWTW and to reduce the rate of future sludge ingress
December 2018 138 000 The project is in construction stage and 99% physical progress has been achieved to date. The dam lining has been completed. Contractor behind schedule, remedial works in progress – workmanship issues.
Digester heating and mixing upgrade as Olifantsvlei WWTW
To ensure that the sludge from the biological process is conditioned and treated to comply with DWS standards
February 2020 115 000 The project is at 56% physical progress. Work resumed on site but behind schedule due to previous works disruptions.
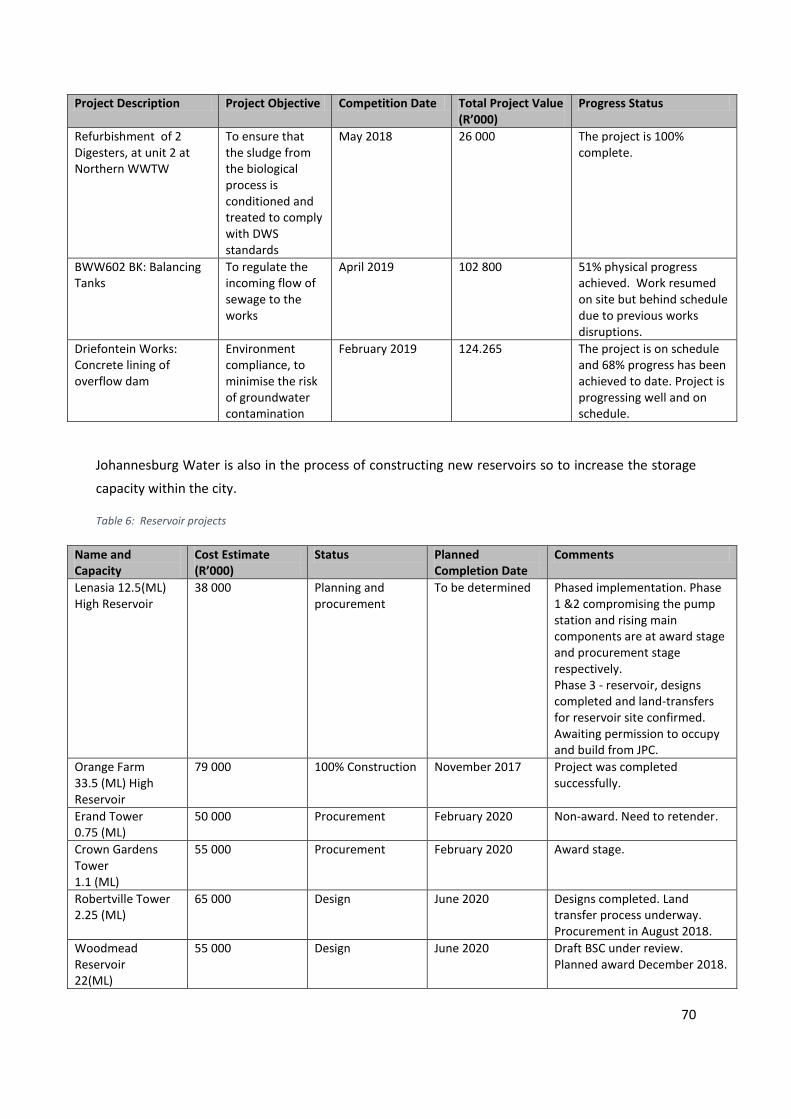
70
Project Description Project Objective Competition Date Total Project Value (R’000)
Progress Status
Refurbishment of 2 Digesters, at unit 2 at Northern WWTW
To ensure that the sludge from the biological process is conditioned and treated to comply with DWS standards
May 2018 26 000 The project is 100% complete.
BWW602 BK: Balancing Tanks
To regulate the incoming flow of sewage to the works
April 2019 102 800 51% physical progress achieved. Work resumed on site but behind schedule due to previous works disruptions.
Driefontein Works: Concrete lining of overflow dam
Environment compliance, to minimise the risk of groundwater contamination
February 2019 124.265 The project is on schedule and 68% progress has been achieved to date. Project is progressing well and on schedule.
Johannesburg Water is also in the process of constructing new reservoirs so to increase the storage
capacity within the city.
Table 6: Reservoir projects
Name and Capacity
Cost Estimate (R’000)
Status Planned Completion Date
Comments
Lenasia 12.5(ML) High Reservoir
38 000 Planning and procurement
To be determined Phased implementation. Phase 1 &2 compromising the pump station and rising main components are at award stage and procurement stage respectively. Phase 3 - reservoir, designs completed and land-transfers for reservoir site confirmed. Awaiting permission to occupy and build from JPC.
Orange Farm 33.5 (ML) High Reservoir
79 000 100% Construction November 2017 Project was completed successfully.
Erand Tower 0.75 (ML)
50 000 Procurement February 2020 Non-award. Need to retender.
Crown Gardens Tower 1.1 (ML)
55 000 Procurement February 2020 Award stage.
Robertville Tower 2.25 (ML)
65 000 Design June 2020 Designs completed. Land transfer process underway. Procurement in August 2018.
Woodmead Reservoir 22(ML)
55 000 Design June 2020 Draft BSC under review. Planned award December 2018.
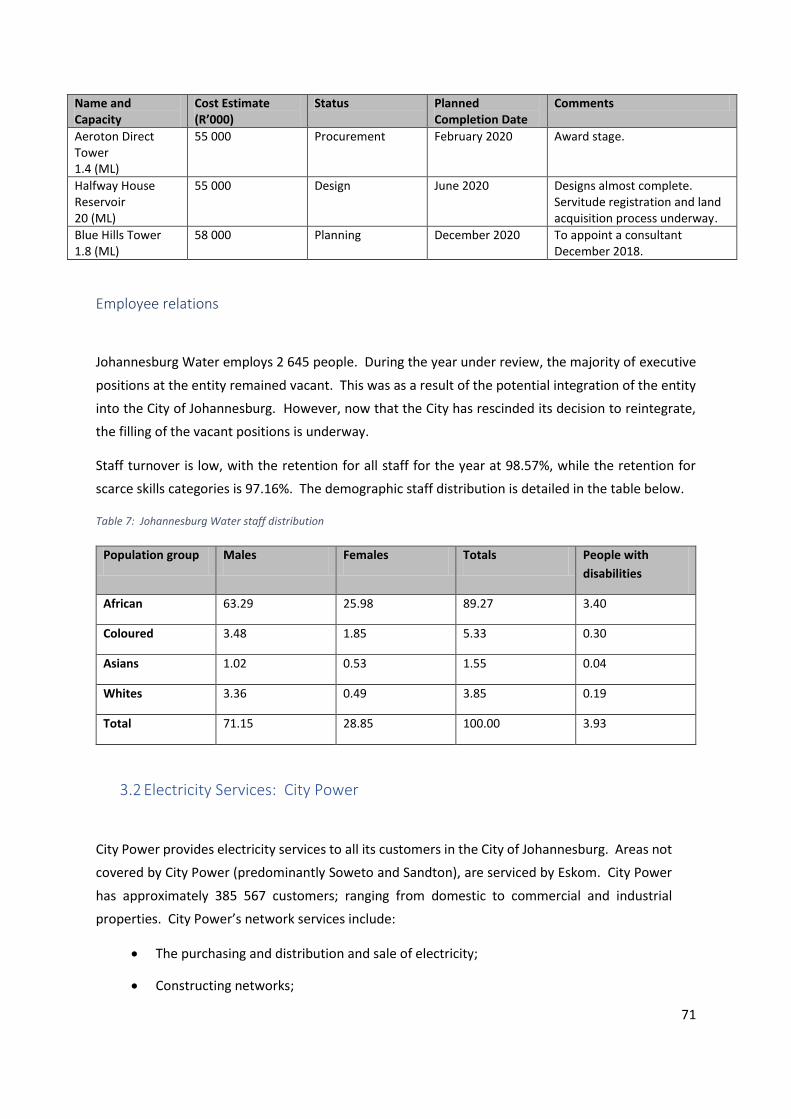
71
Name and Capacity
Cost Estimate (R’000)
Status Planned Completion Date
Comments
Aeroton Direct Tower 1.4 (ML)
55 000 Procurement February 2020 Award stage.
Halfway House Reservoir 20 (ML)
55 000 Design June 2020 Designs almost complete. Servitude registration and land acquisition process underway.
Blue Hills Tower 1.8 (ML)
58 000 Planning December 2020 To appoint a consultant December 2018.
Employee relations
Johannesburg Water employs 2 645 people. During the year under review, the majority of executive
positions at the entity remained vacant. This was as a result of the potential integration of the entity
into the City of Johannesburg. However, now that the City has rescinded its decision to reintegrate,
the filling of the vacant positions is underway.
Staff turnover is low, with the retention for all staff for the year at 98.57%, while the retention for
scarce skills categories is 97.16%. The demographic staff distribution is detailed in the table below.
Table 7: Johannesburg Water staff distribution
Population group Males Females Totals People with
disabilities
African 63.29 25.98 89.27 3.40
Coloured 3.48 1.85 5.33 0.30
Asians 1.02 0.53 1.55 0.04
Whites 3.36 0.49 3.85 0.19
Total 71.15 28.85 100.00 3.93
3.2 Electricity Services: City Power
City Power provides electricity services to all its customers in the City of Johannesburg. Areas not
covered by City Power (predominantly Soweto and Sandton), are serviced by Eskom. City Power
has approximately 385 567 customers; ranging from domestic to commercial and industrial
properties. City Power’s network services include:
The purchasing and distribution and sale of electricity;
Constructing networks;
72
Connecting customers;
Repair and maintenance of networks; and
Installation and maintenance of public lighting.
Performance highlights
Performance highlights in 2017/18 include:
Appointment of the CEO on 1 October 2017 which assisted in stabilising the business;
A total of 1 374 public lights have been installed;
A total of 2 167 units (structures) in informal settlements have been electrified;
Slovo Park: 1076 informal settlement dwellings have been electrified after CoJ allocated R41
million for the completion of this project and project was launched beginning of July by the
Executive Mayor;
Alexandra: 300 units (structures) in informal settlement have been connected and 100 public
lights installed; and
Elias Motsoaledi: 175 RDP houses connected, and 105 public lights installed.
Summary of performance
City Power has achieved 96% compliance to the Quality of Supply (NRS048) target. In terms of basic
service delivery, in 2017/18 the entity installed 1 374 public lights against a target of 1000; it electrified
2 167 units in informal settlement compared to target of 810; average restoration time for logged
electricity supply failures to traffic signals is 10.2 hours. Seven suspects were sentenced to 10 years
each imprisonment for cable theft
City Power is also cognisant of the need to preserve resources for future generations. In this regard,
41 355.5 tons CO₂ was offset in greenhouse gas emissions.
Job creation programmes form another key priority for the entity. In 2017/18, 39.24% of the budget
was spent on 50% black owned companies, while 16.17% of the budget was spent on women owned
companies.
There was a successful launch of the LIGHTS ON! Campaign as a cultural anchor to support the
organisation’s efforts in ensuring retention of the right people doing the right things to reach the
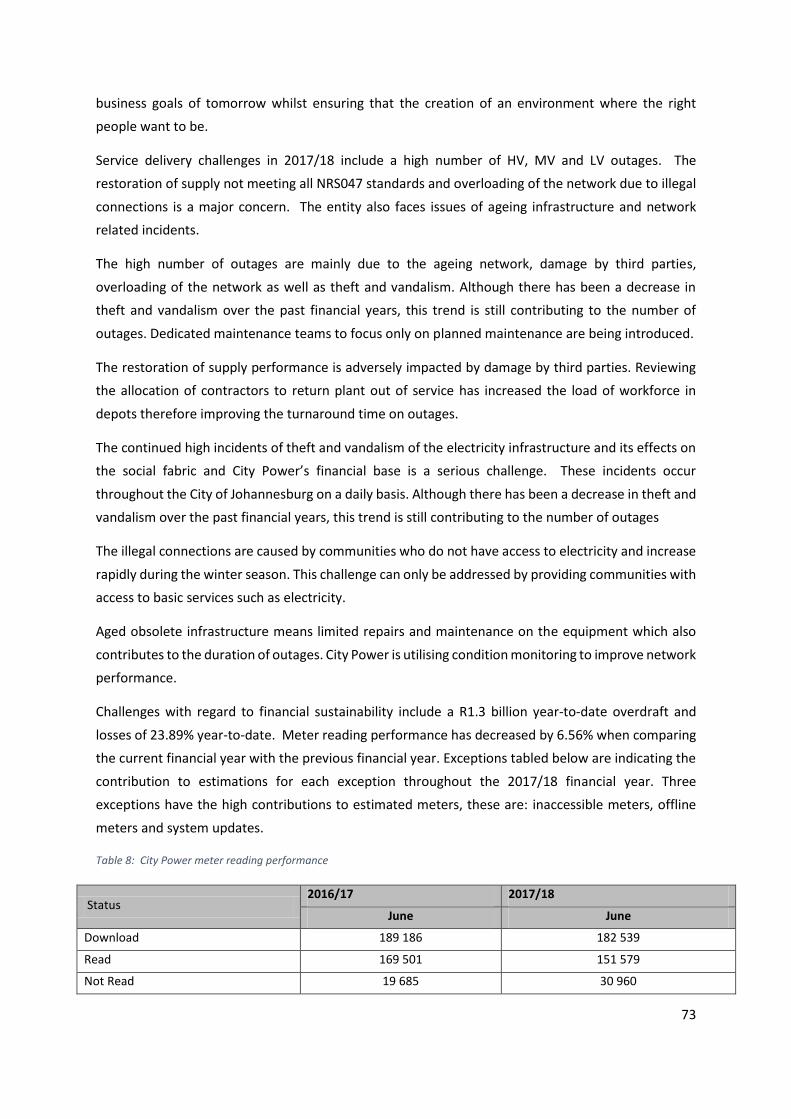
73
business goals of tomorrow whilst ensuring that the creation of an environment where the right
people want to be.
Service delivery challenges in 2017/18 include a high number of HV, MV and LV outages. The
restoration of supply not meeting all NRS047 standards and overloading of the network due to illegal
connections is a major concern. The entity also faces issues of ageing infrastructure and network
related incidents.
The high number of outages are mainly due to the ageing network, damage by third parties,
overloading of the network as well as theft and vandalism. Although there has been a decrease in
theft and vandalism over the past financial years, this trend is still contributing to the number of
outages. Dedicated maintenance teams to focus only on planned maintenance are being introduced.
The restoration of supply performance is adversely impacted by damage by third parties. Reviewing
the allocation of contractors to return plant out of service has increased the load of workforce in
depots therefore improving the turnaround time on outages.
The continued high incidents of theft and vandalism of the electricity infrastructure and its effects on
the social fabric and City Power’s financial base is a serious challenge. These incidents occur
throughout the City of Johannesburg on a daily basis. Although there has been a decrease in theft and
vandalism over the past financial years, this trend is still contributing to the number of outages
The illegal connections are caused by communities who do not have access to electricity and increase
rapidly during the winter season. This challenge can only be addressed by providing communities with
access to basic services such as electricity.
Aged obsolete infrastructure means limited repairs and maintenance on the equipment which also
contributes to the duration of outages. City Power is utilising condition monitoring to improve network
performance.
Challenges with regard to financial sustainability include a R1.3 billion year-to-date overdraft and
losses of 23.89% year-to-date. Meter reading performance has decreased by 6.56% when comparing
the current financial year with the previous financial year. Exceptions tabled below are indicating the
contribution to estimations for each exception throughout the 2017/18 financial year. Three
exceptions have the high contributions to estimated meters, these are: inaccessible meters, offline
meters and system updates.
Table 8: City Power meter reading performance
Status 2016/17 2017/18
June June
Download 189 186 182 539
Read 169 501 151 579
Not Read 19 685 30 960
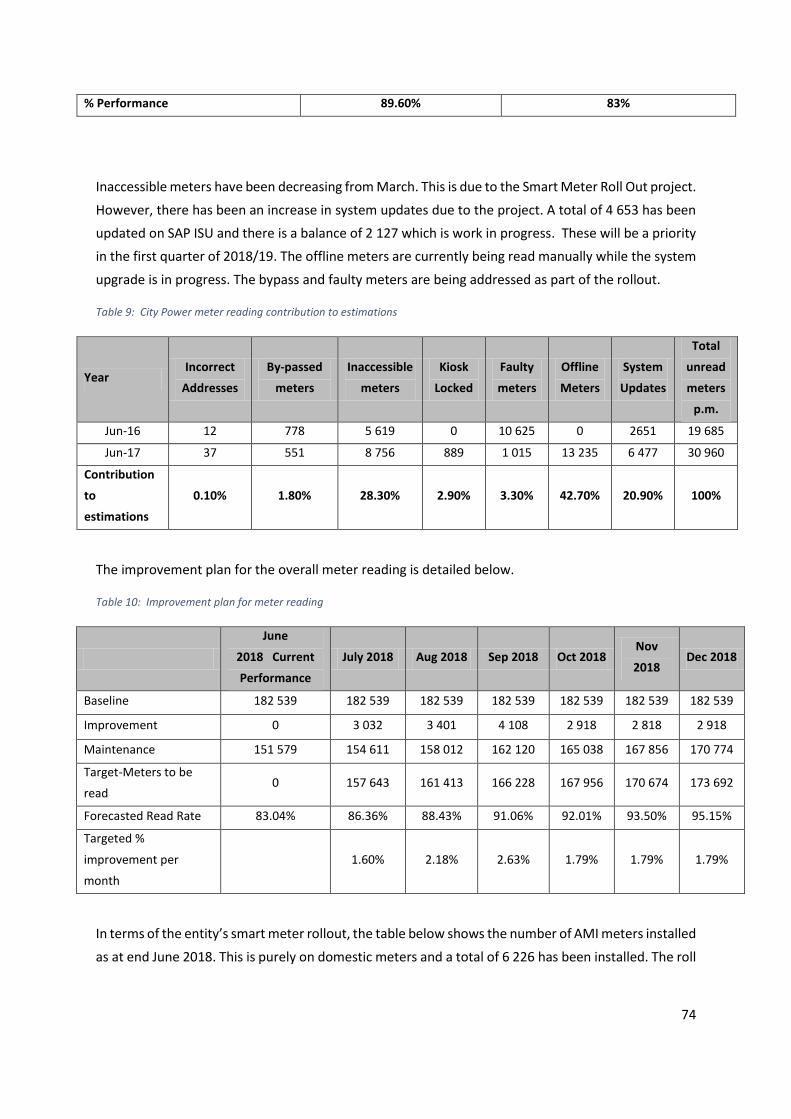
74
% Performance 89.60% 83%
Inaccessible meters have been decreasing from March. This is due to the Smart Meter Roll Out project.
However, there has been an increase in system updates due to the project. A total of 4 653 has been
updated on SAP ISU and there is a balance of 2 127 which is work in progress. These will be a priority
in the first quarter of 2018/19. The offline meters are currently being read manually while the system
upgrade is in progress. The bypass and faulty meters are being addressed as part of the rollout.
Table 9: City Power meter reading contribution to estimations
Year Incorrect
Addresses
By-passed
meters
Inaccessible
meters
Kiosk
Locked
Faulty
meters
Offline
Meters
System
Updates
Total
unread
meters
p.m.
Jun-16 12 778 5 619 0 10 625 0 2651 19 685
Jun-17 37 551 8 756 889 1 015 13 235 6 477 30 960
Contribution
to
estimations
0.10% 1.80% 28.30% 2.90% 3.30% 42.70% 20.90% 100%
The improvement plan for the overall meter reading is detailed below.
Table 10: Improvement plan for meter reading
June
2018 Current
Performance
July 2018 Aug 2018 Sep 2018 Oct 2018 Nov
2018 Dec 2018
Baseline 182 539 182 539 182 539 182 539 182 539 182 539 182 539
Improvement 0 3 032 3 401 4 108 2 918 2 818 2 918
Maintenance 151 579 154 611 158 012 162 120 165 038 167 856 170 774
Target-Meters to be
read 0 157 643 161 413 166 228 167 956 170 674 173 692
Forecasted Read Rate 83.04% 86.36% 88.43% 91.06% 92.01% 93.50% 95.15%
Targeted %
improvement per
month
1.60% 2.18% 2.63% 1.79% 1.79% 1.79%
In terms of the entity’s smart meter rollout, the table below shows the number of AMI meters installed
as at end June 2018. This is purely on domestic meters and a total of 6 226 has been installed. The roll
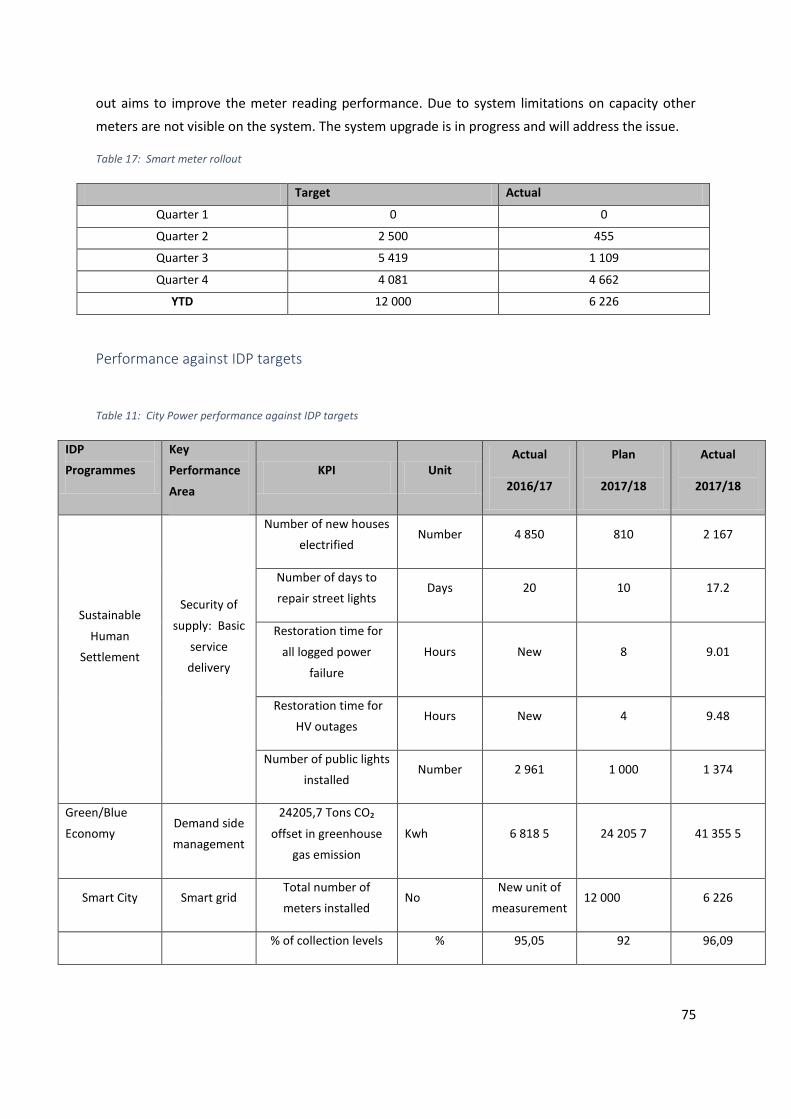
75
out aims to improve the meter reading performance. Due to system limitations on capacity other
meters are not visible on the system. The system upgrade is in progress and will address the issue.
Table 17: Smart meter rollout
Target Actual
Quarter 1 0 0
Quarter 2 2 500 455
Quarter 3 5 419 1 109
Quarter 4 4 081 4 662
YTD 12 000 6 226
Performance against IDP targets
Table 11: City Power performance against IDP targets
IDP
Programmes
Key
Performance
Area
KPI Unit Actual
2016/17
Plan
2017/18
Actual
2017/18
Sustainable
Human
Settlement
Security of
supply: Basic
service
delivery
Number of new houses
electrified Number 4 850 810 2 167
Number of days to
repair street lights Days 20 10 17.2
Restoration time for
all logged power
failure
Hours New 8 9.01
Restoration time for
HV outages Hours New 4 9.48
Number of public lights
installed Number 2 961 1 000 1 374
Green/Blue
Economy Demand side
management
24205,7 Tons CO₂
offset in greenhouse
gas emission
Kwh 6 818 5 24 205 7 41 355 5
Smart City Smart grid Total number of
meters installed No
New unit of
measurement 12 000 6 226
% of collection levels % 95,05 92 96,09
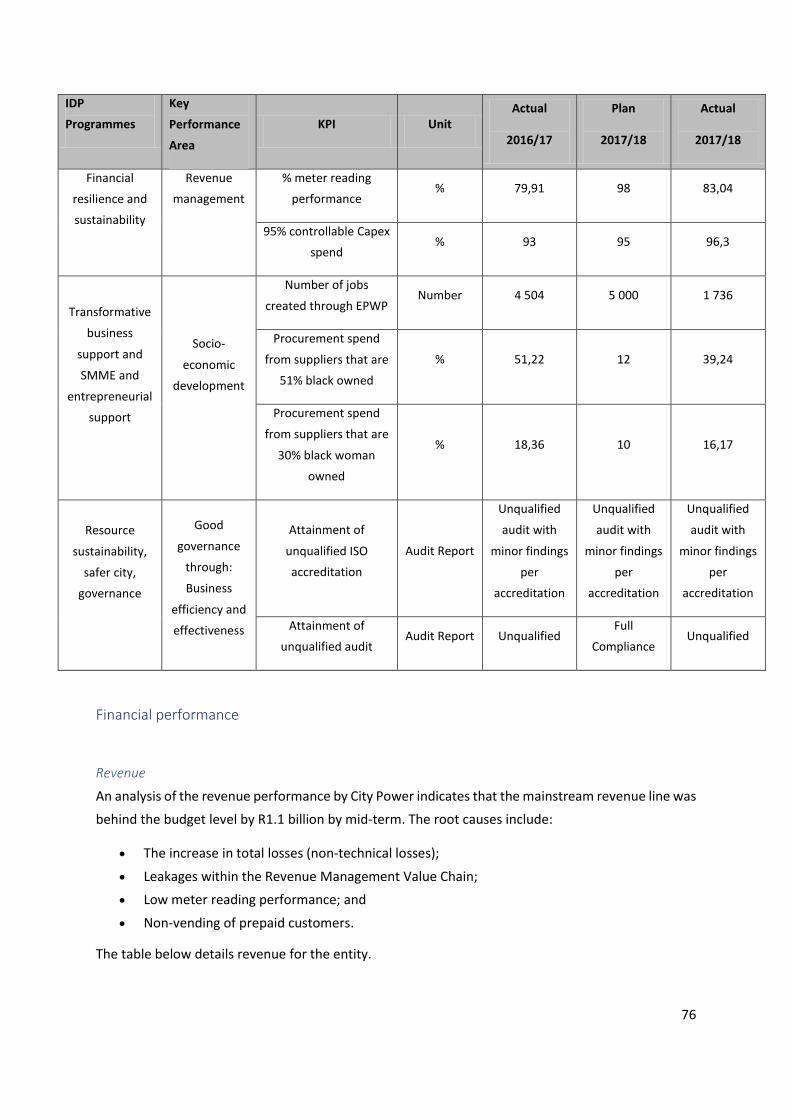
76
IDP
Programmes
Key
Performance
Area
KPI Unit Actual
2016/17
Plan
2017/18
Actual
2017/18
Financial
resilience and
sustainability
Revenue
management
% meter reading
performance % 79,91 98 83,04
95% controllable Capex
spend % 93 95 96,3
Transformative
business
support and
SMME and
entrepreneurial
support
Socio-
economic
development
Number of jobs
created through EPWP Number 4 504 5 000 1 736
Procurement spend
from suppliers that are
51% black owned
% 51,22 12 39,24
Procurement spend
from suppliers that are
30% black woman
owned
% 18,36 10 16,17
Resource
sustainability,
safer city,
governance
Good
governance
through:
Business
efficiency and
effectiveness
Attainment of
unqualified ISO
accreditation
Audit Report
Unqualified
audit with
minor findings
per
accreditation
Unqualified
audit with
minor findings
per
accreditation
Unqualified
audit with
minor findings
per
accreditation
Attainment of
unqualified audit Audit Report Unqualified
Full
Compliance Unqualified
Financial performance
Revenue
An analysis of the revenue performance by City Power indicates that the mainstream revenue line was
behind the budget level by R1.1 billion by mid-term. The root causes include:
The increase in total losses (non-technical losses);
Leakages within the Revenue Management Value Chain;
Low meter reading performance; and
Non-vending of prepaid customers.
The table below details revenue for the entity.
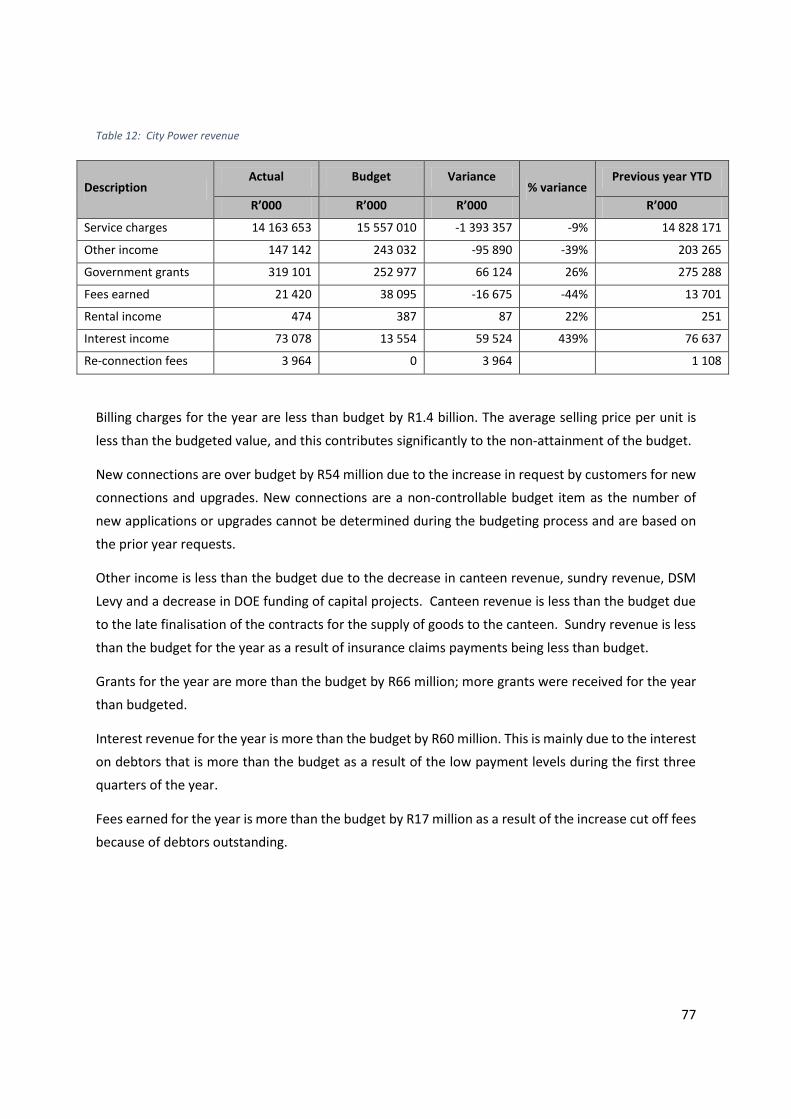
77
Table 12: City Power revenue
Description Actual Budget Variance
% variance Previous year YTD
R’000 R’000 R’000 R’000
Service charges 14 163 653 15 557 010 -1 393 357 -9% 14 828 171
Other income 147 142 243 032 -95 890 -39% 203 265
Government grants 319 101 252 977 66 124 26% 275 288
Fees earned 21 420 38 095 -16 675 -44% 13 701
Rental income 474 387 87 22% 251
Interest income 73 078 13 554 59 524 439% 76 637
Re-connection fees 3 964 0 3 964 1 108
Billing charges for the year are less than budget by R1.4 billion. The average selling price per unit is
less than the budgeted value, and this contributes significantly to the non-attainment of the budget.
New connections are over budget by R54 million due to the increase in request by customers for new
connections and upgrades. New connections are a non-controllable budget item as the number of
new applications or upgrades cannot be determined during the budgeting process and are based on
the prior year requests.
Other income is less than the budget due to the decrease in canteen revenue, sundry revenue, DSM
Levy and a decrease in DOE funding of capital projects. Canteen revenue is less than the budget due
to the late finalisation of the contracts for the supply of goods to the canteen. Sundry revenue is less
than the budget for the year as a result of insurance claims payments being less than budget.
Grants for the year are more than the budget by R66 million; more grants were received for the year
than budgeted.
Interest revenue for the year is more than the budget by R60 million. This is mainly due to the interest
on debtors that is more than the budget as a result of the low payment levels during the first three
quarters of the year.
Fees earned for the year is more than the budget by R17 million as a result of the increase cut off fees
because of debtors outstanding.
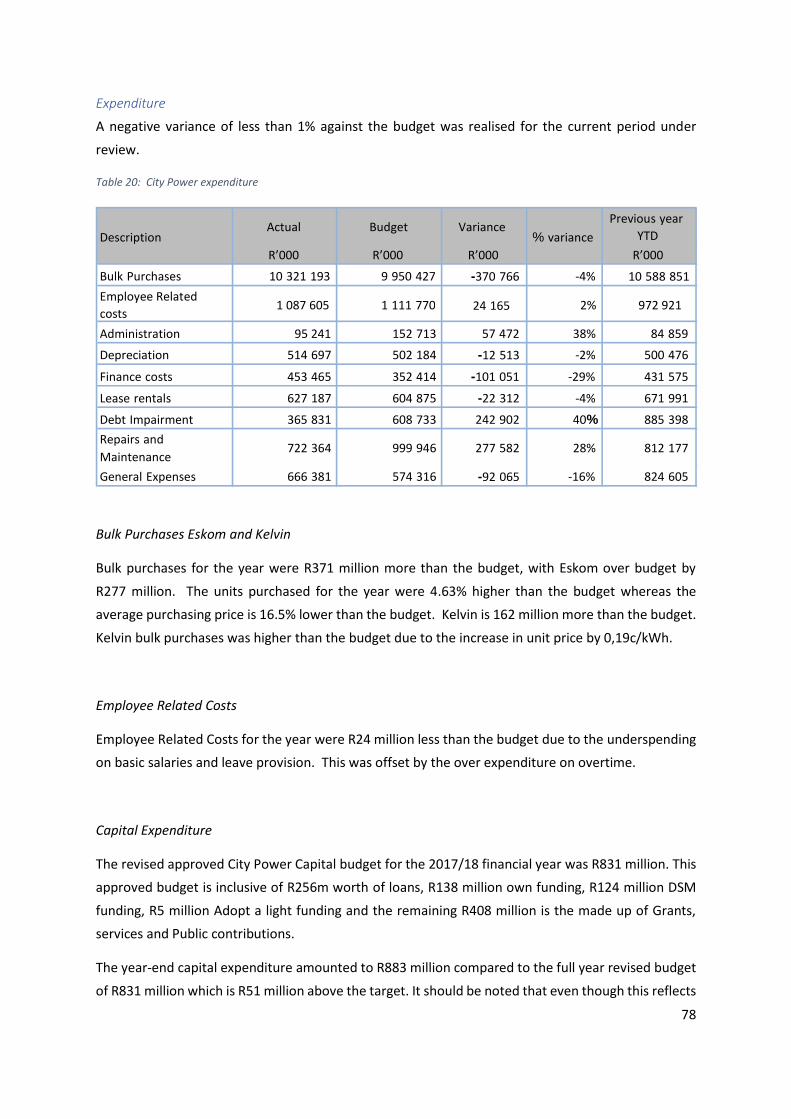
78
Expenditure
A negative variance of less than 1% against the budget was realised for the current period under
review.
Table 20: City Power expenditure
Bulk Purchases Eskom and Kelvin
Bulk purchases for the year were R371 million more than the budget, with Eskom over budget by
R277 million. The units purchased for the year were 4.63% higher than the budget whereas the
average purchasing price is 16.5% lower than the budget. Kelvin is 162 million more than the budget.
Kelvin bulk purchases was higher than the budget due to the increase in unit price by 0,19c/kWh.
Employee Related Costs
Employee Related Costs for the year were R24 million less than the budget due to the underspending
on basic salaries and leave provision. This was offset by the over expenditure on overtime.
Capital Expenditure
The revised approved City Power Capital budget for the 2017/18 financial year was R831 million. This
approved budget is inclusive of R256m worth of loans, R138 million own funding, R124 million DSM
funding, R5 million Adopt a light funding and the remaining R408 million is the made up of Grants,
services and Public contributions.
The year-end capital expenditure amounted to R883 million compared to the full year revised budget
of R831 million which is R51 million above the target. It should be noted that even though this reflects
Actual Budget Variance Previous year
YTD
R’000 R’000 R’000 R’000
Bulk Purchases 10 321 193 9 950 427 -370 766 -4% 10 588 851
Employee Related
costs 1 087 605 1 111 770 24 165 2% 972 921
Administration 95 241 152 713 57 472 38% 84 859
Depreciation 514 697 502 184 -12 513 -2% 500 476
Finance costs 453 465 352 414 -101 051 -29% 431 575
Lease rentals 627 187 604 875 -22 312 -4% 671 991
Debt Impairment 365 831 608 733 242 902 40% 885 398
Repairs and Maintenance
722 364 999 946 277 582 28% 812 177
General Expenses 666 381 574 316 -92 065 -16% 824 605
Description % variance
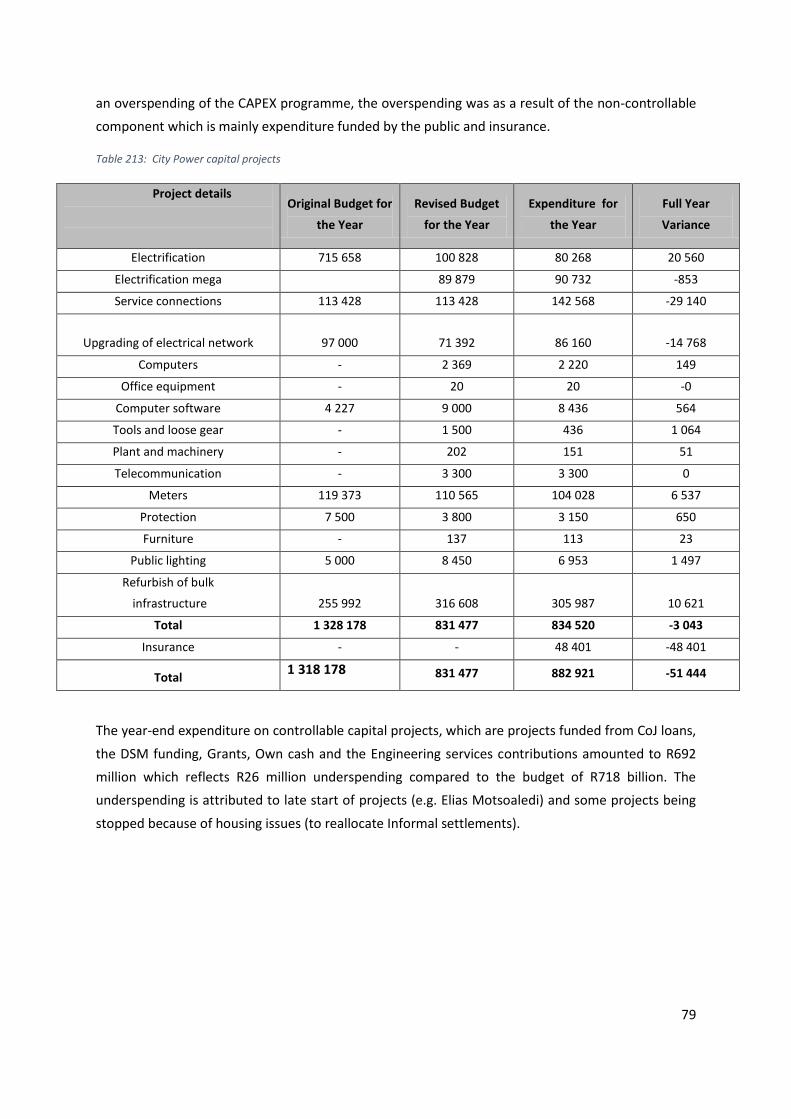
79
an overspending of the CAPEX programme, the overspending was as a result of the non-controllable
component which is mainly expenditure funded by the public and insurance.
Table 213: City Power capital projects
Project details
Original Budget for
the Year
Revised Budget
for the Year
Expenditure for
the Year
Full Year
Variance
Electrification 715 658 100 828 80 268 20 560
Electrification mega 89 879 90 732 -853
Service connections 113 428 113 428 142 568 -29 140
Upgrading of electrical network 97 000 71 392 86 160 -14 768
Computers - 2 369 2 220 149
Office equipment - 20 20 -0
Computer software 4 227 9 000 8 436 564
Tools and loose gear - 1 500 436 1 064
Plant and machinery - 202 151 51
Telecommunication - 3 300 3 300 0
Meters 119 373 110 565 104 028 6 537
Protection 7 500 3 800 3 150 650
Furniture - 137 113 23
Public lighting 5 000 8 450 6 953 1 497
Refurbish of bulk
infrastructure 255 992 316 608 305 987 10 621
Total 1 328 178 831 477 834 520 -3 043
Insurance - - 48 401 -48 401
Total 1 318 178 831 477 882 921 -51 444
The year-end expenditure on controllable capital projects, which are projects funded from CoJ loans,
the DSM funding, Grants, Own cash and the Engineering services contributions amounted to R692
million which reflects R26 million underspending compared to the budget of R718 billion. The
underspending is attributed to late start of projects (e.g. Elias Motsoaledi) and some projects being
stopped because of housing issues (to reallocate Informal settlements).
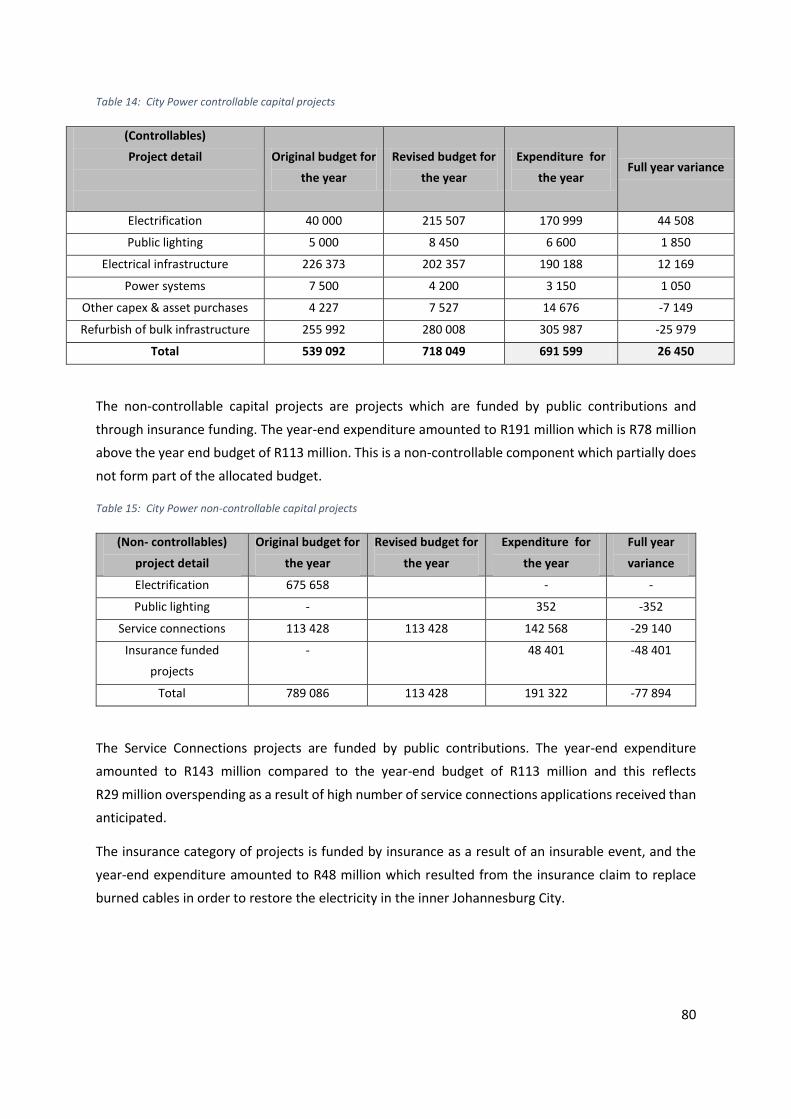
80
Table 14: City Power controllable capital projects
(Controllables)
Project detail
Original budget for
the year
Revised budget for
the year
Expenditure for
the year Full year variance
Electrification 40 000 215 507 170 999 44 508
Public lighting 5 000 8 450 6 600 1 850
Electrical infrastructure 226 373 202 357 190 188 12 169
Power systems 7 500 4 200 3 150 1 050
Other capex & asset purchases 4 227 7 527 14 676 -7 149
Refurbish of bulk infrastructure 255 992 280 008 305 987 -25 979
Total 539 092 718 049 691 599 26 450
The non-controllable capital projects are projects which are funded by public contributions and
through insurance funding. The year-end expenditure amounted to R191 million which is R78 million
above the year end budget of R113 million. This is a non-controllable component which partially does
not form part of the allocated budget.
Table 15: City Power non-controllable capital projects
(Non- controllables)
project detail
Original budget for
the year
Revised budget for
the year
Expenditure for
the year
Full year
variance
Electrification 675 658 - -
Public lighting - 352 -352
Service connections 113 428 113 428 142 568 -29 140
Insurance funded
projects
- 48 401 -48 401
Total 789 086 113 428 191 322 -77 894
The Service Connections projects are funded by public contributions. The year-end expenditure
amounted to R143 million compared to the year-end budget of R113 million and this reflects
R29 million overspending as a result of high number of service connections applications received than
anticipated.
The insurance category of projects is funded by insurance as a result of an insurable event, and the
year-end expenditure amounted to R48 million which resulted from the insurance claim to replace
burned cables in order to restore the electricity in the inner Johannesburg City.
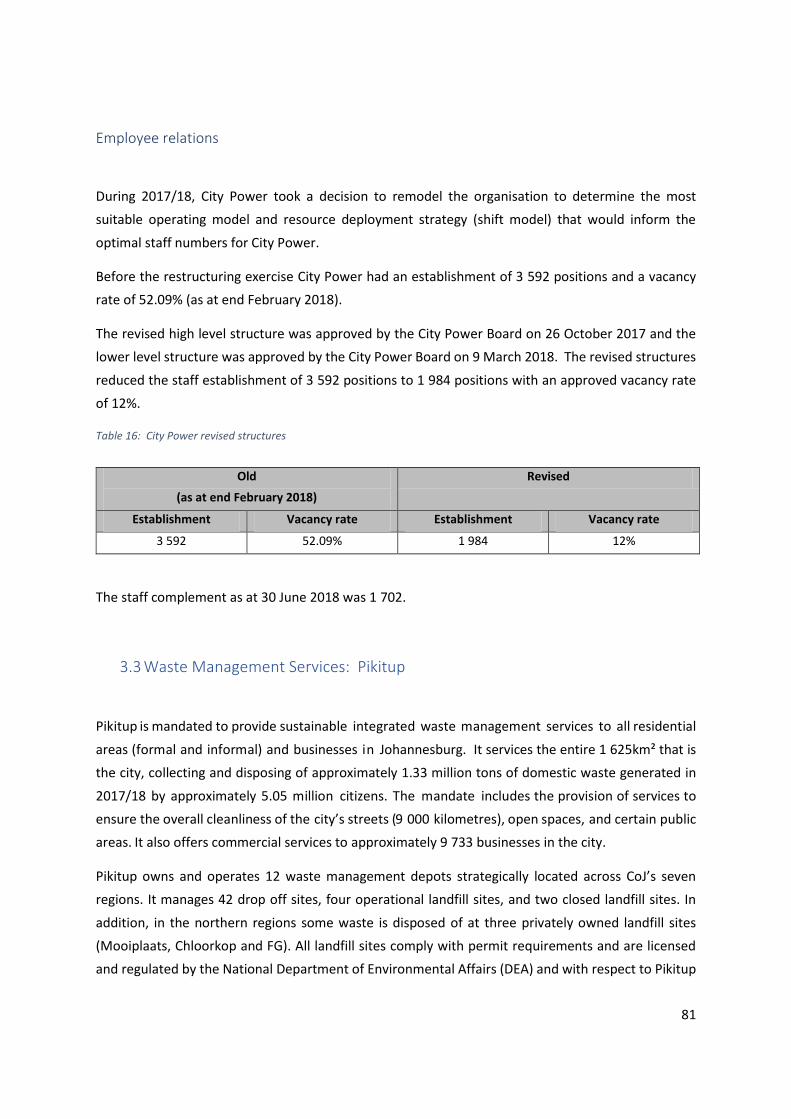
81
Employee relations
During 2017/18, City Power took a decision to remodel the organisation to determine the most
suitable operating model and resource deployment strategy (shift model) that would inform the
optimal staff numbers for City Power.
Before the restructuring exercise City Power had an establishment of 3 592 positions and a vacancy
rate of 52.09% (as at end February 2018).
The revised high level structure was approved by the City Power Board on 26 October 2017 and the
lower level structure was approved by the City Power Board on 9 March 2018. The revised structures
reduced the staff establishment of 3 592 positions to 1 984 positions with an approved vacancy rate
of 12%.
Table 16: City Power revised structures
The staff complement as at 30 June 2018 was 1 702.
3.3 Waste Management Services: Pikitup
Pikitup is mandated to provide sustainable integrated waste management services to all residential
areas (formal and informal) and businesses in Johannesburg. It services the entire 1 625km² that is
the city, collecting and disposing of approximately 1.33 million tons of domestic waste generated in
2017/18 by approximately 5.05 million citizens. The mandate includes the provision of services to
ensure the overall cleanliness of the city’s streets (9 000 kilometres), open spaces, and certain public
areas. It also offers commercial services to approximately 9 733 businesses in the city.
Pikitup owns and operates 12 waste management depots strategically located across CoJ’s seven
regions. It manages 42 drop off sites, four operational landfill sites, and two closed landfill sites. In
addition, in the northern regions some waste is disposed of at three privately owned landfill sites
(Mooiplaats, Chloorkop and FG). All landfill sites comply with permit requirements and are licensed
and regulated by the National Department of Environmental Affairs (DEA) and with respect to Pikitup
Old
(as at end February 2018)
Revised
Establishment Vacancy rate Establishment Vacancy rate
3 592 52.09% 1 984 12%
82
the regulation has been delegated to the Gauteng Department of Agriculture and Rural Development
(GDARD).
The customer base consists of 864 185 formal domestic customers, 8 034 Business Round Collected
Refuse (RCR) customers, 1 153 Bulk service customers, 547 dailies, 3 159 institutions and 895 landfill
customers.
The core business of Pikitup is to ensure domestic waste is collected and disposed in an efficient and
effective manner. This includes waste management in informal settlements and hostels as well as the
clearing of illegal dumping. Service levels are agreed with the shareholder in terms of a Service Level
Agreement. In order to ensure compliance to permits and to ensure a healthy and safe environment,
Pikitup is also responsible for the management and operation of four landfill sites.
Performance highlights
The compliance of landfill sites to permit and license conditions increased to a total
compliance of 94.84%;
Pikitup is providing a waste refuse management service to 164 informal settlements consisting
of 183 895 structures;
Query resolution rate is 60% within seven days;
Pikitup successfully implemented the CUP. 37 co-operatives were established, and 1 362 jobs
created in the waste industry in accordance with the 2016/17 financial year targets; and
The capital expenditure performance for the year under review was R60.06 million (99.91%)
against the annual plan of R60.11 million.
Summary of performance
Total waste diverted away from landfills decreased from last year’s achievement of 149 552 tons to
94 355 tons in the 2017/18 financial year, which is approximately 73% of a target of 130 000 tons set
to be achieved during the period under review. The underperformance in this regard was significantly
influenced by the withdrawal of the service provider contracted to Pikitup to undertake the diversion
of green waste, frequent breakdowns of builders’ crusher machines which lacked maintenance as well
as delayed commencement of the contract for collection of dry recyclables by contracted service
providers. Below is a breakdown of the achievements by waste stream:
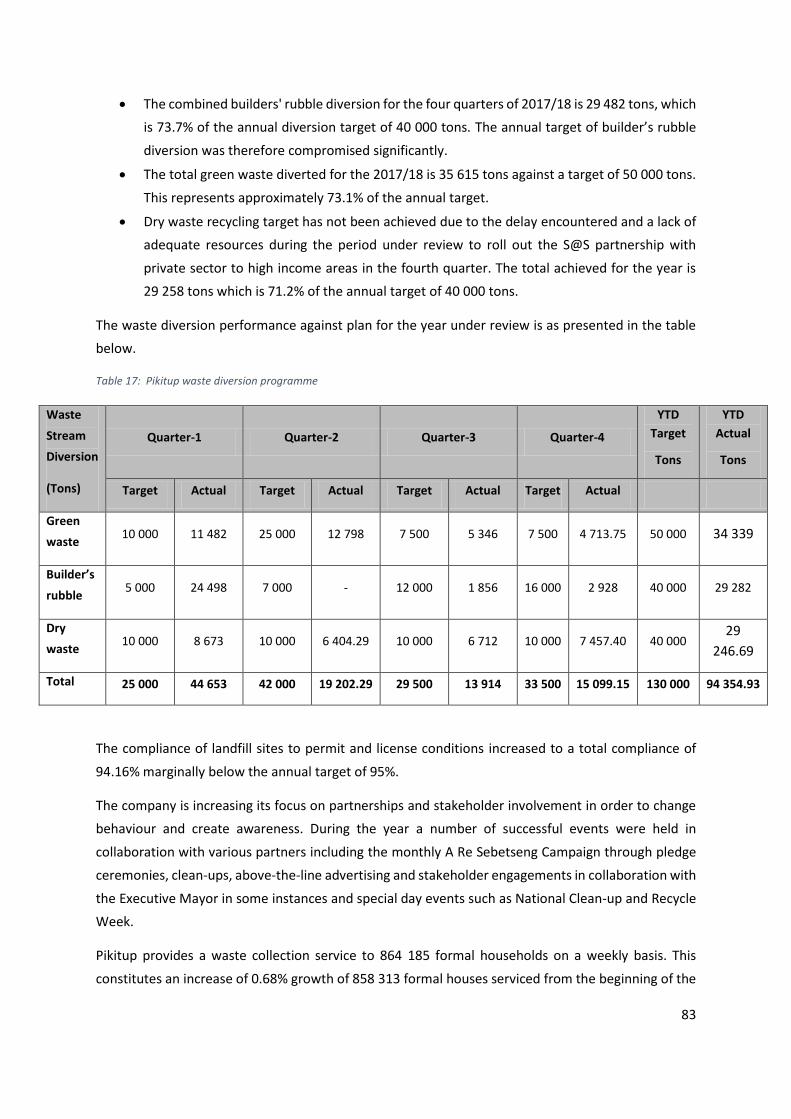
83
The combined builders' rubble diversion for the four quarters of 2017/18 is 29 482 tons, which
is 73.7% of the annual diversion target of 40 000 tons. The annual target of builder’s rubble
diversion was therefore compromised significantly.
The total green waste diverted for the 2017/18 is 35 615 tons against a target of 50 000 tons.
This represents approximately 73.1% of the annual target.
Dry waste recycling target has not been achieved due to the delay encountered and a lack of
adequate resources during the period under review to roll out the S@S partnership with
private sector to high income areas in the fourth quarter. The total achieved for the year is
29 258 tons which is 71.2% of the annual target of 40 000 tons.
The waste diversion performance against plan for the year under review is as presented in the table
below.
Table 17: Pikitup waste diversion programme
Waste
Stream
Diversion
(Tons)
Quarter-1 Quarter-2 Quarter-3 Quarter-4
YTD
Target
Tons
YTD
Actual
Tons
Target Actual Target Actual Target Actual Target Actual
Green
waste 10 000 11 482 25 000 12 798 7 500 5 346 7 500 4 713.75 50 000 34 339
Builder’s
rubble 5 000 24 498 7 000 - 12 000 1 856 16 000 2 928 40 000 29 282
Dry
waste 10 000 8 673 10 000 6 404.29 10 000 6 712 10 000 7 457.40 40 000
29
246.69
Total 25 000 44 653 42 000 19 202.29 29 500 13 914 33 500 15 099.15 130 000 94 354.93
The compliance of landfill sites to permit and license conditions increased to a total compliance of
94.16% marginally below the annual target of 95%.
The company is increasing its focus on partnerships and stakeholder involvement in order to change
behaviour and create awareness. During the year a number of successful events were held in
collaboration with various partners including the monthly A Re Sebetseng Campaign through pledge
ceremonies, clean-ups, above-the-line advertising and stakeholder engagements in collaboration with
the Executive Mayor in some instances and special day events such as National Clean-up and Recycle
Week.
Pikitup provides a waste collection service to 864 185 formal households on a weekly basis. This
constitutes an increase of 0.68% growth of 858 313 formal houses serviced from the beginning of the
84
2016/17 financial year to the end of the reporting period. These households were serviced, and 98%
completion rate was achieved with additional temporary staff or ad-hoc vehicles due to high vehicle
breakdowns on Pikitup owned fleet. Productivity and efficiency measures were implemented to
ensure service standards were adhered to.
There was a total of 25 173 240L bins delivered within the period under review. The majority of new
bins were rolled out to formalised areas as well as providing replacements on backlogs associated with
stolen or damaged bins.
Pikitup is providing a waste refuse management service to 164 informal settlements consisting of
183 895 structures. Assessment and verification are undertaken on a three year cycle in this regard.
Pikitup successfully implemented the CUP. 37 co-operatives were established, and 1 362 jobs created
in the waste industry in accordance with the 2016/17 financial year targets.
Pikitup developed Ward Based Operational Plans to address some of its ward specific challenges and
to improve productivity, operational efficiencies, service delivery and customer relations.
As part of the ward based plans the entity business model will focus on waste minimisation, recycling
and diversion including budgets being shifted from clearing of illegal dumping with an emphasis on
education, awareness and stakeholder partnerships programmes with, for example, waste-pickers.
Integrated Waste Management
Separation at Source aims to create a culture change in households to separate household waste and
thereby divert this waste stream away from landfill in order to meet the targets of CoJ, and in line with
Pikitup Business Plan and the associated SDBIP.
Monitoring of recycling at the drop-off sites and SMMEs was intensified during the review period with
an improvement in SMME/Partners health and safety requirements as well as set operational
standards. Overall the total dry waste tonnages diverted decreased from 38 296 tons last year to
29 258 tons in this financial year, a significant decrease of 23.6%.
Green waste diversion has significantly decreased as compared to the previous financial year. It should
be noted that the overall green waste diversion decreased from 48 978 tons achieved last year to
35 615 tons achieved in this financial year, which represents a 27.3% decrease from the previous
operational period.
The combined builders’ rubble diversion for the four quarters of 2016/17 was 62 032 tons, and 29 482
tons was attained in 2017/18, which represents a significant decrease of 32 550 tons (52.5%). The
effort to contract an off-taker and alternative uses of builders’ rubble has to be intensified in 2018/19.
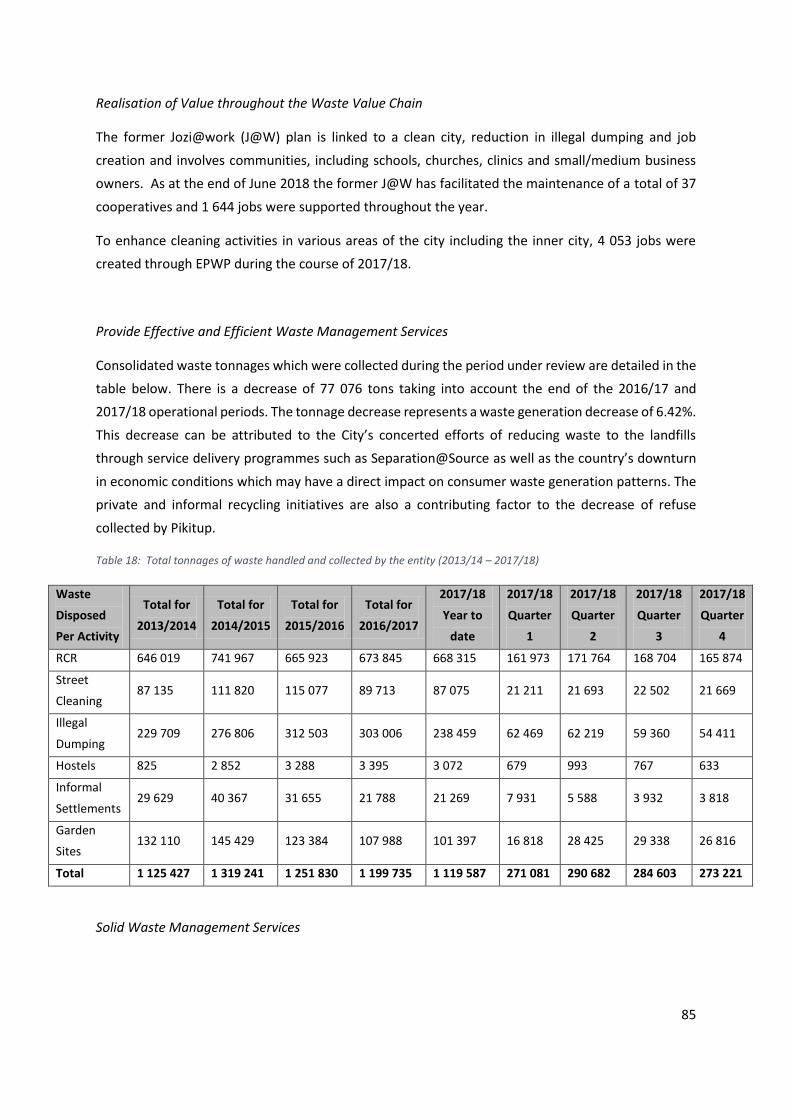
85
Realisation of Value throughout the Waste Value Chain
The former Jozi@work (J@W) plan is linked to a clean city, reduction in illegal dumping and job
creation and involves communities, including schools, churches, clinics and small/medium business
owners. As at the end of June 2018 the former J@W has facilitated the maintenance of a total of 37
cooperatives and 1 644 jobs were supported throughout the year.
To enhance cleaning activities in various areas of the city including the inner city, 4 053 jobs were
created through EPWP during the course of 2017/18.
Provide Effective and Efficient Waste Management Services
Consolidated waste tonnages which were collected during the period under review are detailed in the
table below. There is a decrease of 77 076 tons taking into account the end of the 2016/17 and
2017/18 operational periods. The tonnage decrease represents a waste generation decrease of 6.42%.
This decrease can be attributed to the City’s concerted efforts of reducing waste to the landfills
through service delivery programmes such as Separation@Source as well as the country’s downturn
in economic conditions which may have a direct impact on consumer waste generation patterns. The
private and informal recycling initiatives are also a contributing factor to the decrease of refuse
collected by Pikitup.
Table 18: Total tonnages of waste handled and collected by the entity (2013/14 – 2017/18)
Waste
Disposed
Per Activity
Total for
2013/2014
Total for
2014/2015
Total for
2015/2016
Total for
2016/2017
2017/18
Year to
date
2017/18
Quarter
1
2017/18
Quarter
2
2017/18
Quarter
3
2017/18
Quarter
4
RCR 646 019 741 967 665 923 673 845 668 315 161 973 171 764 168 704 165 874
Street
Cleaning 87 135 111 820 115 077 89 713 87 075 21 211 21 693 22 502 21 669
Illegal
Dumping 229 709 276 806 312 503 303 006 238 459 62 469 62 219 59 360 54 411
Hostels 825 2 852 3 288 3 395 3 072 679 993 767 633
Informal
Settlements 29 629 40 367 31 655 21 788 21 269 7 931 5 588 3 932 3 818
Garden
Sites 132 110 145 429 123 384 107 988 101 397 16 818 28 425 29 338 26 816
Total 1 125 427 1 319 241 1 251 830 1 199 735 1 119 587 271 081 290 682 284 603 273 221
Solid Waste Management Services
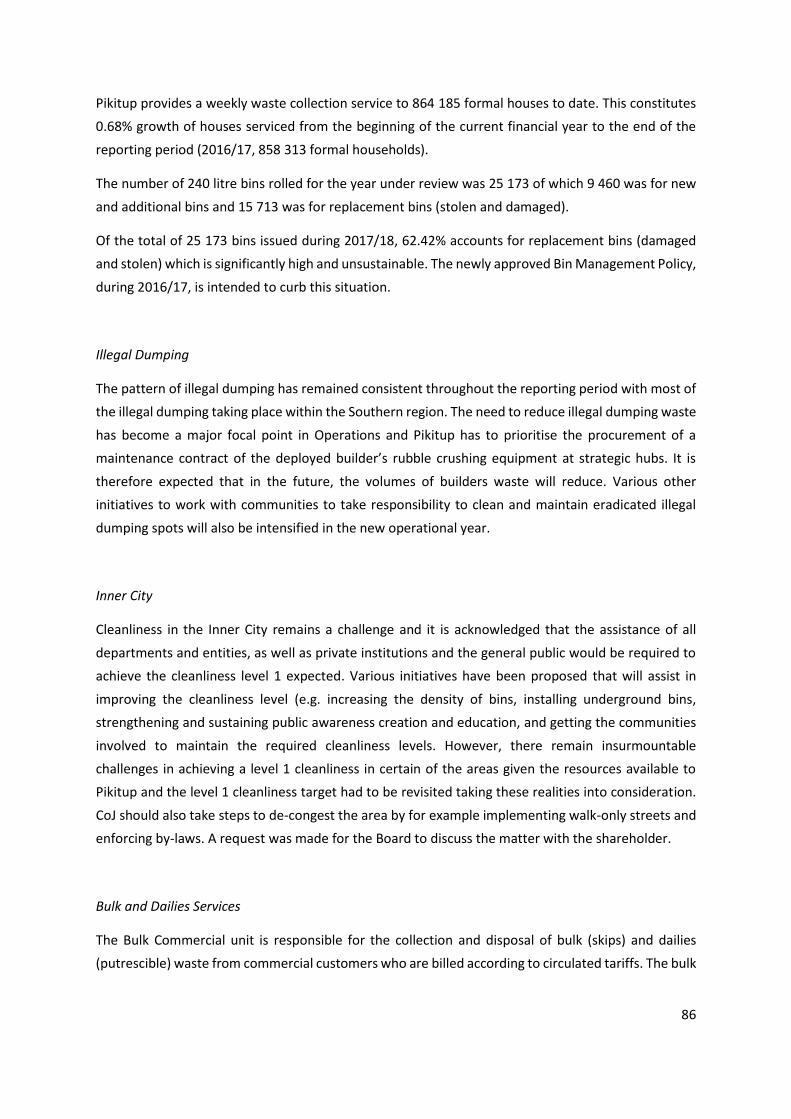
86
Pikitup provides a weekly waste collection service to 864 185 formal houses to date. This constitutes
0.68% growth of houses serviced from the beginning of the current financial year to the end of the
reporting period (2016/17, 858 313 formal households).
The number of 240 litre bins rolled for the year under review was 25 173 of which 9 460 was for new
and additional bins and 15 713 was for replacement bins (stolen and damaged).
Of the total of 25 173 bins issued during 2017/18, 62.42% accounts for replacement bins (damaged
and stolen) which is significantly high and unsustainable. The newly approved Bin Management Policy,
during 2016/17, is intended to curb this situation.
Illegal Dumping
The pattern of illegal dumping has remained consistent throughout the reporting period with most of
the illegal dumping taking place within the Southern region. The need to reduce illegal dumping waste
has become a major focal point in Operations and Pikitup has to prioritise the procurement of a
maintenance contract of the deployed builder’s rubble crushing equipment at strategic hubs. It is
therefore expected that in the future, the volumes of builders waste will reduce. Various other
initiatives to work with communities to take responsibility to clean and maintain eradicated illegal
dumping spots will also be intensified in the new operational year.
Inner City
Cleanliness in the Inner City remains a challenge and it is acknowledged that the assistance of all
departments and entities, as well as private institutions and the general public would be required to
achieve the cleanliness level 1 expected. Various initiatives have been proposed that will assist in
improving the cleanliness level (e.g. increasing the density of bins, installing underground bins,
strengthening and sustaining public awareness creation and education, and getting the communities
involved to maintain the required cleanliness levels. However, there remain insurmountable
challenges in achieving a level 1 cleanliness in certain of the areas given the resources available to
Pikitup and the level 1 cleanliness target had to be revisited taking these realities into consideration.
CoJ should also take steps to de-congest the area by for example implementing walk-only streets and
enforcing by-laws. A request was made for the Board to discuss the matter with the shareholder.
Bulk and Dailies Services
The Bulk Commercial unit is responsible for the collection and disposal of bulk (skips) and dailies
(putrescible) waste from commercial customers who are billed according to circulated tariffs. The bulk
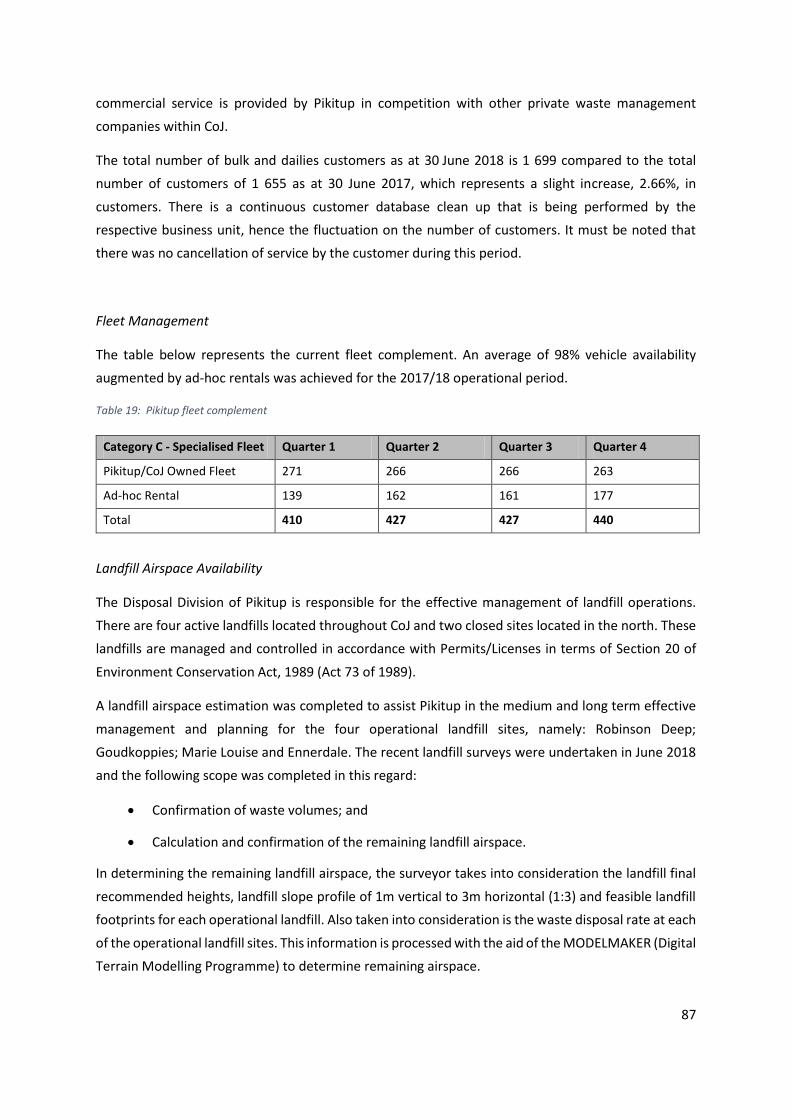
87
commercial service is provided by Pikitup in competition with other private waste management
companies within CoJ.
The total number of bulk and dailies customers as at 30 June 2018 is 1 699 compared to the total
number of customers of 1 655 as at 30 June 2017, which represents a slight increase, 2.66%, in
customers. There is a continuous customer database clean up that is being performed by the
respective business unit, hence the fluctuation on the number of customers. It must be noted that
there was no cancellation of service by the customer during this period.
Fleet Management
The table below represents the current fleet complement. An average of 98% vehicle availability
augmented by ad-hoc rentals was achieved for the 2017/18 operational period.
Table 19: Pikitup fleet complement
Category C - Specialised Fleet Quarter 1 Quarter 2 Quarter 3 Quarter 4
Pikitup/CoJ Owned Fleet 271 266 266 263
Ad-hoc Rental 139 162 161 177
Total 410 427 427 440
Landfill Airspace Availability
The Disposal Division of Pikitup is responsible for the effective management of landfill operations.
There are four active landfills located throughout CoJ and two closed sites located in the north. These
landfills are managed and controlled in accordance with Permits/Licenses in terms of Section 20 of
Environment Conservation Act, 1989 (Act 73 of 1989).
A landfill airspace estimation was completed to assist Pikitup in the medium and long term effective
management and planning for the four operational landfill sites, namely: Robinson Deep;
Goudkoppies; Marie Louise and Ennerdale. The recent landfill surveys were undertaken in June 2018
and the following scope was completed in this regard:
Confirmation of waste volumes; and
Calculation and confirmation of the remaining landfill airspace.
In determining the remaining landfill airspace, the surveyor takes into consideration the landfill final
recommended heights, landfill slope profile of 1m vertical to 3m horizontal (1:3) and feasible landfill
footprints for each operational landfill. Also taken into consideration is the waste disposal rate at each
of the operational landfill sites. This information is processed with the aid of the MODELMAKER (Digital
Terrain Modelling Programme) to determine remaining airspace.
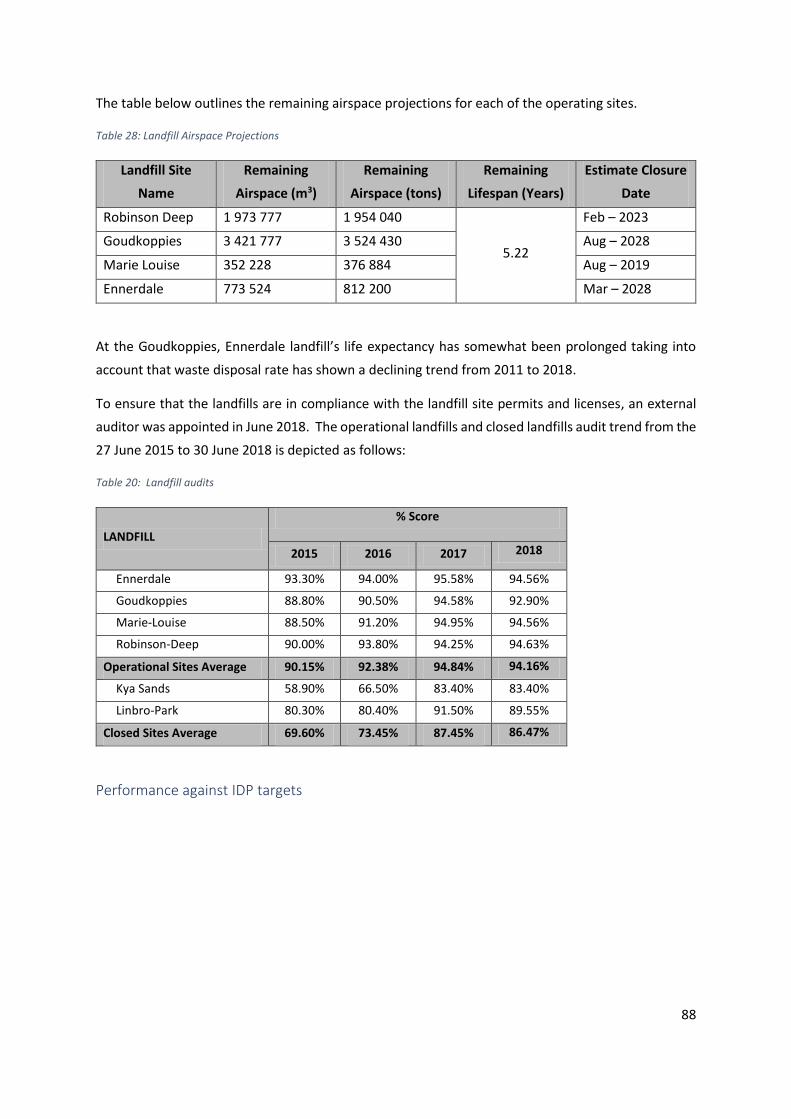
88
The table below outlines the remaining airspace projections for each of the operating sites.
Table 28: Landfill Airspace Projections
Landfill Site
Name
Remaining
Airspace (m3)
Remaining
Airspace (tons)
Remaining
Lifespan (Years)
Estimate Closure
Date
Robinson Deep 1 973 777 1 954 040
5.22
Feb – 2023
Goudkoppies 3 421 777 3 524 430 Aug – 2028
Marie Louise 352 228 376 884 Aug – 2019
Ennerdale 773 524 812 200 Mar – 2028
At the Goudkoppies, Ennerdale landfill’s life expectancy has somewhat been prolonged taking into
account that waste disposal rate has shown a declining trend from 2011 to 2018.
To ensure that the landfills are in compliance with the landfill site permits and licenses, an external
auditor was appointed in June 2018. The operational landfills and closed landfills audit trend from the
27 June 2015 to 30 June 2018 is depicted as follows:
Table 20: Landfill audits
LANDFILL
% Score
2015 2016 2017 2018
Ennerdale 93.30% 94.00% 95.58% 94.56%
Goudkoppies 88.80% 90.50% 94.58% 92.90%
Marie-Louise 88.50% 91.20% 94.95% 94.56%
Robinson-Deep 90.00% 93.80% 94.25% 94.63%
Operational Sites Average 90.15% 92.38% 94.84% 94.16%
Kya Sands 58.90% 66.50% 83.40% 83.40%
Linbro-Park 80.30% 80.40% 91.50% 89.55%
Closed Sites Average 69.60% 73.45% 87.45% 86.47%
Performance against IDP targets
89
Table 30: Pikitup performance against IDP targets
Strategic
Goal
Alignme
nt to the
political
priorities
Indicator
(KPI)
2016/
17
Baseli
ne
2017/
18
Annu
al
Targe
t
Quarter 1 Quarter 2 Quarter 3 Quarter 4 2017/18
Actual
Annual
Performan
ce
Target
Outcome
(Achieved-
Not
Achieved)
Reasons for non-achievement and
remedial action
Tar
get
Act
ual
Tar
get
Actua
l
Tar
get
Act
ual
Tar
get
Actual
Integrated
Waste
Managem
ent, Waste
Prevention
and Waste
Minimisati
on.
Preservin
g our
resource
s for
future
generati
ons
Tons of
green
waste
diverted
48
978
50
000
10
000
11
482
25
000
12
798
7
500
5
346
7
500
4 713 34 339 Target not
achieved
Frequent breakdown of shredders
during the second half of the financial
year. There were not sufficient trucks to
collect the shredded material from the
composting facilities. In addition, the
composting facility was no longer
available for receiving the shredded
material.
To remediate this non-achievement, the
entity will: put in place a maintenance
contract for critical equipment
(shredders); secure additional green
waste off-takers; and re-commission
Panorama green waste composting
facility.
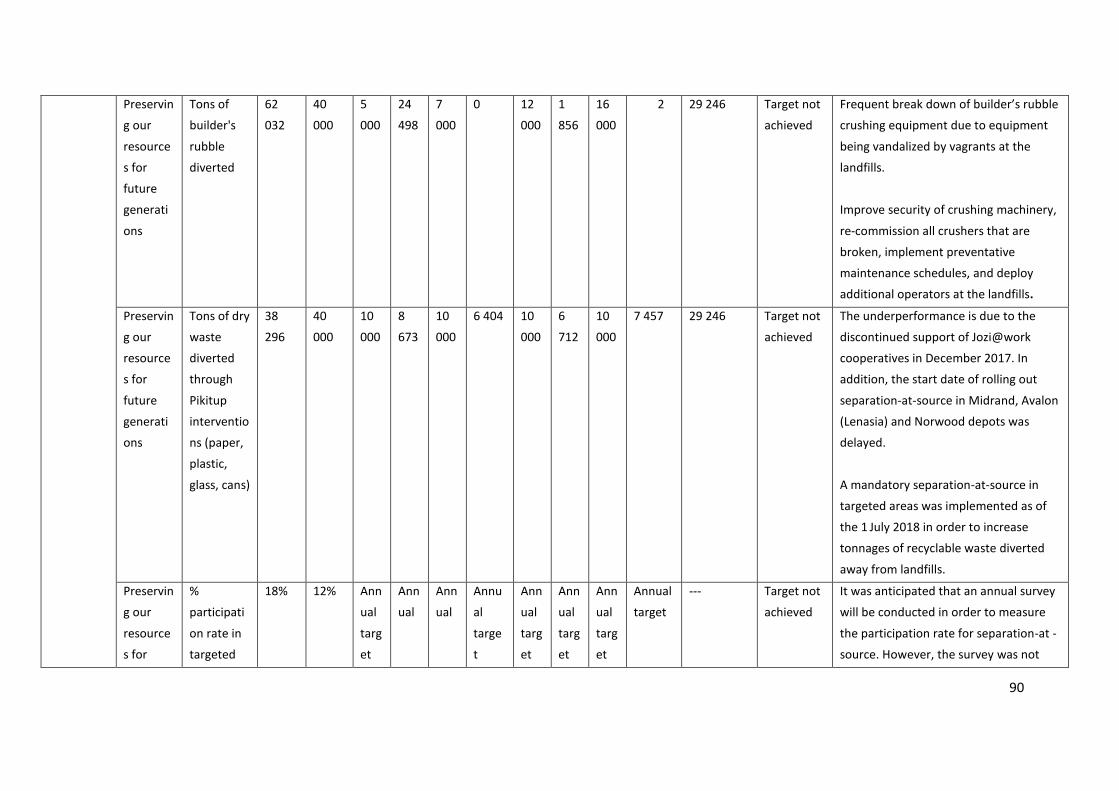
90
Preservin
g our
resource
s for
future
generati
ons
Tons of
builder's
rubble
diverted
62
032
40
000
5
000
24
498
7
000
0 12
000
1
856
16
000
2 9
2
8
29 246 Target not
achieved
Frequent break down of builder’s rubble
crushing equipment due to equipment
being vandalized by vagrants at the
landfills.
Improve security of crushing machinery,
re-commission all crushers that are
broken, implement preventative
maintenance schedules, and deploy
additional operators at the landfills.
Preservin
g our
resource
s for
future
generati
ons
Tons of dry
waste
diverted
through
Pikitup
interventio
ns (paper,
plastic,
glass, cans)
38
296
40
000
10
000
8
673
10
000
6 404 10
000
6
712
10
000
7 457 29 246 Target not
achieved
The underperformance is due to the
discontinued support of Jozi@work
cooperatives in December 2017. In
addition, the start date of rolling out
separation-at-source in Midrand, Avalon
(Lenasia) and Norwood depots was
delayed.
A mandatory separation-at-source in
targeted areas was implemented as of
the 1 July 2018 in order to increase
tonnages of recyclable waste diverted
away from landfills.
Preservin
g our
resource
s for
%
participati
on rate in
targeted
18% 12% Ann
ual
targ
et
Ann
ual
Ann
ual
Annu
al
targe
t
Ann
ual
targ
et
Ann
ual
targ
et
Ann
ual
targ
et
Annual
target
--- Target not
achieved
It was anticipated that an annual survey
will be conducted in order to measure
the participation rate for separation-at -
source. However, the survey was not
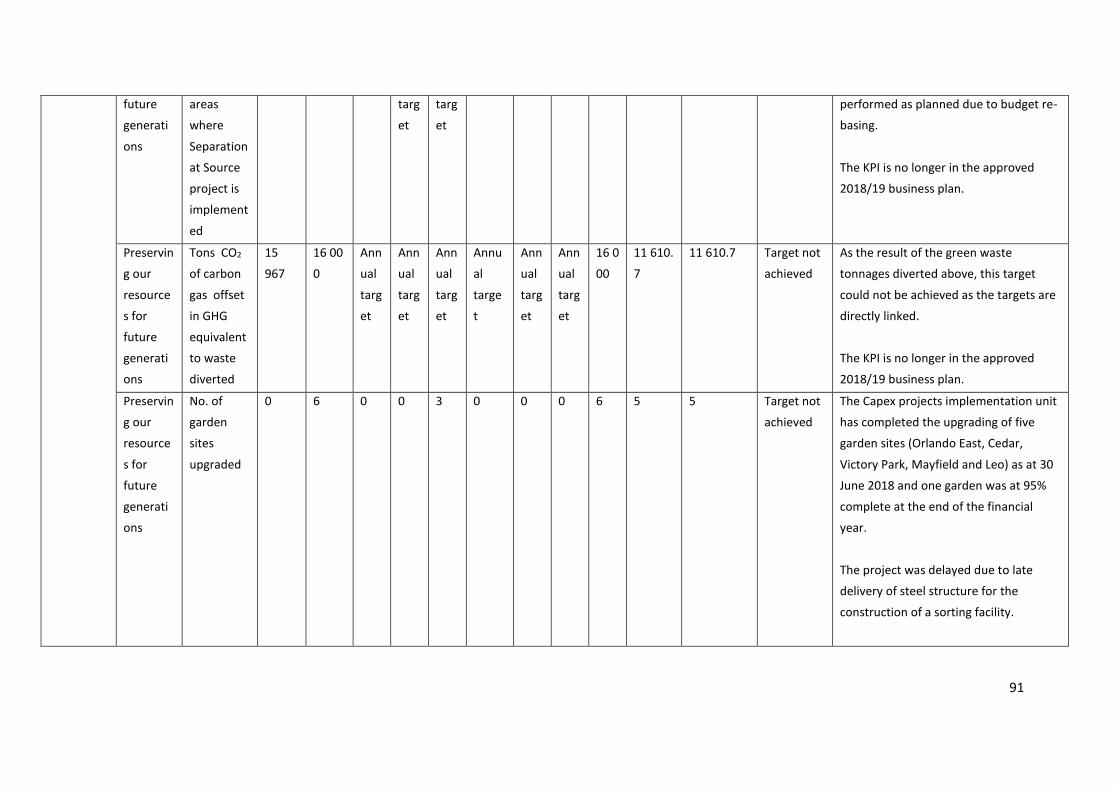
91
future
generati
ons
areas
where
Separation
at Source
project is
implement
ed
targ
et
targ
et
performed as planned due to budget re-
basing.
The KPI is no longer in the approved
2018/19 business plan.
Preservin
g our
resource
s for
future
generati
ons
Tons CO2
of carbon
gas offset
in GHG
equivalent
to waste
diverted
15
967
16 00
0
Ann
ual
targ
et
Ann
ual
targ
et
Ann
ual
targ
et
Annu
al
targe
t
Ann
ual
targ
et
Ann
ual
targ
et
16 0
00
11 610.
7
11 610.7 Target not
achieved
As the result of the green waste
tonnages diverted above, this target
could not be achieved as the targets are
directly linked.
The KPI is no longer in the approved
2018/19 business plan.
Preservin
g our
resource
s for
future
generati
ons
No. of
garden
sites
upgraded
0 6 0 0 3 0 0 0 6 5 5
Target not
achieved
The Capex projects implementation unit
has completed the upgrading of five
garden sites (Orlando East, Cedar,
Victory Park, Mayfield and Leo) as at 30
June 2018 and one garden was at 95%
complete at the end of the financial
year.
The project was delayed due to late
delivery of steel structure for the
construction of a sorting facility.
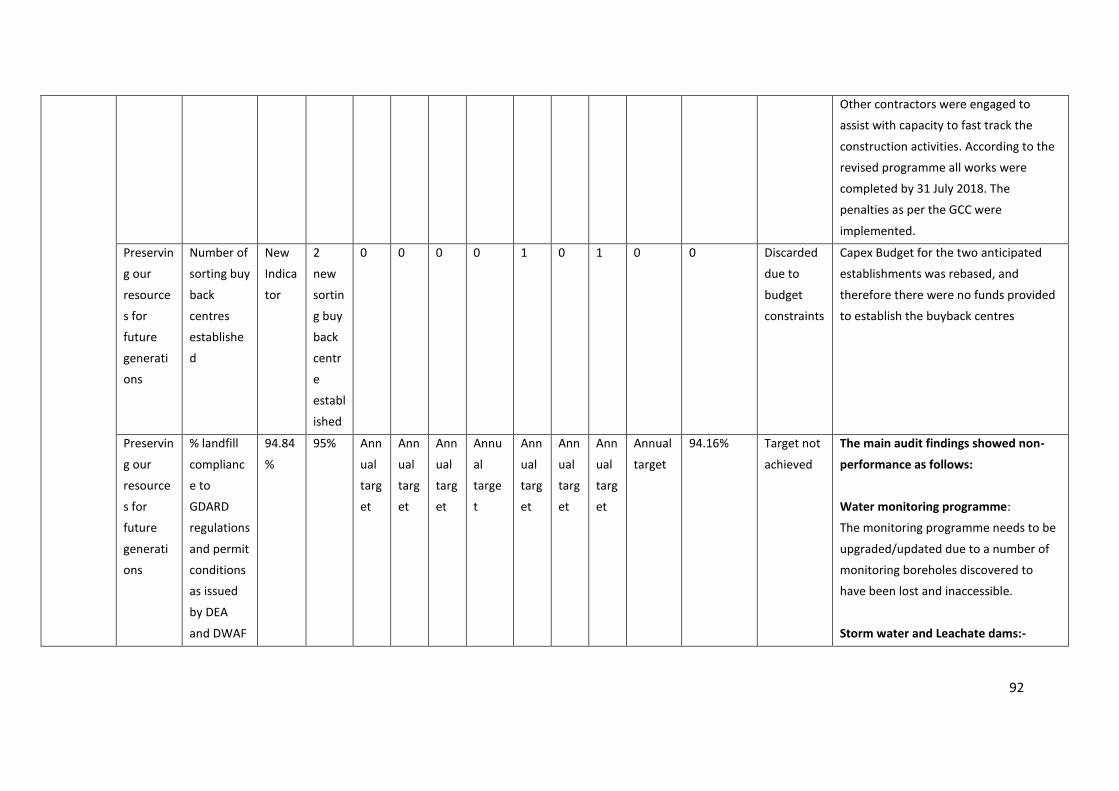
92
Other contractors were engaged to
assist with capacity to fast track the
construction activities. According to the
revised programme all works were
completed by 31 July 2018. The
penalties as per the GCC were
implemented.
Preservin
g our
resource
s for
future
generati
ons
Number of
sorting buy
back
centres
establishe
d
New
Indica
tor
2
new
sortin
g buy
back
centr
e
establ
ished
0 0 0 0 1 0 1 0 0 Discarded
due to
budget
constraints
Capex Budget for the two anticipated
establishments was rebased, and
therefore there were no funds provided
to establish the buyback centres
Preservin
g our
resource
s for
future
generati
ons
% landfill
complianc
e to
GDARD
regulations
and permit
conditions
as issued
by DEA
and DWAF
94.84
%
95% Ann
ual
targ
et
Ann
ual
targ
et
Ann
ual
targ
et
Annu
al
targe
t
Ann
ual
targ
et
Ann
ual
targ
et
Ann
ual
targ
et
Annual
target
94.16% Target not
achieved
The main audit findings showed non-
performance as follows:
Water monitoring programme:
The monitoring programme needs to be
upgraded/updated due to a number of
monitoring boreholes discovered to
have been lost and inaccessible.
Storm water and Leachate dams:-
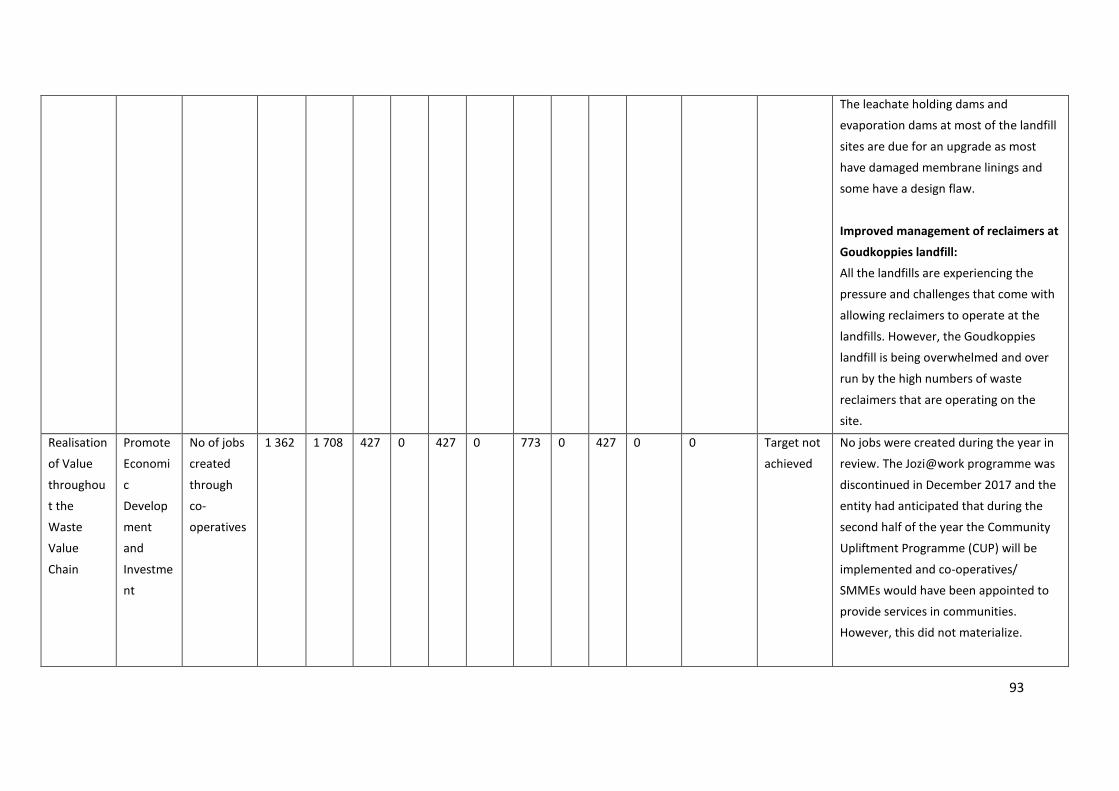
93
The leachate holding dams and
evaporation dams at most of the landfill
sites are due for an upgrade as most
have damaged membrane linings and
some have a design flaw.
Improved management of reclaimers at
Goudkoppies landfill:
All the landfills are experiencing the
pressure and challenges that come with
allowing reclaimers to operate at the
landfills. However, the Goudkoppies
landfill is being overwhelmed and over
run by the high numbers of waste
reclaimers that are operating on the
site.
Realisation
of Value
throughou
t the
Waste
Value
Chain
Promote
Economi
c
Develop
ment
and
Investme
nt
No of jobs
created
through
co-
operatives
1 362 1 708 427 0 427 0 773 0 427 0 0 Target not
achieved
No jobs were created during the year in
review. The Jozi@work programme was
discontinued in December 2017 and the
entity had anticipated that during the
second half of the year the Community
Upliftment Programme (CUP) will be
implemented and co-operatives/
SMMEs would have been appointed to
provide services in communities.
However, this did not materialize.
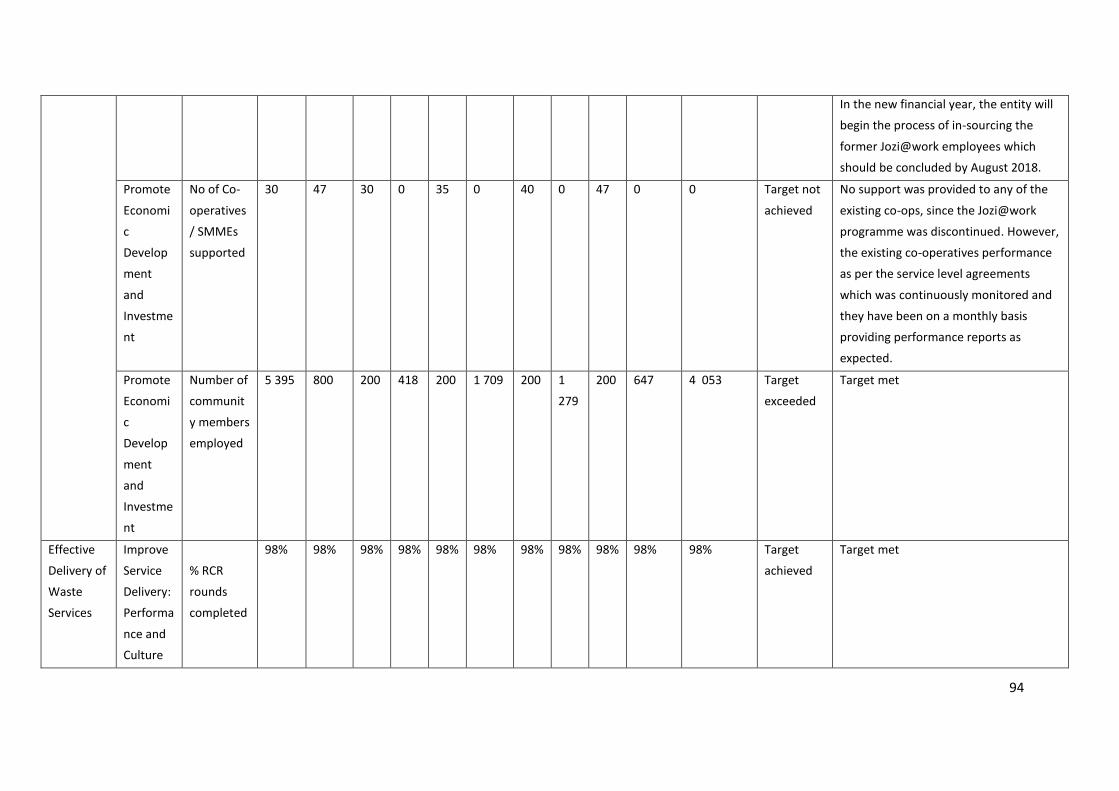
94
In the new financial year, the entity will
begin the process of in-sourcing the
former Jozi@work employees which
should be concluded by August 2018.
Promote
Economi
c
Develop
ment
and
Investme
nt
No of Co-
operatives
/ SMMEs
supported
30 47 30 0 35 0 40 0 47 0 0 Target not
achieved
No support was provided to any of the
existing co-ops, since the Jozi@work
programme was discontinued. However,
the existing co-operatives performance
as per the service level agreements
which was continuously monitored and
they have been on a monthly basis
providing performance reports as
expected.
Promote
Economi
c
Develop
ment
and
Investme
nt
Number of
communit
y members
employed
5 395 800 200 418 200 1 709 200 1
279
200 647 4 053 Target
exceeded
Target met
Effective
Delivery of
Waste
Services
Improve
Service
Delivery:
Performa
nce and
Culture
% RCR
rounds
completed
98% 98% 98% 98% 98% 98% 98% 98% 98% 98% 98% Target
achieved
Target met
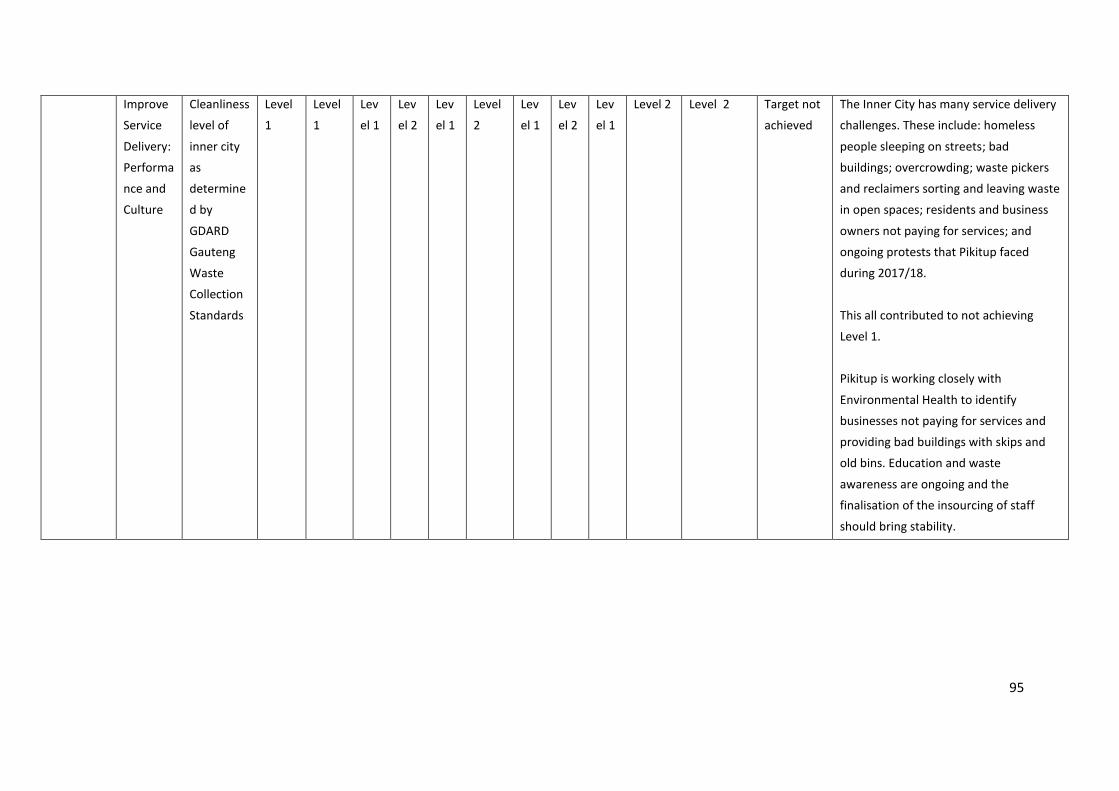
95
Improve
Service
Delivery:
Performa
nce and
Culture
Cleanliness
level of
inner city
as
determine
d by
GDARD
Gauteng
Waste
Collection
Standards
Level
1
Level
1
Lev
el 1
Lev
el 2
Lev
el 1
Level
2
Lev
el 1
Lev
el 2
Lev
el 1
Level 2
Level 2 Target not
achieved
The Inner City has many service delivery
challenges. These include: homeless
people sleeping on streets; bad
buildings; overcrowding; waste pickers
and reclaimers sorting and leaving waste
in open spaces; residents and business
owners not paying for services; and
ongoing protests that Pikitup faced
during 2017/18.
This all contributed to not achieving
Level 1.
Pikitup is working closely with
Environmental Health to identify
businesses not paying for services and
providing bad buildings with skips and
old bins. Education and waste
awareness are ongoing and the
finalisation of the insourcing of staff
should bring stability.
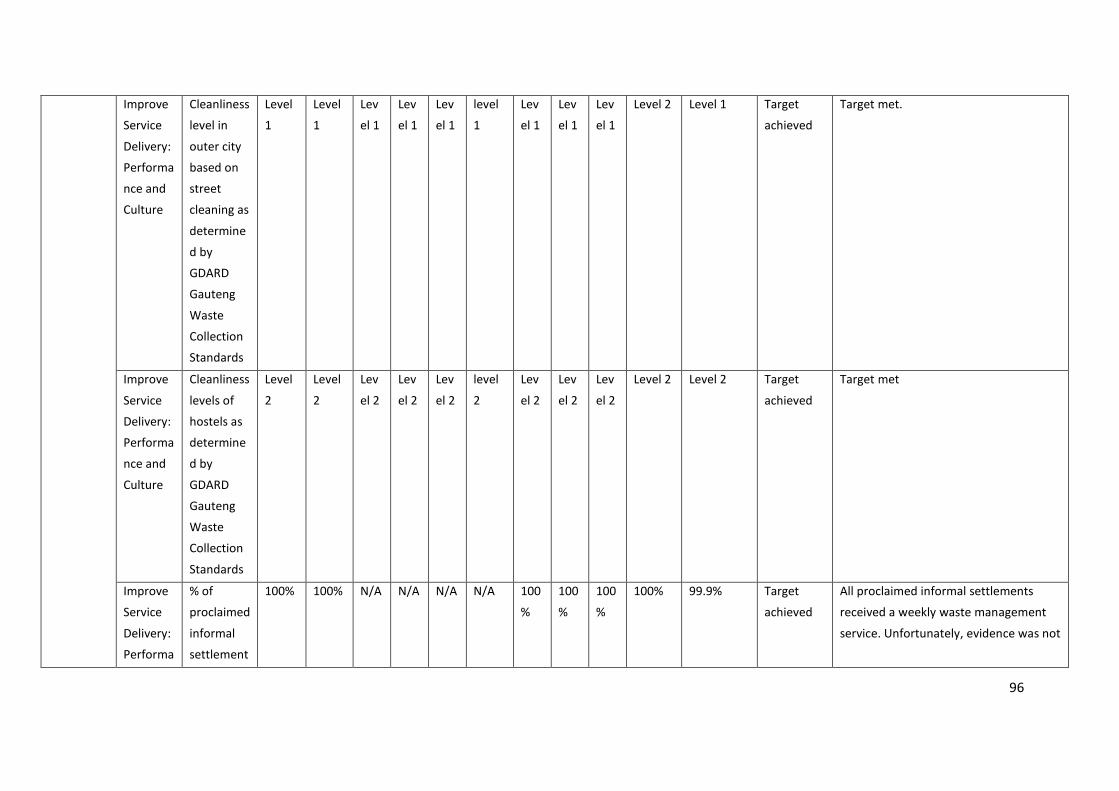
96
Improve
Service
Delivery:
Performa
nce and
Culture
Cleanliness
level in
outer city
based on
street
cleaning as
determine
d by
GDARD
Gauteng
Waste
Collection
Standards
Level
1
Level
1
Lev
el 1
Lev
el 1
Lev
el 1
level
1
Lev
el 1
Lev
el 1
Lev
el 1
Level 2 Level 1 Target
achieved
Target met.
Improve
Service
Delivery:
Performa
nce and
Culture
Cleanliness
levels of
hostels as
determine
d by
GDARD
Gauteng
Waste
Collection
Standards
Level
2
Level
2
Lev
el 2
Lev
el 2
Lev
el 2
level
2
Lev
el 2
Lev
el 2
Lev
el 2
Level 2
Level 2 Target
achieved
Target met
Improve
Service
Delivery:
Performa
% of
proclaimed
informal
settlement
100%
100% N/A N/A N/A N/A 100
%
100
%
100
%
100% 99.9% Target
achieved
All proclaimed informal settlements
received a weekly waste management
service. Unfortunately, evidence was not
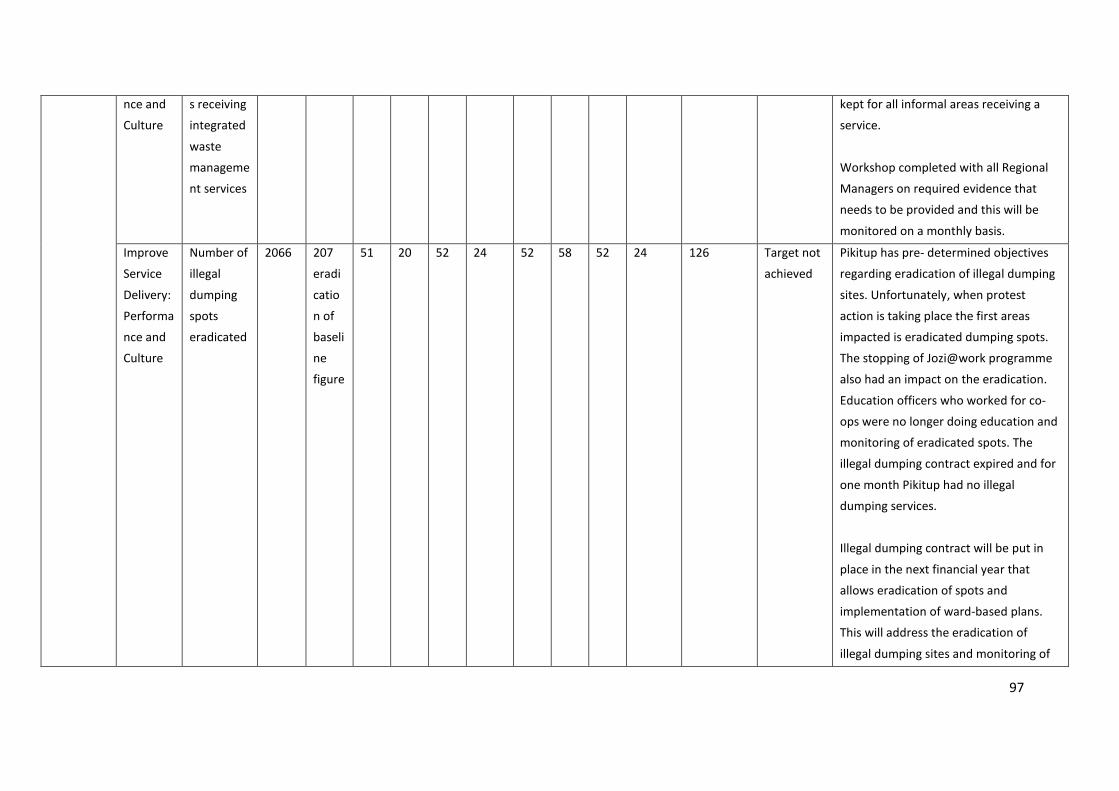
97
nce and
Culture
s receiving
integrated
waste
manageme
nt services
kept for all informal areas receiving a
service.
Workshop completed with all Regional
Managers on required evidence that
needs to be provided and this will be
monitored on a monthly basis.
Improve
Service
Delivery:
Performa
nce and
Culture
Number of
illegal
dumping
spots
eradicated
2066 207
eradi
catio
n of
baseli
ne
figure
51 20 52 24 52 58 52 24 126 Target not
achieved
Pikitup has pre- determined objectives
regarding eradication of illegal dumping
sites. Unfortunately, when protest
action is taking place the first areas
impacted is eradicated dumping spots.
The stopping of Jozi@work programme
also had an impact on the eradication.
Education officers who worked for co-
ops were no longer doing education and
monitoring of eradicated spots. The
illegal dumping contract expired and for
one month Pikitup had no illegal
dumping services.
Illegal dumping contract will be put in
place in the next financial year that
allows eradication of spots and
implementation of ward-based plans.
This will address the eradication of
illegal dumping sites and monitoring of
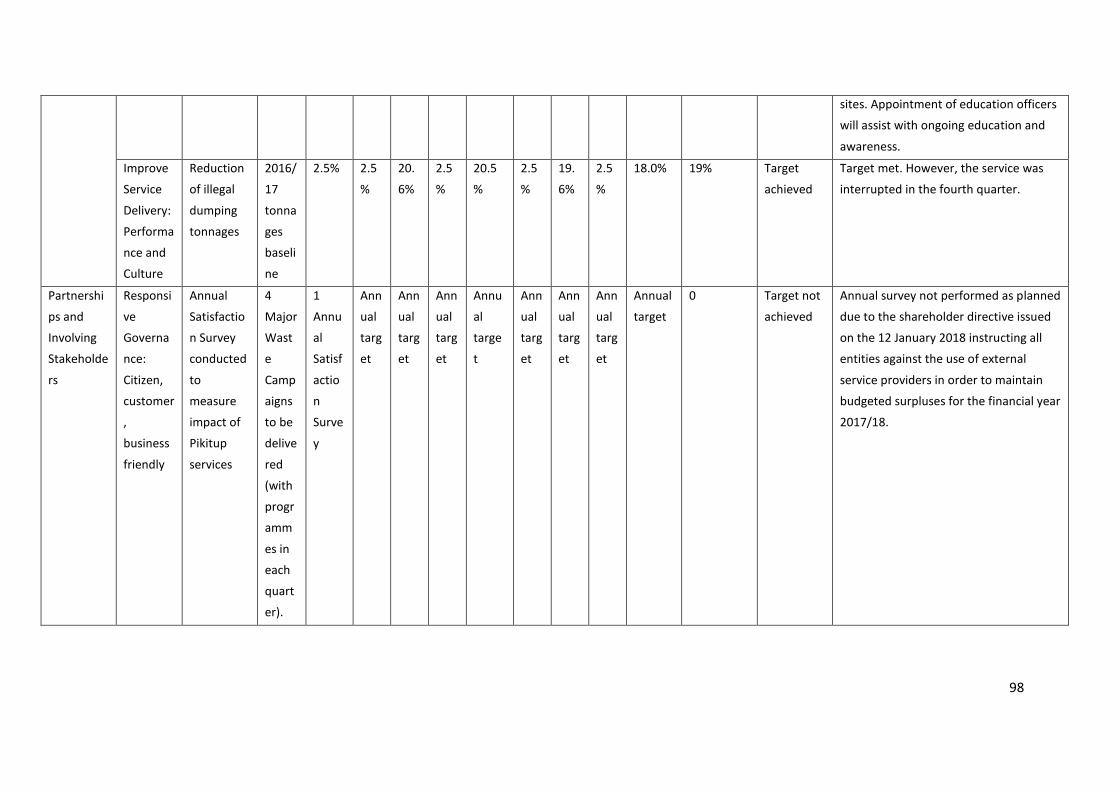
98
sites. Appointment of education officers
will assist with ongoing education and
awareness.
Improve
Service
Delivery:
Performa
nce and
Culture
Reduction
of illegal
dumping
tonnages
2016/
17
tonna
ges
baseli
ne
2.5% 2.5
%
20.
6%
2.5
%
20.5
%
2.5
%
19.
6%
2.5
%
18.0%
19% Target
achieved
Target met. However, the service was
interrupted in the fourth quarter.
Partnershi
ps and
Involving
Stakeholde
rs
Responsi
ve
Governa
nce:
Citizen,
customer
,
business
friendly
Annual
Satisfactio
n Survey
conducted
to
measure
impact of
Pikitup
services
4
Major
Wast
e
Camp
aigns
to be
delive
red
(with
progr
amm
es in
each
quart
er).
1
Annu
al
Satisf
actio
n
Surve
y
Ann
ual
targ
et
Ann
ual
targ
et
Ann
ual
targ
et
Annu
al
targe
t
Ann
ual
targ
et
Ann
ual
targ
et
Ann
ual
targ
et
Annual
target
0 Target not
achieved
Annual survey not performed as planned
due to the shareholder directive issued
on the 12 January 2018 instructing all
entities against the use of external
service providers in order to maintain
budgeted surpluses for the financial year
2017/18.
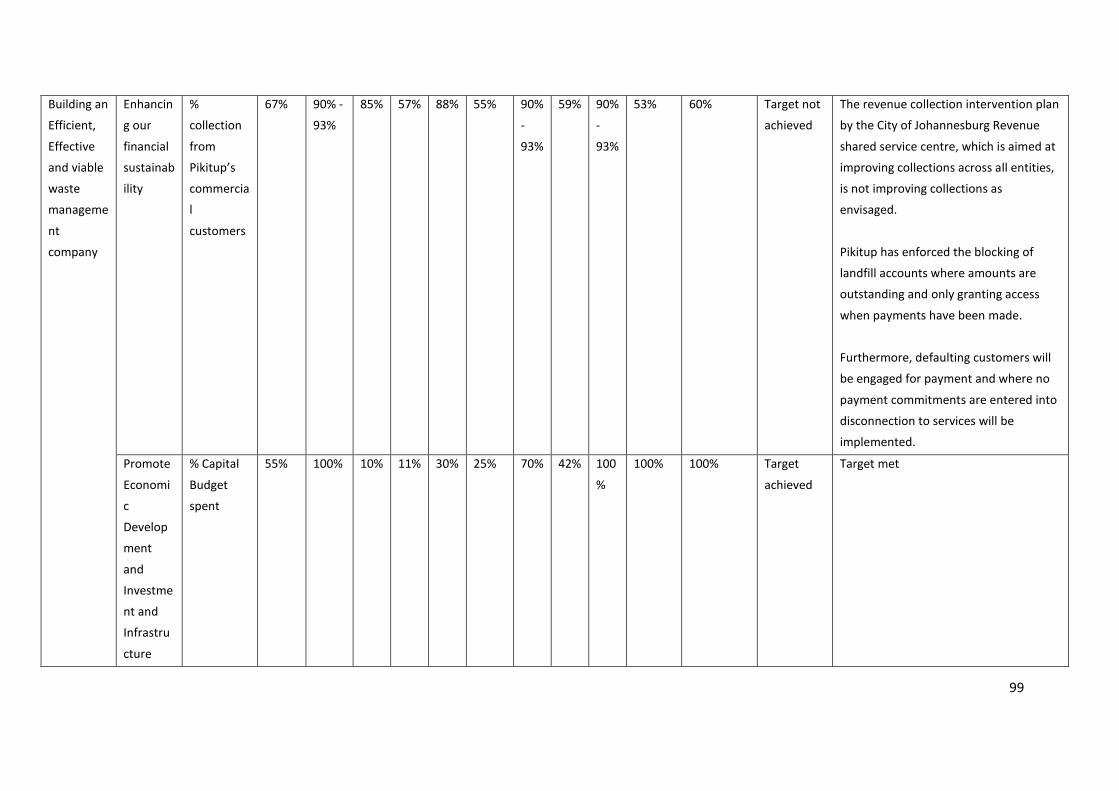
99
Building an
Efficient,
Effective
and viable
waste
manageme
nt
company
Enhancin
g our
financial
sustainab
ility
%
collection
from
Pikitup’s
commercia
l
customers
67% 90% -
93%
85% 57% 88% 55% 90%
-
93%
59% 90%
-
93%
53% 60% Target not
achieved
The revenue collection intervention plan
by the City of Johannesburg Revenue
shared service centre, which is aimed at
improving collections across all entities,
is not improving collections as
envisaged.
Pikitup has enforced the blocking of
landfill accounts where amounts are
outstanding and only granting access
when payments have been made.
Furthermore, defaulting customers will
be engaged for payment and where no
payment commitments are entered into
disconnection to services will be
implemented.
Promote
Economi
c
Develop
ment
and
Investme
nt and
Infrastru
cture
% Capital
Budget
spent
55% 100% 10% 11% 30% 25% 70% 42% 100
%
100%
100%
Target
achieved
Target met
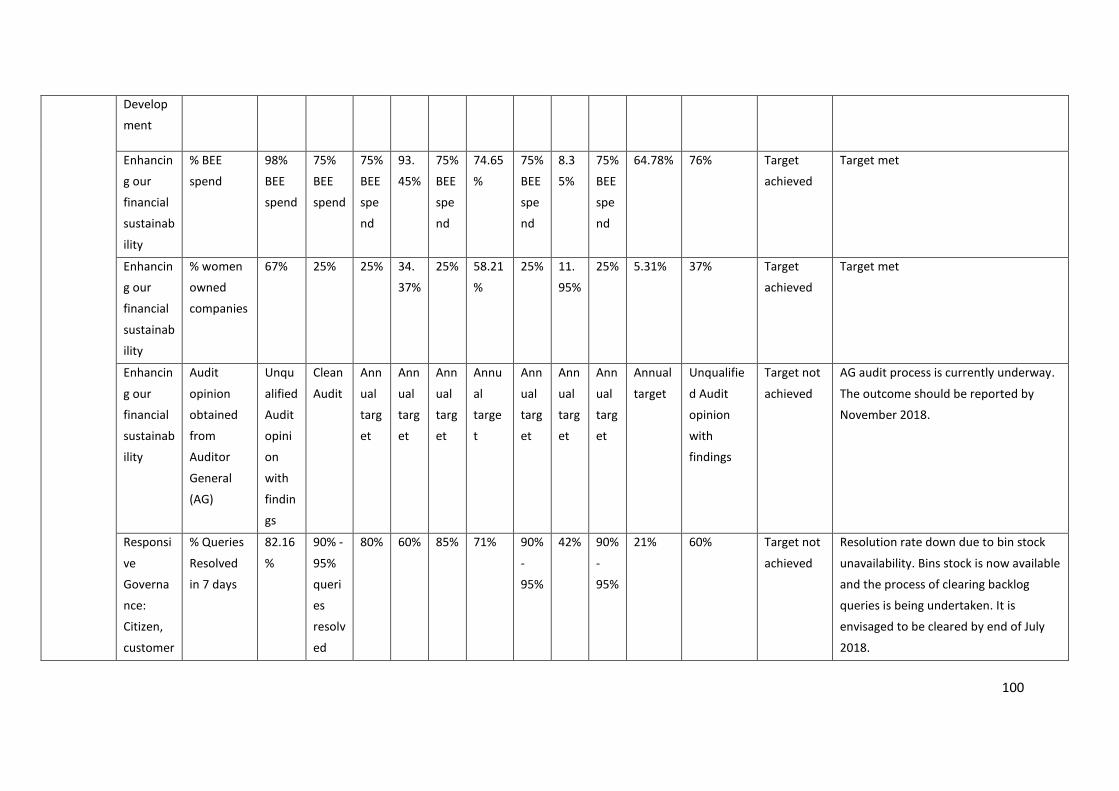
100
Develop
ment
Enhancin
g our
financial
sustainab
ility
% BEE
spend
98%
BEE
spend
75%
BEE
spend
75%
BEE
spe
nd
93.
45%
75%
BEE
spe
nd
74.65
%
75%
BEE
spe
nd
8.3
5%
75%
BEE
spe
nd
64.78% 76% Target
achieved
Target met
Enhancin
g our
financial
sustainab
ility
% women
owned
companies
67% 25% 25% 34.
37%
25% 58.21
%
25% 11.
95%
25% 5.31% 37% Target
achieved
Target met
Enhancin
g our
financial
sustainab
ility
Audit
opinion
obtained
from
Auditor
General
(AG)
Unqu
alified
Audit
opini
on
with
findin
gs
Clean
Audit
Ann
ual
targ
et
Ann
ual
targ
et
Ann
ual
targ
et
Annu
al
targe
t
Ann
ual
targ
et
Ann
ual
targ
et
Ann
ual
targ
et
Annual
target
Unqualifie
d Audit
opinion
with
findings
Target not
achieved
AG audit process is currently underway.
The outcome should be reported by
November 2018.
Responsi
ve
Governa
nce:
Citizen,
customer
% Queries
Resolved
in 7 days
82.16
%
90% -
95%
queri
es
resolv
ed
80% 60% 85% 71% 90%
-
95%
42% 90%
-
95%
21% 60% Target not
achieved
Resolution rate down due to bin stock
unavailability. Bins stock is now available
and the process of clearing backlog
queries is being undertaken. It is
envisaged to be cleared by end of July
2018.
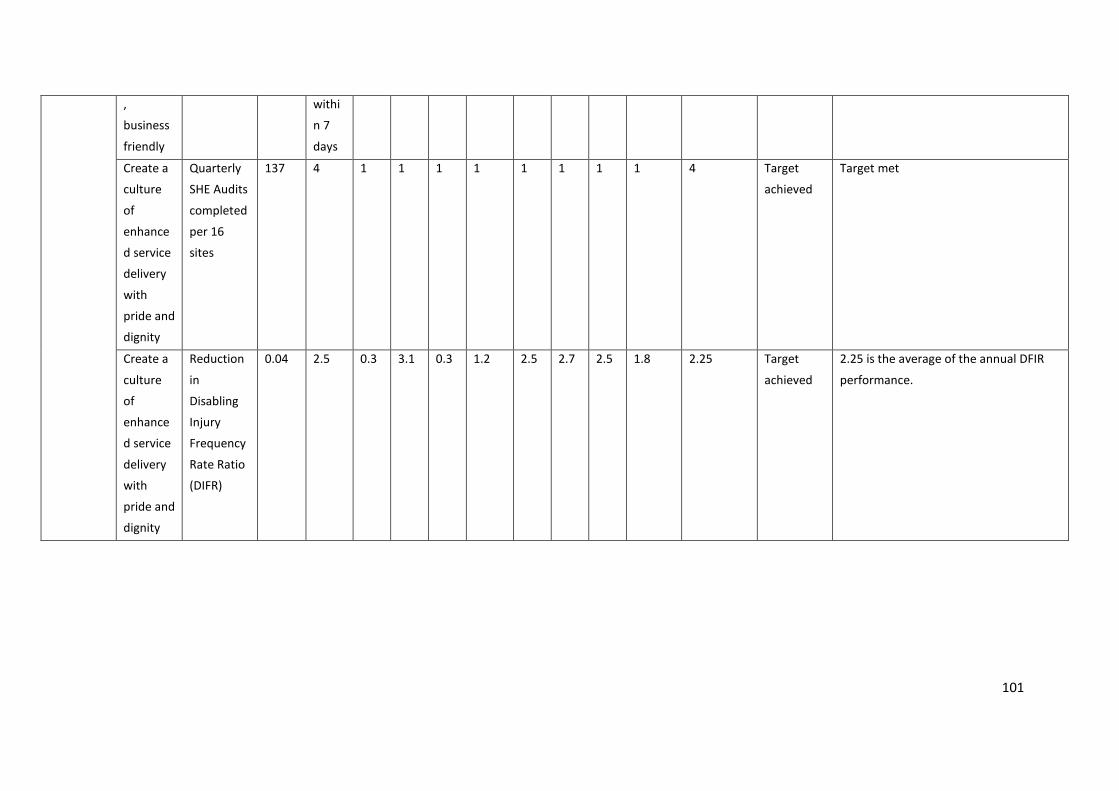
101
,
business
friendly
withi
n 7
days
Create a
culture
of
enhance
d service
delivery
with
pride and
dignity
Quarterly
SHE Audits
completed
per 16
sites
137 4 1 1 1 1 1 1 1 1 4 Target
achieved
Target met
Create a
culture
of
enhance
d service
delivery
with
pride and
dignity
Reduction
in
Disabling
Injury
Frequency
Rate Ratio
(DIFR)
0.04 2.5 0.3 3.1 0.3 1.2 2.5 2.7 2.5 1.8 2.25 Target
achieved
2.25 is the average of the annual DFIR
performance.
102
Financial performance
Revenue
The entity reported a surplus of R179 532 281 in the current year as compared to R291 936 910 in the
prior period with total revenue of R2 296 716 663 (2016/17: R2 200 340 679). The reduction of 39%
in profit is mainly due to the budget cut implemented during the year (2017/18) and an increase of
allowance for doubtful debt. Service charges (revenue) showed an increase of 11% compared to prior
year which was mainly due to the tariff increases. Pikitup’s net asset position was reduced to
R156 592 955 (2016/17: R22 939 326) due to the restatement of the allowances for doubtful debt in
prior period.
Commercial services improved its performance again in 2017/18 with an increase of 13% on total
revenue to R286 619 000 as compared to prior year revenue of R253 822 000. The profit for the year
for commercial services shows an increase of 12% to R114 111 000 as compared to prior year profit
of R102 146 000 (commercial services financial performance is included in the entity performance).
Expenditure
Employee expenditure
The overarching objective in the period has been characterised by amongst others, realignment of the
HR functions and preparation for the implementation of the HR Service Delivery Model. In the
reporting period, the following key delivery service areas were prioritised:
Capacitating line functions as per the approved organogram; and
Enhancing HR compliance to the relevant legislation, regulations and HR policies.
The total staff cost for the 2017/18 financial year is R973 083 224.80.
Capital expenditure
The capital expenditure performance for the year under review is R60.061 million which is 99.91% of
the total capital budget of R 60.110 million. It should be noted that the total projects budget during
the review period is R116.817 million due to some projects being multi-year projects, beyond the
currently reviewed operational period.
Table 31: Pikitup capital projects
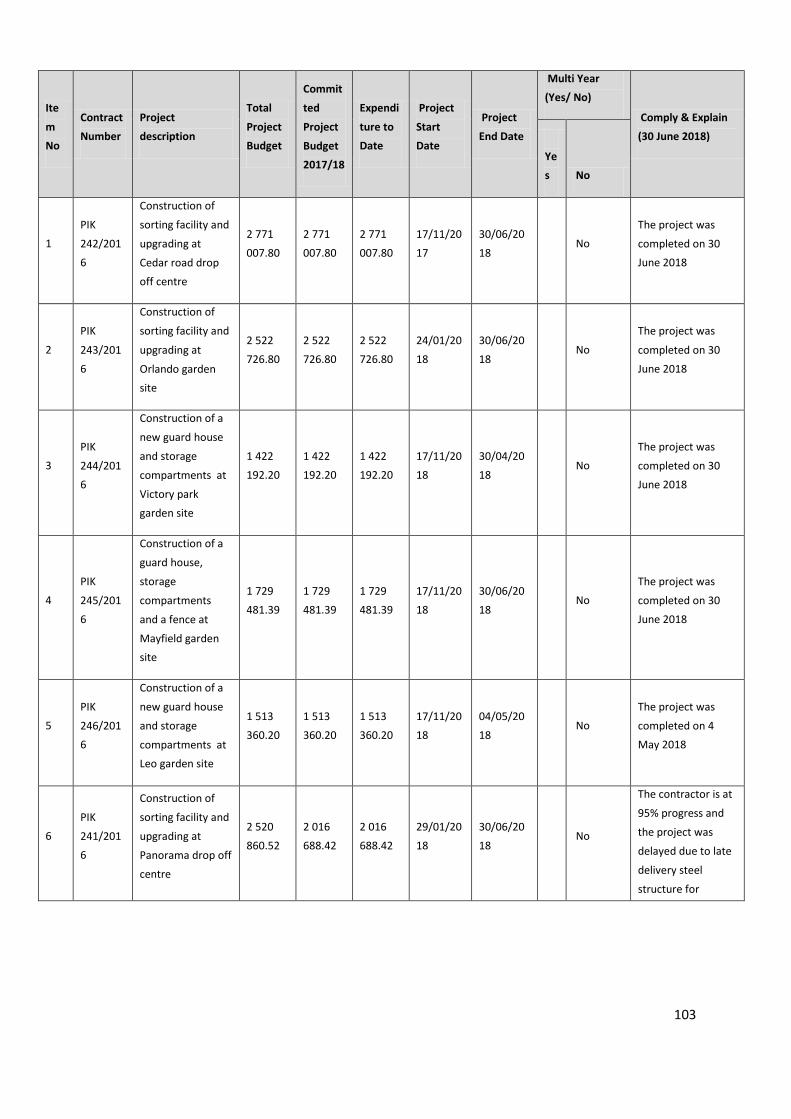
103
Ite
m
No
Contract
Number
Project
description
Total
Project
Budget
Commit
ted
Project
Budget
2017/18
Expendi
ture to
Date
Project
Start
Date
Project
End Date
Multi Year
(Yes/ No)
Comply & Explain
(30 June 2018)
Ye
s No
1
PIK
242/201
6
Construction of
sorting facility and
upgrading at
Cedar road drop
off centre
2 771
007.80
2 771
007.80
2 771
007.80
17/11/20
17
30/06/20
18 No
The project was
completed on 30
June 2018
2
PIK
243/201
6
Construction of
sorting facility and
upgrading at
Orlando garden
site
2 522
726.80
2 522
726.80
2 522
726.80
24/01/20
18
30/06/20
18 No
The project was
completed on 30
June 2018
3
PIK
244/201
6
Construction of a
new guard house
and storage
compartments at
Victory park
garden site
1 422
192.20
1 422
192.20
1 422
192.20
17/11/20
18
30/04/20
18 No
The project was
completed on 30
June 2018
4
PIK
245/201
6
Construction of a
guard house,
storage
compartments
and a fence at
Mayfield garden
site
1 729
481.39
1 729
481.39
1 729
481.39
17/11/20
18
30/06/20
18 No
The project was
completed on 30
June 2018
5
PIK
246/201
6
Construction of a
new guard house
and storage
compartments at
Leo garden site
1 513
360.20
1 513
360.20
1 513
360.20
17/11/20
18
04/05/20
18 No
The project was
completed on 4
May 2018
6
PIK
241/201
6
Construction of
sorting facility and
upgrading at
Panorama drop off
centre
2 520
860.52
2 016
688.42
2 016
688.42
29/01/20
18
30/06/20
18 No
The contractor is at
95% progress and
the project was
delayed due to late
delivery steel
structure for
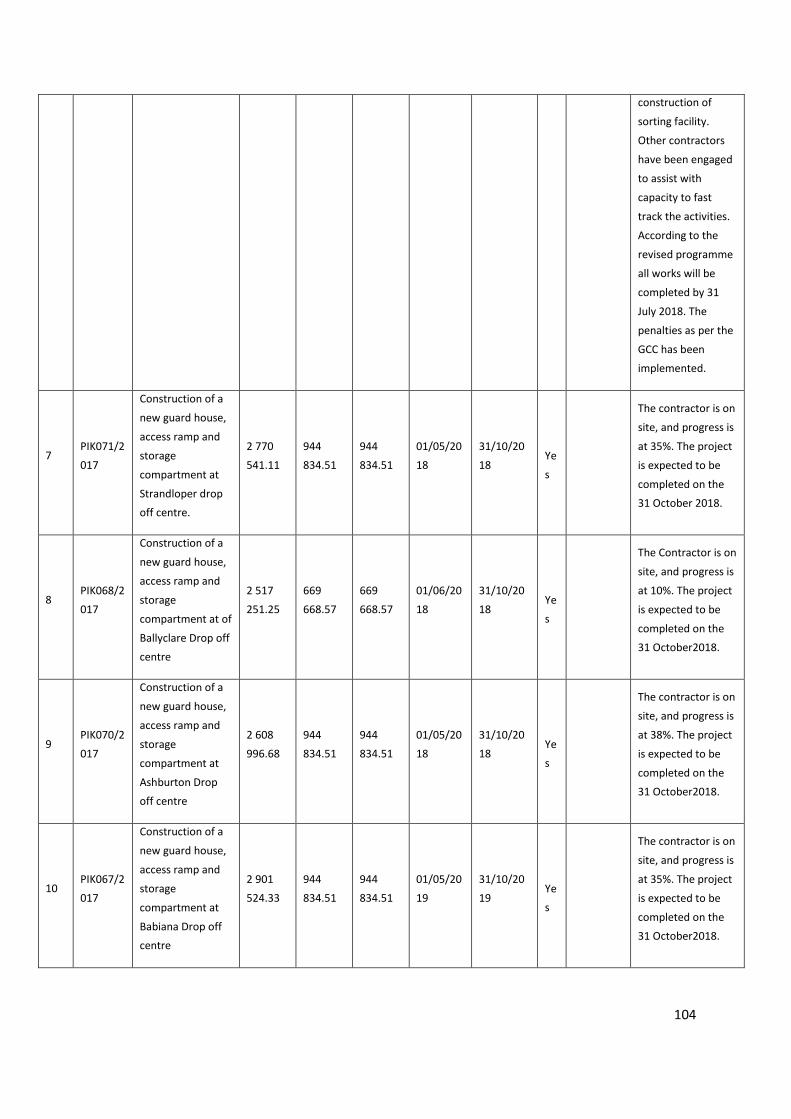
104
construction of
sorting facility.
Other contractors
have been engaged
to assist with
capacity to fast
track the activities.
According to the
revised programme
all works will be
completed by 31
July 2018. The
penalties as per the
GCC has been
implemented.
7 PIK071/2
017
Construction of a
new guard house,
access ramp and
storage
compartment at
Strandloper drop
off centre.
2 770
541.11
944
834.51
944
834.51
01/05/20
18
31/10/20
18
Ye
s
The contractor is on
site, and progress is
at 35%. The project
is expected to be
completed on the
31 October 2018.
8 PIK068/2
017
Construction of a
new guard house,
access ramp and
storage
compartment at of
Ballyclare Drop off
centre
2 517
251.25
669
668.57
669
668.57
01/06/20
18
31/10/20
18
Ye
s
The Contractor is on
site, and progress is
at 10%. The project
is expected to be
completed on the
31 October2018.
9 PIK070/2
017
Construction of a
new guard house,
access ramp and
storage
compartment at
Ashburton Drop
off centre
2 608
996.68
944
834.51
944
834.51
01/05/20
18
31/10/20
18
Ye
s
The contractor is on
site, and progress is
at 38%. The project
is expected to be
completed on the
31 October2018.
10 PIK067/2
017
Construction of a
new guard house,
access ramp and
storage
compartment at
Babiana Drop off
centre
2 901
524.33
944
834.51
944
834.51
01/05/20
19
31/10/20
19
Ye
s
The contractor is on
site, and progress is
at 35%. The project
is expected to be
completed on the
31 October2018.
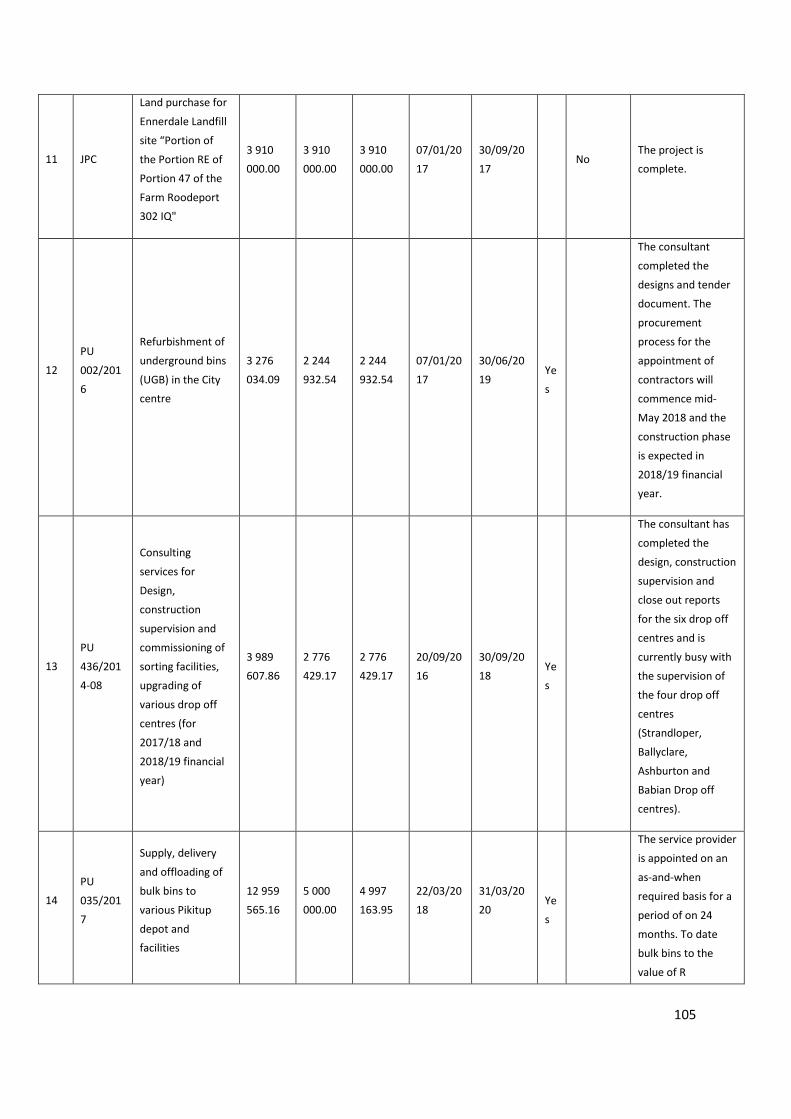
105
11 JPC
Land purchase for
Ennerdale Landfill
site “Portion of
the Portion RE of
Portion 47 of the
Farm Roodeport
302 IQ"
3 910
000.00
3 910
000.00
3 910
000.00
07/01/20
17
30/09/20
17 No
The project is
complete.
12
PU
002/201
6
Refurbishment of
underground bins
(UGB) in the City
centre
3 276
034.09
2 244
932.54
2 244
932.54
07/01/20
17
30/06/20
19
Ye
s
The consultant
completed the
designs and tender
document. The
procurement
process for the
appointment of
contractors will
commence mid-
May 2018 and the
construction phase
is expected in
2018/19 financial
year.
13
PU
436/201
4-08
Consulting
services for
Design,
construction
supervision and
commissioning of
sorting facilities,
upgrading of
various drop off
centres (for
2017/18 and
2018/19 financial
year)
3 989
607.86
2 776
429.17
2 776
429.17
20/09/20
16
30/09/20
18
Ye
s
The consultant has
completed the
design, construction
supervision and
close out reports
for the six drop off
centres and is
currently busy with
the supervision of
the four drop off
centres
(Strandloper,
Ballyclare,
Ashburton and
Babian Drop off
centres).
14
PU
035/201
7
Supply, delivery
and offloading of
bulk bins to
various Pikitup
depot and
facilities
12 959
565.16
5 000
000.00
4 997
163.95
22/03/20
18
31/03/20
20
Ye
s
The service provider
is appointed on an
as-and-when
required basis for a
period of on 24
months. To date
bulk bins to the
value of R
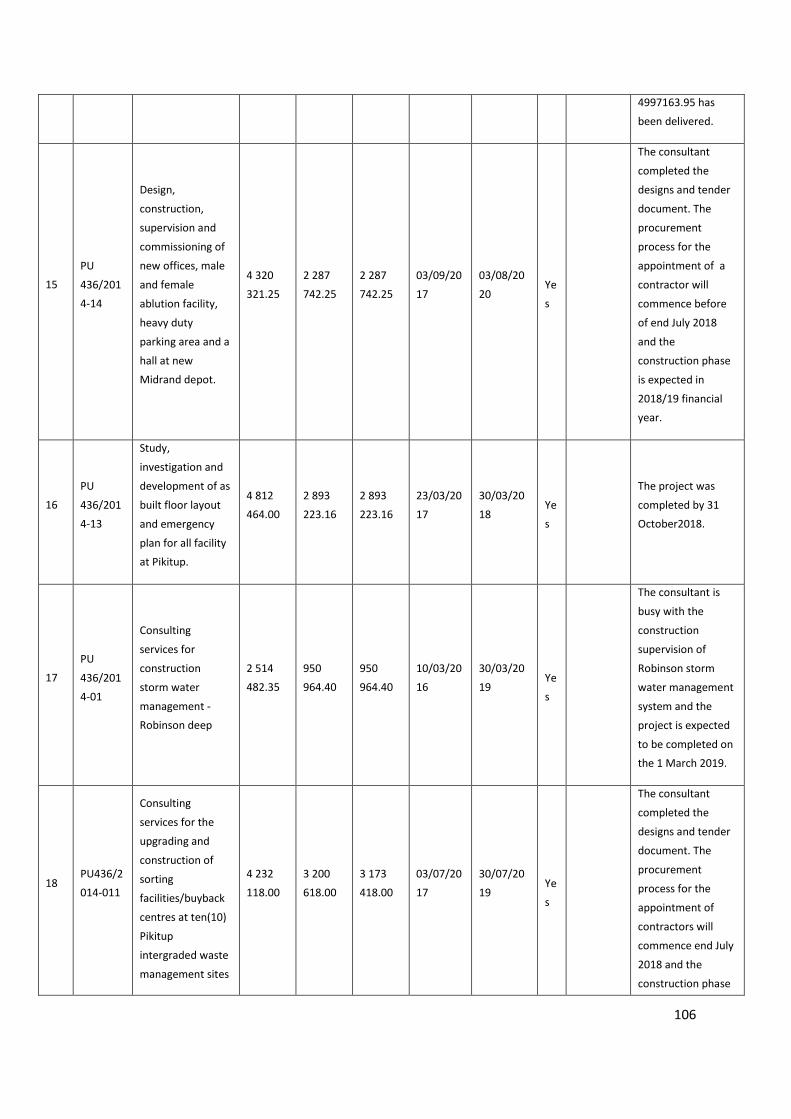
106
4997163.95 has
been delivered.
15
PU
436/201
4-14
Design,
construction,
supervision and
commissioning of
new offices, male
and female
ablution facility,
heavy duty
parking area and a
hall at new
Midrand depot.
4 320
321.25
2 287
742.25
2 287
742.25
03/09/20
17
03/08/20
20
Ye
s
The consultant
completed the
designs and tender
document. The
procurement
process for the
appointment of a
contractor will
commence before
of end July 2018
and the
construction phase
is expected in
2018/19 financial
year.
16
PU
436/201
4-13
Study,
investigation and
development of as
built floor layout
and emergency
plan for all facility
at Pikitup.
4 812
464.00
2 893
223.16
2 893
223.16
23/03/20
17
30/03/20
18
Ye
s
The project was
completed by 31
October2018.
17
PU
436/201
4-01
Consulting
services for
construction
storm water
management -
Robinson deep
2 514
482.35
950
964.40
950
964.40
10/03/20
16
30/03/20
19
Ye
s
The consultant is
busy with the
construction
supervision of
Robinson storm
water management
system and the
project is expected
to be completed on
the 1 March 2019.
18 PU436/2
014-011
Consulting
services for the
upgrading and
construction of
sorting
facilities/buyback
centres at ten(10)
Pikitup
intergraded waste
management sites
4 232
118.00
3 200
618.00
3 173
418.00
03/07/20
17
30/07/20
19
Ye
s
The consultant
completed the
designs and tender
document. The
procurement
process for the
appointment of
contractors will
commence end July
2018 and the
construction phase
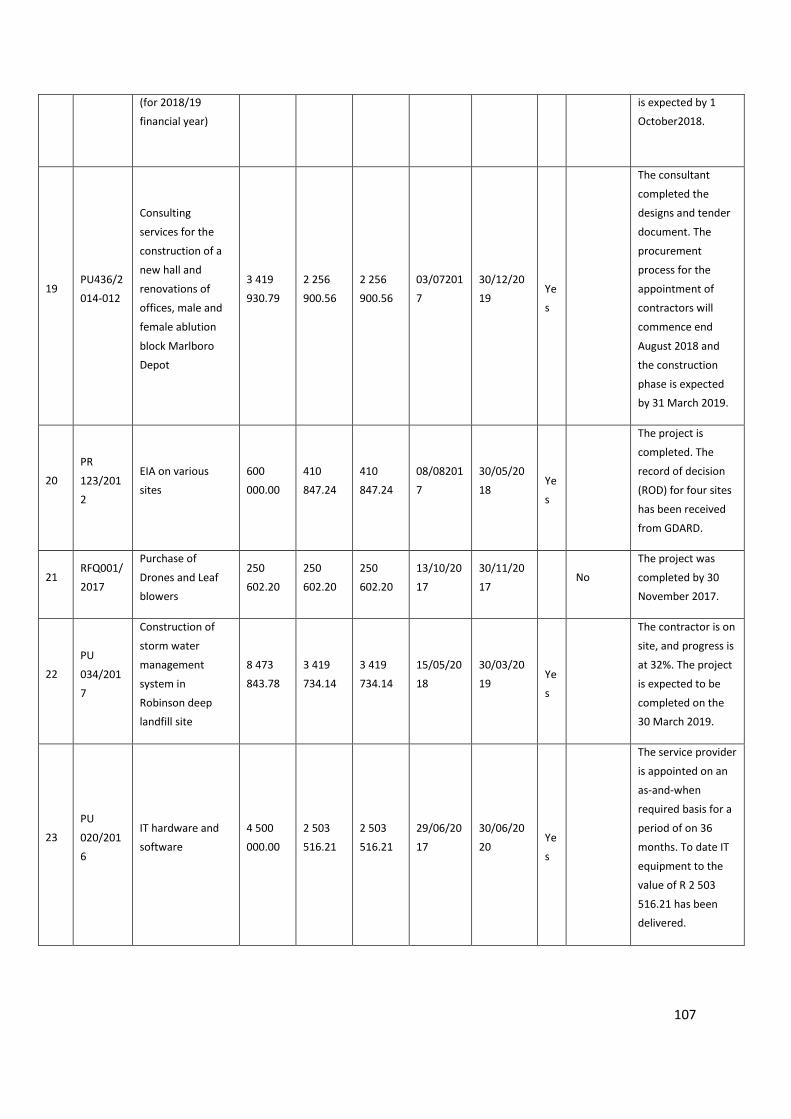
107
(for 2018/19
financial year)
is expected by 1
October2018.
19 PU436/2
014-012
Consulting
services for the
construction of a
new hall and
renovations of
offices, male and
female ablution
block Marlboro
Depot
3 419
930.79
2 256
900.56
2 256
900.56
03/07201
7
30/12/20
19
Ye
s
The consultant
completed the
designs and tender
document. The
procurement
process for the
appointment of
contractors will
commence end
August 2018 and
the construction
phase is expected
by 31 March 2019.
20
PR
123/201
2
EIA on various
sites
600
000.00
410
847.24
410
847.24
08/08201
7
30/05/20
18
Ye
s
The project is
completed. The
record of decision
(ROD) for four sites
has been received
from GDARD.
21 RFQ001/
2017
Purchase of
Drones and Leaf
blowers
250
602.20
250
602.20
250
602.20
13/10/20
17
30/11/20
17 No
The project was
completed by 30
November 2017.
22
PU
034/201
7
Construction of
storm water
management
system in
Robinson deep
landfill site
8 473
843.78
3 419
734.14
3 419
734.14
15/05/20
18
30/03/20
19
Ye
s
The contractor is on
site, and progress is
at 32%. The project
is expected to be
completed on the
30 March 2019.
23
PU
020/201
6
IT hardware and
software
4 500
000.00
2 503
516.21
2 503
516.21
29/06/20
17
30/06/20
20
Ye
s
The service provider
is appointed on an
as-and-when
required basis for a
period of on 36
months. To date IT
equipment to the
value of R 2 503
516.21 has been
delivered.
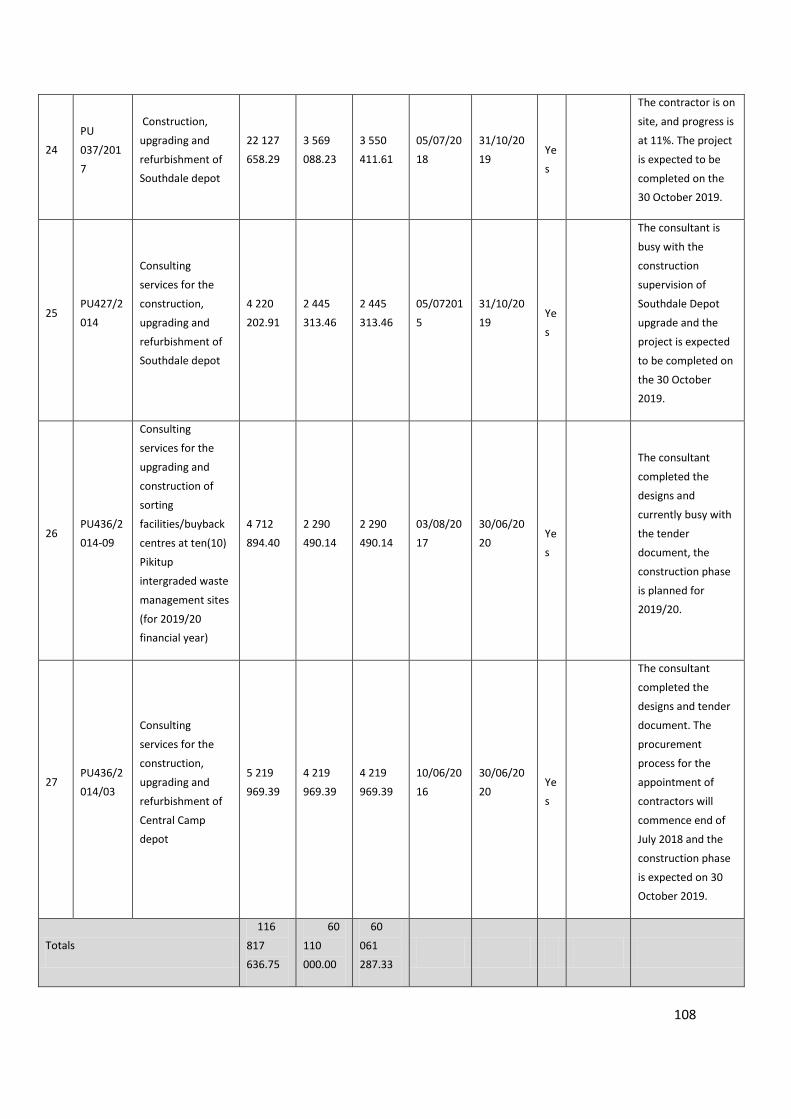
108
24
PU
037/201
7
Construction,
upgrading and
refurbishment of
Southdale depot
22 127
658.29
3 569
088.23
3 550
411.61
05/07/20
18
31/10/20
19
Ye
s
The contractor is on
site, and progress is
at 11%. The project
is expected to be
completed on the
30 October 2019.
25 PU427/2
014
Consulting
services for the
construction,
upgrading and
refurbishment of
Southdale depot
4 220
202.91
2 445
313.46
2 445
313.46
05/07201
5
31/10/20
19
Ye
s
The consultant is
busy with the
construction
supervision of
Southdale Depot
upgrade and the
project is expected
to be completed on
the 30 October
2019.
26 PU436/2
014-09
Consulting
services for the
upgrading and
construction of
sorting
facilities/buyback
centres at ten(10)
Pikitup
intergraded waste
management sites
(for 2019/20
financial year)
4 712
894.40
2 290
490.14
2 290
490.14
03/08/20
17
30/06/20
20
Ye
s
The consultant
completed the
designs and
currently busy with
the tender
document, the
construction phase
is planned for
2019/20.
27 PU436/2
014/03
Consulting
services for the
construction,
upgrading and
refurbishment of
Central Camp
depot
5 219
969.39
4 219
969.39
4 219
969.39
10/06/20
16
30/06/20
20
Ye
s
The consultant
completed the
designs and tender
document. The
procurement
process for the
appointment of
contractors will
commence end of
July 2018 and the
construction phase
is expected on 30
October 2019.
Totals
116
817
636.75
60
110
000.00
60
061
287.33
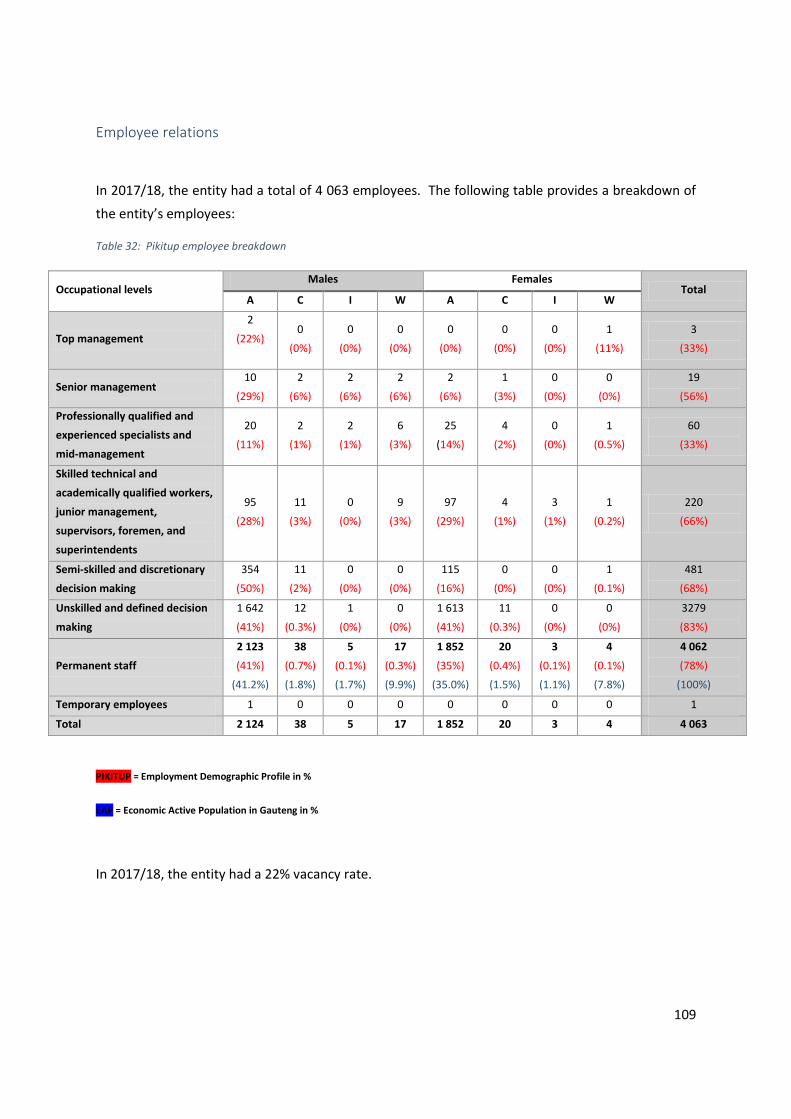
109
Employee relations
In 2017/18, the entity had a total of 4 063 employees. The following table provides a breakdown of
the entity’s employees:
Table 32: Pikitup employee breakdown
Occupational levels Males Females
Total A C I W A C I W
Top management
2
(22%)
0
(0%)
0
(0%)
0
(0%)
0
(0%)
0
(0%)
0
(0%)
1
(11%)
3
(33%)
Senior management 10
(29%)
2
(6%)
2
(6%)
2
(6%)
2
(6%)
1
(3%)
0
(0%)
0
(0%)
19
(56%)
Professionally qualified and
experienced specialists and
mid-management
20
(11%)
2
(1%)
2
(1%)
6
(3%)
25
(14%)
4
(2%)
0
(0%)
1
(0.5%)
60
(33%)
Skilled technical and
academically qualified workers,
junior management,
supervisors, foremen, and
superintendents
95
(28%)
11
(3%)
0
(0%)
9
(3%)
97
(29%)
4
(1%)
3
(1%)
1
(0.2%)
220
(66%)
Semi-skilled and discretionary
decision making
354
(50%)
11
(2%)
0
(0%)
0
(0%)
115
(16%)
0
(0%)
0
(0%)
1
(0.1%)
481
(68%)
Unskilled and defined decision
making
1 642
(41%)
12
(0.3%)
1
(0%)
0
(0%)
1 613
(41%)
11
(0.3%)
0
(0%)
0
(0%)
3279
(83%)
Permanent staff
2 123
(41%)
(41.2%)
38
(0.7%)
(1.8%)
5
(0.1%)
(1.7%)
17
(0.3%)
(9.9%)
1 852
(35%)
(35.0%)
20
(0.4%)
(1.5%)
3
(0.1%)
(1.1%)
4
(0.1%)
(7.8%)
4 062
(78%)
(100%)
Temporary employees 1 0 0 0 0 0 0 0 1
Total 2 124 38 5 17 1 852 20 3 4 4 063
PIKITUP = Employment Demographic Profile in %
EAP = Economic Active Population in Gauteng in %
In 2017/18, the entity had a 22% vacancy rate.
110
3.4 Housing Services: JOSHCO
The City provides housing services through a number of mechanisms. Firstly, the Department of
Housing has the mandate of delivering housing opportunities that provide alternative tenure options;
are located close to economic opportunities; are adequately serviced; are affordable; and are
preferably found in high-density environments.
The Johannesburg Social Housing Company’s (JOSHCO) mandate is to provide and manage affordable
rental housing for up to R15 000 to the market as an integral part of efforts to eradicate the housing
backlog within the City. JOSHCO is a registered Social Housing Institution and is accredited by the
Social Housing Regulatory Authority (SHRA) as a provider of social housing.
The core business of JOSHCO includes the development of social rental housing; refurbishments,
upgrading and management of Council owned rental housing stock, including hostels; housing
management; the refurbishment, conversion and management of Inner City buildings into social
housing units; and the provision of turnaround strategies where necessary.
Performance highlights
JOSHCO’s performance highlights include:
Delivered 1 159 units in the period under review;
JOSHCO has a total of four inner city buildings that were acquired in the past financial years
which are going through pre-construction planning process;
A total of 5 646 jobs were logged from July 2017 to June 2018 from 7 001 units under
management. All 5 646 jobs were successfully resolved;
A total of 1 370 jobs for EPWP were created through the community development
programme; and
The cleaning project created 1 329 jobs for tenants.
Summary of performance
In 2017/18, JOSHCO delivered 1 159 Units translating to an overachievement of 37 units. Under-
performance on targets for 80 Plein street, Nancefield Station, Selby Villages and Lombardy East
projects, were made up for by the additional units delivered in the Turffontein Project (204 additional
units), Dobsonville Project (190 additional units) and Abel Street (155 units).
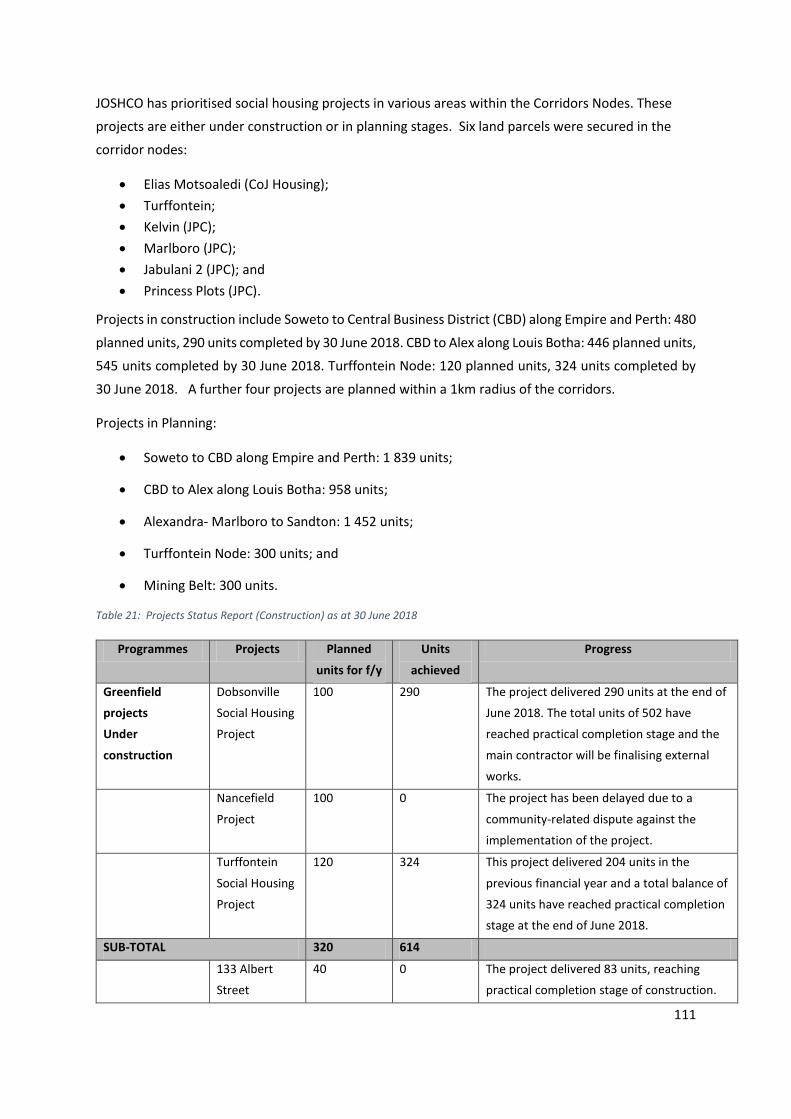
111
JOSHCO has prioritised social housing projects in various areas within the Corridors Nodes. These
projects are either under construction or in planning stages. Six land parcels were secured in the
corridor nodes:
Elias Motsoaledi (CoJ Housing);
Turffontein;
Kelvin (JPC);
Marlboro (JPC);
Jabulani 2 (JPC); and
Princess Plots (JPC).
Projects in construction include Soweto to Central Business District (CBD) along Empire and Perth: 480
planned units, 290 units completed by 30 June 2018. CBD to Alex along Louis Botha: 446 planned units,
545 units completed by 30 June 2018. Turffontein Node: 120 planned units, 324 units completed by
30 June 2018. A further four projects are planned within a 1km radius of the corridors.
Projects in Planning:
Soweto to CBD along Empire and Perth: 1 839 units;
CBD to Alex along Louis Botha: 958 units;
Alexandra- Marlboro to Sandton: 1 452 units;
Turffontein Node: 300 units; and
Mining Belt: 300 units.
Table 21: Projects Status Report (Construction) as at 30 June 2018
Programmes Projects Planned
units for f/y
Units
achieved
Progress
Greenfield
projects
Under
construction
Dobsonville
Social Housing
Project
100 290 The project delivered 290 units at the end of
June 2018. The total units of 502 have
reached practical completion stage and the
main contractor will be finalising external
works.
Nancefield
Project
100 0 The project has been delayed due to a
community-related dispute against the
implementation of the project.
Turffontein
Social Housing
Project
120 324 This project delivered 204 units in the
previous financial year and a total balance of
324 units have reached practical completion
stage at the end of June 2018.
SUB-TOTAL 320 614
133 Albert
Street
40 0 The project delivered 83 units, reaching
practical completion stage of construction.
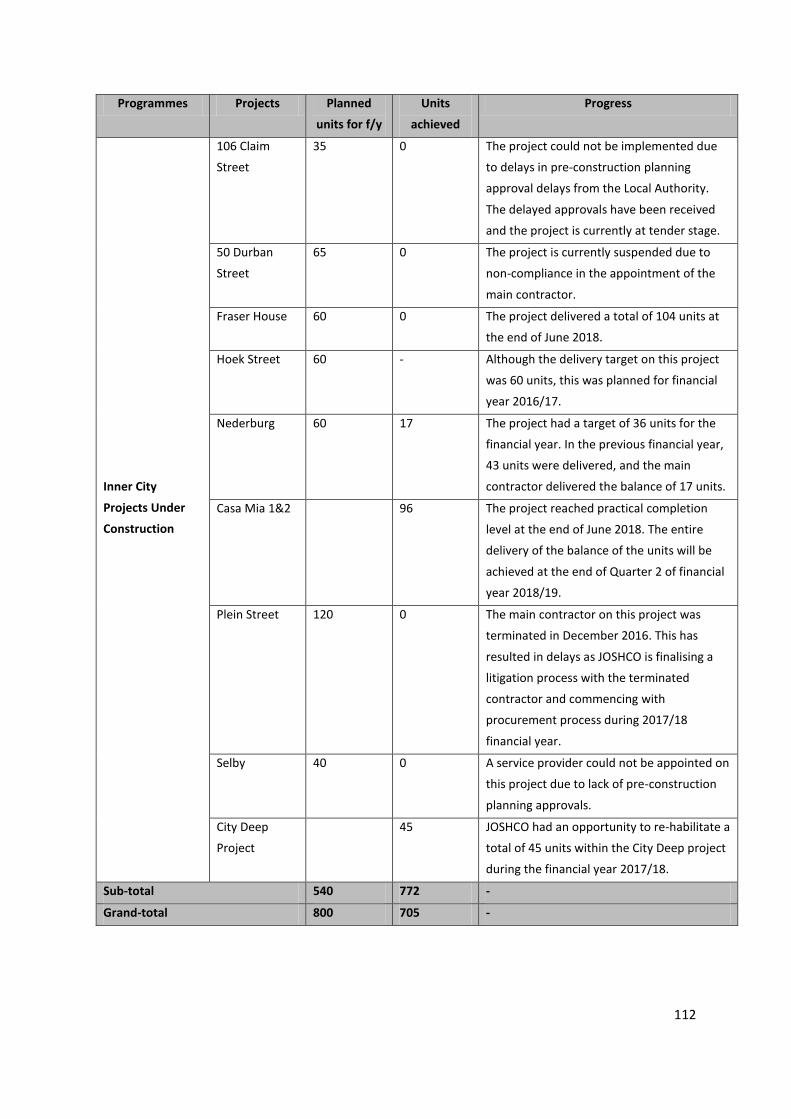
112
Programmes Projects Planned
units for f/y
Units
achieved
Progress
Inner City
Projects Under
Construction
106 Claim
Street
35 0 The project could not be implemented due
to delays in pre-construction planning
approval delays from the Local Authority.
The delayed approvals have been received
and the project is currently at tender stage.
50 Durban
Street
65 0 The project is currently suspended due to
non-compliance in the appointment of the
main contractor.
Fraser House 60 0 The project delivered a total of 104 units at
the end of June 2018.
Hoek Street 60 - Although the delivery target on this project
was 60 units, this was planned for financial
year 2016/17.
Nederburg 60 17 The project had a target of 36 units for the
financial year. In the previous financial year,
43 units were delivered, and the main
contractor delivered the balance of 17 units.
Casa Mia 1&2 96 The project reached practical completion
level at the end of June 2018. The entire
delivery of the balance of the units will be
achieved at the end of Quarter 2 of financial
year 2018/19.
Plein Street 120 0 The main contractor on this project was
terminated in December 2016. This has
resulted in delays as JOSHCO is finalising a
litigation process with the terminated
contractor and commencing with
procurement process during 2017/18
financial year.
Selby 40 0 A service provider could not be appointed on
this project due to lack of pre-construction
planning approvals.
City Deep
Project
45 JOSHCO had an opportunity to re-habilitate a
total of 45 units within the City Deep project
during the financial year 2017/18.
Sub-total 540 772 -
Grand-total 800 705 -
113
Inner City Buildings
JOSHCO has been identified as key role player in contributing towards the transformation of the Inner
City by providing affordable rental housing and transitional emergency accommodation. As at end of
June 2018, JOSHCO has a total of four buildings that were acquired in the past financial years which
are going through a pre-construction planning process in order to be implemented in 2018/19 financial
year.
A budget of R48 million was allocated in this financial year for upgrades at the following 11 projects:
AA House;
Bellavista;
City Deep;
Citrine court;
Jabulani;
Kliptown Golf Course;
La Rosabel;
Kliptown Square;
Rachers; and
Pennyville Rooms.
Upgrades
The upgrade programme is implemented on the basis of Building Conditions Assessments undertaken
on all JOSHCO’s projects currently with tenants. The programme is funded through Capex and this
allows JOSHCO to ensure that the value of the properties is maintained. The programme also
contributes to tenant satisfaction levels. During the 2017/18 Financial Year, R46 million was spent in
Roodepoort, City Deep, Antea, Chelsea, Pennyville and Bothlabela (Alex).
Maintenance
JOSHCO’s maintenance encompasses responsive maintenance and planned maintenance. Responsive
maintenance addresses all logged queries relating to the functionality of the unit occupied by a tenant
whereas planned maintenance is an outcome of JOSHCO’s deliberate assessment of the facility under
management with a view to retain the whole facility (project) in a safe and fully functional state. Due
to cost containment measures during quarter 3 and 4, responsive maintenance was capped at
R500 000 per quarter whilst the rest of planned maintenance was deferred to 2018/19 with the
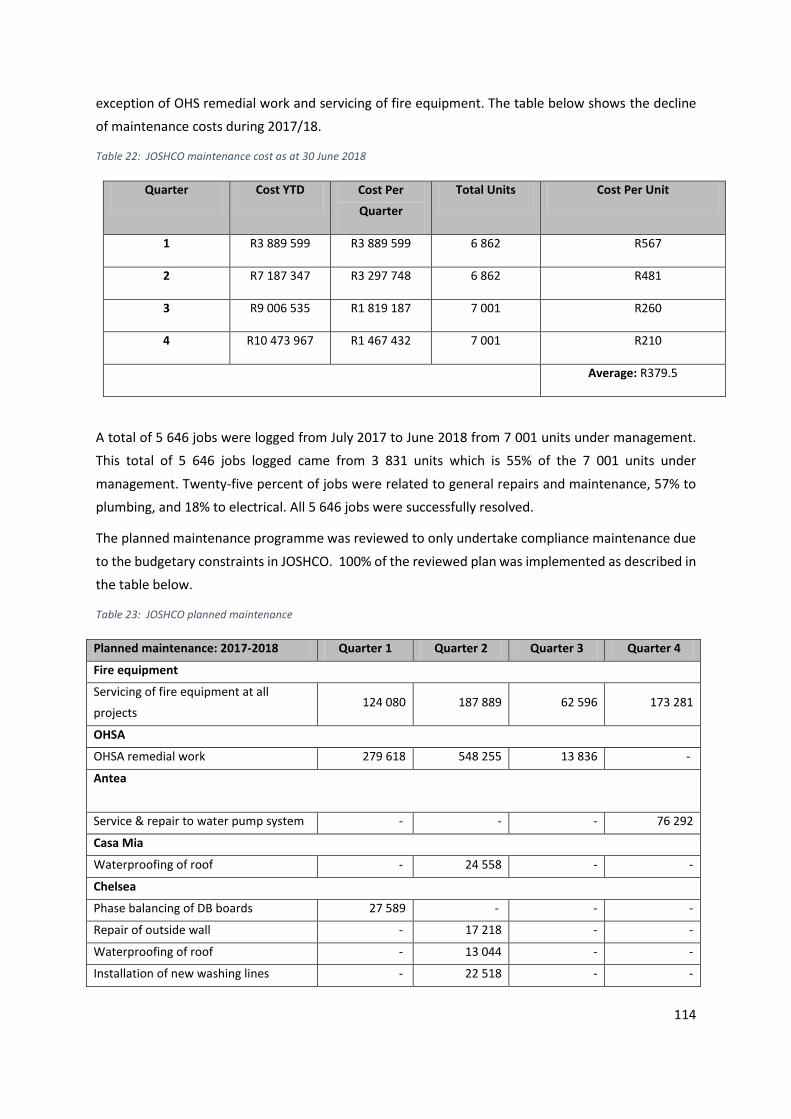
114
exception of OHS remedial work and servicing of fire equipment. The table below shows the decline
of maintenance costs during 2017/18.
Table 22: JOSHCO maintenance cost as at 30 June 2018
Quarter Cost YTD Cost Per
Quarter
Total Units Cost Per Unit
1 R3 889 599 R3 889 599 6 862 R567
2 R7 187 347 R3 297 748 6 862 R481
3 R9 006 535 R1 819 187 7 001 R260
4 R10 473 967 R1 467 432 7 001 R210
Average: R379.5
A total of 5 646 jobs were logged from July 2017 to June 2018 from 7 001 units under management.
This total of 5 646 jobs logged came from 3 831 units which is 55% of the 7 001 units under
management. Twenty-five percent of jobs were related to general repairs and maintenance, 57% to
plumbing, and 18% to electrical. All 5 646 jobs were successfully resolved.
The planned maintenance programme was reviewed to only undertake compliance maintenance due
to the budgetary constraints in JOSHCO. 100% of the reviewed plan was implemented as described in
the table below.
Table 23: JOSHCO planned maintenance
Planned maintenance: 2017-2018 Quarter 1 Quarter 2 Quarter 3 Quarter 4
Fire equipment
Servicing of fire equipment at all
projects 124 080 187 889 62 596 173 281
OHSA
OHSA remedial work 279 618 548 255 13 836 -
Antea
Service & repair to water pump system - - - 76 292
Casa Mia
Waterproofing of roof - 24 558 - -
Chelsea
Phase balancing of DB boards 27 589 - - -
Repair of outside wall - 17 218 - -
Waterproofing of roof - 13 044 - -
Installation of new washing lines - 22 518 - -
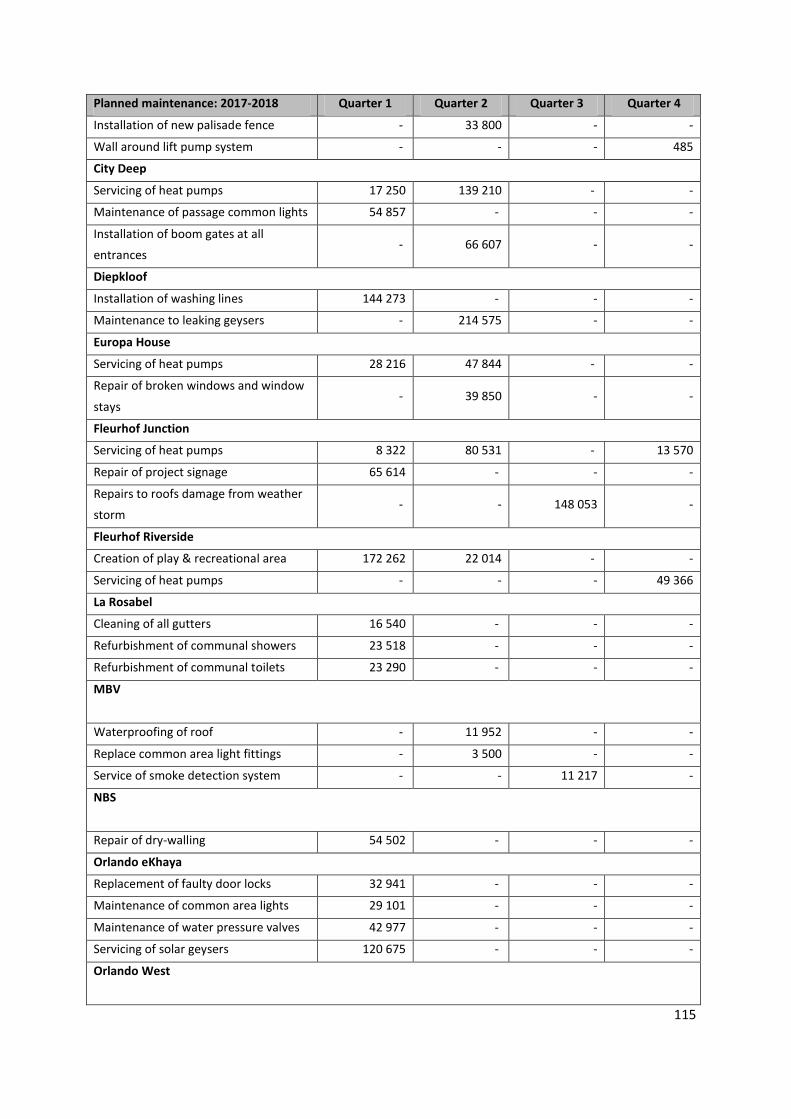
115
Planned maintenance: 2017-2018 Quarter 1 Quarter 2 Quarter 3 Quarter 4
Installation of new palisade fence - 33 800 - -
Wall around lift pump system - - - 485
City Deep
Servicing of heat pumps 17 250 139 210 - -
Maintenance of passage common lights 54 857 - - -
Installation of boom gates at all
entrances - 66 607 - -
Diepkloof
Installation of washing lines 144 273 - - -
Maintenance to leaking geysers - 214 575 - -
Europa House
Servicing of heat pumps 28 216 47 844 - -
Repair of broken windows and window
stays - 39 850 - -
Fleurhof Junction
Servicing of heat pumps 8 322 80 531 - 13 570
Repair of project signage 65 614 - - -
Repairs to roofs damage from weather
storm - - 148 053 -
Fleurhof Riverside
Creation of play & recreational area 172 262 22 014 - -
Servicing of heat pumps - - - 49 366
La Rosabel
Cleaning of all gutters 16 540 - - -
Refurbishment of communal showers 23 518 - - -
Refurbishment of communal toilets 23 290 - - -
MBV
Waterproofing of roof - 11 952 - -
Replace common area light fittings - 3 500 - -
Service of smoke detection system - - 11 217 -
NBS
Repair of dry-walling 54 502 - - -
Orlando eKhaya
Replacement of faulty door locks 32 941 - - -
Maintenance of common area lights 29 101 - - -
Maintenance of water pressure valves 42 977 - - -
Servicing of solar geysers 120 675 - - -
Orlando West
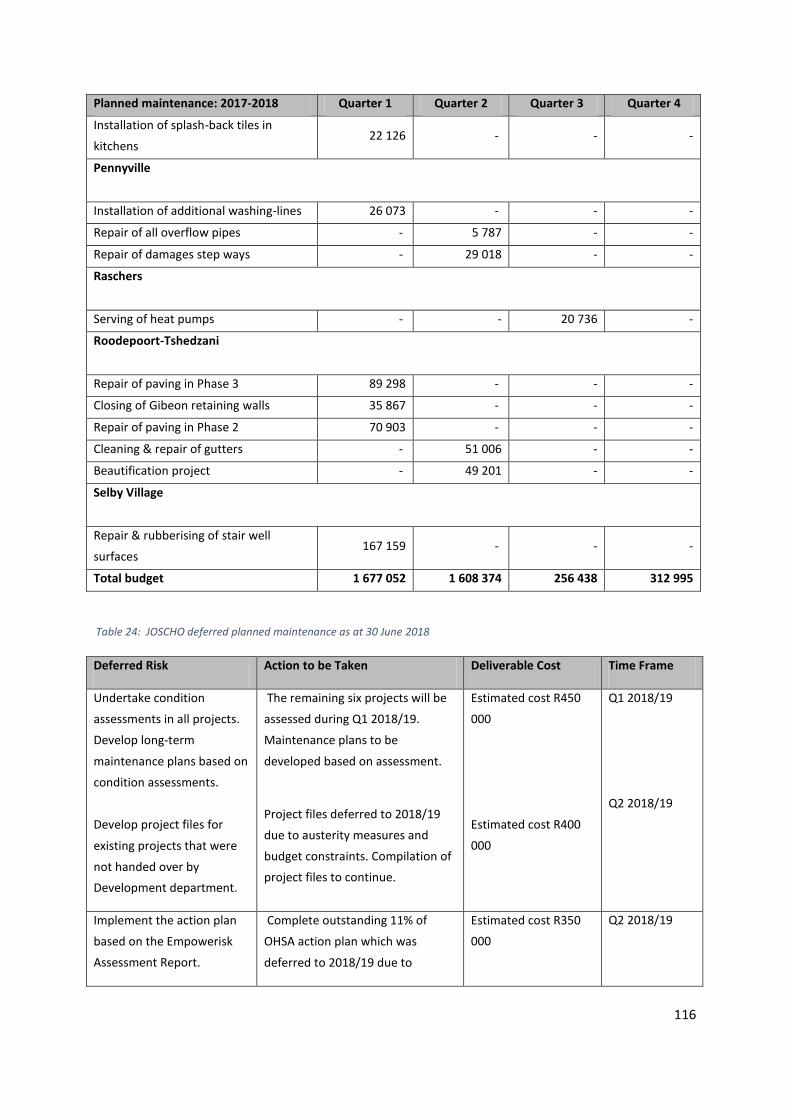
116
Planned maintenance: 2017-2018 Quarter 1 Quarter 2 Quarter 3 Quarter 4
Installation of splash-back tiles in
kitchens 22 126 - - -
Pennyville
Installation of additional washing-lines 26 073 - - -
Repair of all overflow pipes - 5 787 - -
Repair of damages step ways - 29 018 - -
Raschers
Serving of heat pumps - - 20 736 -
Roodepoort-Tshedzani
Repair of paving in Phase 3 89 298 - - -
Closing of Gibeon retaining walls 35 867 - - -
Repair of paving in Phase 2 70 903 - - -
Cleaning & repair of gutters - 51 006 - -
Beautification project - 49 201 - -
Selby Village
Repair & rubberising of stair well
surfaces 167 159 - - -
Total budget 1 677 052 1 608 374 256 438 312 995
Table 24: JOSCHO deferred planned maintenance as at 30 June 2018
Deferred Risk Action to be Taken Deliverable Cost Time Frame
Undertake condition
assessments in all projects.
Develop long-term
maintenance plans based on
condition assessments.
Develop project files for
existing projects that were
not handed over by
Development department.
The remaining six projects will be
assessed during Q1 2018/19.
Maintenance plans to be
developed based on assessment.
Project files deferred to 2018/19
due to austerity measures and
budget constraints. Compilation of
project files to continue.
Estimated cost R450
000
Estimated cost R400
000
Q1 2018/19
Q2 2018/19
Implement the action plan
based on the Empowerisk
Assessment Report.
Complete outstanding 11% of
OHSA action plan which was
deferred to 2018/19 due to
Estimated cost R350
000
Q2 2018/19
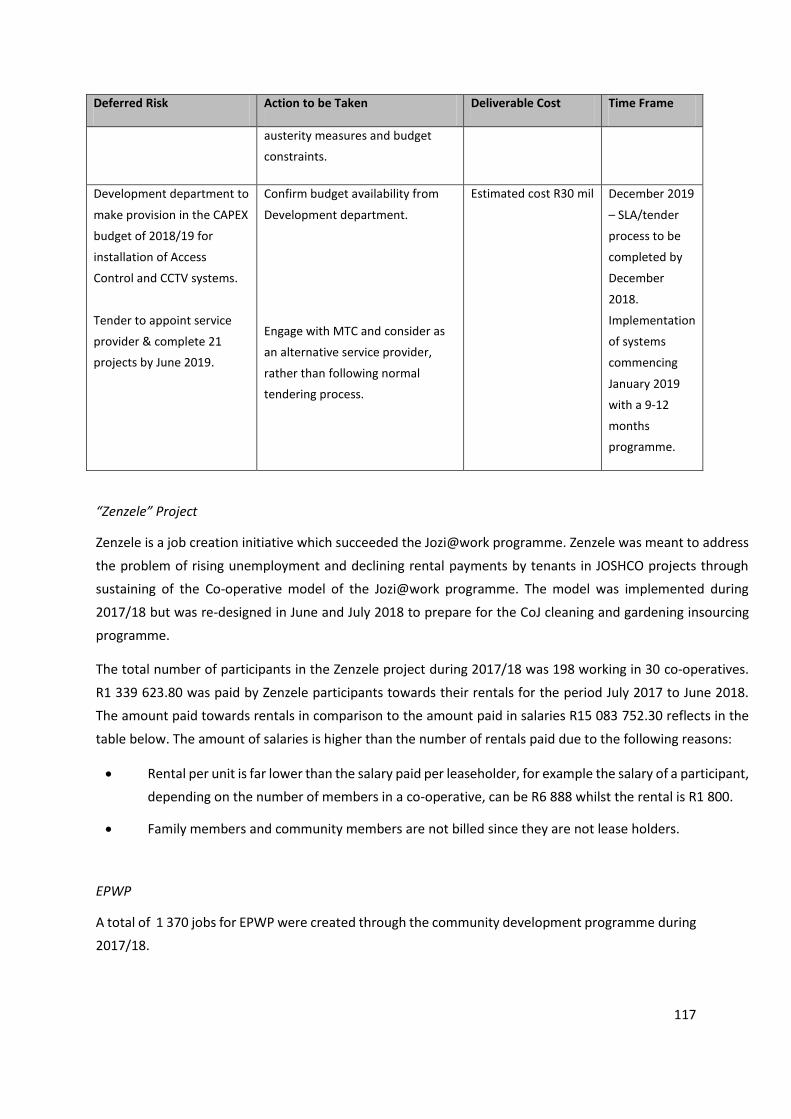
117
Deferred Risk Action to be Taken Deliverable Cost Time Frame
austerity measures and budget
constraints.
Development department to
make provision in the CAPEX
budget of 2018/19 for
installation of Access
Control and CCTV systems.
Tender to appoint service
provider & complete 21
projects by June 2019.
Confirm budget availability from
Development department.
Engage with MTC and consider as
an alternative service provider,
rather than following normal
tendering process.
Estimated cost R30 mil December 2019
– SLA/tender
process to be
completed by
December
2018.
Implementation
of systems
commencing
January 2019
with a 9-12
months
programme.
“Zenzele” Project
Zenzele is a job creation initiative which succeeded the Jozi@work programme. Zenzele was meant to address
the problem of rising unemployment and declining rental payments by tenants in JOSHCO projects through
sustaining of the Co-operative model of the Jozi@work programme. The model was implemented during
2017/18 but was re-designed in June and July 2018 to prepare for the CoJ cleaning and gardening insourcing
programme.
The total number of participants in the Zenzele project during 2017/18 was 198 working in 30 co-operatives.
R1 339 623.80 was paid by Zenzele participants towards their rentals for the period July 2017 to June 2018.
The amount paid towards rentals in comparison to the amount paid in salaries R15 083 752.30 reflects in the
table below. The amount of salaries is higher than the number of rentals paid due to the following reasons:
Rental per unit is far lower than the salary paid per leaseholder, for example the salary of a participant,
depending on the number of members in a co-operative, can be R6 888 whilst the rental is R1 800.
Family members and community members are not billed since they are not lease holders.
EPWP
A total of 1 370 jobs for EPWP were created through the community development programme during
2017/18.
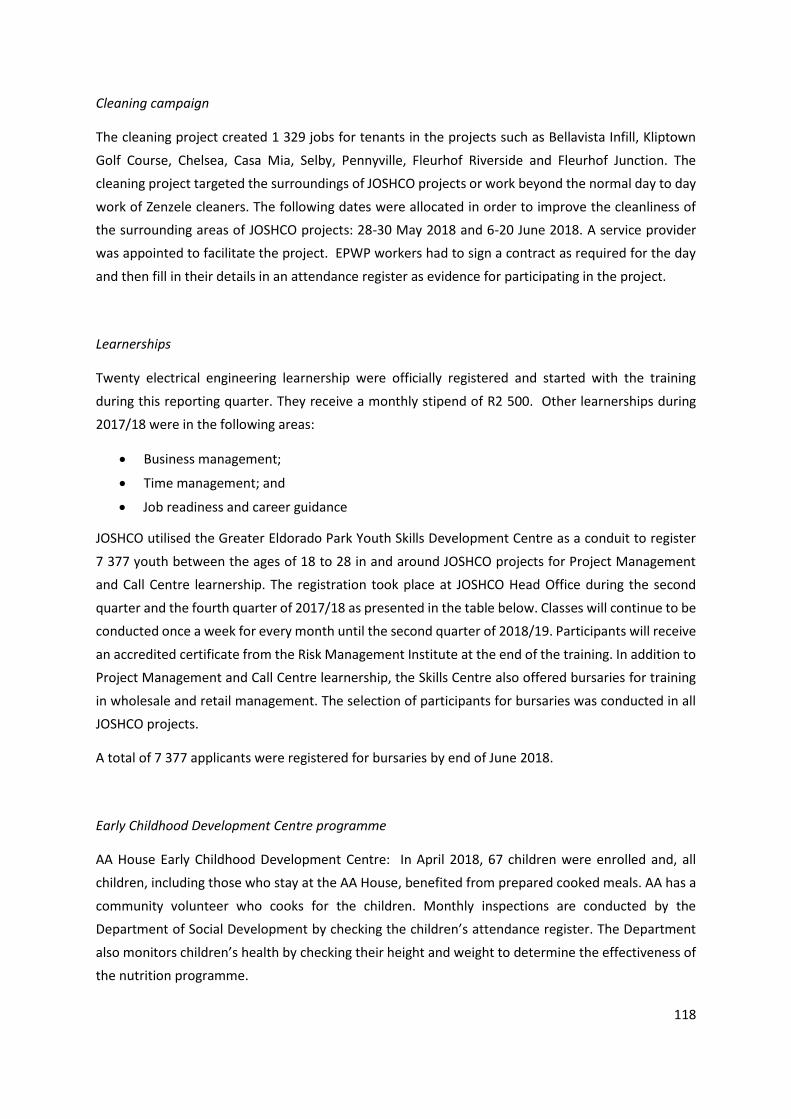
118
Cleaning campaign
The cleaning project created 1 329 jobs for tenants in the projects such as Bellavista Infill, Kliptown
Golf Course, Chelsea, Casa Mia, Selby, Pennyville, Fleurhof Riverside and Fleurhof Junction. The
cleaning project targeted the surroundings of JOSHCO projects or work beyond the normal day to day
work of Zenzele cleaners. The following dates were allocated in order to improve the cleanliness of
the surrounding areas of JOSHCO projects: 28-30 May 2018 and 6-20 June 2018. A service provider
was appointed to facilitate the project. EPWP workers had to sign a contract as required for the day
and then fill in their details in an attendance register as evidence for participating in the project.
Learnerships
Twenty electrical engineering learnership were officially registered and started with the training
during this reporting quarter. They receive a monthly stipend of R2 500. Other learnerships during
2017/18 were in the following areas:
Business management;
Time management; and
Job readiness and career guidance
JOSHCO utilised the Greater Eldorado Park Youth Skills Development Centre as a conduit to register
7 377 youth between the ages of 18 to 28 in and around JOSHCO projects for Project Management
and Call Centre learnership. The registration took place at JOSHCO Head Office during the second
quarter and the fourth quarter of 2017/18 as presented in the table below. Classes will continue to be
conducted once a week for every month until the second quarter of 2018/19. Participants will receive
an accredited certificate from the Risk Management Institute at the end of the training. In addition to
Project Management and Call Centre learnership, the Skills Centre also offered bursaries for training
in wholesale and retail management. The selection of participants for bursaries was conducted in all
JOSHCO projects.
A total of 7 377 applicants were registered for bursaries by end of June 2018.
Early Childhood Development Centre programme
AA House Early Childhood Development Centre: In April 2018, 67 children were enrolled and, all
children, including those who stay at the AA House, benefited from prepared cooked meals. AA has a
community volunteer who cooks for the children. Monthly inspections are conducted by the
Department of Social Development by checking the children’s attendance register. The Department
also monitors children’s health by checking their height and weight to determine the effectiveness of
the nutrition programme.
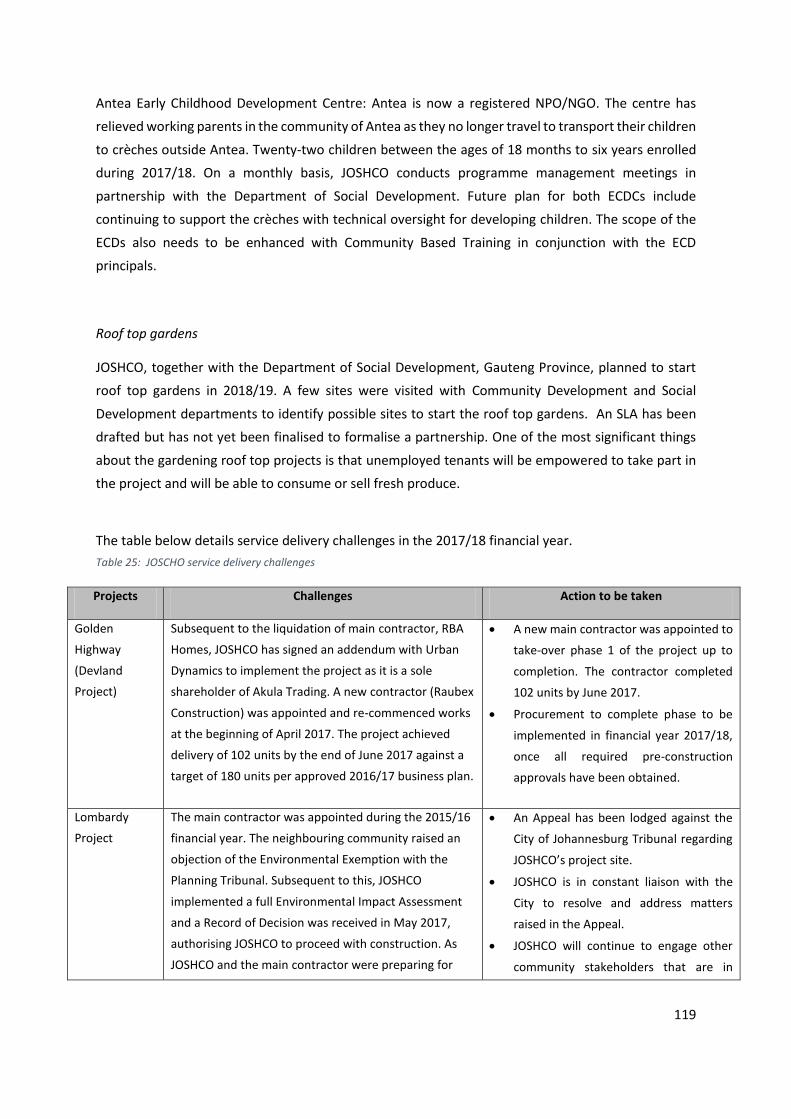
119
Antea Early Childhood Development Centre: Antea is now a registered NPO/NGO. The centre has
relieved working parents in the community of Antea as they no longer travel to transport their children
to crèches outside Antea. Twenty-two children between the ages of 18 months to six years enrolled
during 2017/18. On a monthly basis, JOSHCO conducts programme management meetings in
partnership with the Department of Social Development. Future plan for both ECDCs include
continuing to support the crèches with technical oversight for developing children. The scope of the
ECDs also needs to be enhanced with Community Based Training in conjunction with the ECD
principals.
Roof top gardens
JOSHCO, together with the Department of Social Development, Gauteng Province, planned to start
roof top gardens in 2018/19. A few sites were visited with Community Development and Social
Development departments to identify possible sites to start the roof top gardens. An SLA has been
drafted but has not yet been finalised to formalise a partnership. One of the most significant things
about the gardening roof top projects is that unemployed tenants will be empowered to take part in
the project and will be able to consume or sell fresh produce.
The table below details service delivery challenges in the 2017/18 financial year.
Table 25: JOSCHO service delivery challenges
Projects Challenges Action to be taken
Golden
Highway
(Devland
Project)
Subsequent to the liquidation of main contractor, RBA
Homes, JOSHCO has signed an addendum with Urban
Dynamics to implement the project as it is a sole
shareholder of Akula Trading. A new contractor (Raubex
Construction) was appointed and re-commenced works
at the beginning of April 2017. The project achieved
delivery of 102 units by the end of June 2017 against a
target of 180 units per approved 2016/17 business plan.
A new main contractor was appointed to
take-over phase 1 of the project up to
completion. The contractor completed
102 units by June 2017.
Procurement to complete phase to be
implemented in financial year 2017/18,
once all required pre-construction
approvals have been obtained.
Lombardy
Project
The main contractor was appointed during the 2015/16
financial year. The neighbouring community raised an
objection of the Environmental Exemption with the
Planning Tribunal. Subsequent to this, JOSHCO
implemented a full Environmental Impact Assessment
and a Record of Decision was received in May 2017,
authorising JOSHCO to proceed with construction. As
JOSHCO and the main contractor were preparing for
An Appeal has been lodged against the
City of Johannesburg Tribunal regarding
JOSHCO’s project site.
JOSHCO is in constant liaison with the
City to resolve and address matters
raised in the Appeal.
JOSHCO will continue to engage other
community stakeholders that are in
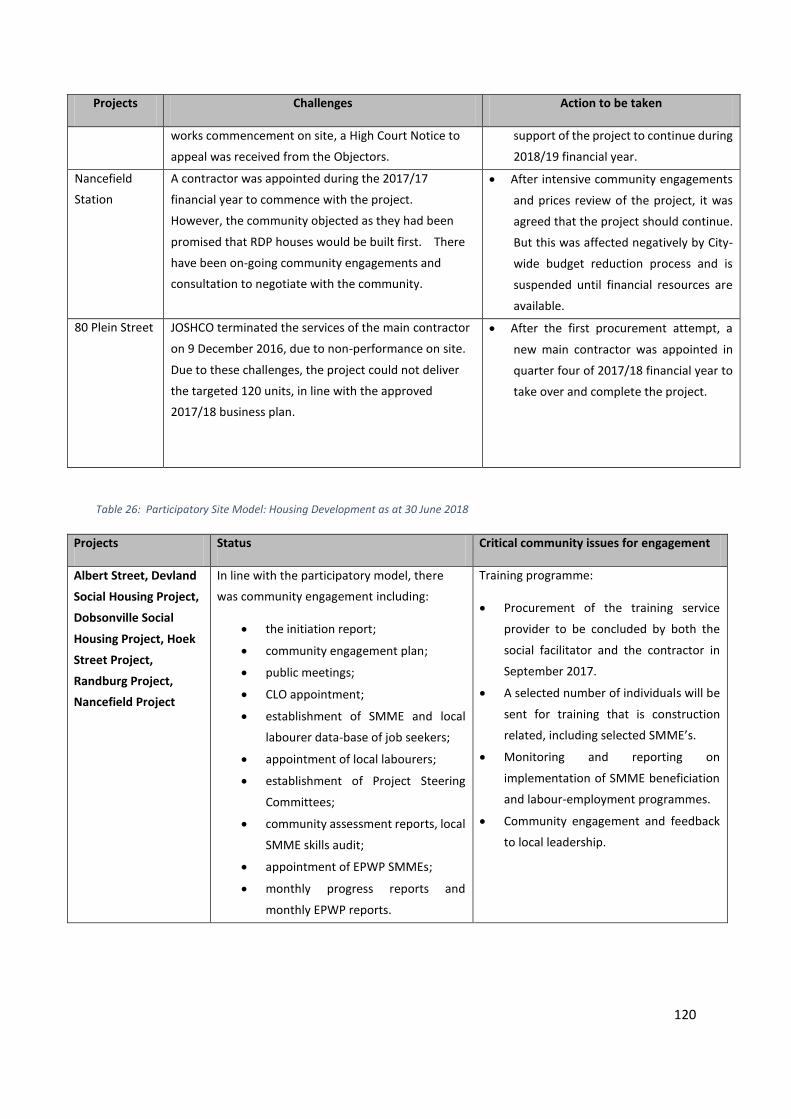
120
Projects Challenges Action to be taken
works commencement on site, a High Court Notice to
appeal was received from the Objectors.
support of the project to continue during
2018/19 financial year.
Nancefield
Station
A contractor was appointed during the 2017/17
financial year to commence with the project.
However, the community objected as they had been
promised that RDP houses would be built first. There
have been on-going community engagements and
consultation to negotiate with the community.
After intensive community engagements
and prices review of the project, it was
agreed that the project should continue.
But this was affected negatively by City-
wide budget reduction process and is
suspended until financial resources are
available.
80 Plein Street JOSHCO terminated the services of the main contractor
on 9 December 2016, due to non-performance on site.
Due to these challenges, the project could not deliver
the targeted 120 units, in line with the approved
2017/18 business plan.
After the first procurement attempt, a
new main contractor was appointed in
quarter four of 2017/18 financial year to
take over and complete the project.
Table 26: Participatory Site Model: Housing Development as at 30 June 2018
Projects Status Critical community issues for engagement
Albert Street, Devland
Social Housing Project,
Dobsonville Social
Housing Project, Hoek
Street Project,
Randburg Project,
Nancefield Project
In line with the participatory model, there
was community engagement including:
the initiation report;
community engagement plan;
public meetings;
CLO appointment;
establishment of SMME and local
labourer data-base of job seekers;
appointment of local labourers;
establishment of Project Steering
Committees;
community assessment reports, local
SMME skills audit;
appointment of EPWP SMMEs;
monthly progress reports and
monthly EPWP reports.
Training programme:
Procurement of the training service
provider to be concluded by both the
social facilitator and the contractor in
September 2017.
A selected number of individuals will be
sent for training that is construction
related, including selected SMME’s.
Monitoring and reporting on
implementation of SMME beneficiation
and labour-employment programmes.
Community engagement and feedback
to local leadership.
121
Performance against IDP targets
Table 27: JOSCHO performance against IDP targets
Key Performance
Indicator/s
Target for the
year
Annual Achievement
Year to date
Achievement in the
quarter
Performance
Assessment Status
Remarks/ Mitigation
Strategic assessment (SDBIP)
Number of social
housing units
developed
1 122
1 159 Target achieved
None
Operational compliance
Internal Audit
Findings Resolution
100%
72%
Target not achieved
The non-achievement is as a
result of additional internal
audit findings which were
raised in the month of June
2018. This reduced the total
number of resolved findings.
Service delivery
Zenzele job creation
project
198
198 Target achieved
None
% achievement of
Service Level
Standards
100%
100%
Target achieved
None
Financial performance
Revenue Collection/
Losses
92%
82%
Target achieved The non-achievement
resulted from
unemployment, and tenants
not making payments on
time.
Capital Expenditure
95%
95%
Target achieved
None
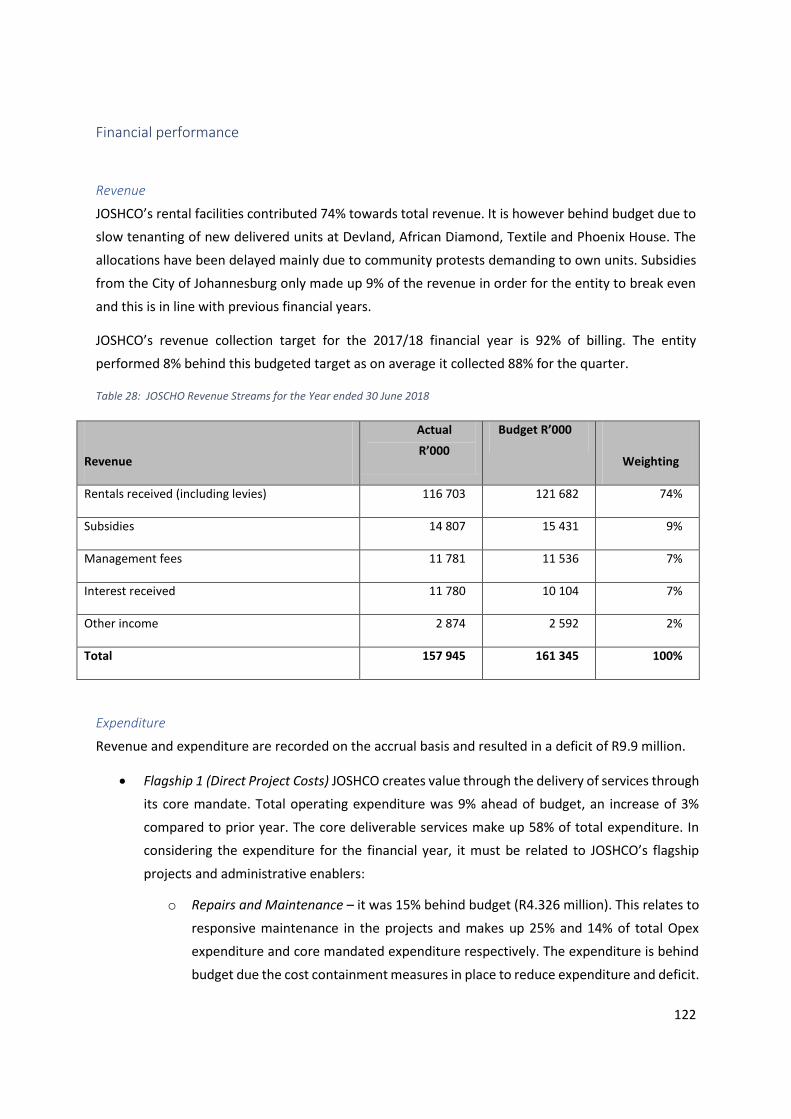
122
Financial performance
Revenue
JOSHCO’s rental facilities contributed 74% towards total revenue. It is however behind budget due to
slow tenanting of new delivered units at Devland, African Diamond, Textile and Phoenix House. The
allocations have been delayed mainly due to community protests demanding to own units. Subsidies
from the City of Johannesburg only made up 9% of the revenue in order for the entity to break even
and this is in line with previous financial years.
JOSHCO’s revenue collection target for the 2017/18 financial year is 92% of billing. The entity
performed 8% behind this budgeted target as on average it collected 88% for the quarter.
Table 28: JOSCHO Revenue Streams for the Year ended 30 June 2018
Revenue
Actual
R’000
Budget R’000
Weighting
Rentals received (including levies) 116 703 121 682 74%
Subsidies 14 807 15 431 9%
Management fees 11 781 11 536 7%
Interest received 11 780 10 104 7%
Other income 2 874 2 592 2%
Total 157 945 161 345 100%
Expenditure
Revenue and expenditure are recorded on the accrual basis and resulted in a deficit of R9.9 million.
Flagship 1 (Direct Project Costs) JOSHCO creates value through the delivery of services through
its core mandate. Total operating expenditure was 9% ahead of budget, an increase of 3%
compared to prior year. The core deliverable services make up 58% of total expenditure. In
considering the expenditure for the financial year, it must be related to JOSHCO’s flagship
projects and administrative enablers:
o Repairs and Maintenance – it was 15% behind budget (R4.326 million). This relates to
responsive maintenance in the projects and makes up 25% and 14% of total Opex
expenditure and core mandated expenditure respectively. The expenditure is behind
budget due the cost containment measures in place to reduce expenditure and deficit.
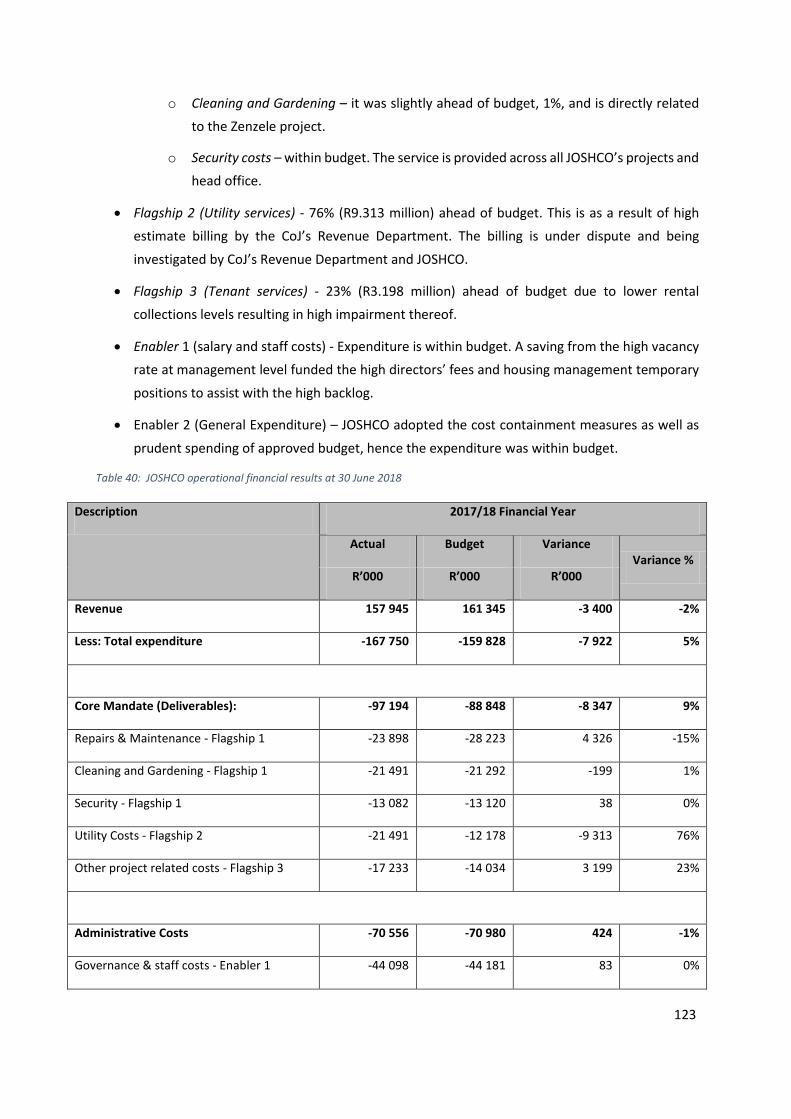
123
o Cleaning and Gardening – it was slightly ahead of budget, 1%, and is directly related
to the Zenzele project.
o Security costs – within budget. The service is provided across all JOSHCO’s projects and
head office.
Flagship 2 (Utility services) - 76% (R9.313 million) ahead of budget. This is as a result of high
estimate billing by the CoJ’s Revenue Department. The billing is under dispute and being
investigated by CoJ’s Revenue Department and JOSHCO.
Flagship 3 (Tenant services) - 23% (R3.198 million) ahead of budget due to lower rental
collections levels resulting in high impairment thereof.
Enabler 1 (salary and staff costs) - Expenditure is within budget. A saving from the high vacancy
rate at management level funded the high directors’ fees and housing management temporary
positions to assist with the high backlog.
Enabler 2 (General Expenditure) – JOSHCO adopted the cost containment measures as well as
prudent spending of approved budget, hence the expenditure was within budget.
Table 40: JOSHCO operational financial results at 30 June 2018
Description 2017/18 Financial Year
Actual Budget Variance Variance %
R’000 R’000 R’000
Revenue 157 945 161 345 -3 400 -2%
Less: Total expenditure -167 750 -159 828 -7 922 5%
Core Mandate (Deliverables): -97 194 -88 848 -8 347 9%
Repairs & Maintenance - Flagship 1 -23 898 -28 223 4 326 -15%
Cleaning and Gardening - Flagship 1 -21 491 -21 292 -199 1%
Security - Flagship 1 -13 082 -13 120 38 0%
Utility Costs - Flagship 2 -21 491 -12 178 -9 313 76%
Other project related costs - Flagship 3 -17 233 -14 034 3 199 23%
Administrative Costs -70 556 -70 980 424 -1%
Governance & staff costs - Enabler 1 -44 098 -44 181 83 0%
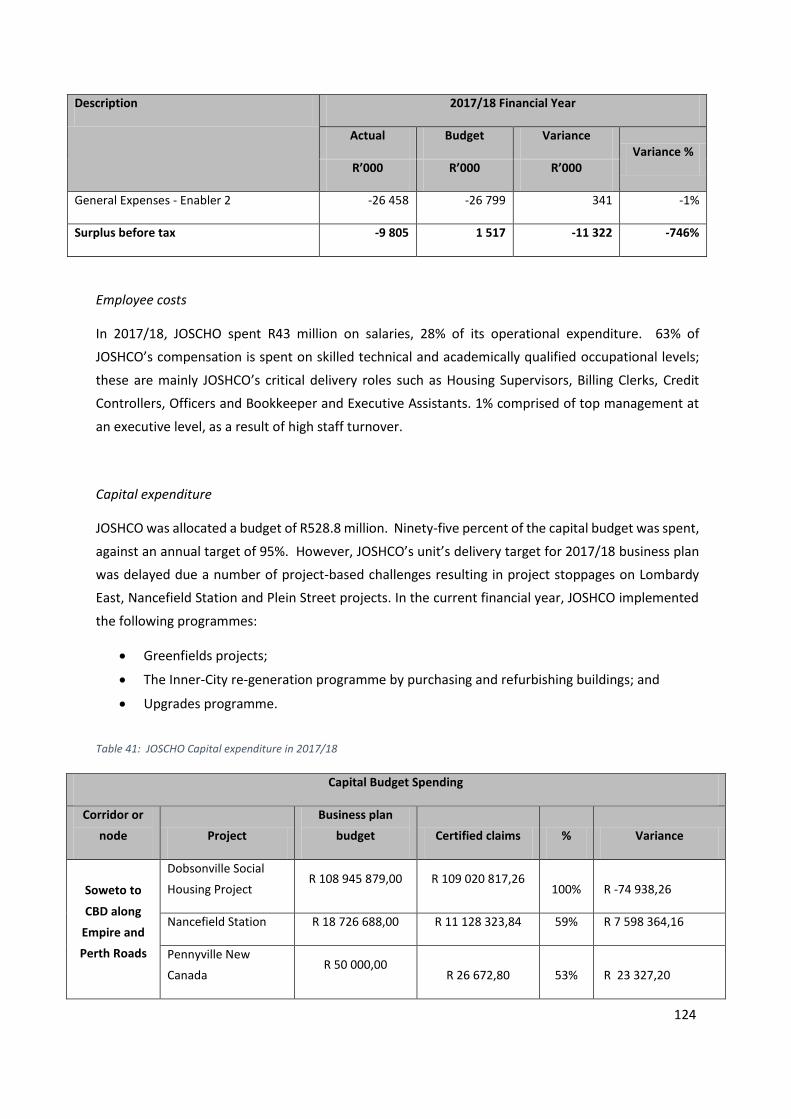
124
Description 2017/18 Financial Year
Actual Budget Variance Variance %
R’000 R’000 R’000
General Expenses - Enabler 2 -26 458 -26 799 341 -1%
Surplus before tax -9 805 1 517 -11 322 -746%
Employee costs
In 2017/18, JOSCHO spent R43 million on salaries, 28% of its operational expenditure. 63% of
JOSHCO’s compensation is spent on skilled technical and academically qualified occupational levels;
these are mainly JOSHCO’s critical delivery roles such as Housing Supervisors, Billing Clerks, Credit
Controllers, Officers and Bookkeeper and Executive Assistants. 1% comprised of top management at
an executive level, as a result of high staff turnover.
Capital expenditure
JOSHCO was allocated a budget of R528.8 million. Ninety-five percent of the capital budget was spent,
against an annual target of 95%. However, JOSHCO’s unit’s delivery target for 2017/18 business plan
was delayed due a number of project-based challenges resulting in project stoppages on Lombardy
East, Nancefield Station and Plein Street projects. In the current financial year, JOSHCO implemented
the following programmes:
Greenfields projects;
The Inner-City re-generation programme by purchasing and refurbishing buildings; and
Upgrades programme.
Table 41: JOSCHO Capital expenditure in 2017/18
Capital Budget Spending
Corridor or
node Project
Business plan
budget Certified claims % Variance
Soweto to
CBD along
Empire and
Perth Roads
Dobsonville Social
Housing Project R 108 945 879,00 R 109 020 817,26
100% R -74 938,26
Nancefield Station R 18 726 688,00 R 11 128 323,84 59% R 7 598 364,16
Pennyville New
Canada R 50 000,00
R 26 672,80 53% R 23 327,20
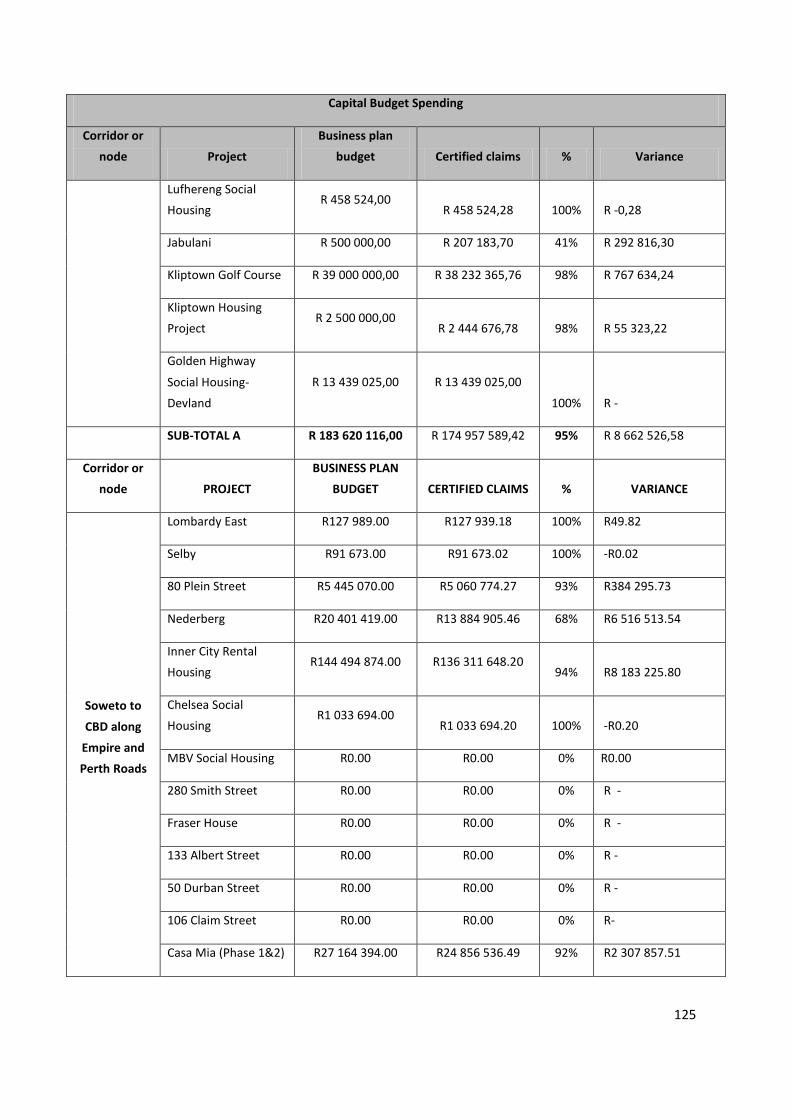
125
Capital Budget Spending
Corridor or
node Project
Business plan
budget Certified claims % Variance
Lufhereng Social
Housing R 458 524,00
R 458 524,28 100% R -0,28
Jabulani R 500 000,00 R 207 183,70 41% R 292 816,30
Kliptown Golf Course R 39 000 000,00 R 38 232 365,76 98% R 767 634,24
Kliptown Housing
Project R 2 500 000,00
R 2 444 676,78 98% R 55 323,22
Golden Highway
Social Housing-
Devland
R 13 439 025,00 R 13 439 025,00
100% R -
SUB-TOTAL A R 183 620 116,00 R 174 957 589,42 95% R 8 662 526,58
Corridor or
node PROJECT
BUSINESS PLAN
BUDGET CERTIFIED CLAIMS % VARIANCE
Soweto to
CBD along
Empire and
Perth Roads
Lombardy East R127 989.00 R127 939.18 100% R49.82
Selby R91 673.00 R91 673.02 100% -R0.02
80 Plein Street R5 445 070.00 R5 060 774.27 93% R384 295.73
Nederberg R20 401 419.00 R13 884 905.46 68% R6 516 513.54
Inner City Rental
Housing R144 494 874.00 R136 311 648.20
94% R8 183 225.80
Chelsea Social
Housing R1 033 694.00
R1 033 694.20 100% -R0.20
MBV Social Housing R0.00 R0.00 0% R0.00
280 Smith Street R0.00 R0.00 0% R -
Fraser House R0.00 R0.00 0% R -
133 Albert Street R0.00 R0.00 0% R -
50 Durban Street R0.00 R0.00 0% R -
106 Claim Street R0.00 R0.00 0% R-
Casa Mia (Phase 1&2) R27 164 394.00 R24 856 536.49 92% R2 307 857.51
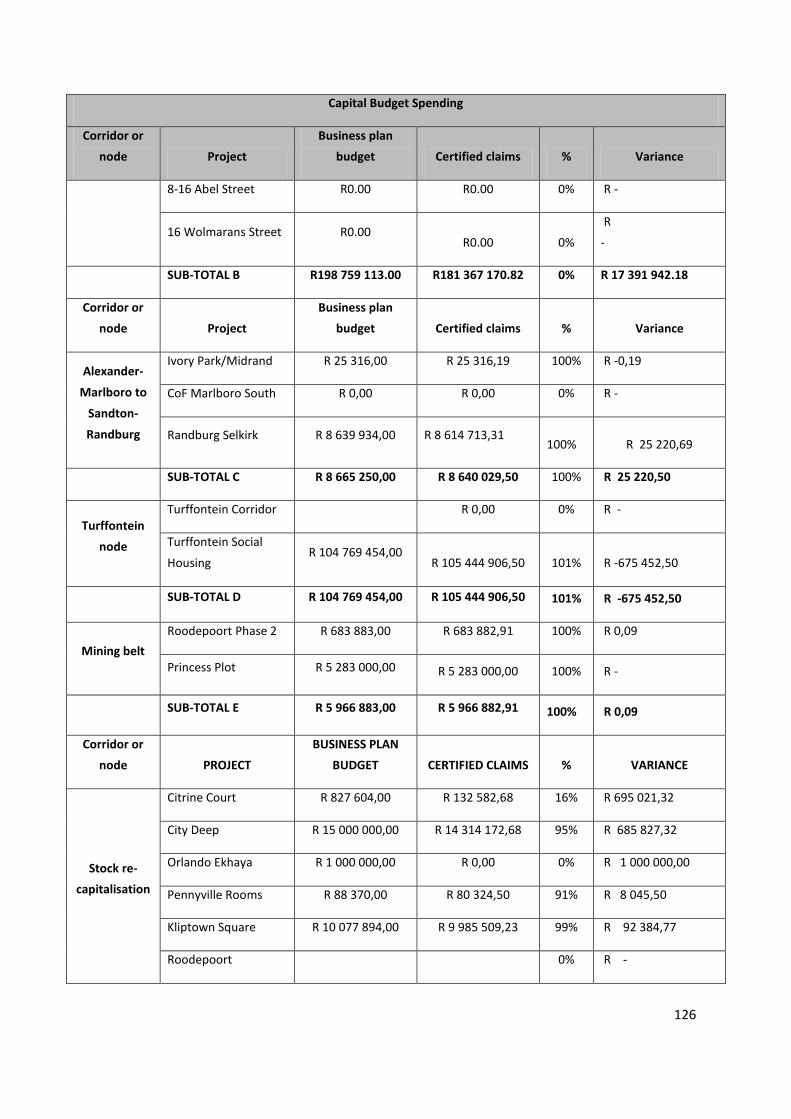
126
Capital Budget Spending
Corridor or
node Project
Business plan
budget Certified claims % Variance
8-16 Abel Street R0.00 R0.00 0% R -
16 Wolmarans Street R0.00 R0.00 0%
R
-
SUB-TOTAL B R198 759 113.00 R181 367 170.82 0% R 17 391 942.18
Corridor or
node Project
Business plan
budget Certified claims % Variance
Alexander-
Marlboro to
Sandton-
Randburg
Ivory Park/Midrand R 25 316,00 R 25 316,19 100% R -0,19
CoF Marlboro South R 0,00 R 0,00 0% R -
Randburg Selkirk R 8 639 934,00 R 8 614 713,31 100% R 25 220,69
SUB-TOTAL C R 8 665 250,00 R 8 640 029,50 100% R 25 220,50
Turffontein
node
Turffontein Corridor R 0,00 0% R -
Turffontein Social
Housing R 104 769 454,00
R 105 444 906,50 101% R -675 452,50
SUB-TOTAL D R 104 769 454,00 R 105 444 906,50 101% R -675 452,50
Mining belt
Roodepoort Phase 2 R 683 883,00 R 683 882,91 100% R 0,09
Princess Plot R 5 283 000,00 R 5 283 000,00 100% R -
SUB-TOTAL E R 5 966 883,00 R 5 966 882,91 100% R 0,09
Corridor or
node PROJECT
BUSINESS PLAN
BUDGET CERTIFIED CLAIMS % VARIANCE
Stock re-
capitalisation
Citrine Court R 827 604,00 R 132 582,68 16% R 695 021,32
City Deep R 15 000 000,00 R 14 314 172,68 95% R 685 827,32
Orlando Ekhaya R 1 000 000,00 R 0,00 0% R 1 000 000,00
Pennyville Rooms R 88 370,00 R 80 324,50 91% R 8 045,50
Kliptown Square R 10 077 894,00 R 9 985 509,23 99% R 92 384,77
Roodepoort 0% R -
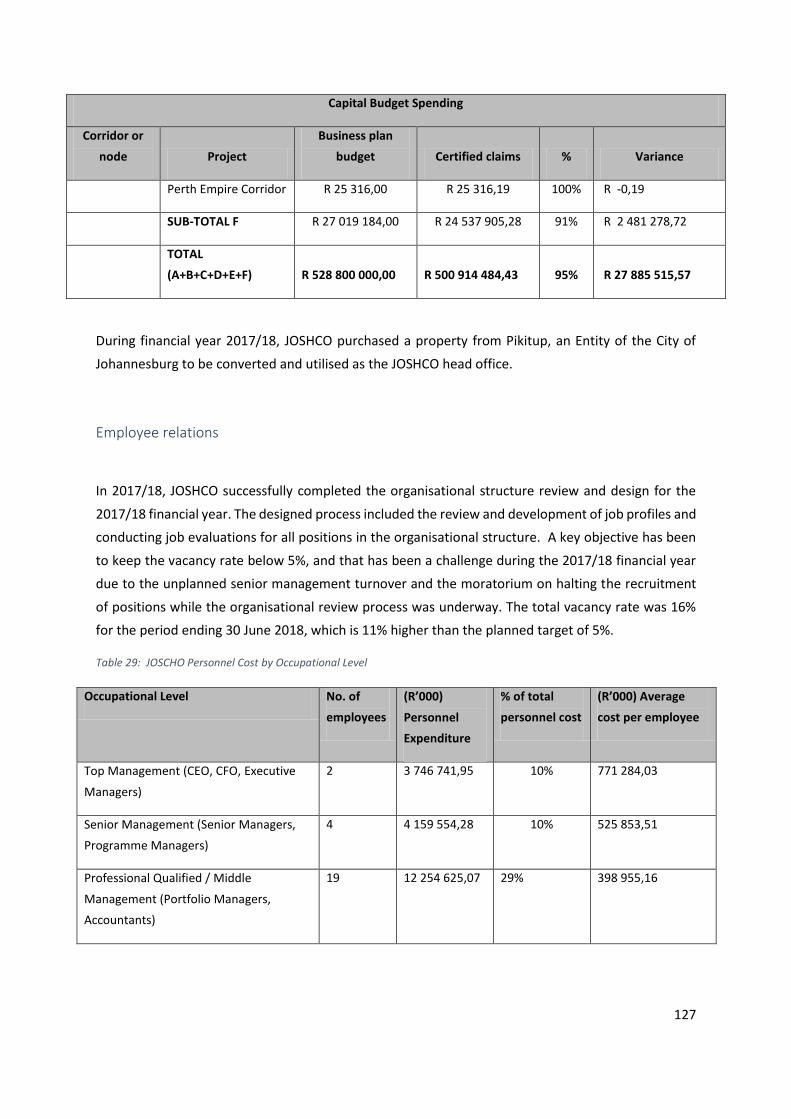
127
Capital Budget Spending
Corridor or
node Project
Business plan
budget Certified claims % Variance
Perth Empire Corridor R 25 316,00 R 25 316,19 100% R -0,19
SUB-TOTAL F R 27 019 184,00 R 24 537 905,28 91% R 2 481 278,72
TOTAL
(A+B+C+D+E+F) R 528 800 000,00 R 500 914 484,43 95% R 27 885 515,57
During financial year 2017/18, JOSHCO purchased a property from Pikitup, an Entity of the City of
Johannesburg to be converted and utilised as the JOSHCO head office.
Employee relations
In 2017/18, JOSHCO successfully completed the organisational structure review and design for the
2017/18 financial year. The designed process included the review and development of job profiles and
conducting job evaluations for all positions in the organisational structure. A key objective has been
to keep the vacancy rate below 5%, and that has been a challenge during the 2017/18 financial year
due to the unplanned senior management turnover and the moratorium on halting the recruitment
of positions while the organisational review process was underway. The total vacancy rate was 16%
for the period ending 30 June 2018, which is 11% higher than the planned target of 5%.
Table 29: JOSCHO Personnel Cost by Occupational Level
Occupational Level No. of
employees
(R’000)
Personnel
Expenditure
% of total
personnel cost
(R’000) Average
cost per employee
Top Management (CEO, CFO, Executive
Managers)
2 3 746 741,95 10% 771 284,03
Senior Management (Senior Managers,
Programme Managers)
4 4 159 554,28 10% 525 853,51
Professional Qualified / Middle
Management (Portfolio Managers,
Accountants)
19 12 254 625,07 29% 398 955,16
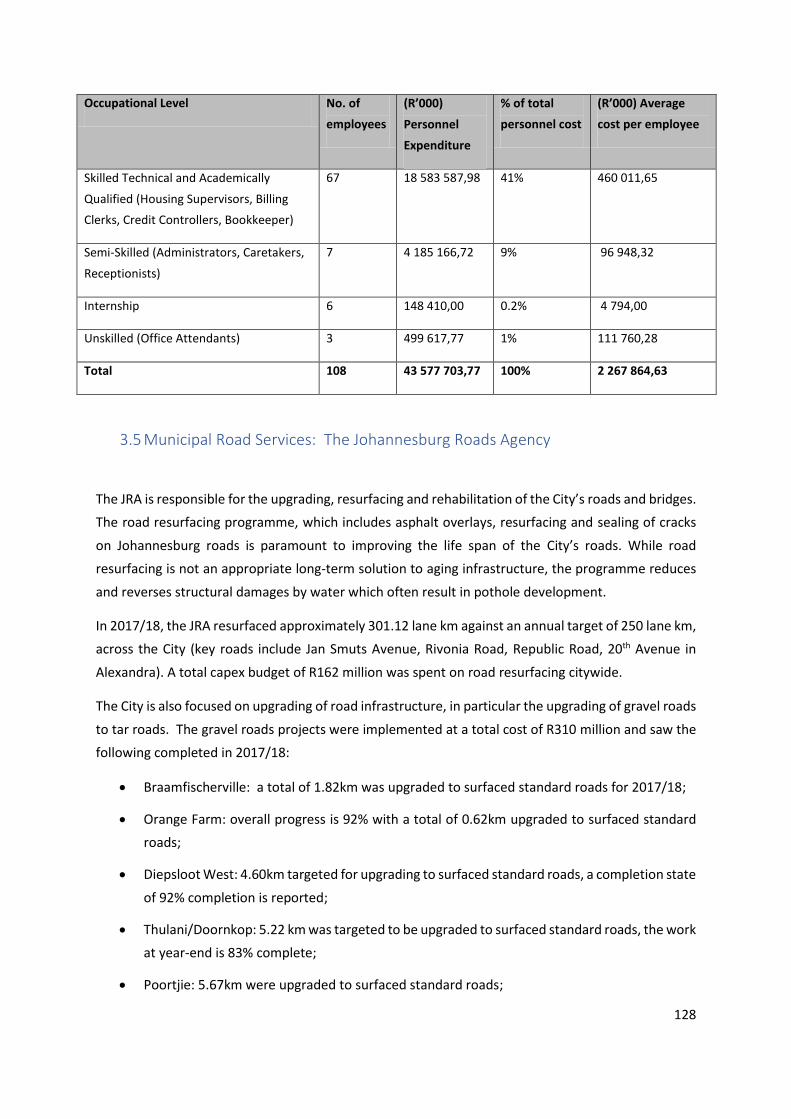
128
Occupational Level No. of
employees
(R’000)
Personnel
Expenditure
% of total
personnel cost
(R’000) Average
cost per employee
Skilled Technical and Academically
Qualified (Housing Supervisors, Billing
Clerks, Credit Controllers, Bookkeeper)
67 18 583 587,98 41% 460 011,65
Semi-Skilled (Administrators, Caretakers,
Receptionists)
7 4 185 166,72 9% 96 948,32
Internship 6 148 410,00 0.2% 4 794,00
Unskilled (Office Attendants) 3 499 617,77 1% 111 760,28
Total 108 43 577 703,77 100% 2 267 864,63
3.5 Municipal Road Services: The Johannesburg Roads Agency
The JRA is responsible for the upgrading, resurfacing and rehabilitation of the City’s roads and bridges.
The road resurfacing programme, which includes asphalt overlays, resurfacing and sealing of cracks
on Johannesburg roads is paramount to improving the life span of the City’s roads. While road
resurfacing is not an appropriate long-term solution to aging infrastructure, the programme reduces
and reverses structural damages by water which often result in pothole development.
In 2017/18, the JRA resurfaced approximately 301.12 lane km against an annual target of 250 lane km,
across the City (key roads include Jan Smuts Avenue, Rivonia Road, Republic Road, 20th Avenue in
Alexandra). A total capex budget of R162 million was spent on road resurfacing citywide.
The City is also focused on upgrading of road infrastructure, in particular the upgrading of gravel roads
to tar roads. The gravel roads projects were implemented at a total cost of R310 million and saw the
following completed in 2017/18:
Braamfischerville: a total of 1.82km was upgraded to surfaced standard roads for 2017/18;
Orange Farm: overall progress is 92% with a total of 0.62km upgraded to surfaced standard
roads;
Diepsloot West: 4.60km targeted for upgrading to surfaced standard roads, a completion state
of 92% completion is reported;
Thulani/Doornkop: 5.22 km was targeted to be upgraded to surfaced standard roads, the work
at year-end is 83% complete;
Poortjie: 5.67km were upgraded to surfaced standard roads;
129
Kaalfontein: 3.26km were targeted to be upgraded to surfaced standard roads, the overall
progress is 94% complete;
Lawley: 1.36 km of road was upgraded;
Ivory Park: Construction progress is at 65%;
Protea South: 0.55 km was completed;
Tshepisong: 1.57 km of road was surfaced and is 93% complete;
Mayibuye: 0.83 km of road was upgraded;
Slovoville: 0.25km of road was upgraded; and
Driezek: 5.05km of road was upgraded.
Performance highlights
Some of the key milestones achieved in the 2017/18 financial year include:
The Company contributed to institutional performance by meeting its targets for roads resurfacing
(301.12km) and roads upgrading (31.34km) contained on the City’s Institutional Service Delivery
Budget Implementation Plan (SDBIP);
The Company spent 97.40% of its total capital budget against a target of 95.00%;
The Company spent its allocated grant funds on providing basic infrastructure;
92.27% achievement against the target of 90.00% on resolving all reported traffic faults on traffic
signals;
61 intersections had their traffic signal timings revised, thus improving mobility and reducing
congestion;
278 signal timings updated, 78 more than the target;
430 road safety investigations completed, 130 more than the annual target;
227 intersections re-cabling completed, 27 more than the annual target;
All 116 petitions have been responded to with reports and investigations completed; and
Completion of the new asphalt plant to support pro-active maintenance and resurfacing
programmes.
130
Summary of performance
In 2017/18, the JRA identified six core areas to drive interventions. These are as follows:
City Institutional SDBIP programmes (roads infrastructure; road resurfacing; gravel roads to
surfaced roads; and storm water infrastructure; conversion of open storm water channels to
underground systems);
JRA Strategic SDBIP (Customer Charter, bridges management, and storm water management);
Internal Processes Expanded Public Works Programme (EPWP and Small, Medium and Micro
Enterprises (SMMEs);
Finance Management (operating expenditure, capital expenditure and Broad Based Black
Economic Empowerment (BBBEE) expenditure); and
Governance (audit processes, internal and external audit performance, risk management
compliance and occupational health and safety).
Beyond the core areas, as part of its day-to-day operations, the JRA also implements the Intelligent
Transport Systems (ITS) Project that contributes to traffic signal management and the management
of traffic signal downtime.
Road Infrastructure resurfacing, upgrading of gravel roads and storm water management
The JRA is focused on upgrading, resurfacing and rehabilitation of both the City’s roads and bridges. It
also focused on improving both vehicular and pedestrian mobility through design and construction of
new bridges, traffic calming measures, non-motorised transit (NMT) infrastructure and existing
intersection improvements (congestion alleviation).
The road resurfacing programme, which includes asphalt overlays, resurfacing and sealing of cracks
on Johannesburg roads is paramount to improving the life span of the City’s roads. While road
resurfacing is not an appropriate long-term solution to aging infrastructure, the programme reduces
and reverses structural damages by water which often result in pothole development. Over the years,
this programme has improved movement of traffic and pedestrians flow and reduced the risk of
vehicles being damaged by potholes and other road defects. As of the end of this financial year the
JRA resurfaced approximately 301,12 lane km against an annual target of 250 lane km, across the City
(key roads include Jan Smuts Avenue, Rivonia Road, Republic Road, 20th Avenue in Alexandra). A total
capex budget of R162 million was spent on road resurfacing Citywide.
Aligned with the City’s pro-poor development the JRA focused on the upgrading of road infrastructure,
in particular the upgrading of gravel roads into tar roads mostly in Regions A, D, G and C across the
following townships in CoJ: Ivory Park, Diepsloot, Braamfischerville, Orange Farm, Driezek,
131
Tshepisong, Doornkoop, Lawley, Slovoville, Kaalfontein and Thulani, Kaalfontein, Mayibuye,
Doornkop/Thulani (I), Doornkop/Thulani (Ii), Slovoville (Phase 1), Tshepisong (Ii), Drieziek Ext 1, 6, 7,
8, Poortjie (1a), Poortjie (1b), Diepsloot, Ivory Park, Lawley, Protea South, Orange Farm and
Braamfischerville. The gravel roads projects were implemented at a total cost of R310 million.
In Braamfischerville, a total of 1.82km was upgraded to surfaced standard roads for 2017/18 and in
Orange Farm, overall progress at year-end is 92% with the total of 0.62km upgraded to surfaced
standard roads. In Diepsloot West, 4.60km targeted for upgrading to surfaced standard roads, a
completion state of 92% completion is reported. In Thulani/Doornkop 5.22 km was targeted to be
upgraded to surfaced standard roads, the work at year-end is 83% complete. In Poortjie 5.67km were
upgraded to surfaced standard roads and in Kaalfontein, 3.26km were targeted to be upgraded to
surfaced standard roads, the overall progress is 94% complete. In Lawley, 1.36 km of road was
upgraded while Ivory Park Construction progress is at 65%. In Protea South 0.55 km was completed
and in Tshepisong 1.57 km of road was surfaced and is 93% complete. In Mayibuye, 0.83 km of road
was upgraded while in Slovoville and Driezek, 0.25km and 5.05km of road respectively was upgraded.
The JRA also embarked on several traffic congestion alleviation projects, such as the M2 West at its
intersection with Main Reef Road and the section of Main Reef Road between Treu Road and
Production Road which have been successfully completed and opened to traffic. The emergency
rehabilitation work on the M1 Double Decker Bridge is at an advanced construction stage and is
planned for completion in April 2019. The scope of work on the M1 Double Decker entails storm water
drainage upgrades and structural repairs to Gauteng Freeway Improvement Programme (GFIP)
Standards. The road rehabilitation and upgrading along Oxford Road, Bowling Drive, Vicky Road and
Graystone Drive are currently underway and are planned for completion during the 2018/19 financial
year.
In relation to storm water management and the conversion of open storm water channels to
underground systems, the JRA converted open drains to underground in areas that include
Braamfischerville measuring 0.918km, Ivory Park measuring 1.026km and Orange Farm measuring,
0.937 km.
Overall, the JRA’s CAPEX implementation programme created a cumulative total of 1 494 jobs against
an annual target of 1 250 and employed 89 local emerging contractors against an annual target of 80.
The JRA in future will look to establish complementary financing mechanisms for road maintenance,
to supplement inadequate resources.
Customer Charter
This programme involves the performance of the Company against set service standards. The JRA has
a City approved set of service standards that allow residents to know what level of service to expect
from the Company as well as the quality of that service. These service standards are benchmarked and
132
reviewed regularly in line with the operating environment. The service standards are also a trust
building mechanism between the company and the public it serves. Currently, the JRA’s service
standards cover, among others, pothole repairs, repairs and maintenance of road trenches,
replacement of manhole covers, and repairs/replacement of traffic lights among others.
While the JRA has experienced improvement in some service standards such as repairs of traffic signal
faults and the reduction of traffic signal downtime, the overall condition of the road infrastructure
continues to increase the amount of service requests made to the company. The company is improving
system connectivity to better account for the performance against service requests and will continue
working towards improved performance in meeting or exceeding the expectations of our residents by
working consistently to surpass these standards.
Bridges Management
The JRA also runs a roads and bridges management and maintenance programme that has the
potential to stimulate economic growth through improved road infrastructure and enhanced roads
sector management. Johannesburg is often confronted by the need for emergency related works,
caused by flooding and heavy rains which affect road infrastructure. The JRA undertakes proactive
maintenance on overtopping bridges and other infrastructure to reduce the effect of these disasters.
Rehabilitation designs for Bridge Road, Froom Street Bridge, Marshall Street Bridge, Platina Bridge,
Modderfontein Bridge, Joe Nhlanhla Bridge and 3rd Road Bridge were completed and planned for
implementation during the coming financial years (2018/19, 2019/20 and 2020/21). In addition, the
construction of four new pedestrian bridges, with the aim of improving pedestrian safety and mobility
are underway at Kaalfontein Bridge, Diepsloot Bridge, Klipspruit Bridge and Slovoville Bridge.
Several detailed designs for new road upgrades, reconstruction and rehabilitation to be implemented
during the 2018/19 financial year have been completed. These include Outspan Road, James Street,
Spencer Road, Ballyclare, Jan Smuts Drive and Crownwood Road. A total capex budget of R52 million
has been spent on road rehabilitation and construction, R156 million on bridge rehabilitation and
R10 million on new bridges.
In 2017/18, the company created 1 494 EPWP work opportunities through its capital projects. The
JRA, in line with the City’s imperatives, is committed to prioritising entrepreneurship and the
advancement of SMMEs as a catalyst to achieving economic growth and development. To this end, a
significant expenditure from the JRA primarily for capital projects is targeted for spending through
SMMEs. In 2017/18, the company spent 96.74% of its total procurement of goods and services from
entities classified as BBBEEE compliant. The company also appointed 89 SMMEs during the period
under review.
133
Given the state of road infrastructure and the immense pressure to continuously improve the quality
of road infrastructure, the JRA has experienced some service delivery challenges in the 2017/18
financial year. These challenges include the following:
Significant (over R1 billion) but inadequate budget to meet service delivery requests optimally;
High number of thefts on the Uninterrupted Power Supply (UPS) leading to increase on downtime
of traffic signals;
Some delays in roads upgrade due to relocation of existing services;
Recurrent network challenges leading to system down time affecting performance in areas such
as pothole repair; and
Management of interdependencies with other entities.
Financial performance
Revenue
The major contributing factor for the surplus in the financial year is due to the additional revenue for
the financial year, namely the developer’s contribution, which are paid to JRA from the City Planning
Department in respect of developers’ payments to the City for the use of Infrastructure, Jobbings for
work done for third parties in relation to construction of parking spaces, foot ways and similar
activities on an ad hoc basis.
During the year, the company experienced an increased demand for jobbings as well as
reinstatements income above the budgeted amount due to increased demand of reinstating sidewalks
etc during the year. The nature of work performed by JRA is driven by third party requests.
The increase in income is 5.3% over budget, and Developers Income is R28.1 million, Reinstatements
R9.4 million as well as Jobbings of R18.8 million over budget which compensates for the other below
budget income items such as Asphalt Sales.
Expenditure
The operating expenditure for the financial year was R1.263 million (0.1%) over the budget. The
employee costs for the financial year were over budget by R1.1 million due to the implementation of
the parity exercise in the fourth quarter as well as appointments being made.
In the context of necessary expenditure, management has drastically reduced all nonessential
expenditure including expenditure for functions, travel and participation in events. Level 1 and 2
contractors were also appointed in the fourth quarter and this contributed to increased expenditure
over the last three months of the financial year.
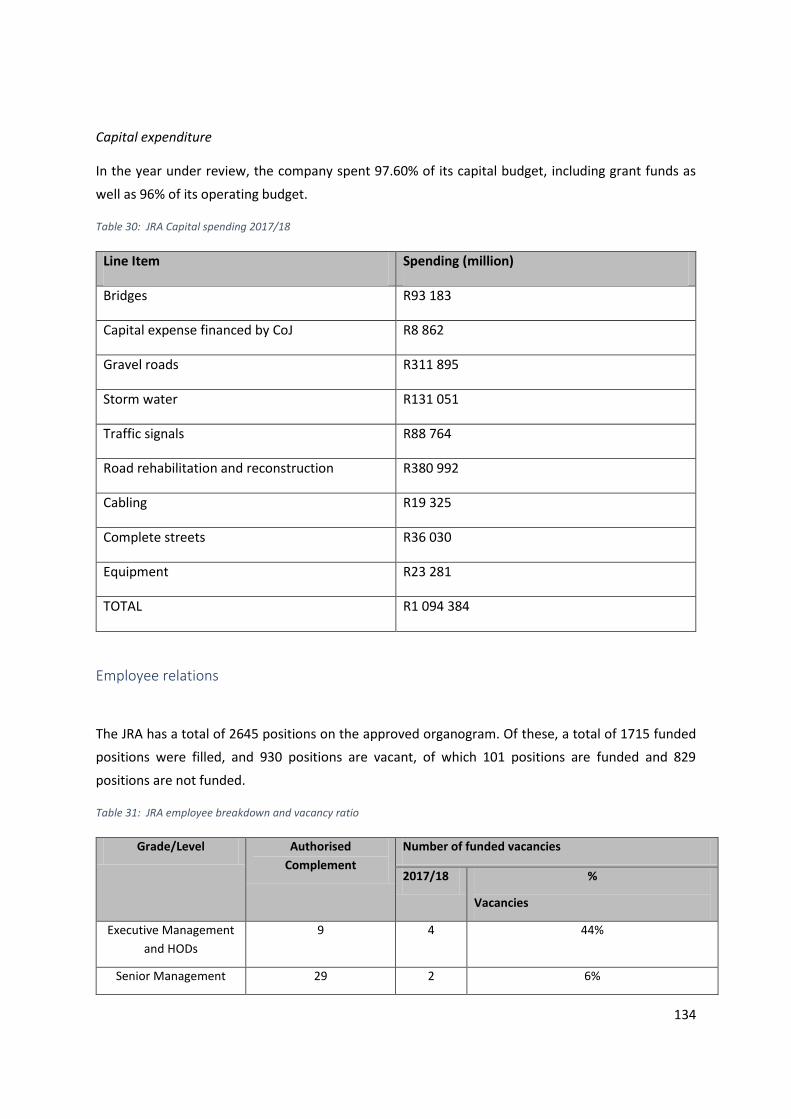
134
Capital expenditure
In the year under review, the company spent 97.60% of its capital budget, including grant funds as
well as 96% of its operating budget.
Table 30: JRA Capital spending 2017/18
Line Item Spending (million)
Bridges R93 183
Capital expense financed by CoJ R8 862
Gravel roads R311 895
Storm water R131 051
Traffic signals R88 764
Road rehabilitation and reconstruction R380 992
Cabling R19 325
Complete streets R36 030
Equipment R23 281
TOTAL R1 094 384
Employee relations
The JRA has a total of 2645 positions on the approved organogram. Of these, a total of 1715 funded
positions were filled, and 930 positions are vacant, of which 101 positions are funded and 829
positions are not funded.
Table 31: JRA employee breakdown and vacancy ratio
Grade/Level Authorised
Complement
Number of funded vacancies
2017/18 %
Vacancies
Executive Management
and HODs
9 4 44%
Senior Management 29 2 6%

135
Grade/Level Authorised
Complement
Number of funded vacancies
2017/18 %
Vacancies
Professionally qualified
and experienced
specialists and mid-
management
104 11 10.5%
Skilled technical and
academically qualified
workers, junior
management,
supervisors, foreman
and superintendents
211 18 8.53%
Semi-skilled and
discretionary decision
making
867 18 8.53%
Unskilled and defined
decision making
1425 48 2.07%
TOTAL 2645 101 3.81%
3.6 Economic Services: The Johannesburg Development Agency
The mandate of JDA is to implement area-based development and regeneration projects. There are
three core development tasks crucial to the fulfilment of this mission:
The JDA plans;
The JDA facilitates development; and
The JDA constructs.
Performance highlights
Performance highlights from the 2017/18 financial year include:
Obtaining a Clean Audit Opinion from the Auditor-General for the 2016/17 year;
136
The time and effort by the Development Facilitation Unit resulting in greater coordination
across City departments and entities and private sector interests in and around the JDA’s
developments in both the Inner City and along the TOD Development Corridors;
Greater stakeholder engagements, through co-creation initiatives in Our City, Our Block and
My Melville initiatives. The JDA’s place-making projects such as #Joziwalks and #ArtMyJozi
have played a meaningful role in shaping the outcomes and greater community custodianship
of future developments.
Most of the NMT projects are being implemented by small construction companies, which
mean that the large-scale infrastructure spending is also benefiting local businesses and
creating local job opportunities.
Summary of performance
The JDA contributes to the Expanded Public Works Programme, a national programme aimed at
providing poverty and income relief through temporary work for the unemployed. However, in the
2017/18 the financial year, the JDA experienced a challenge with EPWP work opportunities being
reported on the EPWP database that were not always supported by reliable supporting evidence, such
as identity documents, attendance registers and proof of payments. This resulted in the JDA having to
reconcile the number of EPWP work opportunities reported with supporting evidence. In the year
under review, 1 645 EPWP work opportunities were reported, although evidence for 805 of these was
reconciled.
In 2017/18 the JDA completed eight pre-feasibility plans. These include a detailed block plan for the
Alexandra UDF, inner city eastern gateway development strategies, Orange Grove infill strategies, a
regeneration renewal precinct plan for the Roodepoort CBD, priority project concept plans for Orange
Farm, a public art programme, the Ghandi Square UDF and the Melville Precinct Plan. Six area-based
partnerships were formalised including the Gandhi Square East partnership, UN Habitat, a Community
Based Forum for the Noordgesig Library, CID for a corridor node (Yeoville) or inner city, NASCHO /
SHRA – SMART Agreement, and Inner City Partnership Fund “My City My Block .
There are nine projects at concept design phase including, amongst others, the Alexandra Sports and
Youth Development centre, fire station and 'Be Safe Centre', Inner City regeneration, Jukskei River
Environmental Upgrading and Rehabilitation Renewal Bulk Infrastructure, and a Klipfontein wellness
centre. A further five projects are at a detailed design phase.
Ten contracts have been awarded including a number of traffic impacts assessment projects, storm
water masterplans and new construction for the Corridor of Freedom. Twelve projects are at a
practical completion stage. Highlights include the Great Walk pedestrian bridge and sidewalk, the
construction of new sports centres, and the Hillbrow Tower precinct.
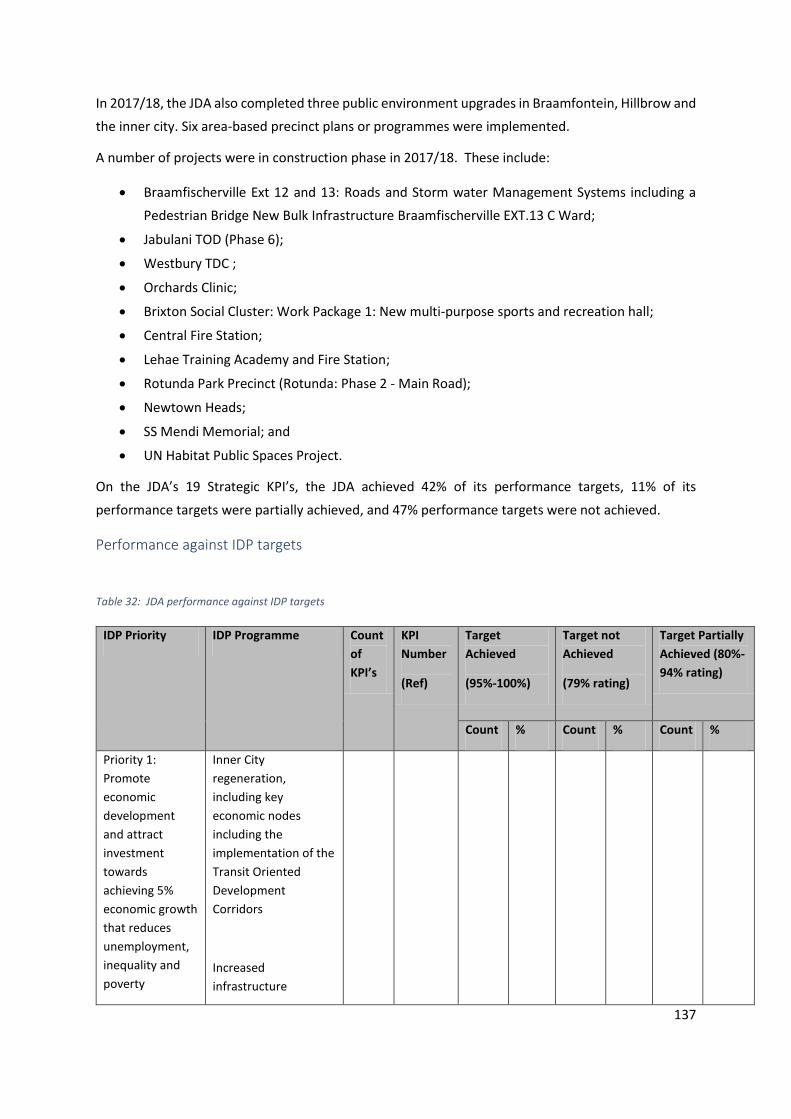
137
In 2017/18, the JDA also completed three public environment upgrades in Braamfontein, Hillbrow and
the inner city. Six area-based precinct plans or programmes were implemented.
A number of projects were in construction phase in 2017/18. These include:
Braamfischerville Ext 12 and 13: Roads and Storm water Management Systems including a
Pedestrian Bridge New Bulk Infrastructure Braamfischerville EXT.13 C Ward;
Jabulani TOD (Phase 6);
Westbury TDC ;
Orchards Clinic;
Brixton Social Cluster: Work Package 1: New multi-purpose sports and recreation hall;
Central Fire Station;
Lehae Training Academy and Fire Station;
Rotunda Park Precinct (Rotunda: Phase 2 - Main Road);
Newtown Heads;
SS Mendi Memorial; and
UN Habitat Public Spaces Project.
On the JDA’s 19 Strategic KPI’s, the JDA achieved 42% of its performance targets, 11% of its
performance targets were partially achieved, and 47% performance targets were not achieved.
Performance against IDP targets
Table 32: JDA performance against IDP targets
IDP Priority IDP Programme Count
of
KPI’s
KPI
Number
(Ref)
Target
Achieved
(95%-100%)
Target not
Achieved
(79% rating)
Target Partially
Achieved (80%-
94% rating)
Count % Count % Count %
Priority 1:
Promote
economic
development
and attract
investment
towards
achieving 5%
economic growth
that reduces
unemployment,
inequality and
poverty
Inner City
regeneration,
including key
economic nodes
including the
implementation of the
Transit Oriented
Development
Corridors
Increased
infrastructure
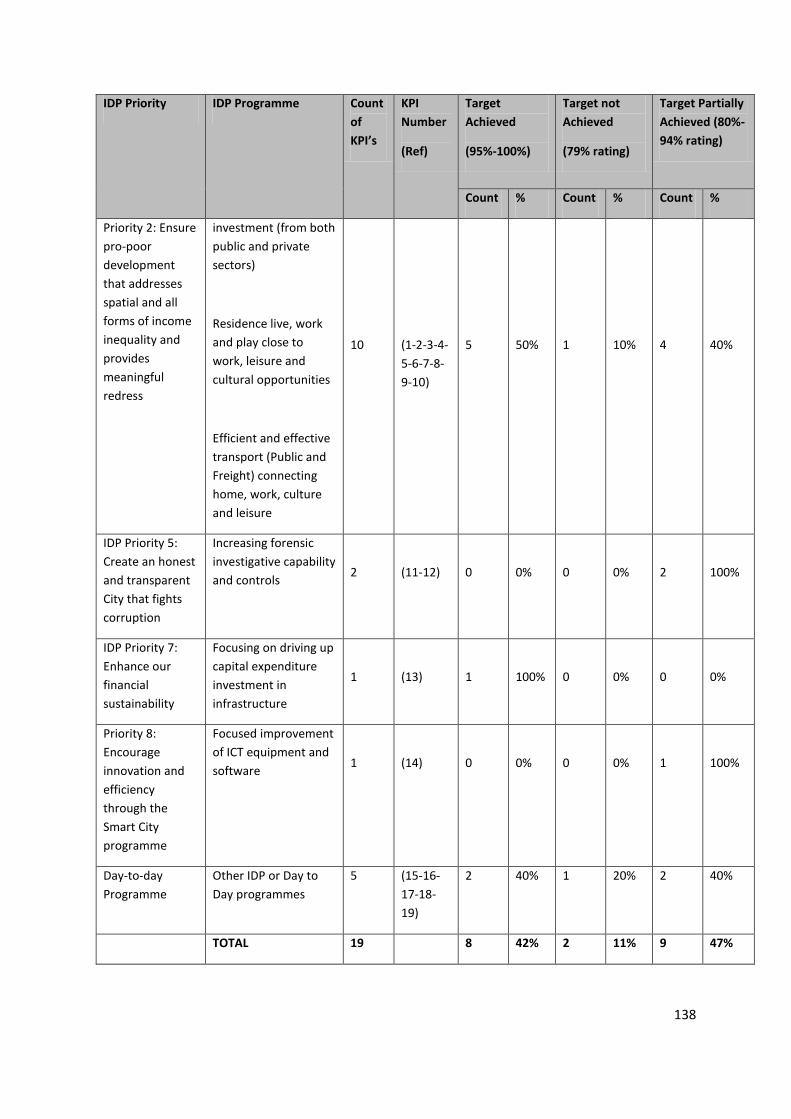
138
IDP Priority IDP Programme Count
of
KPI’s
KPI
Number
(Ref)
Target
Achieved
(95%-100%)
Target not
Achieved
(79% rating)
Target Partially
Achieved (80%-
94% rating)
Count % Count % Count %
Priority 2: Ensure
pro-poor
development
that addresses
spatial and all
forms of income
inequality and
provides
meaningful
redress
investment (from both
public and private
sectors)
Residence live, work
and play close to
work, leisure and
cultural opportunities
Efficient and effective
transport (Public and
Freight) connecting
home, work, culture
and leisure
10
(1-2-3-4-
5-6-7-8-
9-10)
5
50%
1
10%
4
40%
IDP Priority 5:
Create an honest
and transparent
City that fights
corruption
Increasing forensic
investigative capability
and controls
2
(11-12)
0
0%
0
0%
2
100%
IDP Priority 7:
Enhance our
financial
sustainability
Focusing on driving up
capital expenditure
investment in
infrastructure
1
(13)
1
100%
0
0%
0
0%
Priority 8:
Encourage
innovation and
efficiency
through the
Smart City
programme
Focused improvement
of ICT equipment and
software
1
(14)
0
0%
0
0%
1
100%
Day-to-day
Programme
Other IDP or Day to
Day programmes
5 (15-16-
17-18-
19)
2 40% 1 20% 2 40%
TOTAL 19 8 42% 2 11% 9 47%
139
Financial performance
Revenue
The organisation achieved 93% (2016/17: 93%) of the budgeted revenue. The shortfall in the revenue
is mainly due to development management fees that was budgeted on an overall capital spend of 98%
of which the actual percentage spend is 92%. Currently over 74% of the JDA’s funding model is
dependent on the capital expenditure incurred on the infrastructure projects implemented. Although
the revenue is normally based on a conservative spend percentage, most of the projects were delayed
by a number of factors, including poor contractor performance, community and SMME grievances and
land readiness issues. These factors further contribute to the delays of these projects and directly to
the revenue generated by the JDA through development management fees.
Expenditure
The organisation incurred expenditure in excess of the budgeted target for operational expenditure
by 22% (2016/17: 92% overall against target) due to the over-expenditure in internal interest charged
on the overdrawn sweeping account with the City of Johannesburg of R40 million. The JDA is currently
in discussion with the City regarding the reversal of the interest incurred and a request for write-off
has been made for the current year. The JDA is required to implement projects with cash flow reserves
that are currently held by the client departments.
The overall year to date capex expenditure was R1.41 billion (2016/17: R1.39 billion) against an annual
budget of R1.535 billion (2016/17: R1.705 billion). This translates to 92% (2016/17: 82%) of the total
annual budget and against the year to date target of 95% or R1 459 billion.
This under-performance on expenditure was due to a combination of factors at the project
implementation level, these include: project delays on site including land readiness, SMME disputes
and contractor performance; projects not reaching a development stages as planned; construction
challenges including projects with potential structural design risks that needed to be suspended in
order to be investigated; procurement delays or disputes resulting in community stoppages on
projects. Management is aware of the severity reflected in expenditure performance and is committed
to addressing significant project risks earlier and more effectively, including through JDA’s stakeholder
engagement guidelines and a project readiness assessment process.
Employee relations
The revised JDA staff establishment and organogram was approved by the Board on 28 August 2017.
It had a total of 122 positions including 10 from ARP. For the purposes of reporting, ARP will not be
included in the numbers. Of the 112 positions, 25 are vacant and 13 are unfunded and will be kept in
the abeyance until funds become available.
140
3.7 Joburg Market
The Joburg Market (JM) renders a series of services and provides amenities which facilitate the trading
of fresh produce. On a daily basis between 9 500 and 11 000 buyers - depending on the marketing
season - visit JM from across South Africa and the Southern African Development Community (SADC)
region.
The company operates on a commission-based business model where producers deliver their produce
to market agents who in turn sell to buyers.
At any given time, approximately 5 000 producers market their products through the trading floors of
JM. This ensures that a wide assortment of produce in various grades and sizes are available to buyers
from various categories.
Summary of performance
The Joburg Market provides premier market facilities and complementary services to the fresh
produce industry. To this end, in 2017/18, the tonnage traded increased by 8.71% due largely to the
high commodity volumes received in especially in potatoes, onions, and citrus. The Mandela Market
Precinct development programme was produced and is in the design process with the assistance of
the Joburg Property Company (JPC).
Through the Joburg Market’s Urban Farmers Support programme, an 8.8% targeted market share was
achieved by emerging farmers. In addition, 202 hawkers/vendors were trained and over 4000
donations to targeted beneficiaries were made.
All Trading Halls performed better than they did when compared to a similar period in the previous
financial year. The tonnage increased by 6.4% largely due to the high commodity volumes received in
especially bananas, citrus and some vegetable lines. The favourable weather conditions in some
production areas, and farmers recovering from the impact of drought, contributed to the high volumes
received. As a result of improved supply from some production areas, a high demand for fresh
produce and the high prices achieved on some commodities, resulted in the average price increase
from R4.67/kg to R5.15/kg, which represents a 10.4% increase.
The Joburg Market saw a net surplus of R113.1 million – 39.6% above budget. The net income
increased due to a positive cash balance.
Other key achievements include:
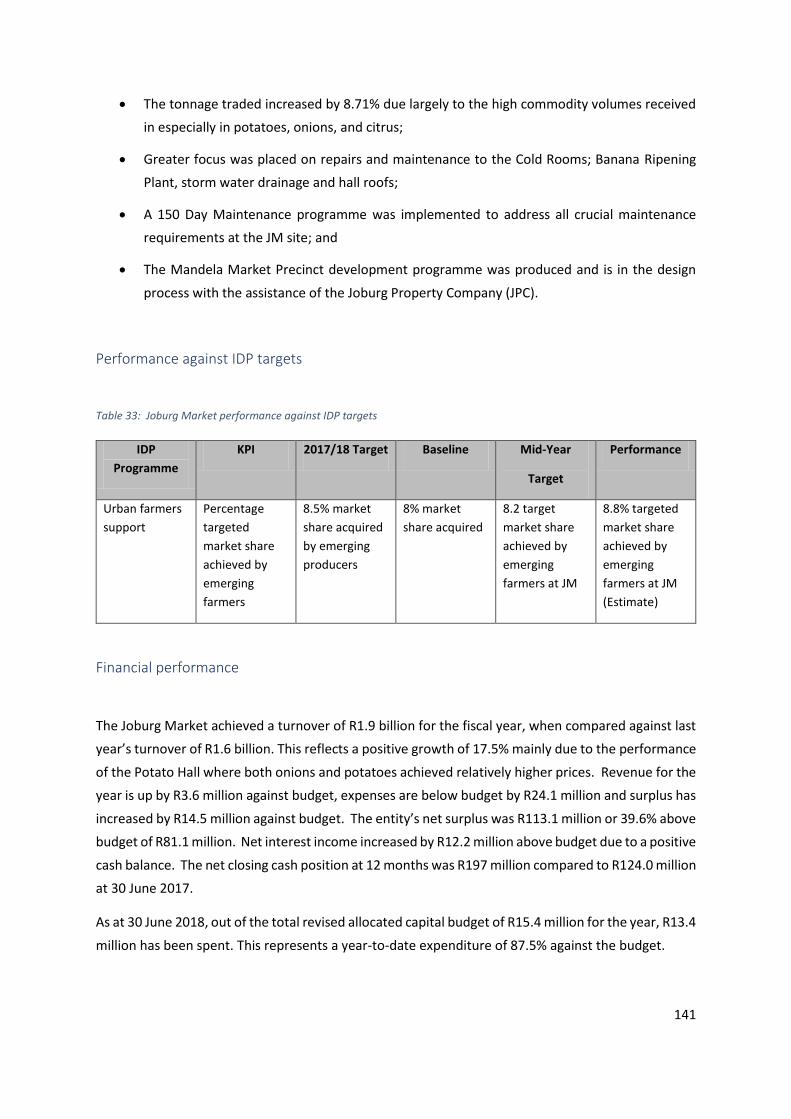
141
The tonnage traded increased by 8.71% due largely to the high commodity volumes received
in especially in potatoes, onions, and citrus;
Greater focus was placed on repairs and maintenance to the Cold Rooms; Banana Ripening
Plant, storm water drainage and hall roofs;
A 150 Day Maintenance programme was implemented to address all crucial maintenance
requirements at the JM site; and
The Mandela Market Precinct development programme was produced and is in the design
process with the assistance of the Joburg Property Company (JPC).
Performance against IDP targets
Table 33: Joburg Market performance against IDP targets
IDP
Programme
KPI 2017/18 Target Baseline Mid-Year
Target
Performance
Urban farmers
support
Percentage
targeted
market share
achieved by
emerging
farmers
8.5% market
share acquired
by emerging
producers
8% market
share acquired
8.2 target
market share
achieved by
emerging
farmers at JM
8.8% targeted
market share
achieved by
emerging
farmers at JM
(Estimate)
Financial performance
The Joburg Market achieved a turnover of R1.9 billion for the fiscal year, when compared against last
year’s turnover of R1.6 billion. This reflects a positive growth of 17.5% mainly due to the performance
of the Potato Hall where both onions and potatoes achieved relatively higher prices. Revenue for the
year is up by R3.6 million against budget, expenses are below budget by R24.1 million and surplus has
increased by R14.5 million against budget. The entity’s net surplus was R113.1 million or 39.6% above
budget of R81.1 million. Net interest income increased by R12.2 million above budget due to a positive
cash balance. The net closing cash position at 12 months was R197 million compared to R124.0 million
at 30 June 2017.
As at 30 June 2018, out of the total revised allocated capital budget of R15.4 million for the year, R13.4
million has been spent. This represents a year-to-date expenditure of 87.5% against the budget.
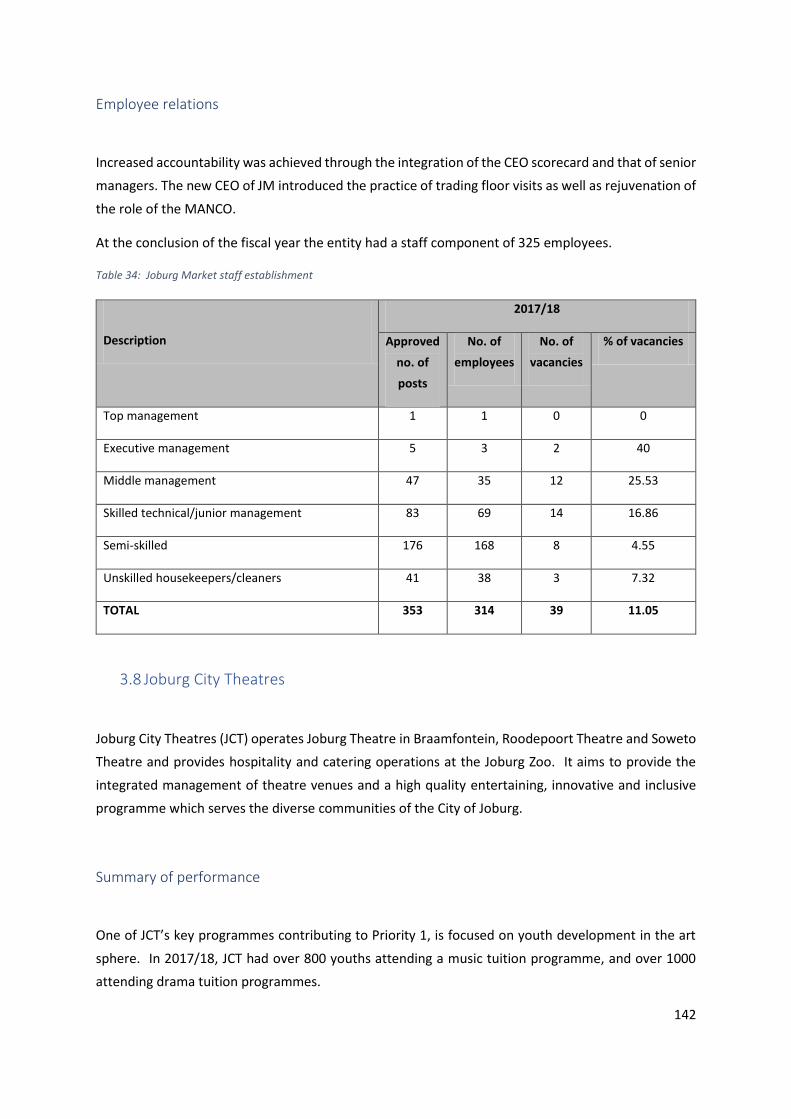
142
Employee relations
Increased accountability was achieved through the integration of the CEO scorecard and that of senior
managers. The new CEO of JM introduced the practice of trading floor visits as well as rejuvenation of
the role of the MANCO.
At the conclusion of the fiscal year the entity had a staff component of 325 employees.
Table 34: Joburg Market staff establishment
Description
2017/18
Approved
no. of
posts
No. of
employees
No. of
vacancies
% of vacancies
Top management 1 1 0 0
Executive management 5 3 2 40
Middle management 47 35 12 25.53
Skilled technical/junior management 83 69 14 16.86
Semi-skilled 176 168 8 4.55
Unskilled housekeepers/cleaners 41 38 3 7.32
TOTAL 353 314 39 11.05
3.8 Joburg City Theatres
Joburg City Theatres (JCT) operates Joburg Theatre in Braamfontein, Roodepoort Theatre and Soweto
Theatre and provides hospitality and catering operations at the Joburg Zoo. It aims to provide the
integrated management of theatre venues and a high quality entertaining, innovative and inclusive
programme which serves the diverse communities of the City of Joburg.
Summary of performance
One of JCT’s key programmes contributing to Priority 1, is focused on youth development in the art
sphere. In 2017/18, JCT had over 800 youths attending a music tuition programme, and over 1000
attending drama tuition programmes.
143
Joburg City Theatres provides free or discounted tickets to numerous groups of people in
Johannesburg. In 2017/18, almost 35 000 tickets were provided to school learners, over 13 000 to
various communities and over 4 500 to senior citizens. There was a total of 241 567 attendees at
theatres in the financial year under review.
In 2017/18, JCT saw 96% of its service level standards achieved. 18 arts and culture or in-house
productions were held, six ballet seasons and five philharmonic orchestra seasons.
The following highlights and achievements are notable:
• Total revenue improvement of 10% year on year while earned revenue improved by 7%;
• The allocation of capital expenditure (100%) fully utilised for the year under review;
• A total attendance of 241 567 representing a 12% improvement from the plan/target;
• Over 150 productions staged throughout the year across all three theatres;
• Movement RSA, a group within Youth Development in the Joburg City Theatres, was honoured
with an invitation to participate in the 10th International Festival in Donzdoft, Germany. This
participation culminated in two other invitations to Germany 2019 and Switzerland in 2020;
• The Color Purple showcase was top highlight in its first season in South Africa attracting full
houses and great reviews from the audiences and the media alike. It far surpassed expectation
on ticket sales reaching over R4 million in ticket sales;
• Legacy projects have continued in the year under review with tributes to legends such as Bra
Hugh Masekela, Gibson Kente, Mama Winnie Madikizela Mandela, and Tata Rholihlahla
Nelson Mandela; and
• The organisation has completed and submitted the Work Skills Plan that informs its training
programme for the 2018/19 financial year.
However, ticket sales remain a challenge particularly the sale of tickets on newly developed African
stories. This productions usually require substantial investments at initial stages with lower returns on
investment and require a number years to warm to the audiences. Rising input costs from the
hospitality and catering business are also a challenge as they may result in price increases to maintain
adequate gross profit margins. Other challenges include:
• Marketing efficiencies particularly maximum utilisation of social media to increase visibility of
productions;
• Mobile theatre truck remains a challenge to market and generate adequate revenue for its
operations;
• The capacity within departments of JCT is a challenge both in the form of inadequate numbers
of human resources and the skills set available in different departments; and
144
• The executive management level has two vacancies resulting in a load of work being shared
between the remaining executives.
Financial performance
JCT continued its upward trajectory in terms of incremental revenue year on year. In the 2017/18
finacial year, the total revenue for the entity amounted to R174 937 691, which equated to a growth
of 8% year on year. This growth derives from both subsidy and earned revenue. Earned revenue
increased by 3% year on year. Increases in earned revenue growth were driven by the Hospitality and
Catering business, interest on investments and rentals of facilities. The ratio of earned revenue to
subsidy has been maintained at 41% exceeding the target set by shareholder of 35:65 in percentage
terms. These revenue improvements have been accompanied by prudent expenditure management.
Expenditure has been kept within the revenue achieved resulting in a surplus of over R500 000 after
taxation.
Employee relations
JCT had a total of 145 permanent and fixed term employees at 30 June 2018. The total approved
structure has 162 positions for the above category of employees. As at 30 June 2018 the vacancy rate
stood at 10%. This vacancy rate did not pose a challenge for the entity as the majority of the vacant
positions were not classified as critical vacancies and to this extent did not negatively impact in the
operations of the entity.
In addition to permanent and fixed term employees, JCT had 161 temporary employees. This category
of employees predominantly work as ushers for the Stage department and short-term contract
workers for Hospitality and Catering department. The total number of staff combining the two
categories stood at 305 employees at 30 June 2018. JCT budgeted and spent about 40% of its total
budget on employee related costs in the year under review.
The staff turnover remains relatively low at less than 5% of the total establishment.
145
3.9 Joburg Property Company
The Joburg Property Company (JPC) is mandated to manage and develop the City’s R9.1 billion
property portfolio made up of almost 30 000 properties. The entity uses council-owned land to
leverage private sector investment in public infrastructure. The core functions of the JPC are as
follows:
Asset management;
Property development;
Facilities management;
Property management;
Outdoor advertising; and
Competitive landscape.
Summary of performance
In 2017/18, the JPC created a total of 2017 jobs through property transactions. In addition, 1 203
SMMEs were supported. R1.4 billion cumulative rand value attraction of investment in the City’s
property transactions was achieved, although construction has not yet started on these. Construction
value on the ground totalled R1.1 billion.
The entity prepared 244 asset management plans, and acquired 12 properties, in support of the City’s
pro-poor priority. These properties are located along the City’s transit-oriented zone.
A further 613 properties to the value of R200 million were taken on. R1.3 billion investment was
realised on CoJ property, while a further R700 million attraction of investment of CoJ property /
construction value on the ground was achieved.
In 2017/18, the entity transferred 599 properties. 589 of these were housing properties transferred
to beneficiaries while the remaining ten were made up of six shops and four churches.
Work on the restoration of the historic amphitheatre and ablutions located at the Jabulani
amphitheatre were completed in 2017/18. The entity also completed the bulk earthworks,
foundations, brickwork, electric and roof structure for the National Academy of Africa’s Performing
Art project was completed.
The town planning applications for the Paterson Park project was approved and the first phase (744
mixed income residential units) will be released in late 2018.
146
The JPC also facilities the conclusion of a sale and development agreement with regard to the Riverside
View housing project – one of the biggest housing projects in Gauteng. Other projects include:
Jabulani Crossing Shopping Centre – bulk earthworks completed with construction to
commence in 2018;
Jabulani housing – will yield 384 residential rental stock units. Phase 1 was completed and
delivered (1 280 units);
Rissik Street Post Office – work on the external façade in underway;
Bertrams Priority Block – condition assessment and precinct plan completed;
Development of civic precincts across the city – four civic precinct plans were approved; and
Southern Farms project – feasibility study completed.
Facilities management is a key priority for the entity. This entails the repair and maintenance for City
departments and entities. However, was taken in 2018 to allow departments to complete their own
repairs and maintenance. Other facility related projects include the opening of 42 swimming pools on
1 September 2017, maintenance completed on six taxi ranks and refurbishment of the Yeoville
Market. New public toilets were erected in Ennerdale, Noord Street and Hillbrow.
The Lenasia Civic Centre Clinic and Ernest Ullman Park Recreation Centre saw repairs undertaken in
2017/18.
Financial performance
In 2017/18, the entity’s total budget grew by 3%. Over R144 million of rental income was raised from
leases and servitudes sales. This exceeded the target of R130 million. The entity also achieved a 100%
spend of its allocated capital expenditure budget.
Employee relations
The entity has 528 employees based at the head office and depots.
147
3.10 Joburg City Parks and Zoo
Johannesburg City Parks and Zoo (JCPZ) is a non-profit entity mandated to provide the sustainable
provision, preservation and management of open spaces, biodiversity, environmental and
conservation services through education, research, direct conservation action and recreation, with a
focus on the zoo, parks and cemeteries.
The Company has a portfolio in excess of 20 000 ha of public green open spaces including parks,
cemeteries, nature reserves and approximately 3.2 million trees. The Zoo has in its collection a total
of 335 species and 49 Subspecies of animals of which there are 2 751 specimens.
The company manages the following products and services:
Urban parks, recreation and leisure facilities;
Johannesburg Zoo;
Zoo conservation and research farm;
Cemeteries and crematoria;
Botanical services;
Nature reserves, including bird sanctuaries, nature trails, dams and lakes;
Environmental education;
Biodiversity and conservation management;
Eco-tourism products and services; and
Trees and arboriculture services.
Summary of performance
Highlights of the entity’s 2017/18 performance include:
The newly developed Zoo Parkade and kiosk was launched in the financial year under review.
The City of Johannesburg hosted the IERM Convention 2017 where a JCPZ official was elected
President of the institute.
The Oliphantsvlei Eco-Cemetery in Region G and Short Street Park in Region G were officially
launched in this period.
148
In the year under review the Zoo witnessed its reinstatement of its membership to Pan African
Association of Zoos and Aquaria (PAAZA) after two consecutive years of suspension. The
Certificate was issued on14 August 2017 and will be valid until 2019.
A lioness at the Zoo gave birth to two lion cubs which are being taken care of by their mother.
Two of the Zoo Facilities namely AngloGold and Old Elephant House remained consistent in
retaining the 3 and 4-star rating in the grading of the Conferences and Facilities.
The Zoo received interest from the media regarding animals which are hand reared. This led
to a media company (Urban Brew), filming activities involved during hand rearing. The animals
filmed were the Mountain Reedbuck and Red Lechwe.
For the first time in the history of Johannesburg Zoo, Water Buffalo has given birth to a healthy
calf.
In the year under review, four Wattle Cranes have been paired of which the hatching of one
chick was observed at the Rietkuil Conservation and Research Farm in Parys, Free State.
The Johannesburg Botanic Garden participated in the Horticultural Flower Show where special
collection plants where exhibited, and awareness was created on the role of botanical gardens
within communities.
The Jukskei Park and the Inner-city Parks (Cavendish and Belleview) were launched in the
period and opened to the public.
The development of the Westpark Cemetery Wall of Remembrance was completed in the
period under review.
The Shetland pony (Tom Tom) celebrated his 42nd birthday and has now become one of the
oldest Shetland Ponies in a zoo in the world.
The Madiba Heritage Tree that was planted at Thokoza Park in Soweto was declared and
gazetted a heritage tree by the Gauteng Provincial Government.
The breeding of more than 300 endangered Pickersgill Reed Frogs which is in the Red List
status. This was in collaboration with Ezemvelo KZN Wildlife, National Zoological Gardens and
Endangered Wildlife Trust.
The Zoo has achieved a 12% increase in visitor numbers from 448 769 visitors in 2016/17 to
503 696 visitors in 2017/18.
210 hectares of alien vegetation were cleared in 2017/18, five wetlands were rehabilitated,
four areas were cleaned of invasive plants from water bodies and four areas of reeds were
controlled. The entity also cleared 25 hectares of river trails.
A number of external factors had an impact on JCPZ during the reporting period. An outbreak of the
polyphagous shot-hole borer (PSHB) in the City of Johannesburg led to tree fatalities and an unhealthy
149
tree canopy, which will have an effect on environmental and ecological services. Key consequences
would be an increase in the city temperature and a reduction in carbon sequestration. Land invasion
on public open space: JCPZ is losing over two ha of land monthly either through illegal land grasps,
land disputes or legal land transfers. Water restrictions are still in place in the City of Johannesburg.
As much as trees will be planted, alternate water sources would be required. This will include dri-
water, grey water, rain harvested water or even borehole water.
Financial performance
During this period, the company spent R875.4 million (96%) of its operational expenditure budget and
R54.0 million of its capital expenditure budget. The revenue generated by the company increased by
8.5% as compared to the previous year.
The expenditure on the capital development programme was achieved at 96% from an allocation of
R56 million for 19 projects. Key developments in the year included the Olifantsvlei Eco-Cemetery,
Johannesburg Botanical Gardens, Bosmont, Pieter Roos Park, Stretford Park, Patterson Park,
Mshenguville, Kaalspruit, Alexandra and the upgrading of parks aligned to Occupational Health and
Safety Standards (OHS).
Employee relations
The entity has a personnel complement of 1 384.
3.11 Metrobus
The City appointed Metrobus in terms of a Service Delivery Agreement to provide safe and customer
friendly bus transport services to the residents of Johannesburg. Metrobus has over the years
accumulated a fleet of 486 buses of which 65 are non-operational leaving 421 buses to operate on
363 routes across Johannesburg covering approximately ten million kilometres and transporting
almost 10 million passengers per annum as at 30 June 2018.
Metrobus operates from three main depots, i.e. Milner Park, Village Main and Roodepoort; the
Company’s Head Office is situated on Raikes Road, Braamfontein.
The entity operates within the Greater Johannesburg metropolitan area in four business segments,
namely:
150
• The provision of daily scheduled public transport;
• The rendering of private hire transport services;
• The operation of scheduled commercial contracts; and
• Special contracts for the Gauteng Province’s Department of Transport in Eldorado Park.
In addition to the above services, and as part of the company’s social responsibility, the following
services are offered at discounted rates:
• A dedicated service to persons with disabilities;
• Subsidised pensioner services;
• Scholar services; and
• Free transportation to the South African Police Services (SAPS), the Johannesburg Metro
Police Department (JMPD) and the South African National Defense Force (SANDF) officers.
Summary of performance
Launched a new Apprenticeship Programme
The apprenticeship programme has been a major contributor to the skills pipeline within the Technical
Department. Metrobus applied for funding and secured funding to the value of R4 080 000 for a period
of three years to implement the apprenticeship programme for 20 candidates in the area of Auto
Electrician Training Programme and Diesel Mechanics Training Programmes The contract is from 1
June 2018 to 31 May 2021. This will add value to the labour force with regards to additional assistance
to repair bus defects.
Accreditation for bulk flammable substances storage
For the first time in the history of fuel management in Metrobus, the entity obtained a certificate to
store bulk flammable substance. This links to the initiative launched in 2016/17 financial year
regarding installation of a fuel management system, which gives accurate accounting in management
of fuel as well as environmental management.
CNG Compliance Certificate
CNG have inspected and issued Metrobus with certificates of compliance for the 30 Mercedes Benz
1725 converted DDF buses and 149 Mercedes Benz Euro 5 DDF buses. This programme will continue
to cover all dual fuel diesel Mercedes Benz buses and should be completed in the new financial year.
151
Executive Management Blitz
The entity has established an Executive Management Blitz which involves monitoring and inspection
of on-route buses during morning and afternoon peak. This initiative has been welcomed by the
commuters who also appreciate the opportunity to engage with Metrobus Management.
Refurbishment of double decker buses
Metrobus completed refurbishment of 29 buses in the 2017/18 financial year. The refurbishment is
being done for the following reasons:
• These buses are 18 years old and they are no longer aesthetically pleasing;
• The floors are no longer compliant to the Road Traffic Rules and Regulations; and
• They have to get a new lease on life before they can be progressively retired.
The bus refurbishment process involves:
• Stripping and assessing of interior and exterior panels, flooring, roof and seats;
• Preparation and fitting, re-paneling with new panels (interior & exterior), laying of the floors,
preparing the bus for paint work and fiberglass, and electrical and lighting;
• Exterior and interior painting;
• The fitting of seats, beading, handle bars etc.; and
• Pre-delivery Quality Assurance.
A total of 9.7 million passengers (including transfers) were transported against the target of 13 million
passengers. Underlying journeys show a decline of 11% year-on-year (2017/18: 10.9 million)
However, the entity has also faced a number of challenges in the year under review. The first of these,
bus fleet availability, notes an operational shortfall of 72 buses. Metrobus has a total fleet of 421
buses which means that fleet utilisation is at 68%. The low fleet utilisation is mainly due to the number
of Out of Commission (OOC) buses at the workshop on a daily basis averaging 115 buses.
Metrobus for the most part of the 2017/18 financial year had more than 50% leadership vacancies
including the Managing Director, General Manager Operations, Chief Information Officer (CIO),
General Manager Corporate Services and the Supply Chain Manager. This affected the stability of the
entity with senior positions being vacant for over a year in the case of the CIO.
In February 2018, Metrobus launched a pilot of the MB routes. Although the pilot of the MB routes
can be regarded as an achievement, the entity acknowledges that the challenges resulting from this
process which clearly indicated that Metrobus is not ready to implement all the MB routes. A decision
152
was taken to only pilot MB4. The other four routes (MB1, MB2, MB3 and MB7) were put on hold
pending fleet capacity improvement as well as Human Resource capability improvement.
Financial performance
The performance of the organisation for the 2017/18 financial year was below expectations. The
organisation had a deficit of R58.2 million in the year relative to a deficit of R19 million for the 2016/17
financial year. The major drive for this deficit is attributable to the shortfall in revenue collections in
the current financial year which stood at R62 million. This shortfall is a result of the outdated
technology which is used by the organisation in the collection of the revenues on the buses. In addition
to the shortfalls in the revenue collections, the subsidy which was received from the shareholder was
not increased despite an increase in the costs which are needed to operate the business. During the
course of the financial year there were also some major occurrences within the organisation like
unprotected strikes and changes in some of the routes being operated and these had an impact on
the revenue collection of the organisation.
The overall expenditure for the year amounted to R663 million (R650 million for 2016/17) against a
budget of R671 million . Though the expenditure was contained within the budget the under
collections with regards to the revenues affected the bottom line of the organisation. In the current
year as per the company policy the organisation performed a revaluation of the assets and this
exercise resulted in an impairment of R24.5 million and retirement of unusable assets of R9.1 million
(both non-cash losses).
Revenue realised for the year was R614 million against a target of R672 million reflecting a R59 million
deficit. This can be directly attributed to fare revenue shortfall. Metrobus recorded a net liability of
R196.9 million.
Metrobus remains concerned about under-collection of fare revenue as well as the high level of losses.
The entity has been making losses over the past 15 years and one of the major causes of the losses
has been the inability of the organisation to collect all the revenues due. Fare revenue and subsidy
remain core funding for Metrobus collectively contributing to a total revenue of R614 million.
Metrobus spent 99% of the 2017/18 adjusted capital expenditure budget.
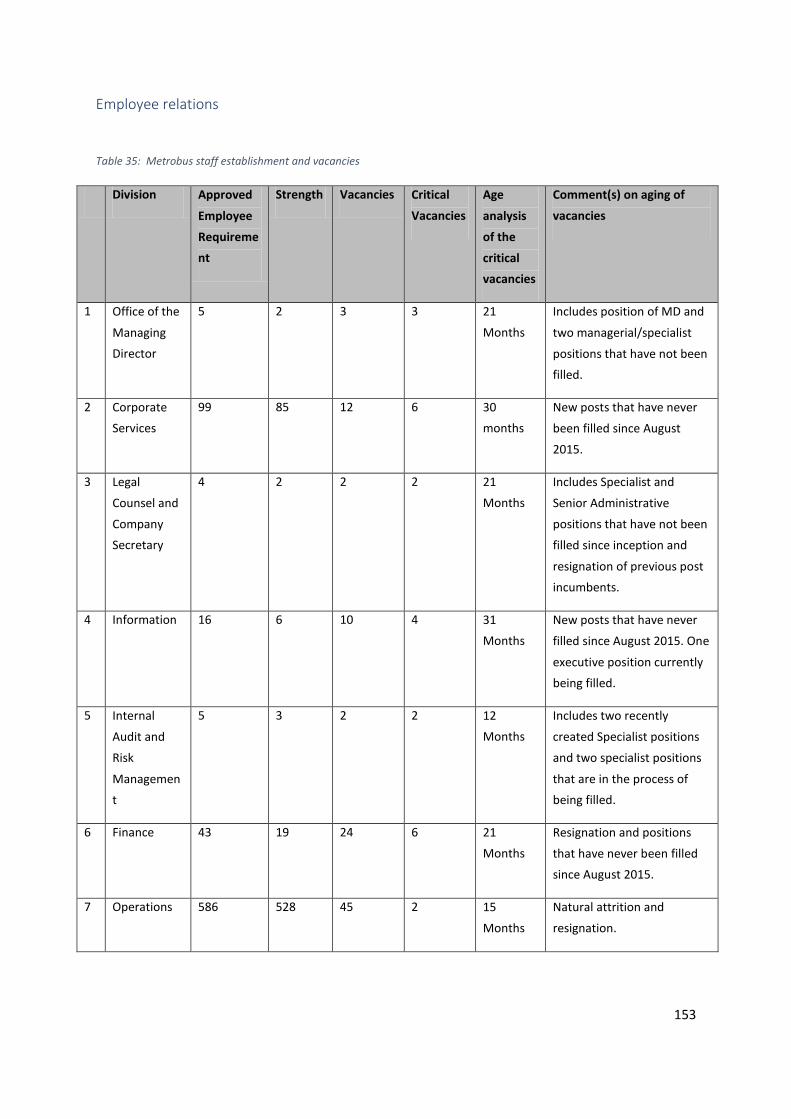
153
Employee relations
Table 35: Metrobus staff establishment and vacancies
Division Approved
Employee
Requireme
nt
Strength Vacancies Critical
Vacancies
Age
analysis
of the
critical
vacancies
Comment(s) on aging of
vacancies
1 Office of the
Managing
Director
5 2 3 3 21
Months
Includes position of MD and
two managerial/specialist
positions that have not been
filled.
2 Corporate
Services
99 85 12 6 30
months
New posts that have never
been filled since August
2015.
3 Legal
Counsel and
Company
Secretary
4 2 2 2 21
Months
Includes Specialist and
Senior Administrative
positions that have not been
filled since inception and
resignation of previous post
incumbents.
4 Information 16 6 10 4 31
Months
New posts that have never
filled since August 2015. One
executive position currently
being filled.
5 Internal
Audit and
Risk
Managemen
t
5 3 2 2 12
Months
Includes two recently
created Specialist positions
and two specialist positions
that are in the process of
being filled.
6 Finance 43 19 24 6 21
Months
Resignation and positions
that have never been filled
since August 2015.
7 Operations 586 528 45 2 15
Months
Natural attrition and
resignation.
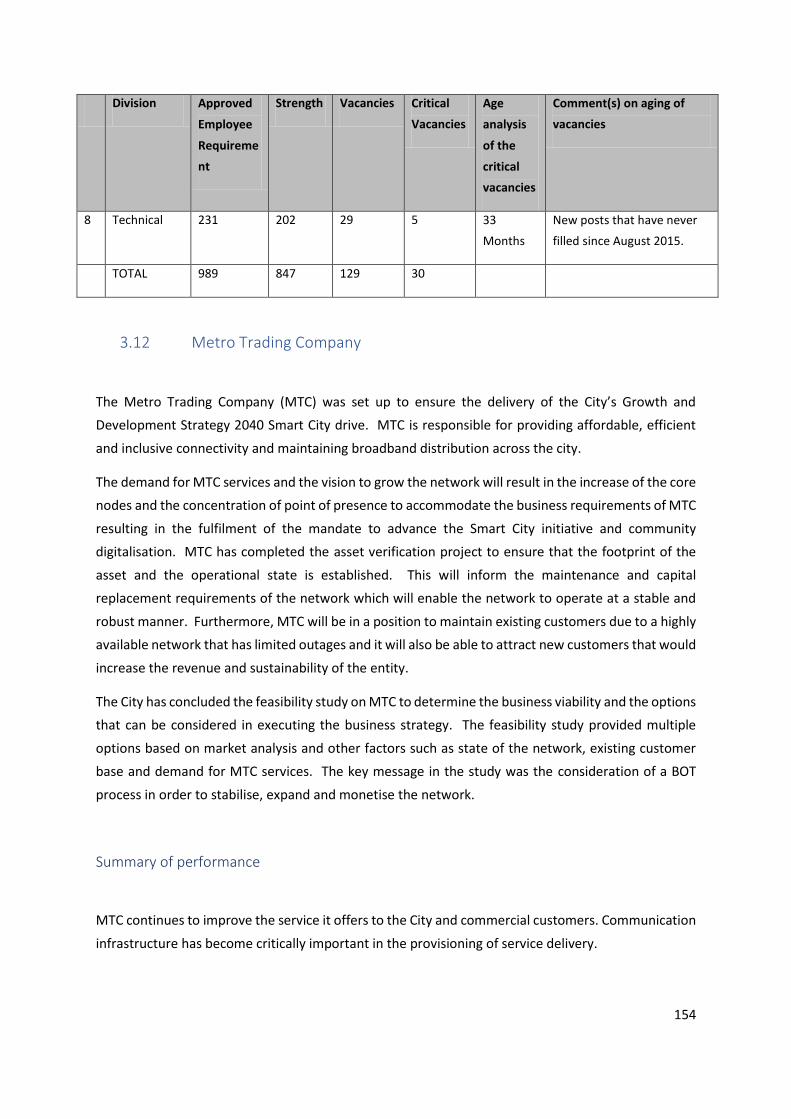
154
Division Approved
Employee
Requireme
nt
Strength Vacancies Critical
Vacancies
Age
analysis
of the
critical
vacancies
Comment(s) on aging of
vacancies
8 Technical 231 202 29 5 33
Months
New posts that have never
filled since August 2015.
TOTAL 989 847 129 30
3.12 Metro Trading Company
The Metro Trading Company (MTC) was set up to ensure the delivery of the City’s Growth and
Development Strategy 2040 Smart City drive. MTC is responsible for providing affordable, efficient
and inclusive connectivity and maintaining broadband distribution across the city.
The demand for MTC services and the vision to grow the network will result in the increase of the core
nodes and the concentration of point of presence to accommodate the business requirements of MTC
resulting in the fulfilment of the mandate to advance the Smart City initiative and community
digitalisation. MTC has completed the asset verification project to ensure that the footprint of the
asset and the operational state is established. This will inform the maintenance and capital
replacement requirements of the network which will enable the network to operate at a stable and
robust manner. Furthermore, MTC will be in a position to maintain existing customers due to a highly
available network that has limited outages and it will also be able to attract new customers that would
increase the revenue and sustainability of the entity.
The City has concluded the feasibility study on MTC to determine the business viability and the options
that can be considered in executing the business strategy. The feasibility study provided multiple
options based on market analysis and other factors such as state of the network, existing customer
base and demand for MTC services. The key message in the study was the consideration of a BOT
process in order to stabilise, expand and monetise the network.
Summary of performance
MTC continues to improve the service it offers to the City and commercial customers. Communication
infrastructure has become critically important in the provisioning of service delivery.
155
For the first and second quarter, MTC had no Service desk and Network Monitoring solution. As a
result, incidents were logged manually via an excel spreadsheet and there was no network monitoring
as a result, accurate performance monitoring could not be done. In the third quarter, MTC procured
an integrated service desk and network monitoring solution.
In the fourth quarter, MTC was able to implement the monitoring and service management tools that
enables MTC to have auditable service delivery performance data. In this fourth quarter, MTC is
enhancing the service management, SLA adherence and network availability monitoring.
MTC is performing well with regards to overall network availability but on other network performance
measures (i.e. high number of incidents logged, percentage of incidents resolved out of SLA) it is not.
This is due to capacity issues with respect to internal resources and contract management
enforcement with respect to external service providers. This issue is being addressed through the
recruitment plan and implementation of policies and control to improve contract management.
Contract Management is the leading cause to the improved performance. In the third quarter MTC
appointed two account managers which has in turn resulted in an improved customer focus and
customer management and has thus fulfilled the requirement of operating within the industry
standards, regular reoccurring customer engagements and improved SLA reporting.
Financial performance
The overall revenue budgeted for the 2017/18 financial was R332 million. MTC has exceeded the
overall revenue target by achieving R352 million.
The high number of unfilled vacancies had a negative impact on the entity’s operations and has
resulted in the under-spending of R16.5 million (56%) on year-to-date expenditure in comparison to
year-to-date approved budget.
The entity reported a surplus of R47.7 million as at 30 June 2018. This surplus is largely due to the
underspending on employee costs and depreciation.
The entity has achieved a capex spending of R22.8 million (95%) as at end of June 2018. The
underspending of R1 million (5%) was a result of savings achieved on some of the capital projects
when comparing to the budget initially allocated.
156
Employee relations
Since its inception, MTC has been operating with 19 permanent staff, interns, short term contract staff
and resources seconded from the City of Johannesburg and from other entities. MTC operates with a
vacancy rate of 69% (the actual vacancy ratio is 49% when considering that five interns and 12 short
term contracts are utilised reducing the vacant rate from 69 to 49%). MTC has a total number of 42
employees, all-inclusive incumbents (outsourced, acting, contracts and interns).
3.13 Economic Development Department
The Department of Economic Development is mandated to provide strategic economic direction to
the City and help steer the City as a whole towards the goal to achieve 5% economic growth and
reduce unemployment by 6%. The Department is also mandated to drive the implementation of the
City’s approved economic development strategy, which has a longer term horizon beyond the 5%
growth target. The economic development strategy emphasises:
A shift to increased localisation of production - replacing imports through getting firms in
Joburg and SA to become competitive suppliers;
A shift to increased economic activity in different regions of the City - promoting increased
economic growth in regions based on their different profiles and comparative advantage;
A shift to increased small entrepreneurship activity - through increased collaboration with the
private sector value-chains and City-supported SMME hubs; and
A shift to increased connectivity with the rest of Africa - through increased trade and
investment links with the rest of Africa, including targeted development of economic precincts
that reflect that Johannesburg is the economic hub of southern and eastern Africa.
Summary of performance
The Department of Economic Development’s 2017/18 cumulative investment attraction directly
amounts to R8.69 billion. Analysis of the Department’s investment promotion drive reflects a high
ratio of Domestic Direct Investment (DDI) towards property development. The sectoral investment
statistics for Johannesburg also reflect indirect investment inflow and expansions in critical sectors
such as health products and pharmaceuticals, agro-processing, small engineering equipment, and ICT
to a small degree.
The Executive Mayor of Johannesburg officially opened Opportunity Centres in Roodepoort, the
Joburg CBD and Diepsloot. To help empower entrepreneurs, the Department of Economic
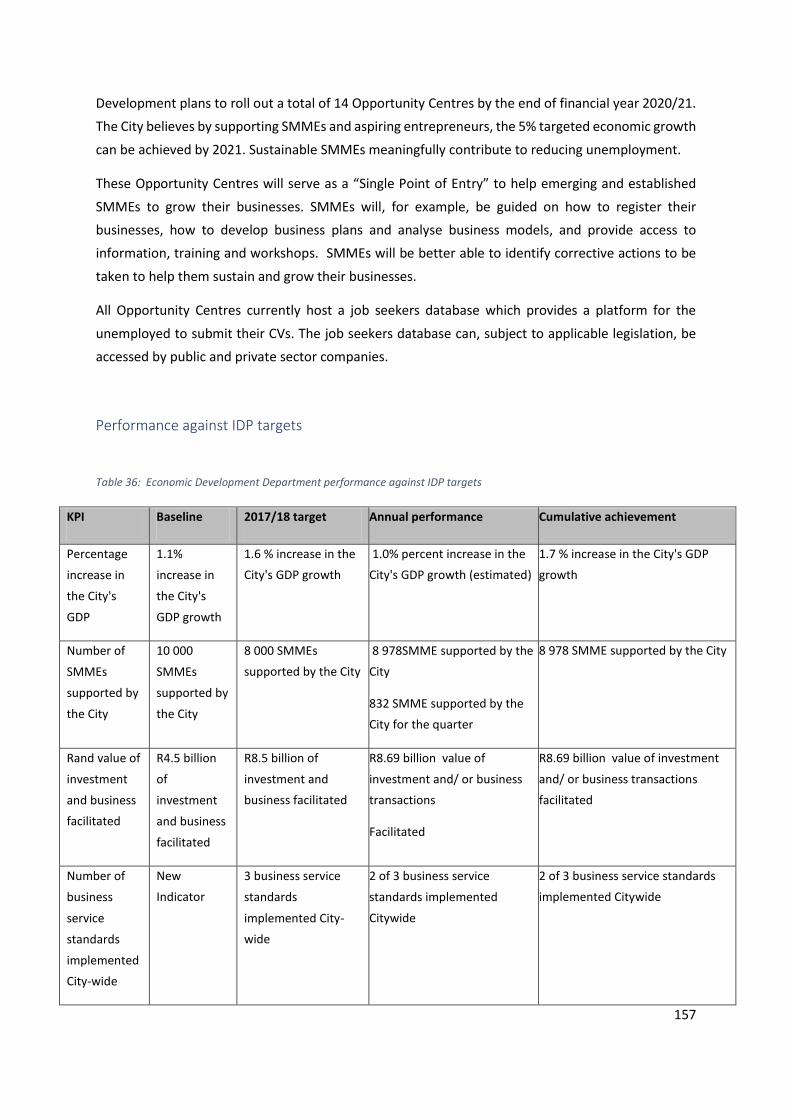
157
Development plans to roll out a total of 14 Opportunity Centres by the end of financial year 2020/21.
The City believes by supporting SMMEs and aspiring entrepreneurs, the 5% targeted economic growth
can be achieved by 2021. Sustainable SMMEs meaningfully contribute to reducing unemployment.
These Opportunity Centres will serve as a “Single Point of Entry” to help emerging and established
SMMEs to grow their businesses. SMMEs will, for example, be guided on how to register their
businesses, how to develop business plans and analyse business models, and provide access to
information, training and workshops. SMMEs will be better able to identify corrective actions to be
taken to help them sustain and grow their businesses.
All Opportunity Centres currently host a job seekers database which provides a platform for the
unemployed to submit their CVs. The job seekers database can, subject to applicable legislation, be
accessed by public and private sector companies.
Performance against IDP targets
Table 36: Economic Development Department performance against IDP targets
KPI Baseline 2017/18 target Annual performance Cumulative achievement
Percentage
increase in
the City's
GDP
1.1%
increase in
the City's
GDP growth
1.6 % increase in the
City's GDP growth
1.0% percent increase in the
City's GDP growth (estimated)
1.7 % increase in the City's GDP
growth
Number of
SMMEs
supported by
the City
10 000
SMMEs
supported by
the City
8 000 SMMEs
supported by the City
8 978SMME supported by the
City
832 SMME supported by the
City for the quarter
8 978 SMME supported by the City
Rand value of
investment
and business
facilitated
R4.5 billion
of
investment
and business
facilitated
R8.5 billion of
investment and
business facilitated
R8.69 billion value of
investment and/ or business
transactions
Facilitated
R8.69 billion value of investment
and/ or business transactions
facilitated
Number of
business
service
standards
implemented
City-wide
New
Indicator
3 business service
standards
implemented City-
wide
2 of 3 business service
standards implemented
Citywide
2 of 3 business service standards
implemented Citywide
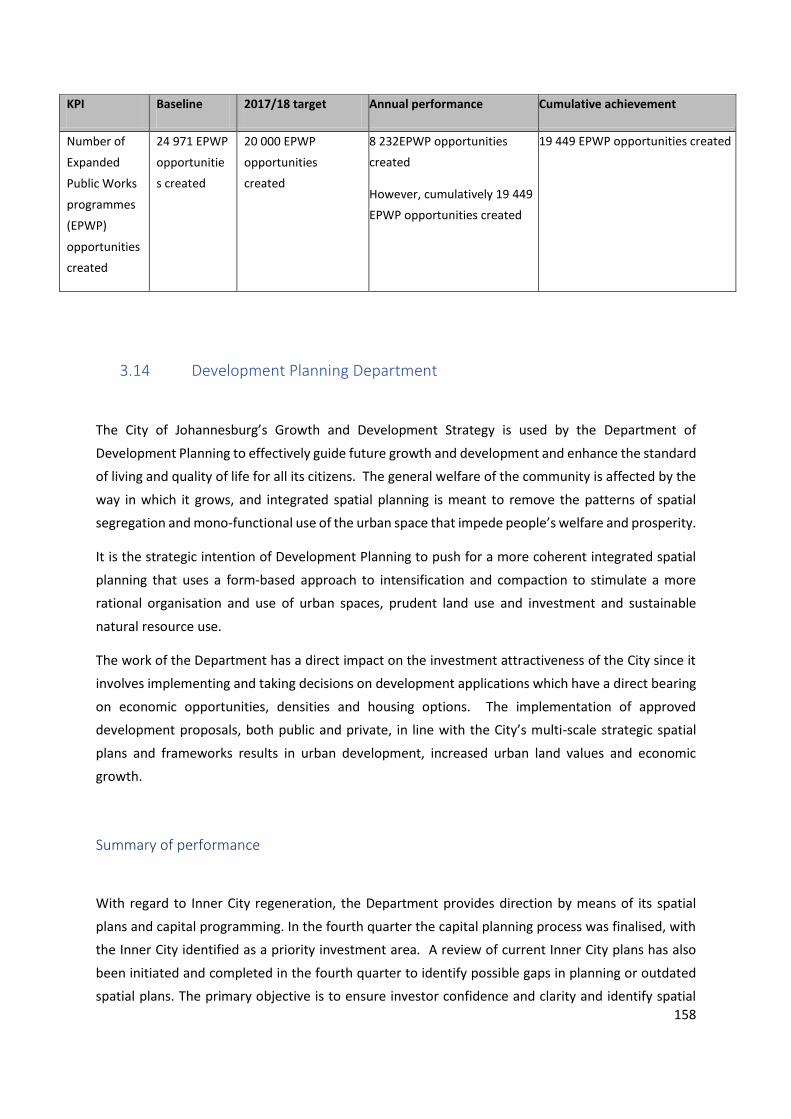
158
KPI Baseline 2017/18 target Annual performance Cumulative achievement
Number of
Expanded
Public Works
programmes
(EPWP)
opportunities
created
24 971 EPWP
opportunitie
s created
20 000 EPWP
opportunities
created
8 232EPWP opportunities
created
However, cumulatively 19 449
EPWP opportunities created
19 449 EPWP opportunities created
3.14 Development Planning Department
The City of Johannesburg’s Growth and Development Strategy is used by the Department of
Development Planning to effectively guide future growth and development and enhance the standard
of living and quality of life for all its citizens. The general welfare of the community is affected by the
way in which it grows, and integrated spatial planning is meant to remove the patterns of spatial
segregation and mono-functional use of the urban space that impede people’s welfare and prosperity.
It is the strategic intention of Development Planning to push for a more coherent integrated spatial
planning that uses a form-based approach to intensification and compaction to stimulate a more
rational organisation and use of urban spaces, prudent land use and investment and sustainable
natural resource use.
The work of the Department has a direct impact on the investment attractiveness of the City since it
involves implementing and taking decisions on development applications which have a direct bearing
on economic opportunities, densities and housing options. The implementation of approved
development proposals, both public and private, in line with the City’s multi-scale strategic spatial
plans and frameworks results in urban development, increased urban land values and economic
growth.
Summary of performance
With regard to Inner City regeneration, the Department provides direction by means of its spatial
plans and capital programming. In the fourth quarter the capital planning process was finalised, with
the Inner City identified as a priority investment area. A review of current Inner City plans has also
been initiated and completed in the fourth quarter to identify possible gaps in planning or outdated
spatial plans. The primary objective is to ensure investor confidence and clarity and identify spatial
159
plans and policies that require revision. Twenty five plans have been reviewed in terms of the
evaluation criteria defined by the Department.
Implementation of priority projects identified in the two new Inner City spatial frameworks (Fordsburg
and Mayfair Urban Development Framework (UDF) and the Inner City Eastern Gateway Development
Framework) has also been initiated in 2017/18. Detailed designs and community participation were
initiated and completed for public environment upgrades and infrastructure upgrades for the
Fordsburg and Mayfair UDF area (construction to occur in the 2019/20 financial year, due to budget
availability). As part of the Inner City Eastern Gateway Implementation, Jeppe Park underwent
significant revitalisation and refurbishments were also completed in the fourth quarter. This included
new play and community recreational facilities.
The Department has been undertaking a nodal review to assess the City’s established nodes in terms
of urban efficiency criteria, with the intention to formulate a revised nodal strategy. The draft nodal
review document was published for public comment in the third quarter, on 28 February 2018. Public
participation was held during the 4th quarter. Due to the number of extensive comments received, the
Department had to extend the timelines to ensure that all comments received are carefully considered
before finalising the nodal strategy. More detailed assessments and intervention strategies for two of
the City’s declining nodes, Lenasia and Roodepoort, have also been completed during the quarter.
Inclusionary housing requires private developers to dedicate a certain percentage of new rental
housing developments to low income and low middle income households at affordable housing cost.
The Department is working on defining incentives, mechanisms and regulations for inclusionary
housing in Johannesburg. The draft document was advertised for public comment in the third quarter
(28 February 2018). The commenting period closed on 30 April 2018. The Department received a great
number of comments that must be carefully considered before the tool can be sent to council for
consideration.
The implementation of projects in prioritised transit oriented development (TOD) precincts will ensure
the transformation of urban spaces around railway and Rea Vaya stations into vibrant mixed-use and
mixed-income activity hubs that bring people together. The Department coordinates a range of
catalytic projects, to create an environment conducive to urban development. Some of the projects
and interventions include:
Empire-Perth Corridor - Milpark precinct: Interventions include improved connectivity to
and within the precinct through pedestrian bridges and non-motorised transit routes. The
implementation of these projects is well underway, the construction of the new
pedestrian bridge began early in January 2018 and is estimated to be completed by 2018.
Jabulani TOD - The JDA continues to implement strategic, catalytic projects to transform
Jabulani in support of the visionary precinct plan for the area. Projects for 2017/18 and
2018/19 include finishing the new connection over the railway to link Jabulani to Jabavu;
160
upgrading Bolani Road to include safe pedestrian movement whilst accommodating
informal traders and public transport infrastructure and building of a new SAFA sports
facility.
Louis Botha Corridor - Paterson Park and Watt Street Interchange: The construction of a
new social cluster in Paterson Park, consisting of a new library and multi-purpose sports
facilities is underway; together with a new upgraded and expanded park on the northern
side. The completion of the project, which was targeted for the end of 2018/19 may be
delayed as the services of the appointed contractor was terminated and a new contractor
will have to be appointed. With the town-planning approvals in place for Paterson Park’s
redevelopment, the JPC will also release the land recently rezoned for higher density
residential development to the private sector, with conditions of inclusionary housing
attached early in the second quarter of 2018/19.
The Department is also working with the JPC to rezone a number of properties acquired
in the Louis Botha Corridor in order to prepare for the release to the private sector
towards the end of this year. The town-planning applications have been lodged at the
beginning of June and are currently being circulated for comments and public objections.
Construction of Watt Street Interchange, the “bridge” between Alexandra and Sandton,
has been initiated. Detail design of this new connection was completed in the first quarter
and the tender for construction was awarded during the second quarter. Further
engagements with property owners affected by the road closures and construction
especially in Wynberg area took place in the third quarter. Site establishment occurred at
the end of the third quarter and construction is underway. Of concern is the budget
availability for this project in the 2018/19 financial year.
The Department together with the JDA, has initiated a process to review the impact of the City’s
investment over the last couple of years into areas such as Diepsloot, Orange Farm and Ivory Park.
The intention is to re-direct the City’s efforts into new programmes to address the inequality and
poverty apparent in the deprived areas. Assessments were completed for all three areas with a
proposed three year implementation programme. The Department’s intention is to pilot new
interventions in these deprived areas.
In Orange Farm, a second series of engagements with the local farming NGO’s, Gauteng Department
of Agriculture and Rural Development as well as the JPC were held to discuss the unlocking of the
agricultural potential of this area through farming and agro-processing. In the fourth quarter, a
comprehensive list of possible interventions was finalized.
One development intervention was identified for Diepsloot in the first quarter and two projects are
underway to realise this intervention. Both projects contribute to a public environment upgrade in
161
Diepsloot Extension 1. Designs were finalised in the 3rd quarter and construction commenced in the
fourth quarter. In the fourth quarter, a comprehensive list of possible interventions was finalised.
The department has a revised operational expenditure budget of R325.385 million (excluding internal
transfers) and a revised revenue budget of R90.582 million. As at 30 June 2018, R87.238 million
revenue against the target budget of R90.582 million has been received. The under collection relates
amongst other things to Service Charges which includes Building Plan and Land Use Development
Fees.
The overall expenditure incurred amounts to R270.394 million against the target of R325.385 million.
The under expenditure relates mainly to additional budget received during the revision of the budget
towards Security Costs of R11 million but not fully expended, Employee Related Costs of R15.754
million and depreciation of R13 million.
The total revised capital budget for the 2017/18 financial year is R307.322 million, inclusive of the
Transit Orientated Development budget of R85.456 million, Inner City amount of R89 062, grant
funding totaling approximately R127.664 million, Capital Replacement Reserve of R2.640 million and
an amount of R2.5 million for the Management of JSIP relating to capital project budgeting. Actual
expenditure to date amounts to R257.282 million.
The overall year to date capex expenditure reflected in the books of Development Planning is
R257.282 million or 88.12% against the target of R291.956 million (based on 95% of revised budget as
per the SDBIP). Actual expenditure measured against the total revised budget equates to 83.72%.
3.1 Housing Department
The Department of Housing has the mandate to deliver housing opportunities that provide alternative
tenure options; are located close to economic opportunities; are adequately serviced; are affordable;
and are preferably found in high-density environments.
Summary of performance
In 2017/18, performance highlights for the Department of Housing included:
Five informal settlements were upgraded during this financial year;
2 020 rental accommodation units have been completed in the Inner City;
2 075 housing opportunities were created this financial year against the annual target of
2 190;
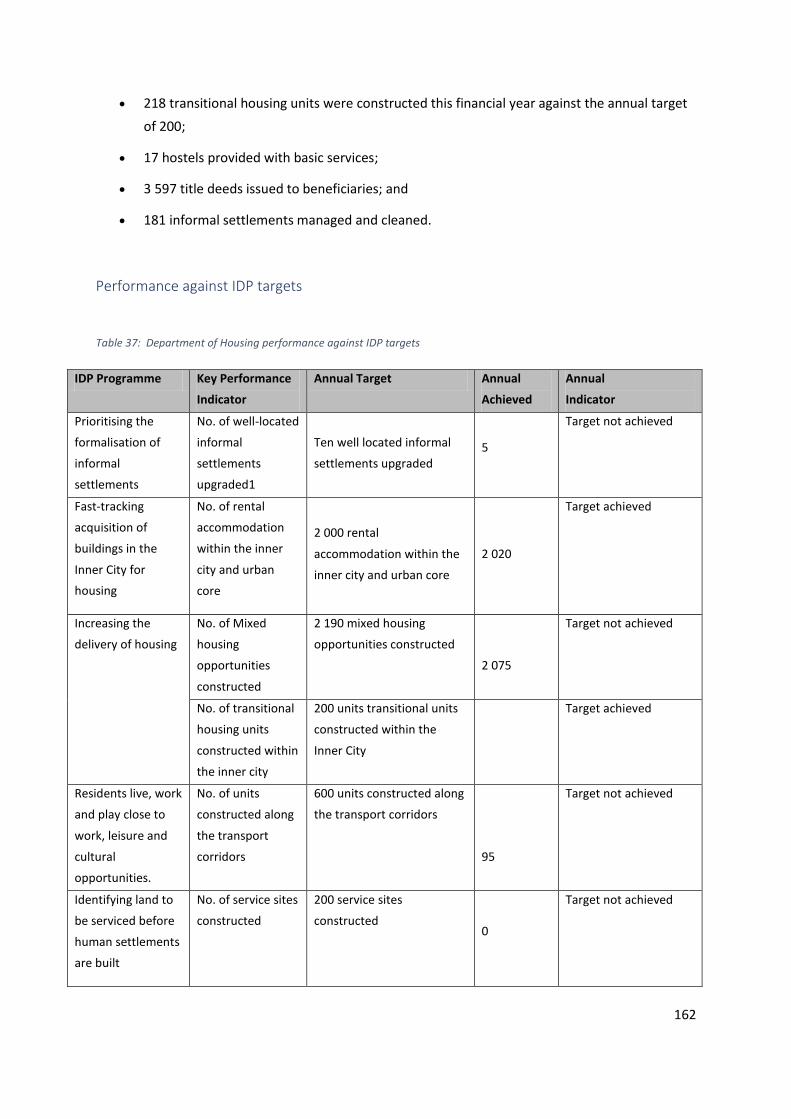
162
218 transitional housing units were constructed this financial year against the annual target
of 200;
17 hostels provided with basic services;
3 597 title deeds issued to beneficiaries; and
181 informal settlements managed and cleaned.
Performance against IDP targets
Table 37: Department of Housing performance against IDP targets
IDP Programme Key Performance
Indicator
Annual Target Annual
Achieved
Annual
Indicator
Prioritising the
formalisation of
informal
settlements
No. of well-located
informal
settlements
upgraded1
Ten well located informal
settlements upgraded 5
Target not achieved
Fast-tracking
acquisition of
buildings in the
Inner City for
housing
No. of rental
accommodation
within the inner
city and urban
core
2 000 rental
accommodation within the
inner city and urban core
2 020
Target achieved
Increasing the
delivery of housing
No. of Mixed
housing
opportunities
constructed
2 190 mixed housing
opportunities constructed
2 075
Target not achieved
No. of transitional
housing units
constructed within
the inner city
200 units transitional units
constructed within the
Inner City
Target achieved
Residents live, work
and play close to
work, leisure and
cultural
opportunities.
No. of units
constructed along
the transport
corridors
600 units constructed along
the transport corridors
95
Target not achieved
Identifying land to
be serviced before
human settlements
are built
No. of service sites
constructed
200 service sites
constructed
0
Target not achieved
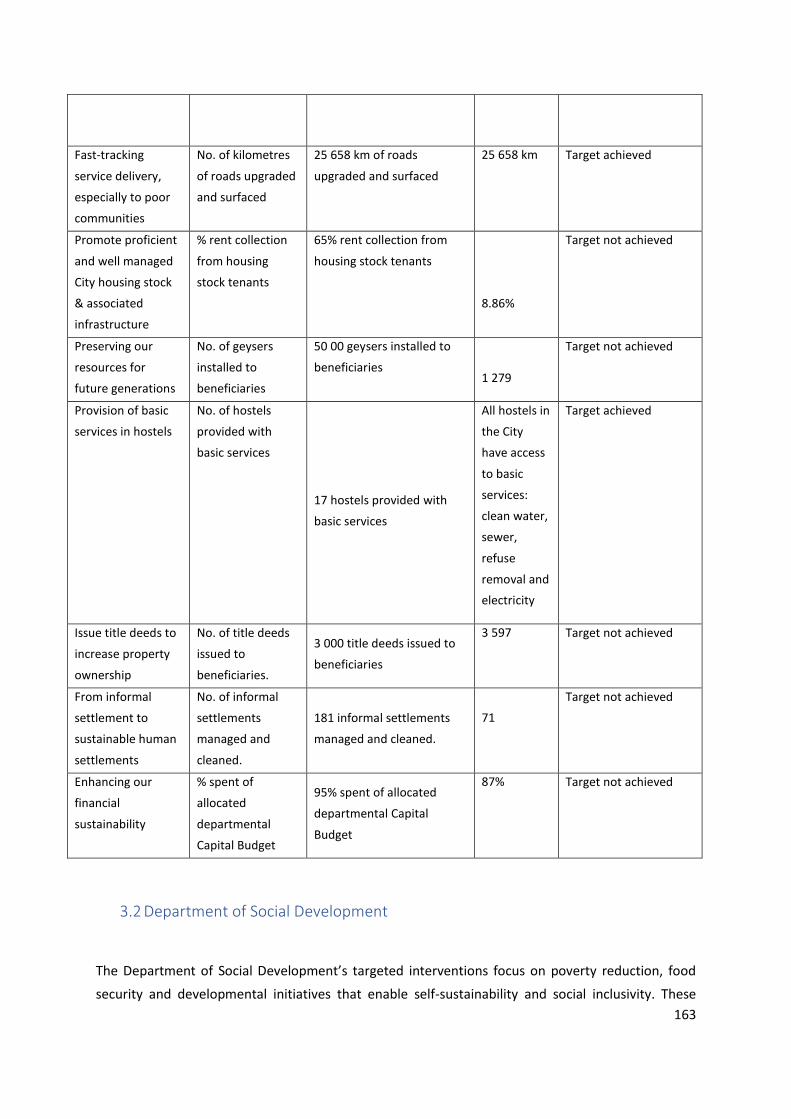
163
3.2 Department of Social Development
The Department of Social Development’s targeted interventions focus on poverty reduction, food
security and developmental initiatives that enable self-sustainability and social inclusivity. These
Fast-tracking
service delivery,
especially to poor
communities
No. of kilometres
of roads upgraded
and surfaced
25 658 km of roads
upgraded and surfaced
25 658 km Target achieved
Promote proficient
and well managed
City housing stock
& associated
infrastructure
% rent collection
from housing
stock tenants
65% rent collection from
housing stock tenants
8.86%
Target not achieved
Preserving our
resources for
future generations
No. of geysers
installed to
beneficiaries
50 00 geysers installed to
beneficiaries
1 279
Target not achieved
Provision of basic
services in hostels
No. of hostels
provided with
basic services
17 hostels provided with
basic services
All hostels in
the City
have access
to basic
services:
clean water,
sewer,
refuse
removal and
electricity
Target achieved
Issue title deeds to
increase property
ownership
No. of title deeds
issued to
beneficiaries.
3 000 title deeds issued to
beneficiaries
3 597 Target not achieved
From informal
settlement to
sustainable human
settlements
No. of informal
settlements
managed and
cleaned.
181 informal settlements
managed and cleaned.
71
Target not achieved
Enhancing our
financial
sustainability
% spent of
allocated
departmental
Capital Budget
95% spent of allocated
departmental Capital
Budget
87% Target not achieved
164
interventions further respond to the conditions of both individual and household poverty by providing
a broad variety of programmes and support services. A critical enabling milestone in addressing the
inter-generational poverty confronting many poor households is food and nutrition security. To this
end the City supports small-scale farmers so that they can contribute to the City’s food trade surplus
through the Agriculture and Food Security Priority Implementation Plan.
The Department’s service offering can be summarised as follows:
• Livelihood and skills development: the Department facilitates and develops livelihood
opportunities linked to food resilience and income-generating opportunities so as to further
develop skills, thereby improving quality of life.
• Social protection: benefits flowing from the enrolment in the Expanded Social Package include
rebates on city services, food support, and social burial support.
• Re-integration of the socially excluded: the Department facilitates social support, such as the
integration and re-integration of ex-offenders, ex-combatants, migrants, people with
disabilities (PWD), homeless people, substance abusers and addicts into community life to
play a positive role.
• Provision of grants and non-financial assistance to NGOs: the Department facilitates funded
and non-financial assistance and capacity building for non-governmental organisations
(NGOs).
• Advocacy and community mobilisation: the Department conducts outreach programmes to
educate the community on the inclusion of the vulnerable and marginalised in economic and
social opportunities.
• Regulatory action: the Department monitors and ensures compliance with policy and
legislation and the progressive enforcement of standards.
Summary of performance
Children’s services conduct assistance from what is referred to as ‘a basket of services.’ These services
include material support, recreational support, educational support, psychosocial support and health
support. For this financial year, a total of 5 941 children were assisted through various programmes
including a toy drive, cultural dance and competition, material support and educational support.
Children also benefitted from Child Protection Events.
A total of 2 734 ECD practitioners were trained through the Children’s Unit on various topics regarding
children, including developmental milestones, nutrition, growth monitoring, health and safety and
first aid and fire-fighting.
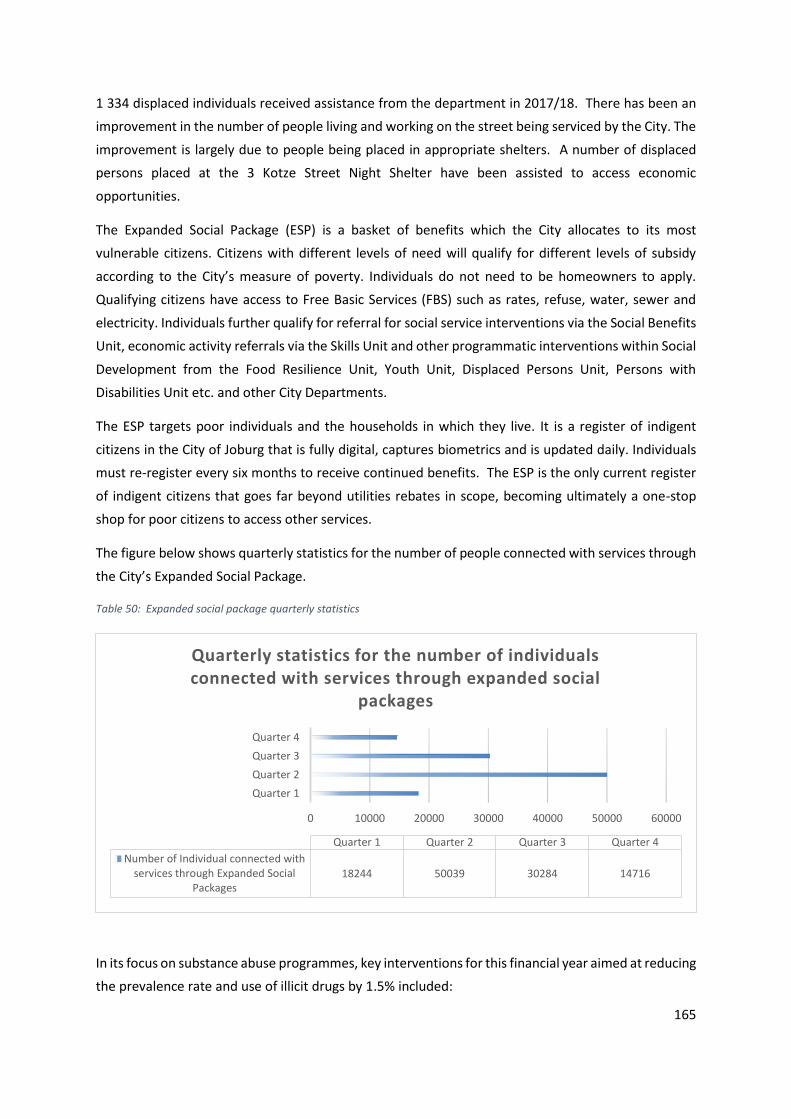
165
1 334 displaced individuals received assistance from the department in 2017/18. There has been an
improvement in the number of people living and working on the street being serviced by the City. The
improvement is largely due to people being placed in appropriate shelters. A number of displaced
persons placed at the 3 Kotze Street Night Shelter have been assisted to access economic
opportunities.
The Expanded Social Package (ESP) is a basket of benefits which the City allocates to its most
vulnerable citizens. Citizens with different levels of need will qualify for different levels of subsidy
according to the City’s measure of poverty. Individuals do not need to be homeowners to apply.
Qualifying citizens have access to Free Basic Services (FBS) such as rates, refuse, water, sewer and
electricity. Individuals further qualify for referral for social service interventions via the Social Benefits
Unit, economic activity referrals via the Skills Unit and other programmatic interventions within Social
Development from the Food Resilience Unit, Youth Unit, Displaced Persons Unit, Persons with
Disabilities Unit etc. and other City Departments.
The ESP targets poor individuals and the households in which they live. It is a register of indigent
citizens in the City of Joburg that is fully digital, captures biometrics and is updated daily. Individuals
must re-register every six months to receive continued benefits. The ESP is the only current register
of indigent citizens that goes far beyond utilities rebates in scope, becoming ultimately a one-stop
shop for poor citizens to access other services.
The figure below shows quarterly statistics for the number of people connected with services through
the City’s Expanded Social Package.
Table 50: Expanded social package quarterly statistics
In its focus on substance abuse programmes, key interventions for this financial year aimed at reducing
the prevalence rate and use of illicit drugs by 1.5% included:
0 10000 20000 30000 40000 50000 60000
Quarter 1
Quarter 2
Quarter 3
Quarter 4
Quarter 1 Quarter 2 Quarter 3 Quarter 4
Number of Individual connected withservices through Expanded Social
Packages18244 50039 30284 14716
Quarterly statistics for the number of individuals connected with services through expanded social
packages
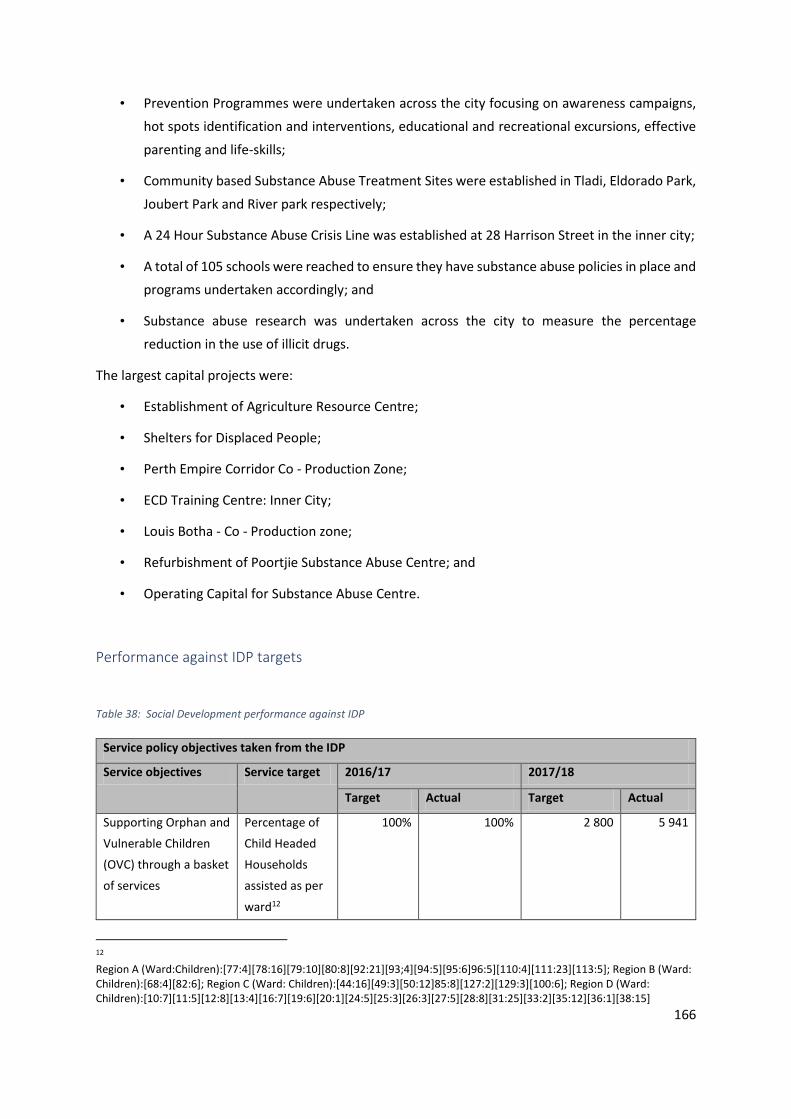
166
• Prevention Programmes were undertaken across the city focusing on awareness campaigns,
hot spots identification and interventions, educational and recreational excursions, effective
parenting and life-skills;
• Community based Substance Abuse Treatment Sites were established in Tladi, Eldorado Park,
Joubert Park and River park respectively;
• A 24 Hour Substance Abuse Crisis Line was established at 28 Harrison Street in the inner city;
• A total of 105 schools were reached to ensure they have substance abuse policies in place and
programs undertaken accordingly; and
• Substance abuse research was undertaken across the city to measure the percentage
reduction in the use of illicit drugs.
The largest capital projects were:
• Establishment of Agriculture Resource Centre;
• Shelters for Displaced People;
• Perth Empire Corridor Co - Production Zone;
• ECD Training Centre: Inner City;
• Louis Botha - Co - Production zone;
• Refurbishment of Poortjie Substance Abuse Centre; and
• Operating Capital for Substance Abuse Centre.
Performance against IDP targets
Table 38: Social Development performance against IDP
Service policy objectives taken from the IDP
Service objectives Service target 2016/17 2017/18
Target Actual Target Actual
Supporting Orphan and
Vulnerable Children
(OVC) through a basket
of services
Percentage of
Child Headed
Households
assisted as per
ward12
100% 100% 2 800
5 941
12 Region A (Ward:Children):[77:4][78:16][79:10][80:8][92:21][93;4][94:5][95:6]96:5][110:4][111:23][113:5]; Region B (Ward: Children):[68:4][82:6]; Region C (Ward: Children):[44:16][49:3][50:12]85:8][127:2][129:3][100:6]; Region D (Ward: Children):[10:7][11:5][12:8][13:4][16:7][19:6][20:1][24:5][25:3][26:3][27:5][28:8][31:25][33:2][35:12][36:1][38:15]
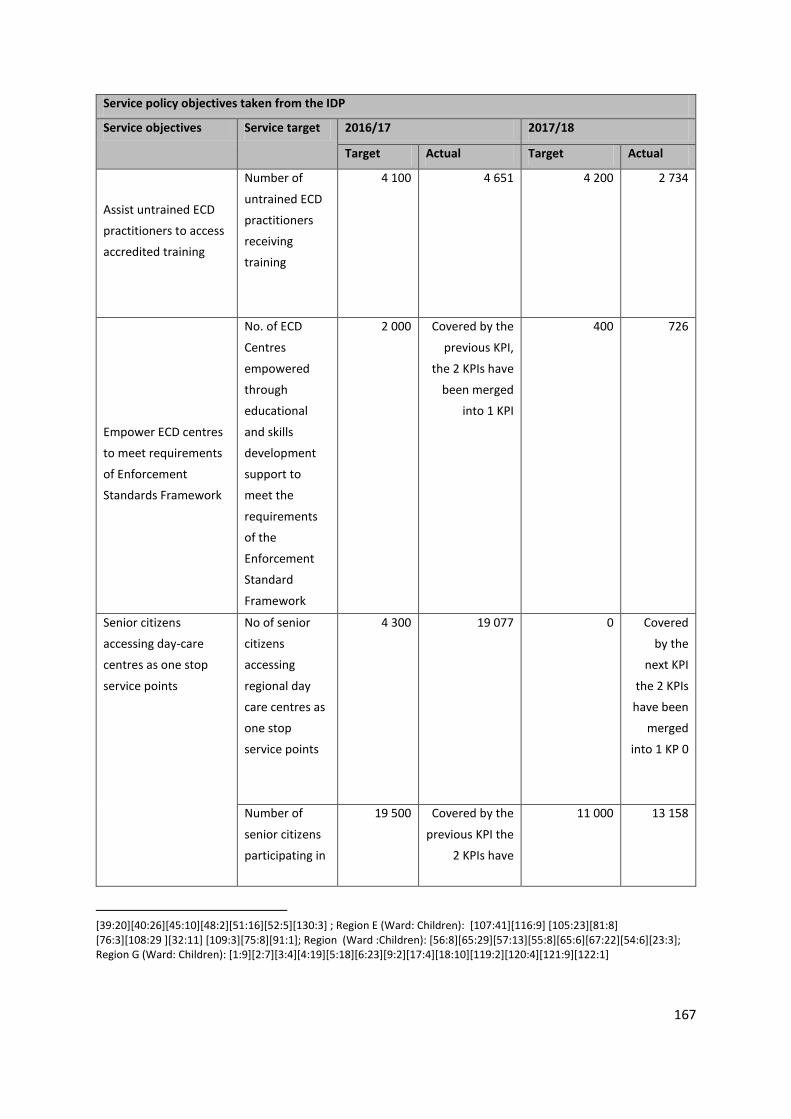
167
Service policy objectives taken from the IDP
Service objectives Service target 2016/17 2017/18
Target Actual Target Actual
Assist untrained ECD
practitioners to access
accredited training
Number of
untrained ECD
practitioners
receiving
training
4 100 4 651 4 200 2 734
Empower ECD centres
to meet requirements
of Enforcement
Standards Framework
No. of ECD
Centres
empowered
through
educational
and skills
development
support to
meet the
requirements
of the
Enforcement
Standard
Framework
2 000 Covered by the
previous KPI,
the 2 KPIs have
been merged
into 1 KPI
400 726
Senior citizens
accessing day-care
centres as one stop
service points
No of senior
citizens
accessing
regional day
care centres as
one stop
service points
4 300 19 077 0 Covered
by the
next KPI
the 2 KPIs
have been
merged
into 1 KP 0
Number of
senior citizens
participating in
19 500 Covered by the
previous KPI the
2 KPIs have
11 000 13 158
[39:20][40:26][45:10][48:2][51:16][52:5][130:3] ; Region E (Ward: Children): [107:41][116:9] [105:23][81:8] [76:3][108:29 ][32:11] [109:3][75:8][91:1]; Region (Ward :Children): [56:8][65:29][57:13][55:8][65:6][67:22][54:6][23:3]; Region G (Ward: Children): [1:9][2:7][3:4][4:19][5:18][6:23][9:2][17:4][18:10][119:2][120:4][121:9][122:1]
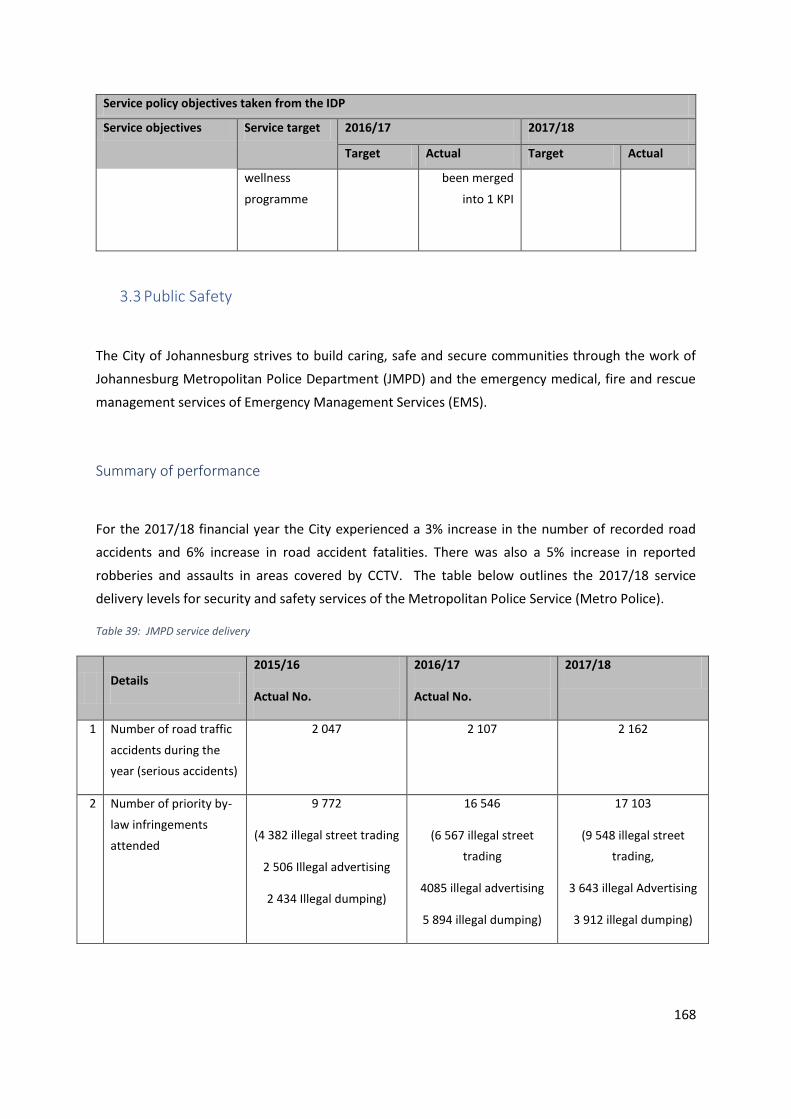
168
Service policy objectives taken from the IDP
Service objectives Service target 2016/17 2017/18
Target Actual Target Actual
wellness
programme
been merged
into 1 KPI
3.3 Public Safety
The City of Johannesburg strives to build caring, safe and secure communities through the work of
Johannesburg Metropolitan Police Department (JMPD) and the emergency medical, fire and rescue
management services of Emergency Management Services (EMS).
Summary of performance
For the 2017/18 financial year the City experienced a 3% increase in the number of recorded road
accidents and 6% increase in road accident fatalities. There was also a 5% increase in reported
robberies and assaults in areas covered by CCTV. The table below outlines the 2017/18 service
delivery levels for security and safety services of the Metropolitan Police Service (Metro Police).
Table 39: JMPD service delivery
Details 2015/16
Actual No.
2016/17
Actual No.
2017/18
1 Number of road traffic
accidents during the
year (serious accidents)
2 047 2 107 2 162
2 Number of priority by-
law infringements
attended
9 772
(4 382 illegal street trading
2 506 Illegal advertising
2 434 Illegal dumping)
16 546
(6 567 illegal street
trading
4085 illegal advertising
5 894 illegal dumping)
17 103
(9 548 illegal street
trading,
3 643 illegal Advertising
3 912 illegal dumping)
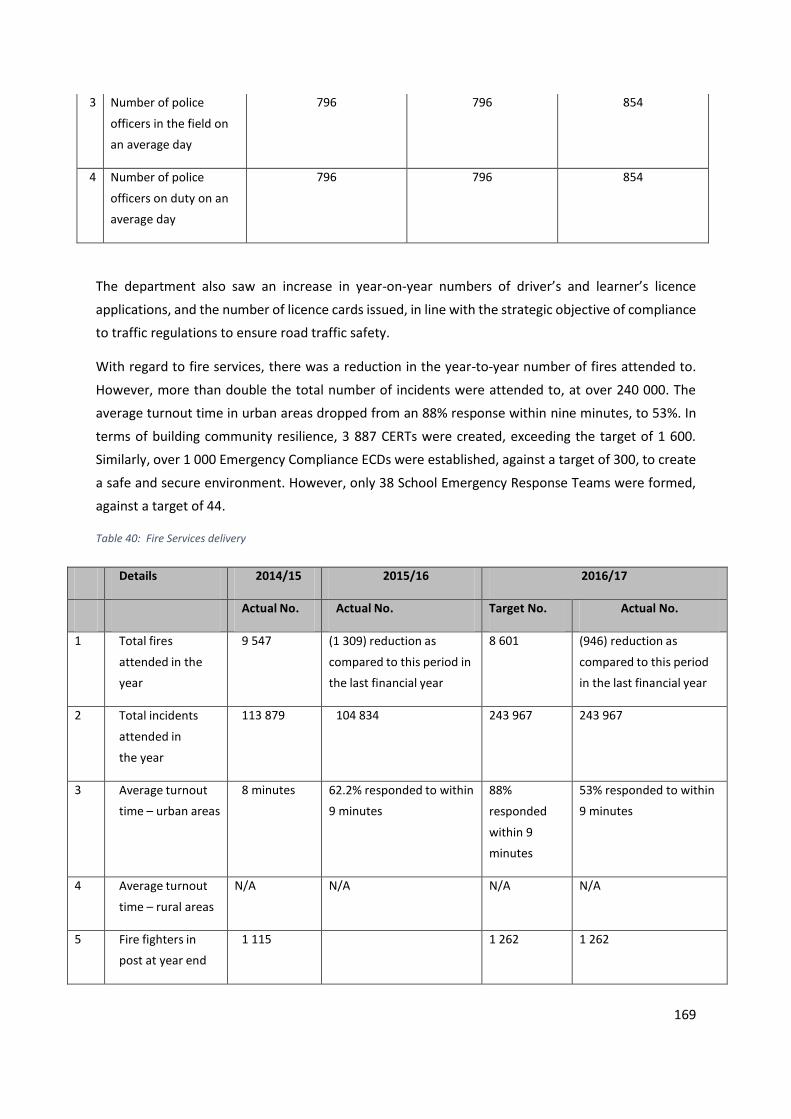
169
3 Number of police
officers in the field on
an average day
796 796 854
4 Number of police
officers on duty on an
average day
796 796 854
The department also saw an increase in year-on-year numbers of driver’s and learner’s licence
applications, and the number of licence cards issued, in line with the strategic objective of compliance
to traffic regulations to ensure road traffic safety.
With regard to fire services, there was a reduction in the year-to-year number of fires attended to.
However, more than double the total number of incidents were attended to, at over 240 000. The
average turnout time in urban areas dropped from an 88% response within nine minutes, to 53%. In
terms of building community resilience, 3 887 CERTs were created, exceeding the target of 1 600.
Similarly, over 1 000 Emergency Compliance ECDs were established, against a target of 300, to create
a safe and secure environment. However, only 38 School Emergency Response Teams were formed,
against a target of 44.
Table 40: Fire Services delivery
Details 2014/15 2015/16 2016/17
Actual No. Actual No. Target No. Actual No.
1 Total fires
attended in the
year
9 547 (1 309) reduction as
compared to this period in
the last financial year
8 601 (946) reduction as
compared to this period
in the last financial year
2 Total incidents
attended in
the year
113 879
104 834
243 967 243 967
3 Average turnout
time – urban areas
8 minutes
62.2% responded to within
9 minutes
88%
responded
within 9
minutes
53% responded to within
9 minutes
4 Average turnout
time – rural areas
N/A N/A N/A N/A
5 Fire fighters in
post at year end
1 115 1 262 1 262
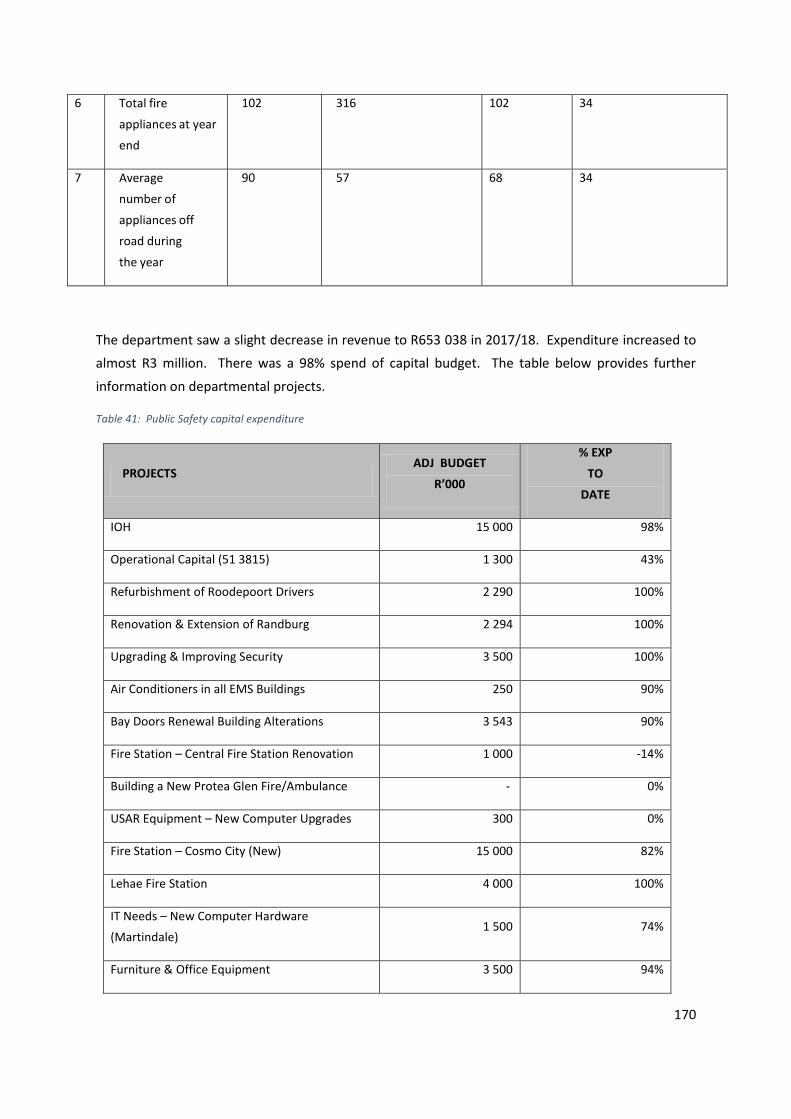
170
The department saw a slight decrease in revenue to R653 038 in 2017/18. Expenditure increased to
almost R3 million. There was a 98% spend of capital budget. The table below provides further
information on departmental projects.
Table 41: Public Safety capital expenditure
PROJECTS ADJ BUDGET
R’000
% EXP
TO
DATE
IOH 15 000 98%
Operational Capital (51 3815) 1 300 43%
Refurbishment of Roodepoort Drivers 2 290 100%
Renovation & Extension of Randburg 2 294 100%
Upgrading & Improving Security 3 500 100%
Air Conditioners in all EMS Buildings 250 90%
Bay Doors Renewal Building Alterations 3 543 90%
Fire Station – Central Fire Station Renovation 1 000 -14%
Building a New Protea Glen Fire/Ambulance - 0%
USAR Equipment – New Computer Upgrades 300 0%
Fire Station – Cosmo City (New) 15 000 82%
Lehae Fire Station 4 000 100%
IT Needs – New Computer Hardware
(Martindale) 1 500 74%
Furniture & Office Equipment 3 500 94%
6 Total fire
appliances at year
end
102
316
102 34
7 Average
number of
appliances off
road during
the year
90
57
68 34
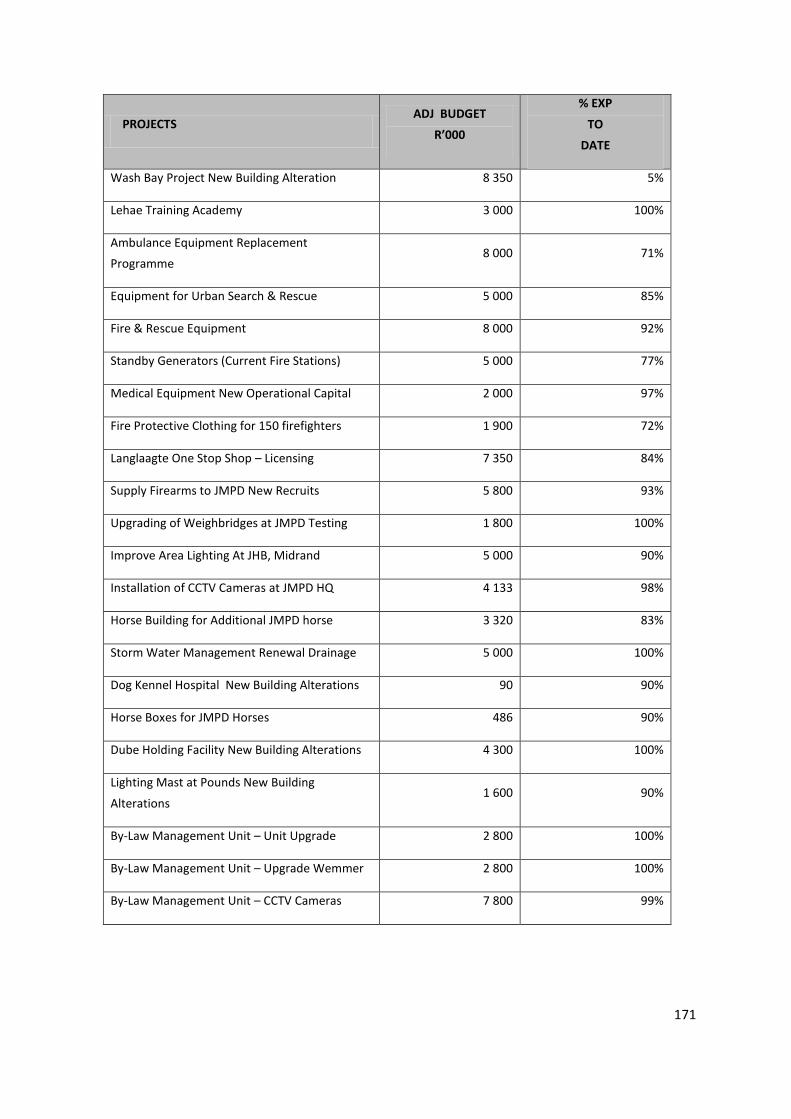
171
PROJECTS ADJ BUDGET
R’000
% EXP
TO
DATE
Wash Bay Project New Building Alteration 8 350 5%
Lehae Training Academy 3 000 100%
Ambulance Equipment Replacement
Programme 8 000 71%
Equipment for Urban Search & Rescue 5 000 85%
Fire & Rescue Equipment 8 000 92%
Standby Generators (Current Fire Stations) 5 000 77%
Medical Equipment New Operational Capital 2 000 97%
Fire Protective Clothing for 150 firefighters 1 900 72%
Langlaagte One Stop Shop – Licensing 7 350 84%
Supply Firearms to JMPD New Recruits 5 800 93%
Upgrading of Weighbridges at JMPD Testing 1 800 100%
Improve Area Lighting At JHB, Midrand 5 000 90%
Installation of CCTV Cameras at JMPD HQ 4 133 98%
Horse Building for Additional JMPD horse 3 320 83%
Storm Water Management Renewal Drainage 5 000 100%
Dog Kennel Hospital New Building Alterations 90 90%
Horse Boxes for JMPD Horses 486 90%
Dube Holding Facility New Building Alterations 4 300 100%
Lighting Mast at Pounds New Building
Alterations 1 600 90%
By-Law Management Unit – Unit Upgrade 2 800 100%
By-Law Management Unit – Upgrade Wemmer 2 800 100%
By-Law Management Unit – CCTV Cameras 7 800 99%
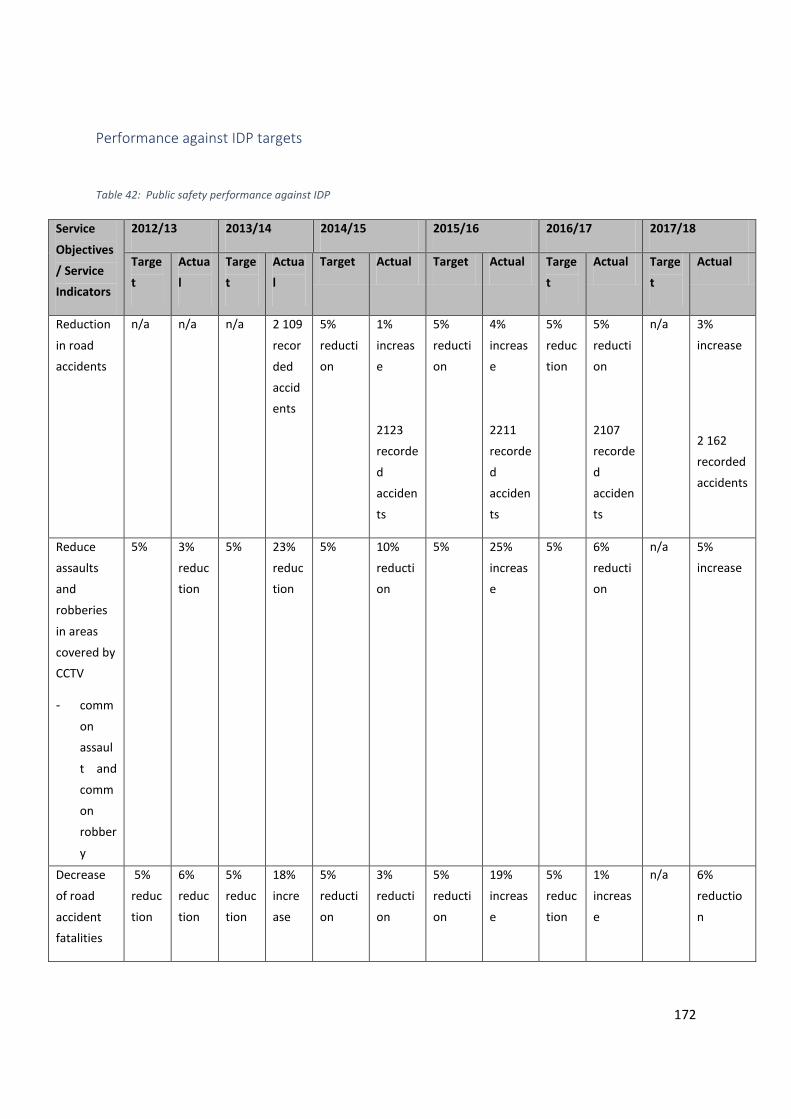
172
Performance against IDP targets
Table 42: Public safety performance against IDP
Service
Objectives
/ Service
Indicators
2012/13 2013/14 2014/15 2015/16 2016/17 2017/18
Targe
t
Actua
l
Targe
t
Actua
l
Target Actual Target Actual Targe
t
Actual Targe
t
Actual
Reduction
in road
accidents
n/a n/a n/a
2 109
recor
ded
accid
ents
5%
reducti
on
1%
increas
e
2123
recorde
d
acciden
ts
5%
reducti
on
4%
increas
e
2211
recorde
d
acciden
ts
5%
reduc
tion
5%
reducti
on
2107
recorde
d
acciden
ts
n/a 3%
increase
2 162
recorded
accidents
Reduce
assaults
and
robberies
in areas
covered by
CCTV
- comm
on
assaul
t and
comm
on
robber
y
5% 3%
reduc
tion
5% 23%
reduc
tion
5% 10%
reducti
on
5% 25%
increas
e
5% 6%
reducti
on
n/a 5%
increase
Decrease
of road
accident
fatalities
5%
reduc
tion
6%
reduc
tion
5%
reduc
tion
18%
incre
ase
5%
reducti
on
3%
reducti
on
5%
reducti
on
19%
increas
e
5%
reduc
tion
1%
increas
e
n/a 6%
reductio
n
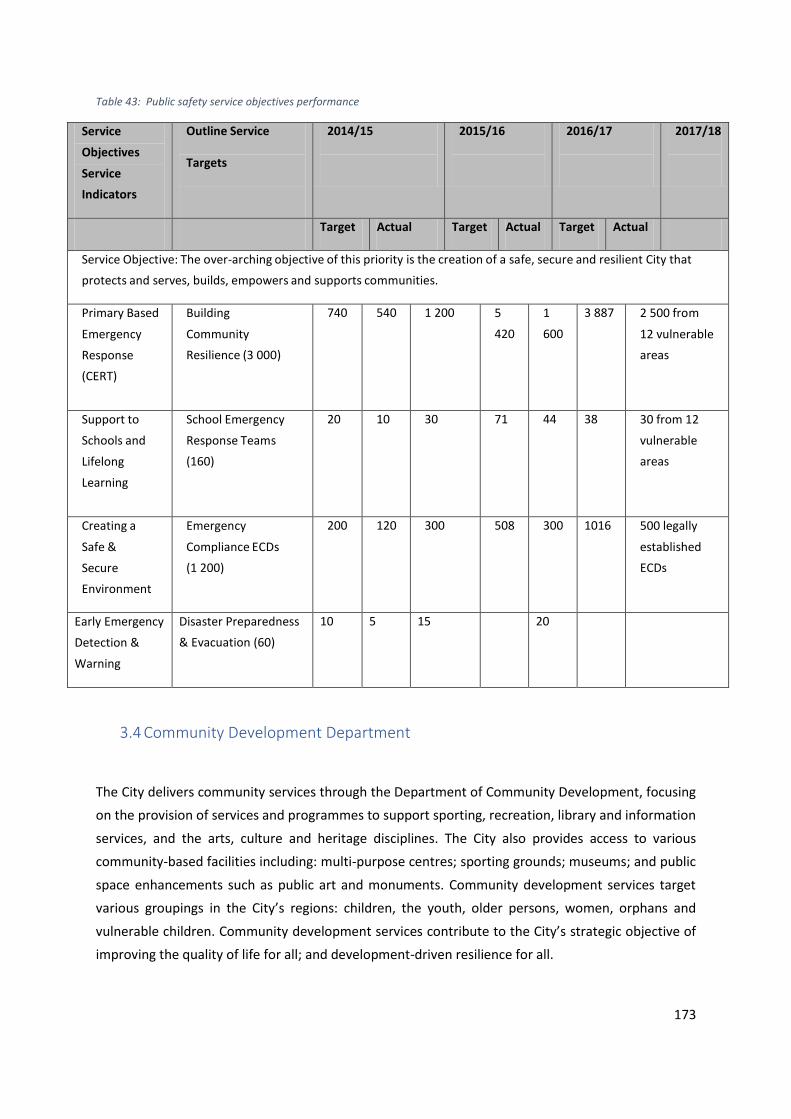
173
Table 43: Public safety service objectives performance
Service
Objectives
Service
Indicators
Outline Service
Targets
2014/15
2015/16
2016/17
2017/18
Target Actual Target Actual Target Actual
Service Objective: The over-arching objective of this priority is the creation of a safe, secure and resilient City that
protects and serves, builds, empowers and supports communities.
Primary Based
Emergency
Response
(CERT)
Building
Community
Resilience (3 000)
740
540
1 200
5
420
1
600
3 887 2 500 from
12 vulnerable
areas
Support to
Schools and
Lifelong
Learning
School Emergency
Response Teams
(160)
20
10
30
71
44
38 30 from 12
vulnerable
areas
Creating a
Safe &
Secure
Environment
Emergency
Compliance ECDs
(1 200)
200
120
300
508
300
1016 500 legally
established
ECDs
Early Emergency
Detection &
Warning
Disaster Preparedness
& Evacuation (60)
10 5 15 20
3.4 Community Development Department
The City delivers community services through the Department of Community Development, focusing
on the provision of services and programmes to support sporting, recreation, library and information
services, and the arts, culture and heritage disciplines. The City also provides access to various
community-based facilities including: multi-purpose centres; sporting grounds; museums; and public
space enhancements such as public art and monuments. Community development services target
various groupings in the City’s regions: children, the youth, older persons, women, orphans and
vulnerable children. Community development services contribute to the City’s strategic objective of
improving the quality of life for all; and development-driven resilience for all.

174
Summary of performance
The Sport and Recreation Directorate exceeded the target of 4.6 million users at sport and recreation
facilities and recorded more than 600 000 bathers for City swimming pools during the 2017/18
swimming season. Due to changing weather patterns and overwhelming user demand the season was
extended by a month, running from 1 September 2017 to 30 April 2018.
With the focus on healthy living and quality of life, the Directorate hosted the Johannesburg
Recreation Summit as well as the Regional Summit in collaboration with Provincial Sport, Arts, Culture
and Heritage, in March 2018, to drive the Provincial Recreation Policy. This was an important step in
the acknowledgement of the value of recreation in communities and the impact made at the 116
recreation centres in Johannesburg that provides more than 600 programmes annually to the broader
community.
Collaborations between the Directorate and external stakeholders was the key to the successful
staging of more than 21 sport development tournaments during the 2017/18 financial year, which
included tournaments i.e. Steven Pienaar Soccer, Maimane Phiri, Tsalanang Community Games, Kwa
Mahlobo Community Games and Simunye Boxing tournament, to name a few.
The City collaborated for the 3rd consecutive year in hosting the International Arnold Classic Sports
Festival with great success, promoting 50 different sporting codes and boasted an all-time high
number of 40 000 visitors and 25 000 participants. The Soweto Marathon signed up more than 20 000
participants proving that the City of Johannesburg is a Sporting City of Choice. City Stadia such as the
FNB Stadium hosted events including Barcelona vs Mamelodi Sundowns , Youth Commemoration Day
as well as the funeral of Winnie Madikezela Mandela at Orlando Stadium
One of the highlights of 2017/18 was the participation in the Sonchini Games, where the City in
collaboration with its provincial counterparts hosted games at eight different facilities across the city,
in order to select 250 youth to represent Johannesburg in Italy during the month of July 2018. This
participation’s focus is that of the promotion and development of sporting youth, exposing young
sport stars to the international scene.
Individualised sport and fitness activities are on the rise, as can be seen in the increased participation
in aerobics on a daily basis at recreation centres and street aerobics, on Saturdays. Streets are taken
over on Saturday mornings in Region A and E and sessions are held in alternative wards, with great
success. Over 5 000 participants have been recorded as participating in street aerobics during the
past financial year. Communities are increasingly doing sport such as walking, running and swimming
to stay fit, rather than getting fit to play sport. This change of focus allows the department to present
more and more mass participation programmes to encourage fitness and a healthy lifestyle.
175
Sustainable programmes during 2017/18 at sport and recreation facilities, included senior citizens
clubs at 47 recreation centres, learn to swim programmes at 12 swimming pools and boxing at 23
facilities across the City as part of the basket of services.
The Department’s ultimate highlight for the 2017/18 financial year was the visit of Usain Bolt -
International Athletic Legend and World Record holder for the 100 and 200m sprints, to the Ruimsig
Athletic Stadium in Region C on 29 January 2018. Pumas sponsored Husain to attend and also
empowered young athletics by means of talent identification.
During 2017/18, the Library and Information Services Directorate (LIS) delivered educational and
developmental programmes in the 88 facilities across the City. Following the approval of the extension
of library operational hours by the Mayoral Committee on 20 April 2017, and the Executive Mayor’s
announcement in the 2017 State of the City address, 11 regional libraries across the city opened their
doors on 1 July 2017 from 09:00 to 17:00 on Saturdays. An accumulative total of beneficiaries of the
extended hours in 2017/18 was 26 953 which also contributed to the overall usage of facilities. Despite
the temporary closure of a number of libraries (Roodepoort, Noordgesig, Randburg and Linden) for
major repairs, maintenance and renovations, over 5.6 million community members used the LIS
facilities in 2017/18.
The Smart City and Innovation programme through eLearning programmes encouraged communities
to utilise the eWorld and free WiFi platforms via their own devices to bridge the digital divide, create
opportunities for youth employability and increase their techno literacy skills. A cumulative total of
56 320 individuals benefited from these programmes across the City which included a variety of
training programmes for staff and community members. Such techno literacy and mobile literacy
programmes were delivered to school children, youth, senior citizens, aspiring entrepreneurs etc.
As the country is struggling with children’s literacy, the City contributed to alleviating the challenge by
continuing to implement four reading development programmes to promote a culture of reading and
create a nation of readers. LIS partnered with 214 ECD centres and 495 schools, and a total of 27 458
beneficiaries were recorded.
The school holiday programmes aim to bring fun reading programmes at City’s libraries to promote
social cohesion and library usage. Children are introduced to reading in a fun and exciting manner
essential to lifelong learning. A total number of 9 661 children enjoyed the four holiday programmes
held in 2017/18. These programmes encouraged participation from a wide range of communities and
focuses on children from print poor environments.
Literacy training classes were directed at improving the quality of life of community members and
foreign nationals that previously could not read in English. The programme recorded a total number
of 1 586 participants which included 370 migrants. The classes for the 370 migrants offered proficiency
level in English language at Hillbrow and Yeoville libraries in wards 64 and 66 respectively.
176
The outreach of library services to seven correctional services, 24 old age homes and eight people
with disabilities (PWDs) establishments was delivered through the circulation of books, reading
materials and support programmes. As a contribution to the Diphetogo initiative of the City, a drug
awareness programme was delivered at the Nishtara Alcohol and Drug Centre in Lenasia. The total
number of beneficiaries of the self-help/motivational reading discussions and colouring therapy
sessions throughout the year was 56.
In the area of the live arts, the Arts Alive Festival continues to be a major platform for promoting the
creative industries in the month of September, which is also Heritage Month. Following on after the
Arts Alive Festival is the Joburg Carnival to mark the end of the year. The Joburg Carnival is yet another
platform for unearthing new talent.
Blue Heritage plaques with City branding were installed and unveiled at 11 sites in 2017/18.
The Newtown Heads, a public art installation of 560 carved wooden heads that sit on plinths across
the Newtown Cultural Precinct, have become one of Newtown’s most iconic features over the last 17
years. In 2018 the Directorate of Arts, Culture and Heritage started to restore and repair these much–
loved public artworks, many of which have become severely damaged or destroyed over years.
The refurbishment of the Newtown heads was spearheaded by sculptor Americo Guambe who led the
original team of artists who first created the heads in 2001. Made from old railway sleepers, each
hand-carved head is unique, representing a sea of faces from across the African continent.
The first phase of the refurbishment, carried out in 2018, has seen the restoration and replacement
of 196 heads around Mary Fitzgerald Square and along the pedestrianised walkway that connects the
square to Helen Joseph Street. The first phase was completed successfully, but the project is
incomplete. A second phase should address the other wooden heads in the Newtown Cultural
Precinct, which are in need of repair or replacement, and which have not yet been attended to. This
will be subject to budget being made available.
The upgrading of the Mendi Monument in Avalon Cemetery, has been successfully brought to
completion. The monument has been increased in scope and size and improved with the addition of
new design elements. The new design incorporates key elements from the existing monument,
including granite panels carrying the names of those who died. Sandblasted granite panels have been
added, carrying the narrative of the sinking of the troopship SS Mendi, with accompanying images.
177
3.5 Health Department
The Health Department is mandated to develop a high quality, efficient, equitable health system that
is accessible to all of Johannesburg's residents. The Department is responsible for the provision of
primary health care services in the City of Johannesburg through its network of 81 clinics (80 fixed and
one satellite).
The City’s clinics operate in conjunction with health facilities managed by the Gauteng Department of
Health, which include: 42 clinics; 11 community health centres; two district hospitals (South Rand and
Bheki Mlangeni); three regional hospitals (Rahima Moosa, Helen Joseph and Edenvale), two tertiary
hospitals (Chris Hani Baragwanath, Charlotte Maxeke); and two specialised hospitals (Tara and Sizwe
Tropical). There is also one non-governmental organisation that renders primary health care services,
namely Witkoppen Clinic.
The City is also responsible for the delivery of municipal health services (environmental health
services) that are provided as a legislative obligation bestowed to the City in terms of the National
Health Act 61 of 2003. Municipal health services encompass those aspects of human health that are
determined by physical, chemical, biological, social and psycho-social factors in the environment.
The City through the Municipal Health Services is therefore mandated to protect the environment and
to safeguard the public from contracting communicable diseases from food, water and other
environmental impacts. This service is an obligatory service to be rendered by the municipalities and
is defined in the National Health Act, 2003, as “Municipal Health Services”.
Municipal Health Services are listed as:
Water quality monitoring;
Food control;
Waste management;
Health surveillance of premises;
Surveillance and prevention of communicable diseases, excluding immunisation;
Vector control;
Environmental pollution control;
Disposal of the dead; and
Chemical safety.
The City’s Health Department also contributes to the strengthening the delivery of primary healthcare
services by:
178
Strengthening district health systems through improved access to primary health care
services;
Training and deploying municipal, ward-based outreach teams (WBOT);
Facilitating functional integration and rationalisation of health facilities;
Improving health literacy levels;
Community participation and co-operative governance in health;
Improving access to antenatal care services;
Improving the TB cure rates;
Increasing the number of clinics providing ARV and HIV treatment services; and
Consolidating the City’s focus on Environmental Health Services (Municipal Health Services)
through promotional, educational and enforcement programmes.
Summary of performance
Highlights in 2017/18 include:
The Executive Mayor’s Integrated Pilot Project was launched on 31 October 2016 at
Princess Clinic. Since then this project has been extended to 13 clinics in the City.
Since the launch of the eHealth@Joburg that took place at Jabavu Clinic on 8 June 2016,
a total of 64 clinics now have the electronic health record system.
The Department saw a 93.8% compliance to food safety legislation by formal food
premises inspected, and a 91.6% compliance to food safety legislation by informal food
premises inspected. Environmental health had a 93% compliance to relevant legislation
by schools.
114 nurses and 11 doctors were trained in 2017/18, and there was an 8.3% increase in
antenatal care.
Between July 2017 and May 2018, 88.9% of people tested positive for HIV and were
initiated on treatment; 94.3% people tested positive for TB and initiated on treatment;
and 102.3% under 1 year immunisation coverage was completed.
There was a 98% expenditure on the allocated capital budget.
93 wards had chronic diseases support groups established.
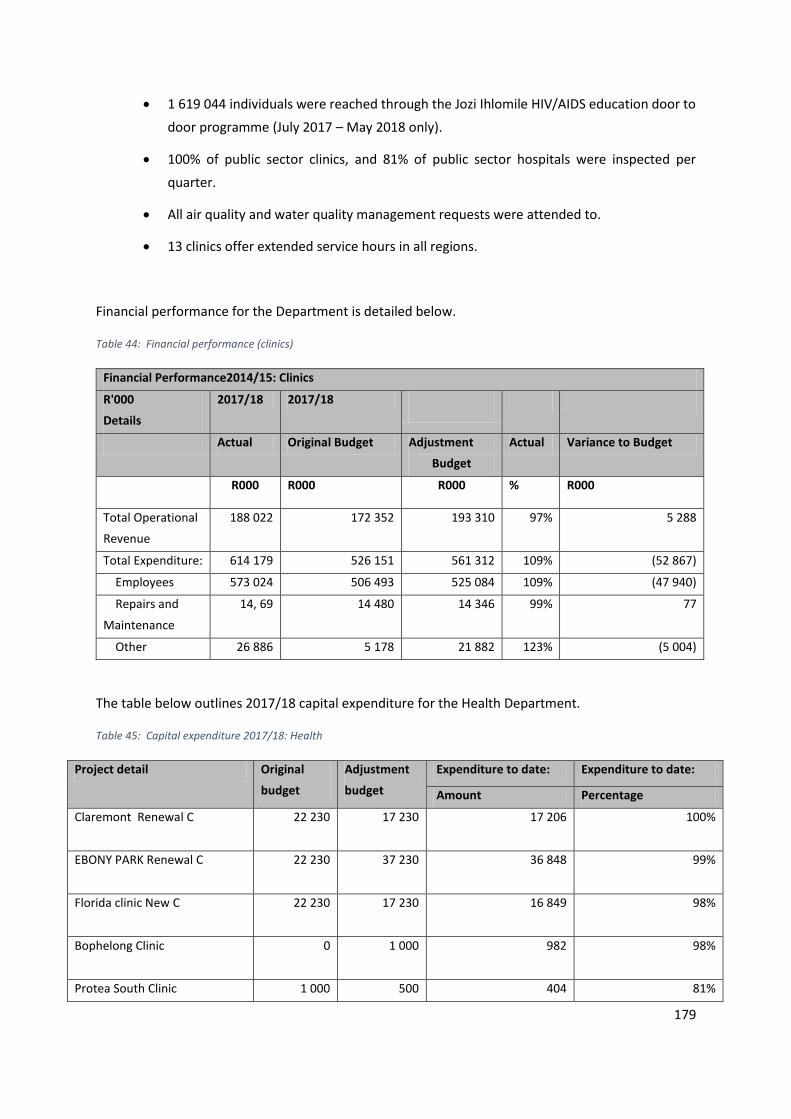
179
1 619 044 individuals were reached through the Jozi Ihlomile HIV/AIDS education door to
door programme (July 2017 – May 2018 only).
100% of public sector clinics, and 81% of public sector hospitals were inspected per
quarter.
All air quality and water quality management requests were attended to.
13 clinics offer extended service hours in all regions.
Financial performance for the Department is detailed below.
Table 44: Financial performance (clinics)
Financial Performance2014/15: Clinics
R'000
Details
2017/18 2017/18
Actual Original Budget Adjustment
Budget
Actual Variance to Budget
R000 R000 R000 % R000
Total Operational
Revenue
188 022 172 352 193 310 97% 5 288
Total Expenditure: 614 179 526 151 561 312 109% (52 867)
Employees 573 024 506 493 525 084 109% (47 940)
Repairs and
Maintenance
14, 69 14 480 14 346 99% 77
Other 26 886 5 178 21 882 123% (5 004)
The table below outlines 2017/18 capital expenditure for the Health Department.
Table 45: Capital expenditure 2017/18: Health
Project detail Original
budget
Adjustment
budget
Expenditure to date: Expenditure to date:
Amount Percentage
Claremont Renewal C
22 230 17 230 17 206 100%
EBONY PARK Renewal C
22 230 37 230 36 848 99%
Florida clinic New C
22 230 17 230 16 849 98%
Bophelong Clinic
0 1 000 982 98%
Protea South Clinic 1 000 500 404 81%
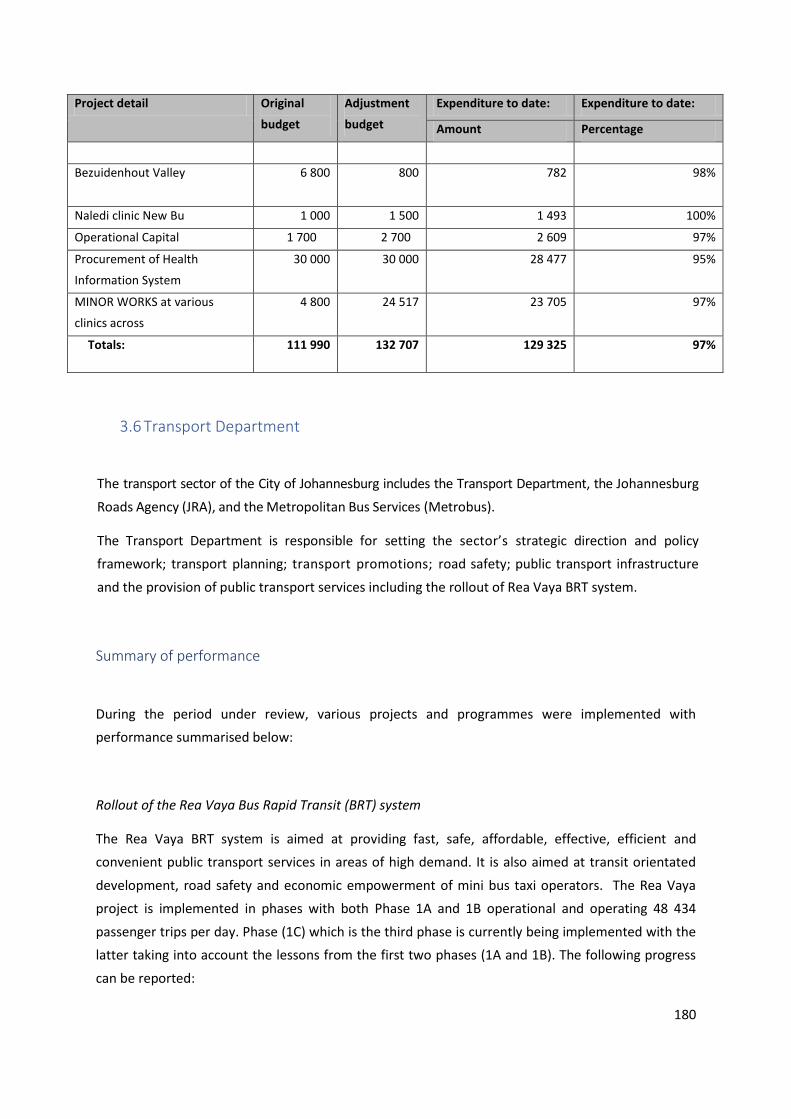
180
Project detail Original
budget
Adjustment
budget
Expenditure to date: Expenditure to date:
Amount Percentage
Bezuidenhout Valley
6 800 800 782 98%
Naledi clinic New Bu 1 000 1 500 1 493 100%
Operational Capital 1 700 2 700 2 609 97%
Procurement of Health
Information System
30 000 30 000 28 477 95%
MINOR WORKS at various
clinics across
4 800 24 517 23 705 97%
Totals: 111 990 132 707 129 325 97%
3.6 Transport Department
The transport sector of the City of Johannesburg includes the Transport Department, the Johannesburg
Roads Agency (JRA), and the Metropolitan Bus Services (Metrobus).
The Transport Department is responsible for setting the sector’s strategic direction and policy
framework; transport planning; transport promotions; road safety; public transport infrastructure
and the provision of public transport services including the rollout of Rea Vaya BRT system.
Summary of performance
During the period under review, various projects and programmes were implemented with
performance summarised below:
Rollout of the Rea Vaya Bus Rapid Transit (BRT) system
The Rea Vaya BRT system is aimed at providing fast, safe, affordable, effective, efficient and
convenient public transport services in areas of high demand. It is also aimed at transit orientated
development, road safety and economic empowerment of mini bus taxi operators. The Rea Vaya
project is implemented in phases with both Phase 1A and 1B operational and operating 48 434
passenger trips per day. Phase (1C) which is the third phase is currently being implemented with the
latter taking into account the lessons from the first two phases (1A and 1B). The following progress
can be reported:
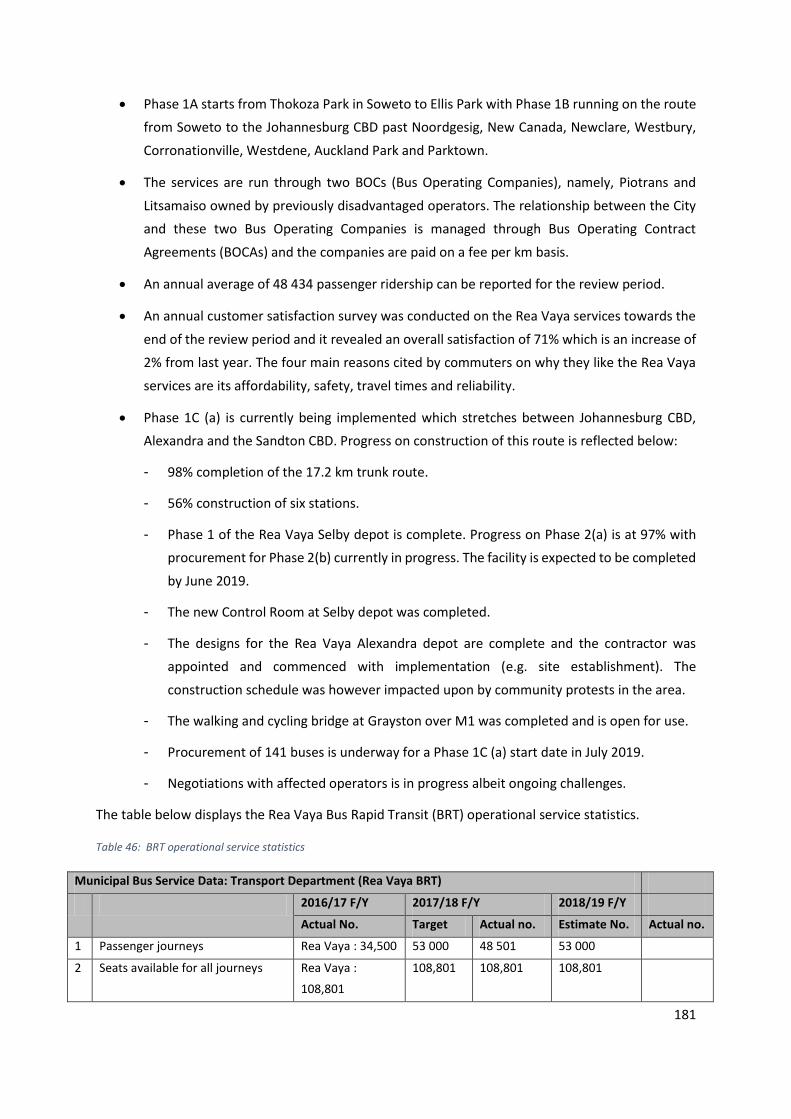
181
Phase 1A starts from Thokoza Park in Soweto to Ellis Park with Phase 1B running on the route
from Soweto to the Johannesburg CBD past Noordgesig, New Canada, Newclare, Westbury,
Corronationville, Westdene, Auckland Park and Parktown.
The services are run through two BOCs (Bus Operating Companies), namely, Piotrans and
Litsamaiso owned by previously disadvantaged operators. The relationship between the City
and these two Bus Operating Companies is managed through Bus Operating Contract
Agreements (BOCAs) and the companies are paid on a fee per km basis.
An annual average of 48 434 passenger ridership can be reported for the review period.
An annual customer satisfaction survey was conducted on the Rea Vaya services towards the
end of the review period and it revealed an overall satisfaction of 71% which is an increase of
2% from last year. The four main reasons cited by commuters on why they like the Rea Vaya
services are its affordability, safety, travel times and reliability.
Phase 1C (a) is currently being implemented which stretches between Johannesburg CBD,
Alexandra and the Sandton CBD. Progress on construction of this route is reflected below:
- 98% completion of the 17.2 km trunk route.
- 56% construction of six stations.
- Phase 1 of the Rea Vaya Selby depot is complete. Progress on Phase 2(a) is at 97% with
procurement for Phase 2(b) currently in progress. The facility is expected to be completed
by June 2019.
- The new Control Room at Selby depot was completed.
- The designs for the Rea Vaya Alexandra depot are complete and the contractor was
appointed and commenced with implementation (e.g. site establishment). The
construction schedule was however impacted upon by community protests in the area.
- The walking and cycling bridge at Grayston over M1 was completed and is open for use.
- Procurement of 141 buses is underway for a Phase 1C (a) start date in July 2019.
- Negotiations with affected operators is in progress albeit ongoing challenges.
The table below displays the Rea Vaya Bus Rapid Transit (BRT) operational service statistics.
Table 46: BRT operational service statistics
Municipal Bus Service Data: Transport Department (Rea Vaya BRT)
2016/17 F/Y 2017/18 F/Y 2018/19 F/Y
Actual No. Target Actual no. Estimate No. Actual no.
1 Passenger journeys Rea Vaya : 34,500 53 000 48 501 53 000
2 Seats available for all journeys Rea Vaya :
108,801
108,801 108,801 108,801
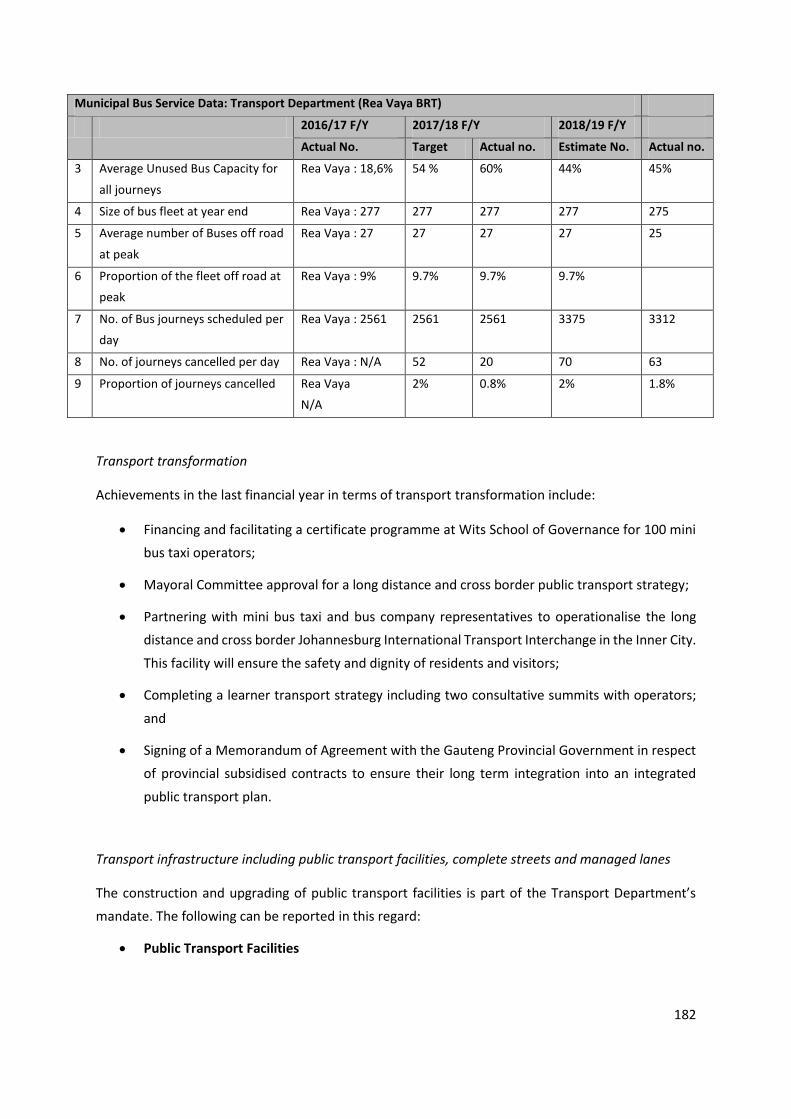
182
Municipal Bus Service Data: Transport Department (Rea Vaya BRT)
2016/17 F/Y 2017/18 F/Y 2018/19 F/Y
Actual No. Target Actual no. Estimate No. Actual no.
3 Average Unused Bus Capacity for
all journeys
Rea Vaya : 18,6% 54 % 60% 44% 45%
4 Size of bus fleet at year end Rea Vaya : 277 277 277 277 275
5 Average number of Buses off road
at peak
Rea Vaya : 27 27 27 27 25
6 Proportion of the fleet off road at
peak
Rea Vaya : 9% 9.7% 9.7% 9.7%
7 No. of Bus journeys scheduled per
day
Rea Vaya : 2561 2561 2561 3375 3312
8 No. of journeys cancelled per day Rea Vaya : N/A 52 20 70 63
9 Proportion of journeys cancelled Rea Vaya
N/A
2% 0.8% 2% 1.8%
Transport transformation
Achievements in the last financial year in terms of transport transformation include:
Financing and facilitating a certificate programme at Wits School of Governance for 100 mini
bus taxi operators;
Mayoral Committee approval for a long distance and cross border public transport strategy;
Partnering with mini bus taxi and bus company representatives to operationalise the long
distance and cross border Johannesburg International Transport Interchange in the Inner City.
This facility will ensure the safety and dignity of residents and visitors;
Completing a learner transport strategy including two consultative summits with operators;
and
Signing of a Memorandum of Agreement with the Gauteng Provincial Government in respect
of provincial subsidised contracts to ensure their long term integration into an integrated
public transport plan.
Transport infrastructure including public transport facilities, complete streets and managed lanes
The construction and upgrading of public transport facilities is part of the Transport Department’s
mandate. The following can be reported in this regard:
Public Transport Facilities
183
o 76% completion of JITI (Johannesburg International Transport Interchange) which will
accommodate long distance and cross border buses. This facility would have been
completed and operationalised during the 2018/19 financial year. However, the main
contractor went insolvent and a new contractor had to be procured.
o Finalised detailed designs for small public transport facilities at Zola / Emdeni and Orange
Farm.
o Initiated construction of a small public transport facility at Driziek.
Complete streets
o Complete Streets are streets which are constructed or retrofitted to accommodate all road
users (pedestrians, cyclists, public transport and motorists). These streets also enhance the
safety of road users and the following can be reported for the period under review:
The designs for complete streets links to Dube railway station are completed.
Construction of complete streets links to Merafe and Mzimhlophe railway stations are in
progress.
The procurement process for designs on the route between Orlando East and Soweto UJ
campus was finalised. The development of designs and implementation of Phase 1 of this
project will be undertaken in forthcoming financial years. This project is funded through
external funding from KfW (German Development Bank).
Designs for managed lanes at Eloff Street in the Inner City are in place and construction is
underway. This is a two-year project.
Cycling promotion
The Department annually distributes bikes to disadvantaged learners. In the 2017/18 financial year,
the following can be reported:
1 307 bikes were distributed as part of cycle promotion. The areas covered included Orlando
and Alexandra and the beneficiaries included learners, members of the community policing
forum (CPF) and health workers etc.
A cycle manual is being finalised. A stakeholder workshop was held on 19 June 2018.
Road safety education, behavioural change and partnerships
184
As part of promoting safety of road users and behavioural change, the Department implemented 76
road safety education and outreach programmes in partnership with stakeholders and the
community. These interventions were implemented at various areas across the city.
During October 2017, the Transport Month programme was implemented in partnership with
stakeholders and the community. The programme included:
Learner Transport Indaba;
Opening of the rehabilitated Oxford and Federation Bridges on the M1;
Distribution of bikes as part of cycling promotion;
Senior citizens appreciation programme;
Promotion of Metrobus services also aimed at increasing Metrobus patronage;
Drivers’ appreciation programme also aimed at improved safety for transport users;
Kasi to Kasi adventure which included travelling to various destinations using public
transport. The objective is to promote public transport as a mode of choice.
Streets alive prayer session in Meadowlands aimed at promoting safety of road users and
behavioural change; and
Participation in a career exhibition aimed at providing career guidance and highlighting career
opportunities to learners in the field of transport.
Strategic transport planning
The following can be reported for the period under review:
The development of the citywide transport ten-year integrated transport network fundable
plan is in progress and anticipated to be completed by December 2018.
A transport master plan to guide intervention to promote walking, cycling and public transport
for the Braamfontein precinct was completed.
Freight management
The citywide freight management plan which was completed and approved by the Mayoral
Committee during March 2017 is being implemented in partnership with stakeholders. The Freight
Management Forum is in place and meeting regularly.
Transport regulation
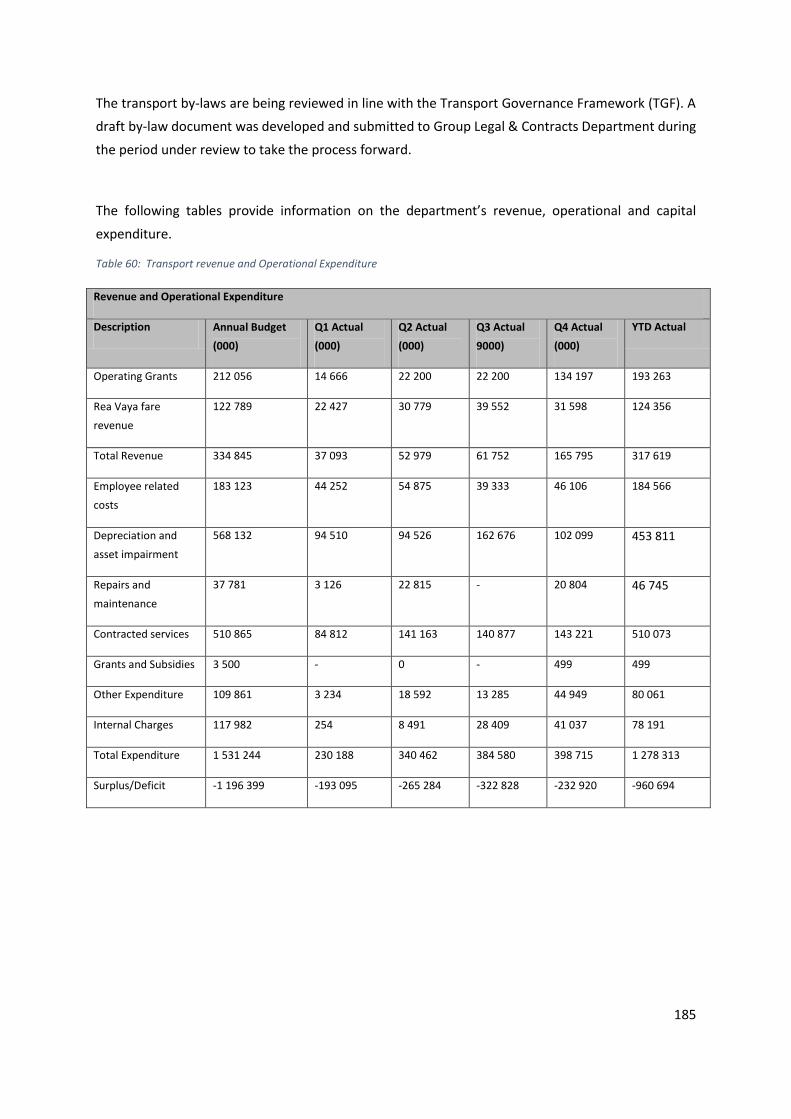
185
The transport by-laws are being reviewed in line with the Transport Governance Framework (TGF). A
draft by-law document was developed and submitted to Group Legal & Contracts Department during
the period under review to take the process forward.
The following tables provide information on the department’s revenue, operational and capital
expenditure.
Table 60: Transport revenue and Operational Expenditure
Revenue and Operational Expenditure
Description Annual Budget
(000)
Q1 Actual
(000)
Q2 Actual
(000)
Q3 Actual
9000)
Q4 Actual
(000)
YTD Actual
Operating Grants 212 056 14 666 22 200 22 200 134 197 193 263
Rea Vaya fare
revenue
122 789 22 427 30 779 39 552 31 598 124 356
Total Revenue 334 845 37 093 52 979 61 752 165 795 317 619
Employee related
costs
183 123 44 252 54 875 39 333 46 106 184 566
Depreciation and
asset impairment
568 132 94 510 94 526 162 676 102 099 453 811
Repairs and
maintenance
37 781 3 126 22 815 - 20 804 46 745
Contracted services 510 865 84 812 141 163 140 877 143 221 510 073
Grants and Subsidies 3 500 - 0 - 499 499
Other Expenditure 109 861 3 234 18 592 13 285 44 949 80 061
Internal Charges 117 982 254 8 491 28 409 41 037 78 191
Total Expenditure 1 531 244 230 188 340 462 384 580 398 715 1 278 313
Surplus/Deficit -1 196 399 -193 095 -265 284 -322 828 -232 920 -960 694
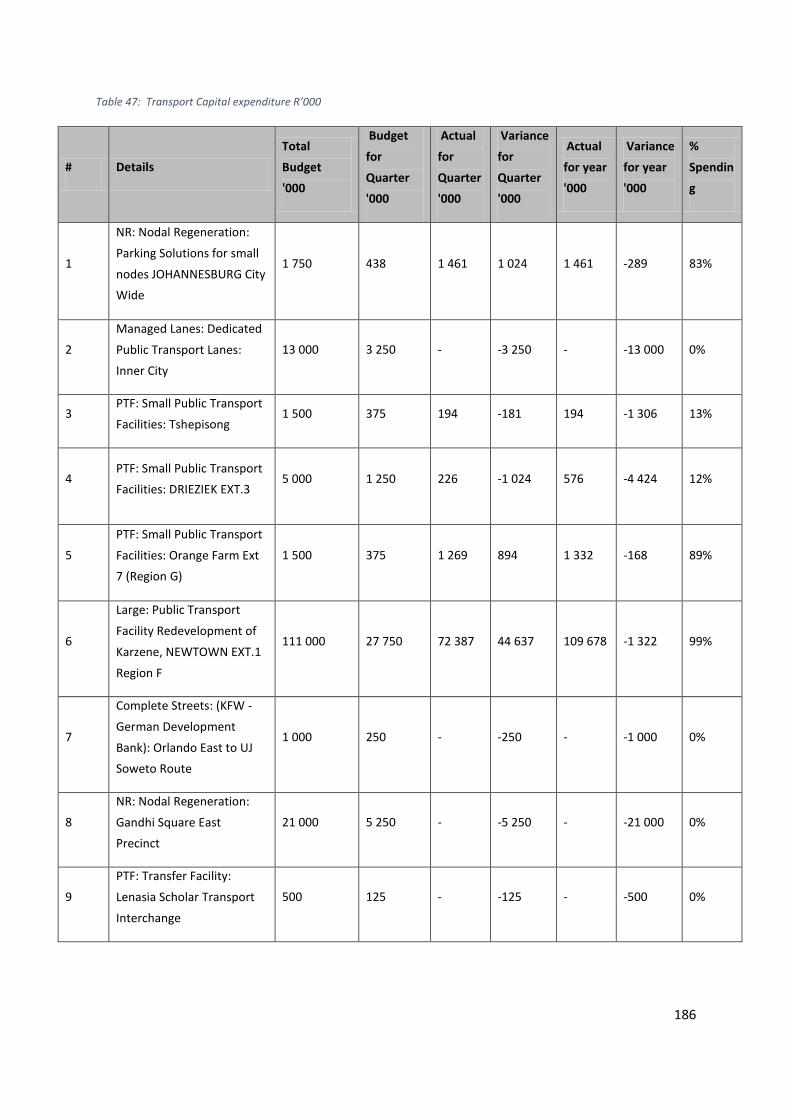
186
Table 47: Transport Capital expenditure R’000
# Details
Total
Budget
'000
Budget
for
Quarter
'000
Actual
for
Quarter
'000
Variance
for
Quarter
'000
Actual
for year
'000
Variance
for year
'000
%
Spendin
g
1
NR: Nodal Regeneration:
Parking Solutions for small
nodes JOHANNESBURG City
Wide
1 750 438 1 461 1 024 1 461 -289 83%
2
Managed Lanes: Dedicated
Public Transport Lanes:
Inner City
13 000 3 250 - -3 250 - -13 000 0%
3 PTF: Small Public Transport
Facilities: Tshepisong 1 500 375 194 -181 194 -1 306 13%
4 PTF: Small Public Transport
Facilities: DRIEZIEK EXT.3 5 000 1 250 226 -1 024 576 -4 424 12%
5
PTF: Small Public Transport
Facilities: Orange Farm Ext
7 (Region G)
1 500 375 1 269 894 1 332 -168 89%
6
Large: Public Transport
Facility Redevelopment of
Karzene, NEWTOWN EXT.1
Region F
111 000 27 750 72 387 44 637 109 678 -1 322 99%
7
Complete Streets: (KFW -
German Development
Bank): Orlando East to UJ
Soweto Route
1 000 250 - -250 - -1 000 0%
8
NR: Nodal Regeneration:
Gandhi Square East
Precinct
21 000 5 250 - -5 250 - -21 000 0%
9
PTF: Transfer Facility:
Lenasia Scholar Transport
Interchange
500 125 - -125 - -500 0%
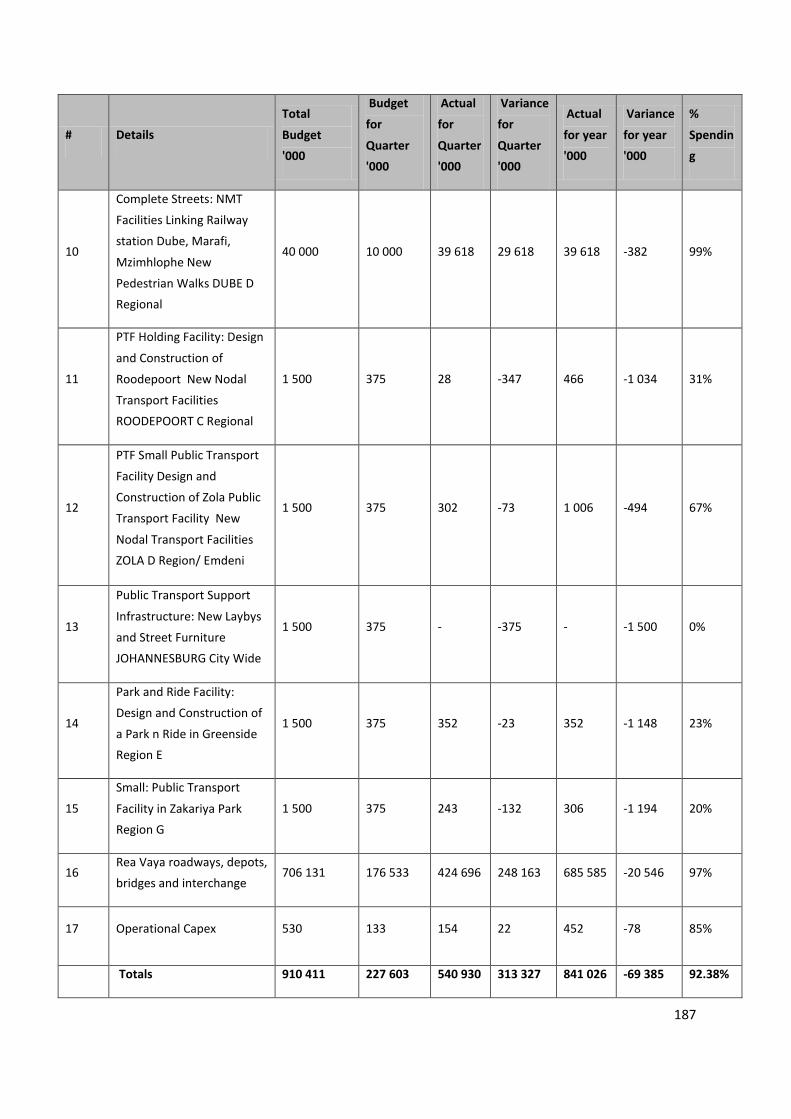
187
# Details
Total
Budget
'000
Budget
for
Quarter
'000
Actual
for
Quarter
'000
Variance
for
Quarter
'000
Actual
for year
'000
Variance
for year
'000
%
Spendin
g
10
Complete Streets: NMT
Facilities Linking Railway
station Dube, Marafi,
Mzimhlophe New
Pedestrian Walks DUBE D
Regional
40 000 10 000 39 618 29 618 39 618 -382 99%
11
PTF Holding Facility: Design
and Construction of
Roodepoort New Nodal
Transport Facilities
ROODEPOORT C Regional
1 500 375 28 -347 466 -1 034 31%
12
PTF Small Public Transport
Facility Design and
Construction of Zola Public
Transport Facility New
Nodal Transport Facilities
ZOLA D Region/ Emdeni
1 500 375 302 -73 1 006 -494 67%
13
Public Transport Support
Infrastructure: New Laybys
and Street Furniture
JOHANNESBURG City Wide
1 500 375 - -375 - -1 500 0%
14
Park and Ride Facility:
Design and Construction of
a Park n Ride in Greenside
Region E
1 500 375 352 -23 352 -1 148 23%
15
Small: Public Transport
Facility in Zakariya Park
Region G
1 500 375 243 -132 306 -1 194 20%
16 Rea Vaya roadways, depots,
bridges and interchange 706 131 176 533 424 696 248 163 685 585 -20 546 97%
17 Operational Capex 530 133 154 22 452 -78 85%
Totals 910 411 227 603 540 930 313 327 841 026 -69 385 92.38%
188
3.7 Environment and Infrastructure Services Department
The Environment and Infrastructure Services Department (EISD) is focused on environmental
sustainability, through the regulate, monitor and influence sustainable use of natural resources and
the protection of the environment; whilst facilitating infrastructure planning to support engineering
services in the City. Its mandate is the following:
• Planning, Policy and Strategy Development;
• Regulation, including compliance and enforcement;
• Monitoring and modelling;
• Facilitation and implementation of key strategic programmes and projects;
• Roll-out of municipal services in an integrated and sustainable manner through coordinated
planning; and
• Education and Awareness across all sectors (to change behaviour).
The Department’s main function is policy development, regulatory and monitoring rather than being
an implementation agent or a service delivery agent. The mandate of the Department is embedded in
the strategic functions of the Department as is reflected in the following key performance areas:
Urban Water Management is meant to ensure security of supply and also ensure the quality
of river health;
Bio-diversity Protection, which is concerned with ensuring protection of eco-systems and bio-
diversity;
Air Quality Management which supports interventions that will lead to clean air (e.g. mitigate
against mine dust);
Climate Change which is aimed at ensuring that City’s greenhouse gas emissions are reduced
to minimise its contribution towards climate change (mitigation) and to ensure resilience
through adaptation;
Waste management and minimisation, aims to reduce environmental pollution and also to
minimize waste going to the landfill sites (taking into consideration the fact that the City has
a challenge around the shortage of landfill space);
Infrastructure planning and coordination is one of the integral areas of focus as it is meant to
ensure adequate and resilient infrastructure to support the City’s spatial vision. The tool that
is used is commonly referred to as the Consolidated Infrastructure Plan; and
189
Environmental education and awareness is aimed at behavioural change on environmental
sustainability.
Summary of performance
Water quality and catchment management
EISD continues with the new approach of improving and managing the quality of watercourses
through rehabilitation projects within the various Water Management Units (WMUs), in both the
Jukskei and Klip Catchments. In the past, various initiatives have been undertaken to improve the
ecological state of the various water courses making up these catchments; be it through river clean-
ups, constant water quality monitoring and rehabilitation work. These initiatives were project based
and made it difficult to assess the improvement of these water courses, hence the transformation in
managing and measuring improvements. The river clean-up programme under the Department still
continues – as river clean ups also contribute to the improvement of the quality of the City’s water
resources as well as improving the quality of life for affected communities.
During 2017/18 rehabilitation work rehabilitation work was undertaken in the following WMUs to
improve the ecological state:
Alexandra, Jukskei River Rehabilitation;
Kaalspruit River Rehabilitation;
Diepsloot River Rehabilitation;
Mshenguville Wetland Rehabilitation; and
Bosmontspruit Rehabilitation.
The various river clean-up projects for the improvement of water courses were undertaken during the
course of the financial year. The City’s objective in relation to Water Quality Management is to
conserve and enhance the watercourses and riparian zones within Johannesburg through
implementing integrated catchment planning and management practices in order to protect water
resources and to promote healthy aquatic ecosystems and riverine areas which support sustainable
social and economic use to the optimal benefit of all stakeholders, including the environment. The
department in collaboration with Joburg City Parks and Zoo (JCPZ) identified the river clean-up
projects in four Regions namely:
Region A – Diepsloot;
Region C – Doornkop and Braamfischerville;
Region E – Buccleuch; and
Region F – Bruma Lake and Denver Informal settlement
The day-to-day activities of the river clean-up operation included - litter picking, grass cutting, reeds
control and removal of debris. A total of 93 work opportunities were created – 27, 25, 15 and 26 in
the respective regions of A, C, E and F.
190
Biodiversity conservation
There is a well-recognised deep interconnectivity between conservation of biodiversity, poverty
alleviation and sustainable development. Like similar cities, the City of Johannesburg is densely
populated and the natural land cover has experienced significant transformation. Despite this, a fair
amount of biodiversity remains within the City’s boundaries. However, the increased urbanisation
currently being experienced within the city is posing a threat to the remaining biodiversity. The overall
objective of the City in relation to biodiversity is to enhance human development and wellbeing
through sustainable use of biological resources and equitable sharing. Projects being undertaken in
the current financial year for the realisation of the City’s objective in relation to biodiversity
conservation include:
Development and Implementation of Invasive Species Monitoring, Control and Eradication Plan.
o The development of the Invasive Species Monitoring, Control and Eradication Plan will
continue in the FY2018/19. However, priority areas for clearing of invasive species were
identified during the FY under review. These priority biodiversity areas included municipal
nature reserves, aquatic environments, and other conservation areas. EISD collaborated with
JCPZ and a total of 3 163 ha was cleared across the seven regions of the City with the creation
of 112 job opportunities.
Implementation of Ecological Management Plans in Protected Areas.
o Ecological Management Plans (EMPs) inform how protected areas are to be managed and
adequate implementation of these plans is critical for the maintenance of ecological,
economic and social viability of biodiversity priority areas.
o The interventions identified in the EMPs range from a number of various activities, such as
firebreaks, alien invasive control, soil conservation and fencing etc.
o The Department identified areas for controlled fire-breaks for the purpose of preserving
grassland ecology and stimulating the germination of some desirable species. The areas
included Nature reserves, bird sanctuaries, ridges and koppies; Parys Zoo Farm and JHB Zoo;
as wells as the Botanical Gardens. The areas covered over 30 protected areas and close to
3 000 ha was controlled-burned and 310 work opportunities created.
o Another intervention from the implementation of the EMP included the control of alien and
invasive species. A total of 441 ha was cleared with a total of 137 work opportunities created.
Protected Area Proclamation
Integrated Waste Management
The City is faced with the challenge of increasing volumes of waste generation and the diminishing
landfill space. The City generates and disposes close to 1.6 million tons of waste on an annual basis.
This figure is increasing on a yearly basis and is projected to reach 2 million tons by 2022. To respond
to this challenge an Integrated Waste Management Policy and Plan was developed and adopted by
Council in 2011. The Plan sets targets for minimization and diversion of waste disposal to landfill. The
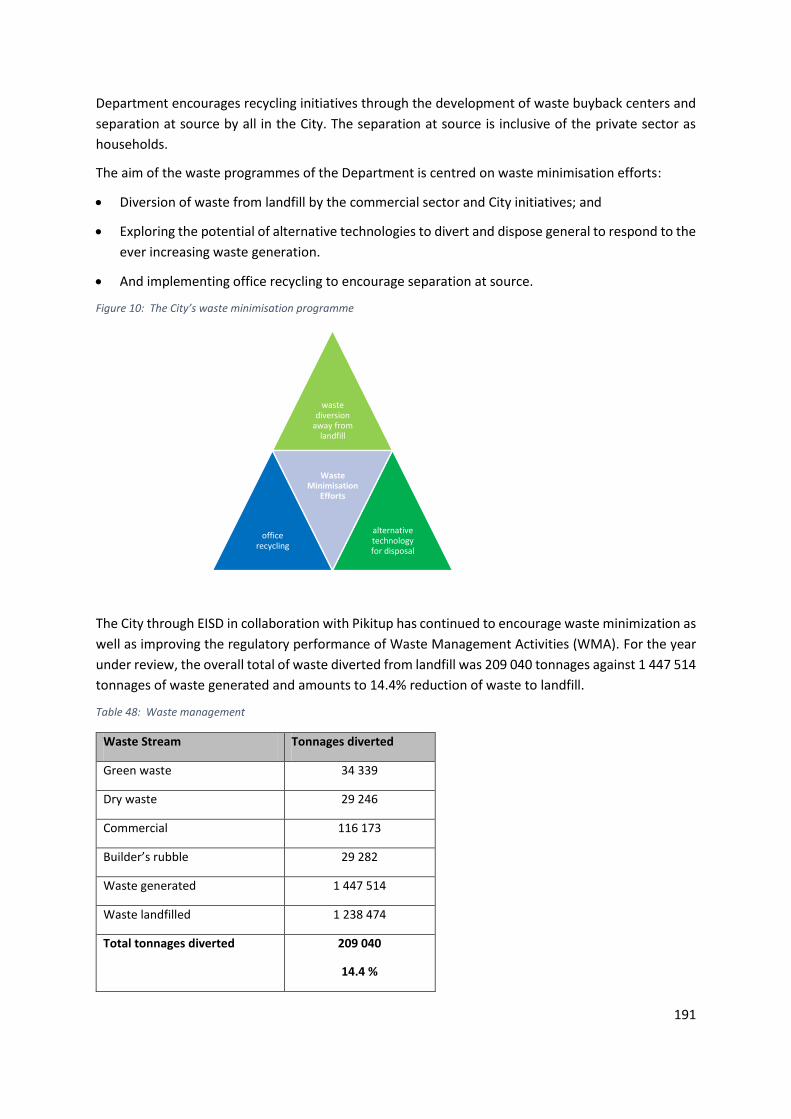
191
Department encourages recycling initiatives through the development of waste buyback centers and
separation at source by all in the City. The separation at source is inclusive of the private sector as
households.
The aim of the waste programmes of the Department is centred on waste minimisation efforts:
Diversion of waste from landfill by the commercial sector and City initiatives; and
Exploring the potential of alternative technologies to divert and dispose general to respond to the
ever increasing waste generation.
And implementing office recycling to encourage separation at source.
Figure 10: The City’s waste minimisation programme
The City through EISD in collaboration with Pikitup has continued to encourage waste minimization as
well as improving the regulatory performance of Waste Management Activities (WMA). For the year
under review, the overall total of waste diverted from landfill was 209 040 tonnages against 1 447 514
tonnages of waste generated and amounts to 14.4% reduction of waste to landfill.
Table 48: Waste management
Waste Stream Tonnages diverted
Green waste 34 339
Dry waste 29 246
Commercial 116 173
Builder’s rubble 29 282
Waste generated 1 447 514
Waste landfilled 1 238 474
Total tonnages diverted
209 040
14.4 %
waste diversion
away from landfill
office recycling
Waste Minimisation
Efforts
alternative technology for disposal
192
The key focus of Waste Management and Regulation within the City of Johannesburg is the
implementation of the Integrated Waste Management Plan (IWMP) targets as promulgated in 2011.
The primary objective of the IWMP is to integrate and optimise waste management activities, thereby
maximising efficiency and improving the quality of life of all citizens, while the associated
environmental impacts and financial cost are minimised (DEAT, 2000). To implement sustainable
waste minimisation, the Department undertakes reuse, recycling and recovery programmes through
strategic interventions including the promotion of waste to energy and other reuse and recycling
initiatives supported by the introduction of waste separation at source programmes. Below are
projects being undertaken this financial year in support of waste management and minimization:
Alternative Waste Treatment Technologies (AWTT) projects
o Waste to Energy (WtE) – In 2017/18, the Department implemented Section 120 of the MFMA
to solicit comments from national and provincial government and other City Departments /
Entities and the comments were submitted and noted; it advertised the Public Notice
through the Speaker’s office which was followed by the 60 days Public Notice process and
presentation to council; and the Department Appointed a Transactional Advisor (TA) for the
project to conduct the EIA and PPP procurement. The TA will also facilitate the development
of the 10 year Integrated Waste Management Plan.
o Landfill Gas (LFG)
o Biogas – the Department completed the engineering design works for the pilot biogas
digester at Robinson Deep Landfill site.
Separation at Source (S@S) at City Owned/ Occupied facilities
Waste Information Management System (WIMS)
Compliance and Enforcement
Waste Management Bylaw review
Skills development of JMPD officers
Compliance monitoring of WMA (Waste legislation, regulations, norms, standards & best
practices)
Illegal Dumping Strategy
Open space planning
Open Space Planning aims to improve the protection and management of the whole landscape and to
secure critical natural processes underpinning development, including important habitats and
ecological linkages, protection of water catchments, and harnessing the benefits of ‘Green
Infrastructure” both natural and engineered. The function also considers important hydrological
193
processes and the promotion of sustainable urban drainage and water sensitive urban design
principles to reduce environmental degradation, mitigate against flood risks and build resilience in the
face of climate change. The Open Space Planning function also seeks to ensure that there is adequate
provision of social open space for recreation, to support a growing population and densifying city.
Integrated Open Space Plans help to ensure the application of findings within spatial planning
processes and greening programmes. Projects being undertaken or initiated in the current financial
year include:
Development of an Integrated Open Space Plan for Lanseria;
Development of a Storm water Design Manual (Phase 2 – year 2);
Regional Attenuation Feasibility study; and
Development of a Catchment Management Plan.
Air quality management
The Department is mandated to undertake the responsibility of implementing and enforcing the
National Environmental Management: Air Quality Act 39 of 2004, as amended. The key function of the
city is to perform the function of the Air Quality Officer which includes the licensing and regulation of
listed industrial activities. The air quality management planning and monitoring of ambient air quality
to ensure that the quality of air complies with the standards to protect the health and wellbeing of
the public.
The following are the functions and/or projects undertaken in regard to air quality management
during this financial year:
Review and implementation of revised Air Pollution Control By-Laws – The draft Air Pollution
Control bylaws were finalised and advertised for public participation.
Atmospheric Emission Licensing- The Department received 14 AEL applications for listed activity
during the 2017/18 Financial Year. A total of eight Atmospheric Emission Licence (AEL) were issued
and six remain. The remaining six could not be finalised due to incomplete information.
Compliance monitoring of industries - The Department conducted a total of 12 inspections for
compliance with AEL conditions. Out of the 12 facilities inspected, three were not complying with
minimum emission standards and were issued with notices in terms of section 31L of NEMA. Act
109 of 1998.
Ambient Air Quality Monitoring - A total of six stations out of a nine are currently operational with
four of these recovering data more than 80% as required by National Air quality Standards for
data integrity.
Figure 11: Map of stations in network
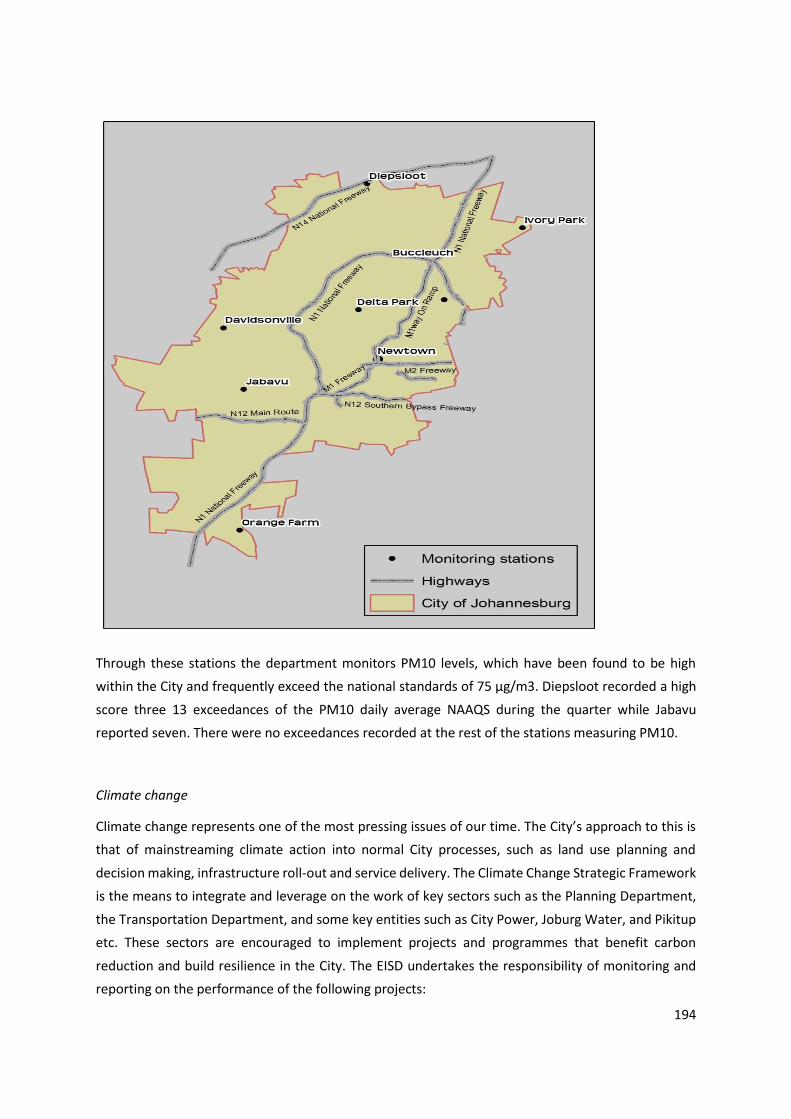
194
Through these stations the department monitors PM10 levels, which have been found to be high
within the City and frequently exceed the national standards of 75 µg/m3. Diepsloot recorded a high
score three 13 exceedances of the PM10 daily average NAAQS during the quarter while Jabavu
reported seven. There were no exceedances recorded at the rest of the stations measuring PM10.
Climate change
Climate change represents one of the most pressing issues of our time. The City’s approach to this is
that of mainstreaming climate action into normal City processes, such as land use planning and
decision making, infrastructure roll-out and service delivery. The Climate Change Strategic Framework
is the means to integrate and leverage on the work of key sectors such as the Planning Department,
the Transportation Department, and some key entities such as City Power, Joburg Water, and Pikitup
etc. These sectors are encouraged to implement projects and programmes that benefit carbon
reduction and build resilience in the City. The EISD undertakes the responsibility of monitoring and
reporting on the performance of the following projects:
195
Wastewater sector - Biogas to energy;
Energy Sector - Energy Mix by technology;
Waste Sector - Green waste diverted from the landfill site; and
Transport Sector - Rea Vaya (Bus Rapid Transit (BRT).
For the year under review, a total of 95 080.27 tCO2e in GHG emissions offset was achieved from the
sector-based projects that were implemented.
Table 49: GHG emissions offset
Sector Project Tons of C02 in GHG emissions offset
a. Water Sector Biogas to energy project. 0 tCO2e
b. Energy Sector Energy Mixed by Technology. 41 355.5 tCO2e
c. Waste Sector Green Waste Diversion from Landfill 11 610.52 tCO2e
d. Transport Sector Rea Vaya BRT project 42 114.25 tCO2e
Total 95 080.27 tCO2e
Service Statistics for Environmental Protection
The City has a statutory obligation to regulate, monitor compliance and to enforce City wide activities
with a variety of environmental laws ranging from the Constitution, the National Environmental
Management Act (NEMA), Specific Environmental Management Acts (SEMAs) to local government by-
laws.
Waste Diversion: The City monitors the diversion of waste to landfill site with the aim of providing
sustainable waste management service to the residents of Johannesburg. In 2016/17, the City
achieved 14.2% reduction of waste to landfill, whilst in the financial year under review the City
achieved 14.4% reduction of waste to landfill against a total of 1 447 514 tonnages of waste generated.
Regulatory Performance of Waste Management Activities: As part of enforcing compliance to the
waste bylaws, the City has implemented a registration and licensing regime. The aim of the regime is
to register all waste related activities and to issue a license once certain conditions have been met.
The Waste Information Management System (WIMS) registered 15 new businesses during the fourth
quarter and issued 23 permits for businesses that were registered. The percentage of permitted WMA
businesses is 53% for 2017/18.
Wastewater Treatment Works (WWTWs) compliance: The Department has an oversight role over
Joburg Water with the aim of ensuring amongst others sound environmental practices and sustainable
delivery of water and sanitation supply. Joburg Water has set a target of 97% compliance for
wastewater discharge prior to discharge into water courses. The overall Wastewater Treatment Works
(WWTWs) compliance for the quarter under review was at 69.6 %.
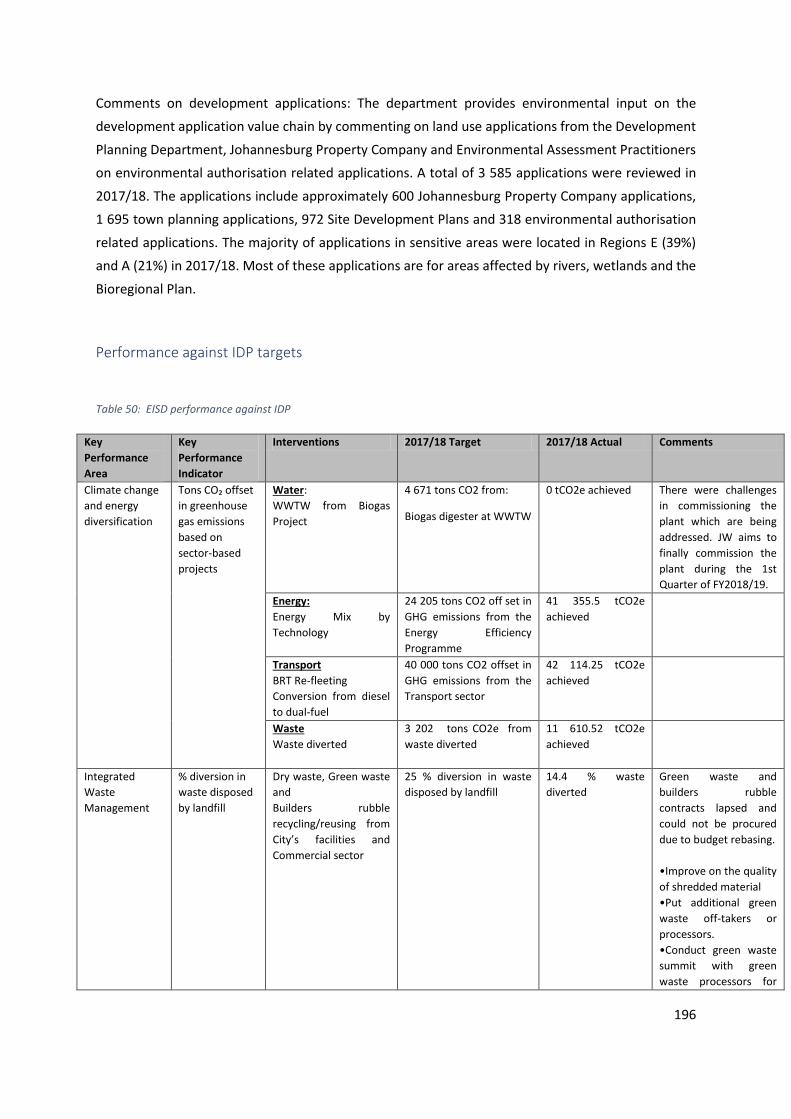
196
Comments on development applications: The department provides environmental input on the
development application value chain by commenting on land use applications from the Development
Planning Department, Johannesburg Property Company and Environmental Assessment Practitioners
on environmental authorisation related applications. A total of 3 585 applications were reviewed in
2017/18. The applications include approximately 600 Johannesburg Property Company applications,
1 695 town planning applications, 972 Site Development Plans and 318 environmental authorisation
related applications. The majority of applications in sensitive areas were located in Regions E (39%)
and A (21%) in 2017/18. Most of these applications are for areas affected by rivers, wetlands and the
Bioregional Plan.
Performance against IDP targets
Table 50: EISD performance against IDP
Key
Performance
Area
Key
Performance
Indicator
Interventions 2017/18 Target 2017/18 Actual Comments
Climate change
and energy
diversification
Tons CO₂ offset
in greenhouse
gas emissions
based on
sector-based
projects
Water:
WWTW from Biogas
Project
4 671 tons CO2 from:
Biogas digester at WWTW
0 tCO2e achieved There were challenges
in commissioning the
plant which are being
addressed. JW aims to
finally commission the
plant during the 1st
Quarter of FY2018/19.
Energy:
Energy Mix by
Technology
24 205 tons CO2 off set in
GHG emissions from the
Energy Efficiency
Programme
41 355.5 tCO2e
achieved
Transport
BRT Re-fleeting
Conversion from diesel
to dual-fuel
40 000 tons CO2 offset in
GHG emissions from the
Transport sector
42 114.25 tCO2e
achieved
Waste
Waste diverted
3 202 tons CO2e from
waste diverted
11 610.52 tCO2e
achieved
Integrated
Waste
Management
% diversion in
waste disposed
by landfill
Dry waste, Green waste
and
Builders rubble
recycling/reusing from
City’s facilities and
Commercial sector
25 % diversion in waste
disposed by landfill
14.4 % waste
diverted
Green waste and
builders rubble
contracts lapsed and
could not be procured
due to budget rebasing.
•Improve on the quality
of shredded material
•Put additional green
waste off-takers or
processors.
•Conduct green waste
summit with green
waste processors for
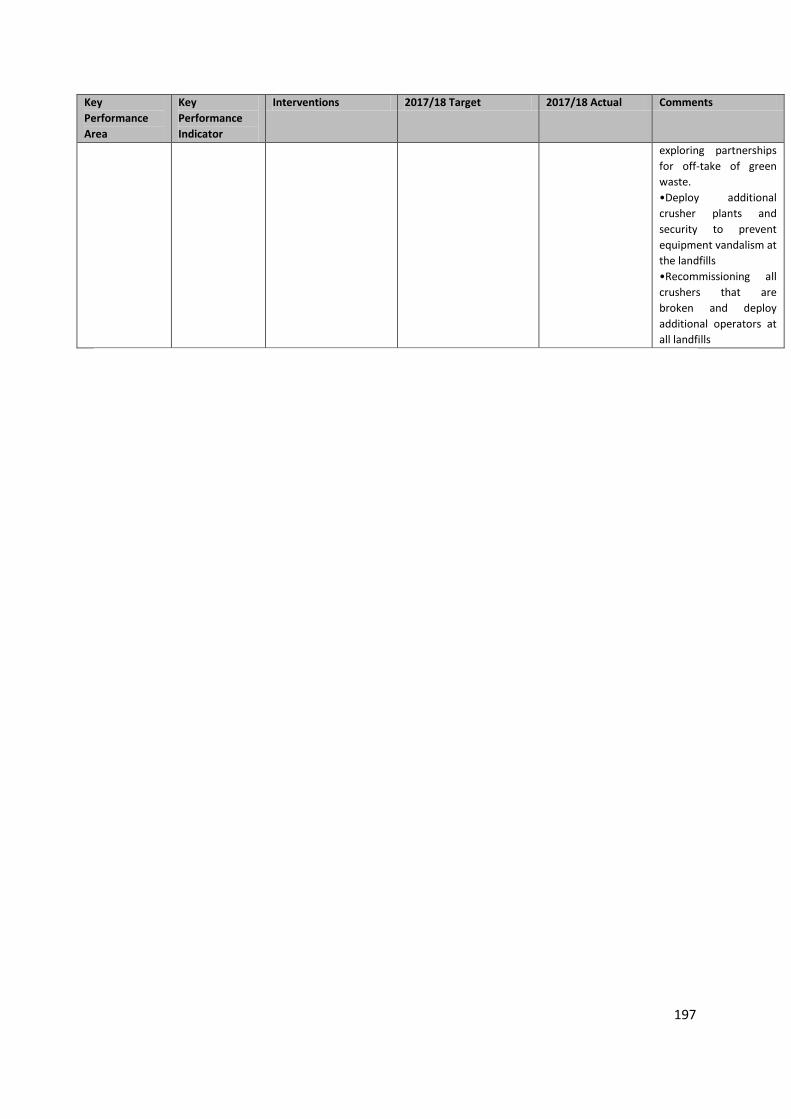
197
Key
Performance
Area
Key
Performance
Indicator
Interventions 2017/18 Target 2017/18 Actual Comments
exploring partnerships
for off-take of green
waste.
•Deploy additional
crusher plants and
security to prevent
equipment vandalism at
the landfills
•Recommissioning all
crushers that are
broken and deploy
additional operators at
all landfills
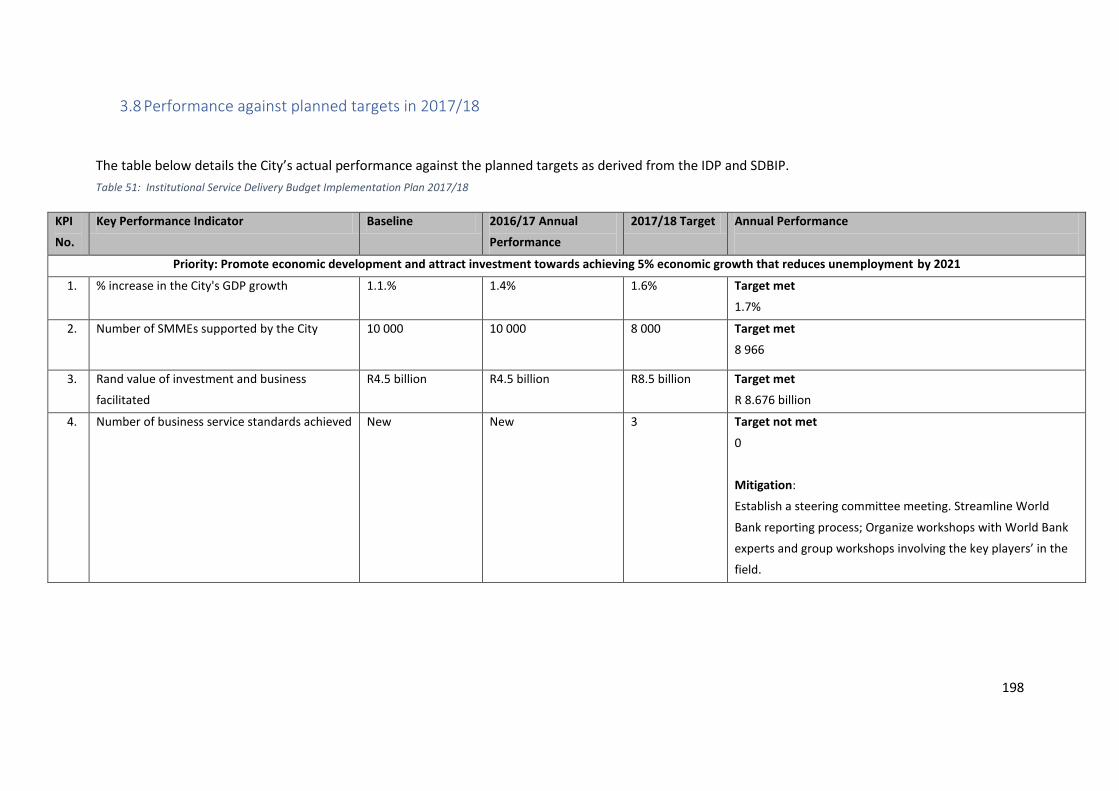
198
3.8 Performance against planned targets in 2017/18
The table below details the City’s actual performance against the planned targets as derived from the IDP and SDBIP.
Table 51: Institutional Service Delivery Budget Implementation Plan 2017/18
KPI
No.
Key Performance Indicator Baseline 2016/17 Annual
Performance
2017/18 Target Annual Performance
Priority: Promote economic development and attract investment towards achieving 5% economic growth that reduces unemployment by 2021
1. % increase in the City's GDP growth 1.1.% 1.4% 1.6% Target met
1.7%
2. Number of SMMEs supported by the City 10 000 10 000 8 000 Target met
8 966
3. Rand value of investment and business
facilitated
R4.5 billion R4.5 billion R8.5 billion Target met
R 8.676 billion
4. Number of business service standards achieved New New 3 Target not met
0
Mitigation:
Establish a steering committee meeting. Streamline World
Bank reporting process; Organize workshops with World Bank
experts and group workshops involving the key players’ in the
field.
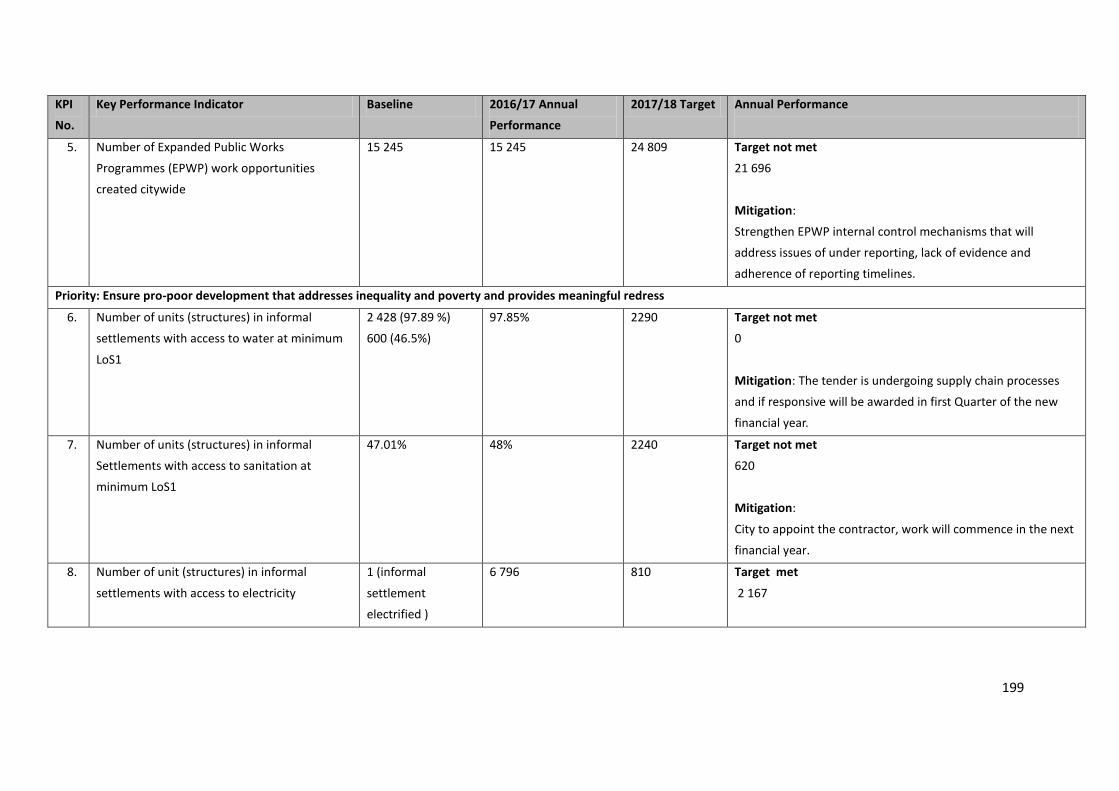
199
KPI
No.
Key Performance Indicator Baseline 2016/17 Annual
Performance
2017/18 Target Annual Performance
5. Number of Expanded Public Works
Programmes (EPWP) work opportunities
created citywide
15 245 15 245 24 809 Target not met
21 696
Mitigation:
Strengthen EPWP internal control mechanisms that will
address issues of under reporting, lack of evidence and
adherence of reporting timelines.
Priority: Ensure pro-poor development that addresses inequality and poverty and provides meaningful redress
6. Number of units (structures) in informal
settlements with access to water at minimum
LoS1
2 428 (97.89 %)
600 (46.5%)
97.85% 2290 Target not met
0
Mitigation: The tender is undergoing supply chain processes
and if responsive will be awarded in first Quarter of the new
financial year.
7. Number of units (structures) in informal
Settlements with access to sanitation at
minimum LoS1
47.01% 48% 2240 Target not met
620
Mitigation:
City to appoint the contractor, work will commence in the next
financial year.
8. Number of unit (structures) in informal
settlements with access to electricity
1 (informal
settlement
electrified )
6 796 810 Target met
2 167
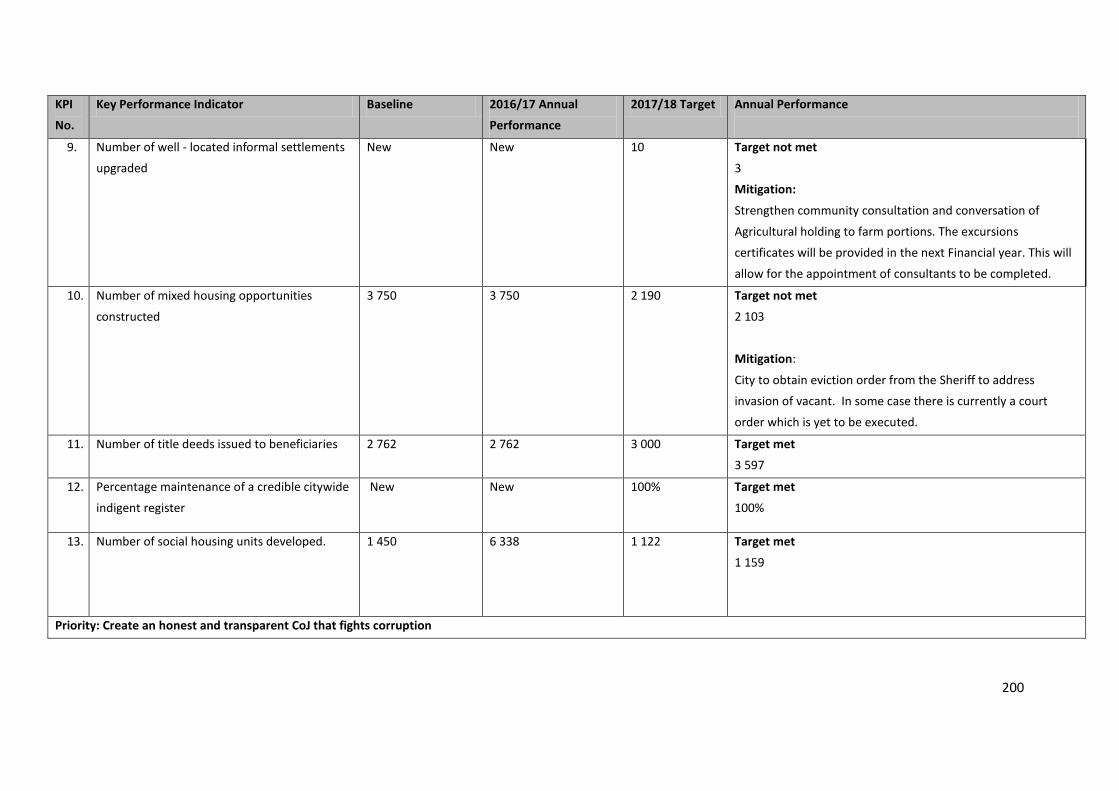
200
KPI
No.
Key Performance Indicator Baseline 2016/17 Annual
Performance
2017/18 Target Annual Performance
9. Number of well - located informal settlements
upgraded
New New 10 Target not met
3
Mitigation:
Strengthen community consultation and conversation of
Agricultural holding to farm portions. The excursions
certificates will be provided in the next Financial year. This will
allow for the appointment of consultants to be completed.
10. Number of mixed housing opportunities
constructed
3 750 3 750 2 190 Target not met
2 103
Mitigation:
City to obtain eviction order from the Sheriff to address
invasion of vacant. In some case there is currently a court
order which is yet to be executed.
11. Number of title deeds issued to beneficiaries 2 762 2 762 3 000 Target met
3 597
12. Percentage maintenance of a credible citywide
indigent register
New New 100% Target met
100%
13. Number of social housing units developed. 1 450 6 338 1 122 Target met
1 159
Priority: Create an honest and transparent CoJ that fights corruption
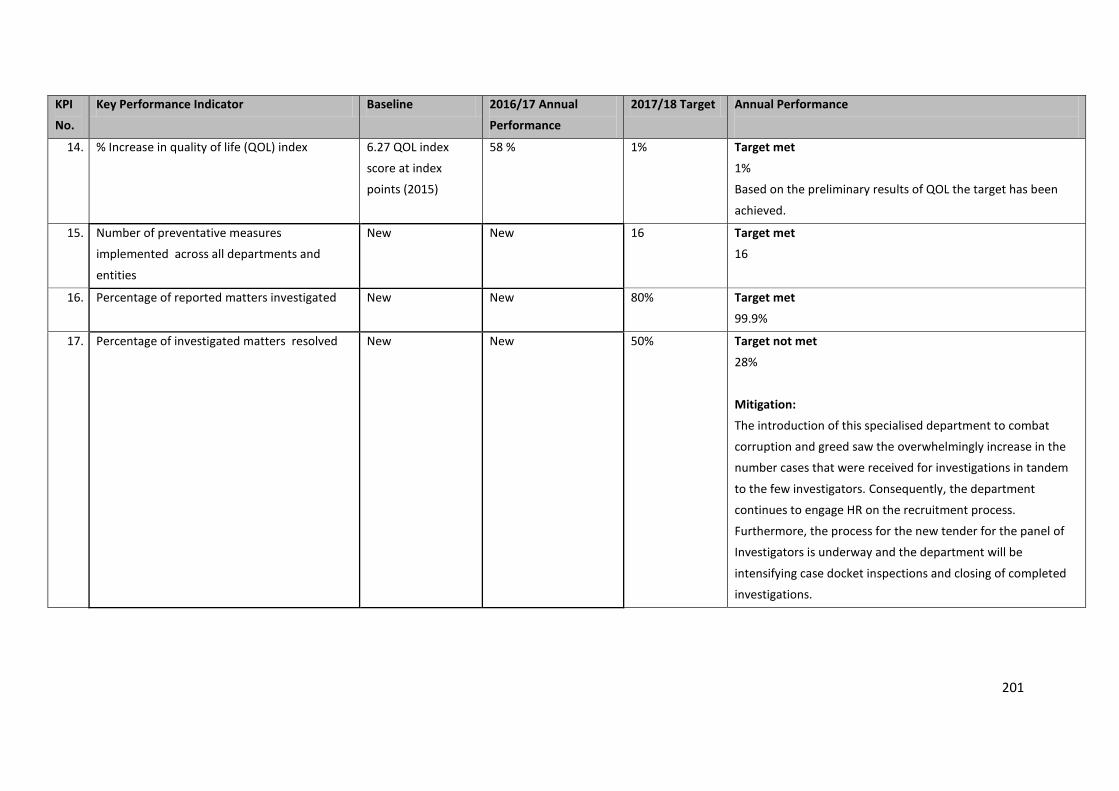
201
KPI
No.
Key Performance Indicator Baseline 2016/17 Annual
Performance
2017/18 Target Annual Performance
14. % Increase in quality of life (QOL) index 6.27 QOL index
score at index
points (2015)
58 % 1% Target met
1%
Based on the preliminary results of QOL the target has been
achieved.
15. Number of preventative measures
implemented across all departments and
entities
New New 16 Target met
16
16. Percentage of reported matters investigated New New 80% Target met
99.9%
17. Percentage of investigated matters resolved New New 50% Target not met
28%
Mitigation:
The introduction of this specialised department to combat
corruption and greed saw the overwhelmingly increase in the
number cases that were received for investigations in tandem
to the few investigators. Consequently, the department
continues to engage HR on the recruitment process.
Furthermore, the process for the new tender for the panel of
Investigators is underway and the department will be
intensifying case docket inspections and closing of completed
investigations.
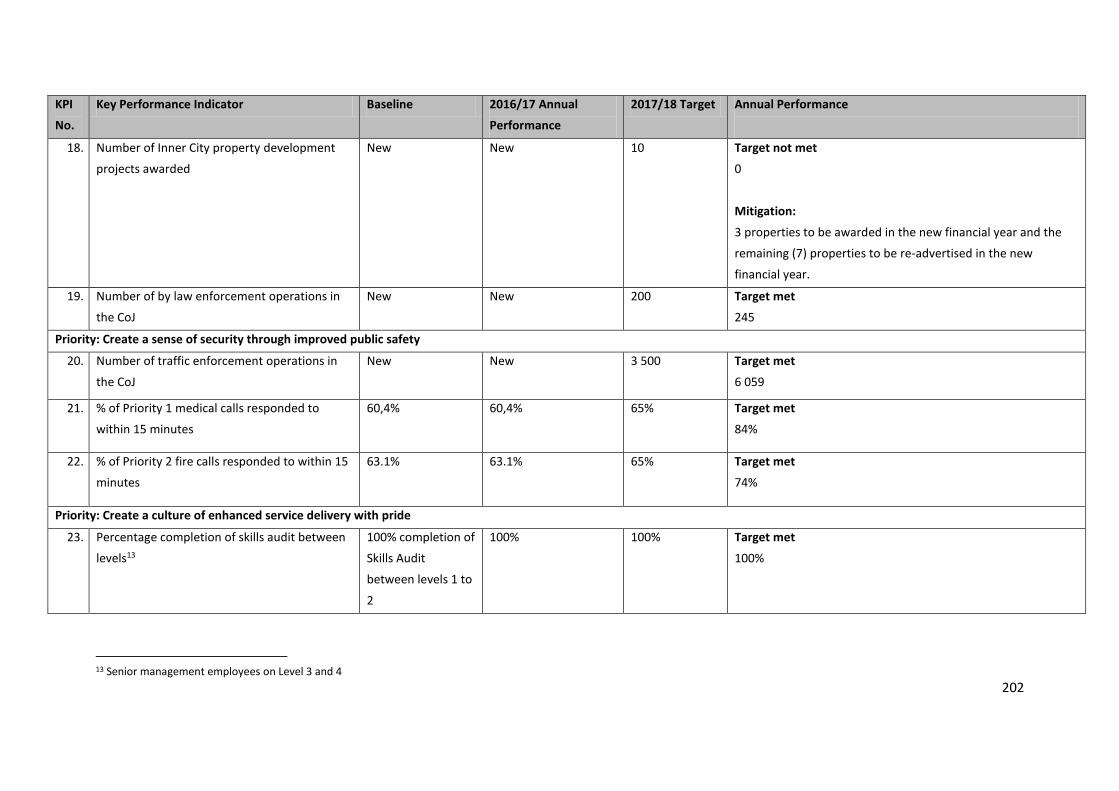
202
KPI
No.
Key Performance Indicator Baseline 2016/17 Annual
Performance
2017/18 Target Annual Performance
18. Number of Inner City property development
projects awarded
New New 10 Target not met
0
Mitigation:
3 properties to be awarded in the new financial year and the
remaining (7) properties to be re-advertised in the new
financial year.
19. Number of by law enforcement operations in
the CoJ
New New 200 Target met
245
Priority: Create a sense of security through improved public safety
20. Number of traffic enforcement operations in
the CoJ
New New 3 500
Target met
6 059
21. % of Priority 1 medical calls responded to
within 15 minutes
60,4% 60,4% 65% Target met
84%
22. % of Priority 2 fire calls responded to within 15
minutes
63.1% 63.1% 65% Target met
74%
Priority: Create a culture of enhanced service delivery with pride
23. Percentage completion of skills audit between
levels13
100% completion of
Skills Audit
between levels 1 to
2
100% 100% Target met
100%
13 Senior management employees on Level 3 and 4
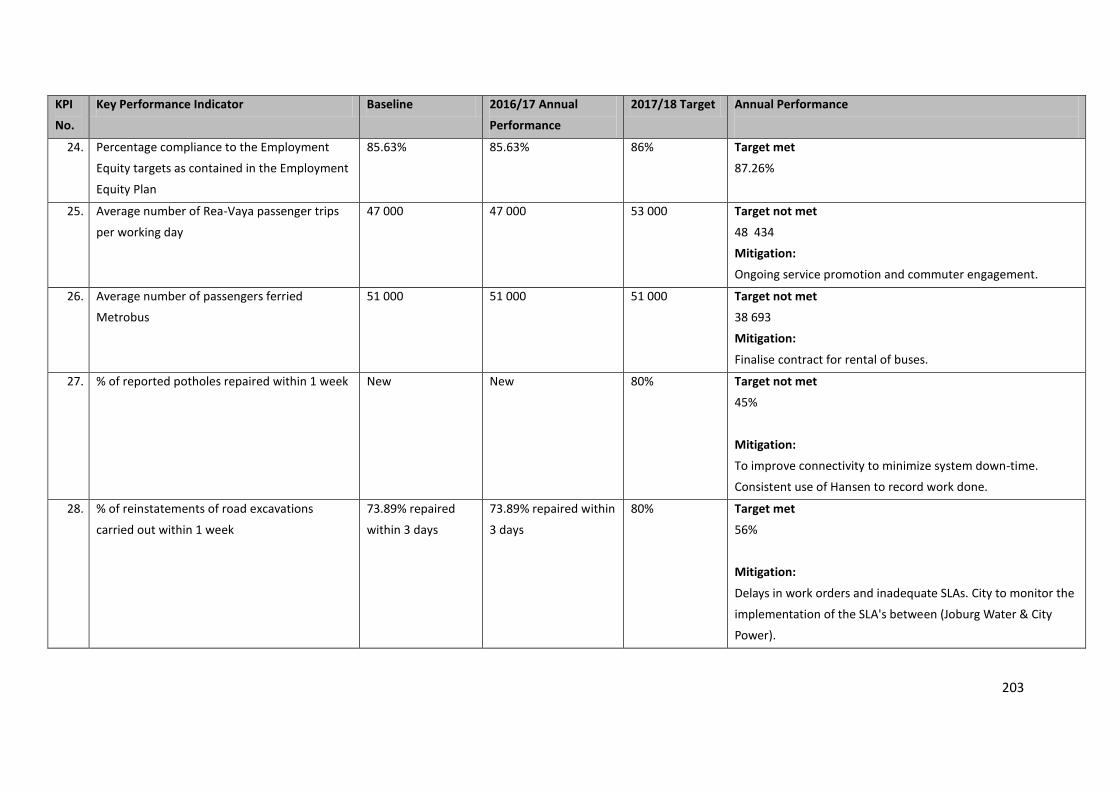
203
KPI
No.
Key Performance Indicator Baseline 2016/17 Annual
Performance
2017/18 Target Annual Performance
24. Percentage compliance to the Employment
Equity targets as contained in the Employment
Equity Plan
85.63% 85.63% 86% Target met
87.26%
25. Average number of Rea-Vaya passenger trips
per working day
47 000 47 000 53 000 Target not met
48 434
Mitigation:
Ongoing service promotion and commuter engagement.
26. Average number of passengers ferried
Metrobus
51 000 51 000 51 000 Target not met
38 693
Mitigation:
Finalise contract for rental of buses.
27. % of reported potholes repaired within 1 week New New 80% Target not met
45%
Mitigation:
To improve connectivity to minimize system down-time.
Consistent use of Hansen to record work done.
28. % of reinstatements of road excavations
carried out within 1 week
73.89% repaired
within 3 days
73.89% repaired within
3 days
80% Target met
56%
Mitigation:
Delays in work orders and inadequate SLAs. City to monitor the
implementation of the SLA's between (Joburg Water & City
Power).
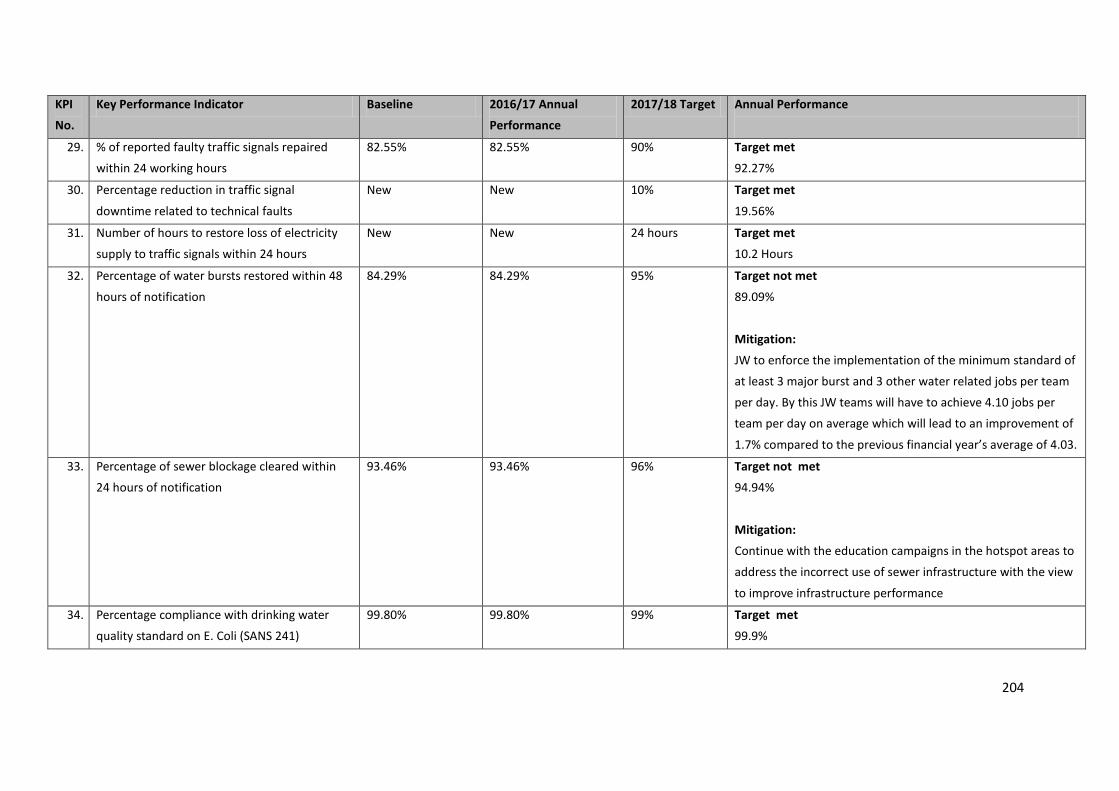
204
KPI
No.
Key Performance Indicator Baseline 2016/17 Annual
Performance
2017/18 Target Annual Performance
29. % of reported faulty traffic signals repaired
within 24 working hours
82.55% 82.55% 90% Target met
92.27%
30. Percentage reduction in traffic signal
downtime related to technical faults
New New 10% Target met
19.56%
31. Number of hours to restore loss of electricity
supply to traffic signals within 24 hours
New New 24 hours Target met
10.2 Hours
32. Percentage of water bursts restored within 48
hours of notification
84.29% 84.29% 95% Target not met
89.09%
Mitigation:
JW to enforce the implementation of the minimum standard of
at least 3 major burst and 3 other water related jobs per team
per day. By this JW teams will have to achieve 4.10 jobs per
team per day on average which will lead to an improvement of
1.7% compared to the previous financial year’s average of 4.03.
33. Percentage of sewer blockage cleared within
24 hours of notification
93.46% 93.46% 96% Target not met
94.94%
Mitigation:
Continue with the education campaigns in the hotspot areas to
address the incorrect use of sewer infrastructure with the view
to improve infrastructure performance
34. Percentage compliance with drinking water
quality standard on E. Coli (SANS 241)
99.80% 99.80% 99% Target met
99.9%
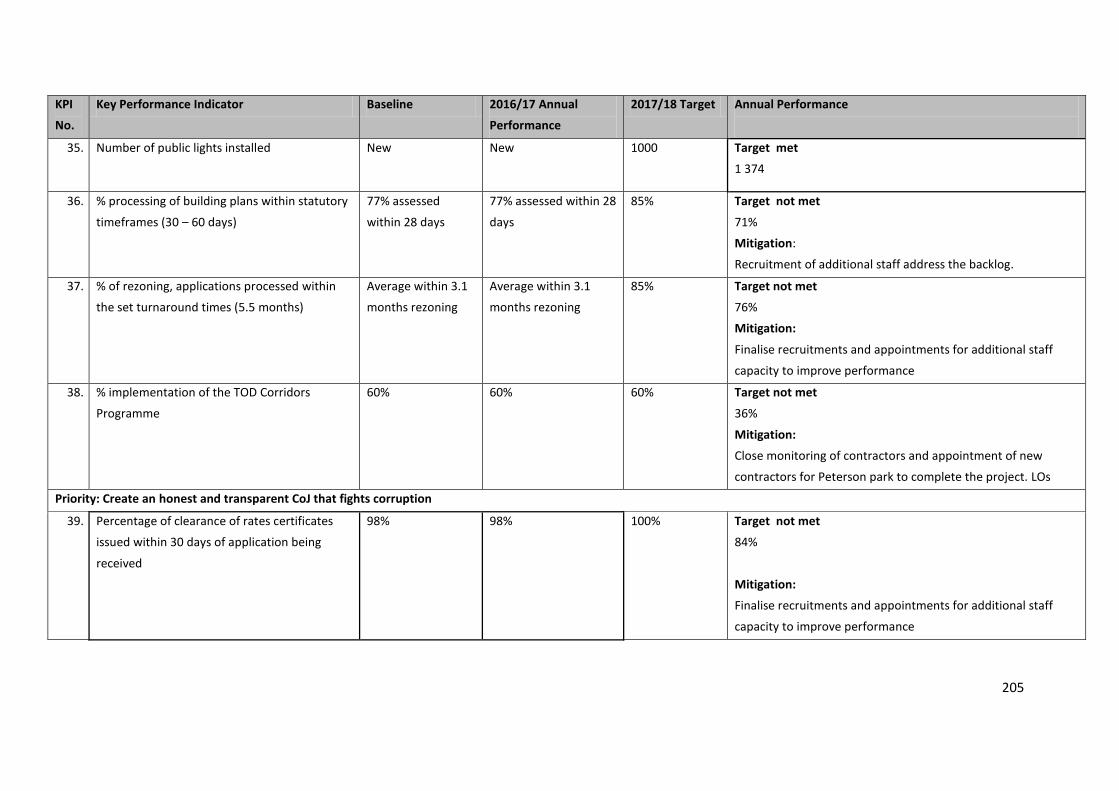
205
KPI
No.
Key Performance Indicator Baseline 2016/17 Annual
Performance
2017/18 Target Annual Performance
35. Number of public lights installed
New New 1000 Target met
1 374
36. % processing of building plans within statutory
timeframes (30 – 60 days)
77% assessed
within 28 days
77% assessed within 28
days
85% Target not met
71%
Mitigation:
Recruitment of additional staff address the backlog.
37. % of rezoning, applications processed within
the set turnaround times (5.5 months)
Average within 3.1
months rezoning
Average within 3.1
months rezoning
85% Target not met
76%
Mitigation:
Finalise recruitments and appointments for additional staff
capacity to improve performance
38. % implementation of the TOD Corridors
Programme
60% 60% 60% Target not met
36%
Mitigation:
Close monitoring of contractors and appointment of new
contractors for Peterson park to complete the project. LOs
Priority: Create an honest and transparent CoJ that fights corruption
39. Percentage of clearance of rates certificates
issued within 30 days of application being
received
98% 98% 100% Target not met
84%
Mitigation:
Finalise recruitments and appointments for additional staff
capacity to improve performance
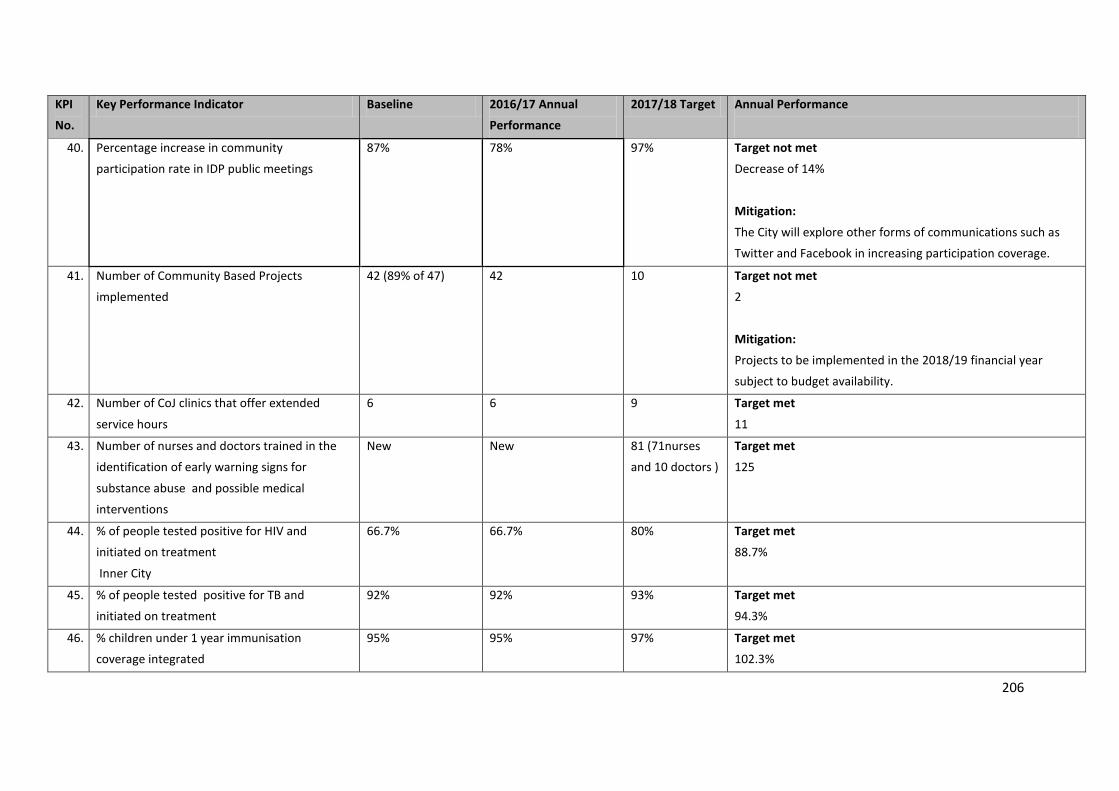
206
KPI
No.
Key Performance Indicator Baseline 2016/17 Annual
Performance
2017/18 Target Annual Performance
40. Percentage increase in community
participation rate in IDP public meetings
87% 78% 97% Target not met
Decrease of 14%
Mitigation:
The City will explore other forms of communications such as
Twitter and Facebook in increasing participation coverage.
41. Number of Community Based Projects
implemented
42 (89% of 47) 42 10 Target not met
2
Mitigation:
Projects to be implemented in the 2018/19 financial year
subject to budget availability.
42. Number of CoJ clinics that offer extended
service hours
6 6 9 Target met
11
43. Number of nurses and doctors trained in the
identification of early warning signs for
substance abuse and possible medical
interventions
New New 81 (71nurses
and 10 doctors )
Target met
125
44. % of people tested positive for HIV and
initiated on treatment
Inner City
66.7% 66.7% 80% Target met
88.7%
45. % of people tested positive for TB and
initiated on treatment
92% 92% 93% Target met
94.3%
46. % children under 1 year immunisation
coverage integrated
95% 95% 97% Target met
102.3%

207
KPI
No.
Key Performance Indicator Baseline 2016/17 Annual
Performance
2017/18 Target Annual Performance
47. % reduction in the prevalence rate of recent
and current use of illicit drugs in the overall
population of the City
New New 1.5% Target met
3.7%
48. Number of visitors to the Zoo 290 268 290 268 480 000 Target met
503 696
49. Number of participants in literacy / e-learning
programs in the libraries
12 000 12 000 12 500 Target met
56 320
50. % of museum programmes implemented New New 80% Target met
100%
51. Number of attendees to theatres New New 215 000 Target met
241 567
52. % of arts, culture and heritage programmes
implemented
New New 80% Target met
83%
53. % compliance with the grass cutting schedule New New 80% Target met
100%
54. Number of lifestyle programmes implemented
at Sports & Recreational facilities
4 4 12 Target met
17
55. Number of competitive sporting codes
implemented
4 4 7 Target met
7
Enhance our Financial Sustainability

208
KPI
No.
Key Performance Indicator Baseline 2016/17 Annual
Performance
2017/18 Target Annual Performance
56. Percentage spend of capital budget 90% 95% 95% Target not met
91%
Mitigation:
Monitor and reviewing of progress on Capital project
through SPMO.
57. Percentage spend on repairs and maintenance
to Property, Plant and Equipment
3.5% 3.5% 6.2% Target not met
4%
Mitigation:
Monitor and reviewing of progress percentage spend on
repairs.
58. Number of profitability and liquidity ratios
achieved
7 7 8 Target not met
6
Mitigation
Through the Financial Development Plan key financial
indicators are continually monitored to ensure healthy financial
performance and financial position.
59. Percentage collection of revenue in respect to
service billings
91% 91% 93.7% Target not met
90.7%
Mitigation:
Monitor and reviewing of progress on collection of revenue.
60. Percentage resolution of billing queries as per
the service level agreement
New New 97.3% Target not met
81.15 %
Mitigation:
The department will continue to encourage departments to
process invoices on time.
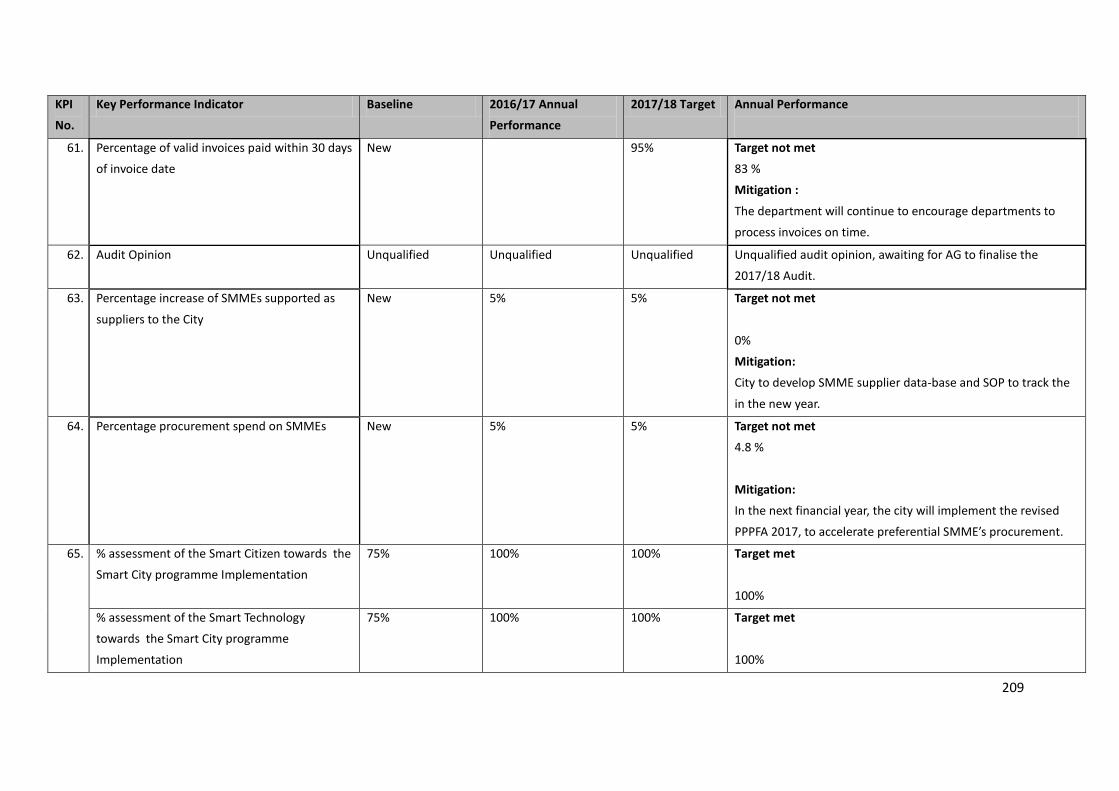
209
KPI
No.
Key Performance Indicator Baseline 2016/17 Annual
Performance
2017/18 Target Annual Performance
61. Percentage of valid invoices paid within 30 days
of invoice date
New 95% Target not met
83 %
Mitigation :
The department will continue to encourage departments to
process invoices on time.
62. Audit Opinion Unqualified Unqualified Unqualified Unqualified audit opinion, awaiting for AG to finalise the
2017/18 Audit.
63. Percentage increase of SMMEs supported as
suppliers to the City
New 5% 5% Target not met
0%
Mitigation:
City to develop SMME supplier data-base and SOP to track the
in the new year.
64. Percentage procurement spend on SMMEs New 5% 5% Target not met
4.8 %
Mitigation:
In the next financial year, the city will implement the revised
PPPFA 2017, to accelerate preferential SMME’s procurement.
65. % assessment of the Smart Citizen towards the
Smart City programme Implementation
75%
100% 100% Target met
100%
% assessment of the Smart Technology
towards the Smart City programme
Implementation
75%
100% 100% Target met
100%
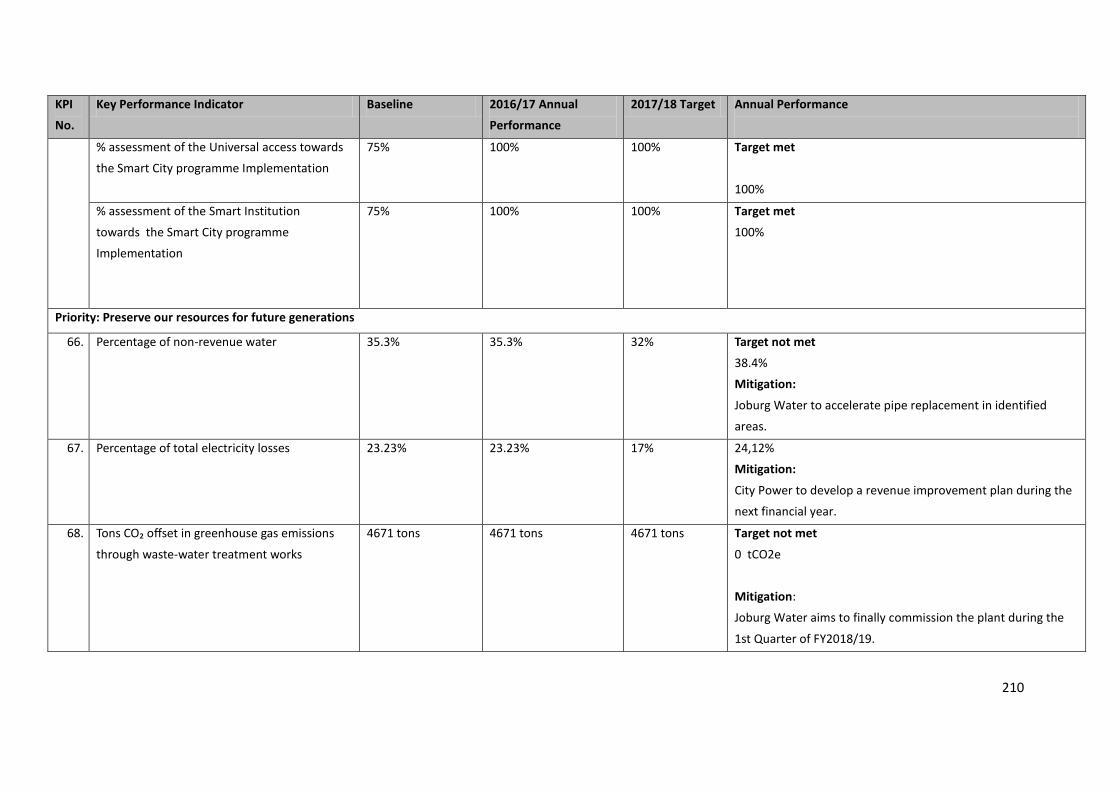
210
KPI
No.
Key Performance Indicator Baseline 2016/17 Annual
Performance
2017/18 Target Annual Performance
% assessment of the Universal access towards
the Smart City programme Implementation
75%
100% 100% Target met
100%
% assessment of the Smart Institution
towards the Smart City programme
Implementation
75%
100% 100% Target met
100%
Priority: Preserve our resources for future generations
66. Percentage of non-revenue water 35.3% 35.3% 32% Target not met
38.4%
Mitigation:
Joburg Water to accelerate pipe replacement in identified
areas.
67. Percentage of total electricity losses 23.23% 23.23% 17% 24,12%
Mitigation:
City Power to develop a revenue improvement plan during the
next financial year.
68. Tons CO₂ offset in greenhouse gas emissions
through waste-water treatment works
4671 tons 4671 tons 4671 tons Target not met
0 tCO2e
Mitigation:
Joburg Water aims to finally commission the plant during the
1st Quarter of FY2018/19.
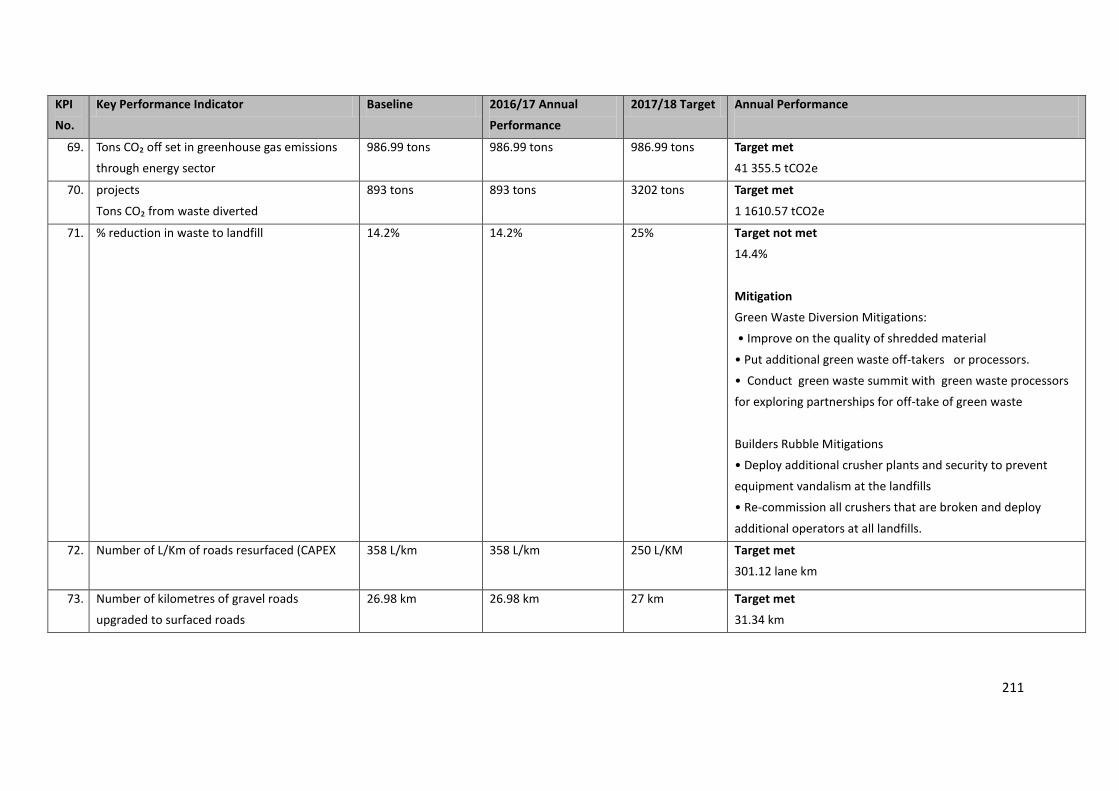
211
KPI
No.
Key Performance Indicator Baseline 2016/17 Annual
Performance
2017/18 Target Annual Performance
69. Tons CO₂ off set in greenhouse gas emissions
through energy sector
986.99 tons 986.99 tons 986.99 tons Target met
41 355.5 tCO2e
70. projects
Tons CO₂ from waste diverted
893 tons 893 tons 3202 tons Target met
1 1610.57 tCO2e
71. % reduction in waste to landfill 14.2%
14.2%
25% Target not met
14.4%
Mitigation
Green Waste Diversion Mitigations:
• Improve on the quality of shredded material
• Put additional green waste off-takers or processors.
• Conduct green waste summit with green waste processors
for exploring partnerships for off-take of green waste
Builders Rubble Mitigations
• Deploy additional crusher plants and security to prevent
equipment vandalism at the landfills
• Re-commission all crushers that are broken and deploy
additional operators at all landfills.
72. Number of L/Km of roads resurfaced (CAPEX 358 L/km 358 L/km 250 L/KM Target met
301.12 lane km
73. Number of kilometres of gravel roads
upgraded to surfaced roads
26.98 km 26.98 km 27 km Target met
31.34 km
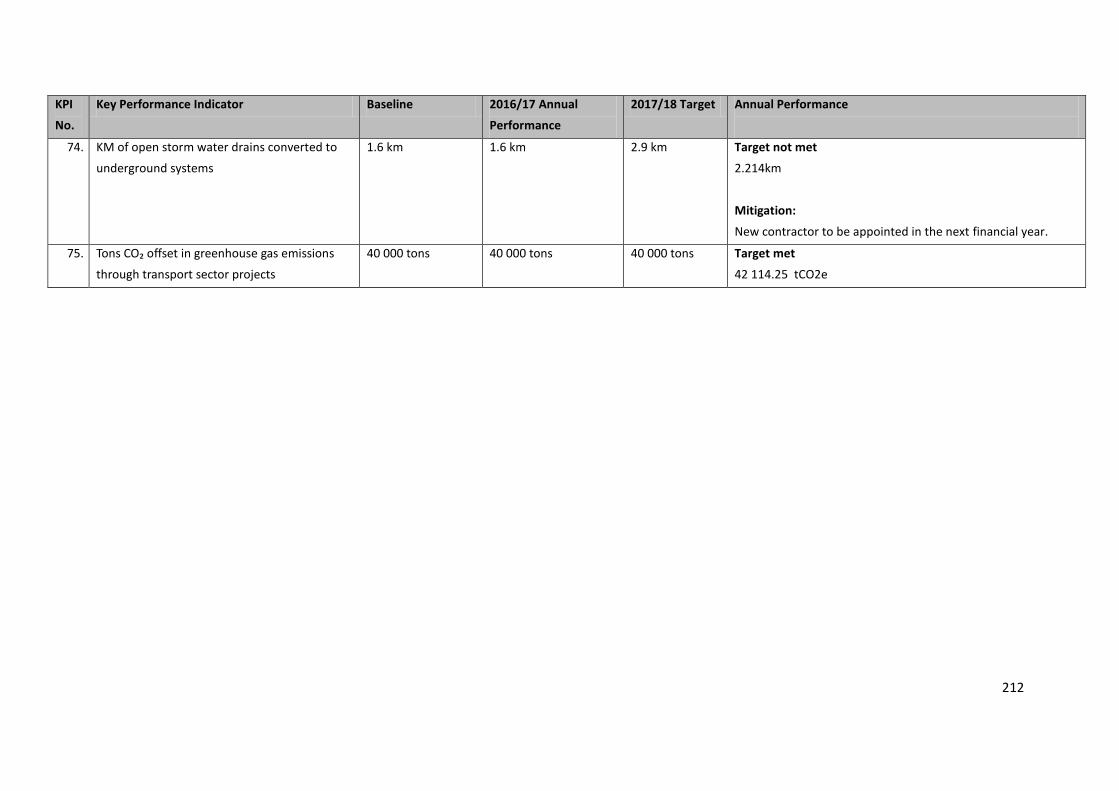
212
KPI
No.
Key Performance Indicator Baseline 2016/17 Annual
Performance
2017/18 Target Annual Performance
74. KM of open storm water drains converted to
underground systems
1.6 km 1.6 km 2.9 km Target not met
2.214km
Mitigation:
New contractor to be appointed in the next financial year.
75. Tons CO₂ offset in greenhouse gas emissions
through transport sector projects
40 000 tons 40 000 tons 40 000 tons Target met
42 114.25 tCO2e
213
4. Organisational Development Performance
4.1 Introduction to the municipal workforce
The operations of Group Human Capital Management are guided by the City’s objective of “a Well
Governed, Efficient and Effective Metropolitan Government Administration, with Professional and
Efficient Staff and Resources that Serve with Pride to make the City Work – so that South Africa Can
Work”.
The City is committed to the provision of professional, effective and efficient service delivery to its
community. In order for this service delivery to take place the City ensures a skilled workforce by
employing people with the required skills, experience and ability to add value to the City’s service
delivery.
The process to recruit employees with the required profile is supported by Human Capital Management
programmes and projects that are implemented across the City. Through these programmes and
projects the human capital capacity of the City is constantly assessed and developed to adapt to a
changing environment and to ensure that employees possess the required skills and competencies to
deliver required services.
Specifically the Human Capital Management Enhancement Programme links directly to the
professionalisation of the City as some of the elements that it addresses are:
Job Profiles inclusive of Job descriptions and grading;
Organisation Culture;
Employment Equity; and
Employment Relations and Development.
4.1.1 Job Profiles inclusive of Job description and grading
The Categorisation and Tuned Assessment of Skills and Knowledge (Task) Job Evaluation Wage Curve
collective agreement was concluded and signed by the South African Local Government Association
(SALGA) and organised labour representatives i.e. South African Municipal Workers Union (SAMWU) and
Independent Municipal Allied Trade Union (IMATU) on 19 April 2010. This collective agreement requires
that all municipalities, including the City of Johannesburg, convert all their current job evaluation
systems into a single job evaluation system, namely TASK. This in effect means that all jobs should be
reviewed and converted into a TASK job description format and be evaluated, correlated and/or
benchmarked to determine the weighting and grading accordingly.
The City of Johannesburg is currently using the TASK job evaluation system to evaluate, correlate and
benchmark the various positions. The system measures four primary factors namely:
214
Complexity: Range of Guidance, Task volumes and Interaction of the activities which are involved
in the specific job;
Knowledge: Minimum level of theoretical experience, training, abilities and judgement required
in the specific job to effectively and efficiently execute the required duties;
Influence: Influence of the post on other people in order to ascertain if the post does have
responsibility for the work of others in the same skill level which might include supervision and
advice to line manager. The frequency of communication between internal and external contacts
will be assessed in order to determine the impact of the interaction; and
Pressure: Range of deadlines, flow of work and uncertainty of the activities which are involved
in the post.
Current Status
The City’s Grading Committee functions with a mandate from SALGA and as such operates as a grading
agent, easing and reducing the workload of SALGA. The focus of the Committee is to evaluate, correlate
and benchmark positions within the City of Johannesburg.
The intention and mandate of the Grading Committee is that the committee should function
independently and autonomously without being influenced by Line Management to ensure an ethical
process conducted with high levels of integrity. The Grading Committee functions within the legislative
framework of the approved job evaluation policy.
4.1.2 Organisation Culture
Local authorities countrywide have gone through a number of transformations since 1994. Since 2000,
the CoJ has amalgamated a number of local authorities under its jurisdiction. The amalgamations brought
together a combination of people of differing individual and organisational cultures, making the CoJ a
multicultural organisation with a mixture of subcultures.
Organisational culture is ingrained in every aspect of an organisation and largely determined by the style
of leadership and management as well as by the employees of the organisation. High performance
organisations have a culture and a strategy that is clearly aligned, where culture drives behaviour that
enables effective delivery of strategic goals and objectives.
From the City’s Employee Satisfaction Survey of 2017, it is clear that it must aspire to have a clearly
defined culture that is aligned with its strategic intent and that employees should positively experience
high levels of job satisfaction and engagement. The diagnostic indicated that there is a need for a unified
and integrated strategic approach to organisational culture, which can give direction to current and future
strategies, programmes and deliverables. It is therefore a priority to develop a blueprint that forms the
basis of culture related interventions that are intended to build an espoused high performance culture
for the City.
To instil a preferred culture, the City will implement a phased process, firstly to review all its formal
mechanisms (policies, procedures and practices) to ensure strategic alignment with the vision and
mission. Secondly a programme of culture change (blueprint) will be designed and implemented based
on the development of a comprehensive framework for culture change in the CoJ.
215
4.1.3 Employment Equity
The implementation of Employment Equity (EE) Act, 55 of 1998 has been used as a transformational tool
within the City of Joburg. The Act assists the City with the elimination of discrimination as well as
improving diversity. To achieve this, consultative structures have been development in the various City
Core Administration departments as well as MEs to consult and develop the necessary strategy towards
the achievement of this legislative obligation. The following were methods deployed to ensure EE
compliance in the City in 2017/18;
Appointment and capacitation of EE management representatives responsible for championing
of EE, Disability and Gender in the respective departments;
Re-establishment of EE Forums in the City Departments for the period 2017/21 for continued
consultation on issues of unfair discrimination and well as the continuous monitoring for the
City’s implementation progress;
Sensitisation of the City’s employees on EE, Gender and Disability through formal and informal
workshop and awareness processes to ensure proper understanding and implementation going
forward; and
On-going monitoring of departmental deviations against set targets (i.e. in terms Race, Gender
and Disability) as well as guide line management on the strategies necessary to improve
compliance.
It must be noted that EE implementation remains a collective issue and requires the City’s commitment
as well as the commitment of all its employees.
4.1.4 Employee Relations and Development
Labour Relations
Municipalities and trade unions negotiate at the South African Local Government Bargaining Council
(SALGBC) for agreed upon collective agreements that regulate certain issues at a national level. Some of
the collective agreements concluded include the Main Collective Agreement and a Salary and Wage
Collective Agreement. The National Collective Agreements contribute to labour stability in the municipal
environment within South Africa. On 7 February 2018, a new Disciplinary Procedure Collective
Agreement was signed into effect by the parties to the SALGBC. In addition to all the above the City and
organised labour also negotiates at the Joburg Divisional Bargaining Council.
The final salary increase of the current Salary and Wage Agreement was implemented on 1 July 2017
with an expiry date of 30 June 2018. Negotiations are taking place to agree on a new Salary and Wage
Agreement with effect from 1 July 2018 for a period of three years.
There were no strikes on a national scale in the past five years however there was a locally triggered
strike in 2015 at a City level related to a parity issue between Municipal Entities and the City Core for
employees on the lower four remuneration levels e.g. general workers and operators. This resulted in a
City Group Programme to address issues of parity, which now forms part of the Human Capital
Management Enhancement Programme.
216
The Management of the Labour Relations environment is challenging because of the two factions within
SAMWU. The City manages this issue through engagement with both factions until such time that there
is clarity regarding which faction is the official SAMWU representative.
In order to equip senior and middle management levels the City continues with the Management and
Leadership Development Programme. The City continuously creates awareness with all employees
regarding the Code of Conduct as prescribed in the Municipal Systems Act Roadshows in Schedule 2,
through departmental presentations and internal publications.
Training and Development
Skills audits and the subsequent identification of skills gaps lead to specific development of employees
as a priority for the City. These actions ensure that the required skills to ensure the delivery of a
professional service are developed for individual employees in line with the specific functions that they
perform to ensure value-add to the City’s objectives. Interventions were proposed following the Skills
Audit of levels 1 and 2. The final report of the Skills Audit of levels 3 and 4 is awaiting Mayoral approval.
Skills development consists of both daily informal mentoring and coaching of employees as well as formal
training and developmental programmes. The City further implements some external outreach
programmes to contribute to the development of the community with a specific intent for the youth to
be skilled and obtain experience and exposure in order for them to become employable.
The following internal employee focused initiatives are implemented:
Subsidised Education to enhance City specific skills and career development;
Career path development for employees through performance management and individual
learning plan processes;
Leadership and Management Development Training Programmes;
Minimum Competency Training Programme to develop competencies in line with National
Treasury Competency requirements;
Adult Educational Training (AET) programmes for the previously disadvantaged;
Matric Programme for the previously disadvantaged; and
Skills Development Consulting Services to our internal clients (Business Units).
The following external Outreach Programmes are implemented:
Internship Programme that allow students to complete the practical component linked to their
studies which may allow such interns to become employable;
Learnership Programme for the community to make an educational contribution of theoretical
and practical skills which may allow such Learners to become employable; and
A Bursary Scheme for the community with a strategic intent to focus these bursaries on City
specific skills requirements.
4.2 Employee positioning, vacancies and turnover
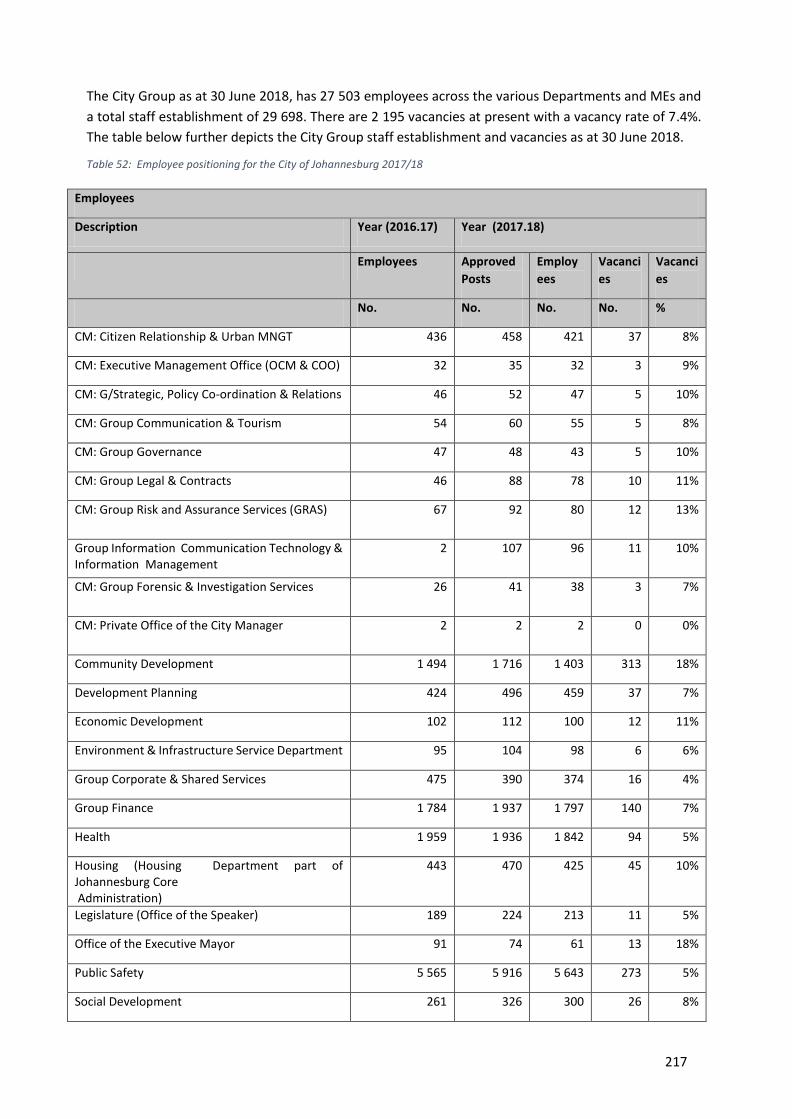
217
The City Group as at 30 June 2018, has 27 503 employees across the various Departments and MEs and
a total staff establishment of 29 698. There are 2 195 vacancies at present with a vacancy rate of 7.4%.
The table below further depicts the City Group staff establishment and vacancies as at 30 June 2018.
Table 52: Employee positioning for the City of Johannesburg 2017/18
Employees
Description Year (2016.17) Year (2017.18)
Employees Approved
Posts
Employ
ees
Vacanci
es
Vacanci
es
No. No. No. No. %
CM: Citizen Relationship & Urban MNGT 436 458 421 37 8%
CM: Executive Management Office (OCM & COO) 32 35 32 3 9%
CM: G/Strategic, Policy Co-ordination & Relations 46 52 47 5 10%
CM: Group Communication & Tourism 54 60 55 5 8%
CM: Group Governance 47 48 43 5 10%
CM: Group Legal & Contracts 46 88 78 10 11%
CM: Group Risk and Assurance Services (GRAS) 67 92 80 12 13%
Group Information Communication Technology & Information Management
2 107 96 11 10%
CM: Group Forensic & Investigation Services 26 41 38 3 7%
CM: Private Office of the City Manager 2 2 2 0 0%
Community Development 1 494 1 716 1 403 313 18%
Development Planning 424 496 459 37 7%
Economic Development 102 112 100 12 11%
Environment & Infrastructure Service Department 95 104 98 6 6%
Group Corporate & Shared Services 475 390 374 16 4%
Group Finance 1 784 1 937 1 797 140 7%
Health 1 959 1 936 1 842 94 5%
Housing (Housing Department part of Johannesburg Core Administration)
443 470 425 45 10%
Legislature (Office of the Speaker) 189 224 213 11 5%
Office of the Executive Mayor 91 74 61 13 18%
Public Safety 5 565 5 916 5 643 273 5%
Social Development 261 326 300 26 8%
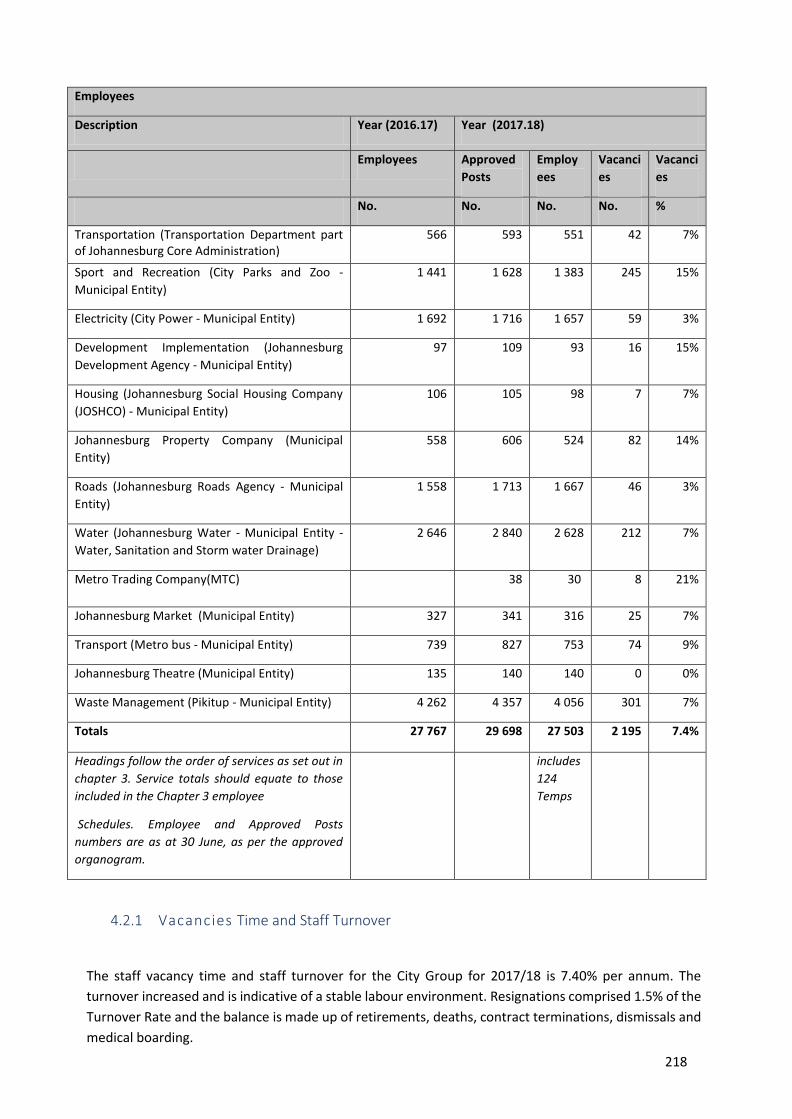
218
Employees
Description Year (2016.17) Year (2017.18)
Employees Approved
Posts
Employ
ees
Vacanci
es
Vacanci
es
No. No. No. No. %
Transportation (Transportation Department part of Johannesburg Core Administration)
566 593 551 42 7%
Sport and Recreation (City Parks and Zoo -
Municipal Entity)
1 441 1 628 1 383 245 15%
Electricity (City Power - Municipal Entity) 1 692 1 716 1 657 59 3%
Development Implementation (Johannesburg
Development Agency - Municipal Entity)
97 109 93 16 15%
Housing (Johannesburg Social Housing Company
(JOSHCO) - Municipal Entity)
106 105 98 7 7%
Johannesburg Property Company (Municipal
Entity)
558 606 524 82 14%
Roads (Johannesburg Roads Agency - Municipal
Entity)
1 558 1 713 1 667 46 3%
Water (Johannesburg Water - Municipal Entity -
Water, Sanitation and Storm water Drainage)
2 646 2 840 2 628 212 7%
Metro Trading Company(MTC) 38 30 8 21%
Johannesburg Market (Municipal Entity) 327 341 316 25 7%
Transport (Metro bus - Municipal Entity) 739 827 753 74 9%
Johannesburg Theatre (Municipal Entity) 135 140 140 0 0%
Waste Management (Pikitup - Municipal Entity) 4 262 4 357 4 056 301 7%
Totals 27 767 29 698 27 503 2 195 7.4%
Headings follow the order of services as set out in
chapter 3. Service totals should equate to those
included in the Chapter 3 employee
Schedules. Employee and Approved Posts
numbers are as at 30 June, as per the approved
organogram.
includes
124
Temps
4.2.1 Vacancies Time and Staff Turnover
The staff vacancy time and staff turnover for the City Group for 2017/18 is 7.40% per annum. The
turnover increased and is indicative of a stable labour environment. Resignations comprised 1.5% of the
Turnover Rate and the balance is made up of retirements, deaths, contract terminations, dismissals and
medical boarding.
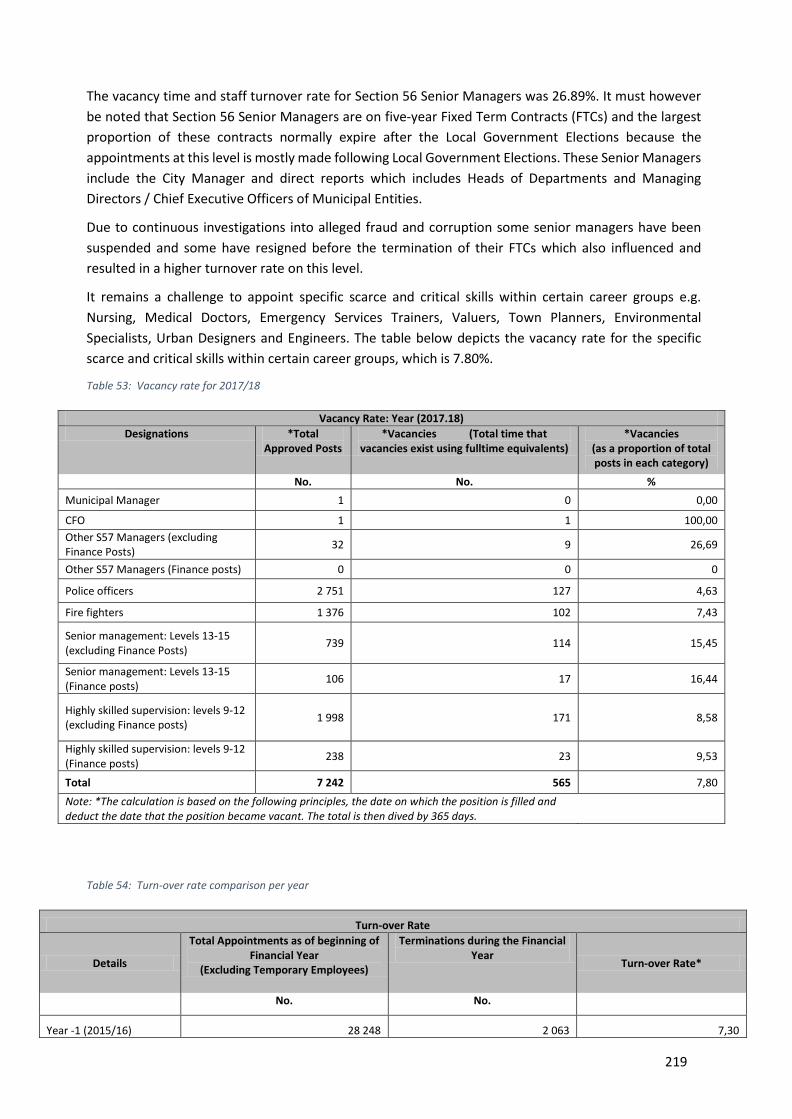
219
The vacancy time and staff turnover rate for Section 56 Senior Managers was 26.89%. It must however
be noted that Section 56 Senior Managers are on five-year Fixed Term Contracts (FTCs) and the largest
proportion of these contracts normally expire after the Local Government Elections because the
appointments at this level is mostly made following Local Government Elections. These Senior Managers
include the City Manager and direct reports which includes Heads of Departments and Managing
Directors / Chief Executive Officers of Municipal Entities.
Due to continuous investigations into alleged fraud and corruption some senior managers have been
suspended and some have resigned before the termination of their FTCs which also influenced and
resulted in a higher turnover rate on this level.
It remains a challenge to appoint specific scarce and critical skills within certain career groups e.g.
Nursing, Medical Doctors, Emergency Services Trainers, Valuers, Town Planners, Environmental
Specialists, Urban Designers and Engineers. The table below depicts the vacancy rate for the specific
scarce and critical skills within certain career groups, which is 7.80%.
Table 53: Vacancy rate for 2017/18
Vacancy Rate: Year (2017.18)
Designations *Total Approved Posts
*Vacancies (Total time that vacancies exist using fulltime equivalents)
*Vacancies (as a proportion of total posts in each category)
No. No. %
Municipal Manager 1 0 0,00
CFO 1 1 100,00
Other S57 Managers (excluding Finance Posts)
32 9 26,69
Other S57 Managers (Finance posts) 0 0 0
Police officers 2 751 127 4,63
Fire fighters 1 376 102 7,43
Senior management: Levels 13-15 (excluding Finance Posts)
739 114 15,45
Senior management: Levels 13-15 (Finance posts)
106 17 16,44
Highly skilled supervision: levels 9-12 (excluding Finance posts)
1 998 171 8,58
Highly skilled supervision: levels 9-12 (Finance posts)
238 23 9,53
Total 7 242 565 7,80
Note: *The calculation is based on the following principles, the date on which the position is filled and deduct the date that the position became vacant. The total is then dived by 365 days.
Table 54: Turn-over rate comparison per year
Turn-over Rate
Details
Total Appointments as of beginning of Financial Year
(Excluding Temporary Employees)
Terminations during the Financial Year
Turn-over Rate*
No. No.
Year -1 (2015/16) 28 248 2 063 7,30
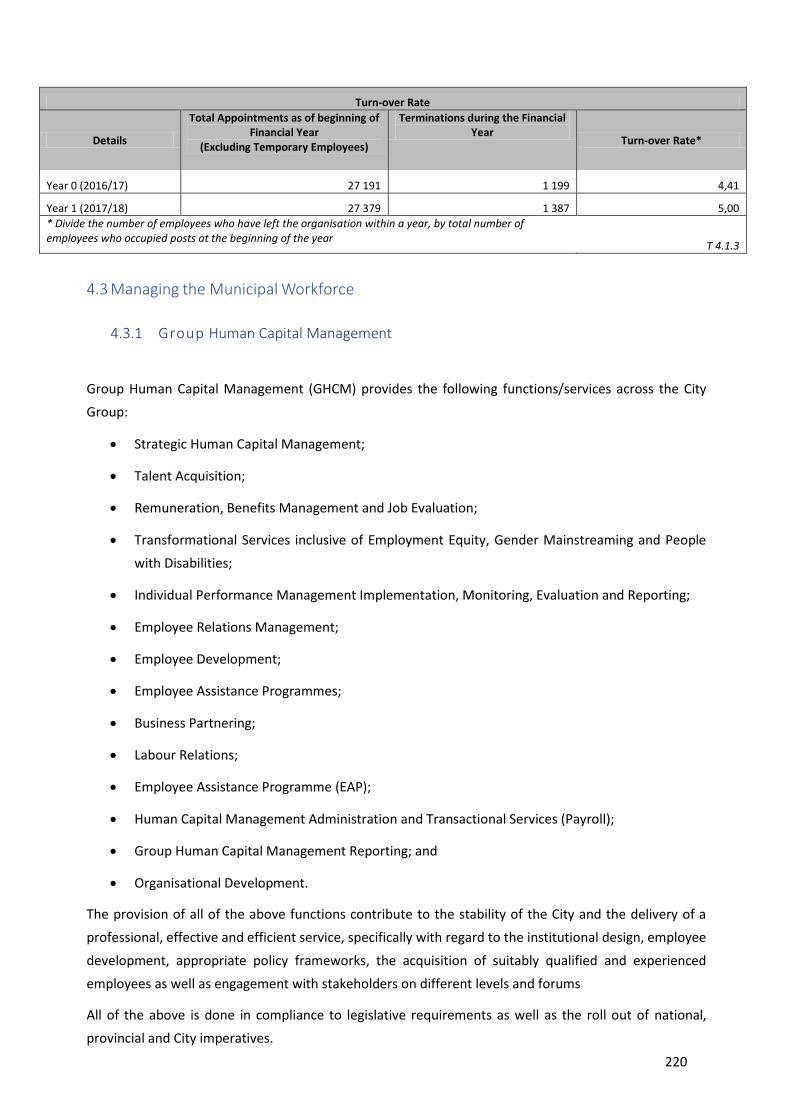
220
Turn-over Rate
Details
Total Appointments as of beginning of Financial Year
(Excluding Temporary Employees)
Terminations during the Financial Year
Turn-over Rate*
Year 0 (2016/17) 27 191 1 199 4,41
Year 1 (2017/18) 27 379 1 387 5,00
* Divide the number of employees who have left the organisation within a year, by total number of employees who occupied posts at the beginning of the year
T 4.1.3
4.3 Managing the Municipal Workforce
4.3.1 Group Human Capital Management
Group Human Capital Management (GHCM) provides the following functions/services across the City
Group:
Strategic Human Capital Management;
Talent Acquisition;
Remuneration, Benefits Management and Job Evaluation;
Transformational Services inclusive of Employment Equity, Gender Mainstreaming and People
with Disabilities;
Individual Performance Management Implementation, Monitoring, Evaluation and Reporting;
Employee Relations Management;
Employee Development;
Employee Assistance Programmes;
Business Partnering;
Labour Relations;
Employee Assistance Programme (EAP);
Human Capital Management Administration and Transactional Services (Payroll);
Group Human Capital Management Reporting; and
Organisational Development.
The provision of all of the above functions contribute to the stability of the City and the delivery of a
professional, effective and efficient service, specifically with regard to the institutional design, employee
development, appropriate policy frameworks, the acquisition of suitably qualified and experienced
employees as well as engagement with stakeholders on different levels and forums
All of the above is done in compliance to legislative requirements as well as the roll out of national,
provincial and City imperatives.
221
4.3.1.1 Regulatory Compliance, Policy and Planning
The City Group currently consists of the Core Administration and 12 MEs. The City Group formulates and
reviews Human Capital Management Policy Frameworks and the MEs are expected to customise or align
their policies without downgrading the set guidelines and standards. This contributes to a standardised
Human Capital environment within the City Group.
The City is in the process of an Institutional Review as per legislative requirements and once approval
processes have been finalised, new structures will be implemented and subsequently maintained in the
normal course of business through the Organisational Development Directorate within GHCM.
Notwithstanding this, business as usual continues in this regard where amendments of structures are
necessary to enhance and ensure effective service delivery.
The City ensures compliance with the legislative requirements e.g. Employment Equity Act, Skills
Development Act, Labour Relations Act, Collective Agreements, etc. Specifically for Employment Equity
and Skills Development, the City reports on progress made to the applicable structures e.g. Department
of Labour and Local Government SETA. The City’s Employment Equity Plan for the period 2016 to 2021
was approved and the process of implementation continues accordingly.
The parity benchmarking exercise that started in 2016 with the implementation of the common salary
key-scales across the City Group is currently being implemented. Phase 1 for Pikitup on the A and B bands
has been concluded and Phase 2 is currently under way.
The governing Policy Frameworks of GHCM address inequality and poverty by:
Incorporating EE elements and principles in all policies;
Offering a Bursary Scheme and opportunities to interns and learners;
Providing support to the Expanded Public Works Programme (EPWP) in which temporary workers
are sourced from the community;
Addressing the issue of gender and disability management in the GHCM Policy Frameworks;
Providing GHCM Policy Frameworks to the MEs as a minimum standard for supporting the City;
and
Growth and Development Strategy (GDS).
Some GHCM Policy Frameworks are due for review and a need has also been identified for the
development of some new Policy Frameworks.
The Department of Cooperative Development and Traditional Affairs (COGTA) is currently in the process
of drafting new Local Government Staff Regulations which includes specific frameworks for some Human
Capital functions which will affect the development of new Policy Frameworks as well as the review
thereof.
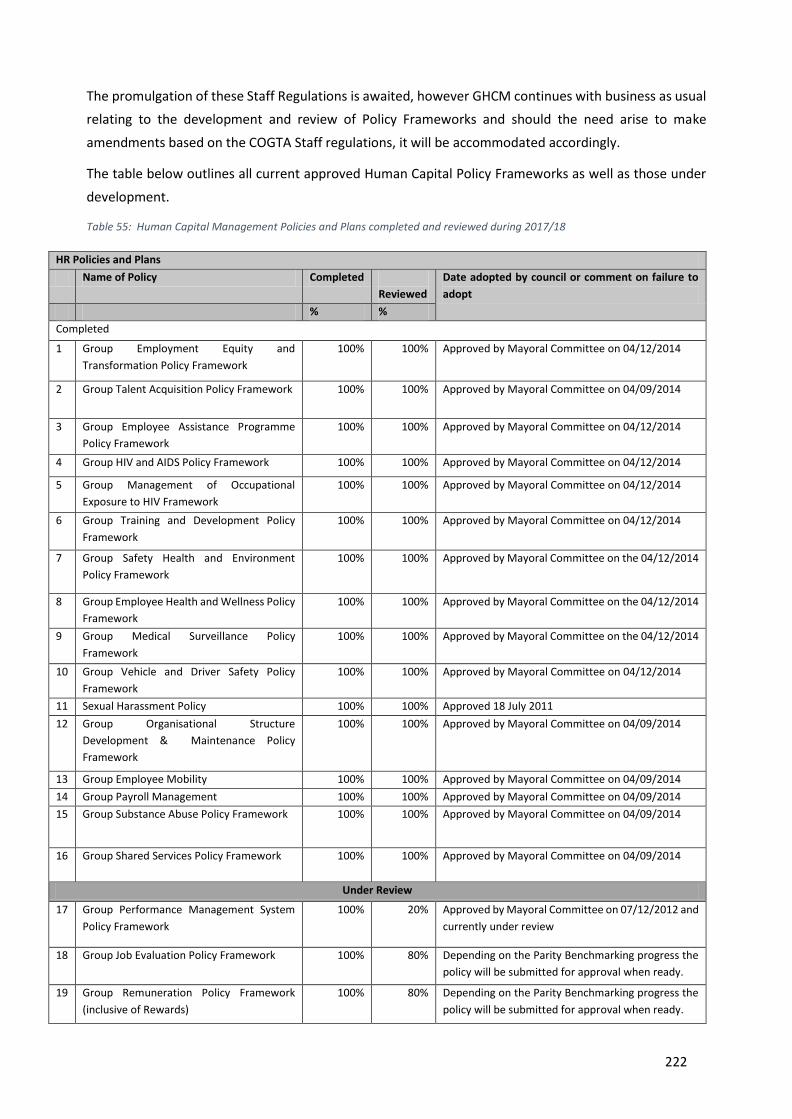
222
The promulgation of these Staff Regulations is awaited, however GHCM continues with business as usual
relating to the development and review of Policy Frameworks and should the need arise to make
amendments based on the COGTA Staff regulations, it will be accommodated accordingly.
The table below outlines all current approved Human Capital Policy Frameworks as well as those under
development.
Table 55: Human Capital Management Policies and Plans completed and reviewed during 2017/18
HR Policies and Plans
Name of Policy Completed
Reviewed
Date adopted by council or comment on failure to
adopt
% %
Completed
1 Group Employment Equity and
Transformation Policy Framework
100% 100% Approved by Mayoral Committee on 04/12/2014
2 Group Talent Acquisition Policy Framework 100% 100% Approved by Mayoral Committee on 04/09/2014
3 Group Employee Assistance Programme
Policy Framework
100% 100% Approved by Mayoral Committee on 04/12/2014
4 Group HIV and AIDS Policy Framework 100% 100% Approved by Mayoral Committee on 04/12/2014
5 Group Management of Occupational
Exposure to HIV Framework
100% 100% Approved by Mayoral Committee on 04/12/2014
6 Group Training and Development Policy
Framework
100% 100% Approved by Mayoral Committee on 04/12/2014
7 Group Safety Health and Environment
Policy Framework
100% 100% Approved by Mayoral Committee on the 04/12/2014
8 Group Employee Health and Wellness Policy
Framework
100% 100% Approved by Mayoral Committee on the 04/12/2014
9 Group Medical Surveillance Policy
Framework
100% 100% Approved by Mayoral Committee on the 04/12/2014
10 Group Vehicle and Driver Safety Policy
Framework
100% 100% Approved by Mayoral Committee on 04/12/2014
11 Sexual Harassment Policy 100% 100% Approved 18 July 2011
12 Group Organisational Structure
Development & Maintenance Policy
Framework
100% 100% Approved by Mayoral Committee on 04/09/2014
13 Group Employee Mobility 100% 100% Approved by Mayoral Committee on 04/09/2014
14 Group Payroll Management 100% 100% Approved by Mayoral Committee on 04/09/2014
15 Group Substance Abuse Policy Framework 100% 100% Approved by Mayoral Committee on 04/09/2014
16 Group Shared Services Policy Framework 100% 100% Approved by Mayoral Committee on 04/09/2014
Under Review
17 Group Performance Management System
Policy Framework
100% 20% Approved by Mayoral Committee on 07/12/2012 and
currently under review
18 Group Job Evaluation Policy Framework 100% 80% Depending on the Parity Benchmarking progress the
policy will be submitted for approval when ready.
19 Group Remuneration Policy Framework
(inclusive of Rewards)
100% 80% Depending on the Parity Benchmarking progress the
policy will be submitted for approval when ready.
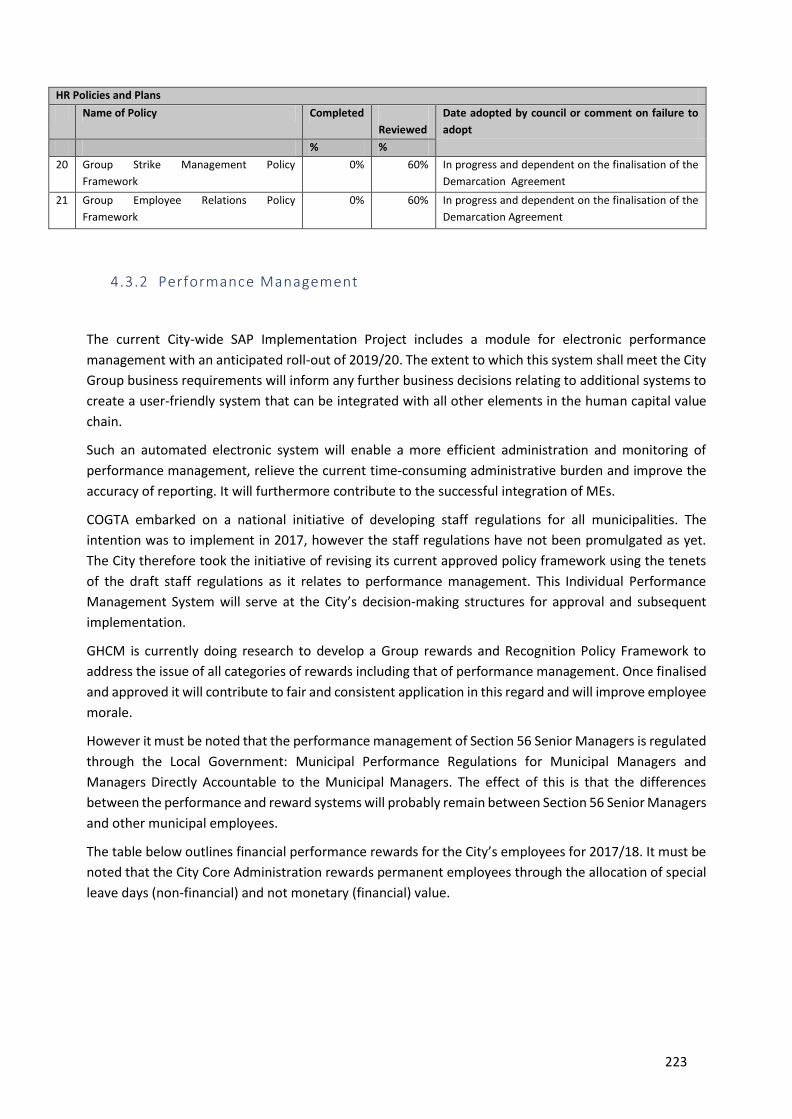
223
HR Policies and Plans
Name of Policy Completed
Reviewed
Date adopted by council or comment on failure to
adopt
% %
20 Group Strike Management Policy
Framework
0% 60% In progress and dependent on the finalisation of the
Demarcation Agreement
21 Group Employee Relations Policy
Framework
0% 60% In progress and dependent on the finalisation of the
Demarcation Agreement
4.3.2 Performance Management
The current City-wide SAP Implementation Project includes a module for electronic performance
management with an anticipated roll-out of 2019/20. The extent to which this system shall meet the City
Group business requirements will inform any further business decisions relating to additional systems to
create a user-friendly system that can be integrated with all other elements in the human capital value
chain.
Such an automated electronic system will enable a more efficient administration and monitoring of
performance management, relieve the current time-consuming administrative burden and improve the
accuracy of reporting. It will furthermore contribute to the successful integration of MEs.
COGTA embarked on a national initiative of developing staff regulations for all municipalities. The
intention was to implement in 2017, however the staff regulations have not been promulgated as yet.
The City therefore took the initiative of revising its current approved policy framework using the tenets
of the draft staff regulations as it relates to performance management. This Individual Performance
Management System will serve at the City’s decision-making structures for approval and subsequent
implementation.
GHCM is currently doing research to develop a Group rewards and Recognition Policy Framework to
address the issue of all categories of rewards including that of performance management. Once finalised
and approved it will contribute to fair and consistent application in this regard and will improve employee
morale.
However it must be noted that the performance management of Section 56 Senior Managers is regulated
through the Local Government: Municipal Performance Regulations for Municipal Managers and
Managers Directly Accountable to the Municipal Managers. The effect of this is that the differences
between the performance and reward systems will probably remain between Section 56 Senior Managers
and other municipal employees.
The table below outlines financial performance rewards for the City’s employees for 2017/18. It must be
noted that the City Core Administration rewards permanent employees through the allocation of special
leave days (non-financial) and not monetary (financial) value.

224
Table 70: Performance rewards by Gender
Designations Beneficiary profile
Gender Total number of
employees in
group
Number of
beneficiaries
Expenditure on
rewards Year 0
(2017.18)
Proportion of
beneficiaries
within group
R' 000 %
F)Unskilled Female 3 014 318 1 321 11%
Male 3 909 724 2 212 19%
E)Semi-skilled Female 2 823 324 4 816 11%
Male 4 020 836 10 846 21%
D)Skilled & Jnr
Management
Female 4 604 362 9 785 8%
Male 6 177 1 098 31 902 18%
C)Profes & Mid
Management
Female 920 210 10 841 23%
Male 1 156 358 19 695 31%
B)Snr
Management
Female 268 17 2 575 6%
Male 449 31 4 586 7%
A)Top
Management
Female 7 1 313 14%
Male 13 0 0
Total 27 379 4 279 98 893 16%
Has the statutory municipal calculator been used as part of the evaluation process? Yes/No
Note: MSA 2000 S51 (d) requires that … ‘performance plans, on which rewards are based should be
aligned with the IDP’… (IDP objectives and targets are set out in Chapter 3) and that Service Delivery and
Budget Implementation Plans (developed under MFMA S69 and Circular 13) should be consistent with
the higher level IDP targets and must be incorporated appropriately in personal performance
agreements as the basis of performance rewards. Those with disability are shown in brackets '(x)' in the
'Number of beneficiaries' column as well as in the numbers at the right hand side of the column (as
illustrated above).
*Note:
The proportion of beneficiaries within the group is above 100% because the employment of some of the beneficiaries at this level
had terminated before the end of the financial year.
225
4.4 Capacitating the municipal workforce
4.4.1 Competency Development
During the 2017/18 financial year the City of Joburg continued to capacitate its employees as per the Skills
Development Act requirements. A number of employees were trained on their specific job requirements so as
to enable them to function at optimum level.
All levels of management were trained on leadership and management skills as per skills audit findings so that
they can manage their teams more effectively. The City also continued to train employees affected by the
National Treasury requirements on Minimum Competency Levels. Financial constraints make it difficult to
provide all the capacitation required by employees and to efficiently manage this, the City has to prioritise and
focus on the most urgent training needs.
The City is also considering building internal capacity in order to reduce over reliance on service providers.
Several applications have been made to the Local Government Seta in terms of a discretionary grant. This
process is challenging as the LGSETA is slow on responding to these requests, which makes it difficult to plan
training going forward.
Focussed training for certain Business Units related to their specific functions, was also implemented to
improve productivity levels in these areas. Training included the Adult Education Training (AET), Matric
Programme, Financial Life Skills and Awareness Programmes on different issues such as health. All employees
have Individual Learning Plans (ILPs) that are linked to their Performance Management and all ILPs are
considered when compiling the City’s Workplace Skills Plan (WSP). Skills gaps identified during the Skills Audit
are reflected in the Workplace Skills Plan for the City. Both the Workplace Skills Plan and the Annual Training
Report were timeously submitted to the Local Government SETA.
The City, in addressing the priority “of creating an efficient work force”, needs to inculcate a culture of
continuous learning in the organisation. Skills development is not the only mechanism of formalised training
and development. Coaching, mentoring and on-the-job training are also used in the skills development
processes. The Return on Investment (ROI) for training and development will be improved when all the
components of a culture of a learning organisation is developed.
The table below reflects the skills levels and number of skilled employees for 2017/18.
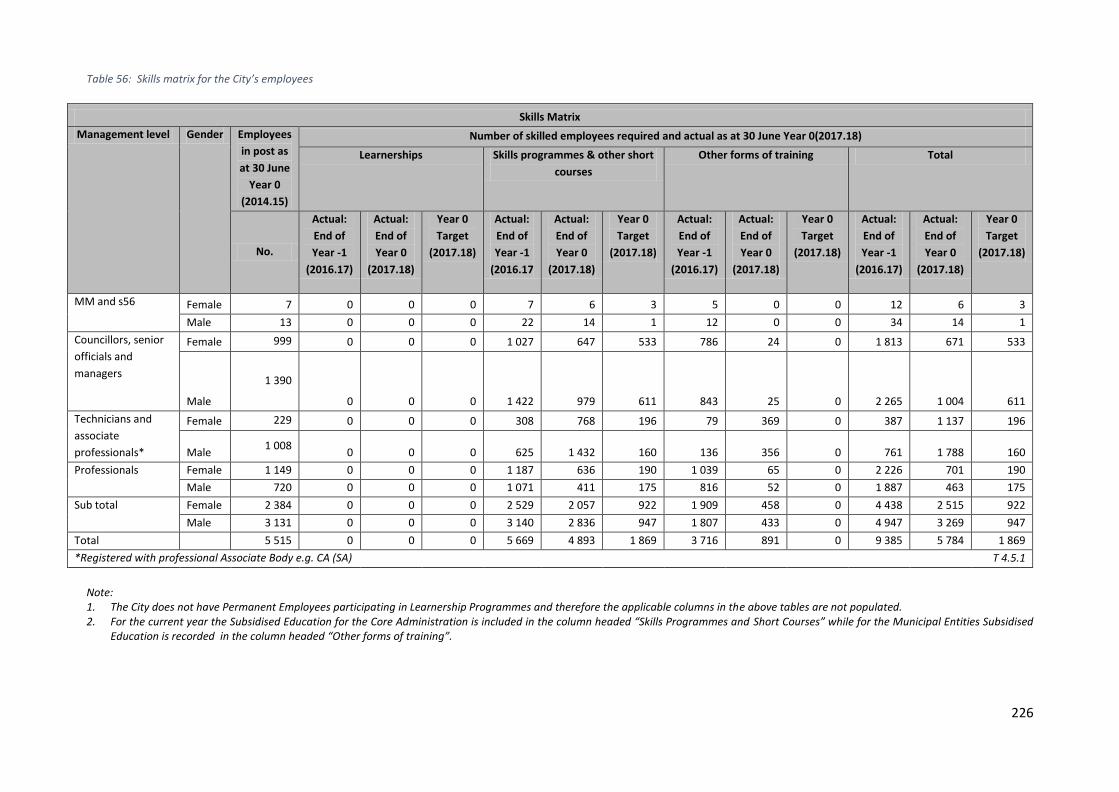
226
Table 56: Skills matrix for the City’s employees
Skills Matrix
Management level Gender Employees
in post as
at 30 June
Year 0
(2014.15)
Number of skilled employees required and actual as at 30 June Year 0(2017.18)
Learnerships Skills programmes & other short
courses
Other forms of training Total
No.
Actual:
End of
Year -1
(2016.17)
Actual:
End of
Year 0
(2017.18)
Year 0
Target
(2017.18)
Actual:
End of
Year -1
(2016.17
Actual:
End of
Year 0
(2017.18)
Year 0
Target
(2017.18)
Actual:
End of
Year -1
(2016.17)
Actual:
End of
Year 0
(2017.18)
Year 0
Target
(2017.18)
Actual:
End of
Year -1
(2016.17)
Actual:
End of
Year 0
(2017.18)
Year 0
Target
(2017.18)
MM and s56 Female 7 0 0 0 7 6 3 5 0 0 12 6 3
Male 13 0 0 0 22 14 1 12 0 0 34 14 1
Councillors, senior
officials and
managers
Female 999 0 0 0 1 027 647 533 786 24 0 1 813 671 533
Male
1 390
0 0 0 1 422 979 611 843 25 0 2 265 1 004 611
Technicians and
associate
professionals*
Female 229 0 0 0 308 768 196 79 369 0 387 1 137 196
Male 1 008
0 0 0 625 1 432 160 136 356 0 761 1 788 160
Professionals Female 1 149 0 0 0 1 187 636 190 1 039 65 0 2 226 701 190
Male 720 0 0 0 1 071 411 175 816 52 0 1 887 463 175
Sub total Female 2 384 0 0 0 2 529 2 057 922 1 909 458 0 4 438 2 515 922
Male 3 131 0 0 0 3 140 2 836 947 1 807 433 0 4 947 3 269 947
Total 5 515 0 0 0 5 669 4 893 1 869 3 716 891 0 9 385 5 784 1 869
*Registered with professional Associate Body e.g. CA (SA) T 4.5.1
Note: 1. The City does not have Permanent Employees participating in Learnership Programmes and therefore the applicable columns in the above tables are not populated. 2. For the current year the Subsidised Education for the Core Administration is included in the column headed “Skills Programmes and Short Courses” while for the Municipal Entities Subsidised
Education is recorded in the column headed “Other forms of training”.
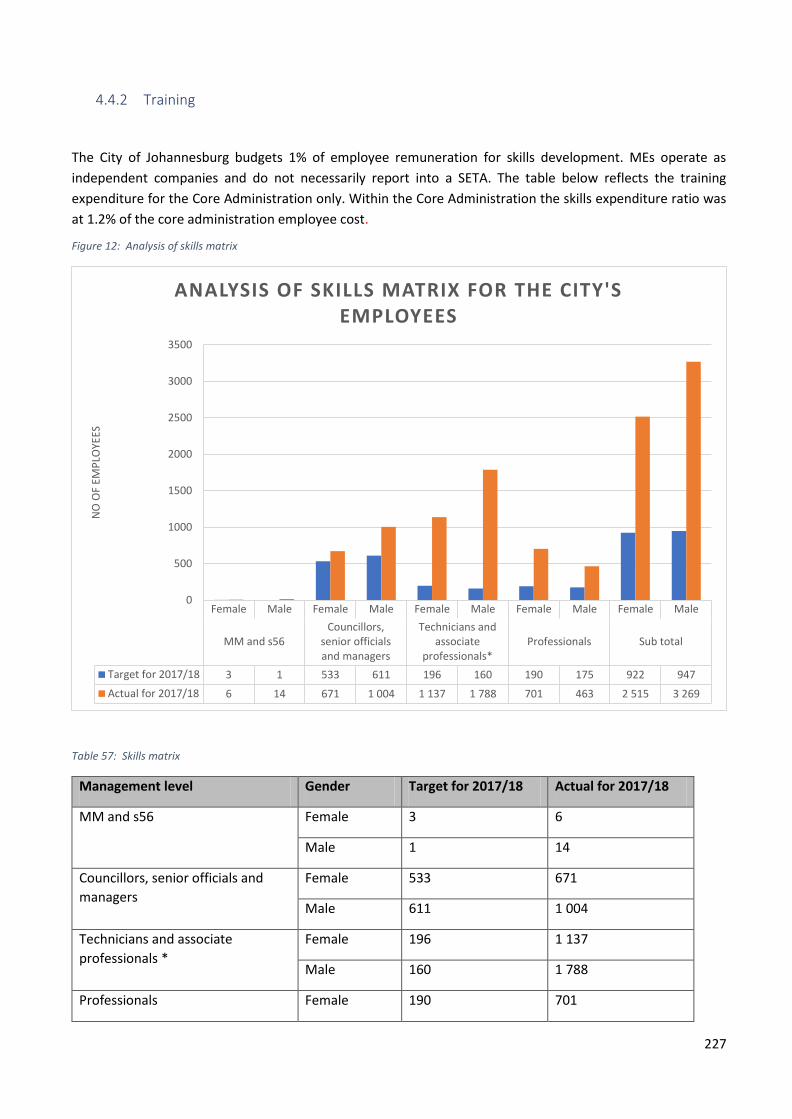
227
4.4.2 Training
The City of Johannesburg budgets 1% of employee remuneration for skills development. MEs operate as
independent companies and do not necessarily report into a SETA. The table below reflects the training
expenditure for the Core Administration only. Within the Core Administration the skills expenditure ratio was
at 1.2% of the core administration employee cost.
Figure 12: Analysis of skills matrix
Table 57: Skills matrix
Management level Gender Target for 2017/18 Actual for 2017/18
MM and s56 Female 3 6
Male 1 14
Councillors, senior officials and
managers
Female 533 671
Male 611 1 004
Technicians and associate
professionals *
Female 196 1 137
Male 160 1 788
Professionals Female 190 701
Female Male Female Male Female Male Female Male Female Male
MM and s56Councillors,
senior officialsand managers
Technicians andassociate
professionals*Professionals Sub total
Target for 2017/18 3 1 533 611 196 160 190 175 922 947
Actual for 2017/18 6 14 671 1 004 1 137 1 788 701 463 2 515 3 269
0
500
1000
1500
2000
2500
3000
3500
NO
OF
EMP
LOYE
ES
ANALYSIS OF SKILLS MATRIX FOR THE CITY'S EMPLOYEES

228
Management level Gender Target for 2017/18 Actual for 2017/18
Male 175 463
Sub total Female 922 2 515
Male 947 3 269
Total 1 869 5 784
*Registered with professional Associate Body e.g. CA (SA)
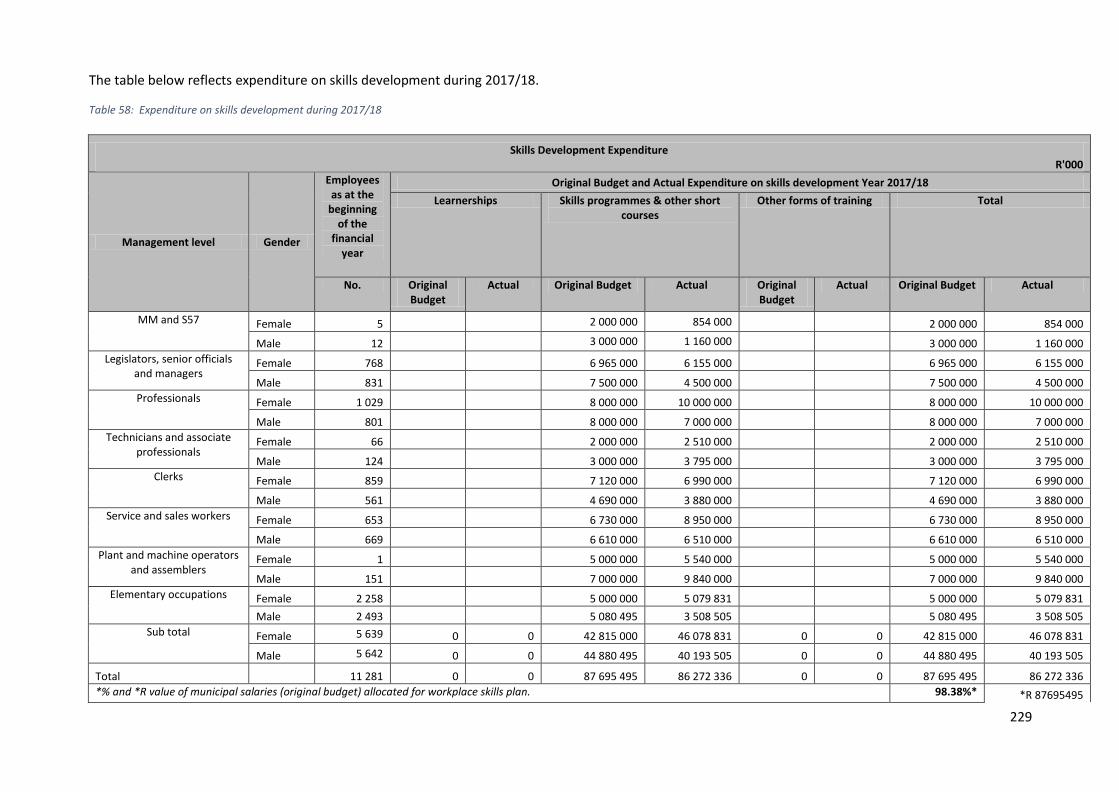
229
The table below reflects expenditure on skills development during 2017/18.
Table 58: Expenditure on skills development during 2017/18
Skills Development Expenditure R'000
Management level Gender
Employees as at the
beginning of the
financial year
Original Budget and Actual Expenditure on skills development Year 2017/18
Learnerships Skills programmes & other short courses
Other forms of training Total
No. Original Budget
Actual Original Budget Actual Original Budget
Actual Original Budget Actual
MM and S57 Female 5 2 000 000 854 000 2 000 000 854 000
Male 12 3 000 000 1 160 000 3 000 000 1 160 000
Legislators, senior officials and managers
Female 768 6 965 000 6 155 000 6 965 000 6 155 000
Male 831 7 500 000 4 500 000 7 500 000 4 500 000
Professionals Female 1 029 8 000 000 10 000 000 8 000 000 10 000 000
Male 801 8 000 000 7 000 000 8 000 000 7 000 000
Technicians and associate professionals
Female 66 2 000 000 2 510 000 2 000 000 2 510 000
Male 124 3 000 000 3 795 000 3 000 000 3 795 000
Clerks Female 859 7 120 000 6 990 000 7 120 000 6 990 000
Male 561 4 690 000 3 880 000 4 690 000 3 880 000
Service and sales workers Female 653 6 730 000 8 950 000 6 730 000 8 950 000
Male 669 6 610 000 6 510 000 6 610 000 6 510 000
Plant and machine operators and assemblers
Female 1 5 000 000 5 540 000 5 000 000 5 540 000
Male 151 7 000 000 9 840 000 7 000 000 9 840 000
Elementary occupations Female 2 258 5 000 000 5 079 831 5 000 000 5 079 831
Male 2 493 5 080 495 3 508 505 5 080 495 3 508 505
Sub total Female 5 639 0 0 42 815 000 46 078 831 0 0 42 815 000 46 078 831
Male 5 642 0 0 44 880 495 40 193 505 0 0 44 880 495 40 193 505
Total 11 281 0 0 87 695 495 86 272 336 0 0 87 695 495 86 272 336
*% and *R value of municipal salaries (original budget) allocated for workplace skills plan. 98.38%* *R 87695495
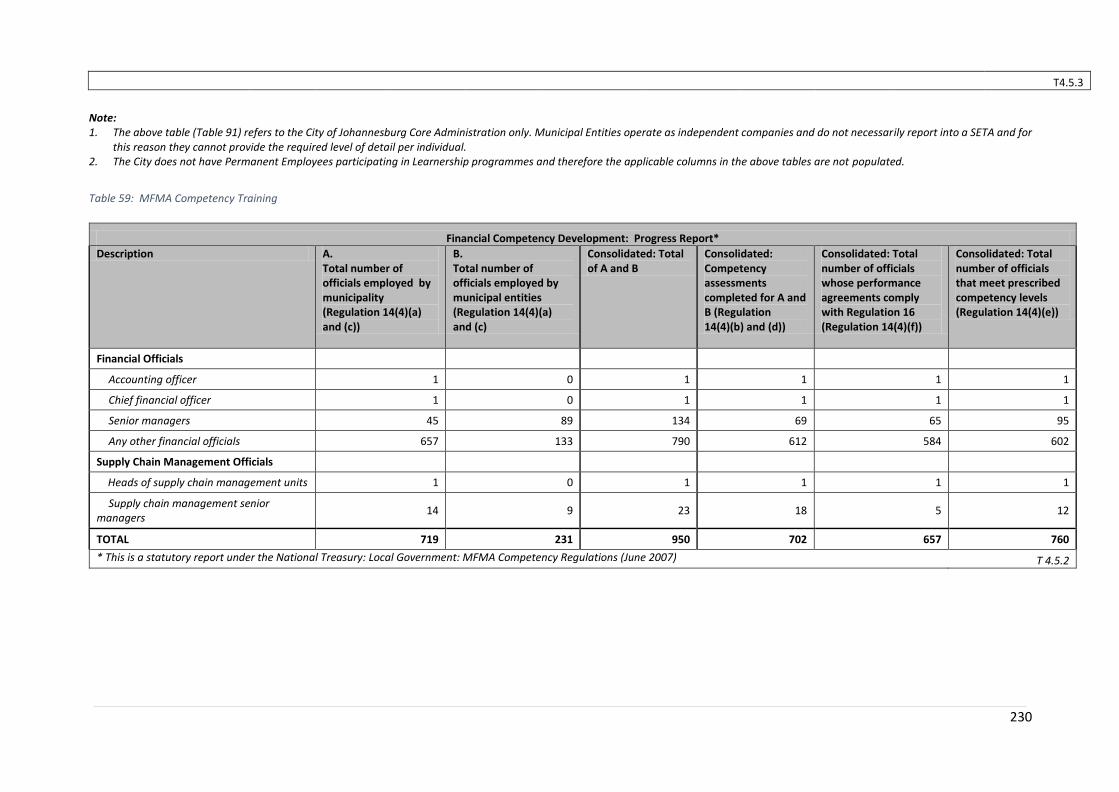
230
T4.5.3
Note: 1. The above table (Table 91) refers to the City of Johannesburg Core Administration only. Municipal Entities operate as independent companies and do not necessarily report into a SETA and for
this reason they cannot provide the required level of detail per individual. 2. The City does not have Permanent Employees participating in Learnership programmes and therefore the applicable columns in the above tables are not populated.
Table 59: MFMA Competency Training
Financial Competency Development: Progress Report*
Description A. Total number of officials employed by municipality (Regulation 14(4)(a) and (c))
B. Total number of officials employed by municipal entities (Regulation 14(4)(a) and (c)
Consolidated: Total of A and B
Consolidated: Competency assessments completed for A and B (Regulation 14(4)(b) and (d))
Consolidated: Total number of officials whose performance agreements comply with Regulation 16 (Regulation 14(4)(f))
Consolidated: Total number of officials that meet prescribed competency levels (Regulation 14(4)(e))
Financial Officials
Accounting officer 1 0 1 1 1 1
Chief financial officer 1 0 1 1 1 1
Senior managers 45 89 134 69 65 95
Any other financial officials 657 133 790 612 584 602
Supply Chain Management Officials
Heads of supply chain management units 1 0 1 1 1 1
Supply chain management senior managers
14 9 23 18 5 12
TOTAL 719 231 950 702 657 760
* This is a statutory report under the National Treasury: Local Government: MFMA Competency Regulations (June 2007) T 4.5.2
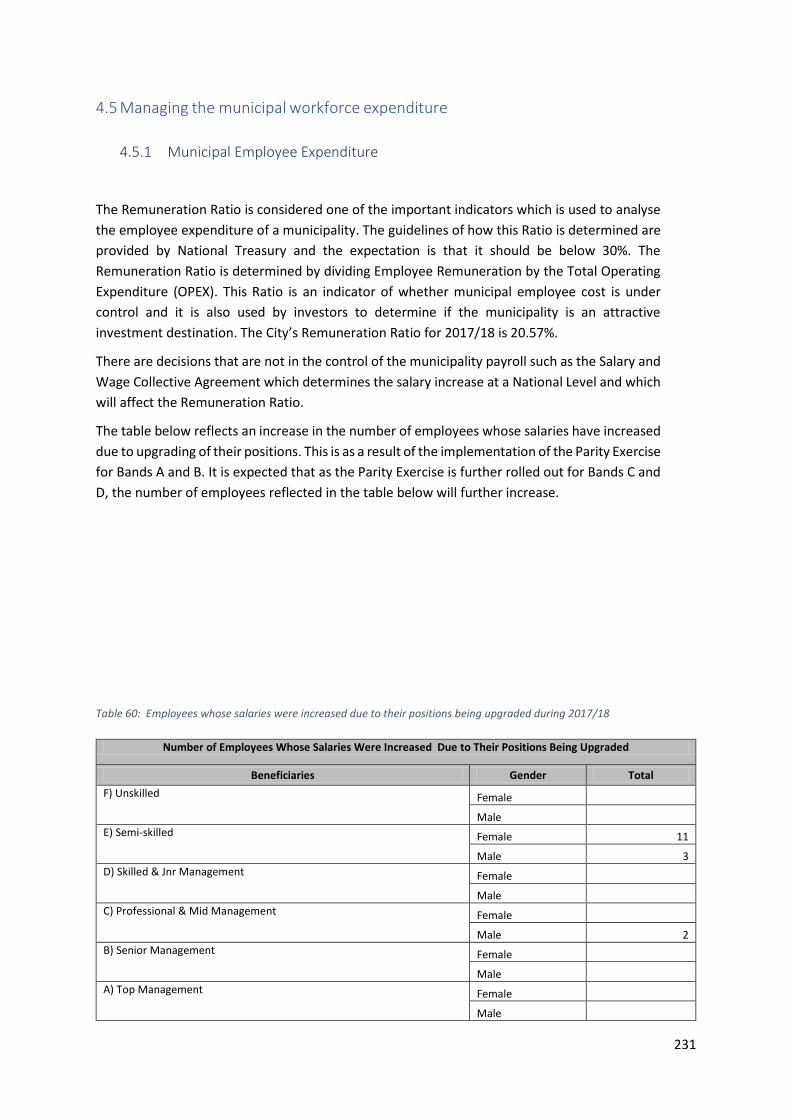
231
4.5 Managing the municipal workforce expenditure
4.5.1 Municipal Employee Expenditure
The Remuneration Ratio is considered one of the important indicators which is used to analyse
the employee expenditure of a municipality. The guidelines of how this Ratio is determined are
provided by National Treasury and the expectation is that it should be below 30%. The
Remuneration Ratio is determined by dividing Employee Remuneration by the Total Operating
Expenditure (OPEX). This Ratio is an indicator of whether municipal employee cost is under
control and it is also used by investors to determine if the municipality is an attractive
investment destination. The City’s Remuneration Ratio for 2017/18 is 20.57%.
There are decisions that are not in the control of the municipality payroll such as the Salary and
Wage Collective Agreement which determines the salary increase at a National Level and which
will affect the Remuneration Ratio.
The table below reflects an increase in the number of employees whose salaries have increased
due to upgrading of their positions. This is as a result of the implementation of the Parity Exercise
for Bands A and B. It is expected that as the Parity Exercise is further rolled out for Bands C and
D, the number of employees reflected in the table below will further increase.
Table 60: Employees whose salaries were increased due to their positions being upgraded during 2017/18
Number of Employees Whose Salaries Were Increased Due to Their Positions Being Upgraded
Beneficiaries Gender Total
F) Unskilled Female
Male
E) Semi-skilled Female 11
Male 3
D) Skilled & Jnr Management Female
Male
C) Professional & Mid Management Female
Male 2
B) Senior Management Female
Male
A) Top Management Female
Male
232
Total 16
Those with disability are shown in brackets '(x)' in the 'Number of beneficiaries' column as well as in the numbers at the right hand side of the column (as illustrated above).
4.5.2 Sick leave
All categories of leave are regulated through the Main Collective Agreement and Collective
Agreement Conditions of Service. All processes for Leave Applications, Attendance Registers,
Activity Reports and delivery of Leave Applications to the Transactions Processing Unit are
manual and on hardcopy and only at the end of these processes is leave captured on the payroll
system.
The manual nature of the leave administration processes results in a number of challenges such
as:
Delays from the time when the leave is applied for until it is captured;
The above delays can result in inaccurate leave balances and subsequent inaccurate
leave accrual figures being reflected in the Annual Financial Statements;
Extensive and time-consuming control and monitoring mechanisms to ensure accuracy
and to prevent attendance fraud; and
Attendance controls through Attendance Registers is unreliable and prone to fraud
and corruption.
All of the above increase the risk of audit findings against the City which is difficult to mitigate
due to the manual leave system and may very well result in a qualified audit.
The automation of all leave processes and accurate attendance recording through biometric
attendance systems linked to the payroll system is crucial for accurate administration and to
reduce the risk of attendance fraud and Auditor-General findings for incorrect leave accruals.
It should further be noted that the automation of the Human Capital Management processes
and systems are key to the successful reabsorption of the Municipal Entities and to ensure
standardised application of Human Capital Management processes within the City Group.
The table below reflects the average sick leave per individual employee as 3.88 days for 2017/18,
which is seen as positive.
Once the SAP implementation project has been concluded and all of the MEs have been
incorporated into one automated electronic system, then reporting for all types of absences can
be more regular and the accuracy thereof will improve.
Table 61: Number of days and cost of sick leave
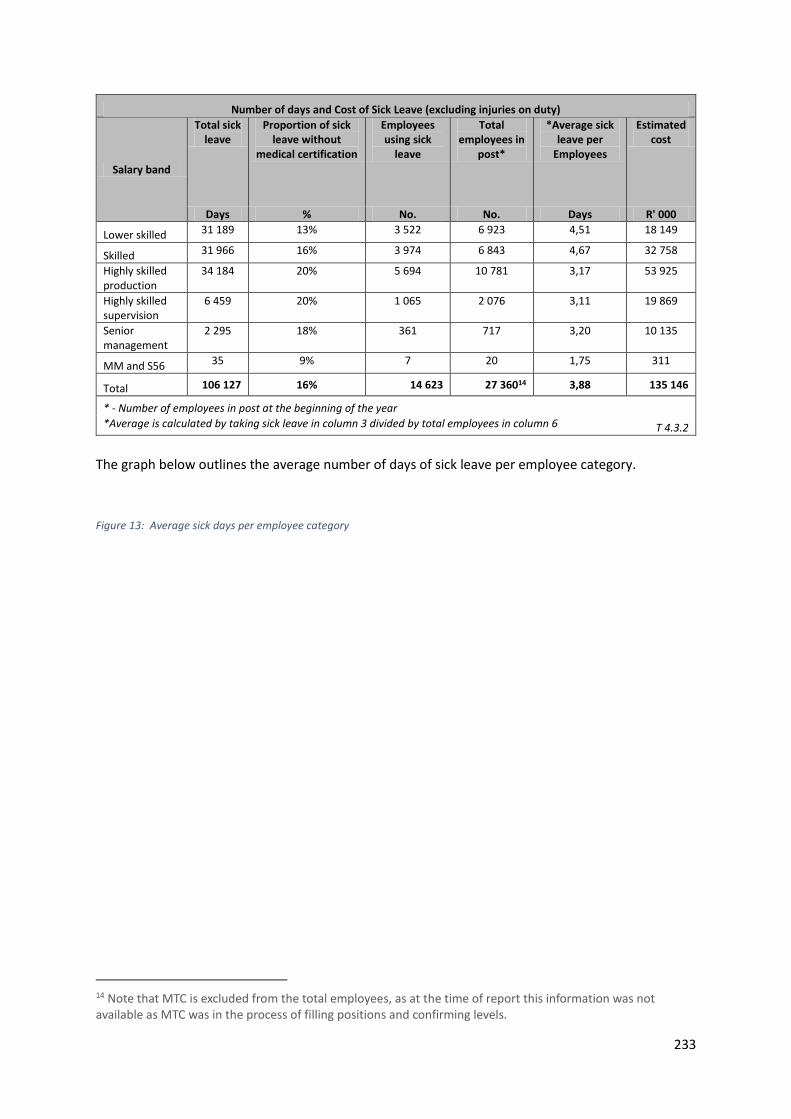
233
Number of days and Cost of Sick Leave (excluding injuries on duty)
Salary band
Total sick leave
Proportion of sick leave without
medical certification
Employees using sick
leave
Total employees in
post*
*Average sick leave per
Employees
Estimated cost
Days % No. No. Days R' 000
Lower skilled 31 189 13% 3 522 6 923 4,51 18 149
Skilled 31 966 16% 3 974 6 843 4,67 32 758
Highly skilled production
34 184 20% 5 694 10 781 3,17 53 925
Highly skilled supervision
6 459 20% 1 065 2 076 3,11 19 869
Senior management
2 295 18% 361 717 3,20 10 135
MM and S56 35 9% 7 20 1,75 311
Total 106 127 16% 14 623 27 36014 3,88 135 146
* - Number of employees in post at the beginning of the year
T 4.3.2 *Average is calculated by taking sick leave in column 3 divided by total employees in column 6
The graph below outlines the average number of days of sick leave per employee category.
Figure 13: Average sick days per employee category
14 Note that MTC is excluded from the total employees, as at the time of report this information was not available as MTC was in the process of filling positions and confirming levels.
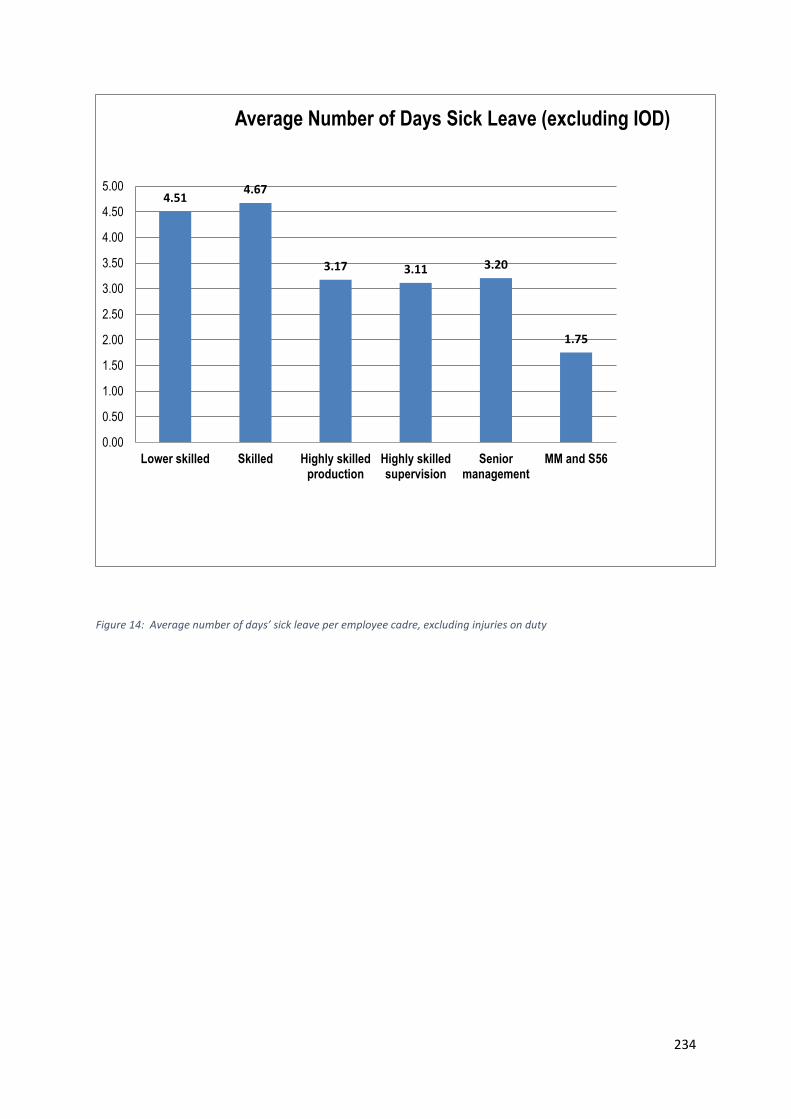
234
Figure 14: Average number of days’ sick leave per employee cadre, excluding injuries on duty
4.514.67
3.17 3.11 3.20
1.75
0.00
0.50
1.00
1.50
2.00
2.50
3.00
3.50
4.00
4.50
5.00
Lower skilled Skilled Highly skilledproduction
Highly skilledsupervision
Seniormanagement
MM and S56
Average Number of Days Sick Leave (excluding IOD)
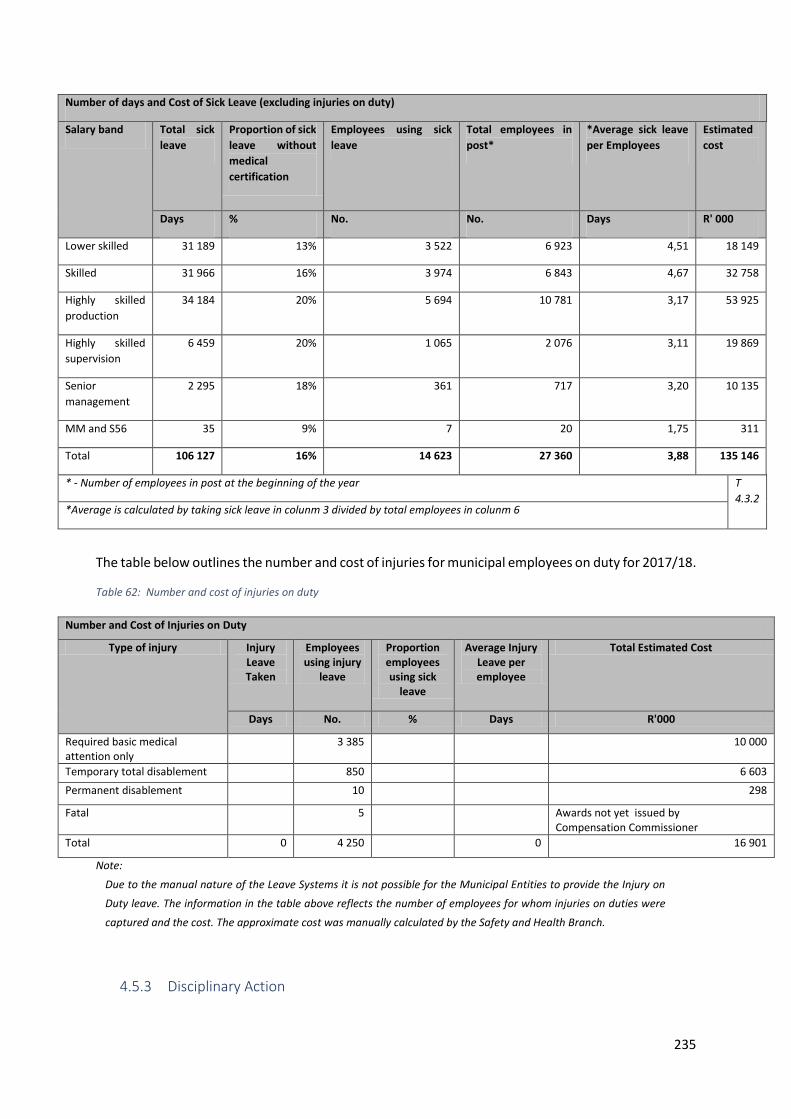
235
Number of days and Cost of Sick Leave (excluding injuries on duty)
Salary band Total sick
leave
Proportion of sick
leave without
medical
certification
Employees using sick
leave
Total employees in
post*
*Average sick leave
per Employees
Estimated
cost
Days % No. No. Days R' 000
Lower skilled 31 189 13% 3 522 6 923 4,51 18 149
Skilled 31 966 16% 3 974 6 843 4,67 32 758
Highly skilled
production
34 184 20% 5 694 10 781 3,17 53 925
Highly skilled
supervision
6 459 20% 1 065 2 076 3,11 19 869
Senior
management
2 295 18% 361 717 3,20 10 135
MM and S56 35 9% 7 20 1,75 311
Total 106 127 16% 14 623 27 360 3,88 135 146
* - Number of employees in post at the beginning of the year T
4.3.2 *Average is calculated by taking sick leave in colunm 3 divided by total employees in colunm 6
The table below outlines the number and cost of injuries for municipal employees on duty for 2017/18.
Table 62: Number and cost of injuries on duty
Number and Cost of Injuries on Duty
Type of injury Injury Leave Taken
Employees using injury
leave
Proportion employees using sick
leave
Average Injury Leave per employee
Total Estimated Cost
Days No. % Days R'000
Required basic medical attention only
3 385 10 000
Temporary total disablement 850 6 603
Permanent disablement 10 298
Fatal 5 Awards not yet issued by Compensation Commissioner
Total 0 4 250 0 16 901
Note:
Due to the manual nature of the Leave Systems it is not possible for the Municipal Entities to provide the Injury on
Duty leave. The information in the table above reflects the number of employees for whom injuries on duties were
captured and the cost. The approximate cost was manually calculated by the Safety and Health Branch.
4.5.3 Disciplinary Action
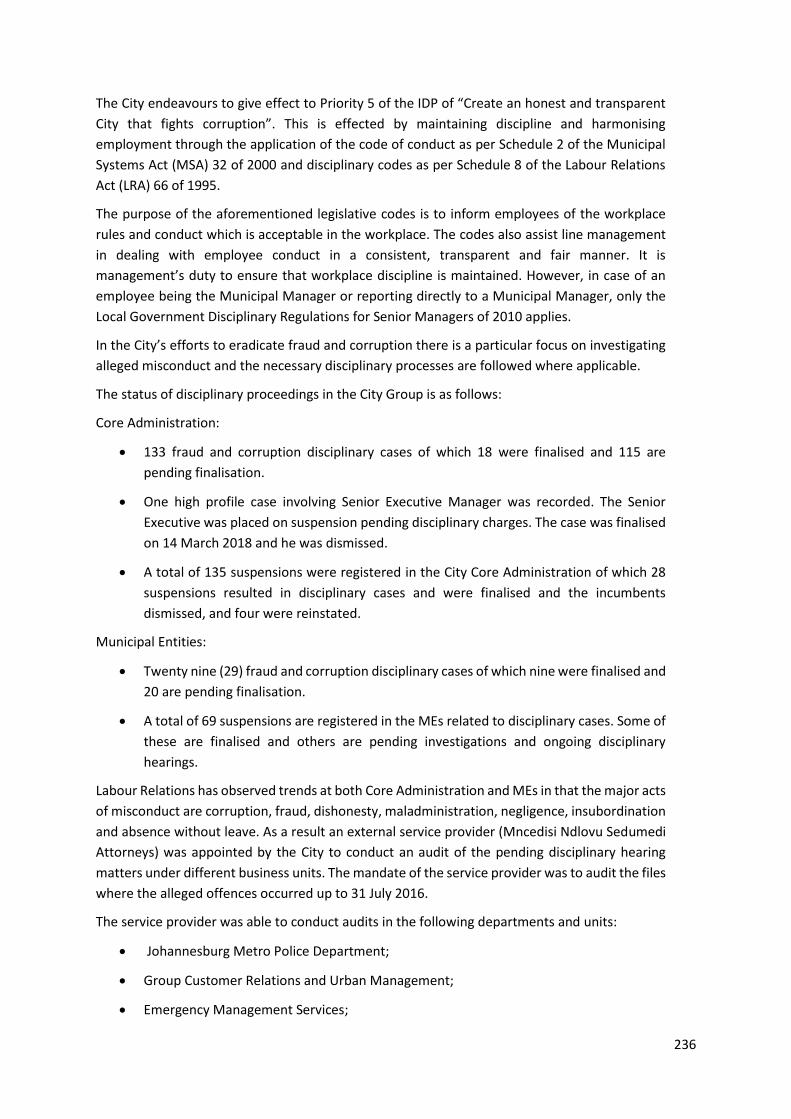
236
The City endeavours to give effect to Priority 5 of the IDP of “Create an honest and transparent
City that fights corruption”. This is effected by maintaining discipline and harmonising
employment through the application of the code of conduct as per Schedule 2 of the Municipal
Systems Act (MSA) 32 of 2000 and disciplinary codes as per Schedule 8 of the Labour Relations
Act (LRA) 66 of 1995.
The purpose of the aforementioned legislative codes is to inform employees of the workplace
rules and conduct which is acceptable in the workplace. The codes also assist line management
in dealing with employee conduct in a consistent, transparent and fair manner. It is
management’s duty to ensure that workplace discipline is maintained. However, in case of an
employee being the Municipal Manager or reporting directly to a Municipal Manager, only the
Local Government Disciplinary Regulations for Senior Managers of 2010 applies.
In the City’s efforts to eradicate fraud and corruption there is a particular focus on investigating
alleged misconduct and the necessary disciplinary processes are followed where applicable.
The status of disciplinary proceedings in the City Group is as follows:
Core Administration:
133 fraud and corruption disciplinary cases of which 18 were finalised and 115 are
pending finalisation.
One high profile case involving Senior Executive Manager was recorded. The Senior
Executive was placed on suspension pending disciplinary charges. The case was finalised
on 14 March 2018 and he was dismissed.
A total of 135 suspensions were registered in the City Core Administration of which 28
suspensions resulted in disciplinary cases and were finalised and the incumbents
dismissed, and four were reinstated.
Municipal Entities:
Twenty nine (29) fraud and corruption disciplinary cases of which nine were finalised and
20 are pending finalisation.
A total of 69 suspensions are registered in the MEs related to disciplinary cases. Some of
these are finalised and others are pending investigations and ongoing disciplinary
hearings.
Labour Relations has observed trends at both Core Administration and MEs in that the major acts
of misconduct are corruption, fraud, dishonesty, maladministration, negligence, insubordination
and absence without leave. As a result an external service provider (Mncedisi Ndlovu Sedumedi
Attorneys) was appointed by the City to conduct an audit of the pending disciplinary hearing
matters under different business units. The mandate of the service provider was to audit the files
where the alleged offences occurred up to 31 July 2016.
The service provider was able to conduct audits in the following departments and units:
Johannesburg Metro Police Department;
Group Customer Relations and Urban Management;
Emergency Management Services;
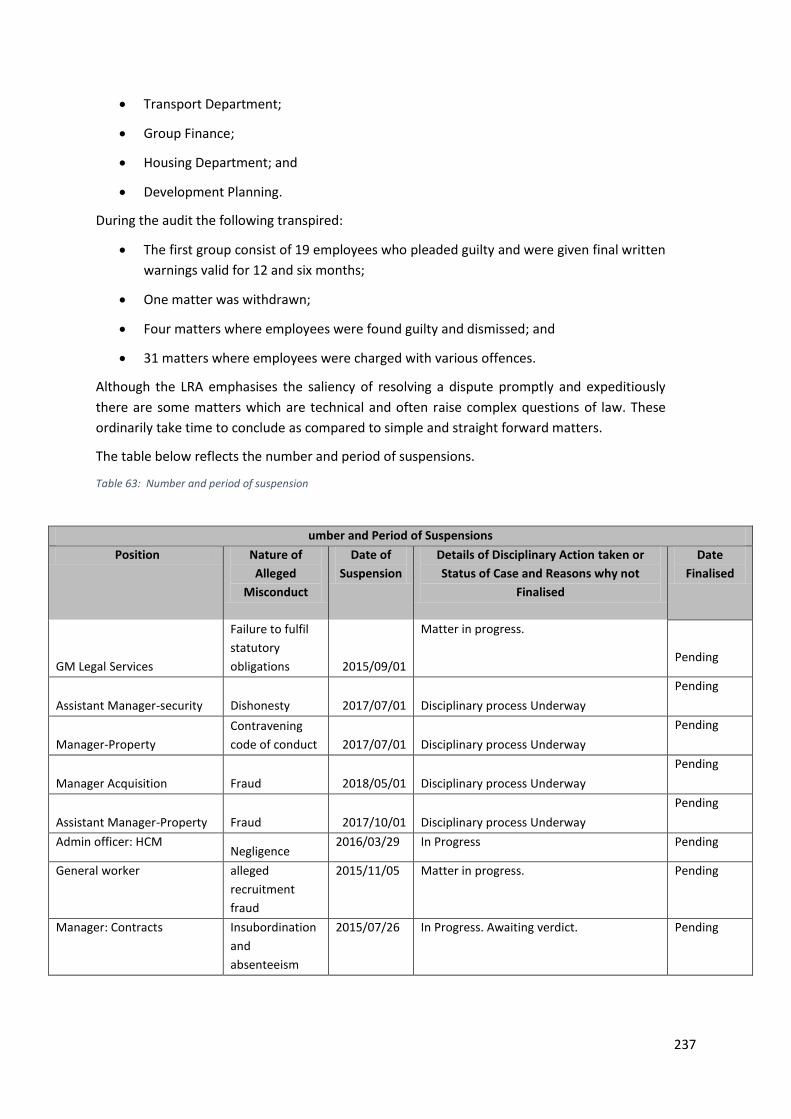
237
Transport Department;
Group Finance;
Housing Department; and
Development Planning.
During the audit the following transpired:
The first group consist of 19 employees who pleaded guilty and were given final written
warnings valid for 12 and six months;
One matter was withdrawn;
Four matters where employees were found guilty and dismissed; and
31 matters where employees were charged with various offences.
Although the LRA emphasises the saliency of resolving a dispute promptly and expeditiously
there are some matters which are technical and often raise complex questions of law. These
ordinarily take time to conclude as compared to simple and straight forward matters.
The table below reflects the number and period of suspensions.
Table 63: Number and period of suspension
umber and Period of Suspensions
Position Nature of
Alleged
Misconduct
Date of
Suspension
Details of Disciplinary Action taken or
Status of Case and Reasons why not
Finalised
Date
Finalised
GM Legal Services
Failure to fulfil
statutory
obligations 2015/09/01
Matter in progress.
Pending
Assistant Manager-security Dishonesty 2017/07/01 Disciplinary process Underway
Pending
Manager-Property
Contravening
code of conduct 2017/07/01 Disciplinary process Underway
Pending
Manager Acquisition Fraud 2018/05/01 Disciplinary process Underway
Pending
Assistant Manager-Property Fraud 2017/10/01 Disciplinary process Underway
Pending
Admin officer: HCM Negligence
2016/03/29 In Progress Pending
General worker alleged
recruitment
fraud
2015/11/05 Matter in progress. Pending
Manager: Contracts Insubordination
and
absenteeism
2015/07/26 In Progress. Awaiting verdict. Pending
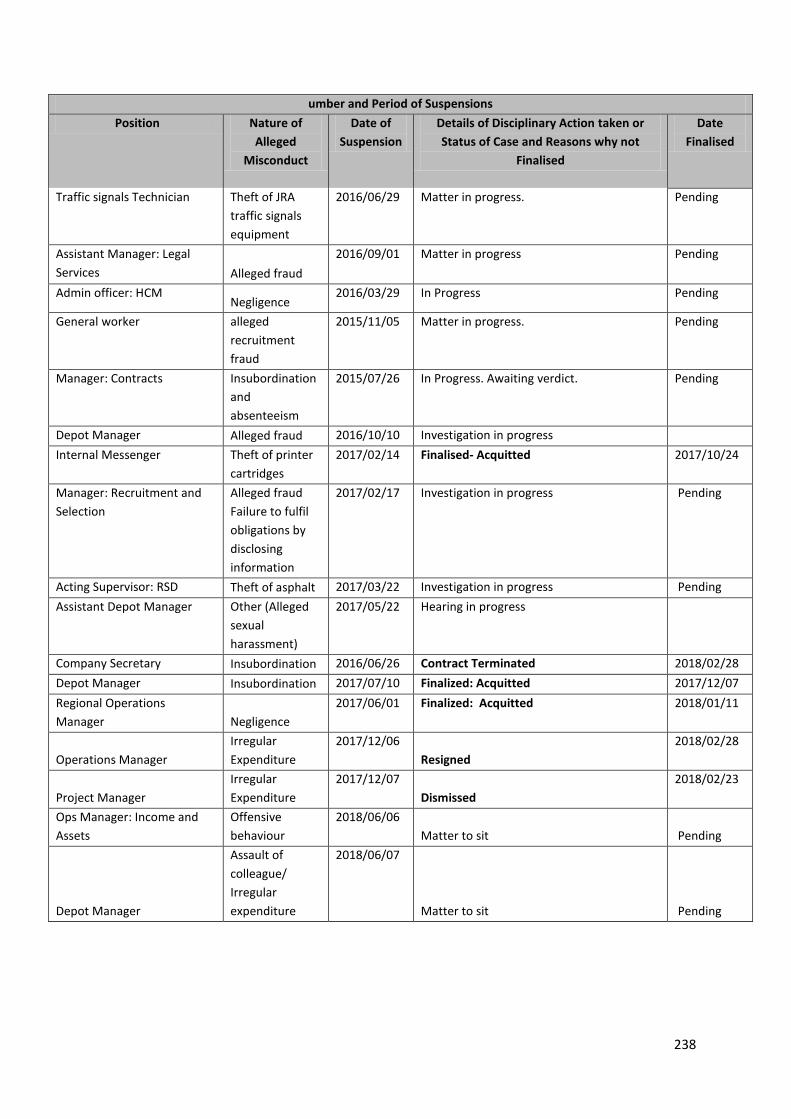
238
umber and Period of Suspensions
Position Nature of
Alleged
Misconduct
Date of
Suspension
Details of Disciplinary Action taken or
Status of Case and Reasons why not
Finalised
Date
Finalised
Traffic signals Technician Theft of JRA
traffic signals
equipment
2016/06/29 Matter in progress. Pending
Assistant Manager: Legal
Services Alleged fraud
2016/09/01 Matter in progress Pending
Admin officer: HCM Negligence
2016/03/29 In Progress Pending
General worker alleged
recruitment
fraud
2015/11/05 Matter in progress. Pending
Manager: Contracts Insubordination
and
absenteeism
2015/07/26 In Progress. Awaiting verdict. Pending
Depot Manager Alleged fraud 2016/10/10 Investigation in progress
Internal Messenger Theft of printer
cartridges
2017/02/14 Finalised- Acquitted 2017/10/24
Manager: Recruitment and
Selection
Alleged fraud
Failure to fulfil
obligations by
disclosing
information
2017/02/17 Investigation in progress Pending
Acting Supervisor: RSD Theft of asphalt 2017/03/22 Investigation in progress Pending
Assistant Depot Manager Other (Alleged
sexual
harassment)
2017/05/22 Hearing in progress
Company Secretary Insubordination 2016/06/26 Contract Terminated 2018/02/28
Depot Manager Insubordination 2017/07/10 Finalized: Acquitted 2017/12/07
Regional Operations
Manager Negligence
2017/06/01 Finalized: Acquitted 2018/01/11
Operations Manager
Irregular
Expenditure
2017/12/06
Resigned
2018/02/28
Project Manager
Irregular
Expenditure
2017/12/07
Dismissed
2018/02/23
Ops Manager: Income and
Assets
Offensive
behaviour
2018/06/06
Matter to sit Pending
Depot Manager
Assault of
colleague/
Irregular
expenditure
2018/06/07
Matter to sit
Pending
239
umber and Period of Suspensions
Position Nature of
Alleged
Misconduct
Date of
Suspension
Details of Disciplinary Action taken or
Status of Case and Reasons why not
Finalised
Date
Finalised
Maintenance Manager Dishonesty
2016/08/15
Investigation has been concluded. The
Hearing held on 24th November not
concluded. The disciplinary enquiry has now
been re- scheduled for the 5th & 6th July
2018.
Property Administrator Dishonesty 2016/03/03 Finalized- Appeal lodged 2017/09/13
Quantity surveyor Dishonesty
2017/03/01
Investigations have been concluded. The
case has been postponed until further
notice. The parties are still in engagement
to agree on a suitable date for the
disciplinary enquiry. It is anticipated that
the enquiry will be held and concluded in
July 2018
Pending
Asset clerk Dishonesty
2017/03/01
Investigation has been concluded. The
Hearing held on 24th November not
concluded. The disciplinary enquiry has
been re-scheduled for the 5th & 6th July
2018.
Pending
Cashier Dishonesty
2017/09/22
The chairperson of disciplinary enquiry
found him guilty and dismissed on the 25
April 2018
2018/04/25
Cashier Dishonesty
2017/09/22
The enquiry has been re-scheduled to 12th
& 13th July 2018.
Pending
Core-Operations Executive Dishonesty
2018/06/04
Placed on suspension pending finalisation of
disciplinary enquiry. The enquiry was
scheduled for 21st & 22 June 2018. The
enquiry was postponed due to agreement
between the parties.
Pending
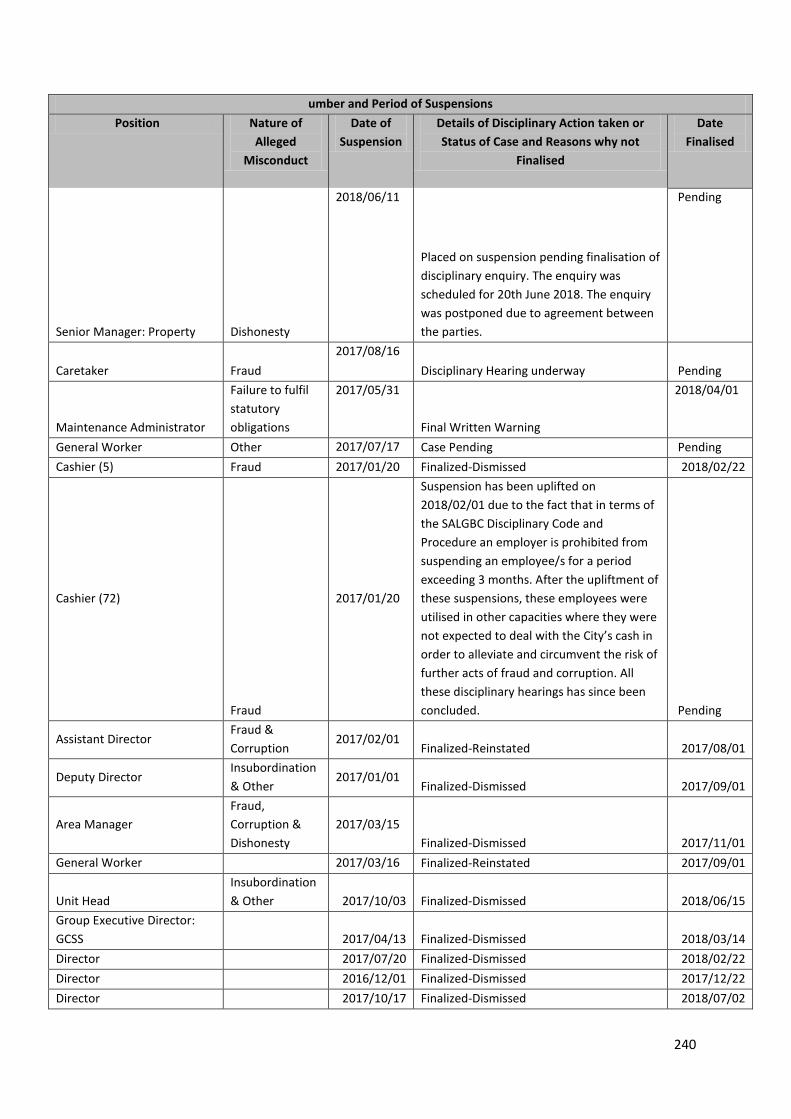
240
umber and Period of Suspensions
Position Nature of
Alleged
Misconduct
Date of
Suspension
Details of Disciplinary Action taken or
Status of Case and Reasons why not
Finalised
Date
Finalised
Senior Manager: Property Dishonesty
2018/06/11
Placed on suspension pending finalisation of
disciplinary enquiry. The enquiry was
scheduled for 20th June 2018. The enquiry
was postponed due to agreement between
the parties.
Pending
Caretaker Fraud
2017/08/16
Disciplinary Hearing underway Pending
Maintenance Administrator
Failure to fulfil
statutory
obligations
2017/05/31
Final Written Warning
2018/04/01
General Worker Other 2017/07/17 Case Pending Pending
Cashier (5) Fraud 2017/01/20 Finalized-Dismissed 2018/02/22
Cashier (72)
Fraud
2017/01/20
Suspension has been uplifted on
2018/02/01 due to the fact that in terms of
the SALGBC Disciplinary Code and
Procedure an employer is prohibited from
suspending an employee/s for a period
exceeding 3 months. After the upliftment of
these suspensions, these employees were
utilised in other capacities where they were
not expected to deal with the City’s cash in
order to alleviate and circumvent the risk of
further acts of fraud and corruption. All
these disciplinary hearings has since been
concluded. Pending
Assistant Director Fraud &
Corruption 2017/02/01
Finalized-Reinstated 2017/08/01
Deputy Director Insubordination
& Other 2017/01/01
Finalized-Dismissed 2017/09/01
Area Manager
Fraud,
Corruption &
Dishonesty
2017/03/15
Finalized-Dismissed 2017/11/01
General Worker 2017/03/16 Finalized-Reinstated 2017/09/01
Unit Head
Insubordination
& Other 2017/10/03 Finalized-Dismissed 2018/06/15
Group Executive Director:
GCSS 2017/04/13 Finalized-Dismissed 2018/03/14
Director 2017/07/20 Finalized-Dismissed 2018/02/22
Director 2016/12/01 Finalized-Dismissed 2017/12/22
Director 2017/10/17 Finalized-Dismissed 2018/07/02
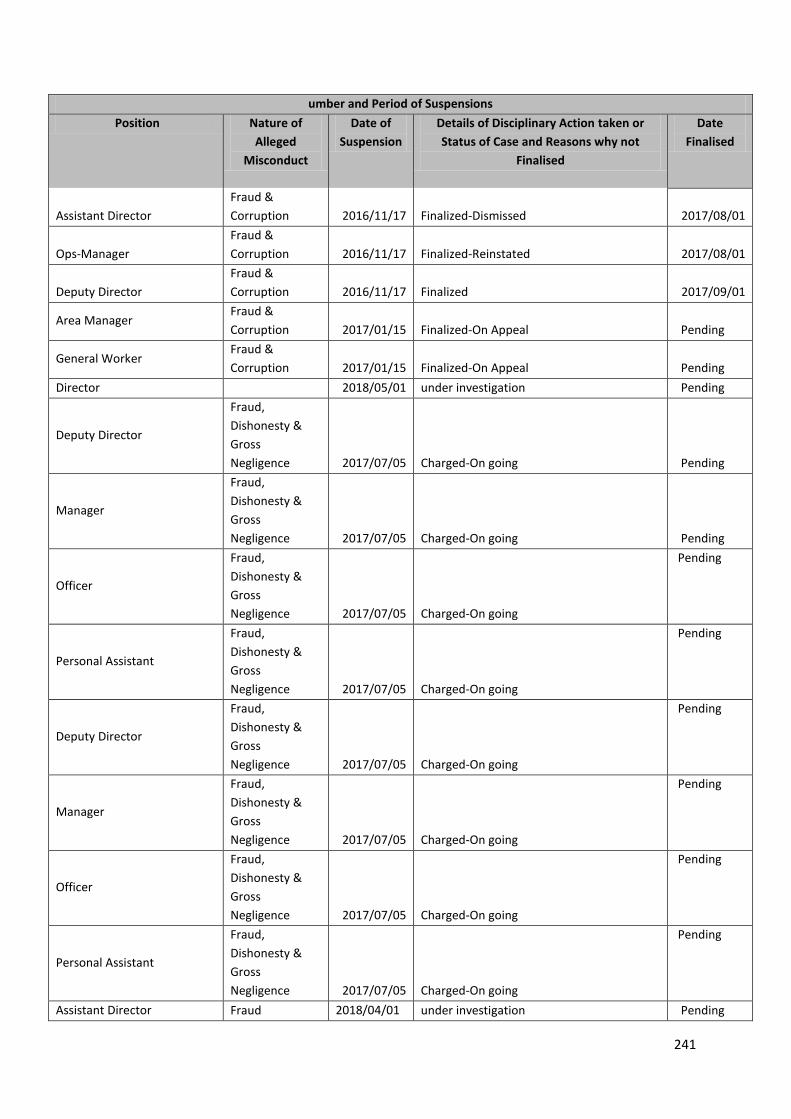
241
umber and Period of Suspensions
Position Nature of
Alleged
Misconduct
Date of
Suspension
Details of Disciplinary Action taken or
Status of Case and Reasons why not
Finalised
Date
Finalised
Assistant Director
Fraud &
Corruption 2016/11/17 Finalized-Dismissed 2017/08/01
Ops-Manager
Fraud &
Corruption 2016/11/17 Finalized-Reinstated 2017/08/01
Deputy Director
Fraud &
Corruption 2016/11/17 Finalized 2017/09/01
Area Manager Fraud &
Corruption 2017/01/15 Finalized-On Appeal Pending
General Worker Fraud &
Corruption 2017/01/15 Finalized-On Appeal Pending
Director 2018/05/01 under investigation Pending
Deputy Director
Fraud,
Dishonesty &
Gross
Negligence 2017/07/05 Charged-On going Pending
Manager
Fraud,
Dishonesty &
Gross
Negligence 2017/07/05 Charged-On going Pending
Officer
Fraud,
Dishonesty &
Gross
Negligence 2017/07/05 Charged-On going
Pending
Personal Assistant
Fraud,
Dishonesty &
Gross
Negligence 2017/07/05 Charged-On going
Pending
Deputy Director
Fraud,
Dishonesty &
Gross
Negligence 2017/07/05 Charged-On going
Pending
Manager
Fraud,
Dishonesty &
Gross
Negligence 2017/07/05 Charged-On going
Pending
Officer
Fraud,
Dishonesty &
Gross
Negligence 2017/07/05 Charged-On going
Pending
Personal Assistant
Fraud,
Dishonesty &
Gross
Negligence 2017/07/05 Charged-On going
Pending
Assistant Director Fraud 2018/04/01 under investigation Pending
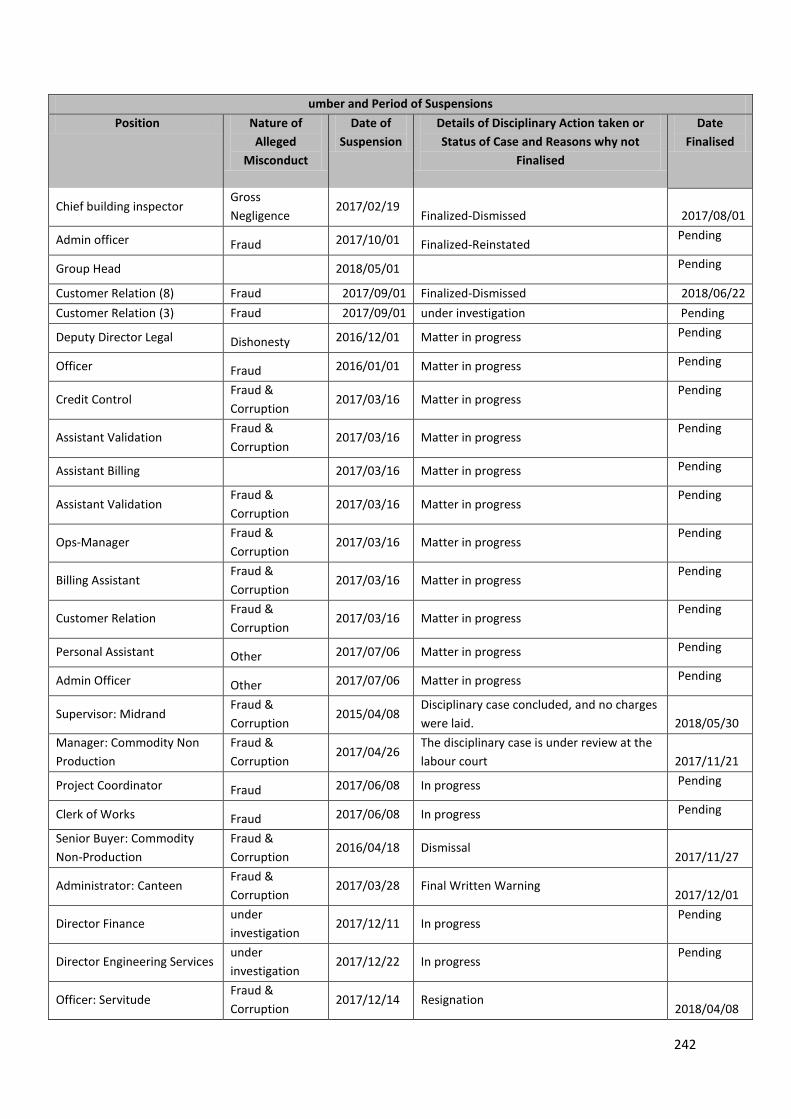
242
umber and Period of Suspensions
Position Nature of
Alleged
Misconduct
Date of
Suspension
Details of Disciplinary Action taken or
Status of Case and Reasons why not
Finalised
Date
Finalised
Chief building inspector Gross
Negligence 2017/02/19
Finalized-Dismissed 2017/08/01
Admin officer Fraud 2017/10/01 Finalized-Reinstated Pending
Group Head 2018/05/01 Pending
Customer Relation (8) Fraud 2017/09/01 Finalized-Dismissed 2018/06/22
Customer Relation (3) Fraud 2017/09/01 under investigation Pending
Deputy Director Legal Dishonesty 2016/12/01 Matter in progress Pending
Officer Fraud 2016/01/01 Matter in progress Pending
Credit Control Fraud &
Corruption 2017/03/16 Matter in progress
Pending
Assistant Validation Fraud &
Corruption 2017/03/16 Matter in progress
Pending
Assistant Billing 2017/03/16 Matter in progress Pending
Assistant Validation Fraud &
Corruption 2017/03/16 Matter in progress
Pending
Ops-Manager Fraud &
Corruption 2017/03/16 Matter in progress
Pending
Billing Assistant Fraud &
Corruption 2017/03/16 Matter in progress
Pending
Customer Relation Fraud &
Corruption 2017/03/16 Matter in progress
Pending
Personal Assistant Other 2017/07/06 Matter in progress Pending
Admin Officer Other 2017/07/06 Matter in progress Pending
Supervisor: Midrand Fraud &
Corruption 2015/04/08
Disciplinary case concluded, and no charges
were laid. 2018/05/30
Manager: Commodity Non
Production
Fraud &
Corruption 2017/04/26
The disciplinary case is under review at the
labour court 2017/11/21
Project Coordinator Fraud 2017/06/08 In progress Pending
Clerk of Works Fraud 2017/06/08 In progress Pending
Senior Buyer: Commodity
Non-Production
Fraud &
Corruption 2016/04/18 Dismissal
2017/11/27
Administrator: Canteen Fraud &
Corruption 2017/03/28 Final Written Warning
2017/12/01
Director Finance under
investigation 2017/12/11 In progress
Pending
Director Engineering Services under
investigation 2017/12/22 In progress
Pending
Officer: Servitude Fraud &
Corruption 2017/12/14 Resignation
2018/04/08
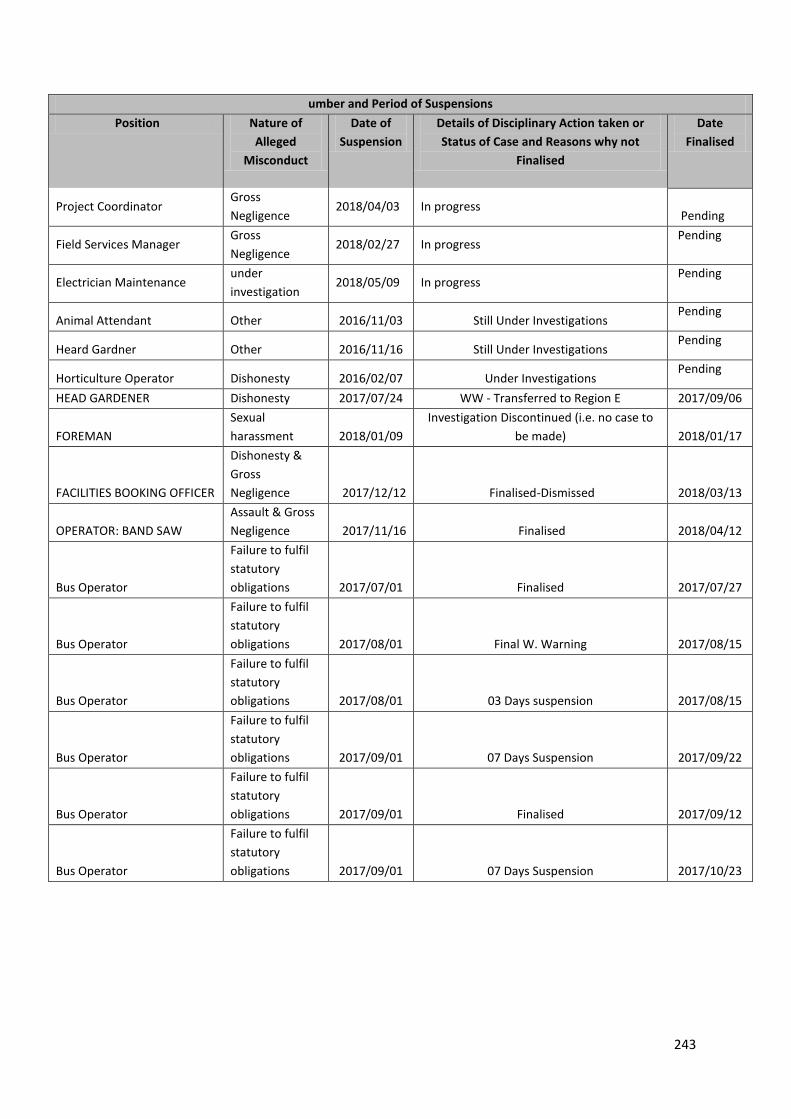
243
umber and Period of Suspensions
Position Nature of
Alleged
Misconduct
Date of
Suspension
Details of Disciplinary Action taken or
Status of Case and Reasons why not
Finalised
Date
Finalised
Project Coordinator Gross
Negligence 2018/04/03 In progress
Pending
Field Services Manager Gross
Negligence 2018/02/27 In progress
Pending
Electrician Maintenance under
investigation 2018/05/09 In progress
Pending
Animal Attendant Other 2016/11/03 Still Under Investigations Pending
Heard Gardner Other 2016/11/16 Still Under Investigations Pending
Horticulture Operator Dishonesty 2016/02/07 Under Investigations Pending
HEAD GARDENER Dishonesty 2017/07/24 WW - Transferred to Region E 2017/09/06
FOREMAN
Sexual
harassment 2018/01/09
Investigation Discontinued (i.e. no case to
be made) 2018/01/17
FACILITIES BOOKING OFFICER
Dishonesty &
Gross
Negligence 2017/12/12 Finalised-Dismissed 2018/03/13
OPERATOR: BAND SAW
Assault & Gross
Negligence 2017/11/16 Finalised 2018/04/12
Bus Operator
Failure to fulfil
statutory
obligations 2017/07/01 Finalised 2017/07/27
Bus Operator
Failure to fulfil
statutory
obligations 2017/08/01 Final W. Warning 2017/08/15
Bus Operator
Failure to fulfil
statutory
obligations 2017/08/01 03 Days suspension 2017/08/15
Bus Operator
Failure to fulfil
statutory
obligations 2017/09/01 07 Days Suspension 2017/09/22
Bus Operator
Failure to fulfil
statutory
obligations 2017/09/01 Finalised 2017/09/12
Bus Operator
Failure to fulfil
statutory
obligations 2017/09/01 07 Days Suspension 2017/10/23
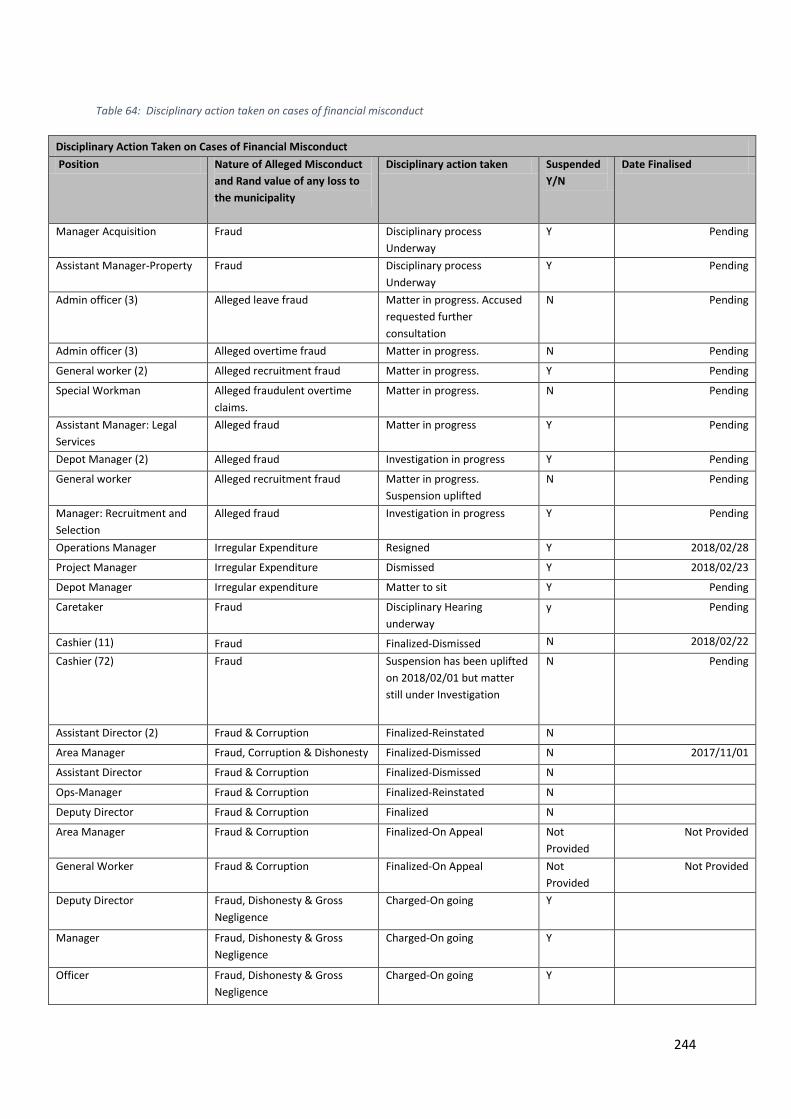
244
Table 64: Disciplinary action taken on cases of financial misconduct
Disciplinary Action Taken on Cases of Financial Misconduct
Position Nature of Alleged Misconduct
and Rand value of any loss to
the municipality
Disciplinary action taken Suspended
Y/N
Date Finalised
Manager Acquisition Fraud Disciplinary process
Underway
Y Pending
Assistant Manager-Property Fraud Disciplinary process
Underway
Y Pending
Admin officer (3) Alleged leave fraud Matter in progress. Accused
requested further
consultation
N Pending
Admin officer (3) Alleged overtime fraud Matter in progress. N Pending
General worker (2) Alleged recruitment fraud Matter in progress. Y Pending
Special Workman Alleged fraudulent overtime
claims.
Matter in progress. N Pending
Assistant Manager: Legal
Services
Alleged fraud Matter in progress Y Pending
Depot Manager (2) Alleged fraud Investigation in progress Y Pending
General worker Alleged recruitment fraud Matter in progress.
Suspension uplifted
N Pending
Manager: Recruitment and
Selection
Alleged fraud Investigation in progress Y Pending
Operations Manager Irregular Expenditure Resigned Y 2018/02/28
Project Manager Irregular Expenditure Dismissed Y 2018/02/23
Depot Manager Irregular expenditure Matter to sit Y Pending
Caretaker Fraud Disciplinary Hearing
underway
y Pending
Cashier (11) Fraud Finalized-Dismissed N 2018/02/22
Cashier (72) Fraud Suspension has been uplifted
on 2018/02/01 but matter
still under Investigation
N Pending
Assistant Director (2) Fraud & Corruption Finalized-Reinstated N
Area Manager Fraud, Corruption & Dishonesty Finalized-Dismissed N 2017/11/01
Assistant Director Fraud & Corruption Finalized-Dismissed N
Ops-Manager Fraud & Corruption Finalized-Reinstated N
Deputy Director Fraud & Corruption Finalized N
Area Manager Fraud & Corruption Finalized-On Appeal Not
Provided
Not Provided
General Worker Fraud & Corruption Finalized-On Appeal Not
Provided
Not Provided
Deputy Director Fraud, Dishonesty & Gross
Negligence
Charged-On going Y
Manager Fraud, Dishonesty & Gross
Negligence
Charged-On going Y
Officer Fraud, Dishonesty & Gross
Negligence
Charged-On going Y
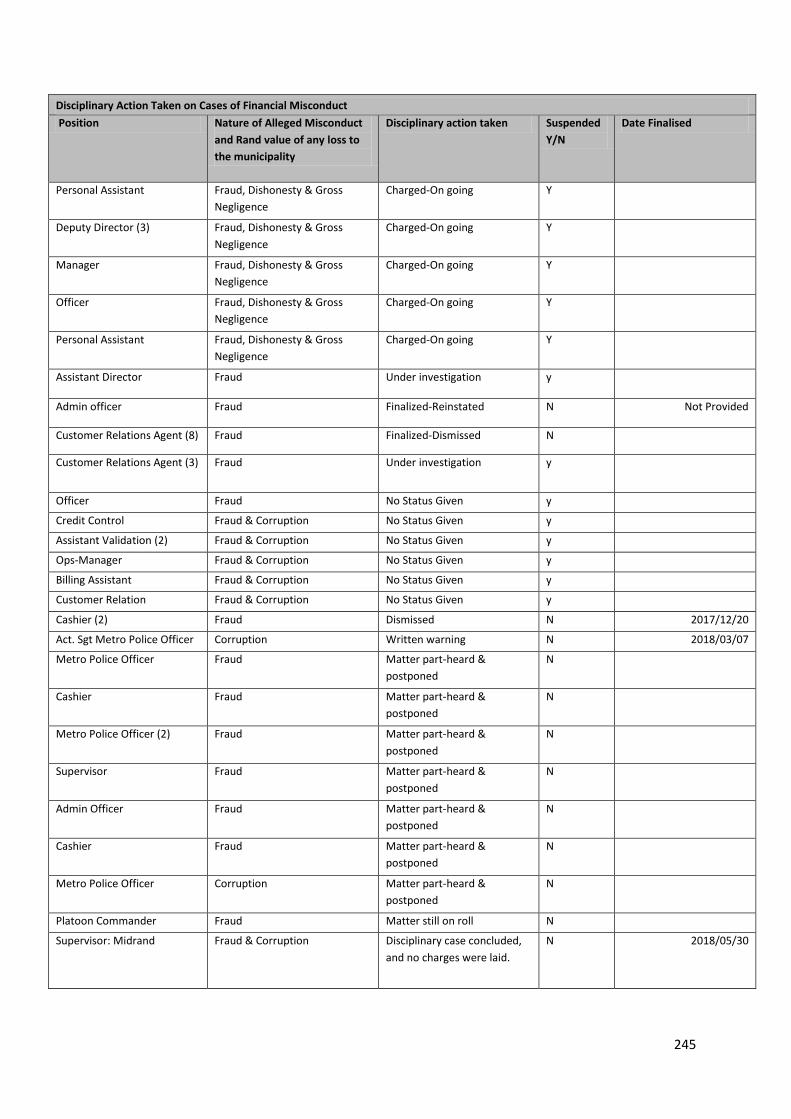
245
Disciplinary Action Taken on Cases of Financial Misconduct
Position Nature of Alleged Misconduct
and Rand value of any loss to
the municipality
Disciplinary action taken Suspended
Y/N
Date Finalised
Personal Assistant Fraud, Dishonesty & Gross
Negligence
Charged-On going Y
Deputy Director (3) Fraud, Dishonesty & Gross
Negligence
Charged-On going Y
Manager Fraud, Dishonesty & Gross
Negligence
Charged-On going Y
Officer Fraud, Dishonesty & Gross
Negligence
Charged-On going Y
Personal Assistant Fraud, Dishonesty & Gross
Negligence
Charged-On going Y
Assistant Director Fraud Under investigation y
Admin officer Fraud Finalized-Reinstated N Not Provided
Customer Relations Agent (8) Fraud Finalized-Dismissed N
Customer Relations Agent (3) Fraud Under investigation y
Officer Fraud No Status Given y
Credit Control Fraud & Corruption No Status Given y
Assistant Validation (2) Fraud & Corruption No Status Given y
Ops-Manager Fraud & Corruption No Status Given y
Billing Assistant Fraud & Corruption No Status Given y
Customer Relation Fraud & Corruption No Status Given y
Cashier (2) Fraud Dismissed N 2017/12/20
Act. Sgt Metro Police Officer Corruption Written warning N 2018/03/07
Metro Police Officer Fraud Matter part-heard &
postponed
N
Cashier Fraud Matter part-heard &
postponed
N
Metro Police Officer (2) Fraud Matter part-heard &
postponed
N
Supervisor Fraud Matter part-heard &
postponed
N
Admin Officer Fraud Matter part-heard &
postponed
N
Cashier Fraud Matter part-heard &
postponed
N
Metro Police Officer Corruption Matter part-heard &
postponed
N
Platoon Commander Fraud Matter still on roll N
Supervisor: Midrand Fraud & Corruption Disciplinary case concluded,
and no charges were laid.
N 2018/05/30
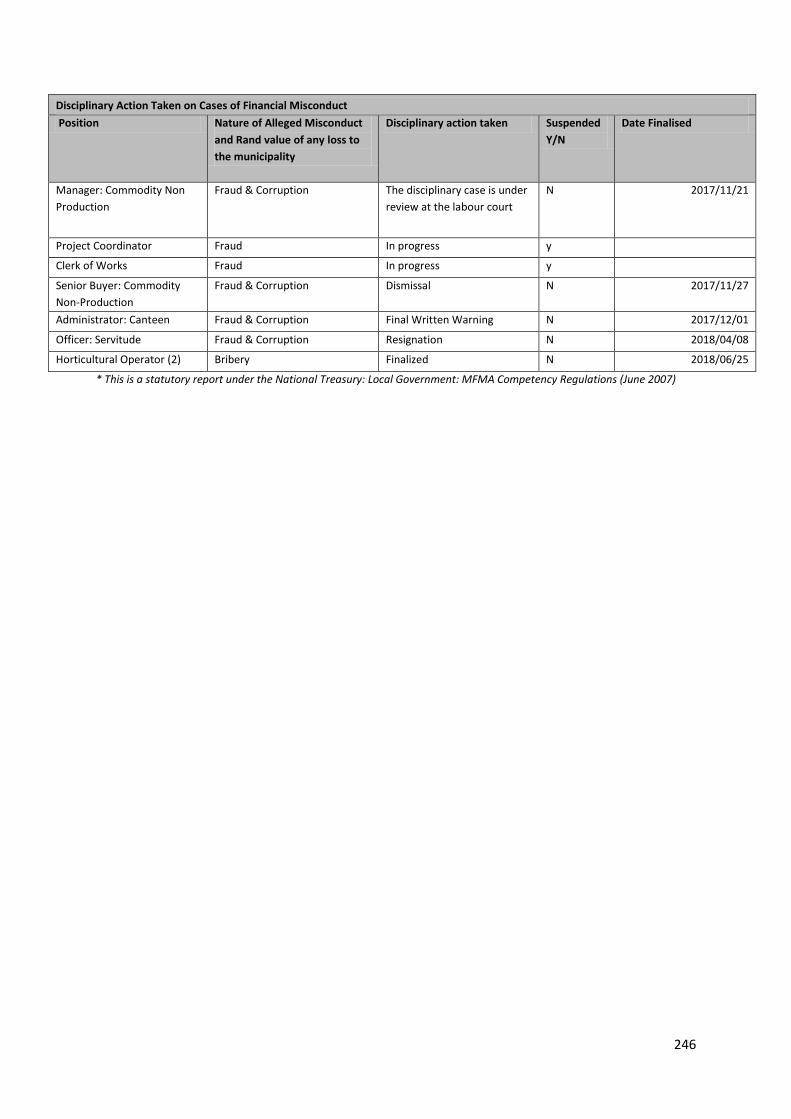
246
Disciplinary Action Taken on Cases of Financial Misconduct
Position Nature of Alleged Misconduct
and Rand value of any loss to
the municipality
Disciplinary action taken Suspended
Y/N
Date Finalised
Manager: Commodity Non
Production
Fraud & Corruption The disciplinary case is under
review at the labour court
N 2017/11/21
Project Coordinator Fraud In progress y
Clerk of Works Fraud In progress y
Senior Buyer: Commodity
Non-Production
Fraud & Corruption Dismissal N 2017/11/27
Administrator: Canteen Fraud & Corruption Final Written Warning N 2017/12/01
Officer: Servitude Fraud & Corruption Resignation N 2018/04/08
Horticultural Operator (2) Bribery Finalized N 2018/06/25
* This is a statutory report under the National Treasury: Local Government: MFMA Competency Regulations (June 2007)
247
5. Group Chief Financial Officer’s Report
5.1 Introduction
This report in essence highlights the City’s financial position and financial performance for the year
under review. The consolidated financial results herein presented are evidence of service delivery and
hard work taking into account the financial performances of all the Departments (i.e. Core) and the
Municipal Owned Entities (MoEs) collectively referred to as the Group consolidated financial results
of the City. It therefore gives me great pleasure to present the highlights of the financial performance
of the City of Johannesburg based on the consolidated Annual Financial Statements for the year ended
30 June 2018.
These Annual Financial Statements15 were prepared in compliance with the provisions of the Generally
Recognized Accounting Practice (GRAP), which is consistent with the prior year.
5.2 Financial overview
In the year under review the City achieved a surplus of
R2.9 billion (2017: R1.4 billion) notwithstanding the economic climate which remained fragile
throughout the financial year. The City has remained focused on continuously strengthening its
financial position whilst actively pursuing the achievement of its service delivery goals. Some of the
key achievements include:
In the year under review, the City spent 91% of the budgeted R7 billion capital budget. Capital
investment is a key tool for improving service delivery and realizing transformational changes
as articulated in the Diphetogo approach adopted by the City.
The City’s cash and cash equivalents at year end amounted to R2.2 billion. Our focus has been,
and remains, to build adequate cash reserves to fund service delivery programmes through a
rigorous cash management strategies that ensure timely information is available to
management to allow for agility in managing cash-flows.
The challenging macro-economic environment continues to negatively impact on our
customers’ ability to pay for services. In the year under review the City achieved a revenue
collection rate of 91%. The City is committed to improving the customer experience within
15 Annexure A
248
the revenue value chain and to this end a number of interventions have been put in place
including:
o Identifying and remedying the process failures that have hampered timeous
resolution of billing queries;
o Improved data management, which has led to more accurate billing;
o Reducing the backlog, especially the high estimations on electricity and water meters;
and
o Improving the coverage of physical meter reading.
In order to improve ease of effecting payments for municipal services, additional payment
channels are continuously being explored. Customers experiencing cash flow challenges, are
encouraged to enter into payment arrangements to service their outstanding debt.
The City has again achieved an unqualified audit opinion as was the case in the previous financial
year. This is a firm indication of the dedicated leadership which drives governance, compliance
and sound financial management. We continue to strive towards clean administration and the
highest standards of corporate governance.
Global Credit Rating Co. (GCR) and Moody’s recently completed their credit ratings reviews of the City
of Johannesburg. GCR assigned the City with a long-term rating of 𝐴𝐴(𝑍𝐴), with the short-term rating
at 𝐴1 +(𝑍𝐴) and a stable outlook. Moody’s maintained the long-term issuer and debt ratings of
𝐵𝑎𝑎3 (𝐺𝑙𝑜𝑏𝑎𝑙 𝑠𝑐𝑎𝑙𝑒, 𝑙𝑜𝑐𝑎𝑙 𝑐𝑢𝑟𝑟𝑒𝑛𝑐𝑦) and 𝐴𝑎1. 𝑧𝑎 (𝑁𝑎𝑡𝑖𝑜𝑛𝑎𝑙 𝑠𝑐𝑎𝑙𝑒, 𝑙𝑜𝑐𝑎𝑙 𝑐𝑢𝑟𝑟𝑒𝑛𝑐𝑦), whilst the
short-term issuer ratings were assigned at 𝑃 − 3 (𝐺𝑙𝑜𝑏𝑎𝑙 𝑠𝑐𝑎𝑙𝑒, 𝑙𝑜𝑐𝑎𝑙 𝑐𝑢𝑟𝑟𝑒𝑛𝑐𝑦) and
𝑃 − 1. 𝑧𝑎 (𝑁𝑎𝑡𝑖𝑜𝑛𝑎𝑙 𝑠𝑐𝑎𝑙𝑒, 𝑙𝑜𝑐𝑎𝑙 𝑐𝑢𝑟𝑟𝑒𝑛𝑐𝑦), whilst the outlook was revised downwards to negative.
The City remains committed to prudent management of its finances and to this end, has set out the
following key initiatives:
• Development and implementation of a billing management policy that complies with
legislative prescripts and by-laws;
• Update and roll-out of standard operating procedures for revenue processes to improve
controls and systems;
• Implementation of strict credit control processes;
• Reduction of uncollectable debt;
• Development and implementation of a billing and payments portal;

249
• Development of a customer-centric approach;
• Increase in the use of e-services.
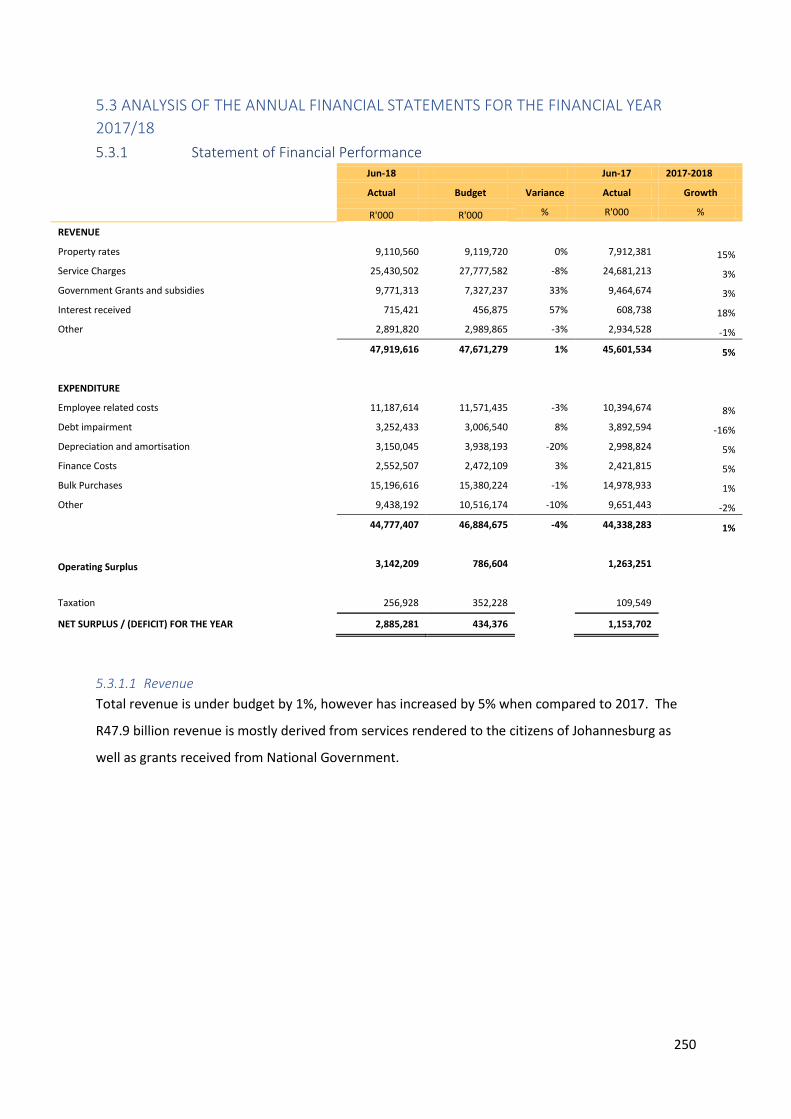
250
5.3 ANALYSIS OF THE ANNUAL FINANCIAL STATEMENTS FOR THE FINANCIAL YEAR
2017/18
5.3.1 Statement of Financial Performance Jun-18 Jun-17 2017-2018
Actual Budget Variance Actual Growth
R'000 R'000 % R'000 %
REVENUE
Property rates 9,110,560 9,119,720 0% 7,912,381 15%
Service Charges 25,430,502 27,777,582 -8% 24,681,213 3%
Government Grants and subsidies 9,771,313 7,327,237 33% 9,464,674 3%
Interest received 715,421 456,875 57% 608,738 18%
Other 2,891,820 2,989,865 -3% 2,934,528 -1%
47,919,616 47,671,279 1% 45,601,534 5%
EXPENDITURE
Employee related costs 11,187,614 11,571,435 -3% 10,394,674 8%
Debt impairment 3,252,433 3,006,540 8% 3,892,594 -16%
Depreciation and amortisation 3,150,045 3,938,193 -20% 2,998,824 5%
Finance Costs 2,552,507 2,472,109 3% 2,421,815 5%
Bulk Purchases 15,196,616 15,380,224 -1% 14,978,933 1%
Other 9,438,192 10,516,174 -10% 9,651,443 -2%
44,777,407 46,884,675 -4% 44,338,283 1%
Operating Surplus 3,142,209 786,604 1,263,251
Taxation 256,928 352,228 109,549
NET SURPLUS / (DEFICIT) FOR THE YEAR 2,885,281 434,376 1,153,702
5.3.1.1 Revenue
Total revenue is under budget by 1%, however has increased by 5% when compared to 2017. The
R47.9 billion revenue is mostly derived from services rendered to the citizens of Johannesburg as
well as grants received from National Government.
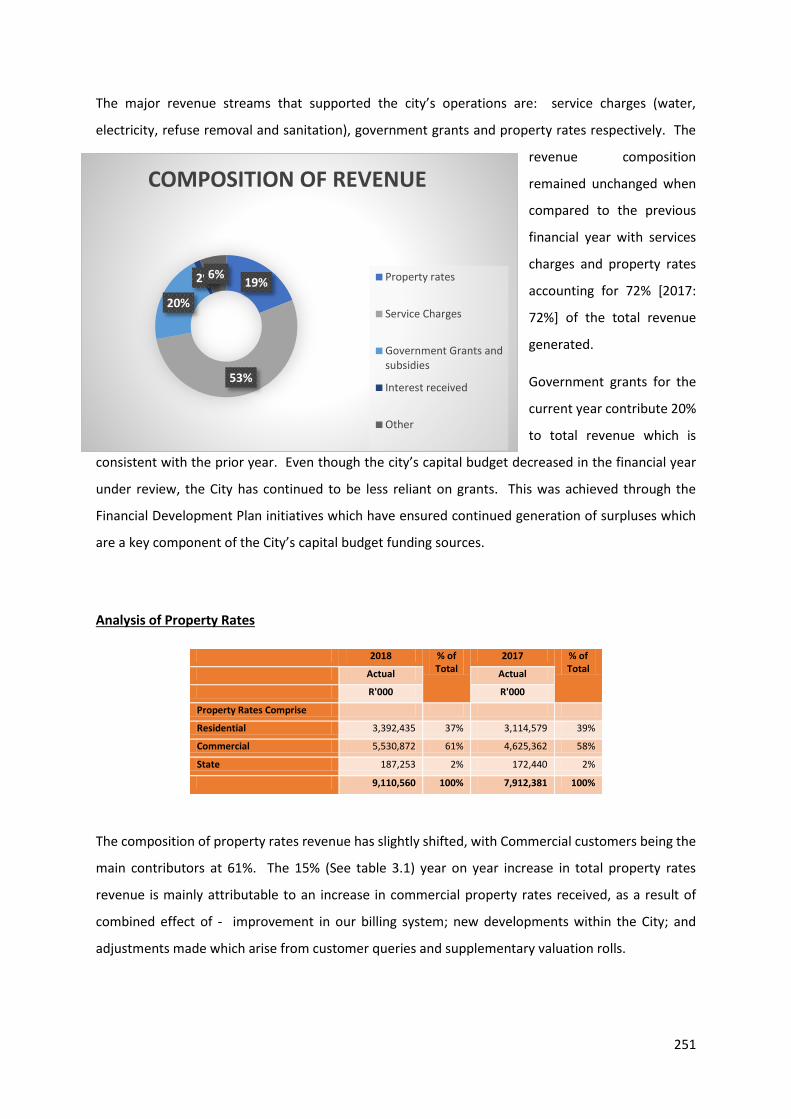
251
The major revenue streams that supported the city’s operations are: service charges (water,
electricity, refuse removal and sanitation), government grants and property rates respectively. The
revenue composition
remained unchanged when
compared to the previous
financial year with services
charges and property rates
accounting for 72% [2017:
72%] of the total revenue
generated.
Government grants for the
current year contribute 20%
to total revenue which is
consistent with the prior year. Even though the city’s capital budget decreased in the financial year
under review, the City has continued to be less reliant on grants. This was achieved through the
Financial Development Plan initiatives which have ensured continued generation of surpluses which
are a key component of the City’s capital budget funding sources.
Analysis of Property Rates
2018 % of Total
2017 % of Total Actual Actual
R'000 R'000
Property Rates Comprise
Residential 3,392,435 37% 3,114,579 39%
Commercial 5,530,872 61% 4,625,362 58%
State 187,253 2% 172,440 2%
9,110,560 100% 7,912,381 100%
The composition of property rates revenue has slightly shifted, with Commercial customers being the
main contributors at 61%. The 15% (See table 3.1) year on year increase in total property rates
revenue is mainly attributable to an increase in commercial property rates received, as a result of
combined effect of - improvement in our billing system; new developments within the City; and
adjustments made which arise from customer queries and supplementary valuation rolls.
19%
53%
20%
2%6%
COMPOSITION OF REVENUE
Property rates
Service Charges
Government Grants andsubsidies
Interest received
Other
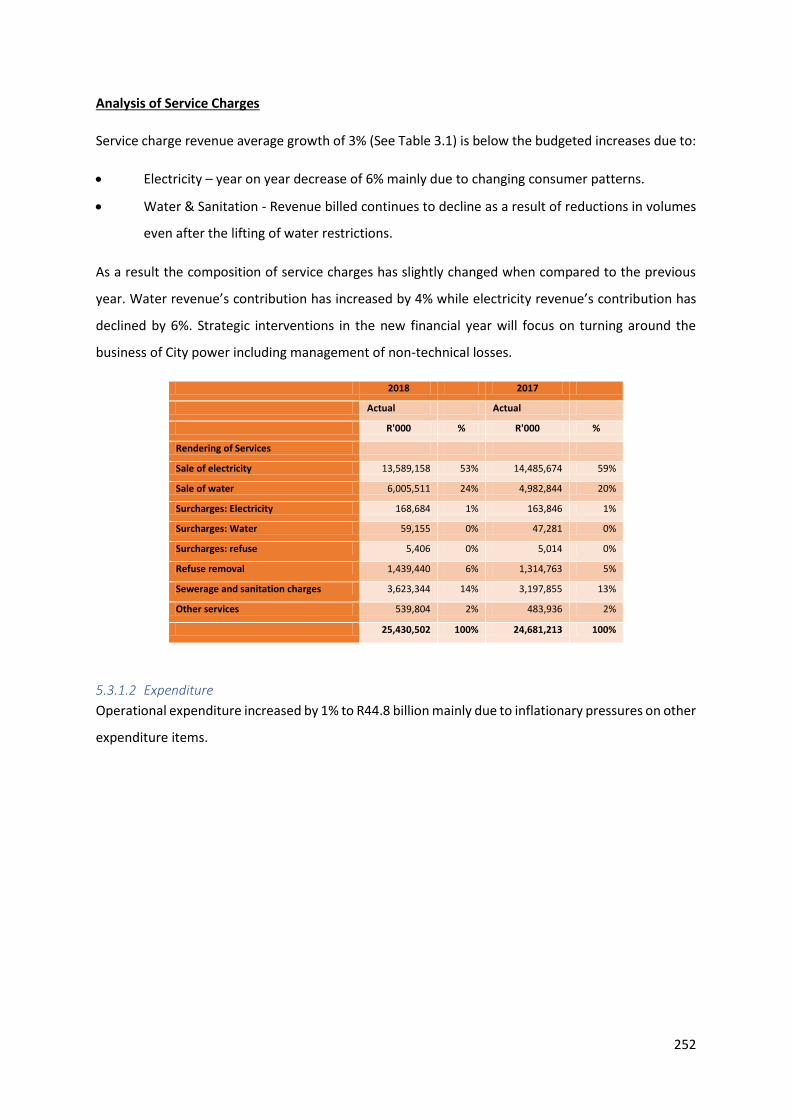
252
Analysis of Service Charges
Service charge revenue average growth of 3% (See Table 3.1) is below the budgeted increases due to:
Electricity – year on year decrease of 6% mainly due to changing consumer patterns.
Water & Sanitation - Revenue billed continues to decline as a result of reductions in volumes
even after the lifting of water restrictions.
As a result the composition of service charges has slightly changed when compared to the previous
year. Water revenue’s contribution has increased by 4% while electricity revenue’s contribution has
declined by 6%. Strategic interventions in the new financial year will focus on turning around the
business of City power including management of non-technical losses.
2018 2017
Actual Actual
R'000 % R'000 %
Rendering of Services
Sale of electricity 13,589,158 53% 14,485,674 59%
Sale of water 6,005,511 24% 4,982,844 20%
Surcharges: Electricity 168,684 1% 163,846 1%
Surcharges: Water 59,155 0% 47,281 0%
Surcharges: refuse 5,406 0% 5,014 0%
Refuse removal 1,439,440 6% 1,314,763 5%
Sewerage and sanitation charges 3,623,344 14% 3,197,855 13%
Other services 539,804 2% 483,936 2%
25,430,502 100% 24,681,213 100%
5.3.1.2 Expenditure
Operational expenditure increased by 1% to R44.8 billion mainly due to inflationary pressures on other
expenditure items.
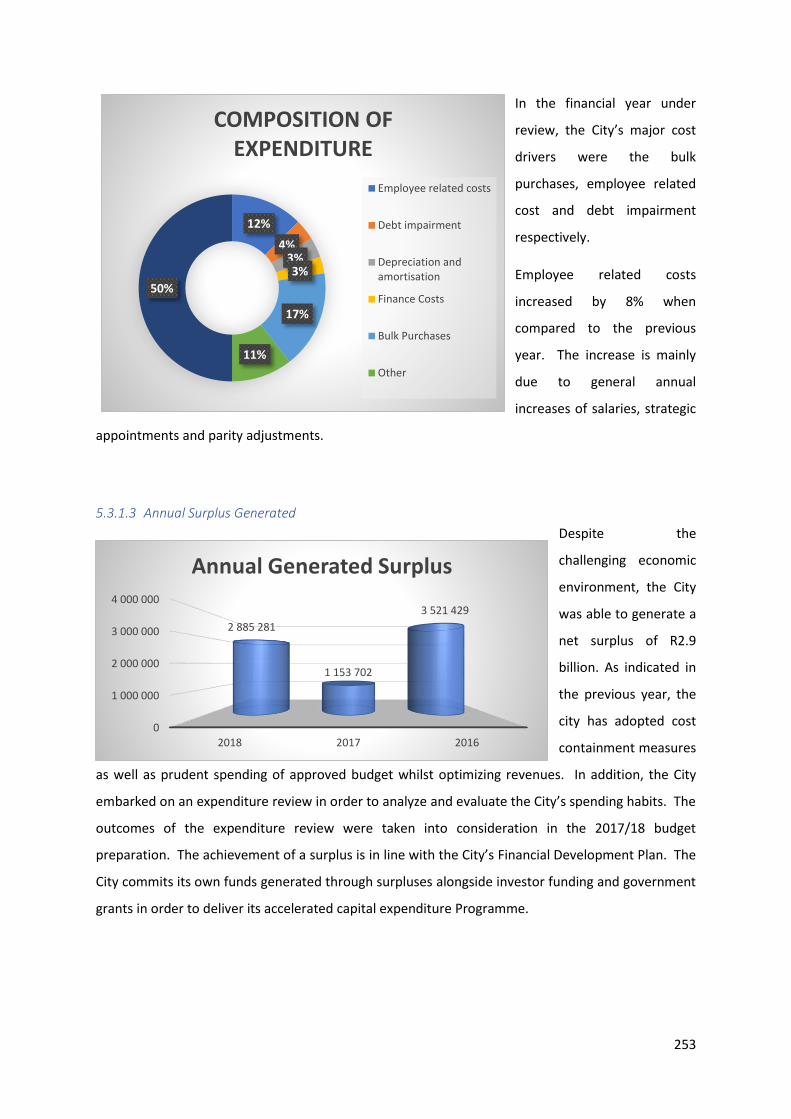
253
In the financial year under
review, the City’s major cost
drivers were the bulk
purchases, employee related
cost and debt impairment
respectively.
Employee related costs
increased by 8% when
compared to the previous
year. The increase is mainly
due to general annual
increases of salaries, strategic
appointments and parity adjustments.
5.3.1.3 Annual Surplus Generated
Despite the
challenging economic
environment, the City
was able to generate a
net surplus of R2.9
billion. As indicated in
the previous year, the
city has adopted cost
containment measures
as well as prudent spending of approved budget whilst optimizing revenues. In addition, the City
embarked on an expenditure review in order to analyze and evaluate the City’s spending habits. The
outcomes of the expenditure review were taken into consideration in the 2017/18 budget
preparation. The achievement of a surplus is in line with the City’s Financial Development Plan. The
City commits its own funds generated through surpluses alongside investor funding and government
grants in order to deliver its accelerated capital expenditure Programme.
12%
4%3%3%
17%
11%
50%
COMPOSITION OF EXPENDITURE
Employee related costs
Debt impairment
Depreciation andamortisation
Finance Costs
Bulk Purchases
Other
0
1 000 000
2 000 000
3 000 000
4 000 000
2018 2017 2016
2 885 281
1 153 702
3 521 429
Annual Generated Surplus
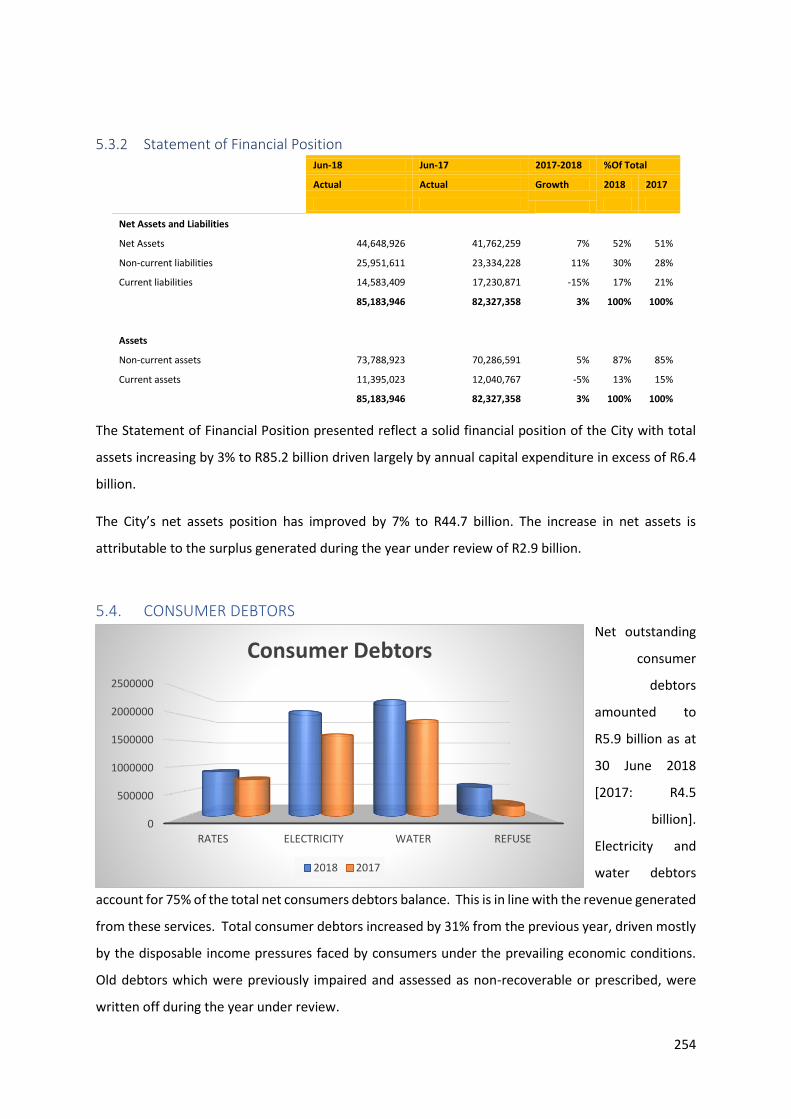
254
5.3.2 Statement of Financial Position
Jun-18 Jun-17 2017-2018 %Of Total
Actual Actual Growth 2018 2017
Net Assets and Liabilities
Net Assets 44,648,926 41,762,259 7% 52% 51%
Non-current liabilities 25,951,611 23,334,228 11% 30% 28%
Current liabilities 14,583,409 17,230,871 -15% 17% 21%
85,183,946 82,327,358 3% 100% 100%
Assets
Non-current assets 73,788,923 70,286,591 5% 87% 85%
Current assets 11,395,023 12,040,767 -5% 13% 15%
85,183,946 82,327,358 3% 100% 100%
The Statement of Financial Position presented reflect a solid financial position of the City with total
assets increasing by 3% to R85.2 billion driven largely by annual capital expenditure in excess of R6.4
billion.
The City’s net assets position has improved by 7% to R44.7 billion. The increase in net assets is
attributable to the surplus generated during the year under review of R2.9 billion.
5.4. CONSUMER DEBTORS Net outstanding
consumer
debtors
amounted to
R5.9 billion as at
30 June 2018
[2017: R4.5
billion].
Electricity and
water debtors
account for 75% of the total net consumers debtors balance. This is in line with the revenue generated
from these services. Total consumer debtors increased by 31% from the previous year, driven mostly
by the disposable income pressures faced by consumers under the prevailing economic conditions.
Old debtors which were previously impaired and assessed as non-recoverable or prescribed, were
written off during the year under review.
0
500000
1000000
1500000
2000000
2500000
RATES ELECTRICITY WATER REFUSE
Consumer Debtors
2018 2017
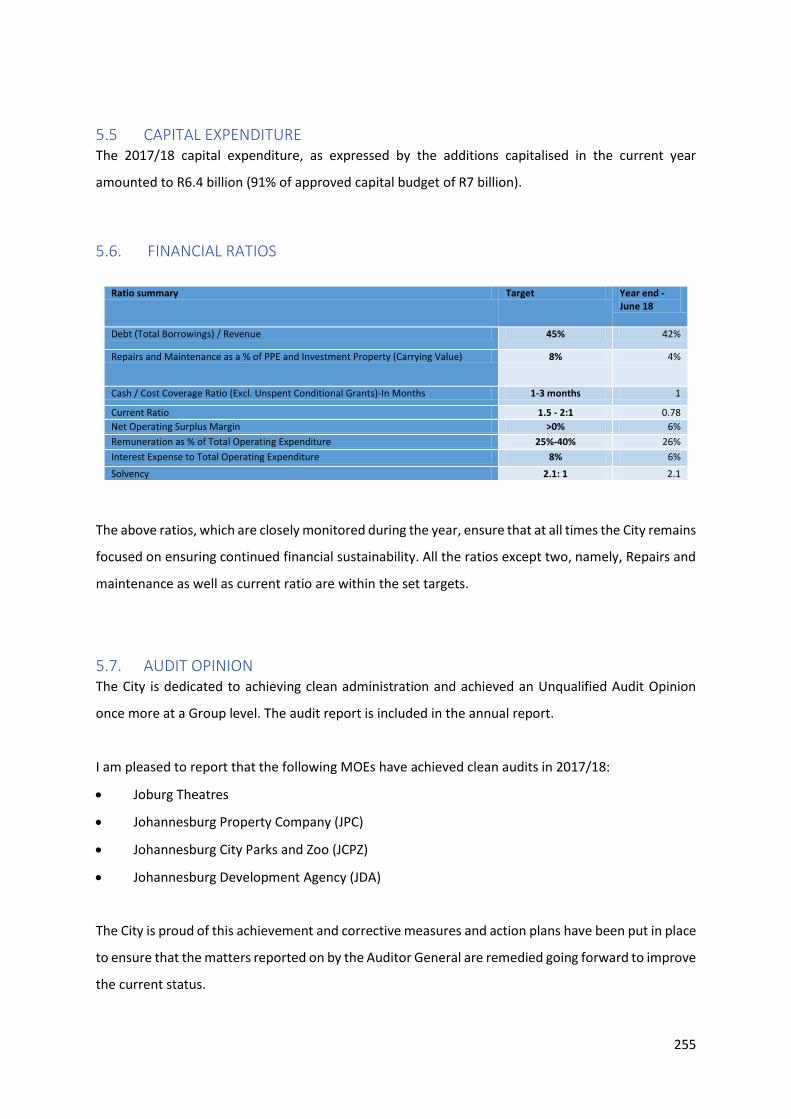
255
5.5 CAPITAL EXPENDITURE The 2017/18 capital expenditure, as expressed by the additions capitalised in the current year
amounted to R6.4 billion (91% of approved capital budget of R7 billion).
5.6. FINANCIAL RATIOS
The above ratios, which are closely monitored during the year, ensure that at all times the City remains
focused on ensuring continued financial sustainability. All the ratios except two, namely, Repairs and
maintenance as well as current ratio are within the set targets.
5.7. AUDIT OPINION The City is dedicated to achieving clean administration and achieved an Unqualified Audit Opinion
once more at a Group level. The audit report is included in the annual report.
I am pleased to report that the following MOEs have achieved clean audits in 2017/18:
Joburg Theatres
Johannesburg Property Company (JPC)
Johannesburg City Parks and Zoo (JCPZ)
Johannesburg Development Agency (JDA)
The City is proud of this achievement and corrective measures and action plans have been put in place
to ensure that the matters reported on by the Auditor General are remedied going forward to improve
the current status.
Ratio summary Target Year end - June 18
Debt (Total Borrowings) / Revenue 45% 42%
Repairs and Maintenance as a % of PPE and Investment Property (Carrying Value) 8% 4%
Cash / Cost Coverage Ratio (Excl. Unspent Conditional Grants)-In Months 1-3 months 1
Current Ratio 1.5 - 2:1 0.78
Net Operating Surplus Margin >0% 6%
Remuneration as % of Total Operating Expenditure 25%-40% 26%
Interest Expense to Total Operating Expenditure 8% 6%
Solvency 2.1: 1 2.1
256
5.8. CONCLUSION I wish to express my earnest appreciation to the Executive Mayor, Councilors, Member of the
Mayoral Committee responsible for Finance, Mayoral Committee, Section 79 Oversight
Committees, Group Audit Committee, Group Performance Audit Committee, Group Risk
Governance Committee, Municipal Manager, Chief Operations Officer, Executive Management
Team, Boards of Directors, Oversight Committees, Managing Directors and Chief Financial
Officers of Municipal Owned Entities and their teams for the support they have provided during
the 2017/18 financial year.
A sincere word of appreciation goes to the entire staff of the City and MoEs, who have played
a role in making the financial year under review a success and ensuring that the financial
statements are finalized on time. The hard work, sacrifices and intensive efforts throughout the
year, are much appreciated.
We remain committed to stabilizing the finances of the City, and instituting fiscal discipline.
Through our fiscal management we will ensure:
• Sustainable cash flow is maintained over the medium term to build up sufficient
reserves which can be utilized towards future capital investments.
• Borrowings will be used to augment internally generated reserves while ensuring the
debt to revenue ratio remains within the prescribed limits set by National Treasury.
Going forward I hope that through prudent financial management we can achieve
transformational change – Diphetogo – for the people of Johannesburg.
__________________________________________
Charity-Ann Wurayayi
Acting Group Chief Financial Officer
City of Johannesburg Metropolitan Municipality
257
6. Annual Report of the Group Audit Committee
ANNUAL REPORT OF THE GROUP AUDIT COMMITTEE (GAC) OF THE CITY OF
JOHANNESBURG MUNICIPALITY FOR THE YEAR ENDED 30 JUNE 2018
Legislative Mandate
The Audit Committee is constituted in terms of sections 166(2) and 166 (6) (b) of the Municipal Finance
Management Act, No. 56 of 2003 (MFMA).
The Audit Committee is an independent advisory body which must advise the Council of City of
Johannesburg Municipality (Council), Mayor, Mayoral Committee, Accounting Officer and the
management of the City of Johannesburg Municipality (Municipality). It advises on matters relating
to:
Internal Financial Control;
Internal Audit;
Risk Management Processes;
Financial Reporting;
Performance Management;
Governance;
Compliance with Laws and Regulations; and
Any other issues referred by the Municipality or its Entities.
Integrated Independent Oversight
The City established three different Advisory Committees because of its size and complexity i.e. Group
Audit Committee (GAC), Group Risk Governance Committee (GRGC) and Group Performance Audit
Committee (GPAC). To ensure continuity and feedback, dual membership system was adopted. Two
members from each Committee represent their Committee on the other Committees to enable
feedback on what transpired in the meetings of the Committees they are deployed to, back to their
main Committee.
The Cross-members do not occupy the positions of Chairperson in any of the Committees. Due to the
City’s business size and complexity it delegated performance and risk oversight responsibilities to
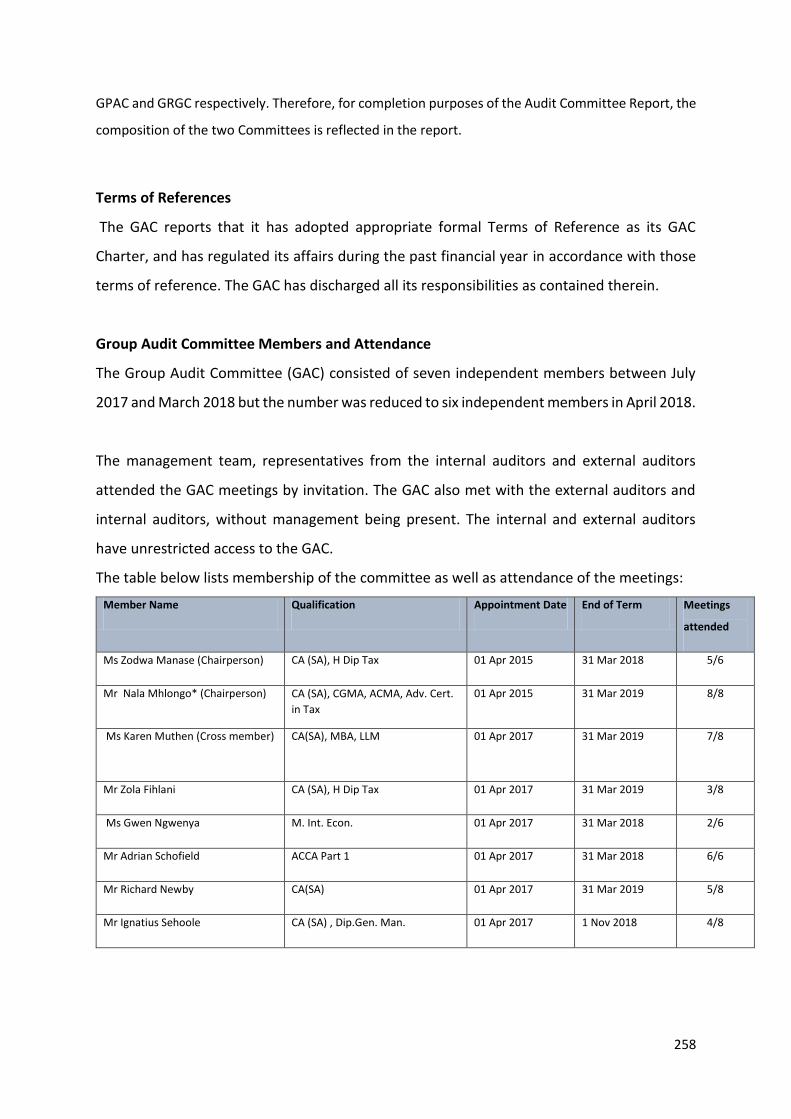
258
GPAC and GRGC respectively. Therefore, for completion purposes of the Audit Committee Report, the
composition of the two Committees is reflected in the report.
Terms of References
The GAC reports that it has adopted appropriate formal Terms of Reference as its GAC
Charter, and has regulated its affairs during the past financial year in accordance with those
terms of reference. The GAC has discharged all its responsibilities as contained therein.
Group Audit Committee Members and Attendance
The Group Audit Committee (GAC) consisted of seven independent members between July
2017 and March 2018 but the number was reduced to six independent members in April 2018.
The management team, representatives from the internal auditors and external auditors
attended the GAC meetings by invitation. The GAC also met with the external auditors and
internal auditors, without management being present. The internal and external auditors
have unrestricted access to the GAC.
The table below lists membership of the committee as well as attendance of the meetings:
Member Name Qualification Appointment Date End of Term Meetings
attended
Ms Zodwa Manase (Chairperson) CA (SA), H Dip Tax 01 Apr 2015 31 Mar 2018 5/6
Mr Nala Mhlongo* (Chairperson) CA (SA), CGMA, ACMA, Adv. Cert.
in Tax
01 Apr 2015 31 Mar 2019 8/8
Ms Karen Muthen (Cross member) CA(SA), MBA, LLM 01 Apr 2017 31 Mar 2019 7/8
Mr Zola Fihlani CA (SA), H Dip Tax 01 Apr 2017 31 Mar 2019 3/8
Ms Gwen Ngwenya M. Int. Econ. 01 Apr 2017 31 Mar 2018 2/6
Mr Adrian Schofield ACCA Part 1 01 Apr 2017 31 Mar 2018 6/6
Mr Richard Newby CA(SA) 01 Apr 2017 31 Mar 2019 5/8
Mr Ignatius Sehoole CA (SA) , Dip.Gen. Man. 01 Apr 2017 1 Nov 2018 4/8
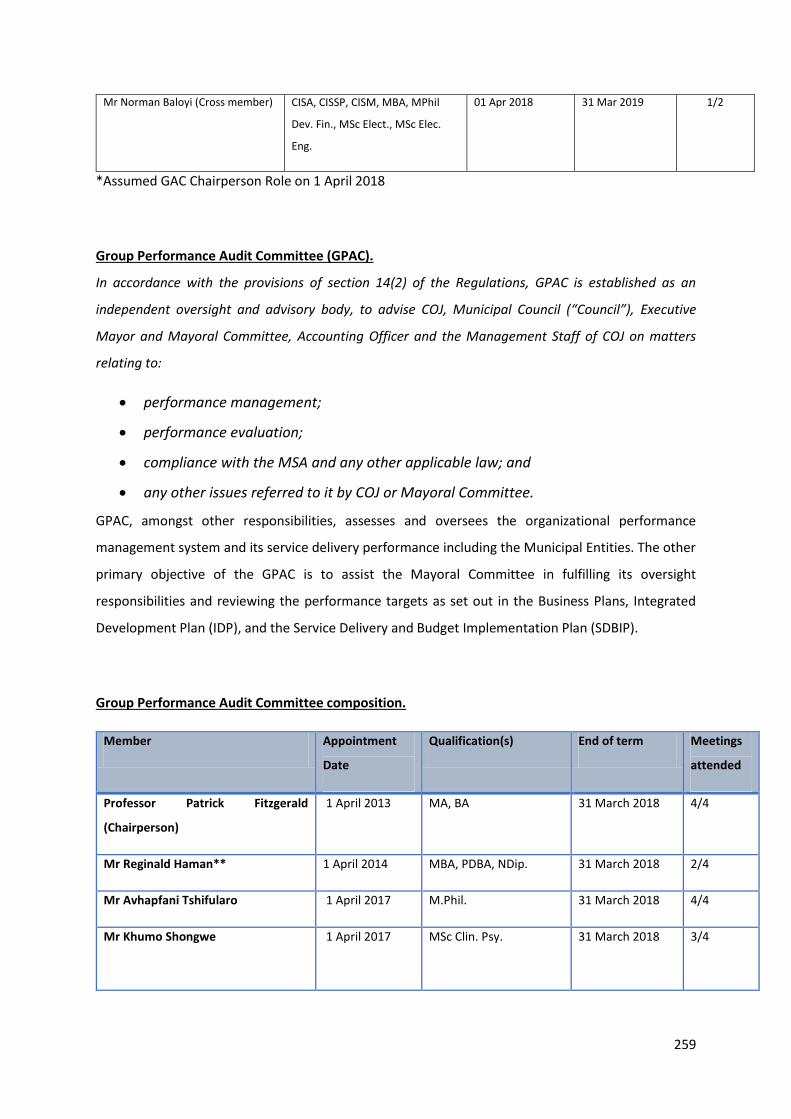
259
Mr Norman Baloyi (Cross member) CISA, CISSP, CISM, MBA, MPhil
Dev. Fin., MSc Elect., MSc Elec.
Eng.
01 Apr 2018 31 Mar 2019 1/2
*Assumed GAC Chairperson Role on 1 April 2018
Group Performance Audit Committee (GPAC).
In accordance with the provisions of section 14(2) of the Regulations, GPAC is established as an
independent oversight and advisory body, to advise COJ, Municipal Council (“Council”), Executive
Mayor and Mayoral Committee, Accounting Officer and the Management Staff of COJ on matters
relating to:
performance management;
performance evaluation;
compliance with the MSA and any other applicable law; and
any other issues referred to it by COJ or Mayoral Committee.
GPAC, amongst other responsibilities, assesses and oversees the organizational performance
management system and its service delivery performance including the Municipal Entities. The other
primary objective of the GPAC is to assist the Mayoral Committee in fulfilling its oversight
responsibilities and reviewing the performance targets as set out in the Business Plans, Integrated
Development Plan (IDP), and the Service Delivery and Budget Implementation Plan (SDBIP).
Group Performance Audit Committee composition.
Member Appointment
Date
Qualification(s) End of term Meetings
attended
Professor Patrick Fitzgerald
(Chairperson)
1 April 2013 MA, BA 31 March 2018 4/4
Mr Reginald Haman** 1 April 2014 MBA, PDBA, NDip. 31 March 2018 2/4
Mr Avhapfani Tshifularo 1 April 2017 M.Phil. 31 March 2018 4/4
Mr Khumo Shongwe 1 April 2017 MSc Clin. Psy. 31 March 2018 3/4
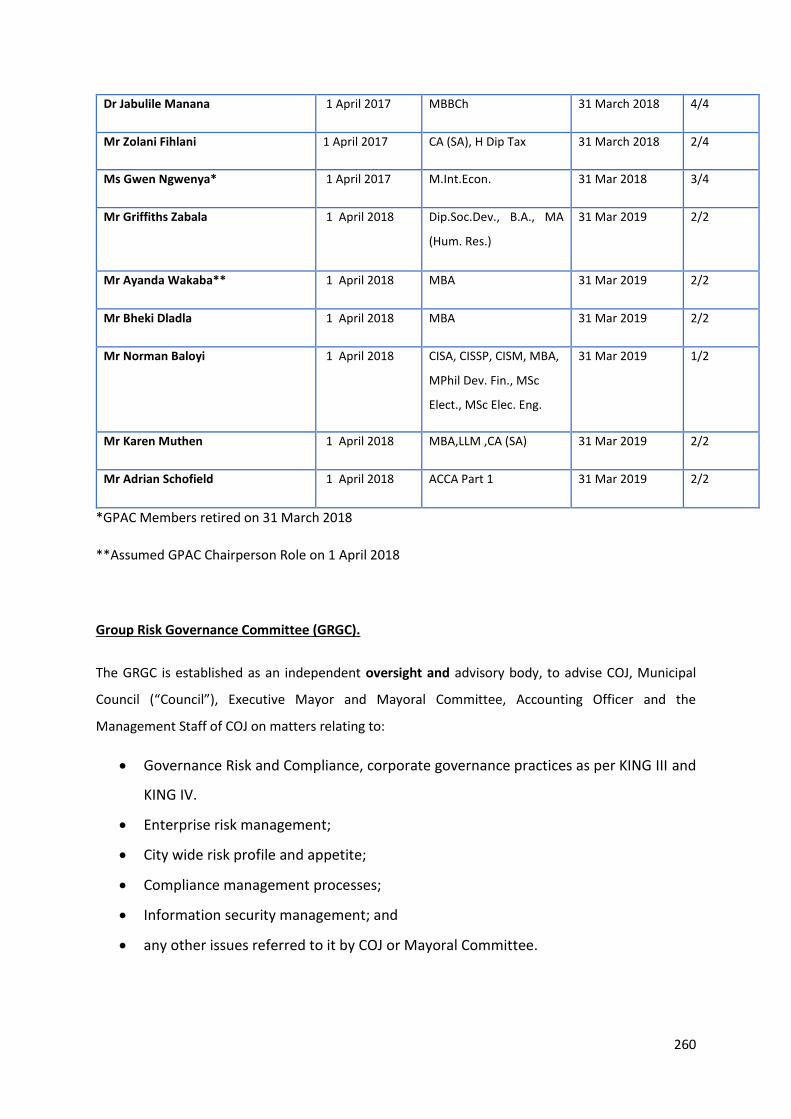
260
Dr Jabulile Manana 1 April 2017 MBBCh 31 March 2018 4/4
Mr Zolani Fihlani 1 April 2017 CA (SA), H Dip Tax 31 March 2018 2/4
Ms Gwen Ngwenya* 1 April 2017 M.Int.Econ. 31 Mar 2018 3/4
Mr Griffiths Zabala 1 April 2018 Dip.Soc.Dev., B.A., MA
(Hum. Res.)
31 Mar 2019 2/2
Mr Ayanda Wakaba** 1 April 2018 MBA 31 Mar 2019 2/2
Mr Bheki Dladla 1 April 2018 MBA 31 Mar 2019 2/2
Mr Norman Baloyi 1 April 2018 CISA, CISSP, CISM, MBA,
MPhil Dev. Fin., MSc
Elect., MSc Elec. Eng.
31 Mar 2019 1/2
Mr Karen Muthen 1 April 2018 MBA,LLM ,CA (SA) 31 Mar 2019 2/2
Mr Adrian Schofield 1 April 2018 ACCA Part 1 31 Mar 2019 2/2
*GPAC Members retired on 31 March 2018
**Assumed GPAC Chairperson Role on 1 April 2018
Group Risk Governance Committee (GRGC).
The GRGC is established as an independent oversight and advisory body, to advise COJ, Municipal
Council (“Council”), Executive Mayor and Mayoral Committee, Accounting Officer and the
Management Staff of COJ on matters relating to:
Governance Risk and Compliance, corporate governance practices as per KING III and
KING IV.
Enterprise risk management;
City wide risk profile and appetite;
Compliance management processes;
Information security management; and
any other issues referred to it by COJ or Mayoral Committee.
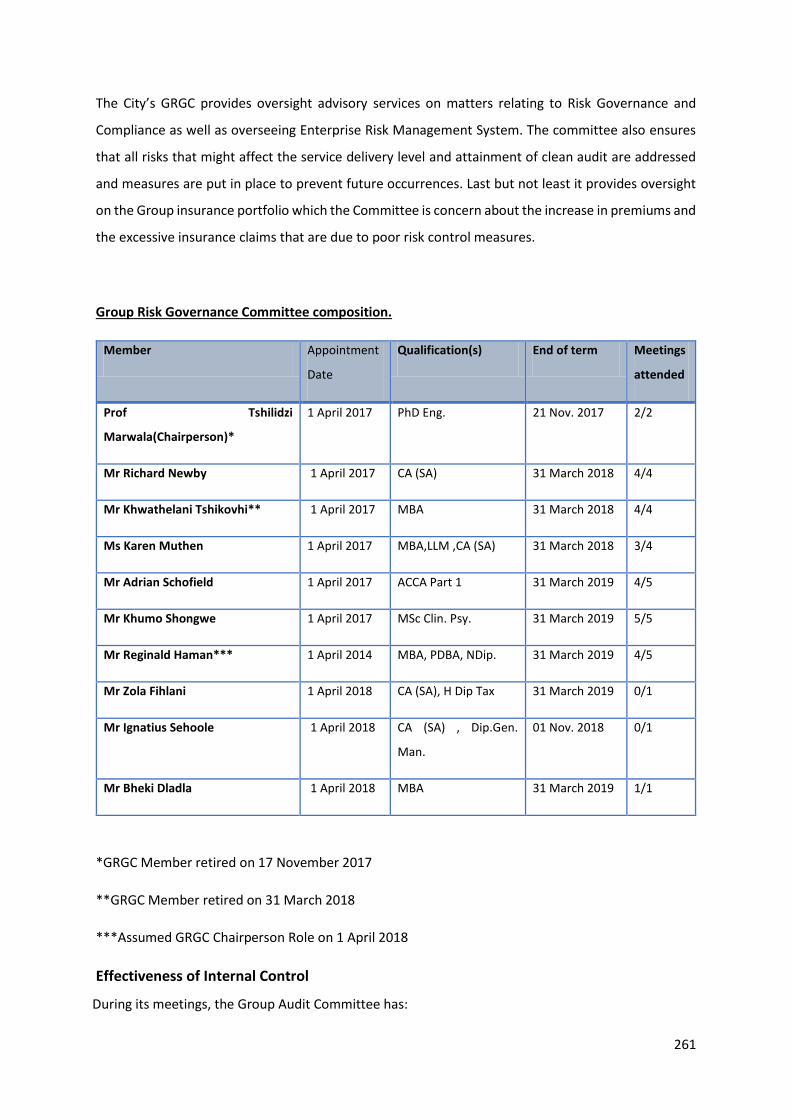
261
The City’s GRGC provides oversight advisory services on matters relating to Risk Governance and
Compliance as well as overseeing Enterprise Risk Management System. The committee also ensures
that all risks that might affect the service delivery level and attainment of clean audit are addressed
and measures are put in place to prevent future occurrences. Last but not least it provides oversight
on the Group insurance portfolio which the Committee is concern about the increase in premiums and
the excessive insurance claims that are due to poor risk control measures.
Group Risk Governance Committee composition.
Member Appointment
Date
Qualification(s) End of term Meetings
attended
Prof Tshilidzi
Marwala(Chairperson)*
1 April 2017 PhD Eng. 21 Nov. 2017 2/2
Mr Richard Newby 1 April 2017 CA (SA) 31 March 2018 4/4
Mr Khwathelani Tshikovhi** 1 April 2017 MBA 31 March 2018 4/4
Ms Karen Muthen 1 April 2017 MBA,LLM ,CA (SA) 31 March 2018 3/4
Mr Adrian Schofield 1 April 2017 ACCA Part 1 31 March 2019 4/5
Mr Khumo Shongwe 1 April 2017 MSc Clin. Psy. 31 March 2019 5/5
Mr Reginald Haman*** 1 April 2014 MBA, PDBA, NDip. 31 March 2019 4/5
Mr Zola Fihlani 1 April 2018 CA (SA), H Dip Tax 31 March 2019 0/1
Mr Ignatius Sehoole 1 April 2018 CA (SA) , Dip.Gen.
Man.
01 Nov. 2018 0/1
Mr Bheki Dladla 1 April 2018 MBA 31 March 2019 1/1
*GRGC Member retired on 17 November 2017
**GRGC Member retired on 31 March 2018
***Assumed GRGC Chairperson Role on 1 April 2018
Effectiveness of Internal Control
During its meetings, the Group Audit Committee has:
262
Reviewed the adequacy and effectiveness of the City’s system of internal financial control
including receiving assurance reports from Management, Internal and External Audit, Legal
and Compliance as well as Enterprise Risk and Advisory;
Reviewed the City’s approach on its exposure to the business and financial risks and
whether processes are in place to safeguard the assets;
Reviewed significant issues raised by the Internal and External Auditors;
Reviewed whether the financial systems can be relied upon in the preparation and
presentation of financial statements;
Reviewed significant legal exposures and pending cases;
Reviewed significant cases of misconduct, fraud or any other unethical activity by
employees of the City ; and
Based on the processes and assurances obtained, we believe that the internal controls are effective in
most areas, significant areas requiring improvements are addressed in the recommendations included
in this report.
Performance Information
The Group Performance Audit Committee (GPAC) has reviewed performance information
provided by the City as well as Internal Audit reports at quarterly meetings throughout the
year. The reliability and usefulness of performance information remains a concern to the
GPAC and it expressed concern over non-alignment of Key Performance Indicators (KPIs) with
the Integrated Development Plan (IDP).
The GPAC was also faced with challenges in evaluating the performance of the City due to insufficient,
inaccurate or no evidence being provided in support of the substantive performance reported.
Inadequate record keeping and the lack of management reviews in relation to reported performance
information were system weaknesses identified by the GPAC. The committee therefore is concerned
that key decisions could be taken based on inaccurate reported performance information which might
also result in funds being channeled to areas where they are not necessarily required. The committee
implores management to implement forthwith adequate review measures, and robust systems of
record keeping.
263
Internal Audit
The Group Audit Committee has:
Reviewed and approved the Internal Audit Charter;
Reviewed and approved the Internal Audit Plan;
Exercised its statutory duty of oversight over the internal audit function;
Evaluated the independence, effectiveness and performance of the Internal Audit Unit
in the fulfillment of its mandate; and
Encouraged co-operation between External and Internal Audit work.
Reviewed a summary of the salient findings of all internal audits carried out by the unit
during the year was reported quarterly.
Reviewed the responses from the Management of the City to the internal audit findings
and where necessary corrective action was recommended and implementation
monitored.
Risk Management
The Group Risk Governance Committee (GRGC) has reviewed the quarterly management risk reports
which dealt with the followings:
o Progress on implementation of mitigations for strategic risks;
o Emerging and materialised risk identified;
o Other significant changes on the risks profile;
o Progress on implementation of Business Continuity Programmes;
The GRGC noted progress on the City’s risk assessment, risk analysis as well as results of risk
monitoring and mitigation actions and/or risk treatment plans on the City-wide top risk.
The committee remains concerned with lack of progress made on the implementation of the Disaster
Recovery Plan and the Business Continuity Plan. On compliance management, the Committee
expressed its concern on the huge number of Departments that are deemed to be non-compliant.
264
Evaluation of Financial Statements
The Group Audit Committee has;
Reviewed the quality, adequacy, accuracy and reliability of financial information;
Reviewed and discussed the audited Annual Financial Statements with the Auditor-
General;
Responded to any issues raised by Internal Audit and AGSA during the year;
Reviewed changes in accounting policies and practices; and
Reviewed significant adjustments resulting from the audit.
Quarterly Reporting
The Group Audit Committee was satisfied with the content and quality of quarterly reports prepared
and submitted by the Accounting Officer to the Committee for review.
There is, however, room for improvements with regard to the timeliness of the quarterly reports sub-
mitted for meetings.
Quarterly Group Audit Committee meetings are scheduled long after the respective reporting quarter
(three months after close of reporting quarter) resulting in quarterly reports being received, reviewed
and deliberated on long after the period in discussion.
Auditor-General South Africa
The Group Audit Committee has:
Reviewed the scope of the External Audit to ensure the critical areas within the City
are covered;
Reviewed the AGSA’s report on issues arising out of the external audit and concurred
with unqualified with others matters for the City; and
Based on processes followed and assurances received from the AGSA, nothing has come to the
attention of the Audit Committee with regards to any matter impacting on the independence of
the External Auditors.
265
Key Recommendations
The Accounting Officer should ensure that all stakeholders continue with diligent efforts to
manage and reduce the significant Water and Electricity Losses.
Over the last three years, the City has lost approximately R100 million as a result of bus
cash shortages. It is recommended that processes and controls are streamlined and
strengthened swiftly in order to eliminate any loopholes, that an automated fare
collection system is implemented without delay and that all bank accounts should be
reconciled daily and any corrective actions implemented immediately.
Probity audits are conducted for all tenders in respect of significant procurements of
goods and services, however, no such audits are conducted on procurement of goods
and services under contracts secured by other organs of state (in terms of Regulation 32
of Municipal Supply Chain Management Regulations). It is recommended that the City
should consider conducting probity audits on Regulation 32 procurement.
The threshold for the implementation of probity audits should be reviewed by the EMT,
so as to remove any impediments to the expeditious awarding of procurement
contracts, and to ensure that any negative effect on service delivery is minimized.
The Accounting Officer should ensure that all stakeholders continue with diligent efforts to
improve the debtors’ collection rates and to focus attention on revenue improvement
strategies, as well as on cost cutting and project prioritization initiatives which may assist
in improving the overall liquidity status of the City.
The City may consider setting up a Disciplinary Board (in terms of Municipal Regulations
on Financial Misconduct Procedures and Criminal Proceedings) to oversee the forensic
investigations on matters of financial misconduct.
A concerted effort needs to be made to reduce the timeframe for conclusion of
disciplinary processes. Alternative dispute resolution strategies should be considered in
respect of labour disputes that are legally and technically complex, in order to minimize
the financial obligations of the City.
The number of unresolved significant internal and external audit findings from the
previous years remains high and therefore it is recommended that the internal control
issues should receive appropriate attention in order to improve the annual audit
outcomes.
266
Progress made in filling-up the vacancies within the internal audit unit and other critical
positions in the City is noted and appreciated, however, the Audit Committee remains
concerned with number of vacant senior positions and therefore the Accounting Officer
should ensure that the remaining senior positions are addressed accordingly.
According to AGSA report, certain investments were made in contravention of Municipal
Investment Regulation 6.The investees of the investments in question have never been
disclosed on the Group Annual Financial Statements for the City. In future, it is
recommended that a full disclosure be made about the nature and the names of the
investees of all significant investments made on behalf of the City.
In order to make sure that the returns of investments for projects are maximized, the
Accounting Officer should continue with diligent efforts to set-up and stabilize the
Programme Management Office (PMO), such that capital spend is continuously and
effectively monitored.
According to JPC’s Annual Report for the year ended 30 June 2018, value of properties
available to the market for economic development and revenue generation for the City
amounts to R4.577 billion but the City’s Group Annual Financial Statements for the year
ended 30 June 2018 only reflect the investment properties for only R1 billion. According to
JPC’s accounts, the City’s investment properties generated R58.4 million in revenues for
2018 financial year but nothing is disclosed in the Group Financial Statements for the City.
It is recommended that the full disclosure be made regarding the investment properties
for the City including the returns on investments.
It is recommendation that the physical verification of the properties owned by the City be
done on a regular basis by reconciling the internal records to the valuation rolls and the
Deeds Registry.
According to Regulation 16 of the Municipal Regulations on Financial Misconduct
Procedures and Criminal Proceedings, “Municipalities and municipal entities must report
on all suspensions, disciplinary or criminal proceedings instituted in cases of financial
misconduct in their annual reports”. It is recommended that this requirement be
implemented in full.
The ICT environment remains a challenge for the City and accordingly Management is
encouraged to address it swiftly.

267
Financial recording, reconciliation, reporting and review must be diligently and
competently performed throughout the financial year, in order to eradicate the need for
material adjustments to the financial statements after financial close;
Internal controls surrounding procurement processes must be strictly aligned with
procurement regulations and strengthened to mitigate the rising irregular expenditure.
The City should establish a system of reconciling the number of consumers for all categories
of services (electricity, water and waste management) against the number of ratepayers as
per the valuation rolls annually and all significant variances should be documented and
investigated in order to detect any revenue leakages which may arise as a result of the
discrepancies. Significant fluctuations of consumer numbers between the consecutive
financial years should also be investigated in order to establish the root causes.
Appreciation The Group Audit Committee would like to express its gratitude to the Council, Mayor, Mayoral
Committee, Accounting Officer, Executive Management, Finance staff, Representatives of the
Entities, forensic investigators, Internal Audit Staff, Other Assurance Providers and the AGSA for
their co-operation and assistance during the year.
Mr A N Mhlongo
Chairperson of the Group Audit Committee
Date: 30 November 2018
268
7. Auditor-General Audit Findings
Report of the Auditor-General to the Gauteng Provincial Legislature and the
council on the City of Johannesburg Metropolitan Municipality
7.1 Report on the audit of the financial statements
Opinion
1. I have audited the consolidated and separate financial statements of the City of Johannesburg
Metropolitan Municipality (CJMM) set out on pages xx to xx, which comprise the statement
of financial position as at 30 June 2018, the statement of financial performance, statement of
changes in net assets, cash flow statement and statement of comparison of budget and actual
amounts for the year then ended, as well as the notes to the financial statements, including a
summary of significant accounting policies.
2. In my opinion, the consolidated and separate financial statements present fairly, in all material
respects, the financial position of the City of Johannesburg Metropolitan Municipality as at 30
June 2018, and its financial performance and cash flows for the year then ended in accordance
with the South African Standards of Generally Recognised Accounting Practice (SA Standards
of GRAP) and the requirements of the Municipal Finance Management Act of South Africa,
2003 (Act No. 56 of 2003) (MFMA) and the Division of Revenue Act, 2016 (Act No. 3 of 2017)
(DoRA).
Basis for opinion
3. I conducted my audit in accordance with the International Standards on Auditing (ISAs). My
responsibilities under those standards are further described in the auditor-general’s
responsibilities for the audit of the financial statements section of this auditor’s report.
4. I am independent of the municipality in accordance with the International Ethics Standards
Board for Accountants’ Code of ethics for professional accountants (IESBA code) and the
ethical requirements that are relevant to my audit in South Africa. I have fulfilled my other
ethical responsibilities in accordance with these requirements and the IESBA code.
5. I believe that the audit evidence I have obtained is sufficient and appropriate to provide a
basis for my opinion.
Key audit matter
6. Key audit matters are those matters that, in my professional judgement, were of most
significance in my audit of the financial statements of the current period. These matters were
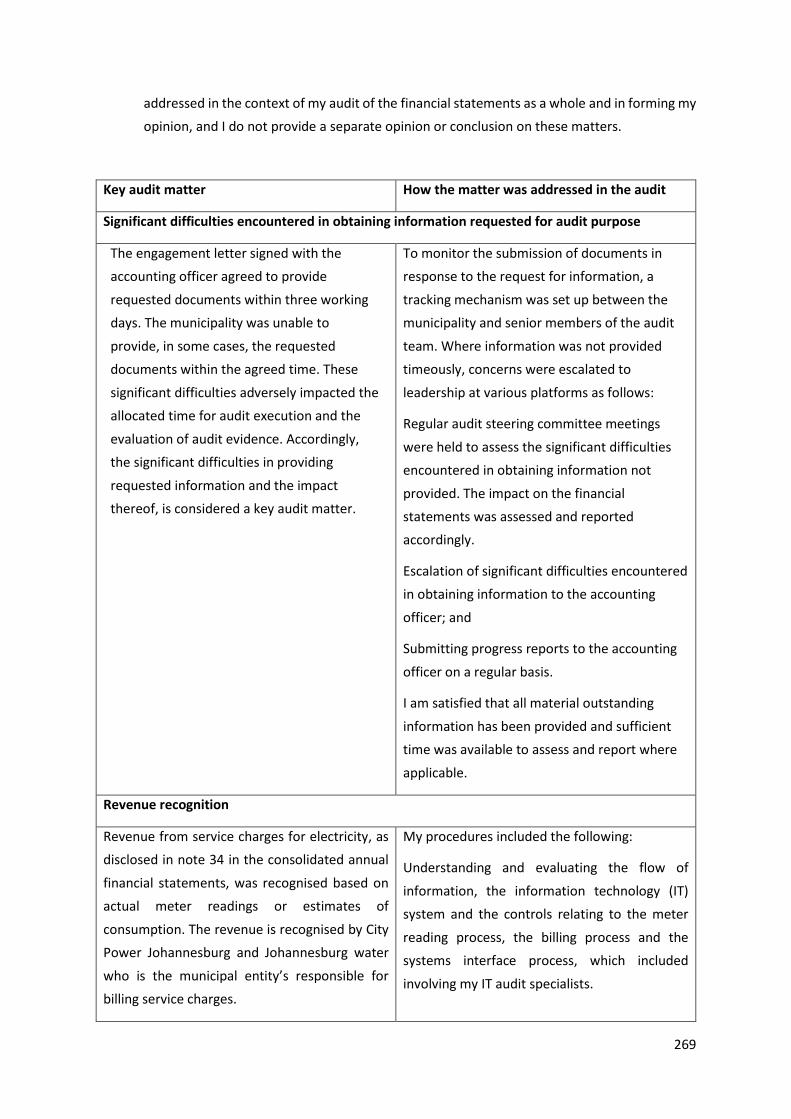
269
addressed in the context of my audit of the financial statements as a whole and in forming my
opinion, and I do not provide a separate opinion or conclusion on these matters.
Key audit matter How the matter was addressed in the audit
Significant difficulties encountered in obtaining information requested for audit purpose
The engagement letter signed with the
accounting officer agreed to provide
requested documents within three working
days. The municipality was unable to
provide, in some cases, the requested
documents within the agreed time. These
significant difficulties adversely impacted the
allocated time for audit execution and the
evaluation of audit evidence. Accordingly,
the significant difficulties in providing
requested information and the impact
thereof, is considered a key audit matter.
To monitor the submission of documents in
response to the request for information, a
tracking mechanism was set up between the
municipality and senior members of the audit
team. Where information was not provided
timeously, concerns were escalated to
leadership at various platforms as follows:
Regular audit steering committee meetings
were held to assess the significant difficulties
encountered in obtaining information not
provided. The impact on the financial
statements was assessed and reported
accordingly.
Escalation of significant difficulties encountered
in obtaining information to the accounting
officer; and
Submitting progress reports to the accounting
officer on a regular basis.
I am satisfied that all material outstanding
information has been provided and sufficient
time was available to assess and report where
applicable.
Revenue recognition
Revenue from service charges for electricity, as
disclosed in note 34 in the consolidated annual
financial statements, was recognised based on
actual meter readings or estimates of
consumption. The revenue is recognised by City
Power Johannesburg and Johannesburg water
who is the municipal entity’s responsible for
billing service charges.
My procedures included the following:
Understanding and evaluating the flow of
information, the information technology (IT)
system and the controls relating to the meter
reading process, the billing process and the
systems interface process, which included
involving my IT audit specialists.
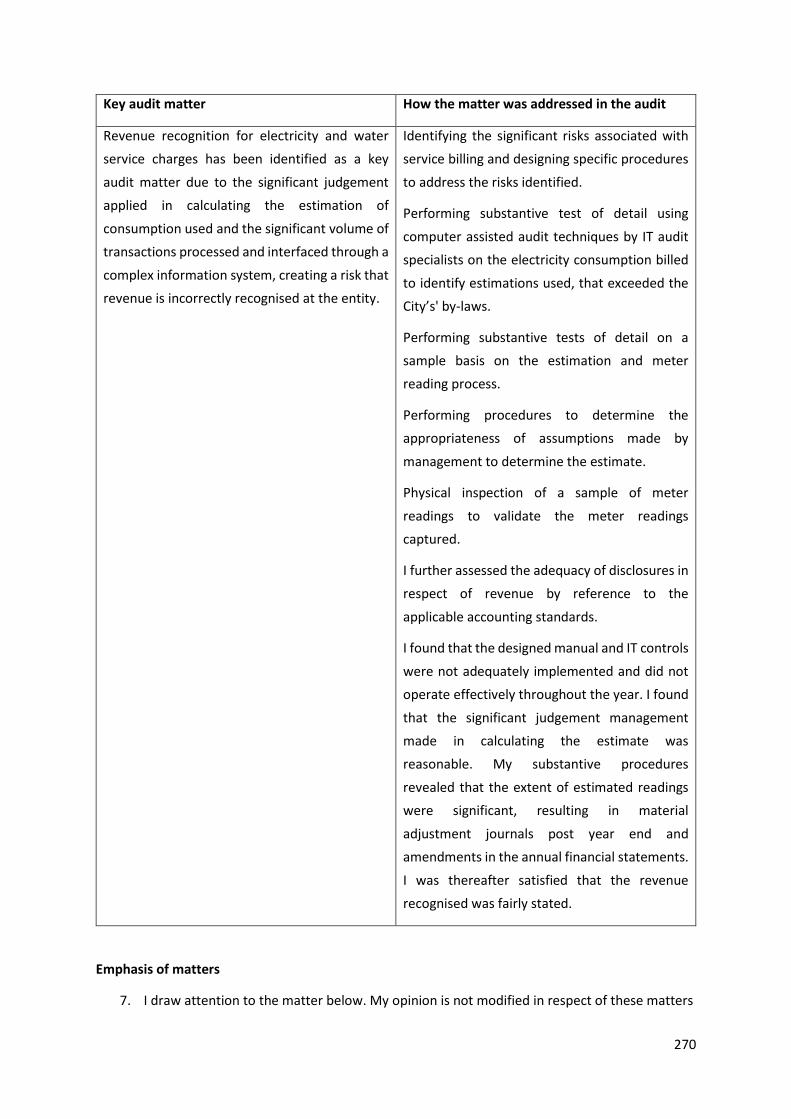
270
Key audit matter How the matter was addressed in the audit
Revenue recognition for electricity and water
service charges has been identified as a key
audit matter due to the significant judgement
applied in calculating the estimation of
consumption used and the significant volume of
transactions processed and interfaced through a
complex information system, creating a risk that
revenue is incorrectly recognised at the entity.
Identifying the significant risks associated with
service billing and designing specific procedures
to address the risks identified.
Performing substantive test of detail using
computer assisted audit techniques by IT audit
specialists on the electricity consumption billed
to identify estimations used, that exceeded the
City’s' by-laws.
Performing substantive tests of detail on a
sample basis on the estimation and meter
reading process.
Performing procedures to determine the
appropriateness of assumptions made by
management to determine the estimate.
Physical inspection of a sample of meter
readings to validate the meter readings
captured.
I further assessed the adequacy of disclosures in
respect of revenue by reference to the
applicable accounting standards.
I found that the designed manual and IT controls
were not adequately implemented and did not
operate effectively throughout the year. I found
that the significant judgement management
made in calculating the estimate was
reasonable. My substantive procedures
revealed that the extent of estimated readings
were significant, resulting in material
adjustment journals post year end and
amendments in the annual financial statements.
I was thereafter satisfied that the revenue
recognised was fairly stated.
Emphasis of matters
7. I draw attention to the matter below. My opinion is not modified in respect of these matters
271
Restatement of corresponding figures
8. As disclosed in note 49 to the consolidated and separate financial statements, the
corresponding figures for 30 June 2017 have been restated as a result of errors discovered in
the consolidated and separate financial statements of the municipality for the year ended 30
June 2018.
Material uncertainties
9. With reference to note 48 to the consolidated and separate financial statements, the
municipality is a defendant in various lawsuits. The outcome of these matters cannot
presently be determined and/or reliably measured; therefore, no provision for any liabilities
that may result has been made in the financial statements.
Material impairments
10. As disclosed in note 10 to the consolidated and separate financial statements, the consumer
debtors’ balance has been significantly impaired. The allowance for impairment of consumer
debtors amounts to R16 068 158 000 (2016-17:R13 379 501) which represents 73,3% (2016-
17: 74,9%) of total consumer debtors. The contribution to the provision for debt impairment
was R3 162 718 000 (2016-17:R4 596 297 000).
Material electricity losses
11. As disclosed in note 42 to the consolidated and separate financial statements, material
electricity losses of R2 508 683 000 (2016-17: R1 970 946 000) was incurred, which represents
24,2% (2016-17: 18,4%) of total electricity purchased. Technical losses amounted to R970 859
000 (2016-17: R878 234 000) and was due to energy lost in the transportation of electricity
from the point of supply to point of distribution through dissipation as useless heat. Non-
technical losses amounted to R1 537 824 000 (2016-17: R1 092 712 000) and were due to theft
and bypass of meters, illegal recalibration of meters, damaged meters and faulty voltage and
current transformers, billing errors and customers without meters.
Other matter
12. I draw attention to the matter below. My opinion is not modified in respect of this matter.
Unaudited disclosure notes
13. In terms of section 125(2)(e) of the MFMA, the municipality is required to disclose particulars
of non-compliance with the MFMA in the financial statements. This disclosure requirement
272
did not form part of the audit of the financial statements and, accordingly, I do not express an
opinion thereon.
Responsibilities of the accounting officer for the financial statements
14. The accounting officer is responsible for the preparation and fair presentation of the
consolidated and separate financial statements in accordance with the SA Standards of GRAP,
and the requirements of the MFMA and DoRA, and for such internal control as the accounting
officer determines is necessary to enable the preparation of financial statements that are free
from material misstatement, whether due to fraud or error.
15. In preparing the separate financial statements, the accounting officer is responsible for
assessing the CJMM’s ability to continue as a going concern, disclosing, as applicable, matters
relating to going concern and using the going concern basis of accounting unless the
appropriate governance structure either intends to liquidate the municipality or to cease
operations, or has no realistic alternative but to do so.
Auditor-general’s responsibilities for the audit of the financial statements
16. My objectives are to obtain reasonable assurance about whether the financial statements as
a whole are free from material misstatement, whether due to fraud or error, and to issue an
auditor’s report that includes my opinion. Reasonable assurance is a high level of assurance,
but is not a guarantee that an audit conducted in accordance with the ISAs will always detect
a material misstatement when it exists. Misstatements can arise from fraud or error and are
considered material if, individually or in the aggregate, they could reasonably be expected to
influence the economic decisions of users taken on the basis of these financial statements.
17. A further description of my responsibilities for the audit of the financial statements is included
in the annexure to this auditor’s report.
7.2 Report on the audit of the annual performance report
Introduction and scope
18. In accordance with the Public Audit Act of South Africa, 2004 (Act No. 25 of 2004) (PAA) and
the general notice issued in terms thereof, I have a responsibility to report material findings
on the reported performance information against predetermined objectives for selected
programmes presented in the annual performance report. I performed procedures to identify
findings but not to gather evidence to express assurance.
19. My procedures address the reported performance information, which must be based on the
approved performance planning documents of the municipality. I have not evaluated the
completeness and appropriateness of the performance indicators included in the planning
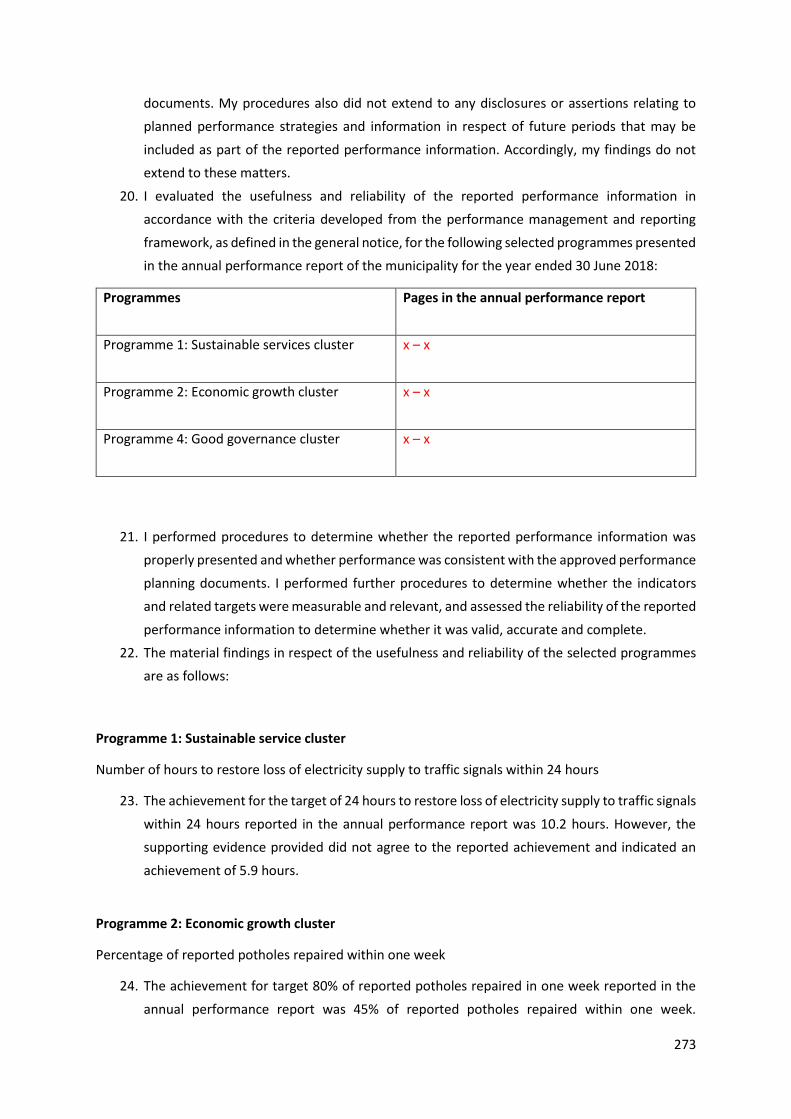
273
documents. My procedures also did not extend to any disclosures or assertions relating to
planned performance strategies and information in respect of future periods that may be
included as part of the reported performance information. Accordingly, my findings do not
extend to these matters.
20. I evaluated the usefulness and reliability of the reported performance information in
accordance with the criteria developed from the performance management and reporting
framework, as defined in the general notice, for the following selected programmes presented
in the annual performance report of the municipality for the year ended 30 June 2018:
Programmes
Pages in the annual performance report
Programme 1: Sustainable services cluster
x – x
Programme 2: Economic growth cluster
x – x
Programme 4: Good governance cluster
x – x
21. I performed procedures to determine whether the reported performance information was
properly presented and whether performance was consistent with the approved performance
planning documents. I performed further procedures to determine whether the indicators
and related targets were measurable and relevant, and assessed the reliability of the reported
performance information to determine whether it was valid, accurate and complete.
22. The material findings in respect of the usefulness and reliability of the selected programmes
are as follows:
Programme 1: Sustainable service cluster
Number of hours to restore loss of electricity supply to traffic signals within 24 hours
23. The achievement for the target of 24 hours to restore loss of electricity supply to traffic signals
within 24 hours reported in the annual performance report was 10.2 hours. However, the
supporting evidence provided did not agree to the reported achievement and indicated an
achievement of 5.9 hours.
Programme 2: Economic growth cluster
Percentage of reported potholes repaired within one week
24. The achievement for target 80% of reported potholes repaired in one week reported in the
annual performance report was 45% of reported potholes repaired within one week.
274
However, the supporting evidence provided did not agree to the reported achievement as it
was not complete and the actual achievement could not be determined.
Programme 4: Good governance cluster
Percentage of clearance of rates certificates issued within 30 days of application being received
25. I was unable to obtain sufficient appropriate audit evidence for the reported achievement of
the target 100% of clearance of rates certificates issued within 30 days of application being
received. This was due to limitations on the scope of my work. Management could not provide
all the supporting evidence for audit. I was unable to obtain sufficient appropriate evidence
for the reported actual evidence. Consequently, I was unable to determine whether any
adjustments were required to the reported achievement of 84%.
Percentage of investigative matters resolved
26. The achievement for target 50% of investigated matters resolved reported in the
annual performance report was 28% of investigated matters resolved. However, the
supporting evidence provided did not agree to the reported achievement and the
actual achievement could not be determined.
Other matters
27. I draw attention to the matters below.
Achievement of planned targets
28. Refer to the annual performance report on pages x to x for information on the achievement
of planned targets for the year. This information should be considered in the context of the
material findings on the reliability of the reported performance information in paragraphs 22
to 26 of this report.
Adjustment of material misstatements
29. I identified material misstatements in the annual performance report submitted for auditing.
These material misstatements were on the reported performance information of the
following programmes:
Programme 1: Sustainable services cluster
Programme 2: Economic growth
Programme 4: Good governance cluster
30. As management subsequently corrected only some of the misstatements, I raised material
findings on the reliability of the reported performance information. Those that were not
corrected are reported above.
275
7.3 Report on the audit of compliance with legislation
Introduction and scope
31. In accordance with the PAA and the general notice issued in terms thereof, I have a
responsibility to report material findings on the compliance of the municipality with specific
matters in key legislation. I performed procedures to identify findings but not to gather
evidence to express assurance.
32. The material findings on compliance with specific matters in key legislations are as follows:
Annual financial statements
33. The financial statements submitted for auditing were not prepared in all material respects in
accordance with the requirements of section 122 of the MFMA. Material misstatements of
assets, liabilities, expenditure and disclosure items identified by the auditors in the submitted
financial statements were subsequently corrected, resulting in the financial statements
receiving an unqualified audit opinion.
Expenditure management
34. Money owed by the municipality was not always paid within 30 days, as required by section
65(2)(e) of the MFMA.
35. Reasonable steps were not taken to prevent irregular expenditure, as required by section
62(1)(d) of the MFMA. The value of R5 000 465 as disclosed in note 55 of the financial
statements is still being assessed to quantify the full extent of the irregular expenditure. The
majority of the disclosed irregular expenditure was caused by non-compliance with the
Municipal Supply Chain Management Regulations (SCM regulation) on the fleet contract.
36. Reasonable steps were not taken to prevent unauthorised expenditure of R435 476 000, as
disclosed in note 52 of the financial statements, in contravention of section 62(1)(d) of the
MFMA.
Consequence management
37. Some of the unauthorised, irregular and fruitless and wasteful expenditure incurred by the
municipality was not investigated to determine if any person is liable for the expenditure, as
required by section 32(2)(a) and (b) of the MFMA.
276
Assets management
38. Investments were made in Citi Bank, Deutsche Bank, Land and Agricultural Development Bank
of South Africa, Trans-Caledon Tunnel Authority and STANLIB, in contravention of municipal
investment regulation 6.
Revenue management
39. An effective system of internal control for debtors and revenue was not in place, as required
by section 97(i) of the MFMA.
Procurement and contract management
40. Some of the goods and services with a transaction value of below R200 000 were procured
without obtaining the required price quotations, in contravention of by SCM regulation 17(a)
and (c). Similar non-compliance was also reported in the prior year.
41. Some of the goods and services of a transaction value above R200 000 were procured without
inviting competitive bids, as required by SCM regulation 19(a). Deviations were approved by
the accounting officer even though it was not impractical to invite competitive bids, in
contravention of SCM regulation 36(1). Similar non-compliance was also reported in the prior
year. The majority of this non-compliance was identified in the procurement processes for IT
services.
42. Some of the contracts and quotations were awarded to bidders based on preference points
that were not allocated and/or calculated in accordance with the requirements of the
Preferential Procurement Policy Framework Act, 2000 (Act No. 5 of 2000) and its regulations.
Similar non-compliance was also reported in the prior year.
43. Some of the competitive bids were adjudicated by a bid adjudication committee that was not
composed in accordance with SCM regulation 29(2).
44. The performance of some of the contractors or service providers was not monitored on a
monthly basis, as required by section 116(2)(b) of the MFMA.
45. The contract performance and monitoring measures and methods were insufficient to ensure
effective contract management, in contravention of section 116(2)(c) of the MFMA. Similar
non-compliance was also reported in the prior year.
46. Persons in service of the municipality whose close family members had a private or business
interest in contracts awarded by the municipality failed to disclose such interest, in
contravention of SCM regulation 46(2)(e) and the code of conduct for staff members issued
in terms of the MSA. Similar non-compliance was also reported in the prior year.
277
Other information
47. The accounting officer is responsible for the other information. The other information
comprises the information included in the annual report which includes the accounting officer
report and the audit committee’s report. The other information does not include the financial
statements, the auditor’s report and those selected presented in the annual performance
report that have been specifically reported on in the auditor’s report.
48. My opinion on the financial statements and findings on the reported performance information
and compliance with legislation do not cover the other information and I do not express an
audit opinion or any form of assurance conclusion thereon.
49. In connection with my audit, my responsibility is to read the other information and, in doing
so, consider whether the other information is materially inconsistent with the financial
statements and the selected programmes presented in the annual performance report, or my
knowledge obtained in the audit, or otherwise appears to be materially misstated.
50. I did not receive the other information prior to the date of this auditor’s report. When I do
receive and read this information, if I conclude that there is a material misstatement therein,
I am required to communicate the matter to those charged with governance and request that
the other information be corrected. If the other information is not corrected, I may have to
retract this auditor’s report and re-issue an amended report as appropriate, however, if it is
corrected this will not be necessary.
7.4 Internal control deficiencies
51. I considered internal control relevant to my audit of the financial statements, reported
performance information and compliance with applicable legislation; however, my objective
was not to express any form of assurance thereon. The matters reported below are limited to
the significant internal control deficiencies that resulted in the findings on the annual
performance report and the findings on compliance with legislation included in this report.
52. The accounting officer did not adequately exercise oversight responsibility regarding financial
and performance reporting and compliance with legislation. The municipality did not have
sufficient monitoring and reviewing controls to ensure that financial and performance reports
submitted for audit were accurate and complete and that action plans developed were
adequately and timeously implemented.
53. Senior management lacked the necessary control disciplines over financial and performance
reporting and compliance with key legislation. As a result, there were inadequate year-end
reconciliations, a lack of review of reports and a lack of monitoring over proper control
implementation. Furthermore, there was a lack of a proper records management system that
could support the information reported in the financial statements and the annual
278
performance report and as a result material errors and omissions were identified during the
audit process.
54. Internal audit processes did not always identify internal control deficiencies and recommend
appropriate corrective action effectively and timeously. This resulted in significant and
recurring control deficiencies relating to the preparation of the annual financial and
performance reports and compliance with legislation.
7.5 Other reports
55. I draw attention to the following engagements conducted by various parties that had, or could
have, an impact on the matters reported in the municipality’s financial statements, reported
performance information, compliance with applicable legislation and other related matters.
These reports did not form part of my opinion on the financial statements or my findings on
the reported performance information or compliance with legislation.
56. Eight hundred and sixty-nine cases of alleged irregularities relating to financial misconduct,
fraudulent acts, theft and non-compliance were investigated during the financial year. The
majority of these cases were investigated internally by the municipality’s forensic department.
All these investigations relate to irregularities identified prior to 2016/17 financial year. None
of the irregularities incurred in the prior year have been investigated.
Johannesburg
31 December 2018

279
Annexure A: Annual Financial Statements
280
Annexure B: Auditor-General’s responsibility for the audit
1. As part of an audit in accordance with the ISAs, I exercise professional judgement and maintain
professional scepticism throughout my audit of the consolidated and separate financial statements,
and the procedures performed on reported performance information for selected programmes and
on the group’s compliance with respect to the selected subject matters.
Financial statements
2. In addition to my responsibility for the audit of the consolidated and separate financial statements
as described in the auditor’s report, I also:
identify and assess the risks of material misstatement of the consolidated and separate
financial statements whether due to fraud or error, design and perform audit procedures
responsive to those risks, and obtain audit evidence that is sufficient and appropriate to
provide a basis for my opinion. The risk of not detecting a material misstatement resulting
from fraud is higher than for one resulting from error, as fraud may involve collusion, forgery,
intentional omissions, misrepresentations, or the override of internal control.
obtain an understanding of internal control relevant to the audit in order to design audit
procedures that are appropriate in the circumstances, but not for the purpose of expressing
an opinion on the effectiveness of the group’s internal control.
evaluate the appropriateness of accounting policies used and the reasonableness of
accounting estimates and related disclosures made by the accounting officer.
conclude on the appropriateness of the accounting officer’s use of the going concern basis of
accounting in the preparation of the consolidated and separate financial statements. I also
conclude, based on the audit evidence obtained, whether a material uncertainty exists related
to events or conditions that may cast significant doubt on the CJMM’s ability to continue as a
going concern. If I conclude that a material uncertainty exists, I am required to draw attention
in my auditor’s report to the related disclosures in the financial statements about the material
uncertainty or, if such disclosures are inadequate, to modify the opinion on the consolidated
and separate financial statements. My conclusions are based on the information available to
me at the date of the auditor’s report. However, future events or conditions may cause a
group to cease to continue as a going concern.
evaluate the overall presentation, structure and content of the consolidated and separate
financial statements, including the disclosures, and whether the consolidated and separate
financial statements represent the underlying transactions and events in a manner that
achieves fair presentation.
obtain sufficient appropriate audit evidence regarding the financial information of the entities
or business activities within the group to express an opinion on the consolidated financial

281
statements. I am responsible for the direction, supervision and performance of the group
audit. I remain solely responsible for my audit opinion
Communication with those charged with governance
3. I communicate with the accounting officer regarding, among other matters, the planned scope and
timing of the audit and significant audit findings, including any significant deficiencies in internal
control that I identify during my audit.
4. I also confirm to the accounting officer that I have complied with relevant ethical requirements
regarding independence, and communicate all relationships and other matters that may reasonably
be thought to have a bearing on my independence and where applicable, related safeguards.
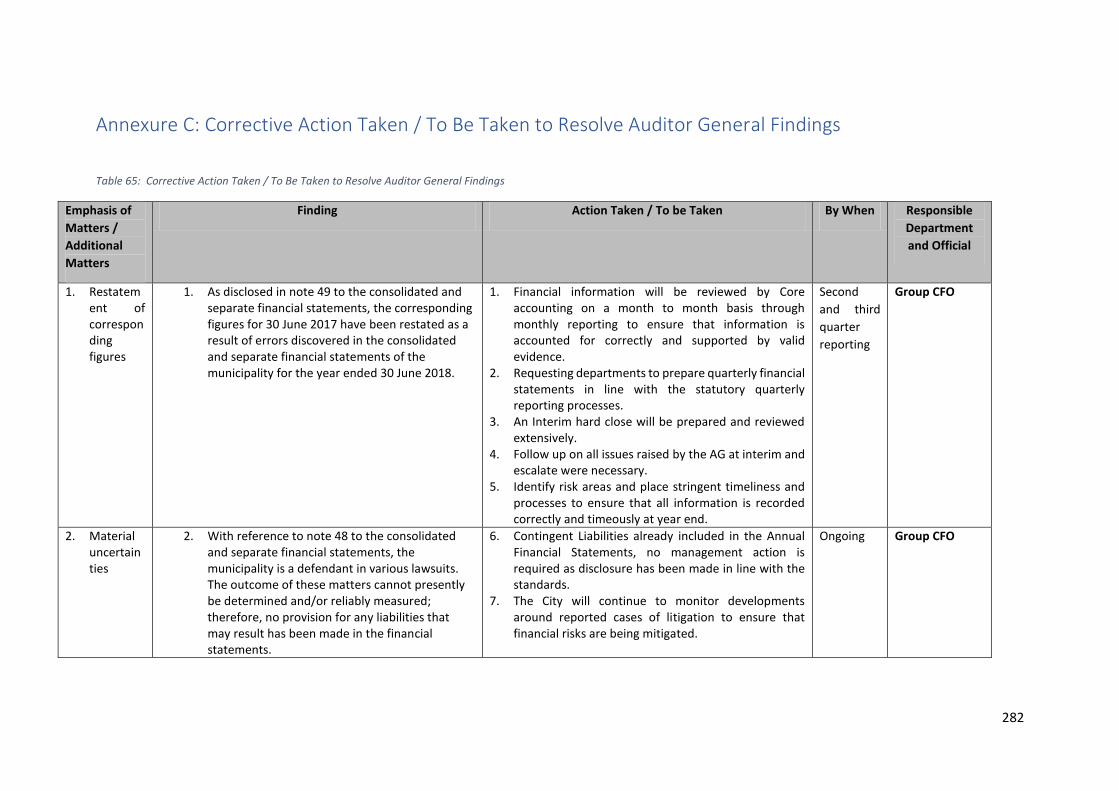
282
Annexure C: Corrective Action Taken / To Be Taken to Resolve Auditor General Findings
Table 65: Corrective Action Taken / To Be Taken to Resolve Auditor General Findings
Emphasis of
Matters /
Additional
Matters
Finding Action Taken / To be Taken By When Responsible
Department
and Official
1. Restatement of corresponding figures
1. As disclosed in note 49 to the consolidated and separate financial statements, the corresponding figures for 30 June 2017 have been restated as a result of errors discovered in the consolidated and separate financial statements of the municipality for the year ended 30 June 2018.
1. Financial information will be reviewed by Core accounting on a month to month basis through monthly reporting to ensure that information is accounted for correctly and supported by valid evidence.
2. Requesting departments to prepare quarterly financial statements in line with the statutory quarterly reporting processes.
3. An Interim hard close will be prepared and reviewed extensively.
4. Follow up on all issues raised by the AG at interim and escalate were necessary.
5. Identify risk areas and place stringent timeliness and processes to ensure that all information is recorded correctly and timeously at year end.
Second
and third
quarter
reporting
Group CFO
2. Material uncertainties
2. With reference to note 48 to the consolidated and separate financial statements, the municipality is a defendant in various lawsuits. The outcome of these matters cannot presently be determined and/or reliably measured; therefore, no provision for any liabilities that may result has been made in the financial statements.
6. Contingent Liabilities already included in the Annual Financial Statements, no management action is required as disclosure has been made in line with the standards.
7. The City will continue to monitor developments around reported cases of litigation to ensure that financial risks are being mitigated.
Ongoing Group CFO
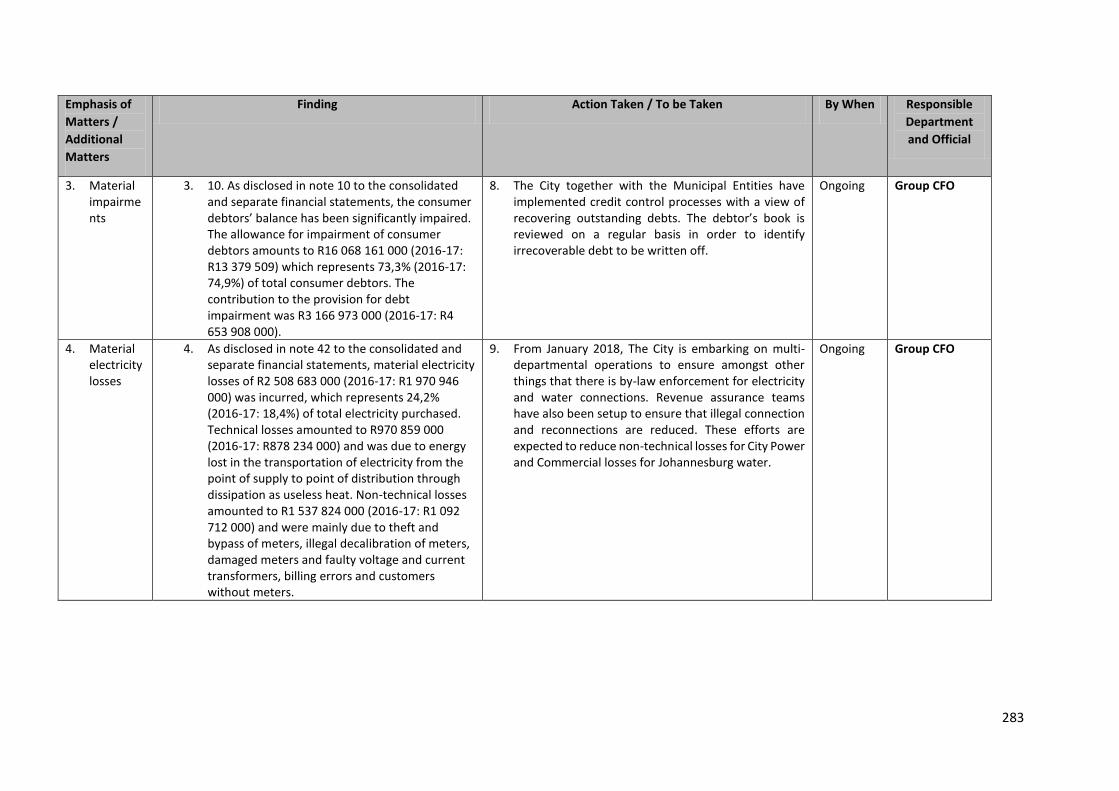
283
Emphasis of
Matters /
Additional
Matters
Finding Action Taken / To be Taken By When Responsible
Department
and Official
3. Material impairments
3. 10. As disclosed in note 10 to the consolidated and separate financial statements, the consumer debtors’ balance has been significantly impaired. The allowance for impairment of consumer debtors amounts to R16 068 161 000 (2016-17: R13 379 509) which represents 73,3% (2016-17: 74,9%) of total consumer debtors. The contribution to the provision for debt impairment was R3 166 973 000 (2016-17: R4 653 908 000).
8. The City together with the Municipal Entities have implemented credit control processes with a view of recovering outstanding debts. The debtor’s book is reviewed on a regular basis in order to identify irrecoverable debt to be written off.
Ongoing Group CFO
4. Material electricity losses
4. As disclosed in note 42 to the consolidated and separate financial statements, material electricity losses of R2 508 683 000 (2016-17: R1 970 946 000) was incurred, which represents 24,2% (2016-17: 18,4%) of total electricity purchased. Technical losses amounted to R970 859 000 (2016-17: R878 234 000) and was due to energy lost in the transportation of electricity from the point of supply to point of distribution through dissipation as useless heat. Non-technical losses amounted to R1 537 824 000 (2016-17: R1 092 712 000) and were mainly due to theft and bypass of meters, illegal decalibration of meters, damaged meters and faulty voltage and current transformers, billing errors and customers without meters.
9. From January 2018, The City is embarking on multi-departmental operations to ensure amongst other things that there is by-law enforcement for electricity and water connections. Revenue assurance teams have also been setup to ensure that illegal connection and reconnections are reduced. These efforts are expected to reduce non-technical losses for City Power and Commercial losses for Johannesburg water.
Ongoing Group CFO
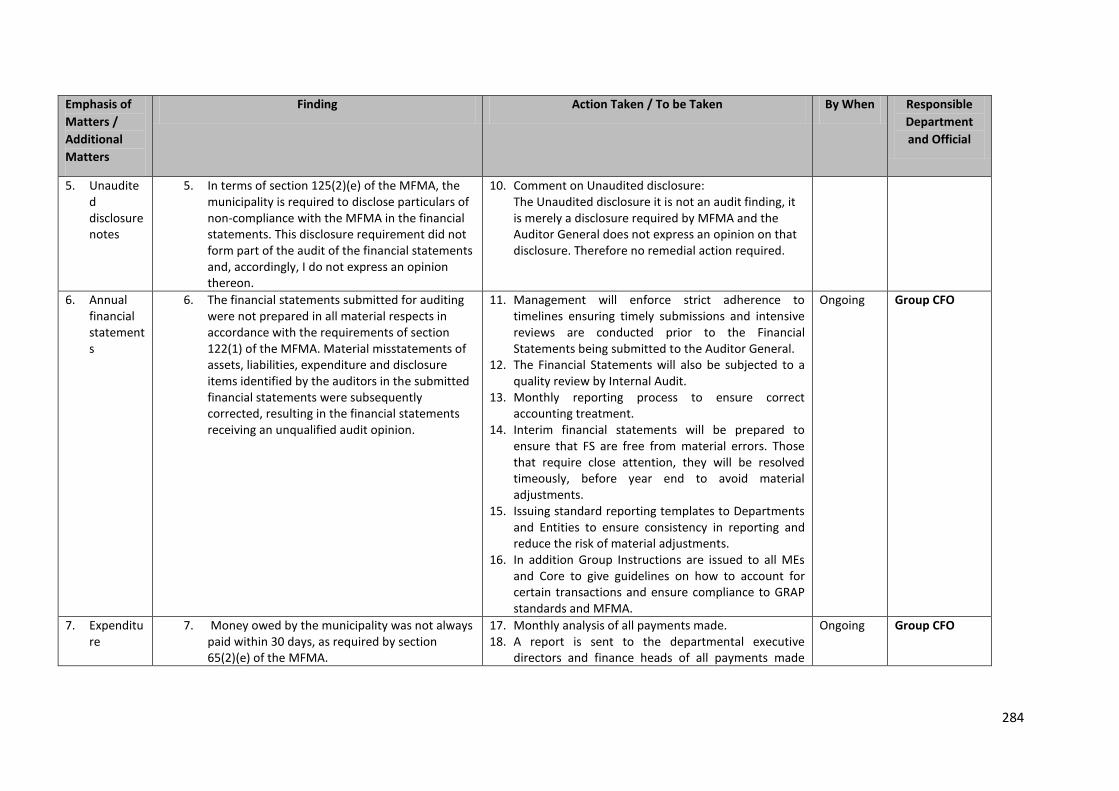
284
Emphasis of
Matters /
Additional
Matters
Finding Action Taken / To be Taken By When Responsible
Department
and Official
5. Unaudited disclosure notes
5. In terms of section 125(2)(e) of the MFMA, the municipality is required to disclose particulars of non-compliance with the MFMA in the financial statements. This disclosure requirement did not form part of the audit of the financial statements and, accordingly, I do not express an opinion thereon.
10. Comment on Unaudited disclosure: The Unaudited disclosure it is not an audit finding, it is merely a disclosure required by MFMA and the Auditor General does not express an opinion on that disclosure. Therefore no remedial action required.
6. Annual financial statements
6. The financial statements submitted for auditing were not prepared in all material respects in accordance with the requirements of section 122(1) of the MFMA. Material misstatements of assets, liabilities, expenditure and disclosure items identified by the auditors in the submitted financial statements were subsequently corrected, resulting in the financial statements receiving an unqualified audit opinion.
11. Management will enforce strict adherence to timelines ensuring timely submissions and intensive reviews are conducted prior to the Financial Statements being submitted to the Auditor General.
12. The Financial Statements will also be subjected to a quality review by Internal Audit.
13. Monthly reporting process to ensure correct accounting treatment.
14. Interim financial statements will be prepared to ensure that FS are free from material errors. Those that require close attention, they will be resolved timeously, before year end to avoid material adjustments.
15. Issuing standard reporting templates to Departments and Entities to ensure consistency in reporting and reduce the risk of material adjustments.
16. In addition Group Instructions are issued to all MEs and Core to give guidelines on how to account for certain transactions and ensure compliance to GRAP standards and MFMA.
Ongoing Group CFO
7. Expenditure
7. Money owed by the municipality was not always paid within 30 days, as required by section 65(2)(e) of the MFMA.
17. Monthly analysis of all payments made. 18. A report is sent to the departmental executive
directors and finance heads of all payments made
Ongoing Group CFO
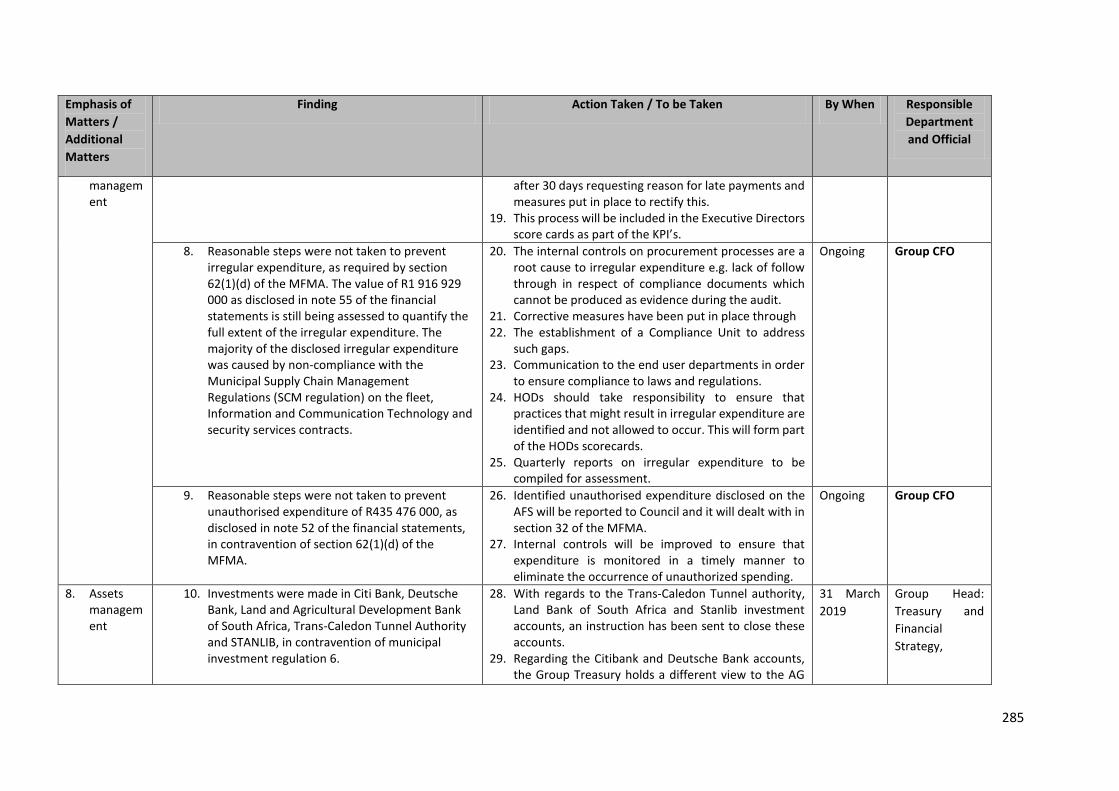
285
Emphasis of
Matters /
Additional
Matters
Finding Action Taken / To be Taken By When Responsible
Department
and Official
management
after 30 days requesting reason for late payments and measures put in place to rectify this.
19. This process will be included in the Executive Directors score cards as part of the KPI’s.
8. Reasonable steps were not taken to prevent irregular expenditure, as required by section 62(1)(d) of the MFMA. The value of R1 916 929 000 as disclosed in note 55 of the financial statements is still being assessed to quantify the full extent of the irregular expenditure. The majority of the disclosed irregular expenditure was caused by non-compliance with the Municipal Supply Chain Management Regulations (SCM regulation) on the fleet, Information and Communication Technology and security services contracts.
20. The internal controls on procurement processes are a root cause to irregular expenditure e.g. lack of follow through in respect of compliance documents which cannot be produced as evidence during the audit.
21. Corrective measures have been put in place through 22. The establishment of a Compliance Unit to address
such gaps. 23. Communication to the end user departments in order
to ensure compliance to laws and regulations. 24. HODs should take responsibility to ensure that
practices that might result in irregular expenditure are identified and not allowed to occur. This will form part of the HODs scorecards.
25. Quarterly reports on irregular expenditure to be compiled for assessment.
Ongoing Group CFO
9. Reasonable steps were not taken to prevent unauthorised expenditure of R435 476 000, as disclosed in note 52 of the financial statements, in contravention of section 62(1)(d) of the MFMA.
26. Identified unauthorised expenditure disclosed on the AFS will be reported to Council and it will dealt with in section 32 of the MFMA.
27. Internal controls will be improved to ensure that expenditure is monitored in a timely manner to eliminate the occurrence of unauthorized spending.
Ongoing Group CFO
8. Assets management
10. Investments were made in Citi Bank, Deutsche Bank, Land and Agricultural Development Bank of South Africa, Trans-Caledon Tunnel Authority and STANLIB, in contravention of municipal investment regulation 6.
28. With regards to the Trans-Caledon Tunnel authority, Land Bank of South Africa and Stanlib investment accounts, an instruction has been sent to close these accounts.
29. Regarding the Citibank and Deutsche Bank accounts, the Group Treasury holds a different view to the AG
31 March
2019
Group Head:
Treasury and
Financial
Strategy,

286
Emphasis of
Matters /
Additional
Matters
Finding Action Taken / To be Taken By When Responsible
Department
and Official
finding, which was explained to the auditors, but discarded. Section 7 (3)(b) of the MFMA reads: “a municipality may not open a bank account with an institution not registered in terms of the Banks Act (Act 94 of 1990). Both Citibank and Deutsche Bank are duly registered and have valid banking licenses as issued by the South African Reserve Bank. The basis of the finding is premised on these institutions being local branches of foreign-owned banks, which the MFMA is silent on. The requirement as per legislation is that the banks must be licensed and registered with the SARB, which both are.
Sinovuyo
Mpakama
9. Revenue management
11. 39. An effective system of internal control for debtors and revenue for the entities was not in place, as required by section 97(i) of the MFMA.
30. At Group level the City is able to adequately manage, account and report on revenue when it is earned.
31. A decision was taken at the Mayoral Lekgotla to move the billing function to MEs to ensure that there is accountability for revenue earned at that level.
Ongoing Group CFO
10. Procurement and contract management
12. Some of the goods and services with a transaction value of below R200 000 were procured without obtaining the required price quotations, in contravention of by SCM regulation 17(a) and (c). Similar non-compliance was also reported in the prior year municipality failed to disclose such interest, in contravention of SCM regulation 46(2)(e) and the code of conduct for staff members issued in terms of the MSA. Similar non-compliance was also reported in the prior year.
32. This finding is as a result of instances where 3 quotations were requested but 1 or 2 quotations were received. The checklist will be amended to include proof of quotations requested. Requesting additional quotation will put the City at risk of quotations manipulation.
In instances where the staff members failed do
declare interests such are referred to Forensic
unit for further investigation and actioning.
33. A practice note and checklist will be re - issued to all User Departments for the utilisation of all requirements below R200 000 threshold.
Ongoing Group CFO
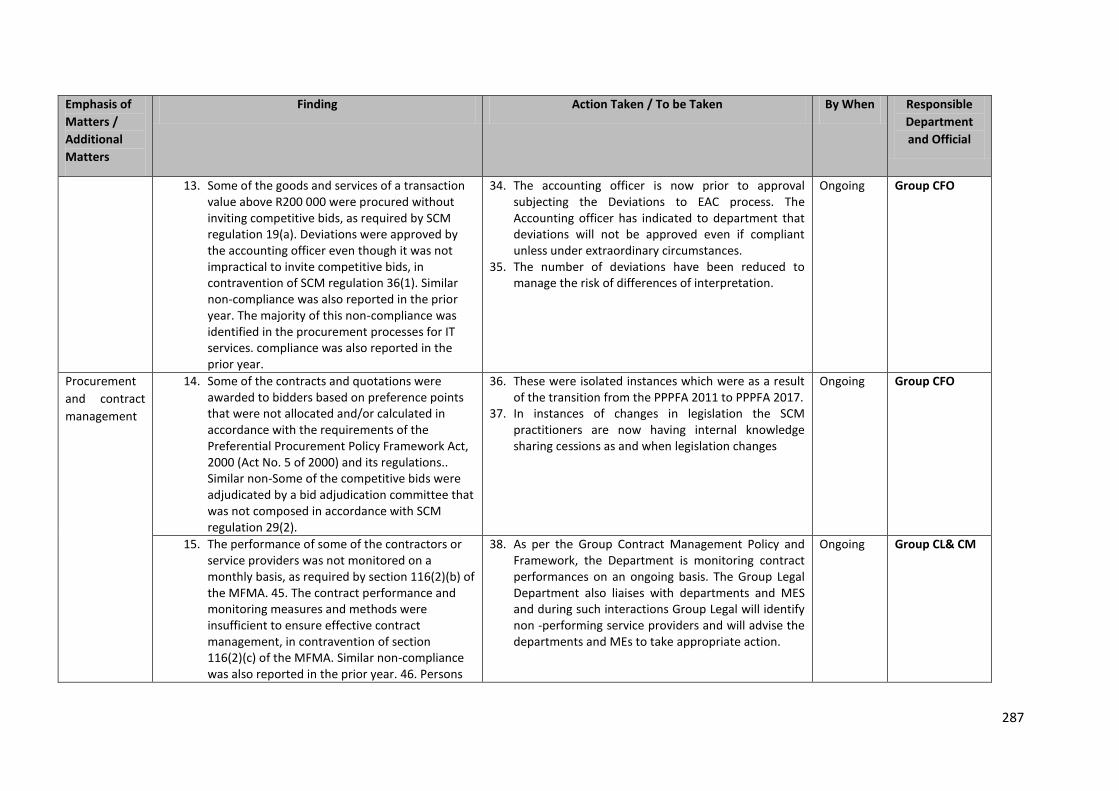
287
Emphasis of
Matters /
Additional
Matters
Finding Action Taken / To be Taken By When Responsible
Department
and Official
13. Some of the goods and services of a transaction value above R200 000 were procured without inviting competitive bids, as required by SCM regulation 19(a). Deviations were approved by the accounting officer even though it was not impractical to invite competitive bids, in contravention of SCM regulation 36(1). Similar non-compliance was also reported in the prior year. The majority of this non-compliance was identified in the procurement processes for IT services. compliance was also reported in the prior year.
34. The accounting officer is now prior to approval subjecting the Deviations to EAC process. The Accounting officer has indicated to department that deviations will not be approved even if compliant unless under extraordinary circumstances.
35. The number of deviations have been reduced to manage the risk of differences of interpretation.
Ongoing Group CFO
Procurement
and contract
management
14. Some of the contracts and quotations were awarded to bidders based on preference points that were not allocated and/or calculated in accordance with the requirements of the Preferential Procurement Policy Framework Act, 2000 (Act No. 5 of 2000) and its regulations.. Similar non-Some of the competitive bids were adjudicated by a bid adjudication committee that was not composed in accordance with SCM regulation 29(2).
36. These were isolated instances which were as a result of the transition from the PPPFA 2011 to PPPFA 2017.
37. In instances of changes in legislation the SCM practitioners are now having internal knowledge sharing cessions as and when legislation changes
Ongoing Group CFO
15. The performance of some of the contractors or service providers was not monitored on a monthly basis, as required by section 116(2)(b) of the MFMA. 45. The contract performance and monitoring measures and methods were insufficient to ensure effective contract management, in contravention of section 116(2)(c) of the MFMA. Similar non-compliance was also reported in the prior year. 46. Persons
38. As per the Group Contract Management Policy and Framework, the Department is monitoring contract performances on an ongoing basis. The Group Legal Department also liaises with departments and MES and during such interactions Group Legal will identify non -performing service providers and will advise the departments and MEs to take appropriate action.
Ongoing Group CL& CM
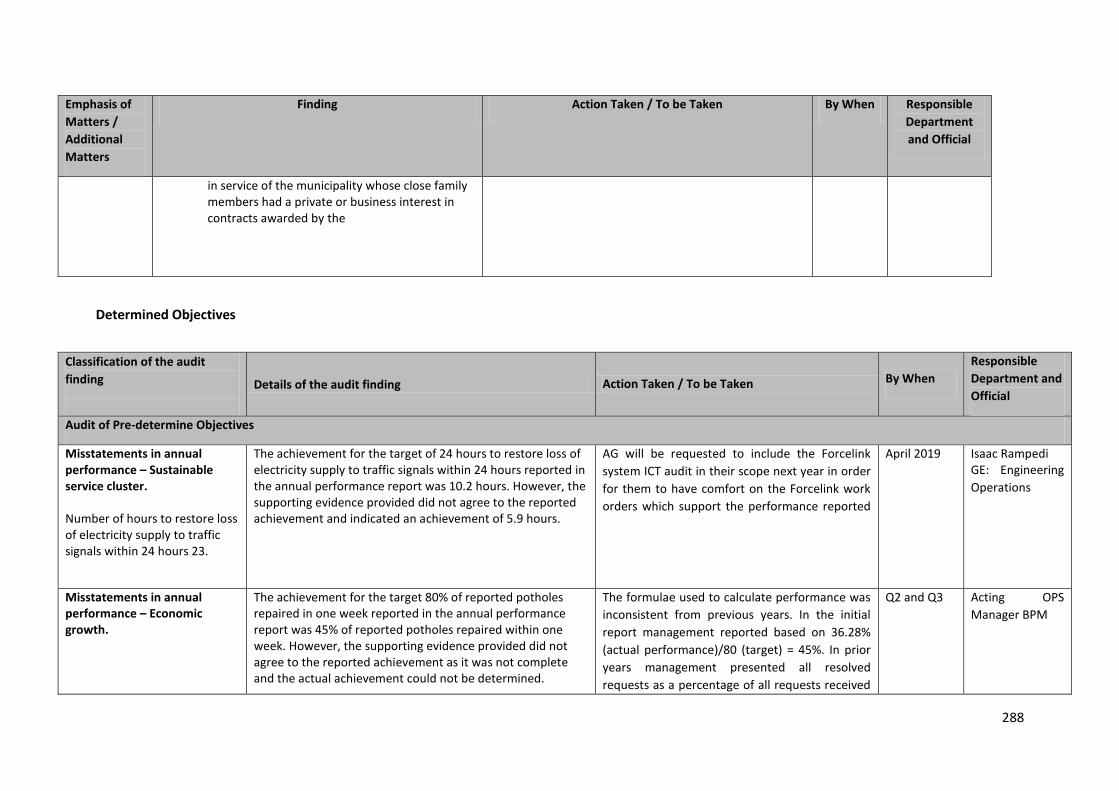
288
Emphasis of
Matters /
Additional
Matters
Finding Action Taken / To be Taken By When Responsible
Department
and Official
in service of the municipality whose close family members had a private or business interest in contracts awarded by the
Determined Objectives
Classification of the audit
finding
Details of the audit finding Action Taken / To be Taken By When
Responsible
Department and
Official
Audit of Pre-determine Objectives
Misstatements in annual performance – Sustainable service cluster. Number of hours to restore loss of electricity supply to traffic signals within 24 hours 23.
The achievement for the target of 24 hours to restore loss of electricity supply to traffic signals within 24 hours reported in the annual performance report was 10.2 hours. However, the supporting evidence provided did not agree to the reported achievement and indicated an achievement of 5.9 hours.
AG will be requested to include the Forcelink
system ICT audit in their scope next year in order
for them to have comfort on the Forcelink work
orders which support the performance reported
April 2019 Isaac Rampedi GE: Engineering
Operations
Misstatements in annual performance – Economic growth.
The achievement for the target 80% of reported potholes repaired in one week reported in the annual performance report was 45% of reported potholes repaired within one week. However, the supporting evidence provided did not agree to the reported achievement as it was not complete and the actual achievement could not be determined.
The formulae used to calculate performance was
inconsistent from previous years. In the initial
report management reported based on 36.28%
(actual performance)/80 (target) = 45%. In prior
years management presented all resolved
requests as a percentage of all requests received
Q2 and Q3 Acting OPS
Manager BPM
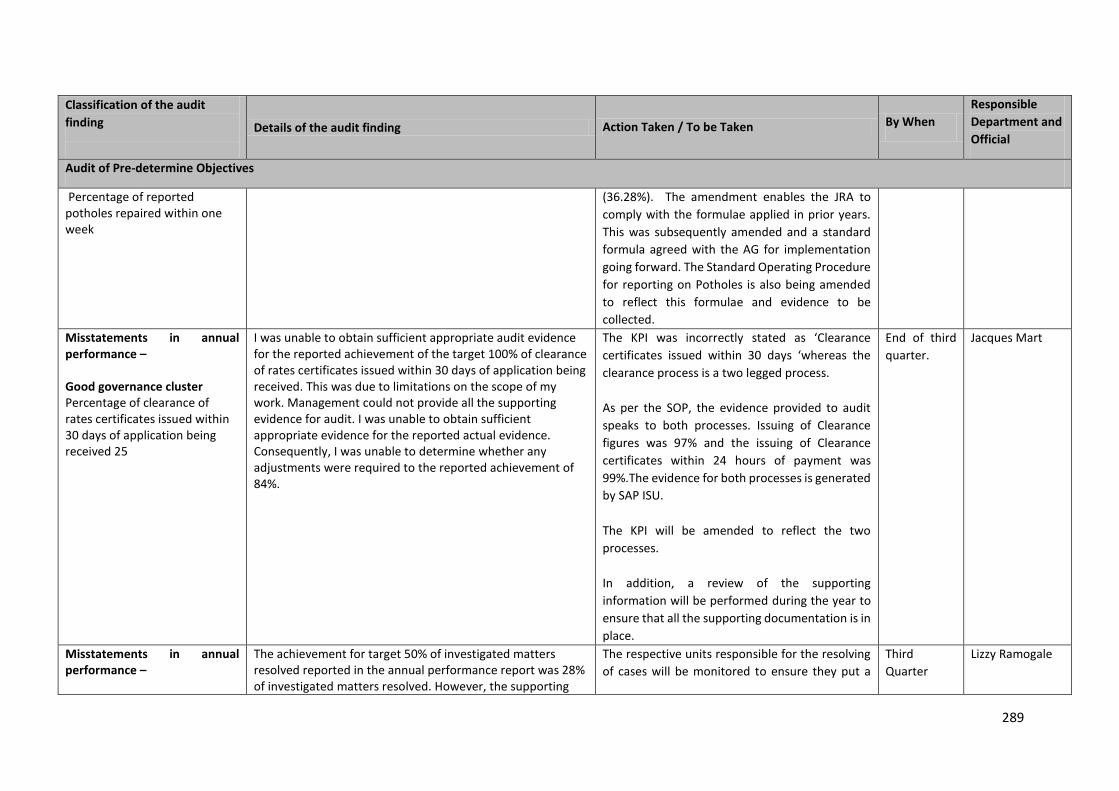
289
Classification of the audit
finding
Details of the audit finding Action Taken / To be Taken By When
Responsible
Department and
Official
Audit of Pre-determine Objectives
Percentage of reported potholes repaired within one week
(36.28%). The amendment enables the JRA to
comply with the formulae applied in prior years.
This was subsequently amended and a standard
formula agreed with the AG for implementation
going forward. The Standard Operating Procedure
for reporting on Potholes is also being amended
to reflect this formulae and evidence to be
collected.
Misstatements in annual performance – Good governance cluster Percentage of clearance of rates certificates issued within 30 days of application being received 25
I was unable to obtain sufficient appropriate audit evidence for the reported achievement of the target 100% of clearance of rates certificates issued within 30 days of application being received. This was due to limitations on the scope of my work. Management could not provide all the supporting evidence for audit. I was unable to obtain sufficient appropriate evidence for the reported actual evidence. Consequently, I was unable to determine whether any adjustments were required to the reported achievement of 84%.
The KPI was incorrectly stated as ‘Clearance
certificates issued within 30 days ‘whereas the
clearance process is a two legged process.
As per the SOP, the evidence provided to audit
speaks to both processes. Issuing of Clearance
figures was 97% and the issuing of Clearance
certificates within 24 hours of payment was
99%.The evidence for both processes is generated
by SAP ISU.
The KPI will be amended to reflect the two
processes.
In addition, a review of the supporting
information will be performed during the year to
ensure that all the supporting documentation is in
place.
End of third
quarter.
Jacques Mart
Misstatements in annual performance –
The achievement for target 50% of investigated matters resolved reported in the annual performance report was 28% of investigated matters resolved. However, the supporting
The respective units responsible for the resolving
of cases will be monitored to ensure they put a
Third
Quarter
Lizzy Ramogale
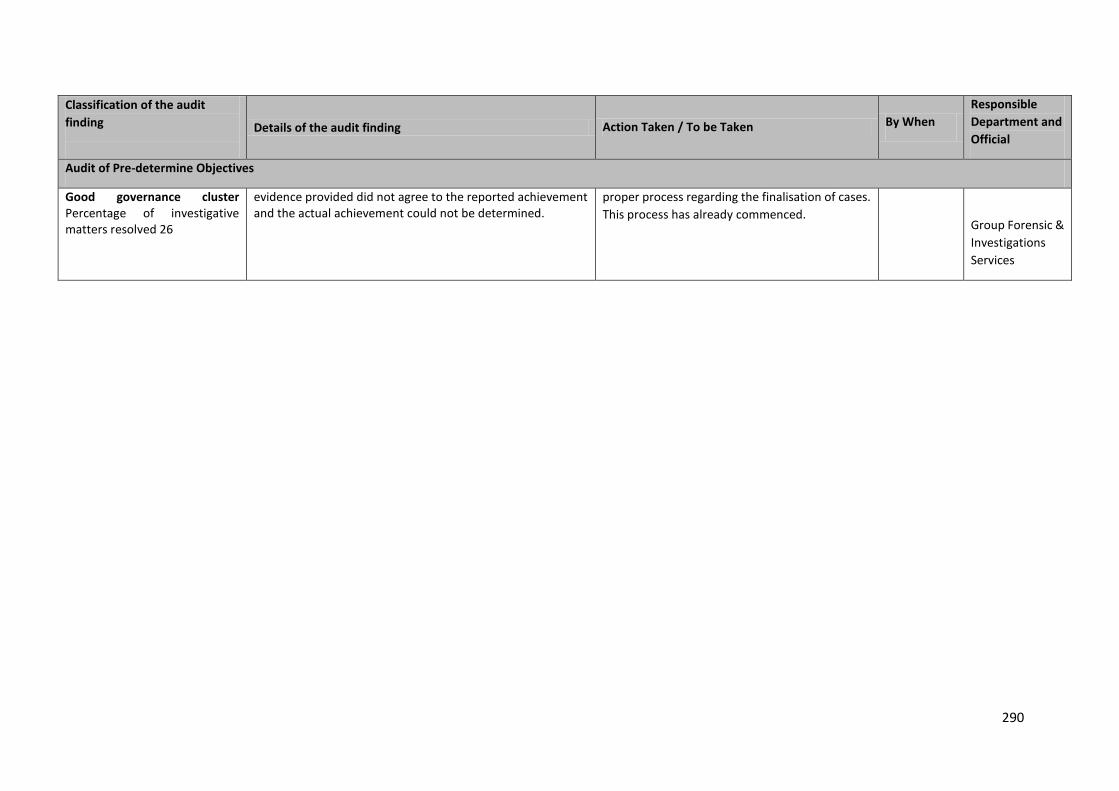
290
Classification of the audit
finding
Details of the audit finding Action Taken / To be Taken By When
Responsible
Department and
Official
Audit of Pre-determine Objectives
Good governance cluster Percentage of investigative matters resolved 26
evidence provided did not agree to the reported achievement and the actual achievement could not be determined.
proper process regarding the finalisation of cases.
This process has already commenced.
Group Forensic &
Investigations
Services

291