Embed Size (px)
Citation preview

CITY OF LONDON I N V E S T M E N T G R O U P P L C
HALF YEAR REPORT 2019/20

Half year summary 1
Chairman’s statement 2
Chief Executive Officer’s review 5
Consolidated income statement 10
Consolidated statement of comprehensive income 10
Consolidated statement of financial position 11
Consolidated statement of changes in equity 12
Consolidated cash flow statement 14
Notes 15
Statement of directors’ responsibilities 25
Independent review report 26
Shareholder information 28
City of London Investment Group PLC is an established asset management group which has built its reputation by specialising in Emerging Market closed-end fund investment, with an institutional client focus.
Over the years the Group has expanded its range to include Developed, Frontier and Opportunistic Value closed-end fund strategies. Its most recent addition, a Real Estate Investment Trust (REIT) strategy, which shares many similarities to the closed-end fund products, launched in January 2019.
Contents
CITY OF LONDON I N V E S T M E N T G R O U P P L C
www.citlon.co.uk

HALF YEAR SUMMARY
City of London Investment Group PLC Half Year Report 2019/20 1
• Funds under Management (FuM) of US$6.0 billion (£4.5 billion) at 31st December 2019. This compares with US$5.4 billion (£4.3 billion) at the beginning of this financial year on 1st July 2019 and US$4.6 billion (£3.6 billion) at 31st December 2018
• FuM at 31st January 2020 of US$5.8 billion (£4.4 billion)
• Revenues representing the Group’s management fees on FuM were £17.3 million (31st December 2018: £15.6 million)
• Profit before tax of £6.3 million (31st December 2018: £5.2 million)
• Increased interim dividend to 10p per share (31st December 2018: 9p) payable on 20th March 2020 to shareholders on the register on 6th March 2020
“Valuations across much of the CEF universe, particularly in the EM space are far from stretched and it is this value protection that gives us cause for relative optimism.”
Barry Aling, Chairman
Jun Jun Jun Jun Dec 16 17 18 19 19
Funds under Management US$bn
6.05.4
5.14.7
4.0
Pre-tax profit £m
First half year Second half year
8.0
11.411.612.8
Jun Jun Jun Jun Dec 16 17 18 19 19
This release includes forward-looking statements, which may differ from actual results. Any forward-looking statements are based on certain factors and assumptions, which may prove incorrect, and are subject to risks, uncertainties and assumptions relating to future events, the Group’s operations, results of operations, growth strategy and liquidity.
6.3

CHAIRMAN’S STATEMENT
2 City of London Investment Group PLC Half Year Report 2019/20
31st December 2019 was a watershed moment in the history of your Company as our founder, Barry Olliff, retired from his executive role on his 75th birthday. In a career that spanned more than 50 years and witnessed massive changes in the structure and operation of equity markets globally, Barry has been a pioneer in the specialist area of closed-end funds (CEFs). Having identified the significant value attractions of CEFs in the Emerging Markets (EM) some 30 years ago, CLIG developed a leading position as an asset manager in the sector and, as these first half results demonstrate, we are beginning to replicate this success in Developed and other segments of the CEF universe, the rewards from which should continue to bear real fruit in the years to come.
While Barry will no longer be involved in the day- to-day management of the firm, the Board has been keen to retain his wise counsel and, following his retirement from the Board in October 2020, he will therefore remain an adviser to the Group until 31st December 2021. I am sure that I speak for all colleagues and shareholders in thanking Barry for his vision and dedication to the CLIG cause and wish him a long and happy retirement. Finally, I would like to assure all stakeholders that the “Olliff DNA”, in terms of an adherence to prudence, transparency and our fiduciary responsibilities will continue to be writ large in everything we do.
Against the background of ongoing US/China trade negotiations and Middle East tensions, the
accommodative G7 monetary stance helped global equity sentiment improve through much of 2019, with a tech-heavy US market leading the way. Having lagged developed markets initially in 2019, emerging markets recorded a relatively strong finish to the year and with a benign inflation outlook and the first phase of a US/China trade deal now completed, the prospects for 2020 appear promising. The artificial stimulus afforded asset markets over recent years through so-called quantitative easing has created its own longer term concerns in terms of some hair-raising equity valuations, notably in the global technology sector, as well as private sector debt leverage. However, in general terms, emerging market ratings are now well below developed markets, with many having the additional protection of strong foreign exchange reserves. Central banks will need to tread very carefully if and when they decide to reverse their balance sheet expansion in order to avoid a crash landing but we continue to believe that the prudent use of closed-end funds, offering assets at a modest discount to their underlying value, will serve investors well over the longer term.
Assets and performance Having established a successful platform as a manager of emerging market assets over many years, the Group has been engaged for some time in the expansion and diversification of its asset base beyond the capacity-constrained EM universe. To do so organically is a slow process as management teams need to build a track record in the newer strategies while ensuring no dilution or weakening in the management of the core product. It was very pleasing therefore that, during 2019, CLIG’s Developed CEF product “came of age” with growth of more than 50% in funds under management (FuM) in the six months to December 2019 to US$1.1 billion. FuM for the Opportunistic Value strategy also grew by 16% to US$270 million, raising diversified products to 26% of total assets.

City of London Investment Group PLC Half Year Report 2019/20 3
We are now embarked on a similar initiative in the REIT sector with two products that were launched at the start of 2019. The strong relative performance of the two strategies over their first year provides a very promising start which will begin to bear fruit in terms of future mandates.
Building a successful asset management business requires many and varied skills and attributes, which can take many years to nurture but arguably, the three most important are performance, performance and performance on behalf of our clients. All fund managers, and the methodology they use to seek relative out-performance, will face difficult periods from which, hopefully, they will learn and improve. In essence, the CLIG approach is to measure and mitigate the risks inherent in equities through the judicious use of CEFs which customarily offer equity exposure at a discount to their underlying value. With the sole exception of the Frontier strategy, this policy helped us materially outperform across the entire product range in the six months to December 2019, adding valuable alpha to our longer term track record. Over the six-month period, total FuM grew by 12% to US$6.0 billion and, with a healthy forward pipeline of new inflows, the prospects for further growth in 2020 are encouraging.
Results Comparative year-on-year results for the first half have been flattered somewhat by the strong headwinds that confronted equity markets in the closing months of 2018. Nevertheless, stronger equity markets and healthy net inflows to Group FuM were the key factors in recording a 23% YOY increase in unaudited pre-tax profits to £6.3 million for the six-month period to 31st December 2019. Although the emerging market strategy continued to form the core asset base of the business, record inflows to our developed products provided an important and growing contribution.
As noted previously our revenue margins on the newer developed strategies are somewhat lower than traditional EM but it is pleasing to note that the overall blended margin fell only slightly in the period to 75 basis points, a level which continues to offer healthy returns.
Gross revenues rose by 11% to £17.3 million and as a result of a continuing decline in commissions payable to third parties, net fee income rose by 13% to £16.4 million. Despite a 24% increase in the Employee Incentive Plan (EIP) charge to £0.5 million, total administrative expenses rose by a modest 9% as a result of continued tight cost controls throughout the business. This “investment” in the EIP, which is designed to incentivise employee equity ownership and enhance alignment between shareholders and staff, has proven to be highly successful since its introduction four years ago. During that period, no fewer than 75% of the Group’s current workforce has participated in the scheme for an aggregate of more than one million share awards or approximately 4% of the Company’s issued equity and we are confident that this trend will continue beyond June 2020, when the additional 5% allocation of operating profits to fund participation will expire. Basic earnings per share (EPS) for the six-month period rose by 22% to 19.9p, in line with the profit increase already noted, while fully diluted EPS rose by a similar percentage to 19.4p.
Climate change Given CLIG’s spread of five offices across three continents, the twin challenges of containing costs and restricting our carbon footprint are significant. Wherever possible, video conferencing is used both internally and for client presentations to minimise air travel and, in light of the need to tackle climate change at all levels of society, CLIG will continue to adopt a responsible approach to its carbon footprint, within the bounds of business necessities.

CHAIRMAN’S STATEMENT CONTINUED
4 City of London Investment Group PLC Half Year Report 2019/20
Dividends The results summarised in this statement paint a favourable picture of CLIG’s performance over the six-month period and, as suggested elsewhere in this report, there are solid grounds for optimism as we enter a new decade. It is against this background that your Board is pleased to announce a 1p per share increase in the interim dividend to 10p, an 11% increase which rewards our shareholders while providing sufficient reserves either to weather unforeseen setbacks or take advantage of opportunities that may arise to further expand the business.
The Board Barry Olliff ’s retirement from his executive role on 31st December 2019 was the culmination of a two-year management transition which is now complete. Succession planning is always challenging but it is particularly the case when seeking to replace a founder and it is with that in mind that I would like to pay tribute to our new CEO, Tom Griffith, and his executive team for managing a smooth transition with total professionalism. At the same time, I warmly welcome Carlos Yuste to the Board as the director responsible for business development. Carlos has spent an aggregate 17 years in the “CLIG family” and is highly respected for his knowledge of the US institutional investor universe and, given our ambitions to further expand our penetration of this client base with our newer products, we are fortunate to have his experience to guide us.
Towards the end of 2019, we were informed by our Group Finance Director, Tracy Rodrigues, that, for family reasons, she needed to take a leave of absence and accordingly, she will step down from the Board with effect from 31st March 2020. Having risen through the ranks of the finance department over a 20-year period, Tracy is a highly valued member of the executive team but thankfully, and due in no small way to Tracy’s efforts, we are well resourced to cover her duties during her absence, having made an additional senior qualified hire in recent weeks. We wish Tracy well during her absence.
Outlook Despite an increasingly fractious and polarised political world, equity markets made solid gains through much of 2019 and have entered the new decade in a similarly buoyant fashion. Prudence would always dictate caution against investor complacency in these seemingly benign conditions and it is true that the stretched valuations in the technology sector, to name one example, are somewhat reminiscent of the dot-com asset bubble at the turn of the century. In contrast to “tech”, however, valuations across much of the CEF universe, particularly in the EM space are far from stretched and it is this value protection that gives us cause for relative optimism. This is not to predict a sudden value arbitrage from “tech” to “value” investing but it is worth reiterating that the gains made by CLIG in 2019 owe more to a prudent and value-orientated investment style than to asset bubbles of any kind; they are the fruits of many years of hard work and patience and we are confident that, over time, it is these investment tenets that will serve our clients and shareholders well.
Barry Aling Chairman 14th February 2020

CHIEF EXECUTIVE OFFICER’S REVIEW
City of London Investment Group PLC Half Year Report 2019/20 5
Funds under Management (FuM) flows As shareholders will have seen from our 31st December 2019 trading update, net inflows during the first two quarters of the financial year totalled US$182 million. The Emerging Markets (EM) strategy experienced net outflows of US$118 million due primarily to clients rebalancing, while the Diversification strategies experienced net inflows of US$300 million over the same period. Net flows
of US$272 million into the Developed strategy through the first half of this fiscal year outpaced full year flows of US$253 million through fiscal year end 30th June 2019. Table 1 below shows net flows into and out of each strategy for each of the past five years and the current financial year to date.
FuM by strategy Although growth within the Diversification strategies may appear to have happened overnight, plans put in place many years ago are beginning to pay dividends. As of 30th June 2015, FuM in the EM strategy represented 91% of FuM across all strategies. While FuM in the EM strategy have increased in US dollar terms during the subsequent 4 ½ years, the EM strategy now represents a reduced percentage of FuM across all strategies of 74%. Table 2 below shows the assets by strategy at the past five fiscal year ends and at 31st December 2019.
Table 1: Net Flows Across Strategies (US$000’s)
FY 2015 FY 2016 FY 2017 FY 2018 FY 2019 FYTD 2020
Emerging Markets 22,698 150,116 (295,333) (215,083) (183,521) (118,000)
Frontier 100,000 25,000 11,001 67,000 (21,336) 8,000
Developed – (20,000) 68,551 279,394 252,883 272,000
Opportunistic Value/Tactical 142,602 (14,772) (56,136) 54,251 48,236 20,000
REIT – – – – 6,000 –
Discontinued strategies (335) (2,038) – – – –
Group totals 264,965 138,306 (271,917) 185,562 102,262 182,000
Table 2: FuM by Strategy (US$m)
30 Jun 15 30 Jun 16 30 Jun 17 30 Jun 18 30 Jun 19 31 Dec 19
Emerging Markets 3,853 3,659 4,200 4,207 4,221 4,429
Frontier 103 127 172 245 206 206
Developed 99 71 179 480 729 1,109
Opportunistic Value/Tactical 153 148 110 174 233 270
Other 3 – – 1 7 7
Group totals 4,211 4,005 4,661 5,107 5,396 6,021

As with many successful endeavours, recent (seemingly “overnight”) success with the Diversification products has been 10+ years in the making. We’ve found over time at CLIG that everything worth doing takes longer than we expect. For example:
• Training good people, takes longer than we expect.
• Finding good products and creating sustainable records, takes longer than we expect.
• Getting shareholders to understand and buy into what we are attempting to achieve, takes longer than we expect.
• Identifying, negotiating and researching potential CLIM Diversification candidates, takes longer than we expect.
No plan survives contact with reality exactly as expected. Patience is the key ingredient that helps us endure difficult circumstances. While the road to achievement is a long one, those without patience – who want to see results immediately – may not be willing to remain on the path to achieve their goals.
Results FuM ended the interim period at US$6.0 billion, up from US$5.4 billion at the 30th June 2019 fiscal year end, aided by rising markets, net inflows, and relative outperformance. Income is currently accruing at a weighted average rate of 75 basis points of FuM annually, net of third party commissions.
US$/sterling currency movements have a direct impact upon the Group’s profitability. Our revenue is almost entirely US dollar-based, whilst costs are incurred primarily in a combination of sterling and US dollars. The following table illustrates the point – an increase in the exchange rate from 1.20 to 1.30 on FuM of US$6.0 billion reduces post-tax profits by £1.2 million.
As previously announced, and in recognition of the improved results and consistent with the current dividend cover policy, the interim dividend payable on 20th March 2020 was increased by 1p to 10p per share (2019: 9p).
Inclusive of regulatory and statutory capital requirements, there is £12.5 million cash in the bank. The Group continues to consider CLIG diversification opportunities that could further enhance the Group’s earnings and share price. We have considered numerous potential candidates over the past 15 years, although to date these opportunities have not materialised into a transaction, for one reason or another. As mentioned previously, everything takes longer than we expect and CLIG diversification is no exception.
Performance The EM strategies outperformed on average by 0.75% relative to the MSCI EM Index over the six months to 31st December 2019, driven by discount narrowing and good NAV performance of the underlying holdings.
The Developed strategies outperformed on average by 3.5% relative to the MSCI ACWI ex US over the period, with positive discount effects, good country allocation, and strong NAV performance.
The Opportunistic Value strategy outperformed on average by 2.2% relative to the blended MSCI ACWI/Barclay’s Global Aggregate Index over the period, led by good NAV performance and significant discount narrowing.
6 City of London Investment Group PLC Half Year Report 2019/20
CHIEF EXECUTIVE OFFICER’S REVIEW CONTINUED
Post-tax profit: Illustration of US$/£ rate effect FuM US$bn: 5.0 5.5 6.0 6.5 7.0
US$/£ Post-tax, £m
1.20 9.3 10.9 12.6 14.2 15.8
1.25 8.9 10.4 11.9 13.5 15.0
1.30 8.4 9.9 11.4 12.8 14.3
1.35 8.0 9.4 10.8 12.3 13.7
1.40 7.6 9.0 10.4 11.7 13.1 Assumes: 1. Average net fee 75 bp’s 2. Annual operating costs £5m plus US$9m plus S$1m (£1 = S$1.8) 3. Profit-share 30% 4. EIP 5% 4. Average tax of 21%
Note: The above table is intended to illustrate the approximate impact of movement in US$/£, given an assumed set of trading conditions. It is not intended to be interpreted or used as a profit forecast.

City of London Investment Group PLC Half Year Report 2019/20 7
31 Dec14
31 Mar15
30 Jun15
30 Sep15
31 Dec15
31 Mar16
30 Jun16
30 Sep16
31 Dec16
31 Mar17
30 Jun17
30 Sep17
31 Dec17
31 Mar18
30 Jun18
30 Sep18
31 Dec18
31 Mar19
30 Jun19
30 Sep19
31 Dec19
0
100
150
50
200
250
CLIG v M1EF Cumulative T/R (all values in GBP) – 5 year
CLIG LN M1EF Index
Source: BloombergNote: CLIG LN and M1EF rebased to 100 as of starting date
The Frontier strategy underperformed on average by 5% relative to the S&P Frontier 150 Index over the period, due primarily to negative country allocation and discount widening.
The Emerging Markets REIT and International REIT strategies posted a positive six months in relative and absolute terms, driven by good stock selection.
KPIs As noted in the Annual Report for the year ended 30th June 2019, we have moved away from comparing our Total Return (T/R) to that of our peers. We have instead adopted the following two primary “Share Price” KPIs to be evaluated over a five-year period against the MSCI Emerging Markets T/R Net Index (M1EF):
• Our share price to compound annually at between 7.5% to 12.5%; or
• Our share price to double the cumulative return of the M1EF.
Our goal is to achieve one of the two over a rolling five-year period. These measures are meant to stretch the management team, without incentivising managers to take undue levels of risk.
For the five years ending 31st December 2019, CLIG’s cumulative total return was 91.55% (13.9% per annum, meeting the first KPI), which still compares favourably with the 54.4% total return from M1EF, although it remains behind the 2x target.
For reference, CLIG’s cumulative total return since inception through 31st December 2019 was 540.34% (14.5% per annum) compared with the 152.10% cumulative return for M1EF over the same time period.

8 City of London Investment Group PLC Half Year Report 2019/20
CHIEF EXECUTIVE OFFICER’S REVIEW CONTINUED
Template Please see above our Template projecting CLIG profitability, using a number of key assumptions. This is not a profit forecast – rather it should be used in conjunction with data that can be reviewed – and is updated monthly, on the CLIG website.
Recent announcements Our founder, Barry Olliff, retired from his executive role effective 31st December 2019, having retired from the Board of City of London Investment Management Company Limited (CLIM) on 1st December 2019. Barry agreed to the Board’s request to complete his term as a Non-Executive, non-independent Director on the Group Board through to October 2020. Additionally, Barry has agreed to serve in an advisory
role to the executive team for the next two years. Barry’s advisory role and Board position provides a level of business continuity that is uncommon in transitions from a founder to the next generation.
Carlos Yuste re-joined the Group Board, as of 1st January 2020. Carlos returned to the Group in 2018, having previously been a CLIG Executive Director from 2005-2015, and originally joined the Group in 2000. Carlos is the Head of Business Development, overseeing our Marketing, Client Service, Web Design, Performance & Attribution teams, as well as other responsibilities. Carlos adds a depth of experience, both within CLIG and the overall investment management industry, which is crucial for the continued development of our business in the years ahead.
Note: Excludes unrealised gains on seed investments and the special dividend of 13.5p per share paid on 22 March 2019
£000
0
500
1,000
1,500
2,000
3,500
3,000
2,500
Q 1 Q 2 Q 3 Q 4 Q 1 Q 2 Q 3 Q 4 Q 1 Q 2 Q 3 Q 4
2019/20 - £3.4m to Reserves 2020/21 - £5.2m to Reserves
2019/ 2020 2020/ 2021
2018/19 - £1.5m to Reserves
27p Dividend
2018/ 2019Interim dividend increased from 9p to 10p
Assumed earnings (£)Based on assumptions made in the annual accounts (£)Actual earnings (£)Dividend breakeven (£)
1
28p Dividend 1
Key assumptions: (June 2019 comparatives in Italics)
• Starting point Current FuM (Dec 2019) • Net increase for the remainder of this financial year (straight-
lined to June 2020): – emerging market CEF strategy zero (zero) – non-emerging market CEF strategies US$250m (US$250m
over the full year) • Net increase in 2020/2021 (straight-lined to June 2021):
– emerging market CEF strategy zero – non-emerging market CEF strategies US$250m
• Operating margin adjusted monthly for change in product mix and commission run-off
• Market growth: 0% • Overheads for 2019/20: no increase on 2018/19 (0%) • Overheads for 2020/21: +3% compared to 2018/19 • EIP charge for 2019/20: 5% of operating profit (5%) • EIP charge for 2020/21: n/a now falls within 30% profit-share • Corporation tax based on an estimated average rate of 21% (21%) • Exchange rate assumed to be £1/$1.31 for entire period (£1/US$1.27) • Number of CLIG Shares in issue (26.6m) less those held by the
Employee Benefit Trust (1.7m) as at 31 December 2019
Template – dividend cover Actual and assumed over three financial years

Tracy Rodrigues, Group Finance Director, has requested a leave of absence for family reasons and will step down from the Board on 31st March 2020. A senior accounting executive was recently hired to support the established team within the Finance department and will report to me directly.
BREXIT At the time of this writing, the pound has been relatively stable after the 12th December 2019 victory by Prime Minister Johnson and his Conservative Party. We will continue to monitor the negotiations that will occur during the transition period that ends on 31st December 2020, and the ramifications of the UK leaving the EU. Our client base remains primarily US institutions, and the trans-Atlantic nature of CLIG gives us confidence in the face of these circumstances.
Barry Olliff’s intended CLIG share sales As previously stated, shareholders are reminded of Barry’s intention to sell up to 500,000 shares at each of 450p, 475p and 500p subject to relevant restrictions. As per listing rules, any share sales will be announced to the market after execution.
CLIG outlook The EM strategy has outperformed against its relative indices for the most recent two calendar years and remains either first or second quartile against peers for 1, 5, 10, and 15 years, and since inception. Both the Developed and Opportunistic Value strategies are in the first quartile against peers for 1, 3, and 5 years and since inception, which has been achieved while investing the inflows from new client mandates. The Emerging Markets REIT and International REIT strategies posted positive results for the six-month period in relative and absolute terms, driven by good stock selection. As performance is a key driver of success in our business, these results are a positive indication for both marketing efforts and client retention in the future.
Thanks to employees Barry Olliff ’s retirement necessitated a multi-year management transition which was a potentially destabilising process for the Group. Management and Staff, however, have remained focused on delivering strong investment performance and top-quality client servicing to our clients. The team has demonstrated stability and consistency. I am grateful for the support and work of my colleagues over the past six months, especially during this period of management transition.
Tom Griffith Chief Executive Officer 14th February 2020
City of London Investment Group PLC Half Year Report 2019/20 9

10 City of London Investment Group PLC Half Year Report 2019/20
CONSOLIDATED INCOME STATEMENT FOR THE SIX MONTHS ENDED 31ST DECEMBER 2019
Six months ended Six months ended Year ended 31st Dec 2019 31st Dec 2018 30th June 2019 (unaudited) (unaudited) (audited) Note £ £ £
Revenue Gross fee income 3 17,317,850 15,562,330 31,933,229 Commissions payable (152,665) (429,655) (751,523) Custody fees payable (722,894) (611,701) (1,327,296)
Net fee income 16,442,291 14,520,974 29,854,410
Administrative expenses Staff costs 7,919,480 7,131,264 14,789,754 Other administrative expenses 2,027,406 2,179,737 4,254,383 Depreciation and amortisation* 319,534 143,950 306,445
(10,266,420) (9,454,951) (19,350,582) Operating profit 6,175,871 5,066,023 10,503,828 Net interest receivable and similar gains* 4 157,089 96,379 893,731
Profit before tax 6,332,960 5,162,402 11,397,559 Income tax expense (1,276,045) (1,057,440) (2,352,275)
Profit for the period 5,056,915 4,104,962 9,045,284
Profit attributable to: Non-controlling interests 61,970 – 246,374 Equity shareholders of the parent 4,994,945 4,104,962 8,798,910
Basic earnings per share 5 19.9p 16.3p 34.9p
Diluted earnings per share 5 19.4p 15.9p 34.1p
* The Group adopted IFRS 16 at 1st July 2019. Under the transition method chosen, comparative information has not been restated.
CONSOLIDATED STATEMENT OF COMPREHENSIVE INCOME FOR THE SIX MONTHS ENDED 31ST DECEMBER 2019
Six months ended Six months ended Year ended 31st Dec 2019 31st Dec 2018 30th June 2019 (unaudited) (unaudited) (audited) £ £ £
Profit for the period 5,056,915 4,104,962 9,045,284 Other comprehensive income: Foreign currency translation difference (39,963) 14,786 6,124
Total comprehensive income for the period 5,016,952 4,119,748 9,051,408
Attributable to: Equity shareholders of the parent 4,954,982 4,119,748 8,805,034 Non-controlling interests 61,970 – 246,374

City of London Investment Group PLC Half Year Report 2019/20 11
CONSOLIDATED STATEMENT OF FINANCIAL POSITION 31ST DECEMBER 2019
31st Dec 2019 31st Dec 2018 30th June 2019 (unaudited) (unaudited) (audited) Note £ £ £
Non current assets Property and equipment 619,941 755,598 670,048 Intangible assets 114,882 246,731 193,465 Right-of-use assets* 1,977,740 – – Other financial assets 7,744,392 37,308 7,699,491 Deferred tax asset 369,173 275,663 380,234
10,826,128 1,315,300 8,943,238
Current assets Trade and other receivables 6,338,920 5,338,388 5,979,448 Other financial assets 87,414 187,000 126,754 Cash and cash equivalents 6 12,509,221 18,699,003 13,813,089
18,935,555 24,224,391 19,919,291
Current liabilities Trade and other payables (4,998,307) (4,653,996) (5,766,484) Lease liabilities* (315,026) – – Current tax payable (938,027) (262,375) (692,840)
Creditors, amounts falling due within one year (6,251,360) (4,916,371) (6,459,324)
Net current assets 12,684,195 19,308,020 13,459,967
Total assets less current liabilities 23,510,323 20,623,320 22,403,205
Non current liabilities Deferred tax liability (166,710) (3,221) (116,441) Lease liabilities* (1,583,762) – –
Net assets 21,759,851 20,620,099 22,286,764
Capital and reserves Share capital 265,607 266,867 265,607 Share premium account 2,256,104 2,256,104 2,256,104 Investment in own shares 7 (5,814,037) (4,569,614) (5,029,063) Share option reserve 245,440 344,511 299,011 EIP share reserve 975,593 752,466 1,015,316 Foreign exchange reserve 54,416 103,041 94,379 Capital redemption reserve 26,107 24,847 26,107 Retained earnings* 20,598,471 21,441,877 19,953,375
Attributable to: Equity shareholders of the parent 18,607,701 20,620,099 18,880,836 Non-controlling interests 3,152,150 – 3,405,928
Total equity 21,759,851 20,620,099 22,286,764
* The Group adopted IFRS 16 at 1st July 2019. Under the transition method chosen, comparative information has not been restated.

12 City of London Investment Group PLC Half Year Report 2019/20
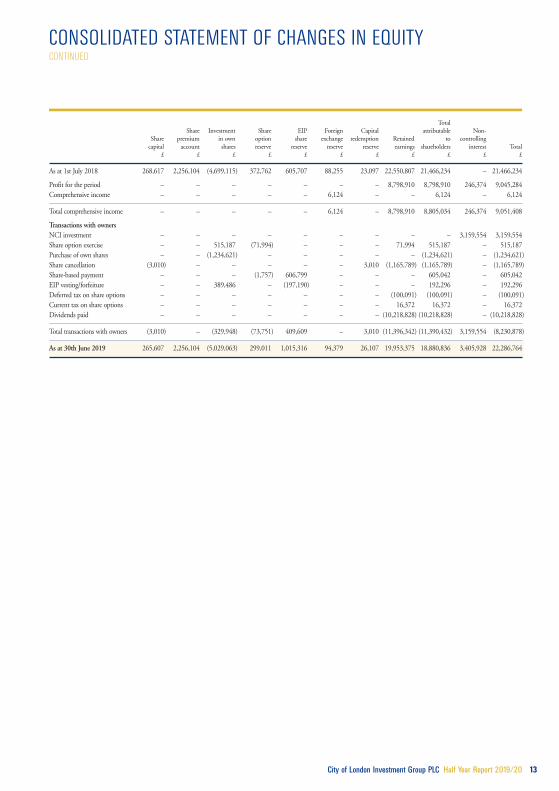
CONSOLIDATED STATEMENT OF CHANGES IN EQUITY FOR THE SIX MONTHS ENDED 31ST DECEMBER 2019
Total Share Investment Share EIP Foreign Capital attributable Non- Share premium in own option share exchange redemption Retained to controlling capital account shares reserve reserve reserve reserve earnings shareholders interest Total £ £ £ £ £ £ £ £ £ £ £
At 30th June 2019 as previously reported 265,607 2,256,104 (5,029,063) 299,011 1,015,316 94,379 26,107 19,953,375 18,880,836 3,405,928 22,286,764
Adjustment on initial application of IFRS 16* – – – – – – – 122,337 122,337 – 122,337
Adjusted balance at 1st July 2019 265,607 2,256,104 (5,029,063) 299,011 1,015,316 94,379 26,107 20,075,712 19,003,173 3,405,928 22,409,101
Profit for the period – – – – – – – 4,994,945 4,994,945 61,970 5,056,915
Comprehensive income – – – – – (39,963) – – (39,963) – (39,963)
Total comprehensive income – – – – – (39,963) – 4,994,945 4,954,982 61,970 5,016,952
Transactions with owners NCI investment/ redemption – – – – – – – – – (315,748) (315,748) Share option exercise – – 323,676 (53,571) – – – 53,571 323,676 – 323,676 Purchase of own shares – – (2,044,150) – – – – – (2,044,150) – (2,044,150) Share-based payment – – – – 421,739 – – – 421,739 – 421,739 EIP vesting/forfeiture – – 935,500 – (461,462) – – – 474,038 – 474,038 Deferred tax on share options – – – – – – – (26,634) (26,634) – (26,634) Current tax on share options – – – – – – – 5,856 5,856 – 5,856 Dividends paid – – – – – – – (4,504,979) (4,504,979) – (4,504,979)
Total transactions with owners – – (784,974) (53,571) (39,723) – – (4,472,186) (5,350,454) (315,748) (5,666,202)
As at 31st December 2019 265,607 2,256,104 (5,814,037) 245,440 975,593 54,416 26,107 20,598,471 18,607,701 3,152,150 21,759,851
*The Group adopted IFRS 16 at 1st July 2019. Under the transition method chosen, comparative information has not been restated.
Total Share Investment Share EIP Foreign Capital attributable Non- Share premium in own option share exchange redemption Retained to controlling capital account shares reserve reserve reserve reserve earnings shareholders interest Total £ £ £ £ £ £ £ £ £ £ £
As at 1st July 2018 268,617 2,256,104 (4,699,115) 372,762 605,707 88,255 23,097 22,550,807 21,466,234 – 21,466,234 Profit for the period – – – – – – – 4,104,962 4,104,962 – 4,104,962 Comprehensive income – – – – – 14,786 – – 14,786 – 14,786
Total comprehensive income – – – – – 14,786 – 4,104,962 4,119,748 – 4,119,748
Transactions with owners Share option exercise – – 204,080 (26,780) – – – 26,780 204,080 – 204,080 Purchase of own shares – – (465,416) – – – – – (465,416) – (465,416) Share cancellation (1,750) – – – – – 1,750 (649,120) (649,120) – (649,120) Share-based payment – – – (1,471) – – – – (1,471) – (1,471) EIP provision – – – – 344,388 – – – 344,388 – 344,388 EIP vesting/forfeiture – – 390,837 – (197,629) – – – 193,208 – 193,208 Deferred tax on share options – – – – – – – (49,683) (49,683) – (49,683) Current tax on share options – – – – – – – 1,784 1,784 – 1,784 Dividends paid – – – – – – – (4,543,653) (4,543,653) – (4,543,653)
Total transactions with owners (1,750) – 129,501 (28,251) 146,759 – 1,750 (5,213,892) (4,965,883) – (4,965,883)
As at 31st December 2018 266,867 2,256,104 (4,569,614) 344,511 752,466 103,041 24,847 21,441,877 20,620,099 – 20,620,099
CONSOLIDATED STATEMENT OF CHANGES IN EQUITY CONTINUED
City of London Investment Group PLC Half Year Report 2019/20 13
Total Share Investment Share EIP Foreign Capital attributable Non- Share premium in own option share exchange redemption Retained to controlling capital account shares reserve reserve reserve reserve earnings shareholders interest Total £ £ £ £ £ £ £ £ £ £ £
As at 1st July 2018 268,617 2,256,104 (4,699,115) 372,762 605,707 88,255 23,097 22,550,807 21,466,234 – 21,466,234
Profit for the period – – – – – – – 8,798,910 8,798,910 246,374 9,045,284 Comprehensive income – – – – – 6,124 – – 6,124 – 6,124
Total comprehensive income – – – – – 6,124 – 8,798,910 8,805,034 246,374 9,051,408
Transactions with owners NCI investment – – – – – – – – – 3,159,554 3,159,554 Share option exercise – – 515,187 (71,994) – – – 71,994 515,187 – 515,187 Purchase of own shares – – (1,234,621) – – – – – (1,234,621) – (1,234,621) Share cancellation (3,010) – – – – – 3,010 (1,165,789) (1,165,789) – (1,165,789) Share-based payment – – – (1,757) 606,799 – – – 605,042 – 605,042 EIP vesting/forfeiture – – 389,486 – (197,190) – – – 192,296 – 192,296 Deferred tax on share options – – – – – – – (100,091) (100,091) – (100,091) Current tax on share options – – – – – – – 16,372 16,372 – 16,372 Dividends paid – – – – – – – (10,218,828) (10,218,828) – (10,218,828)
Total transactions with owners (3,010) – (329,948) (73,751) 409,609 – 3,010 (11,396,342) (11,390,432) 3,159,554 (8,230,878)
As at 30th June 2019 265,607 2,256,104 (5,029,063) 299,011 1,015,316 94,379 26,107 19,953,375 18,880,836 3,405,928 22,286,764

14 City of London Investment Group PLC Half Year Report 2019/20
CONSOLIDATED CASH FLOW STATEMENT FOR THE SIX MONTHS ENDED 31ST DECEMBER 2019
Six months ended Six months ended Year ended
31st Dec 2019 31st Dec 2018 30th June 2019
(unaudited) (unaudited) (audited)
£ £ £
Cash flow from operating activities Operating profit 6,175,871 5,066,023 10,503,828 Adjustments for: Profit on disposal of assets – (240) (240) Depreciation charges* 268,611 93,028 204,601 Amortisation of intangible assets 50,923 50,922 101,844 Share-based payment charge – (1,471) (1,757) EIP charge 421,740 342,565 793,036 Translation adjustments 56,873 (58,341) (24,646)
Cash generated from operations before changes in working capital 6,974,018 5,492,486 11,576,666 (Increase)/decrease in trade and other receivables (442,543) 494,772 (80,825) (Decrease)/increase in trade and other payables (114,393) 47,594 975,184
Cash generated from operations 6,417,082 6,034,852 12,471,025 Interest received 41,080 45,667 87,749 Interest paid* (52,550) 14,316 1,118 Taxation paid (1,017,160) (1,360,570) (2,252,111)
Net cash generated from operating activities 5,388,452 4,734,265 10,307,781
Cash flow from investing activities Purchase of property and equipment (62,973) (388,975) (421,316) Purchase of non-current financial assets – – (7,088,847) Purchase of current financial assets – – (21,078) Proceeds from sale of current financial assets – 57,064 57,064
Net cash used in investing activities (62,973) (331,911) (7,474,177)
Cash flow from financing activities Ordinary dividends paid (4,504,979) (4,543,653) (10,218,828) Purchase and cancellation of own shares – (649,120) (1,165,789) Purchase of own shares by employee benefit trust (2,044,150) (465,416) (1,234,621) Proceeds from sale of own shares by employee benefit trust 323,676 204,080 515,186 Payment of lease liabilities* (166,648) – – Capital (to)/from non-controlling interest (315,748) – 3,150,599
Net cash used in financing activities (6,707,849) (5,454,109) (8,953,453)
Net decrease in cash and cash equivalents (1,382,370) (1,051,755) (6,119,849) Cash and cash equivalents at start of period 13,813,089 19,704,111 19,704,111 Cash held in funds** 88,349 – 217,091 Effect of exchange rate changes (9,847) 46,647 11,736
Cash and cash equivalents at end of period 12,509,221 18,699,003 13,813,089
* The Group adopted IFRS 16 at 1st July 2019. Under the transition method chosen, comparative information has not been restated. ** Cash held in REIT funds consolidated on a net asset basis

NOTES
City of London Investment Group PLC Half Year Report 2019/20 15
1 BASIS OF PREPARATION AND SIGNIFICANT ACCOUNTING POLICIES
The financial information contained herein is unaudited and does not comprise statutory financial information within the meaning of section 434 of the Companies Act 2006. The information for the year ended 30th June 2019 has been extracted from the latest published audited accounts. The report of the independent auditor on those financial statements contained no qualification or statement under s498(2) or (3) of the Companies Act 2006.
These interim financial statements have been prepared in accordance with the Disclosure and Transparency Rules of the Financial Conduct Authority and IAS 34 “Interim Financial Reporting” as adopted by the European Union. The accounting policies are consistent with those set out and applied in the statutory accounts of the Group for the year ended 30th June 2019, which were prepared in accordance with IFRSs as adopted by the European Union, other than those stated below and in Note 2.
The consolidated financial information contained within this report incorporates the results, cash flows and financial position of the Company and its subsidiaries for the period to 31st December 2019.
The Directors have a reasonable expectation that the Group has adequate resources to continue in operation for the foreseeable future. They therefore continue to adopt the going concern basis in preparing these interim financial statements.
New or amended accounting standards and interpretations adopted The Group has adopted all the new or amended accounting standards and interpretations issued by the International Accounting Standards Board (IASB) that are mandatory for the current reporting period. Any new or amended accounting standards that are not mandatory have not been early adopted.
The following accounting standards or interpretations are most relevant to the Group.
IFRS 16 Leases The Group adopted IFRS 16 from 1st July 2019 which replaces IAS 17 Leases. This standard introduces a single lease accounting model that requires a lessee to recognise lease assets and liabilities, which were previously accounted for as operating leases, on the statement of financial position.
The right-of-use asset as shown in the statement of financial position represents the leased asset against which the lessee has an obligation to pay lease rentals for the right to use the asset. The obligation to pay is shown as a lease liability within the statement of the financial position.
On initial application of IFRS 16 the Group has identified and recognised in its statement of financial position, both the discounted value of its total lease commitments as a lease liability and the corresponding asset as a right-of-use asset.
The resulting depreciation of the leased assets and interest due on the lease liabilities, over the term of the lease, is recognised within its income statement.
The Group has adopted IFRS 16 and prior period comparatives have not been restated as the cumulative catch up approach has been applied. Any adjustments arising on transition are recognised in opening equity. As a result the comparative information provided continues to be accounted for in accordance with the Group’s previous accounting policy. Refer to note 2 for the impact due to changes in accounting policies.

16 City of London Investment Group PLC Half Year Report 2019/20
NOTES CONTINUED
2 IMPACT DUE TO CHANGES IN ACCOUNTING POLICIES
Adoption of IFRS 16 Leases As explained in note 1, the Group has adopted IFRS 16 as issued in January 2016. The Group has elected to apply the following practical expedients and exemptions as permitted within the standard:
• not to reassess whether a contract is or contains a lease at the date of initial application;
• leases which are due to expire within 12 months from adoption are accounted for in the same way as short-term leases and the lease payments are expensed to profit or loss over the lease term;
• not to apply the standard to low value lease assets; and
• review lease terms where the contract contains options to extend or terminate the lease.
Adjustments recognised on adoption of IFRS 16 Leases The Group has recognised the total lease liability on those leases which were previously accounted for as operating leases, subject to certain practical expedients applied at transition and the exemptions for short-term leases and low value assets. The measurement of the lease liability is based on the total amount of outstanding lease payments, discounted to its present value based on the incremental borrowing rate. The Group’s weighted average incremental borrowing rate as at 1st July 2019 was 6%.
The total discounted lease liability recognised as at 1st July 2019 is as follows:
£
Operating lease commitments as disclosed 30th June 2019 1,124,323
Discounted present value of lease liability 1,102,925
Add adjustment for different treatment of renewal options contained within the lease 1,022,089
Less short term operating leases less than 12 months (49,527)
Lease liability recognised as at 1st July 2019 2,075,487
Comprised of: Current lease liabilities 419,086 Non-current lease liabilities 1,656,401
2,075,487
The right-of-use asset was measured at the present value of the lease liability, adjusted for any prepaid or accrued lease payments relating to the leases at the date of initial recognition and the impact of future restoration costs.
The right-of-use assets all relate to the Group’s property leases.
City of London Investment Group PLC Half Year Report 2019/20 17
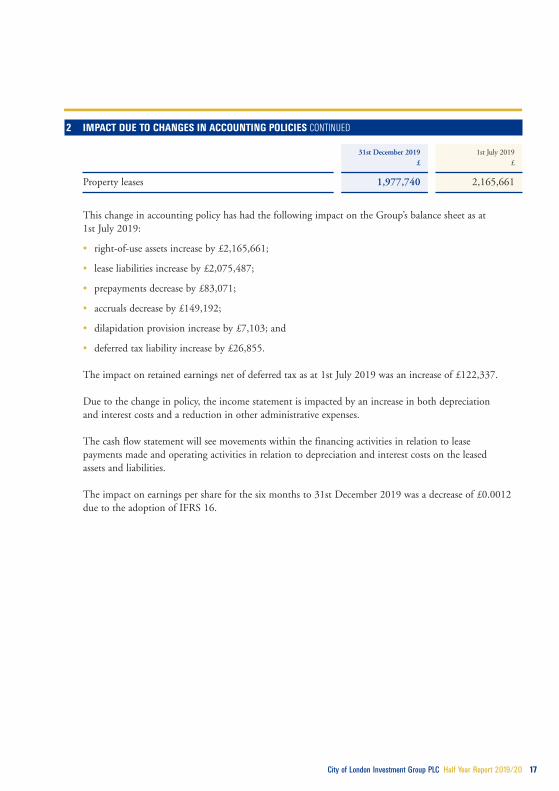
2 IMPACT DUE TO CHANGES IN ACCOUNTING POLICIES CONTINUED
31st December 2019 1st July 2019 £ £
Property leases 1,977,740 2,165,661
This change in accounting policy has had the following impact on the Group’s balance sheet as at 1st July 2019:
• right-of-use assets increase by £2,165,661;
• lease liabilities increase by £2,075,487;
• prepayments decrease by £83,071;
• accruals decrease by £149,192;
• dilapidation provision increase by £7,103; and
• deferred tax liability increase by £26,855.
The impact on retained earnings net of deferred tax as at 1st July 2019 was an increase of £122,337.
Due to the change in policy, the income statement is impacted by an increase in both depreciation and interest costs and a reduction in other administrative expenses.
The cash flow statement will see movements within the financing activities in relation to lease payments made and operating activities in relation to depreciation and interest costs on the leased assets and liabilities.
The impact on earnings per share for the six months to 31st December 2019 was a decrease of £0.0012 due to the adoption of IFRS 16.

NOTES CONTINUED
18 City of London Investment Group PLC Half Year Report 2019/20
3 SEGMENTAL ANALYSIS
The directors consider that the Group has only one reportable segment, namely asset management, and hence only analysis by geographical location is given.
Europe USA Canada UK (ex UK) Other Total £ £ £ £ £ £
Six months to 31st December 2019 Revenue 16,064,433 603,950 192,163 457,304 – 17,317,850 Non-current assets: Property and equipment 226,702 – 359,922 – 33,317 619,941 Intangible assets 88,985 – 25,897 – – 114,882 Right of use assets 359,717 – 1,531,107 – 86,916 1,977,740
Six months to 31st December 2018 Revenue 14,404,701 475,393 184,057 498,179 – 15,562,330 Non-current assets: Property and equipment 294,249 – 423,482 – 37,867 755,598 Intangible assets 206,543 – 40,188 – – 246,731
Year to 30th June 2019 Gross fee income 29,577,509 1,035,215 379,197 941,308 – 31,933,229 Non-current assets: Property and equipment 255,493 – 381,726 – 32,829 670,048 Intangible assets 160,422 – 33,043 – – 193,465
The Group has classified revenue based on the domicile of its clients and non-current assets based on where the assets are held.
Included in revenues are fees of £2,214,410 (30th June 2019 – £4,226,746; 31st December 2018 – £2,056,906) which arose from fee income from the Group’s largest customer. No other single customer contributed 10 per cent or more to the Group’s revenue in either of the reporting periods.

4 NET INTEREST RECEIVABLE AND SIMILAR GAINS
Six months ended Six months ended Year ended 31st Dec 2019 31st Dec 2018 30th June 2019 (unaudited) (unaudited) (audited) £ £ £
Interest on bank deposit 41,080 45,667 87,749 Unrealised gains on investments 197,026 38,608 848,652 Unrealised loss on hedging investments (28,467) (2,212) (43,788) Interest receivable on restated US state tax returns – 14,316 1,118 Interest payable (952) – – Interest on lease liabilities (51,598) – –
157,089 96,379 893,731
5 EARNINGS PER SHARE
The calculation of earnings per share is based on the profit for the period attributable to the equity shareholders of the parent of £4,994,945 (30th June 2019 – £8,798,910; 31st December 2018 – £4,104,962) divided by the weighted average number of ordinary shares in issue for the six months ended 31st December 2019 of 25,044,155 (30th June 2019 – 25,203,147; 31st December 2018 – 25,253,885).
As set out in note 7 the Employee Benefit Trust held 1,679,543 ordinary shares in the company as at 31st December 2019. The Trustees of the Trust have waived all rights to dividends associated with these shares. In accordance with IAS 33 “Earnings per share”, the ordinary shares held by the Employee Benefit Trust have been excluded from the calculation of the weighted average number of ordinary shares in issue.
The calculation of diluted earnings per share is based on the profit for the period attributable to the equity shareholders of the parent of £4,994,945 (30th June 2019 – £8,798,910; 31st December 2018 – £4,104,962) divided by the diluted weighted average number of ordinary shares in issue for the six months ended 31st December 2019 of 25,712,408 (30th June 2019 – 25,816,823; 31st December 2018 – 25,834,021).
City of London Investment Group PLC Half Year Report 2019/20 19

NOTES CONTINUED
20 City of London Investment Group PLC Half Year Report 2019/20
6 CASH AND CASH EQUIVALENTS
Six months ended Six months ended Year ended 31st Dec 2019 31st Dec 2018 30th June 2019 (unaudited) (unaudited) (audited) £ £ £
Cash at bank and in hand 12,509,221 14,778,664 13,813,089 Committed cash* – 3,920,339 –
Total cash and cash equivalents 12,509,221 18,699,003 13,813,089
* Committed cash held by BNY Mellon, as agent, for the seed investment of our new REIT funds as of 2nd January 2019.
7 INVESTMENT IN OWN SHARES
Investment in own shares relates to City of London Investment Group PLC shares held by an Employee Benefit Trust on behalf of City of London Investment Group PLC.
At 31st December 2019 the Trust held 989,449 ordinary 1p shares (30th June 2019 – 908,348; 31st December 2018 – 823,429), of which 534,375 ordinary 1p shares (30th June 2019 – 630,750; 31st December 2019 – 737,480) were subject to options in issue.
The Trust also held in custody 690,094 ordinary 1p shares (30th June 2019 – 624,200; 31st December 2018 – 624,780) for employees in relation to restricted share awards granted under the Group’s Employee Incentive Plan (EIP).
The Trust has waived its entitlement to receive dividends in respect of the total shares held (31st December 2019 – 1,679,543; 30th June 2019 – 1,539,098; 31st December 2018 – 1,560,909).
8 DIVIDENDS
A final dividend of 18p per share in respect of the year ended 30th June 2019 was paid on 29th October 2019.
An interim dividend of 10p per share (2019 – 9p) in respect of the year ended 30th June 2020 will be paid on 20th March 2020 to members registered at the close of business on 6th March 2020.

City of London Investment Group PLC Half Year Report 2019/20 21
9 PRINCIPAL RISKS AND UNCERTAINTIES
In the course of conducting its business operations, the Group is exposed to a variety of risks including market, liquidity, operational and other risks that may be material and require appropriate controls and on-going oversight.
Each department/line of business reviews its risks and business processes and these are assigned both an inherent and residual risk rating, as whilst all risk cannot be eliminated, the aim is to proactively identify and manage those risks that have been identified.
The Board has established a Risk and Compliance Committee (“the RCC”) which is chaired by the Head of Compliance. The other members of the RCC are the four executive Directors, the US Chief Compliance Officer and a representative covering US Corporate Governance.
The principal risks to which the Group will be exposed in the second half of the financial year are substantially the same as those described in the last annual report (see pages 26 to 27), being the potential for loss of funds under management as a result of poor investment performance, client redemptions, breach of mandate guidelines or market volatility, loss of key personnel, business continuity, legal and regulatory risks.
Changes in market prices, such as foreign exchange rates and equity prices will affect the Group’s income and the value of its investments.
Most of the Group’s revenues, and a significant part of its expenses, are denominated in currencies other than sterling, principally US dollars. These revenues are derived from fee income which is based upon the net asset value of accounts managed, and have the benefit of a natural hedge by reference to the underlying currencies in which investments are held. Inevitably, debtor and creditor balances arise which in turn give rise to currency exposures.

NOTES CONTINUED
22 City of London Investment Group PLC Half Year Report 2019/20
10 FINANCIAL INSTRUMENTS
The Group’s financial assets include cash and cash equivalents, investments and other receivables.
Its financial liabilities include accruals and other payables. The fair value of the Group’s financial assets and liabilities is materially the same as the book value.
Fair value measurements recognised in the statement of financial position The following table provides an analysis of financial instruments that are measured subsequent to initial recognition at fair value, grouped into Levels 1 to 3 based on the degree to which the fair value is observable.
• Level 1: fair value derived from quoted prices (unadjusted) in active markets for identical assets and liabilities.
• Level 2: fair value derived from inputs other than quoted prices included within Level 1 that are observable for the assets or liability, either directly (i.e. as prices) or indirectly (i.e. derived from prices).
• Level 3: fair value derived from valuation techniques that include inputs for the asset or liability that are not based on observable market data.
The fair values of the financial instruments are determined as follows:
• Investments for hedging purposes are valued using the quoted bid price and shown under Level 1.
• Investments in own funds are determined with reference to the net asset value (NAV) of the fund. Where the NAV is a quoted price the fair value is shown under Level 1, where the NAV is not a quoted price the fair value is shown under Level 2.
• Forward currency trades are valued using the forward exchange bid rates and are shown under Level 2.
• Unlisted equity securities are valued using the net assets of the underlying companies and are shown under Level 3.
The level within which the financial asset or liability is classified is determined based on the lowest level of significant input to the fair value measurement.
Level 1 Level 2 Level 3 Total 31st December 2019 £ £ £ £
Financial assets at fair value through profit or loss Investment in other financial assets 87,414 – – 87,414 Investment in other non-current financial assets 7,696,378 47,558 456 7,744,392 Forward currency trades – 163,365 – 163,365
Total 7,783,792 210,923 456 7,995,171
There are no financial liabilities at fair value at 31st December 2019.

City of London Investment Group PLC Half Year Report 2019/20 23
10 FINANCIAL INSTRUMENTS CONTINUED
Level 1 Level 2 Level 3 Total 31st December 2018 £ £ £ £
Financial assets at fair value through profit or loss Investment in own funds – 37,308 – 37,308 Investment in other financial assets 187,000 – – 187,000
Total 187,000 37,308 – 224,308
Financial liabilities at fair value through profit or loss Forward currency trades – 113,713 – 113,713
Total – 113,713 – 113,713
Level 1 Level 2 Level 3 Total 30th June 2019 £ £ £ £
Financial assets at fair value through profit or loss Investment in other financial assets 126,754 – – 126,754 Investment in other non-current financial assets 7,655,016 44,475 – 7,699,491
Total 7,781,770 44,475 – 7,826,245
Financial liabilities at fair value through profit or loss Forward currency trades – 95,917 – 95,917
Total – 95,917 – 95,917
Level 3 Level 3 assets as of 31st December 2019 were £456 (30th June 2019: nil; 31st December 2018: nil).
There were no transfers between any of the levels in the reporting period.

NOTES CONTINUED
24 City of London Investment Group PLC Half Year Report 2019/20
10 FINANCIAL INSTRUMENTS CONTINUED
All fair value gains and losses included in other comprehensive income relate to the investment in own funds.
Where there is an impairment in the investment in own funds, the loss is reported in the income statement. No impairment was recognised during the period or the preceding year.
The fair value gain on the forward currency trades is offset in the income statement by the foreign exchange losses on other currency assets and liabilities held during the period and at the period end. The net profit reported for the period is £126,526 (30th June 2019: net loss £143,082; 31st December 2018: net loss £104,660).
11 GENERAL
The interim financial statements for the six months to 31st December 2019 were approved by the Board on 14th February 2020. These financial statements are unaudited, but they have been reviewed by the auditors, having regard to International Standard on Review Engagements (UK and Ireland) 2410 “Review of Interim Financial Information performed by the Independent Auditor of the Entity” issued by the Auditing Practices Board.
Copies of this statement are available on our website www.citlon.co.uk

City of London Investment Group PLC Half Year Report 2019/20 25
STATEMENT OF DIRECTORS’ RESPONSIBILITIES
The Directors are responsible for preparing the condensed interim financial statements, in accordance with applicable law and regulations and confirm that, to the best of their knowledge:
• this condensed set of financial statements has been prepared in accordance with IAS 34 “Interim Financial Reporting”, as adopted by the European Union, and
• this condensed set of financial statements includes a fair review of the information required by Sections DTR 4.2.7R and DTR 4.2.8R of the Disclosure and Transparency Rules of the United Kingdom’s Financial Conduct Authority.
By order of the Board
Tom Griffith Chief Executive Officer

26 City of London Investment Group PLC Half Year Report 2019/20
INDEPENDENT REVIEW REPORT TO CITY OF LONDON INVESTMENT GROUP PLC
Introduction We have been engaged by the Company to review the condensed set of financial statements in the half-yearly financial report for the six months ended 31st December 2019 which comprises Consolidated Income Statement, Consolidated Statement of Comprehensive Income, Consolidated Statement of Financial Position, Consolidated Statement of Changes in Equity, Consolidated Cash Flow Statement and the related explanatory notes. We have read the other information contained in the half-yearly financial report and considered whether it contains any apparent misstatements or material inconsistencies with the information in the condensed set of financial statements.
Directors’ Responsibilities The half-yearly financial report, is the responsibility of, and has been approved by, the directors. The directors are responsible for preparing and presenting the half-yearly financial report in accordance with the Disclosure and Transparency Rules of the United Kingdom’s Financial Conduct Authority.
As disclosed in note 1, the annual financial statements of the Group are prepared in accordance with International Financial Reporting Standards and International Financial Reporting Interpretations Committee pronouncements as adopted by the European Union. The condensed set of financial statements included in this half-yearly financial report has been prepared in accordance with International Accounting Standard 34, “Interim Financial Reporting” as adopted by the European Union.
Our Responsibility Our responsibility is to express to the Company a conclusion on the condensed set of financial statements in the half-yearly financial report based on our review.
Scope of Review We conducted our review in accordance with International Standard on Review Engagements (UK and Ireland) 2410, “Review of Interim Financial Information Performed by the Independent Auditor of the Entity” issued by the Auditing Practices Board for use in the United Kingdom. A review of interim financial information consists of making enquiries, primarily of persons responsible for financial and accounting matters, and applying analytical and other review procedures. A review is substantially less in scope than an audit conducted in accordance with International Standards on Auditing (UK) and consequently does not enable us to obtain assurance that we would become aware of all significant matters that might be identified in an audit. Accordingly, we do not express an audit opinion.

City of London Investment Group PLC Half Year Report 2019/20 27
Conclusion Based on our review, nothing has come to our attention that causes us to believe that the condensed set of financial statements in the half-yearly financial report for the six months ended 31st December 2019 is not prepared, in all material respects, in accordance with International Accounting Standard 34, “Interim Financial Reporting” as adopted by the European Union, and the Disclosure and Transparency Rules of the United Kingdom’s Financial Conduct Authority.
Use of our report This report is made solely to the Company in accordance with International Standard on Review Engagements (UK and Ireland) 2410 “Review of Interim Financial Information performed by the Independent Auditor of the Entity” issued by the Auditing Practices Board and for the purpose of the Disclosure and Transparency Rules of the United Kingdom’s Financial Conduct Authority. Our review work has been undertaken so that we might state to the Company those matters we are required to state to them in an independent review report and for no other purpose. To the fullest extent permitted by law, we do not accept or assume responsibility to anyone other than the Company, for our review work, for this report, or for the conclusions we have formed.
RSM UK Audit LLP Chartered Accountants 25 Farringdon Street London EC4A 4AB
14th February 2020

28 City of London Investment Group PLC Half Year Report 2019/20
SHAREHOLDER INFORMATION
Registered office 77 Gracechurch Street London EC3V 0AS
Registered number 2685257
Company Secretary Philippa Keith
Financial adviser and broker Zeus Capital 10 Old Burlington Street London W1S 3AG
Auditors RSM UK Audit LLP Chartered Accountants 25 Farringdon Street London EC4A 4AB
Bankers The Royal Bank of Scotland plc London City Office 62-63 Threadneedle Street London EC2R 8LA
Registrar Link Asset Services 34 Beckenham Road Beckenham Kent BR3 4TU
By phone on 0871 664 0300 from the UK and +44 371 664 0300 from overseas. (Calls cost 12 pence per minute plus network extras. Calls outside the United Kingdom will be charged at the applicable international rate. Lines are open from 9am to 5:30pm Mon – Fri, excluding public holidays in England and Wales).
By email: [email protected]

Designed and produced by
The paper used in this document contains materials sourced from responsibly managed and sustainable commercial forests, certified in accordance with the FSC® (Forest Stewardship Council).

London office 77 Gracechurch Street London EC3V 0AS United Kingdom
Telephone: + 44 (0) 207 711 0771 Facsimile: + 44 (0) 207 711 0774
US East Coast office The Barn 1125 Airport Road Coatesville, PA 19320 United States Telephone: + 1 610 380 2110 Facsimile: + 1 610 380 2116
US West Coast office Plaza Center 10900 NE 8th Street Suite 1414 Bellevue, WA 98004 United States Telephone: + 1 610 380 0090
Singapore office 20 Collyer Quay #10-04 Singapore 049319
Telephone: + 65 6236 9136 Facsimile: + 65 6532 3997
Dubai office Unit 2, 2nd Floor The Gate Village Building 1 Dubai International Financial Centre PO Box 506695 Dubai United Arab Emirates
Telephone: + 971 (0)4 249 8404 Facsimile: + 971 (0)4 437 0510
www.citlon.co.uk


![[Challenge:Future] Impacting Half Billion Lives Vision LAH](https://img.pdfslide.net/doc/110x75/58adf8241a28abf0628b5461/challengefuture-impacting-half-billion-lives-vision-lah.jpg)