Embed Size (px)
Citation preview
City of Mason, Ohio
Independent Auditors’ Report onInternal Controls and Compliance
Year ended December 31, 2010

88 East Broad Street, Fifth Floor, Columbus, Ohio 43215‐3506 Phone: 614‐466‐4514 or 800‐282‐0370 Fax: 614‐466‐4490
www. auditor.state.oh.us
Members of City Council City of Mason 6000 Mason-Montgomery Road Mason, Ohio 45040 We have reviewed the Independent Auditors’ Report of the City of Mason, Warren County, prepared by Clark, Schaefer, Hackett & Co., for the audit period January 1, 2010 through December 31, 2010. Based upon this review, we have accepted these reports in lieu of the audit required by Section 117.11, Revised Code. The Auditor of State did not audit the accompanying financial statements and, accordingly, we are unable to express, and do not express an opinion on them. Our review was made in reference to the applicable sections of legislative criteria, as reflected by the Ohio Constitution, and the Revised Code, policies, procedures and guidelines of the Auditor of State, regulations and grant requirements. The City of Mason is responsible for compliance with these laws and regulations. Dave Yost Auditor of State August 15, 2011

This Page is Intentionally Left Blank.
TABLE OF CONTENTS
Report on Internal Control Over Financial Reporting and on Complianceand Other Matters Based on an Audit of Financial Statements Performedin Accordance with Government Auditing Standards ..........................................................1 – 2
Schedule of Findings and Responses.............................................................................................. 3

This Page is Intentionally Left Blank.
one east fourth street, ste. 1200
cincinnati, oh 45202
www.cshco.com
p. 513.241.3111
f. 513.241.1212
cincinnati | columbus | dayton | middletown | springfield
REPORT ON INTERNAL CONTROL OVER FINANCIAL REPORTINGAND ON COMPLIANCE AND OTHER MATTERS BASED ON AN AUDIT OF FINANCIAL STATEMENTS PERFORMED IN ACCORDANCEWITH GOVERNMENT AUDITING STANDARDS
To City CouncilCity of Mason, Ohio:
We have audited the financial statements of the governmental activities, the business-type activities, each major fund, and the aggregate remaining fund information of the City of Mason, Ohio (the City) as of and for the year ended December 31, 2010, which collectively comprise the City’s basic financial statements and have issued our report thereon dated June 23, 2011. We conducted our audit in accordance with auditing standards generally accepted in the United States of America and the standards applicable to financial audits contained in Government Auditing Standards, issued by the Comptroller General of the United States.
Internal Control Over Financial Reporting
In planning and performing our audit, we considered the City’s internal control over financial reporting as a basis for designing our auditing procedures for the purpose of expressing our opinions on the financial statements, but not for the purpose of expressing an opinion on the effectiveness of the City’s internal control over financial reporting. Accordingly, we do not express an opinion on the effectiveness of the City’s internal control over financial reporting.
A deficiency in internal control exists when the design or operation of a control does not allow management or employees, in the normal course of performing their assigned functions, to prevent, or detect and correct misstatements on a timely basis. A material weakness is a deficiency, or a combination of deficiencies, in internal control such that there is a reasonable possibility that a material misstatement of the entity’s financial statements will not be prevented, or detected and corrected on a timely basis.
Our consideration of internal control over financial reporting was for the limited purpose described in the first paragraph of this section and was not designed to identify all deficiencies in internal control over financial reporting that might be deficiencies, significant deficiencies or material weaknesses. We did not identify any deficiencies in internal control over financial reporting that we consider to be material weaknesses, as defined above. However, we identified certain deficiencies in internal control over financial reporting described in the accompanying schedule of findings and responses as item 2010-1 that we consider to be a significant deficiency in internal control over financial reporting. A significant deficiency is a deficiency, or a combination of deficiencies, in internal control that is less severe than a material weakness, yet important enough to merit attention by those charged with governance.
Compliance And Other Matters
As part of obtaining reasonable assurance about whether the City's financial statements are free of material misstatement, we performed tests of its compliance with certain provisions of laws, regulations, contracts and grant agreements, noncompliance with which could have a direct and material effect on the determination of financial statement amounts. However, providing an opinion on compliance with those provisions was not an objective of our audit and, accordingly, we do not express such an opinion. The results of our tests disclosed no instances of noncompliance or other matters that are required to be reported under Government Auditing Standards.
We noted certain matters that we reported to management of the City in a separate letter dated June 23, 2011.
The City's response to the findings identified in our audit is described in the accompanying schedule of findings and responses. We did not audit the City's response and, accordingly, we express no opinion on it.
This report is intended solely for the information and use of management, City Council, the Ohio Auditor of State and others within the entity, and is not intended to be and should not be used by anyone other than these specified parties.
Cincinnati, OhioJune 23, 2011
2
CITY OF MASON, OHIOSchedule of Findings and ResponsesYear Ended December 31, 2010
Finding 2010-1 – Prior Period Adjustment
A prior period adjustment was needed to record a prepaid item related to a joint operating agreement with Mason City School District for the City’s Community Center. The City restated net assets/fund balance by $1,259,766 to account for this change. Throughout the year, the City maintains its books and records on the cash-basis of accounting and converts its financial statements at year-end to generally accepted accounting principles. The adjustment was necessary to correct the City’s conversion process and financial reporting of the transaction. Under our professional auditing standards, prior period adjustments are considered to an indicator that internal controls over financial reporting did not function as designed.
Management Response: The Mason Community Center Joint Use and Operation Agreement between the City of Mason and Mason City Schools was not clear on how the remaining balance would be utilized or how much may be refunded back to each organization. Even though the prepaid occurred in a prior period, it was not known that it was a prepaid and how much the prepaid was until it was resolved between the City of Mason and Mason City Schools in 2010.
3

This Page is Intentionally Left Blank.
Comprehensive Annual Financial Report
City of Mason
Mason, Ohio 45040 Year Ended December 31, 2010
City of Mason, Ohio
Comprehensive Annual Financial Report
Year Ended December 31, 2010
Prepared by: Finance Department
Joseph Reigelsperger Finance Director
i

THIS PAGE INTENTIONALLY LEFT BLANK
ii
City of Mason, OhioTable of ContentsFor the Year Ended December 31, 2010
Page
INTRODUCTORY SECTIONLetter of Transmittal viiList of Principal Officials xiiiCity Organizational Chart xivCertificate of Achievement for Excellence in Financial Reporting xv
FINANCIAL SECTIONIndependent Auditors' Report 1Management's Discussion and Analysis 3
Basic Financial Statements:Government-wide Financial Statements:
Statement of Net Assets 15Statement of Activities 16
Fund Financial Statements:Balance Sheet - Governmental Funds 18Reconciliation of Total Governmental Fund Balances to Net Assets of Governmental Activities 21Statement of Revenues, Expenditures and Changes in Fund Balance - Governmental Funds 22Reconciliation of the Statement of Revenues, Expenditures, and Changes in Fund Balance of Governmental Funds to the Statement of Activities 24Statement of Net Assets - Proprietary Funds 26Statement of Revenues, Expenses and Changes in Fund Net Assets - Proprietary Funds 28Statement of Cash Flows - Proprietary Funds 30Statement of Fiduciary Assets and Liabilities - Fiduciary Fund 32
Notes to the Basic Financial Statements 33
Required Supplementary Information:Schedule of Revenues, Expenditures and Changes in Fund Balance - Budget and Actual
(Non-GAAP Budgetary Basis) - General Fund 63Schedule of Revenues, Expenditures and Changes in Fund Balance - Budget and Actual
(Non-GAAP Budgetary Basis) - Street Construction, Maintenance and Repair 68Schedule of Revenues, Expenditures and Changes in Fund Balance - Budget and Actual
(Non-GAAP Budgetary Basis) - Fire and Emergency Medical Service Fund 69Notes to the Required Supplementary Information 70
Combining Statements and Individual Fund Schedules:Nonmajor Governmental Funds:
Fund Descriptions 73Combining Balance Sheet 74Combining Statement of Revenues, Expenditures and Changes in Fund Balance 75
Nonmajor Special Revenue Funds:Fund Descriptions 76Combining Balance Sheet 78Combining Statement of Revenues, Expenditures and Changes in Fund Balance 82Individual Fund Schedules of Revenues, Expenditures and Changes in Fund Balance - Budget and Actual (Non-GAAP Budgetary Basis):
State Highway Improvement Fund 86Street Subdivision Fund 87
iii
City of Mason, OhioTable of ContentsFor the Year Ended December 31, 2010
Table Page
Federal Grant Fund 88Police Officer Training Fund 89Parks and Recreation Fund 90Police Crime Prevention Fund 91Drug Law Enforcement Fund 92Law Enforcement and Education Fund 93Indigent Driver Fund 94Municipal Court Computer Costs Fund 95Municipal Court Computer Education Fund 96Municipal Court Improvement Fund 97Vehicle Immobilization Fee Fund 98Municipal Court Probation Services Fund 99Municipal Court Indigent Driver IDAM Fund 100Subdivision Inspection Fund 101Central Parke TIF Fund 102Mason Enterprise Parke TIF Fund 103Tylersville Road TIF Fund 104I-71 Corridor TIF Fund 105
Nonmajor Debt Service Funds:Fund Descriptions 107Combining Balance Sheet 108Combining Statement of Revenues, Expenditures and Changes in Fund Balance 110Individual Fund Schedules of Revenues, Expenditures and Changes in Fund Balance - Budget and Actual (Non-GAAP Budgetary Basis):
General Obligation Bond Retirement Fund 112Special Assessment Bond Retirement Fund 113Tax Increment Financing Bond Retirement Fund 114Government Center Bond Retirement Fund 115
Nonmajor Funds:Agency Funds
Fund Descriptions 116Statement of Changes in Assets and Liabilities 117
STATISTICAL SECTIONNet Assets by Component 1 121Changes in Net Assets 2 122Governmental Activities Tax Revenues by Source 3 125Fund Balances of Governmental Funds 4 126Changes in Fund Balances of Governmental Funds 5 128Income Tax Revenue by Payer Type 6 130Assessed and Estimated Actual Value of Taxable Property 7 131Property Tax Rates - Direct and Overlapping Governments 8 132Principal Property Taxpayers 9 133Property Tax Levies and Collections - Real, Public Utility and Tangible Personal Property 10 134Special Assessment Billings and Collections 11 135Ratios of Outstanding Debt by Type 12 136
iv
City of Mason, OhioTable of ContentsFor the Year Ended December 31, 2010
Table Page
STATISTICAL SECTION (Continued)Ratios of Net General Bonded Debt Outstanding To Assessed Value and Net Bonded
Debt Per Capita 13 137Ratio of Annual Debt Service Expenditures For General Obligation Bonded Debt To Total
General Government Expenditures 14 138Direct and Overlapping Governmental Activities Debt 15 139Legal Debt Margin Information 16 140Pledged-Revenue Coverage 17 141Demographic and Economic Statistics 18 142Principal Employers 19 143Full-time City of Mason Employee by Function 20 144Operating Indicators and Capital Asset Statistics 21 145
v

THIS PAGE INTENTIONALLY LEFT BLANK
vi

This Page is Intentionally Left Blank.
INTRODUCTORY SECTION
June 30, 2011 Honorable Mayor, Members of Council, and Citizens of Mason: We are pleased to present the City of Mason Comprehensive Annual Financial Report (CAFR) for the fiscal year ended December 31, 2010. While there are no legal requirements for the preparation of this report, it represents a commitment by the City of Mason to conform to nationally recognized standards of excellence in financial reporting. State law requires that each public office file an annual financial report with the Auditor of State. The State Auditor requires all cities to prepare financial reports within one hundred fifty days after the end of the fiscal year. The financial report must also be in conformity with generally accepted accounting principals (GAAP). The management of the City of Mason, particularly the Director of Finance’s Office, assumes full responsibility for both the completeness and relia-bility of the information contained in this report. The accuracy of the presented data and the completeness and fairness of presentation is assured through a comprehensive framework of internal control that is established for this purpose. Because the cost of internal control should not exceed anticipated benefits, the objective is to provide reasonable, rather than absolute, assurance that the financial statements are free of any material misstatements. Clark, Schaefer, Hackett & Co., Certified Public Accountants, have issue an unqualified (“clean”) opinion on the City of Mason’s financial statements for the year ended December 31, 2010. The independent auditor’s report is located at the front of the financial section of this report. Management’s discussion and analysis (MD&A) immediately follows the independent auditor’s report and provides a narrative introduction,
overview, and analysis of the basic financial statements. MD&A complement this letter of transmittal and should be read in conjunction with it.
PROFILE OF THE CITY
Mason has earned a reputation as a progressive, innovative community. The city is located in the southwest portion of Ohio, 22 miles northeast of Cincinnati and 28 miles south of Dayton. It is the largest city in Warren County.
Originally settled as the village of Palmyra in 1815 by Major William Mason, the community was renamed in his honor 20 years later. Incorporated as a city in 1971, Mason is governed by a charter that establishes guidelines for its operations. Mason is a home-rule city with a council/manager form of government. The legislative body of Mason consists of a mayor and six council members who are responsible for the legislative affairs of the city. Council also makes appointments to various statutory and advisory boards and appoints the City Manager, Law Director, and Clerk of Council.
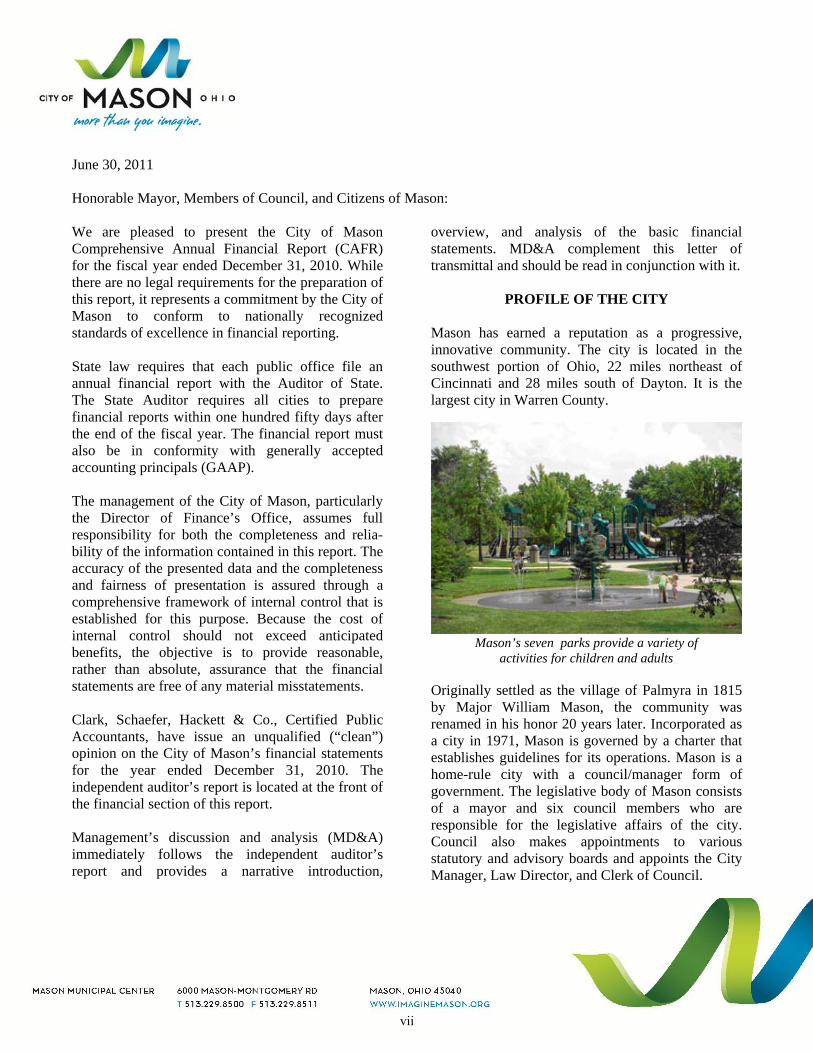
Mason’s seven parks provide a variety of activities for children and adults
vii
As chief executive officer, the City Manager is responsible for enforcement of all laws and ordinances and the efficient delivery of all city services. The city provides many of the municipal services normally associated with a municipality, including emergency services; street construction and maintenance; full engineering, building, and planning services; recreation space and activities; and business recruitment and retention. Sanitary sewer, stormwater, and solid waste collection and disposal services are provided under an Enterprise Fund concept, with user charges set by City Council to ensure adequate coverage of oper-ating expenses and payments on outstanding debt. The city also operates a Community Center and Golf Course through Enterprise Funds. The annual budget for the City of Mason serves as the foundation for the city’s financial planning and control. As required by the charter, the City Manager prepares and submits the annual budget and capital program to the council. After a review and final recommendation from Council’s Finance Committee, the budget is legally enacted through passage of the annual appropriation ordinance. Department heads, with approval from the Finance Director, may transfer resources below the object/fund level that was approved by Council. However, only Council, using a supplemental appropriation or re-appropriation ordinance, may approve any increase in appropriation or transfers between levels identified in the annual appropriation ordinance before the end of the fiscal year.
LOCAL ECONOMY Mason’s industrial facilities employ an estimated 22,000 persons, equivalent to about three quarters of the city’s nighttime population of 30,712. Three of the ten largest employers in Warren County are located in Mason. The city’s ten largest employers provide work for more than 6,000 persons and generated more than $6.4 million in income tax revenue in 2010. Overall, it is estimated that there are more than 700 businesses that operate within Mason’s 18 square miles.
Mason continues to attract quality companies that are relocating or expanding. In choosing Mason, companies cite prime location along the interstates,
availability of land for development within established business parks, rising property values, the established core of high-tech businesses, available workforce, and an exceptional level of support and services with a favorable business environment widely promoted in the region. Tax incentives targeting high-tech businesses and light industry are strong inducements as well. Additionally, interest in the marriage between tourism, Warren County’s top industry, and business development continues to be a focus for Mason.
In the last fifteen years, Mason has become home to numerous national companies and has one of the region’s largest complements of international businesses. The Greater Cincinnati, Ohio, region ranks twentieth in total exports among U.S. cities. Mason contributes to the region’s worldwide impact, being home to a number of the region’s more than 1,000 firms engaged in international trade that generate annual export sales of over $6 billion. More than 300 firms from Japan, Western Europe, and Canada have established facilities in the Greater Cincinnati, Ohio, region.
In an effort to further enhance Mason’s foreign investment strategy, the city joined CincinnatiUSA Partnership’s Regional Economic Development Council (REDC) in 2001. This regional marketing partnership has lent remarkable strength and leverage to Mason’s work on both national and international recruitment projects. Mason renewed its commitment to this innovative regional strategy in 2009, with a three-year commitment as one of thirteen members—and only the third city—to come
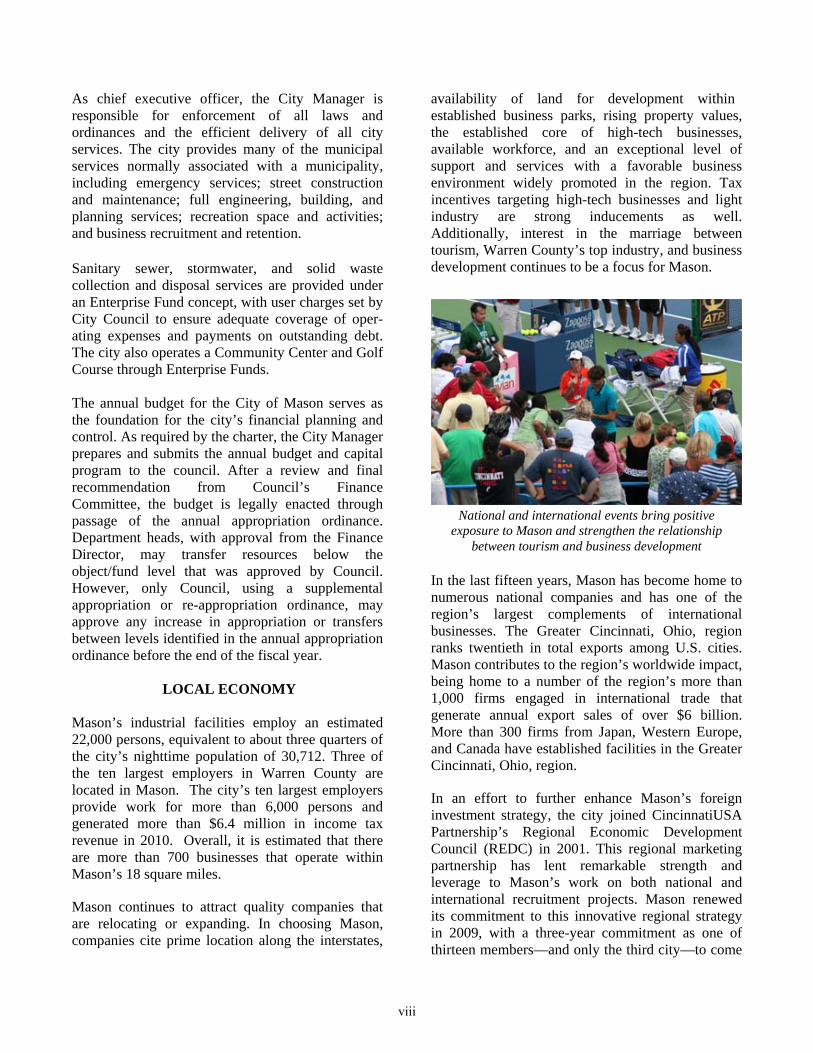
National and international events bring positive exposure to Mason and strengthen the relationship
between tourism and business development
viii
together to make marketing and recruitment decisions for the Greater Cincinnati region.
The CincinnatiUSA organization strengthens a methodology of continued relationship maintenance with valuable contacts in Europe and Asia, giving Mason the opportunity to tell the unique stories of our corporate investors to companies outside the U.S. that are looking to start new U.S. operations. The REDC Partnership in years 2004-2006 is estimated to have shown a value of well over $350,000 of marketing and recruitment outreach value during the three-year term. With Mason’s annual participation of $25,000, the return on investment for marketing leverage, exposure, and opportunity continues to be substantial.
In 2007, the city negotiated a contribution renewal through 2009 that combined two organizations: CincinnatiUSA Partnership for Economic Development and CincyTechUSA. This new agreement provided Mason with membership on the Board of Governors and partnership with the CincyTech management team. The target business sectors that the CincinnatiUSA and CincyTech partnerships helped the city reach included emerging markets, entrepreneurs, information technology, biosciences, and advanced manufacturing. These partnerships have helped give Mason a high profile among investment prospects and have set the city apart from the efforts of competing communities. A renewal of the agreement in 2010 provides the city with leverage for continuing to reach these markets important to the city’s overall economic development goals.
The year 2010 marked the city’s sixth year of operating with the Mason Port Authority. This economic development tool has already provided advantageous flexibility with financial recruitment options. Since its inception, the Port has helped retain over 208 jobs and allowed the city to attract more than $7 million in new capital investment, with over 130 new jobs to be created. The Mason Port Authority makes regular proposals to major prospects, often in combination with the marketing of the city’s industrial property on S.R. 741. The Port has facilitated these opportunities for Mason that would not have been possible without this important economic development tool.
Mason’s reputation as a serious business environment is confirmed by corporate decisions to consolidate here and move jobs and investment to the city. New investments reported in 2010 were over $12 million as 169,807 square feet of new corporate and industrial space were added, bringing over 190 announced new jobs to the community. The slow economic conditions did have an impact in Mason, reducing the new investment numbers and job creation to low levels. However, even in a down national economy, Mason’s 2010 new investment numbers for industrial and corporate sectors trended in the black, ending the year with projects in the pipeline that are expected to be realized in 2011.
The diversified tax base in Mason allows the continued reporting of annual growth in 2010 with 15 projects that were a combination of new jobs, new square footage, and new investments. The combined new investment revenues for 2008 through 2010 were over $101.7 million, with over 479,000 new square feet and over 1,500 new jobs. 2010 kicked off several large developments now underway or complete: the $3.1 million new City of Mason Fire Station 51 and administrative offices, Sinclair Community College’s $2 million land purchase intended for expansion, a $1.8 million investment for the Top Gun Sales Performance expansion, the $2.143 million investment by L-3 Communications, and a $950,000 investment made by Tide Dry Cleaners for their new location.
In 2010, industrial and office absorption continued the trend, with the private sector focusing heavily on existing real estate for expansion opportunities and mergers and acquisitions. Since Mason is
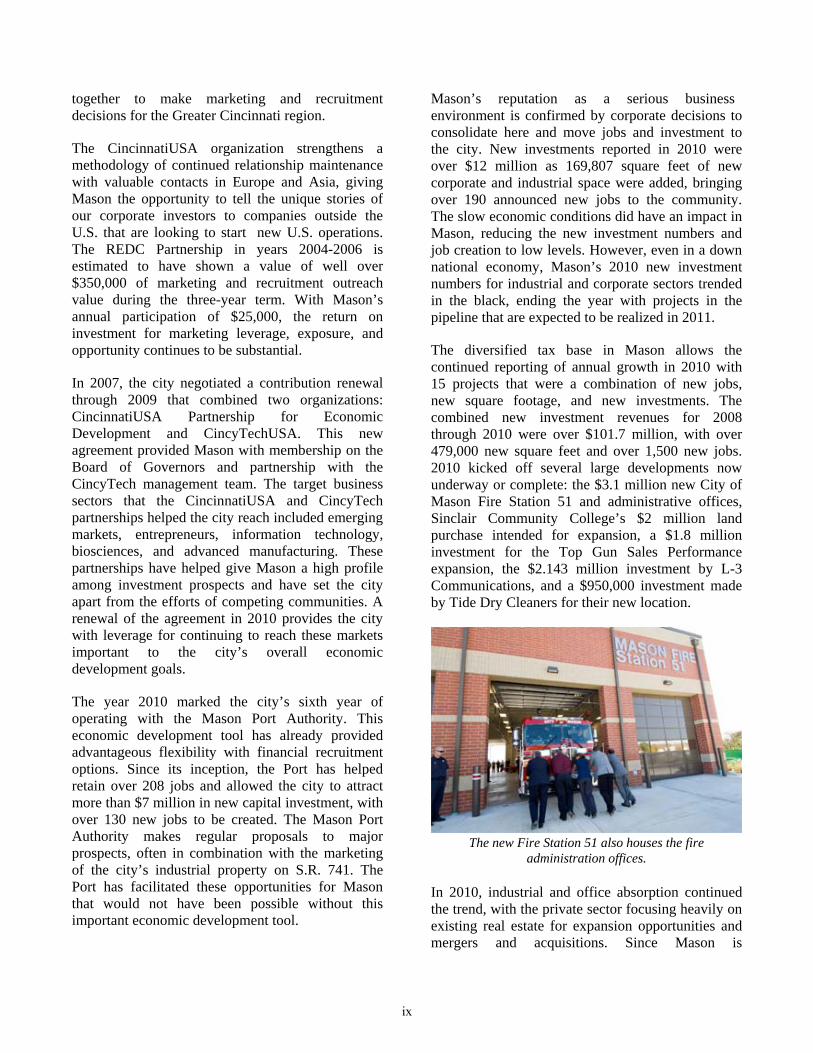
The new Fire Station 51 also houses the fire administration offices.
ix
traditionally strong within the build-to-suit sector, the city does not have a large supply of vacant buildings, making some major regional opportunities not available to the city, such as Tata Consultancy and GE Corporate Headquarters. Like so many other cities, Mason was impacted by the downturn in job creation within companies located within its borders. Companies that currently receive tax incentives, however, show a combined overall net of 470 jobs above those expected in their growth plans.
As each new investment is announced, job creation and payroll are projected for the next three years. Many of the jobs announced have already been realized by the city and many others will be realized in the next two years. The following projects were the largest new developments announced in the City of Mason for 2010:
Corporate investment (new capital)
New Capital City of Mason Fire Station and Administrative Offices
$3.1 M
L-3 Communications $3.1 M Sinclair Community College $2.0 M Top Gun Sales Performance $1.8 M Tide Dry Cleaners $950 K
Growth and development in the City of Mason are expected to continue. Efforts to focus on growth sectors and emerging markets that bring high rates of return to the city are the key focus of the city’s economic strategy. In 2010, Mason saw continued interest in land sales and new construction in the industrial, manufacturing, and specialty healthcare and pharmaceutical sectors. Recognizing that the regional market outlook predicts flat activity into the next several years, Mason still expects to see positive commercial activity. The city’s physical location, municipal facilities, developable terrain, services and utilities, and the progressive attitude and actions of city council, administration, and citizens are strong assets. Focal areas for future growth are city-owned land that continues to offer competitive options for new investors and the I-71 corridor, which has over 600 acres of undeveloped land that has attracted the attention of the development community. Mason is
also well attuned to the benefit of destination construction such as Great Wolf Lodge, new investments by Kings Island amusement park, and the expansion of high-profile events such as the Tennis Masters Series and related sports events, which are expected to drive more interest in tourism development. The city’s economic development efforts fully recognize a positive relationship between destination tourism and the development of conference, technology, and office development.
LONG-TERM FINANCIAL PLANNING
As part of the annual budgeting process, the city administration prepares a capital improvement plan for the next five years. City Council then reviews and prioritizes the projects. In addition to the capital improvement plan, the City of Mason uses a financial forecast of both operating and capital expenditures. Using these tools, Council makes policy decisions and allocates financial resources for long-term financial planning.
RELEVANT FINANCIAL POLICIES In 2007, Mason’s voters approved a ballot issue to phase in a full income tax credit for residents who pay a municipal income tax to other cities. In prior years, Mason residents received a credit of 50% of taxes paid to other municipalities. The charter amendment increased the credit to 65% in 2007,
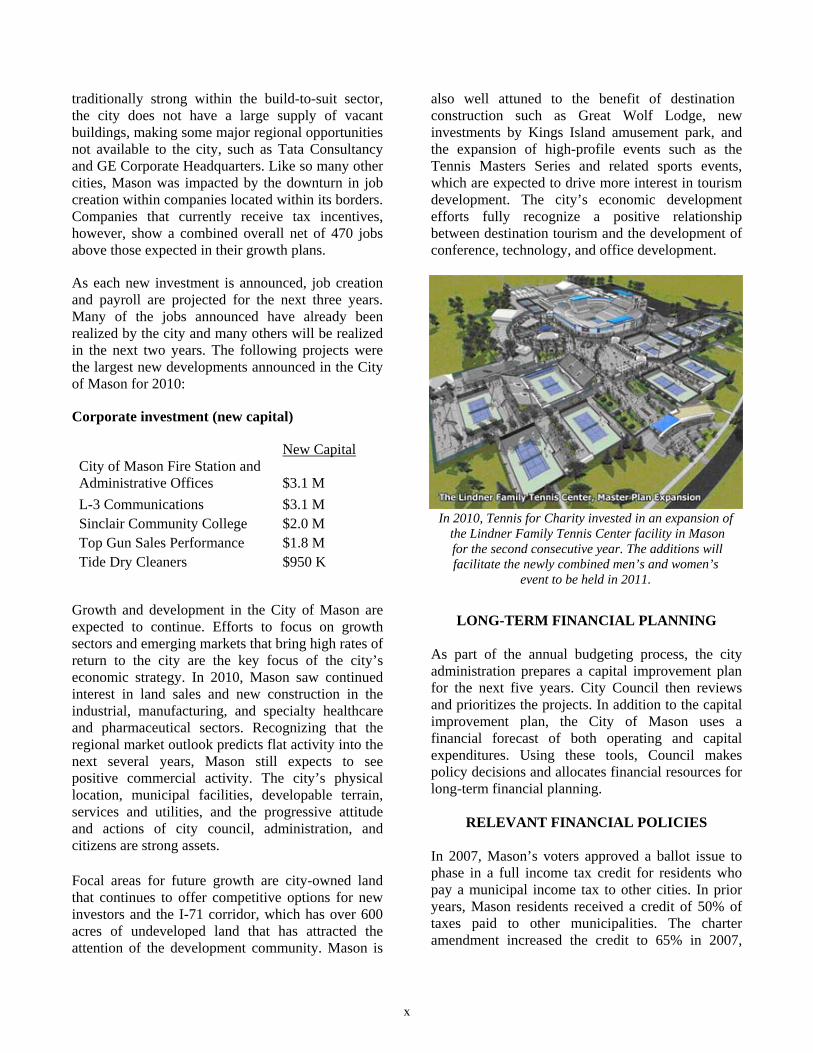
In 2010, Tennis for Charity invested in an expansion of the Lindner Family Tennis Center facility in Mason for the second consecutive year. The additions will facilitate the newly combined men’s and women’s
event to be held in 2011.
x
80% in 2008, 90% in 2009, and 100% (full credit) in 2010 and later years. Most of the loss in revenue from residents is expected to be offset by the consistent increase in collections from businesses and by non-resident withholding. The City of Mason continues its policy of using only reliable financial resources when budgeting for operating costs. One-time resources and resources at risk of being eliminated are used for one-time expenditures, capital improvements, or debt reduction. State law is phasing out tangible personal property tax that is assessed on business inventory, machines, and equipment. As part of the phase-out, the state is reimbursing local governments for lost revenue for a limited period of time. In consideration, the City of Mason continues to decrease its reliance upon decreasing revenue sources for operating expenses.
MAJOR INITIATIVES For the Year 2010
Mason’s citizens are the city’s greatest asset. Therefore, in preparing each year’s budget, our customers’ needs for services and the safeguarding of their environment in conformity with applicable federal and state standards are the government’s greatest concern. Mason’s success has been its ability to equitably balance the needs of residents and businesses. Major events that occurred in 2010 that position the city for future economic growth and improvement include: Community Center Expansion In 2009, construction began on the Mason Community Center expansion and an attached office facility to be leased by TriHealth for medical offices. The partnership with TriHealth extends the city’s track record of success in developing mutually beneficial relationships that deliver enormous and cost-effective benefits to the residents of Mason. The partnership with TriHealth is anticipated to increase market exposure to the Mason Community Center and thereby help the center regain and increase its market share while continuing its focus on serving area families. This, in turn, will strengthen the
financial position of the center into the future. The expanded center opened in the fall of 2010.
Mason Road Widening The City of Mason has continued its investment into infrastructure. In 2010, construction was completed on the $4.0 million widening of Mason Road from an existing two-lane roadway to a three-lane roadway with curb and gutter. The roadway was widened from West Main Street to the western corporation limits. Also included were curb and gutter, sidewalk, bike path, storm sewers, landscaping, and street trees. Fire Station 51 Relocation During 2010, work was completed on relocating Station 51 and fire administrative offices from downtown Mason to the north, to the southwest corner of Alliance Drive and Mason-Montgomery Road.
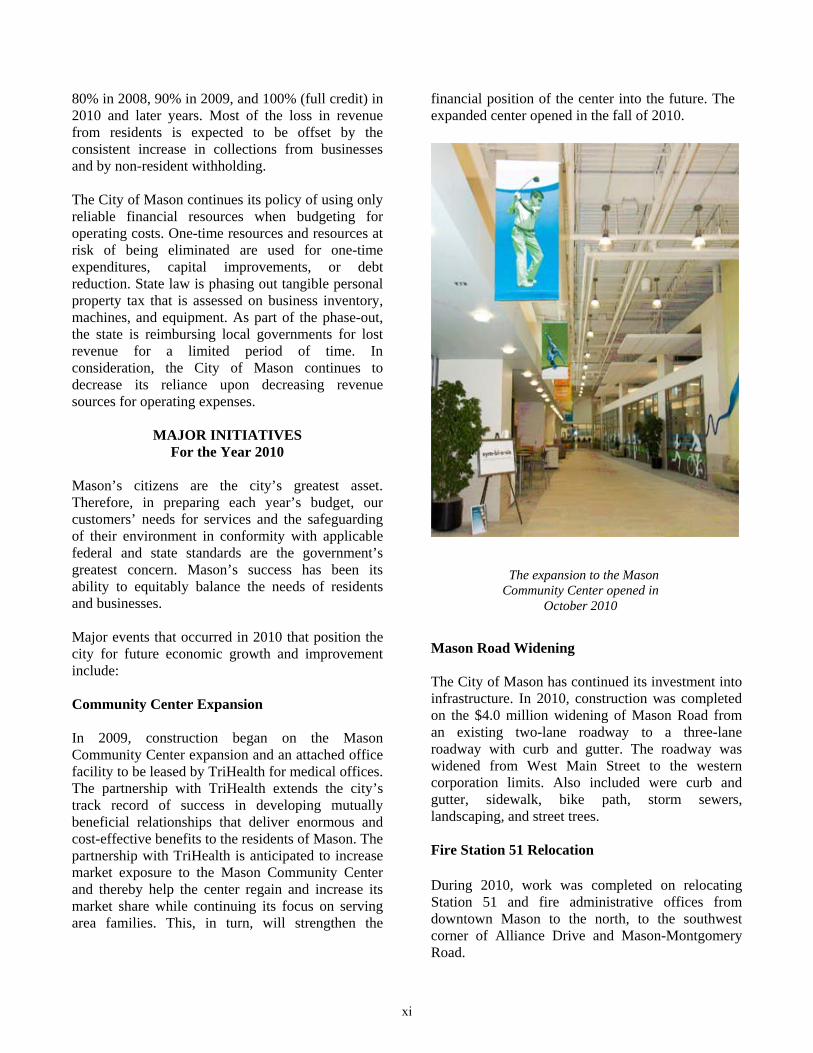
The expansion to the Mason Community Center opened in
October 2010
xi
Infrastructure Improvements Besides the Community Center Expansion, Mason Road improvement, and the Fire Station relocation, other infrastructure improvements in 2010 included the construction of the first roundabout in Mason (on Mason Road at the Hickory Woods Drive intersection), First Avenue/S Forest Street Storm Sewer improvement, the Mason Sports Park Effluent Irrigation Project, the U.S. 42 Trunk Sewer North (Phase 3) Improvement, US 42/ Tylersville intersection improvements, elimination of the Bethany Road/Parkside lift station.. Looking Ahead to the Future Accomplishments to look forward to in 2011 include:
• Completing the design and beginning right-of-
way acquisition for the Bethany Road roundabout.
• Beginning construction of the U.S. 42 im-provements.
• Additional engineering work on the I-71/ Western Row Road Interchange Project, including assessment and recommendation of the feasible alternative, environmental studies, and refined cost estimates.
• Updating the Wastewater and Stormwater Master Plans.
• Relocating the Bethany Road Force Main. • Storm sewer project on Church Street & Forest
Avenue.
AWARDS AND ACKNOWLEDGEMENTS The Government Finance Officers Association (GFOA) awarded a Certificate of Achievement for Excellence in Financial Reporting to the City of Mason for its comprehensive annual financial report (CAFR) for the fiscal year ended December 31, 2009. Mason has been awarded the Certificate of Achievement each year beginning in 1997. In order to be awarded a Certificate of Achievement, the city had to publish an easily readable and efficiently organized CAFR that satisfies both generally accepted accounting principles and applicable legal requirements. A Certificate of Achievement is valid for a period of one year only. We believe our current report conforms to the Certificate of Achievement Program requirements. It is being submitted to GFOA to determine its eligibility for an award for another certificate. Our most sincere appreciation is extended to all members of the staff whose efforts have made this report possible, including Mary Mueller, Bev Salatin, the staff of Plattenburg & Associates, Inc., and Clark, Schaefer, Hackett & Co. for their dedicated service in the preparation of this comprehensive annual financial report.
Sincerely,
Eric Hansen Joseph J. Reigelsperger City Manager Finance Director
xii
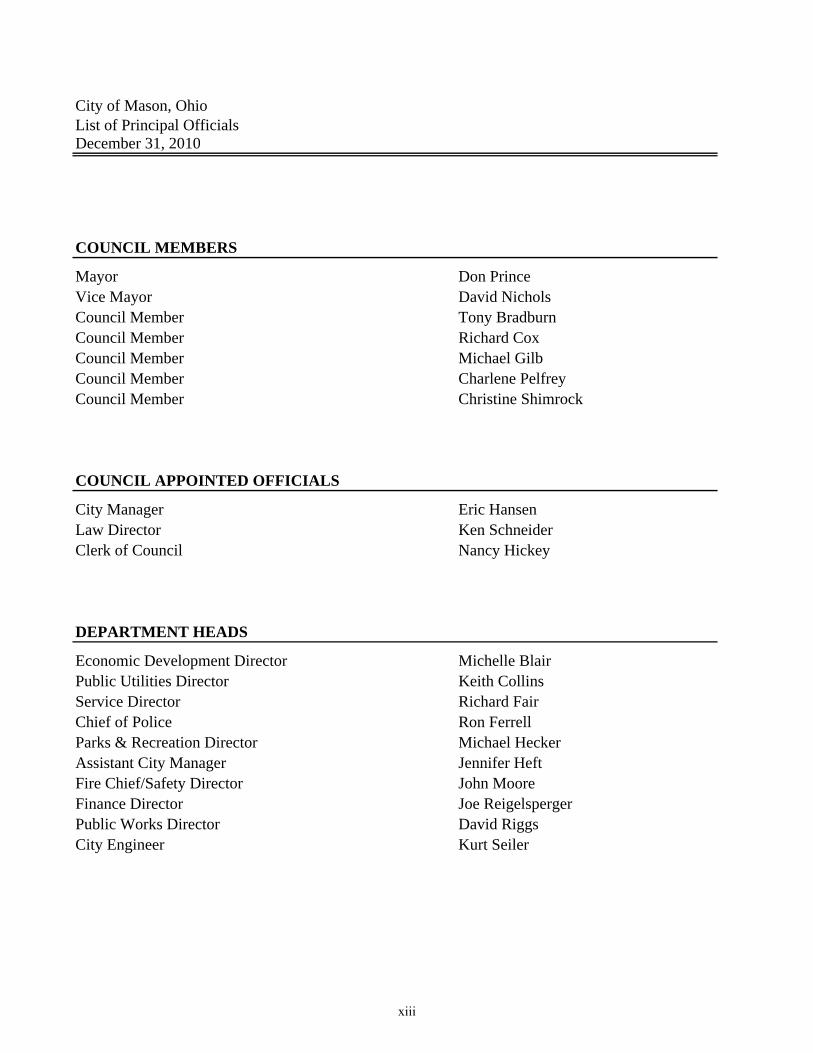
City of Mason, Ohio List of Principal Officials
COUNCIL MEMBERS
Mayor Don PrinceVice Mayor David NicholsCouncil Member Tony BradburnCouncil Member Richard CoxCouncil Member Michael GilbCouncil Member Charlene PelfreyCouncil Member Christine Shimrock
COUNCIL APPOINTED OFFICIALS
City Manager Eric HansenLaw Director Ken SchneiderClerk of Council Nancy Hickey
DEPARTMENT HEADS
Economic Development Director Michelle BlairPublic Utilities Director Keith CollinsService Director Richard FairChief of Police Ron FerrellParks & Recreation Director Michael HeckerAssistant City Manager Jennifer HeftFire Chief/Safety Director John MooreFinance Director Joe ReigelspergerPublic Works Director David RiggsCity Engineer Kurt Seiler
December 31, 2010
xiii
Ci
Res
iden
ts o
f Mas
on
Mas
on C
ity C
ounc
il
M
ayor
Don
Prin
ce
Vic
e-M
ayor
Dav
id N
icho
ls
Tony
Bra
dbur
n
Chr
istin
e Sh
rimro
ck
M
icha
el G
ilb
Cha
rlene
Pel
frey
R
icha
rd C
ox
City
Man
ager
Er
ic H
anse
n
Gov
ernm
ent R
elat
ions
Te
rry
Schu
lte
Law
Dire
ctor
Ke
n Sc
hnei
der
Econ
omic
Dev
elop
men
t M
iche
le B
lair
Bet
h G
ottfr
ied
C
lerk
of C
ounc
il/R
ecep
tioni
st
Nan
cy H
icke
y
Secr
etar
y to
the
City
Man
ager
Jo
an B
erna
rd
Assi
stan
t City
Man
ager
Je
nnife
r Hef
t Pu
blic
Info
rmat
ion
Offi
cer
Jenn
ifer T
repa
l
Hum
an R
esou
rces
Dire
ctor
Ka
ri G
eise
r
Assi
stan
t to
the
City
Man
ager
1
-Vac
ant
IT M
anag
er
Rob
in M
cKee
han
Hum
an R
esou
rces
Tec
hnic
ian
Barb
Her
ing
Park
s &
Rec
reat
ion
Mic
hael
Hec
ker
Engi
neer
ing
& B
uild
ing
Kurt
Seile
r Fi
nanc
e Jo
e R
eige
lspe
rger
Fi
re/S
afet
y D
irect
or
John
Moo
re
Polic
e R
on F
arre
ll Pu
blic
Util
ities
Ke
ith C
ollin
s Pu
blic
Wor
ks
Dav
id R
iggs
Asst
. City
Eng
inee
r 1
Vaca
nt
Proj
ect C
oord
inat
or
Art O
liver
Secr
etar
y Ba
rbar
a B
ecke
lhim
er
Subd
ivis
ion
Engi
neer
Sc
ott B
urkh
ardt
Chi
ef B
uild
ing
Offi
cial
G
reg
Nic
holls
GIS
Man
ager
Am
y Sc
hues
ler
Engi
neer
Tec
hnic
ians
R
yan
Tyre
e St
ephe
n C
adde
ll C
raig
Bar
ksda
le
Secr
etar
y Ke
ndra
Tay
lor
Rec
eptio
nist
W
anda
Lin
dley
Build
ing
Insp
ecto
rs
Bill
Barn
ett
Lore
nzo
Adam
Faci
lity
Man
ager
La
rry
Rud
d
Asst
. Fin
ance
Dire
ctor
M
ary
Mue
ller
Fina
nce
Tech
nici
an
Mar
lene
Bur
nell
Secr
etar
y C
arol
yn B
yrd
Fina
nce
Cle
rk
Bev
Sal
atin
Acco
unt C
lerk
s Ja
son
Sche
ll Je
ssic
a M
anw
arin
g An
anth
anar
ayan
an,
Kalp
agam
2
- Vac
ant
Dep
uty
Chi
ef
Cra
ig B
ryan
t Jo
e H
oyin
g
Secr
etar
y Pa
m E
icke
nhor
st
Lieu
tena
nts
Mar
k G
eran
o D
ave
Man
ning
C
hris
Hey
woo
d R
icha
rd W
entz
el
John
Cer
jan
Scot
t Ray
FT P
aram
edic
s/Fi
refig
hter
s Br
ad W
eesn
er
Gre
g Th
omas
Bi
ll Bl
ades
Pa
ul R
osel
l D
ougl
as N
agel
Aa
ron
Bosc
o Jo
hn S
chau
rer
Nic
hola
s St
ocks
dale
Al
ex C
arr
Dus
tin M
cGhg
hy
Trav
is B
raus
ch
Dou
glas
Woo
llard
As
hley
Lee
D
oug
Rol
ph
Willi
am W
illis
Julie
Sta
nley
Ja
son
Gra
ham
Br
yan
Brum
agen
M
ike
Bree
n N
atha
niel
Wya
tt Jo
rdan
Boy
d
FF/E
MS
/Insp
ecto
r Er
ic D
urbi
n
P
T Fi
re F
ight
ers/
EM
S
Secr
etar
y Ke
lli K
line
Assi
stan
t Chi
ef o
f Pol
ice
Stev
e Sc
huch
art
Todd
Car
ter
Cle
rk
Kare
n E
ve -
Supe
rvis
or
Patti
e C
onno
r Ka
ren
Arp
Terr
y Sa
ylor
Lieu
tena
nts
M
ikel
Car
ter
Nei
l Gar
land
M
icha
el D
owne
y Sc
ott D
ough
man
Je
ff Bu
rson
Offi
cers
S
cott
Bur
dick
A
aron
Yea
ry
Dan
Edw
ards
R
ober
t Tem
ple
S
cott
Spe
ars
C
raig
Klin
e
Bra
d W
alke
r
Der
ek B
aum
an
Nat
han
Ket
tere
r
Jam
ie V
an W
agne
r
Aar
on S
chaf
fer
Bria
n La
hman
M
icha
el B
isho
p
An
drew
Her
linge
r
S
ean
McC
orm
ick
D
anie
l Fry
Vi
ncen
t Moo
re
E
ric F
itzge
rald
Ke
vin
Brya
nt
Ste
phan
ie D
ebol
t
Jeffr
y W
yss
S
haw
n Ar
yes
Levi
Wel
ls
1
Vac
ant
Det
ectiv
es
Don
Cop
e To
ni L
ewis
Tr
oy N
elso
n N
icho
las
Fant
ini
Staf
f Ser
vice
s Lt
. Pau
l Lin
dens
chm
idt
Dar
e O
ffice
R
yan
Tann
er
Scho
ol R
esou
rce
Offi
cer
Karli
Sm
ith
Fore
man
Bo
b Be
han
Kath
y W
ray
Secr
etar
y Pa
tti W
orkm
an
Mai
nten
ance
Wor
kers
Je
ff Ko
hus
Eric
Lyk
ins
Tony
Tra
cy
Mik
e Tr
ader
Be
n Vo
gels
ang
Ric
k O
ppy
Geo
rge
Obe
rle
Larr
y Bu
rres
s Pa
trick
For
d Ke
n Sp
illm
an
Con
rad
Flow
ers
Tren
t Tur
ner
2 - V
acan
t
Mec
hani
cs
Gle
n Ja
nson
Tr
avis
Sid
ers
Mai
nt. W
orke
r/Mec
hani
c R
oy M
oore
Asst
. Sup
erin
tend
ent
Vaca
nt
Stor
m W
ater
Eng
inee
r Ka
thy
Wad
e-D
orm
an
Secr
etar
y Ba
rb O
sten
darp
Util
ity P
roje
ct In
spec
tor
Vaca
nt
Mai
nten
ance
For
eman
Ed
Sm
ith
Mai
nten
ance
Wor
kers
M
ike
Pann
o La
rry
Ree
der
Mik
e Le
dfor
d R
icha
rd M
ahiq
ues
Nea
l Cha
mbe
rlain
Plan
t Ope
rato
rs
Bob
Beye
r Jo
sh C
reec
h Se
th W
ilson
D
avid
Jan
des
Fina
nce
Cle
rk
Gal
e Lo
ng
Secr
etar
y Sh
eri C
ollin
s
Man
ager
St
eve
Gay
field
– F
acilit
ies
Chr
issy
Ave
ry -
Rec
reat
ion
Sale
s an
d M
arke
ting
Adv
isor
La
cey
Luxo
n
Mai
nten
ance
Sup
ervi
sor
Don
Alle
n
Mai
nten
ance
Wor
kers
S
teve
McN
amee
D
ean
Tayl
or
Troy
App
lega
te
Dar
ryl D
avis
D
evon
Mar
tin
1 - V
acan
t
Mem
bers
hip
Ser
vice
s Su
perv
isor
D
ana
Mai
denb
erg
Rec
reat
ion
Supe
rvis
ors
Angi
e G
ardn
er
Dan
e Bu
rche
tt
Nat
asha
Coo
ley
Gro
up F
itnes
s Ad
viso
r La
ura
Sw
artz
el
Wel
lnes
s Su
perv
isor
Ke
lly H
urst
IT T
echn
icia
n Er
ic M
eist
er
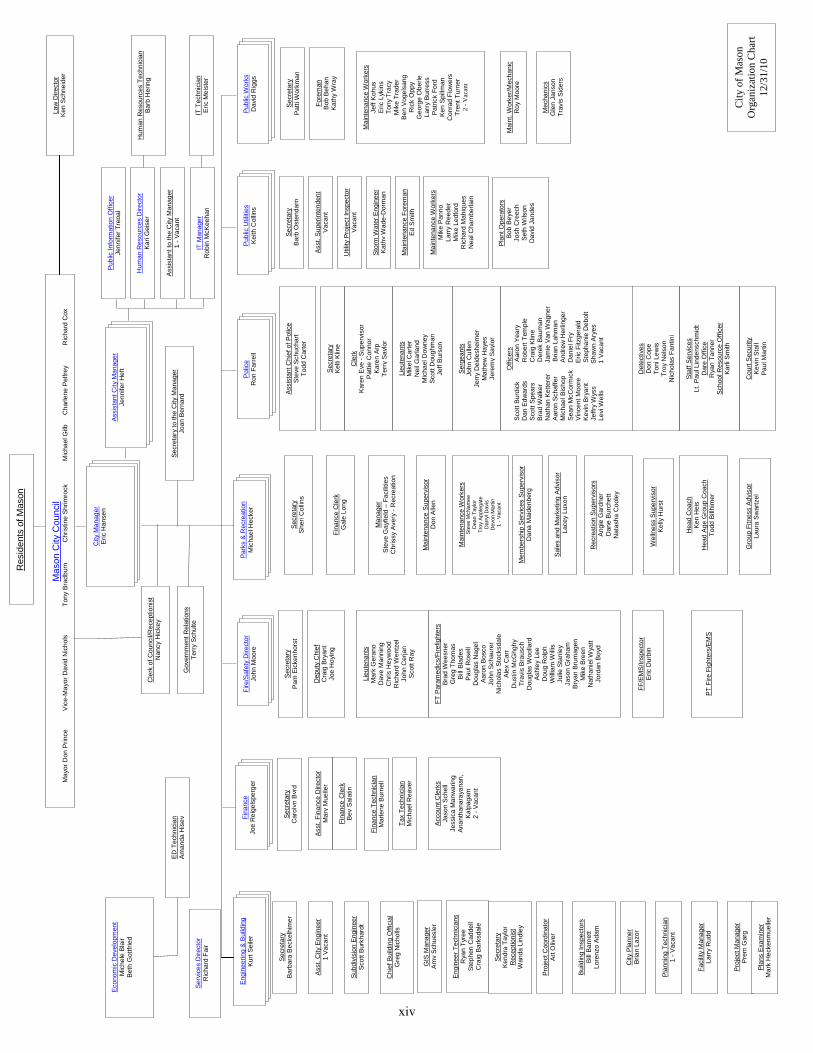
City
of M
ason
O
rgan
izat
ion
Cha
rt 12
/31/
10
Cou
rt Se
curit
y Ke
vin
Stal
l Pa
ul M
artin
Proj
ect M
anag
er
Prem
Gar
g
Plan
s Ex
amin
er
Mar
k H
ecke
nmue
ller
Serv
ices
Dire
ctor
R
icha
rd F
air
ED T
echn
icia
n Am
anda
His
ey
Tax
Tech
nici
an
Mic
hael
Rea
ver
Hea
d C
oach
Ke
n H
eis
Hea
d Ag
e G
roup
Coa
ch
Todd
Bill
him
er
City
Pla
nner
Br
ian
Lazo
r
Plan
ning
Tec
hnic
ian
1 - V
acan
t
Serg
eant
s
John
Cul
len
Jerr
y D
eide
shei
mer
M
athe
w H
ayes
Je
rem
y Sa
ylor
xiv
Certificate of
Presented to
City of Mason
For its Comprehensive Annual
December 31, 2009
President
Executive Director
Financial Reportfor the Fiscal Year Ended
Reportingin Financial
for ExcellenceAchievement
Text38: Ohio
A Certificate of Achievement for Excellence in FinancialReporting is presented by the Government Finance Officers
Association of the United States and Canada togovernment units and public employee retirement
systems whose comprehensive annual financialreports (CAFRs) achieve the higheststandards in government accounting
and financial reporting.
xv
THIS PAGE INTENTIONALLY LEFT BLANK
xvi
FINANCIAL SECTION
one east fourth street, ste. 1200
cincinnati, oh 45202
www.cshco.com
p. 513.241.3111
f. 513.241.1212
cincinnati | columbus | dayton | middletown | springfield
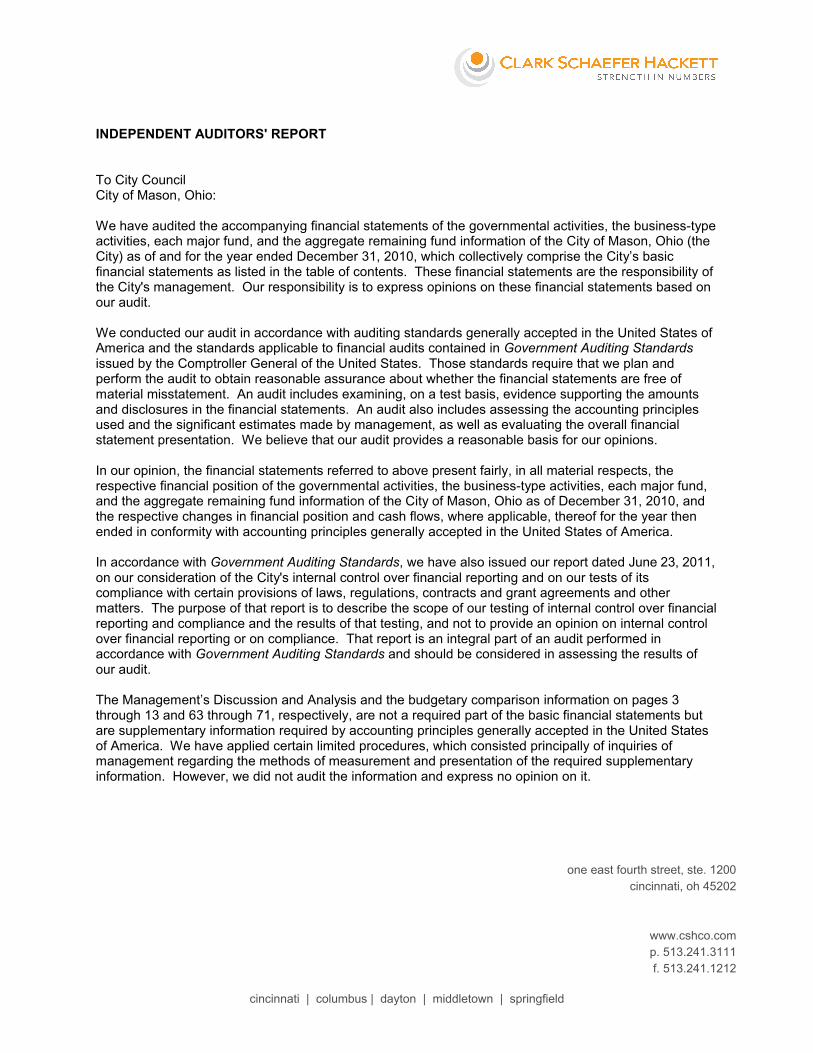
INDEPENDENT AUDITORS' REPORT
To City CouncilCity of Mason, Ohio:
We have audited the accompanying financial statements of the governmental activities, the business-type activities, each major fund, and the aggregate remaining fund information of the City of Mason, Ohio (the City) as of and for the year ended December 31, 2010, which collectively comprise the City’s basic financial statements as listed in the table of contents. These financial statements are the responsibility of the City's management. Our responsibility is to express opinions on these financial statements based on our audit.
We conducted our audit in accordance with auditing standards generally accepted in the United States of America and the standards applicable to financial audits contained in Government Auditing Standardsissued by the Comptroller General of the United States. Those standards require that we plan and perform the audit to obtain reasonable assurance about whether the financial statements are free of material misstatement. An audit includes examining, on a test basis, evidence supporting the amounts and disclosures in the financial statements. An audit also includes assessing the accounting principles used and the significant estimates made by management, as well as evaluating the overall financial statement presentation. We believe that our audit provides a reasonable basis for our opinions.
In our opinion, the financial statements referred to above present fairly, in all material respects, the respective financial position of the governmental activities, the business-type activities, each major fund, and the aggregate remaining fund information of the City of Mason, Ohio as of December 31, 2010, and the respective changes in financial position and cash flows, where applicable, thereof for the year then ended in conformity with accounting principles generally accepted in the United States of America.
In accordance with Government Auditing Standards, we have also issued our report dated June 23, 2011, on our consideration of the City's internal control over financial reporting and on our tests of its compliance with certain provisions of laws, regulations, contracts and grant agreements and other matters. The purpose of that report is to describe the scope of our testing of internal control over financial reporting and compliance and the results of that testing, and not to provide an opinion on internal control over financial reporting or on compliance. That report is an integral part of an audit performed in accordance with Government Auditing Standards and should be considered in assessing the results of our audit.
The Management’s Discussion and Analysis and the budgetary comparison information on pages 3through 13 and 63 through 71, respectively, are not a required part of the basic financial statements but are supplementary information required by accounting principles generally accepted in the United States of America. We have applied certain limited procedures, which consisted principally of inquiries of management regarding the methods of measurement and presentation of the required supplementary information. However, we did not audit the information and express no opinion on it.
Our audit was conducted for the purpose of forming opinions on the financial statements that collectively comprise the City of Mason, Ohio’s basic financial statements. The introductory section, combining and individual nonmajor fund financial statements and schedules, and statistical tables are presented for purposes of additional analysis and are not a required part of the basic financial statements. The combining and individual nonmajor fund financial statements and schedules have been subjected to the auditing procedures applied in the audit of the basic financial statements and, in our opinion, are fairly stated in all material respects in relation to the basic financial statements taken as a whole. The introductory section and statistical tables have not been subjected to the auditing procedures applied in the audit of the basic financial statements and, accordingly, we express no opinion on them.
Cincinnati, OhioJune 23, 2011
2
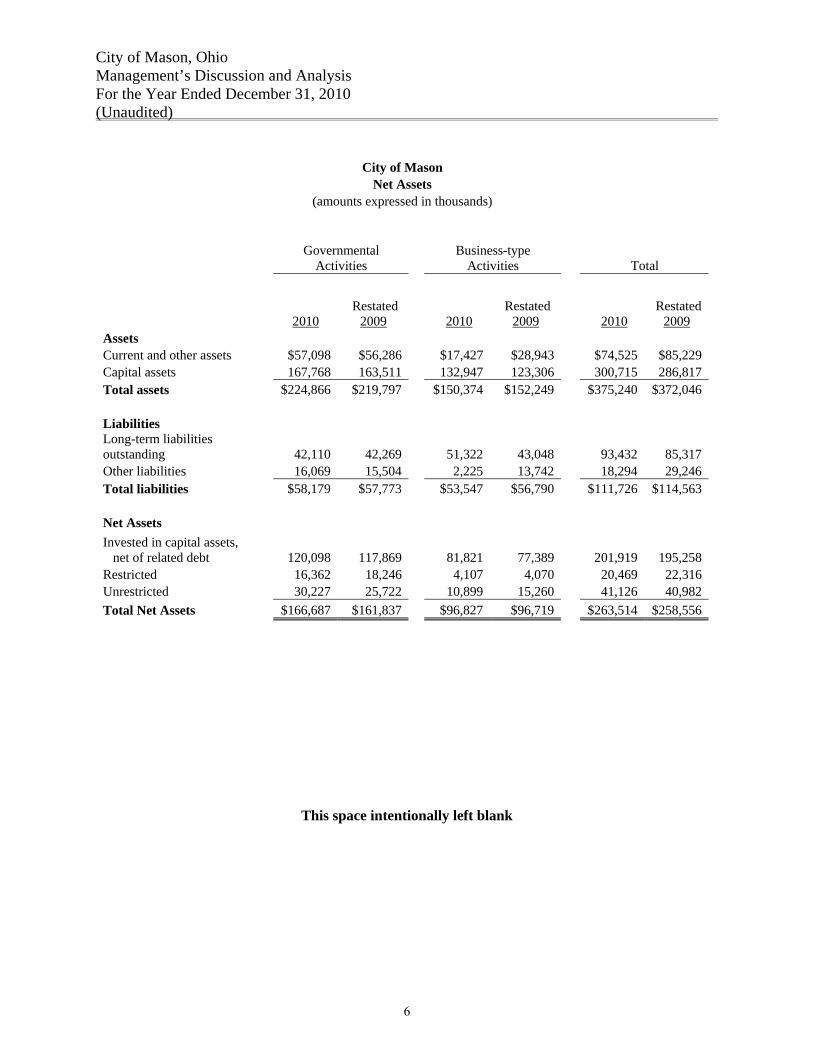
City of Mason, Ohio Management’s Discussion and Analysis For the Year Ended December 31, 2010 (Unaudited) As management of the City of Mason, we offer readers of the City of Mason’s financial statement this narrative overview and analysis of the financial activities of the City of Mason for the fiscal year ended December 31, 2010. We encourage readers to consider the information presented here in conjunction with additional information that we have furnished in our letter of transmittal, which can be found in the introductory section of this report. Financial Highlights The assets of the City of Mason exceeded its liabilities at the close of 2010 by $263,514,107 (net assets). Of this amount, $41,125,282 is considered unrestricted and may be used to meet the government’s ongoing obligations to citizens and creditors. The unrestricted balance is 88 percent of the 2010 expenses of $46,950,698.
• The city’s total net assets increased by $4,957,776. Net assets of the governmental activities (defined below) increased $4,849,803, which represents an 82 percent increase from the 2009 increase in net assets. Net assets of the business-type activities (also defined below) increased $107,973. The increase in governmental activities was primarily the result of the completion of construction projects.
• The total cost of the city’s programs decreased $155,492, which is 0.03 percent less than in 2009. The cost of governmental activities decreased $800,384 or 2.5 percent, while the cost of business-type activities increased $644,892 or 4.0 percent.
• As of the close of the 2010 fiscal year, the city’s governmental funds reported combined ending fund balances of $36,207,942, an increase of $1,651,769 in comparison with the prior year. The General Fund unreserved balance of $13,044,258 as of December 31, 2010, is 55.2 percent of the 2010 expenditures and transfers of $23,643,945. The City of Mason strives to maintain a minimum unreserved fund balance equal to three months of expenditures (25 percent).
Overview of the Financial Statements This discussion and analysis is intended to serve as an introduction to the city’s basic financial statements, which are comprised of three components: 1) government-wide financial statements, 2) fund financial statements, and 3) notes to the financial statements. This report also contains other supplementary information in addition to the basic financial statements themselves. 1) Government-wide financial statements.
The government-wide financial statements are designed to provide readers with a broad overview of the city’s finances in a manner similar to private-sector business. The statement of net assets presents information on all of the city’s assets and liabilities, with the difference between the two reported as net assets. Over time, increases or decreases in net assets may serve as a useful indicator of whether the financial position of the city is improving or deteriorating. The statement of activities presents information showing how the government’s net assets changed during the most recent fiscal year. All changes in net assets are reported as soon as the underlying event giving rise to the change occurs, regardless of the timing of the cash flows. Thus, revenue and expenses reported in this statement for some items may result in cash flows in future fiscal periods (e.g., uncollected taxes and earned but unused vacation leave).
3
City of Mason, Ohio Management’s Discussion and Analysis For the Year Ended December 31, 2010 (Unaudited)
Both of the government-wide financial statements distinguish governmental activities from business-type activities. Governmental activities are principally supported by taxes and intergovernmental revenues. These include general government, public safety, leisure time activities, community development, and transportation/street repair. Business-type activities are intended to recover all or a significant portion of their costs through user fees or charges. The city includes five enterprise activities under business-type activities: a sanitary sewer system, a stormwater system, waste collection system, golf course, and the community center activities.
2) Fund financial statements.
A fund is a grouping of related accounts that is used to maintain control over resources that have been segregated for specific activities or objectives. The city, like other state and local governments, uses fund accounting to ensure and demonstrate compliance with finance-related legal requirements. All of the funds of the city can be divided into three categories: governmental funds, proprietary funds, and fiduciary funds. Governmental funds. Governmental funds are used to account for essentially the same functions reported as governmental activities in the government-wide financial statements. However, unlike the government-wide financial statements, governmental fund financial statements focus on the near-term inflows and outflows of spendable resources, as well as on balances of spendable resources available at the end of the fiscal year. Because the focus of governmental funds is narrower than that of the government-wide financial statements, it is useful to compare the information presented for governmental funds with similar information presented for governmental activities in the government-wide financial statements. By doing so, readers may better understand the long-term impact of the government’s near-term financing decisions. Both the governmental fund balance sheet and the governmental fund statement of revenues, expenditures, and changes in fund balances provide a reconciliation to facilitate this comparison between governmental funds and governmental activities. The city maintains 27 individual governmental funds. Information is presented separately in the governmental fund balance sheet and in the governmental fund statement of revenues, expenditures, and changes in fund balances for the three major funds: the general fund; street construction, maintenance, and repair; and the fire and emergency medical services fund. Data for the other 24 governmental funds are combined into a single, aggregated presentation. Individual fund data for each of these nonmajor governmental funds is provided in the form of combining statements elsewhere in this report. Proprietary funds. The city maintains only one type of proprietary fund. Enterprise funds are used to report the same functions presented as business-type activities in the government-wide financial statements. The city uses enterprise funds to account for its sanitary sewer, stormwater, waste collection, golf course, and community center operations. Proprietary funds provide the same type of information as the government-wide financial statements, only in more detail. The proprietary fund financial statements provide separate information for the sanitary sewer, waste collection, stormwater, community center, and golf course funds. Statements for these funds are provided elsewhere in this document. Fiduciary funds. Fiduciary funds are used to account for resources held for the benefit of parties outside the government, such as fines collected by Mason Municipal Court. Fiduciary funds are not reflected in the government-wide financial statement because the resources of those funds are not
4
City of Mason, Ohio Management’s Discussion and Analysis For the Year Ended December 31, 2010 (Unaudited)
available to support the city’s own programs. The accounting used for fiduciary funds is much like that used for proprietary funds.
3) Notes to the financial statements.
The notes provide additional information that is essential to a full understanding of the data provided in the government-wide and fund financial statements.
Other information. In addition to the basic financial statements and accompanying notes, this report also presents certain required supplementary information concerning the city’s general fund budget and the fire and emergency medical service fund budget. The city adopts an annual appropriation budget for each fund. A budgetary comparison statement has been provided for each fund to demonstrate compliance with this budget. The combining statements referred to earlier in connection with non-major governmental funds are presented immediately following the required supplemental information Government-Wide Financial Analysis As noted earlier, net assets may serve over time as a useful indicator of a government’s financial position. The city’s assets exceeded liabilities by $263,514,107 at the close of the most recent fiscal year. The largest portion of the city’s net assets (76.6 percent) reflects its investment in capital assets (e.g., land, buildings, improvements other than buildings, machinery and equipment, and infrastructure) less any related outstanding debt used to acquire those assets. The city used these capital assets to provide services to citizens; therefore these assets are not available for future spending. Although the city’s investment in capital assets is reported net of related debt, it should be noted that the resources needed to repay debt must be provided from other sources, since capital assets themselves cannot be used to liquidate these liabilities. An additional portion of the city’s net assets (7.7 percent) represents resources that are subject to restrictions as to how they may be used. The remaining balance of unrestricted net assets ($41,125,282) may be used to meet the city’s on-going obligations to citizens and creditors. It is important to note that the unrestricted net assets of the city’s business-type activities ($10,898,229) may not be used to fund governmental activities. At the end of the current fiscal year, the city was able to report positive balances in all three categories of net assets: for the government as a whole and for its separate governmental and business-type activities. Overall net assets of the city increased $4,957,776 in 2010. Net assets for governmental activities increased $4,849,803, while net assets for business-type activities increased $107,973. The increase in net assets for 2010 ($4,957,776) was $2,100,587 less than the increase in net assets for 2009 ($7,058,363). This decrease is primarily the result of decreased income tax and investment earnings due to the recession and implementing full income tax credit in 2010.
5
City of Mason, Ohio Management’s Discussion and Analysis For the Year Ended December 31, 2010 (Unaudited)
City of Mason Net Assets
(amounts expressed in thousands)
Governmental
Activities Business-type
Activities Total
2010 Restated
2009 2010 Restated
2009 2010 Restated
2009 Assets Current and other assets $57,098 $56,286 $17,427 $28,943 $74,525 $85,229 Capital assets 167,768 163,511 132,947 123,306 300,715 286,817 Total assets $224,866 $219,797 $150,374 $152,249 $375,240 $372,046 Liabilities Long-term liabilities outstanding 42,110 42,269 51,322 43,048 93,432 85,317 Other liabilities 16,069 15,504 2,225 13,742 18,294 29,246 Total liabilities $58,179 $57,773 $53,547 $56,790 $111,726 $114,563 Net Assets Invested in capital assets, net of related debt 120,098 117,869 81,821 77,389 201,919 195,258 Restricted 16,362 18,246 4,107 4,070 20,469 22,316 Unrestricted 30,227 25,722 10,899 15,260 41,126 40,982 Total Net Assets $166,687 $161,837 $96,827 $96,719 $263,514 $258,556
This space intentionally left blank
6
City of Mason, Ohio Management’s Discussion and Analysis For the Year Ended December 31, 2010 (Unaudited)
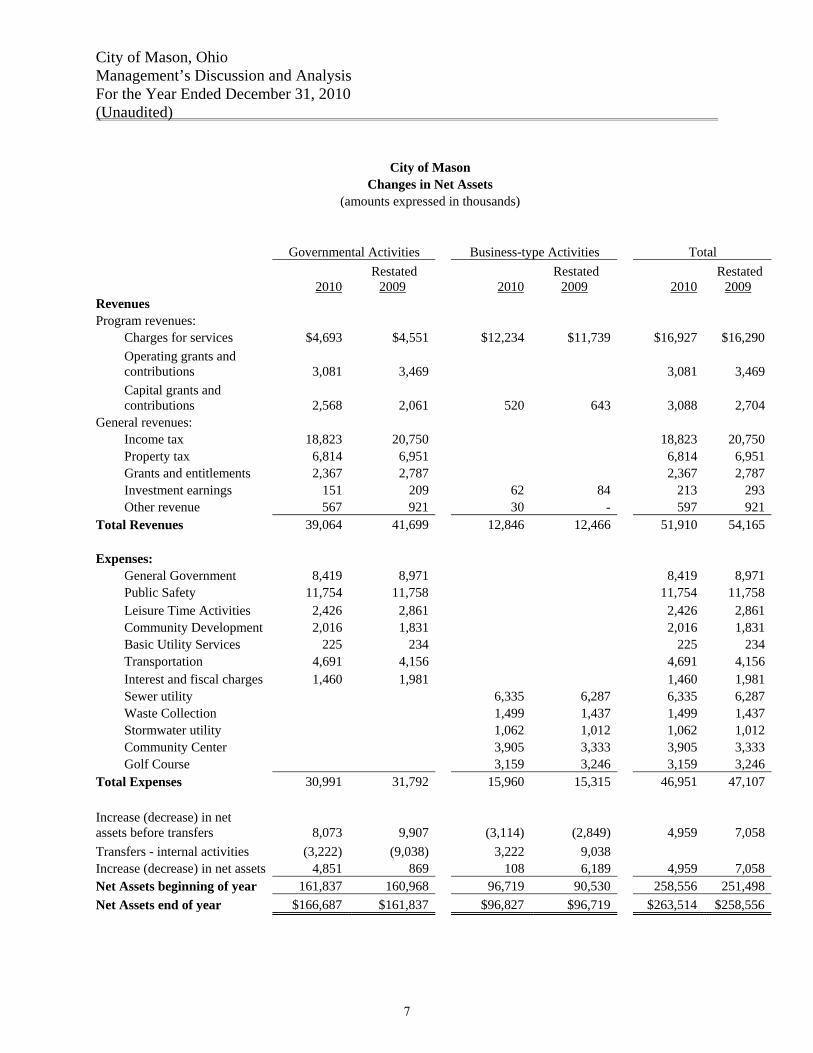
City of Mason Changes in Net Assets
(amounts expressed in thousands) Governmental Activities Business-type Activities Total
2010 Restated
2009 2010 Restated
2009 2010 Restated
2009 Revenues Program revenues: Charges for services $4,693 $4,551 $12,234 $11,739 $16,927 $16,290
Operating grants and contributions 3,081 3,469 3,081 3,469
Capital grants and contributions 2,568 2,061 520 643 3,088 2,704
General revenues: Income tax 18,823 20,750 18,823 20,750 Property tax 6,814 6,951 6,814 6,951 Grants and entitlements 2,367 2,787 2,367 2,787 Investment earnings 151 209 62 84 213 293 Other revenue 567 921 30 - 597 921 Total Revenues 39,064 41,699 12,846 12,466 51,910 54,165
Expenses: General Government 8,419 8,971 8,419 8,971 Public Safety 11,754 11,758 11,754 11,758 Leisure Time Activities 2,426 2,861 2,426 2,861 Community Development 2,016 1,831 2,016 1,831 Basic Utility Services 225 234 225 234 Transportation 4,691 4,156 4,691 4,156 Interest and fiscal charges 1,460 1,981 1,460 1,981 Sewer utility 6,335 6,287 6,335 6,287 Waste Collection 1,499 1,437 1,499 1,437 Stormwater utility 1,062 1,012 1,062 1,012 Community Center 3,905 3,333 3,905 3,333 Golf Course 3,159 3,246 3,159 3,246
Total Expenses 30,991 31,792 15,960 15,315 46,951 47,107
Increase (decrease) in net assets before transfers 8,073 9,907 (3,114) (2,849) 4,959 7,058 Transfers - internal activities (3,222) (9,038) 3,222 9,038 Increase (decrease) in net assets 4,851 869 108 6,189 4,959 7,058 Net Assets beginning of year 161,837 160,968 96,719 90,530 258,556 251,498 Net Assets end of year $166,687 $161,837 $96,827 $96,719 $263,514 $258,556
7
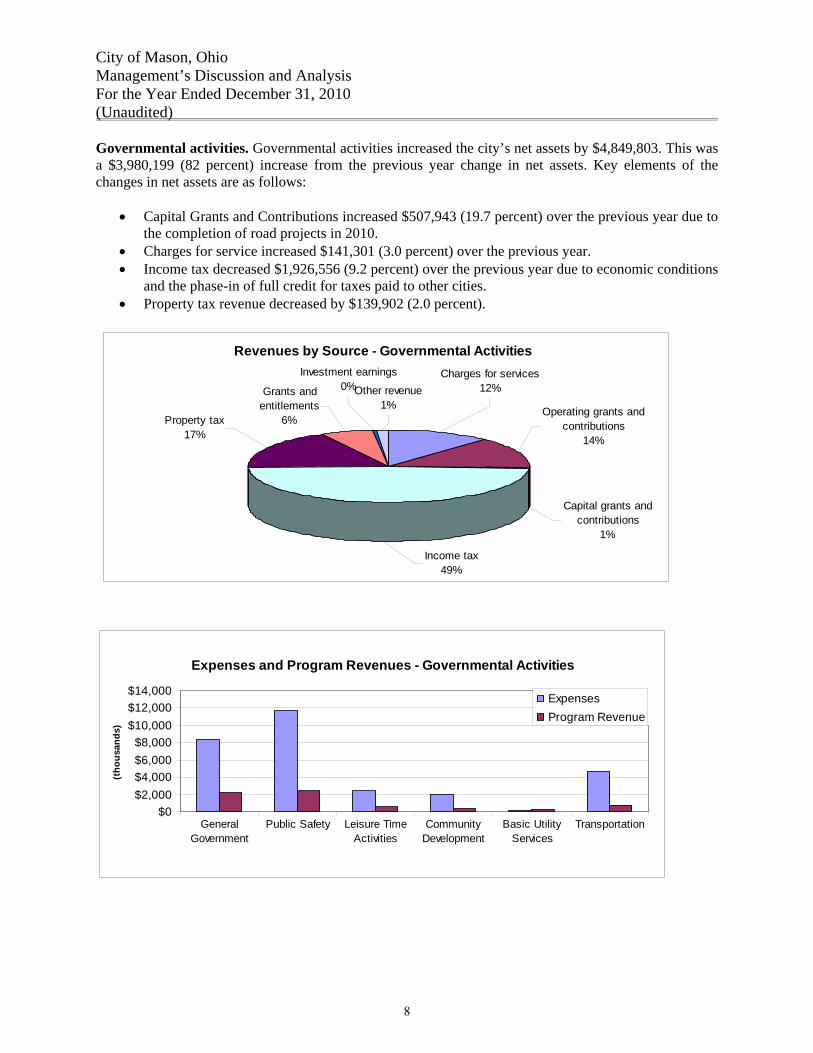
City of Mason, Ohio Management’s Discussion and Analysis For the Year Ended December 31, 2010 (Unaudited) Governmental activities. Governmental activities increased the city’s net assets by $4,849,803. This was a $3,980,199 (82 percent) increase from the previous year change in net assets. Key elements of the changes in net assets are as follows:
• Capital Grants and Contributions increased $507,943 (19.7 percent) over the previous year due to the completion of road projects in 2010.
• Charges for service increased $141,301 (3.0 percent) over the previous year. • Income tax decreased $1,926,556 (9.2 percent) over the previous year due to economic conditions
and the phase-in of full credit for taxes paid to other cities. • Property tax revenue decreased by $139,902 (2.0 percent).
Revenues by Source - Governmental Activities
Income tax49%
Capital grants and contributions
1%
Charges for services12%
Operating grants and contributions
14%
Other revenue1%
Property tax17%
Grants and entitlements
6%
Investment earnings0%
Expenses and Program Revenues - Governmental Activities
$0$2,000$4,000$6,000$8,000
$10,000$12,000$14,000
GeneralGovernment
Public Safety Leisure TimeActivities
CommunityDevelopment
Basic UtilityServices
Transportation
(tho
usan
ds)
ExpensesProgram Revenue
8
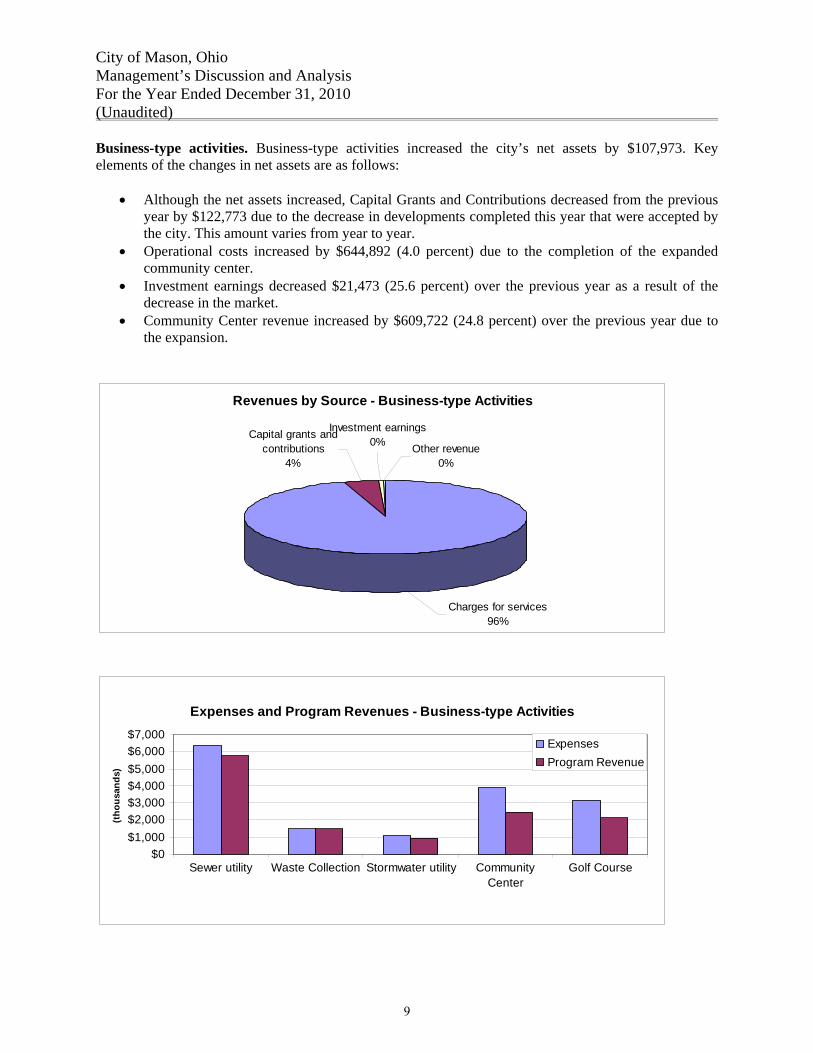
City of Mason, Ohio Management’s Discussion and Analysis For the Year Ended December 31, 2010 (Unaudited) Business-type activities. Business-type activities increased the city’s net assets by $107,973. Key elements of the changes in net assets are as follows:
• Although the net assets increased, Capital Grants and Contributions decreased from the previous year by $122,773 due to the decrease in developments completed this year that were accepted by the city. This amount varies from year to year.
• Operational costs increased by $644,892 (4.0 percent) due to the completion of the expanded community center.
• Investment earnings decreased $21,473 (25.6 percent) over the previous year as a result of the decrease in the market.
• Community Center revenue increased by $609,722 (24.8 percent) over the previous year due to the expansion.
Revenues by Source - Business-type Activities
Other revenue0%
Capital grants and contributions
4%
Charges for services96%
Investment earnings0%
Expenses and Program Revenues - Business-type Activities
$0$1,000$2,000$3,000$4,000$5,000$6,000$7,000
Sewer utility Waste Collection Stormwater utility CommunityCenter
Golf Course
(tho
usan
ds)
ExpensesProgram Revenue
9
City of Mason, Ohio Management’s Discussion and Analysis For the Year Ended December 31, 2010 (Unaudited) Financial Analysis of the Government’s Funds As noted earlier, the City of Mason uses fund accounting to ensure and demonstrate compliance with finance-related legal requirements. Governmental funds. The focus of the City of Mason’s governmental funds is to provide information on near-term inflows, outflows, and balances of spendable resources. Such information is useful in assessing the City of Mason’s financing requirements. In particular, the unreserved fund balance may serve as a useful measure of the government’s net resources that are available for spending at the end of the fiscal year. As of the end of the fiscal year, the City of Mason’s governmental funds reported combined ending fund balances of $36,207,942 an increase of $1,651,769 in comparison with the prior year. $22,828,373 of this amount constitutes unreserved fund balance, which is available for spending at the government’s discretion. The remainder of the fund balance is reserved to indicate that it is not available for new spending because it has already been committed to liquidate contracts and purchase orders of the prior period. The general fund is the chief operating fund of the city. At December 31, 2010, the unreserved fund balance of the general fund was $13,044,258, while the total fund balance was $21,769,240. As a measure of the general fund’s liquidity, it may be useful to compare both unreserved fund balance and total fund balance to total fund expenditures (excluding transfers out). Unreserved fund balance represents 42.1 percent of the total general fund expenditures (excluding transfers out), while total fund balance represents 70.3 percent of that same amount. The unreserved fund balance is roughly equal to five months of total fund expenditures, which is higher than the City’s target minimum for an unreserved fund balance of three months. The fund balance of the city’s general fund increased by $3,006,883 during the current fiscal year. Key factors in this change are as follows:
• Although revenue decreased from the previous year by $1,654,709 (due primarily to the income tax full credit) which is a 5.8% decrease; expenses decreased by $4,882,989 (due primarily to because of property purchase in 2009 and to cost saving measures) which is a 19.4% decrease.
• The amount of transfers out decreased by $7,388,521 or 31.3%. In 2009, transfers out were higher because of a one-time transfer for the community center expansion construction.
The street construction, maintenance and repair fund pays for all major street construction and improvements. The fund balance decreased by $184,855. Revenue increased by $879,557 (30.9 percent). Expenditures increased by $2,695,422 (47.9 percent) due to capital outlay for road construction projects. The fire and emergency medical service fund provides public safety services to the City of Mason using a five-mill property tax levy as its major source of revenue. The fund balance decreased by $1,539,833. Revenue decreased by $121,701 (2.1 percent). Expenditures increased by $1,110,745 (15.4 percent) due to capital outlay for the new fire station. Proprietary funds. The proprietary fund financial statements provide the same information found in the government-wide financial statements, but in more detail.
10
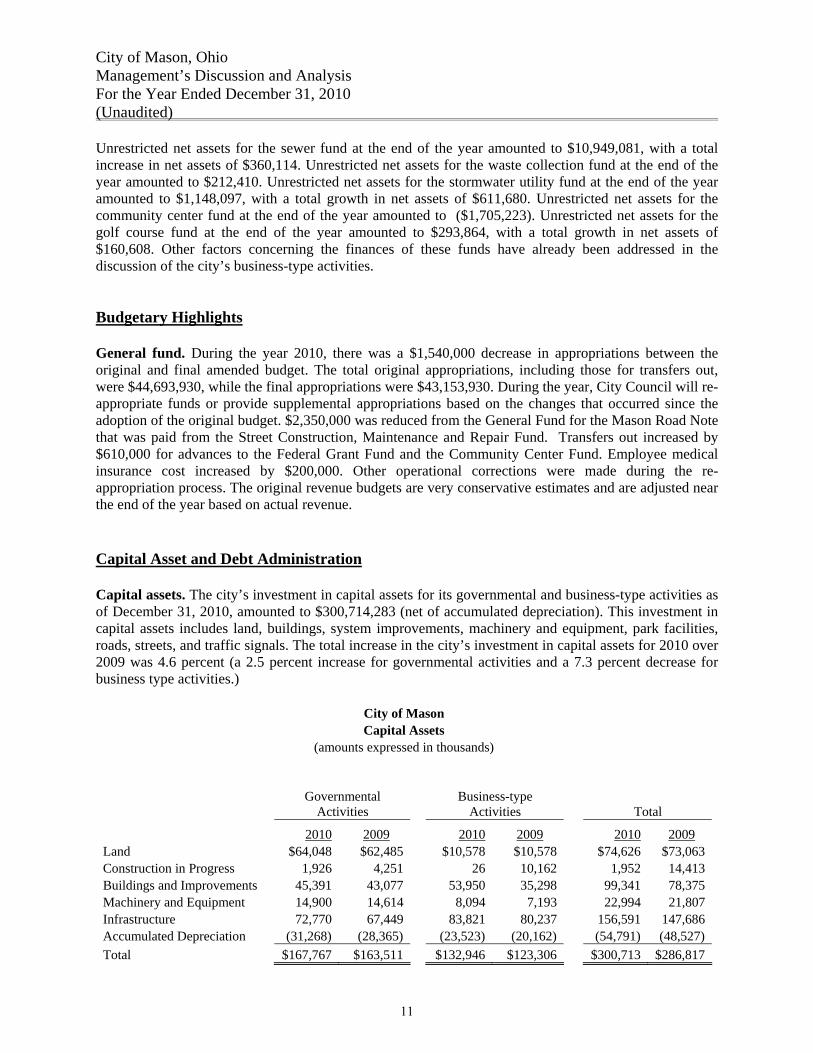
City of Mason, Ohio Management’s Discussion and Analysis For the Year Ended December 31, 2010 (Unaudited) Unrestricted net assets for the sewer fund at the end of the year amounted to $10,949,081, with a total increase in net assets of $360,114. Unrestricted net assets for the waste collection fund at the end of the year amounted to $212,410. Unrestricted net assets for the stormwater utility fund at the end of the year amounted to $1,148,097, with a total growth in net assets of $611,680. Unrestricted net assets for the community center fund at the end of the year amounted to ($1,705,223). Unrestricted net assets for the golf course fund at the end of the year amounted to $293,864, with a total growth in net assets of $160,608. Other factors concerning the finances of these funds have already been addressed in the discussion of the city’s business-type activities. Budgetary Highlights General fund. During the year 2010, there was a $1,540,000 decrease in appropriations between the original and final amended budget. The total original appropriations, including those for transfers out, were $44,693,930, while the final appropriations were $43,153,930. During the year, City Council will re-appropriate funds or provide supplemental appropriations based on the changes that occurred since the adoption of the original budget. $2,350,000 was reduced from the General Fund for the Mason Road Note that was paid from the Street Construction, Maintenance and Repair Fund. Transfers out increased by $610,000 for advances to the Federal Grant Fund and the Community Center Fund. Employee medical insurance cost increased by $200,000. Other operational corrections were made during the re-appropriation process. The original revenue budgets are very conservative estimates and are adjusted near the end of the year based on actual revenue. Capital Asset and Debt Administration Capital assets. The city’s investment in capital assets for its governmental and business-type activities as of December 31, 2010, amounted to $300,714,283 (net of accumulated depreciation). This investment in capital assets includes land, buildings, system improvements, machinery and equipment, park facilities, roads, streets, and traffic signals. The total increase in the city’s investment in capital assets for 2010 over 2009 was 4.6 percent (a 2.5 percent increase for governmental activities and a 7.3 percent decrease for business type activities.)
City of Mason Capital Assets
(amounts expressed in thousands)
Governmental
Activities Business-type
Activities Total
2010 2009 2010 2009 2010 2009 Land $64,048 $62,485 $10,578 $10,578 $74,626 $73,063 Construction in Progress 1,926 4,251 26 10,162 1,952 14,413 Buildings and Improvements 45,391 43,077 53,950 35,298 99,341 78,375 Machinery and Equipment 14,900 14,614 8,094 7,193 22,994 21,807 Infrastructure 72,770 67,449 83,821 80,237 156,591 147,686 Accumulated Depreciation (31,268) (28,365) (23,523) (20,162) (54,791) (48,527) Total $167,767 $163,511 $132,946 $123,306 $300,713 $286,817
11
City of Mason, Ohio Management’s Discussion and Analysis For the Year Ended December 31, 2010 (Unaudited) Major capital events during the current fiscal year included the following:
• The conclusion of several projects: Mason Road Widening ($3.9 million of additions), New Fire Station 51 Construction ($3.5 million), and Community Center Expansion ($19.5 million).
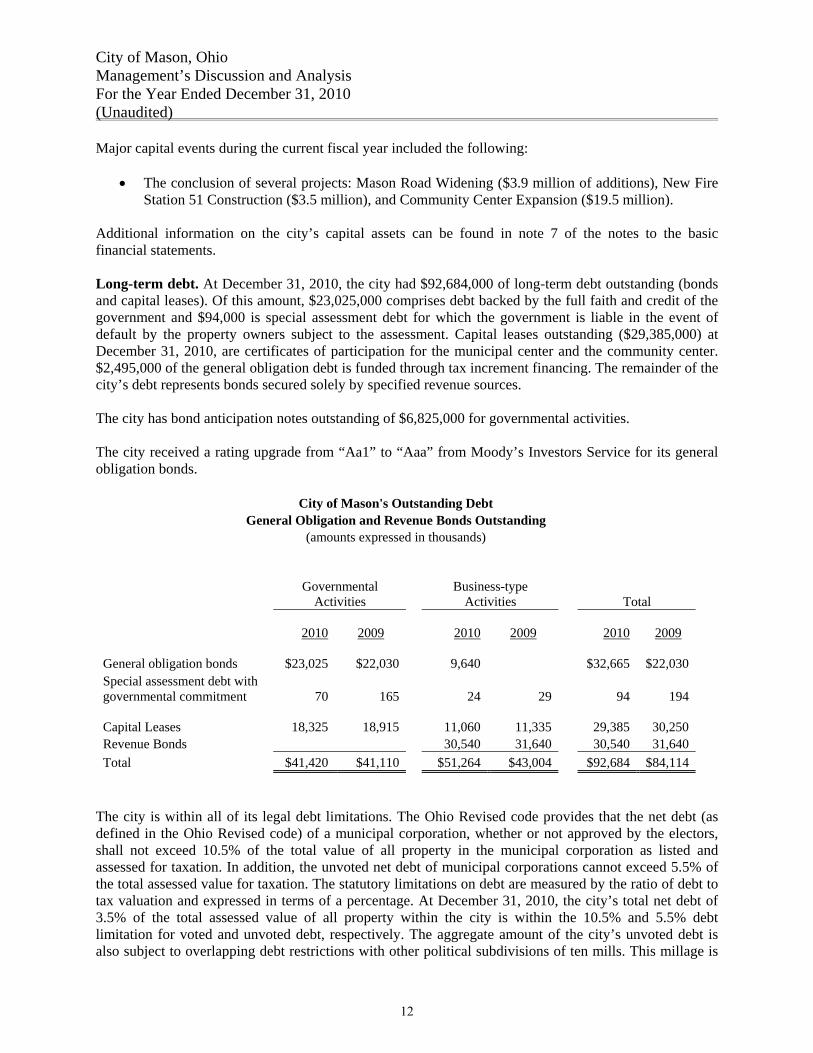
Additional information on the city’s capital assets can be found in note 7 of the notes to the basic financial statements. Long-term debt. At December 31, 2010, the city had $92,684,000 of long-term debt outstanding (bonds and capital leases). Of this amount, $23,025,000 comprises debt backed by the full faith and credit of the government and $94,000 is special assessment debt for which the government is liable in the event of default by the property owners subject to the assessment. Capital leases outstanding ($29,385,000) at December 31, 2010, are certificates of participation for the municipal center and the community center. $2,495,000 of the general obligation debt is funded through tax increment financing. The remainder of the city’s debt represents bonds secured solely by specified revenue sources. The city has bond anticipation notes outstanding of $6,825,000 for governmental activities. The city received a rating upgrade from “Aa1” to “Aaa” from Moody’s Investors Service for its general obligation bonds.
City of Mason's Outstanding Debt General Obligation and Revenue Bonds Outstanding
(amounts expressed in thousands)
Governmental
Activities Business-type
Activities Total
2010 2009 2010 2009
2010 2009
General obligation bonds $23,025 $22,030
9,640 $32,665 $22,030 Special assessment debt with governmental commitment 70 165 24 29 94 194
Capital Leases 18,325 18,915
11,060
11,335 29,385 30,250 Revenue Bonds 30,540 31,640 30,540 31,640 Total $41,420 $41,110 $51,264 $43,004 $92,684 $84,114
The city is within all of its legal debt limitations. The Ohio Revised code provides that the net debt (as defined in the Ohio Revised code) of a municipal corporation, whether or not approved by the electors, shall not exceed 10.5% of the total value of all property in the municipal corporation as listed and assessed for taxation. In addition, the unvoted net debt of municipal corporations cannot exceed 5.5% of the total assessed value for taxation. The statutory limitations on debt are measured by the ratio of debt to tax valuation and expressed in terms of a percentage. At December 31, 2010, the city’s total net debt of 3.5% of the total assessed value of all property within the city is within the 10.5% and 5.5% debt limitation for voted and unvoted debt, respectively. The aggregate amount of the city’s unvoted debt is also subject to overlapping debt restrictions with other political subdivisions of ten mills. This millage is
12
City of Mason, Ohio Management’s Discussion and Analysis For the Year Ended December 31, 2010 (Unaudited) measured against the property values in each overlapping district. At December 31, 2010, the millage amount was 5.8698 mills, of which 5.2687 mills were restricted by the City of Mason for unvoted debt. Additional information regarding the city’s long-term debt can be found in note 10 of the notes to the basic financial statements. Economic Factors and Next Year’s Budgets The City of Mason is located in Warren County, which currently has an unemployment rate of 8.4 percent. This is lower than the current Ohio rate of 9.3 percent and the national rate of 9.1 percent. The City of Mason continues to promote economic growth in Mason while many neighboring municipalities suffer steeper declines. The city continues to attract desirable commercial enterprises. Intense competition continues to force the city to be aggressive in its economic development objectives of increasing investment, creating employment opportunities, and retaining businesses that have already been established in Mason. The 2011 budget was prepared in a manner similar to prior years by conservatively estimating revenue while seeking opportunities for cost savings. Based on concerns about the current recession, every effort is made to reduce expenditures with minimal impact to the current level of services. As part of the budget process, a capital improvement plan was completed and evaluated for 2011 and future years. The total appropriations budgeted for 2011 including transfers and capital outlay ($93,492,850) is 5.6 percent more than the 2010 original appropriations ($88,202,241). Request for Information This financial report is designed to provide a general overview of the City of Mason’s finances for all those with an interest in the government’s finances. Questions concerning any of the information provided in this report or requests for additional financial information should be addressed to Joe Reigelsperger, Finance Director, City of Mason, 6000 Mason-Montgomery Road, Mason, Ohio 45040, or by e-mail to [email protected].
13

THIS PAGE INTENTIONALLY LEFT BLANK
14
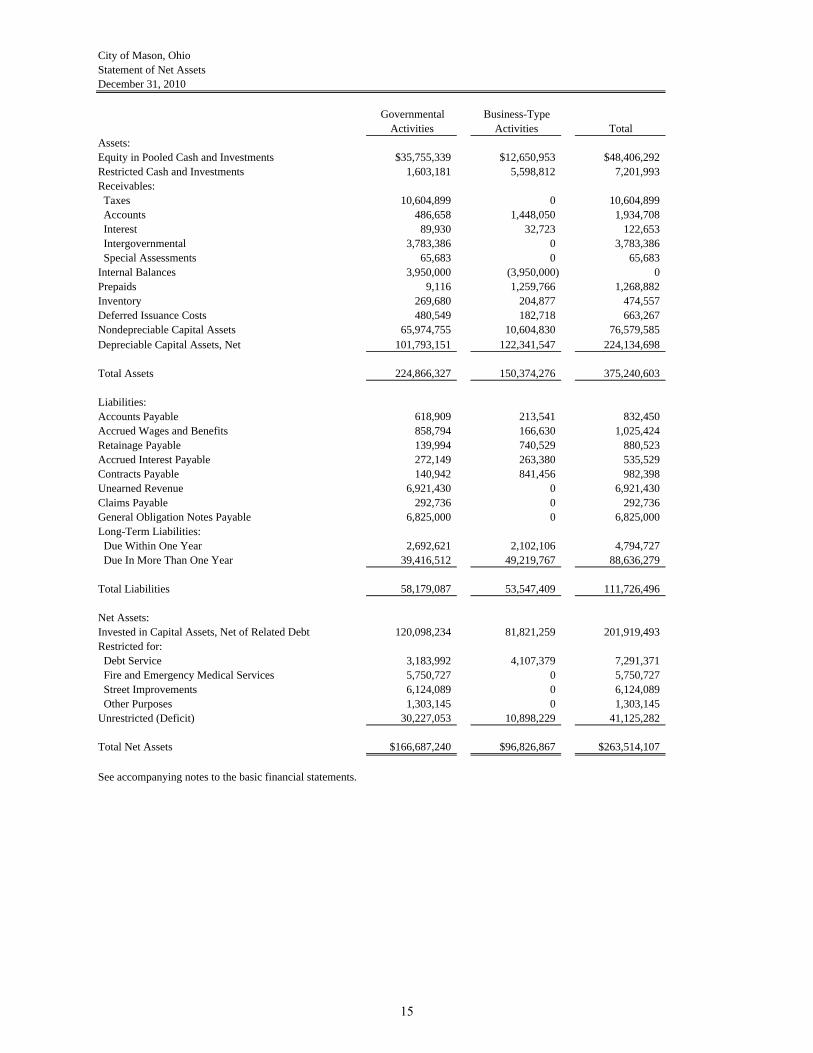
City of Mason, OhioStatement of Net AssetsDecember 31, 2010
Governmental Business-TypeActivities Activities Total
Assets:Equity in Pooled Cash and Investments $35,755,339 $12,650,953 $48,406,292Restricted Cash and Investments 1,603,181 5,598,812 7,201,993Receivables: Taxes 10,604,899 0 10,604,899 Accounts 486,658 1,448,050 1,934,708 Interest 89,930 32,723 122,653 Intergovernmental 3,783,386 0 3,783,386 Special Assessments 65,683 0 65,683Internal Balances 3,950,000 (3,950,000) 0Prepaids 9,116 1,259,766 1,268,882Inventory 269,680 204,877 474,557Deferred Issuance Costs 480,549 182,718 663,267Nondepreciable Capital Assets 65,974,755 10,604,830 76,579,585Depreciable Capital Assets, Net 101,793,151 122,341,547 224,134,698
Total Assets 224,866,327 150,374,276 375,240,603
Liabilities:Accounts Payable 618,909 213,541 832,450Accrued Wages and Benefits 858,794 166,630 1,025,424Retainage Payable 139,994 740,529 880,523Accrued Interest Payable 272,149 263,380 535,529Contracts Payable 140,942 841,456 982,398Unearned Revenue 6,921,430 0 6,921,430Claims Payable 292,736 0 292,736General Obligation Notes Payable 6,825,000 0 6,825,000Long-Term Liabilities: Due Within One Year 2,692,621 2,102,106 4,794,727 Due In More Than One Year 39,416,512 49,219,767 88,636,279
Total Liabilities 58,179,087 53,547,409 111,726,496
Net Assets:Invested in Capital Assets, Net of Related Debt 120,098,234 81,821,259 201,919,493Restricted for: Debt Service 3,183,992 4,107,379 7,291,371 Fire and Emergency Medical Services 5,750,727 0 5,750,727 Street Improvements 6,124,089 0 6,124,089 Other Purposes 1,303,145 0 1,303,145Unrestricted (Deficit) 30,227,053 10,898,229 41,125,282
Total Net Assets $166,687,240 $96,826,867 $263,514,107
See accompanying notes to the basic financial statements.
15
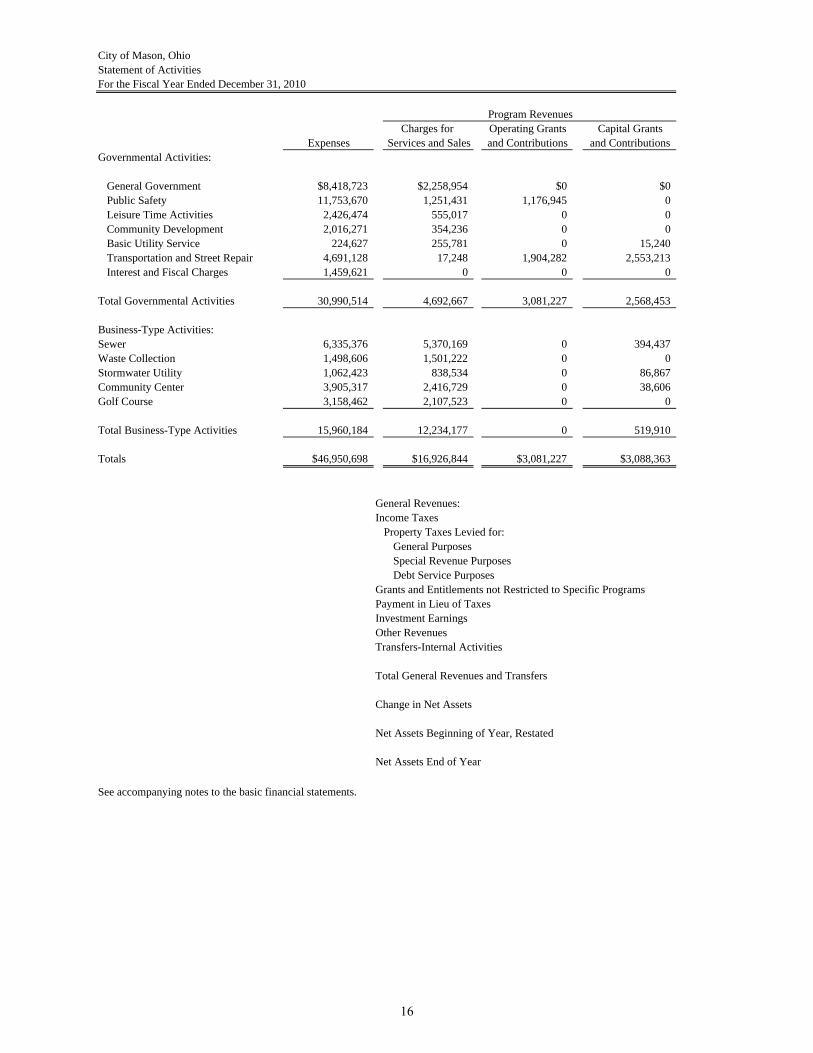
City of Mason, OhioStatement of ActivitiesFor the Fiscal Year Ended December 31, 2010
Charges for Operating Grants Capital GrantsExpenses Services and Sales and Contributions and Contributions
Governmental Activities:
General Government $8,418,723 $2,258,954 $0 $0Public Safety 11,753,670 1,251,431 1,176,945 0Leisure Time Activities 2,426,474 555,017 0 0Community Development 2,016,271 354,236 0 0Basic Utility Service 224,627 255,781 0 15,240Transportation and Street Repair 4,691,128 17,248 1,904,282 2,553,213Interest and Fiscal Charges 1,459,621 0 0 0
Total Governmental Activities 30,990,514 4,692,667 3,081,227 2,568,453
Business-Type Activities:Sewer 6,335,376 5,370,169 0 394,437Waste Collection 1,498,606 1,501,222 0 0Stormwater Utility 1,062,423 838,534 0 86,867Community Center 3,905,317 2,416,729 0 38,606Golf Course 3,158,462 2,107,523 0 0
Total Business-Type Activities 15,960,184 12,234,177 0 519,910
Totals $46,950,698 $16,926,844 $3,081,227 $3,088,363
General Revenues:Income Taxes Property Taxes Levied for:
General Purposes Special Revenue Purposes Debt Service Purposes
Grants and Entitlements not Restricted to Specific ProgramsPayment in Lieu of TaxesInvestment EarningsOther RevenuesTransfers-Internal Activities
Total General Revenues and Transfers
Change in Net Assets
Net Assets Beginning of Year, Restated
Net Assets End of Year
See accompanying notes to the basic financial statements.
Program Revenues
16
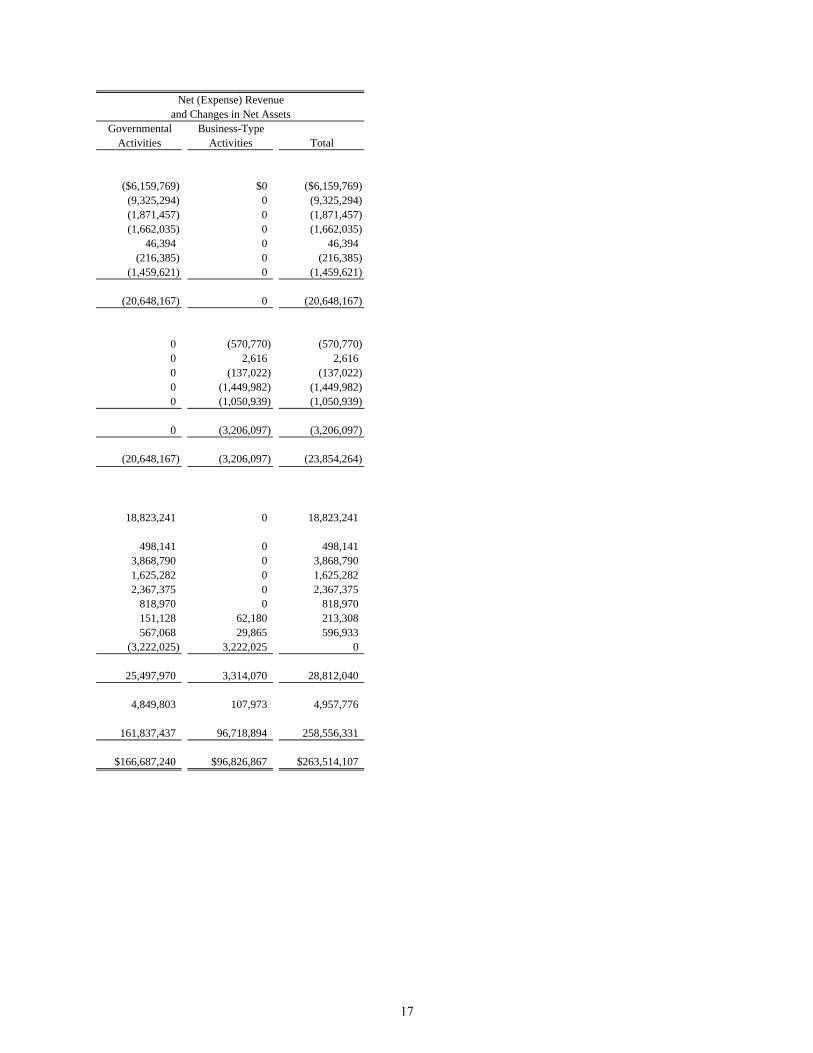
Governmental Business-TypeActivities Activities Total
($6,159,769) $0 ($6,159,769)(9,325,294) 0 (9,325,294)(1,871,457) 0 (1,871,457)(1,662,035) 0 (1,662,035)
46,394 0 46,394(216,385) 0 (216,385)
(1,459,621) 0 (1,459,621)
(20,648,167) 0 (20,648,167)
0 (570,770) (570,770)0 2,616 2,6160 (137,022) (137,022)0 (1,449,982) (1,449,982)0 (1,050,939) (1,050,939)
0 (3,206,097) (3,206,097)
(20,648,167) (3,206,097) (23,854,264)
18,823,241 0 18,823,241
498,141 0 498,1413,868,790 0 3,868,7901,625,282 0 1,625,2822,367,375 0 2,367,375
818,970 0 818,970151,128 62,180 213,308567,068 29,865 596,933
(3,222,025) 3,222,025 0
25,497,970 3,314,070 28,812,040
4,849,803 107,973 4,957,776
161,837,437 96,718,894 258,556,331
$166,687,240 $96,826,867 $263,514,107
Net (Expense) Revenueand Changes in Net Assets
17
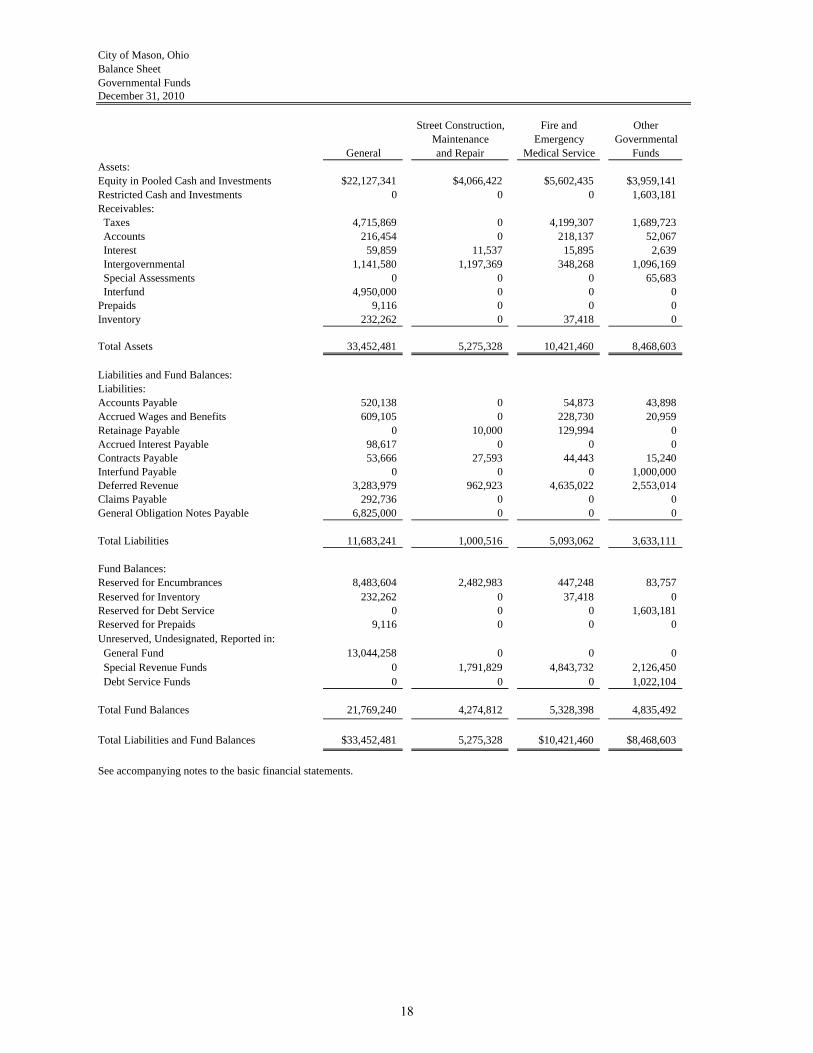
City of Mason, OhioBalance SheetGovernmental FundsDecember 31, 2010
Street Construction, Fire and OtherMaintenance Emergency Governmental
General and Repair Medical Service FundsAssets:Equity in Pooled Cash and Investments $22,127,341 $4,066,422 $5,602,435 $3,959,141Restricted Cash and Investments 0 0 0 1,603,181Receivables: Taxes 4,715,869 0 4,199,307 1,689,723 Accounts 216,454 0 218,137 52,067 Interest 59,859 11,537 15,895 2,639 Intergovernmental 1,141,580 1,197,369 348,268 1,096,169 Special Assessments 0 0 0 65,683 Interfund 4,950,000 0 0 0Prepaids 9,116 0 0 0Inventory 232,262 0 37,418 0
Total Assets 33,452,481 5,275,328 10,421,460 8,468,603
Liabilities and Fund Balances:Liabilities:Accounts Payable 520,138 0 54,873 43,898Accrued Wages and Benefits 609,105 0 228,730 20,959Retainage Payable 0 10,000 129,994 0Accrued Interest Payable 98,617 0 0 0Contracts Payable 53,666 27,593 44,443 15,240Interfund Payable 0 0 0 1,000,000Deferred Revenue 3,283,979 962,923 4,635,022 2,553,014Claims Payable 292,736 0 0 0General Obligation Notes Payable 6,825,000 0 0 0
Total Liabilities 11,683,241 1,000,516 5,093,062 3,633,111
Fund Balances:Reserved for Encumbrances 8,483,604 2,482,983 447,248 83,757Reserved for Inventory 232,262 0 37,418 0Reserved for Debt Service 0 0 0 1,603,181Reserved for Prepaids 9,116 0 0 0Unreserved, Undesignated, Reported in: General Fund 13,044,258 0 0 0 Special Revenue Funds 0 1,791,829 4,843,732 2,126,450 Debt Service Funds 0 0 0 1,022,104
Total Fund Balances 21,769,240 4,274,812 5,328,398 4,835,492
Total Liabilities and Fund Balances $33,452,481 5,275,328 $10,421,460 $8,468,603
See accompanying notes to the basic financial statements.
18
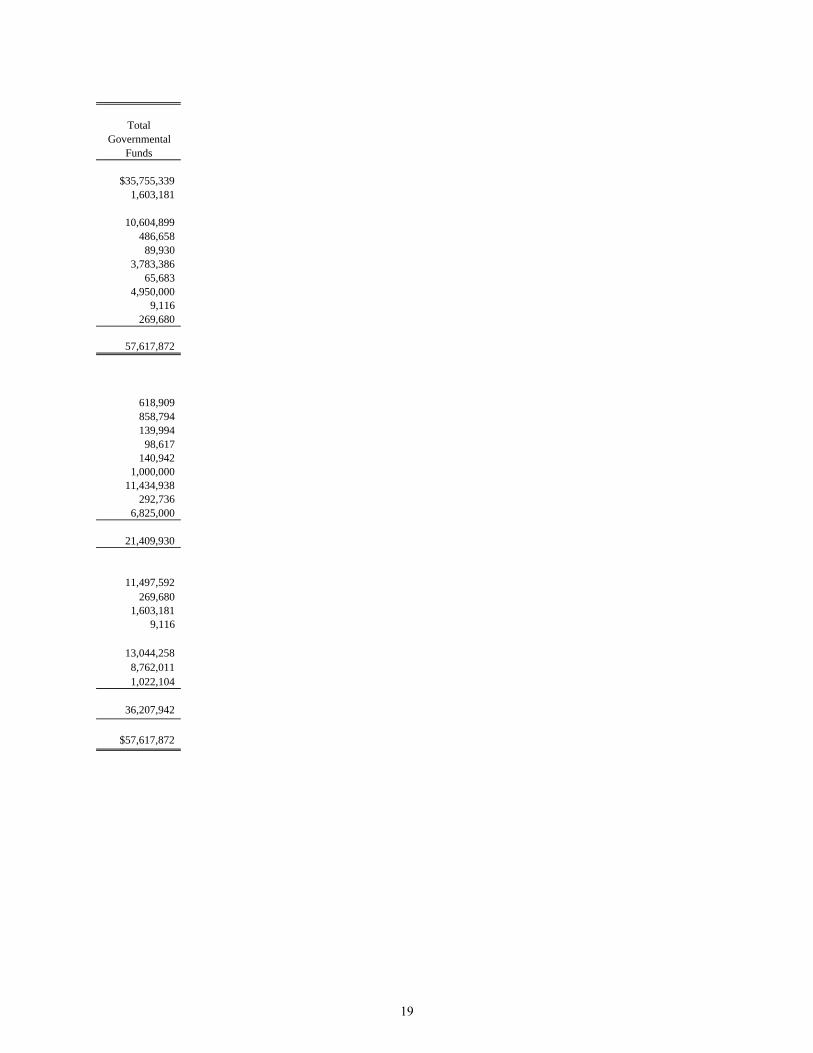
TotalGovernmental
Funds
$35,755,3391,603,181
10,604,899486,658
89,9303,783,386
65,6834,950,000
9,116269,680
57,617,872
618,909858,794139,994
98,617140,942
1,000,00011,434,938
292,7366,825,000
21,409,930
11,497,592269,680
1,603,1819,116
13,044,2588,762,0111,022,104
36,207,942
$57,617,872
19

THIS PAGE INTENTIONALLY LEFT BLANK
20
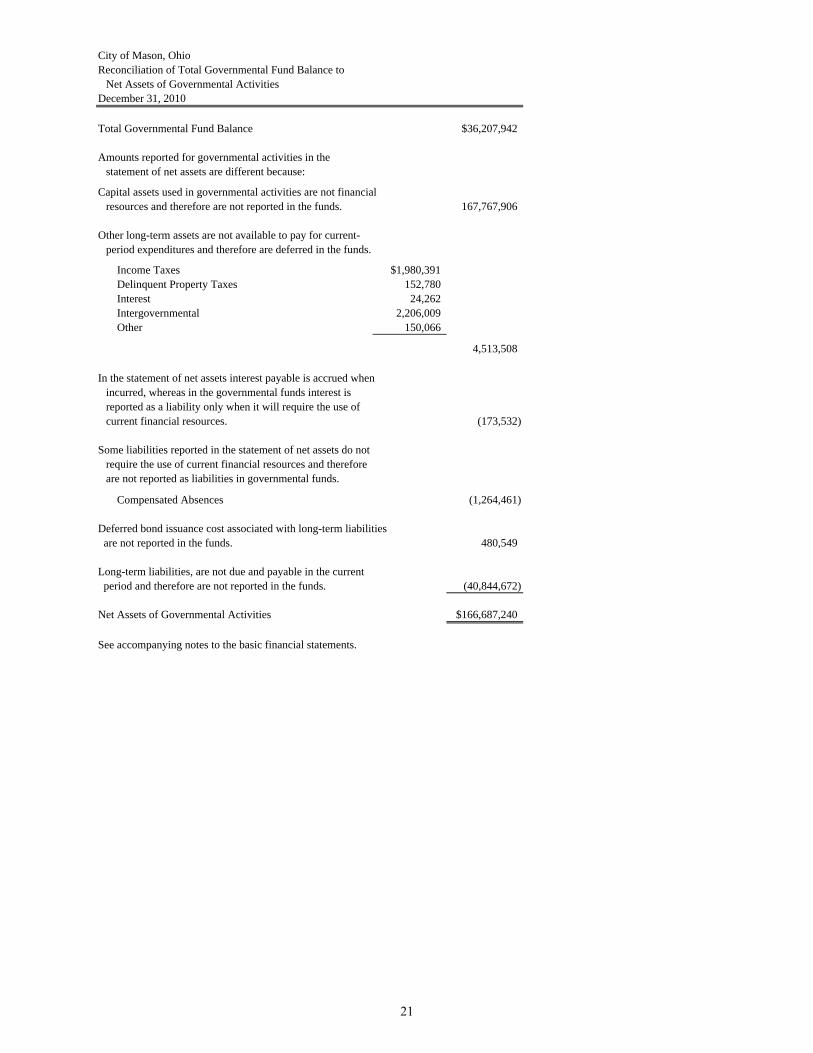
City of Mason, OhioReconciliation of Total Governmental Fund Balance to
Net Assets of Governmental Activities
Total Governmental Fund Balance $36,207,942
Amounts reported for governmental activities in thestatement of net assets are different because:
Capital assets used in governmental activities are not financialresources and therefore are not reported in the funds. 167,767,906
Other long-term assets are not available to pay for current-period expenditures and therefore are deferred in the funds.
Income Taxes $1,980,391Delinquent Property Taxes 152,780Interest 24,262Intergovernmental 2,206,009Other 150,066
4,513,508
In the statement of net assets interest payable is accrued whenincurred, whereas in the governmental funds interest isreported as a liability only when it will require the use ofcurrent financial resources. (173,532)
Some liabilities reported in the statement of net assets do notrequire the use of current financial resources and thereforeare not reported as liabilities in governmental funds.
Compensated Absences (1,264,461)
Deferred bond issuance cost associated with long-term liabilities are not reported in the funds. 480,549
Long-term liabilities, are not due and payable in the current period and therefore are not reported in the funds. (40,844,672)
Net Assets of Governmental Activities $166,687,240
See accompanying notes to the basic financial statements.
December 31, 2010
21
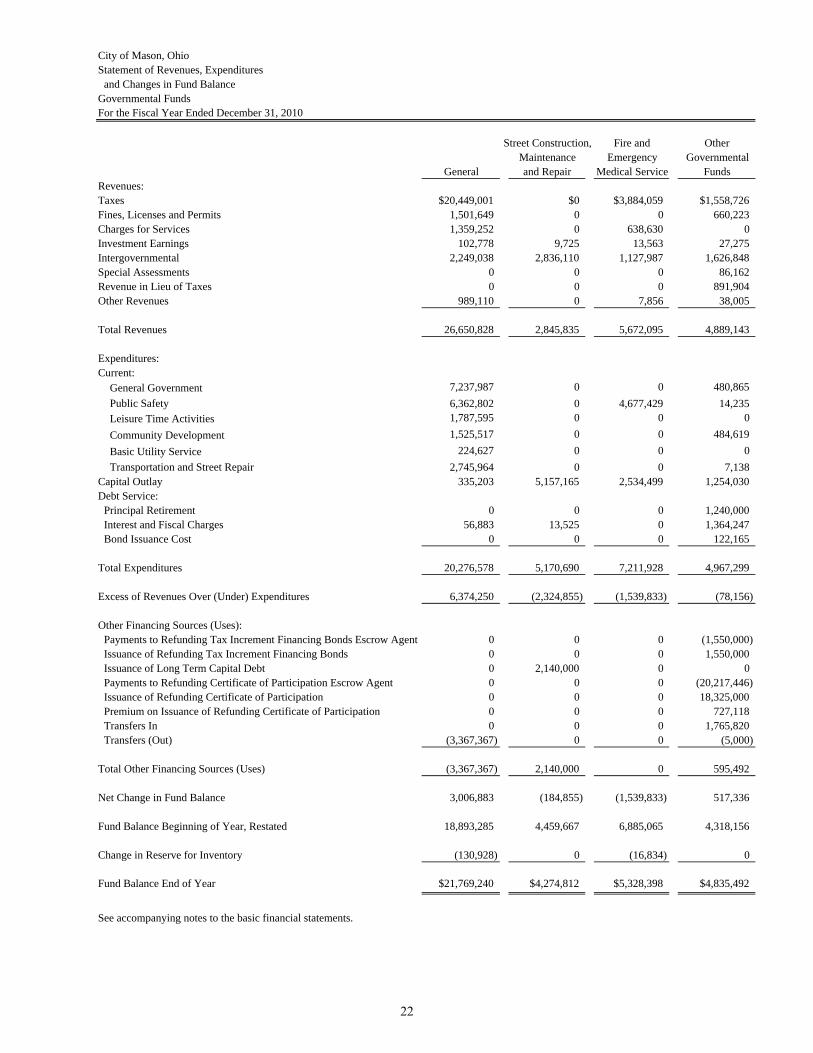
City of Mason, OhioStatement of Revenues, Expenditures
and Changes in Fund BalanceGovernmental FundsFor the Fiscal Year Ended December 31, 2010
Street Construction, Fire and OtherMaintenance Emergency Governmental
General and Repair Medical Service FundsRevenues:Taxes $20,449,001 $0 $3,884,059 $1,558,726Fines, Licenses and Permits 1,501,649 0 0 660,223Charges for Services 1,359,252 0 638,630 0Investment Earnings 102,778 9,725 13,563 27,275Intergovernmental 2,249,038 2,836,110 1,127,987 1,626,848Special Assessments 0 0 0 86,162Revenue in Lieu of Taxes 0 0 0 891,904Other Revenues 989,110 0 7,856 38,005
Total Revenues 26,650,828 2,845,835 5,672,095 4,889,143
Expenditures:Current:
General Government 7,237,987 0 0 480,865Public Safety 6,362,802 0 4,677,429 14,235Leisure Time Activities 1,787,595 0 0 0Community Development 1,525,517 0 0 484,619Basic Utility Service 224,627 0 0 0Transportation and Street Repair 2,745,964 0 0 7,138
Capital Outlay 335,203 5,157,165 2,534,499 1,254,030Debt Service:
Principal Retirement 0 0 0 1,240,000Interest and Fiscal Charges 56,883 13,525 0 1,364,247Bond Issuance Cost 0 0 0 122,165
Total Expenditures 20,276,578 5,170,690 7,211,928 4,967,299
Excess of Revenues Over (Under) Expenditures 6,374,250 (2,324,855) (1,539,833) (78,156)
Other Financing Sources (Uses):Payments to Refunding Tax Increment Financing Bonds Escrow Agent 0 0 0 (1,550,000)Issuance of Refunding Tax Increment Financing Bonds 0 0 0 1,550,000Issuance of Long Term Capital Debt 0 2,140,000 0 0Payments to Refunding Certificate of Participation Escrow Agent 0 0 0 (20,217,446)Issuance of Refunding Certificate of Participation 0 0 0 18,325,000Premium on Issuance of Refunding Certificate of Participation 0 0 0 727,118Transfers In 0 0 0 1,765,820Transfers (Out) (3,367,367) 0 0 (5,000)
Total Other Financing Sources (Uses) (3,367,367) 2,140,000 0 595,492
Net Change in Fund Balance 3,006,883 (184,855) (1,539,833) 517,336
Fund Balance Beginning of Year, Restated 18,893,285 4,459,667 6,885,065 4,318,156
Change in Reserve for Inventory (130,928) 0 (16,834) 0
Fund Balance End of Year $21,769,240 $4,274,812 $5,328,398 $4,835,492
See accompanying notes to the basic financial statements.
22
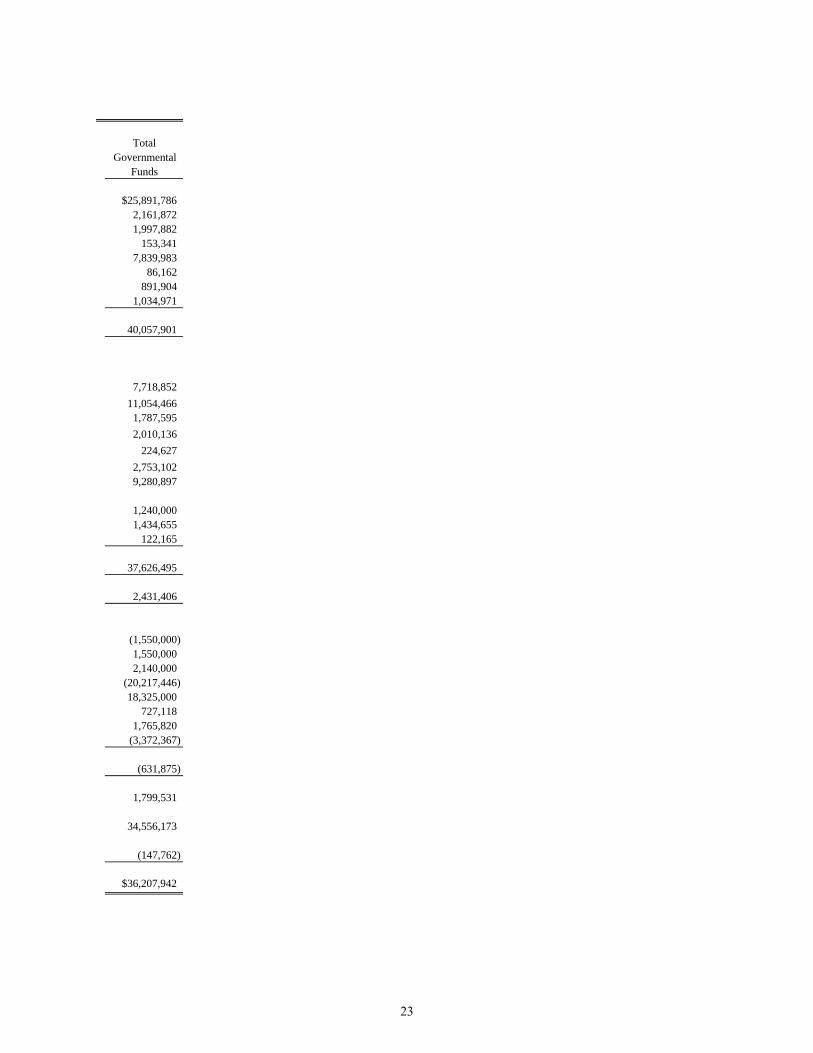
TotalGovernmental
Funds
$25,891,7862,161,8721,997,882
153,3417,839,983
86,162891,904
1,034,971
40,057,901
7,718,85211,054,466
1,787,5952,010,136
224,6272,753,1029,280,897
1,240,0001,434,655
122,165
37,626,495
2,431,406
(1,550,000)1,550,0002,140,000
(20,217,446)18,325,000
727,1181,765,820
(3,372,367)
(631,875)
1,799,531
34,556,173
(147,762)
$36,207,942
23
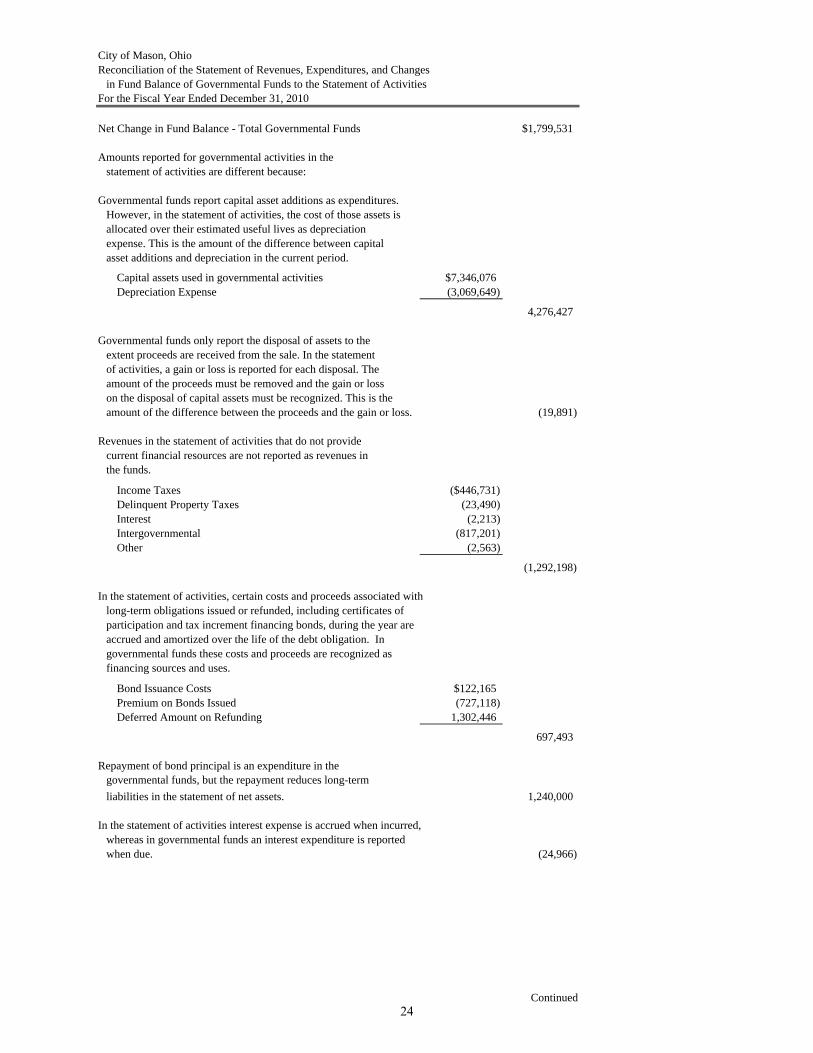
City of Mason, OhioReconciliation of the Statement of Revenues, Expenditures, and Changes
in Fund Balance of Governmental Funds to the Statement of ActivitiesFor the Fiscal Year Ended December 31, 2010
Net Change in Fund Balance - Total Governmental Funds $1,799,531
Amounts reported for governmental activities in thestatement of activities are different because:
Governmental funds report capital asset additions as expenditures. However, in the statement of activities, the cost of those assets is allocated over their estimated useful lives as depreciation expense. This is the amount of the difference between capital asset additions and depreciation in the current period.
Capital assets used in governmental activities $7,346,076Depreciation Expense (3,069,649)
4,276,427
Governmental funds only report the disposal of assets to theextent proceeds are received from the sale. In the statementof activities, a gain or loss is reported for each disposal. Theamount of the proceeds must be removed and the gain or losson the disposal of capital assets must be recognized. This is theamount of the difference between the proceeds and the gain or loss. (19,891)
Revenues in the statement of activities that do not providecurrent financial resources are not reported as revenues inthe funds.
Income Taxes ($446,731)Delinquent Property Taxes (23,490)Interest (2,213)Intergovernmental (817,201)Other (2,563)
(1,292,198)
In the statement of activities, certain costs and proceeds associated with long-term obligations issued or refunded, including certificates of participation and tax increment financing bonds, during the year are accrued and amortized over the life of the debt obligation. In governmental funds these costs and proceeds are recognized as financing sources and uses.
Bond Issuance Costs $122,165Premium on Bonds Issued (727,118)Deferred Amount on Refunding 1,302,446
697,493
Repayment of bond principal is an expenditure in thegovernmental funds, but the repayment reduces long-termliabilities in the statement of net assets. 1,240,000
In the statement of activities interest expense is accrued when incurred,whereas in governmental funds an interest expenditure is reportedwhen due. (24,966)
Continued24
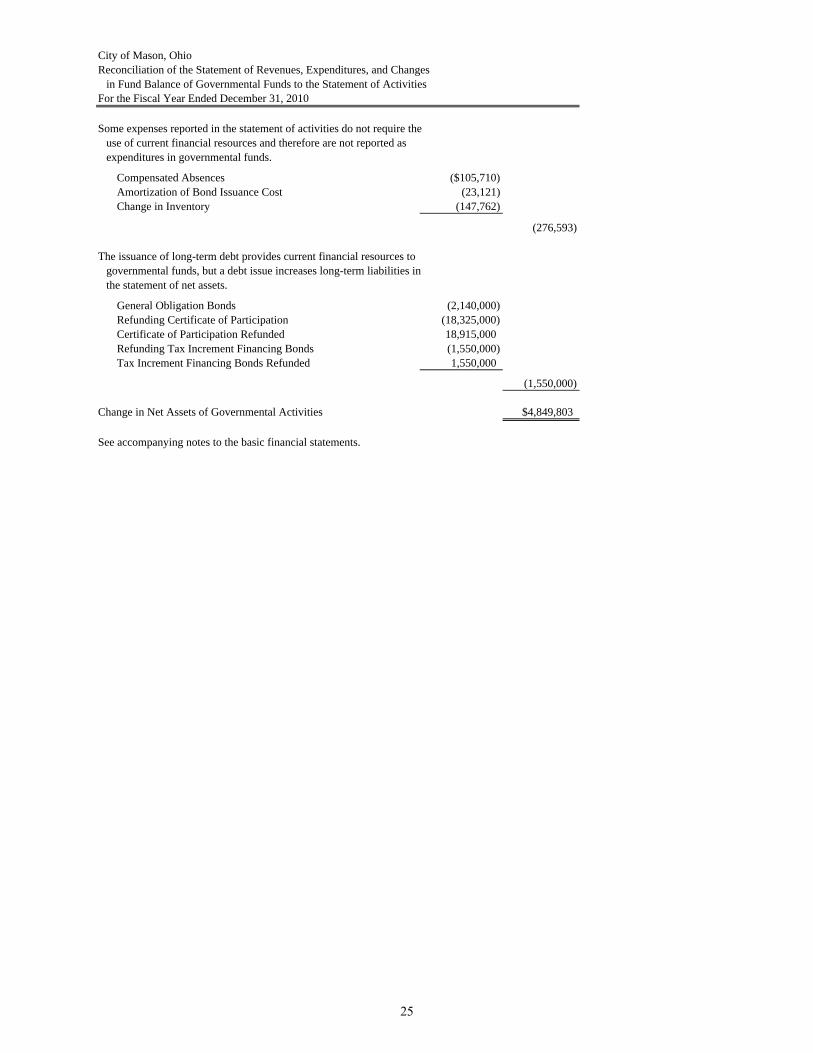
City of Mason, OhioReconciliation of the Statement of Revenues, Expenditures, and Changes
in Fund Balance of Governmental Funds to the Statement of ActivitiesFor the Fiscal Year Ended December 31, 2010
Some expenses reported in the statement of activities do not require theuse of current financial resources and therefore are not reported asexpenditures in governmental funds.
Compensated Absences ($105,710)Amortization of Bond Issuance Cost (23,121)Change in Inventory (147,762)
(276,593)
The issuance of long-term debt provides current financial resources to governmental funds, but a debt issue increases long-term liabilities in the statement of net assets.
General Obligation Bonds (2,140,000)Refunding Certificate of Participation (18,325,000)Certificate of Participation Refunded 18,915,000Refunding Tax Increment Financing Bonds (1,550,000)Tax Increment Financing Bonds Refunded 1,550,000
(1,550,000)
Change in Net Assets of Governmental Activities $4,849,803
See accompanying notes to the basic financial statements.
25
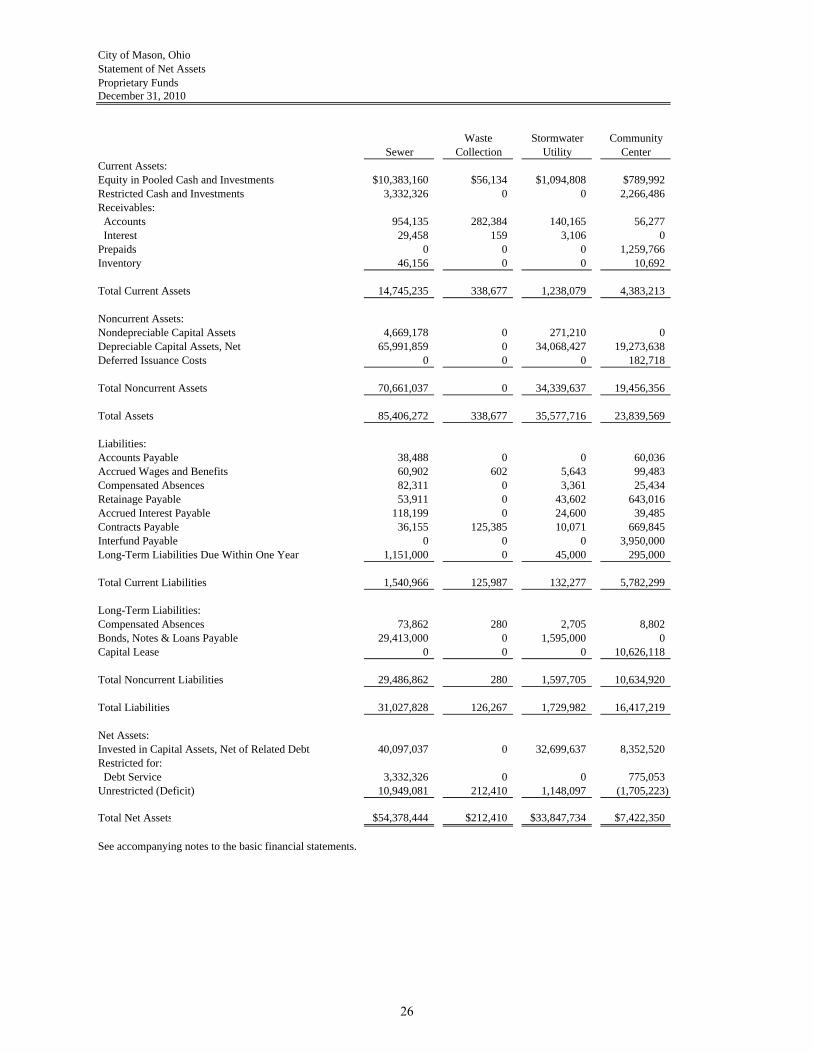
City of Mason, OhioStatement of Net AssetsProprietary FundsDecember 31, 2010
Waste Stormwater CommunitySewer Collection Utility Center
Current Assets:Equity in Pooled Cash and Investments $10,383,160 $56,134 $1,094,808 $789,992Restricted Cash and Investments 3,332,326 0 0 2,266,486Receivables: Accounts 954,135 282,384 140,165 56,277 Interest 29,458 159 3,106 0Prepaids 0 0 0 1,259,766Inventory 46,156 0 0 10,692
Total Current Assets 14,745,235 338,677 1,238,079 4,383,213
Noncurrent Assets:Nondepreciable Capital Assets 4,669,178 0 271,210 0Depreciable Capital Assets, Net 65,991,859 0 34,068,427 19,273,638Deferred Issuance Costs 0 0 0 182,718
Total Noncurrent Assets 70,661,037 0 34,339,637 19,456,356
Total Assets 85,406,272 338,677 35,577,716 23,839,569
Liabilities:Accounts Payable 38,488 0 0 60,036Accrued Wages and Benefits 60,902 602 5,643 99,483Compensated Absences 82,311 0 3,361 25,434Retainage Payable 53,911 0 43,602 643,016Accrued Interest Payable 118,199 0 24,600 39,485Contracts Payable 36,155 125,385 10,071 669,845Interfund Payable 0 0 0 3,950,000Long-Term Liabilities Due Within One Year 1,151,000 0 45,000 295,000
Total Current Liabilities 1,540,966 125,987 132,277 5,782,299
Long-Term Liabilities:Compensated Absences 73,862 280 2,705 8,802Bonds, Notes & Loans Payable 29,413,000 0 1,595,000 0Capital Lease 0 0 0 10,626,118
Total Noncurrent Liabilities 29,486,862 280 1,597,705 10,634,920
Total Liabilities 31,027,828 126,267 1,729,982 16,417,219
Net Assets:Invested in Capital Assets, Net of Related Debt 40,097,037 0 32,699,637 8,352,520Restricted for: Debt Service 3,332,326 0 0 775,053Unrestricted (Deficit) 10,949,081 212,410 1,148,097 (1,705,223)
Total Net Assets $54,378,444 $212,410 $33,847,734 $7,422,350
See accompanying notes to the basic financial statements.
26
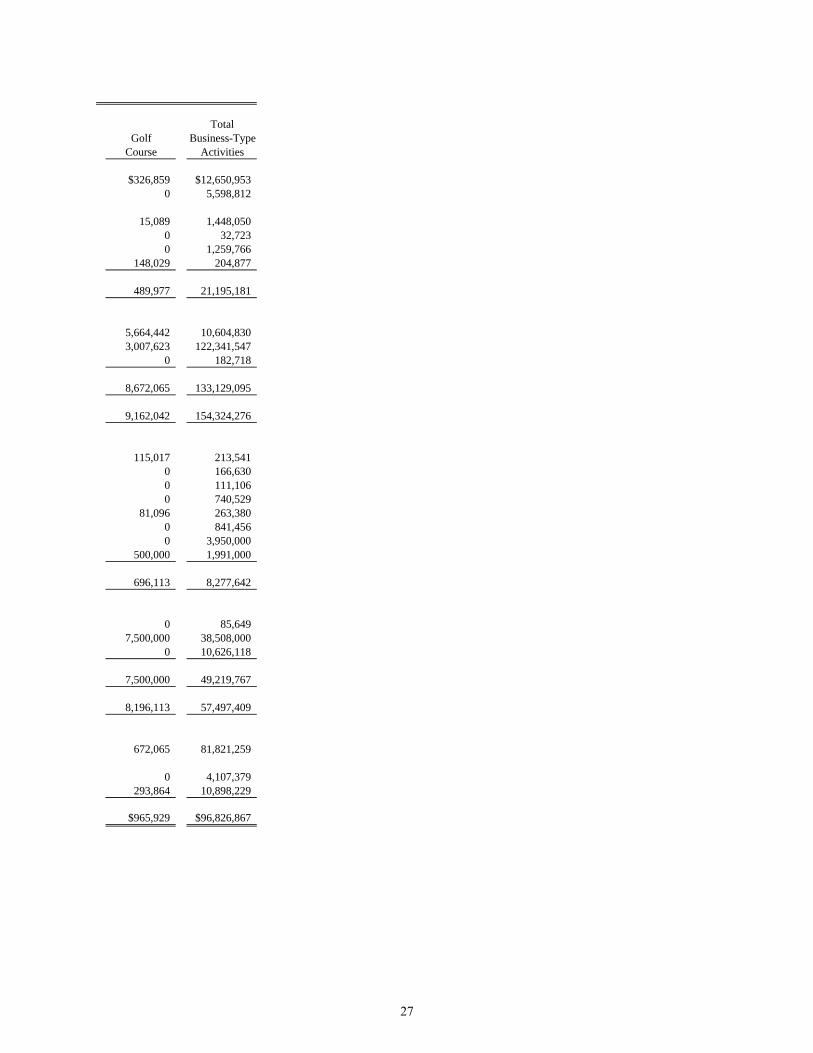
TotalGolf Business-Type
Course Activities
$326,859 $12,650,9530 5,598,812
15,089 1,448,0500 32,7230 1,259,766
148,029 204,877
489,977 21,195,181
5,664,442 10,604,8303,007,623 122,341,547
0 182,718
8,672,065 133,129,095
9,162,042 154,324,276
115,017 213,5410 166,6300 111,1060 740,529
81,096 263,3800 841,4560 3,950,000
500,000 1,991,000
696,113 8,277,642
0 85,6497,500,000 38,508,000
0 10,626,118
7,500,000 49,219,767
8,196,113 57,497,409
672,065 81,821,259
0 4,107,379293,864 10,898,229
$965,929 $96,826,867
27
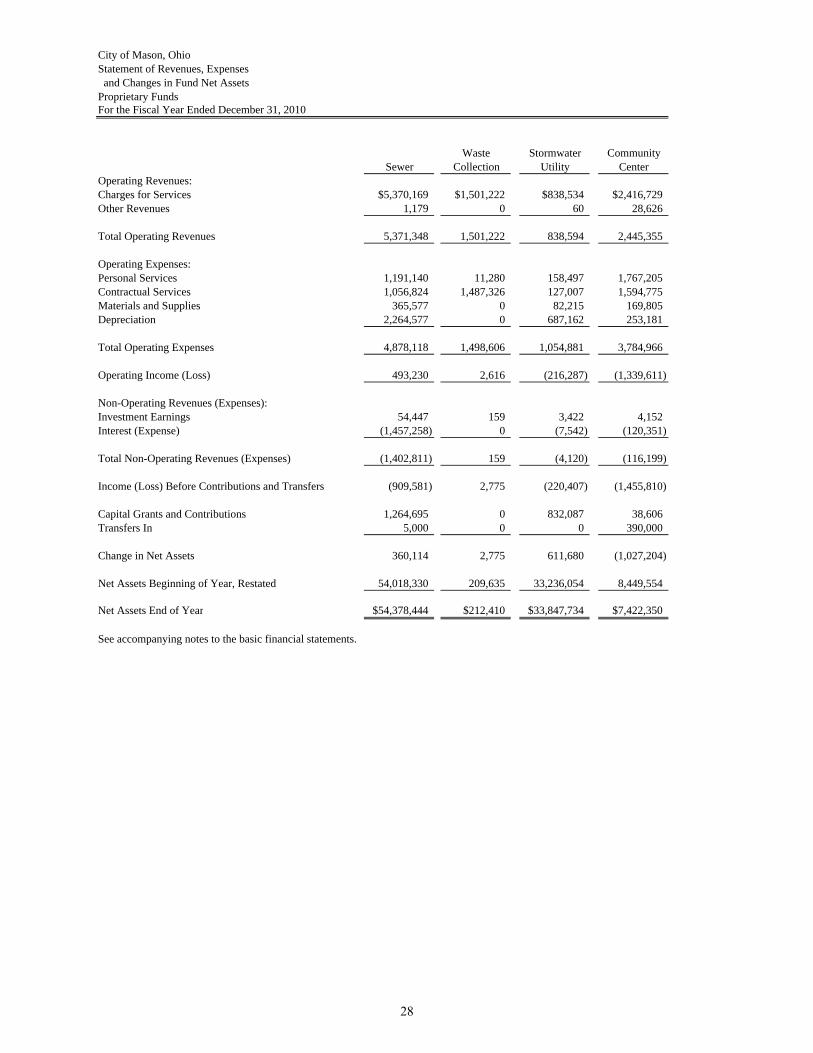
City of Mason, OhioStatement of Revenues, Expenses and Changes in Fund Net AssetsProprietary FundsFor the Fiscal Year Ended December 31, 2010
Waste Stormwater CommunitySewer Collection Utility Center
Operating Revenues:Charges for Services $5,370,169 $1,501,222 $838,534 $2,416,729Other Revenues 1,179 0 60 28,626
Total Operating Revenues 5,371,348 1,501,222 838,594 2,445,355
Operating Expenses:Personal Services 1,191,140 11,280 158,497 1,767,205Contractual Services 1,056,824 1,487,326 127,007 1,594,775Materials and Supplies 365,577 0 82,215 169,805Depreciation 2,264,577 0 687,162 253,181
Total Operating Expenses 4,878,118 1,498,606 1,054,881 3,784,966
Operating Income (Loss) 493,230 2,616 (216,287) (1,339,611)
Non-Operating Revenues (Expenses):Investment Earnings 54,447 159 3,422 4,152Interest (Expense) (1,457,258) 0 (7,542) (120,351)
Total Non-Operating Revenues (Expenses) (1,402,811) 159 (4,120) (116,199)
Income (Loss) Before Contributions and Transfers (909,581) 2,775 (220,407) (1,455,810)
Capital Grants and Contributions 1,264,695 0 832,087 38,606Transfers In 5,000 0 0 390,000
Change in Net Assets 360,114 2,775 611,680 (1,027,204)
Net Assets Beginning of Year, Restated 54,018,330 209,635 33,236,054 8,449,554
Net Assets End of Year $54,378,444 $212,410 $33,847,734 $7,422,350
See accompanying notes to the basic financial statements.
28
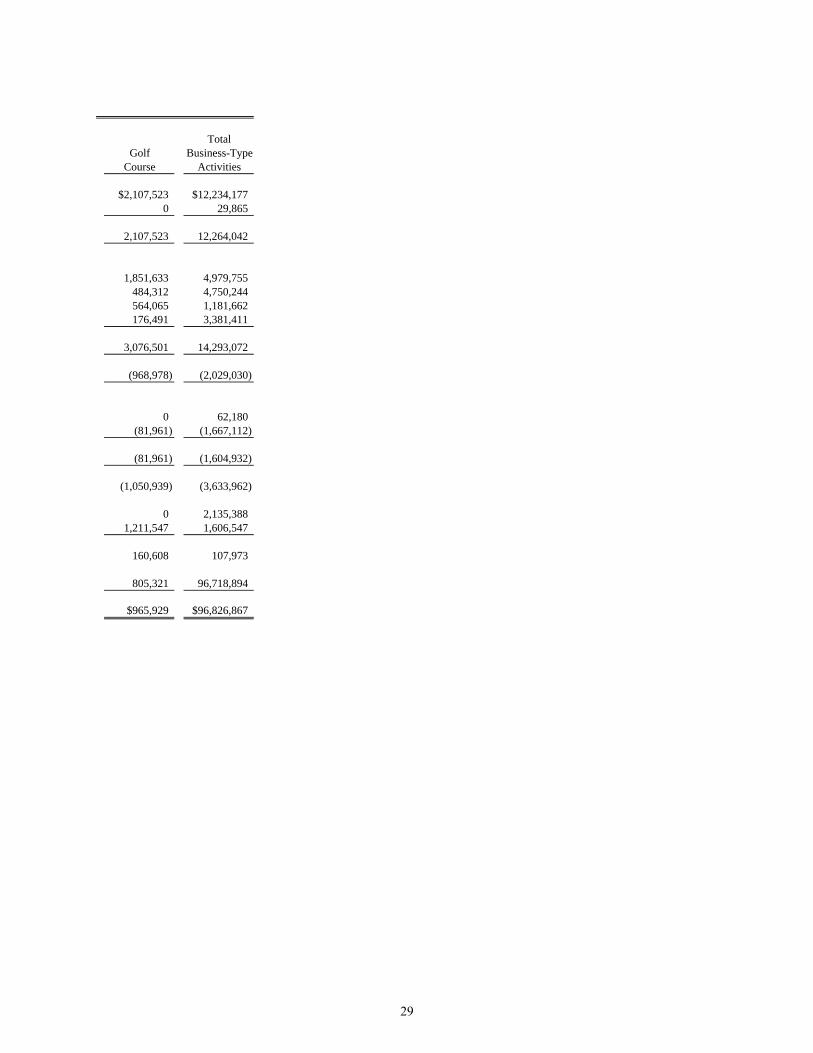
TotalGolf Business-Type
Course Activities
$2,107,523 $12,234,1770 29,865
2,107,523 12,264,042
1,851,633 4,979,755484,312 4,750,244564,065 1,181,662176,491 3,381,411
3,076,501 14,293,072
(968,978) (2,029,030)
0 62,180(81,961) (1,667,112)
(81,961) (1,604,932)
(1,050,939) (3,633,962)
0 2,135,3881,211,547 1,606,547
160,608 107,973
805,321 96,718,894
$965,929 $96,826,867
29
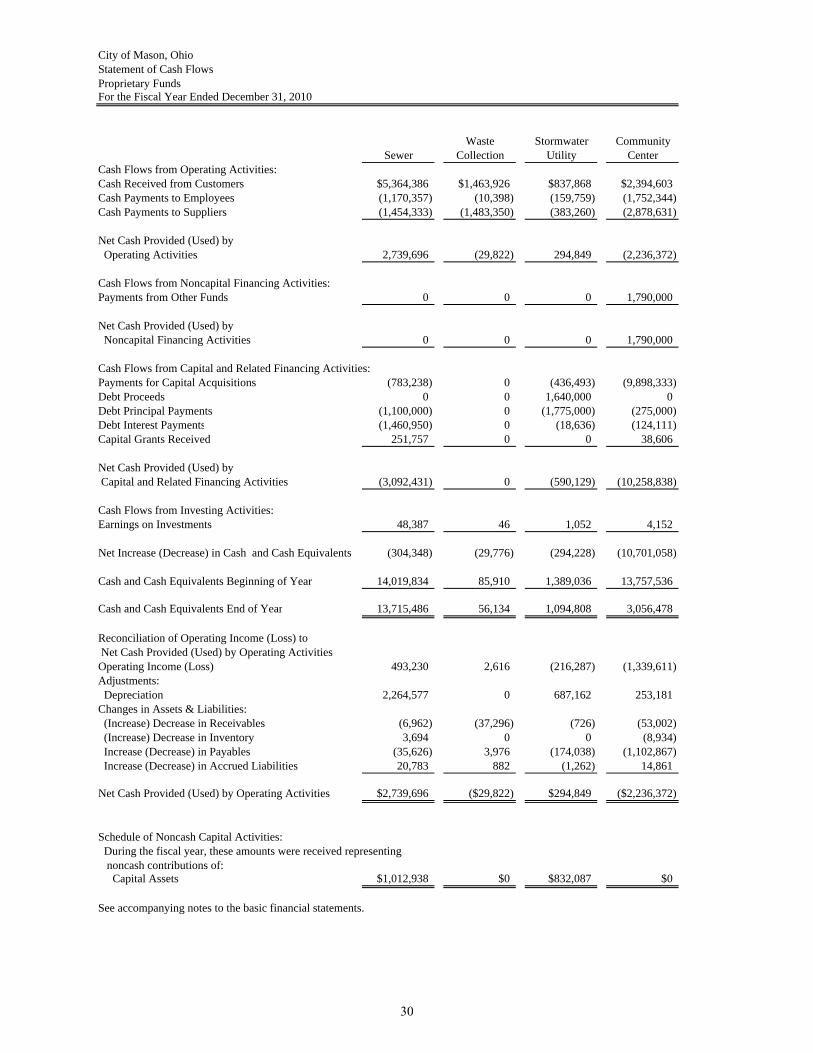
City of Mason, OhioStatement of Cash FlowsProprietary FundsFor the Fiscal Year Ended December 31, 2010
Waste Stormwater CommunitySewer Collection Utility Center
Cash Flows from Operating Activities:Cash Received from Customers $5,364,386 $1,463,926 $837,868 $2,394,603Cash Payments to Employees (1,170,357) (10,398) (159,759) (1,752,344)Cash Payments to Suppliers (1,454,333) (1,483,350) (383,260) (2,878,631)
Net Cash Provided (Used) by Operating Activities 2,739,696 (29,822) 294,849 (2,236,372)
Cash Flows from Noncapital Financing Activities:Payments from Other Funds 0 0 0 1,790,000
Net Cash Provided (Used) by Noncapital Financing Activities 0 0 0 1,790,000
Cash Flows from Capital and Related Financing Activities:Payments for Capital Acquisitions (783,238) 0 (436,493) (9,898,333)Debt Proceeds 0 0 1,640,000 0Debt Principal Payments (1,100,000) 0 (1,775,000) (275,000)Debt Interest Payments (1,460,950) 0 (18,636) (124,111)Capital Grants Received 251,757 0 0 38,606
Net Cash Provided (Used) by Capital and Related Financing Activities (3,092,431) 0 (590,129) (10,258,838)
Cash Flows from Investing Activities:Earnings on Investments 48,387 46 1,052 4,152
Net Increase (Decrease) in Cash and Cash Equivalents (304,348) (29,776) (294,228) (10,701,058)
Cash and Cash Equivalents Beginning of Year 14,019,834 85,910 1,389,036 13,757,536
Cash and Cash Equivalents End of Year 13,715,486 56,134 1,094,808 3,056,478
Reconciliation of Operating Income (Loss) to Net Cash Provided (Used) by Operating ActivitiesOperating Income (Loss) 493,230 2,616 (216,287) (1,339,611)Adjustments: Depreciation 2,264,577 0 687,162 253,181Changes in Assets & Liabilities: (Increase) Decrease in Receivables (6,962) (37,296) (726) (53,002) (Increase) Decrease in Inventory 3,694 0 0 (8,934) Increase (Decrease) in Payables (35,626) 3,976 (174,038) (1,102,867) Increase (Decrease) in Accrued Liabilities 20,783 882 (1,262) 14,861
Net Cash Provided (Used) by Operating Activities $2,739,696 ($29,822) $294,849 ($2,236,372)
Schedule of Noncash Capital Activities: During the fiscal year, these amounts were received representing noncash contributions of: Capital Assets $1,012,938 $0 $832,087 $0
See accompanying notes to the basic financial statements.
30
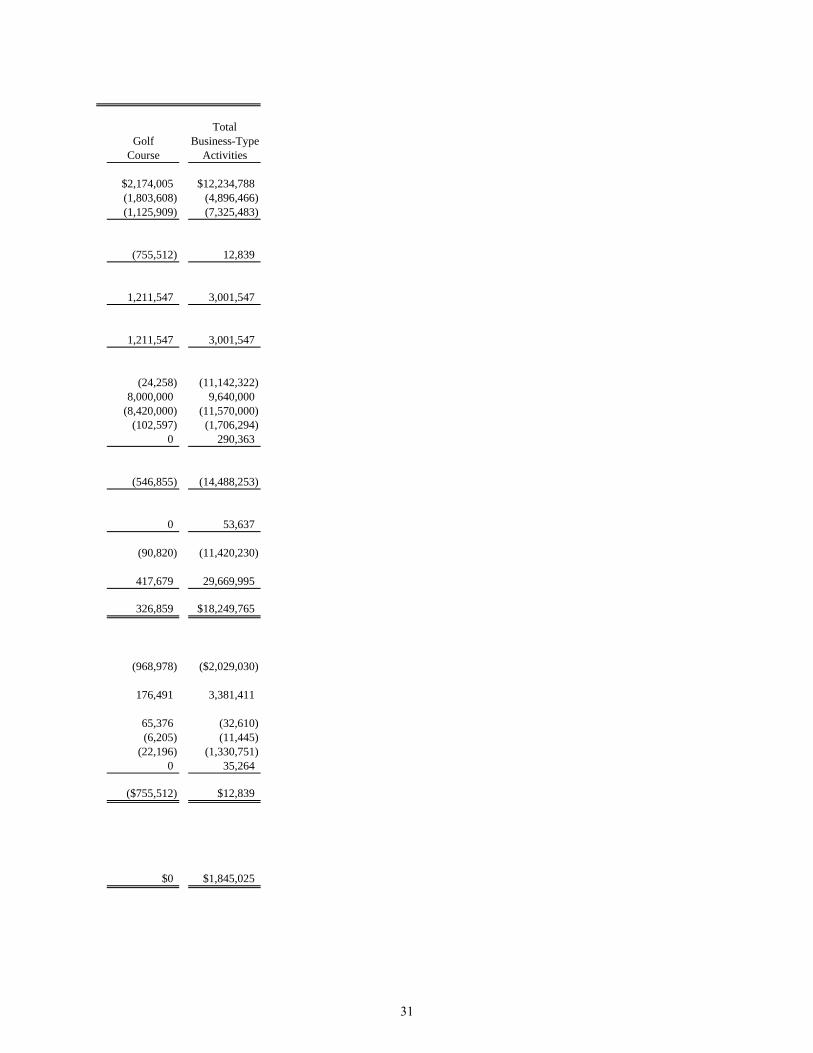
TotalGolf Business-Type
Course Activities
$2,174,005 $12,234,788(1,803,608) (4,896,466)(1,125,909) (7,325,483)
(755,512) 12,839
1,211,547 3,001,547
1,211,547 3,001,547
(24,258) (11,142,322)8,000,000 9,640,000
(8,420,000) (11,570,000)(102,597) (1,706,294)
0 290,363
(546,855) (14,488,253)
0 53,637
(90,820) (11,420,230)
417,679 29,669,995
326,859 $18,249,765
(968,978) ($2,029,030)
176,491 3,381,411
65,376 (32,610)(6,205) (11,445)
(22,196) (1,330,751)0 35,264
($755,512) $12,839
$0 $1,845,025
31
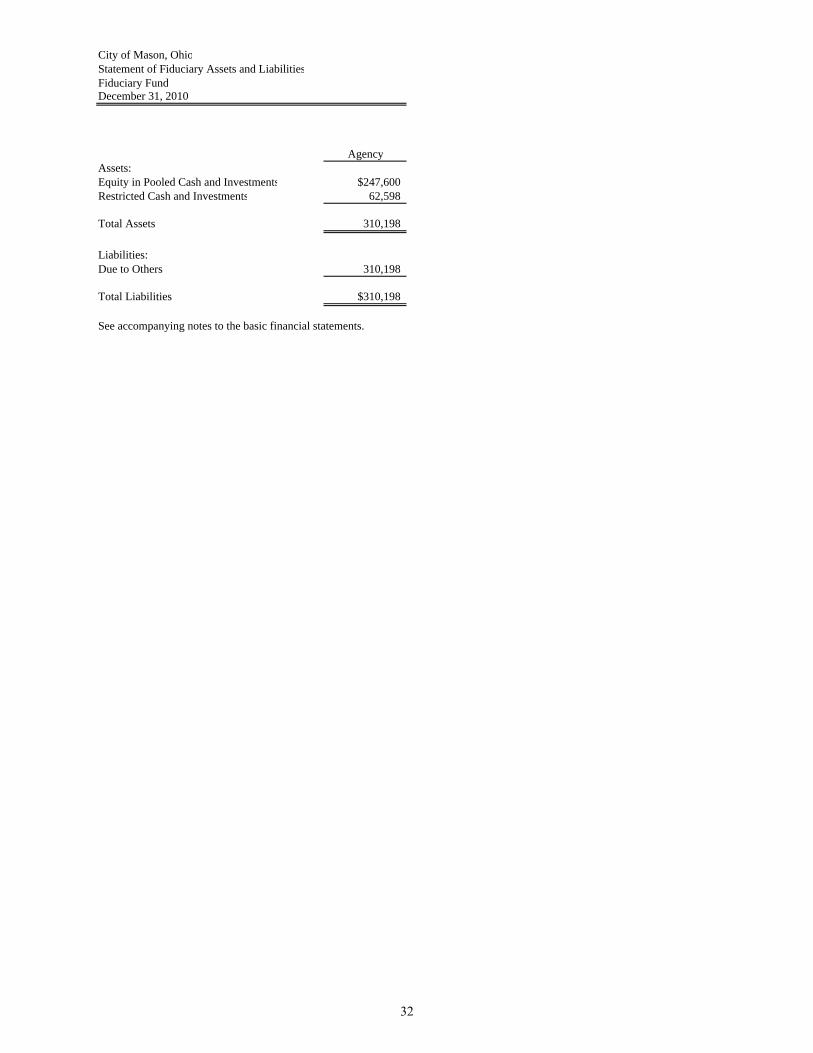
City of Mason, OhioStatement of Fiduciary Assets and LiabilitiesFiduciary FundDecember 31, 2010
AgencyAssets:Equity in Pooled Cash and Investments $247,600Restricted Cash and Investments 62,598
Total Assets 310,198
Liabilities:Due to Others 310,198
Total Liabilities $310,198
See accompanying notes to the basic financial statements.
32
City of Mason, Ohio Notes to the Basic Financial Statements For the Year Ended December 31, 2010 Note 1 – Description of the City and Reporting Entity The City of Mason, Ohio (the “City”) was incorporated in 1815, adopted its Charter in 1969 and became a city in 1971. The City is a home-rule municipal corporation created under the laws of the State of Ohio. The City operates under a Council-Manager form of government. Reporting Entity A reporting entity is comprised of the primary government, component units and other organizations that are included to ensure that financial statements are not misleading. The primary government of the City consists of all funds, departments, boards and agencies that are not legally separate from the City. For the City, this includes; police and fire, parks and recreation, planning, zoning, community development, street maintenance, sewer, stormwater waste collection, community center and golf center. Council and the City Manager have direct responsibility for these activities. Component units are legally separate organizations for which the City is financially accountable. The City is financially accountable for an organization if the City appoints a voting majority of the organization’s governing board; and (1) the City is able to significantly influence the programs or services performed or provided by the organization; or (2) the City is legally entitled to or can otherwise access the organization’s resources; the City is legally obligated or has otherwise assumed the responsibility to finance the deficits of, or provide financial support to, the organization; or the City is obligated for the debt of the organizations. Component units may also include organizations for which the City authorizes the issuance of debt or the levying of taxes, or determines the budget. There are no component units included as part of this report. The Miami Valley Risk Management Association, Inc. (MVRMA) is a risk sharing insurance pool established for the purpose of enabling the subscribing political subdivisions to obtain liability insurance and providing a formalized, jointly administered self-insurance fund for its members. The members formed a not-for-profit corporation known as Miami Valley Risk Management Association, Inc. for the purpose of administering the pool. The subscribing members of the self-insurance pool include the Cities of Beavercreek, Bellbrook, Blue Ash, Centerville, Englewood, Kettering, Madeira, Mason, Miamisburg, Montgomery, Piqua, Sidney, Springdale, Tipp City, Troy, Vandalia, West Carrollton, Wilmington and Wyoming and the Village of Indian Hill. The City has no explicit and measurable equity interest in MVRMA and no ongoing financial responsibility for MVRMA. More information on MVRMA is presented in Note 5. The City participates in a joint venture called the Liberty Township Joint Economic Development District (JEDD). This joint venture is presented in Note 17. Note 2 – Summary of Significant Accounting Policies The financial statements of the City have been prepared in conformity with generally accepted accounting principles (GAAP) as applied to local governmental units. The Governmental Accounting Standards Board (GASB) is the accepted standard-setting body for establishing governmental accounting and financial principles. The City also applies Financial Accounting
33
City of Mason, Ohio Notes to the Basic Financial Statements For the Year Ended December 31, 2010 Standards Board (FASB) guidance issued on or before November 30, 1989, to its governmental and business-type activities and to its enterprise funds provided they do not conflict with or contradict GASB pronouncements. For proprietary funds the City has elected not to follow subsequent private-sector guidance. The most significant of the City’s accounting policies are described below. Measurement Focus
Government-Wide Financial Statements The government-wide financial statements are prepared using the economic resources measurement focus. All assets and all liabilities associated with the operation of the City are included on the Statement of Net Assets. Fund Financial Statements All governmental funds are accounted for using a flow of current financial resources measurement focus. With this measurement focus, only current assets and current liabilities generally are included on the balance sheet. The statement of revenues, expenditures and changes in fund balances reports on the sources (i.e., revenues and other financing sources) and uses (i.e., expenditures and other financing uses) of current financial resources. This approach differs from the manner in which the governmental activities of the government-wide financial statements are prepared. Governmental fund financial statements therefore include a reconciliation with brief explanations to better identify the relationship between the government-wide statements and the statements for governmental funds. Like the government-wide statements, all proprietary funds are accounted for on a flow of economic resources measurement focus. All assets and all liabilities associated with the operation of these funds are included on the statement of net assets. The statement of revenues, expenses and changes in fund net assets presents increases (i.e., revenues) and decreases (i.e., expenses) in total net assets. The statement of cash flows provides information about how the City finances and meets the cash flow needs of its proprietary activities.
Basis of Presentation The City’s basic financial statements consist of government-wide statements, including a statement of net assets and a statement of activities, and fund financial statements which provide a more detailed level of financial information.
Government-Wide Financial Statements The statement of net assets and the statement of activities display information about the City as a whole. These statements include the financial activities of the primary government, except for fiduciary funds. The statements distinguish between those activities of the City that are governmental and those that are considered business-type activities. The statement of net assets presents the financial condition of the governmental and business-type activities of the City at year-end. The statement of activities presents a
34
City of Mason, Ohio Notes to the Basic Financial Statements For the Year Ended December 31, 2010
comparison between direct expenses and program revenues for each program or function of the City’s governmental activities and for the business-type activities of the City. Direct expenses are those that are specifically associated with a service, program or department and therefore clearly identifiable to a particular function. Program revenues include charges paid by the recipient of the goods or services offered by the program, grants and contributions that are restricted to meeting the operational or capital requirements of a particular program and interest earned on grants that is required to be used to support a particular program. Revenues which are not classified as program revenues are presented as general revenues of the City, with certain limited exceptions. The comparison of direct expenses with program revenues identifies the extent to which each business segment or governmental function is self-financing or draws from the general revenues of the City. Fund Financial Statements During the year, the City segregates transactions related to certain City functions or activities in separate funds in order to aid financial management and to demonstrate legal compliance. Fund financial statements are designed to present financial information of the City at this more detailed level. The focus of governmental and enterprise fund financial statements is on major funds. Each major fund is presented in a separate column. Non-major funds are aggregated and presented in a single column. Fiduciary funds are reported by type.
Fund Accounting The City uses funds to maintain its financial records during the year. A fund is defined as a fiscal and accounting entity with a self balancing set of accounts. There are three categories of funds: governmental, proprietary and fiduciary.
Governmental Funds Governmental funds are those through which most governmental functions typically are financed. Governmental fund reporting focuses on the sources, uses and balances of current financial resources. Expendable assets are assigned to the various governmental funds according to the purposes for which they may or must be used. Current liabilities are assigned to the fund from which they will be paid. The difference between governmental fund assets and liabilities is reported as fund balance. The following are the City's major governmental funds:
General Fund - The general fund accounts for all financial resources except those required to be accounted for in another fund. The general fund balance is available to the City for any purpose provided it is expended or transferred according to the charter of the City and/or the general laws of Ohio. Street Construction, Maintenance and Repair Special Revenue Fund – This special revenue fund accounts for 92.5% of the City’s share of state gasoline taxes and motor vehicle license fees. State law requires that such monies be spent on street construction and maintenance.
35
City of Mason, Ohio Notes to the Basic Financial Statements For the Year Ended December 31, 2010
Fire and Emergency Medical Service Special Revenue Fund – This special revenue fund accounts for expenditures of property tax revenues and other resources in the operation of the City’s Fire Department.
The other governmental funds of the City account for grants and other resources that are generally restricted to use for a particular purpose. Proprietary Funds
Proprietary fund reporting focuses on changes in net assets, financial position and cash flows. Proprietary funds are classified as either enterprise or internal service. The City does not have an internal service fund.
Enterprise Funds - Enterprise funds may be used to account for any activity for which a fee is charged to external users for goods or services. The following are the City’s major enterprise funds:
Sewer Fund - The sewer fund accounts for the provision of sanitary sewer service to the residents and commercial users located within the City. Waste Collection Fund – This fund accounts for the waste collection provided to the residents of the City. Stormwater Utility Fund – This fund accounts for provision of stormwater systems within the City. Community Center Fund – This fund accounts for the community center services provided to the residents of the City and the expansion of the Center. Golf Course Fund – This fund accounts for the golf course provided to residents within and outside of the City.
Fiduciary Funds Fiduciary fund reporting focuses on net assets and changes in net assets. The fiduciary fund category is split into four classifications: agency funds, pension trust funds, investment trust funds and private-purpose trust funds. The City has three Agency funds. The City has a Municipal Court Agency Fund (to account for amounts held on behalf of other governments and bonds deposited with the court pending final disposition of various causes), a Mason Port Authority Agency Fund (to enhance future development opportunities in the City, to support the economic development strategies of the City and to promote participation in activities that will have a positive impact on the general economic wealth of Mason), and a Community Improvement Corporation Agency Fund (to account for custodial transactions related to community improvement). Agency funds are custodial in nature (assets equal liabilities) and do not involve measurement of results of operations. Trust funds are used to account for assets held under a trust agreement for individuals, private organizations, or other governments and are therefore not available to support the City’s own programs. The City currently has no trust funds.
36
City of Mason, Ohio Notes to the Basic Financial Statements For the Year Ended December 31, 2010 Basis of Accounting Basis of accounting determines when transactions are recorded in the financial records and reported on the financial statements. Government-wide financial statements are prepared using the accrual basis of accounting. Governmental funds use the modified accrual basis of accounting. Proprietary and fiduciary funds also use the accrual basis of accounting. Differences in the accrual and modified accrual basis of accounting arise in the recognition of revenue, the recording of deferred revenue and in the presentation of expenses versus expenditures.
Revenues - Exchange and Non-exchange Transactions Revenue resulting from exchange transactions, in which each party gives and receives essentially equal value, is recorded on the accrual basis when the exchange takes place. On a modified accrual basis, revenue is recorded in the fiscal year in which the resources are measurable and become available. Available means that the resources will be collected within the current fiscal year or are expected to be collected soon enough thereafter to be used to pay liabilities of the current fiscal year. For the City, available means expected to be received within sixty days of year-end. Nonexchange transactions, in which the City receives value without directly giving equal value in return, include income taxes, property taxes, grants, entitlements and donations. On an accrual basis, revenue from income taxes is recognized in the period in which the income is earned. Revenue from property taxes is recognized in the year for which the taxes are levied. Revenue from grants, entitlements and donations is recognized in the year in which all eligibility requirements have been satisfied. Eligibility requirements include timing requirements, which specify the year when the resources are required to be used or the year when use is first permitted; matching requirements, in which the City must provide local resources to be used for a specified purpose; and expenditure requirements, in which the resources are provided to the City on a reimbursement basis. On a modified accrual basis, revenue from nonexchange transactions must also be available before it can be recognized. Under the modified accrual basis, the following revenue sources are considered to be both measurable and available at year-end: income tax, state-levied locally shared taxes (including gasoline tax), fines and forfeitures, interest, grants and fees. Deferred Revenue Deferred revenue arises when assets are recognized before revenue recognition criteria have been satisfied. Property taxes for which there is an enforceable legal claim as of the current year-end, but which were levied to finance future operations, have been recorded as deferred revenue. Special assessments not received within the available period and grants and entitlements received before the eligibility requirements are met are also recorded as deferred revenue.
37
City of Mason, Ohio Notes to the Basic Financial Statements For the Year Ended December 31, 2010
On governmental fund financial statements, receivables that will not be collected within the available period have also been reported as deferred revenue. Unearned Revenue Unearned revenue represents amounts under the accrual basis of accounting for which asset recognition criteria have been met, but for which revenue recognition criteria have not been met because such amounts have not yet been earned. Expenses/Expenditures On the accrual basis of accounting, expenses are recognized at the time they are incurred. The measurement focus of governmental fund accounting is on decreases in net financial resources (expenditures) rather than expenses. Expenditures are generally recognized in the accounting period in which the related fund liability is incurred, if measurable. Allocations of cost, such as depreciation and amortization, are not recognized in governmental funds.
Equity in Pooled Cash and Investments To improve cash management the City’s cash and investments are pooled. Monies for all funds, except cash and investments held in segregated accounts, are maintained in this pool. Individual fund integrity is maintained through City records. Each fund’s interest in the pool is presented as “Equity in Pooled Cash and Investments” on the balance sheet. Investments are reported at fair value which is based on quoted market prices, with the exception of nonparticipating repurchase agreements, which are reported at cost. For investments in open-end mutual funds, fair value is determined by the fund’s share price. For purposes of the statement of cash flows and for presentation on the statement of net assets/balance sheet, investments with an original maturity of three months or less and investments of the cash management pool are considered to be cash equivalents. Following the Ohio Revised Code, the City has specified certain funds to receive an allocation of interest earnings. Interest revenues during 2010 amounted to $215,521 (on the fund financial statements). The general fund interest revenue was $102,778. Inventory On government-wide financial statements, inventories are presented at the lower of cost or market on a first-in, first-out basis and are expensed when used. On fund financial statements, inventories of governmental funds are stated at cost while inventories of proprietary funds are stated at the lower of cost or market. For all funds, cost is determined on a first-in, first-out basis. Inventory in governmental funds consists of expendable supplies held for consumption. The cost of inventory items is recorded as an expenditure in the governmental fund types when purchased. Inventories of the proprietary funds are expensed when used.
38
City of Mason, Ohio Notes to the Basic Financial Statements For the Year Ended December 31, 2010 Prepaid Items Payments made for services that will benefit periods beyond December 31, 2010, are recorded as prepaid items using the consumption method. A current asset for the prepaid amount is recorded at the time of the purchase and an expenditure/expense is reported in the year in which services are consumed. Capital Assets
General capital assets are those assets not specifically related to activities reported in the proprietary funds. These assets generally result from expenditures in the governmental funds. These assets are reported in the governmental activities column of the government-wide statement of net assets but are not reported in the fund financial statements. Capital assets utilized by the proprietary funds are reported both in the business-type activities column of the government-wide statement of net assets and in the respective proprietary funds. All capital assets are capitalized at cost (or estimated historical cost) and updated for additions and retirements during the year. Donated capital assets are recorded at their fair market values as of the date received. The City’s infrastructure consists of bridges, culverts, curbs, sidewalks, storm sewers, streets, and water and sewer lines. Improvements are capitalized; the costs of normal maintenance and repairs that do not add to the value of the asset or materially extend an asset’s life are not. Interest incurred during the construction of proprietary fund capital assets are also capitalized. The City uses a $5,000 capitalization threshold. All reported capital assets are depreciated except for land and construction in progress. The Land classification includes the City’s right-of-way easements (intangible assets, per GASB 51). Improvements are depreciated over the remaining useful lives of the related capital assets. Useful lives for infrastructure were estimated based on the City’s historical records of necessary improvements and replacement. Depreciation is computed using the straight-line method over the following useful lives:
Description Estimated Lives Buildings and Improvements 15-50 years Equipment 5-20 years Infrastructure 25-60 years
Compensated Absences The City reports compensated absences in accordance with the provisions of GASB No. 16, "Accounting for Compensated Absences.” Vacation benefits are accrued as a liability as the benefits are earned if the employees' rights to receive compensation are attributable to services already rendered and it is probable that the employer will compensate the employees for the benefits through paid time off or some other means. Sick leave benefits are accrued as a liability using the vesting method. The entire compensated absence liability is reported on the government-wide financial statements. For governmental fund financial statements, a liability is recorded only for the portion of unpaid compensated absences that have matured, for example, as a result of employee resignations and retirements. In
39
City of Mason, Ohio Notes to the Basic Financial Statements For the Year Ended December 31, 2010 proprietary funds, the entire amount of compensated absences is reported as a fund liability. Accrued Liabilities and Long-Term Obligations
All payables, accrued liabilities and long-term obligations are reported in the government-wide financial statements, and all payables, accrued liabilities and long-term obligations payable from proprietary funds are reported on the proprietary fund financial statements. In general, governmental fund payables and accrued liabilities that, once incurred, are paid in a timely manner and in full from current financial resources, are reported as obligations of the funds. However, claims and judgments, and compensated absences that will be paid from governmental funds are reported as a liability in the fund financial statements only to the extent that they are due for payment during the current year. Bonds, capital leases and long-term loans are recognized as a liability on the fund financial statements when due. Fund Balance Reserves
The City reserves those portions of fund balance which are legally segregated for a specific future use or which do not represent expendable resources and therefore are not available for appropriation or expenditure. As a result, encumbrances, inventories, prepaids and debt service are recorded as a reservation of fund balance. Restricted Assets
Restricted assets consist of resources whose use is restricted by bond covenant agreements. Net Assets
Net assets represent the difference between assets and liabilities. Net assets invested in capital assets, net of related debt consists of capital assets, net of accumulated depreciation, reduced by the outstanding balances of any borrowing used for the acquisition, construction or improvement of those assets. Net assets are reported as restricted when there are limitations imposed on their use either through the enabling legislation adopted by the City or through external restrictions imposed by creditors, grantors or laws or regulations of other governments. The City applies restricted resources when an expense is incurred for purposes for which both restricted and unrestricted net assets are available. The City’s Governmental Activities, Sewer fund and Community Center fund have restricted net assets relative to those resources necessary to comply with various covenants of bond financing agreements. Of the City’s $20,469,332 in restricted net assets, none were restricted by enabling legislation. Operating Revenues and Expenses
The City, in its proprietary funds, distinguishes operating revenues and expenses from nonoperating items. Operating revenues and expenses generally result from providing services and delivering goods in connection with a proprietary fund’s principal ongoing operations. The principal operating revenues of the City’s enterprise fund are charges to customers for sales and services. Operating expenses for the enterprise fund includes the cost of sales and services,
40
City of Mason, Ohio Notes to the Basic Financial Statements For the Year Ended December 31, 2010 administrative expenses, and depreciation on capital assets. All revenues and expenses not meeting this definition are reported as nonoperating revenues and expenses. Contributions of Capital Contributions of capital in proprietary fund financial statements arise from outside contributions of capital assets, tap-in fees to the extent they exceed the cost of the connection to the system, or from grants or outside contributions of resources restricted to capital acquisition and construction. Interfund Activity Transfers between governmental and business-type activities on the government-wide statements are reported in the same manner as general revenues. Exchange transactions between funds are reported as revenues in the seller funds and as expenditures/expenses in the purchaser funds. Flows of cash or goods from one fund to another without a requirement for repayment are reported as interfund transfers. Interfund transfers are reported as other financing sources/uses in governmental funds and after nonoperating revenues/expenses in proprietary funds. Repayments from funds responsible for particular expenditures/expenses to the funds that initially paid for them are not presented on the financial statements. As a general rule, the effect of interfund (internal) activity has been eliminated from the government-wide statement of activities. The interfund services provided and used are not eliminated through the process of consolidation. Estimates The preparation of the financial statements in conformity with generally accepted accounting principles requires management to make estimates and assumptions that affect the amounts reported in the financial statements and accompanying notes. Actual results may differ from those estimates. Note 3 – Equity in Pooled Cash and Investments . Cash resources of several individual funds are combined to form a pool of cash and investments. Each fund type’s portion of this pool is displayed on the financial statements as “Equity in Pooled Cash and Investments.” State statute requires the classification of monies held by the City into three categories:
Active Monies - Those monies required to be kept in a "cash" or "near cash" status for immediate use by the City. Such monies must by law be maintained either as cash in the City treasury, in depository accounts payable or withdrawable on demand.
Inactive Monies – Those monies not required for use within the current two year period
of designated depositories. Ohio law permits inactive monies to be deposited or invested as certificates of deposit maturing not later than the end of the current period of
41
City of Mason, Ohio Notes to the Basic Financial Statements For the Year Ended December 31, 2010
designated depositories, or as savings or deposit accounts, including, but not limited to passbook accounts.
Interim Monies – Those monies which are not needed for immediate use but which will
be needed before the end of the current period of designation of depositories. Ohio law permits interim monies to be invested or deposited in the following securities:
(1) Bonds, notes, or other obligations of or guaranteed by the United States, or
those for which the faith of the United States is pledged for the payment of principal and interest.
(2) Bonds, notes, debentures, or other obligations or securities issued by any federal governmental agency.
(3) No-load money market mutual funds consisting exclusively of obligations described in (1) or (2) above and repurchase agreements secured by such obligations, provided that investments in securities described in this division are made only through eligible institutions.
(4) Interim deposits in the eligible institutions applying for interim monies to
be evidenced by time certificates of deposit maturing not more than one year from date of deposit, or by savings or deposit accounts, including, but limited to, passbook accounts.
(5) Bonds and other obligations of the State of Ohio.
(6) The Ohio State Treasurer's investment pool (STAR Ohio).
(7) Commercial paper and banker’s acceptances which meet the requirements
established by Ohio Revised Code, Sec. 135.142.
(8) Under limited circumstances, corporate debt interests in either of the two highest rating classifications by at least two nationally recognized rating agencies.
Protection of the City's deposits is provided by the Federal Deposit Insurance Corporation, by eligible securities pledged by the financial institution as security for repayment, by surety company bonds deposited with the treasurer by the financial institution or by a single collateral pool established by the financial institution to secure the repayment of all public moneys deposited with the institution. Investments in stripped principal or interest obligations, reverse repurchase agreements and derivatives are prohibited. The issuance of taxable notes for the purpose of arbitrage, the use of leverage and short selling are also prohibited. An investment must mature within five years from the date of purchase unless matched to a specific obligation or debt of the City, and must be purchased with the expectation that it will be held to maturity. Investments may only be made through specified dealers and institutions.
42
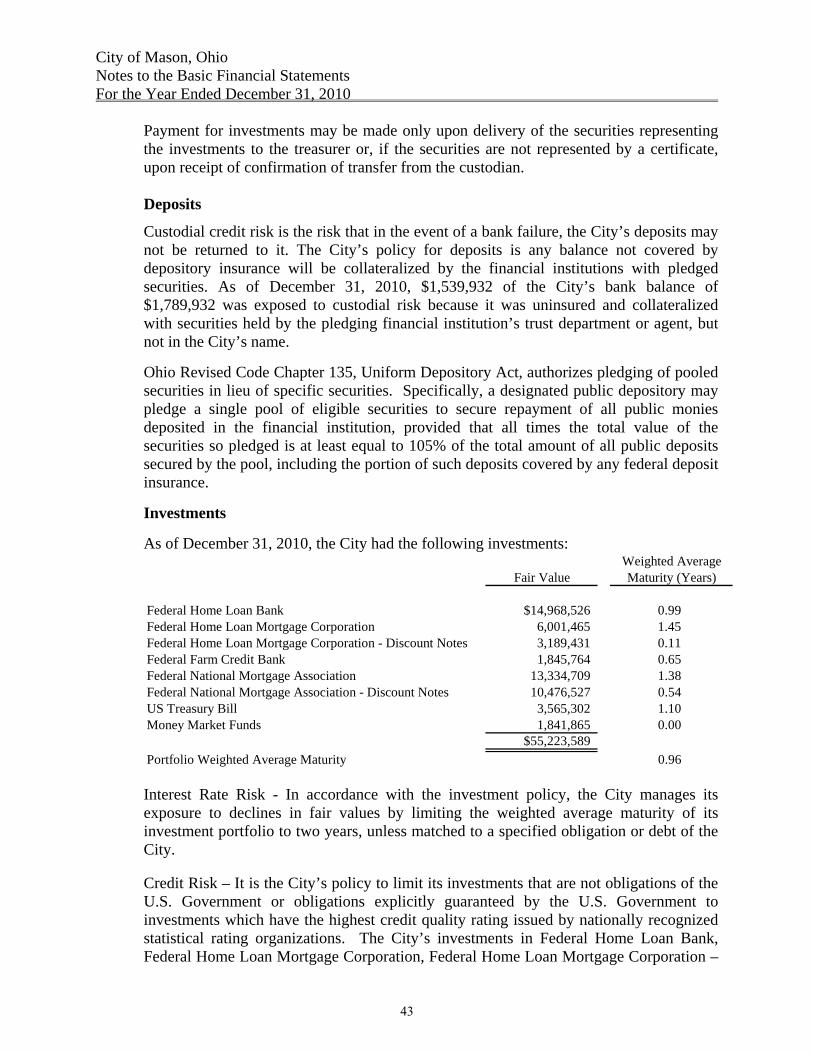
City of Mason, Ohio Notes to the Basic Financial Statements For the Year Ended December 31, 2010
Payment for investments may be made only upon delivery of the securities representing the investments to the treasurer or, if the securities are not represented by a certificate, upon receipt of confirmation of transfer from the custodian. Deposits
Custodial credit risk is the risk that in the event of a bank failure, the City’s deposits may not be returned to it. The City’s policy for deposits is any balance not covered by depository insurance will be collateralized by the financial institutions with pledged securities. As of December 31, 2010, $1,539,932 of the City’s bank balance of $1,789,932 was exposed to custodial risk because it was uninsured and collateralized with securities held by the pledging financial institution’s trust department or agent, but not in the City’s name. Ohio Revised Code Chapter 135, Uniform Depository Act, authorizes pledging of pooled securities in lieu of specific securities. Specifically, a designated public depository may pledge a single pool of eligible securities to secure repayment of all public monies deposited in the financial institution, provided that all times the total value of the securities so pledged is at least equal to 105% of the total amount of all public deposits secured by the pool, including the portion of such deposits covered by any federal deposit insurance. Investments As of December 31, 2010, the City had the following investments:
Weighted AverageFair Value Maturity (Years)
Federal Home Loan Bank $14,968,526 0.99Federal Home Loan Mortgage Corporation 6,001,465 1.45Federal Home Loan Mortgage Corporation - Discount Notes 3,189,431 0.11Federal Farm Credit Bank 1,845,764 0.65Federal National Mortgage Association 13,334,709 1.38Federal National Mortgage Association - Discount Notes 10,476,527 0.54US Treasury Bill 3,565,302 1.10Money Market Funds 1,841,865 0.00
$55,223,589Portfolio Weighted Average Maturity 0.96
Interest Rate Risk - In accordance with the investment policy, the City manages its exposure to declines in fair values by limiting the weighted average maturity of its investment portfolio to two years, unless matched to a specified obligation or debt of the City. Credit Risk – It is the City’s policy to limit its investments that are not obligations of the U.S. Government or obligations explicitly guaranteed by the U.S. Government to investments which have the highest credit quality rating issued by nationally recognized statistical rating organizations. The City’s investments in Federal Home Loan Bank, Federal Home Loan Mortgage Corporation, Federal Home Loan Mortgage Corporation –
43
City of Mason, Ohio Notes to the Basic Financial Statements For the Year Ended December 31, 2010
Discount Notes, Federal Farm Credit Bank, Federal National Mortgage Association, Federal National Mortgage Association – Discount Notes and Money Market Funds in were rated AAA by Standard and Poor’s and Fitch ratings and Aaa by Moody’s Investors Service. Concentration of Credit Risk – The City’s investment policy allows investments in Federal Government Securities or Instrumentalities. The City has invested 27% of the City’s investments in Federal Home Loan Bank, 11% in Federal Home Loan Mortgage Corporation, 6% in Federal Home Loan Mortgage Corporation – Discount Notes, 3% in Federal Farm Credit Bank, 24% in Federal National Mortgage Association, 19% in Federal National Mortgage Association – Discount Notes, 4% in Money Market Funds and 6% in US Treasury Bills,. Custodial credit risk is the risk that in the event of the failure of the counterparty, the City will not be able to recover the value of its investments or collateral securities that are in the possession of an outside party. All of the City’s securities are either insured and registered in the name of the City or at least registered in the name of the City.
Note 4 – Receivables Receivables at year end, consisted primarily of municipal income taxes, property and other taxes, intergovernmental receivables arising from entitlements, shared revenues, special assessments, accrued interest on investments, interfund and accounts receivable. No allowances for doubtful accounts have been recorded because uncollectible amounts are expected to be insignificant. Special assessments expected to be collected in more than one year amounts to $12,936 in the Special Assessments Bond Retirement Fund. Property Taxes Property taxes include amounts levied against all real, public utility, and tangible personal property located in the City. Property tax revenue received during 2010 for real and public utility property taxes represents collections of 2009 taxes. Property tax payments received during 2010 for tangible personal property (other than public utility property) are for 2010 taxes. 2010 real property taxes are levied after October 1, 2010, on the assessed value as of January 1, 2010, the lien date. Assessed values are established by State law at 35 percent of appraised market value. 2010 real property taxes are collected in and intended to finance 2011 operations. Public utility tangible personal property currently is assessed at varying percentages of true value; public utility real property is assessed at 100 percent of true value. 2010 public utility property taxes became a lien December 31, 2009, are levied after October 1, 2009, and are collected in 2011 with real property taxes. 2010 tangible personal property taxes are levied after October 1, 2010, on the value as of
44
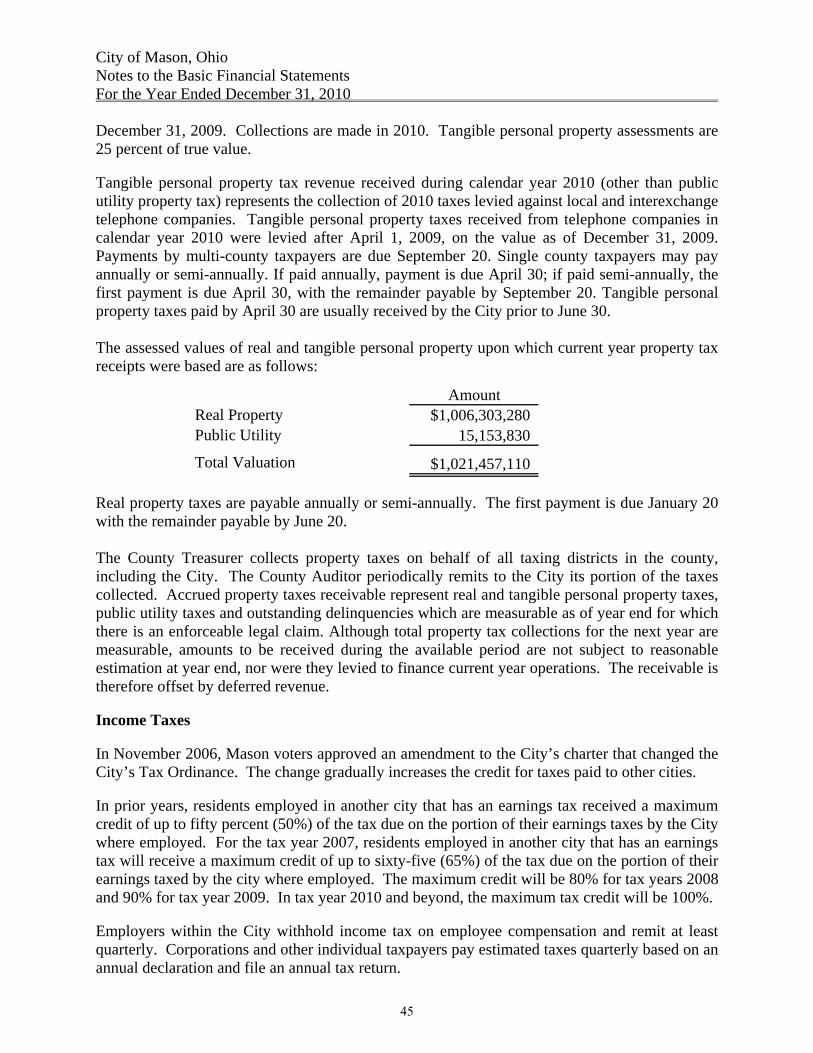
City of Mason, Ohio Notes to the Basic Financial Statements For the Year Ended December 31, 2010 December 31, 2009. Collections are made in 2010. Tangible personal property assessments are 25 percent of true value. Tangible personal property tax revenue received during calendar year 2010 (other than public utility property tax) represents the collection of 2010 taxes levied against local and interexchange telephone companies. Tangible personal property taxes received from telephone companies in calendar year 2010 were levied after April 1, 2009, on the value as of December 31, 2009. Payments by multi-county taxpayers are due September 20. Single county taxpayers may pay annually or semi-annually. If paid annually, payment is due April 30; if paid semi-annually, the first payment is due April 30, with the remainder payable by September 20. Tangible personal property taxes paid by April 30 are usually received by the City prior to June 30. The assessed values of real and tangible personal property upon which current year property tax receipts were based are as follows:
AmountReal Property $1,006,303,280Public Utility 15,153,830
Total Valuation $1,021,457,110
Real property taxes are payable annually or semi-annually. The first payment is due January 20 with the remainder payable by June 20. The County Treasurer collects property taxes on behalf of all taxing districts in the county, including the City. The County Auditor periodically remits to the City its portion of the taxes collected. Accrued property taxes receivable represent real and tangible personal property taxes, public utility taxes and outstanding delinquencies which are measurable as of year end for which there is an enforceable legal claim. Although total property tax collections for the next year are measurable, amounts to be received during the available period are not subject to reasonable estimation at year end, nor were they levied to finance current year operations. The receivable is therefore offset by deferred revenue. Income Taxes In November 2006, Mason voters approved an amendment to the City’s charter that changed the City’s Tax Ordinance. The change gradually increases the credit for taxes paid to other cities. In prior years, residents employed in another city that has an earnings tax received a maximum credit of up to fifty percent (50%) of the tax due on the portion of their earnings taxes by the City where employed. For the tax year 2007, residents employed in another city that has an earnings tax will receive a maximum credit of up to sixty-five (65%) of the tax due on the portion of their earnings taxed by the city where employed. The maximum credit will be 80% for tax years 2008 and 90% for tax year 2009. In tax year 2010 and beyond, the maximum tax credit will be 100%. Employers within the City withhold income tax on employee compensation and remit at least quarterly. Corporations and other individual taxpayers pay estimated taxes quarterly based on an annual declaration and file an annual tax return.
45
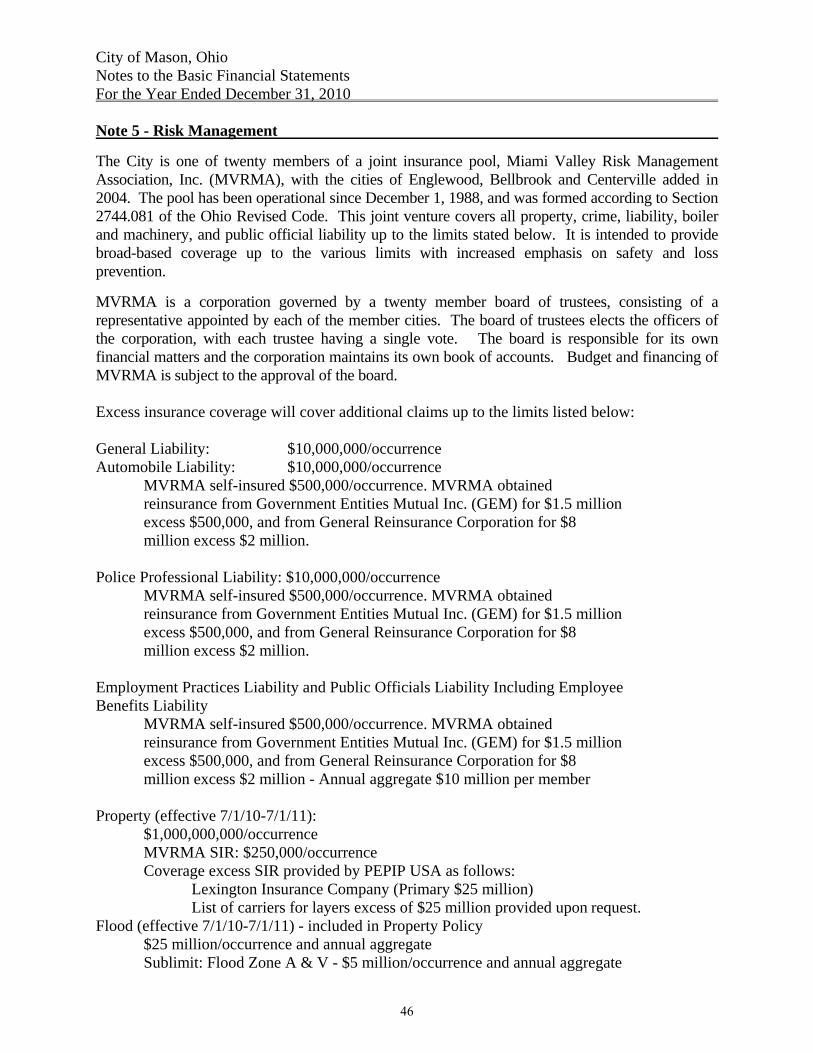
City of Mason, Ohio Notes to the Basic Financial Statements For the Year Ended December 31, 2010 Note 5 - Risk Management The City is one of twenty members of a joint insurance pool, Miami Valley Risk Management Association, Inc. (MVRMA), with the cities of Englewood, Bellbrook and Centerville added in 2004. The pool has been operational since December 1, 1988, and was formed according to Section 2744.081 of the Ohio Revised Code. This joint venture covers all property, crime, liability, boiler and machinery, and public official liability up to the limits stated below. It is intended to provide broad-based coverage up to the various limits with increased emphasis on safety and loss prevention. MVRMA is a corporation governed by a twenty member board of trustees, consisting of a representative appointed by each of the member cities. The board of trustees elects the officers of the corporation, with each trustee having a single vote. The board is responsible for its own financial matters and the corporation maintains its own book of accounts. Budget and financing of MVRMA is subject to the approval of the board. Excess insurance coverage will cover additional claims up to the limits listed below: General Liability: $10,000,000/occurrence Automobile Liability: $10,000,000/occurrence
MVRMA self-insured $500,000/occurrence. MVRMA obtained reinsurance from Government Entities Mutual Inc. (GEM) for $1.5 million excess $500,000, and from General Reinsurance Corporation for $8 million excess $2 million.
Police Professional Liability: $10,000,000/occurrence
MVRMA self-insured $500,000/occurrence. MVRMA obtained reinsurance from Government Entities Mutual Inc. (GEM) for $1.5 million excess $500,000, and from General Reinsurance Corporation for $8 million excess $2 million.
Employment Practices Liability and Public Officials Liability Including Employee Benefits Liability
MVRMA self-insured $500,000/occurrence. MVRMA obtained reinsurance from Government Entities Mutual Inc. (GEM) for $1.5 million excess $500,000, and from General Reinsurance Corporation for $8 million excess $2 million - Annual aggregate $10 million per member
Property (effective 7/1/10-7/1/11):
$1,000,000,000/occurrence MVRMA SIR: $250,000/occurrence Coverage excess SIR provided by PEPIP USA as follows:
Lexington Insurance Company (Primary $25 million) List of carriers for layers excess of $25 million provided upon request.
Flood (effective 7/1/10-7/1/11) - included in Property Policy $25 million/occurrence and annual aggregate Sublimit: Flood Zone A & V - $5 million/occurrence and annual aggregate
46
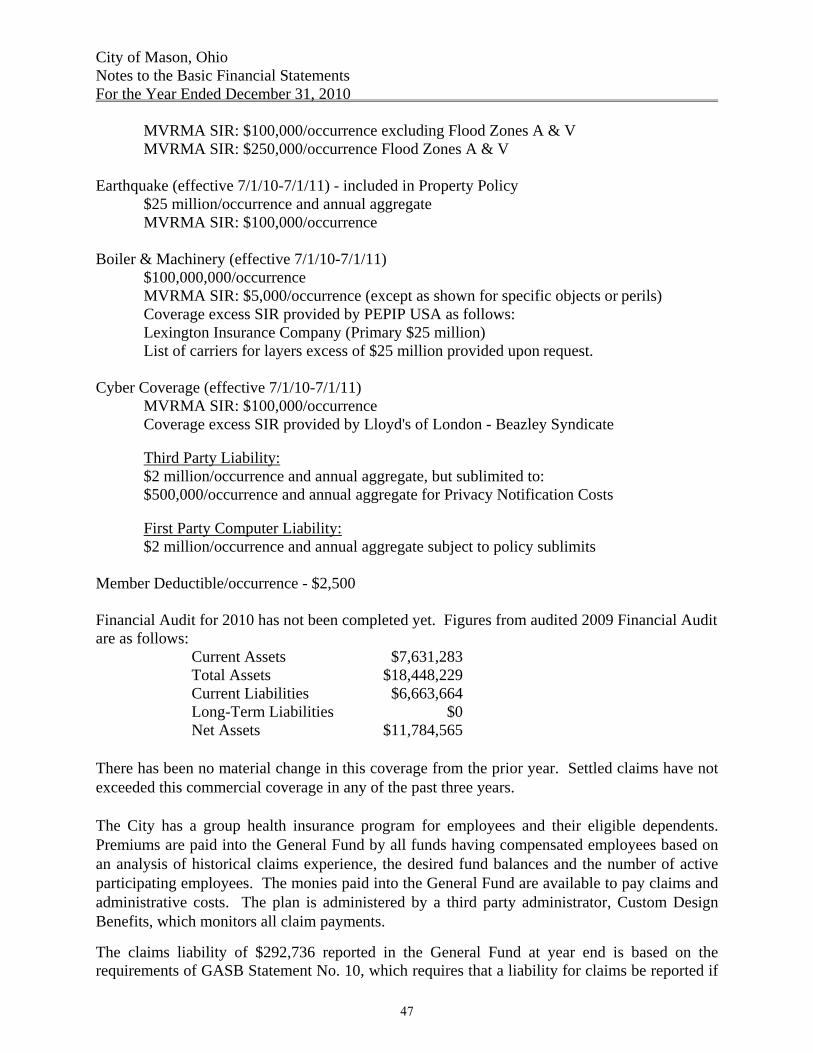
City of Mason, Ohio Notes to the Basic Financial Statements For the Year Ended December 31, 2010
MVRMA SIR: $100,000/occurrence excluding Flood Zones A & V MVRMA SIR: $250,000/occurrence Flood Zones A & V
Earthquake (effective 7/1/10-7/1/11) - included in Property Policy
$25 million/occurrence and annual aggregate MVRMA SIR: $100,000/occurrence
Boiler & Machinery (effective 7/1/10-7/1/11)
$100,000,000/occurrence MVRMA SIR: $5,000/occurrence (except as shown for specific objects or perils) Coverage excess SIR provided by PEPIP USA as follows: Lexington Insurance Company (Primary $25 million) List of carriers for layers excess of $25 million provided upon request.
Cyber Coverage (effective 7/1/10-7/1/11)
MVRMA SIR: $100,000/occurrence Coverage excess SIR provided by Lloyd's of London - Beazley Syndicate Third Party Liability: $2 million/occurrence and annual aggregate, but sublimited to: $500,000/occurrence and annual aggregate for Privacy Notification Costs First Party Computer Liability: $2 million/occurrence and annual aggregate subject to policy sublimits
Member Deductible/occurrence - $2,500 Financial Audit for 2010 has not been completed yet. Figures from audited 2009 Financial Audit are as follows: Current Assets $7,631,283 Total Assets $18,448,229 Current Liabilities $6,663,664 Long-Term Liabilities $0 Net Assets $11,784,565 There has been no material change in this coverage from the prior year. Settled claims have not exceeded this commercial coverage in any of the past three years. The City has a group health insurance program for employees and their eligible dependents. Premiums are paid into the General Fund by all funds having compensated employees based on an analysis of historical claims experience, the desired fund balances and the number of active participating employees. The monies paid into the General Fund are available to pay claims and administrative costs. The plan is administered by a third party administrator, Custom Design Benefits, which monitors all claim payments. The claims liability of $292,736 reported in the General Fund at year end is based on the requirements of GASB Statement No. 10, which requires that a liability for claims be reported if
47
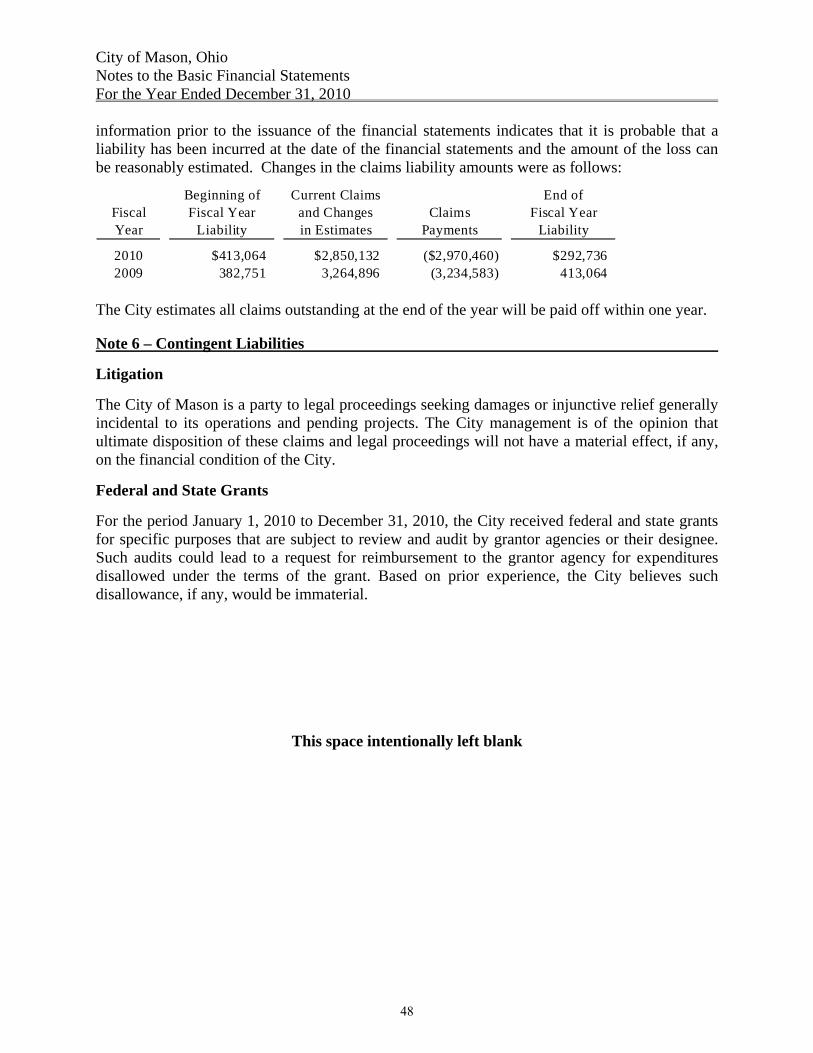
City of Mason, Ohio Notes to the Basic Financial Statements For the Year Ended December 31, 2010 information prior to the issuance of the financial statements indicates that it is probable that a liability has been incurred at the date of the financial statements and the amount of the loss can be reasonably estimated. Changes in the claims liability amounts were as follows:
Beginning of Current Claims End ofFiscal Fiscal Year and Changes Claims Fiscal YearYear Liability in Estimates Payments Liability
2010 $413,064 $2,850,132 ($2,970,460) $292,7362009 382,751 3,264,896 (3,234,583) 413,064
The City estimates all claims outstanding at the end of the year will be paid off within one year.
Note 6 – Contingent Liabilities
Litigation The City of Mason is a party to legal proceedings seeking damages or injunctive relief generally incidental to its operations and pending projects. The City management is of the opinion that ultimate disposition of these claims and legal proceedings will not have a material effect, if any, on the financial condition of the City. Federal and State Grants For the period January 1, 2010 to December 31, 2010, the City received federal and state grants for specific purposes that are subject to review and audit by grantor agencies or their designee. Such audits could lead to a request for reimbursement to the grantor agency for expenditures disallowed under the terms of the grant. Based on prior experience, the City believes such disallowance, if any, would be immaterial.
This space intentionally left blank
48
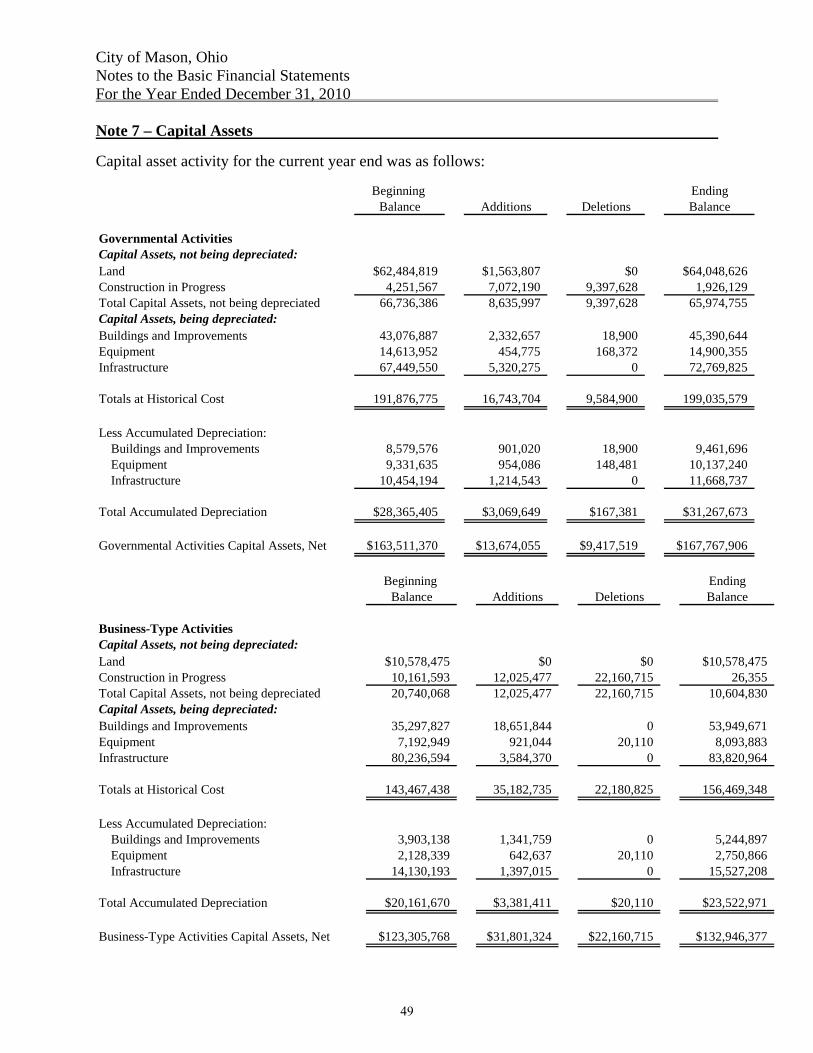
City of Mason, Ohio Notes to the Basic Financial Statements For the Year Ended December 31, 2010 Note 7 – Capital Assets Capital asset activity for the current year end was as follows:
Beginning EndingBalance Additions Deletions Balance
Governmental ActivitiesCapital Assets, not being depreciated:Land $62,484,819 $1,563,807 $0 $64,048,626Construction in Progress 4,251,567 7,072,190 9,397,628 1,926,129Total Capital Assets, not being depreciated 66,736,386 8,635,997 9,397,628 65,974,755Capital Assets, being depreciated:Buildings and Improvements 43,076,887 2,332,657 18,900 45,390,644Equipment 14,613,952 454,775 168,372 14,900,355Infrastructure 67,449,550 5,320,275 0 72,769,825
Totals at Historical Cost 191,876,775 16,743,704 9,584,900 199,035,579
Less Accumulated Depreciation:Buildings and Improvements 8,579,576 901,020 18,900 9,461,696Equipment 9,331,635 954,086 148,481 10,137,240Infrastructure 10,454,194 1,214,543 0 11,668,737
Total Accumulated Depreciation $28,365,405 $3,069,649 $167,381 $31,267,673
Governmental Activities Capital Assets, Net $163,511,370 $13,674,055 $9,417,519 $167,767,906
Beginning EndingBalance Additions Deletions Balance
Business-Type ActivitiesCapital Assets, not being depreciated:Land $10,578,475 $0 $0 $10,578,475Construction in Progress 10,161,593 12,025,477 22,160,715 26,355Total Capital Assets, not being depreciated 20,740,068 12,025,477 22,160,715 10,604,830Capital Assets, being depreciated:Buildings and Improvements 35,297,827 18,651,844 0 53,949,671Equipment 7,192,949 921,044 20,110 8,093,883Infrastructure 80,236,594 3,584,370 0 83,820,964
Totals at Historical Cost 143,467,438 35,182,735 22,180,825 156,469,348
Less Accumulated Depreciation:Buildings and Improvements 3,903,138 1,341,759 0 5,244,897Equipment 2,128,339 642,637 20,110 2,750,866Infrastructure 14,130,193 1,397,015 0 15,527,208
Total Accumulated Depreciation $20,161,670 $3,381,411 $20,110 $23,522,971
Business-Type Activities Capital Assets, Net $123,305,768 $31,801,324 $22,160,715 $132,946,377
49
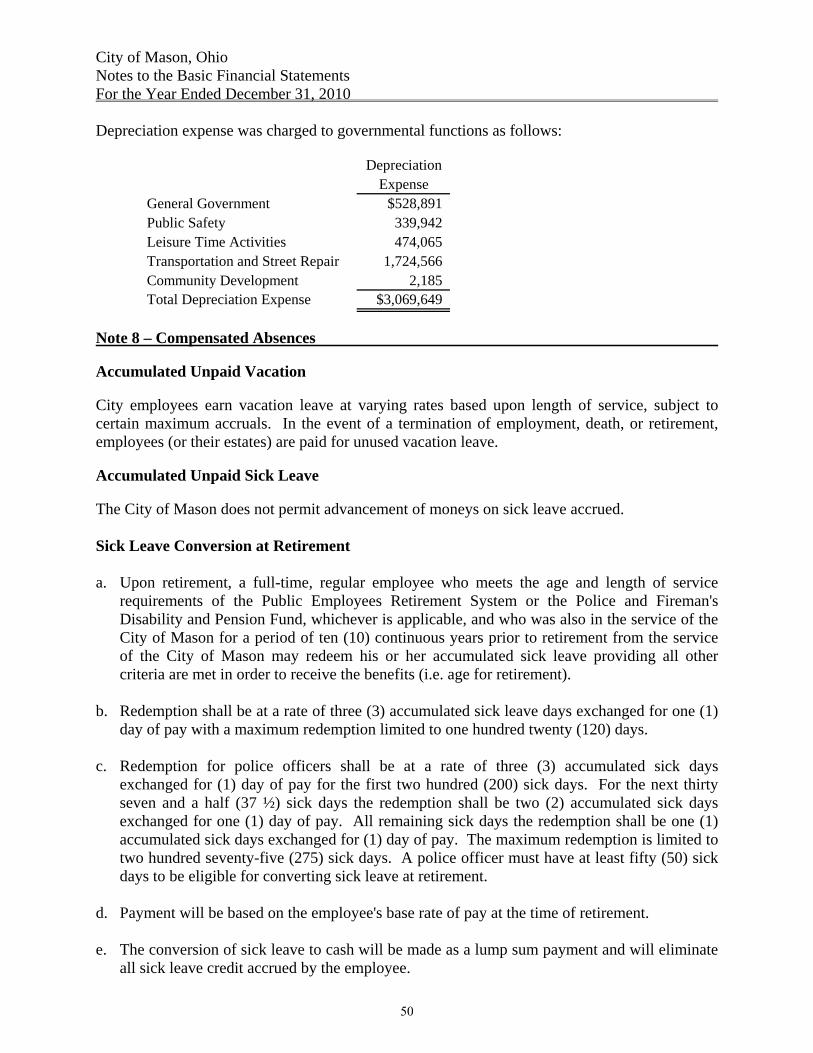
City of Mason, Ohio Notes to the Basic Financial Statements For the Year Ended December 31, 2010 Depreciation expense was charged to governmental functions as follows:
DepreciationExpense
General Government $528,891Public Safety 339,942Leisure Time Activities 474,065Transportation and Street Repair 1,724,566Community Development 2,185Total Depreciation Expense $3,069,649
Note 8 – Compensated Absences Accumulated Unpaid Vacation City employees earn vacation leave at varying rates based upon length of service, subject to certain maximum accruals. In the event of a termination of employment, death, or retirement, employees (or their estates) are paid for unused vacation leave. Accumulated Unpaid Sick Leave The City of Mason does not permit advancement of moneys on sick leave accrued. Sick Leave Conversion at Retirement a. Upon retirement, a full-time, regular employee who meets the age and length of service
requirements of the Public Employees Retirement System or the Police and Fireman's Disability and Pension Fund, whichever is applicable, and who was also in the service of the City of Mason for a period of ten (10) continuous years prior to retirement from the service of the City of Mason may redeem his or her accumulated sick leave providing all other criteria are met in order to receive the benefits (i.e. age for retirement).
b. Redemption shall be at a rate of three (3) accumulated sick leave days exchanged for one (1)
day of pay with a maximum redemption limited to one hundred twenty (120) days. c. Redemption for police officers shall be at a rate of three (3) accumulated sick days
exchanged for (1) day of pay for the first two hundred (200) sick days. For the next thirty seven and a half (37 ½) sick days the redemption shall be two (2) accumulated sick days exchanged for one (1) day of pay. All remaining sick days the redemption shall be one (1) accumulated sick days exchanged for (1) day of pay. The maximum redemption is limited to two hundred seventy-five (275) sick days. A police officer must have at least fifty (50) sick days to be eligible for converting sick leave at retirement.
d. Payment will be based on the employee's base rate of pay at the time of retirement. e. The conversion of sick leave to cash will be made as a lump sum payment and will eliminate
all sick leave credit accrued by the employee.
50
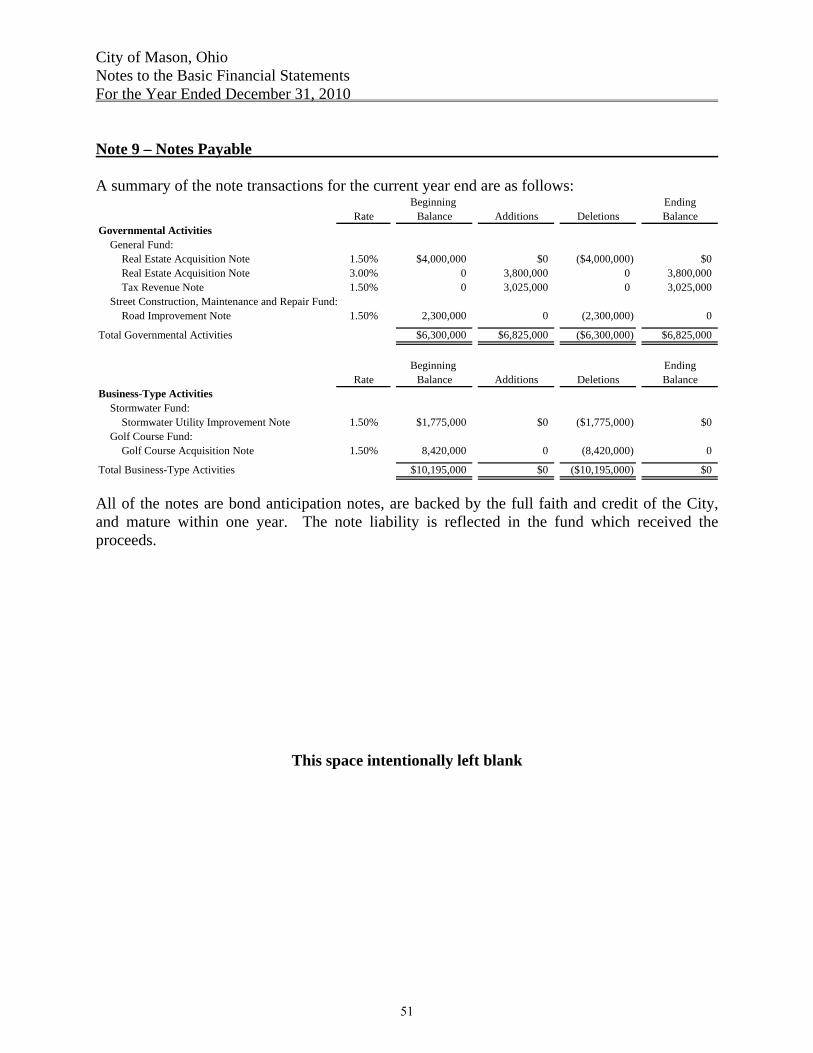
City of Mason, Ohio Notes to the Basic Financial Statements For the Year Ended December 31, 2010 Note 9 – Notes Payable A summary of the note transactions for the current year end are as follows:
Beginning EndingRate Balance Additions Deletions Balance
Governmental ActivitiesGeneral Fund:
Real Estate Acquisition Note 1.50% $4,000,000 $0 ($4,000,000) $0Real Estate Acquisition Note 3.00% 0 3,800,000 0 3,800,000Tax Revenue Note 1.50% 0 3,025,000 0 3,025,000
Street Construction, Maintenance and Repair Fund:Road Improvement Note 1.50% 2,300,000 0 (2,300,000) 0
Total Governmental Activities $6,300,000 $6,825,000 ($6,300,000) $6,825,000
Beginning EndingRate Balance Additions Deletions Balance
Business-Type ActivitiesStormwater Fund:
Stormwater Utility Improvement Note 1.50% $1,775,000 $0 ($1,775,000) $0Golf Course Fund:
Golf Course Acquisition Note 1.50% 8,420,000 0 (8,420,000) 0
Total Business-Type Activities $10,195,000 $0 ($10,195,000) $0
All of the notes are bond anticipation notes, are backed by the full faith and credit of the City, and mature within one year. The note liability is reflected in the fund which received the proceeds.
This space intentionally left blank
51
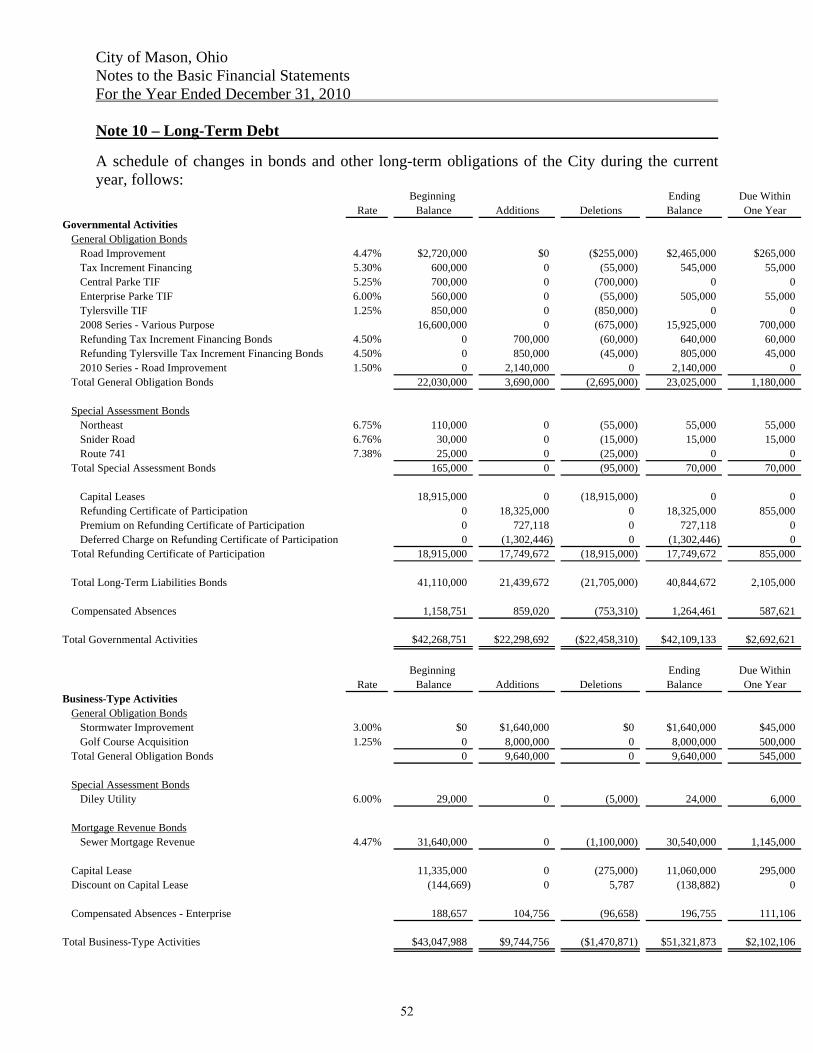
City of Mason, Ohio Notes to the Basic Financial Statements For the Year Ended December 31, 2010 Note 10 – Long-Term Debt A schedule of changes in bonds and other long-term obligations of the City during the current year, follows:
Beginning Ending Due WithinRate Balance Additions Deletions Balance One Year
Governmental ActivitiesGeneral Obligation Bonds
Road Improvement 4.47% $2,720,000 $0 ($255,000) $2,465,000 $265,000Tax Increment Financing 5.30% 600,000 0 (55,000) 545,000 55,000Central Parke TIF 5.25% 700,000 0 (700,000) 0 0Enterprise Parke TIF 6.00% 560,000 0 (55,000) 505,000 55,000Tylersville TIF 1.25% 850,000 0 (850,000) 0 02008 Series - Various Purpose 16,600,000 0 (675,000) 15,925,000 700,000Refunding Tax Increment Financing Bonds 4.50% 0 700,000 (60,000) 640,000 60,000Refunding Tylersville Tax Increment Financing Bonds 4.50% 0 850,000 (45,000) 805,000 45,0002010 Series - Road Improvement 1.50% 0 2,140,000 0 2,140,000 0
Total General Obligation Bonds 22,030,000 3,690,000 (2,695,000) 23,025,000 1,180,000
Special Assessment BondsNortheast 6.75% 110,000 0 (55,000) 55,000 55,000Snider Road 6.76% 30,000 0 (15,000) 15,000 15,000Route 741 7.38% 25,000 0 (25,000) 0 0
Total Special Assessment Bonds 165,000 0 (95,000) 70,000 70,000
Capital Leases 18,915,000 0 (18,915,000) 0 0Refunding Certificate of Participation 0 18,325,000 0 18,325,000 855,000Premium on Refunding Certificate of Participation 0 727,118 0 727,118 0Deferred Charge on Refunding Certificate of Participation 0 (1,302,446) 0 (1,302,446) 0
Total Refunding Certificate of Participation 18,915,000 17,749,672 (18,915,000) 17,749,672 855,000
Total Long-Term Liabilities Bonds 41,110,000 21,439,672 (21,705,000) 40,844,672 2,105,000
Compensated Absences 1,158,751 859,020 (753,310) 1,264,461 587,621
Total Governmental Activities $42,268,751 $22,298,692 ($22,458,310) $42,109,133 $2,692,621
Beginning Ending Due WithinRate Balance Additions Deletions Balance One Year
Business-Type ActivitiesGeneral Obligation Bonds
Stormwater Improvement 3.00% $0 $1,640,000 $0 $1,640,000 $45,000Golf Course Acquisition 1.25% 0 8,000,000 0 8,000,000 500,000
Total General Obligation Bonds 0 9,640,000 0 9,640,000 545,000
Special Assessment BondsDiley Utility 6.00% 29,000 0 (5,000) 24,000 6,000
Mortgage Revenue BondsSewer Mortgage Revenue 4.47% 31,640,000 0 (1,100,000) 30,540,000 1,145,000
Capital Lease 11,335,000 0 (275,000) 11,060,000 295,000Discount on Capital Lease (144,669) 0 5,787 (138,882) 0
Compensated Absences - Enterprise 188,657 104,756 (96,658) 196,755 111,106
Total Business-Type Activities $43,047,988 $9,744,756 ($1,470,871) $51,321,873 $2,102,106
52
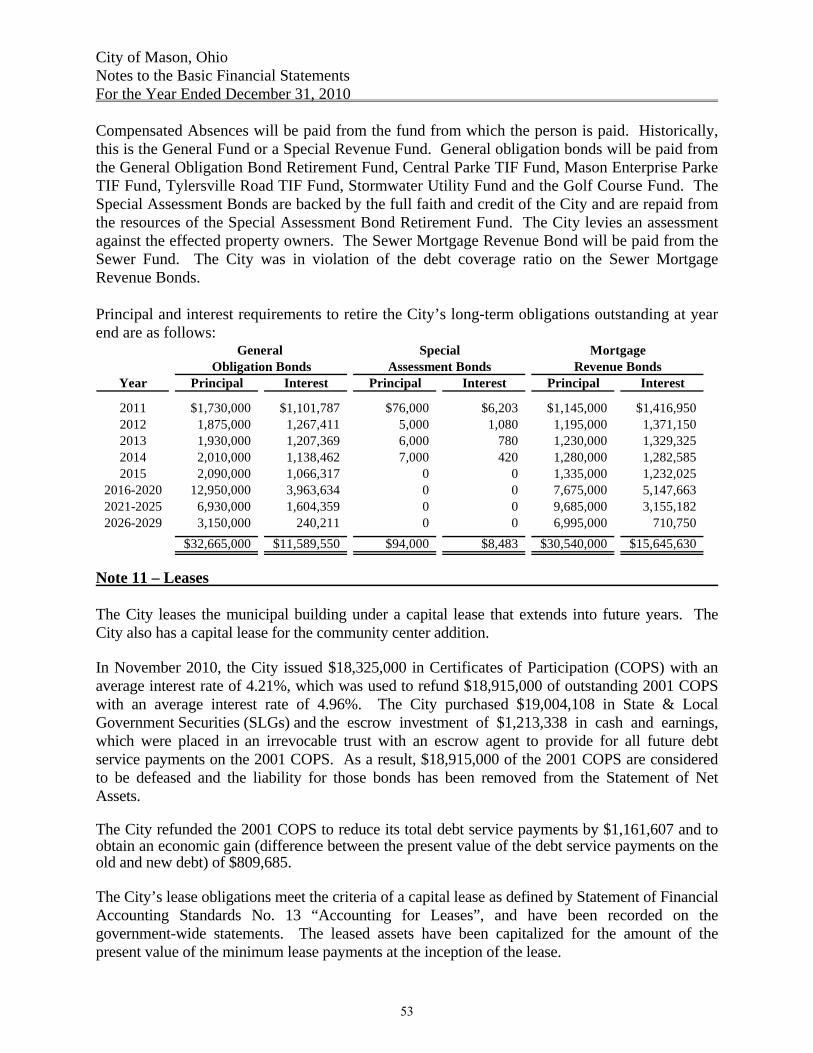
City of Mason, Ohio Notes to the Basic Financial Statements For the Year Ended December 31, 2010 Compensated Absences will be paid from the fund from which the person is paid. Historically, this is the General Fund or a Special Revenue Fund. General obligation bonds will be paid from the General Obligation Bond Retirement Fund, Central Parke TIF Fund, Mason Enterprise Parke TIF Fund, Tylersville Road TIF Fund, Stormwater Utility Fund and the Golf Course Fund. The Special Assessment Bonds are backed by the full faith and credit of the City and are repaid from the resources of the Special Assessment Bond Retirement Fund. The City levies an assessment against the effected property owners. The Sewer Mortgage Revenue Bond will be paid from the Sewer Fund. The City was in violation of the debt coverage ratio on the Sewer Mortgage Revenue Bonds. Principal and interest requirements to retire the City’s long-term obligations outstanding at year end are as follows:
Year Principal Interest Principal Interest Principal Interest
2011 $1,730,000 $1,101,787 $76,000 $6,203 $1,145,000 $1,416,9502012 1,875,000 1,267,411 5,000 1,080 1,195,000 1,371,1502013 1,930,000 1,207,369 6,000 780 1,230,000 1,329,3252014 2,010,000 1,138,462 7,000 420 1,280,000 1,282,5852015 2,090,000 1,066,317 0 0 1,335,000 1,232,025
2016-2020 12,950,000 3,963,634 0 0 7,675,000 5,147,6632021-2025 6,930,000 1,604,359 0 0 9,685,000 3,155,1822026-2029 3,150,000 240,211 0 0 6,995,000 710,750
$32,665,000 $11,589,550 $94,000 $8,483 $30,540,000 $15,645,630
Revenue BondsAssessment BondsObligation BondsGeneral Special Mortgage
Note 11 – Leases
The City leases the municipal building under a capital lease that extends into future years. The City also has a capital lease for the community center addition. In November 2010, the City issued $18,325,000 in Certificates of Participation (COPS) with an average interest rate of 4.21%, which was used to refund $18,915,000 of outstanding 2001 COPS with an average interest rate of 4.96%. The City purchased $19,004,108 in State & Local Government Securities (SLGs) and the escrow investment of $1,213,338 in cash and earnings, which were placed in an irrevocable trust with an escrow agent to provide for all future debt service payments on the 2001 COPS. As a result, $18,915,000 of the 2001 COPS are considered to be defeased and the liability for those bonds has been removed from the Statement of Net Assets. The City refunded the 2001 COPS to reduce its total debt service payments by $1,161,607 and to obtain an economic gain (difference between the present value of the debt service payments on the old and new debt) of $809,685. The City’s lease obligations meet the criteria of a capital lease as defined by Statement of Financial Accounting Standards No. 13 “Accounting for Leases”, and have been recorded on the government-wide statements. The leased assets have been capitalized for the amount of the present value of the minimum lease payments at the inception of the lease.
53
City of Mason, Ohio Notes to the Basic Financial Statements For the Year Ended December 31, 2010 The following is a schedule of the future long-term minimum lease payments required under the capital lease, and the present value of the minimum lease payments is as follows:
Governmental Business-TypeYear Activities Activities2011 $1,598,013 $768,8262012 1,597,375 767,9262013 1,599,475 771,9262014 1,597,025 769,6402015 1,599,425 770,978
2016-2020 7,985,725 3,849,6302021-2025 7,984,815 3,849,6622026-2030 1,595,025 3,854,0842031-2034 0 3,083,660
Total minimum lease payments 25,556,878 18,486,332
Less: Amount representing interest (7,231,878) (7,426,332)
Present value of minimum lease payments $18,325,000 $11,060,000
Capital lease payments are made from the Government Center Reserve Fund and the Community Center Fund. The costs of capital assets acquired under capital leases in accordance with Statement of Financial Accounting Standards Board No. 13 are as follows:
Buildings and Improvements $35,735,000
Note 12 – Pension Plans
Ohio Public Employees Retirement System Ohio Public Employees Retirement System (OPERS) administers three separate pension plans, a Traditional Pension Plan (TP), a Member-Directed Plan (MD) and a Combined Plan (CO). The TP Plan is a cost-sharing multiple-employer defined benefit pension plan. The MD Plan is a defined contribution plan in which the member invests both member and employer contributions (employer contributions vest over five years at 20% per year). Under the MD Plan members accumulate retirement assets equal to the value of member and (vested) employer contributions plus any investment earnings. The CO Plan is a cost sharing, multiple-employer defined benefit pension plan. Under the CO Plan, OPERS invests employer contributions to provide a formula retirement benefit similar in nature to the TP Plan benefit. Member contributions, the investment of which is self-directed by the members, accumulate retirement assets in a manner similar to the MD Plan. OPERS provides retirement, disability, survivor and death benefits and annual cost of living adjustments to members of the TP and CO Plans. Members of the MD Plan do not qualify for the ancillary benefits. Authority to establish and amend benefits is provided in Chapter 145 of the Ohio Revised Code. OPERS issues a stand-alone financial report. Interested parties may obtain a copy by writing to the OPERS, 277 East Town Street, Columbus, Ohio 43215-4642 or by calling 614-222-5601 or 800-222-7377, or by visiting the OPERS website at www.opers.org.
54
City of Mason, Ohio Notes to the Basic Financial Statements For the Year Ended December 31, 2010 The Ohio Revised Code provides statutory authority for member and employer contributions. Plan members and employer contributions rates were consistent across all three plans. Plan members are required to contribute 10% of their annual covered salary to fund pension obligations. The employer pension contribution rate for the City is 14% of covered payroll. The contribution rates are determined actuarially. The City’s required contributions to OPERS for the years ended December 31, 2010, 2009 and 2008 were $702,783, $639,689 and $537,950, respectively. The full amount has been contributed for 2008 and 2009 and 92% has been contributed for 2010. Ohio Police and Fire Pension Fund The City contributes to the Ohio Police and Fire Pension Fund (OP&F), a cost-sharing multiple employer defined benefit pension plan. OP&F provides retirement and disability pension benefits, annual cost-of-living adjustments, and death benefits to plan members and beneficiaries. Benefit provisions are established by the Ohio State Legislature and are codified in Chapter 742 of the Ohio Revised Code. OP&F issues a publicly available financial report that includes financial information and required supplementary information. That report may be obtained by writing to OP&F, 140 East Town Street, Columbus, Ohio 43215-5164, or by visiting the OP&F website at www.op-f.org. Plan members are required to contribute 10.0% of their annual covered salary, while employers (the City) are required to contribute 19.5% for police officers and 24.0% for firefighters. The City’s contributions to OP&F for the years ending December 31, 2010, 2009 and 2008 were $801,170, $764,347, and $735,414, respectively. The full amount has been contributed for 2008 and 2009 and 89% has been contributed for 2010. Note 13 – Post Employment Benefits Ohio Public Employees Retirement System Plan Description Ohio Public Employees Retirement System (OPERS) administers three separate pension plans: The Traditional Pension Plan – a cost sharing, multiple-employer defined benefit pension plan; the Member-Directed Plan – a defined contribution plan; and the Combined Plan – a cost sharing, multiple-employer defined benefit pension plan that has elements of both a defined benefit and defined contribution plan. OPERS maintains a cost-sharing multiple employer defined benefit post-employment healthcare plan, which includes a medical plan, prescription drug program and Medicare Part B premium reimbursement, to qualifying members of both the Traditional Pension and the Combined Plans. Members of the Member-Directed Plan do not qualify for ancillary benefits, including post-employment health care coverage. In order to qualify for post-employment health card coverage, age-and-service retirees under the Traditional Pension and Combined Plans must have 10 or more years of qualifying Ohio service credit. Health care coverage for disability benefit recipients and qualified survivor benefit
55
City of Mason, Ohio Notes to the Basic Financial Statements For the Year Ended December 31, 2010 recipients is available. The health care coverage provided by OPERS meets the definition of an Other Post Employment Benefit (OPEB) as described in GASB Statement 45. The Ohio Revised Code permits, but does not mandate, OPERS to provide OPEB benefits to its eligible members and beneficiaries. Authority to establish and amend benefits is provided in Chapter 145 of the Ohio Revised Code. OPERS issues a stand-alone financial report. Interested parties may obtain a copy by writing OPERS, 277 East Town Street, Columbus, OH 43215-4642, or by calling 614-222-5601 or 800-222-7377, or by visiting the OPERS website at www.opers.org. Funding Policy The Ohio Revised Code provides the statutory authority requiring public employers to fund post retirement health care through their contributions to OPERS. A portion of each employer’s contribution to OPERS is set aside for the funding of post retirement health care benefits. Employer contribution rates are expressed as a percentage of the covered payroll of active members. In 2010, the City contributed at 14% of covered payroll. The Ohio Revised Code currently limits the employer contribution to a rate not to exceed 14% of covered payroll. Active members do not make contributions to the OPEB Plan. OPERS’ Post Employment Health Care Plan was established under, and is administered in accordance with, Internal Revenue Code 401(h). Each year, the OPERS Retirement Board determined the portion of the employer contribution rate that will be set aside for funding of post employment health care benefits. The portion of employer contributions allocated to the health care for members in the Traditional Plan was 5.5% from January 1 through February 28, 2010 and 5.0% from March 1 through December 31, 2010. The portion of employer contributions allocated to health care for members in the Combined Plan was 4.73% from January 1 through February 28, 2010, and 4.23% from March 1 through December 31, 2010. The OPERS Retirement Board is also authorized to establish rules for the payment of a portion of the health care coverage by the retiree or their surviving beneficiaries. Payment amounts vary depending on the number of covered dependents and the coverage selected. Information from City’s Records The City's required contributions for the current year, which were used to fund postemployment benefits, were $52,112 for the period January 1 through February 28, 2010, and $203,601 for the period March 1 through December 31, 2010, $82,753 for the period of January 1 through March 31, 2009 and $186,307 for the period of April 1 through December 31, 2009, $268,975 for 2008. The full amount (actual) has been contributed for 2008 and 2009 and 92% has been contributed for 2010. OPERS Retirement Board Implements its Health Care Preservation Plan The Health Care Preservation Plan (HCPP) adopted by the OPERS Board of Trustees on
56
City of Mason, Ohio Notes to the Basic Financial Statements For the Year Ended December 31, 2010 September 9, 2004, was effective January 1, 2007. Member and employer contribution rates increased on January 1 of each year 2006 to 2008, which allowed additional funds to be allocated to the health care plan. Ohio Police and Fire Pension Fund Plan Description The City contributes to the Ohio Police and Fire Pension Fund (OP&F) sponsored healthcare program, a cost-sharing, multiple-employer defined post-employment healthcare plan administered by OP&F. OP&F provides healthcare benefits including coverage for medical, prescription drugs, dental, vision, Medicare Part B Premium and long term care to retirees, qualifying benefit recipients and their eligible dependents. OP&F provides access to post-retirement healthcare coverage for any person who receives or is eligible to receive a monthly service, disability, or survivor benefit check or is a spouse or eligible dependent child of such person. The healthcare coverage provided by OP&F meets the definition of an Other Post Employment Benefit (OPEB) as described in GASB Statement 45. The Ohio Revised Code allows, but does not mandate, OP&F to provide OPEB benefits. Authority for the OP&F Board of Trustees to provide healthcare coverage to eligible participants and to establish and amend benefits are codified in Chapter 742 of the Ohio Revised Code. OP&F issues a publicly available financial report that includes financial information and required supplementary information for the Plan. That report may be obtained by writing to OP&F, 140 East Town Street, Columbus, Ohio 43215-5164, or by visiting the OP&F website at www.op-f.org. Funding Policy The Ohio Revised Code provides for contribution requirements of the participating employers and of plan members to the OP&F (defined benefit pension plan). Participating employers are required to contribute to the pension plan at rates expressed as percentages of the payroll of active pension plan members, currently, 19.5% and 24.0% of covered payroll for police and fire employers, respectively. The Ohio Revised Code states that the employer contribution may not exceed 19.5% of the covered payroll for police employer units and 24.0% of covered payroll for fire employer units. Active members do not make contributions to the OPEB Plan. OP&F maintains funds for health care in two separate accounts. One for health care benefits under IRS Code Section 115 trust and one for Medicare Part B reimbursements administrated as an Internal Revenue Code 401(h) account, both of which are within the defined benefit pension plan, under the authority granted by the Ohio Revised Code to the OP&F Board of Trustees. The Board of Trustees is authorized to allocate a portion of the total employer contributions made into the pension plan to the Section 115 trust and Section 401(h) account as the employer contribution for retiree healthcare benefits. For the year ended December 31, 2010, the employer contribution allocated to the health care plan was 6.75% of covered payroll. The amount of
57
City of Mason, Ohio Notes to the Basic Financial Statements For the Year Ended December 31, 2010 employer contributions allocated to the healthcare plan each year is subject to the Trustees’ primary responsibility to ensure that pension benefits are adequately funded and is limited by the provisions of Sections 115 and 401(h). The OP&F Board of Trustees also is authorized to establish requirements for contributions to the healthcare plan by retirees and their eligible dependents, or their surviving beneficiaries. Payment amounts vary depending on the number of covered dependents and the coverage selected. Information from City’s Records The City’s required contributions to OP&F were $141,135 for police and $110,508 for fire for the year ending December 31, 2010; $134,324 for police and $105,691 for fire for the year ending December 31, 2009; and $141,894 for police and $91,546 for fire for the year ending December 31, 2008, respectively, was allocated to the healthcare plan. The actual contributions for 2008 and 2009 were 100% and 89% has been contributed for 2010. Note 14 – Conduit Debt Obligations From time to time, Industrial Revenue Bonds have been issued to provide financial assistance to private-sector entities for the acquisition and construction of commercial, healthcare, and housing facilities deemed to be in the public interest. The bonds are secured by the property financed and are payable solely from bonds, ownership of the acquired facilities transfers to the private-sector entity served by the bond issuance. The City, the State, or any political subdivision thereof is not obligated in any manner for repayment of the bonds. Accordingly, the bonds are not reported as liabilities in the accompanying financial statements. The following is the conduit debt outstanding at December 31, 2010:
Year Original Outstanding YearIssuance Issued Amount December 31, 2010 Mature
Cedar Village 2010 $16,250,000 $16,235,000 2035
Mt. Healthy Christian Home: Healthcare 1997A 1997 4,600,000 3,840,000 2032 Housing 1997B 1997 2,150,000 1,795,000 2032
Mason Christian Village: Healthcare Refunding 1998 7,650,000 6,165,000 2032 Healthcare Facilities 2000 4,400,000 3,915,000 2035
Crane Plastics Company 2007 8,000,000 6,840,000 2033
Total Conduit Debt Outstanding $38,790,000
58
City of Mason, Ohio Notes to the Basic Financial Statements For the Year Ended December 31, 2010 Note 15 – Construction Commitments The City had the following outstanding commitments at year end: Projects AmountNew Fire Station 51 - Construction $7,403Bethany Road Improvements 59,026US 42 and Tylersville Road Intersection 39,100Western Row Road I-75 and State Route 741 Interchange Study 600,000US 42 Widening - Tylerville Road to Butler-Warren Road 922,970Split Phase Signal Timing Elimination 17,945Mason-Montgomery Road and Bethany Road Roundabout 122,759Mason Road and Hickory Woods Drive Roundabout 98,680Bethany Road - Parkside Lift Station Elimination 34,575US 42 Trunk Sewer Phase 3 24,500Mason-Montgomery Road Sewer Crossing (Bethany Road Sewer Improvement) 3,900Beach Lift Station Rehabilitation 3,440Mason Sports Park Effluent Irrigation 15,000Bethany Road Force Main Relocation 19,500First Ave/S Forest Ave Storm Sewer 81,554St. Susanna and Four Seasons Storm Sewer 70,200Church Street and Forest Ave Storm Sewer 1,490Community Center Expansion 399,431
Total $2,521,473
NOTE 16 – Interfund Transactions Interfund transactions at year end, consisted of the following individual interfund receivables, interfund payables, transfers in and transfers out:
Receivable Payable In OutGeneral Fund $4,950,000 $0 $0 $3,367,367Sewer Fund 0 0 5,000 0Community Center Fund 0 3,950,000 390,000 0Golf Course Fund 0 0 1,211,547 0Other Governmental Funds 0 1,000,000 1,765,820 5,000
Total All Funds $4,950,000 $4,950,000 $3,372,367 $3,372,367
Interfund Transfers
Interfund balance/transfers are used to move revenues from the fund that statute or budget requires to collect them to the fund that statute or budget requires to expend them and unrestricted revenues collected in the General Fund to finance various programs accounted for in other funds in accordance with budgetary authorizations; to segregate and to return money to the fund from which it was originally provided once a project is completed. The transfer out of the Other Governmental Funds and the transfer in the Sewer Fund is for financial reporting purposes only.
59
City of Mason, Ohio Notes to the Basic Financial Statements For the Year Ended December 31, 2010 Note 17 – Joint Venture Liberty Township, the City of Mason, and the City of Middletown contracted to create the Liberty Township Joint Economic Development District (JEDD) for the purpose of facilitating economic development to create jobs and employment opportunities and to improve the economic welfare of the people in the State of Ohio and in the area of the contracting parties through facilitating economic development along the corridor of Interstate 75, Cincinnati Dayton Road and State Route 129. For more information and a copy of the financial statements, contact the City of Middletown. A 1.5% income tax was enacted for the JEDD. Imposition of tax began on October 1, 2006 and terminates December 31, 2045, with two ten year extensions. Mason’s use of funds provide for the improvement of the transportation network within the City, including the improvements of Bethany and Mason Roads. Distribution of Gross Tax: 5% Service Fee for Middletown to collect the income 1% Escrow payment for refunds 94% Net distribution Net Distribution: 83% Liberty Township 2% Middletown 15% Mason Note 18 – Change in Accounting Principles For 2010, the City has implemented GASB No. 51 “Accounting and Financial Reporting for Intangible Assets.” Any intangible assets acquired by the City prior to January 1, 2010 have already been included in the capital assets system (right-of-way easements). Note 19 – Prior Period Adjustment The City made the following restatements as of December 31, 2009: The City’s Community Center Fund was restated to include a prepaid item for the City and Mason City Schools’ joint operating agreement.
60
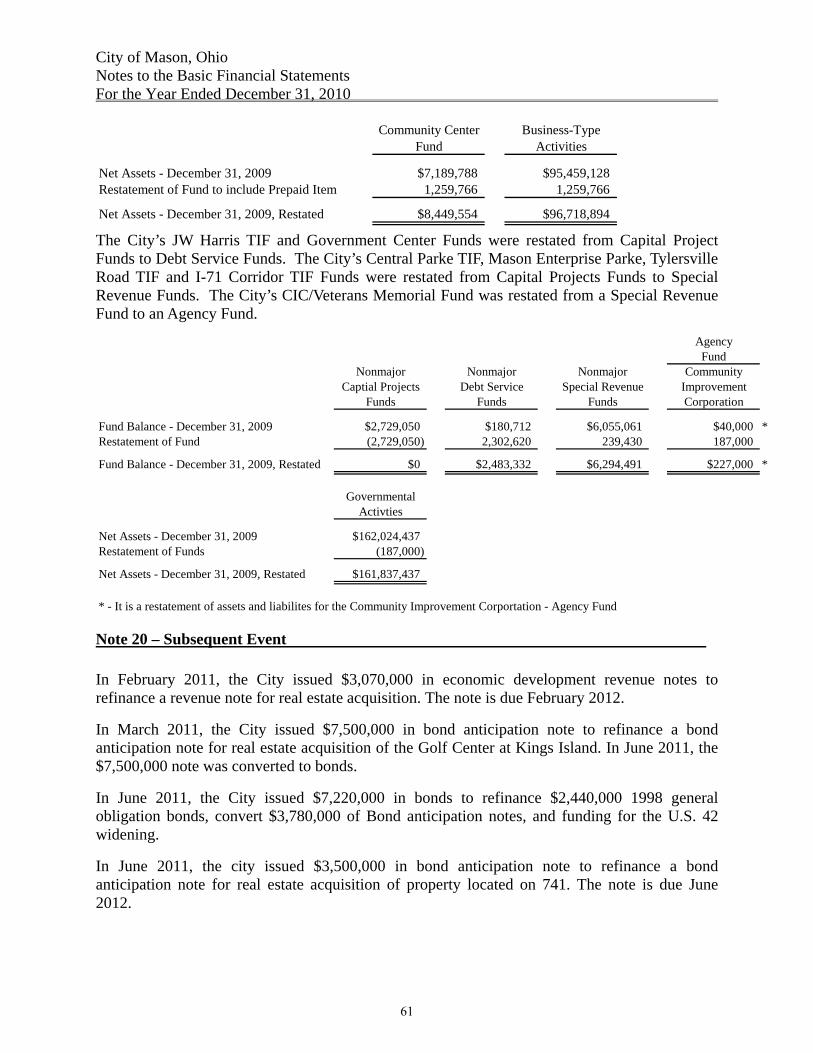
City of Mason, Ohio Notes to the Basic Financial Statements For the Year Ended December 31, 2010
Community Center Business-TypeFund Activities
Net Assets - December 31, 2009 $7,189,788 $95,459,128Restatement of Fund to include Prepaid Item 1,259,766 1,259,766
Net Assets - December 31, 2009, Restated $8,449,554 $96,718,894
The City’s JW Harris TIF and Government Center Funds were restated from Capital Project Funds to Debt Service Funds. The City’s Central Parke TIF, Mason Enterprise Parke, Tylersville Road TIF and I-71 Corridor TIF Funds were restated from Capital Projects Funds to Special Revenue Funds. The City’s CIC/Veterans Memorial Fund was restated from a Special Revenue Fund to an Agency Fund.
AgencyFund
Nonmajor Nonmajor Nonmajor CommunityCaptial Projects Debt Service Special Revenue Improvement
Funds Funds Funds Corporation
Fund Balance - December 31, 2009 $2,729,050 $180,712 $6,055,061 $40,000 *Restatement of Fund (2,729,050) 2,302,620 239,430 187,000
Fund Balance - December 31, 2009, Restated $0 $2,483,332 $6,294,491 $227,000 *
GovernmentalActivties
Net Assets - December 31, 2009 $162,024,437Restatement of Funds (187,000)
Net Assets - December 31, 2009, Restated $161,837,437
* - It is a restatement of assets and liabilites for the Community Improvement Corportation - Agency Fund
Note 20 – Subsequent Event
In February 2011, the City issued $3,070,000 in economic development revenue notes to refinance a revenue note for real estate acquisition. The note is due February 2012.
In March 2011, the City issued $7,500,000 in bond anticipation note to refinance a bond anticipation note for real estate acquisition of the Golf Center at Kings Island. In June 2011, the $7,500,000 note was converted to bonds.
In June 2011, the City issued $7,220,000 in bonds to refinance $2,440,000 1998 general obligation bonds, convert $3,780,000 of Bond anticipation notes, and funding for the U.S. 42 widening.
In June 2011, the city issued $3,500,000 in bond anticipation note to refinance a bond anticipation note for real estate acquisition of property located on 741. The note is due June 2012.
61
REQUIRED SUPPLEMENTARY INFORMATION
62
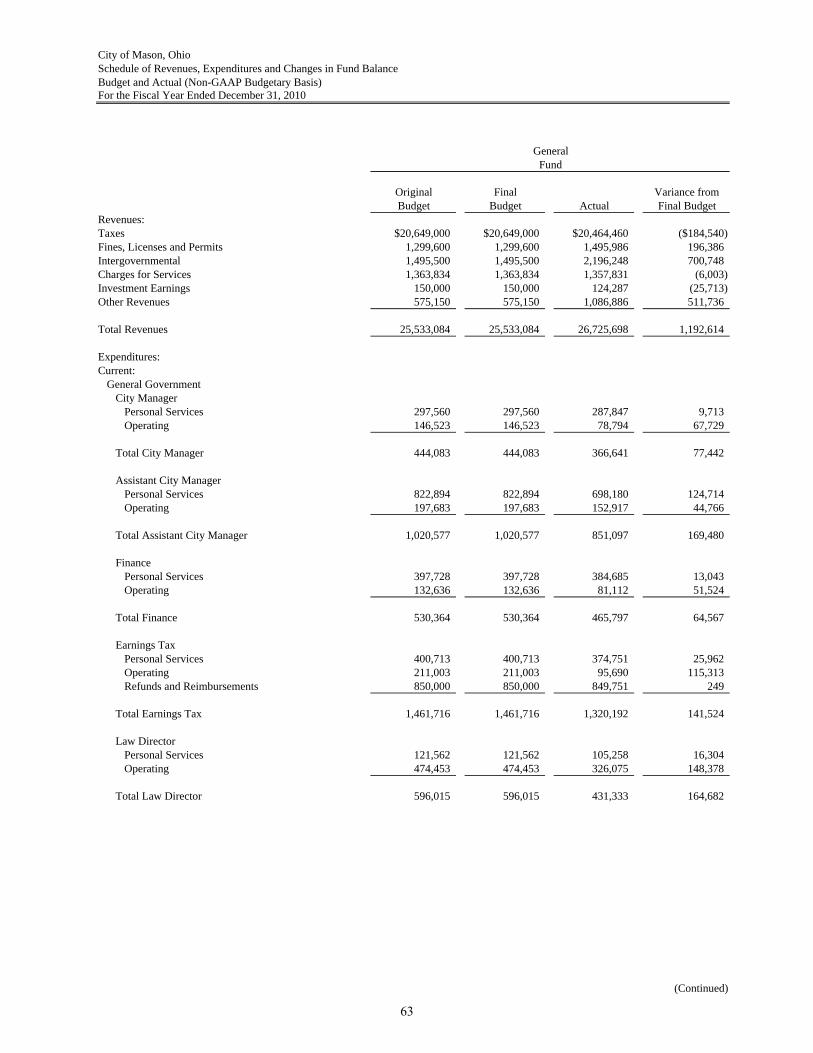
City of Mason, OhioSchedule of Revenues, Expenditures and Changes in Fund BalanceBudget and Actual (Non-GAAP Budgetary Basis)For the Fiscal Year Ended December 31, 2010
Original Final Variance fromBudget Budget Actual Final Budget
Revenues:Taxes $20,649,000 $20,649,000 $20,464,460 ($184,540)Fines, Licenses and Permits 1,299,600 1,299,600 1,495,986 196,386Intergovernmental 1,495,500 1,495,500 2,196,248 700,748Charges for Services 1,363,834 1,363,834 1,357,831 (6,003)Investment Earnings 150,000 150,000 124,287 (25,713)Other Revenues 575,150 575,150 1,086,886 511,736
Total Revenues 25,533,084 25,533,084 26,725,698 1,192,614
Expenditures:Current:
General GovernmentCity Manager
Personal Services 297,560 297,560 287,847 9,713Operating 146,523 146,523 78,794 67,729
Total City Manager 444,083 444,083 366,641 77,442
Assistant City ManagerPersonal Services 822,894 822,894 698,180 124,714Operating 197,683 197,683 152,917 44,766
Total Assistant City Manager 1,020,577 1,020,577 851,097 169,480
FinancePersonal Services 397,728 397,728 384,685 13,043Operating 132,636 132,636 81,112 51,524
Total Finance 530,364 530,364 465,797 64,567
Earnings TaxPersonal Services 400,713 400,713 374,751 25,962Operating 211,003 211,003 95,690 115,313Refunds and Reimbursements 850,000 850,000 849,751 249
Total Earnings Tax 1,461,716 1,461,716 1,320,192 141,524
Law DirectorPersonal Services 121,562 121,562 105,258 16,304Operating 474,453 474,453 326,075 148,378
Total Law Director 596,015 596,015 431,333 164,682
(Continued)
FundGeneral
63
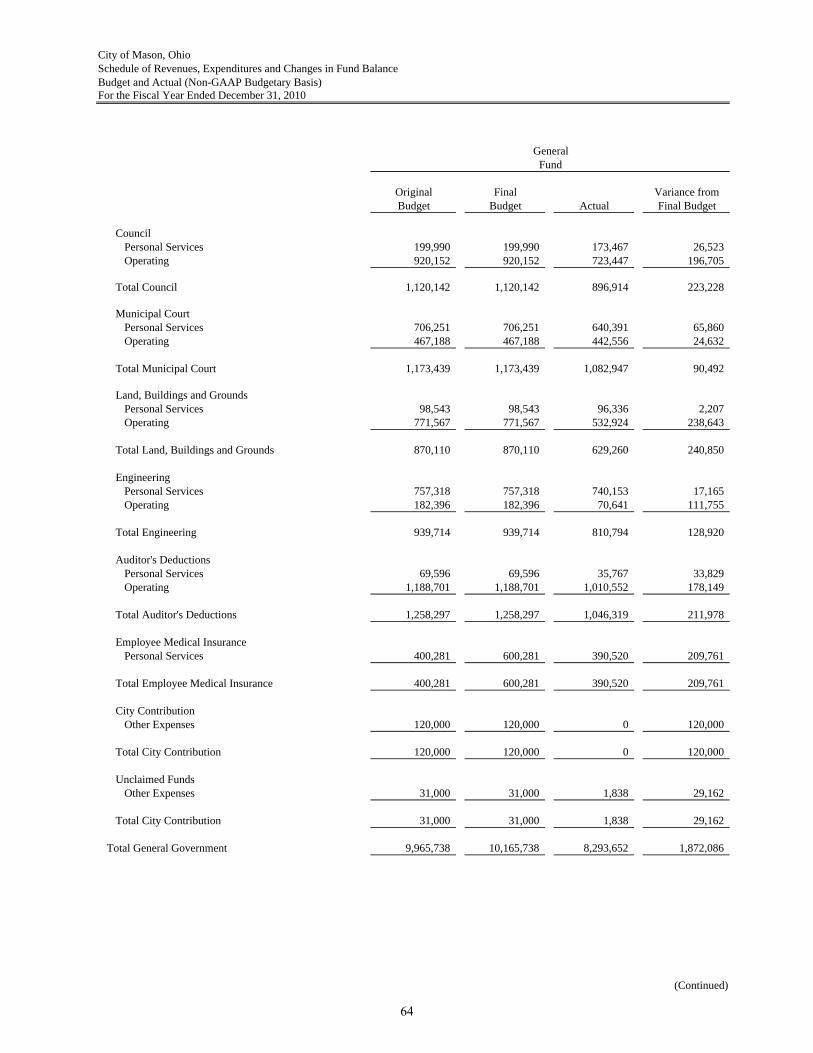
City of Mason, OhioSchedule of Revenues, Expenditures and Changes in Fund BalanceBudget and Actual (Non-GAAP Budgetary Basis)For the Fiscal Year Ended December 31, 2010
Original Final Variance fromBudget Budget Actual Final Budget
CouncilPersonal Services 199,990 199,990 173,467 26,523Operating 920,152 920,152 723,447 196,705
Total Council 1,120,142 1,120,142 896,914 223,228
Municipal CourtPersonal Services 706,251 706,251 640,391 65,860Operating 467,188 467,188 442,556 24,632
Total Municipal Court 1,173,439 1,173,439 1,082,947 90,492
Land, Buildings and GroundsPersonal Services 98,543 98,543 96,336 2,207Operating 771,567 771,567 532,924 238,643
Total Land, Buildings and Grounds 870,110 870,110 629,260 240,850
EngineeringPersonal Services 757,318 757,318 740,153 17,165Operating 182,396 182,396 70,641 111,755
Total Engineering 939,714 939,714 810,794 128,920
Auditor's DeductionsPersonal Services 69,596 69,596 35,767 33,829Operating 1,188,701 1,188,701 1,010,552 178,149
Total Auditor's Deductions 1,258,297 1,258,297 1,046,319 211,978
Employee Medical InsurancePersonal Services 400,281 600,281 390,520 209,761
Total Employee Medical Insurance 400,281 600,281 390,520 209,761
City ContributionOther Expenses 120,000 120,000 0 120,000
Total City Contribution 120,000 120,000 0 120,000
Unclaimed FundsOther Expenses 31,000 31,000 1,838 29,162
Total City Contribution 31,000 31,000 1,838 29,162
Total General Government 9,965,738 10,165,738 8,293,652 1,872,086
(Continued)
FundGeneral
64
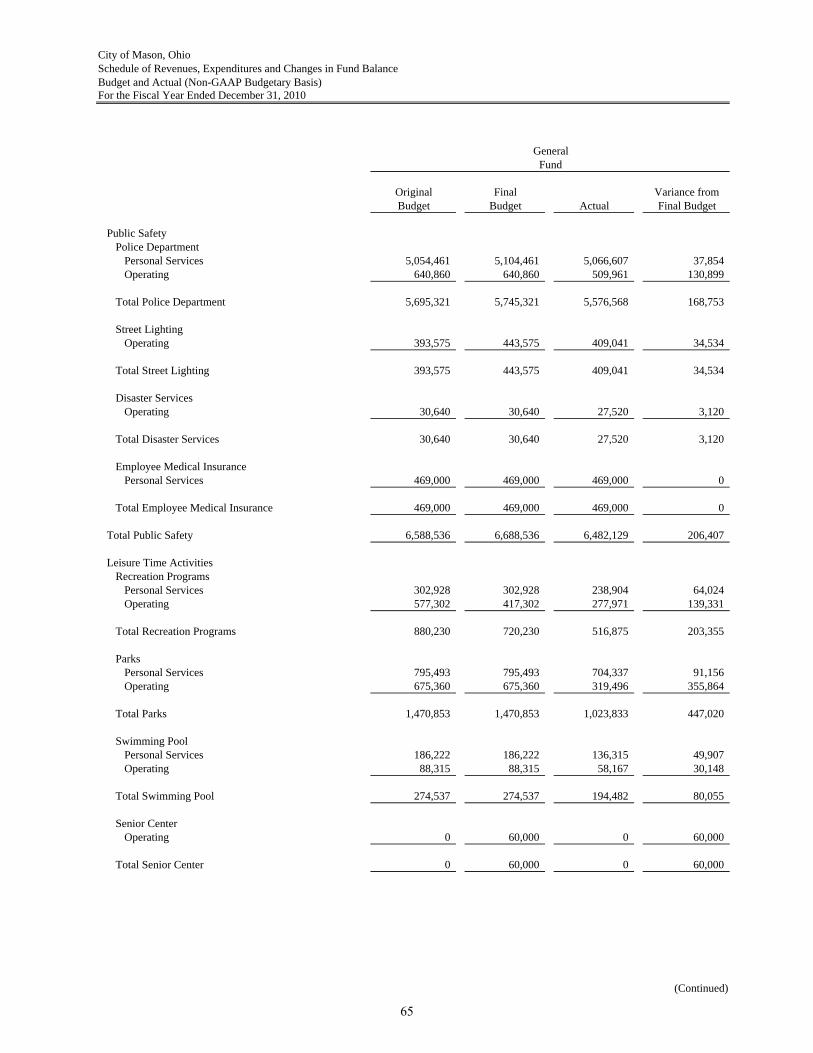
City of Mason, OhioSchedule of Revenues, Expenditures and Changes in Fund BalanceBudget and Actual (Non-GAAP Budgetary Basis)For the Fiscal Year Ended December 31, 2010
Original Final Variance fromBudget Budget Actual Final Budget
Public SafetyPolice Department
Personal Services 5,054,461 5,104,461 5,066,607 37,854Operating 640,860 640,860 509,961 130,899
Total Police Department 5,695,321 5,745,321 5,576,568 168,753
Street LightingOperating 393,575 443,575 409,041 34,534
Total Street Lighting 393,575 443,575 409,041 34,534
Disaster ServicesOperating 30,640 30,640 27,520 3,120
Total Disaster Services 30,640 30,640 27,520 3,120
Employee Medical InsurancePersonal Services 469,000 469,000 469,000 0
Total Employee Medical Insurance 469,000 469,000 469,000 0
Total Public Safety 6,588,536 6,688,536 6,482,129 206,407
Leisure Time ActivitiesRecreation Programs
Personal Services 302,928 302,928 238,904 64,024Operating 577,302 417,302 277,971 139,331
Total Recreation Programs 880,230 720,230 516,875 203,355
ParksPersonal Services 795,493 795,493 704,337 91,156Operating 675,360 675,360 319,496 355,864
Total Parks 1,470,853 1,470,853 1,023,833 447,020
Swimming PoolPersonal Services 186,222 186,222 136,315 49,907Operating 88,315 88,315 58,167 30,148
Total Swimming Pool 274,537 274,537 194,482 80,055
Senior CenterOperating 0 60,000 0 60,000
Total Senior Center 0 60,000 0 60,000
(Continued)
FundGeneral
65
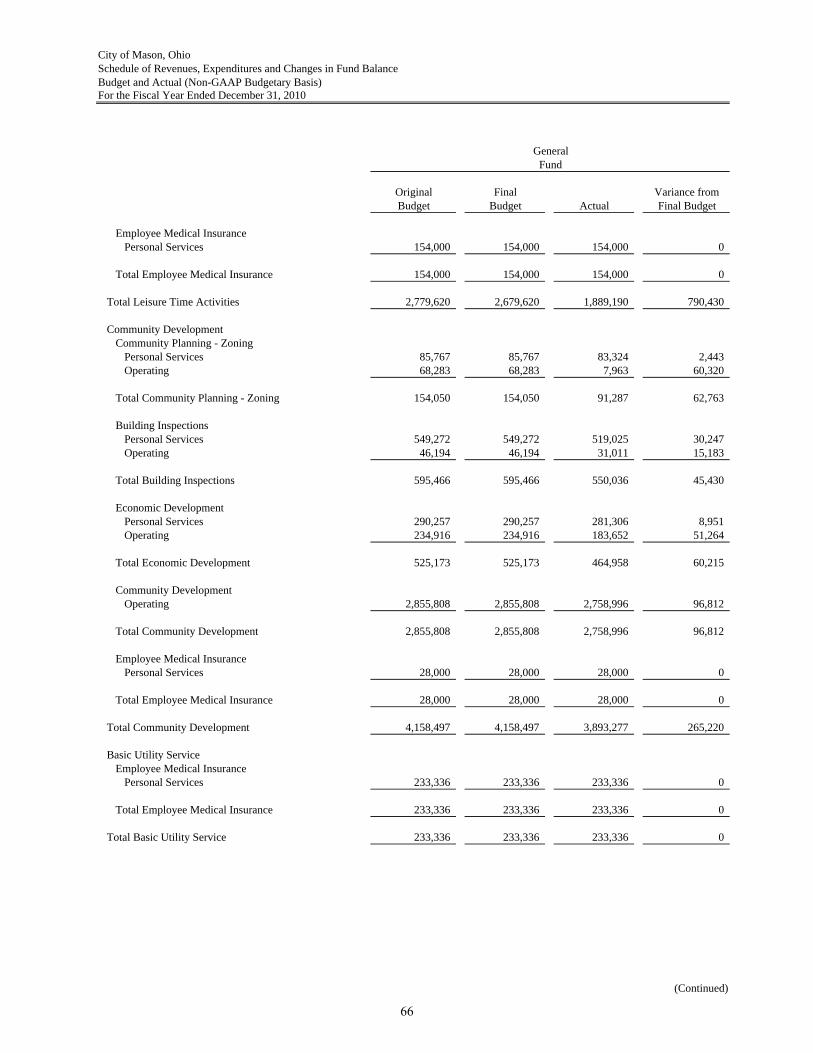
City of Mason, OhioSchedule of Revenues, Expenditures and Changes in Fund BalanceBudget and Actual (Non-GAAP Budgetary Basis)For the Fiscal Year Ended December 31, 2010
Original Final Variance fromBudget Budget Actual Final Budget
Employee Medical InsurancePersonal Services 154,000 154,000 154,000 0
Total Employee Medical Insurance 154,000 154,000 154,000 0
Total Leisure Time Activities 2,779,620 2,679,620 1,889,190 790,430
Community DevelopmentCommunity Planning - Zoning
Personal Services 85,767 85,767 83,324 2,443Operating 68,283 68,283 7,963 60,320
Total Community Planning - Zoning 154,050 154,050 91,287 62,763
Building InspectionsPersonal Services 549,272 549,272 519,025 30,247Operating 46,194 46,194 31,011 15,183
Total Building Inspections 595,466 595,466 550,036 45,430
Economic DevelopmentPersonal Services 290,257 290,257 281,306 8,951Operating 234,916 234,916 183,652 51,264
Total Economic Development 525,173 525,173 464,958 60,215
Community DevelopmentOperating 2,855,808 2,855,808 2,758,996 96,812
Total Community Development 2,855,808 2,855,808 2,758,996 96,812
Employee Medical InsurancePersonal Services 28,000 28,000 28,000 0
Total Employee Medical Insurance 28,000 28,000 28,000 0
Total Community Development 4,158,497 4,158,497 3,893,277 265,220
Basic Utility ServiceEmployee Medical Insurance
Personal Services 233,336 233,336 233,336 0
Total Employee Medical Insurance 233,336 233,336 233,336 0
Total Basic Utility Service 233,336 233,336 233,336 0
(Continued)
GeneralFund
66
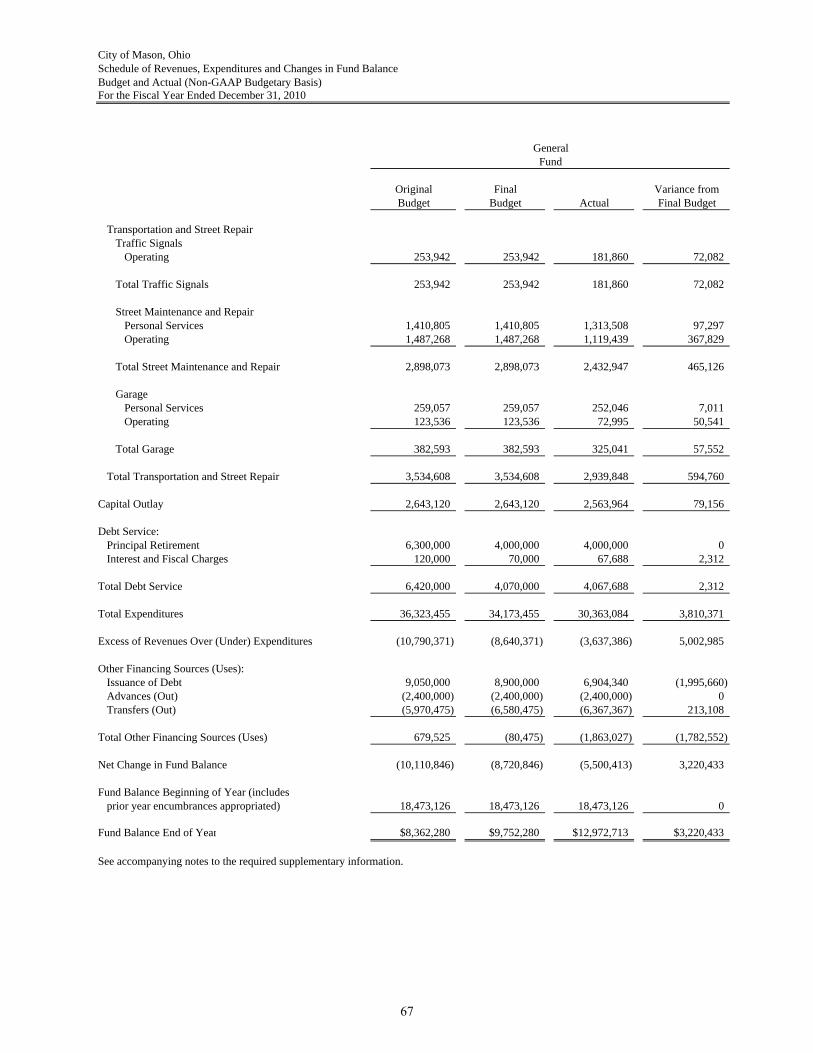
City of Mason, OhioSchedule of Revenues, Expenditures and Changes in Fund BalanceBudget and Actual (Non-GAAP Budgetary Basis)For the Fiscal Year Ended December 31, 2010
Original Final Variance fromBudget Budget Actual Final Budget
Transportation and Street RepairTraffic Signals
Operating 253,942 253,942 181,860 72,082
Total Traffic Signals 253,942 253,942 181,860 72,082
Street Maintenance and RepairPersonal Services 1,410,805 1,410,805 1,313,508 97,297Operating 1,487,268 1,487,268 1,119,439 367,829
Total Street Maintenance and Repair 2,898,073 2,898,073 2,432,947 465,126
GaragePersonal Services 259,057 259,057 252,046 7,011Operating 123,536 123,536 72,995 50,541
Total Garage 382,593 382,593 325,041 57,552
Total Transportation and Street Repair 3,534,608 3,534,608 2,939,848 594,760
Capital Outlay 2,643,120 2,643,120 2,563,964 79,156
Debt Service:Principal Retirement 6,300,000 4,000,000 4,000,000 0Interest and Fiscal Charges 120,000 70,000 67,688 2,312
Total Debt Service 6,420,000 4,070,000 4,067,688 2,312
Total Expenditures 36,323,455 34,173,455 30,363,084 3,810,371
Excess of Revenues Over (Under) Expenditures (10,790,371) (8,640,371) (3,637,386) 5,002,985
Other Financing Sources (Uses):Issuance of Debt 9,050,000 8,900,000 6,904,340 (1,995,660)Advances (Out) (2,400,000) (2,400,000) (2,400,000) 0Transfers (Out) (5,970,475) (6,580,475) (6,367,367) 213,108
Total Other Financing Sources (Uses) 679,525 (80,475) (1,863,027) (1,782,552)
Net Change in Fund Balance (10,110,846) (8,720,846) (5,500,413) 3,220,433
Fund Balance Beginning of Year (includes prior year encumbrances appropriated) 18,473,126 18,473,126 18,473,126 0
Fund Balance End of Year $8,362,280 $9,752,280 $12,972,713 $3,220,433
See accompanying notes to the required supplementary information.
GeneralFund
67
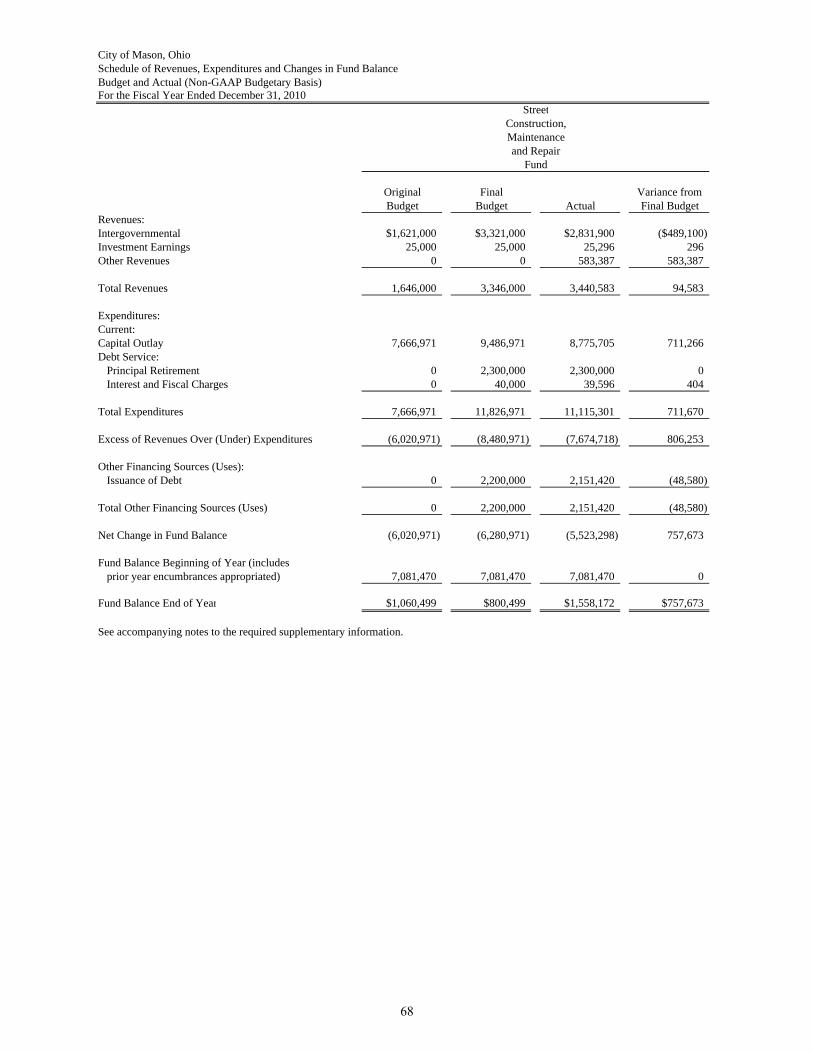
City of Mason, OhioSchedule of Revenues, Expenditures and Changes in Fund BalanceBudget and Actual (Non-GAAP Budgetary Basis)For the Fiscal Year Ended December 31, 2010
Original Final Variance fromBudget Budget Actual Final Budget
Revenues:Intergovernmental $1,621,000 $3,321,000 $2,831,900 ($489,100)Investment Earnings 25,000 25,000 25,296 296Other Revenues 0 0 583,387 583,387
Total Revenues 1,646,000 3,346,000 3,440,583 94,583
Expenditures:Current:Capital Outlay 7,666,971 9,486,971 8,775,705 711,266Debt Service:
Principal Retirement 0 2,300,000 2,300,000 0Interest and Fiscal Charges 0 40,000 39,596 404
Total Expenditures 7,666,971 11,826,971 11,115,301 711,670
Excess of Revenues Over (Under) Expenditures (6,020,971) (8,480,971) (7,674,718) 806,253
Other Financing Sources (Uses):Issuance of Debt 0 2,200,000 2,151,420 (48,580)
Total Other Financing Sources (Uses) 0 2,200,000 2,151,420 (48,580)
Net Change in Fund Balance (6,020,971) (6,280,971) (5,523,298) 757,673
Fund Balance Beginning of Year (includes prior year encumbrances appropriated) 7,081,470 7,081,470 7,081,470 0
Fund Balance End of Year $1,060,499 $800,499 $1,558,172 $757,673
See accompanying notes to the required supplementary information.
Fund
Street
Maintenanceand Repair
Construction,
68
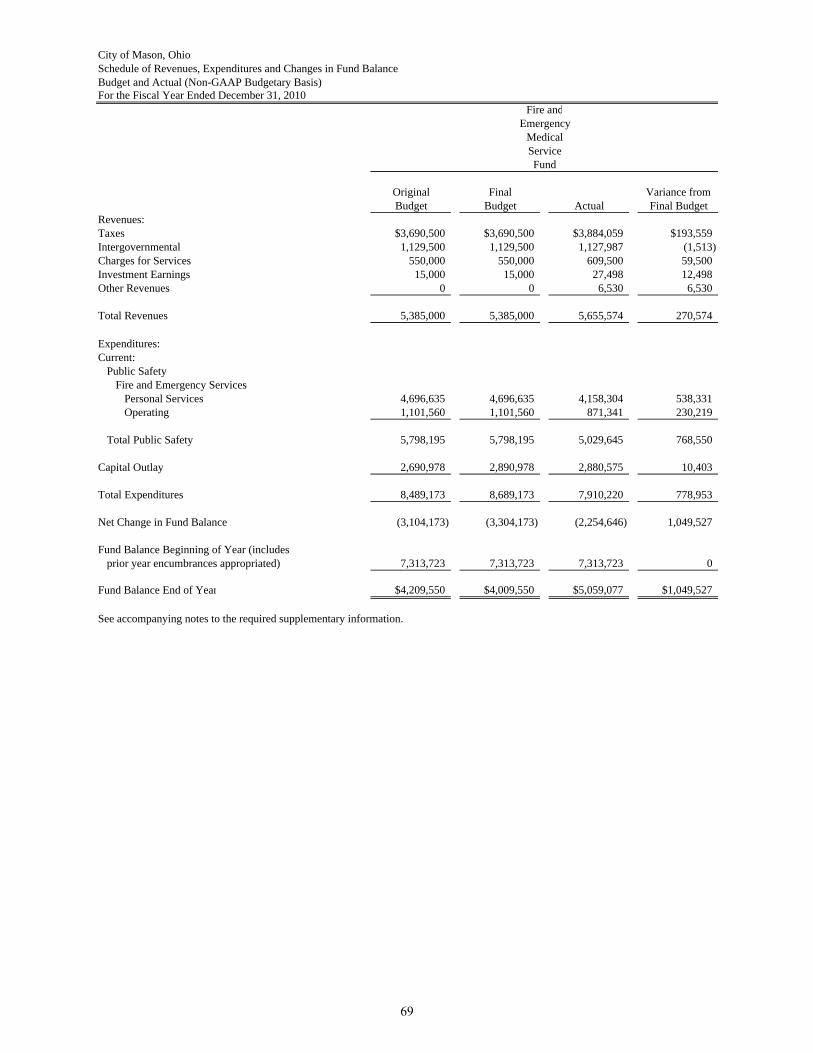
City of Mason, OhioSchedule of Revenues, Expenditures and Changes in Fund BalanceBudget and Actual (Non-GAAP Budgetary Basis)For the Fiscal Year Ended December 31, 2010
Original Final Variance fromBudget Budget Actual Final Budget
Revenues:Taxes $3,690,500 $3,690,500 $3,884,059 $193,559Intergovernmental 1,129,500 1,129,500 1,127,987 (1,513)Charges for Services 550,000 550,000 609,500 59,500Investment Earnings 15,000 15,000 27,498 12,498Other Revenues 0 0 6,530 6,530
Total Revenues 5,385,000 5,385,000 5,655,574 270,574
Expenditures:Current:
Public SafetyFire and Emergency Services
Personal Services 4,696,635 4,696,635 4,158,304 538,331Operating 1,101,560 1,101,560 871,341 230,219
Total Public Safety 5,798,195 5,798,195 5,029,645 768,550
Capital Outlay 2,690,978 2,890,978 2,880,575 10,403
Total Expenditures 8,489,173 8,689,173 7,910,220 778,953
Net Change in Fund Balance (3,104,173) (3,304,173) (2,254,646) 1,049,527
Fund Balance Beginning of Year (includes prior year encumbrances appropriated) 7,313,723 7,313,723 7,313,723 0
Fund Balance End of Year $4,209,550 $4,009,550 $5,059,077 $1,049,527
See accompanying notes to the required supplementary information.
Fund
Fire and
MedicalService
Emergency
69
City of Mason, Ohio Notes to the Required Supplementary Information For The Year Ended December 31, 2010 Note 1 – Budgetary Process All funds, except agency funds, are legally required to be budgeted and appropriated. The major documents prepared are the tax budget, the certificate of estimated resources, and the appropriations resolution, all of which are prepared on the budgetary basis of accounting. The tax budget demonstrates a need for existing or increased tax rates. The certificate of estimated resources establishes a limit on the amount Council may appropriate. The appropriations resolution is Council’s authorization to spend resources and sets annual limits on expenditures plus encumbrances at the level of control selected by Council. The legal level of control has been established by Council so that appropriation measures shall be classified so as to set forth separately the amounts appropriated for each department and within each department, the amount appropriated for each object for the General Fund. All other funds are maintained at the fund level. The certificate of estimated resources may be amended during the year if projected increases or decreases in revenue are identified by the Finance Director. The amounts reported as the original budgeted amounts on the budgetary statements reflect the amounts on the certificate of estimated resources when the original appropriations were adopted. The amounts reported as the final budgeted amounts on the budgetary statements reflect the amounts on the final amended certificate of estimated resources issued during the year. The appropriation resolution is subject to amendment throughout the year with the restriction that appropriations cannot exceed estimated resources. The amounts reported as the original budgeted amounts reflect the first appropriation resolution for that fund that covered the entire year, including amounts automatically carried forward from prior years. The amounts reported as the final budgeted amounts represent the final appropriation amounts passed by Council during the year. While the City is reporting financial position, results of operations and changes in fund balance on the basis of generally accepted accounting principles (GAAP), the budgetary basis as provided by law is based upon accounting for certain transactions on a basis of cash receipts, disbursements and encumbrances. The Schedule of Revenues, Expenditures and Changes in Fund Balances - Budget and Actual (Non-GAAP Budgetary Basis) presented for the General Fund, Street Construction, Maintenance and Repair Fund, and Fire and Emergency Medical Services Fund are presented on the budgetary basis to provide a meaningful comparison of actual results with the budget. The major differences between the budget basis and GAAP basis are as follows:
1. Revenues are recorded when received in cash (budget) as opposed to when susceptible to accrual (GAAP).
2. Expenditures are recorded when paid in cash (budget) as opposed to when the liability is
incurred (GAAP).
3. Encumbrances are treated as expenditures (budget) rather than as a reservation of fund balance (GAAP).
70
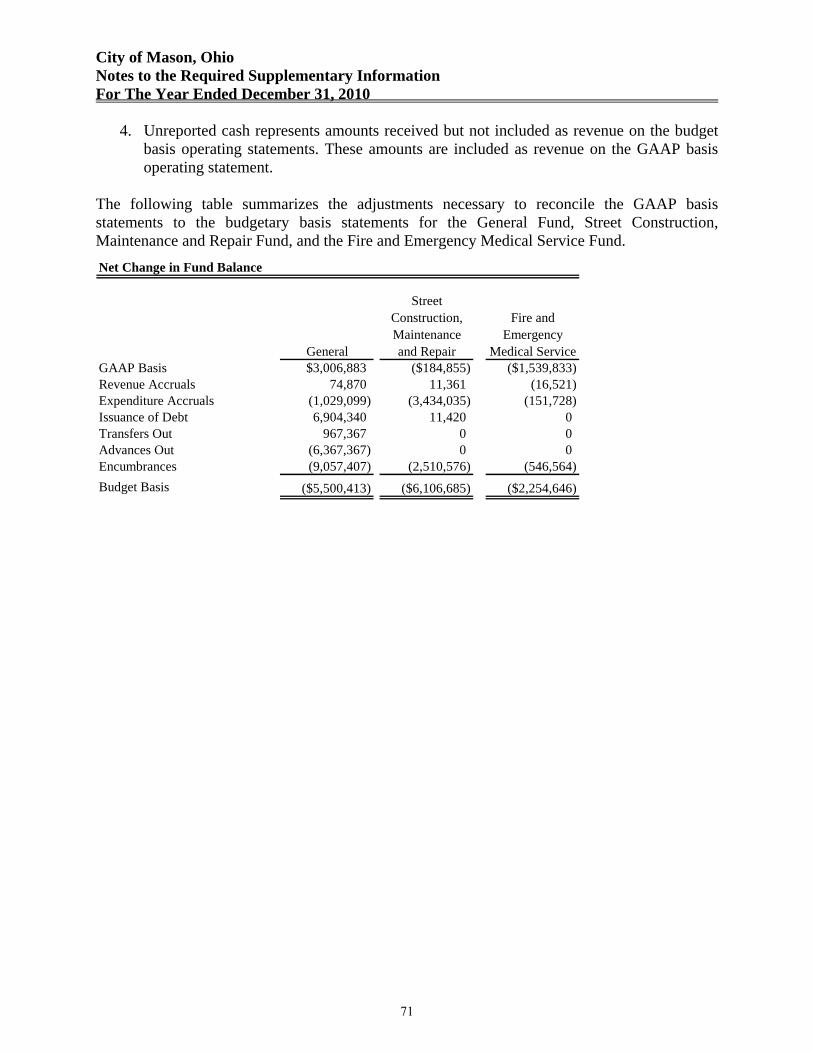
City of Mason, Ohio Notes to the Required Supplementary Information For The Year Ended December 31, 2010
4. Unreported cash represents amounts received but not included as revenue on the budget basis operating statements. These amounts are included as revenue on the GAAP basis operating statement.
The following table summarizes the adjustments necessary to reconcile the GAAP basis statements to the budgetary basis statements for the General Fund, Street Construction, Maintenance and Repair Fund, and the Fire and Emergency Medical Service Fund.
Net Change in Fund Balance
General
Street Construction, Maintenance and Repair
Fire and Emergency
Medical ServiceGAAP Basis $3,006,883 ($184,855) ($1,539,833)Revenue Accruals 74,870 11,361 (16,521)Expenditure Accruals (1,029,099) (3,434,035) (151,728)Issuance of Debt 6,904,340 11,420 0Transfers Out 967,367 0 0Advances Out (6,367,367) 0 0Encumbrances (9,057,407) (2,510,576) (546,564)Budget Basis ($5,500,413) ($6,106,685) ($2,254,646)
71
COMBINING STATEMENTS AND
INDIVIDUAL FUND SCHEDULES
72
NONMAJOR GOVERNMENTAL FUNDS
Special Revenue Funds: Special Revenue funds are used to account for the proceeds of specific revenue sources (other than amounts relating to expendable trusts or major capital projects) that are legally restricted to expenditures for specified purposes. Debt Service Funds: The Debt Service Funds are used to account for the accumulation of resources and payment of general obligation bond principal and interest from governmental resources and special assessments levies when the government is obligated in some manner for payment.
73
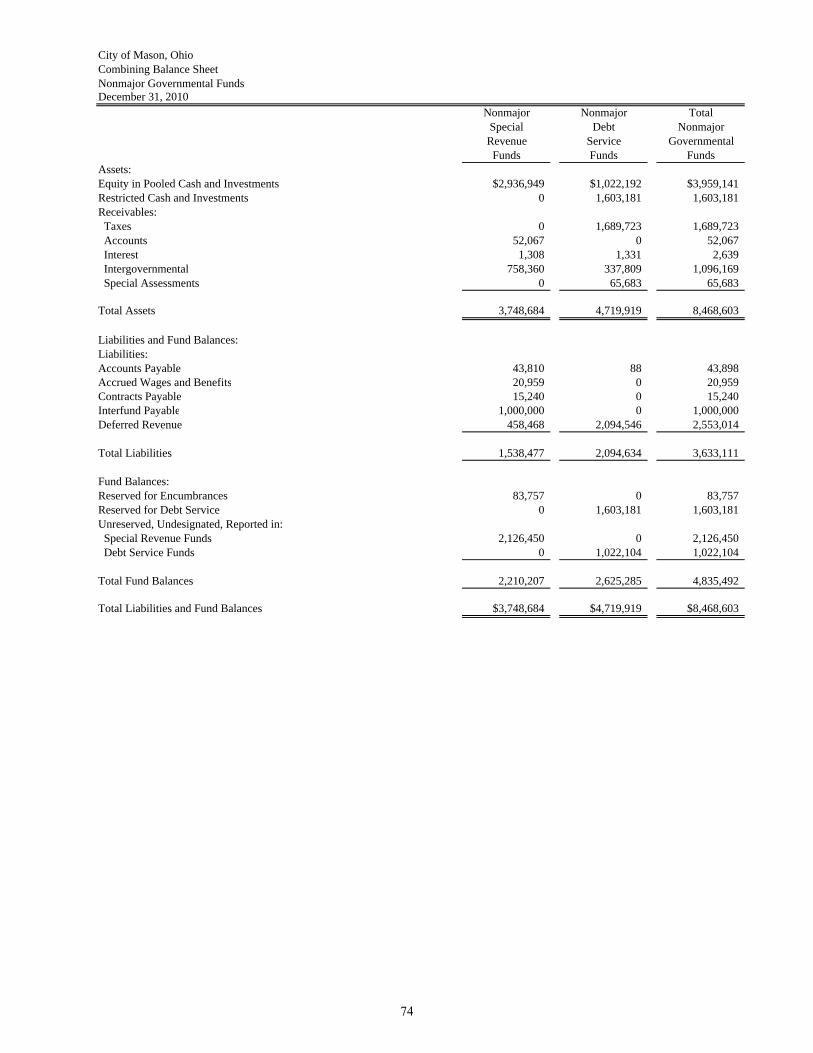
City of Mason, OhioCombining Balance SheetNonmajor Governmental FundsDecember 31, 2010
Nonmajor Nonmajor TotalSpecial Debt NonmajorRevenue Service Governmental
Funds Funds FundsAssets:Equity in Pooled Cash and Investments $2,936,949 $1,022,192 $3,959,141Restricted Cash and Investments 0 1,603,181 1,603,181Receivables: Taxes 0 1,689,723 1,689,723 Accounts 52,067 0 52,067 Interest 1,308 1,331 2,639 Intergovernmental 758,360 337,809 1,096,169 Special Assessments 0 65,683 65,683
Total Assets 3,748,684 4,719,919 8,468,603
Liabilities and Fund Balances:Liabilities:Accounts Payable 43,810 88 43,898Accrued Wages and Benefits 20,959 0 20,959Contracts Payable 15,240 0 15,240Interfund Payable 1,000,000 0 1,000,000Deferred Revenue 458,468 2,094,546 2,553,014
Total Liabilities 1,538,477 2,094,634 3,633,111
Fund Balances:Reserved for Encumbrances 83,757 0 83,757Reserved for Debt Service 0 1,603,181 1,603,181Unreserved, Undesignated, Reported in: Special Revenue Funds 2,126,450 0 2,126,450 Debt Service Funds 0 1,022,104 1,022,104
Total Fund Balances 2,210,207 2,625,285 4,835,492
Total Liabilities and Fund Balances $3,748,684 $4,719,919 $8,468,603
74
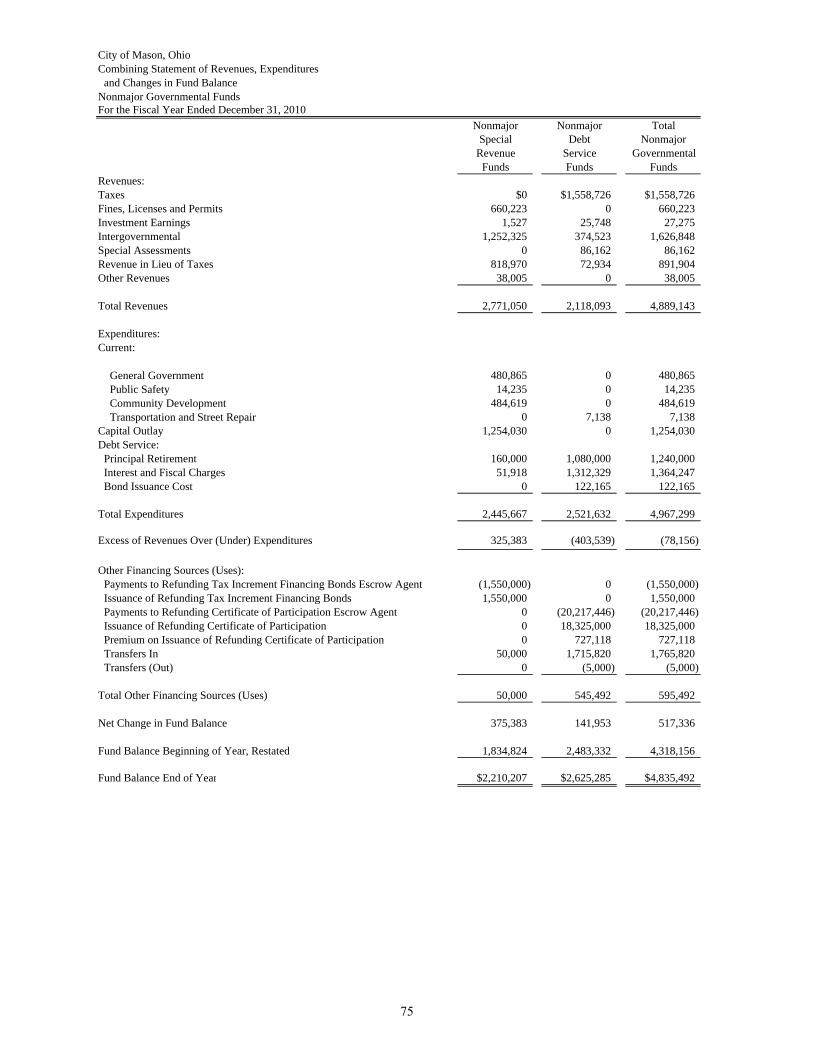
City of Mason, OhioCombining Statement of Revenues, Expenditures
and Changes in Fund BalanceNonmajor Governmental FundsFor the Fiscal Year Ended December 31, 2010
Nonmajor Nonmajor TotalSpecial Debt Nonmajor
Revenue Service GovernmentalFunds Funds Funds
Revenues:Taxes $0 $1,558,726 $1,558,726Fines, Licenses and Permits 660,223 0 660,223Investment Earnings 1,527 25,748 27,275Intergovernmental 1,252,325 374,523 1,626,848Special Assessments 0 86,162 86,162Revenue in Lieu of Taxes 818,970 72,934 891,904Other Revenues 38,005 0 38,005
Total Revenues 2,771,050 2,118,093 4,889,143
Expenditures:Current:
General Government 480,865 0 480,865Public Safety 14,235 0 14,235Community Development 484,619 0 484,619Transportation and Street Repair 0 7,138 7,138
Capital Outlay 1,254,030 0 1,254,030Debt Service:
Principal Retirement 160,000 1,080,000 1,240,000Interest and Fiscal Charges 51,918 1,312,329 1,364,247Bond Issuance Cost 0 122,165 122,165
Total Expenditures 2,445,667 2,521,632 4,967,299
Excess of Revenues Over (Under) Expenditures 325,383 (403,539) (78,156)
Other Financing Sources (Uses):Payments to Refunding Tax Increment Financing Bonds Escrow Agent (1,550,000) 0 (1,550,000)Issuance of Refunding Tax Increment Financing Bonds 1,550,000 0 1,550,000Payments to Refunding Certificate of Participation Escrow Agent 0 (20,217,446) (20,217,446)Issuance of Refunding Certificate of Participation 0 18,325,000 18,325,000Premium on Issuance of Refunding Certificate of Participation 0 727,118 727,118Transfers In 50,000 1,715,820 1,765,820Transfers (Out) 0 (5,000) (5,000)
Total Other Financing Sources (Uses) 50,000 545,492 595,492
Net Change in Fund Balance 375,383 141,953 517,336
Fund Balance Beginning of Year, Restated 1,834,824 2,483,332 4,318,156
Fund Balance End of Year $2,210,207 $2,625,285 $4,835,492
75
NONMAJOR SPECIAL REVENUE FUNDS Fund Descriptions State Highway Improvement: To account for the remaining 7.5% of the City’s share of state gasoline taxes and motor vehicle license fees. State law requires that such monies be spent on state highways construction and improvements. Street Subdivision: To track fee paid by developers that may only be used to subdivision street improvements. Federal Grant: To account for monies designated to be used for federal grant purposes. Police Officer Training: To account for monies designated to be used for police officer training. Parks and Recreation: This fund accounts for monies received from residential building permits and other sources collected for the purpose of providing funds for recreational capital improvements. Police Crime Prevention: This fund is used to account for donations received for the prevention of crime within the City. Drug Law Enforcement: To account for monies designated to be used for drug law enforcement. Law Enforcement and Education: To account for monies received from court fines imposed for drivers convicted of driving under the influence of drugs and alcohol. Monies generated under this fund shall be used for enforcement and education of the public of such dangers. Indigent Driver: This fund is used to account for fees collected in conjunction with DUI offenses. Revenues received are used, by the court, for treatment and education of drug and alcohol offenders. Municipal Court Computer Costs: To account for monies received from court fines. Monies generated under this fund shall be used for computer related expenses of the Court. Municipal Court Computer Education: This fund is used to account for a $2.00 fee assessed in conjunction with court costs. Revenues collected are used for computer education and training within the Municipal Court. Municipal Court Improvement: This fund is used to account for a $5.00 fee assessed in conjunction with court costs. Revenues collected are used for improvements to the Municipal Court facilities. Vehicle Immobilization Fee: This fund is used to account for reimbursements received from the State of Ohio for costs incurred with the Court ordered immobilization of a vehicle. Municipal Court Probation Services: To account for monies received from court fines. Monies generated under this fund shall be used for probation services provided by the Court.
76
Municipal Court Indigent Driver IDAM: To account for fees collected in conjunction with DUI offenses. Revenues received are used, by the court, for treatment and education of drug and alcohol offenders. Subdivision Inspection: This fund is used to account for the revenues received and expenses incurred for inspection services rendered in the City of Mason. Central Parke TIF: This fund is used to account for the financial resources and expenditures related to the development of the Central Park business park. Mason Enterprise Parke TIF: This fund is used to account for the financial resources and expenditures related to the development of the Mason Enterprise business park. Tylersville Road TIF: This fund is used to account for the financial resources and expenditures related to the development of the Tylersville Crossing business park. I-71 Corridor TIF: This fund is used to account for the financial resources and expenditures related to the development and improvements to the I-71 Corridor. enter.
77
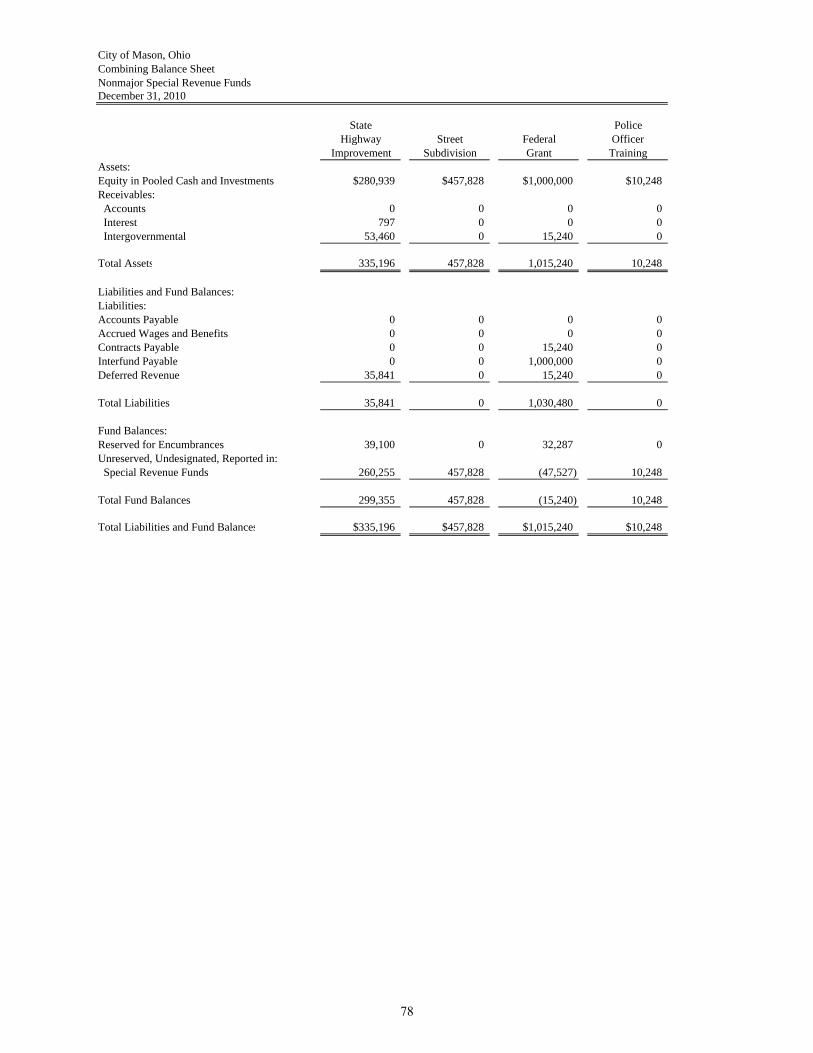
City of Mason, OhioCombining Balance SheetNonmajor Special Revenue FundsDecember 31, 2010
State PoliceHighway Street Federal Officer
Improvement Subdivision Grant TrainingAssets:Equity in Pooled Cash and Investments $280,939 $457,828 $1,000,000 $10,248Receivables: Accounts 0 0 0 0 Interest 797 0 0 0 Intergovernmental 53,460 0 15,240 0
Total Assets 335,196 457,828 1,015,240 10,248
Liabilities and Fund Balances:Liabilities:Accounts Payable 0 0 0 0Accrued Wages and Benefits 0 0 0 0Contracts Payable 0 0 15,240 0Interfund Payable 0 0 1,000,000 0Deferred Revenue 35,841 0 15,240 0
Total Liabilities 35,841 0 1,030,480 0
Fund Balances:Reserved for Encumbrances 39,100 0 32,287 0Unreserved, Undesignated, Reported in: Special Revenue Funds 260,255 457,828 (47,527) 10,248
Total Fund Balances 299,355 457,828 (15,240) 10,248
Total Liabilities and Fund Balances $335,196 $457,828 $1,015,240 $10,248
78
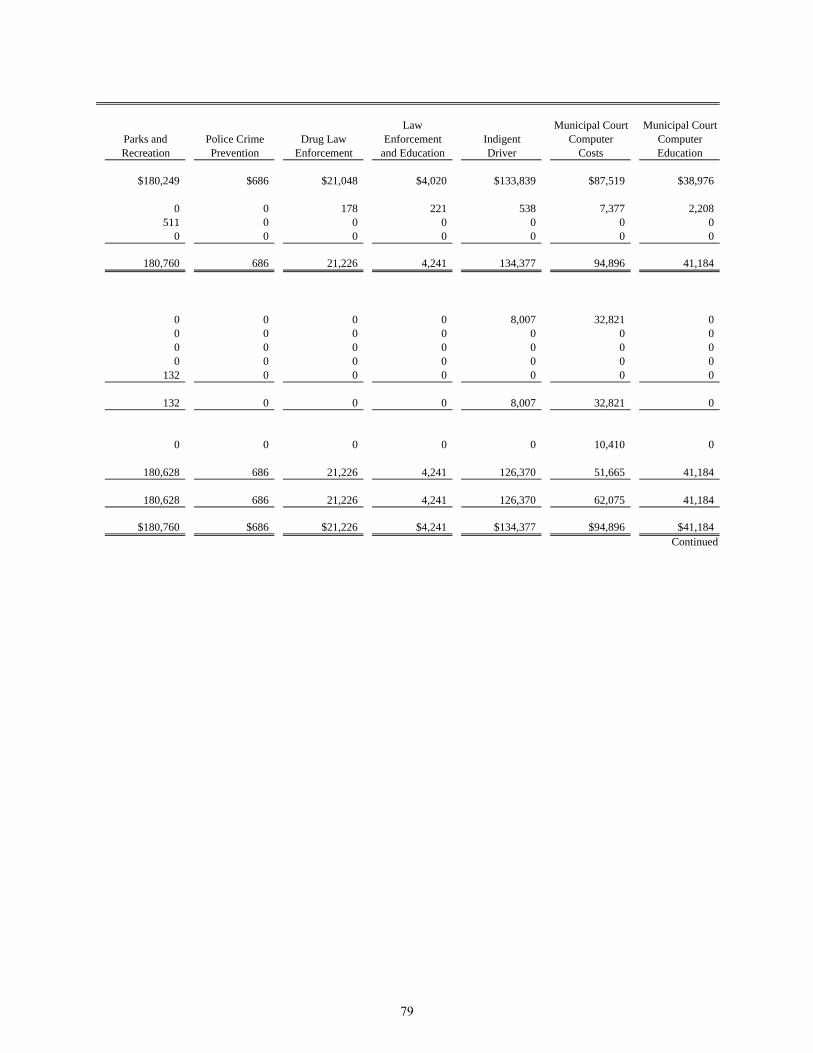
Law Municipal Court Municipal CourtParks and Police Crime Drug Law Enforcement Indigent Computer ComputerRecreation Prevention Enforcement and Education Driver Costs Education
$180,249 $686 $21,048 $4,020 $133,839 $87,519 $38,976
0 0 178 221 538 7,377 2,208511 0 0 0 0 0 0
0 0 0 0 0 0 0
180,760 686 21,226 4,241 134,377 94,896 41,184
0 0 0 0 8,007 32,821 00 0 0 0 0 0 00 0 0 0 0 0 00 0 0 0 0 0 0
132 0 0 0 0 0 0
132 0 0 0 8,007 32,821 0
0 0 0 0 0 10,410 0
180,628 686 21,226 4,241 126,370 51,665 41,184
180,628 686 21,226 4,241 126,370 62,075 41,184
$180,760 $686 $21,226 $4,241 $134,377 $94,896 $41,184Continued
79
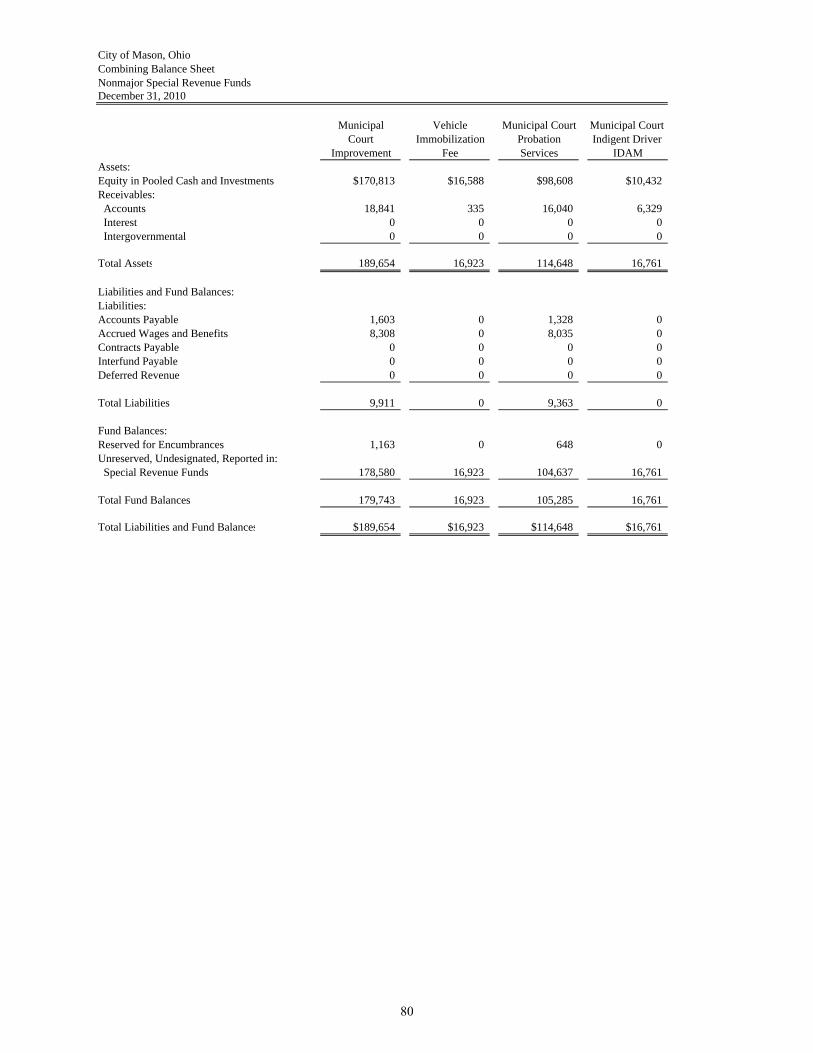
City of Mason, OhioCombining Balance SheetNonmajor Special Revenue FundsDecember 31, 2010
Municipal Vehicle Municipal Court Municipal Court Court Immobilization Probation Indigent Driver
Improvement Fee Services IDAMAssets:Equity in Pooled Cash and Investments $170,813 $16,588 $98,608 $10,432Receivables: Accounts 18,841 335 16,040 6,329 Interest 0 0 0 0 Intergovernmental 0 0 0 0
Total Assets 189,654 16,923 114,648 16,761
Liabilities and Fund Balances:Liabilities:Accounts Payable 1,603 0 1,328 0Accrued Wages and Benefits 8,308 0 8,035 0Contracts Payable 0 0 0 0Interfund Payable 0 0 0 0Deferred Revenue 0 0 0 0
Total Liabilities 9,911 0 9,363 0
Fund Balances:Reserved for Encumbrances 1,163 0 648 0Unreserved, Undesignated, Reported in: Special Revenue Funds 178,580 16,923 104,637 16,761
Total Fund Balances 179,743 16,923 105,285 16,761
Total Liabilities and Fund Balances $189,654 $16,923 $114,648 $16,761
80
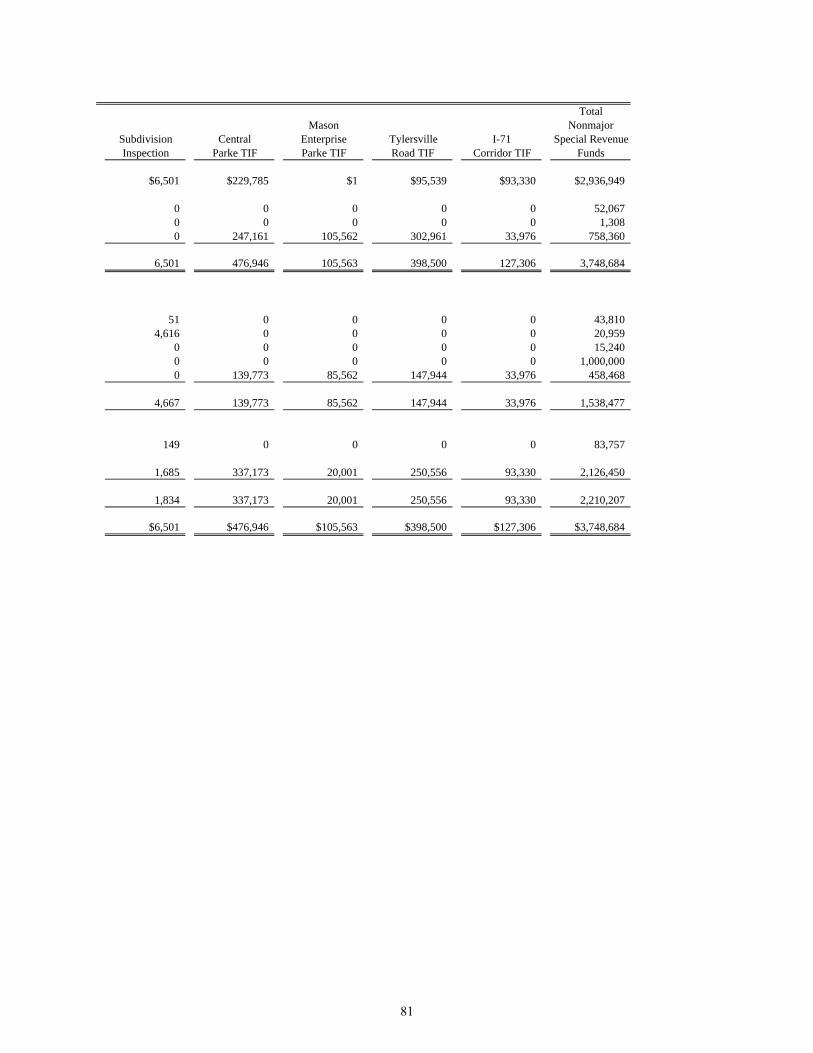
TotalMason Nonmajor
Subdivision Central Enterprise Tylersville I-71 Special RevenueInspection Parke TIF Parke TIF Road TIF Corridor TIF Funds
$6,501 $229,785 $1 $95,539 $93,330 $2,936,949
0 0 0 0 0 52,0670 0 0 0 0 1,3080 247,161 105,562 302,961 33,976 758,360
6,501 476,946 105,563 398,500 127,306 3,748,684
51 0 0 0 0 43,8104,616 0 0 0 0 20,959
0 0 0 0 0 15,2400 0 0 0 0 1,000,0000 139,773 85,562 147,944 33,976 458,468
4,667 139,773 85,562 147,944 33,976 1,538,477
149 0 0 0 0 83,757
1,685 337,173 20,001 250,556 93,330 2,126,450
1,834 337,173 20,001 250,556 93,330 2,210,207
$6,501 $476,946 $105,563 $398,500 $127,306 $3,748,684
81
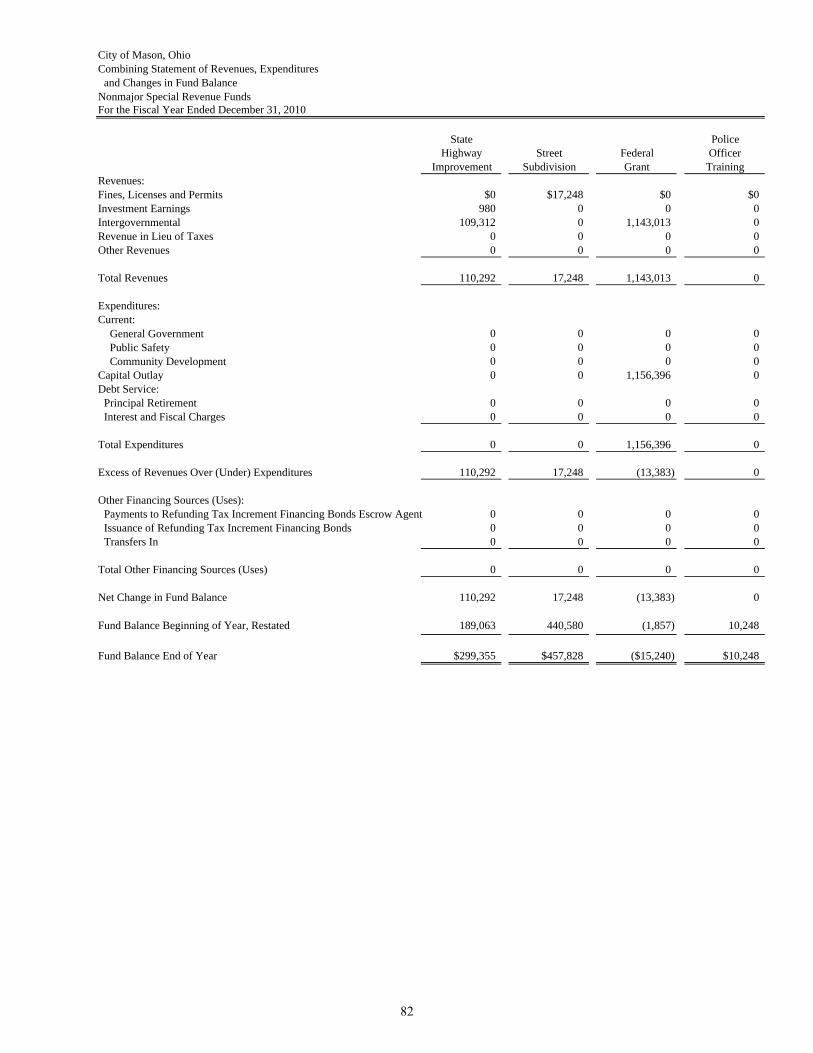
City of Mason, OhioCombining Statement of Revenues, Expenditures
and Changes in Fund BalanceNonmajor Special Revenue FundsFor the Fiscal Year Ended December 31, 2010
State PoliceHighway Street Federal Officer
Improvement Subdivision Grant TrainingRevenues:Fines, Licenses and Permits $0 $17,248 $0 $0Investment Earnings 980 0 0 0Intergovernmental 109,312 0 1,143,013 0Revenue in Lieu of Taxes 0 0 0 0Other Revenues 0 0 0 0
Total Revenues 110,292 17,248 1,143,013 0
Expenditures:Current:
General Government 0 0 0 0Public Safety 0 0 0 0Community Development 0 0 0 0
Capital Outlay 0 0 1,156,396 0Debt Service:
Principal Retirement 0 0 0 0Interest and Fiscal Charges 0 0 0 0
Total Expenditures 0 0 1,156,396 0
Excess of Revenues Over (Under) Expenditures 110,292 17,248 (13,383) 0
Other Financing Sources (Uses):Payments to Refunding Tax Increment Financing Bonds Escrow Agent 0 0 0 0Issuance of Refunding Tax Increment Financing Bonds 0 0 0 0Transfers In 0 0 0 0
Total Other Financing Sources (Uses) 0 0 0 0
Net Change in Fund Balance 110,292 17,248 (13,383) 0
Fund Balance Beginning of Year, Restated 189,063 440,580 (1,857) 10,248
Fund Balance End of Year $299,355 $457,828 ($15,240) $10,248
82
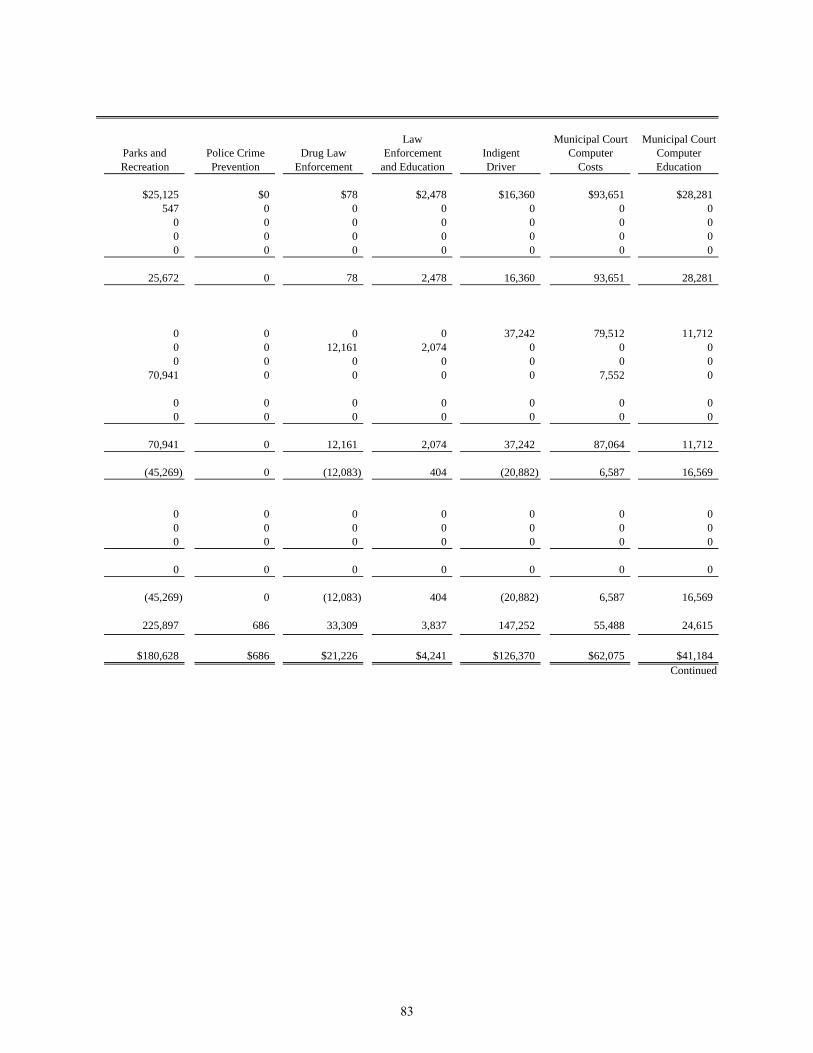
Law Municipal Court Municipal CourtParks and Police Crime Drug Law Enforcement Indigent Computer ComputerRecreation Prevention Enforcement and Education Driver Costs Education
$25,125 $0 $78 $2,478 $16,360 $93,651 $28,281547 0 0 0 0 0 0
0 0 0 0 0 0 00 0 0 0 0 0 00 0 0 0 0 0 0
25,672 0 78 2,478 16,360 93,651 28,281
0 0 0 0 37,242 79,512 11,7120 0 12,161 2,074 0 0 00 0 0 0 0 0 0
70,941 0 0 0 0 7,552 0
0 0 0 0 0 0 00 0 0 0 0 0 0
70,941 0 12,161 2,074 37,242 87,064 11,712
(45,269) 0 (12,083) 404 (20,882) 6,587 16,569
0 0 0 0 0 0 00 0 0 0 0 0 00 0 0 0 0 0 0
0 0 0 0 0 0 0
(45,269) 0 (12,083) 404 (20,882) 6,587 16,569
225,897 686 33,309 3,837 147,252 55,488 24,615
$180,628 $686 $21,226 $4,241 $126,370 $62,075 $41,184Continued
83
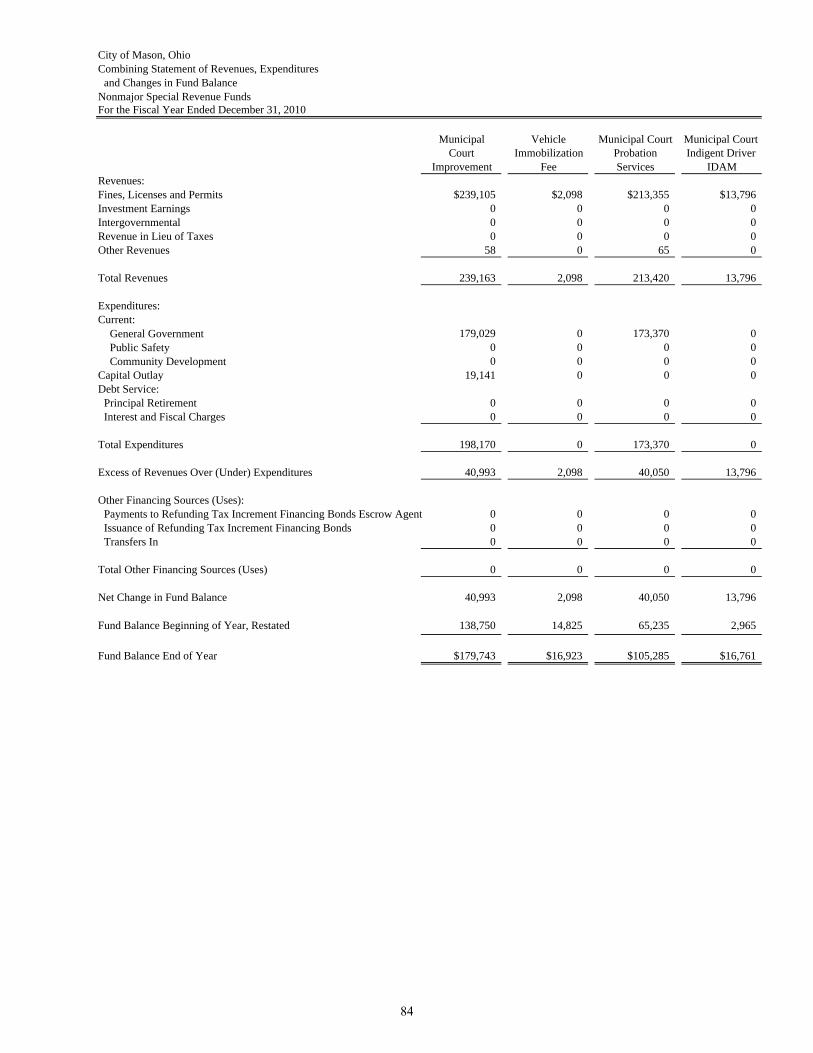
City of Mason, OhioCombining Statement of Revenues, Expenditures
and Changes in Fund BalanceNonmajor Special Revenue FundsFor the Fiscal Year Ended December 31, 2010
Municipal Vehicle Municipal Court Municipal Court Court Immobilization Probation Indigent Driver
Improvement Fee Services IDAMRevenues:Fines, Licenses and Permits $239,105 $2,098 $213,355 $13,796Investment Earnings 0 0 0 0Intergovernmental 0 0 0 0Revenue in Lieu of Taxes 0 0 0 0Other Revenues 58 0 65 0
Total Revenues 239,163 2,098 213,420 13,796
Expenditures:Current:
General Government 179,029 0 173,370 0Public Safety 0 0 0 0Community Development 0 0 0 0
Capital Outlay 19,141 0 0 0Debt Service:
Principal Retirement 0 0 0 0Interest and Fiscal Charges 0 0 0 0
Total Expenditures 198,170 0 173,370 0
Excess of Revenues Over (Under) Expenditures 40,993 2,098 40,050 13,796
Other Financing Sources (Uses):Payments to Refunding Tax Increment Financing Bonds Escrow Agent 0 0 0 0Issuance of Refunding Tax Increment Financing Bonds 0 0 0 0Transfers In 0 0 0 0
Total Other Financing Sources (Uses) 0 0 0 0
Net Change in Fund Balance 40,993 2,098 40,050 13,796
Fund Balance Beginning of Year, Restated 138,750 14,825 65,235 2,965
Fund Balance End of Year $179,743 $16,923 $105,285 $16,761
84
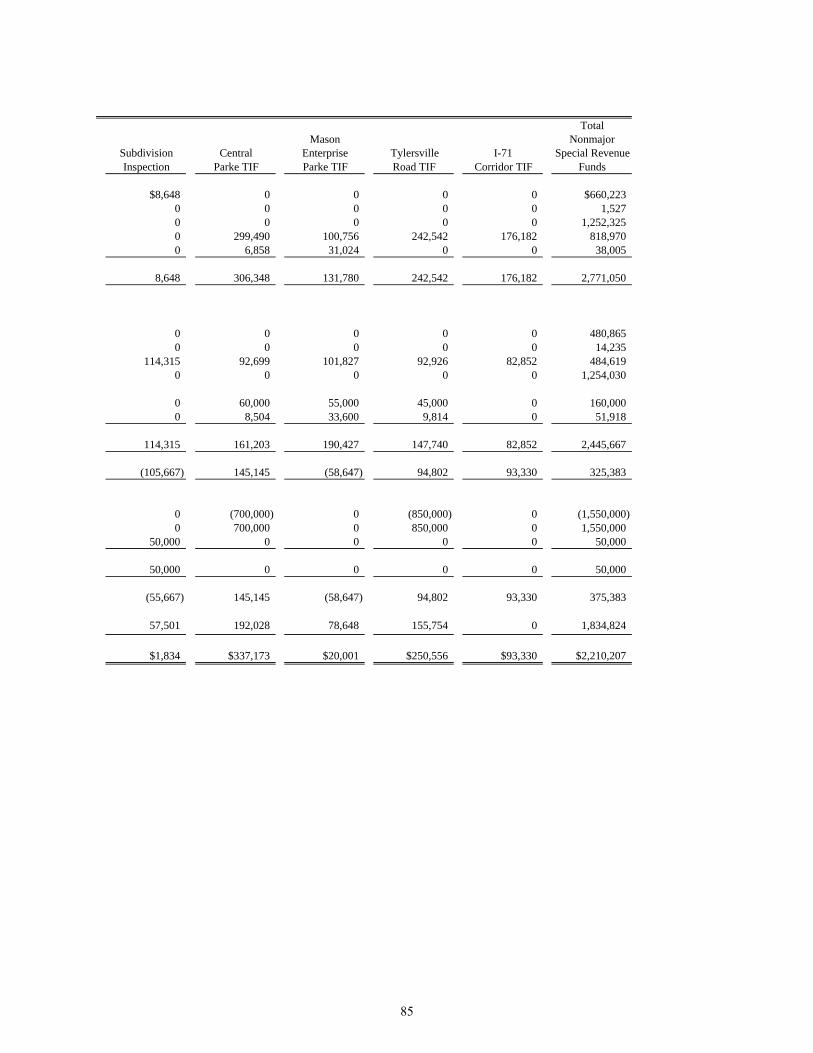
TotalMason Nonmajor
Subdivision Central Enterprise Tylersville I-71 Special RevenueInspection Parke TIF Parke TIF Road TIF Corridor TIF Funds
$8,648 0 0 0 0 $660,2230 0 0 0 0 1,5270 0 0 0 0 1,252,3250 299,490 100,756 242,542 176,182 818,9700 6,858 31,024 0 0 38,005
8,648 306,348 131,780 242,542 176,182 2,771,050
0 0 0 0 0 480,8650 0 0 0 0 14,235
114,315 92,699 101,827 92,926 82,852 484,6190 0 0 0 0 1,254,030
0 60,000 55,000 45,000 0 160,0000 8,504 33,600 9,814 0 51,918
114,315 161,203 190,427 147,740 82,852 2,445,667
(105,667) 145,145 (58,647) 94,802 93,330 325,383
0 (700,000) 0 (850,000) 0 (1,550,000)0 700,000 0 850,000 0 1,550,000
50,000 0 0 0 0 50,000
50,000 0 0 0 0 50,000
(55,667) 145,145 (58,647) 94,802 93,330 375,383
57,501 192,028 78,648 155,754 0 1,834,824
$1,834 $337,173 $20,001 $250,556 $93,330 $2,210,207
85

City of Mason, OhioSchedule of Revenues, Expenditures and Changes in Fund BalanceBudget and Actual (Non-GAAP Budgetary Basis)For the Fiscal Year Ended December 31, 2010
Final Variance fromBudget Actual Final Budget
Revenues:Intergovernmental $100,000 $109,077 $9,077Investment Earnings 0 1,077 1,077
Total Revenues 100,000 110,154 10,154
Expenditures:Current:Capital Outlay 54,100 39,100 15,000
Total Expenditures 54,100 39,100 15,000
Net Change in Fund Balance 45,900 71,054 25,154
Fund Balance Beginning of Year (includes prior year encumbrances appropriated) 170,946 170,946 0
Fund Balance End of Year $216,846 $242,000 $25,154
Fund
HighwayImprovement
State
86

City of Mason, OhioSchedule of Revenues, Expenditures and Changes in Fund BalanceBudget and Actual (Non-GAAP Budgetary Basis)For the Fiscal Year Ended December 31, 2010
Final Variance fromBudget Actual Final Budget
Revenues:Fines, Licenses and Permits $10,000 $18,600 $8,600
Total Revenues 10,000 18,600 8,600
Expenditures:Current:
Transportation and Street Repair 0 0 0
Total Expenditures 0 0 0
Excess of Revenues Over (Under) Expenditures 10,000 18,600 8,600
Other Financing Sources (Uses):Transfers (Out) (438,000) 0 438,000
Total Other Financing Sources (Uses) (438,000) 0 438,000
Net Change in Fund Balance (428,000) 18,600 446,600
Fund Balance Beginning of Year (includes prior year encumbrances appropriated) 439,228 439,228 0
Fund Balance End of Year $11,228 $457,828 $446,600
Fund
StreetSubdivision
87
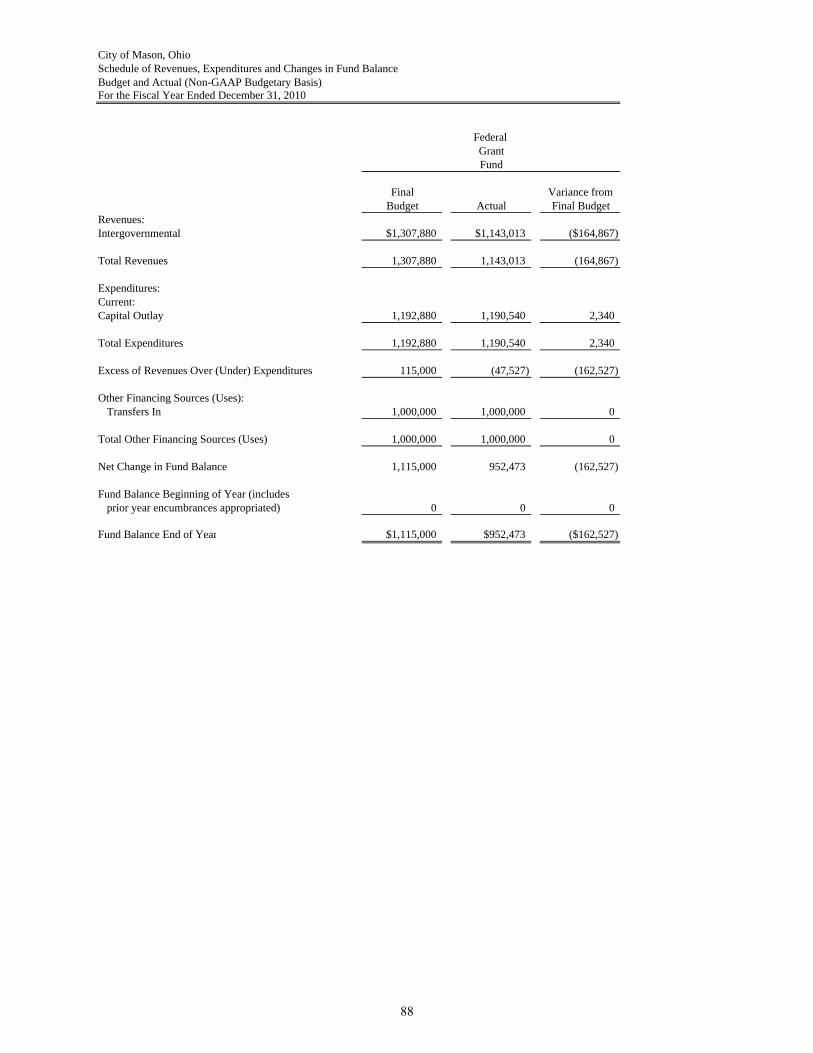
City of Mason, OhioSchedule of Revenues, Expenditures and Changes in Fund BalanceBudget and Actual (Non-GAAP Budgetary Basis)For the Fiscal Year Ended December 31, 2010
Final Variance fromBudget Actual Final Budget
Revenues:Intergovernmental $1,307,880 $1,143,013 ($164,867)
Total Revenues 1,307,880 1,143,013 (164,867)
Expenditures:Current:Capital Outlay 1,192,880 1,190,540 2,340
Total Expenditures 1,192,880 1,190,540 2,340
Excess of Revenues Over (Under) Expenditures 115,000 (47,527) (162,527)
Other Financing Sources (Uses):Transfers In 1,000,000 1,000,000 0
Total Other Financing Sources (Uses) 1,000,000 1,000,000 0
Net Change in Fund Balance 1,115,000 952,473 (162,527)
Fund Balance Beginning of Year (includes prior year encumbrances appropriated) 0 0 0
Fund Balance End of Year $1,115,000 $952,473 ($162,527)
Fund
Federal Grant
88

City of Mason, OhioSchedule of Revenues, Expenditures and Changes in Fund BalanceBudget and Actual (Non-GAAP Budgetary Basis)For the Fiscal Year Ended December 31, 2010
Final Variance fromBudget Actual Final Budget
Revenues:Intergovernmental $0 $0 $0
Total Revenues 0 0 0
Expenditures:Current:
Public Safety 9,428 0 9,428
Total Expenditures 9,428 0 9,428
Net Change in Fund Balance (9,428) 0 9,428
Fund Balance Beginning of Year (includes prior year encumbrances appropriated) 10,248 10,248 0
Fund Balance End of Year $820 $10,248 $9,428
Fund
OfficerTraining
Police
89
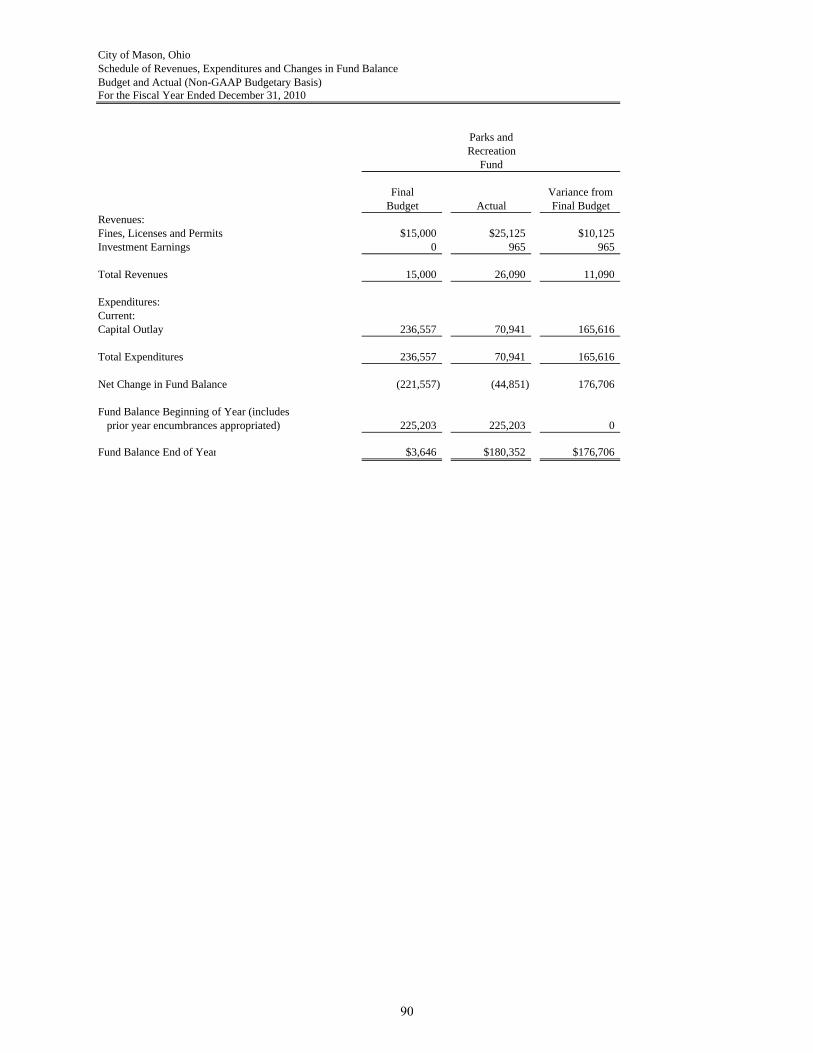
City of Mason, OhioSchedule of Revenues, Expenditures and Changes in Fund BalanceBudget and Actual (Non-GAAP Budgetary Basis)For the Fiscal Year Ended December 31, 2010
Final Variance fromBudget Actual Final Budget
Revenues:Fines, Licenses and Permits $15,000 $25,125 $10,125Investment Earnings 0 965 965
Total Revenues 15,000 26,090 11,090
Expenditures:Current:Capital Outlay 236,557 70,941 165,616
Total Expenditures 236,557 70,941 165,616
Net Change in Fund Balance (221,557) (44,851) 176,706
Fund Balance Beginning of Year (includes prior year encumbrances appropriated) 225,203 225,203 0
Fund Balance End of Year $3,646 $180,352 $176,706
Fund
Parks andRecreation
90
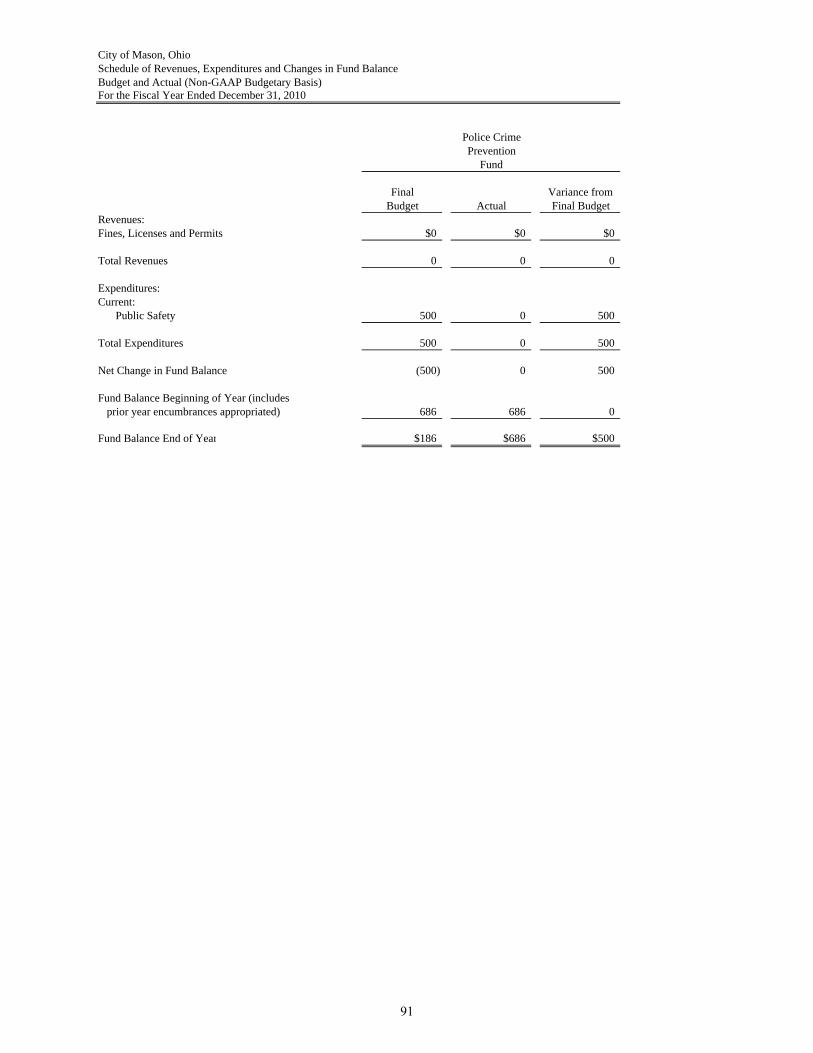
City of Mason, OhioSchedule of Revenues, Expenditures and Changes in Fund BalanceBudget and Actual (Non-GAAP Budgetary Basis)For the Fiscal Year Ended December 31, 2010
Final Variance fromBudget Actual Final Budget
Revenues:Fines, Licenses and Permits $0 $0 $0
Total Revenues 0 0 0
Expenditures:Current:
Public Safety 500 0 500
Total Expenditures 500 0 500
Net Change in Fund Balance (500) 0 500
Fund Balance Beginning of Year (includes prior year encumbrances appropriated) 686 686 0
Fund Balance End of Year $186 $686 $500
Fund
Police CrimePrevention
91

City of Mason, OhioSchedule of Revenues, Expenditures and Changes in Fund BalanceBudget and Actual (Non-GAAP Budgetary Basis)For the Fiscal Year Ended December 31, 2010
Final Variance fromBudget Actual Final Budget
Revenues:Fines, Licenses and Permits $0 $0 $0
Total Revenues 0 0 0
Expenditures:Current:
Public Safety 12,000 12,161 (161)
Total Expenditures 12,000 12,161 (161)
Net Change in Fund Balance (12,000) (12,161) (161)
Fund Balance Beginning of Year (includes prior year encumbrances appropriated) 33,209 33,209 0
Fund Balance End of Year $21,209 $21,048 ($161)
Fund
Drug Law Enforcement
92

City of Mason, OhioSchedule of Revenues, Expenditures and Changes in Fund BalanceBudget and Actual (Non-GAAP Budgetary Basis)For the Fiscal Year Ended December 31, 2010
Final Variance fromBudget Actual Final Budget
Revenues:Fines, Licenses and Permits $500 $2,382 $1,882
Total Revenues 500 2,382 1,882
Expenditures:Current:
Public Safety 3,500 2,074 1,426
Total Expenditures 3,500 2,074 1,426
Net Change in Fund Balance (3,000) 308 3,308
Fund Balance Beginning of Year (includes prior year encumbrances appropriated) 3,712 3,712 0
Fund Balance End of Year $712 $4,020 $3,308
Fund
Enforcementand Education
Law
93

City of Mason, OhioSchedule of Revenues, Expenditures and Changes in Fund BalanceBudget and Actual (Non-GAAP Budgetary Basis)For the Fiscal Year Ended December 31, 2010
Final Variance fromBudget Actual Final Budget
Revenues:Fines, Licenses and Permits $10,000 $16,306 $6,306
Total Revenues 10,000 16,306 6,306
Expenditures:Current:
General Government 135,870 36,710 99,160
Total Expenditures 135,870 36,710 99,160
Net Change in Fund Balance (125,870) (20,404) 105,466
Fund Balance Beginning of Year (includes prior year encumbrances appropriated) 149,259 149,259 0
Fund Balance End of Year $23,389 $128,855 $105,466
Fund
IndigentDriver
94

City of Mason, OhioSchedule of Revenues, Expenditures and Changes in Fund BalanceBudget and Actual (Non-GAAP Budgetary Basis)For the Fiscal Year Ended December 31, 2010
Final Variance fromBudget Actual Final Budget
Revenues:Fines, Licenses and Permits $80,000 $90,881 $10,881
Total Revenues 80,000 90,881 10,881
Expenditures:Current:
General Government 75,552 69,901 5,651Capital Outlay 28,350 27,600 750
Total Expenditures 103,902 97,501 6,401
Net Change in Fund Balance (23,902) (6,620) 17,282
Fund Balance Beginning of Year (includes prior year encumbrances appropriated) 50,908 50,908 0
Fund Balance End of Year $27,006 $44,288 $17,282
Fund
Municipal
ComputerCosts
Court
95
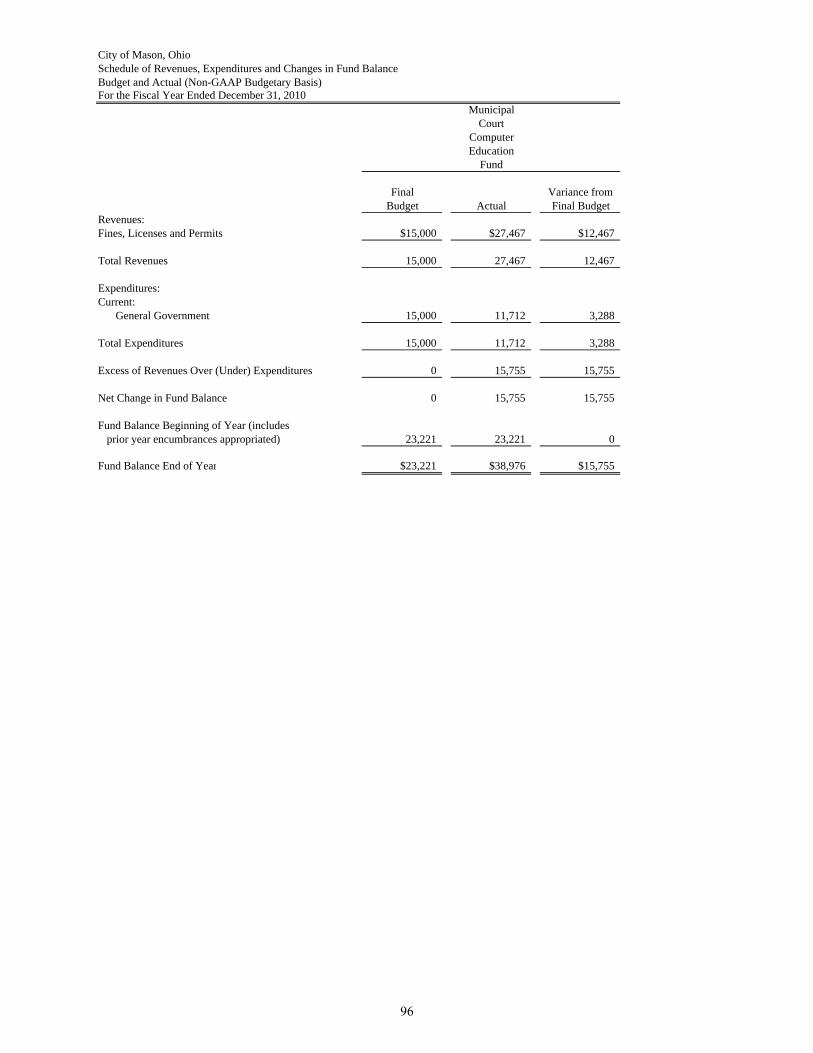
City of Mason, OhioSchedule of Revenues, Expenditures and Changes in Fund BalanceBudget and Actual (Non-GAAP Budgetary Basis)For the Fiscal Year Ended December 31, 2010
Final Variance fromBudget Actual Final Budget
Revenues:Fines, Licenses and Permits $15,000 $27,467 $12,467
Total Revenues 15,000 27,467 12,467
Expenditures:Current:
General Government 15,000 11,712 3,288
Total Expenditures 15,000 11,712 3,288
Excess of Revenues Over (Under) Expenditures 0 15,755 15,755
Net Change in Fund Balance 0 15,755 15,755
Fund Balance Beginning of Year (includes prior year encumbrances appropriated) 23,221 23,221 0
Fund Balance End of Year $23,221 $38,976 $15,755
Fund
Municipal
ComputerEducation
Court
96

City of Mason, OhioSchedule of Revenues, Expenditures and Changes in Fund BalanceBudget and Actual (Non-GAAP Budgetary Basis)For the Fiscal Year Ended December 31, 2010
Final Variance fromBudget Actual Final Budget
Revenues:Fines, Licenses and Permits $180,000 $239,874 $59,874
Total Revenues 180,000 239,874 59,874
Expenditures:Current:
General Government 192,886 180,928 11,958Capital Outlay 19,141 19,141 0
Total Expenditures 212,027 200,069 11,958
Net Change in Fund Balance (32,027) 39,805 71,832
Fund Balance Beginning of Year (includes prior year encumbrances appropriated) 128,243 128,243 0
Fund Balance End of Year $96,216 $168,048 $71,832
Fund
CourtImprovement
Municipal
97
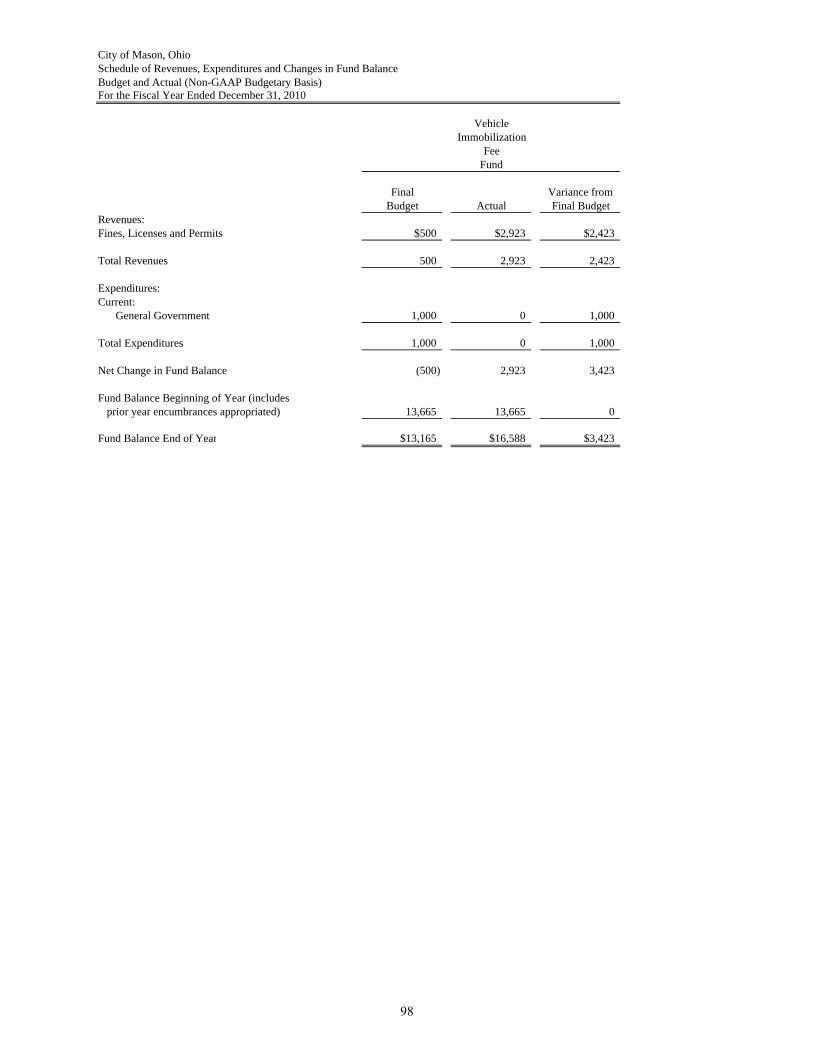
City of Mason, OhioSchedule of Revenues, Expenditures and Changes in Fund BalanceBudget and Actual (Non-GAAP Budgetary Basis)For the Fiscal Year Ended December 31, 2010
Final Variance fromBudget Actual Final Budget
Revenues:Fines, Licenses and Permits $500 $2,923 $2,423
Total Revenues 500 2,923 2,423
Expenditures:Current:
General Government 1,000 0 1,000
Total Expenditures 1,000 0 1,000
Net Change in Fund Balance (500) 2,923 3,423
Fund Balance Beginning of Year (includes prior year encumbrances appropriated) 13,665 13,665 0
Fund Balance End of Year $13,165 $16,588 $3,423
Fund
ImmobilizationFee
Vehicle
98

City of Mason, OhioSchedule of Revenues, Expenditures and Changes in Fund BalanceBudget and Actual (Non-GAAP Budgetary Basis)For the Fiscal Year Ended December 31, 2010
Final Variance fromBudget Actual Final Budget
Revenues:Fines, Licenses and Permits $220,000 $214,073 ($5,927)
Total Revenues 220,000 214,073 (5,927)
Expenditures:Current:
General Government 236,338 175,632 60,706
Total Expenditures 236,338 175,632 60,706
Net Change in Fund Balance (16,338) 38,441 54,779
Fund Balance Beginning of Year (includes prior year encumbrances appropriated) 58,190 58,190 0
Fund Balance End of Year $41,852 $96,631 $54,779
Fund
MunicipalCourt
ProbationServices
99

City of Mason, OhioSchedule of Revenues, Expenditures and Changes in Fund BalanceBudget and Actual (Non-GAAP Budgetary Basis)For the Fiscal Year Ended December 31, 2010
Final Variance fromBudget Actual Final Budget
Revenues:Fines, Licenses and Permits $1,000 $7,767 $6,767
Total Revenues 1,000 7,767 6,767
Expenditures:Current:
General Government 2,000 0 2,000
Total Expenditures 2,000 0 2,000
Net Change in Fund Balance (1,000) 7,767 8,767
Fund Balance Beginning of Year (includes prior year encumbrances appropriated) 2,665 2,665 0
Fund Balance End of Year $1,665 $10,432 $8,767
Fund
Indigent Driver IDAM
Municipal Court
100
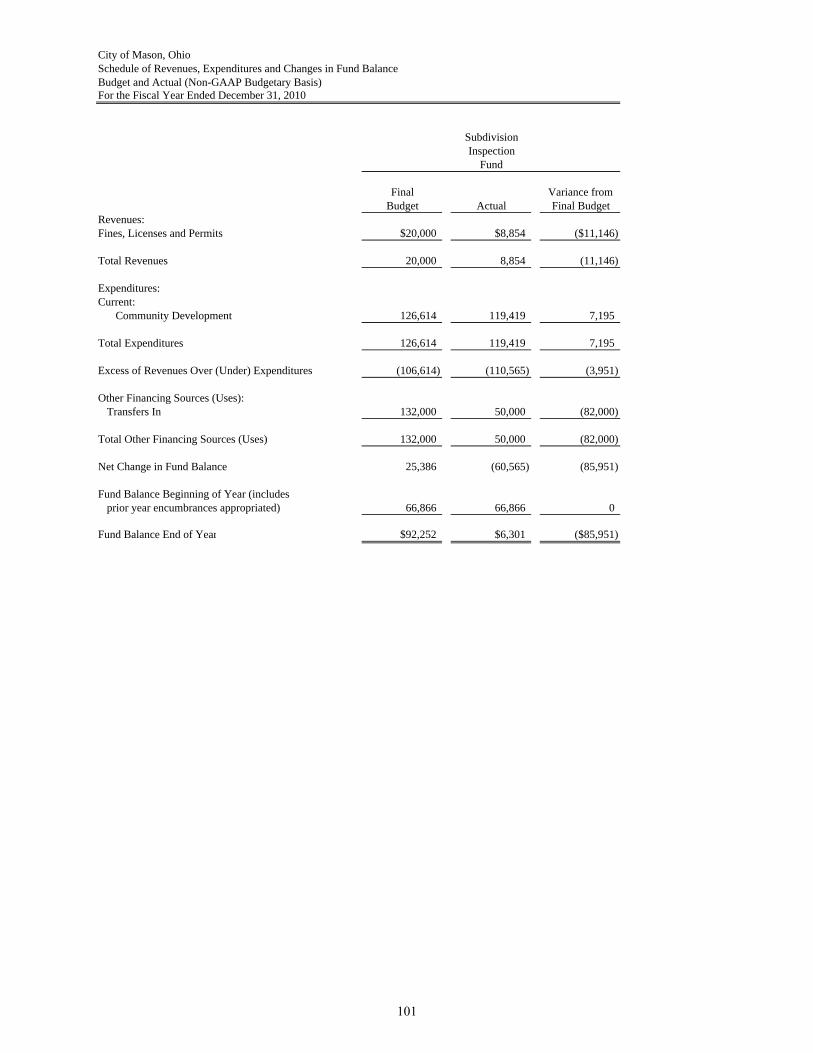
City of Mason, OhioSchedule of Revenues, Expenditures and Changes in Fund BalanceBudget and Actual (Non-GAAP Budgetary Basis)For the Fiscal Year Ended December 31, 2010
Final Variance fromBudget Actual Final Budget
Revenues:Fines, Licenses and Permits $20,000 $8,854 ($11,146)
Total Revenues 20,000 8,854 (11,146)
Expenditures:Current:
Community Development 126,614 119,419 7,195
Total Expenditures 126,614 119,419 7,195
Excess of Revenues Over (Under) Expenditures (106,614) (110,565) (3,951)
Other Financing Sources (Uses):Transfers In 132,000 50,000 (82,000)
Total Other Financing Sources (Uses) 132,000 50,000 (82,000)
Net Change in Fund Balance 25,386 (60,565) (85,951)
Fund Balance Beginning of Year (includes prior year encumbrances appropriated) 66,866 66,866 0
Fund Balance End of Year $92,252 $6,301 ($85,951)
Fund
SubdivisionInspection
101
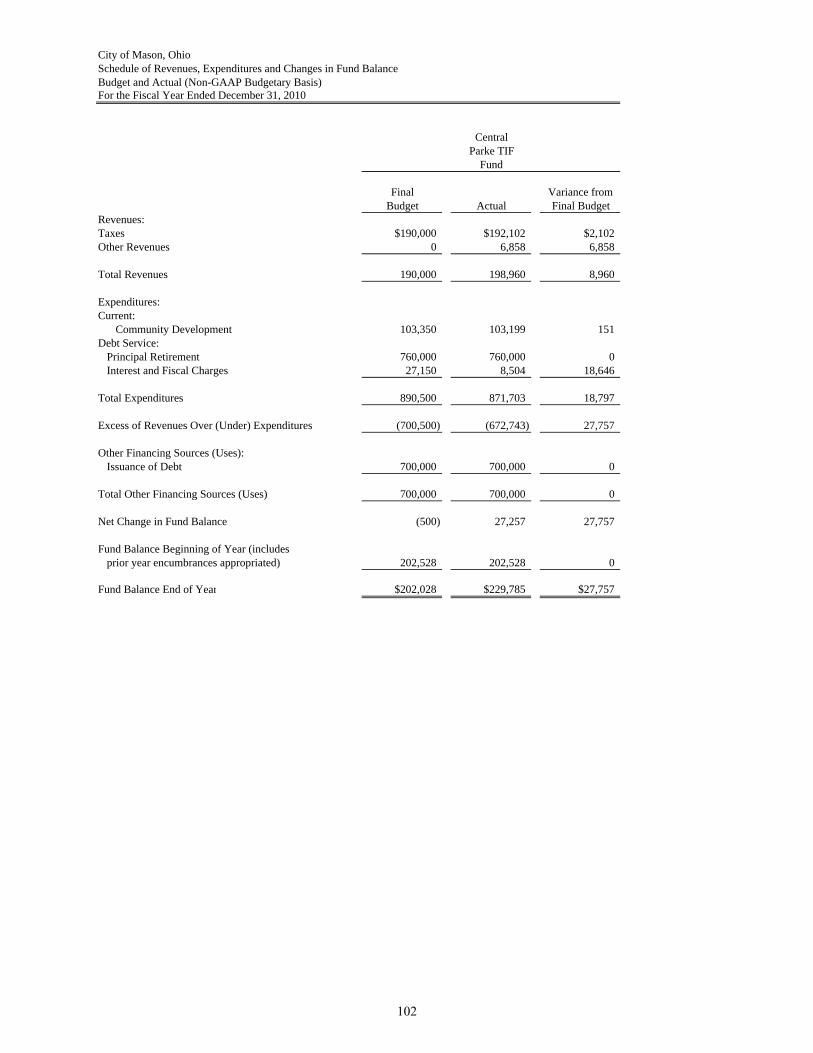
City of Mason, OhioSchedule of Revenues, Expenditures and Changes in Fund BalanceBudget and Actual (Non-GAAP Budgetary Basis)For the Fiscal Year Ended December 31, 2010
Final Variance fromBudget Actual Final Budget
Revenues:Taxes $190,000 $192,102 $2,102Other Revenues 0 6,858 6,858
Total Revenues 190,000 198,960 8,960
Expenditures:Current:
Community Development 103,350 103,199 151Debt Service:
Principal Retirement 760,000 760,000 0Interest and Fiscal Charges 27,150 8,504 18,646
Total Expenditures 890,500 871,703 18,797
Excess of Revenues Over (Under) Expenditures (700,500) (672,743) 27,757
Other Financing Sources (Uses):Issuance of Debt 700,000 700,000 0
Total Other Financing Sources (Uses) 700,000 700,000 0
Net Change in Fund Balance (500) 27,257 27,757
Fund Balance Beginning of Year (includes prior year encumbrances appropriated) 202,528 202,528 0
Fund Balance End of Year $202,028 $229,785 $27,757
Fund
CentralParke TIF
102
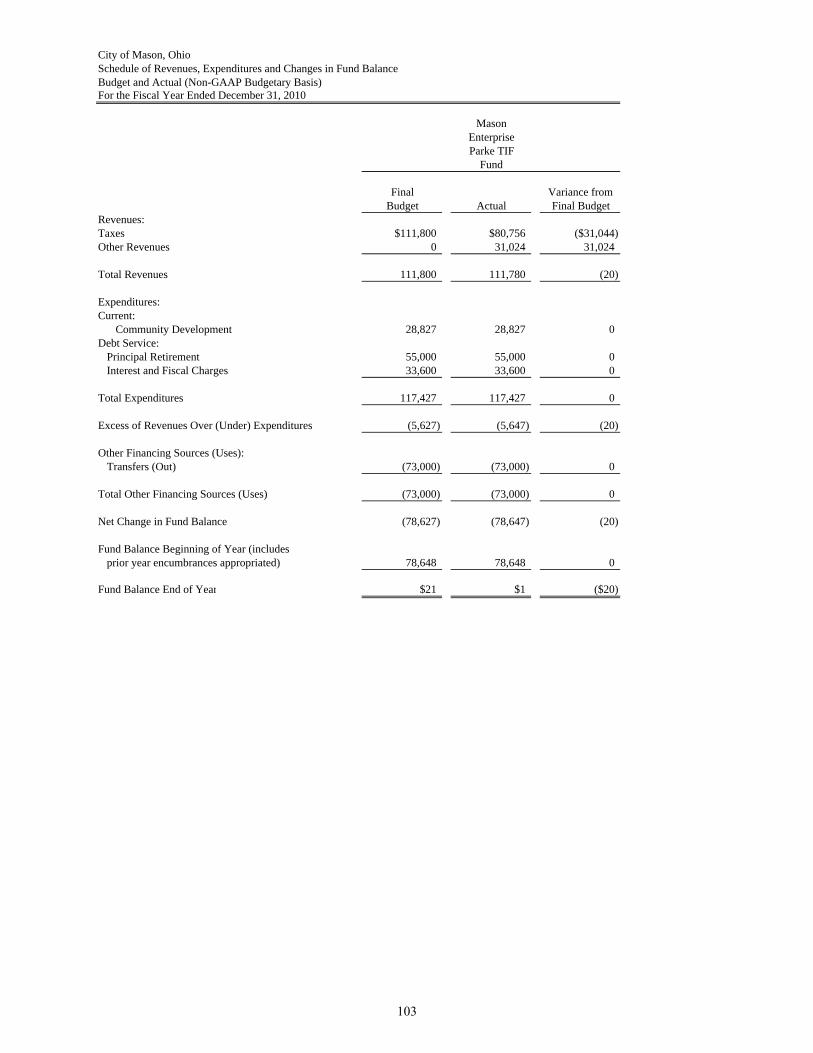
City of Mason, OhioSchedule of Revenues, Expenditures and Changes in Fund BalanceBudget and Actual (Non-GAAP Budgetary Basis)For the Fiscal Year Ended December 31, 2010
Final Variance fromBudget Actual Final Budget
Revenues:Taxes $111,800 $80,756 ($31,044)Other Revenues 0 31,024 31,024
Total Revenues 111,800 111,780 (20)
Expenditures:Current:
Community Development 28,827 28,827 0Debt Service:
Principal Retirement 55,000 55,000 0Interest and Fiscal Charges 33,600 33,600 0
Total Expenditures 117,427 117,427 0
Excess of Revenues Over (Under) Expenditures (5,627) (5,647) (20)
Other Financing Sources (Uses):Transfers (Out) (73,000) (73,000) 0
Total Other Financing Sources (Uses) (73,000) (73,000) 0
Net Change in Fund Balance (78,627) (78,647) (20)
Fund Balance Beginning of Year (includes prior year encumbrances appropriated) 78,648 78,648 0
Fund Balance End of Year $21 $1 ($20)
Fund
MasonEnterpriseParke TIF
103
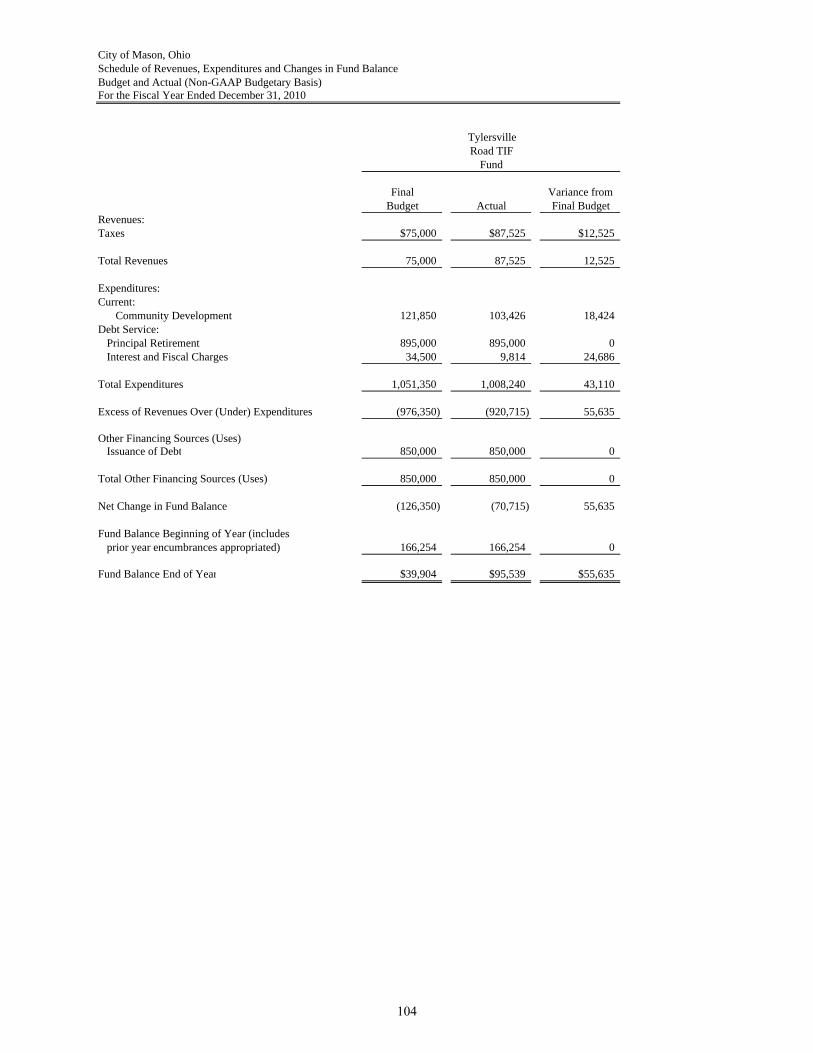
City of Mason, OhioSchedule of Revenues, Expenditures and Changes in Fund BalanceBudget and Actual (Non-GAAP Budgetary Basis)For the Fiscal Year Ended December 31, 2010
Final Variance fromBudget Actual Final Budget
Revenues:Taxes $75,000 $87,525 $12,525
Total Revenues 75,000 87,525 12,525
Expenditures:Current:
Community Development 121,850 103,426 18,424Debt Service:
Principal Retirement 895,000 895,000 0Interest and Fiscal Charges 34,500 9,814 24,686
Total Expenditures 1,051,350 1,008,240 43,110
Excess of Revenues Over (Under) Expenditures (976,350) (920,715) 55,635
Other Financing Sources (Uses):Issuance of Debt 850,000 850,000 0
Total Other Financing Sources (Uses) 850,000 850,000 0
Net Change in Fund Balance (126,350) (70,715) 55,635
Fund Balance Beginning of Year (includes prior year encumbrances appropriated) 166,254 166,254 0
Fund Balance End of Year $39,904 $95,539 $55,635
Fund
TylersvilleRoad TIF
104
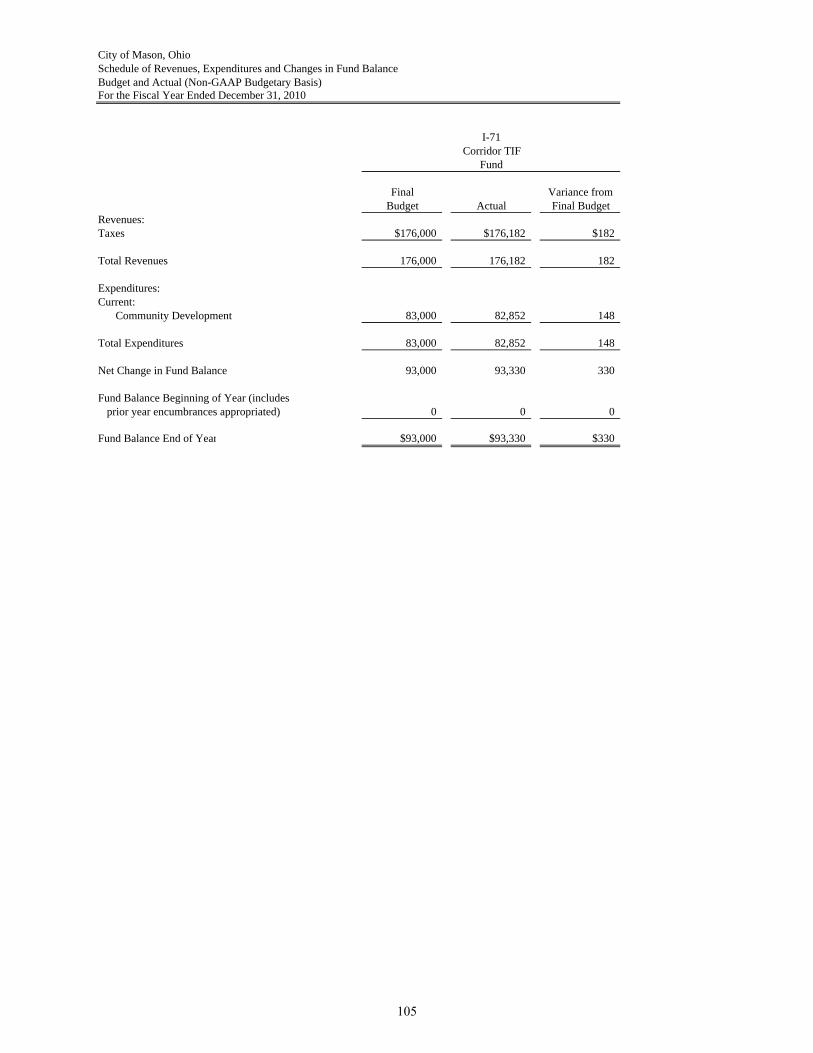
City of Mason, OhioSchedule of Revenues, Expenditures and Changes in Fund BalanceBudget and Actual (Non-GAAP Budgetary Basis)For the Fiscal Year Ended December 31, 2010
Final Variance fromBudget Actual Final Budget
Revenues:Taxes $176,000 $176,182 $182
Total Revenues 176,000 176,182 182
Expenditures:Current:
Community Development 83,000 82,852 148
Total Expenditures 83,000 82,852 148
Net Change in Fund Balance 93,000 93,330 330
Fund Balance Beginning of Year (includes prior year encumbrances appropriated) 0 0 0
Fund Balance End of Year $93,000 $93,330 $330
FundCorridor TIF
I-71
105

THIS PAGE INTENTIONALLY LEFT BLANK
106
NONMAJOR DEBT SERVICE FUNDS Fund Descriptions General Obligation Bond Retirement: To accumulate monies for the payment of long–term and short–term debt issued without a vote of the people. Special Assessment Bond Retirement: To account for payment of bonds issued for improvements deemed to benefit specific properties against which assessments are levied. Tax Increment Financing Bond Retirement: This fund is used to account for the financial resources and expenditures (debt principal and interest payments) related to the development of 42 North Commerce Parke. Government Center Bond Retirement: This fund is used to account for the financial resources and expenditures (debt principal and interest payments) related to the construction of the Mason Municipal Center.
107
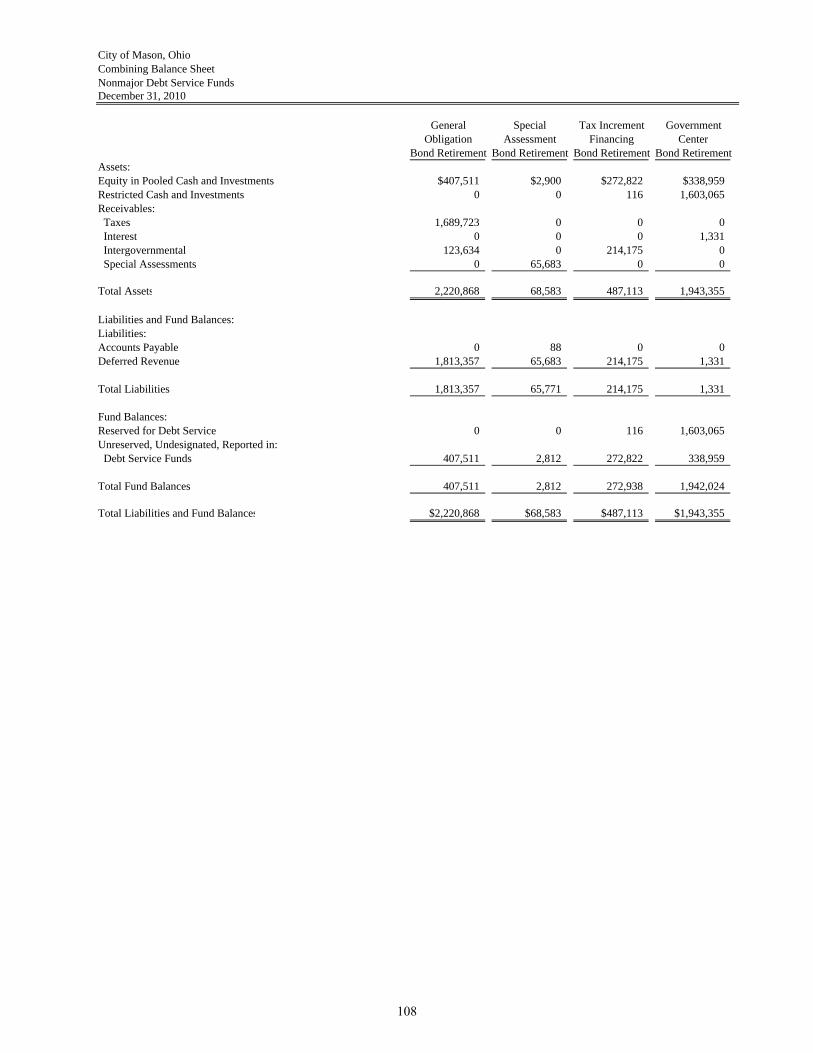
City of Mason, OhioCombining Balance SheetNonmajor Debt Service FundsDecember 31, 2010
General Special Tax Increment GovernmentObligation Assessment Financing Center
Bond Retirement Bond Retirement Bond Retirement Bond RetirementAssets:Equity in Pooled Cash and Investments $407,511 $2,900 $272,822 $338,959Restricted Cash and Investments 0 0 116 1,603,065Receivables: Taxes 1,689,723 0 0 0 Interest 0 0 0 1,331 Intergovernmental 123,634 0 214,175 0 Special Assessments 0 65,683 0 0
Total Assets 2,220,868 68,583 487,113 1,943,355
Liabilities and Fund Balances:Liabilities:Accounts Payable 0 88 0 0Deferred Revenue 1,813,357 65,683 214,175 1,331
Total Liabilities 1,813,357 65,771 214,175 1,331
Fund Balances:Reserved for Debt Service 0 0 116 1,603,065Unreserved, Undesignated, Reported in: Debt Service Funds 407,511 2,812 272,822 338,959
Total Fund Balances 407,511 2,812 272,938 1,942,024
Total Liabilities and Fund Balances $2,220,868 $68,583 $487,113 $1,943,355
108
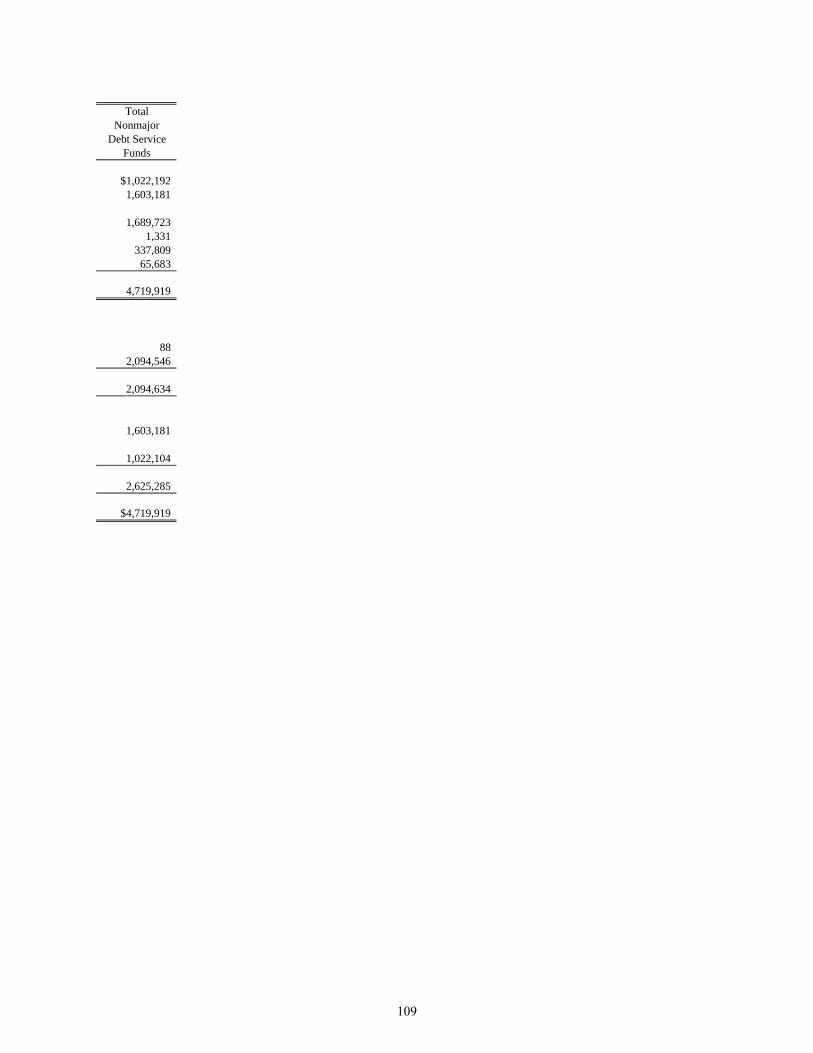
TotalNonmajor
Debt ServiceFunds
$1,022,1921,603,181
1,689,7231,331
337,80965,683
4,719,919
882,094,546
2,094,634
1,603,181
1,022,104
2,625,285
$4,719,919
109
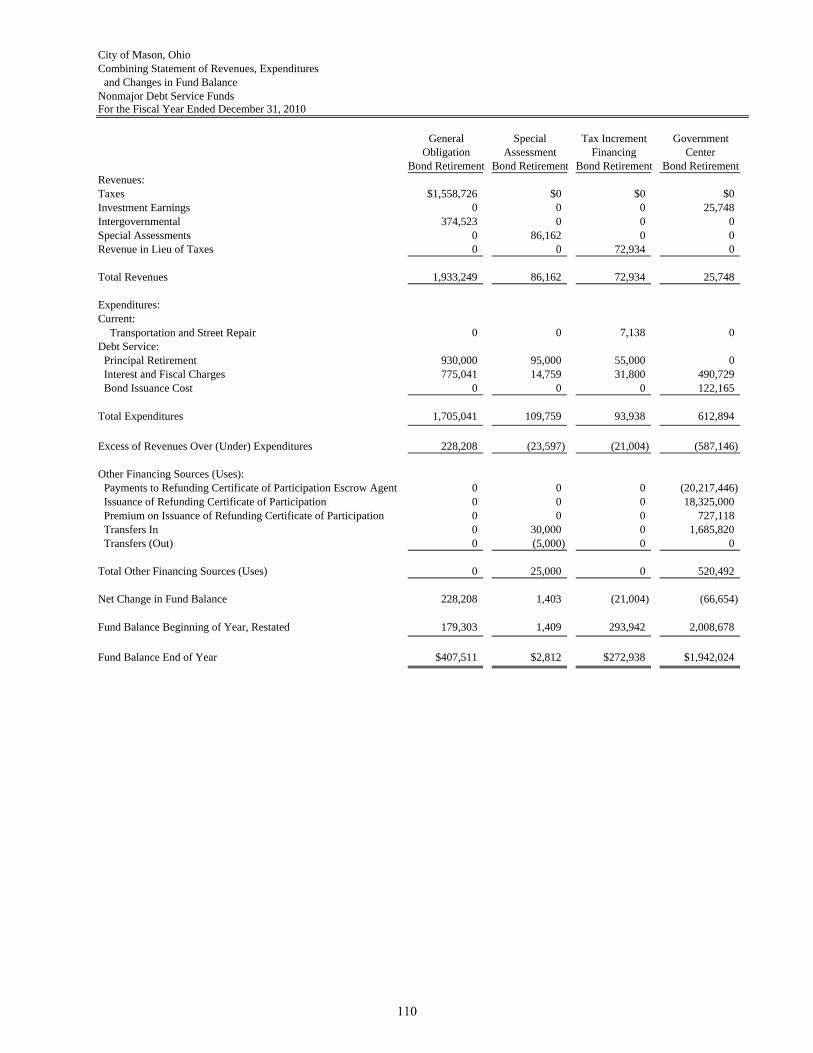
City of Mason, OhioCombining Statement of Revenues, Expenditures
and Changes in Fund BalanceNonmajor Debt Service FundsFor the Fiscal Year Ended December 31, 2010
General Special Tax Increment GovernmentObligation Assessment Financing Center
Bond Retirement Bond Retirement Bond Retirement Bond RetirementRevenues:Taxes $1,558,726 $0 $0 $0Investment Earnings 0 0 0 25,748Intergovernmental 374,523 0 0 0Special Assessments 0 86,162 0 0Revenue in Lieu of Taxes 0 0 72,934 0
Total Revenues 1,933,249 86,162 72,934 25,748
Expenditures:Current:
Transportation and Street Repair 0 0 7,138 0Debt Service:
Principal Retirement 930,000 95,000 55,000 0Interest and Fiscal Charges 775,041 14,759 31,800 490,729Bond Issuance Cost 0 0 0 122,165
Total Expenditures 1,705,041 109,759 93,938 612,894
Excess of Revenues Over (Under) Expenditures 228,208 (23,597) (21,004) (587,146)
Other Financing Sources (Uses):Payments to Refunding Certificate of Participation Escrow Agent 0 0 0 (20,217,446)Issuance of Refunding Certificate of Participation 0 0 0 18,325,000Premium on Issuance of Refunding Certificate of Participation 0 0 0 727,118Transfers In 0 30,000 0 1,685,820Transfers (Out) 0 (5,000) 0 0
Total Other Financing Sources (Uses) 0 25,000 0 520,492
Net Change in Fund Balance 228,208 1,403 (21,004) (66,654)
Fund Balance Beginning of Year, Restated 179,303 1,409 293,942 2,008,678
Fund Balance End of Year $407,511 $2,812 $272,938 $1,942,024
110
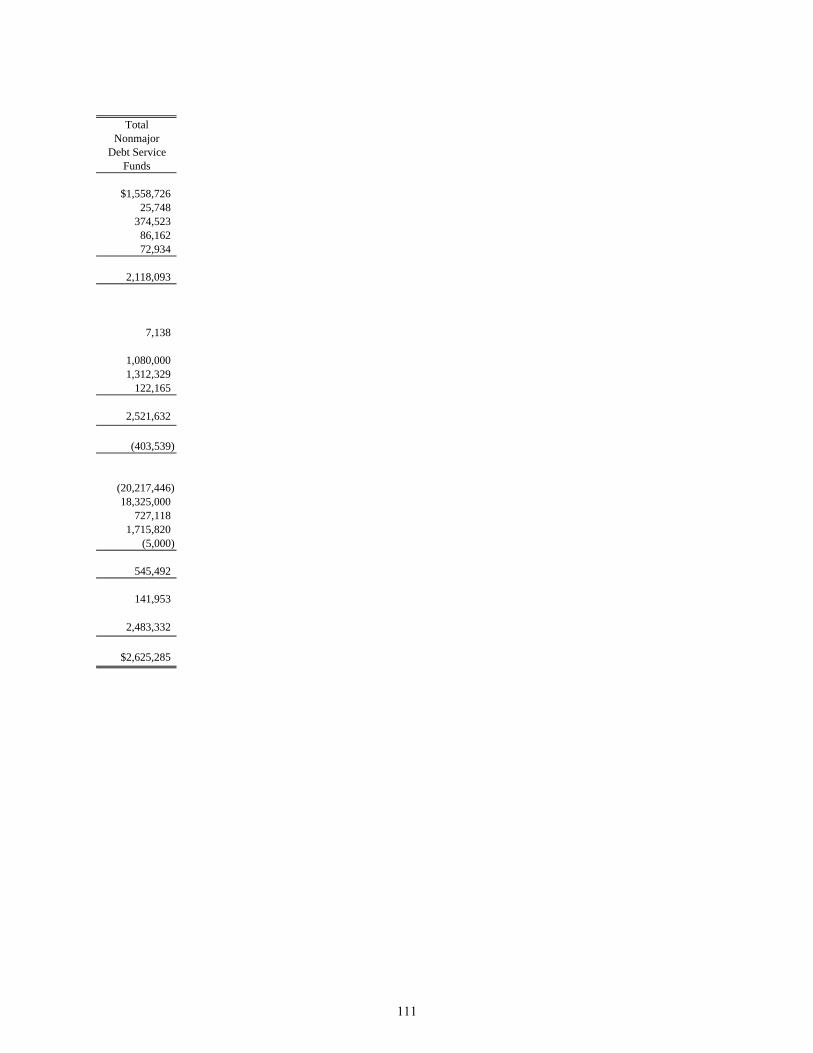
TotalNonmajor
Debt ServiceFunds
$1,558,72625,748
374,52386,16272,934
2,118,093
7,138
1,080,0001,312,329
122,165
2,521,632
(403,539)
(20,217,446)18,325,000
727,1181,715,820
(5,000)
545,492
141,953
2,483,332
$2,625,285
111
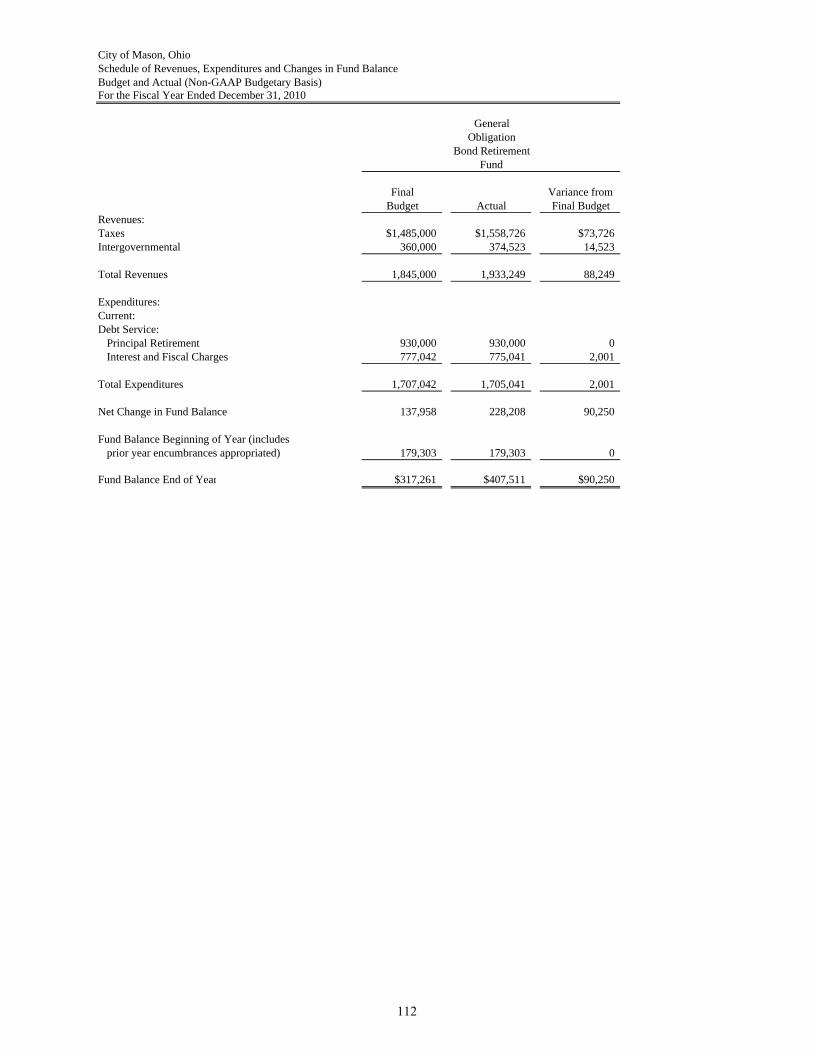
City of Mason, OhioSchedule of Revenues, Expenditures and Changes in Fund BalanceBudget and Actual (Non-GAAP Budgetary Basis)For the Fiscal Year Ended December 31, 2010
Final Variance fromBudget Actual Final Budget
Revenues:Taxes $1,485,000 $1,558,726 $73,726Intergovernmental 360,000 374,523 14,523
Total Revenues 1,845,000 1,933,249 88,249
Expenditures:Current:Debt Service:
Principal Retirement 930,000 930,000 0Interest and Fiscal Charges 777,042 775,041 2,001
Total Expenditures 1,707,042 1,705,041 2,001
Net Change in Fund Balance 137,958 228,208 90,250
Fund Balance Beginning of Year (includes prior year encumbrances appropriated) 179,303 179,303 0
Fund Balance End of Year $317,261 $407,511 $90,250
Fund
ObligationGeneral
Bond Retirement
112
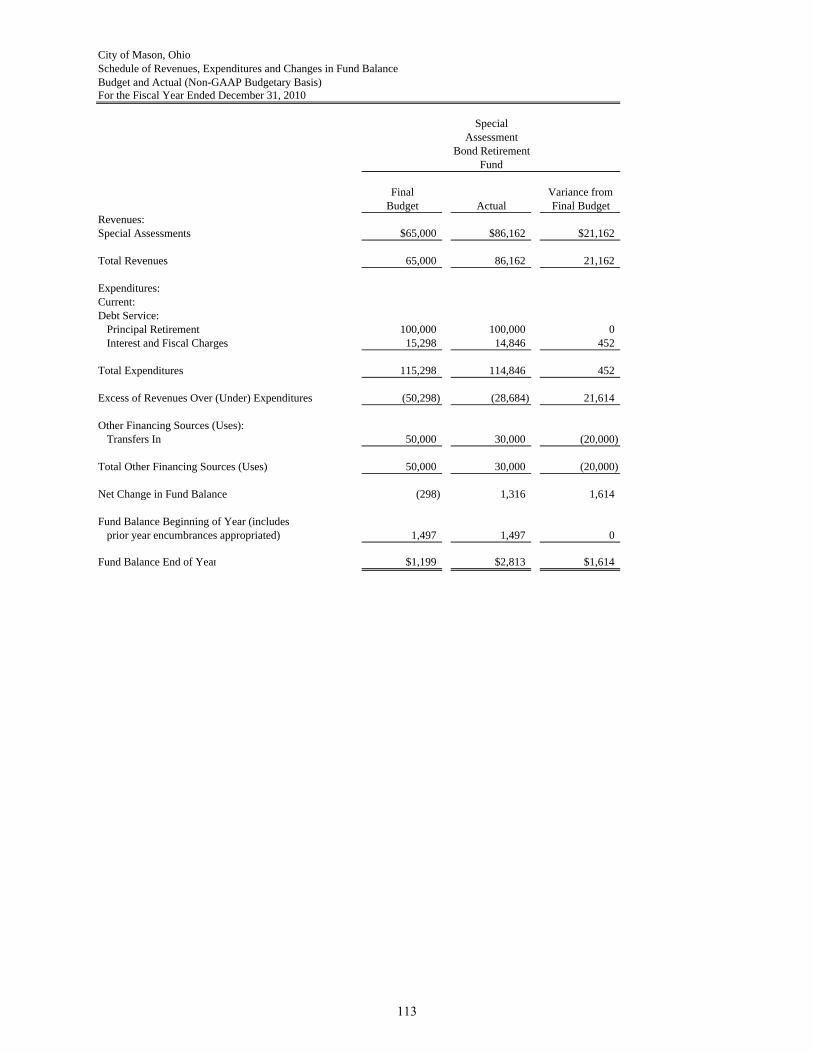
City of Mason, OhioSchedule of Revenues, Expenditures and Changes in Fund BalanceBudget and Actual (Non-GAAP Budgetary Basis)For the Fiscal Year Ended December 31, 2010
Final Variance fromBudget Actual Final Budget
Revenues:Special Assessments $65,000 $86,162 $21,162
Total Revenues 65,000 86,162 21,162
Expenditures:Current:Debt Service:
Principal Retirement 100,000 100,000 0Interest and Fiscal Charges 15,298 14,846 452
Total Expenditures 115,298 114,846 452
Excess of Revenues Over (Under) Expenditures (50,298) (28,684) 21,614
Other Financing Sources (Uses):Transfers In 50,000 30,000 (20,000)
Total Other Financing Sources (Uses) 50,000 30,000 (20,000)
Net Change in Fund Balance (298) 1,316 1,614
Fund Balance Beginning of Year (includes prior year encumbrances appropriated) 1,497 1,497 0
Fund Balance End of Year $1,199 $2,813 $1,614
Fund
SpecialAssessment
Bond Retirement
113
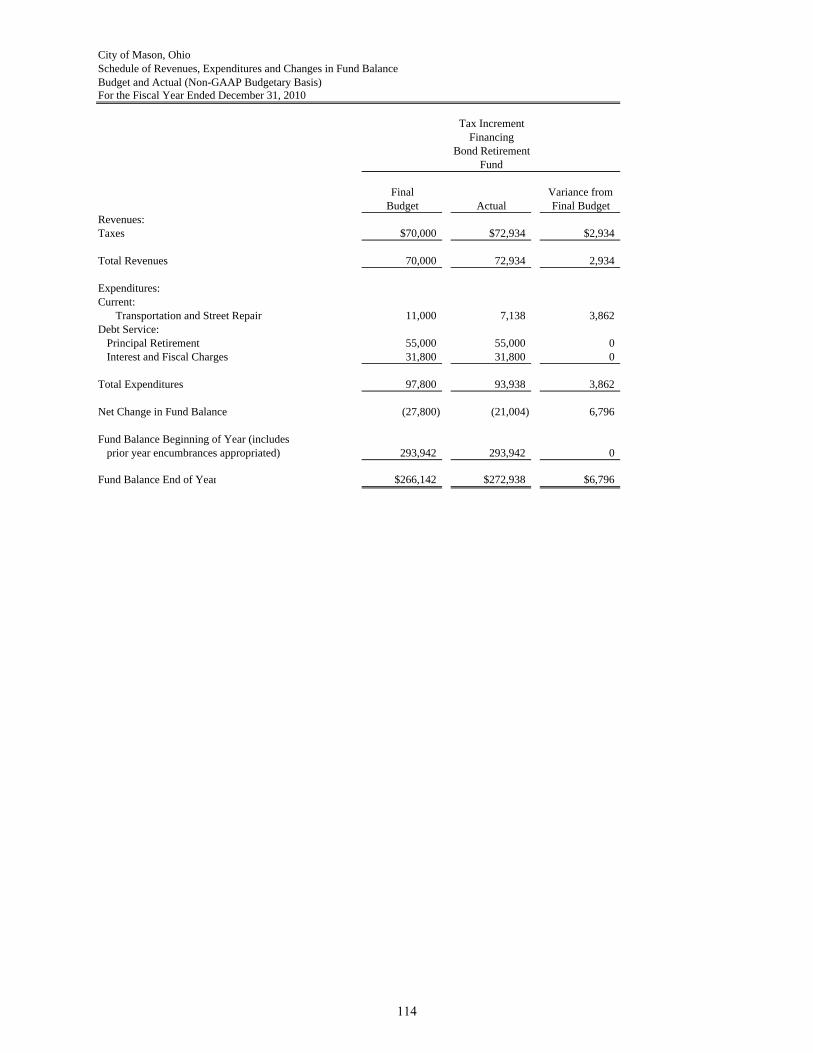
City of Mason, OhioSchedule of Revenues, Expenditures and Changes in Fund BalanceBudget and Actual (Non-GAAP Budgetary Basis)For the Fiscal Year Ended December 31, 2010
Final Variance fromBudget Actual Final Budget
Revenues:Taxes $70,000 $72,934 $2,934
Total Revenues 70,000 72,934 2,934
Expenditures:Current:
Transportation and Street Repair 11,000 7,138 3,862Debt Service:
Principal Retirement 55,000 55,000 0Interest and Fiscal Charges 31,800 31,800 0
Total Expenditures 97,800 93,938 3,862
Net Change in Fund Balance (27,800) (21,004) 6,796
Fund Balance Beginning of Year (includes prior year encumbrances appropriated) 293,942 293,942 0
Fund Balance End of Year $266,142 $272,938 $6,796
Fund
Tax IncrementFinancing
Bond Retirement
114

City of Mason, OhioSchedule of Revenues, Expenditures and Changes in Fund BalanceBudget and Actual (Non-GAAP Budgetary Basis)For the Fiscal Year Ended December 31, 2010
Final Variance fromBudget Actual Final Budget
Revenues:Taxes $0 $0 $0
Total Revenues 0 0 0
Expenditures:Current:Debt Service:
Principal Retirement 18,915,000 18,915,000 0Interest and Fiscal Charges 1,926,675 1,915,340 11,335
Total Expenditures 20,841,675 20,830,340 11,335
Excess of Revenues Over (Under) Expenditures (20,841,675) (20,830,340) 11,335
Other Financing Sources (Uses):Issuance of Debt 19,055,193 19,052,118 (3,075)Transfers In 1,671,675 1,685,820 14,145Transfers (Out) (10,000) 0 10,000
Total Other Financing Sources (Uses) 20,716,868 20,737,938 21,070
Net Change in Fund Balance (124,807) (92,402) 32,405
Fund Balance Beginning of Year (includes prior year encumbrances appropriated) 2,036,578 2,036,578 0
Fund Balance End of Year $1,911,771 $1,944,176 $32,405
Fund
Government
Bond RetirementCenter
115
NONMAJOR FUNDS Agency Funds: The Agency Funds are custodial in nature (assets equal liabilities) and do not involve measurement of results of operations. Fund Descriptions Municipal Court Fund: To account for amounts held on behalf of other governments and bonds deposited with the court pending final disposition of various causes. Mason Port Authority Fund: To enhance future development opportunities in the City, to support the economic development strategies of the City and to promote participation in activities that will have a positive impact on the general economic wealth of Mason. Community Improvement Corporation Fund: To account for custodial transactions related to community improvement.
116
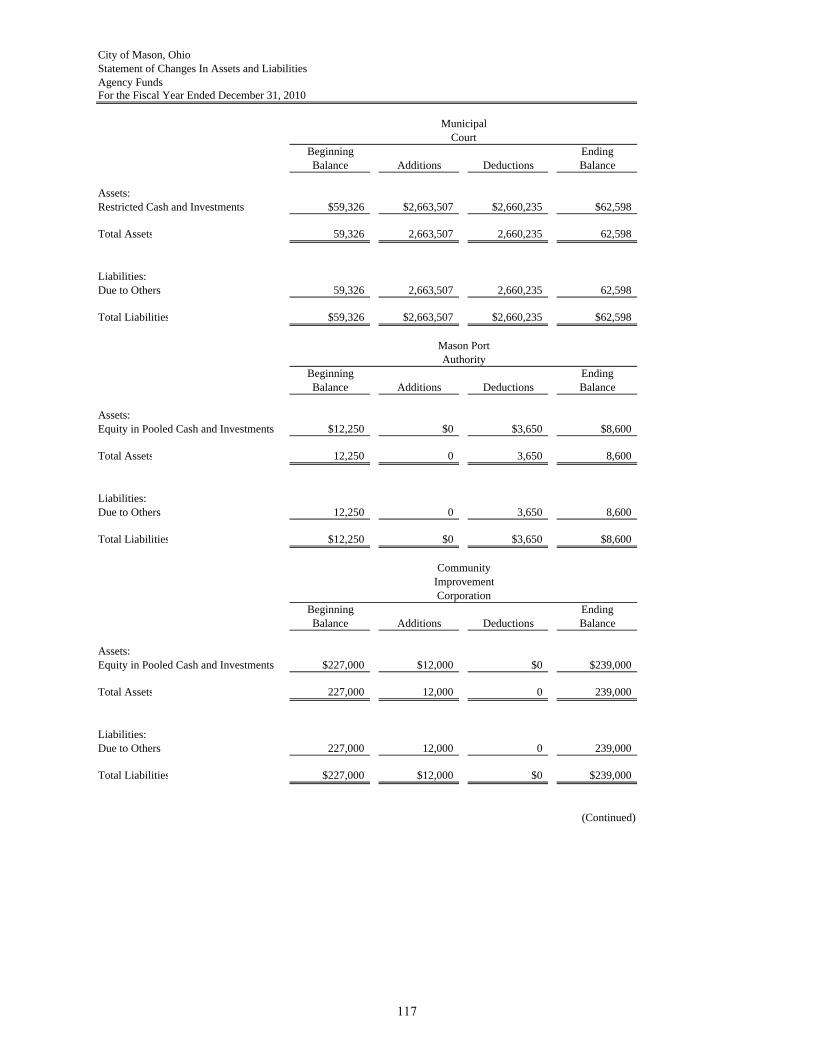
City of Mason, OhioStatement of Changes In Assets and LiabilitiesAgency FundsFor the Fiscal Year Ended December 31, 2010
Beginning EndingBalance Additions Deductions Balance
Assets:Restricted Cash and Investments $59,326 $2,663,507 $2,660,235 $62,598
Total Assets 59,326 2,663,507 2,660,235 62,598
Liabilities:Due to Others 59,326 2,663,507 2,660,235 62,598
Total Liabilities $59,326 $2,663,507 $2,660,235 $62,598
Beginning EndingBalance Additions Deductions Balance
Assets:Equity in Pooled Cash and Investments $12,250 $0 $3,650 $8,600
Total Assets 12,250 0 3,650 8,600
Liabilities:Due to Others 12,250 0 3,650 8,600
Total Liabilities $12,250 $0 $3,650 $8,600
Beginning EndingBalance Additions Deductions Balance
Assets:Equity in Pooled Cash and Investments $227,000 $12,000 $0 $239,000
Total Assets 227,000 12,000 0 239,000
Liabilities:Due to Others 227,000 12,000 0 239,000
Total Liabilities $227,000 $12,000 $0 $239,000
(Continued)
Corporation
MunicipalCourt
CommunityImprovement
Mason PortAuthority
117
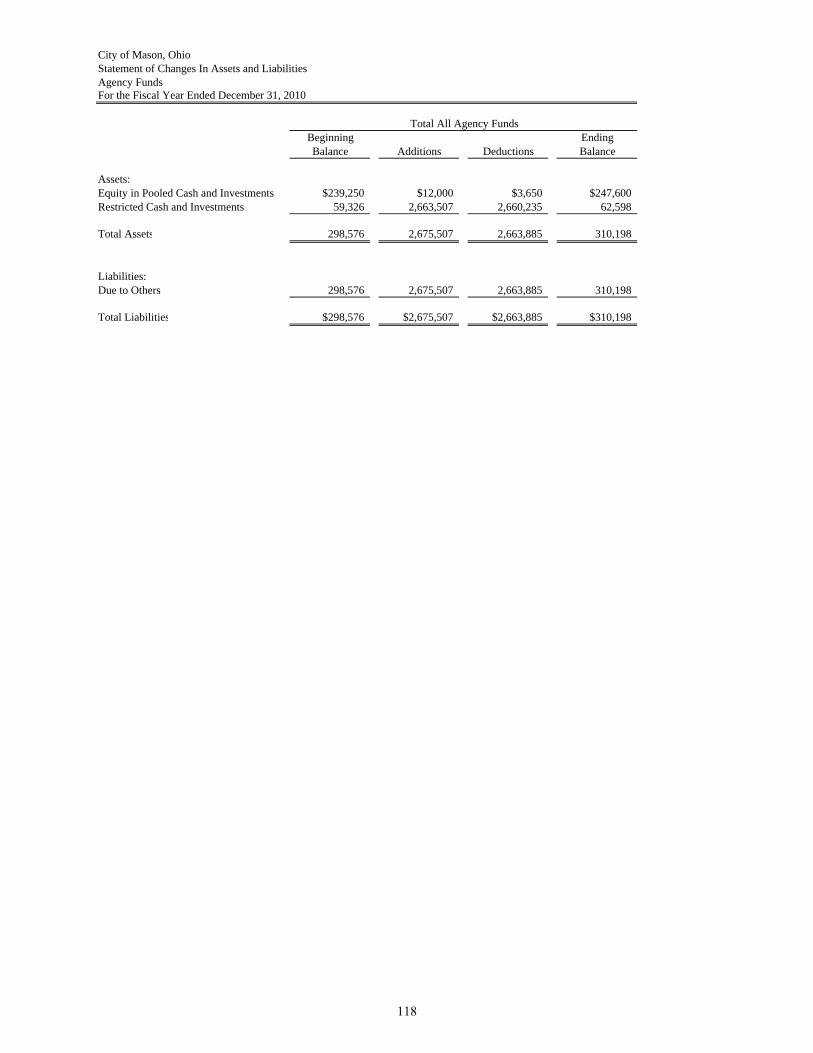
City of Mason, OhioStatement of Changes In Assets and LiabilitiesAgency FundsFor the Fiscal Year Ended December 31, 2010
Total All Agency FundsBeginning EndingBalance Additions Deductions Balance
Assets:Equity in Pooled Cash and Investments $239,250 $12,000 $3,650 $247,600Restricted Cash and Investments 59,326 2,663,507 2,660,235 62,598
Total Assets 298,576 2,675,507 2,663,885 310,198
Liabilities:Due to Others 298,576 2,675,507 2,663,885 310,198
Total Liabilities $298,576 $2,675,507 $2,663,885 $310,198
118
STATISTICAL SECTION
City of Mason, Ohio Statistical Section This part of the City's comprehensive annual financial report presents detailed information as a context for understanding what the information in the financial statements, note disclosures, and required supplementary information says about the City's overall financial health. Contents Financial Trends: These schedules contain trend information to help the reader understand how the City's financial position has changed over time. Revenue Capacity: These schedules contain information to help the reader understand and assess the City’s most significant local revenue source, the income tax. Debt Capacity: These schedules present information to help the reader assess the affordability of the City’s current levels of outstanding debt and the City's ability to issue additional debt in the future. Economic and Demographic Information: These schedules offer economic and demographic indicators to help the reader understand the environment within which the City’s financial activities take place and to provide information that facilitates comparisons of financial information over time and among governments. Operating Information: These schedules contain service and infrastructure data to help the reader understand how the information in the City’s financial report relates to the services the City provides and the activities it performs. Sources: Unless otherwise noted, the information in these schedules is derived from the comprehensive annual financial reports for the relevant year. The City implemented GASB Statement 34 in fiscal year 2001; schedules presenting government-wide information include information beginning in that fiscal year.
119

THIS PAGE INTENTIONALLY LEFT BLANK
120
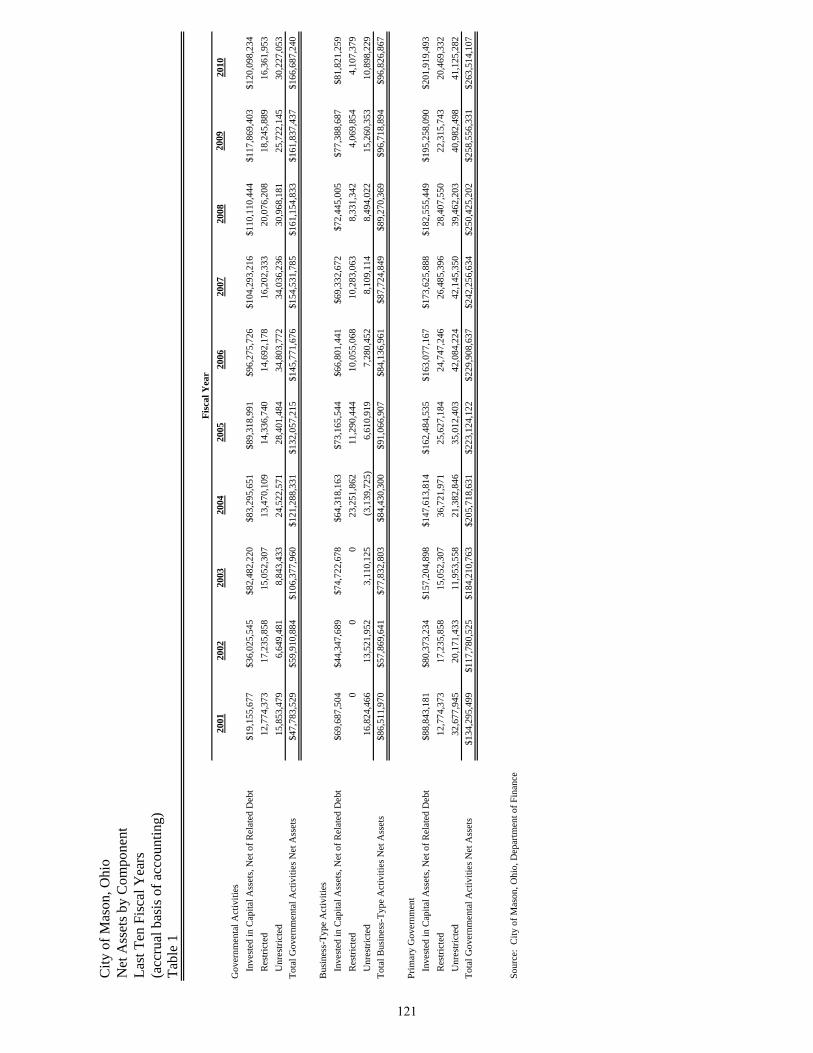
City
of M
ason
, Ohi
oN
et A
sset
s by
Com
pone
n tLa
st T
en F
isca
l Yea
rs(a
ccru
al b
asis
of a
ccou
ntin
g)Ta
ble
1
2001
2002
2003
2004
2005
2006
2007
2008
2009
2010
Gov
ernm
enta
l Act
iviti
es
Inve
sted
in C
apita
l Ass
ets,
Net
of R
elat
ed D
ebt
$19,
155,
677
$36,
025,
545
$82,
482,
220
$83,
295,
651
$89,
318,
991
$96,
275,
726
$104
,293
,216
$110
,110
,444
$117
,869
,403
$120
,098
,234
R
estri
cted
12,7
74,3
7317
,235
,858
15,0
52,3
0713
,470
,109
14,3
36,7
4014
,692
,178
16,2
02,3
3320
,076
,208
18,2
45,8
8916
,361
,953
U
nres
trict
ed15
,853
,479
6,64
9,48
18,
843,
433
24,5
22,5
7128
,401
,484
34,8
03,7
7234
,036
,236
30,9
68,1
8125
,722
,145
30,2
27,0
53To
tal G
over
nmen
tal A
ctiv
ities
Net
Ass
ets
$47,
783,
529
$59,
910,
884
$106
,377
,960
$121
,288
,331
$132
,057
,215
$145
,771
,676
$154
,531
,785
$161
,154
,833
$161
,837
,437
$166
,687
,240
Bus
ines
s-Ty
pe A
ctiv
ities
In
vest
ed in
Cap
ital A
sset
s, N
et o
f Rel
ated
Deb
t$6
9,68
7,50
4$4
4,34
7,68
9$7
4,72
2,67
8$6
4,31
8,16
3$7
3,16
5,54
4$6
6,80
1,44
1$6
9,33
2,67
2$7
2,44
5,00
5$7
7,38
8,68
7$8
1,82
1,25
9
Res
trict
ed0
00
23,2
51,8
6211
,290
,444
10,0
55,0
6810
,283
,063
8,33
1,34
24,
069,
854
4,10
7,37
9
Unr
estri
cted
16,8
24,4
6613
,521
,952
3,11
0,12
5(3
,139
,725
)6,
610,
919
7,28
0,45
28,
109,
114
8,49
4,02
215
,260
,353
10,8
98,2
29To
tal B
usin
ess-
Type
Act
iviti
es N
et A
sset
s$8
6,51
1,97
0$5
7,86
9,64
1$7
7,83
2,80
3$8
4,43
0,30
0$9
1,06
6,90
7$8
4,13
6,96
1$8
7,72
4,84
9$8
9,27
0,36
9$9
6,71
8,89
4$9
6,82
6,86
7
Prim
ary
Gov
ernm
ent
In
vest
ed in
Cap
ital A
sset
s, N
et o
f Rel
ated
Deb
t$8
8,84
3,18
1$8
0,37
3,23
4$1
57,2
04,8
98$1
47,6
13,8
14$1
62,4
84,5
35$1
63,0
77,1
67$1
73,6
25,8
88$1
82,5
55,4
49$1
95,2
58,0
90$2
01,9
19,4
93
Res
trict
ed12
,774
,373
17,2
35,8
5815
,052
,307
36,7
21,9
7125
,627
,184
24,7
47,2
4626
,485
,396
28,4
07,5
5022
,315
,743
20,4
69,3
32
Unr
estri
cted
32,6
77,9
4520
,171
,433
11,9
53,5
5821
,382
,846
35,0
12,4
0342
,084
,224
42,1
45,3
5039
,462
,203
40,9
82,4
9841
,125
,282
Tota
l Gov
ernm
enta
l Act
iviti
es N
et A
sset
s$1
34,2
95,4
99$1
17,7
80,5
25$1
84,2
10,7
63$2
05,7
18,6
31$2
23,1
24,1
22$2
29,9
08,6
37$2
42,2
56,6
34$2
50,4
25,2
02$2
58,5
56,3
31$2
63,5
14,1
07
Sour
ce:
City
of M
ason
, Ohi
o, D
epar
tmen
t of F
inan
ce
Fisc
al Y
ear
121
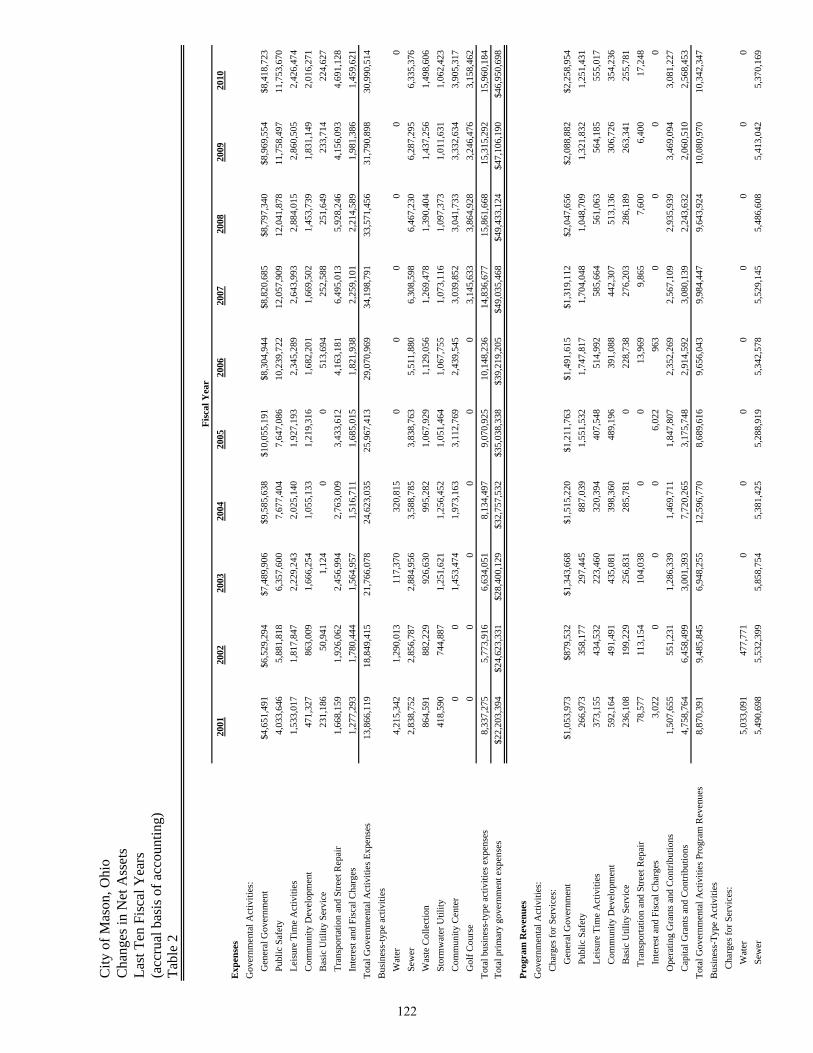
City
of M
ason
, Ohi
oC
hang
es in
Net
Ass
ets
Last
Ten
Fis
cal Y
ears
(acc
rual
bas
is o
f acc
ount
ing)
Tabl
e 2
2001
2002
2003
2004
2005
2006
2007
2008
2009
2010
Exp
ense
sG
over
nmen
tal A
ctiv
ities
:
Gen
eral
Gov
ernm
ent
$4,6
51,4
91$6
,529
,294
$7,4
89,9
06$9
,585
,638
$10,
055,
191
$8,3
04,9
44$8
,820
,685
$8,7
97,3
40$8
,969
,554
$8,4
18,7
23
Publ
ic S
afet
y4,
033,
646
5,88
1,81
86,
357,
600
7,67
7,40
47,
647,
086
10,2
39,7
2212
,057
,909
12,0
41,8
7811
,758
,497
11,7
53,6
70
Leis
ure
Tim
e A
ctiv
ities
1,53
3,01
71,
817,
847
2,22
9,24
32,
025,
140
1,92
7,19
32,
345,
289
2,64
3,99
32,
884,
015
2,86
0,50
52,
426,
474
C
omm
unity
Dev
elop
men
t47
1,32
786
3,00
91,
666,
254
1,05
5,13
31,
219,
316
1,68
2,20
11,
669,
502
1,45
3,73
91,
831,
149
2,01
6,27
1
Bas
ic U
tility
Ser
vice
231,
186
50,9
411,
124
00
513,
694
252,
588
251,
649
233,
714
224,
627
Tr
ansp
orta
tion
and
Stre
et R
epai
r1,
668,
159
1,92
6,06
22,
456,
994
2,76
3,00
93,
433,
612
4,16
3,18
16,
495,
013
5,92
8,24
64,
156,
093
4,69
1,12
8
Inte
rest
and
Fis
cal C
harg
es1,
277,
293
1,78
0,44
41,
564,
957
1,51
6,71
11,
685,
015
1,82
1,93
82,
259,
101
2,21
4,58
91,
981,
386
1,45
9,62
1To
tal G
over
nmen
tal A
ctiv
ities
Exp
ense
s13
,866
,119
18,8
49,4
1521
,766
,078
24,6
23,0
3525
,967
,413
29,0
70,9
6934
,198
,791
33,5
71,4
5631
,790
,898
30,9
90,5
14B
usin
ess-
type
act
iviti
es
Wat
er4,
215,
342
1,29
0,01
311
7,37
032
0,81
50
00
00
0
Sew
er2,
838,
752
2,85
6,78
72,
884,
956
3,58
8,78
53,
838,
763
5,51
1,88
06,
308,
598
6,46
7,23
06,
287,
295
6,33
5,37
6
Was
te C
olle
ctio
n86
4,59
188
2,22
992
6,63
099
5,28
21,
067,
929
1,12
9,05
61,
269,
478
1,39
0,40
41,
437,
256
1,49
8,60
6
Stor
mw
ater
Util
ity41
8,59
074
4,88
71,
251,
621
1,25
6,45
21,
051,
464
1,06
7,75
51,
073,
116
1,09
7,37
31,
011,
631
1,06
2,42
3
Com
mun
ity C
ente
r0
01,
453,
474
1,97
3,16
33,
112,
769
2,43
9,54
53,
039,
852
3,04
1,73
33,
332,
634
3,90
5,31
7
Gol
f Cou
rse
00
00
00
3,14
5,63
33,
864,
928
3,24
6,47
63,
158,
462
Tota
l bus
ines
s-ty
pe a
ctiv
ities
exp
ense
s8,
337,
275
5,77
3,91
66,
634,
051
8,13
4,49
79,
070,
925
10,1
48,2
3614
,836
,677
15,8
61,6
6815
,315
,292
15,9
60,1
84To
tal p
rimar
y go
vern
men
t exp
ense
s$2
2,20
3,39
4$2
4,62
3,33
1$2
8,40
0,12
9$3
2,75
7,53
2$3
5,03
8,33
8$3
9,21
9,20
5$4
9,03
5,46
8$4
9,43
3,12
4$4
7,10
6,19
0$4
6,95
0,69
8
Prog
ram
Rev
enue
sG
over
nmen
tal A
ctiv
ities
:
Cha
rges
for S
ervi
ces:
Gen
eral
Gov
ernm
ent
$1,0
53,9
73$8
79,5
32$1
,343
,668
$1,5
15,2
20$1
,211
,763
$1,4
91,6
15$1
,319
,112
$2,0
47,6
56$2
,088
,882
$2,2
58,9
54
Pu
blic
Saf
ety
266,
973
358,
177
297,
445
887,
039
1,55
1,53
21,
747,
817
1,70
4,04
81,
048,
709
1,32
1,83
21,
251,
431
Leis
ure
Tim
e A
ctiv
ities
373,
155
434,
532
223,
460
320,
394
407,
548
514,
992
585,
664
561,
063
564,
185
555,
017
Com
mun
ity D
evel
opm
ent
592,
164
491,
491
435,
081
398,
360
489,
196
391,
088
442,
307
513,
136
306,
726
354,
236
Bas
ic U
tility
Ser
vice
236,
108
199,
229
256,
831
285,
781
022
8,73
827
6,20
328
6,18
926
3,34
125
5,78
1
Tra
nspo
rtatio
n an
d St
reet
Rep
air
78,5
7711
3,15
410
4,03
80
013
,969
9,86
57,
600
6,40
017
,248
Inte
rest
and
Fis
cal C
harg
es3,
022
00
06,
022
963
00
00
O
pera
ting
Gra
nts a
nd C
ontri
butio
ns1,
507,
655
551,
231
1,28
6,33
91,
469,
711
1,84
7,80
72,
352,
269
2,56
7,10
92,
935,
939
3,46
9,09
43,
081,
227
C
apita
l Gra
nts a
nd C
ontri
butio
ns4,
758,
764
6,45
8,49
93,
001,
393
7,72
0,26
53,
175,
748
2,91
4,59
23,
080,
139
2,24
3,63
22,
060,
510
2,56
8,45
3To
tal G
over
nmen
tal A
ctiv
ities
Pro
gram
Rev
enue
s8,
870,
391
9,48
5,84
56,
948,
255
12,5
96,7
708,
689,
616
9,65
6,04
39,
984,
447
9,64
3,92
410
,080
,970
10,3
42,3
47B
usin
ess-
Type
Act
iviti
es
Cha
rges
for S
ervi
ces:
Wat
er5,
033,
091
477,
771
00
00
00
00
Sew
er5,
490,
698
5,53
2,39
95,
858,
754
5,38
1,42
55,
288,
919
5,34
2,57
85,
529,
145
5,48
6,60
85,
413,
042
5,37
0,16
9
Fisc
al Y
ear
122
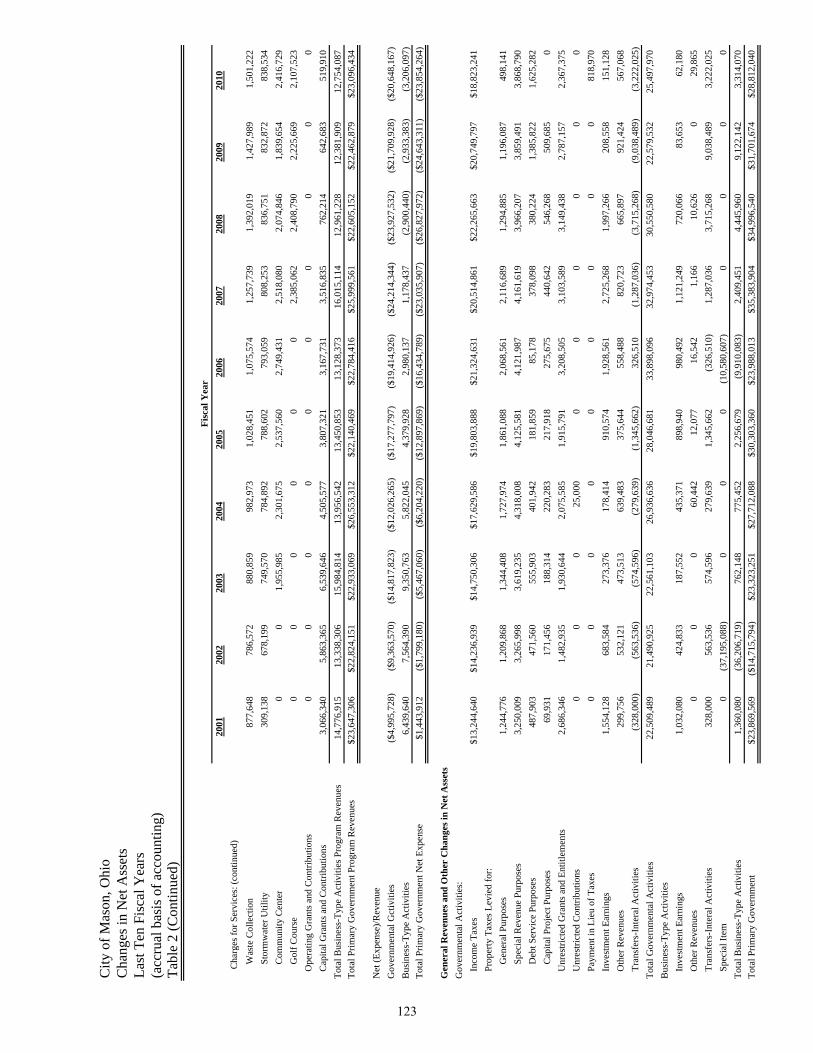
City
of M
ason
, Ohi
oC
hang
es in
Net
Ass
ets
Last
Ten
Fis
cal Y
ears
(acc
rual
bas
is o
f acc
ount
ing)
Tabl
e 2
(Con
tinue
d)
2001
2002
2003
2004
2005
2006
2007
2008
2009
2010
C
harg
es fo
r Ser
vice
s: (c
ontin
ued)
Was
te C
olle
ctio
n87
7,64
878
6,57
288
0,85
998
2,97
31,
028,
451
1,07
5,57
41,
257,
739
1,39
2,01
91,
427,
989
1,50
1,22
2
St
orm
wat
er U
tility
309,
138
678,
199
749,
570
784,
892
788,
602
793,
059
808,
253
836,
751
832,
872
838,
534
Com
mun
ity C
ente
r0
01,
955,
985
2,30
1,67
52,
537,
560
2,74
9,43
12,
518,
080
2,07
4,84
61,
839,
654
2,41
6,72
9
G
olf C
ours
e0
00
00
02,
385,
062
2,40
8,79
02,
225,
669
2,10
7,52
3
Ope
ratin
g G
rant
s and
Con
tribu
tions
00
00
00
00
00
C
apita
l Gra
nts a
nd C
ontri
butio
ns3,
066,
340
5,86
3,36
56,
539,
646
4,50
5,57
73,
807,
321
3,16
7,73
13,
516,
835
762,
214
642,
683
519,
910
Tota
l Bus
ines
s-Ty
pe A
ctiv
ities
Pro
gram
Rev
enue
s14
,776
,915
13,3
38,3
0615
,984
,814
13,9
56,5
4213
,450
,853
13,1
28,3
7316
,015
,114
12,9
61,2
2812
,381
,909
12,7
54,0
87To
tal P
rimar
y G
over
nmen
t Pro
gram
Rev
enue
s$2
3,64
7,30
6$2
2,82
4,15
1$2
2,93
3,06
9$2
6,55
3,31
2$2
2,14
0,46
9$2
2,78
4,41
6$2
5,99
9,56
1$2
2,60
5,15
2$2
2,46
2,87
9$2
3,09
6,43
4
Net
(Exp
ense
)/Rev
enue
Gov
ernm
enta
l Gct
iviti
es($
4,99
5,72
8)($
9,36
3,57
0)($
14,8
17,8
23)
($12
,026
,265
)($
17,2
77,7
97)
($19
,414
,926
)($
24,2
14,3
44)
($23
,927
,532
)($
21,7
09,9
28)
($20
,648
,167
)B
usin
ess-
Type
Act
iviti
es6,
439,
640
7,56
4,39
09,
350,
763
5,82
2,04
54,
379,
928
2,98
0,13
71,
178,
437
(2,9
00,4
40)
(2,9
33,3
83)
(3,2
06,0
97)
Tota
l Prim
ary
Gov
ernm
ent N
et E
xpen
se$1
,443
,912
($1,
799,
180)
($5,
467,
060)
($6,
204,
220)
($12
,897
,869
)($
16,4
34,7
89)
($23
,035
,907
)($
26,8
27,9
72)
($24
,643
,311
)($
23,8
54,2
64)
Gen
eral
Rev
enue
s and
Oth
er C
hang
es in
Net
Ass
ets
Gov
ernm
enta
l Act
iviti
es:
In
com
e Ta
xes
$13,
244,
640
$14,
236,
939
$14,
750,
306
$17,
629,
586
$19,
803,
888
$21,
324,
631
$20,
514,
861
$22,
265,
663
$20,
749,
797
$18,
823,
241
Pr
oper
ty T
axes
Lev
ied
for:
Gen
eral
Pur
pose
s1,
244,
776
1,20
9,86
81,
344,
408
1,72
7,97
41,
861,
088
2,06
8,56
12,
116,
689
1,29
4,88
51,
196,
087
498,
141
Spec
ial R
even
ue P
urpo
ses
3,25
0,00
93,
265,
998
3,61
9,23
54,
318,
008
4,12
5,58
14,
121,
987
4,16
1,61
93,
966,
207
3,85
9,49
13,
868,
790
Deb
t Ser
vice
Pur
pose
s48
7,90
347
1,56
055
5,90
340
1,94
218
1,85
985
,178
378,
098
380,
224
1,38
5,82
21,
625,
282
Cap
ital P
roje
ct P
urpo
ses
69,9
3117
1,45
618
8,31
422
0,28
321
7,91
827
5,67
544
0,64
254
6,26
850
9,68
50
U
nres
trict
ed G
rant
s and
Ent
itlem
ents
2,68
6,34
61,
482,
935
1,93
0,64
42,
075,
585
1,91
5,79
13,
208,
505
3,10
3,58
93,
149,
438
2,78
7,15
72,
367,
375
U
nres
trict
ed C
ontri
butio
ns0
00
25,0
000
00
00
0
Paym
ent i
n Li
eu o
f Tax
es0
00
00
00
00
818,
970
In
vest
men
t Ear
ning
s1,
554,
128
683,
584
273,
376
178,
414
910,
574
1,92
8,56
12,
725,
268
1,99
7,26
620
8,55
815
1,12
8
Oth
er R
even
ues
299,
756
532,
121
473,
513
639,
483
375,
644
558,
488
820,
723
665,
897
921,
424
567,
068
Tr
ansf
ers-
Inte
ral A
ctiv
ities
(328
,000
)(5
63,5
36)
(574
,596
)(2
79,6
39)
(1,3
45,6
62)
326,
510
(1,2
87,0
36)
(3,7
15,2
68)
(9,0
38,4
89)
(3,2
22,0
25)
Tota
l Gov
ernm
enta
l Act
iviti
es
22,5
09,4
8921
,490
,925
22,5
61,1
0326
,936
,636
28,0
46,6
8133
,898
,096
32,9
74,4
5330
,550
,580
22,5
79,5
3225
,497
,970
Bus
ines
s-Ty
pe A
ctiv
ities
In
vest
men
t Ear
ning
s1,
032,
080
424,
833
187,
552
435,
371
898,
940
980,
492
1,12
1,24
972
0,06
683
,653
62,1
80
Oth
er R
even
ues
00
060
,442
12,0
7716
,542
1,16
610
,626
029
,865
Tr
ansf
ers-
Inte
ral A
ctiv
ities
328,
000
563,
536
574,
596
279,
639
1,34
5,66
2(3
26,5
10)
1,28
7,03
63,
715,
268
9,03
8,48
93,
222,
025
Sp
ecia
l Ite
m0
(37,
195,
088)
00
0(1
0,58
0,60
7)0
00
0To
tal B
usin
ess-
Type
Act
iviti
es
1,36
0,08
0(3
6,20
6,71
9)76
2,14
877
5,45
22,
256,
679
(9,9
10,0
83)
2,40
9,45
14,
445,
960
9,12
2,14
23,
314,
070
Tota
l Prim
ary
Gov
ernm
ent
$23,
869,
569
($14
,715
,794
)$2
3,32
3,25
1$2
7,71
2,08
8$3
0,30
3,36
0$2
3,98
8,01
3$3
5,38
3,90
4$3
4,99
6,54
0$3
1,70
1,67
4$2
8,81
2,04
0
Fisc
al Y
ear
123
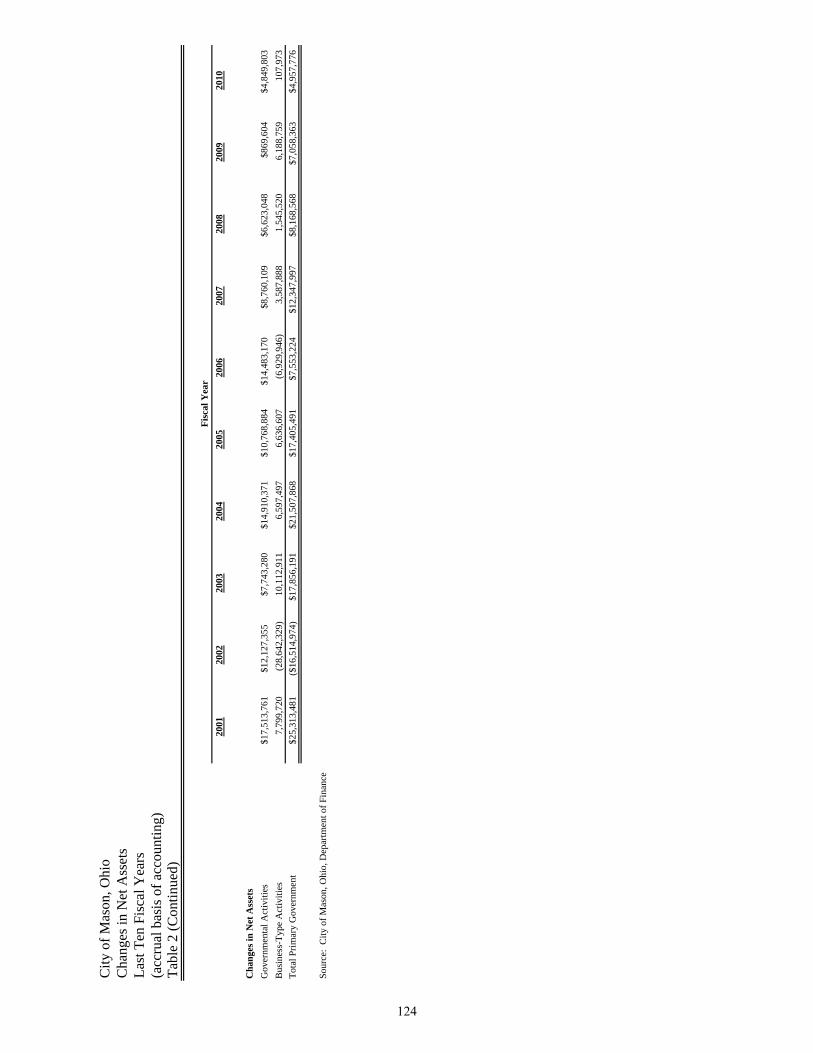
City
of M
ason
, Ohi
oC
hang
es in
Net
Ass
ets
Last
Ten
Fis
cal Y
ears
(acc
rual
bas
is o
f acc
ount
ing)
Tabl
e 2
(Con
tinue
d)
2001
2002
2003
2004
2005
2006
2007
2008
2009
2010
Cha
nges
in N
et A
sset
sG
over
nmen
tal A
ctiv
ities
$17,
513,
761
$12,
127,
355
$7,7
43,2
80$1
4,91
0,37
1$1
0,76
8,88
4$1
4,48
3,17
0$8
,760
,109
$6,6
23,0
48$8
69,6
04$4
,849
,803
Bus
ines
s-Ty
pe A
ctiv
ities
7,79
9,72
0(2
8,64
2,32
9)10
,112
,911
6,59
7,49
76,
636,
607
(6,9
29,9
46)
3,58
7,88
81,
545,
520
6,18
8,75
910
7,97
3To
tal P
rimar
y G
over
nmen
t $2
5,31
3,48
1($
16,5
14,9
74)
$17,
856,
191
$21,
507,
868
$17,
405,
491
$7,5
53,2
24$1
2,34
7,99
7$8
,168
,568
$7,0
58,3
63$4
,957
,776
Sour
ce:
City
of M
ason
, Ohi
o, D
epar
tmen
t of F
inan
ce
Fisc
al Y
ear
124
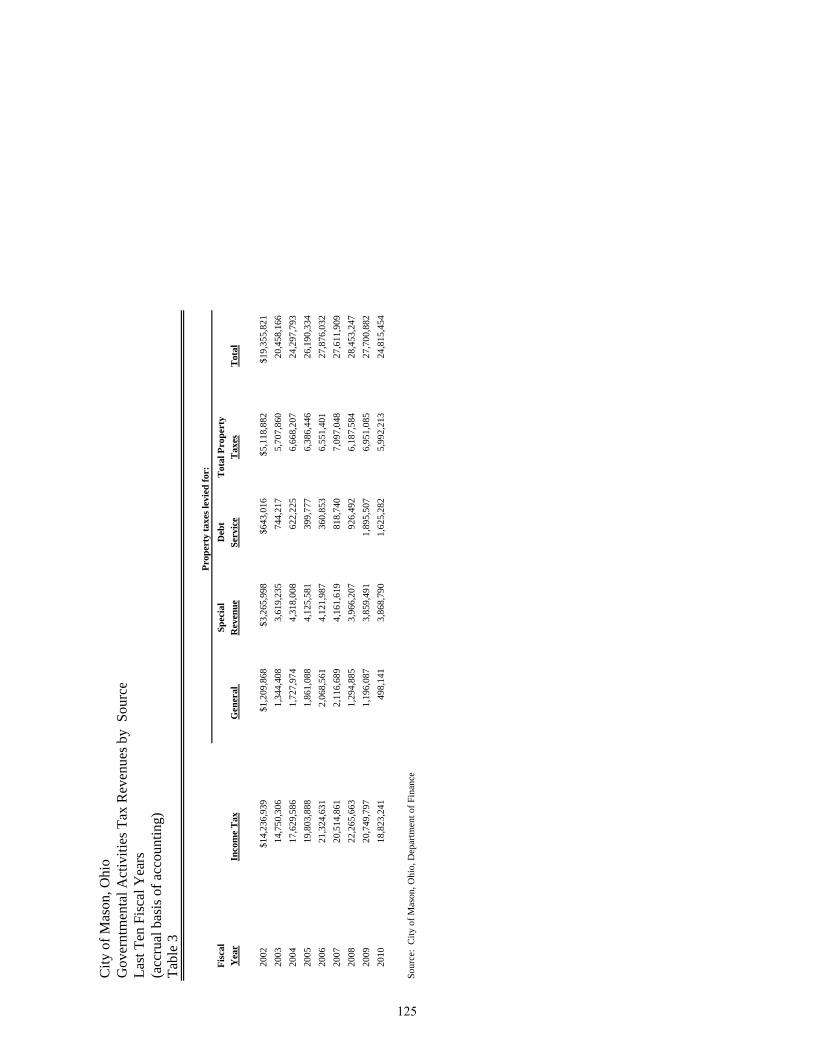
City
of M
ason
, Ohi
oG
over
ntm
enta
l Act
iviti
es T
ax R
even
ues b
y S
ourc
eLa
st T
en F
isca
l Yea
rs(a
ccru
al b
asis
of a
ccou
ntin
g)Ta
ble
3
Fisc
alSp
ecia
lD
ebt
Tot
al P
rope
rty
Yea
rIn
com
e T
axG
ener
al
Rev
enue
Serv
ice
Tax
esT
otal
2002
$14,
236,
939
$1,2
09,8
68$3
,265
,998
$643
,016
$5,1
18,8
82$1
9,35
5,82
120
0314
,750
,306
1,34
4,40
83,
619,
235
744,
217
5,70
7,86
020
,458
,166
2004
17,6
29,5
861,
727,
974
4,31
8,00
862
2,22
56,
668,
207
24,2
97,7
9320
0519
,803
,888
1,86
1,08
84,
125,
581
399,
777
6,38
6,44
626
,190
,334
2006
21,3
24,6
312,
068,
561
4,12
1,98
736
0,85
36,
551,
401
27,8
76,0
3220
0720
,514
,861
2,11
6,68
94,
161,
619
818,
740
7,09
7,04
827
,611
,909
2008
22,2
65,6
631,
294,
885
3,96
6,20
792
6,49
26,
187,
584
28,4
53,2
4720
0920
,749
,797
1,19
6,08
73,
859,
491
1,89
5,50
76,
951,
085
27,7
00,8
8220
1018
,823
,241
498,
141
3,86
8,79
01,
625,
282
5,99
2,21
324
,815
,454
Sour
ce:
City
of M
ason
, Ohi
o, D
epar
tmen
t of F
inan
ce
Prop
erty
taxe
s lev
ied
for:
125
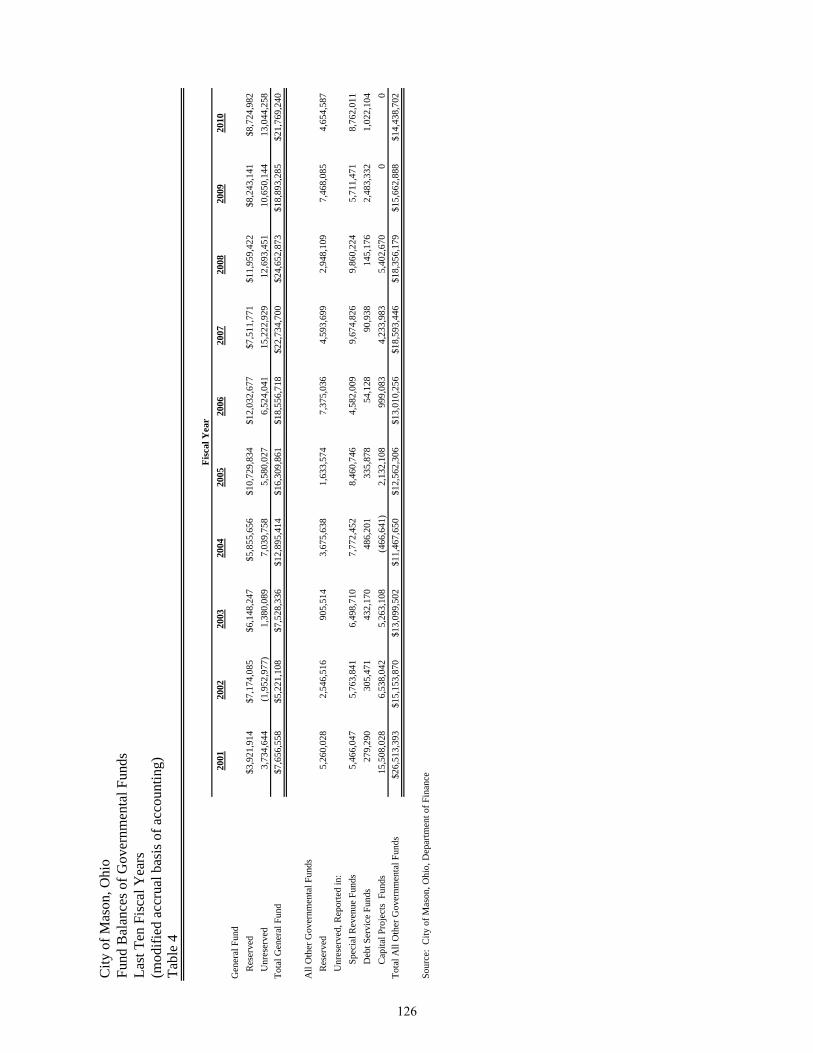
City
of M
ason
, Ohi
oFu
nd B
alan
ces o
f Gov
ernm
enta
l Fun
dsLa
st T
en F
isca
l Yea
rs(m
odifi
ed a
ccru
al b
asis
of a
ccou
ntin
g)Ta
ble
4
2001
2002
2003
2004
2005
2006
2007
2008
2009
2010
Gen
eral
Fun
d
Res
erve
d$3
,921
,914
$7,1
74,0
85$6
,148
,247
$5,8
55,6
56$1
0,72
9,83
4$1
2,03
2,67
7$7
,511
,771
$11,
959,
422
$8,2
43,1
41$8
,724
,982
U
nres
erve
d3,
734,
644
(1,9
52,9
77)
1,38
0,08
97,
039,
758
5,58
0,02
76,
524,
041
15,2
22,9
2912
,693
,451
10,6
50,1
4413
,044
,258
Tota
l Gen
eral
Fun
d$7
,656
,558
$5,2
21,1
08$7
,528
,336
$12,
895,
414
$16,
309,
861
$18,
556,
718
$22,
734,
700
$24,
652,
873
$18,
893,
285
$21,
769,
240
All
Oth
er G
over
nmen
tal F
unds
R
eser
ved
5,26
0,02
82,
546,
516
905,
514
3,67
5,63
81,
633,
574
7,37
5,03
64,
593,
699
2,94
8,10
97,
468,
085
4,65
4,58
7
Unr
eser
ved,
Rep
orte
d in
:
Sp
ecia
l Rev
enue
Fun
ds5,
466,
047
5,76
3,84
16,
498,
710
7,77
2,45
28,
460,
746
4,58
2,00
99,
674,
826
9,86
0,22
45,
711,
471
8,76
2,01
1
D
ebt S
ervi
ce F
unds
279,
290
305,
471
432,
170
486,
201
335,
878
54,1
2890
,938
145,
176
2,48
3,33
21,
022,
104
Cap
ital P
roje
cts
Fund
s15
,508
,028
6,53
8,04
25,
263,
108
(466
,641
)2,
132,
108
999,
083
4,23
3,98
35,
402,
670
00
Tota
l All
Oth
er G
over
nmen
tal F
unds
$26,
513,
393
$15,
153,
870
$13,
099,
502
$11,
467,
650
$12,
562,
306
$13,
010,
256
$18,
593,
446
$18,
356,
179
$15,
662,
888
$14,
438,
702
Sour
ce:
City
of M
ason
, Ohi
o, D
epar
tmen
t of F
inan
ce
Fisc
al Y
ear
126

THIS PAGE INTENTIONALLY LEFT BLANK
127
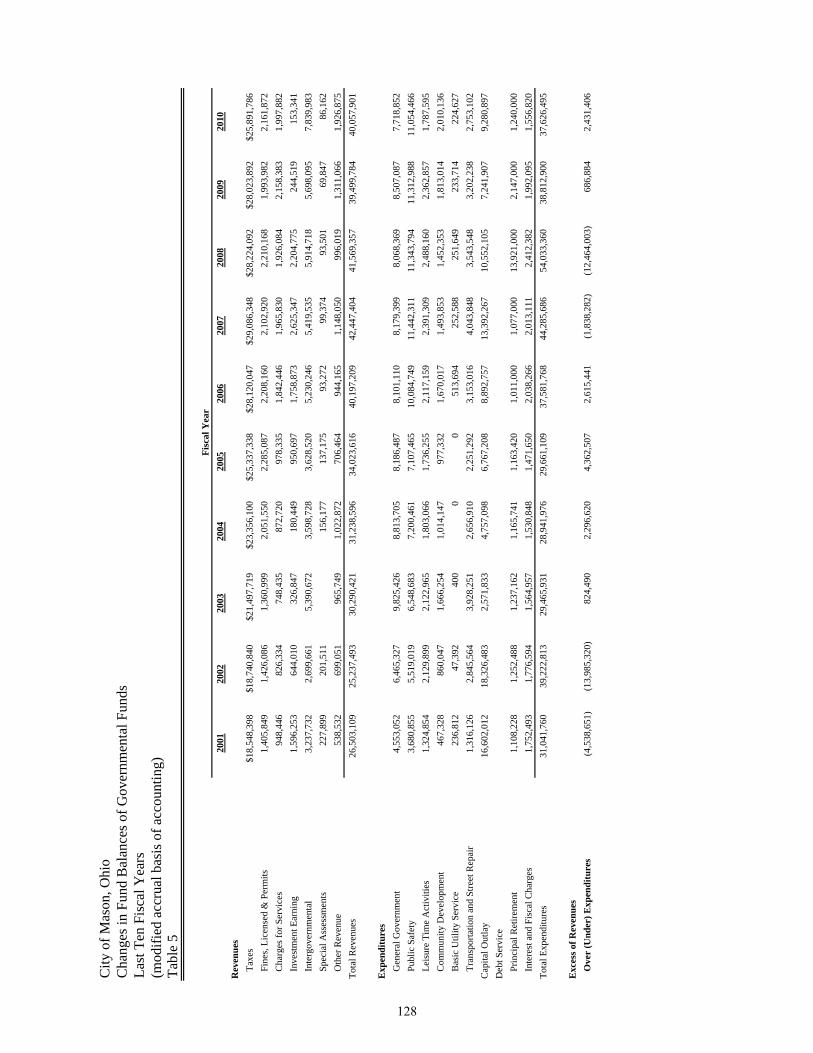
City
of M
ason
, Ohi
oC
hang
es in
Fun
d B
alan
ces o
f Gov
ernm
enta
l Fun
dsLa
st T
en F
isca
l Yea
rs(m
odifi
ed a
ccru
al b
asis
of a
ccou
ntin
g)Ta
ble
5
2001
2002
2003
2004
2005
2006
2007
2008
2009
2010
Rev
enue
s
Taxe
s$1
8,54
8,39
8$1
8,74
0,84
0$2
1,49
7,71
9$2
3,35
6,10
0$2
5,33
7,33
8$2
8,12
0,04
7$2
9,08
6,34
8$2
8,22
4,09
2$2
8,02
3,89
2$2
5,89
1,78
6
Fine
s, Li
cens
ed &
Per
mits
1,40
5,84
91,
426,
086
1,36
0,99
92,
051,
550
2,28
5,08
72,
208,
160
2,10
2,92
02,
210,
168
1,99
3,98
22,
161,
872
C
harg
es fo
r Ser
vice
s94
8,44
682
6,33
474
8,43
587
2,72
097
8,33
51,
842,
446
1,96
5,83
01,
926,
084
2,15
8,38
31,
997,
882
In
vest
men
t Ear
ning
1,59
6,25
364
4,01
032
6,84
718
0,44
995
0,69
71,
758,
873
2,62
5,34
72,
204,
775
244,
519
153,
341
In
terg
over
nmen
tal
3,23
7,73
22,
699,
661
5,39
0,67
23,
598,
728
3,62
8,52
05,
230,
246
5,41
9,53
55,
914,
718
5,69
8,09
57,
839,
983
Sp
ecia
l Ass
essm
ents
227,
899
201,
511
156,
177
137,
175
93,2
7299
,374
93,5
0169
,847
86,1
62
Oth
er R
even
ue53
8,53
269
9,05
196
5,74
91,
022,
872
706,
464
944,
165
1,14
8,05
099
6,01
91,
311,
066
1,92
6,87
5To
tal R
even
ues
26,5
03,1
0925
,237
,493
30,2
90,4
2131
,238
,596
34,0
23,6
1640
,197
,209
42,4
47,4
0441
,569
,357
39,4
99,7
8440
,057
,901
Exp
endi
ture
s
Gen
eral
Gov
ernm
ent
4,55
3,05
26,
465,
327
9,82
5,42
68,
813,
705
8,18
6,48
78,
101,
110
8,17
9,39
98,
068,
369
8,50
7,08
77,
718,
852
Pu
blic
Saf
ety
3,68
0,85
55,
519,
019
6,54
8,68
37,
200,
461
7,10
7,46
510
,084
,749
11,4
42,3
1111
,343
,794
11,3
12,9
8811
,054
,466
Le
isur
e Ti
me
Act
iviti
es1,
324,
854
2,12
9,89
92,
122,
965
1,80
3,06
61,
736,
255
2,11
7,15
92,
391,
309
2,48
8,16
02,
362,
857
1,78
7,59
5
Com
mun
ity D
evel
opm
ent
467,
328
860,
047
1,66
6,25
41,
014,
147
977,
332
1,67
0,01
71,
493,
853
1,45
2,35
31,
813,
014
2,01
0,13
6
Bas
ic U
tility
Ser
vice
236,
812
47,3
9240
00
051
3,69
425
2,58
825
1,64
923
3,71
422
4,62
7
Tran
spor
tatio
n an
d St
reet
Rep
air
1,31
6,12
62,
845,
564
3,92
8,25
12,
656,
910
2,25
1,29
23,
153,
016
4,04
3,84
83,
543,
548
3,20
2,23
82,
753,
102
Cap
ital O
utla
y16
,602
,012
18,3
26,4
832,
571,
833
4,75
7,09
86,
767,
208
8,89
2,75
713
,392
,267
10,5
52,1
057,
241,
907
9,28
0,89
7D
ebt S
ervi
ce
Prin
cipa
l Ret
irem
ent
1,10
8,22
81,
252,
488
1,23
7,16
21,
165,
741
1,16
3,42
01,
011,
000
1,07
7,00
013
,921
,000
2,14
7,00
01,
240,
000
In
tere
st a
nd F
isca
l Cha
rges
1,75
2,49
31,
776,
594
1,56
4,95
71,
530,
848
1,47
1,65
02,
038,
266
2,01
3,11
12,
412,
382
1,99
2,09
51,
556,
820
Tota
l Exp
endi
ture
s31
,041
,760
39,2
22,8
1329
,465
,931
28,9
41,9
7629
,661
,109
37,5
81,7
6844
,285
,686
54,0
33,3
6038
,812
,900
37,6
26,4
95
Exc
ess o
f Rev
enue
s
Ove
r (U
nder
) Exp
endi
ture
s(4
,538
,651
)(1
3,98
5,32
0)82
4,49
02,
296,
620
4,36
2,50
72,
615,
441
(1,8
38,2
82)
(12,
464,
003)
686,
884
2,43
1,40
6
Fisc
al Y
ear
128
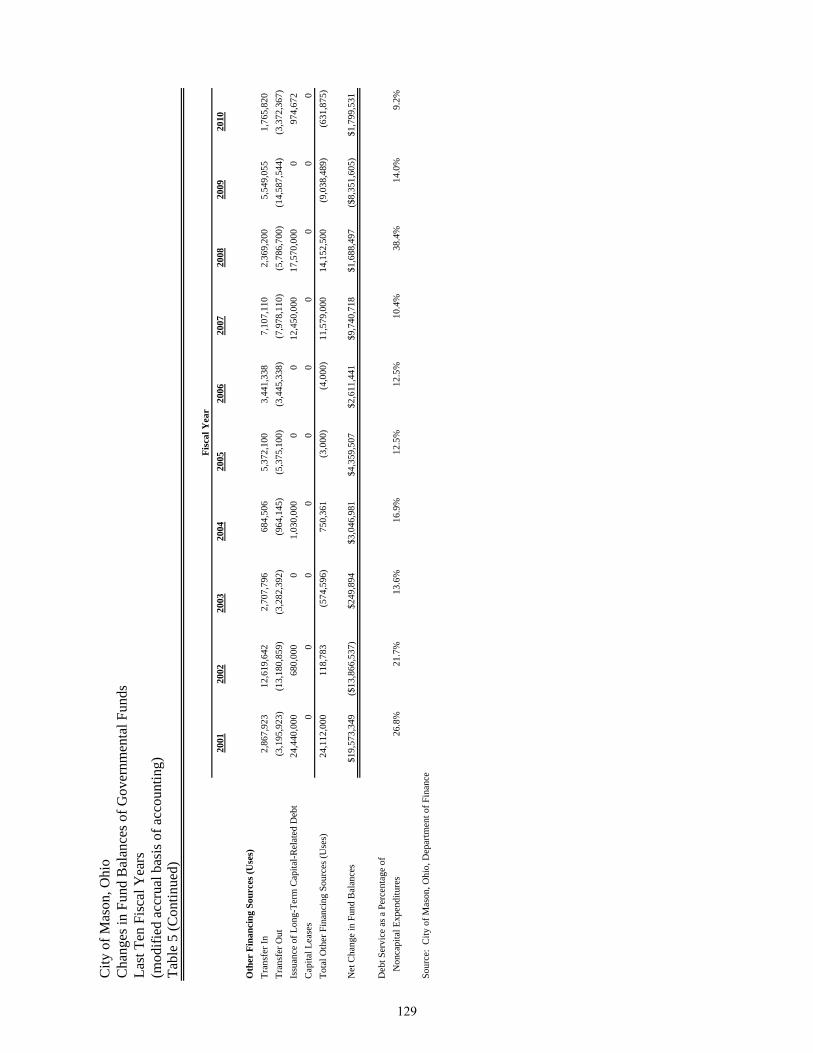
City
of M
ason
, Ohi
oC
hang
es in
Fun
d B
alan
ces o
f Gov
ernm
enta
l Fun
dsLa
st T
en F
isca
l Yea
rs(m
odifi
ed a
ccru
al b
asis
of a
ccou
ntin
g)Ta
ble
5 (C
ontin
ued)
2001
2002
2003
2004
2005
2006
2007
2008
2009
2010
Oth
er F
inan
cing
Sou
rces
(Use
s)Tr
ansf
er In
2,86
7,92
312
,619
,642
2,70
7,79
668
4,50
65,
372,
100
3,44
1,33
87,
107,
110
2,36
9,20
05,
549,
055
1,76
5,82
0Tr
ansf
er O
ut(3
,195
,923
)(1
3,18
0,85
9)(3
,282
,392
)(9
64,1
45)
(5,3
75,1
00)
(3,4
45,3
38)
(7,9
78,1
10)
(5,7
86,7
00)
(14,
587,
544)
(3,3
72,3
67)
Issu
ance
of L
ong-
Term
Cap
ital-R
elat
ed D
ebt
24,4
40,0
0068
0,00
00
1,03
0,00
00
012
,450
,000
17,5
70,0
000
974,
672
Cap
ital L
ease
s0
00
00
00
00
0To
tal O
ther
Fin
anci
ng S
ourc
es (U
ses)
24,1
12,0
0011
8,78
3(5
74,5
96)
750,
361
(3,0
00)
(4,0
00)
11,5
79,0
0014
,152
,500
(9,0
38,4
89)
(631
,875
)
Net
Cha
nge
in F
und
Bal
ance
s$1
9,57
3,34
9($
13,8
66,5
37)
$249
,894
$3,0
46,9
81$4
,359
,507
$2,6
11,4
41$9
,740
,718
$1,6
88,4
97($
8,35
1,60
5)$1
,799
,531
Deb
t Ser
vice
as a
Per
cent
age
of
N
onca
pita
l Exp
endi
ture
s26
.8%
21.7
%13
.6%
16.9
%12
.5%
12.5
%10
.4%
38.4
%14
.0%
9.2%
Sour
ce:
City
of M
ason
, Ohi
o, D
epar
tmen
t of F
inan
ce
Fisc
al Y
ear
129
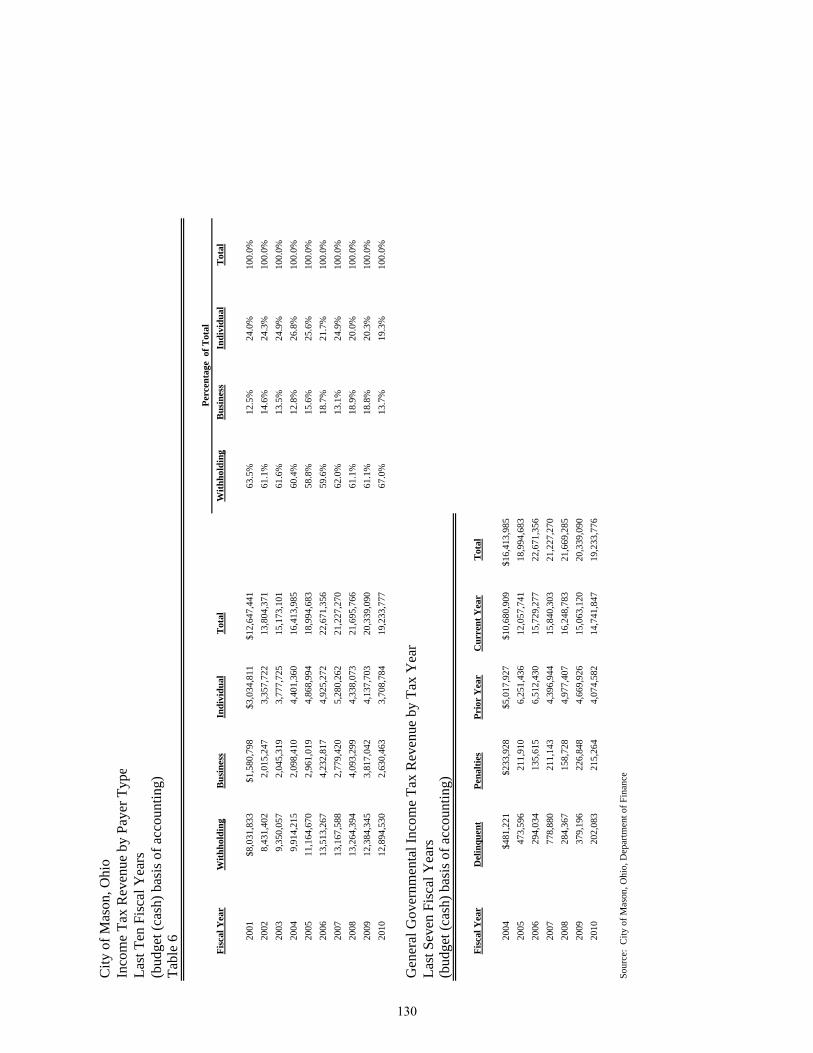
City
of M
ason
, Ohi
oIn
com
e Ta
x R
even
ue b
y Pa
yer T
ype
Last
Ten
Fis
cal Y
ears
(bud
get (
cash
) bas
is o
f acc
ount
ing)
Tabl
e 6
Fisc
al Y
ear
With
hold
ing
Bus
ines
sIn
divi
dual
Tot
alW
ithho
ldin
gB
usin
ess
Indi
vidu
alT
otal
2001
$8,0
31,8
33$1
,580
,798
$3,0
34,8
11$1
2,64
7,44
163
.5%
12.5
%24
.0%
100.
0%20
028,
431,
402
2,01
5,24
73,
357,
722
13,8
04,3
7161
.1%
14.6
%24
.3%
100.
0%20
039,
350,
057
2,04
5,31
93,
777,
725
15,1
73,1
0161
.6%
13.5
%24
.9%
100.
0%20
049,
914,
215
2,09
8,41
04,
401,
360
16,4
13,9
8560
.4%
12.8
%26
.8%
100.
0%20
0511
,164
,670
2,96
1,01
94,
868,
994
18,9
94,6
8358
.8%
15.6
%25
.6%
100.
0%20
0613
,513
,267
4,23
2,81
74,
925,
272
22,6
71,3
5659
.6%
18.7
%21
.7%
100.
0%20
0713
,167
,588
2,77
9,42
05,
280,
262
21,2
27,2
7062
.0%
13.1
%24
.9%
100.
0%20
0813
,264
,394
4,09
3,29
94,
338,
073
21,6
95,7
6661
.1%
18.9
%20
.0%
100.
0%20
0912
,384
,345
3,81
7,04
24,
137,
703
20,3
39,0
9061
.1%
18.8
%20
.3%
100.
0%20
1012
,894
,530
2,63
0,46
33,
708,
784
19,2
33,7
7767
.0%
13.7
%19
.3%
100.
0%
Fisc
al Y
ear
Del
inqu
ent
Pena
lties
Prio
r Y
ear
Cur
rent
Yea
rT
otal
2004
$481
,221
$233
,928
$5,0
17,9
27$1
0,68
0,90
9$1
6,41
3,98
520
0547
3,59
621
1,91
06,
251,
436
12,0
57,7
4118
,994
,683
2006
294,
034
135,
615
6,51
2,43
015
,729
,277
22,6
71,3
5620
0777
8,88
021
1,14
34,
396,
944
15,8
40,3
0321
,227
,270
2008
284,
367
158,
728
4,97
7,40
716
,248
,783
21,6
69,2
8520
0937
9,19
622
6,84
84,
669,
926
15,0
63,1
2020
,339
,090
2010
202,
083
215,
264
4,07
4,58
214
,741
,847
19,2
33,7
76
Sour
ce:
City
of M
ason
, Ohi
o, D
epar
tmen
t of F
inan
ce
Perc
enta
ge o
f Tot
al
(bud
get (
cash
) bas
is o
f acc
ount
ing)
Gen
eral
Gov
ernm
enta
l Inc
ome
Tax
Rev
enue
by
Tax
Yea
rLa
st S
even
Fis
cal Y
ears
130
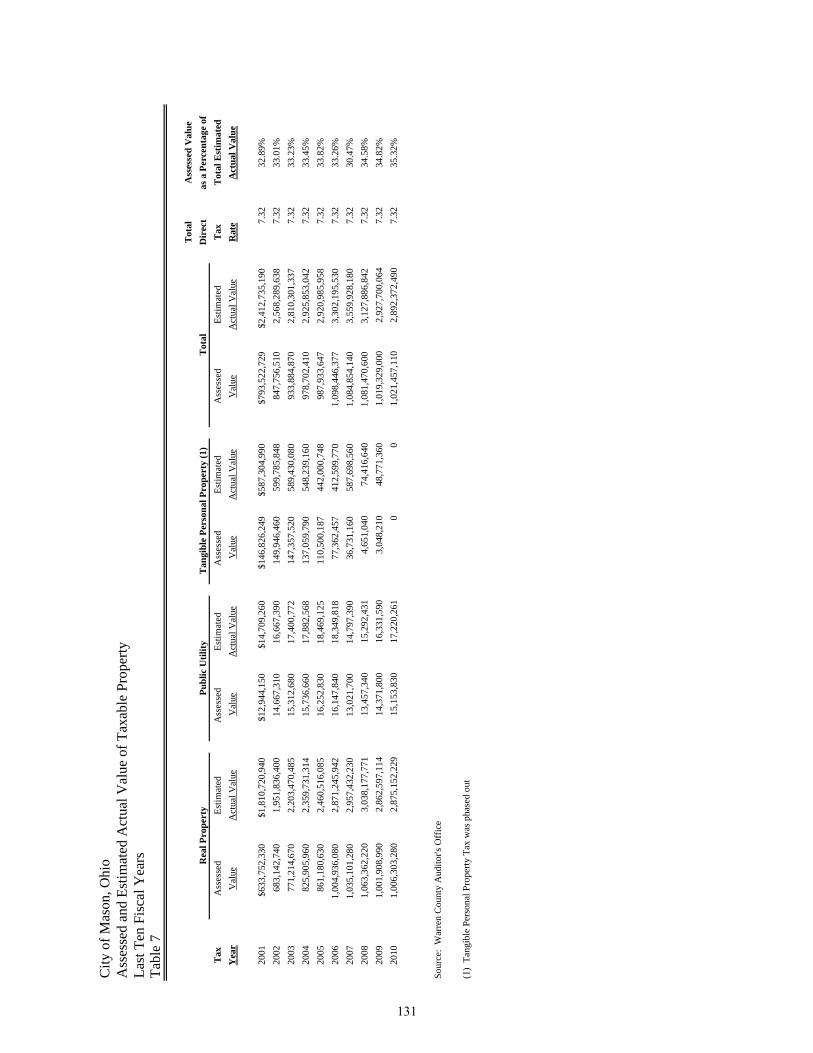
City
of M
ason
, Ohi
oA
sses
sed
and
Estim
ated
Act
ual V
alue
of T
axab
le P
rope
rt yLa
st T
en F
isca
l Yea
rsTa
ble
7
Tot
alA
sses
sed
Val
ueR
eal P
rope
rty
Publ
ic U
tility
Tan
gibl
e Pe
rson
al P
rope
rty
(1)
Dir
ect
as a
Per
cent
age
ofT
axA
sses
sed
Estim
ated
Ass
esse
d Es
timat
edA
sses
sed
Estim
ated
Ass
esse
dEs
timat
edT
axT
otal
Est
imat
edY
ear
Val
ueA
ctua
l Val
ueV
alue
Act
ual V
alue
Val
ueA
ctua
l Val
ueV
alue
Act
ual V
alue
Rat
eA
ctua
l Val
ue
2001
$633
,752
,330
$1,8
10,7
20,9
40$1
2,94
4,15
0$1
4,70
9,26
0$1
46,8
26,2
49$5
87,3
04,9
90$7
93,5
22,7
29$2
,412
,735
,190
7.32
32.8
9%20
0268
3,14
2,74
01,
951,
836,
400
14,6
67,3
1016
,667
,390
149,
946,
460
599,
785,
848
847,
756,
510
2,56
8,28
9,63
87.
3233
.01%
2003
771,
214,
670
2,20
3,47
0,48
515
,312
,680
17,4
00,7
72
147,
357,
520
589,
430,
080
933,
884,
870
2,81
0,30
1,33
77.
3233
.23%
2004
825,
905,
960
2,35
9,73
1,31
415
,736
,660
17,8
82,5
68
137,
059,
790
548,
239,
160
978,
702,
410
2,92
5,85
3,04
27.
3233
.45%
2005
861,
180,
630
2,46
0,51
6,08
516
,252
,830
18,4
69,1
25
110,
500,
187
442,
000,
748
987,
933,
647
2,92
0,98
5,95
87.
3233
.82%
2006
1,00
4,93
6,08
02,
871,
245,
942
16,1
47,8
4018
,349
,818
77
,362
,457
412,
599,
770
1,09
8,44
6,37
73,
302,
195,
530
7.32
33.2
6%20
071,
035,
101,
280
2,95
7,43
2,23
013
,021
,700
14,7
97,3
90
36,7
31,1
6058
7,69
8,56
01,
084,
854,
140
3,55
9,92
8,18
07.
3230
.47%
2008
1,06
3,36
2,22
0 3,
038,
177,
771
13,4
57,3
40
15,2
92,4
31
4,65
1,04
0 74
,416
,640
1,
081,
470,
600
3,12
7,88
6,84
27.
3234
.58%
2009
1,00
1,90
8,99
0 2,
862,
597,
114
14,3
71,8
00
16,3
31,5
90
3,04
8,21
0 48
,771
,360
1,
019,
329,
000
2,92
7,70
0,06
4 7.
3234
.82%
2010
1,00
6,30
3,28
0 2,
875,
152,
229
15,1
53,8
30
17,2
20,2
61
0 0
1,02
1,45
7,11
0 2,
892,
372,
490
7.32
35.3
2%
Sour
ce:
War
ren
Cou
nty
Aud
itor's
Off
ice
(1)
Tang
ible
Per
sona
l Pro
perty
Tax
was
pha
sed
out
Tot
al
131
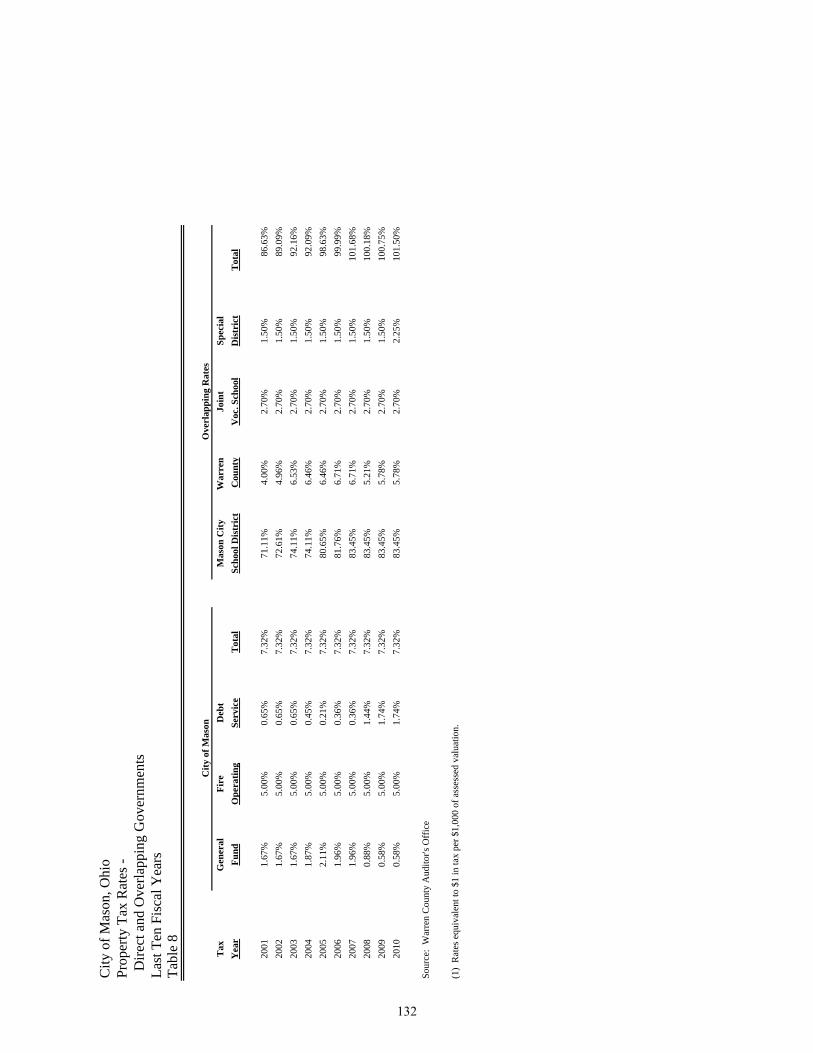
City
of M
ason
, Ohi
oPr
oper
ty T
ax R
ates
- D
irect
and
Ove
rlapp
ing
Gov
ernm
ents
Last
Ten
Fis
cal Y
ears
Tabl
e 8
Tax
Gen
eral
Fire
Deb
tM
ason
City
War
ren
Join
tSp
ecia
lY
ear
Fund
Ope
ratin
gSe
rvic
eT
otal
Scho
ol D
istr
ict
Cou
nty
Voc
. Sch
ool
Dis
tric
tT
otal
2001
1.67
%5.
00%
0.65
%7.
32%
71.1
1%4.
00%
2.70
%1.
50%
86.6
3%20
021.
67%
5.00
%0.
65%
7.32
%72
.61%
4.96
%2.
70%
1.50
%89
.09%
2003
1.67
%5.
00%
0.65
%7.
32%
74.1
1%6.
53%
2.70
%1.
50%
92.1
6%20
041.
87%
5.00
%0.
45%
7.32
%74
.11%
6.46
%2.
70%
1.50
%92
.09%
2005
2.11
%5.
00%
0.21
%7.
32%
80.6
5%6.
46%
2.70
%1.
50%
98.6
3%20
061.
96%
5.00
%0.
36%
7.32
%81
.76%
6.71
%2.
70%
1.50
%99
.99%
2007
1.96
%5.
00%
0.36
%7.
32%
83.4
5%6.
71%
2.70
%1.
50%
101.
68%
2008
0.88
%5.
00%
1.44
%7.
32%
83.4
5%5.
21%
2.70
%1.
50%
100.
18%
2009
0.58
%5.
00%
1.74
%7.
32%
83.4
5%5.
78%
2.70
%1.
50%
100.
75%
2010
0.58
%5.
00%
1.74
%7.
32%
83.4
5%5.
78%
2.70
%2.
25%
101.
50%
Sour
ce:
War
ren
Cou
nty
Aud
itor's
Off
ice
(1)
Rat
es e
quiv
alen
t to
$1 in
tax
per $
1,00
0 of
ass
esse
d va
luat
ion.
City
of M
ason
Ove
rlap
ping
Rat
es
132
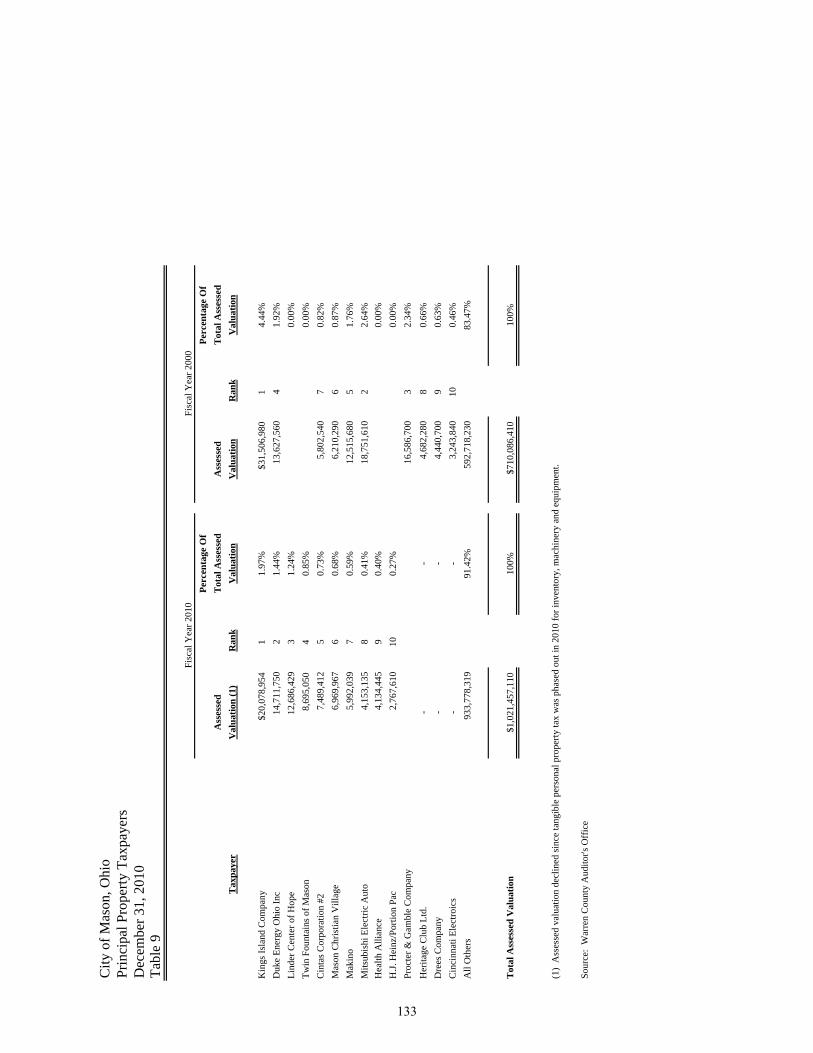
City
of M
ason
, Ohi
oPr
inci
pal P
rope
rty T
axpa
yer s
Dec
embe
r 31,
201
0
Tabl
e 9
Perc
enta
ge O
fPe
rcen
tage
Of
A
sses
sed
Tot
al A
sses
sed
Ass
esse
dT
otal
Ass
esse
dT
axpa
yer
Val
uatio
n (1
)R
ank
Val
uatio
nV
alua
tion
Ran
kV
alua
tion
Kin
gs Is
land
Com
pany
$20,
078,
954
11.
97%
$31,
506,
980
14.
44%
Duk
e En
ergy
Ohi
o In
c14
,711
,750
2
1.44
%13
,627
,560
4
1.92
%Li
nder
Cen
ter o
f Hop
e12
,686
,429
3
1.24
%0.
00%
Twin
Fou
ntai
ns o
f Mas
on8,
695,
050
40.
85%
0.00
%C
inta
s Cor
pora
tion
#27,
489,
412
5 0.
73%
5,80
2,54
0 7
0.82
%M
ason
Chr
istia
n V
illag
e6,
969,
967
6 0.
68%
6,21
0,29
0 6
0.87
%M
akin
o5,
992,
039
7 0.
59%
12,5
15,6
80
5 1.
76%
M
itsub
ishi
Ele
ctric
Aut
o4,
153,
135
8 0.
41%
18,7
51,6
10
2 2.
64%
Hea
lth A
llian
ce4,
134,
445
9 0.
40%
0.00
%H
.J. H
einz
/Por
tion
Pac
2,76
7,61
0 10
0.
27%
0.00
%Pr
octe
r & G
ambl
e C
ompa
ny16
,586
,700
3
2.34
%H
erita
ge C
lub
Ltd.
--
4,68
2,28
0 8
0.66
%D
rees
Com
pany
--
4,44
0,70
0 9
0.63
%C
inci
nnat
i Ele
ctro
ics
--
3,24
3,84
0 10
0.
46%
All
Oth
ers
933,
778,
319
91.4
2%59
2,71
8,23
0 83
.47%
T
otal
Ass
esse
d V
alua
tion
$1,0
21,4
57,1
1010
0%$7
10,0
86,4
1010
0%
(1)
Ass
esse
d va
luat
ion
decl
ined
sinc
e ta
ngib
le p
erso
nal p
rope
rty ta
x w
as p
hase
d ou
t in
2010
for i
nven
tory
, mac
hine
ry a
nd e
quip
men
t.
Sour
ce:
War
ren
Cou
nty
Aud
itor's
Off
ice
Fisc
al Y
ear 2
010
Fisc
al Y
ear 2
000
133
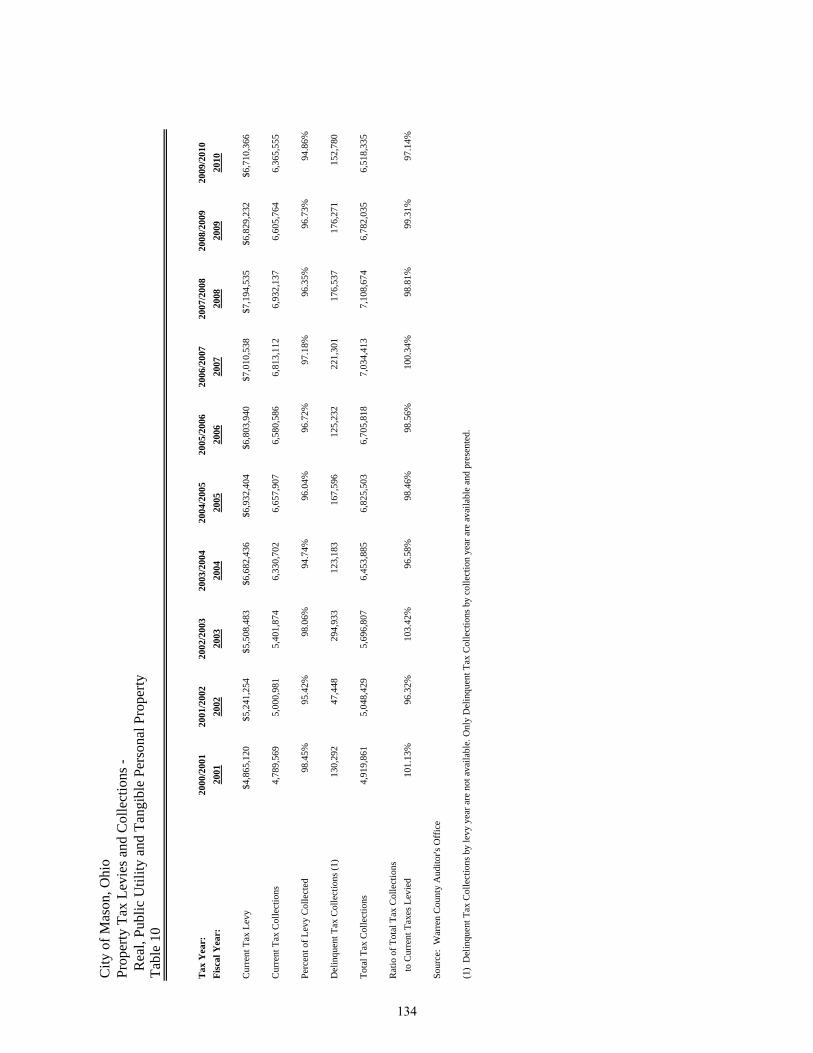
City
of M
ason
, Ohi
oPr
oper
ty T
ax L
evie
s and
Col
lect
ions
- R
eal,
Publ
ic U
tility
and
Tan
gibl
e Pe
rson
al P
rope
rtyTa
ble
10
Tax
Yea
r:20
00/2
001
2001
/200
220
02/2
003
2003
/200
420
04/2
005
2005
/200
620
06/2
007
2007
/200
820
08/2
009
2009
/201
0Fi
scal
Yea
r:20
0120
0220
0320
0420
0520
0620
0720
0820
0920
10
Cur
rent
Tax
Lev
y$4
,865
,120
$5,2
41,2
54$5
,508
,483
$6,6
82,4
36$6
,932
,404
$6,8
03,9
40$7
,010
,538
$7,1
94,5
35$6
,829
,232
$6,7
10,3
66
Cur
rent
Tax
Col
lect
ions
4,78
9,56
95,
000,
981
5,40
1,87
46,
330,
702
6,65
7,90
76,
580,
586
6,81
3,11
26,
932,
137
6,60
5,76
46,
365,
555
Perc
ent o
f Lev
y C
olle
cted
98.4
5%95
.42%
98.0
6%94
.74%
96.0
4%96
.72%
97.1
8%96
.35%
96.7
3%94
.86%
Del
inqu
ent T
ax C
olle
ctio
ns (1
)13
0,29
247
,448
294,
933
123,
183
167,
596
125,
232
221,
301
176,
537
176,
271
152,
780
Tota
l Tax
Col
lect
ions
4,91
9,86
15,
048,
429
5,69
6,80
76,
453,
885
6,82
5,50
36,
705,
818
7,03
4,41
37,
108,
674
6,78
2,03
56,
518,
335
Rat
io o
f Tot
al T
ax C
olle
ctio
ns
to C
urre
nt T
axes
Lev
ied
101.
13%
96.3
2%10
3.42
%96
.58%
98.4
6%98
.56%
100.
34%
98.8
1%99
.31%
97.1
4%
Sour
ce:
War
ren
Cou
nty
Aud
itor's
Off
ice
(1)
Del
inqu
ent T
ax C
olle
ctio
ns b
y le
vy y
ear a
re n
ot a
vaila
ble.
Onl
y D
elin
quen
t Tax
Col
lect
ions
by
colle
ctio
n ye
ar a
re a
vaila
ble
and
pres
ente
d.
134
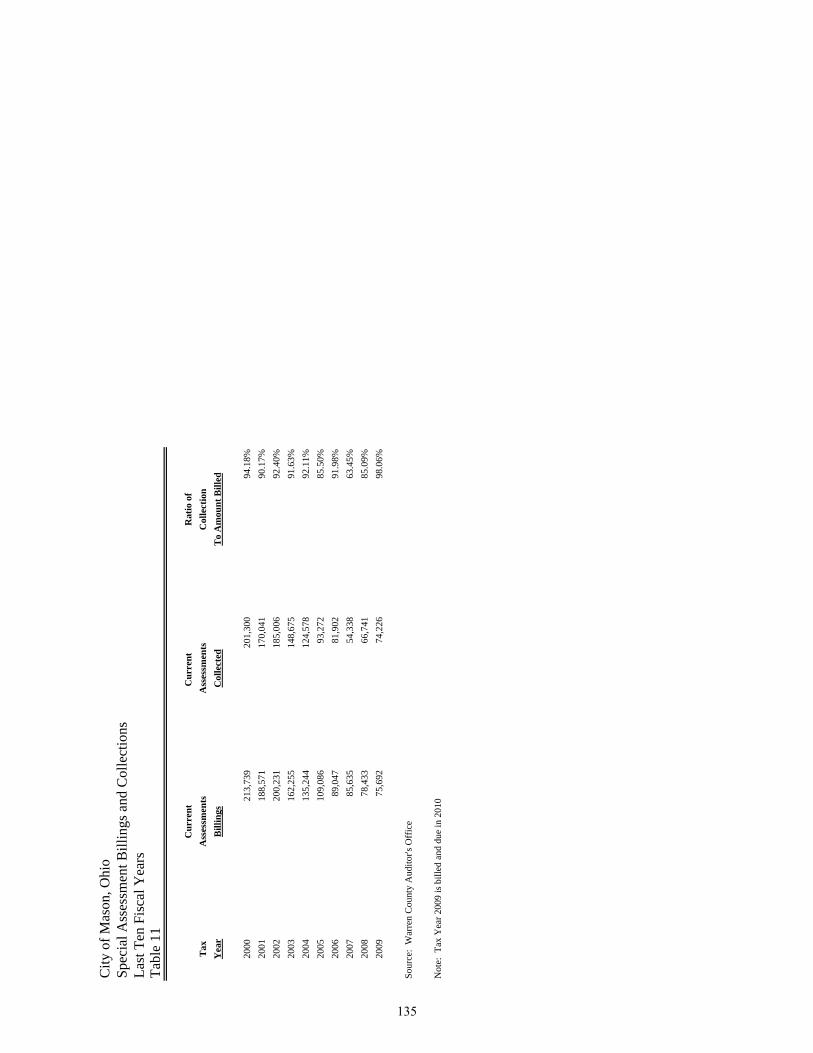
City
of M
ason
, Ohi
oSp
ecia
l Ass
essm
ent B
illin
gs a
nd C
olle
ctio
nsLa
st T
en F
isca
l Yea
rsTa
ble
11
Cur
rent
Cur
rent
R
atio
of
Tax
Ass
essm
ents
Ass
essm
ents
Col
lect
ion
Yea
rB
illin
gsC
olle
cted
To
Am
ount
Bill
ed
2000
213,
739
201,
300
94.1
8%20
0118
8,57
117
0,04
190
.17%
2002
200,
231
185,
006
92.4
0%20
0316
2,25
514
8,67
591
.63%
2004
135,
244
124,
578
92.1
1%20
0510
9,08
693
,272
85.5
0%20
0689
,047
81,9
0291
.98%
2007
85,6
3554
,338
63.4
5%20
0878
,433
66,7
4185
.09%
2009
75,6
9274
,226
98.0
6%
Sour
ce:
War
ren
Cou
nty
Aud
itor's
Off
ice
Not
e: T
ax Y
ear 2
009
is b
illed
and
due
in 2
010
135
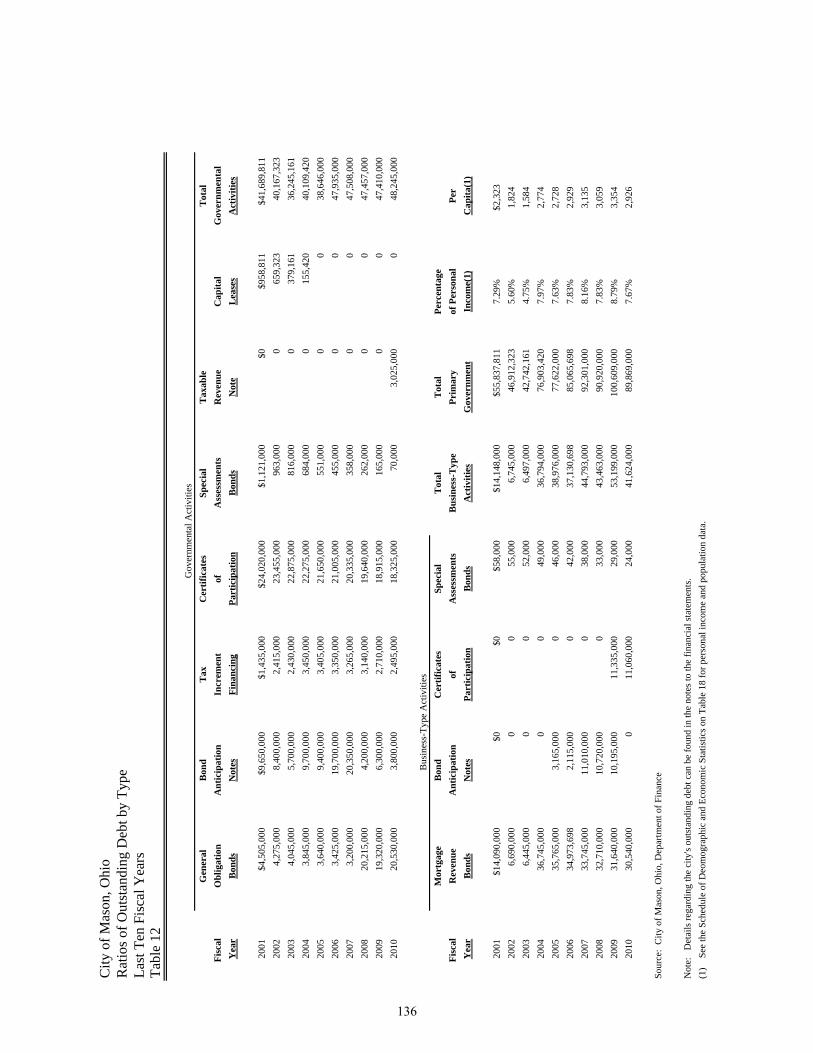
City
of M
ason
, Ohi
oR
atio
s of O
utst
andi
ng D
ebt b
y Ty
p eLa
st T
en F
isca
l Yea
rsTa
ble
12
Gen
eral
Bon
dT
axC
ertif
icat
esSp
ecia
lT
axab
leT
otal
Fisc
al
Obl
igat
ion
Ant
icip
atio
nIn
crem
ent
ofA
sses
smen
tsR
even
ueC
apita
lG
over
nmen
tal
Yea
rB
onds
Not
esFi
nanc
ing
Part
icip
atio
nB
onds
Not
eL
ease
sA
ctiv
ities
2001
$4,5
05,0
00$9
,650
,000
$1,4
35,0
00$2
4,02
0,00
0$1
,121
,000
$0$9
58,8
11$4
1,68
9,81
120
024,
275,
000
8,40
0,00
0
2,
415,
000
23,4
55,0
0096
3,00
0
065
9,32
340
,167
,323
2003
4,04
5,00
0
5,
700,
000
2,43
0,00
0
22
,875
,000
816,
000
0
379,
161
36,2
45,1
61
20
043,
845,
000
9,70
0,00
0
3,
450,
000
22,2
75,0
00
68
4,00
0
015
5,42
040
,109
,420
2005
3,64
0,00
0
9,
400,
000
3,40
5,00
0
21
,650
,000
551,
000
0
038
,646
,000
2006
3,42
5,00
0
19
,700
,000
3,35
0,00
0
21
,005
,000
455,
000
0
047
,935
,000
2007
3,20
0,00
0
20
,350
,000
3,26
5,00
0
20
,335
,000
358,
000
0
047
,508
,000
2008
20,2
15,0
00
4,
200,
000
3,14
0,00
0
19
,640
,000
262,
000
0
047
,457
,000
2009
19,3
20,0
00
6,
300,
000
2,71
0,00
0
18
,915
,000
165,
000
0
047
,410
,000
2010
20,5
30,0
00
3,
800,
000
2,49
5,00
0
18
,325
,000
70,0
00
3,
025,
000
048
,245
,000
Mor
tgag
eB
ond
Cer
tific
ates
Spec
ial
Tot
alT
otal
Perc
enta
geFi
scal
R
even
ueA
ntic
ipat
ion
ofA
sses
smen
tsB
usin
ess-
Typ
ePr
imar
yof
Per
sona
lPe
rY
ear
Bon
dsN
otes
Part
icip
atio
nB
onds
Act
iviti
esG
over
nmen
tIn
com
e(1)
Cap
ita(1
)
2001
$14,
090,
000
$0$0
$58,
000
$14,
148,
000
$55,
837,
811
7.29
%$2
,323
2002
6,69
0,00
0
0
055
,000
6,74
5,00
0
46
,912
,323
5.60
%1,
824
2003
6,44
5,00
0
0
052
,000
6,49
7,00
0
42
,742
,161
4.75
%1,
584
2004
36,7
45,0
00
0
049
,000
36,7
94,0
00
76
,903
,420
7.97
%2,
774
2005
35,7
65,0
00
3,
165,
000
046
,000
38,9
76,0
00
77
,622
,000
7.63
%2,
728
2006
34,9
73,6
98
2,
115,
000
042
,000
37,1
30,6
98
85
,065
,698
7.83
%2,
929
2007
33,7
45,0
00
11
,010
,000
038
,000
44,7
93,0
00
92
,301
,000
8.16
%3,
135
2008
32,7
10,0
00
10
,720
,000
033
,000
43,4
63,0
00
90
,920
,000
7.83
%3,
059
2009
31,6
40,0
00
10
,195
,000
11,3
35,0
0029
,000
53,1
99,0
00
10
0,60
9,00
0
8.79
%3,
354
2010
30,5
40,0
00
0
11,0
60,0
00
24
,000
41,6
24,0
00
89
,869
,000
7.67
%2,
926
Sour
ce:
City
of M
ason
, Ohi
o, D
epar
tmen
t of F
inan
ce
Not
e:
Det
ails
rega
rdin
g th
e ci
ty's
outs
tand
ing
debt
can
be
foun
d in
the
note
s to
the
finan
cial
stat
emen
ts.
(1)
See
the
Sche
dule
of D
eom
ogra
phic
and
Eco
nom
ic S
tatis
tics o
n Ta
ble
18 fo
r per
sona
l inc
ome
and
popu
latio
n da
ta.
Gov
ernm
enta
l Act
iviti
es
Bus
ines
s-Ty
pe A
ctiv
ities
136
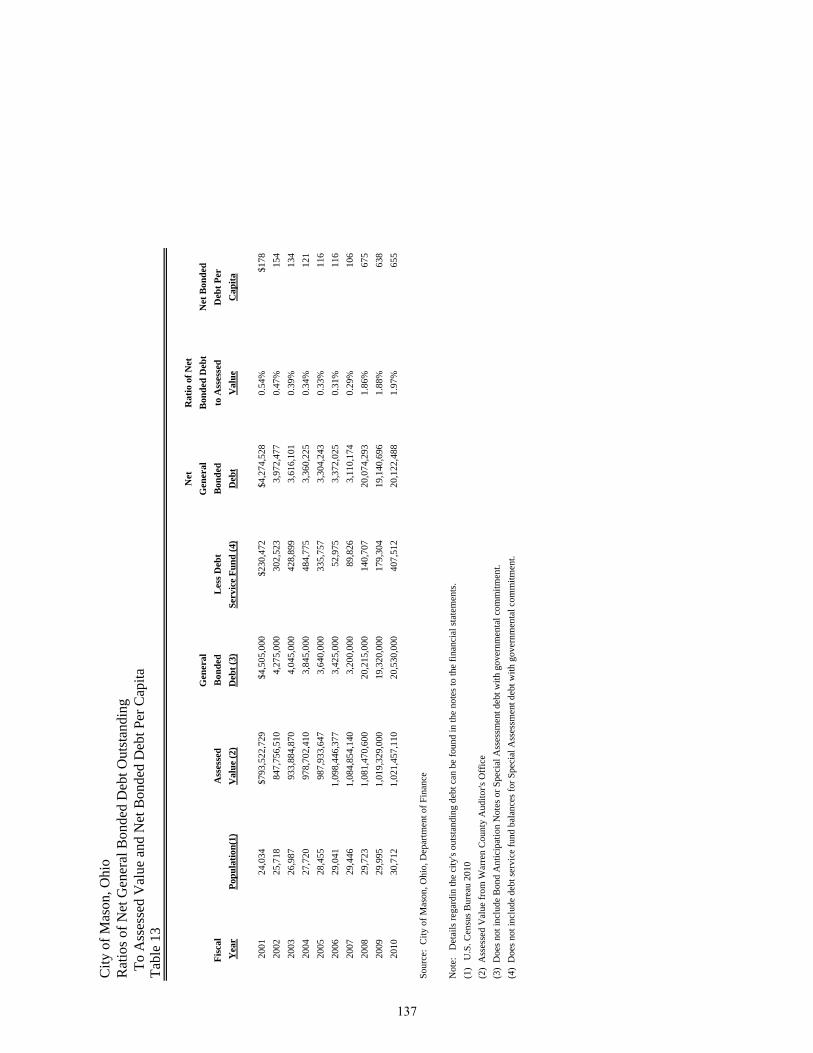
City
of M
ason
, Ohi
oR
atio
s of N
et G
ener
al B
onde
d D
ebt O
utst
andi
ng T
o A
sses
sed
Val
ue a
nd N
et B
onde
d D
ebt P
er C
apita
Tabl
e 13
Net
Rat
io o
f Net
Gen
eral
Gen
eral
Bon
ded
Deb
tN
et B
onde
dFi
scal
A
sses
sed
Bon
ded
Les
s Deb
tB
onde
dto
Ass
esse
dD
ebt P
erY
ear
Popu
latio
n(1)
Val
ue (2
)D
ebt (
3)Se
rvic
e Fu
nd (4
)D
ebt
Val
ueC
apita
2001
24,0
34$7
93,5
22,7
29$4
,505
,000
$230
,472
$4,2
74,5
280.
54%
$178
2002
25,7
1884
7,75
6,51
04,
275,
000
302,
523
3,97
2,47
70.
47%
154
2003
26,9
8793
3,88
4,87
04,
045,
000
428,
899
3,61
6,10
10.
39%
134
2004
27,7
2097
8,70
2,41
03,
845,
000
484,
775
3,36
0,22
50.
34%
121
2005
28,4
5598
7,93
3,64
73,
640,
000
335,
757
3,30
4,24
30.
33%
116
2006
29,0
411,
098,
446,
377
3,42
5,00
052
,975
3,37
2,02
50.
31%
116
2007
29,4
461,
084,
854,
140
3,20
0,00
089
,826
3,11
0,17
40.
29%
106
2008
29,7
231,
081,
470,
600
20,2
15,0
0014
0,70
720
,074
,293
1.86
%67
520
0929
,995
1,01
9,32
9,00
019
,320
,000
179,
304
19,1
40,6
961.
88%
638
2010
30,7
121,
021,
457,
110
20,5
30,0
0040
7,51
220
,122
,488
1.97
%65
5 So
urce
: C
ity o
f Mas
on, O
hio,
Dep
artm
ent o
f Fin
ance
Not
e:
Det
ails
rega
rdin
the
city
's ou
tsta
ndin
g de
bt c
an b
e fo
und
in th
e no
tes t
o th
e fin
anci
al st
atem
ents
.(1
) U
.S. C
ensu
s Bur
eau
2010
(2)
Ass
esse
d V
alue
from
War
ren
Cou
nty
Aud
itor's
Off
ice
(3)
Doe
s not
incl
ude
Bon
d A
ntic
ipat
ion
Not
es o
r Spe
cial
Ass
essm
ent d
ebt w
ith g
over
nmen
tal c
omm
itmen
t.
(4)
Doe
s not
incl
ude
debt
serv
ice
fund
bal
ance
s for
Spe
cial
Ass
essm
ent d
ebt w
ith g
over
nmen
tal c
omm
itmen
t.
137
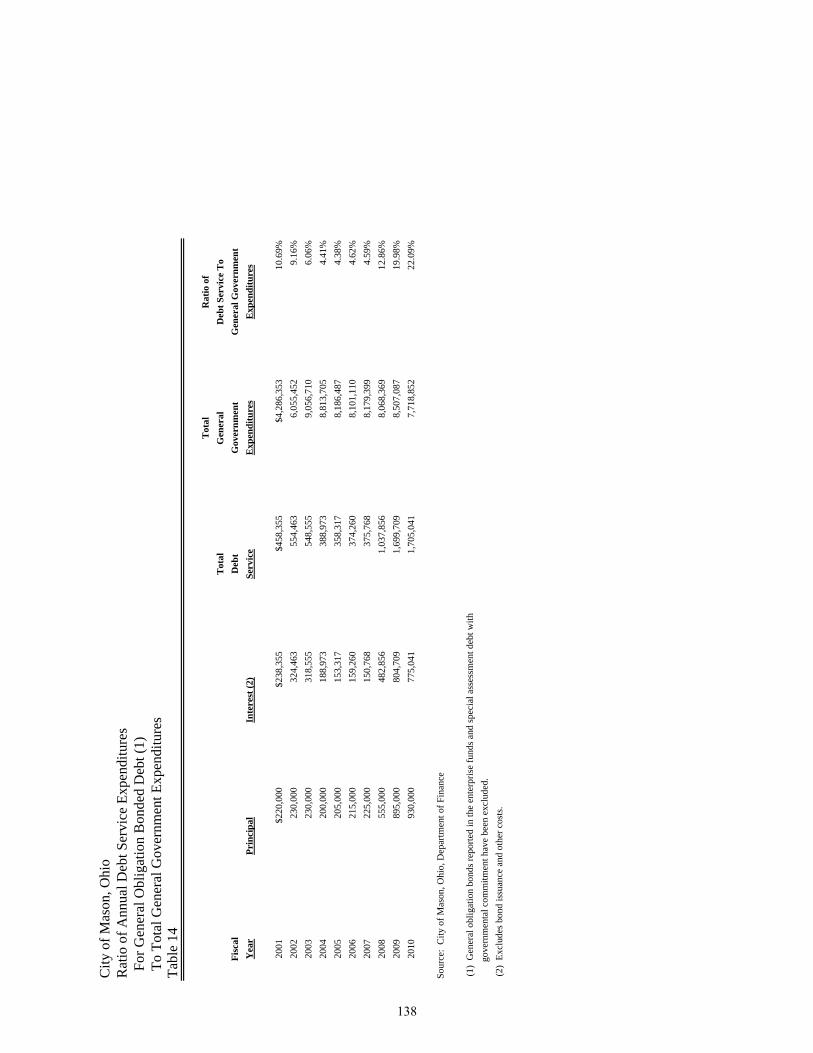
City
of M
ason
, Ohi
oR
atio
of A
nnua
l Deb
t Ser
vice
Exp
endi
ture
s F
or G
ener
al O
blig
atio
n B
onde
d D
ebt (
1) T
o To
tal G
ener
al G
over
nmen
t Exp
endi
ture
sTa
ble
14
T
otal
Rat
io o
f
Tot
alG
ener
alD
ebt S
ervi
ce T
oFi
scal
Deb
tG
over
nmen
tG
ener
al G
over
nmen
tY
ear
Prin
cipa
lIn
tere
st (2
)Se
rvic
eE
xpen
ditu
res
Exp
endi
ture
s
2001
$220
,000
$238
,355
$458
,355
$4,2
86,3
5310
.69%
2002
230,
000
324,
463
554,
463
6,05
5,45
29.
16%
2003
230,
000
318,
555
548,
555
9,05
6,71
06.
06%
2004
200,
000
188,
973
388,
973
8,81
3,70
54.
41%
2005
205,
000
153,
317
358,
317
8,18
6,48
74.
38%
2006
215,
000
159,
260
374,
260
8,10
1,11
04.
62%
2007
225,
000
150,
768
375,
768
8,17
9,39
94.
59%
2008
555,
000
482,
856
1,03
7,85
68,
068,
369
12.8
6%20
0989
5,00
080
4,70
91,
699,
709
8,50
7,08
719
.98%
2010
930,
000
775,
041
1,70
5,04
17,
718,
852
22.0
9%
Sour
ce:
City
of M
ason
, Ohi
o, D
epar
tmen
t of F
inan
ce
(1)
Gen
eral
obl
igat
ion
bond
s rep
orte
d in
the
ente
rpris
e fu
nds a
nd sp
ecia
l ass
essm
ent d
ebt w
ith
gov
ernm
enta
l com
mitm
ent h
ave
been
exc
lude
d. (2
) Ex
clud
es b
ond
issu
ance
and
oth
er c
osts
.
138
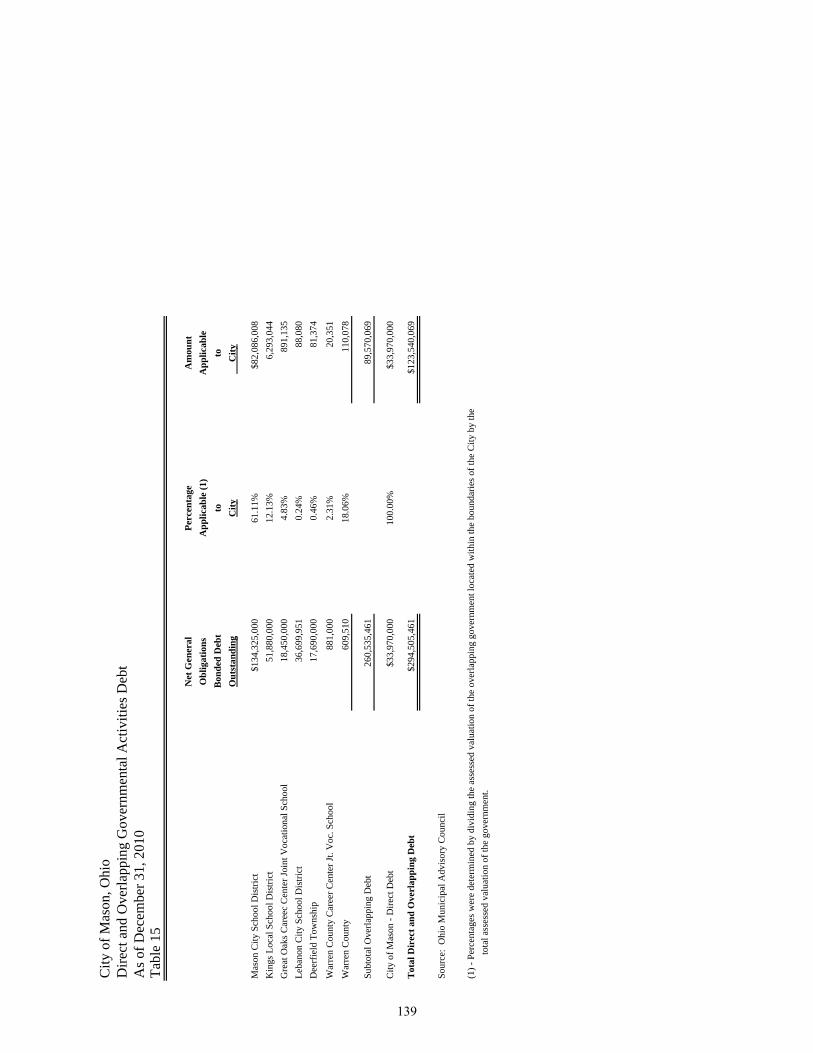
City
of M
ason
, Ohi
oD
irect
and
Ove
rlapp
ing
Gov
ernm
enta
l Act
iviti
es D
ebt
As o
f Dec
embe
r 31,
201
0Ta
ble
15
Net
Gen
eral
Perc
enta
ge
Am
ount
Obl
igat
ions
App
licab
le (1
)
App
licab
leB
onde
d D
ebt
to
to
Out
stan
ding
City
C
ity
Mas
on C
ity S
choo
l Dis
trict
$134
,325
,000
61.1
1%$8
2,08
6,00
8K
ings
Loc
al S
choo
l Dis
trict
51,8
80,0
0012
.13%
6,29
3,04
4G
reat
Oak
s Car
eec
Cen
ter J
oint
Voc
atio
nal S
choo
l18
,450
,000
4.83
%89
1,13
5Le
bano
n C
ity S
choo
l Dis
trict
36,6
99,9
510.
24%
88,0
80D
eerf
ield
Tow
nshi
p17
,690
,000
0.46
%81
,374
War
ren
Cou
nty
Car
eer C
ente
r Jt.
Voc
. Sch
ool
881,
000
2.31
%20
,351
War
ren
Cou
nty
609,
510
18.0
6%11
0,07
8
Subt
otal
Ove
rlapp
ing
Deb
t26
0,53
5,46
189
,570
,069
City
of M
ason
- D
irect
Deb
t$3
3,97
0,00
010
0.00
%$3
3,97
0,00
0
Tot
al D
irec
t and
Ove
rlap
ping
Deb
t$2
94,5
05,4
61$1
23,5
40,0
69
Sour
ce:
Ohi
o M
unic
ipal
Adv
isor
y C
ounc
il
(1) -
Per
cent
ages
wer
e de
term
ined
by
divi
ding
the
asse
ssed
val
uatio
n of
the
over
lapp
ing
gove
rnm
ent l
ocat
ed w
ithin
the
boun
darie
s of t
he C
ity b
y th
e
tota
l ass
esse
d va
luat
ion
of th
e go
vern
men
t.
139
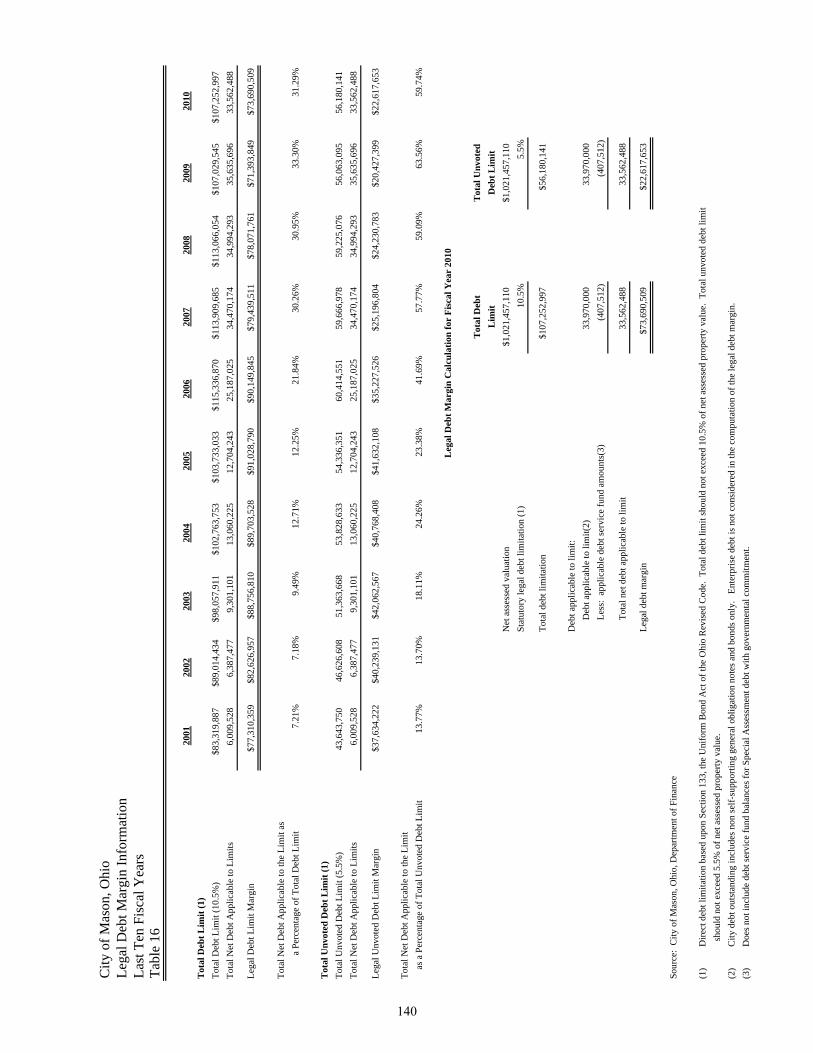
City
of M
ason
, Ohi
oLe
gal D
ebt M
argi
n In
form
atio
nLa
st T
en F
isca
l Yea
rsTa
ble
16
2001
2002
2003
2004
2005
2006
2007
2008
2009
2010
Tot
al D
ebt L
imit
(1)
Tota
l Deb
t Lim
it (1
0.5%
)$8
3,31
9,88
7$8
9,01
4,43
4$9
8,05
7,91
1$1
02,7
63,7
53$1
03,7
33,0
33$1
15,3
36,8
70$1
13,9
09,6
85$1
13,0
66,0
54$1
07,0
29,5
45$1
07,2
52,9
97To
tal N
et D
ebt A
pplic
able
to L
imits
6,00
9,52
86,
387,
477
9,30
1,10
113
,060
,225
12,7
04,2
4325
,187
,025
34,4
70,1
7434
,994
,293
35,6
35,6
9633
,562
,488
Lega
l Deb
t Lim
it M
argi
n$7
7,31
0,35
9$8
2,62
6,95
7$8
8,75
6,81
0$8
9,70
3,52
8$9
1,02
8,79
0$9
0,14
9,84
5$7
9,43
9,51
1$7
8,07
1,76
1$7
1,39
3,84
9$7
3,69
0,50
9
Tota
l Net
Deb
t App
licab
le to
the
Lim
it as
a
Per
cent
age
of T
otal
Deb
t Lim
it7.
21%
7.18
%9.
49%
12.7
1%12
.25%
21.8
4%30
.26%
30.9
5%33
.30%
31.2
9%
Tot
al U
nvot
ed D
ebt L
imit
(1)
Tota
l Unv
oted
Deb
t Lim
it (5
.5%
)43
,643
,750
46,6
26,6
0851
,363
,668
53,8
28,6
3354
,336
,351
60,4
14,5
5159
,666
,978
59,2
25,0
7656
,063
,095
56,1
80,1
41To
tal N
et D
ebt A
pplic
able
to L
imits
6,00
9,52
86,
387,
477
9,30
1,10
113
,060
,225
12,7
04,2
4325
,187
,025
34,4
70,1
7434
,994
,293
35,6
35,6
9633
,562
,488
Lega
l Unv
oted
Deb
t Lim
it M
argi
n$3
7,63
4,22
2$4
0,23
9,13
1$4
2,06
2,56
7$4
0,76
8,40
8$4
1,63
2,10
8$3
5,22
7,52
6$2
5,19
6,80
4$2
4,23
0,78
3$2
0,42
7,39
9$2
2,61
7,65
3
Tota
l Net
Deb
t App
licab
le to
the
Lim
it
as a
Per
cent
age
of T
otal
Unv
oted
Deb
t Lim
it13
.77%
13.7
0%18
.11%
24.2
6%23
.38%
41.6
9%57
.77%
59.0
9%63
.56%
59.7
4%
Tot
al D
ebt
Tot
al U
nvot
edL
imit
Deb
t Lim
itN
et a
sses
sed
valu
atio
nSt
atut
ory
lega
l deb
t lim
itatio
n (1
)10
.5%
5.5%
Tota
l deb
t lim
itatio
n$1
07,2
52,9
97$5
6,18
0,14
1
Deb
t app
licab
le to
lim
it:
Deb
t app
licab
le to
lim
it(2)
33,9
70,0
0033
,970
,000
L
ess:
app
licab
le d
ebt s
ervi
ce fu
nd a
mou
nts(
3)(4
07,5
12)
(407
,512
)
T
otal
net
deb
t app
licab
le to
lim
it33
,562
,488
33,5
62,4
88
Lega
l deb
t mar
gin
$73,
690,
509
$22,
617,
653
Sour
ce:
City
of M
ason
, Ohi
o, D
epar
tmen
t of F
inan
ce
(1)
Dire
ct d
ebt l
imita
tion
base
d up
on S
ectio
n 13
3, th
e U
nifo
rm B
ond
Act
of t
he O
hio
Rev
ised
Cod
e. T
otal
deb
t lim
it sh
ould
not
exc
eed
10.5
% o
f net
ass
esse
d pr
oper
ty v
alue
. To
tal u
nvot
ed d
ebt l
imit
sh
ould
not
exc
eed
5.5%
of n
et a
sses
sed
prop
erty
val
ue.
(2)
City
deb
t out
stan
ding
incl
udes
non
self-
supp
ortin
g ge
nera
l obl
igat
ion
note
s and
bon
ds o
nly.
En
terp
rise
debt
is n
ot c
onsi
dere
d in
the
com
puta
tion
of th
e le
gal d
ebt m
argi
n.(3
)
D
oes n
ot in
clud
e de
bt se
rvic
e fu
nd b
alan
ces f
or S
peci
al A
sses
smen
t deb
t with
gov
ernm
enta
l com
mitm
ent.
Leg
al D
ebt M
argi
n C
alcu
latio
n fo
r Fi
scal
Yea
r 20
10
$1,0
21,4
57,1
10$1
,021
,457
,110
140
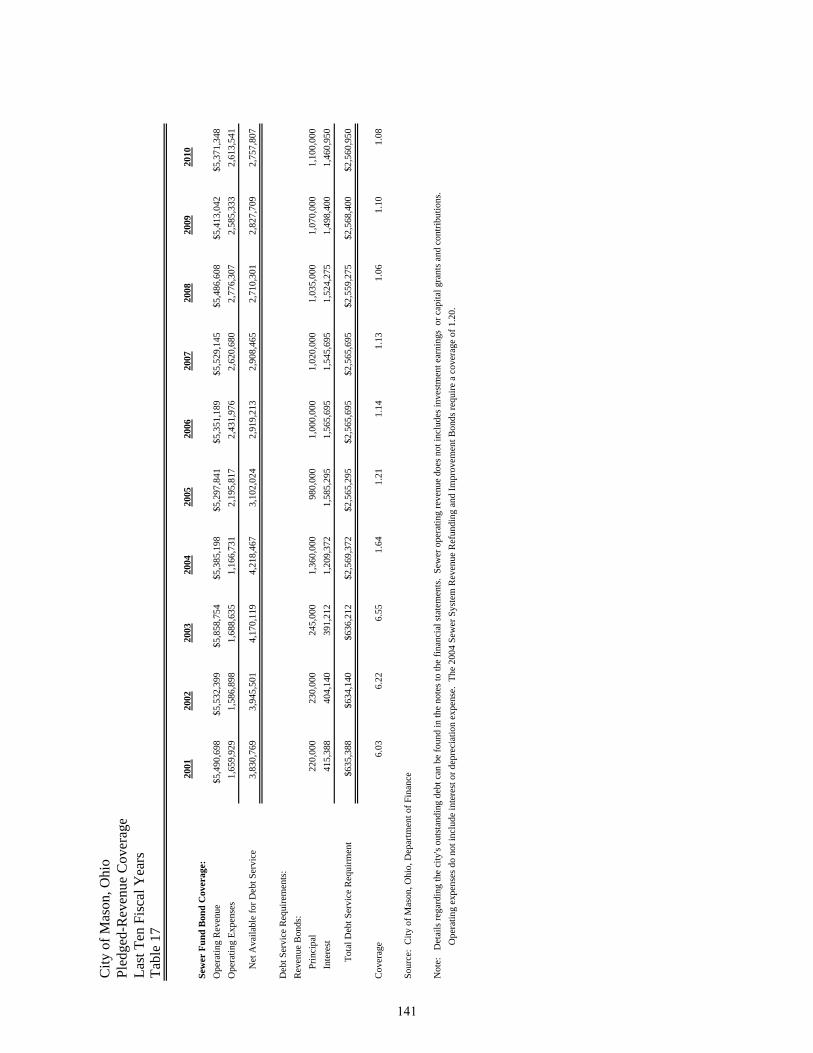
City
of M
ason
, Ohi
oPl
edge
d-R
even
ue C
over
age
Last
Ten
Fis
cal Y
ears
Tabl
e 17
20
0120
0220
0320
0420
0520
0620
0720
0820
0920
10Se
wer
Fun
d B
ond
Cov
erag
e:O
pera
ting
Rev
enue
$5,4
90,6
98$5
,532
,399
$5,8
58,7
54$5
,385
,198
$5,2
97,8
41$5
,351
,189
$5,5
29,1
45$5
,486
,608
$5,4
13,0
42$5
,371
,348
Ope
ratin
g Ex
pens
es1,
659,
929
1,58
6,89
81,
688,
635
1,16
6,73
12,
195,
817
2,43
1,97
62,
620,
680
2,77
6,30
72,
585,
333
2,61
3,54
1
N
et A
vaila
ble
for D
ebt S
ervi
ce3,
830,
769
3,94
5,50
14,
170,
119
4,21
8,46
73,
102,
024
2,91
9,21
32,
908,
465
2,71
0,30
12,
827,
709
2,75
7,80
7
Deb
t Ser
vice
Req
uire
men
ts:
Rev
enue
Bon
ds:
P
rinci
pal
220,
000
230,
000
245,
000
1,36
0,00
098
0,00
01,
000,
000
1,02
0,00
01,
035,
000
1,07
0,00
01,
100,
000
In
tere
st41
5,38
840
4,14
039
1,21
21,
209,
372
1,58
5,29
51,
565,
695
1,54
5,69
51,
524,
275
1,49
8,40
01,
460,
950
Tot
al D
ebt S
ervi
ce R
equi
rmen
t$6
35,3
88$6
34,1
40$6
36,2
12$2
,569
,372
$2,5
65,2
95$2
,565
,695
$2,5
65,6
95$2
,559
,275
$2,5
68,4
00$2
,560
,950
Cov
erag
e6.
036.
226.
551.
641.
211.
141.
131.
061.
101.
08
Sour
ce:
City
of M
ason
, Ohi
o, D
epar
tmen
t of F
inan
ce
Not
e:
Det
ails
rega
rdin
g th
e ci
ty's
outs
tand
ing
debt
can
be
foun
d in
the
note
s to
the
finan
cial
stat
emen
ts.
Sew
er o
pera
ting
reve
nue
does
not
incl
udes
inve
stm
ent e
arni
ngs
or c
apita
l gra
nts a
nd c
ontri
butio
ns.
Ope
ratin
g ex
pens
es d
o no
t inc
lude
inte
rest
or d
epre
ciat
ion
expe
nse.
The
200
4 Se
wer
Sys
tem
Rev
enue
Ref
undi
ng a
nd Im
prov
emen
t Bon
ds re
quire
a c
over
age
of 1
.20.
141
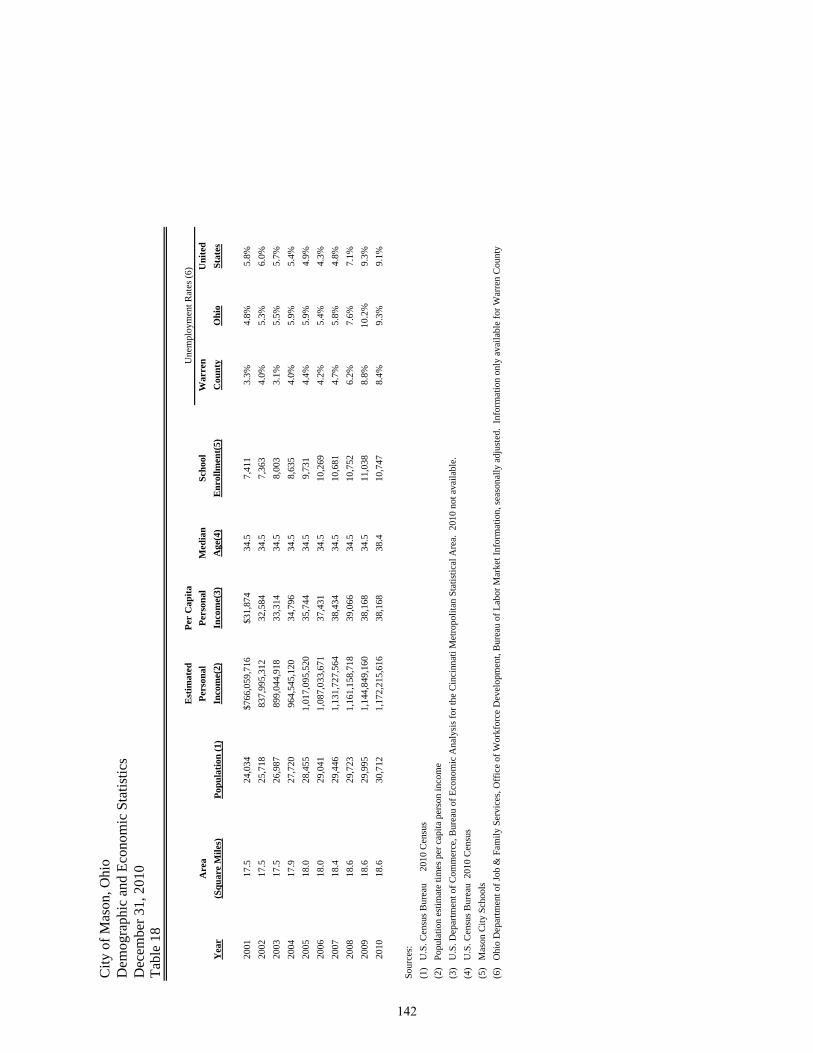
City
of M
ason
, Ohi
oD
emog
raph
ic a
nd E
cono
mic
Sta
tistic
sD
ecem
ber 3
1, 2
010
Tabl
e 18
Est
imat
edPe
r C
apita
Are
aPe
rson
alPe
rson
alM
edia
nSc
hool
War
ren
Uni
ted
Yea
r(S
quar
e M
iles)
Popu
latio
n (1
)In
com
e(2)
Inco
me(
3)A
ge(4
)E
nrol
lmen
t(5)
Cou
nty
Ohi
oSt
ates
2001
17.5
24,0
34$7
66,0
59,7
16$3
1,87
434
.57,
411
3.3%
4.8%
5.8%
2002
17.5
25,7
1883
7,99
5,31
232
,584
34.5
7,36
34.
0%5.
3%6.
0%20
0317
.526
,987
899,
044,
918
33,3
1434
.58,
003
3.1%
5.5%
5.7%
2004
17.9
27,7
2096
4,54
5,12
034
,796
34.5
8,63
54.
0%5.
9%5.
4%20
0518
.028
,455
1,01
7,09
5,52
035
,744
34.5
9,73
14.
4%5.
9%4.
9%20
0618
.029
,041
1,08
7,03
3,67
137
,431
34.5
10,2
694.
2%5.
4%4.
3%20
0718
.429
,446
1,13
1,72
7,56
438
,434
34.5
10,6
814.
7%5.
8%4.
8%20
0818
.629
,723
1,16
1,15
8,71
839
,066
34.5
10,7
526.
2%7.
6%7.
1%20
0918
.629
,995
1,14
4,84
9,16
038
,168
34.5
11,0
388.
8%10
.2%
9.3%
2010
18.6
30,7
121,
172,
215,
616
38,1
6838
.410
,747
8.4%
9.3%
9.1%
Sour
ces:
(1)
U.S
. Cen
sus B
urea
u
201
0 C
ensu
s(2
) P
opul
atio
n es
timat
e tim
es p
er c
apita
per
son
inco
me
(3)
U.S
. Dep
artm
ent o
f Com
mer
ce, B
urea
u of
Eco
nom
ic A
naly
sis f
or th
e C
inci
nnat
i Met
ropo
litan
Sta
tistic
al A
rea.
201
0 no
t ava
ilabl
e.(4
) U
.S. C
ensu
s Bur
eau
201
0 C
ensu
s(5
) M
ason
City
Sch
ools
(6)
Ohi
o D
epar
tmen
t of J
ob &
Fam
ily S
ervi
ces,
Off
ice
of W
orkf
orce
Dev
elop
men
t, B
urea
u of
Lab
or M
arke
t Inf
orm
atio
n, se
ason
ally
adj
uste
d. I
nfor
mat
ion
only
ava
ilabl
e fo
r War
ren
Cou
nty
Une
mpl
oym
ent R
ates
(6)
142
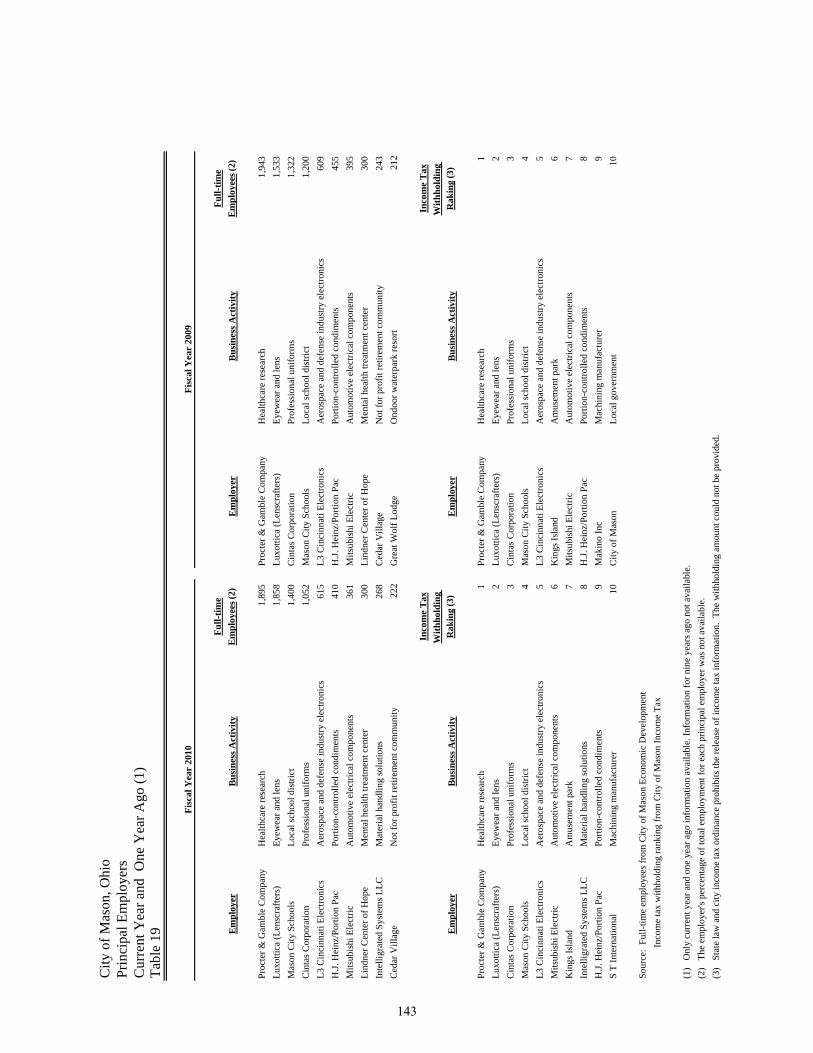
City
of M
ason
, Ohi
oPr
inci
pal E
mpl
oyer
sC
urre
nt Y
ear a
nd O
ne Y
ear A
go (1
)Ta
ble
19
Full-
time
Full-
time
Em
ploy
erB
usin
ess A
ctiv
ityE
mpl
oyee
s (2)
Em
ploy
erB
usin
ess A
ctiv
ityE
mpl
oyee
s (2)
Proc
ter &
Gam
ble
Com
pany
Hea
lthca
re re
sear
ch1,
895
Proc
ter &
Gam
ble
Com
pany
Hea
lthca
re re
sear
ch1,
943
Luxo
ttica
(Len
scra
fters
)Ey
ewea
r and
lens
1,85
8Lu
xotti
ca (L
ensc
rafte
rs)
Eyew
ear a
nd le
ns1,
533
Mas
on C
ity S
choo
lsLo
cal s
choo
l dis
trict
1,40
0C
inta
s Cor
pora
tion
Prof
essi
onal
uni
form
s1,
322
Cin
tas C
orpo
ratio
nPr
ofes
sion
al u
nifo
rms
1,05
2M
ason
City
Sch
ools
Loca
l sch
ool d
istri
ct1,
200
L3 C
inci
nnat
i Ele
ctro
nics
Aer
ospa
ce a
nd d
efen
se in
dust
ry e
lect
roni
cs61
5L3
Cin
cinn
ati E
lect
roni
csA
eros
pace
and
def
ense
indu
stry
ele
ctro
nics
609
H.J.
Hei
nz/P
ortio
n Pa
c Po
rtion
-con
trolle
d co
ndim
ents
410
H.J.
Hei
nz/P
ortio
n Pa
c Po
rtion
-con
trolle
d co
ndim
ents
455
Mits
ubis
hi E
lect
ricA
utom
otiv
e el
ectri
cal c
ompo
nent
s36
1M
itsub
ishi
Ele
ctric
Aut
omot
ive
elec
trica
l com
pone
nts
395
Lind
ner C
ente
r of H
ope
Men
tal h
ealth
trea
tmen
t cen
ter
300
Lind
ner C
ente
r of H
ope
Men
tal h
ealth
trea
tmen
t cen
ter
300
Inte
lligr
ated
Sys
tem
s LLC
Mat
eria
l han
dlin
g so
lutio
ns26
8C
edar
Vill
age
Not
for p
rofit
retir
emen
t com
mun
ity24
3C
edar
Vill
age
Not
for p
rofit
retir
emen
t com
mun
ity22
2 G
reat
Wol
f Lod
geO
ndoo
r wat
erpa
rk re
sort
212
Inco
me
Tax
Inco
me
Tax
W
ithho
ldin
g
With
hold
ing
Em
ploy
erB
usin
ess A
ctiv
ityR
akin
g(3
)E
mpl
oyer
Bus
ines
s Act
ivity
Rak
ing
(3)
Proc
ter &
Gam
ble
Com
pany
Hea
lthca
re re
sear
ch1
Proc
ter &
Gam
ble
Com
pany
Hea
lthca
re re
sear
ch1
Luxo
ttica
(Len
scra
fters
)Ey
ewea
r and
lens
2Lu
xotti
ca (L
ensc
rafte
rs)
Eyew
ear a
nd le
ns2
Cin
tas C
orpo
ratio
nPr
ofes
sion
al u
nifo
rms
3C
inta
s Cor
pora
tion
Prof
essi
onal
uni
form
s3
Mas
on C
ity S
choo
lsLo
cal s
choo
l dis
trict
4M
ason
City
Sch
ools
Loca
l sch
ool d
istri
ct4
L3 C
inci
nnat
i Ele
ctro
nics
Aer
ospa
ce a
nd d
efen
se in
dust
ry e
lect
roni
cs5
L3 C
inci
nnat
i Ele
ctro
nics
Aer
ospa
ce a
nd d
efen
se in
dust
ry e
lect
roni
cs5
Mits
ubis
hi E
lect
ricA
utom
otiv
e el
ectri
cal c
ompo
nent
s6
Kin
gs Is
land
Am
usem
ent p
ark
6K
ings
Isla
ndA
mus
emen
t par
k7
Mits
ubis
hi E
lect
ricA
utom
otiv
e el
ectri
cal c
ompo
nent
s7
Inte
lligr
ated
Sys
tem
s LLC
Mat
eria
l han
dlin
g so
lutio
ns8
H.J.
Hei
nz/P
ortio
n Pa
c Po
rtion
-con
trolle
d co
ndim
ents
8H
.J. H
einz
/Por
tion
Pac
Porti
on-c
ontro
lled
cond
imen
ts9
Mak
ino
Inc
Mac
hini
ng m
anuf
actu
rer
9S
T In
tern
atio
nal
Mac
hini
ng m
anuf
actu
rer
10C
ity o
f Mas
onLo
cal g
over
nmen
t10
Sour
ce:
Full-
time
empl
oyee
s fro
m C
ity o
f Mas
on E
cono
mic
Dev
elop
men
t
In
com
e ta
x w
ithho
ldin
g ra
nkin
g fr
om C
ity o
f Mas
on In
com
e Ta
x
(1)
Onl
y cu
rren
t yea
r and
one
yea
r ago
info
rmat
ion
avai
labl
e. In
form
atio
n fo
r nin
e ye
ars a
go n
ot a
vaila
ble.
(2)
The
em
ploy
er's
perc
enta
ge o
f tot
al e
mpl
oym
ent f
or e
ach
prin
cipa
l em
ploy
er w
as n
ot a
vaila
ble.
(3)
Sta
te la
w a
nd c
ity in
com
e ta
x or
dina
nce
proh
ibits
the
rele
ase
of in
com
e ta
x in
form
atio
n. T
he w
ithho
ldin
g am
ount
cou
ld n
ot b
e pr
ovid
ed.
Fisc
al Y
ear
2010
Fisc
al Y
ear
2009
143
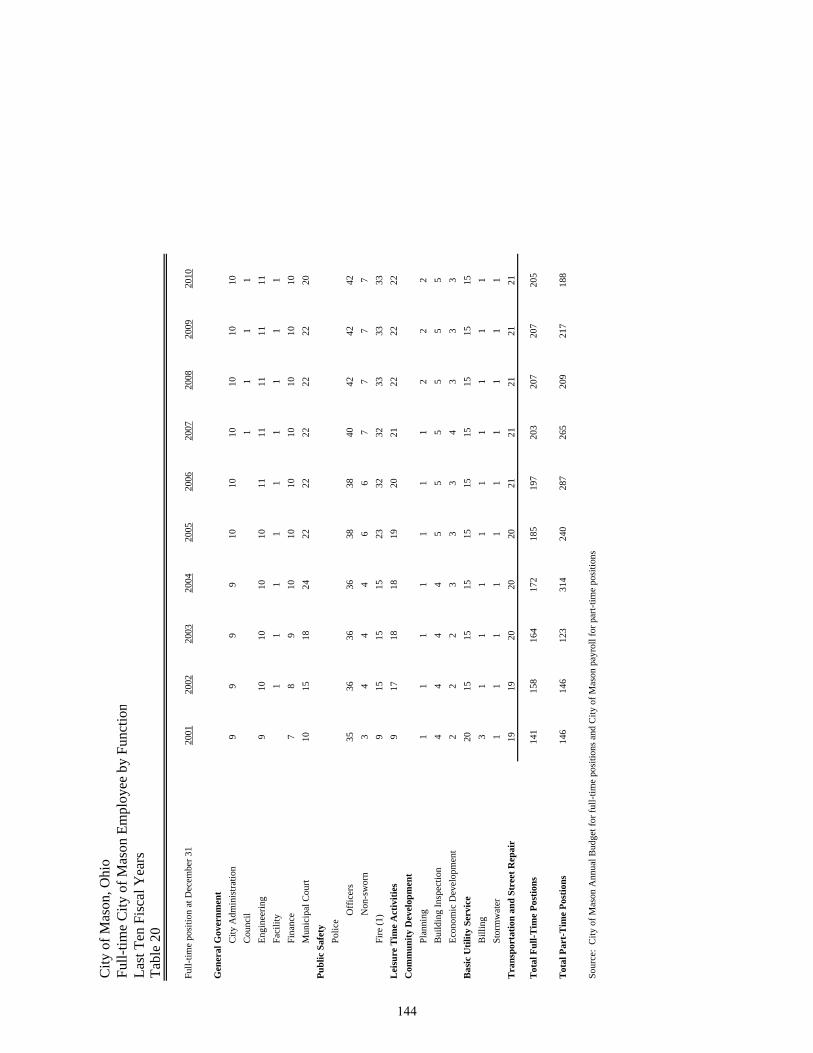
City
of M
ason
, Ohi
oFu
ll-tim
e C
ity o
f Mas
on E
mpl
oyee
by
Func
tion
Last
Ten
Fis
cal Y
ears
Tabl
e 20
Full-
time
posi
tion
at D
ecem
ber 3
120
0120
0220
0320
0420
0520
0620
0720
0820
0920
10
Gen
eral
Gov
ernm
ent
City
Adm
inis
tratio
n9
99
910
1010
1010
10C
ounc
il1
11
1En
gine
erin
g9
1010
1010
1111
1111
11Fa
cilit
y1
11
11
11
11
Fina
nce
78
910
1010
1010
1010
Mun
icip
al C
ourt
1015
1824
2222
2222
2220
Publ
ic S
afet
yPo
lice
Off
icer
s35
3636
3638
3840
4242
42N
on-s
wor
n3
44
46
67
77
7Fi
re (1
)9
1515
1523
3232
3333
33L
eisu
re T
ime
Act
iviti
es9
1718
1819
2021
2222
22C
omm
unity
Dev
elop
men
tPl
anni
ng1
11
11
11
22
2B
uild
ing
Insp
ectio
n4
44
45
55
55
5Ec
onom
ic D
evel
opm
ent
22
23
33
43
33
Bas
ic U
tility
Ser
vice
2015
1515
1515
1515
1515
Bill
ing
31
11
11
11
11
Stor
mw
ater
11
11
11
11
11
Tra
nspo
rtat
ion
and
Stre
et R
epai
r19
1920
2020
2121
2121
21
Tot
al F
ull-T
ime
Post
ions
141
158
164
172
185
197
203
207
207
205
Tot
al P
art-
Tim
e Po
stio
ns14
614
612
331
424
028
726
520
921
718
8
Sour
ce:
City
of M
ason
Ann
ual B
udge
t for
full-
time
posi
tions
and
City
of M
ason
pay
roll
for p
art-t
ime
posi
tions
144
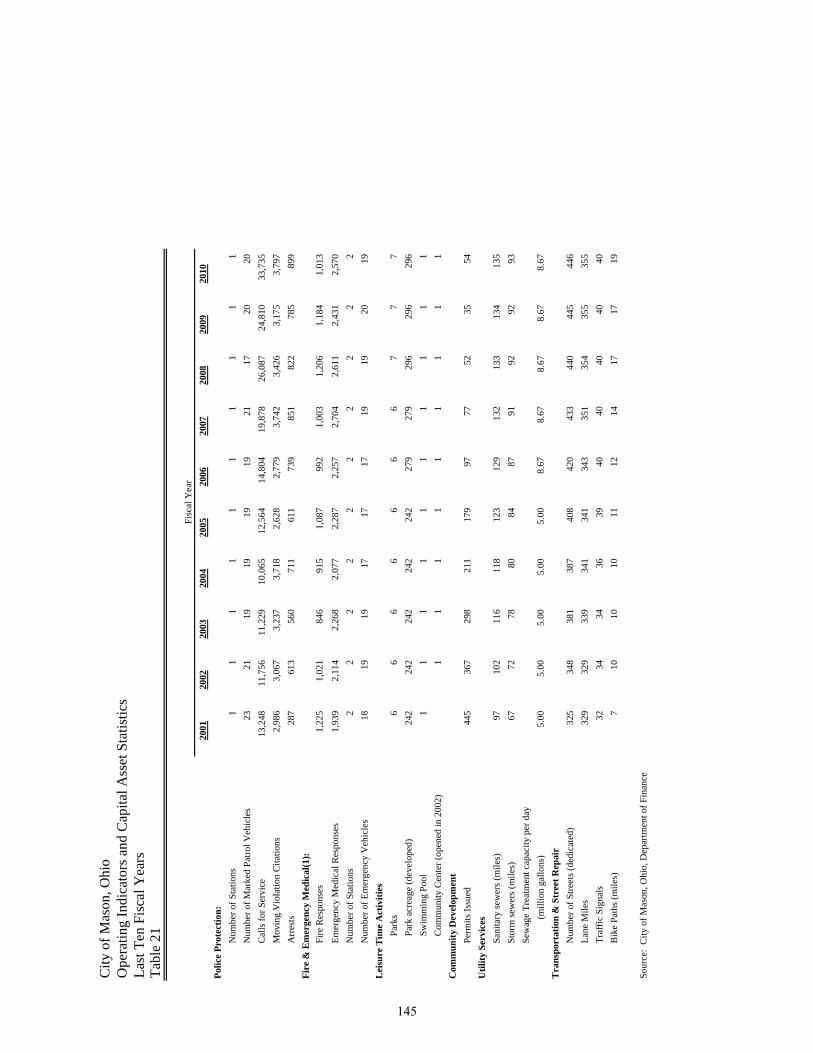
City
of M
ason
, Ohi
oO
pera
ting
Indi
cato
rs a
nd C
apita
l Ass
et S
tatis
tics
Last
Ten
Fis
cal Y
ears
Tabl
e 21
2001
2002
2003
2004
2005
2006
2007
2008
2009
2010
Polic
e Pr
otec
tion:
N
umbe
r of S
tatio
ns1
11
11
11
11
1
Num
ber o
f Mar
ked
Patro
l Veh
icle
s23
2119
1919
1921
1720
20C
alls
for S
ervi
ce13
,248
11,7
5611
,229
10,0
6512
,564
14,8
0419
,878
26,0
8724
,810
33,7
35M
ovin
g V
iola
tion
Cita
tions
2,98
63,
067
3,23
73,
718
2,62
82,
779
3,74
23,
426
3,17
53,
797
Arr
ests
287
613
560
711
611
739
851
822
785
899
Fire
& E
mer
genc
y M
edic
al(1
):Fi
re R
espo
nses
1,22
51,
021
846
915
1,08
799
21,
003
1,20
61,
184
1,01
3
Emer
genc
y M
edic
al R
espo
nses
1,93
92,
114
2,26
82,
077
2,28
72,
257
2,70
42,
611
2,43
12,
570
N
umbe
r of S
tatio
ns2
22
22
22
22
2
Num
ber o
f Em
erge
ncy
Veh
icle
s18
1919
1717
1719
1920
19L
eisu
re T
ime
Act
iviti
es
Pa
rks
66
66
66
67
77
Park
acr
eage
(dev
elop
ed)
242
242
242
242
242
279
279
296
296
296
Sw
imm
ing
Pool
11
11
11
11
11
C
omm
unity
Cen
ter (
open
ed in
200
2)1
11
11
11
11
Com
mun
ity D
evel
opm
ent
Pe
rmits
Issu
ed44
536
729
821
117
997
7752
3554
Util
ity S
ervi
ces
Sa
nita
ry se
wer
s (m
iles)
9710
211
611
812
312
913
213
313
413
5
Stor
m se
wer
s (m
iles)
6772
7880
8487
9192
9293
Sew
age
Trea
tmen
t cap
acity
per
day
(m
illio
n ga
llons
)5.
005.
005.
005.
005.
008.
678.
678.
678.
678.
67T
rans
port
atio
n &
Str
eet R
epai
r
Num
ber o
f Stre
ets (
dedi
cate
d)32
534
838
138
740
842
043
344
044
544
6
Lane
Mile
s32
932
933
934
134
134
335
135
435
535
5Tr
affic
Sig
nals
3234
3436
3940
4040
4040
Bik
e Pa
ths (
mile
s)7
1010
1011
1214
1717
19
Sour
ce:
City
of M
ason
, Ohi
o, D
epar
tmen
t of F
inan
ce
Fisc
al Y
ear
145

THIS PAGE INTENTIONALLY LEFT BLANK
146

This Page is Intentionally Left Blank.
88 East Broad Street, Fifth Floor, Columbus, Ohio 43215‐3506 Phone: 614‐466‐4514 or 800‐282‐0370 Fax: 614‐466‐4490
www.auditor.state.oh.us
CITY OF MASON
WARREN COUNTY
CLERK’S CERTIFICATION This is a true and correct copy of the report which is required to be filed in the Office of the Auditor of State pursuant to Section 117.26, Revised Code, and which is filed in Columbus, Ohio.
CLERK OF THE BUREAU CERTIFIED AUGUST 25, 2011