Embed Size (px)
Citation preview
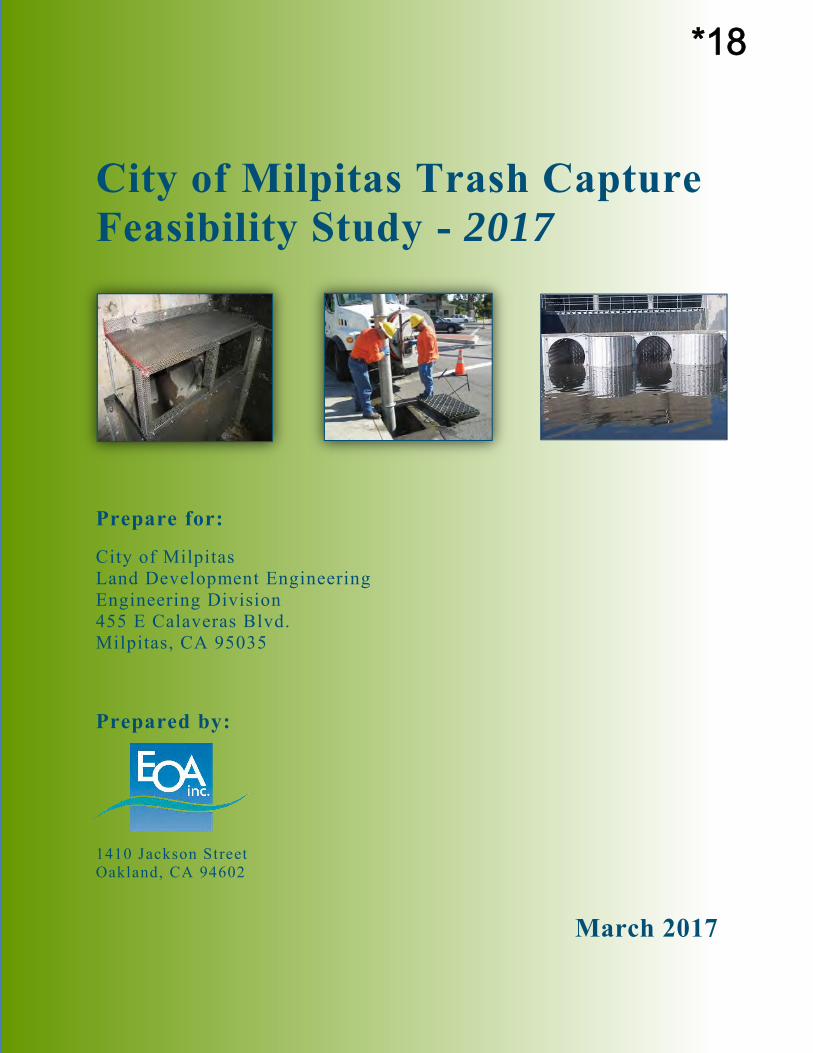
City of Milpitas Trash Capture Feasibility Study - 2017
Prepare for:
City of Milpitas Land Development Engineering Engineering Division 455 E Calaveras Blvd. Milpitas, CA 95035
Prepared by:
1410 Jackson Street Oakland, CA 94602
March 2017
*18
Milpitas Trash Capture Feasibility Study
March 2017 ii
Table of Contents
1. Introduction ................................................................................................................. 1
2. Trash Full Capture Devices ......................................................................................... 3
2.1 Large Full Capture Devices ........................................................................................................ 3 2.1.1 Hydrodynamic Separators ................................................................................................ 3 2.1.2 Gross Solids Removal Devices (GSRD) .......................................................................... 4 2.1.3 Netting Devices ................................................................................................................ 5
2.2 Small Full Capture Devices ........................................................................................................ 7 3. Trash Generation and Existing Management Activities .............................................. 8
3.1 Baseline Trash Generation .......................................................................................................... 8 3.2 Trash Management Areas ........................................................................................................... 8 3.3 Current Trash Control Actions and Reduction Benefits ........................................................... 11
3.3.1 Existing Trash Full Capture Devices .............................................................................. 11 3.3.2 Other TMA-specific Control Actions ............................................................................. 12 3.3.3 Enhanced Creek and Shoreline Cleanups ....................................................................... 13 3.3.4 Source Controls .............................................................................................................. 13
3.4 Additional Reduction Benefits Needed to Achieve Goals ........................................................ 13 4. Trash Capture Feasibility Analysis ............................................................................ 14
4.1 Large Full Capture Devices ...................................................................................................... 14 4.1.1 High Priority Stormwater Catchments ............................................................................ 14 4.1.2 Large Device Siting and Sizing ...................................................................................... 17
4.2 Trash Reduction Benefits - Small Devices ............................................................................... 19 4.2.1 High Priority Catch Basin Locations (Towards 70% Reduction) ................................... 19 4.2.2 Moderate Priority Catch Basin Locations (Towards 80% and 100% Reduction) .......... 22 4.2.3 Small Device Siting and Sizing ...................................................................................... 24
5. Cost Estimates ............................................................................................................ 25
5.1 Addressing the 70% Reduction Goal ........................................................................................ 25 5.2 Addressing the 80% and 100% Reduction Goals ..................................................................... 26
6. Conclusions & Recommendations .............................................................................. 32
6.1 Proposed Road Map to 70% Reduction .................................................................................... 32 6.2 Addressing Future Trash Reduction Requirements .................................................................. 33
Milpitas Trash Capture Feasibility Study
March 2017 iii
Table of Figures Figure 1. (Left) Diagram of a Contech CDS® hydrodynamic separator. (Right) Separator Cylinder of Contech CDS® hydrodynamic separator (Courtesy of City of San Jose) ................................................................................... 4
Figure 2 Cut away view of Linear Radial Configuration #1 (LR-1) screen (courtesy of the American Society of Civil Engineers Publications). ...................................................................................................................................... 5
Figure 3. Gross solids removal device (GSRD) in linear-radial configuration (Left) and installed in the City of Milpitas (Right). ........................................................................................................................................................... 5
Figure 4. Oldcastle Stormwater Solutions Net Tech Gross Pollutant Trap ................................................................. 6
Figure 5. Fresh Creek Technologies End-of-Pipe Netting TrashTrap® ...................................................................... 6
Figure 6. Small Connector Pipe Screens installed in catch basins in the SF Bay Area. .............................................. 7
Figure 7. Inlet insert manufactured by Revel Environmental Manufacturing, Inc. ..................................................... 7
Figure 8: City of Milpitas baseline trash generation, Trash Management Areas (TMAs), trash full capture areas, and current on-land visual trash assessment sites/results. ................................................................................................... 9
Figure 9: High priority stormwater catchments (11) considered for Large Full Capture Device installation. .......... 15
Figure 10: High priority catch basins in TMAs 1D, 1E, and 2 for potential Small Full Trash Capture Devices installations. ................................................................................................................................................................ 20
Figure 11: High priority catch basins in TMA 3 for potential Small Full Trash Capture Devices installations. ....... 21
Figure 12: High (Phase 1) and moderate (Phases 2 & 3) priority catch basins in the City of Milpitas identified for potential Small Full Trash Capture Devices installations. .......................................................................................... 23
Table of Tables Table 1: Weighting factors for each trash generation category. ................................................................................... 8
Table 2: City of Milpitas baseline trash generation by Trash Management Areas (TMAs). ...................................... 10
Table 3: Trash Control Measures Implemented by the City of Milpitas and Estimated % Reductions – FY 2015-16. ..................................................................................................................................................................................... 11
Table 4: Existing Full Trash Capture Devices on Public or Private Property. ............................................................ 12
Table 5: Stormwater catchments draining high priority Trash Management Areas (TMAs) and estimated maximum trash reduction possible (Note: those in bold are considered high priority and are further evaluated). ....................... 16
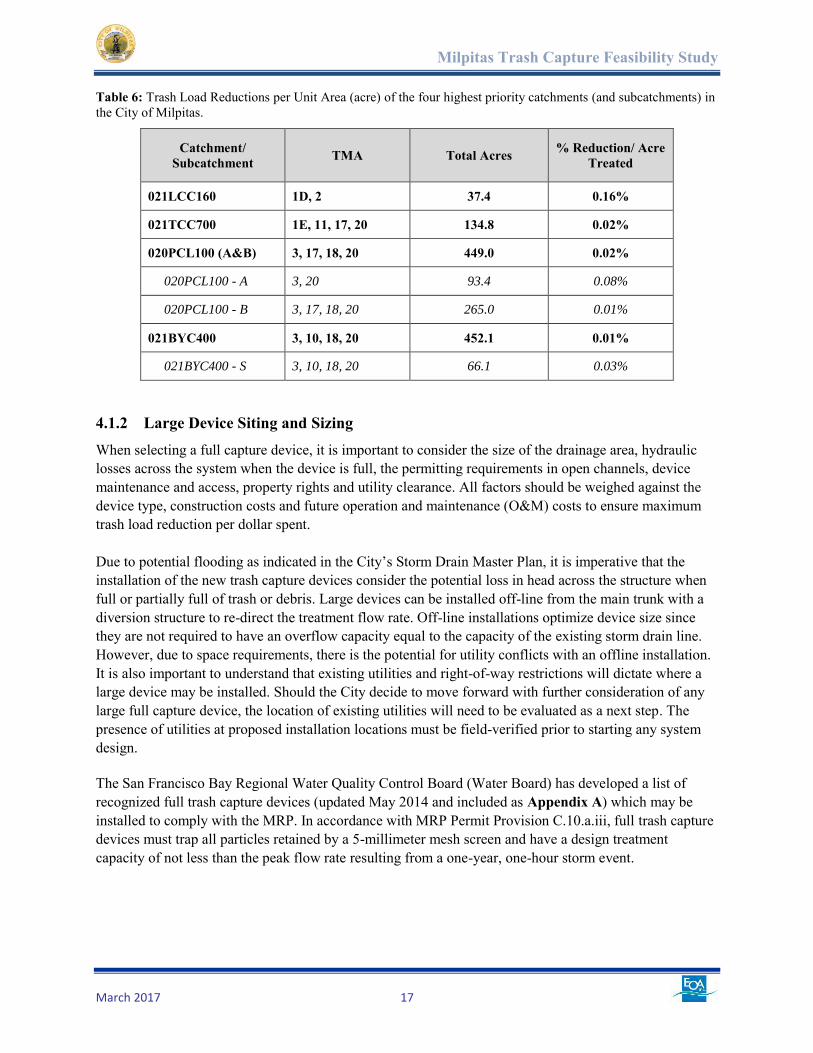
Table 6: Trash Load Reductions per Unit Area (acre) of the four highest priority catchments (and subcatchments) in the City of Milpitas. ..................................................................................................................................................... 17
Table 7: Runoff Coefficients for Sizing Large Devices .............................................................................................. 18
Table 8. Treatment flow rates for sizing large trash full capture devices in the four highest priority catchments (and subcatchments) in the City of Milpitas. ....................................................................................................................... 19
Table 9: Estimated trash load reductions associated with installing and maintaining small full trash capture devices in 66 high priority catch basins within the City of Milpitas. ....................................................................................... 22
Table 10: Estimated trash load reductions associated with installing and maintaining small full trash capture devices in 219 moderate priority catch basins within the City of Milpitas. .............................................................................. 24
Table 11: Preliminary planning level cost estimates for treating high priority stormwater catchments and subcatchments in the City of Milpitas via large full capture devices to address the 70% trash reduction goal. .......... 27
Milpitas Trash Capture Feasibility Study
March 2017 iv
Table 12: Preliminary planning level cost estimates for treating high priority Trash Management Areas (TMAs) in the City of Milpitas via small full capture devices to address the 70% trash reduction goal. ...................................... 28
Table 13: Comparison of the trash reduction benefits and costs associated with potential large and small full capture devices in the City of Milpitas to address the 70% trash reduction goal. .................................................................... 29
Table 14. Preliminary planning level cost estimates for treating moderate priority Trash Management Areas (TMAs) in the City of Milpitas via small full capture devices to address the 80% and 100% trash reduction goals. ............... 31
Table 15: Reported and estimated trash reduction benefits associated with source controls, existing public and private full capture devices, proposed additional small full capture devices, and other actions implemented in the City of Milpitas. ........................................................................................................................................................... 33
Table 16: Comparison of the trash reduction benefits and costs associated with potential large and small full capture devices in the City of Milpitas. .................................................................................................................................... 34
Appendices Appendix A – Trash Full Capture Devices Recognized by the San Francisco Bay Regional Water Quality Control
Board
Appendix B - Base Maps Illustrating Potential Large Full Capture Locations in High Priority Stormwater Catchments
Appendix C - Detailed Cost Estimates for Large Full Capture Devices in the City of Milpitas
Milpitas Trash Capture Feasibility Study
March 2017 1
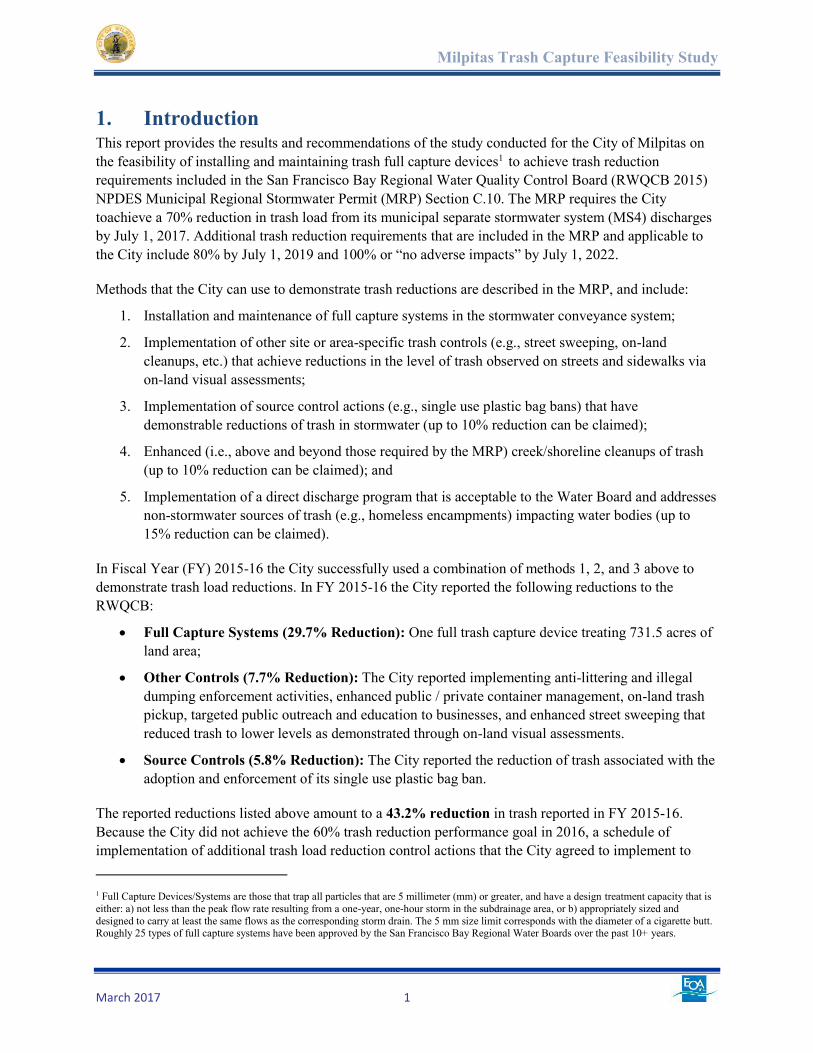
1. Introduction This report provides the results and recommendations of the study conducted for the City of Milpitas on the feasibility of installing and maintaining trash full capture devices1 to achieve trash reduction requirements included in the San Francisco Bay Regional Water Quality Control Board (RWQCB 2015) NPDES Municipal Regional Stormwater Permit (MRP) Section C.10. The MRP requires the City toachieve a 70% reduction in trash load from its municipal separate stormwater system (MS4) discharges by July 1, 2017. Additional trash reduction requirements that are included in the MRP and applicable to the City include 80% by July 1, 2019 and 100% or “no adverse impacts” by July 1, 2022.
Methods that the City can use to demonstrate trash reductions are described in the MRP, and include:
1. Installation and maintenance of full capture systems in the stormwater conveyance system;
2. Implementation of other site or area-specific trash controls (e.g., street sweeping, on-land cleanups, etc.) that achieve reductions in the level of trash observed on streets and sidewalks via on-land visual assessments;
3. Implementation of source control actions (e.g., single use plastic bag bans) that have demonstrable reductions of trash in stormwater (up to 10% reduction can be claimed);
4. Enhanced (i.e., above and beyond those required by the MRP) creek/shoreline cleanups of trash (up to 10% reduction can be claimed); and
5. Implementation of a direct discharge program that is acceptable to the Water Board and addresses non-stormwater sources of trash (e.g., homeless encampments) impacting water bodies (up to 15% reduction can be claimed).
In Fiscal Year (FY) 2015-16 the City successfully used a combination of methods 1, 2, and 3 above to demonstrate trash load reductions. In FY 2015-16 the City reported the following reductions to the RWQCB:
Full Capture Systems (29.7% Reduction): One full trash capture device treating 731.5 acres of land area;
Other Controls (7.7% Reduction): The City reported implementing anti-littering and illegal dumping enforcement activities, enhanced public / private container management, on-land trash pickup, targeted public outreach and education to businesses, and enhanced street sweeping that reduced trash to lower levels as demonstrated through on-land visual assessments.
Source Controls (5.8% Reduction): The City reported the reduction of trash associated with the adoption and enforcement of its single use plastic bag ban.
The reported reductions listed above amount to a 43.2% reduction in trash reported in FY 2015-16. Because the City did not achieve the 60% trash reduction performance goal in 2016, a schedule of implementation of additional trash load reduction control actions that the City agreed to implement to 1 Full Capture Devices/Systems are those that trap all particles that are 5 millimeter (mm) or greater, and have a design treatment capacity that is either: a) not less than the peak flow rate resulting from a one-year, one-hour storm in the subdrainage area, or b) appropriately sized and designed to carry at least the same flows as the corresponding storm drain. The 5 mm size limit corresponds with the diameter of a cigarette butt. Roughly 25 types of full capture systems have been approved by the San Francisco Bay Regional Water Boards over the past 10+ years.
Milpitas Trash Capture Feasibility Study
March 2017 2
attain the 2017 mandatory reduction of 70% was submitted to the Water Board. In this plan, the City agreed to conduct a Citywide Trash Capture Feasibility Study (Trash Capture Study) to identify locations and types of full capture systems that could be installed to achieve the reduction requirements in the MRP, and assess the costs associated with the installation and maintenance of devices.
This Trash Capture Study was conducted to provide information to City staff on the feasibility and costs of installing trash full capture devices at strategic locations within City drainage areas and Trash Management Areas (TMAs). This report includes a description of trash full capture systems and locations evaluated, the predicted trash reductions associated with each device/location, and the preliminary cost estimates for design, installation and maintenance of each device. The report provides the City with a ‘road map’ to follow in the short-term (e.g., 2017), while understanding that the ultimate goal is to obtain a 100% trash load reduction or “no adverse impacts” to receiving eaters from trash by July 1, 2022.
All trash reduction benefits and costs are based on the best information available at the time the Trash Capture Study was conducted. Additionally, trash load reduction estimates are consistent with the current trash load reduction accounting methodology accepted by RWQCB staff. If trash accounting methodologies are modified in the future, the assumptions used in the Study to determine estimated trash load reduction percentages for each control measure should be revisited and revised accordingly. This report supplements the City’s Long-Term Trash Load Reduction Plan and Assessment Strategy developed in January 2014.

Milpitas Trash Capture Feasibility Study
March 2017 3
2. Trash Full Capture Devices A trash full capture system is defined as a single device (or a series of devices) that traps all particles that are 5 mm or greater, and has a design treatment capacity that is either: a) of not less than the peak flow rate, Q, resulting from a one-year, one-hour, storm in the subdrainage area, or b) appropriately sized to, and designed to carry at least the same flows as, the corresponding storm drain (SFBRWQCB 2015). In California, a number of full capture systems have been certified/approved by the Los Angeles Regional Water Quality Control Board (LA Water Board) and the San Francisco Bay Regional Water Quality Control Board (SF Bay Water Board) as part of their TMDL implementation program and grant-funded projects.1 Systems approved/certified to-date by these regulatory agencies include larger “end-of-pipe” and “in-line” netting and screening devices, and smaller screening devices installed in storm drain vaults or catch basins. Descriptions of both large and small full capture devices are included in this section.
2.1 Large Full Capture Devices Large devices can treat an entire stormwater catchment area, including storm drains on private property and provide a single location for maintenance, saving operation and maintenance resources over time. Two disadvantages of large devices are the relatively high capital and construction costs, which require a large initial funding source, and the higher instance of subsurface utility conflicts at desired locations within highly urbanized areas.
There are three general types of large full capture devices currently installed in the Bay Area -hydrodynamic separators, gross solids removal devices, and netting devices. The selection of large devices for reducing trash will depend on the characteristics of a specific location, potential for environmental permitting, and resulting trash load reduction percentage.
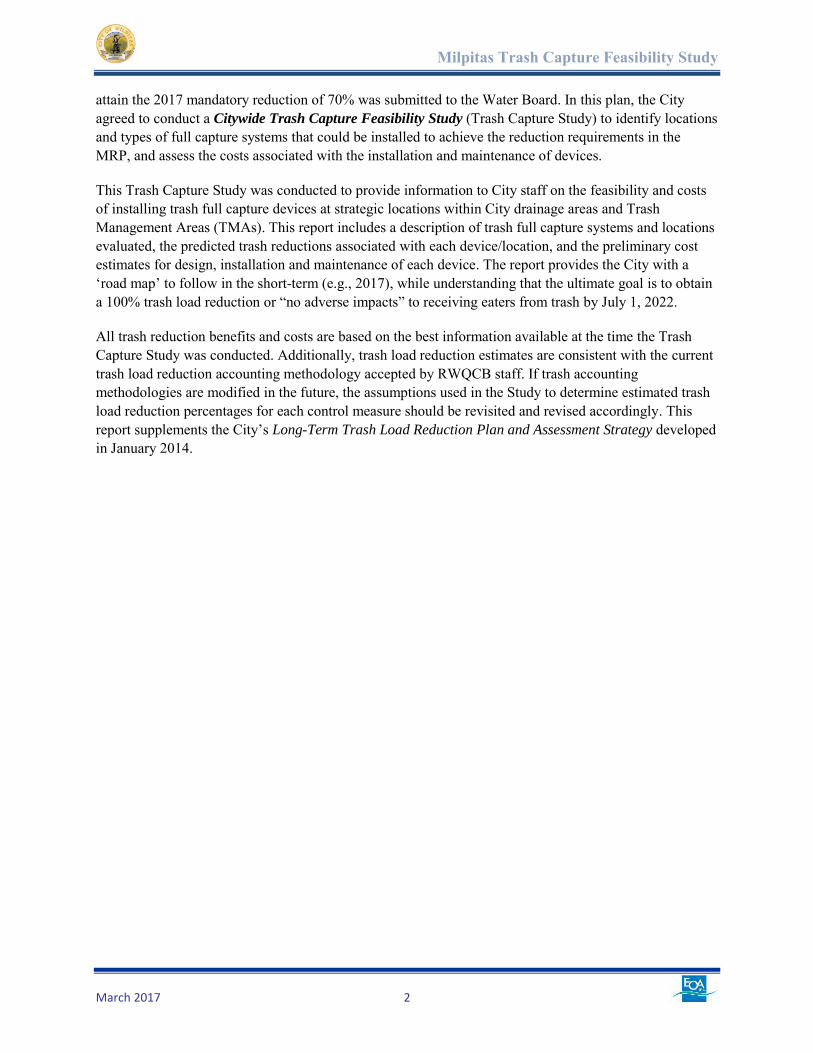
2.1.1 Hydrodynamic Separators The most common large device installed within the Bay Area is a hydrodynamic separator (HDS), also known as a vortex separator or swirl concentrator (Figure 1). These devices are produced by several manufacturers, each with their own design, but all contain large cylindrical separation chambers in which stormwater enters, creating a vortex to separate trash, debris, oil, and other pollutants from stormwater. The velocity is highest at the outer edge of the vortex, keeping trash and debris from clogging outflow holes and allowing the stormwater to leave the cylinder. Heavier material settles to the bottom of the storage sump, and floatables remain on the surface of the water within the separator cylinder (Figure 2).
Trash, debris and sediment is usually removed from the HDS with a vacuum truck, however, alternative devices may be fitted with a large basket to collect settled material, which is subsequently removed via a boom truck and emptied into a container for disposal. HDS units have the advantage of being relatively small and offer additional flexibility their installation locations, when compared to the other types of large devices. HDS units come in a large variety of types and sizes, and may be scaled up to handle peak flows of several hundred cubic feet per second. They can also be small enough to be retrofitted into existing manholes. Studies have shown that HDS units can be highly effective at trapping trash.
1 Based on the information available at the time of this report (SWRCB 2015), future approvals of trash full capture systems will be administered
by the State Water Board through the implementation of the statewide Trash Amendments.
Milpitas Trash Capture Feasibility Study
March 2017 4
Figure 1. (Left) Diagram of a Contech CDS® hydrodynamic separator (Source: www.conteches.com/products/stormwater-management/treatment). (Right) Separator Cylinder of Contech CDS® hydrodynamic separator (Courtesy of City of San Jose)
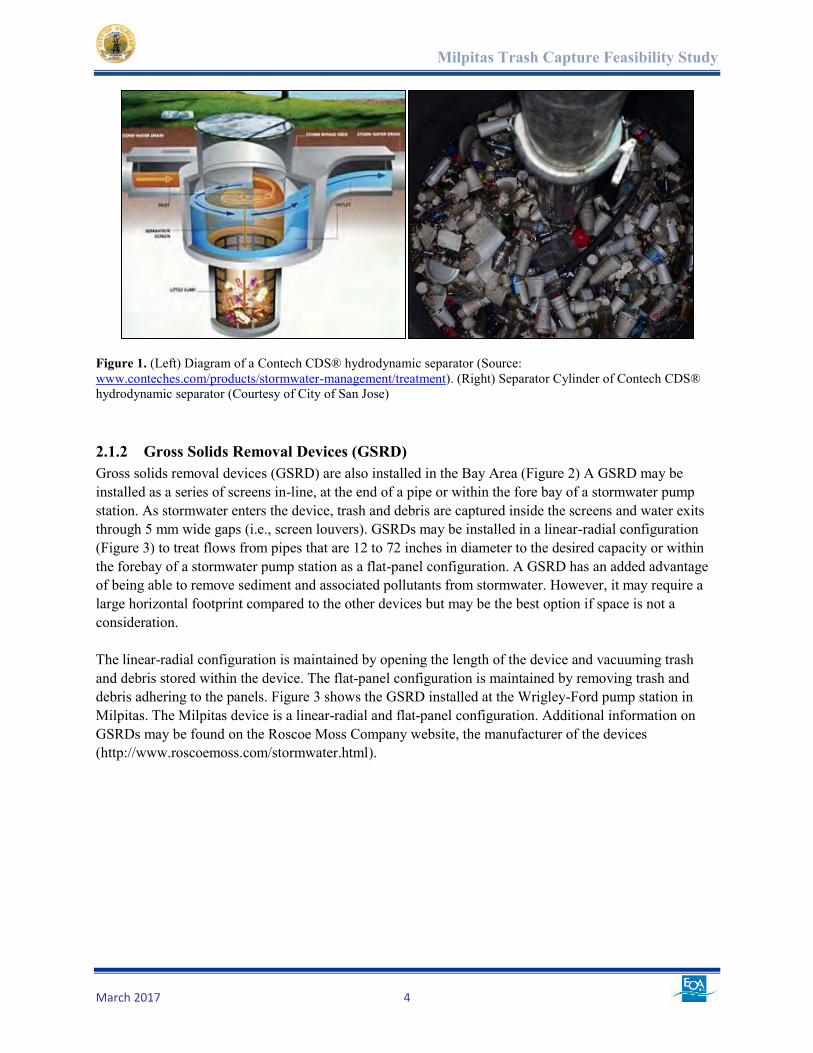
2.1.2 Gross Solids Removal Devices (GSRD) Gross solids removal devices (GSRD) are also installed in the Bay Area (Figure 2) A GSRD may be installed as a series of screens in-line, at the end of a pipe or within the fore bay of a stormwater pump station. As stormwater enters the device, trash and debris are captured inside the screens and water exits through 5 mm wide gaps (i.e., screen louvers). GSRDs may be installed in a linear-radial configuration (Figure 3) to treat flows from pipes that are 12 to 72 inches in diameter to the desired capacity or within the forebay of a stormwater pump station as a flat-panel configuration. A GSRD has an added advantage of being able to remove sediment and associated pollutants from stormwater. However, it may require a large horizontal footprint compared to the other devices but may be the best option if space is not a consideration. The linear-radial configuration is maintained by opening the length of the device and vacuuming trash and debris stored within the device. The flat-panel configuration is maintained by removing trash and debris adhering to the panels. Figure 3 shows the GSRD installed at the Wrigley-Ford pump station in Milpitas. The Milpitas device is a linear-radial and flat-panel configuration. Additional information on GSRDs may be found on the Roscoe Moss Company website, the manufacturer of the devices (http://www.roscoemoss.com/stormwater.html).
Milpitas Trash Capture Feasibility Study
March 2017 5
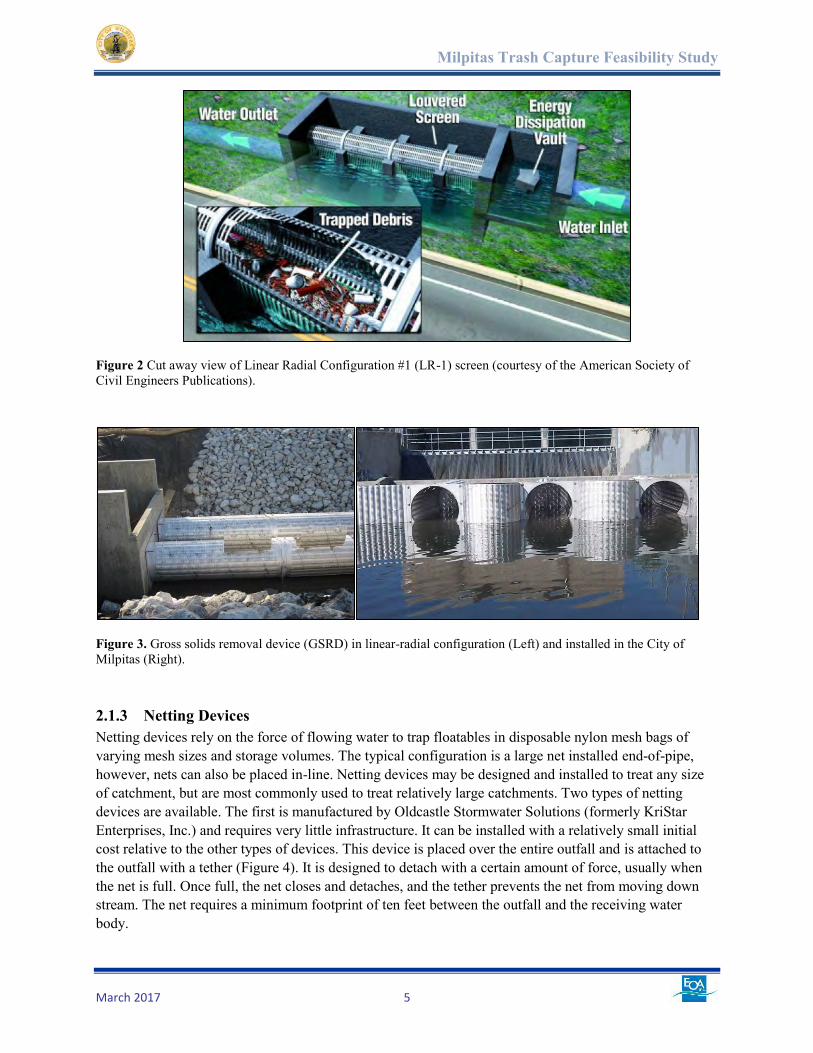
Figure 2 Cut away view of Linear Radial Configuration #1 (LR-1) screen (courtesy of the American Society of Civil Engineers Publications).
Figure 3. Gross solids removal device (GSRD) in linear-radial configuration (Left) and installed in the City of Milpitas (Right).
2.1.3 Netting Devices Netting devices rely on the force of flowing water to trap floatables in disposable nylon mesh bags of varying mesh sizes and storage volumes. The typical configuration is a large net installed end-of-pipe, however, nets can also be placed in-line. Netting devices may be designed and installed to treat any size of catchment, but are most commonly used to treat relatively large catchments. Two types of netting devices are available. The first is manufactured by Oldcastle Stormwater Solutions (formerly KriStar Enterprises, Inc.) and requires very little infrastructure. It can be installed with a relatively small initial cost relative to the other types of devices. This device is placed over the entire outfall and is attached to the outfall with a tether (Figure 4). It is designed to detach with a certain amount of force, usually when the net is full. Once full, the net closes and detaches, and the tether prevents the net from moving down stream. The net requires a minimum footprint of ten feet between the outfall and the receiving water body.
Milpitas Trash Capture Feasibility Study
March 2017 6
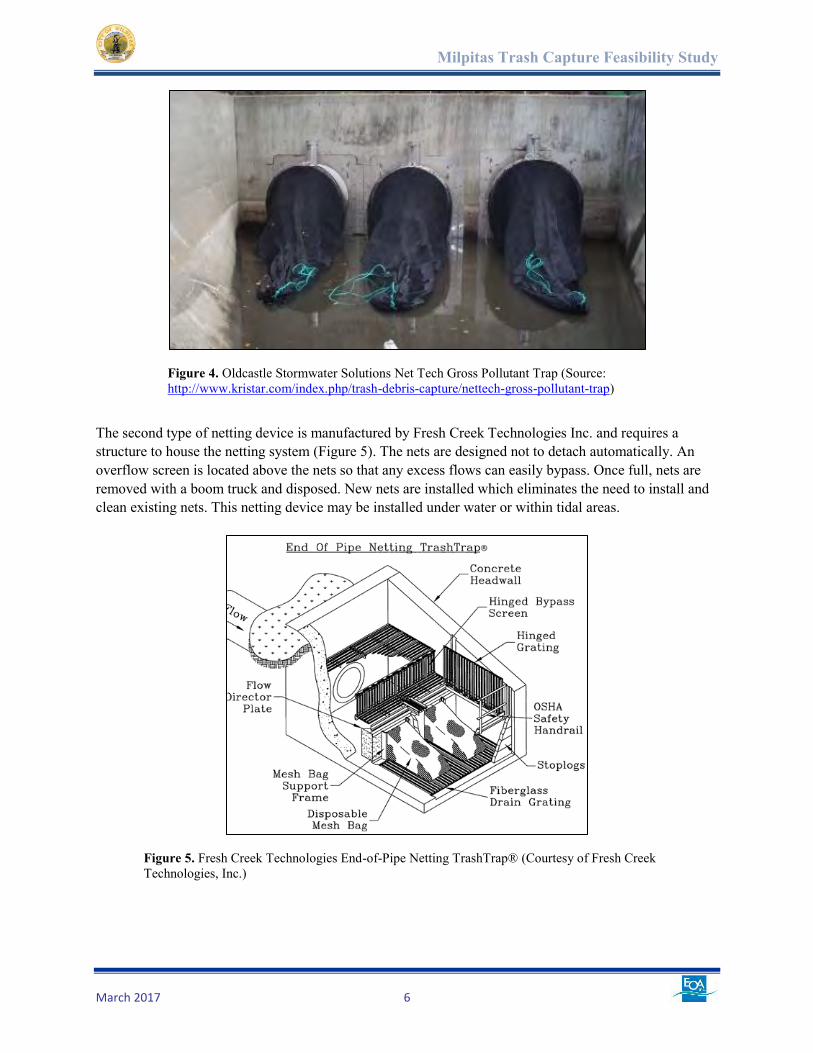
Figure 4. Oldcastle Stormwater Solutions Net Tech Gross Pollutant Trap (Source: http://www.kristar.com/index.php/trash-debris-capture/nettech-gross-pollutant-trap)
The second type of netting device is manufactured by Fresh Creek Technologies Inc. and requires a structure to house the netting system (Figure 5). The nets are designed not to detach automatically. An overflow screen is located above the nets so that any excess flows can easily bypass. Once full, nets are removed with a boom truck and disposed. New nets are installed which eliminates the need to install and clean existing nets. This netting device may be installed under water or within tidal areas.
Figure 5. Fresh Creek Technologies End-of-Pipe Netting TrashTrap® (Courtesy of Fresh Creek Technologies, Inc.)
Milpitas Trash Capture Feasibility Study
March 2017 7
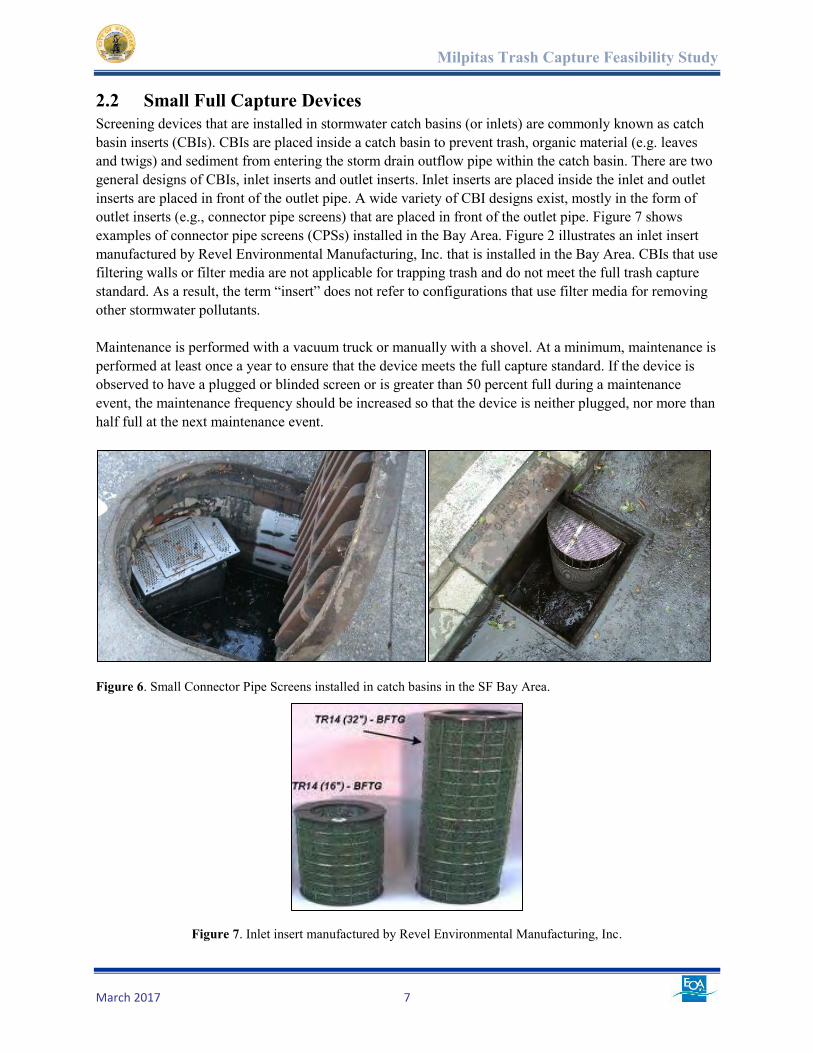
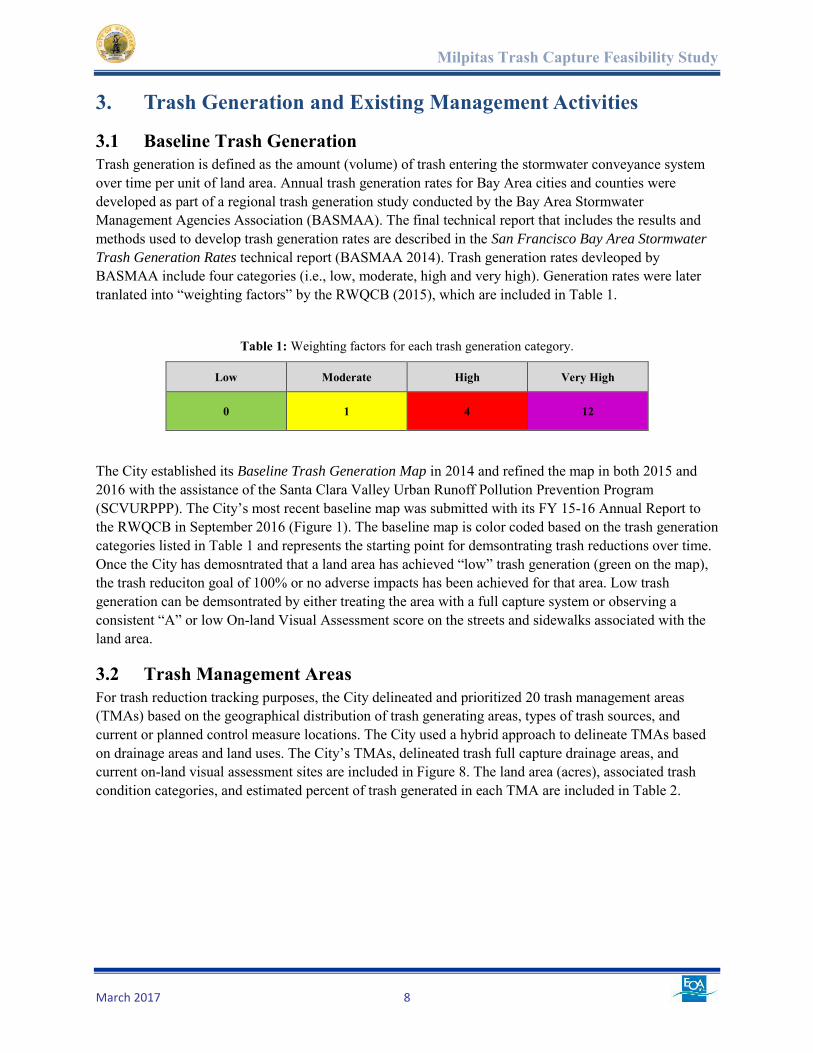
2.2 Small Full Capture Devices Screening devices that are installed in stormwater catch basins (or inlets) are commonly known as catch basin inserts (CBIs). CBIs are placed inside a catch basin to prevent trash, organic material (e.g. leaves and twigs) and sediment from entering the storm drain outflow pipe within the catch basin. There are two general designs of CBIs, inlet inserts and outlet inserts. Inlet inserts are placed inside the inlet and outlet inserts are placed in front of the outlet pipe. A wide variety of CBI designs exist, mostly in the form of outlet inserts (e.g., connector pipe screens) that are placed in front of the outlet pipe. Figure 7 shows examples of connector pipe screens (CPSs) installed in the Bay Area. Figure 2 illustrates an inlet insert manufactured by Revel Environmental Manufacturing, Inc. that is installed in the Bay Area. CBIs that use filtering walls or filter media are not applicable for trapping trash and do not meet the full trash capture standard. As a result, the term “insert” does not refer to configurations that use filter media for removing other stormwater pollutants. Maintenance is performed with a vacuum truck or manually with a shovel. At a minimum, maintenance is performed at least once a year to ensure that the device meets the full capture standard. If the device is observed to have a plugged or blinded screen or is greater than 50 percent full during a maintenance event, the maintenance frequency should be increased so that the device is neither plugged, nor more than half full at the next maintenance event.
Figure 6. Small Connector Pipe Screens installed in catch basins in the SF Bay Area.
Figure 7. Inlet insert manufactured by Revel Environmental Manufacturing, Inc.
Milpitas Trash Capture Feasibility Study
March 2017 8
3. Trash Generation and Existing Management Activities
3.1 Baseline Trash Generation Trash generation is defined as the amount (volume) of trash entering the stormwater conveyance system over time per unit of land area. Annual trash generation rates for Bay Area cities and counties were developed as part of a regional trash generation study conducted by the Bay Area Stormwater Management Agencies Association (BASMAA). The final technical report that includes the results and methods used to develop trash generation rates are described in the San Francisco Bay Area Stormwater
Trash Generation Rates technical report (BASMAA 2014). Trash generation rates devleoped by BASMAA include four categories (i.e., low, moderate, high and very high). Generation rates were later tranlated into “weighting factors” by the RWQCB (2015), which are included in Table 1.
Table 1: Weighting factors for each trash generation category.
Low Moderate High Very High
0 1 4 12
The City established its Baseline Trash Generation Map in 2014 and refined the map in both 2015 and 2016 with the assistance of the Santa Clara Valley Urban Runoff Pollution Prevention Program (SCVURPPP). The City’s most recent baseline map was submitted with its FY 15-16 Annual Report to the RWQCB in September 2016 (Figure 1). The baseline map is color coded based on the trash generation categories listed in Table 1 and represents the starting point for demsontrating trash reductions over time. Once the City has demosntrated that a land area has achieved “low” trash generation (green on the map), the trash reduciton goal of 100% or no adverse impacts has been achieved for that area. Low trash generation can be demsontrated by either treating the area with a full capture system or observing a consistent “A” or low On-land Visual Assessment score on the streets and sidewalks associated with the land area.
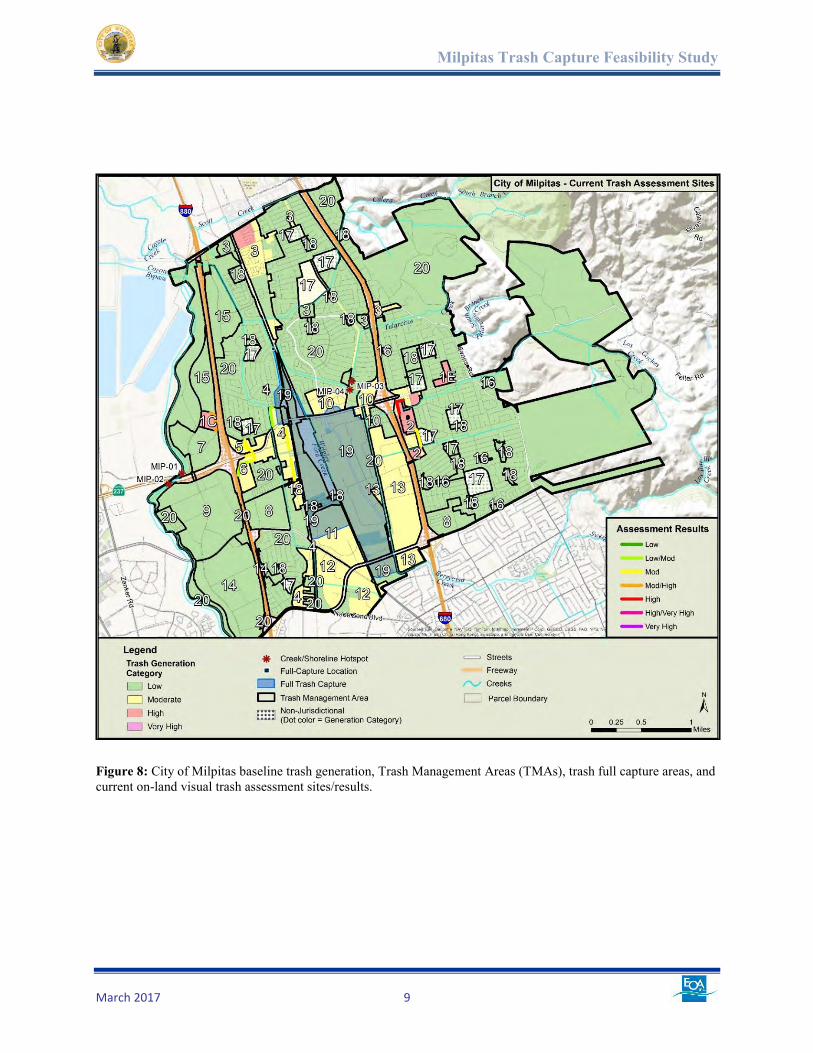
3.2 Trash Management Areas For trash reduction tracking purposes, the City delineated and prioritized 20 trash management areas (TMAs) based on the geographical distribution of trash generating areas, types of trash sources, and current or planned control measure locations. The City used a hybrid approach to delineate TMAs based on drainage areas and land uses. The City’s TMAs, delineated trash full capture drainage areas, and current on-land visual assessment sites are included in Figure 8. The land area (acres), associated trash condition categories, and estimated percent of trash generated in each TMA are included in Table 2.
Milpitas Trash Capture Feasibility Study
March 2017 9
Figure 8: City of Milpitas baseline trash generation, Trash Management Areas (TMAs), trash full capture areas, and current on-land visual trash assessment sites/results.
Milpitas Trash Capture Feasibility Study
March 2017 10
Table 2: City of Milpitas baseline trash generation by Trash Management Areas (TMAs).
Trash Management Area
(TMA)
TMA Land Area by Category (Acres) Land
Area (Acres)
% of Trash Generated in
City Low Moderate High Very High
1 0 0 63 0 63 12.6%
2 0 32 21 0 53 5.9%
3 95 95 26 0 216 10.0%
4 5 117 2 0 124 6.3%
5 0 27 0 0 27 1.4%
6 0 50 7 0 57 3.9%
7 101 0 0 0 101 0.0%
8 159 0 0 0 159 0.0%
9 307 0 0 0 307 0.0%
10 0 81 7 0 88 5.5%
11 0 133 0 0 133 6.7%
12 32 156 0 0 188 7.9%
13 9 250 0 0 259 12.7%
14 301 0 0 0 301 0.0%
15 189 0 0 0 189 0.0%
16 16 0 0 0 16 0.0%
17 36 2 0 0 38 0.1%
18 138 0 0 0 138 0.0%
19 77 471 11 0 559 26.1%
20 4,925 17 0 0 4,943 0.9%
Total 6,391 1,432 136 0 7,960 100%
Milpitas Trash Capture Feasibility Study
March 2017 11
3.3 Current Trash Control Actions and Reduction Benefits The City is required to control trash from its stormwater conveyance system before it is discharged to creeks and the San Francisco Bay (RWQCB 2015). Trash control actions currently implemented and planned by the City, along with the methods used by the City to assess progress towards trash load reduction goals outlined in the MRP, are described in its Long-Term Trash Load Reduction Plan. Additionally, the most recent trash load reductions observed to date are described in the City’s FY 2015-
2016 Annual Report.
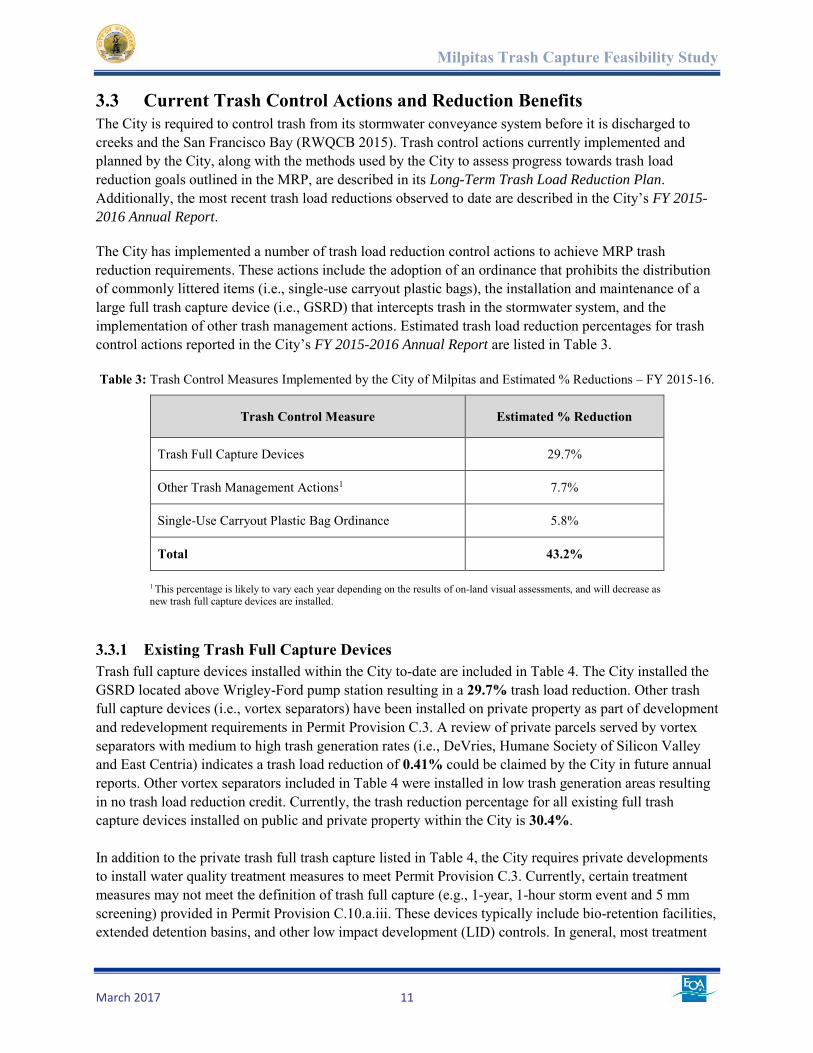
The City has implemented a number of trash load reduction control actions to achieve MRP trash reduction requirements. These actions include the adoption of an ordinance that prohibits the distribution of commonly littered items (i.e., single-use carryout plastic bags), the installation and maintenance of a large full trash capture device (i.e., GSRD) that intercepts trash in the stormwater system, and the implementation of other trash management actions. Estimated trash load reduction percentages for trash control actions reported in the City’s FY 2015-2016 Annual Report are listed in Table 3. Table 3: Trash Control Measures Implemented by the City of Milpitas and Estimated % Reductions – FY 2015-16.
Trash Control Measure Estimated % Reduction
Trash Full Capture Devices 29.7%
Other Trash Management Actions1 7.7%
Single-Use Carryout Plastic Bag Ordinance 5.8%
Total 43.2%
1 This percentage is likely to vary each year depending on the results of on-land visual assessments, and will decrease as new trash full capture devices are installed.
3.3.1 Existing Trash Full Capture Devices Trash full capture devices installed within the City to-date are included in Table 4. The City installed the GSRD located above Wrigley-Ford pump station resulting in a 29.7% trash load reduction. Other trash full capture devices (i.e., vortex separators) have been installed on private property as part of development and redevelopment requirements in Permit Provision C.3. A review of private parcels served by vortex separators with medium to high trash generation rates (i.e., DeVries, Humane Society of Silicon Valley and East Centria) indicates a trash load reduction of 0.41% could be claimed by the City in future annual reports. Other vortex separators included in Table 4 were installed in low trash generation areas resulting in no trash load reduction credit. Currently, the trash reduction percentage for all existing full trash capture devices installed on public and private property within the City is 30.4%. In addition to the private trash full trash capture listed in Table 4, the City requires private developments to install water quality treatment measures to meet Permit Provision C.3. Currently, certain treatment measures may not meet the definition of trash full capture (e.g., 1-year, 1-hour storm event and 5 mm screening) provided in Permit Provision C.10.a.iii. These devices typically include bio-retention facilities, extended detention basins, and other low impact development (LID) controls. In general, most treatment

Milpitas Trash Capture Feasibility Study
March 2017 12
measures are only treating on-site runoff from an individual parcel. A review of a limited number of water quality control measures provided by the City indicates a trash load reduction of 0% due to their location in low trash generating areas. Table 4: Existing Full Trash Capture Devices on Public or Private Property.
Site Name Device Location Device Type TMA(s) Treatment
Area (Acres)
% Trash Reduction
Wrigley/Ford Pump Station
Above Wrigley/Ford pump station GSRD 4, 10, 11,
19 731.50 29.7%
DeVries 153 N. Main Street Vegetated Swale & Vortex Separator 4 1.22 0.02%
Humane Society of Silicon Valley
901 Ames Ave Vegetated Swale & Vortex Separator 13 4.85 0.25%
Mil Aspen Associates 1666 S. Main Street Vegetated Swale &
Vortex Separator 20 2.70 0%
East Centria 1101 S. Main Street Vegetated Swale & Vortex Separator 4, 20 11.28 0.14%
South Bay Honda 920 Thompson Drive Vegetated Swale &
Vortex Separator 8 4.80 0%
Piercey Toyota 950 Thompson Street Vegetated Swale 8 11.37 0%
Milpitas Main Pump Station 1425 McCarthy Blvd Vegetated Swale 14 0.18 0%
Library 160 N. Main Street Vegetated Swale 19 3.36 0%
Paragon PJ3204
1696 S. Main Street cross street Snell Place
Grassy swales and landscaping. Two
vortex hydrodynamic
separators
20 4.56 0%
Total 775.8 30.1%
3.3.2 Other TMA-specific Control Actions The City has also implemented a number of other trash management actions, including anti-littering and illegal dumping enforcement activities, enhanced public/private container management, on-land trash pickup, targeted public information and outreach to businesses, enhanced inspections of businesses, and street sweeping. Trash reduction benefits associated with these actions were observed via on-land visual trash assessments conducted by SCVURPPP on behalf of the City. These actions have resulted in an estimated trash load reduction of 7.7%. As additional trash full capture systems are implemented, it will not be necessary to verify trash reductions via on-land visual assessments within these full capture treatment areas. As a result, the City will lose trash load reduction percentage credit associated with Other TMA-specific Control Actions, but gain the reduction credit in areas where trash full capture systems are implemented. Therefore, the trash load reduction percentage associated with Other Actions will be

Milpitas Trash Capture Feasibility Study
March 2017 13
reduced if full capture systems identified in this Study are installed in areas where trash reductions associated with these actions were previously reported.
3.3.3 Enhanced Creek and Shoreline Cleanups Although the City conducted one-time creek cleanups of Las Coches and Calera Creek in FY 2015-2016, the City did not include a jurisdiction-wide trash load reduction percentage for this effort in its FY 2015-
2016 Annual Report. Future reductions associated with enhanced creek and shoreline cleanups conducted by the City are currently unknown and therefore are assumed to be zero for the purposes evaluating scenarios that achieve 70%, 80% and 100% trash load reductions.
3.3.4 Source Controls On September 1, 2015, the Milpitas City Council approved the Single-Use Carry-Out Plastic Bag Ordinance No. 287 that bans single-use carry-out plastic bags for all retail establishments, with the exception of restaurants. In FY 2015-16, the City reported a 5.8% reduction associated with the bag ordinance. The estimated load reduction attributable to the City’s single-use plastic bag ordinance was based on reduction findings presented in the SCVURPPP Storm Drain Trash Monitoring and
Characterization Report dated September 2016. Reduction findings presented in the SCVURPPP report are assumed to be applicable to the City. For the purposes evaluating scenarios that achieve 70%, 80% and 100% trash load reductions in the City, it is assumed that the 5.8% reduction for the action will continue to be allowed by the RWQCB. Based on conversations with the City staff, the City may adopt an ordinance that bans the distribution of expanded polystyrene food service ware by restaurants and other food establishments in the City. Should the City adopt and implement this ordinance, the estimated load reductions would be based on reduction findings presented in the SCVURPPP Storm Drain Trash Monitoring and Characterization Report dated September 2016, or other information on the effectiveness of the ban that would be collected by the City. For the purposes evaluating scenarios that achieve 70%, 80% and 100% trash load reductions in the City, it is assumed that the 4.2% reduction claimed by other municipalities that have adopted similar ordinances in Santa Clara County would be claimed by the City. This also assumes that this level of reduction will continue to be allowed by the RWQCB.
3.4 Additional Reduction Benefits Needed to Achieve Goals Based on the information included in the City’s FY 2015-2016 Annual Report, the City must reduce their baseline level of trash by an additional 26.8% in FY 2016-17 to reach the 70% trash load reduction goal by July 1, 2017. This assumes that the same level of reduction (i.e., 43.2%) reported in FY 15-16 will again be demonstrated and reported by the City in FY 17-18.
Milpitas Trash Capture Feasibility Study
March 2017 14
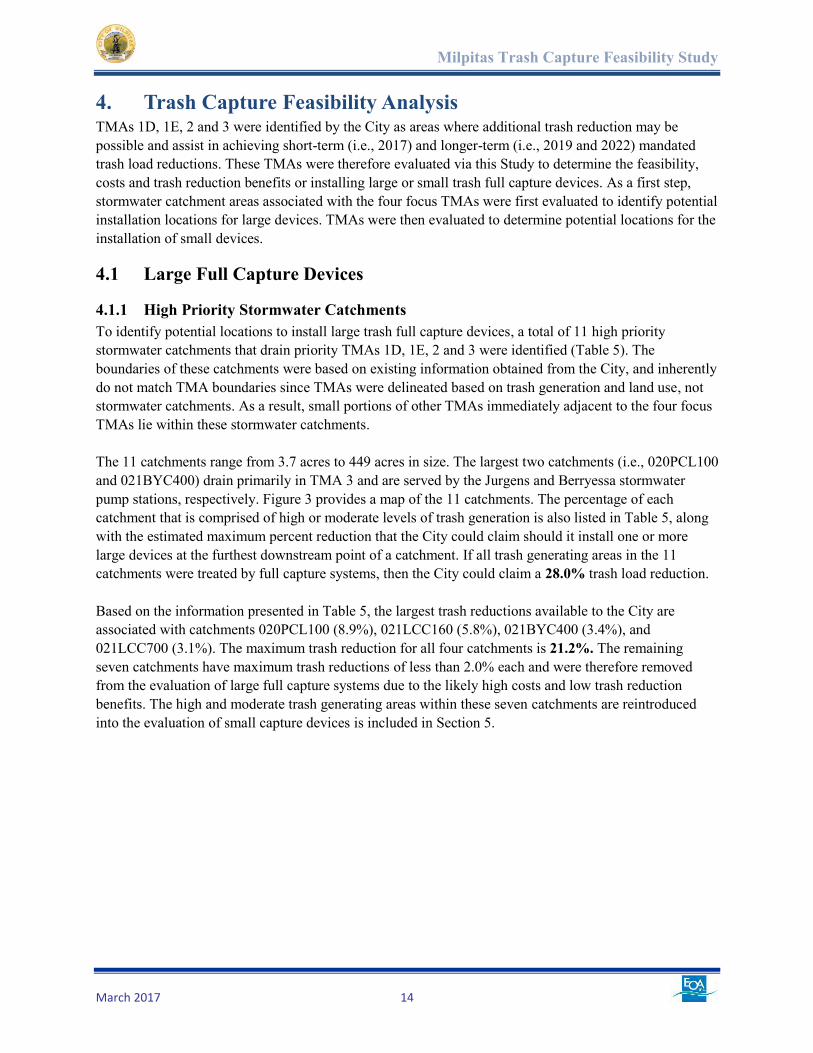
4. Trash Capture Feasibility Analysis TMAs 1D, 1E, 2 and 3 were identified by the City as areas where additional trash reduction may be possible and assist in achieving short-term (i.e., 2017) and longer-term (i.e., 2019 and 2022) mandated trash load reductions. These TMAs were therefore evaluated via this Study to determine the feasibility, costs and trash reduction benefits or installing large or small trash full capture devices. As a first step, stormwater catchment areas associated with the four focus TMAs were first evaluated to identify potential installation locations for large devices. TMAs were then evaluated to determine potential locations for the installation of small devices.
4.1 Large Full Capture Devices
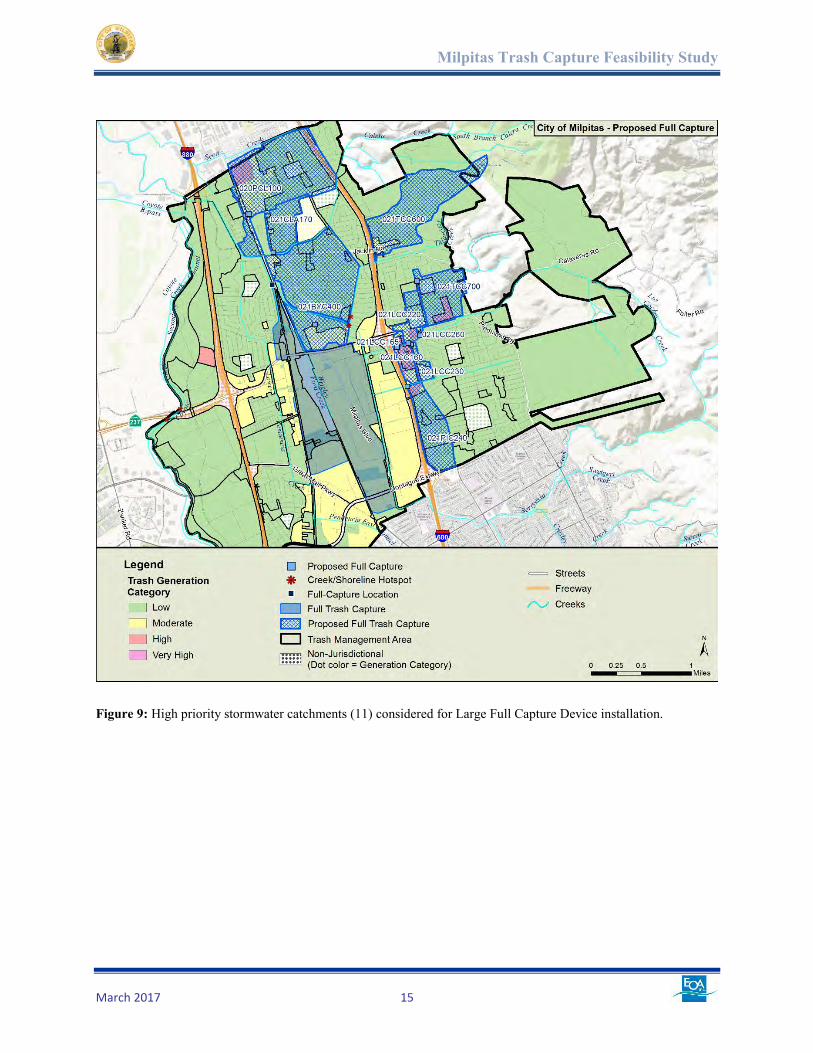
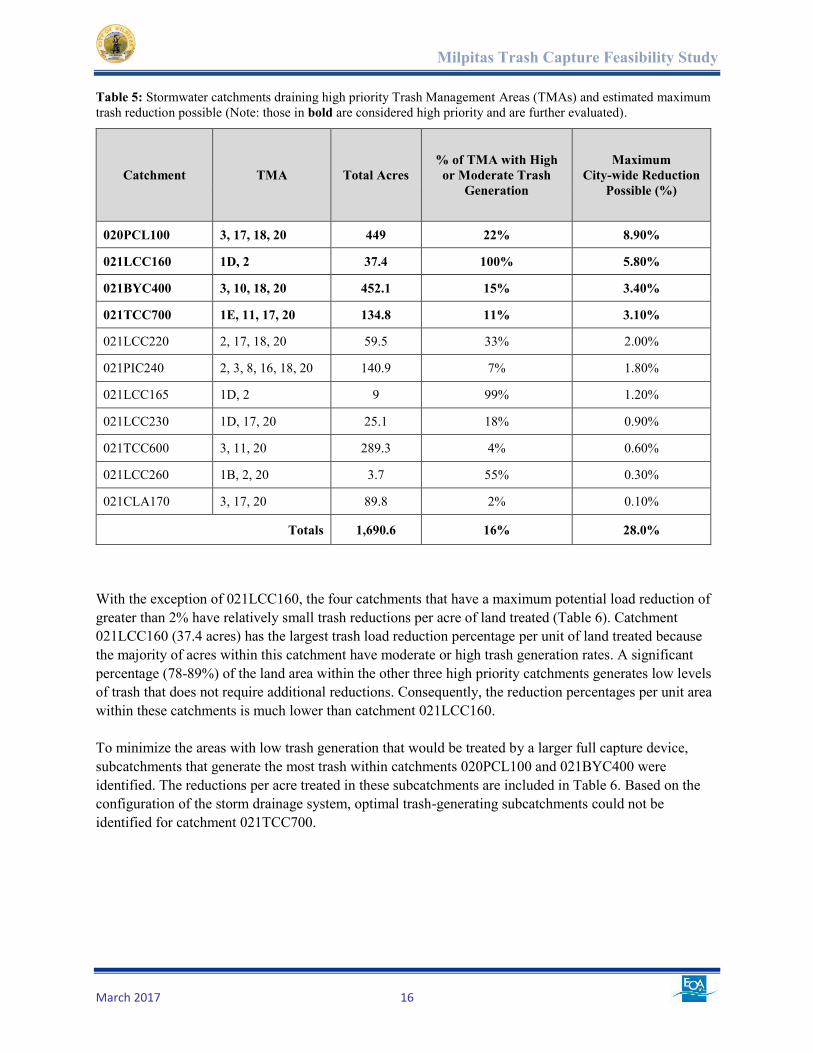
4.1.1 High Priority Stormwater Catchments To identify potential locations to install large trash full capture devices, a total of 11 high priority stormwater catchments that drain priority TMAs 1D, 1E, 2 and 3 were identified (Table 5). The boundaries of these catchments were based on existing information obtained from the City, and inherently do not match TMA boundaries since TMAs were delineated based on trash generation and land use, not stormwater catchments. As a result, small portions of other TMAs immediately adjacent to the four focus TMAs lie within these stormwater catchments. The 11 catchments range from 3.7 acres to 449 acres in size. The largest two catchments (i.e., 020PCL100 and 021BYC400) drain primarily in TMA 3 and are served by the Jurgens and Berryessa stormwater pump stations, respectively. Figure 3 provides a map of the 11 catchments. The percentage of each catchment that is comprised of high or moderate levels of trash generation is also listed in Table 5, along with the estimated maximum percent reduction that the City could claim should it install one or more large devices at the furthest downstream point of a catchment. If all trash generating areas in the 11 catchments were treated by full capture systems, then the City could claim a 28.0% trash load reduction. Based on the information presented in Table 5, the largest trash reductions available to the City are associated with catchments 020PCL100 (8.9%), 021LCC160 (5.8%), 021BYC400 (3.4%), and 021LCC700 (3.1%). The maximum trash reduction for all four catchments is 21.2%. The remaining seven catchments have maximum trash reductions of less than 2.0% each and were therefore removed from the evaluation of large full capture systems due to the likely high costs and low trash reduction benefits. The high and moderate trash generating areas within these seven catchments are reintroduced into the evaluation of small capture devices is included in Section 5.
Milpitas Trash Capture Feasibility Study
March 2017 15
Figure 9: High priority stormwater catchments (11) considered for Large Full Capture Device installation.
Milpitas Trash Capture Feasibility Study
March 2017 16
Table 5: Stormwater catchments draining high priority Trash Management Areas (TMAs) and estimated maximum trash reduction possible (Note: those in bold are considered high priority and are further evaluated).
Catchment TMA Total Acres % of TMA with High
or Moderate Trash Generation
Maximum City-wide Reduction
Possible (%)
020PCL100 3, 17, 18, 20 449 22% 8.90%
021LCC160 1D, 2 37.4 100% 5.80%
021BYC400 3, 10, 18, 20 452.1 15% 3.40%
021TCC700 1E, 11, 17, 20 134.8 11% 3.10%
021LCC220 2, 17, 18, 20 59.5 33% 2.00%
021PIC240 2, 3, 8, 16, 18, 20 140.9 7% 1.80%
021LCC165 1D, 2 9 99% 1.20%
021LCC230 1D, 17, 20 25.1 18% 0.90%
021TCC600 3, 11, 20 289.3 4% 0.60%
021LCC260 1B, 2, 20 3.7 55% 0.30%
021CLA170 3, 17, 20 89.8 2% 0.10%
Totals 1,690.6 16% 28.0%
With the exception of 021LCC160, the four catchments that have a maximum potential load reduction of greater than 2% have relatively small trash reductions per acre of land treated (Table 6). Catchment 021LCC160 (37.4 acres) has the largest trash load reduction percentage per unit of land treated because the majority of acres within this catchment have moderate or high trash generation rates. A significant percentage (78-89%) of the land area within the other three high priority catchments generates low levels of trash that does not require additional reductions. Consequently, the reduction percentages per unit area within these catchments is much lower than catchment 021LCC160. To minimize the areas with low trash generation that would be treated by a larger full capture device, subcatchments that generate the most trash within catchments 020PCL100 and 021BYC400 were identified. The reductions per acre treated in these subcatchments are included in Table 6. Based on the configuration of the storm drainage system, optimal trash-generating subcatchments could not be identified for catchment 021TCC700.
Milpitas Trash Capture Feasibility Study
March 2017 17
Table 6: Trash Load Reductions per Unit Area (acre) of the four highest priority catchments (and subcatchments) in the City of Milpitas.
Catchment/ Subcatchment TMA Total Acres % Reduction/ Acre
Treated
021LCC160 1D, 2 37.4 0.16%
021TCC700 1E, 11, 17, 20 134.8 0.02%
020PCL100 (A&B) 3, 17, 18, 20 449.0 0.02%
020PCL100 - A 3, 20 93.4 0.08%
020PCL100 - B 3, 17, 18, 20 265.0 0.01%
021BYC400 3, 10, 18, 20 452.1 0.01%
021BYC400 - S 3, 10, 18, 20 66.1 0.03%
4.1.2 Large Device Siting and Sizing
When selecting a full capture device, it is important to consider the size of the drainage area, hydraulic losses across the system when the device is full, the permitting requirements in open channels, device maintenance and access, property rights and utility clearance. All factors should be weighed against the device type, construction costs and future operation and maintenance (O&M) costs to ensure maximum trash load reduction per dollar spent. Due to potential flooding as indicated in the City’s Storm Drain Master Plan, it is imperative that the installation of the new trash capture devices consider the potential loss in head across the structure when full or partially full of trash or debris. Large devices can be installed off-line from the main trunk with a diversion structure to re-direct the treatment flow rate. Off-line installations optimize device size since they are not required to have an overflow capacity equal to the capacity of the existing storm drain line. However, due to space requirements, there is the potential for utility conflicts with an offline installation. It is also important to understand that existing utilities and right-of-way restrictions will dictate where a large device may be installed. Should the City decide to move forward with further consideration of any large full capture device, the location of existing utilities will need to be evaluated as a next step. The presence of utilities at proposed installation locations must be field-verified prior to starting any system design. The San Francisco Bay Regional Water Quality Control Board (Water Board) has developed a list of recognized full trash capture devices (updated May 2014 and included as Appendix A) which may be installed to comply with the MRP. In accordance with MRP Permit Provision C.10.a.iii, full trash capture devices must trap all particles retained by a 5-millimeter mesh screen and have a design treatment capacity of not less than the peak flow rate resulting from a one-year, one-hour storm event.
Milpitas Trash Capture Feasibility Study
March 2017 18
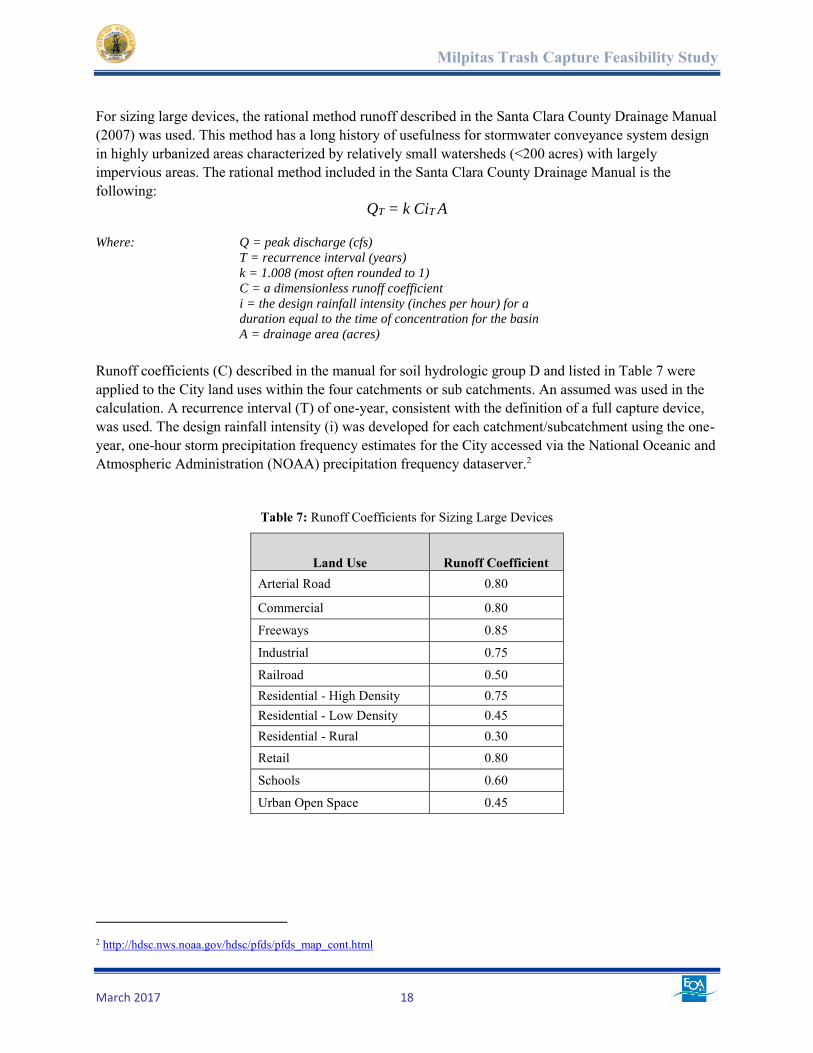
For sizing large devices, the rational method runoff described in the Santa Clara County Drainage Manual (2007) was used. This method has a long history of usefulness for stormwater conveyance system design in highly urbanized areas characterized by relatively small watersheds (<200 acres) with largely impervious areas. The rational method included in the Santa Clara County Drainage Manual is the following:
QT = k CiT A Where: Q = peak discharge (cfs)
T = recurrence interval (years)
k = 1.008 (most often rounded to 1)
C = a dimensionless runoff coefficient
i = the design rainfall intensity (inches per hour) for a
duration equal to the time of concentration for the basin
A = drainage area (acres)
Runoff coefficients (C) described in the manual for soil hydrologic group D and listed in Table 7 were applied to the City land uses within the four catchments or sub catchments. An assumed was used in the calculation. A recurrence interval (T) of one-year, consistent with the definition of a full capture device, was used. The design rainfall intensity (i) was developed for each catchment/subcatchment using the one-year, one-hour storm precipitation frequency estimates for the City accessed via the National Oceanic and Atmospheric Administration (NOAA) precipitation frequency dataserver.2
Table 7: Runoff Coefficients for Sizing Large Devices
Land Use Runoff Coefficient Arterial Road 0.80
Commercial 0.80
Freeways 0.85
Industrial 0.75
Railroad 0.50 Residential - High Density 0.75 Residential - Low Density 0.45 Residential - Rural 0.30 Retail 0.80
Schools 0.60
Urban Open Space 0.45
2 http://hdsc.nws.noaa.gov/hdsc/pfds/pfds_map_cont.html

Milpitas Trash Capture Feasibility Study
March 2017 19
Estimated treatment flow rates for catchments 020PCL100, 021LCC160 and 021TCC700 were calculated using the rationale method. Additionally, flow rates were also calculated for subcatchments to the 020PCL100 catchment (i.e., 020PCL100-A and 020PCL100-B) to evaluate the costs and benefits of treating portions of the larger catchment that have higher trash generation rates. The treatment flow rate for the entire 021BYC400 catchment was not calculated due to the size of the catchment (452 acres) and the low (per unit) trash reduction associated with this catchment. However, the flow rate for the subcatchment 021BYC400-S was calculated. Treatment flow rates for each of the highest priority catchments and subcatchments in the City are listed in Table 8.
Table 8. Treatment flow rates for sizing large trash full capture devices in the four highest priority catchments (and subcatchments) in the City of Milpitas.
Catchment/ Subcatchment Total Acres
Runoff Coefficient (C) for the Catchment
Treatment Intensity (i)
(in/hr)
Treatment Flow Rate (Q)
(cfs)
021LCC160 37.4 0.68 0.44 11.2
021TCC700 134.8 0.58 0.45 33.7
020PCL100 (A&B) 449.0 0.57 0.37 84.9
020PCL100 - A 93.4 0.70 0.38 24.8
020PCL100 - B 265.0 0.54 0.36 51.8
021BYC400
021BYC400 - S 66.1 0.76 0.33 16.5
Treatment flow rates included in Table 8 were used to estimate the size of each large full capture device that could conceptually be installed at the most downstream portion of each catchment or subcatchment. Base maps that include a potential location for a large device in each of the catchments/subcatchments are included in Appendix B. Preliminary planning level capital and O&M costs estimates for each type of large device are included in Section 5 and cost-benefit comparisons between catchments/subcatchments, large device types, and large and small devices are included in Section 6.
4.2 Trash Reduction Benefits - Small Devices
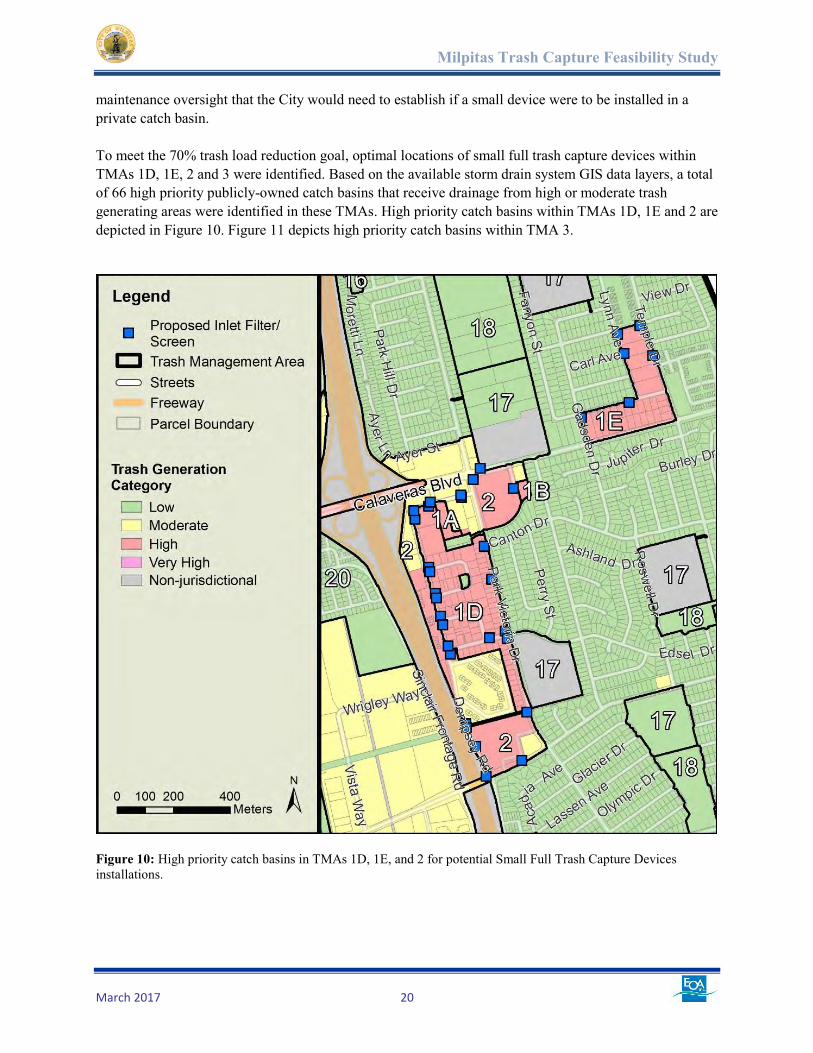
4.2.1 High Priority Catch Basin Locations (Towards 70% Reduction)
Small trash full capture devices (e.g., connector pipe screens or catch basin inserts) are alternatives to large devices. The potential benefits and the estimated trash load reduction associated with installing small devices in areas proposed for treatment were evaluated as part of the Study. Only publicly-owned catch basins receiving trash from high or moderate trash generating areas were included in the evaluation since catch basins in low trash generating areas do not provide a trash load reduction benefit. Privately-owned catch basins were also not included in the analysis because of the lack of ownership and
Milpitas Trash Capture Feasibility Study
March 2017 20
maintenance oversight that the City would need to establish if a small device were to be installed in a private catch basin. To meet the 70% trash load reduction goal, optimal locations of small full trash capture devices within TMAs 1D, 1E, 2 and 3 were identified. Based on the available storm drain system GIS data layers, a total of 66 high priority publicly-owned catch basins that receive drainage from high or moderate trash generating areas were identified in these TMAs. High priority catch basins within TMAs 1D, 1E and 2 are depicted in Figure 10. Figure 11 depicts high priority catch basins within TMA 3.
Figure 10: High priority catch basins in TMAs 1D, 1E, and 2 for potential Small Full Trash Capture Devices installations.
Milpitas Trash Capture Feasibility Study
March 2017 21
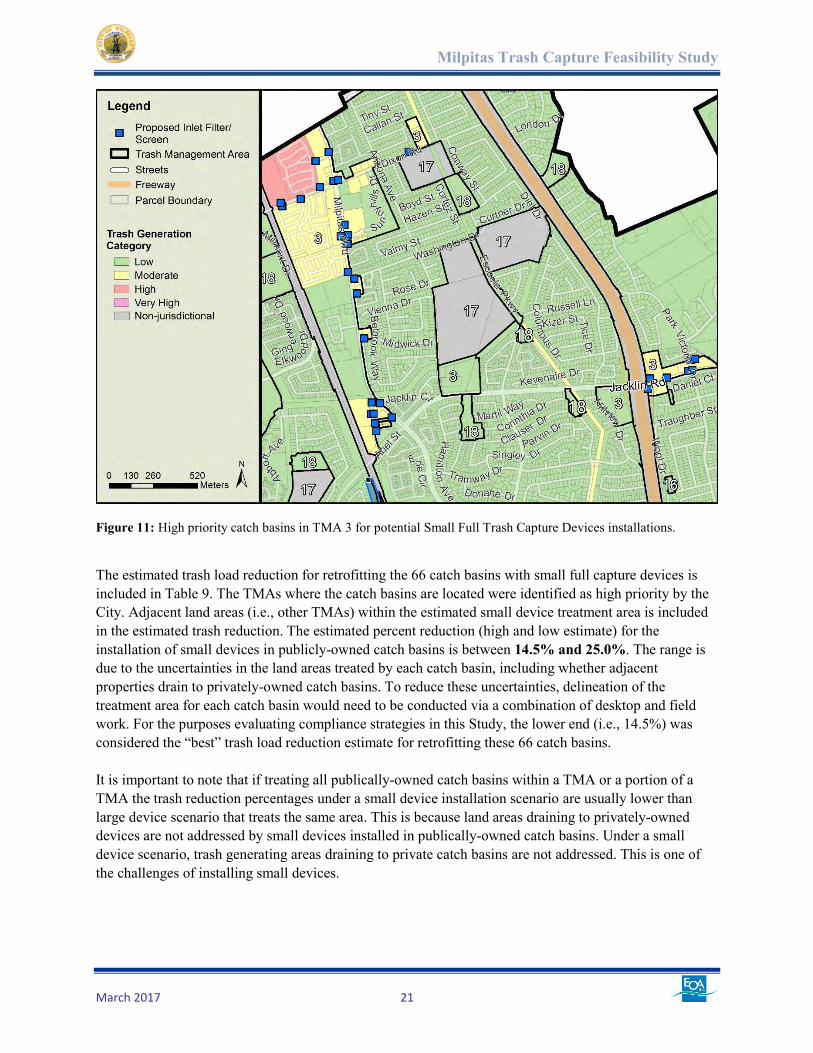
Figure 11: High priority catch basins in TMA 3 for potential Small Full Trash Capture Devices installations.
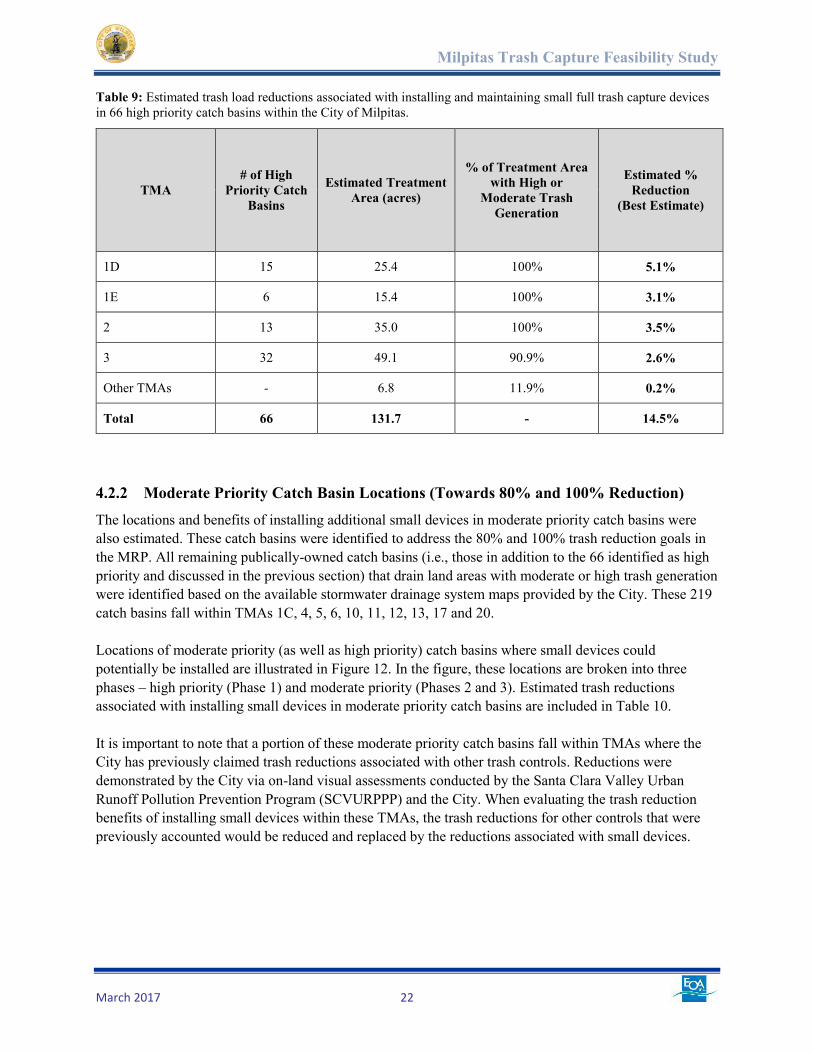
The estimated trash load reduction for retrofitting the 66 catch basins with small full capture devices is included in Table 9. The TMAs where the catch basins are located were identified as high priority by the City. Adjacent land areas (i.e., other TMAs) within the estimated small device treatment area is included in the estimated trash reduction. The estimated percent reduction (high and low estimate) for the installation of small devices in publicly-owned catch basins is between 14.5% and 25.0%. The range is due to the uncertainties in the land areas treated by each catch basin, including whether adjacent properties drain to privately-owned catch basins. To reduce these uncertainties, delineation of the treatment area for each catch basin would need to be conducted via a combination of desktop and field work. For the purposes evaluating compliance strategies in this Study, the lower end (i.e., 14.5%) was considered the “best” trash load reduction estimate for retrofitting these 66 catch basins. It is important to note that if treating all publically-owned catch basins within a TMA or a portion of a TMA the trash reduction percentages under a small device installation scenario are usually lower than large device scenario that treats the same area. This is because land areas draining to privately-owned devices are not addressed by small devices installed in publically-owned catch basins. Under a small device scenario, trash generating areas draining to private catch basins are not addressed. This is one of the challenges of installing small devices.
Milpitas Trash Capture Feasibility Study
March 2017 22
Table 9: Estimated trash load reductions associated with installing and maintaining small full trash capture devices in 66 high priority catch basins within the City of Milpitas.
TMA # of High
Priority Catch Basins
Estimated Treatment Area (acres)
% of Treatment Area with High or
Moderate Trash Generation
Estimated % Reduction
(Best Estimate)
1D 15 25.4 100% 5.1%
1E 6 15.4 100% 3.1%
2 13 35.0 100% 3.5%
3 32 49.1 90.9% 2.6%
Other TMAs - 6.8 11.9% 0.2%
Total 66 131.7 - 14.5%
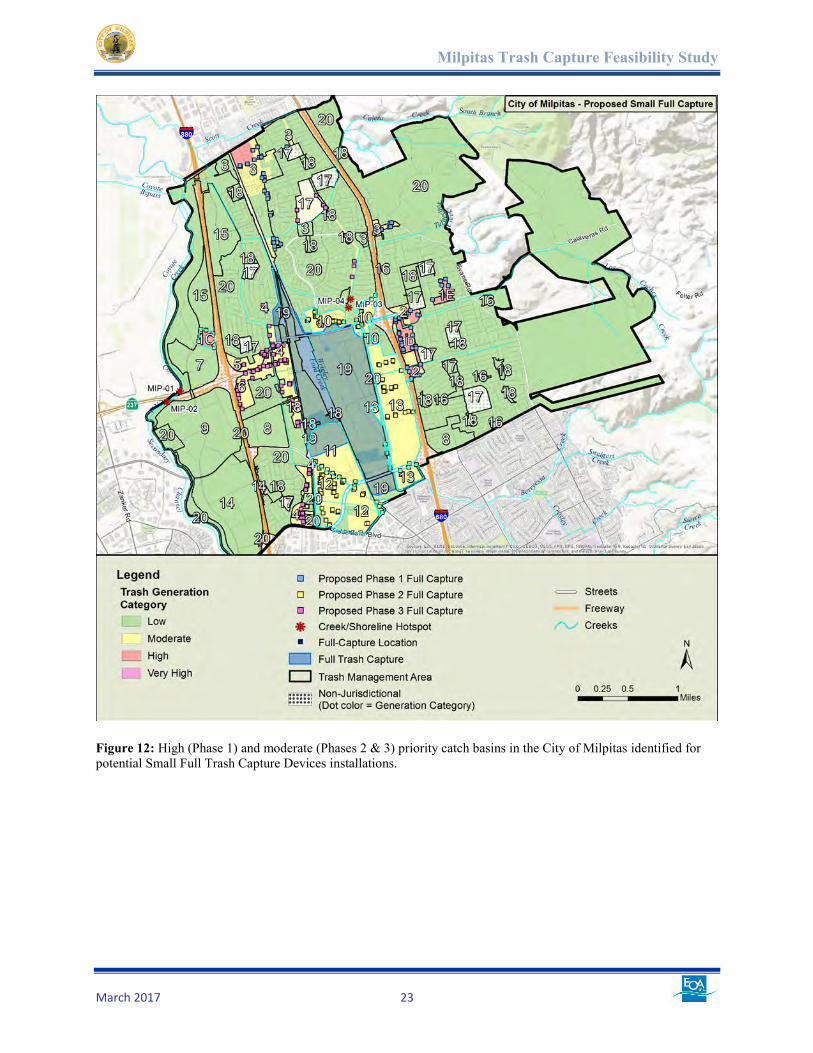
4.2.2 Moderate Priority Catch Basin Locations (Towards 80% and 100% Reduction)
The locations and benefits of installing additional small devices in moderate priority catch basins were also estimated. These catch basins were identified to address the 80% and 100% trash reduction goals in the MRP. All remaining publically-owned catch basins (i.e., those in addition to the 66 identified as high priority and discussed in the previous section) that drain land areas with moderate or high trash generation were identified based on the available stormwater drainage system maps provided by the City. These 219 catch basins fall within TMAs 1C, 4, 5, 6, 10, 11, 12, 13, 17 and 20. Locations of moderate priority (as well as high priority) catch basins where small devices could potentially be installed are illustrated in Figure 12. In the figure, these locations are broken into three phases – high priority (Phase 1) and moderate priority (Phases 2 and 3). Estimated trash reductions associated with installing small devices in moderate priority catch basins are included in Table 10. It is important to note that a portion of these moderate priority catch basins fall within TMAs where the City has previously claimed trash reductions associated with other trash controls. Reductions were demonstrated by the City via on-land visual assessments conducted by the Santa Clara Valley Urban Runoff Pollution Prevention Program (SCVURPPP) and the City. When evaluating the trash reduction benefits of installing small devices within these TMAs, the trash reductions for other controls that were previously accounted would be reduced and replaced by the reductions associated with small devices.
Milpitas Trash Capture Feasibility Study
March 2017 23
Figure 12: High (Phase 1) and moderate (Phases 2 & 3) priority catch basins in the City of Milpitas identified for potential Small Full Trash Capture Devices installations.

Milpitas Trash Capture Feasibility Study
March 2017 24
Table 10: Estimated trash load reductions associated with installing and maintaining small full trash capture devices in 219 moderate priority catch basins within the City of Milpitas.
TMA # of High
Priority Catch Basins
Estimated Treatment Area (acres)
% of Treatment Area with High or
Moderate Trash Generation
Estimated % Reduction
(Best Estimate)
Phase II
1C 8 7.5 100% 1.5%
10 33 31.2 100% 2.0%
11 9 16.9 100% 0.86%
12 47 65.7 98% 3.2%
13 32 74.8 99% 3.7%
Other TMAs 0 20.0 5% 0.1%
SubTotal 129 216.1 90% 11.4%
Phase III
4 52 65.2 95% 3.3%
5 6 6.7 97% 0.33%
6 24 26.5 100% 2.3%
17 5 3.4 42% 0.07%
20 3 16.2 32% 0.26%
Other TMAs 0 0.2 100% 0.01%
SubTotal 90 118.2 86% 6.3%
Total 219 334.3 89% 17.7%
4.2.3 Small Device Siting and Sizing
Connector pipe screens or catch basin inserts intercept trash within catch basins before it enters the rest of City’s stormwater conveyance system. If routinely maintained, this interception point should not significantly impact the hydraulics of the system as a whole. However, localized flooding or ponding can occur at individual catch basins during rain events if small devices are not adequately maintained. All full capture devices must be cleaned and maintained in accordance with MRP Permit Provision C.10.b.i to meet full trash capture system requirements.
Milpitas Trash Capture Feasibility Study
March 2017 25
5. Cost Estimates
5.1 Addressing the 70% Reduction Goal TMAs 1D, 1E, 2 and 3 were identified by the City as high priority areas where additional trash reduction should be evaluated. In the previous section, these areas were evaluated to identify the high priority locations where the City should consider installing large or small trash full capture devices based on the trash reduction benefits. In this section, preliminary planning level cost estimates associated with designing, constructing/installing, and maintaining each device (or groups of devices) are presented. Comparisons of capital and on-going O&M costs between small and full capture devices are also included to assist the City with making decisions about the most cost-effective approaches to achieving mandated trash load reductions. Preliminary planning level costs estimates for large devices are included in Table. Cost estimates for small devices are included in Table 12. Annual and 30-year base costs (device, installation and replacement) and maintenance/operation costs are compared for large and small devices in Table 13. For more detailed costs estimates for large devices, refer to Appendix C. The following assumptions were made when determining construction costs for each proposed device:
Large Devices
o Device cost for hydrodynamic separators (HDS) assumed to be approximately $2,500 for each cubic feet per second treated based on an average for treatment rates greater than 20 cfs provided by KriStar (Old Castle) and Contech Engineered Solutions;
o Device cost for gross solids removal devices (GSRDs) assumed to be approximately 1,220 for each cubic feet per second treated based on an average for treatment rates greater than 60 cfs provided by Roscoe Moss Company;
o Installation costs for large devices are assumed to be 2x the cost of the device plus any diversion structures for HDS units;
o Large devices are installed in areas which do not require major utility relocation, property or easement acquisition or environmental permitting;
o A contingency of 50% of the device and installation costs for design costs, administration and construction contingencies;
o Total Base Cost is presented in the assumed construction year (2017) dollars and includes installation, diversion structure and the device. It does not include maintenance or device replacement; and
o Annualized (30 year) costs assume an annual interest rate of 5.0%.
Small Devices
o Connector pipe screens or catch basin inserts were assumed to be installed in catch basin with dimensions of 24” x 36”; and
o Manufacture and installation costs for connector pipe screens or catch basin inserts is $600/device. Small devices vendors usually lump the cost of manufacturing and installation together.
Milpitas Trash Capture Feasibility Study
March 2017 26
For cleaning, replacement and maintenance cost estimates, the following assumptions were made:
Connector pipe screens or catch basin inserts are cleaned and average of four times a year, requiring 20 minutes/cleaning event with a team of two maintenance workers at $73/hour and vacuum truck at $250/hour;
HDS devices and GSRDs are cleaned twice a year, requiring 4 hours of a team of two staff members at $73/hour, a vacuum truck at $250/hour, a utility truck at $16/hour and a small pump costing $44/hour;
Large devices were assumed to have a lifetime of 50 years; and
Connector pipe screens and catch basin inserts were assumed to need replacing every 10 years.
5.2 Addressing the 80% and 100% Reduction Goals Preliminary planning level cost estimates for installing and maintaining full capture systems designed to achieve the 80% and 100% trash reduction requirements in the MRP were also calculated. These cost estimates are included in Table 14. Because costs per unit of trash reduction become increasingly more expensive as less high and very high trash generating areas are available for treatment, the siting of trash devices becomes more important to optimize cost-benefit. Small devices are generally easier to site, compared to large devices, because they are less constrained by the configuration of the storm drain system and the boundaries of the associated stormwater catchment or subcatchment. For this reason, cost estimates included in Table 14 for achieving 80% and 100% reductions were focused on small devices. Cost estimates are provided for two sets of small devices (i.e., Phases 1 and 2) for which the trash reduction benefits were described in section 4.2.2. For developing cost estimates for installing and maintaining small devices for moderate priority catch basins, the same assumptions listed in section 6.1 were used.
Milpitas Trash Capture Feasibility Study
March 2017 27
Table 11: Preliminary planning level cost estimates for treating high priority stormwater catchments and subcatchments in the City of Milpitas via large full capture devices to address the 70% trash reduction goal.
Stormwater Catchment Device Type
Total Acres
Treated
Reduction Benefit for Other
Pollutants (PCBs/Hg)
Base Costs (Device, Installation &
Contingency)
Operation and Maintenance Costs Total
30-Year Costs
Total Annualized (30 years) Annual Total
(30 years)
021LCC160 In-Line HDS 37.4 Low $156,084 $10,153 $3,064 $91,920 $248,004
021TCC700 In-Line HDS 134.8 Low $408,993 $26,606 $3,064 $91,920 $500,913
020PCL100 (A&B) In-Line HDS 449.0 Low $985,418 $64,103 $3,064 $91,920 $1,077,338
020PCL100-A GSRD 93.4 Low $135,909 $8,841 $3,064 $91,920 $227,829
020PCL100-B GSRD 265.0 Low $284,346 $18,497 $3,064 $91,920 $376,266
021BYC400-S In-Line HDS 66.1 Low $215,618 $14,026 $3,064 $91,920 $307,538

Milpitas Trash Capture Feasibility Study
March 2017 28
Table 12: Preliminary planning level cost estimates for treating high priority Trash Management Areas (TMAs) in the City of Milpitas via small full capture devices to address the 70% trash reduction goal.
TMA # Devices Total Acres Treated3
Reduction Benefit for Other Pollutants (PCBs/Hg)
Estimated Base Costs (Device & Installation)
Estimated Operation and Maintenance Costs
Estimated Total 30-Year Costs
Total (Includes
Replacement)4
Annualized (30 years) Annual Total
(30 years)
1D 15 25.4 Low $27,000 $1,756.39 $6,663 $199,881 $226,881
1E 6 15.4 Low $10,800 $702.56 $2,665 $79,952 $90,752
2 13 35.0 Low $23,400 $1,522.20 $5,774 $173,230 $196,630
3 32 49.1 Low $57,600 $3,746.96 $14,214 $426,413 $484,013
Other TMAs 0 6.8 Low - - - - -
Total 66 131.7 - $118,800 $7,728.11 $29,316 $879,476 $998,276
3 Estimated based on desktop analysis. Further field delineations are needed to confirm treatment areas. 4 Assumes lifespan of each CPS or catch basin insert is 10 years. Replacement would need to occur twice during 30 years.
Milpitas Trash Capture Feasibility Study
March 2017 29
Table 13: Comparison of the trash reduction benefits and costs associated with potential large and small full capture devices in the City of Milpitas to address the 70% trash reduction goal.
Full Capture Device
Category
Type # of Devices
Associated Stormwater Catchment
Associated TMAs
Total Estimated Annual Costs Total Estimated 30-year Costs Cost-Benefit
Capital O&M Total Capital O&M Total Total % Trash Reduction
30-year Costs for each 1% Trash
Reduction
Large GSRD 1 020PCL100-A 3, 20 $8,841 $3,064 $11,905 $135,909 $91,920 $227,829 7.7% $29,768
Large In-Line HDS 1 021LCC160 1D, 2 $10,153 $3,064 $13,217 $156,084 $91,920 $248,004 5.8% $42,836
Small CPS or Insert 66 NA 1D, 1E, 2, 3 $7,728 $29,316 $37,044 $118,800 $879,476 $998,276 14.5% $68,847
Large In-Line HDS 1 020PCL100 (A&B) 3, 17, 18, 20 $64,103 $3,064 $67,167 $985,418 $91,920 $1,077,338 8.9% $121,369
Large In-Line HDS 1 021BYC400-S 3, 10, 18, 20 $14,026 $3,064 $17,090 $215,618 $91,920 $307,538 2.2% $140,893
Large In-Line HDS 1 021TCC700 1E, 11, 17, 20 $26,606 $3,064 $29,670 $408,993 $91,920 $500,913 3.1% $160,813
Large GSRD 1 020PCL100-B 3, 17, 18, 20 $18,497 $3,064 $21,561 $284,346 $91,920 $376,266 1.2% $307,644
Milpitas Trash Capture Feasibility Study
March 2017 30
Page Intentionally Left Blank
Milpitas Trash Capture Feasibility Study
March 2017 31
Table 14. Preliminary planning level cost estimates for treating moderate priority Trash Management Areas (TMAs) in the City of Milpitas via small full capture devices to address the 80% and 100% trash reduction goals.
Phase TMA # Devices Total Acres Treated5
Reduction Benefit for
Other Pollutants (PCBs/Hg)
Base Costs (Device & Installation) Operation and Maintenance Costs
Total 30-Year Costs Total
(Includes Replacement)6
Annualized (30 years) Annual Total
(30 years)
2
1C 8 7.5 Low $14,400 $937 $3,553 $106,603 $121,003
10 33 31.2 Low $59,400 $3,864 $14,658 $439,738 $499,138
11 9 16.9 Low $16,200 $1,054 $3,998 $119,929 $136,129
12 47 65.7 Low $84,600 $5,503 $20,876 $626,294 $710,894
13 32 74.8 Low $57,600 $3,747 $14,214 $426,413 $484,013
Other 0 20.0 Low - - - - -
SubTotal 129 216.1 - $232,200 $15,105 $57,299 $1,718,977 $1,951,177
3
4 52 65.2 Low $9,000 $6,089 $23,097 $692,921 $786,521
5 6 6.7 Low $10,800 $703 $2,665 $79,952 $90,752
6 24 26.5 Low $93,600 $2,810 $10,660 $319,810 $363,010
17 5 3.4 Low $10,800 $585 $2,221 $66,627 $75,627
20 3 16.2 Low $43,200 $351 $1,333 $39,976 $45,376
Other 0 0.2 Low - - - - -
SubTotal 90 118.2 - $162,000 $10,538 $39,976 $1,199,286 $1,361,286
Totals 219 334.3 - $294,200 $25,643 $97,275 $2,918,263 $3,312,463
5 Preliminary estimate based on desktop analysis. Further field delineations are needed to confirm treatment areas. 6 Assumes lifespan on CPS or catch basin insert is 10 years. Replacement would need to occur twice during 30 years.
Milpitas Trash Capture Feasibility Study
March 2017 32
6. Conclusions & Recommendations
Based on conversations with City staff, the City budgeted approximately $350,000 in FY 2015-16 for the design and construction of trash full capture devices. These funds are intended to assist the City with achievement of the required 70% trash load reduction goal by July 1, 2017. The levels of City funding available or projected to assist in achieving future trash reductions (i.e., 80% and 100%) are currently unknown.
6.1 Proposed Road Map to 70% Reduction The trash reduction evaluation and preliminary planning level cost estimates presented in Table 12 for all devices or combinations of devices suggests that the City would incur the lowest costs over 30 years by installing a Gross Solids Removal Device (GSRD) in the channel draining stormwater catchment 020PCL100-A and one in-line Hydrodynamic Separator (HDS) to treat the stormwater catchment 021LCC160. The GSRD would treat high, moderate and low trash generating areas in TMAs 3 and 20. The HDS would treat moderate and high trash generating areas in TMAs 1D and 2. It is estimated that these devices would collectively reduce trash entering the stormwater conveyance system by 13.5%. If the City should choose to move forward with further evaluating these devices, the practicality of having these devices be operational by the MRP required timeframe for achieving 70% reduction should be considered. For these devices to become operational, the City would likely need to immediately develop a bid package, solicit a contractor bids, negotiate/award the contract, and require the contractor to design, construct and install the device by July 1, 2017. Based on the experience of the EOA project team, it is highly unlikely that one or both of these devices could be operational in this timeframe. Therefore, the City would need to be prepared to risk a non-compliance determination by the San Francisco Bay Regional Water Board. Considering the potential ramifications of being in non-compliance with the MRP, the design and installation of these two large devices is not recommended at this time to achieve the 70% reduction goal. As an alternative to installing large full capture devices to address trash in TMAs 1D, 2 and 3, the project team recommends that the City consider the near-term installation of small devices in the 66 high priority catch basins identified in TMAs 1D, 1E, 2 and 3. These devices can likely be operational by July 1, 2017. At a minimum, these catch basins should reduce trash entering the stormwater conveyance system by 14.5%, a reduction comparable to the two large devices discussed above. Once treatment areas for these small devices are delineated in the field, it is highly likely that the trash reduction percentage for these devices will increase up to 25.0%. In addition to installing small capture devices to assist the City in addressing the 70% reduction target in the MRP, the project team also recommends that the City reevaluate the trash generation categories assigned to the mobile home parks located along North Dixon Landing Road between Milmont Avenue and Milpitas Boulevard. The interior of these residential communities are currently identified as high trash generating areas on the City’s baseline map. Based on our limited review of these residential areas, the interiors of the mobile home parks are not likely generating high trash levels, although the adjacent streets may be consider high trash generating. Based on confirmations via on-land visual assessments conducted by the City and/or SCVURPPP, baseline trash levels could be reduced for these areas, which would assist the City in demonstrating additional trash reduction percentages by July 1, 2017.

Milpitas Trash Capture Feasibility Study
March 2017 33
Table 13 provides a summary of the estimated trash reductions benefits that the City could claim in FY 2016-17 should the 66 small full capture devices be installed in high priority catch basins identified during this evaluation. The trash load reductions presented in Table 13 assume the City will do the following in pursuit of 70% reduction in FY 2016-17:
o Continue to demonstrate similar or higher trash reductions to those reported in FY 15-16 from other (non-full capture) controls via on-land assessments;
o Adopt and begin implementing an expanded polystyrene food service ware ordinance by July 1, 2017 and the reductions associated with the ordinance will be similar to that claimed by other cities in the Santa Clara Valley (i.e., 4.2%); and
o Begin claiming reductions associated with existing full capture systems installed on private land areas that are currently estimated to be roughly 0.4%.
The reductions included in Table 15 do not include added reductions associated with revisions to baseline trash generation maps described in the previous paragraph. If these revisions are made, the reductions reported by the City should increase in FY 2016-17.
Table 15: Reported and estimated trash reduction benefits associated with source controls, existing public and private full capture devices, proposed additional small full capture devices, and other actions implemented in the City of Milpitas.
Reductions Reported FY 2015-16
Estimated 2016-17
Single-Use Plastic Bag Ordinance 5.8% 5.8%
Expanded Polystyrene Food Service Ware Ordinance 0% 4.2%
Existing Public Full Capture 29.7% 29.7%
Existing Private Full Capture 0% 0.4%
Small Full Capture (Phase 1: 66 devices) 0% 14.5 - 25.0%
Other Management Actions (via on-land visual assessments) 7.7% 8.0 – 15.0%
Total 43.2% 62.6-80.1%
6.2 Addressing Future Trash Reduction Requirements Based on the results of this Study, the City’s achievement of the MRP-required 80% and 100% trash load reductions will become increasingly more expensive over time. This is mainly because there will be limited very high or high trash generating areas remaining within the City, should the recommendations outlined in section 6.1 will implemented. The only options that will be available to the City to address the 80% and 100% trash reduction goals will be to reduce trash from the remaining moderate trash generating areas. Based on the estimated costs presented in Table 11, costs for full capture systems per unit of trash reduced will increase by a factor of 2 to 4 times once the 70% reduction goal is achieved.

Milpitas Trash Capture Feasibility Study
March 2017 34
For these reasons described above, the project team recommends that once the treatment areas for all small trash capture devices have been delineated, the City should consider the costs and benefits of implementing other types of controls before embarking on the design and installation of large or small devices. Based on this evaluation, small devices may likely be the most cost effective approach for the City. Larger devices, however, will likely not be the most cost-effective strategies to address trash, given that these devices will be constrained by the existing configuration of the storm drain system and the boundaries of the associated stormwater catchment or subcatchment, which results in the treatment of low trash generating areas that have no trash reduction benefit. It is important to note that another factor that will need to be taken into consideration if the City begins to install full capture systems in areas where trash reductions associated with other (non-full capture) controls have been claimed in previous fiscal years, is the potential for double-counting load reductions. The overlap between full capture systems and on-land visual assessments will need to be reconciled when calculated load reductions. Trash reductions previously claimed/reported for other actions will be reduced if they are associated with areas that are treated by future full capture systems. Based on the project team’s current understanding of the number of on-land visual assessment site locations and associated trash reductions that were claimed in fiscal years prior to FY 2016-17, planning level trash reduction estimates for small full capture devices and other actions are provided in Table 16. These estimates should be considered preliminary at this time and should be refined based on delineations of treatment areas if the City decides to install additional small full capture systems in the future. Table 16: Comparison of the trash reduction benefits and costs associated with potential large and small full capture devices in the City of Milpitas.
Reductions Estimated 2019
Estimated 2022
Single-Use Plastic Bag Ordinance 5.8% 5.8%
Expanded Polystyrene Food Service Ware Ordinance 4.2% 4.2%
Existing Public Full Capture 29.7% 29.7%
Existing Private Full Capture 0.6% 0.8%
Small Full Capture (Phase 1: 66 devices) 14.5 - 25% 14.5 - 25%
Small Full Capture (Phase 2: ~129 devices) 11.4 - 30% 11.4 - 30%
Small Full Capture (Phase 3: ~90 devices) 0% 6.3-10%
Other Management Actions (via on-land visual assessments) 5-10% 0%
Additional Creek and Shoreline Cleanups 0% 0%
Total 71.2 - 100% 72.7 – 100%
Milpitas Trash Capture Feasibility Study
March 2017
Appendix A:
Trash Full Capture Devices Recognized
by the San Francisco Bay Regional Water Quality Control Board

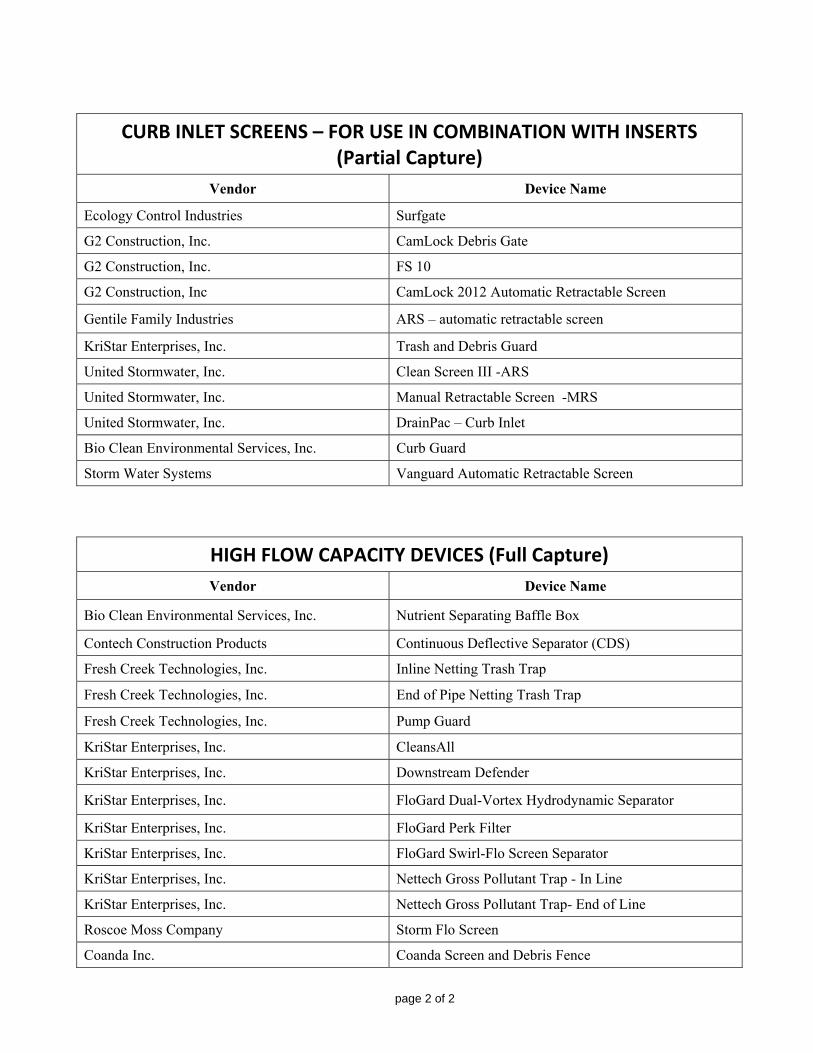
Trash Capture Devices approved by San Francisco Bay
Regional Water Quality Control Board staff
May 2014
page 1 of 2
Devices on this list – catch basin inserts (connector pipe screens and media filters) and high-flow capacity devices (hydrodynamic separators and trash nets) have been approved by Water Board staff as providing full trash capture in compliance with the Municipal Regional Stormwater NPDES Permit. Curb inlet screens may be used in combination with full capture devices, but alone they are not considered full-capture.
CATCH BASIN INSERTS (Full Capture)
Vendor Device Name
Advanced Solutions Stormtek ST3
Advanced Solutions Stormtek ST3-G
Best Management Products, Inc. SNOUT Oil-Debris Separator (with Trash Screen)
Bio Clean Environmental Services, Inc. Grate Inlet Skimmer Box (square design)
Bio Clean Environmental Services, Inc. High Capacity Round Grate Inlet Skimmer Box
Bio Clean Environmental Services, Inc. Round Connector Pipe Screen
Ecology Control Industries Debris Dam
G2 Construction, Inc. Collector Pipe Screen
G2 Construction, Inc. Collector Pipe Screen Removable
Gentile Family Industries Wavy Grate Trash Catcher
KriStar Enterprises, Inc. Flo Gard Plus Catch Basin Filter Insert, combination inlet style – C3 (stainless steel)
KriStar Enterprises, Inc. Flo Gard Plus Catch Basin Filter Inserts, flat grated inlet style, rectangular or round – C3 (stainless steel)
KriStar Enterprises, Inc. FloGard Catch Basin Outlet Screen Insert
Revel Environmental Manufacturing, Inc. (REM) Triton Bioflex Drop Inlet Trash Guard
United Stormwater, Inc. Connector Pipe Screen
United Stormwater, Inc. DrainPac – Drop Inlet
Xeripave, LLC Storm Grate Baskets with screened 10” sidewall
page 2 of 2
CURB INLET SCREENS – FOR USE IN COMBINATION WITH INSERTS (Partial Capture)
Vendor Device Name
Ecology Control Industries Surfgate
G2 Construction, Inc. CamLock Debris Gate
G2 Construction, Inc. FS 10
G2 Construction, Inc CamLock 2012 Automatic Retractable Screen
Gentile Family Industries ARS – automatic retractable screen
KriStar Enterprises, Inc. Trash and Debris Guard
United Stormwater, Inc. Clean Screen III -ARS
United Stormwater, Inc. Manual Retractable Screen -MRS
United Stormwater, Inc. DrainPac – Curb Inlet
Bio Clean Environmental Services, Inc. Curb Guard
Storm Water Systems Vanguard Automatic Retractable Screen
HIGH FLOW CAPACITY DEVICES (Full Capture)
Vendor Device Name
Bio Clean Environmental Services, Inc. Nutrient Separating Baffle Box
Contech Construction Products Continuous Deflective Separator (CDS)
Fresh Creek Technologies, Inc. Inline Netting Trash Trap
Fresh Creek Technologies, Inc. End of Pipe Netting Trash Trap
Fresh Creek Technologies, Inc. Pump Guard
KriStar Enterprises, Inc. CleansAll
KriStar Enterprises, Inc. Downstream Defender
KriStar Enterprises, Inc. FloGard Dual-Vortex Hydrodynamic Separator
KriStar Enterprises, Inc. FloGard Perk Filter
KriStar Enterprises, Inc. FloGard Swirl-Flo Screen Separator
KriStar Enterprises, Inc. Nettech Gross Pollutant Trap - In Line
KriStar Enterprises, Inc. Nettech Gross Pollutant Trap- End of Line
Roscoe Moss Company Storm Flo Screen
Coanda Inc. Coanda Screen and Debris Fence

Milpitas Trash Capture Feasibility Study
March 2017
Appendix B:
Base Maps Illustrating Potential Large Full Capture Locations in High Priority Stormwater Catchments
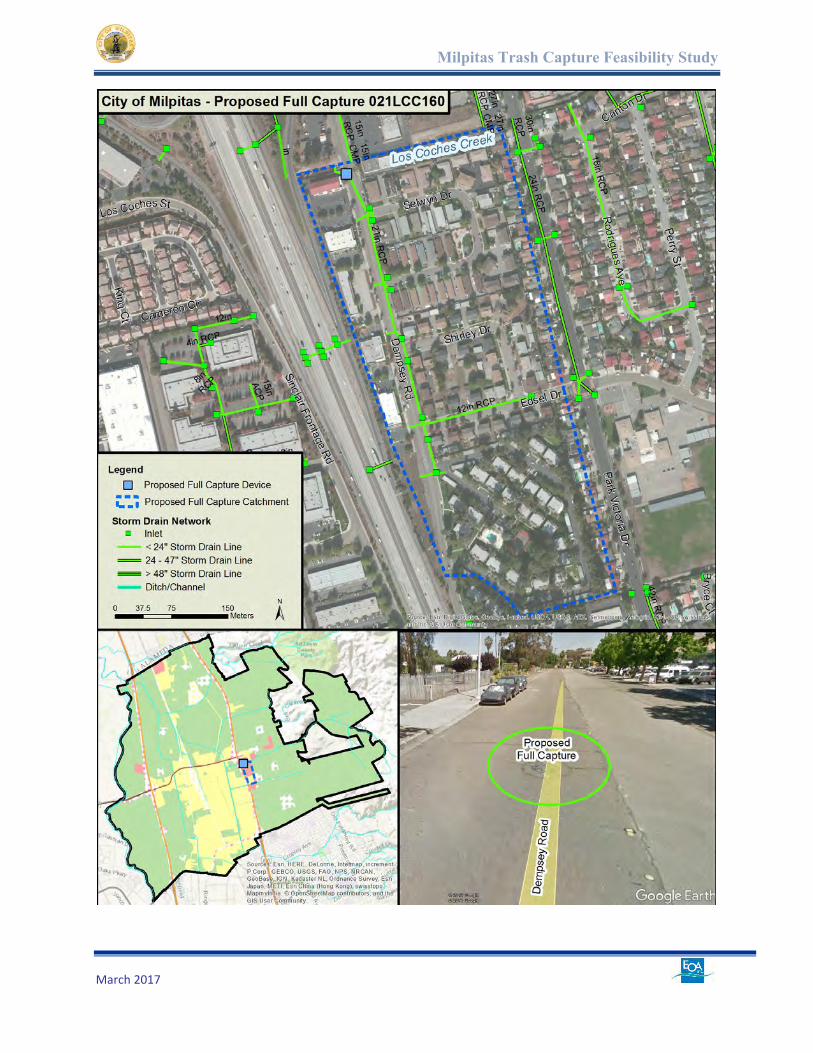
Milpitas Trash Capture Feasibility Study
March 2017
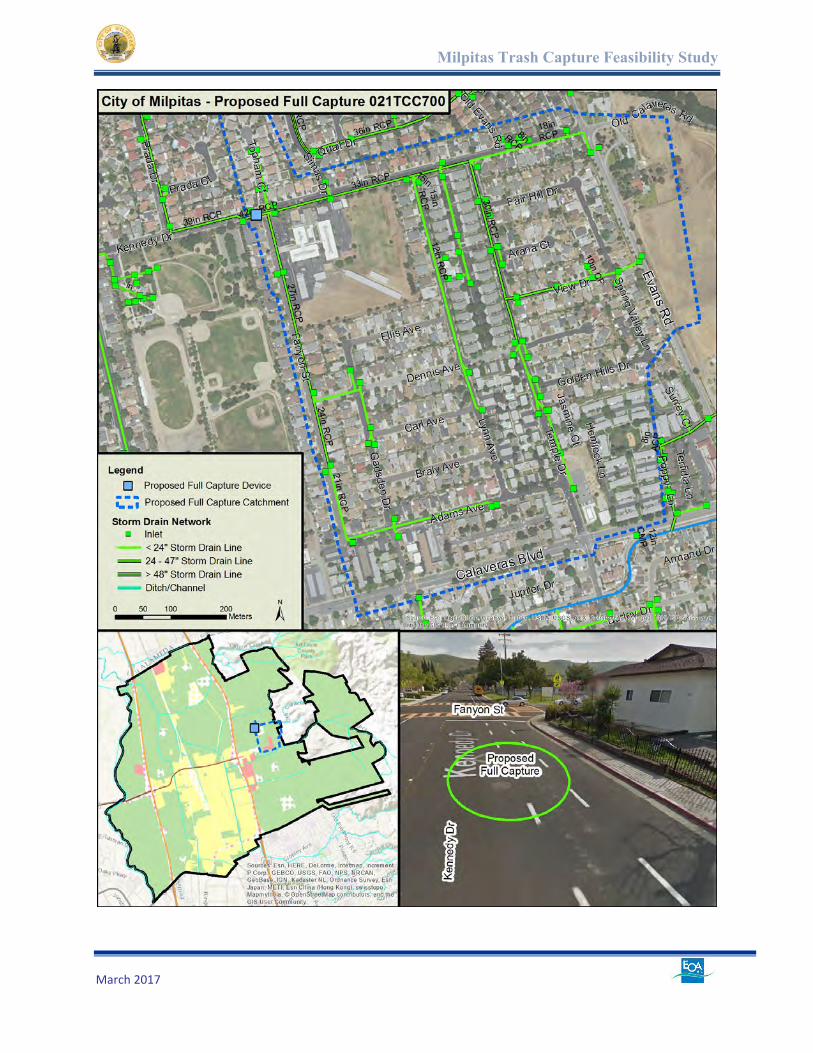
Milpitas Trash Capture Feasibility Study
March 2017
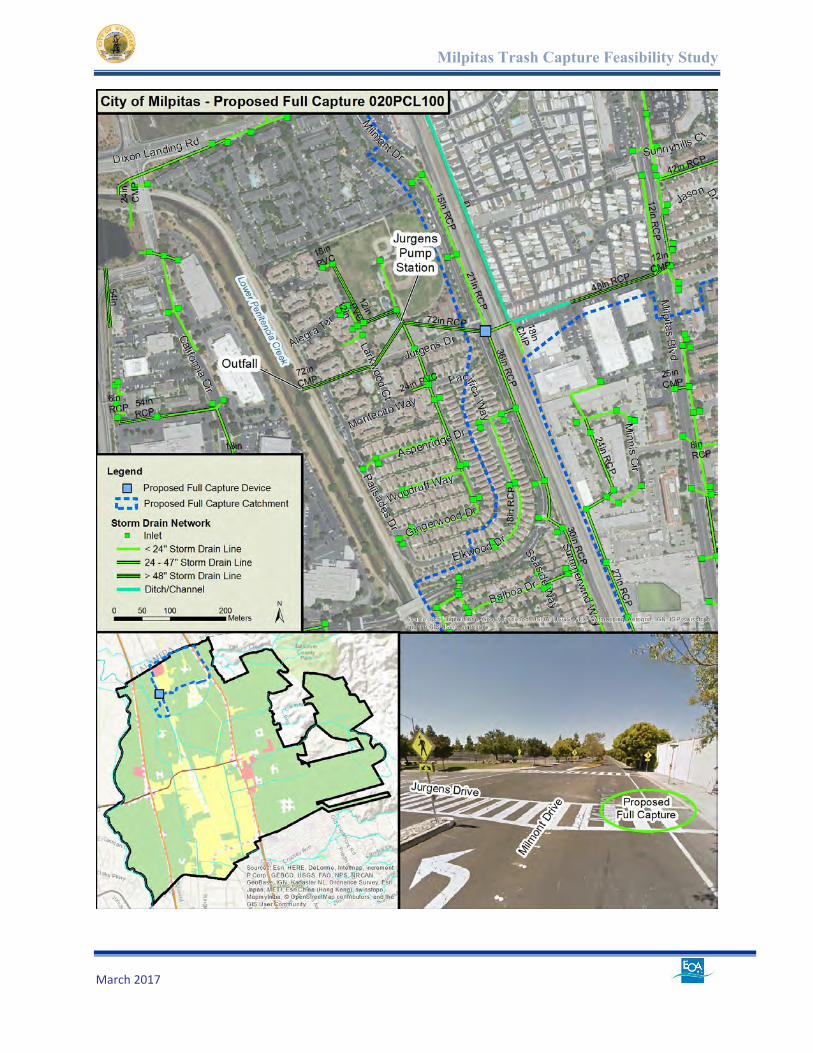
Milpitas Trash Capture Feasibility Study
March 2017
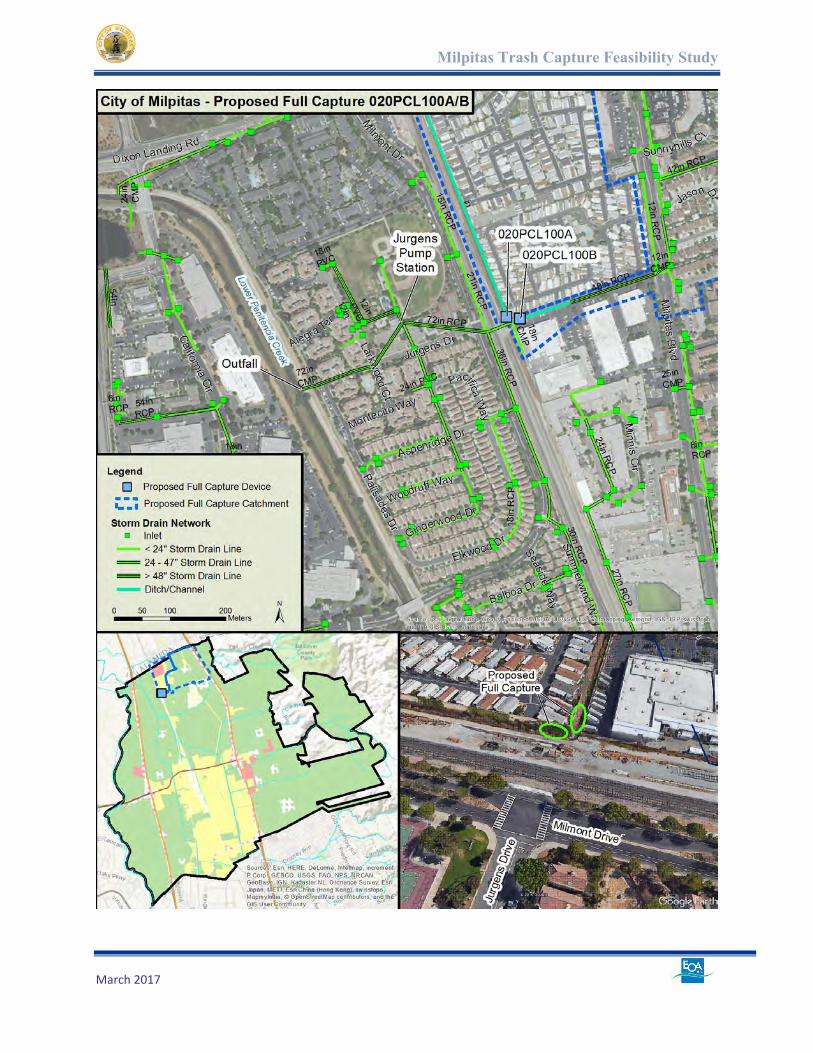
Milpitas Trash Capture Feasibility Study
March 2017
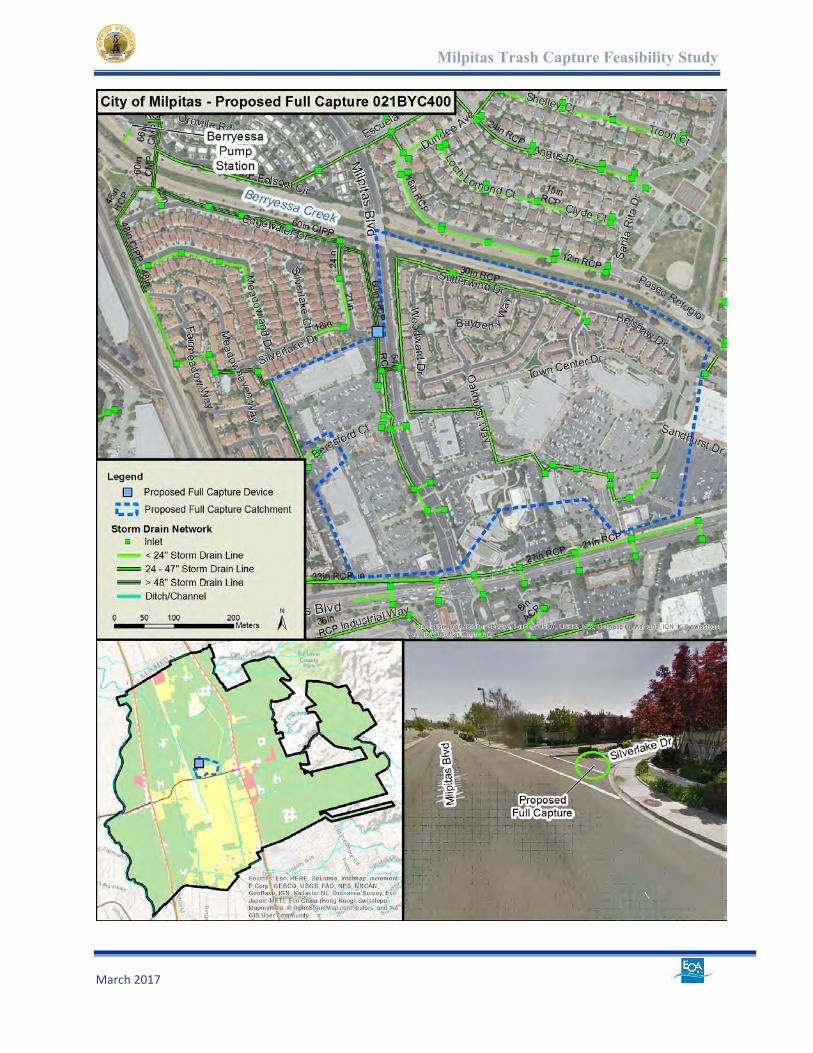
Milpitas Trash Capture Feasibility Study
March 2017
Milpitas Trash Capture Feasibility Study
March 2017
Appendix C:
Detailed Cost Estimate for Potential Large Full Capture Devices in the City of Milpitas

Milpitas Trash Capture Feasibility Study
March 2017
Catchment Device Type
Estimated Base Costs
Annual Maintenance
Cost (2017)
Total Annual Cost for 30
Years (Base and
Maintenance)
Device Cost
(2017)
Diversion Structure
or DS Manhole
Cost
Installation Cost
(2017)
Total Base 2017 Cost (Capital)
Contingency Total Base Cost with
Contingency
Annualized Base Cost (30 years)
021LCC160 In-Line HDS $28,019 $20,000 $76,037 $104,056 $52,028 $156,084 $10,153 $3,064 $13,217
021TCC700 In-Line HDS $84,221 $20,000 $188,441 $272,662 $136,331 $408,993 $26,606 $3,064 $29,670
020PCL100 In-Line HDS $212,315 $20,000 $444,630 $656,945 $328,473 $985,418 $64,103 $3,064 $67,167
020PCL100A GSRD $30,202 $0 $60,404 $90,606 $45,303 $135,909 $8,841 $3,064 $11,905
020PCL100B GSRD $63,188 $0 $126,376 $189,564 $94,782 $284,346 $18,497 $3,064 $21,561
021BYC400S In-Line HDS $41,248 $20,000 $102,497 $143,745 $71,873 $215,618 $14,026 $3,064 $17,090