Embed Size (px)
Citation preview

Conservation & Climate aCtion Plan
City of missoula
Letter from the Mayor’s Climate Action Task Force ............................................................. 1
Letter from the Mayor ........................................................................................................... 2
Acknowledgements .............................................................................................................. 3
Executive Summary .............................................................................................................. 4
introduction ......................................................................................................................... 8
The Case for the Plan ........................................................................................................ 9
City of Missoula Conservation & Climate Change Milestones .......................................... 9
City of Missoula Greenhouse Gas Inventory ................................................................... 10
Conservation & Climate Action Plan ............................................................................... 11
methodology ..................................................................................................................... 13
Emissions Factor for Electricity Produced in the State of Montana ............................... 14
Use of the Climate and Air Pollution Planning Assistant ................................................ 14
Explanation of the Suites of Strategies and Relation to Interim Goals ........................... 15
Conservation and Climate action strategies ................................................................. 16
Fleet and Facilities Working Group ................................................................................. 18
Internal Policies and Practices Working Group ............................................................... 39
Renewable Energy and Offsets Working Group .............................................................. 57
additional actions and strategies identified ................................................................. 70
Recommended Actions ................................................................................................... 71
Conservation & Climate Action Plan Demonstration Projects ........................................ 74
Strategies for the Community Conservation & Climate Action Plan ............................... 77
implementation ................................................................................................................. 79
appendix ........................................................................................................................... 85
Abbreviations/ Key Definitions ........................................................................................ 86
Conversion Factors and Common Variables .................................................................. 87
Contents
Submitted November 6, 2012 • Updated November 6, 2012
City of missoula Conservation & Climate aCtion Plan 2
Dear Friends,
What makes the City of Missoula such a wonderful place to live, work, play and engage with family, friends and neighbors?
Some say it’s the easy access to rivers, mountains, and open space. Others talk about the mix of vibrant local businesses, sporting events, outdoor concerts, farmer’s markets, and family-friendly gatherings that make our city so unique. Some just say it’s something intangible – the quality of life in Missoula that’s pretty darned exceptional.
We, the members of Missoula’s Climate Action Plan Task Force, believe that Missoula is a wonderful place – and keeps getting better – in large part because of its people. Business leaders, teachers, government employees, students, and citizens routinely work hand-in-hand with elected leaders to protect our public resources, support the local economy, and help care for this community.
We also understand that when challenges come up, community members must rise to meet them. And because we believe our city is unique, we want to help craft good decisions that will protect it for the long term. We can’t predict the future, but we do know that our city will keep growing and changing — and that we’ll need to find new, efficient ways to power our buildings and provide goods and services to citizens. And, with climate change already causing drought, declining snowpack, and shifts in our native plant and animal species, it is ever more critical to protect the clean air and clean water that are the lifeblood of our economy and our community.
In 2009, the City of Missoula took an inventory of its municipal energy use and carbon footprint, and Mayor John Engen convened this Task Force to move from research to action. We, the members, include small business owners, City employees, conservation professionals, University representatives, and more. Over the course of a year, we consulted with an even wider, more diverse group of individuals to develop conservation actions that will streamline our city-wide operations, reduce costs, decrease consumption, and build a safer future for the City of Missoula. We feel that this plan—although ambitious—is absolutely necessary. We also recognize that as we move forward, the plan will likely evolve and improve thanks to the ingenuity and dedication of Missoula’s City government.
Many thanks are due to the City employees, local citizens, business leaders, and groups who contributed to this plan. In particular, Chase Jones and Andrew Valainis deserve special recognition for all their hard work and for keeping the rest of us on track. And most importantly, we thank Mayor Engen for convening this group and trusting us to create a plan this community deserves.
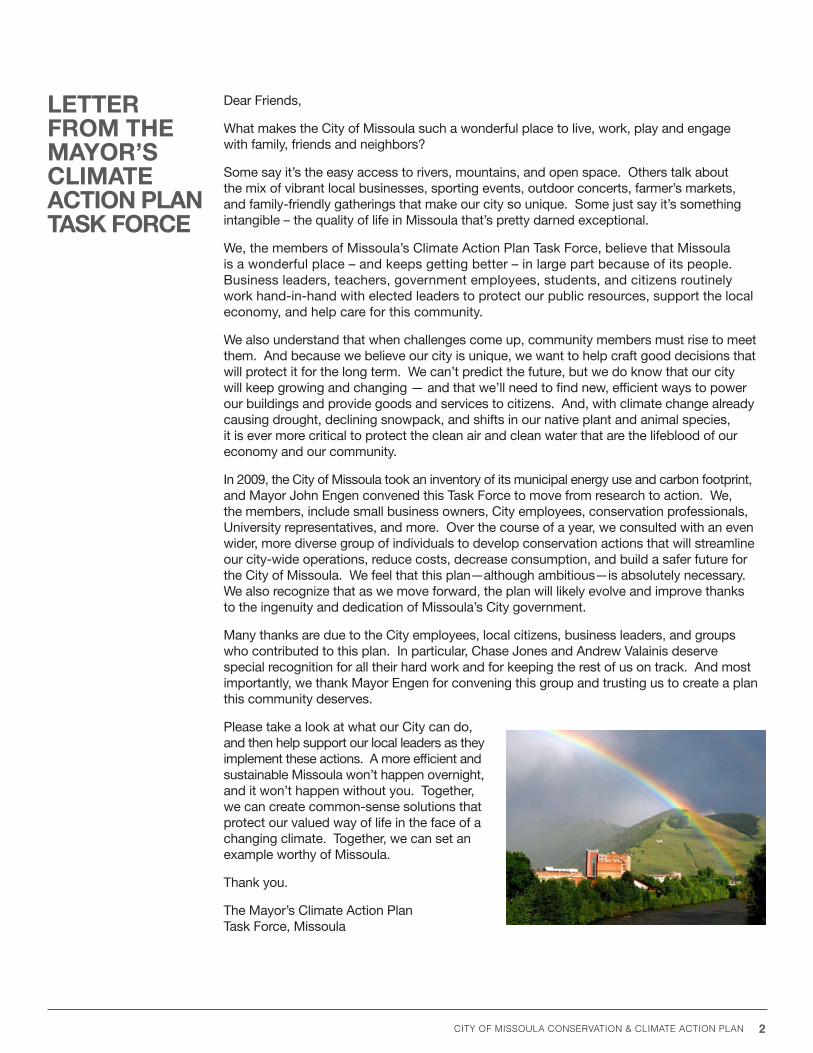
Please take a look at what our City can do, and then help support our local leaders as they implement these actions. A more efficient and sustainable Missoula won’t happen overnight, and it won’t happen without you. Together, we can create common-sense solutions that protect our valued way of life in the face of a changing climate. Together, we can set an example worthy of Missoula.
Thank you.
The Mayor’s Climate Action Plan Task Force, Missoula
letter from the mayor’s Climate aCtion Plan task forCe
City of missoula Conservation & Climate aCtion Plan 3
November 5, 2012
Greetings and welcome to our Conservation & Climate Action Plan.
Good work takes time, even when it’s urgent.
There’s no question that the City of Missoula feels a sense of urgency around climate change and our responsibility to do our part to temper it. We made a commitment years ago to our citizens and fellow municipalities to join in the effort to use less energy and generate fewer greenhouse emissions.
The work has been detailed and challenging. First, we had to commit. Then we had to understand what our carbon footprint looks like. Then we had to acknowledge that we have to balance our responsibilities to deliver services to our citizens with our responsibility to protect our environment for generations to come. Finally, we had to have a plan.
The plan in your hands is the product of the work of an extraordinary group of committed citizen volunteers with various areas of expertise who have created a practical way for the City of Missoula to become carbon neutral over time. It’s smart, it’s understandable and we’ve committed resources to ensuring it’s put to work.
This is a good thing, a long time in the making, that will have consequences for many years to come. With this plan, we further commit to doing the right thing.
Sincerely,
John Engen Mayor
letter from the mayor

City of missoula Conservation & Climate aCtion Plan 4
Prepared by
Chase Jones, LEED Green Associate,
Missoula Office of Planning and Grants
andrew valainis, Energy Corps Member,
Missoula Office of Planning and Grants
task force members
amy Cilimburg, Montana Audubon
(Task Force Co-Chair)
ross keogh, Sagebrush Energy
(Task Force Co-Chair)
Jill alban, Clark Fork Coalition
Dan Daly, Roseburg Forest Products Co.
Chase Jones, LEED Green Associate,
Missoula Office of Planning and Grants
steve loken, Loken Builders
Bryan von lossberg, Alternative Energy
Resources Organization
Ginny merriam, City of Missoula
Cherie Peacock, PE, LEED AP, University of Montana
robin saha, Ph.D., University of Montana
Beth schenk, St. Patrick Hospital and
Health Sciences Center
Ben schmidt, Missoula City-County Health Department
Jack stucky, City of Missoula
andrew valainis, Energy Corps, Missoula Office of
Planning and Grants
krisztian varsa, University of Montana
(Previous Energy Corps Member)
aCknowleDGments
Missoula “We picked carbon neutrality as a goal, because we believed that Missoula can get it done. Let’s put our city on the map as having a dedicated and comprehensive program for mitigating our impacts to the climate.
- ROSS KEOGh
City of missoula Conservation & Climate aCtion Plan 5
executive summary
The City of Missoula has been engaged and involved in
conservation and climate action-related commitments,
projects, work and planning for many years as part of
Municipal Operations. Each step has been an important
block to a solid foundation of reducing energy consumption,
saving money and contributing to a healthy, clean environment.
This Municipal Conservation & Climate Action Plan (MCCAP)
is the synergy of these activities and will serve as the formal
roadmap and latest iteration of City actions to achieve and
maintain commitments, resolutions and goals. Milestones
include: joining the Cities for Climate Protection Campaign
(1996), signing the U.S. Conference of Mayors’ Climate
Protection Agreement (1996), and conducting Missoula’s
first Greenhouse Gas Inventory (2009).
The City of Missoula believes that it is uniquely positioned
to act as a leader and catalyst for positive action in the
community through conservation and climate action planning.
Operating efficiently and saving money is a high priority
for the City. Conservation and climate action planning is
an effective way to identify strategies that reduce energy
and fuel consumption, lean operations, save money and
free up funds to allow for long-term stability and viability.
Climate change is a present and growing risk to Missoula’s
environment, economy, quality of life, and community.
The City of Missoula is committed to taking action to
mitigate greenhouse gas emissions, acting as a steward
to sustain natural resources and our environment for future
generations through conservation.
emissions inventory
In 2008, Missoula Mayor John Engen requested the
assistance of University of Montana (UM) Environmental
Studies professor Robin Saha and UM students in
conducting a detailed municipal greenhouse gas (GhG)
emissions inventory for Missoula. This inventory examines
changes in emissions from fiscal years 2003 to 2008 to
determine sectors and sources within sectors for which
emissions are increasing, decreasing and remaining stable
over time. 2008 was chosen as the “target year” because
it was the most recent year for which an entire year’s data
could be obtained when the inventory began. Included in
the inventory was a list of recommended actions that the
City should take. One of them, and a logical next step, was
to set a reduction target and develop a climate action plan.
Municipal emissions for 2008 totaled 11,540 metric tons of
Carbon Dioxide equivalents (mtCO2e). This value served as
basis for the emissions targets and interim goals described
in this document.
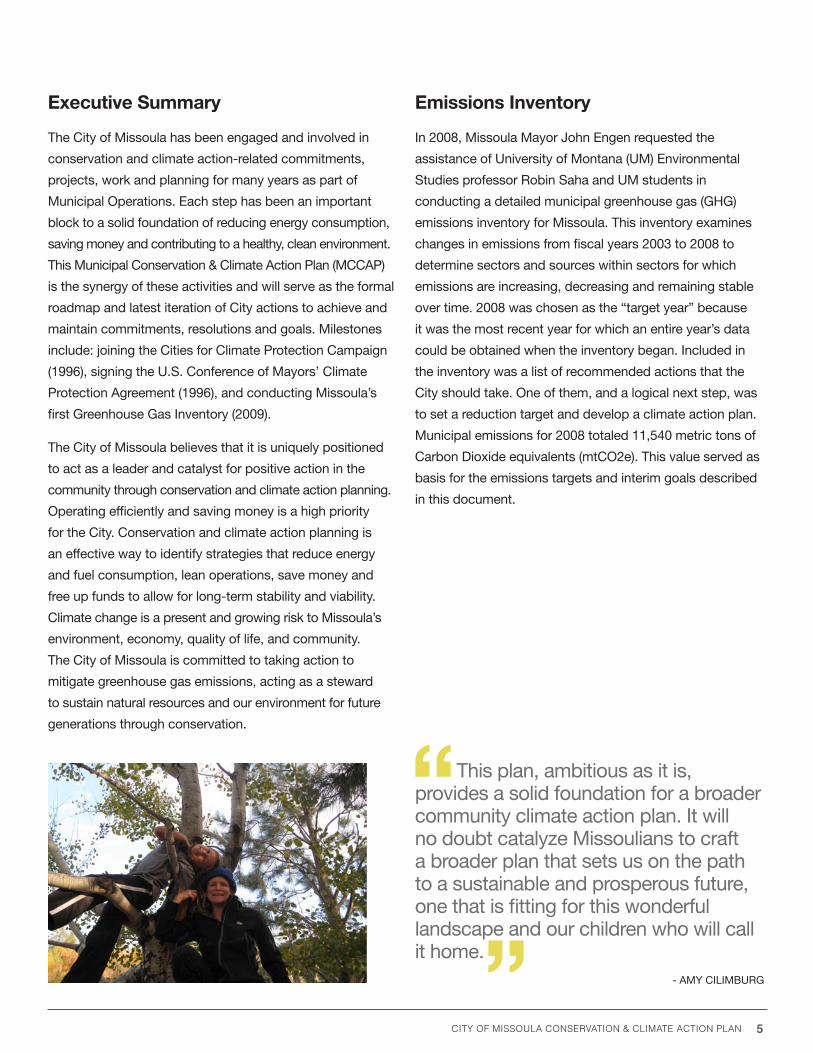
This plan, ambitious as it is, provides a solid foundation for a broader community climate action plan. It will no doubt catalyze Missoulians to craft a broader plan that sets us on the path to a sustainable and prosperous future, one that is fitting for this wonderful landscape and our children who will call it home.
- AMy CILIMBURG
City of missoula Conservation & Climate aCtion Plan 6
task force and working Groups
In 2011, Mayor Engen appointed members from his Mayor’s
Advisory Group on Climate Change and Sustainability, the
Greenhouse Gas Energy Conservation Team, and other key
community members to form a task force charged with drafting
a Conservation & Climate Action Plan. The Task Force
developed plan objectives and outlined emissions reduction
goals. They then identified three areas of focus to craft the
MCCAP: Fleet and Facilities, Internal Policies and Practices,
and Renewable Energy and Offsets. These were created
with focus areas that would be complementary parts of a
holistic approach to emissions reductions. Each area of
focus became a formal subcommittee or Working Group,
with Task Force members self-assigning themselves based
on expertise and interest. Next, Task Force members
suggested additional working group members from the
community for recruitment. From there, strategy creation
was executed at the Working Group level while the Task
Force served as the overall vetting and advisory body,
as well as Plan and Process architect. Overlap and
collaboration among strategies was intended and will
increase the positive effects of each.
strategies
The conservation and climate action strategies are the
roadmap to reducing City energy consumption, costs,
and emissions, and are steps to achieving conservation
and climate action goals. In the Action Plan document,
strategies include projected implementation costs, annual
energy and dollar savings, and avoided emissions where
possible. Estimates and projections are based on published
research, case studies and best practices from established
agencies, organizations and other municipalities, and
are referenced in each strategy. Exact costs, savings,
and avoided emissions will be tracked and reported after
implementation where possible and will be evaluated on
a case-by-case basis. Strategies included in this plan are
intended to be the first in a series of Plan updates as we
continually adjust to the changing realities of economics,
technology, government policies, and our ecosystems.
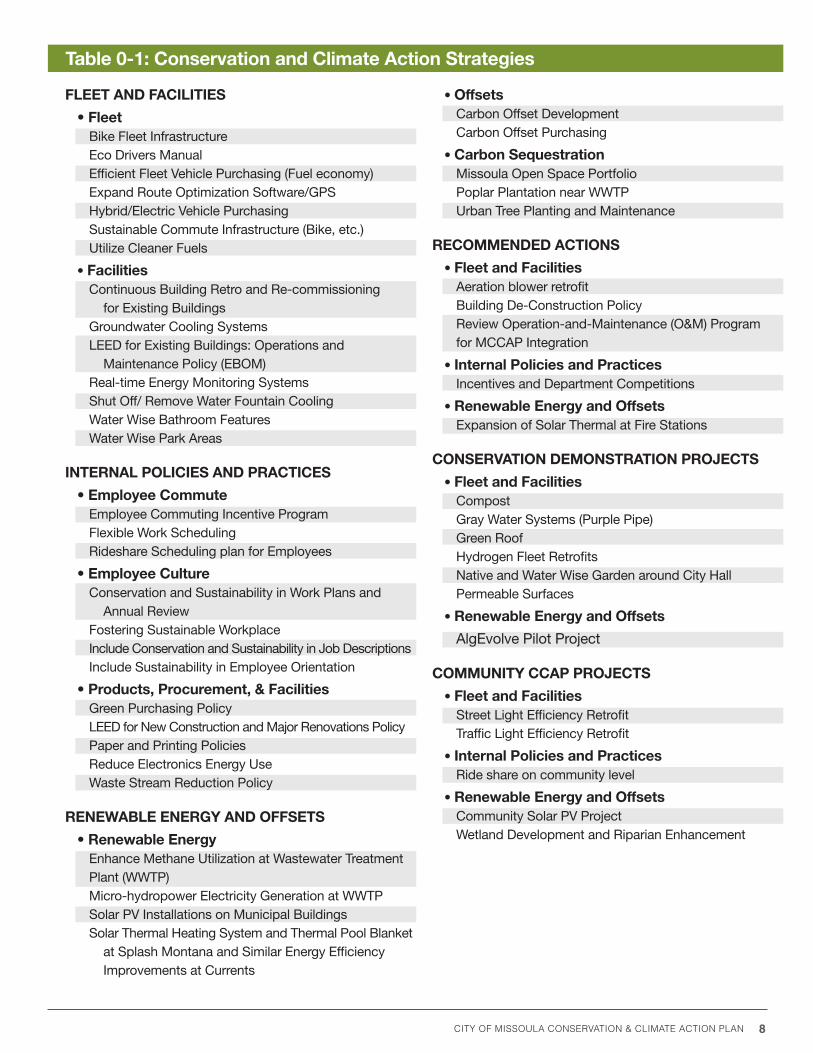
Table 0-1 below lists the strategies included in the Action Plan.
They are organized alphabetically within each working group
and subcategory.
emissions reduction targets and Goals
The greenhouse gas emissions target for the City of
Missoula is to be carbon neutral by 2025. Carbon neutrality
means that through conservation and reduction measures,
along with the purchase of Carbon Offsets, the City’s
net greenhouse gas emissions will be zero. Achieving
carbon neutrality requires the purchase of some form of
Carbon Offsets1 to account for emissions that remain
after conservation and other forms of reduction have been
fully explored. Short-term, interim goals were established
to encourage beginning reduction activities as soon as
possible and to help measure and track progress towards
the overall carbon neutrality target. Those goals are:
Target:
Carbon neutral by 2025
Interim Goal #1:
10% reduction from 2008 baseline by 2015
Interim Goal #2:
30% reduction from 2008 baseline by 2017
Interim Goal #3:
50% reduction by 2020
1 A Carbon Offset is one metric ton of carbon dioxide equivalent (CO2e) that is taken out of the atmosphere, or one metric ton of CO2e that is not emitted to the atmosphere. Carbon Offsets are generated by carbon sequestration or emissions reduction activities that are quantified, reported, verified, validated, and certified via the regulatory or voluntary market. ClearSky Climate Solutions: www.clearskyclimatesolutions.com

City of missoula Conservation & Climate aCtion Plan 7
implementation
Using the tentative timeline established by the Task Force
for implementation of each strategy, the City will achieve all
of the interim goals and carbon neutrality target described in
this Plan. however, in order to achieve them, progress must
begin immediately. Below are crucial steps that should be
taken as soon as possible to facilitate implementation.
establish a full-time, Dedicated staff A dedicated, full-time staff member to oversee this Plan is
needed to successfully implement recommended strategies
across all departments and staff and produce the desired
results and expected benefits. This staff person would take
responsibility for the coordination of the City’s conservation
and climate action efforts. This would include strategy
implementation and establishing timelines for review and
updates to the City’s Greenhouse Gas Emissions Inventory
and Conservation & Climate Action Plan.
The importance of establishing a full-time, dedicated staff
to oversee the City of Missoula’s Conservation & Climate
Action Plan and associated activities was recognized
and approved in the budget for Fiscal year 2013 with
an FTE. Specific job description, details and hiring will
occur in Fiscal year 2013. Once hired, the FTE will interact
and collaborate where appropriate with all levels of City
government including the Mayor/Administration, Staff,
City Council, Mayor’s Advisory Group on Climate Change
and Sustainability, Greenhouse Gas Energy Conservation
Team and stakeholders to ensure success.
establish a Data monitoring and reporting system Collecting data and reporting on the impacts of each
strategy is essential to the Climate Action Planning process.
Tracking and monitoring provides evidence of energy, fuel,
water, and cost savings, feedback on project success,
and progress toward goals. In addition, it provides sound
reasoning and results to justify continued internal and
external investment and funding.
establish a Budget and financing strategy This plan presents a wide variety of strategies, and thus
requires a robust mix of funding mechanisms. Many
recommendations will require both financial and human
investment. Below is a list of commonly used mechanisms
to be included and used as appropriate and available.
• Integration and Inclusion in annual City Budget
• Grants
• Energy Savings Performance Contracts
• Bonds
• Revolving Loan Funds
• Utility Rebates and Incentives
• Reinvestment of Rebates, Incentives,
and/or Energy Savings
• Public/Private Partnerships
Year: 2015Goal: 10% below baseline
Year: 2020Goal: 50% below baseline
Year: 2025Goal: Carbon Neutral
Year: 2017Goal: 30% below baseline
0
2,000
4,000
6,000
8,000
10,000
12,000
14,000
Gre
enho
use
Gas
Em
issi
ons
(mtCO2e)
Suite 1
Suite 2
Suite 3
Suite 4
UnmitigatedEmissions
2008 Emissions Baseline
Business as Usual (1% increase per year)
2013 2015 2017 2019 2021 2023 2025 2027 2029
Offsets andFuture Strategies
Year: 2015Goal: 10% below baseline
Year: 2020Goal: 50% below baseline
Year: 2025Goal: Carbon Neutral
Year: 2017Goal: 30% below baseline Figure 0-1: Impact of
Implementing Strategy Suites on City of Missoula Greenhouse Gas Emissions, Showing Interim Goals
City of missoula Conservation & Climate aCtion Plan 8
table 0-1: Conservation and Climate action strategies
fleet anD faCilities
• FleetBike Fleet InfrastructureEco Drivers ManualEfficient Fleet Vehicle Purchasing (Fuel economy)Expand Route Optimization Software/GPShybrid/Electric Vehicle PurchasingSustainable Commute Infrastructure (Bike, etc.)Utilize Cleaner Fuels
• facilitiesContinuous Building Retro and Re-commissioning for Existing BuildingsGroundwater Cooling SystemsLEED for Existing Buildings: Operations and Maintenance Policy (EBOM)Real-time Energy Monitoring SystemsShut Off/ Remove Water Fountain CoolingWater Wise Bathroom FeaturesWater Wise Park Areas
internal PoliCies anD PraCtiCes
• Employee CommuteEmployee Commuting Incentive ProgramFlexible Work SchedulingRideshare Scheduling plan for Employees
• Employee CultureConservation and Sustainability in Work Plans and Annual ReviewFostering Sustainable WorkplaceInclude Conservation and Sustainability in Job DescriptionsInclude Sustainability in Employee Orientation
• Products, Procurement, & FacilitiesGreen Purchasing Policy LEED for New Construction and Major Renovations PolicyPaper and Printing PoliciesReduce Electronics Energy UseWaste Stream Reduction Policy
renewaBle enerGy anD offsets
• Renewable Energy Enhance Methane Utilization at Wastewater Treatment Plant (WWTP)Micro-hydropower Electricity Generation at WWTPSolar PV Installations on Municipal BuildingsSolar Thermal heating System and Thermal Pool Blanket at Splash Montana and Similar Energy Efficiency Improvements at Currents
• offsetsCarbon Offset DevelopmentCarbon Offset Purchasing
• Carbon sequestrationMissoula Open Space PortfolioPoplar Plantation near WWTPUrban Tree Planting and Maintenance
reCommenDeD aCtions
• fleet and facilitiesAeration blower retrofitBuilding De-Construction PolicyReview Operation-and-Maintenance (O&M) Program for MCCAP Integration
• internal Policies and PracticesIncentives and Department Competitions
• renewable energy and offsetsExpansion of Solar Thermal at Fire Stations
Conservation Demonstration ProJeCts
• fleet and facilitiesCompostGray Water Systems (Purple Pipe)Green Roofhydrogen Fleet RetrofitsNative and Water Wise Garden around City hallPermeable Surfaces
• renewable energy and offsets
AlgEvolve Pilot Project
Community CCaP ProJeCts
• fleet and facilitiesStreet Light Efficiency RetrofitTraffic Light Efficiency Retrofit
• internal Policies and PracticesRide share on community level
• renewable energy and offsetsCommunity Solar PV ProjectWetland Development and Riparian Enhancement

City of missoula Conservation & Climate aCtion Plan 9
introDuCtion
City of missoula Conservation & Climate aCtion Plan 10INTRODUCTION
the Case for the Plan
operating efficiently and saving money The City of Missoula is committed to maintaining the high
levels of service to the community that make Missoula a
wonderful place to live and do business. As a result, the City
is always looking for ways to reduce operations costs and to
do more with less. Conservation & Climate Action Planning is
an effective way to identify strategies that reduce energy and
fuel consumption, lean operations, save money and free up
funds to allow for long-term stability and viability. Implementing
the strategies and activities in this plan emphasizes
resourcefulness, efficiency and fiscal responsibility.
energy and natural resource Conservation The City of Missoula should operate as a steward to
sustain natural resources and our environment for future
generations through energy and resource conservation.
The City of Missoula recognizes that fossil fuels and other
natural resources are finite and that we need to take action
to reduce their consumption. This plan identifies strategies
and practices that enable City operations to optimize efficiency,
work wisely and responsibly, and utilize technology and
innovation to consume less, reduce costs, and build resiliency
for the future.
maintaining a healthy environment and Community Climate change is a present and growing risk to Missoula’s
environment, economy, quality of life and community.
Therefore, the City of Missoula is committed to taking
action to mitigate greenhouse gas emissions. Decreasing
greenhouse gas emissions, especially by reducing
dependence on fossil fuels, will help mitigate the associated
negative impacts to human health, including asthma and
respiratory diseases, heart disease, and mercury-related
neurological damage. At the same time, reducing fossil fuel
use decreases harm to the environment by reducing air
pollution, acid rain, and drought.2,3 Actions outlined in this
plan will reduce the City’s operational emissions and will
contribute to local clean air, clean water, community health
and long-term prosperity.
Government leading by example The City of Missoula believes that it is uniquely positioned
to act as a leader and catalyst for positive action in
the community through Conservation & Climate Action
Planning. The plan creation process has been an exercise
in broad collaboration with diverse organizations and
individuals and represents the Task Force’s collective
experience and expertise. Plan implementation, tracking
and reporting will be an opportunity for local government
to provide best practices, lessons learned, case studies,
helpful resources and replicable strategies that will hopefully
empower other organizations, businesses, agencies and
individuals to engage in energy conservation and climate
action activities.
City of missoula Conservation & Climate Change milestones
The City of Missoula has been engaged and involved in
conservation and climate action related commitments,
projects, work and planning for many years. Each step has
been an important block to a solid foundation of reducing
energy consumption, saving money and contributing to a
healthy, clean environment. This Municipal Conservation
& Climate Action Plan (MCCAP) is the synergy of these
activities and will serve as the formal roadmap and
latest iteration of City actions to achieve and maintain
commitments, resolutions and goals. Milestones include:
1996 – U.S. Conference of Mayors’ Climate Protection
Agreement Signed
1996 – Cities for Climate Protection Campaign
2004 – Missoula Greenhouse Gas – Energy Efficiency Plan
2004 – Greenhouse Gas and Energy Conservation Team
Established
2007 – City Council Resolution #7241 – Energy Efficiency and
Greenhouse Gas reduction policy for municipal building
2007 – Mayor’s Advisory Group on Climate Change and
Sustainability Established
2 Union of Concerned Scientists. “The Hidden Cost of Fossil Fuels.” 2002. http://www.ucsusa.org/clean_energy/our-energy-choices/coal-and-other-fossil-fuels/the-hidden-cost-of-fossil.html3 Physicians for Social Responsibility. “Coal Fired Power Plants: Understanding the Health Costs of a Dirty Energy Source”. http://www.psr.org/assets/pdfs/coal-fired-power-plants.pdf
City of missoula Conservation & Climate aCtion Plan 11INTRODUCTION
2008 – City Council Resolution #7375 – Fuel and energy
reduction policy
2008 – First City “Green Team” forms with staff from
18 Departments
2009 – Mayor’s Memorandum on new employee Green Policy
based upon City Green Team recommendations for
ways to reduce energy, fuel and product use.
2009 – Missoula Greenhouse Gas Emissions Inventory
& Analysis
2009 – Energy Efficiency & Conservation Block Grant (EECBG)
successful application
City of missoula Greenhouse Gas inventory
In 2008, Missoula Mayor John Engen requested the assistance
of University of Montana (UM) Environmental Studies professor
Robin Saha and UM students in conducting a detailed
municipal greenhouse gas emissions inventory for Missoula.
In addition to identifying and quantifying various direct and
indirect emissions from municipal operations, this inventory
examines changes in emissions from fiscal years 2003 to 2008
to determine sectors and sources within sectors for which
emissions are increasing, decreasing and remaining stable
over time. The year 2003 was chosen as the baseline for the
inventory because it was the earliest year for which hard-copy
records of purchased energy existed for most sectors. 2008
was chosen as the “target year” because it was the most
recent year for which an entire year’s data could be obtained
when the inventory began. Included in the inventory was
a list of recommended actions that the City should take.
One of them, and a logical next step, was to set a reduction
target and develop a climate action plan. This document
represents that effort.
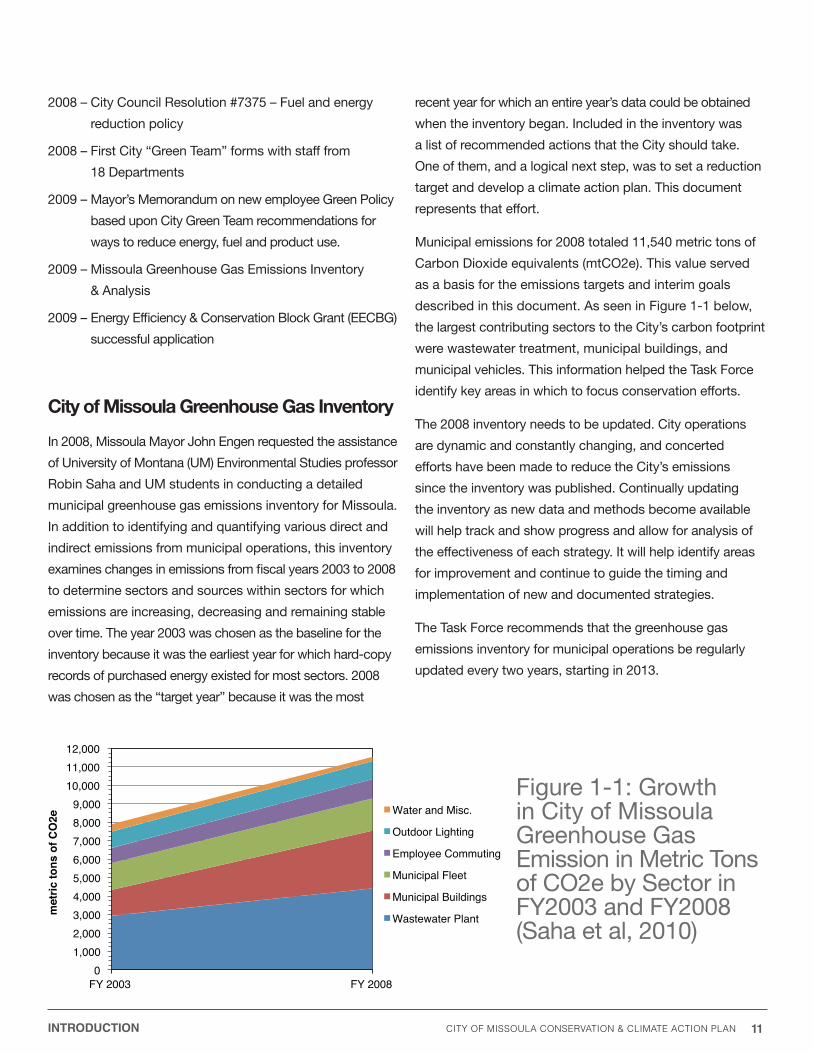
Municipal emissions for 2008 totaled 11,540 metric tons of
Carbon Dioxide equivalents (mtCO2e). This value served
as a basis for the emissions targets and interim goals
described in this document. As seen in Figure 1-1 below,
the largest contributing sectors to the City’s carbon footprint
were wastewater treatment, municipal buildings, and
municipal vehicles. This information helped the Task Force
identify key areas in which to focus conservation efforts.
The 2008 inventory needs to be updated. City operations
are dynamic and constantly changing, and concerted
efforts have been made to reduce the City’s emissions
since the inventory was published. Continually updating
the inventory as new data and methods become available
will help track and show progress and allow for analysis of
the effectiveness of each strategy. It will help identify areas
for improvement and continue to guide the timing and
implementation of new and documented strategies.
The Task Force recommends that the greenhouse gas
emissions inventory for municipal operations be regularly
updated every two years, starting in 2013.
01,0002,0003,0004,0005,0006,0007,0008,0009,000
10,00011,00012,000
FY 2003 FY 2008
met
ric to
ns o
f CO
2e
Water and Misc.
Outdoor Lighting
Employee Commuting
Municipal Fleet
Municipal Buildings
Wastewater Plant
Figure 1-1: Growth in City of Missoula Greenhouse Gas Emission in Metric Tons of CO2e by Sector in Fy2003 and Fy2008 (Saha et al, 2010)

City of missoula Conservation & Climate aCtion Plan 12INTRODUCTION
Conservation & Climate action Plan
scope This Conservation & Climate Action Plan focuses wholly on
municipal operations. This was identified by the Task Force
as the logical first step and foundation to community-wide
or larger efforts. There was much Task Force enthusiasm
and interest in larger-scale planning, but it was decided that
the current City staff and budget capacity was in line with
a Municipal scope. In addition, the Task Force agreed that
the “City’s house must be in order first” to successfully lead
or collaborate on broader conservation and climate action
planning activities.
Many activities that reduce fuel and energy consumption,
reduce operations costs, and address climate change
have occurred continually and for years in City operations.
however, they have occurred departmentally and have not
necessarily been comprehensively documented or planned.
This plan is an effort to document past and current activities
and provide an overall road map for future City conservation
and climate action activities.
mitigation According to the Intergovernmental Panel on Climate
Change’s Fourth Assessment Report, “mitigation means
implementing policies to reduce GhG emission and
enhance sinks.” Adaptation is defined as “initiatives and
measures to reduce the vulnerability of natural and human
systems against actual or expected climate change
effects.”4 In essence, mitigation focuses on reducing the
amount of emissions produced to lessen the severity of
the effects of climate change, while adaptation focuses on
adjusting habits, processes, and ways of life in response to
the changes produced. Both are important and necessary
as communities discuss the implications and effects of
climate change on their ways of life.
This plan emphasizes mitigation as a natural first step.
The document presents a mix of climate action strategies
and conservation activities. Both are vital to mitigating the
effects of climate change. Adaptation and other methods will
likely be included in future updates to the plan. The Clark
Fork Coalition has recently published a report discussing
adaptation strategies for the Missoula community.5
The report is a synthesis of a two-day Climatewise
Community Workshop hosted by the Clark Fork Coalition
in 2011. The workshop focused on educating attendees
about the impacts of climate change on the local economy
and community and developing and discussing strategies
designed to address risks and impacts. The City should
continue to collaborate with the Clark Fork Coalition as its
Climatewise work continues and develops.
foundation for a Community wide Conservation & Climate action Plan The Municipal Conservation & Climate Action Plan (MCCAP)
is to serve as a learning process and foundation for the final
goal of developing and implementing a community-wide
effort. The City hopes to lead by example and use this plan
as a catalyst for positive action in the community. A well
developed and supported community-wide Action Plan is
necessary to maximize the positive effects on Missoula’s
environment, economy, and community. The successful
completion and implementation of a Municipal Conservation
& Climate Action Plan will allow the City to provide case
studies, best practices, and methodology to the community-
wide planning process.
municipal Conservation & Climate action Plan objectives To define what the MCCAP intends to attain or accomplish,
Task Force members identified the following plan and
process objectives:
• Document Past and Current Conservation
& Climate Action Activities
• Set Emissions Reduction Target
• Identify Potential Conservation
& Climate Action Strategies
• Evaluate Potential Actions’ Feasibility
• Recommend Implementation Strategy
• Establish Plan for Monitoring and Reporting
4 IPCC Fourth Assessment Report: Climate Change 2007: Working Group III: Mitigation of Climate Change - Glossary5 Clark Fork Coalition. “Missoula County Climate Change Primer: Strategies To Care For Our Community, Land & Water.” 2011.
City of missoula Conservation & Climate aCtion Plan 13INTRODUCTION
working Groups To achieve plan objectives and outline emissions reduction
goals, the Task Force identified three areas of focus to
craft the Action Plan: Fleet and Facilities, Internal Policies
and Practices, and Renewable Energy and Offsets. Each
area of focus became a formal subcommittee or Working
Group, with Task Force members self-assigning themselves
based on expertise and interest. Next, Task Force members
suggested additional Working Group members from the
community for recruitment. From there, strategy creation
was executed at the Working Group level while the Task
Force served as the overall vetting and advisory body, as
well as Plan and Process architect.
In deciding on Working Group areas of focus, the Task
Force recognized the incredible opportunity as well as the
complexity of City Operations. To achieve desired results,
Working Groups had to be chosen with a holistic approach
that encompassed the built environment, human interaction,
and emerging technology and innovation.
The focus areas for each working group were created as
complementary parts of a whole that will meet the challenge
of emissions reductions. Strategies developed by the Fleet
and Facilities working group include infrastructure, building
energy use, vehicles and equipment, fuel use, and staff
commuting. Strategies developed by the Internal Policies
and Practices working group include operations policies,
workplace culture, purchasing, and employee health and
wellbeing. Strategies developed by the Renewable Energy
and Offsets working group include renewable energy
generation, carbon sequestration projects, and carbon
offsets. Overlap and collaboration among strategies was
intended and will increase the positive effects of each.
We are lucky in Missoula to have community members
who volunteered many hours on the Task Force and
Working Groups and who possessed the professional,
diverse knowledge and professional skill set to provide the
needed ideas, input and technical knowledge to develop
robust strategies in each focus area.
6 A Carbon Offset is one metric ton of carbon dioxide equivalent (CO2e) that is taken out of the atmosphere, or one metric ton of CO2e that is not emitted to the atmosphere. Carbon Offsets are generated by carbon sequestration or emissions reduction activities that are quantified, reported, verified, validated, and certified via the regulatory or voluntary market. ClearSky Climate Solutions: www.clearskyclimatesolutions.com7 Missoula Greenhouse Gas Emissions Inventory and Analysis, 2003-2008: Toward a Blueprint for Municipal Sustainability, September 2010.
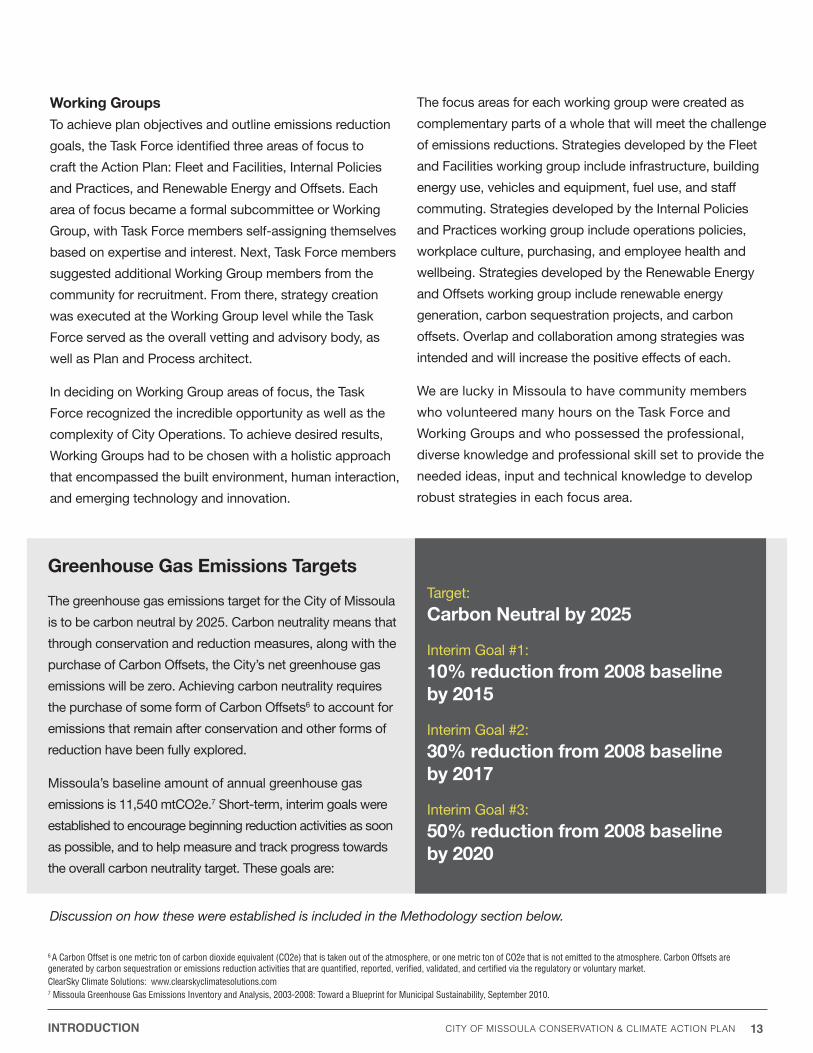
Greenhouse Gas emissions targets
The greenhouse gas emissions target for the City of Missoula
is to be carbon neutral by 2025. Carbon neutrality means that
through conservation and reduction measures, along with the
purchase of Carbon Offsets, the City’s net greenhouse gas
emissions will be zero. Achieving carbon neutrality requires
the purchase of some form of Carbon Offsets6 to account for
emissions that remain after conservation and other forms of
reduction have been fully explored.
Missoula’s baseline amount of annual greenhouse gas
emissions is 11,540 mtCO2e.7 Short-term, interim goals were
established to encourage beginning reduction activities as soon
as possible, and to help measure and track progress towards
the overall carbon neutrality target. These goals are:
Target:
Carbon neutral by 2025
Interim Goal #1:
10% reduction from 2008 baseline by 2015
Interim Goal #2:
30% reduction from 2008 baseline by 2017
Interim Goal #3:
50% reduction from 2008 baseline by 2020
Discussion on how these were established is included in the Methodology section below.

City of missoula Conservation & Climate aCtion Plan 14
methoDoloGy
City of missoula Conservation & Climate aCtion Plan 15METHODOLOGY
emissions factor for electricity Produced in the state of montana
The calculations for greenhouse gas emissions in this document
used widely accepted CO2e conversion factors. A list of
conversion factors and common variables used throughout
the calculations can be found in the Appendix. The amount
of emissions generated from the production of electricity
depends on what sources of fuel are being used to generate
the electricity. After much debate, the Task Force decided to
use an emissions factor of 0.432 mtCO2e/MWh, as provided
by ICLEI’s Climate and Air Pollution Planning Assistant (CAPPA)
software tool. “[G]reenhouse gas emissions factors for electricity
generation are the most recent available from [EPA’s Emissions
& Generation Resource Integrated Database (eGRID)], calendar
year 2007”,8 which is a credible, reliable, and regularly updated
database of emissions factor values. Using this factor would
ensure consistency between values from proprietary calculations
and those calculated using the CAPPA software itself. Most
importantly, using this factor would ensure consistency with the
Missoula Greenhouse Gas Emissions Inventory and Analysis,
2003/2008, which also used eGRID 2007 values.
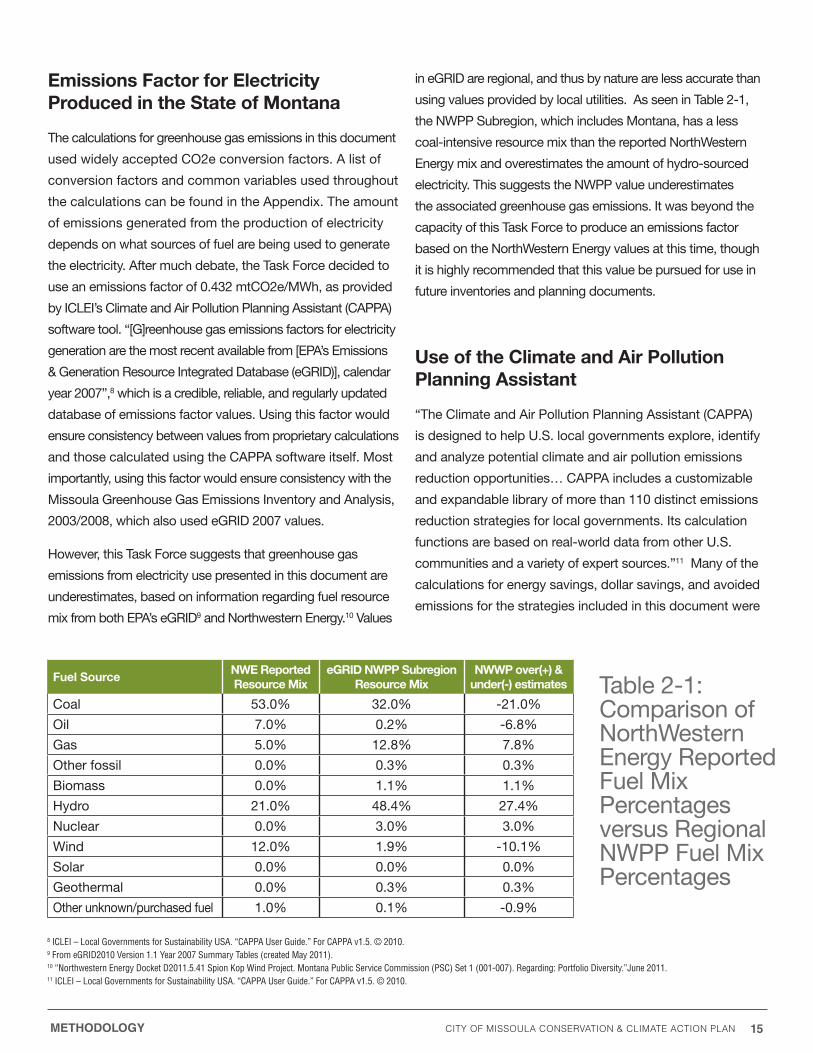
however, this Task Force suggests that greenhouse gas
emissions from electricity use presented in this document are
underestimates, based on information regarding fuel resource
mix from both EPA’s eGRID9 and Northwestern Energy.10 Values
in eGRID are regional, and thus by nature are less accurate than
using values provided by local utilities. As seen in Table 2-1,
the NWPP Subregion, which includes Montana, has a less
coal-intensive resource mix than the reported NorthWestern
Energy mix and overestimates the amount of hydro-sourced
electricity. This suggests the NWPP value underestimates
the associated greenhouse gas emissions. It was beyond the
capacity of this Task Force to produce an emissions factor
based on the NorthWestern Energy values at this time, though
it is highly recommended that this value be pursued for use in
future inventories and planning documents.
use of the Climate and air Pollution Planning assistant
“The Climate and Air Pollution Planning Assistant (CAPPA)
is designed to help U.S. local governments explore, identify
and analyze potential climate and air pollution emissions
reduction opportunities… CAPPA includes a customizable
and expandable library of more than 110 distinct emissions
reduction strategies for local governments. Its calculation
functions are based on real-world data from other U.S.
communities and a variety of expert sources.”11 Many of the
calculations for energy savings, dollar savings, and avoided
emissions for the strategies included in this document were
fuel sourcenwe reported resource mix
eGriD nwPP subregion resource mix
nwwP over(+) & under(-) estimates
Coal 53.0% 32.0% -21.0%
Oil 7.0% 0.2% -6.8%
Gas 5.0% 12.8% 7.8%
Other fossil 0.0% 0.3% 0.3%
Biomass 0.0% 1.1% 1.1%
hydro 21.0% 48.4% 27.4%
Nuclear 0.0% 3.0% 3.0%
Wind 12.0% 1.9% -10.1%
Solar 0.0% 0.0% 0.0%
Geothermal 0.0% 0.3% 0.3%
Other unknown/purchased fuel 1.0% 0.1% -0.9%
Table 2-1: Comparison of NorthWestern Energy Reported Fuel Mix Percentages versus Regional NWPP Fuel Mix Percentages
8 ICLEI – Local Governments for Sustainability USA. “CAPPA User Guide.” For CAPPA v1.5. © 2010.9 From eGRID2010 Version 1.1 Year 2007 Summary Tables (created May 2011).10 “Northwestern Energy Docket D2011.5.41 Spion Kop Wind Project. Montana Public Service Commission (PSC) Set 1 (001-007). Regarding: Portfolio Diversity.”June 2011. 11 ICLEI – Local Governments for Sustainability USA. “CAPPA User Guide.” For CAPPA v1.5. © 2010.
City of missoula Conservation & Climate aCtion Plan 16METHODOLOGY
conducted in proprietary spreadsheets with researched and
available data. CAPPA was used to assist with calculations
that would have otherwise been very difficult and time-
consuming due to complexity or lack of available data.
Proprietary calculations were often cross-referenced with
CAPPA calculations and showed consistency.
explanation of the suites of strategies and relation to interim Goals
No one strategy will be the best solution to reducing the
City’s emissions. In order to have a significant impact, it is
necessary to implement multiple strategies to allow them
to complement each other. The strategies were therefore
grouped into suites, to be implemented together.
The Task Force determined that 2025 will be the target year
for the City to achieve carbon neutrality. The years between
2013 (the year after drafting of this document) and 2025 were
split into segments of 3, 2, 3, and 5 years. The strategies were
placed in one of those groupings to be implemented within that
time frame, acknowledging that availability of funding and staff
time will influence the actual timing of implementation.
The placement into the different suites was based on both
quantitative and qualitative factors. The quantitative factors
were primarily annual emissions reduction and simple payback.
The qualitative factors included simplicity of implementation,
pre-existence of groundwork related to the strategy, ability to
be a “quick win,” and time required for full-scale implementation.
Once the suites were established, interim emission reductions
goals were created based on the reduction potential from the
suites. The suites with their associated interim goals are:
suite 1 2013-2015: Achieve 10% reduction
from 2008 baseline
suite 2 2016-2017: Achieve 30% reduction
from 2008 baseline
suite 3 2018-2020: Achieve 50% reduction
from 2008 baseline
suite 4 2020-2025: Achieve carbon neutrality
Figure 0-1 (on page 6) shows the impact of the suites on
the City’s total baseline emissions. The gray area represents
the unmitigated emissions after strategies have been
implemented. The graph includes a 1% annual growth in
emissions to account for intangible or unforeseen contributions
to the total emissions (e.g. population growth, new buildings,
etc.). The Task Force decided on a 1% emissions growth rate
to serve as a placeholder and to simply acknowledge that
there will be an increase in emissions over time. Because the
City has conducted only one Emissions Inventory, there are
not enough data to accurately predict trends in emissions
growth. Emissions growth will undoubtedly vary from year to
year. Some years the City will experience large spikes due to
new buildings, services, annexations or utility enhancements
and expansion while others will stay level or grow slowly. The
variable nature of emissions growth emphasizes the need
for regular Emissions Inventory updates and monitoring over
time as called for in the Implementation section in this report.
With emissions data over time, growth will be more accurately
accounted for and projections will become clearer. Updated
data will be reflected in future versions of this graph .With the
current set of strategies, the City will need to begin purchasing
Carbon Offsets in 2020 to meet its third interim goal. Though
the unmitigated emissions levels out in 2020, the 1% increase
in emissions still exists. To remain carbon neutral the City
would need to increase the amount of Offsets it purchases
every year to account for any increase in emissions.
Advances and changes in technology, pricing, and incentives
will affect the impacts and cost effectiveness of the strategies
included in this plan, as well as present new opportunities
and strategies that will contribute to achieving the interim and
carbon neutrality goals. These newly identified strategies will
be included and implemented as the plan and these suites
are continually updated.
Collecting data and establishing a baseline allows you to set achievable goals and, more importantly, to know when you need to step up your efforts and when you should be celebrating your successes.
- ANDREW VALAINIS
City of missoula Conservation & Climate aCtion Plan 17
Conservation anD Climate aCtion strateGiesThis chapter details the strategies identified by the
Conservation & Climate Action Plan Task Force and
Working Groups, which include City Staff. The
strategies are the roadmap to reducing City energy
consumption, costs, and emissions, and are steps
to achieving conservation and climate action goals.
Strategies include projected implementation costs,
annual energy and dollar savings, and avoided
emissions where possible. Estimates and projections
are based on published research, case studies
and best practices from established agencies,
organizations and other municipalities, and are
referenced in each strategy. Exact costs,
savings, and avoided emissions will be tracked and
reported after implementation where possible and
will be evaluated on a case-by-case basis. Strategies
included in this plan are intended to be the first in
a series of Plan updates as we continually adjust
to the changing realities of economics, technology,
government policies, and our ecosystems.
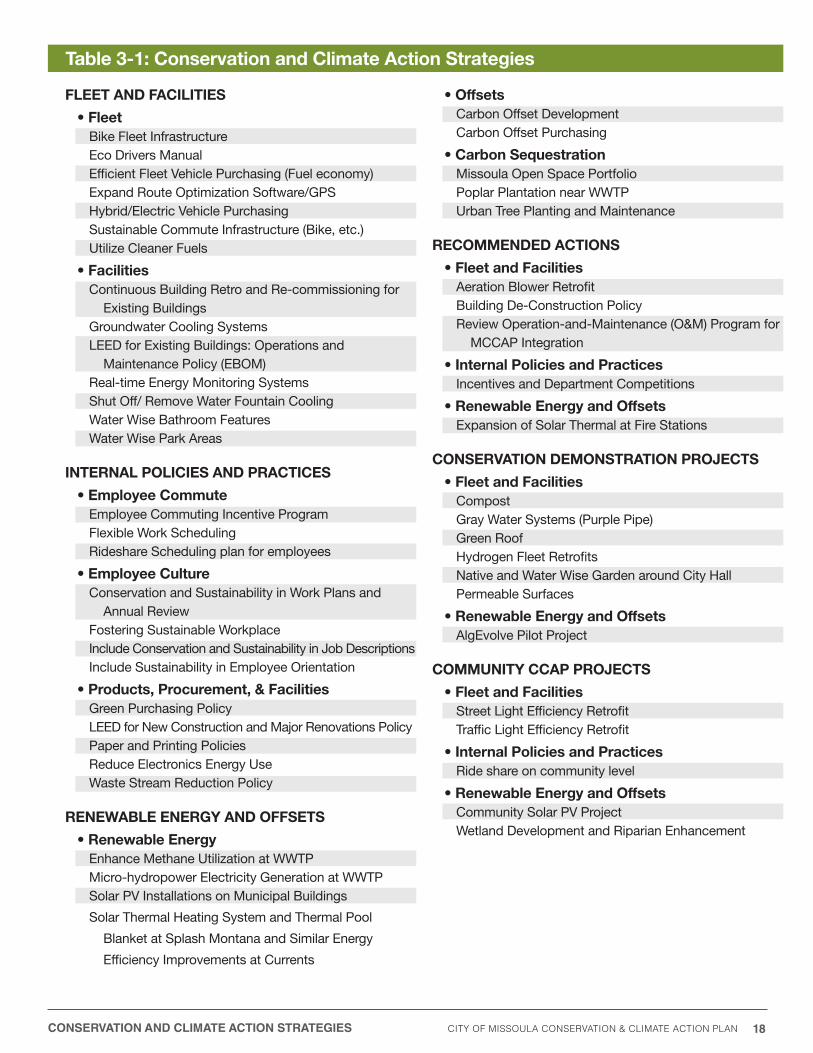
Table 3-1 below lists the strategies included in the
MCCAP. They are organized alphabetically within
each working group and subcategory.
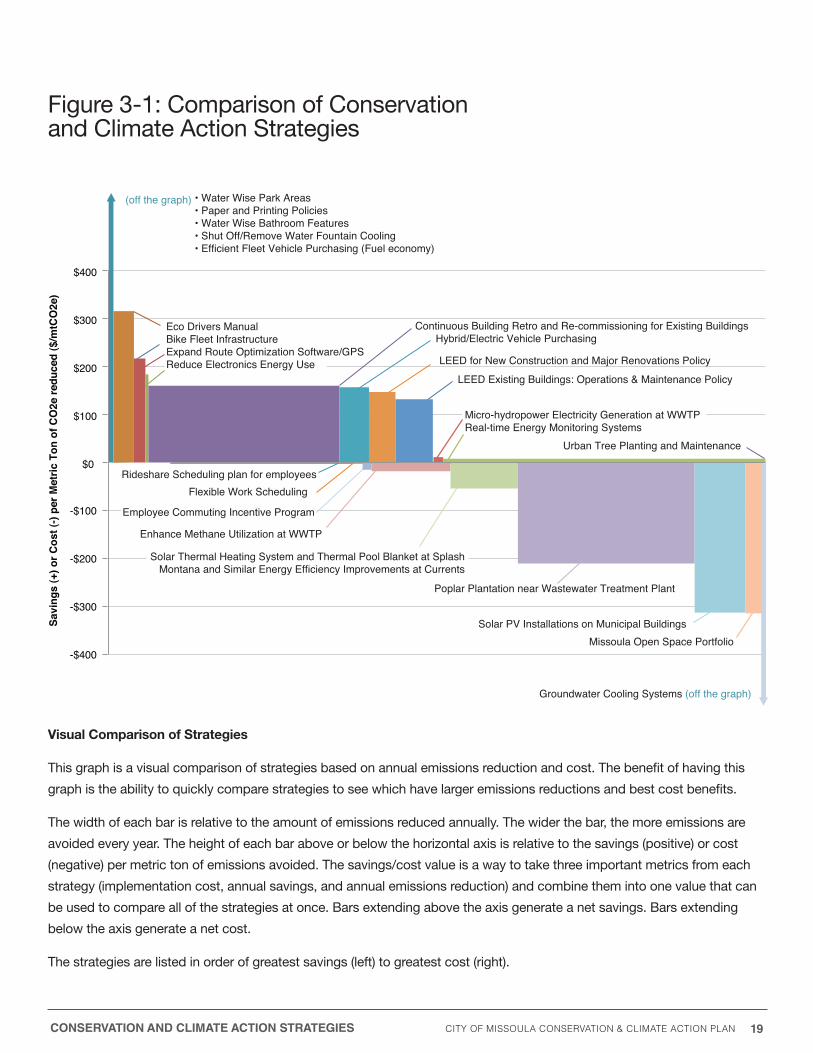
Figure 3-1 below provides a snap shot of the strategies
included in this plan, each represented by a bar on the
graph. The benefit of the graph is that it provides a visual
comparison of all of the strategies. The vertical axis
shows savings or cost per metric ton of CO2e reduced,
and the horizontal axis shows the total annual emissions
reduction in mtCO2e. The width of each bar is relative to
the amount of emissions avoided annually.
The height of each bar above or below the horizontal
axis is relative to the savings (positive) or cost (negative)
per metric ton of emissions avoided. The savings/cost
value is a way to take three important metrics from each
strategy (implementation cost, annual savings, and
annual emissions reduction) and combine them into one
value that can be used to compare all of the strategies
at once. Information on how this value was calculated
can be found in the Appendix.
The strategies are organized from left to right in order
of greatest savings to greatest cost. Note that some
of the bars are hard to see since the relative emissions
reduction (width) is so small. Some of the bars extend
off the graph. The current view is presented to provide
the best visual representation of the entire list of
strategies. Several strategies are not shown on this
graph, due to lack of available data. For example,
the projected emissions reductions for many of the
employee culture strategies are indeterminable at this
time, and so those were not included.
City of missoula Conservation & Climate aCtion Plan 18
table 3-1: Conservation and Climate action strategies
CONSERVATION AND CLIMATE ACTION STRATEGIES
fleet anD faCilities
• Fleet Bike Fleet InfrastructureEco Drivers ManualEfficient Fleet Vehicle Purchasing (Fuel economy)Expand Route Optimization Software/GPShybrid/Electric Vehicle PurchasingSustainable Commute Infrastructure (Bike, etc.)Utilize Cleaner Fuels
• FacilitiesContinuous Building Retro and Re-commissioning for Existing BuildingsGroundwater Cooling SystemsLEED for Existing Buildings: Operations and Maintenance Policy (EBOM)Real-time Energy Monitoring SystemsShut Off/ Remove Water Fountain CoolingWater Wise Bathroom FeaturesWater Wise Park Areas
internal PoliCies anD PraCtiCes
• Employee CommuteEmployee Commuting Incentive ProgramFlexible Work SchedulingRideshare Scheduling plan for employees
• Employee CultureConservation and Sustainability in Work Plans and Annual ReviewFostering Sustainable WorkplaceInclude Conservation and Sustainability in Job DescriptionsInclude Sustainability in Employee Orientation
• Products, Procurement, & FacilitiesGreen Purchasing Policy LEED for New Construction and Major Renovations PolicyPaper and Printing PoliciesReduce Electronics Energy UseWaste Stream Reduction Policy
renewaBle enerGy anD offsets
• Renewable EnergyEnhance Methane Utilization at WWTPMicro-hydropower Electricity Generation at WWTPSolar PV Installations on Municipal Buildings
Solar Thermal heating System and Thermal Pool
Blanket at Splash Montana and Similar Energy
Efficiency Improvements at Currents
• OffsetsCarbon Offset DevelopmentCarbon Offset Purchasing
• Carbon SequestrationMissoula Open Space PortfolioPoplar Plantation near WWTPUrban Tree Planting and Maintenance
reCommenDeD aCtions
• Fleet and FacilitiesAeration Blower RetrofitBuilding De-Construction PolicyReview Operation-and-Maintenance (O&M) Program for MCCAP Integration
• Internal Policies and PracticesIncentives and Department Competitions
• Renewable Energy and OffsetsExpansion of Solar Thermal at Fire Stations
Conservation Demonstration ProJeCts
• Fleet and FacilitiesCompostGray Water Systems (Purple Pipe)Green Roofhydrogen Fleet RetrofitsNative and Water Wise Garden around City hallPermeable Surfaces
• Renewable Energy and OffsetsAlgEvolve Pilot Project
Community CCaP ProJeCts
• Fleet and FacilitiesStreet Light Efficiency RetrofitTraffic Light Efficiency Retrofit
• Internal Policies and PracticesRide share on community level
• Renewable Energy and OffsetsCommunity Solar PV ProjectWetland Development and Riparian Enhancement
City of missoula Conservation & Climate aCtion Plan 19CONSERVATION AND CLIMATE ACTION STRATEGIES
visual Comparison of strategies
This graph is a visual comparison of strategies based on annual emissions reduction and cost. The benefit of having this
graph is the ability to quickly compare strategies to see which have larger emissions reductions and best cost benefits.
The width of each bar is relative to the amount of emissions reduced annually. The wider the bar, the more emissions are
avoided every year. The height of each bar above or below the horizontal axis is relative to the savings (positive) or cost
(negative) per metric ton of emissions avoided. The savings/cost value is a way to take three important metrics from each
strategy (implementation cost, annual savings, and annual emissions reduction) and combine them into one value that can
be used to compare all of the strategies at once. Bars extending above the axis generate a net savings. Bars extending
below the axis generate a net cost.
The strategies are listed in order of greatest savings (left) to greatest cost (right).
-$400
-$300
-$200
-$100
$0
$100
$200
$300
$400
Savi
ngs
(+) o
r Cos
t (-)
per M
etric
Ton
of C
O2e
redu
ced
($/m
tCO
2e)
Urban Tree Planting and Maintenance
Eco Drivers Manual Bike Fleet Infrastructure Expand Route Optimization Software/GPSReduce Electronics Energy Use
Poplar Plantation near Wastewater Treatment Plant
Micro-hydropower Electricity Generation at WWTPReal-time Energy Monitoring Systems
Employee Commuting Incentive Program
Solar Thermal Heating System and Thermal Pool Blanket at SplashMontana and Similar Energy Efficiency Improvements at Currents
Flexible Work SchedulingRideshare Scheduling plan for employees
Solar PV Installations on Municipal Buildings
Continuous Building Retro and Re-commissioning for Existing Buildings Hybrid/Electric Vehicle Purchasing
• Water Wise Park Areas• Paper and Printing Policies• Water Wise Bathroom Features• Shut Off/Remove Water Fountain Cooling• Efficient Fleet Vehicle Purchasing (Fuel economy)
LEED Existing Buildings: Operations & Maintenance Policy
LEED for New Construction and Major Renovations Policy
(off the graph)
Groundwater Cooling Systems (off the graph)
Enhance Methane Utilization at WWTP
Missoula Open Space Portfolio
Figure 3-1: Comparison of Conservation and Climate Action Strategies
City of missoula Conservation & Climate aCtion Plan 20CONSERVATION AND CLIMATE ACTION STRATEGIES
workinG GrouP memBers
Cherie Peacock, University of Montana (Working Group Chair)
heath Carey, Terra Mater Solutions, Bioroot Energy
Dan Daly, Roseburg Forest Products
John freer, Riverworks Inc.
Dale horton, National Center for Appropriate Technology
steve loken, Loken Builders
heather mcmillin, Homeword
hannah motl, spectrUM Discovery Area
Jack stucky, City of Missoula
starr sullivan, City of Missoula
Nationally, building energy use and transportation are the two largest sectors of municipal emissions. As presented in the
2008 Greenhouse Gas Inventory, Missoula is no exception. The following Fleet and Facilities (FF) strategies include high-
efficiency and updated equipment and will produce large decreases in maintenance costs. Often, upgrades and efficiency
measures are limited or prohibited by the cost of equipment and available conditions. It is important to continually monitor
existing equipment and new products to identify the most cost-effective opportunities.
The way equipment is used is just as important as the efficiency of the machine, as improper use can negate any benefits
of mechanical efficiency. This highlights the importance of the relationship between these strategies and those described in
the Internal Policies and Practices section.
fleet and facilities Completed actions
Table 3-2 below lists actions already taken by the City within the scope of the Fleet and Facilities working group categories.
It is important to recognize these projects and programs and that they be kept in place as we pursue greater reductions in
operational costs, energy use, and emissions.
Table 3-2: Fleet and Facilities Completed ActionsAction Year ImplementedPurchased Hybrid Vehicles 2004Resolution 7241: Energy Efficiency and Greenhouse Gas Reduction Policy for Municipal Buildings 2007Resolution 7375: Fuel Energy Reduction Plan 2007Conducted Lighting Upgrade and Other Energy Efficiency Measures at Central Maintenance Facility 2009Purchased Plug-In Electric Vehicle 2010Energy Savings Performance Contract with Johnson Controls 2010GPS Route Optimization Technology Installed in Select Fleet Vehicles 2011
fleet anD faCilities workinG GrouP
City of missoula Conservation & Climate aCtion Plan 21CONSERVATION AND CLIMATE ACTION STRATEGIES
fleet and facilities strategies
Table 3-3 summarizes the Fleet and Facilities Working Group strategies. Further details are described in the narratives below.
Table 3-3: Fleet and Facilities Strategies
StrategyImplementation
CostEst. Annual Dollar
SavingsAnnual Avoided
Emissions (mtCO2e)Simple
Payback (yrs)
FlEEt
FF-1 Bike Fleet Infrastructure $180-$653 $140 0.36 1-4FF-2 Eco Drivers Manual < $1,000 $35,000 90.5 < 0.1FF-3 Efficient Fleet Vehicle Purchasing
(fuel economy) -$121,290 $8,723 22.5 0
FF-4 Expand Route Optimization Software/GPS $65,313 $19,800 51.6 3.3FF-5 Hybrid/Electric Vehicle Purchasing $221,058 $50,572 134 4FF-6 Sustainable Commute Infrastructure Unknown Indeterminable Indeterminable IndeterminableFF-7 Utilize Cleaner Fuels Unknown -$14,131/$104,574 165-565 N/A
FACIlItIES
FF-8 Continuous Building Retro and Re-commissioning for Existing Buildings $89,224 $176,975 862.1 0.5
FF-9 Geothermal/Groundwater Cooling/Heating $174,000 $2,230 9.63 78FF-10 LEED EBOM Policy $88,000 $35,500 169.1 2.5FF-11 Real-time Energy Monitoring Systems $105,000 $23,532 1,452 4.5FF-12 Shut Off/ Remove Water Fountain Cooling $160 $11,123 4.8 0.16FF-13 Water Wise Bathroom Features $27,624 $72,025 1.2 0.41FF-14 Water Wise Park Areas $9,583 / acre $42,560 / acre 0.3 / acre 0.5
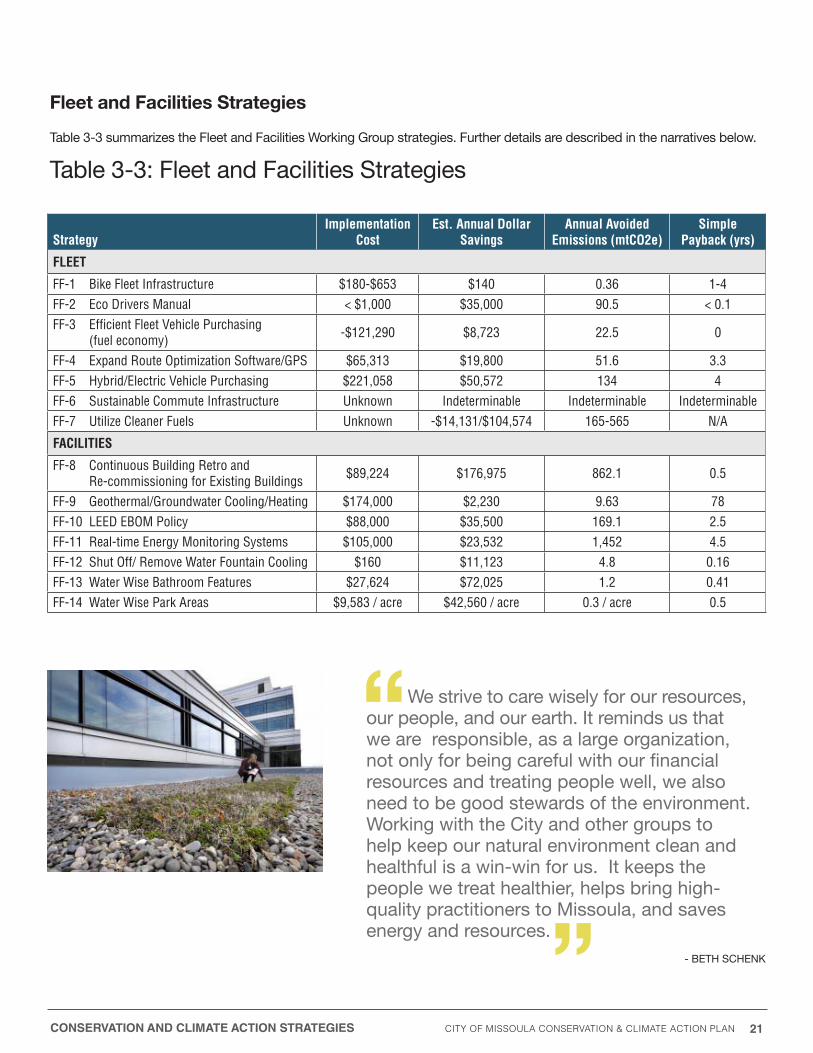
We strive to care wisely for our resources, our people, and our earth. It reminds us that we are responsible, as a large organization, not only for being careful with our financial resources and treating people well, we also need to be good stewards of the environment. Working with the City and other groups to help keep our natural environment clean and healthful is a win-win for us. It keeps the people we treat healthier, helps bring high-quality practitioners to Missoula, and saves energy and resources.
- BETh SChENK
City of missoula Conservation & Climate aCtion Plan 22CONSERVATION AND CLIMATE ACTION STRATEGIES
BaCkGrounD
The City of Missoula has a history of encouraging employees’ use of sustainable
transportation and employee wellness as well as being a model for other
businesses. Currently, the City offers covered bike parking for employees and
informally encourages the use of bikes (and buses) to attend work-related meetings.
The creation of a fleet of bicycles that could be “checked out” (similar to a motor
pool) would allow employees who do not bike to work to use a bicycle to attend
meetings as opposed to checking out a vehicle from the motor pool.
The City is considered by many to be a progressive city and state-wide leader
in both livability and sustainability. Initiating a bike-fleet program reflects the
organizational culture and helps the City set an example that is relevant to the
concept of an active, livable community.
Benefits of a Bike Fleet:
• Help reduce traffic congestion and emissions, conserve resources and reduce
travel costs during the workday.
• Increased employee productivity as it is easy to access many parts of
town efficiently by bike due to central location downtown and proximity
to Missoula’s major bike trails. This allows efficient access to University,
North/Westside, as well as the Southside/Mall area.
• Easy access to Mountain Line transfer center making bike/bus trips feasible.
An employee could expand the range of the bicycle by combining bus and
bike for more distant trips thereby increase the potential use of bikes for
work-related travel.
• Improved employee wellness as a bike fleet offers employees a means of
getting physical activity during the work day, whether they use it to travel to
offsite meetings or run errands during lunch (subject to bike fleet policy).
• Most trips Americans make are short: 49% are less than 3 miles, 39% are less
than 2 miles, and 24% are less than 1 mile.3
• Bicycling reduces road congestion and air pollution. Traffic congestion wastes
nearly 3.9 billion gallons of gas per year in the U.S.
Department
> Bike/Ped Office
> “Motor pool”
> human Resources/benefits/
wellness
strategy target
> Reduce emissions associated
with motor pool
related strategies
> Fuel & Fleet
timeline
> Six weeks
Potential Partners
> MIST – FreeCycles Community
Bike Shop
> Other local bike shops
Potential funding sources
> None identified at this time
FF-1 Bike Fleet Infrastructure
StrategyImplementation
CostEstimated Annual Energy Savings Estimated Annual
Dollar SavingsAnnual Avoided
Emissions (mtCO2e)Simple PaybackTherms kWh Gallons of Fuel
FF-1 $180-$6538 -- -- 40 $1409 0.369 1–4 yrs
reCommenDation
Establish a bike fleet to be used by City staff to attend meetings and other local, work related events.

City of missoula Conservation & Climate aCtion Plan 23
• For every 1 mile pedaled rather than driven, nearly 1 pound of
CO2 (0.88 lbs) is saved.5
• Bicycling is less expensive than driving a car. The average American
household spends $7,179 per year on owning and driving their
cars.6
• Using data from the Office of Planning and Grants for June-
September 2011, taking round trips 4 miles or less by bicycle
would have avoided 44.85 VMT (16 of 86 trips)9. This would
equate to a savings of $10.35 on gasoline and 0.03 mtCO2e.
Similar to the University of Montana bike fleet, the City should “brand”
their bikes to make them more recognizable and thus increase the public
awareness of the program. This could include painting the bikes the same
color, including stickers or labels, etc. This will also help distinguish City-
owned bikes from other bikes in the area.
FF-1 Bike Fleet Infrastructure Continued
references
1. BiketoWorkInfo.org http://www.biketoworkinfo.org/resources/pdf/Bicycle_Stats_One_Pager.pdf
2. 2-mile map (created by Lewis Kelley, OPG/Transportation)
3. Bikes Belong.org
4. Texas Transportation Institute, 2010. http://www.bikesbelong.org/resources/stats-and-research/statistics/in-2009-congestion-caused-48-billion-hours-of-travel-delay-and-39-billion-gallons-of-wasted-fuel
5. US Environmental Protection Agency, 2009 http://www.epa.gov/OMSWWW/fetrends.htm#summary
6. Bureau of Transportation Statistics, 2010. http://www.epa.gov/OMSWWW/fetrends.htm#summary
7. Equipment Statistics Summary Reports, cerca December 2011
8. Cost Estimates (based on name brand models)
high end: $653
• Bike $550 • Helmet $7 (St Patrick Hospital) • Paniers $40 • Lock $30 • Headlight $13 • Taillight $13
9 Office of Planning and Grants Gas Log for Jeep Support Vehicle, June - September 2011. Annual estimates in the included table were extrapolated using monthly averages. These are likely low estimates, since the data is for the months most likely to have the lowest vehicle use for local travel due to better weather conditions. Also, OPG already has a bike in use for local meetings.
Low end: $180
• Potential partnership program with Missoula Free Cycles. Monthly rental would include bike, lock, light, helmet, and maintenance (as needed).
CONSERVATION AND CLIMATE ACTION STRATEGIES
City of missoula Conservation & Climate aCtion Plan 24
BaCkGrounD
The EcoDriver’s Manual is a manual of “Smart Driving” techniques, which are tips
and tricks to improve overall vehicle gas mileage.1 The manual is endorsed by
several car manufacturers and produced by the U.S. Forest Service. Each vehicle
in the City’s fleet should have an EcoDriver’s Manual accessible to the driver.
Additionally, all City employees should be given an EcoDriver’s Manual during their
orientation period. Smart Driving techniques can improve vehicle gas mileage as
much as 33%.1,2 Smart Driving could save up to approximately 10,200 gallons
of fuel.3 This could produce dollar savings of over $35,000 annually,4 and avoid
emitting approximately 90.5 mtCO2e.5
EcoDriver’s training could be included into defensive driver training that already
exists within the City operations. For example, the Parks and Recreation
Department requires defensive driver training every three years.
references
1. U.S. Forest Service. “EcoDriver’s Manual.” http://www.fs.fed.us/sustainableoperations/documents/TheEcoDriversManual.pdf
2. Energy and Environmental Analysis, Inc., “Owner Related Fuel Economy Improvements”, Arlington, Virginia, 2001.
3. Equipment Statistics Summary Reports, cerca December 2011. Cost and fuel savings are estimated using “practical” fleet vehicles only, i.e. those that could participate in the manual’s recommendations without sacrificing efficiency of their duties.
4. Energy Information Association, November 2011. http://www.eia.gov/oog/info/gdu/gasdiesel.asp $3.45/gal unleaded, $4.09/gal diesel. A trending increase in gas prices will increase the dollar savings realized annually.
5. http://www.epa.gov/otaq/climate/420f05001.htm
FF-2 EcoDriver’s Manual
Department
> human Resources
> Vehicle Maintenance & Facilities
strategy target
> Reduce fuel consumption by
improving City employees’
driving habits with the fleet
related strategies
> “Fostering Sustainable Behavior” Book
> Fleet Emissions
> Vehicle Maintenance
> Drive Smoothly
> Maximum Speeds
timeline
> Implement changes to employee
orientation and required vehicle
operations documents within
one year
Potential Partners
> Automobile Manufacturer’s
Association
> Missoula County
Potential funding sources
> Unknown
StrategyImplementation
CostEstimated Annual Energy Savings Estimated Annual
Dollar SavingsAnnual Avoided
Emissions (mtCO2e)Simple PaybackTherms kWh Gallons of Fuel
FF-2 < $1000 -- -- 10,200 $35,000 90.5 < 1 mo.
reCommenDation
That City staff use more fuel efficient, “Smart Driving” techniques while operating City fleet vehicles, using recommendations
found in a distributed EcoDriver’s Manual.
CONSERVATION AND CLIMATE ACTION STRATEGIES
City of missoula Conservation & Climate aCtion Plan 25
BaCkGrounD
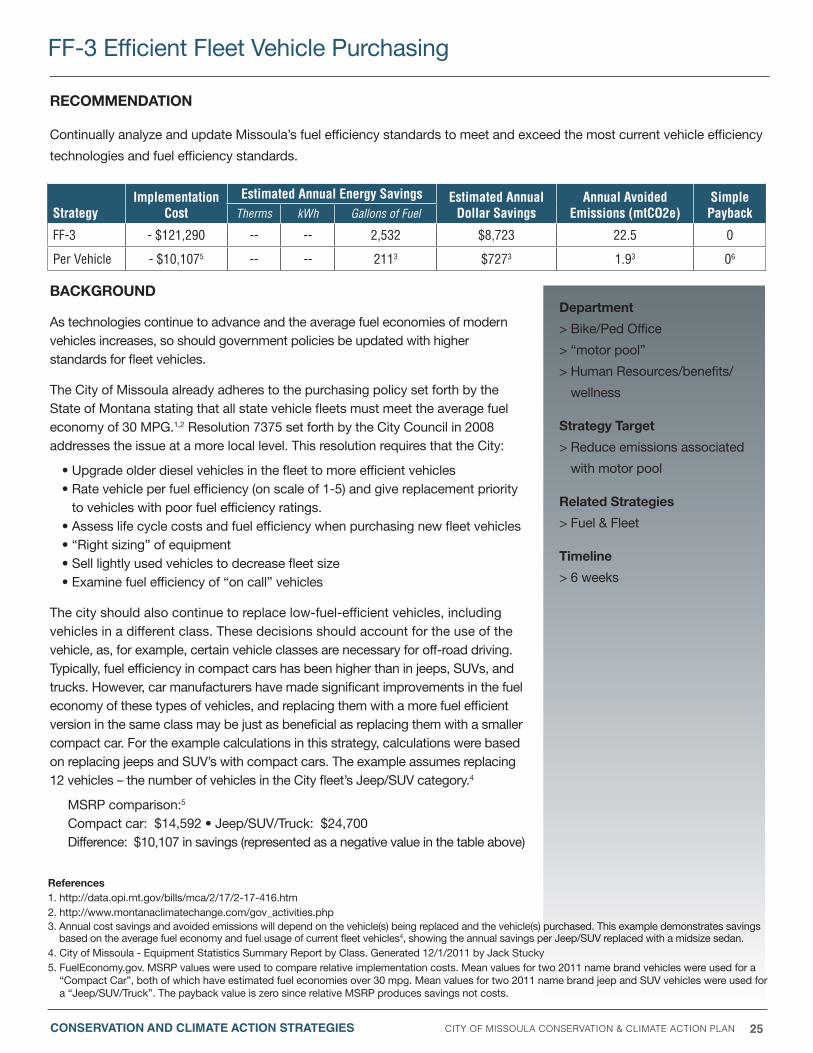
As technologies continue to advance and the average fuel economies of modern vehicles increases, so should government policies be updated with higher standards for fleet vehicles.
The City of Missoula already adheres to the purchasing policy set forth by the State of Montana stating that all state vehicle fleets must meet the average fuel economy of 30 MPG.1,2 Resolution 7375 set forth by the City Council in 2008 addresses the issue at a more local level. This resolution requires that the City:
• Upgrade older diesel vehicles in the fleet to more efficient vehicles• Rate vehicle per fuel efficiency (on scale of 1-5) and give replacement priority
to vehicles with poor fuel efficiency ratings.• Assess life cycle costs and fuel efficiency when purchasing new fleet vehicles• “Right sizing” of equipment• Sell lightly used vehicles to decrease fleet size• Examine fuel efficiency of “on call” vehicles
The city should also continue to replace low-fuel-efficient vehicles, including vehicles in a different class. These decisions should account for the use of the vehicle, as, for example, certain vehicle classes are necessary for off-road driving. Typically, fuel efficiency in compact cars has been higher than in jeeps, SUVs, and trucks. however, car manufacturers have made significant improvements in the fuel economy of these types of vehicles, and replacing them with a more fuel efficient version in the same class may be just as beneficial as replacing them with a smaller compact car. For the example calculations in this strategy, calculations were based on replacing jeeps and SUV’s with compact cars. The example assumes replacing 12 vehicles – the number of vehicles in the City fleet’s Jeep/SUV category.4
MSRP comparison:5 Compact car: $14,592 • Jeep/SUV/Truck: $24,700 Difference: $10,107 in savings (represented as a negative value in the table above)
FF-3 Efficient Fleet Vehicle Purchasing
StrategyImplementation
CostEstimated Annual Energy Savings Estimated Annual
Dollar SavingsAnnual Avoided
Emissions (mtCO2e)Simple PaybackTherms kWh Gallons of Fuel
FF-3 - $121,290 -- -- 2,532 $8,723 22.5 0
Per Vehicle - $10,1075 -- -- 2113 $7273 1.93 06
reCommenDation
Continually analyze and update Missoula’s fuel efficiency standards to meet and exceed the most current vehicle efficiency
technologies and fuel efficiency standards.
references1. http://data.opi.mt.gov/bills/mca/2/17/2-17-416.htm2. http://www.montanaclimatechange.com/gov_activities.php3. Annual cost savings and avoided emissions will depend on the vehicle(s) being replaced and the vehicle(s) purchased. This example demonstrates savings
based on the average fuel economy and fuel usage of current fleet vehicles4, showing the annual savings per Jeep/SUV replaced with a midsize sedan.4. City of Missoula - Equipment Statistics Summary Report by Class. Generated 12/1/2011 by Jack Stucky5. FuelEconomy.gov. MSRP values were used to compare relative implementation costs. Mean values for two 2011 name brand vehicles were used for a
“Compact Car”, both of which have estimated fuel economies over 30 mpg. Mean values for two 2011 name brand jeep and SUV vehicles were used for a “Jeep/SUV/Truck”. The payback value is zero since relative MSRP produces savings not costs.
CONSERVATION AND CLIMATE ACTION STRATEGIES
Department
> Bike/Ped Office
> “motor pool”
> human Resources/benefits/
wellness
strategy target
> Reduce emissions associated
with motor pool
related strategies
> Fuel & Fleet
timeline
> 6 weeks
City of missoula Conservation & Climate aCtion Plan 26
BaCkGrounD
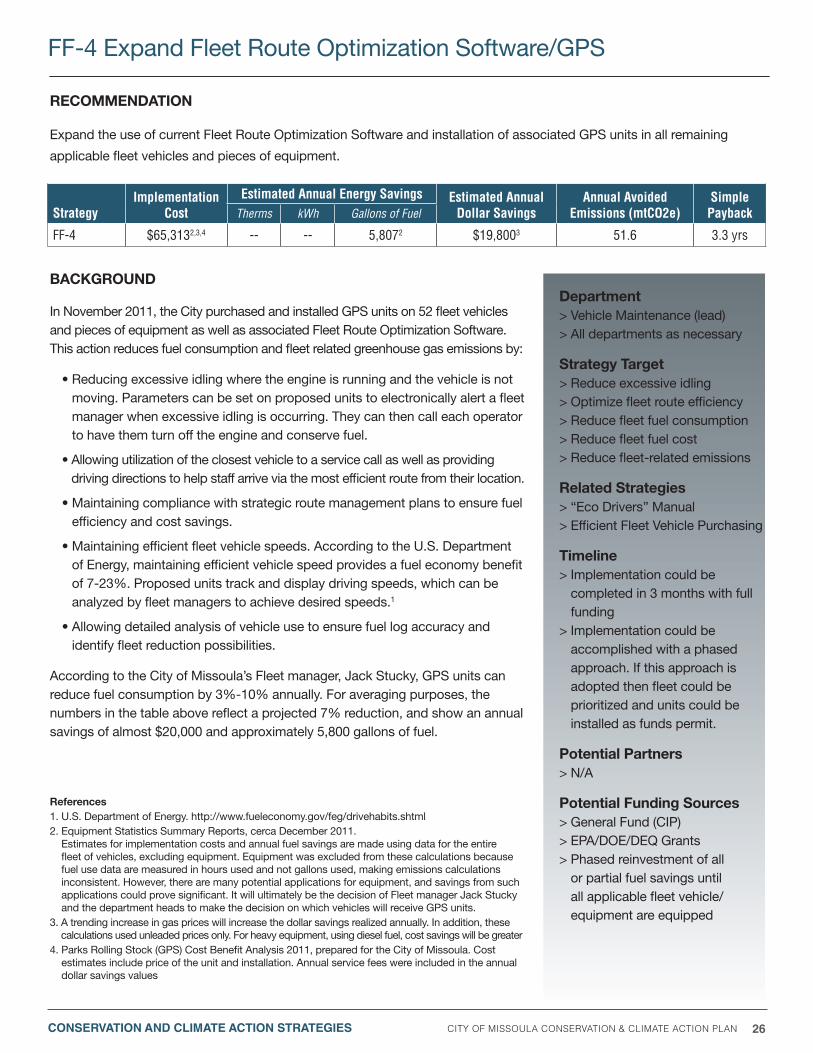
In November 2011, the City purchased and installed GPS units on 52 fleet vehicles and pieces of equipment as well as associated Fleet Route Optimization Software. This action reduces fuel consumption and fleet related greenhouse gas emissions by:
• Reducing excessive idling where the engine is running and the vehicle is not moving. Parameters can be set on proposed units to electronically alert a fleet manager when excessive idling is occurring. They can then call each operator to have them turn off the engine and conserve fuel.
• Allowing utilization of the closest vehicle to a service call as well as providing driving directions to help staff arrive via the most efficient route from their location.
• Maintaining compliance with strategic route management plans to ensure fuel efficiency and cost savings.
• Maintaining efficient fleet vehicle speeds. According to the U.S. Department of Energy, maintaining efficient vehicle speed provides a fuel economy benefit of 7-23%. Proposed units track and display driving speeds, which can be analyzed by fleet managers to achieve desired speeds.1
• Allowing detailed analysis of vehicle use to ensure fuel log accuracy and identify fleet reduction possibilities.
According to the City of Missoula’s Fleet manager, Jack Stucky, GPS units can reduce fuel consumption by 3%-10% annually. For averaging purposes, the numbers in the table above reflect a projected 7% reduction, and show an annual savings of almost $20,000 and approximately 5,800 gallons of fuel.
references1. U.S. Department of Energy. http://www.fueleconomy.gov/feg/drivehabits.shtml2. Equipment Statistics Summary Reports, cerca December 2011.
Estimates for implementation costs and annual fuel savings are made using data for the entire fleet of vehicles, excluding equipment. Equipment was excluded from these calculations because fuel use data are measured in hours used and not gallons used, making emissions calculations inconsistent. however, there are many potential applications for equipment, and savings from such applications could prove significant. It will ultimately be the decision of Fleet manager Jack Stucky and the department heads to make the decision on which vehicles will receive GPS units.
3. A trending increase in gas prices will increase the dollar savings realized annually. In addition, these calculations used unleaded prices only. For heavy equipment, using diesel fuel, cost savings will be greater
4. Parks Rolling Stock (GPS) Cost Benefit Analysis 2011, prepared for the City of Missoula. Cost estimates include price of the unit and installation. Annual service fees were included in the annual dollar savings values
FF-4 Expand Fleet Route Optimization Software/GPS
StrategyImplementation
CostEstimated Annual Energy Savings Estimated Annual
Dollar SavingsAnnual Avoided
Emissions (mtCO2e)Simple PaybackTherms kWh Gallons of Fuel
FF-4 $65,3132,3,4 -- -- 5,8072 $19,8003 51.6 3.3 yrs
reCommenDation
Expand the use of current Fleet Route Optimization Software and installation of associated GPS units in all remaining
applicable fleet vehicles and pieces of equipment.
Department > Vehicle Maintenance (lead) > All departments as necessary
strategy target > Reduce excessive idling > Optimize fleet route efficiency > Reduce fleet fuel consumption > Reduce fleet fuel cost > Reduce fleet-related emissions
related strategies > “Eco Drivers” Manual > Efficient Fleet Vehicle Purchasing
timeline > Implementation could be
completed in 3 months with full funding
> Implementation could be accomplished with a phased approach. If this approach is adopted then fleet could be prioritized and units could be installed as funds permit.
Potential Partners > N/A
Potential funding sources > General Fund (CIP) > EPA/DOE/DEQ Grants > Phased reinvestment of all
or partial fuel savings until all applicable fleet vehicle/equipment are equipped
CONSERVATION AND CLIMATE ACTION STRATEGIES
City of missoula Conservation & Climate aCtion Plan 27
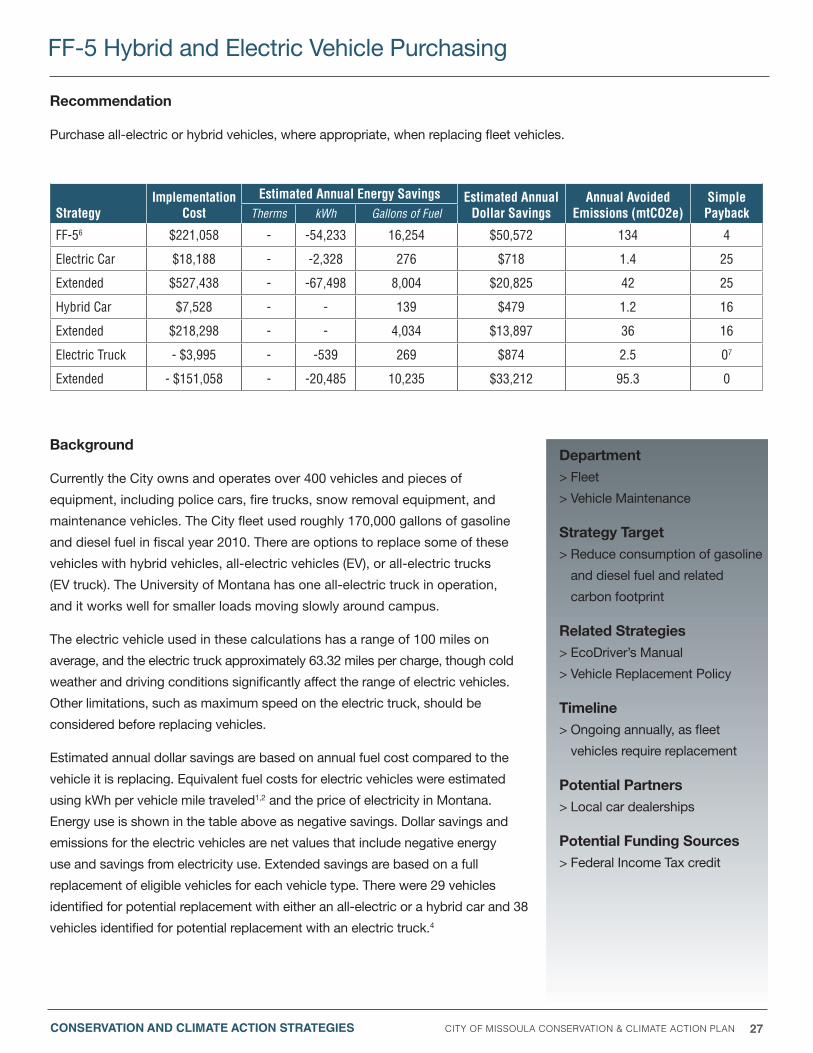
Background
Currently the City owns and operates over 400 vehicles and pieces of
equipment, including police cars, fire trucks, snow removal equipment, and
maintenance vehicles. The City fleet used roughly 170,000 gallons of gasoline
and diesel fuel in fiscal year 2010. There are options to replace some of these
vehicles with hybrid vehicles, all-electric vehicles (EV), or all-electric trucks
(EV truck). The University of Montana has one all-electric truck in operation,
and it works well for smaller loads moving slowly around campus.
The electric vehicle used in these calculations has a range of 100 miles on
average, and the electric truck approximately 63.32 miles per charge, though cold
weather and driving conditions significantly affect the range of electric vehicles.
Other limitations, such as maximum speed on the electric truck, should be
considered before replacing vehicles.
Estimated annual dollar savings are based on annual fuel cost compared to the
vehicle it is replacing. Equivalent fuel costs for electric vehicles were estimated
using kWh per vehicle mile traveled1,2 and the price of electricity in Montana.
Energy use is shown in the table above as negative savings. Dollar savings and
emissions for the electric vehicles are net values that include negative energy
use and savings from electricity use. Extended savings are based on a full
replacement of eligible vehicles for each vehicle type. There were 29 vehicles
identified for potential replacement with either an all-electric or a hybrid car and 38
vehicles identified for potential replacement with an electric truck.4
FF-5 hybrid and Electric Vehicle Purchasing
Department > Fleet
> Vehicle Maintenance
strategy target > Reduce consumption of gasoline
and diesel fuel and related
carbon footprint
related strategies > EcoDriver’s Manual
> Vehicle Replacement Policy
timeline > Ongoing annually, as fleet
vehicles require replacement
Potential Partners > Local car dealerships
Potential funding sources > Federal Income Tax credit
StrategyImplementation
CostEstimated Annual Energy Savings Estimated Annual
Dollar SavingsAnnual Avoided
Emissions (mtCO2e)Simple PaybackTherms kWh Gallons of Fuel
FF-56 $221,058 - -54,233 16,254 $50,572 134 4
Electric Car $18,188 - -2,328 276 $718 1.4 25
Extended $527,438 - -67,498 8,004 $20,825 42 25
Hybrid Car $7,528 - - 139 $479 1.2 16
Extended $218,298 - - 4,034 $13,897 36 16
Electric Truck - $3,995 - -539 269 $874 2.5 07
Extended - $151,058 - -20,485 10,235 $33,212 95.3 0
recommendation
Purchase all-electric or hybrid vehicles, where appropriate, when replacing fleet vehicles.
CONSERVATION AND CLIMATE ACTION STRATEGIES
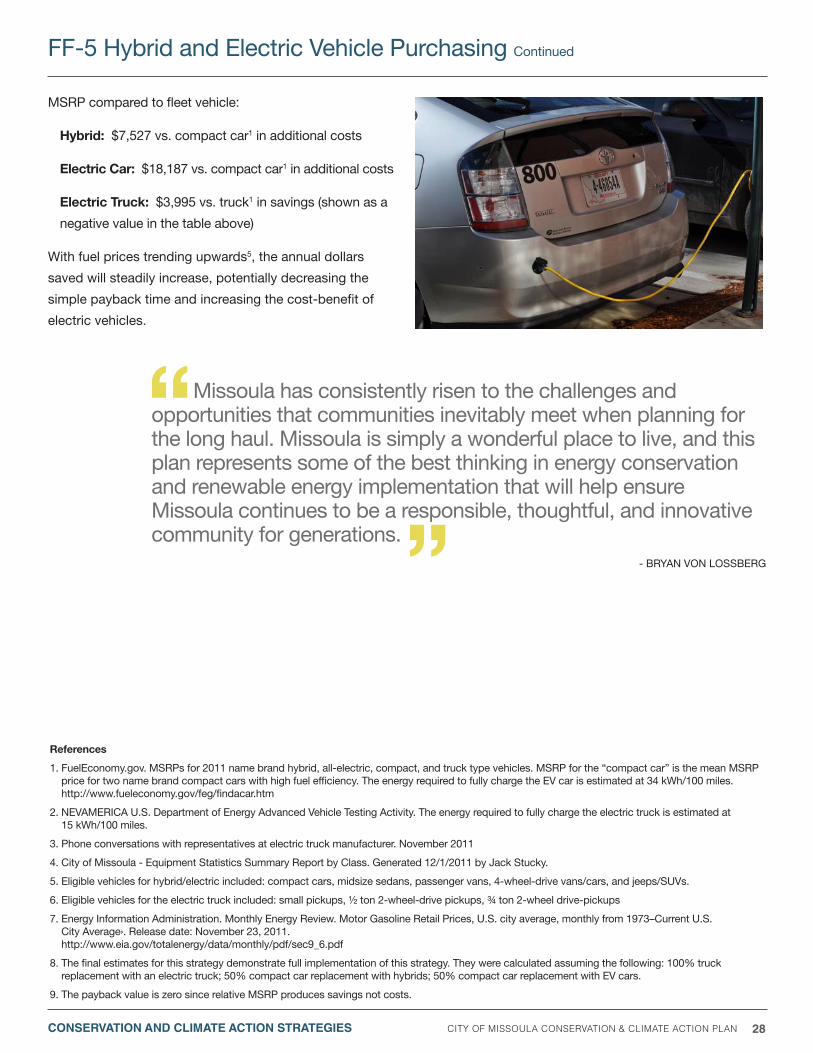
City of missoula Conservation & Climate aCtion Plan 28
MSRP compared to fleet vehicle:
hybrid: $7,527 vs. compact car1 in additional costs
electric Car: $18,187 vs. compact car1 in additional costs
electric truck: $3,995 vs. truck1 in savings (shown as a
negative value in the table above)
With fuel prices trending upwards5, the annual dollars
saved will steadily increase, potentially decreasing the
simple payback time and increasing the cost-benefit of
electric vehicles.
To be more effective in raising public awareness about the
City’s purchase and use of these vehicles, a logo, brand,
or decal should be painted onto the vehicle. This should
include simple text highlighting the fact that the vehicle is a
hybrid or all-electric, and that it is a City vehicle. Other text
on the vehicle could act as an education piece; for example,
highlighting the average number of gallons of gasoline
saved every year compared to a compact car.
FF-5 hybrid and Electric Vehicle Purchasing Continued
references
1. FuelEconomy.gov. MSRPs for 2011 name brand hybrid, all-electric, compact, and truck type vehicles. MSRP for the “compact car” is the mean MSRP price for two name brand compact cars with high fuel efficiency. The energy required to fully charge the EV car is estimated at 34 kWh/100 miles. http://www.fueleconomy.gov/feg/findacar.htm
2. NEVAMERICA U.S. Department of Energy Advanced Vehicle Testing Activity. The energy required to fully charge the electric truck is estimated at 15 kWh/100 miles.
3. Phone conversations with representatives at electric truck manufacturer. November 2011
4. City of Missoula - Equipment Statistics Summary Report by Class. Generated 12/1/2011 by Jack Stucky.
5. Eligible vehicles for hybrid/electric included: compact cars, midsize sedans, passenger vans, 4-wheel-drive vans/cars, and jeeps/SUVs.
6. Eligible vehicles for the electric truck included: small pickups, ½ ton 2-wheel-drive pickups, ¾ ton 2-wheel drive-pickups
7. Energy Information Administration. Monthly Energy Review. Motor Gasoline Retail Prices, U.S. city average, monthly from 1973–Current U.S. City Average›. Release date: November 23, 2011. http://www.eia.gov/totalenergy/data/monthly/pdf/sec9_6.pdf
8. The final estimates for this strategy demonstrate full implementation of this strategy. They were calculated assuming the following: 100% truck replacement with an electric truck; 50% compact car replacement with hybrids; 50% compact car replacement with EV cars.
9. The payback value is zero since relative MSRP produces savings not costs.
CONSERVATION AND CLIMATE ACTION STRATEGIES
Missoula has consistently risen to the challenges and opportunities that communities inevitably meet when planning for the long haul. Missoula is simply a wonderful place to live, and this plan represents some of the best thinking in energy conservation and renewable energy implementation that will help ensure Missoula continues to be a responsible, thoughtful, and innovative community for generations.
- BRyAN VON LOSSBERG

City of missoula Conservation & Climate aCtion Plan 29
StrategyImplementation
CostEstimated Annual Energy Savings Estimated Annual
Dollar SavingsAnnual Avoided
Emissions (mtCO2e)Simple PaybackTherms kWh Gallons of Fuel
FF-6 Unknown -- -- Indeterminable Indeterminable Indeterminable Indeterminable
reCommenDation
Increase efforts to facilitate employees’ use of sustainable commuting modes, including creation of key infrastructure items.
BaCkGrounD
The City of Missoula wants to continue its tradition of encouraging employees to
commute to work in a sustainable manner. Inconvenience is a large impediment
to engaging in sustainable behaviors.1 Simple improvements can be made that will
support employees’ use of such sustainable transportation choices such as walking,
biking, and riding the bus. Where lacking, the following items should be installed,
developed, and/or provided to support and encourage sustainable commuting:
• Secured, covered bike parking
• Electric vehicle charging stations
• Bike repair station
• On-site bike repair expertise
• Workshops on bike repair, safe cycling, exercise conditioning, dressing for
cold-weather commuting, navigating the bus system
• Maps of trails/paths for walking and cycling
• Customized bike/walk routes from home to work
• Customized bus route mapping from home to work
• Bus schedules
• “check-out” items, including: umbrellas, rain gear, helmet, panniers, locks
• First aid kit (bandaids, moleskin, antiseptic wipes)
• Convenient location to shower/change clothes
After the infrastructure is created and ready for use, employees should receive
explanation and training, potentially in a workshop, on the new facilities and
discuss how to use any new or unfamiliar equipment.
references
1. McKenzie-Mohr, Doug. 2011. “Fostering Sustainable Behavior: An Introduction to Community Based Social Marketing.” Pp.121-128, discussing “Convenience: Making it Easy to Act.”
FF-6 Sustainable Commute Infrastructure
Department > Bike/Ped Office
strategy target > Reduce greenhouse gas
emissions associated with
employee commute
related strategies > Bike Fleet Infrastructure
> Preferred Parking
> Incentives
timeline
> 2-6 weeks
Potential Partners > Willard School Chain Links
> Free Cycles
> Other local bike shops
> ASUM Transportation
> Mountain Line
> Missoula In Motion
Potential funding sources
CONSERVATION AND CLIMATE ACTION STRATEGIES

City of missoula Conservation & Climate aCtion Plan 30
StrategyImplementation
CostEstimated Annual Energy Savings Estimated Annual
Dollar SavingsAnnual Avoided
Emissions (mtCO2e)Simple PaybackTherms kWh Gallons of Fuel
BioDiesel Unknown -- -- 70,658 - $14,131 564.6 --
CNG Unknown -- -- 70,658 $104,574 165.4 Unknown
reCommenDation
Replace conventional fuels with cleaner burning fuels.
BaCkGrounD
In 2010, the City of Missoula used 70,6583 gallons of diesel fuel, which accounted
for 41% of total fuel purchased, and has a carbon footprint of approximately
720 mtCO2e. While there is a clear need for diesel reduction, this has proven difficult
since diesel-fueled vehicles are mostly functional specific, and reduction in use will
cause a reduction in essential services. Therefore reducing emissions instead through
cleaner fuels is a good option. Montana State Code 90-4-1011 states, “The state of
Montana encourages the use of alternative fuels and fuel blends to the extent that
doing so produces environmental and economic benefits to the citizens of Montana.”
It continues, “State and local governments should be encouraged to set an example
with their vehicle fleets in the use of alternative fuels and fuel blends.”1 Two options
for Missoula are BioDiesel and Compressed Natural Gas (CNG).
BioDiesel. According to the U.S Department of Energy, the production and use
of biodiesel results in a 78.5%2a reduction in CO2 emissions, when compared to
petroleum diesel. A blend of B20 biodiesel has also been shown to greatly reduce
emission levels of particulate matter, sulfates, unburned hydrocarbons, and
carbon monoxide.
The City previously used biodiesel, and the fleet is bio-fuel ready; however, a lack of a
reliable supplier is the main issue.4 Options include contracting with local producers
to grow biofuel crops, buying from new commercial biofuel plant coming soon to
havre5 and then storing and pumping biofuel at City facilities, or contracting with
someone to collect and produce biofuel from local restaurants’ waste oil.
The cost of biodiesel depends on the market price for vegetable oil. In general,
biodiesel blended at a 20 percent level with petroleum diesel costs approximately
20 cents per gallon more than diesel alone. Given the other advantages of
biodiesel, though, an emission management system with biodiesel is a least-cost
alternative. A study by Booz-Allen & hamilton, Inc., found fleets using a 20 percent
biodiesel blend would experience lower total annual costs than other alternative
fuels. Similarly, results reported by the University of Georgia indicate biodiesel-
powered buses are competitive with other alternatively fueled buses with biodiesel
prices as high as $3 per gallon.2b
FF-7 Utilize Cleaner Fuels
Department
> Vehicle Maintenance
strategy target
> Reduce emissions associated
with diesel vehicles
related strategies
> Improve overall fleet fuel
efficiency
> Fleet emissions reduction
> Efficient fleet purchasing policy
timeline
> Implemented can begin
almost immediately once a
reliable source is found
Potential Partners
> Bio Energy Testing Center6
> Bioroot Energy (Envirolene)7
> Sign a contract to create a
reliable source
Potential funding sources
> Federal tax credits to
incentivize suppliers
CONSERVATION AND CLIMATE ACTION STRATEGIES
City of missoula Conservation & Climate aCtion Plan 31
Estimated annual dollar savings in the table above are based
on fuel costs only. At approximately $0.20 more per gallon,
annual fuel savings for a 100% changeover to biodiesel
would increase annual fuel costs from $289,202 to $303,334.
Compressed Natural Gas (CNG). Though also a fossil fuel,
natural gas is a domestically available, inherently clean-burning
fuel. Using compressed natural gas (CNG) and liquefied natural
gas (LNG) as vehicle fuels increases energy security, paves the
way for fuel cell vehicles, and improves public health and the
environment. Compared with vehicles fueled by conventional
diesel and gasoline, natural gas vehicles can produce
significantly lower amounts of harmful emissions such as
nitrogen oxides, particulate matter, and toxic and carcinogenic
pollutants as well as carbon dioxide.8c Due to the cleaner
burning characteristics of natural gas, CNG vehicle engines
can run more efficiently than a gasoline-powered vehicle,
thereby extending the life of the vehicle.9
According to the Department of Energy, relative to gasoline
and diesel counterparts, CNG reduces emissions between
21% and 26%.8b The numbers in this table used an estimate
of 23% reduction. On average, CNG costs approximately
$1.24 less than gasoline on a per-gasoline-gallon equivalent
basis and approximately $1.48 less than diesel on a
per-diesel-gallon equivalent basis.8a
With prices for gas steadily rising, CNG could prove to be a
very cost effective option. Unlike biodiesel, however, vehicles
may need to be converted to a CNG or LNG system before the
fuel can be used. This will increase initial implementation costs.
Like all fuels, safety and proper storage and handling
are always a concern. Natural-gas-powered vehicles are
designed and built to be safe both in normal operation
and in accidents. New OEM natural gas vehicles are
subjected to the same federal government crash tests as
other vehicles. Natural gas cylinders are much thicker and
stronger than gasoline or diesel tanks. Industry standards
test them far beyond normal environmental and service
damage risks, including bonfire tests and penetration tests.
The cylinders are designed for a specific lifetime from 15 up
to 25 years and are required to be inspected every 3 years
or 36,000 miles.9 Leaks are a concern, especially indoors.
however, CNG disperses rapidly, minimizing ignition risk
relative to gasoline. Natural gas is lighter than air and will not
pool as a liquid or vapor on the ground.10
To be more effective in raising public awareness about the
City’s use of cleaner fuels a logo, brand, or decal should be
painted onto those vehicles. This should include simple text
highlighting the fact that the vehicle uses a cleaner type of
fuel and that it is a City vehicle. Other text on the vehicle
could act as an education piece; for example, highlighting
the average number of gallons of gasoline avoided every
year, and even avoided emissions.
references1. Montana Code Annotated 90-4-1011. http://data.opi.mt.gov/bills/mca/90/4/90-4-1011.htm2. Biodiesel.org 3. Benefits of Biodiesel. http://www.biodiesel.org/docs/ffs-basics/benefits-of-biodiesel.pdf?sfvrsn=44. Fleets: Market Segments. http://www.biodiesel.org/using-biodiesel/market-segments/fleets5. Fuel, Gas, Electricity Emm Report Fy2010 by Jack Stucky6. Montana Associated Technology Roundtables. “Missoula based Sustainable Systems fails to pay farmers. Missoula’s biodiesel bus system loses its fuel
supplier of 10 years.” April 22, 2009. http://www.matr.net/article-33970.html7. Leeds, Tim, “New Biofuels Plant headed for havre.” havre Daily News. May 9, 2011. http://www.havredailynews.com/news/story-234980.html8. Montana State University – Northern. Bioenergy Testing Center. http://bioenergytestingcenter.com/9. Bioroot Energy. http://biorootenergy.com10. U.S. Department of Energy - Energy Efficiency and Renewable Energy – Alternative Fuels and Alternative Vehicles Data Center. 11. Clean Cities – “Alternative Fuel Price Report January 2012”.12. Natural Gas Emissions. http://www.afdc.energy.gov/afdc/vehicles/emissions_natural_gas.html?print13. Natural Gas Benefits. http://www.afdc.energy.gov/afdc/fuels/natural_gas_benefits.html14. Clean Vehicle Education Foundation. “how Safe are Natural Gas Vehicles?” Technology Committee Bulletin. September 1999, revised September 2010.
http://www.cleanvehicle.org/committee/technical/PDFs/Web-TC-TechBul2-Safety.pdf15 U.S. Environmental Protection Agency. “Clean Alternative Fuels: Compressed Natural Gas.” EPA420-F-00-033. March 2002.
http://www.afdc.energy.gov/afdc/pdfs/epa_cng.pdf
FF-7 Utilize Cleaner Fuels Continued
CONSERVATION AND CLIMATE ACTION STRATEGIES
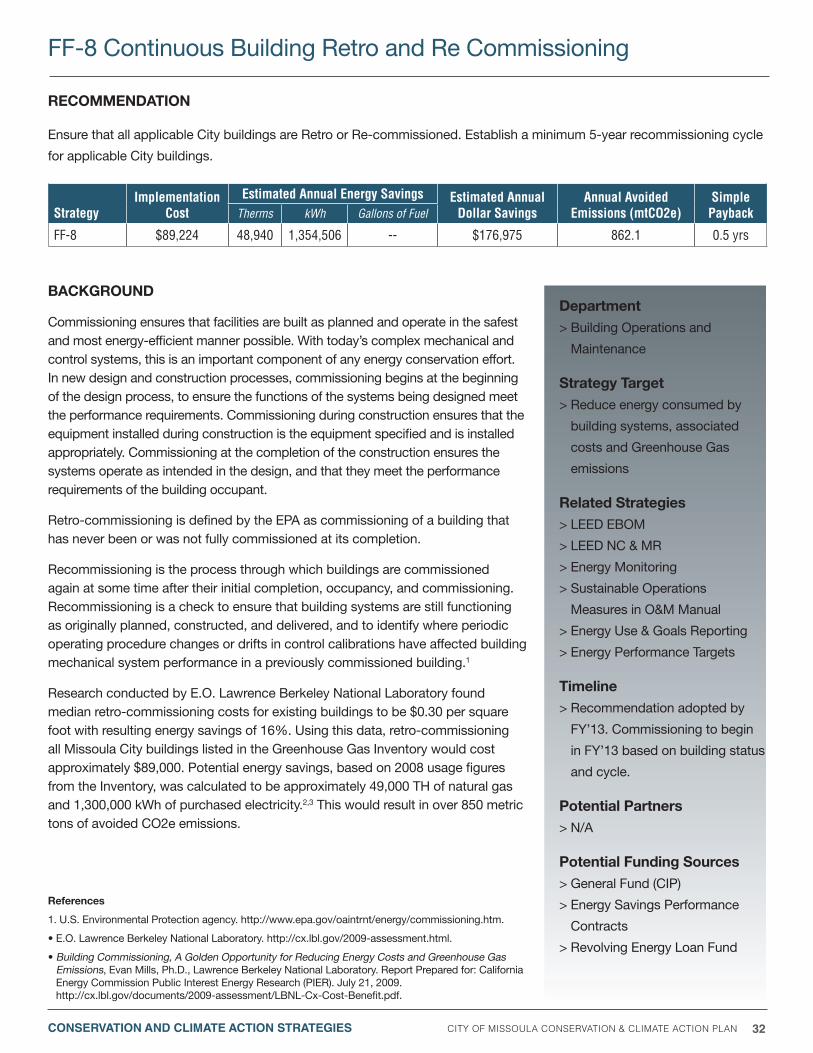
City of missoula Conservation & Climate aCtion Plan 32
StrategyImplementation
CostEstimated Annual Energy Savings Estimated Annual
Dollar SavingsAnnual Avoided
Emissions (mtCO2e)Simple PaybackTherms kWh Gallons of Fuel
FF-8 $89,224 48,940 1,354,506 -- $176,975 862.1 0.5 yrs
reCommenDation
Ensure that all applicable City buildings are Retro or Re-commissioned. Establish a minimum 5-year recommissioning cycle
for applicable City buildings.
BaCkGrounD
Commissioning ensures that facilities are built as planned and operate in the safest and most energy-efficient manner possible. With today’s complex mechanical and control systems, this is an important component of any energy conservation effort. In new design and construction processes, commissioning begins at the beginning of the design process, to ensure the functions of the systems being designed meet the performance requirements. Commissioning during construction ensures that the equipment installed during construction is the equipment specified and is installed appropriately. Commissioning at the completion of the construction ensures the systems operate as intended in the design, and that they meet the performance requirements of the building occupant.
Retro-commissioning is defined by the EPA as commissioning of a building that has never been or was not fully commissioned at its completion.
Recommissioning is the process through which buildings are commissioned again at some time after their initial completion, occupancy, and commissioning. Recommissioning is a check to ensure that building systems are still functioning as originally planned, constructed, and delivered, and to identify where periodic operating procedure changes or drifts in control calibrations have affected building mechanical system performance in a previously commissioned building.1
Research conducted by E.O. Lawrence Berkeley National Laboratory found median retro-commissioning costs for existing buildings to be $0.30 per square foot with resulting energy savings of 16%. Using this data, retro-commissioning all Missoula City buildings listed in the Greenhouse Gas Inventory would cost approximately $89,000. Potential energy savings, based on 2008 usage figures from the Inventory, was calculated to be approximately 49,000 Th of natural gas and 1,300,000 kWh of purchased electricity.2,3 This would result in over 850 metric tons of avoided CO2e emissions.
references
1. U.S. Environmental Protection agency. http://www.epa.gov/oaintrnt/energy/commissioning.htm.
• E.O. Lawrence Berkeley National Laboratory. http://cx.lbl.gov/2009-assessment.html.
• Building Commissioning, A Golden Opportunity for Reducing Energy Costs and Greenhouse Gas Emissions, Evan Mills, Ph.D., Lawrence Berkeley National Laboratory. Report Prepared for: California Energy Commission Public Interest Energy Research (PIER). July 21, 2009. http://cx.lbl.gov/documents/2009-assessment/LBNL-Cx-Cost-Benefit.pdf.
FF-8 Continuous Building Retro and Re Commissioning
Department > Building Operations and
Maintenance
strategy target > Reduce energy consumed by
building systems, associated
costs and Greenhouse Gas
emissions
related strategies > LEED EBOM
> LEED NC & MR
> Energy Monitoring
> Sustainable Operations
Measures in O&M Manual
> Energy Use & Goals Reporting
> Energy Performance Targets
timeline > Recommendation adopted by
Fy’13. Commissioning to begin
in Fy’13 based on building status
and cycle.
Potential Partners > N/A
Potential funding sources > General Fund (CIP)
> Energy Savings Performance
Contracts
> Revolving Energy Loan Fund
CONSERVATION AND CLIMATE ACTION STRATEGIES
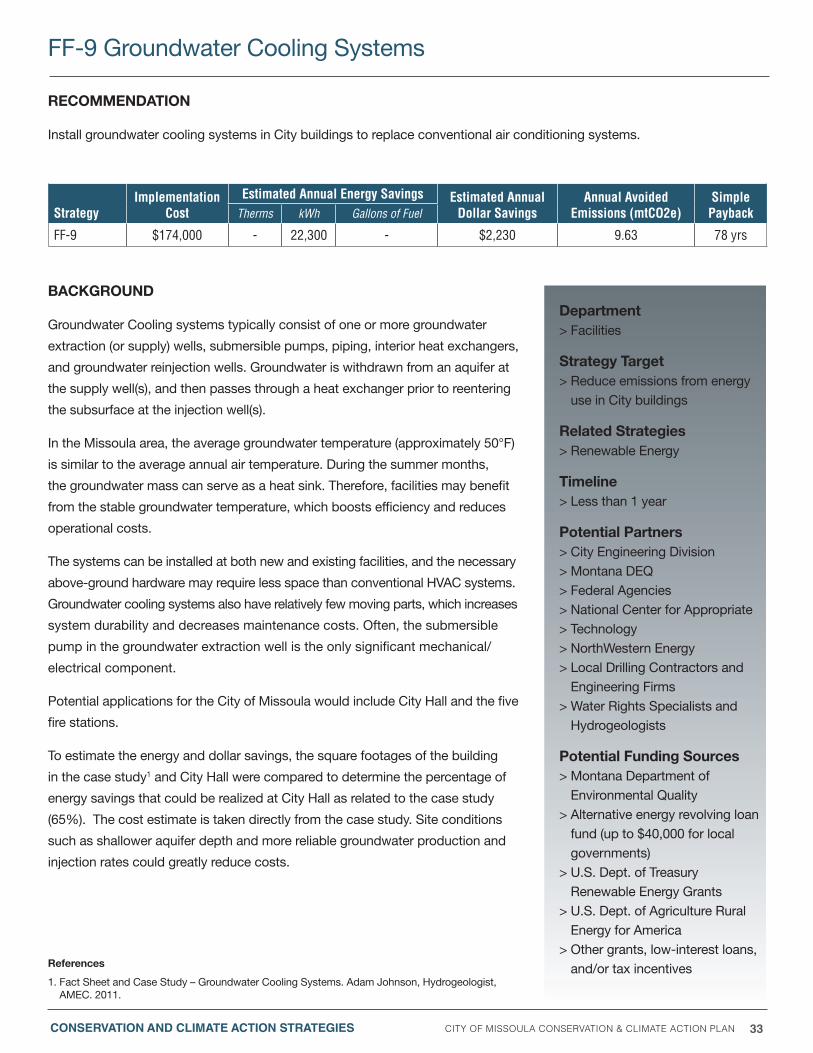
City of missoula Conservation & Climate aCtion Plan 33
StrategyImplementation
CostEstimated Annual Energy Savings Estimated Annual
Dollar SavingsAnnual Avoided
Emissions (mtCO2e)Simple PaybackTherms kWh Gallons of Fuel
FF-9 $174,000 - 22,300 - $2,230 9.63 78 yrs
reCommenDation
Install groundwater cooling systems in City buildings to replace conventional air conditioning systems.
BaCkGrounD
Groundwater Cooling systems typically consist of one or more groundwater
extraction (or supply) wells, submersible pumps, piping, interior heat exchangers,
and groundwater reinjection wells. Groundwater is withdrawn from an aquifer at
the supply well(s), and then passes through a heat exchanger prior to reentering
the subsurface at the injection well(s).
In the Missoula area, the average groundwater temperature (approximately 50°F)
is similar to the average annual air temperature. During the summer months,
the groundwater mass can serve as a heat sink. Therefore, facilities may benefit
from the stable groundwater temperature, which boosts efficiency and reduces
operational costs.
The systems can be installed at both new and existing facilities, and the necessary
above-ground hardware may require less space than conventional hVAC systems.
Groundwater cooling systems also have relatively few moving parts, which increases
system durability and decreases maintenance costs. Often, the submersible
pump in the groundwater extraction well is the only significant mechanical/
electrical component.
Potential applications for the City of Missoula would include City hall and the five
fire stations.
To estimate the energy and dollar savings, the square footages of the building
in the case study1 and City hall were compared to determine the percentage of
energy savings that could be realized at City hall as related to the case study
(65%). The cost estimate is taken directly from the case study. Site conditions
such as shallower aquifer depth and more reliable groundwater production and
injection rates could greatly reduce costs.
references
1. Fact Sheet and Case Study – Groundwater Cooling Systems. Adam Johnson, hydrogeologist, AMEC. 2011.
FF-9 Groundwater Cooling Systems
Department > Facilities
strategy target > Reduce emissions from energy
use in City buildings
related strategies > Renewable Energy
timeline > Less than 1 year
Potential Partners > City Engineering Division > Montana DEQ > Federal Agencies > National Center for Appropriate > Technology > NorthWestern Energy > Local Drilling Contractors and
Engineering Firms> Water Rights Specialists and
hydrogeologists
Potential funding sources > Montana Department of
Environmental Quality> Alternative energy revolving loan
fund (up to $40,000 for local governments)
> U.S. Dept. of Treasury Renewable Energy Grants
> U.S. Dept. of Agriculture Rural Energy for America
> Other grants, low-interest loans, and/or tax incentives
CONSERVATION AND CLIMATE ACTION STRATEGIES
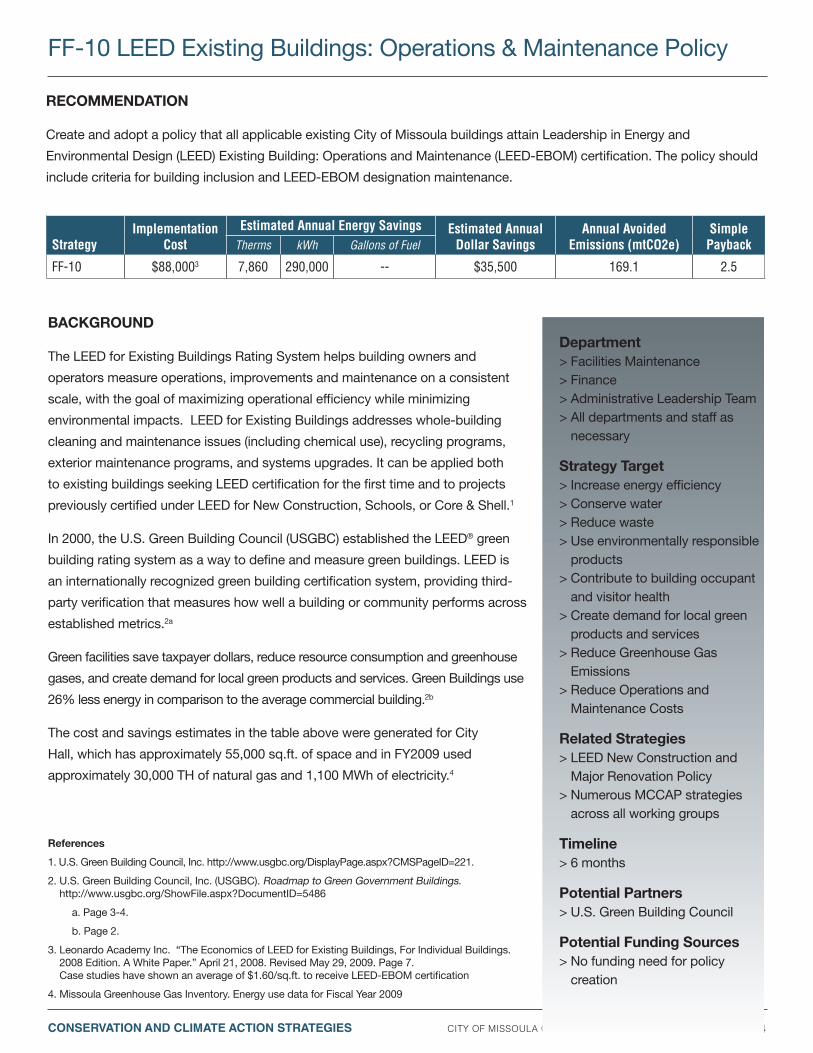
City of missoula Conservation & Climate aCtion Plan 34
StrategyImplementation
CostEstimated Annual Energy Savings Estimated Annual
Dollar SavingsAnnual Avoided
Emissions (mtCO2e)Simple PaybackTherms kWh Gallons of Fuel
FF-10 $88,0003 7,860 290,000 -- $35,500 169.1 2.5
reCommenDation
Create and adopt a policy that all applicable existing City of Missoula buildings attain Leadership in Energy and
Environmental Design (LEED) Existing Building: Operations and Maintenance (LEED-EBOM) certification. The policy should
include criteria for building inclusion and LEED-EBOM designation maintenance.
BaCkGrounD
The LEED for Existing Buildings Rating System helps building owners and
operators measure operations, improvements and maintenance on a consistent
scale, with the goal of maximizing operational efficiency while minimizing
environmental impacts. LEED for Existing Buildings addresses whole-building
cleaning and maintenance issues (including chemical use), recycling programs,
exterior maintenance programs, and systems upgrades. It can be applied both
to existing buildings seeking LEED certification for the first time and to projects
previously certified under LEED for New Construction, Schools, or Core & Shell.1
In 2000, the U.S. Green Building Council (USGBC) established the LEED® green
building rating system as a way to define and measure green buildings. LEED is
an internationally recognized green building certification system, providing third-
party verification that measures how well a building or community performs across
established metrics.2a
Green facilities save taxpayer dollars, reduce resource consumption and greenhouse
gases, and create demand for local green products and services. Green Buildings use
26% less energy in comparison to the average commercial building.2b
The cost and savings estimates in the table above were generated for City
hall, which has approximately 55,000 sq.ft. of space and in Fy2009 used
approximately 30,000 Th of natural gas and 1,100 MWh of electricity.4
references
1. U.S. Green Building Council, Inc. http://www.usgbc.org/DisplayPage.aspx?CMSPageID=221.
2. U.S. Green Building Council, Inc. (USGBC). Roadmap to Green Government Buildings. http://www.usgbc.org/ShowFile.aspx?DocumentID=5486
a. Page 3-4.
b. Page 2.
3. Leonardo Academy Inc. “The Economics of LEED for Existing Buildings, For Individual Buildings. 2008 Edition. A White Paper.” April 21, 2008. Revised May 29, 2009. Page 7. Case studies have shown an average of $1.60/sq.ft. to receive LEED-EBOM certification
4. Missoula Greenhouse Gas Inventory. Energy use data for Fiscal year 2009
FF-10 LEED Existing Buildings: Operations & Maintenance Policy
Department > Facilities Maintenance > Finance > Administrative Leadership Team> All departments and staff as
necessary
strategy target > Increase energy efficiency> Conserve water> Reduce waste> Use environmentally responsible
products> Contribute to building occupant
and visitor health> Create demand for local green
products and services> Reduce Greenhouse Gas
Emissions> Reduce Operations and
Maintenance Costs
related strategies> LEED New Construction and
Major Renovation Policy> Numerous MCCAP strategies
across all working groups
timeline> 6 months
Potential Partners> U.S. Green Building Council
Potential funding sources> No funding need for policy
creation
CONSERVATION AND CLIMATE ACTION STRATEGIES
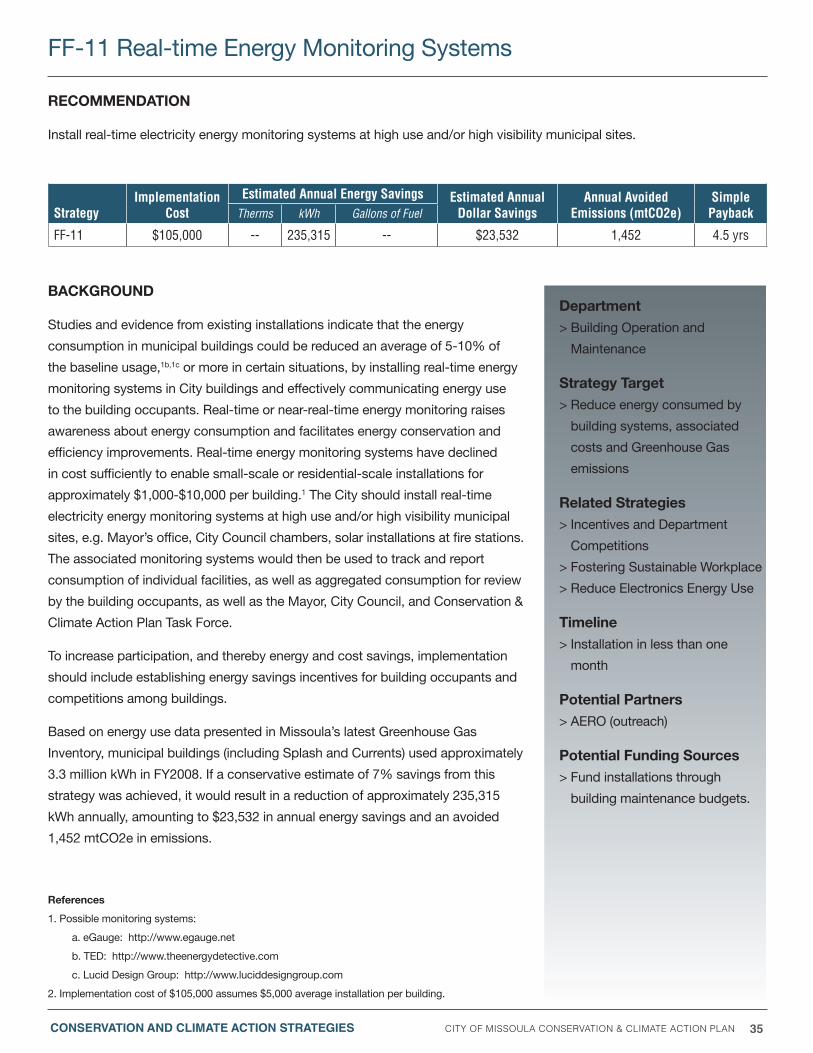
City of missoula Conservation & Climate aCtion Plan 35
StrategyImplementation
CostEstimated Annual Energy Savings Estimated Annual
Dollar SavingsAnnual Avoided
Emissions (mtCO2e)Simple PaybackTherms kWh Gallons of Fuel
FF-11 $105,000 -- 235,315 -- $23,532 1,452 4.5 yrs
reCommenDation
Install real-time electricity energy monitoring systems at high use and/or high visibility municipal sites.
BaCkGrounD
Studies and evidence from existing installations indicate that the energy
consumption in municipal buildings could be reduced an average of 5-10% of
the baseline usage,1b,1c or more in certain situations, by installing real-time energy
monitoring systems in City buildings and effectively communicating energy use
to the building occupants. Real-time or near-real-time energy monitoring raises
awareness about energy consumption and facilitates energy conservation and
efficiency improvements. Real-time energy monitoring systems have declined
in cost sufficiently to enable small-scale or residential-scale installations for
approximately $1,000-$10,000 per building.1 The City should install real-time
electricity energy monitoring systems at high use and/or high visibility municipal
sites, e.g. Mayor’s office, City Council chambers, solar installations at fire stations.
The associated monitoring systems would then be used to track and report
consumption of individual facilities, as well as aggregated consumption for review
by the building occupants, as well as the Mayor, City Council, and Conservation &
Climate Action Plan Task Force.
To increase participation, and thereby energy and cost savings, implementation
should include establishing energy savings incentives for building occupants and
competitions among buildings.
Based on energy use data presented in Missoula’s latest Greenhouse Gas
Inventory, municipal buildings (including Splash and Currents) used approximately
3.3 million kWh in Fy2008. If a conservative estimate of 7% savings from this
strategy was achieved, it would result in a reduction of approximately 235,315
kWh annually, amounting to $23,532 in annual energy savings and an avoided
1,452 mtCO2e in emissions.
references
1. Possible monitoring systems:
a. eGauge: http://www.egauge.net
b. TED: http://www.theenergydetective.com
c. Lucid Design Group: http://www.luciddesigngroup.com
2. Implementation cost of $105,000 assumes $5,000 average installation per building.
Department> Building Operation and
Maintenance
strategy target > Reduce energy consumed by
building systems, associated
costs and Greenhouse Gas
emissions
related strategies> Incentives and Department
Competitions
> Fostering Sustainable Workplace
> Reduce Electronics Energy Use
timeline> Installation in less than one
month
Potential Partners> AERO (outreach)
Potential funding sources> Fund installations through
building maintenance budgets.
FF-11 Real-time Energy Monitoring Systems
CONSERVATION AND CLIMATE ACTION STRATEGIES
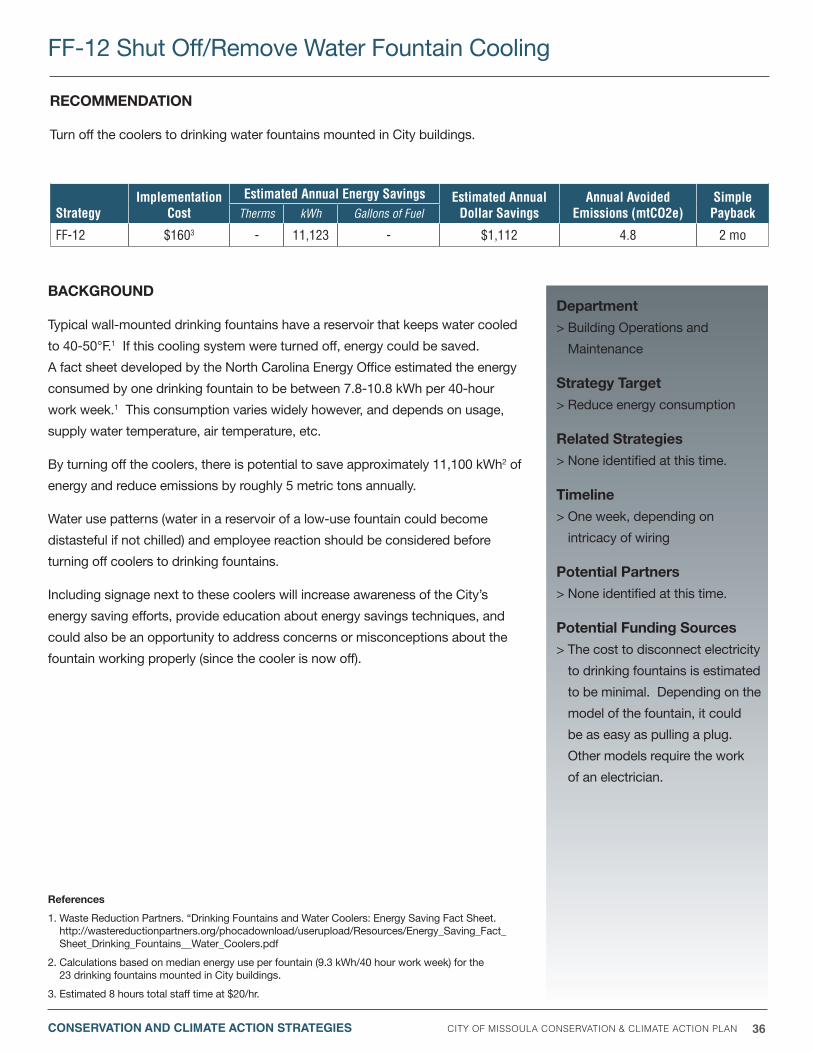
City of missoula Conservation & Climate aCtion Plan 36
StrategyImplementation
CostEstimated Annual Energy Savings Estimated Annual
Dollar SavingsAnnual Avoided
Emissions (mtCO2e)Simple PaybackTherms kWh Gallons of Fuel
FF-12 $1603 - 11,123 - $1,112 4.8 2 mo
reCommenDation
Turn off the coolers to drinking water fountains mounted in City buildings.
BaCkGrounD
Typical wall-mounted drinking fountains have a reservoir that keeps water cooled
to 40-50°F.1 If this cooling system were turned off, energy could be saved.
A fact sheet developed by the North Carolina Energy Office estimated the energy
consumed by one drinking fountain to be between 7.8-10.8 kWh per 40-hour
work week.1 This consumption varies widely however, and depends on usage,
supply water temperature, air temperature, etc.
By turning off the coolers, there is potential to save approximately 11,100 kWh2 of
energy and reduce emissions by roughly 5 metric tons annually.
Water use patterns (water in a reservoir of a low-use fountain could become
distasteful if not chilled) and employee reaction should be considered before
turning off coolers to drinking fountains.
Including signage next to these coolers will increase awareness of the City’s
energy saving efforts, provide education about energy savings techniques, and
could also be an opportunity to address concerns or misconceptions about the
fountain working properly (since the cooler is now off).
references
1. Waste Reduction Partners. “Drinking Fountains and Water Coolers: Energy Saving Fact Sheet. http://wastereductionpartners.org/phocadownload/userupload/Resources/Energy_Saving_Fact_Sheet_Drinking_Fountains__Water_Coolers.pdf
2. Calculations based on median energy use per fountain (9.3 kWh/40 hour work week) for the 23 drinking fountains mounted in City buildings.
3. Estimated 8 hours total staff time at $20/hr.
FF-12 Shut Off/Remove Water Fountain Cooling
Department> Building Operations and
Maintenance
strategy target > Reduce energy consumption
related strategies> None identified at this time.
timeline> One week, depending on
intricacy of wiring
Potential Partners> None identified at this time.
Potential funding sources > The cost to disconnect electricity
to drinking fountains is estimated
to be minimal. Depending on the
model of the fountain, it could
be as easy as pulling a plug.
Other models require the work
of an electrician.
CONSERVATION AND CLIMATE ACTION STRATEGIES

City of missoula Conservation & Climate aCtion Plan 37
StrategyImplementation
CostEstimated Annual Energy Savings Estimated Annual
Dollar SavingsAnnual Avoided
Emissions (mtCO2e)Simple PaybackTherms kWh Gallons of Fuel
FF-13 $27,6242 90 1,557 - $72,025 1.2 5 mo
reCommenDation
Install “water wise” and energy efficient bathroom features in City-owned and operated bathrooms.
BaCkGrounD
The City of Missoula’s buildings serve employees as well as citizens. The City
could save hundreds of thousands of gallons annually by converting to touch-
less, water-wise, and low-flow features.1a,b For example, compared to older toilets,
high efficiency toilets can save up to almost 3 gallons of water per flush.1 high
efficiency and touch-less faucets can reduce hot water use, thus saving energy
on water heating in addition to lowering water consumption.1b,3 The estimated
savings in this strategy are for toilets and faucets alone, but other features that
could increase savings significantly should be considered (i.e. waterless urinals).3
In addition to the water and energy reductions, “water wise” features that include
automatic controls are more hygienic and can reduce the spreading of germs.3,4
references
1. ICLEI - CAPPA v1.5 ©2010.
a. “high Efficiency Toilets.”
b. “Faucets.”
2. Assumptions include: annual water savings, percent hot water use, daily water use, etc. Costs of water and electricity were customized.
3. Cost per faucet/toilet1a,b plus an additional estimated $120/bathroom for installation (6 hr staff time x $20/hr)
4. Government of Manitoba, Canada. “Fact Sheet – Water Conservation.” http://www.gov.mb.ca/ia/climate/toolkit/water_conservation.pdf
5. Lewis, Mark. “Benefits of restroom automation: touchless technology keeps germs in their place.” July, 2004. http://findarticles.com/p/articles/mi_m3830/is_7_54/ai_n14920746/
Department> Building Maintenance
strategy target > Reduce water consumption and
maintenance costs
related strategies> Water Wise Park Areas
> Fostering Sustainable Behavior
timeline> One week for installation of new
features after procurement.
Potential Partners> Missoula County
> Mountain Water
> Clark Fork Coalition
> Wastewater Treatment Plant
Potential funding sources> Mountain Water
> US EPA
FF-13 Water Wise Bathroom Features
CONSERVATION AND CLIMATE ACTION STRATEGIES
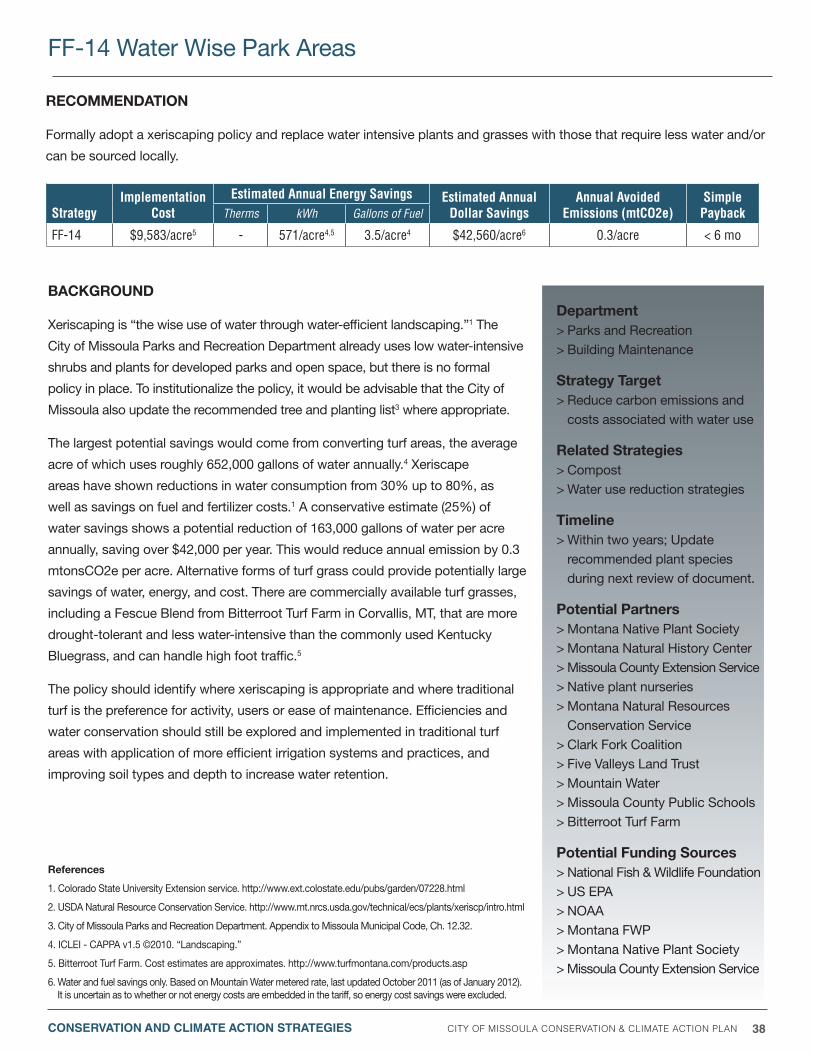
City of missoula Conservation & Climate aCtion Plan 38
StrategyImplementation
CostEstimated Annual Energy Savings Estimated Annual
Dollar SavingsAnnual Avoided
Emissions (mtCO2e)Simple PaybackTherms kWh Gallons of Fuel
FF-14 $9,583/acre5 - 571/acre4,5 3.5/acre4 $42,560/acre6 0.3/acre < 6 mo
reCommenDation
Formally adopt a xeriscaping policy and replace water intensive plants and grasses with those that require less water and/or
can be sourced locally.
BaCkGrounD
Xeriscaping is “the wise use of water through water-efficient landscaping.”1 The
City of Missoula Parks and Recreation Department already uses low water-intensive
shrubs and plants for developed parks and open space, but there is no formal
policy in place. To institutionalize the policy, it would be advisable that the City of
Missoula also update the recommended tree and planting list3 where appropriate.
The largest potential savings would come from converting turf areas, the average
acre of which uses roughly 652,000 gallons of water annually.4 Xeriscape
areas have shown reductions in water consumption from 30% up to 80%, as
well as savings on fuel and fertilizer costs.1 A conservative estimate (25%) of
water savings shows a potential reduction of 163,000 gallons of water per acre
annually, saving over $42,000 per year. This would reduce annual emission by 0.3
mtonsCO2e per acre. Alternative forms of turf grass could provide potentially large
savings of water, energy, and cost. There are commercially available turf grasses,
including a Fescue Blend from Bitterroot Turf Farm in Corvallis, MT, that are more
drought-tolerant and less water-intensive than the commonly used Kentucky
Bluegrass, and can handle high foot traffic.5
The policy should identify where xeriscaping is appropriate and where traditional
turf is the preference for activity, users or ease of maintenance. Efficiencies and
water conservation should still be explored and implemented in traditional turf
areas with application of more efficient irrigation systems and practices, and
improving soil types and depth to increase water retention.
references
1. Colorado State University Extension service. http://www.ext.colostate.edu/pubs/garden/07228.html
2. USDA Natural Resource Conservation Service. http://www.mt.nrcs.usda.gov/technical/ecs/plants/xeriscp/intro.html
3. City of Missoula Parks and Recreation Department. Appendix to Missoula Municipal Code, Ch. 12.32.
4. ICLEI - CAPPA v1.5 ©2010. “Landscaping.”
5. Bitterroot Turf Farm. Cost estimates are approximates. http://www.turfmontana.com/products.asp
6. Water and fuel savings only. Based on Mountain Water metered rate, last updated October 2011 (as of January 2012). It is uncertain as to whether or not energy costs are embedded in the tariff, so energy cost savings were excluded.
FF-14 Water Wise Park Areas
Department> Parks and Recreation> Building Maintenance
strategy target > Reduce carbon emissions and
costs associated with water use
related strategies> Compost> Water use reduction strategies
timeline> Within two years; Update
recommended plant species during next review of document.
Potential Partners> Montana Native Plant Society> Montana Natural history Center> Missoula County Extension Service> Native plant nurseries> Montana Natural Resources
Conservation Service> Clark Fork Coalition> Five Valleys Land Trust> Mountain Water> Missoula County Public Schools> Bitterroot Turf Farm
Potential funding sources> National Fish & Wildlife Foundation> US EPA> NOAA> Montana FWP> Montana Native Plant Society> Missoula County Extension Service
CONSERVATION AND CLIMATE ACTION STRATEGIES

City of missoula Conservation & Climate aCtion Plan 39
workinG GrouP memBers
amy Cilimburg, Montana Audubon Society
(Working Group Chair)
Ben schmidt, Missoula City-County Health Department
Beth schenk, St. Patrick Hospital and
Health Sciences Center
Jackie Corday, City of Missoula
Jennifer thompson, Missoula in Motion
laurie Pfau, City of Missoula
meghan oswalt, U.S. Forest Service
robin saha, Ph.D, University of Montana
A tremendous amount of energy conservation and emissions reduction potential exists in the way the nearly 450 City employees
go about their work every day. The following Internal Practices & Policy (IPP) strategies intend to further integrate green
practices into City operations so that reducing energy and material consumption, reducing the cost of doing business, and
healthy, happy employees are the workplace norm. Internal Policies and Practices strategies are a cost effective foundation
for emissions reduction and can be implemented rather quickly. Savings tend to decrease over time without centralized
support and consistent follow up, training and feedback. Therefore, staff assigned to champion and oversee efforts is
essential to long-term success.
internal Policies and Practices Completed actions
Table 3-4 below lists actions already taken by the City within the scope of the Internal Policies and Practices working
group categories. It is important to recognize these projects and programs and they be kept in place as we pursue greater
reductions in operational costs, energy use, and emissions.
Table 3-4: Internal Policies and Practices Completed Actions
internal PoliCies anD PraCtiCes workinG GrouP
Action Year ImplementedFormation of City Green Team 2008Green Team Initiatives and Green Policy 2009Administrative Rule 11: City Fleet Vehicle Use 2010
CONSERVATION AND CLIMATE ACTION STRATEGIES

City of missoula Conservation & Climate aCtion Plan 40
internal Policies and Practices strategies
Table 3-5 below summarizes the Internal Policies and Practices working group strategies. Further details are described
in the narratives below.
Table 3-5: Internal Policies and Practices Strategies
StrategyImplementation
CostEst. Annual Dollar
SavingsAnnual Avoided
Emissions (mtCO2e)Simple
Payback (yrs)
EmPlOYEE COmmutE
IPP-1 Employee Commuting Incentive Program Unknown $0 31 --IPP-2 Flexible Work Scheduling < $1000 Indeterminable 31 UnknownIPP-3 Rideshare Scheduling plan for employees < $1000 $0 62 --
EmPlOYEE CulturE
IPP-4 Conservation and Sustainability in Work Plans and Annual Review Unknown Indeterminable Indeterminable --
IPP-5 Fostering Sustainable Workplace Unknown Indeterminable Indeterminable --IPP-6 Include Conservation and Sustainability
in Job Descriptions Unknown Indeterminable Indeterminable --
IPP-7 Include Sustainability in Employee Orientation Unknown Indeterminable Indeterminable --
PrODuCtS, PrOCurEmEnt, & FACIlItIES
IPP-8 Green Purchasing Policy Unknown Indeterminable Indeterminable --IPP-9 LEED for New Construction and Major
Renovations Policy $43,500 $25,438 119 < 2
IPP-10 Paper and Printing Policies < $1000 - $9,500 $58,000 - >$170,000 0.5 -1.4 < 2 monthsIPP-11 Reduce Electronics Energy Use < $1000 $3,350 14.5 0.3IPP-12 Waste Stream Reduction Policy < $1000 Indeterminable Indeterminable --
CONSERVATION AND CLIMATE ACTION STRATEGIES
The City now owns and manages approximately 3,800 acres of open space that provides many ecological benefits, including floodwater storage, contributing to clean water and air, wildlife and bird habitat, carbon storage, and the cooling influence of trees during the summer months, as well as providing scenic beauty and many health and recreation benefits to our citizens. - JACKIE CORDAy,
Open Space Program Manager

City of missoula Conservation & Climate aCtion Plan 41
StrategyImplementation
CostEstimated Annual Energy Savings Estimated Annual
Dollar SavingsAnnual Avoided
Emissions (mtCO2e)Simple PaybackTherms kWh Gallons of Fuel
IPP-1 Unknown -- -- 0 $0 31 --
reCommenDation
Provide incentives to City employees who find alternatives to single-occupancy vehicle commuting. Formalize easy
enrollment in Missoula in Motion’s Way to Go! Club.
BaCkGrounD
Currently, all City employees receive a Mountain Line bus pass and have the
opportunity to enroll in Missoula In Motion’s Way to Go! Club (WTG!C). The
WTG!C is an incentive program for commuters that employees can opt into.1
By formalizing enrollment for City employees during orientation (as part of the
sustainability portion) participation becomes more the norm. Additionally, the
City should conduct a survey of employee commuting behavior to have baseline
data to help determine the effectiveness of incentives. Insight into the commuting
habits and preferences of employees can inform the City’s implementation of
measures that will simultaneously meet employee needs and reduce the overall
contribution to transportation-related emissions. Incentives could come directly
from Missoula in Motion or could include other department prizes and/or cash.
These incentives should be City-specific (i.e. different from the current WTG!C
prizes) and should be developed with employee input. Interest in and desire for
different types of incentives could be included in the survey mentioned above to
most effectively motivate employees to participate.
Realizing a conservative 5% increase in sustainable commuting (29 employees)
from this strategy would result in approximately 300 vehicle miles avoided
every work day. This equates to 3,470 gallons of fuel2 and, collectively, $12,000
in savings for those employees. This would avoid 31 mtCO2e in commuting-
related emissions for the City. Since the cost and fuel savings are realized by City
employees, they are not included in the table below. The associated emissions do
fall under the scope of the City and are therefore included.
This project would reinvigorate the City’s’ relationship with Missoula in Motion, which
will lead to future synergy and collaboration on other transportation-related projects.
references
1. Missoula In Motion: http://missoulainmotion.com
2. Assuming 21.3 mpg. FuelEconomy.gov - average combined fuel economy of 2008 name brand midsize, wagon, and truck vehicles.
Department> human Resources
> Planning and Grants
> Bike/Ped Office
strategy target > Reduce emissions associated
with employee transportation
> Better tracking of employee
commute mode
related strategies> Fostering Sustainable Workplace
> Incorporate Sustainability in
Employee Orientation
> Employee Commuting Incentive
Program
timeline> First year: conduct commute
survey; enroll in WTG!C as
part of orientation (strategy
concurrent with implementation
of sustainability training during
orientation).
Potential Partners> Missoula In Motion
> Mountain Line
> MRTMA
> Missoula Parking Commission
Potential funding sources> None identified.
IPP-1 Employee Commuting Incentive Program
CONSERVATION AND CLIMATE ACTION STRATEGIES
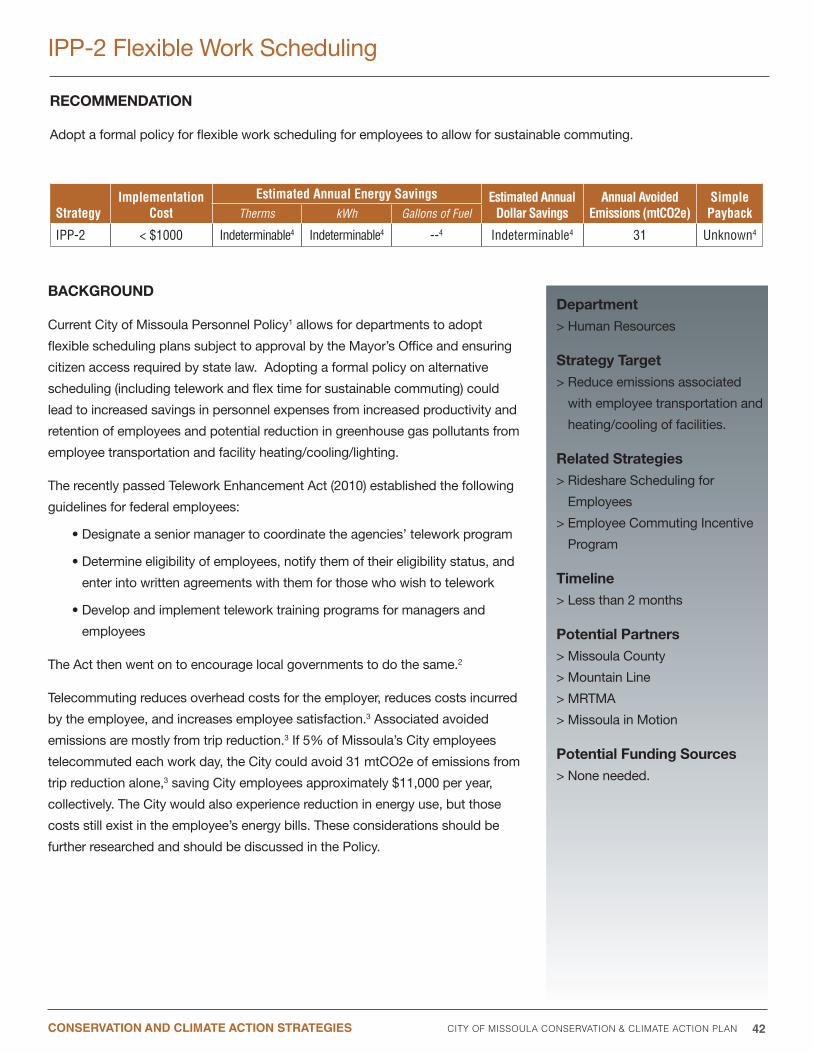
City of missoula Conservation & Climate aCtion Plan 42
StrategyImplementation
CostEstimated Annual Energy Savings Estimated Annual
Dollar SavingsAnnual Avoided
Emissions (mtCO2e)Simple PaybackTherms kWh Gallons of Fuel
IPP-2 < $1000 Indeterminable4 Indeterminable4 --4 Indeterminable4 31 Unknown4
reCommenDation
Adopt a formal policy for flexible work scheduling for employees to allow for sustainable commuting.
BaCkGrounD
Current City of Missoula Personnel Policy1 allows for departments to adopt
flexible scheduling plans subject to approval by the Mayor’s Office and ensuring
citizen access required by state law. Adopting a formal policy on alternative
scheduling (including telework and flex time for sustainable commuting) could
lead to increased savings in personnel expenses from increased productivity and
retention of employees and potential reduction in greenhouse gas pollutants from
employee transportation and facility heating/cooling/lighting.
The recently passed Telework Enhancement Act (2010) established the following
guidelines for federal employees:
• Designate a senior manager to coordinate the agencies’ telework program
• Determine eligibility of employees, notify them of their eligibility status, and
enter into written agreements with them for those who wish to telework
• Develop and implement telework training programs for managers and
employees
The Act then went on to encourage local governments to do the same.2
Telecommuting reduces overhead costs for the employer, reduces costs incurred
by the employee, and increases employee satisfaction.3 Associated avoided
emissions are mostly from trip reduction.3 If 5% of Missoula’s City employees
telecommuted each work day, the City could avoid 31 mtCO2e of emissions from
trip reduction alone,3 saving City employees approximately $11,000 per year,
collectively. The City would also experience reduction in energy use, but those
costs still exist in the employee’s energy bills. These considerations should be
further researched and should be discussed in the Policy.
IPP-2 Flexible Work Scheduling
Department> human Resources
strategy target > Reduce emissions associated
with employee transportation and
heating/cooling of facilities.
related strategies> Rideshare Scheduling for
Employees
> Employee Commuting Incentive
Program
timeline> Less than 2 months
Potential Partners> Missoula County
> Mountain Line
> MRTMA
> Missoula in Motion
Potential funding sources> None needed.
CONSERVATION AND CLIMATE ACTION STRATEGIES
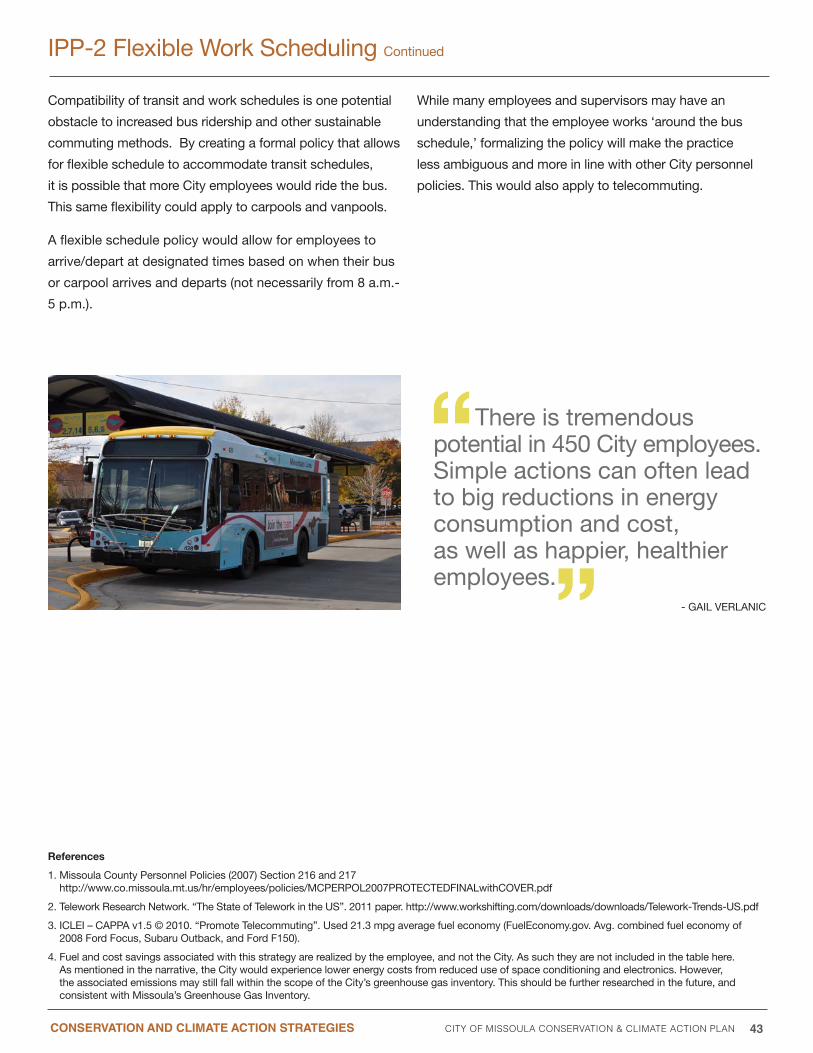
City of missoula Conservation & Climate aCtion Plan 43
Compatibility of transit and work schedules is one potential
obstacle to increased bus ridership and other sustainable
commuting methods. By creating a formal policy that allows
for flexible schedule to accommodate transit schedules,
it is possible that more City employees would ride the bus.
This same flexibility could apply to carpools and vanpools.
A flexible schedule policy would allow for employees to
arrive/depart at designated times based on when their bus
or carpool arrives and departs (not necessarily from 8 a.m.-
5 p.m.).
While many employees and supervisors may have an
understanding that the employee works ‘around the bus
schedule,’ formalizing the policy will make the practice
less ambiguous and more in line with other City personnel
policies. This would also apply to telecommuting.
IPP-2 Flexible Work Scheduling Continued
references
1. Missoula County Personnel Policies (2007) Section 216 and 217 http://www.co.missoula.mt.us/hr/employees/policies/MCPERPOL2007PROTECTEDFINALwithCOVER.pdf
2. Telework Research Network. “The State of Telework in the US”. 2011 paper. http://www.workshifting.com/downloads/downloads/Telework-Trends-US.pdf
3. ICLEI – CAPPA v1.5 © 2010. “Promote Telecommuting”. Used 21.3 mpg average fuel economy (FuelEconomy.gov. Avg. combined fuel economy of 2008 Ford Focus, Subaru Outback, and Ford F150).
4. Fuel and cost savings associated with this strategy are realized by the employee, and not the City. As such they are not included in the table here. As mentioned in the narrative, the City would experience lower energy costs from reduced use of space conditioning and electronics. however, the associated emissions may still fall within the scope of the City’s greenhouse gas inventory. This should be further researched in the future, and consistent with Missoula’s Greenhouse Gas Inventory.
CONSERVATION AND CLIMATE ACTION STRATEGIES
There is tremendous potential in 450 City employees. Simple actions can often lead to big reductions in energy consumption and cost, as well as happier, healthier employees.
- GAIL VERLANIC
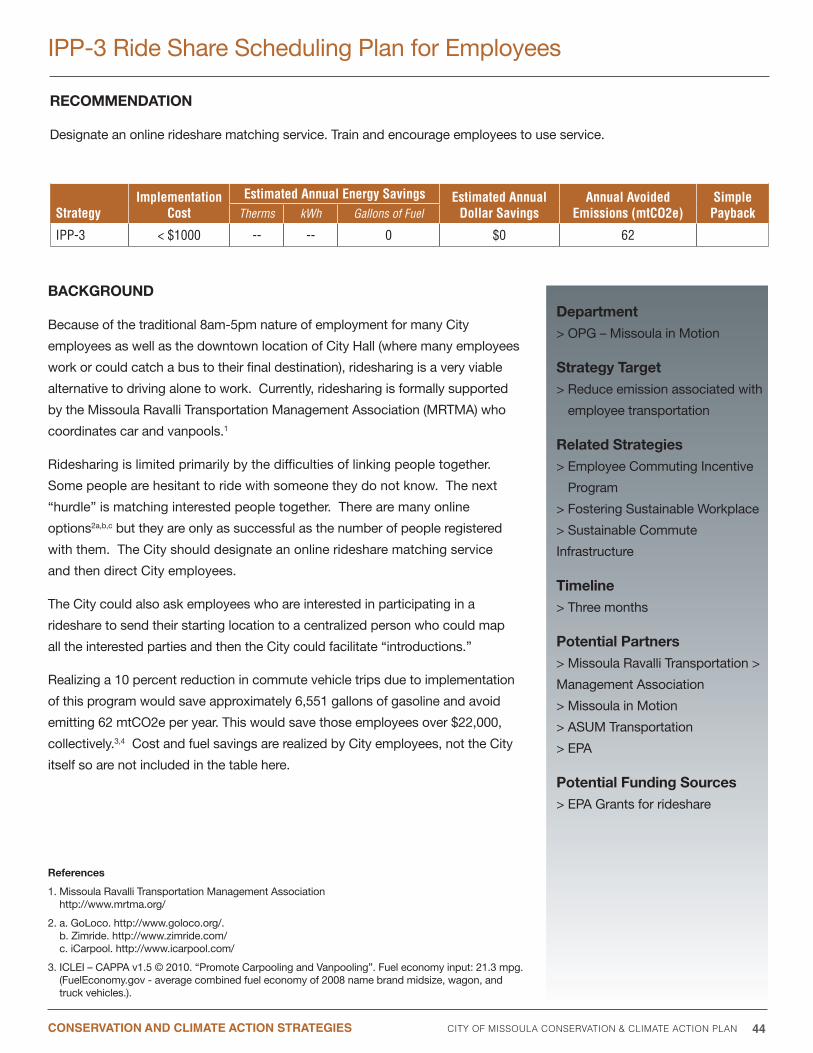
City of missoula Conservation & Climate aCtion Plan 44
StrategyImplementation
CostEstimated Annual Energy Savings Estimated Annual
Dollar SavingsAnnual Avoided
Emissions (mtCO2e)Simple PaybackTherms kWh Gallons of Fuel
IPP-3 < $1000 -- -- 0 $0 62
reCommenDation
Designate an online rideshare matching service. Train and encourage employees to use service.
BaCkGrounD
Because of the traditional 8am-5pm nature of employment for many City
employees as well as the downtown location of City hall (where many employees
work or could catch a bus to their final destination), ridesharing is a very viable
alternative to driving alone to work. Currently, ridesharing is formally supported
by the Missoula Ravalli Transportation Management Association (MRTMA) who
coordinates car and vanpools.1
Ridesharing is limited primarily by the difficulties of linking people together.
Some people are hesitant to ride with someone they do not know. The next
“hurdle” is matching interested people together. There are many online
options2a,b,c but they are only as successful as the number of people registered
with them. The City should designate an online rideshare matching service
and then direct City employees.
The City could also ask employees who are interested in participating in a
rideshare to send their starting location to a centralized person who could map
all the interested parties and then the City could facilitate “introductions.”
Realizing a 10 percent reduction in commute vehicle trips due to implementation
of this program would save approximately 6,551 gallons of gasoline and avoid
emitting 62 mtCO2e per year. This would save those employees over $22,000,
collectively.3,4 Cost and fuel savings are realized by City employees, not the City
itself so are not included in the table here.
references
1. Missoula Ravalli Transportation Management Association http://www.mrtma.org/
2. a. GoLoco. http://www.goloco.org/. b. Zimride. http://www.zimride.com/ c. iCarpool. http://www.icarpool.com/
3. ICLEI – CAPPA v1.5 © 2010. “Promote Carpooling and Vanpooling”. Fuel economy input: 21.3 mpg. (FuelEconomy.gov - average combined fuel economy of 2008 name brand midsize, wagon, and truck vehicles.).
Department> OPG – Missoula in Motion
strategy target > Reduce emission associated with
employee transportation
related strategies> Employee Commuting Incentive
Program
> Fostering Sustainable Workplace
> Sustainable Commute
Infrastructure
timeline> Three months
Potential Partners> Missoula Ravalli Transportation >
Management Association
> Missoula in Motion
> ASUM Transportation
> EPA
Potential funding sources> EPA Grants for rideshare
IPP-3 Ride Share Scheduling Plan for Employees
CONSERVATION AND CLIMATE ACTION STRATEGIES
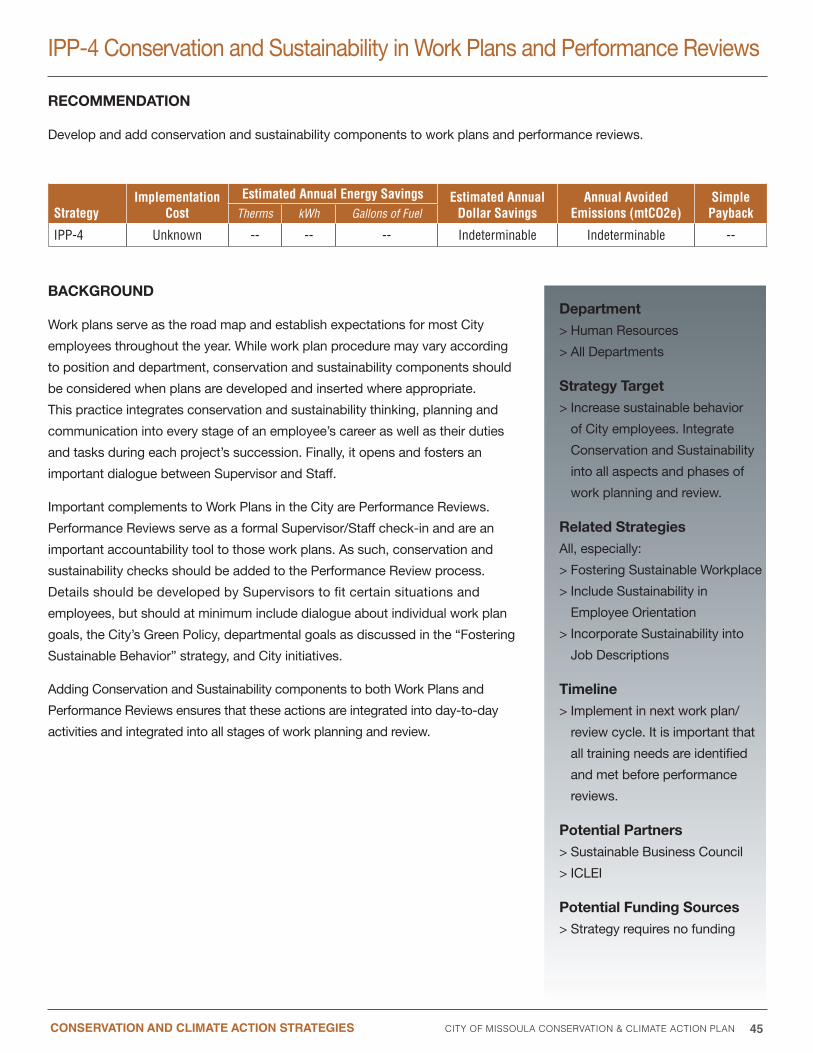
City of missoula Conservation & Climate aCtion Plan 45
StrategyImplementation
CostEstimated Annual Energy Savings Estimated Annual
Dollar SavingsAnnual Avoided
Emissions (mtCO2e)Simple PaybackTherms kWh Gallons of Fuel
IPP-4 Unknown -- -- -- Indeterminable Indeterminable --
reCommenDation
Develop and add conservation and sustainability components to work plans and performance reviews.
BaCkGrounD
Work plans serve as the road map and establish expectations for most City
employees throughout the year. While work plan procedure may vary according
to position and department, conservation and sustainability components should
be considered when plans are developed and inserted where appropriate.
This practice integrates conservation and sustainability thinking, planning and
communication into every stage of an employee’s career as well as their duties
and tasks during each project’s succession. Finally, it opens and fosters an
important dialogue between Supervisor and Staff.
Important complements to Work Plans in the City are Performance Reviews.
Performance Reviews serve as a formal Supervisor/Staff check-in and are an
important accountability tool to those work plans. As such, conservation and
sustainability checks should be added to the Performance Review process.
Details should be developed by Supervisors to fit certain situations and
employees, but should at minimum include dialogue about individual work plan
goals, the City’s Green Policy, departmental goals as discussed in the “Fostering
Sustainable Behavior” strategy, and City initiatives.
Adding Conservation and Sustainability components to both Work Plans and
Performance Reviews ensures that these actions are integrated into day-to-day
activities and integrated into all stages of work planning and review.
IPP-4 Conservation and Sustainability in Work Plans and Performance Reviews
Department> human Resources
> All Departments
strategy target > Increase sustainable behavior
of City employees. Integrate
Conservation and Sustainability
into all aspects and phases of
work planning and review.
related strategiesAll, especially:
> Fostering Sustainable Workplace
> Include Sustainability in
Employee Orientation
> Incorporate Sustainability into
Job Descriptions
timeline> Implement in next work plan/
review cycle. It is important that
all training needs are identified
and met before performance
reviews.
Potential Partners> Sustainable Business Council
> ICLEI
Potential funding sources> Strategy requires no funding
CONSERVATION AND CLIMATE ACTION STRATEGIES
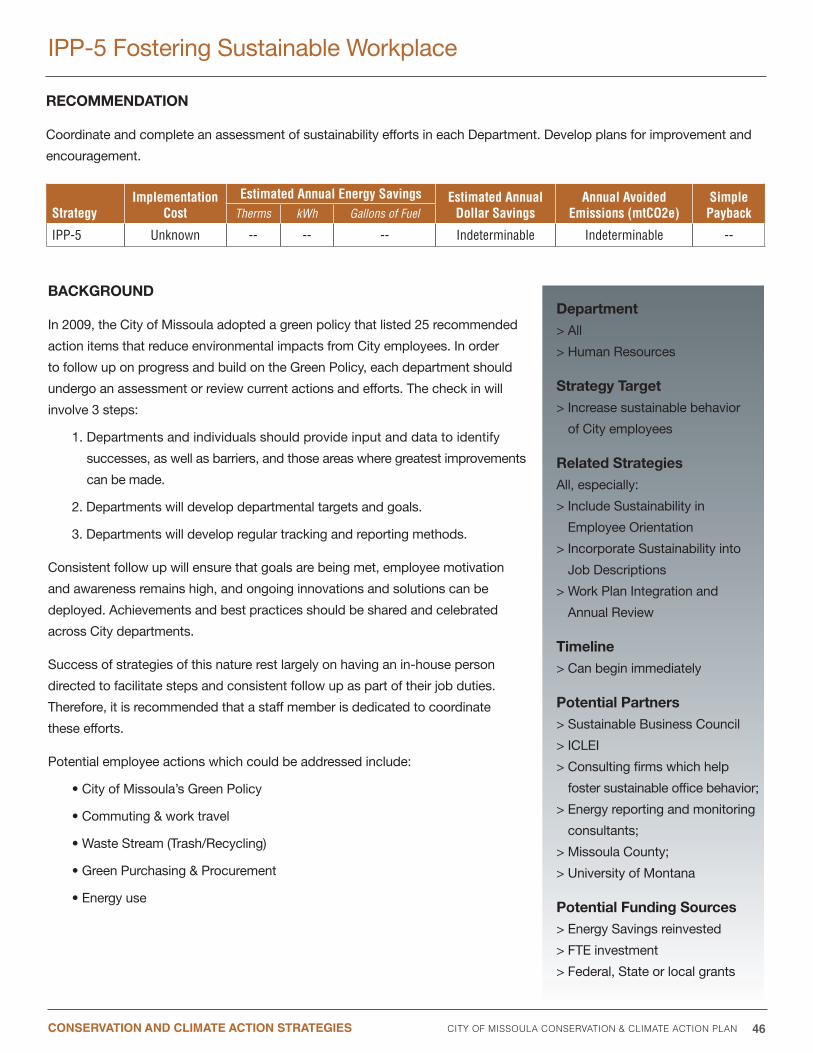
City of missoula Conservation & Climate aCtion Plan 46
StrategyImplementation
CostEstimated Annual Energy Savings Estimated Annual
Dollar SavingsAnnual Avoided
Emissions (mtCO2e)Simple PaybackTherms kWh Gallons of Fuel
IPP-5 Unknown -- -- -- Indeterminable Indeterminable --
reCommenDation
Coordinate and complete an assessment of sustainability efforts in each Department. Develop plans for improvement and
encouragement.
BaCkGrounD
In 2009, the City of Missoula adopted a green policy that listed 25 recommended
action items that reduce environmental impacts from City employees. In order
to follow up on progress and build on the Green Policy, each department should
undergo an assessment or review current actions and efforts. The check in will
involve 3 steps:
1. Departments and individuals should provide input and data to identify
successes, as well as barriers, and those areas where greatest improvements
can be made.
2. Departments will develop departmental targets and goals.
3. Departments will develop regular tracking and reporting methods.
Consistent follow up will ensure that goals are being met, employee motivation
and awareness remains high, and ongoing innovations and solutions can be
deployed. Achievements and best practices should be shared and celebrated
across City departments.
Success of strategies of this nature rest largely on having an in-house person
directed to facilitate steps and consistent follow up as part of their job duties.
Therefore, it is recommended that a staff member is dedicated to coordinate
these efforts.
Potential employee actions which could be addressed include:
• City of Missoula’s Green Policy
• Commuting & work travel
• Waste Stream (Trash/Recycling)
• Green Purchasing & Procurement
• Energy use
IPP-5 Fostering Sustainable Workplace
Department> All
> human Resources
strategy target > Increase sustainable behavior
of City employees
related strategiesAll, especially:
> Include Sustainability in
Employee Orientation
> Incorporate Sustainability into
Job Descriptions
> Work Plan Integration and
Annual Review
timeline> Can begin immediately
Potential Partners> Sustainable Business Council
> ICLEI
> Consulting firms which help
foster sustainable office behavior;
> Energy reporting and monitoring
consultants;
> Missoula County;
> University of Montana
Potential funding sources> Energy Savings reinvested
> FTE investment
> Federal, State or local grants
CONSERVATION AND CLIMATE ACTION STRATEGIES

City of missoula Conservation & Climate aCtion Plan 47
StrategyImplementation
CostEstimated Annual Energy Savings Estimated Annual
Dollar SavingsAnnual Avoided
Emissions (mtCO2e)Simple PaybackTherms kWh Gallons of Fuel
IPP-6 Unknown -- -- -- Indeterminable Indeterminable --
reCommenDation
Develop and add conservation and sustainability components to all job descriptions.
BaCkGrounD
Fostering sustainable behavior in City offices can be made easier by ensuring
that new employees already have such knowledge. Including conservation
and sustainability components to job descriptions is already a growing trend in
businesses large and small.1 One company, Clean Clothes, Inc., “start(s) at the
beginning by screening new employees for their knowledge about organics and
organic cotton. As a result, they have a corporate culture that attracts employees
who are environmentally aware.”1 In addition, current employees’ job descriptions
will be updated as part of the Work Plan Integration and Annual Review strategy.
Developing and adding conservation and sustainability components to job
descriptions will increase the likelihood that the City employees will participate in
existing and ongoing efforts to reduce costs and environmental impact. “Engaged
employees are a business’ prime resource in cutting costs and finding innovative
ways to reduce the firm’s environmental and social impacts.”1
references
1. Woofter, Jennifer. “how to Approach Employee Education on Sustainability.” 2009. http://sustainabilityconsulting.wordpress.com/2009/04/08/resources-how-to-approach-employee-education-on-sustainability/
IPP-6 Include Conservation and Sustainability in Job Descriptions
Department> human Resources
> All
strategy target > Support and strengthen the
commitment to sustainability
in City offices
related strategiesAll, especially:
> Fostering Sustainable Workplace
> Sustainability in Employee
Orientation
> Work Plan Integration and
Annual Review.
timeline> Can begin immediately,
and update future position
descriptions on an on-going
basis
Potential Partners> None identified.
Potential funding sources> Strategy has no cost.
CONSERVATION AND CLIMATE ACTION STRATEGIES
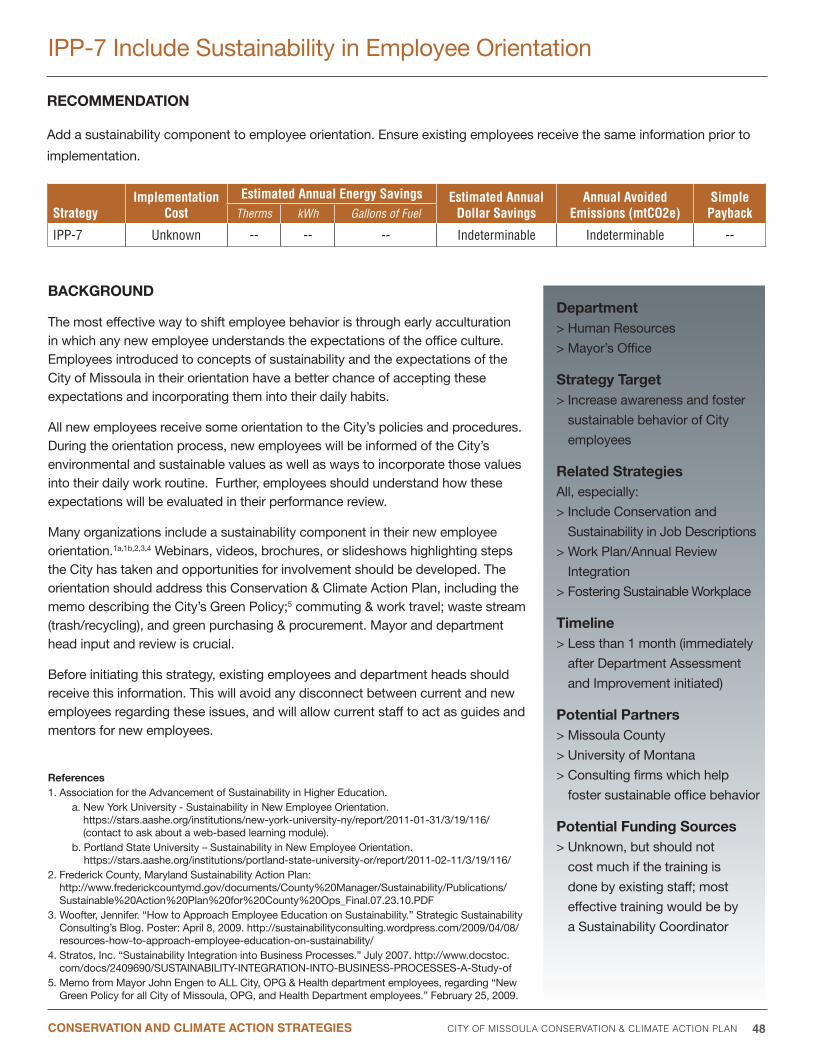
City of missoula Conservation & Climate aCtion Plan 48
StrategyImplementation
CostEstimated Annual Energy Savings Estimated Annual
Dollar SavingsAnnual Avoided
Emissions (mtCO2e)Simple PaybackTherms kWh Gallons of Fuel
IPP-7 Unknown -- -- -- Indeterminable Indeterminable --
reCommenDation
Add a sustainability component to employee orientation. Ensure existing employees receive the same information prior to
implementation.
BaCkGrounD
The most effective way to shift employee behavior is through early acculturation in which any new employee understands the expectations of the office culture. Employees introduced to concepts of sustainability and the expectations of the City of Missoula in their orientation have a better chance of accepting these expectations and incorporating them into their daily habits.
All new employees receive some orientation to the City’s policies and procedures. During the orientation process, new employees will be informed of the City’s environmental and sustainable values as well as ways to incorporate those values into their daily work routine. Further, employees should understand how these expectations will be evaluated in their performance review.
Many organizations include a sustainability component in their new employee orientation.1a,1b,2,3,4 Webinars, videos, brochures, or slideshows highlighting steps the City has taken and opportunities for involvement should be developed. The orientation should address this Conservation & Climate Action Plan, including the memo describing the City’s Green Policy;5 commuting & work travel; waste stream (trash/recycling), and green purchasing & procurement. Mayor and department head input and review is crucial.
Before initiating this strategy, existing employees and department heads should receive this information. This will avoid any disconnect between current and new employees regarding these issues, and will allow current staff to act as guides and mentors for new employees.
references1. Association for the Advancement of Sustainability in higher Education.
a. New york University - Sustainability in New Employee Orientation. https://stars.aashe.org/institutions/new-york-university-ny/report/2011-01-31/3/19/116/ (contact to ask about a web-based learning module).
b. Portland State University – Sustainability in New Employee Orientation. https://stars.aashe.org/institutions/portland-state-university-or/report/2011-02-11/3/19/116/
2. Frederick County, Maryland Sustainability Action Plan: http://www.frederickcountymd.gov/documents/County%20Manager/Sustainability/Publications/Sustainable%20Action%20Plan%20for%20County%20Ops_Final.07.23.10.PDF
3. Woofter, Jennifer. “how to Approach Employee Education on Sustainability.” Strategic Sustainability Consulting’s Blog. Poster: April 8, 2009. http://sustainabilityconsulting.wordpress.com/2009/04/08/resources-how-to-approach-employee-education-on-sustainability/
4. Stratos, Inc. “Sustainability Integration into Business Processes.” July 2007. http://www.docstoc.com/docs/2409690/SUSTAINABILITy-INTEGRATION-INTO-BUSINESS-PROCESSES-A-Study-of
5. Memo from Mayor John Engen to ALL City, OPG & health department employees, regarding “New Green Policy for all City of Missoula, OPG, and health Department employees.” February 25, 2009.
IPP-7 Include Sustainability in Employee Orientation
Department> human Resources
> Mayor’s Office
strategy target > Increase awareness and foster
sustainable behavior of City
employees
related strategiesAll, especially:
> Include Conservation and
Sustainability in Job Descriptions
> Work Plan/Annual Review
Integration
> Fostering Sustainable Workplace
timeline> Less than 1 month (immediately
after Department Assessment
and Improvement initiated)
Potential Partners> Missoula County
> University of Montana
> Consulting firms which help
foster sustainable office behavior
Potential funding sources> Unknown, but should not
cost much if the training is
done by existing staff; most
effective training would be by
a Sustainability Coordinator
CONSERVATION AND CLIMATE ACTION STRATEGIES

City of missoula Conservation & Climate aCtion Plan 49
StrategyImplementation
CostEstimated Annual Energy Savings Estimated Annual
Dollar SavingsAnnual Avoided
Emissions (mtCO2e)Simple PaybackTherms kWh Gallons of Fuel
IPP-8 Unknown -- -- -- Indeterminable Indeterminable --
reCommenDation
Adopt a formal “Green” Purchasing plan for the City. Establish a system to track products and savings. Inform other
departments with regular reports.
BaCkGrounD
The City of Missoula purchases a large volume of products each year.
Establishing a comprehensive green purchasing or environmentally preferable
purchasing plan for city departments can identify and reduce the environmental
impact of purchases and maximize resource efficiency.1a,b A green purchasing
policy allows the city to set standards for purchasing that take into account
social equity, environmental harm and fiscal criteria. In addition to the cost and
energy benefits, adopting an environmentally preferable purchasing plan or green
purchasing policy would demonstrate the City’s commitment to sustainability.
An environmentally preferable product is one “that has a reduced negative effect
or increased positive effect on human health and the environment when compared
with competing products that serve the same purpose.”1b
This takes into consideration factors such as packaging, raw materials, recycled
content, energy efficiency, locality of business, etc.1b,2 The Policy should be all
inclusive, covering any and all items that the City purchases. This includes: electronics
such as computers and printers/copiers, office supplies such as pens and paper, and
other items such as water coolers and furniture. This has the potential to:
• Reduce hazardous materials management costs (e.g. using less-toxic products)
• Reduce operational costs (energy savings from efficient equipment)
• Reduce disposal costs (hazardous and solid waste) by generating less
waste and using longer lasting products
• Reduce repair and replacement costs when using more durable and
more repairable equipment
• Reduce employee safety and health costs at the facility (and liability) by
improving the work environment and minimizing risks to workers
• Reduce material and energy consumption
IPP-8 Green Purchasing Policy
Department> All
> IT Department, to help establish
central repository
strategy target > Reduce contribution to
secondary impacts
related strategies> Paper and Printing Policy
> Fostering Sustainable Workplace
> Work Plan Integration/Annual
Review
timeline> 1 year, for research on products
and adoption of policy before
implementation
Potential Partners> Missoula Office City
> Other local office supply
businesses
Potential funding sources> Self-funded through energy
savings
CONSERVATION AND CLIMATE ACTION STRATEGIES

City of missoula Conservation & Climate aCtion Plan 50
The City of Missoula does not have one central ordering
location for all departments to use, so sharing of information
will be essential to a successful implementation of this
strategy. Establishing a central repository for information,
potentially web based, would allow easy access for all
departments and staff.
Savings and avoided emissions vary greatly with types of
product and the degree to which they are implemented, so
estimates are not made here.
IPP-8 Green Purchasing Policy Continued
references
1. ResponsiblePurchasing.org.
a. City of Berkeley. Green Purchasing Policy. 2004. http://www.responsiblepurchasing.org/UserFiles/File/Ofice%20Electronics/Policies/City_of_Berkeley_CA_Green_Purchasing_Policy_2004.pdf
b. City of Seattle. Sustainable Purchasing Policy. 2003. http://www.responsiblepurchasing.org/UserFiles/File/Computers/Policies/Seattle_Purchasing_policy_2003.pdf
2. City of Portland. Sustainable Procurement Policy. September 2010 Update. http://www.portlandonline.com/shared/cfm/image.cfm?id=204110
CONSERVATION AND CLIMATE ACTION STRATEGIES

City of missoula Conservation & Climate aCtion Plan 51
IPP-8 Green Purchasing Policy Continued
StrategyImplementation
CostEstimated Annual Energy Savings Estimated Annual
Dollar SavingsAnnual Avoided
Emissions (mtCO2e)Simple PaybackTherms kWh Gallons of Fuel
IPP-9 $43,50010 4,7609 213,9509 -- $25,4389 1199 < 2
reCommenDation
Create and adopt a policy that all future City of Missoula new construction and major renovation building projects attain
Leadership in Energy and Environmental Design (LEED) certification. The policy should include a minimum level of LEED
certification over a certain square footage or cost.
BaCkGrounD
In 2000, the U.S. Green Building Council (USGBC) established the LEED® green
building rating system as a way to define and measure green buildings. LEED is an
internationally recognized green building certification system, providing third-party
verification that measures how well a building or community performs across
established metrics.1 Green facilities save tax-payer dollars, reduce resource
consumption and greenhouse gases, and create demand for local green products
and services.2
LEED for New Construction and Major Renovation certification is designed to guide
and distinguish high-performance commercial and institutional projects. It certifies
the design and construction activities of both new buildings and major renovations
to existing buildings (affecting over 50 percent of the building).3 When included
in the pre-project planning and budgeting stages, green building designs can be
included while remaining within the original budget, and often for less (excluding
additional certification and documentation costs).8,9,10 If the renovation scope
does not involve significant design and construction activities, such as envelope
modifications or total interior reconstruction, LEED for Existing Buildings: Operation
& Maintenance certification will be the more appropriate rating system.3
In comparison to the average commercial building:
• Green buildings use 26% less energy
• Green buildings have 13% lower maintenance costs
• Green buildings have 27% higher occupant satisfaction
• Green buildings have 33% less greenhouse gas emissions4
Important Facts:
• Buildings account for 39% of the CO2 emissions per year, more than either
the transportation (33%) or the industrial fields (29%).
• In comparison to the national building stock, the average LEED certified
building uses 24% less electricity and saves 13.86 million metric tons of
CO2 emissions annually.5
IPP-9 LEED for New Construction and Major Renovations Policy
Department> Facilities Maintenance
> Finance
> Administrative Leadership Team
> All departments and staff as
necessary
strategy target > Increase energy efficiency
> Conserve water
> Reduce waste
> Use environmentally responsible
products
> Contribute to building occupant
and visitor health
> Create demand for local green
products and services
> Reduce Greenhouse Gas
Emissions
> Reduce Operations and
Maintenance Costs
related strategies> LEED EBOM Policy
> Numerous MCCAP strategies
across all working groups
timeline> 6 months
Potential Partners> U.S. Green Building Council
Potential funding sources> No funding need for policy
creation
CONSERVATION AND CLIMATE ACTION STRATEGIES
City of missoula Conservation & Climate aCtion Plan 52
Why Build Green in the Public Sector?
Lead by Example. Promote local market transformation
by using best practices in construction, operation and
maintenance of government owned or leased buildings.
Reduce Operations and Maintenance Costs Over the Life
of a Building. Energy and water efficient design paired
with green operations practices reduce operations and
maintenance costs over the entire life of the building.
Extend Infrastructure Capacity. Green buildings lessen the
demands on infrastructure through waste and stormwater
management efforts.
Reduce Staff-related Overhead and Relocation Costs.
Improved indoor air quality, natural light and flexible design
can contribute positively to staff satisfaction and productivity,
reduce absenteeism, improve employee retention and reduce
the costs associated with employee relocation.6
LEED is a useful public policy tool as outlined below. Many
LEED rating systems can complement existing state and
local green building policies and initiatives.
• LEED is transparent and reduces technical and
administrative uncertainties.
• LEED saves time and resources by providing a
comprehensive set of tools for application and use.
• LEED provides a consistent tool for quantifying and
benchmarking green building program outcomes.
• Third-party certification through GBCI avoids the need
to establish local certification bodies.
• LEED is revised regularly to continually improve
performance thresholds and to stay current with
changes in building technologies and markets.
• Government entities can participate in and influence the
development of LEED through membership in USGBC.7
It should be noted that adding new buildings inherently
increases the City’s greenhouse gas footprint, unless the
buildings are designed to have net-zero emissions. Thus,
this strategy will not directly reduce the City’s current
emissions. One of the many benefits of a LEED certification
is that certified buildings emit less greenhouse gases
than non-certified buildings. As such, emissions from this
strategy are better described as “avoided” emissions as
opposed to “reduced” emissions.
references
1. http://www.usgbc.org/ShowFile.aspx?DocumentID=5486. Roadmap to Green Government Buildings. U.S. Green Building Council, Inc. (USGBC). Page 3-4.
2. http://www.usgbc.org/ShowFile.aspx?DocumentID=5486. Roadmap to Green Government Buildings. U.S. Green Building Council, Inc. (USGBC). Page 2.
3. http://www.usgbc.org/ShowFile.aspx?DocumentID=5486. Roadmap to Green Government Buildings. U.S. Green Building Council, Inc. (USGBC). Page 14.
4. http://www.usgbc.org/ShowFile.aspx?DocumentID=5486. Roadmap to Green Government Buildings. U.S. Green Building Council, Inc. (USGBC). Page 3.
5. http://www.usgbc.org/ShowFile.aspx?DocumentID=5486. Roadmap to Green Government Buildings. U.S. Green Building Council, Inc. (USGBC). Page 8.
6. http://www.usgbc.org/ShowFile.aspx?DocumentID=5486. Roadmap to Green Government Buildings. U.S. Green Building Council, Inc. (USGBC). Page 3.
7. http://www.usgbc.org/ShowFile.aspx?DocumentID=5486. Roadmap to Green Government Buildings. U.S. Green Building Council, Inc. (USGBC). Page 16.
8. http://www.usgbc.org/ShowFile.aspx?DocumentID=5486. Roadmap to Green Government Buildings. .S. Green Building Council, Inc. (USGBC). Page 25.
9. ICLEI - CAPPA v1.5 © 2010. “Green Building.” Assumes 25% savings in both electricity and natural gas. The estimated savings shown are for City hall, which is approximately 55,000 sq. ft.
10. Nusca, Andrew “LEED Certification: What it costs” SmartPlanet.com. The value shown in the table is for registration/certification and compliance costs only, but does not include documentation costs which represent staff/consultant time. As noted in the background, additional construction costs are minimal, and often less expensive when included early in the planning process.8,9 http://www.smartplanet.com/blog/smart-takes/leed-certification-what-it-costs/7973.
IPP-9 LEED for New Construction and Major Renovations Policy Continued
CONSERVATION AND CLIMATE ACTION STRATEGIES
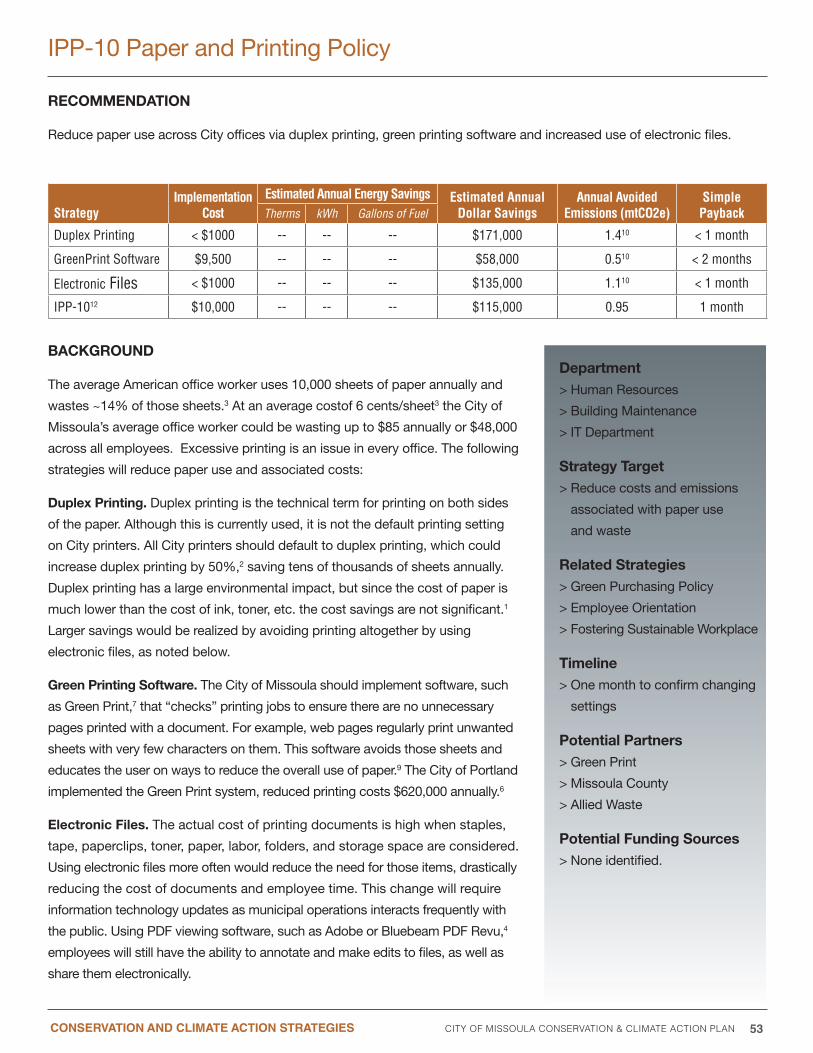
City of missoula Conservation & Climate aCtion Plan 53
reCommenDation
Reduce paper use across City offices via duplex printing, green printing software and increased use of electronic files.
BaCkGrounD
The average American office worker uses 10,000 sheets of paper annually and
wastes ~14% of those sheets.3 At an average costof 6 cents/sheet3 the City of
Missoula’s average office worker could be wasting up to $85 annually or $48,000
across all employees. Excessive printing is an issue in every office. The following
strategies will reduce paper use and associated costs:
Duplex Printing. Duplex printing is the technical term for printing on both sides
of the paper. Although this is currently used, it is not the default printing setting
on City printers. All City printers should default to duplex printing, which could
increase duplex printing by 50%,2 saving tens of thousands of sheets annually.
Duplex printing has a large environmental impact, but since the cost of paper is
much lower than the cost of ink, toner, etc. the cost savings are not significant.1
Larger savings would be realized by avoiding printing altogether by using
electronic files, as noted below.
Green Printing software. The City of Missoula should implement software, such
as Green Print,7 that “checks” printing jobs to ensure there are no unnecessary
pages printed with a document. For example, web pages regularly print unwanted
sheets with very few characters on them. This software avoids those sheets and
educates the user on ways to reduce the overall use of paper.9 The City of Portland
implemented the Green Print system, reduced printing costs $620,000 annually.6
electronic files. The actual cost of printing documents is high when staples,
tape, paperclips, toner, paper, labor, folders, and storage space are considered.
Using electronic files more often would reduce the need for those items, drastically
reducing the cost of documents and employee time. This change will require
information technology updates as municipal operations interacts frequently with
the public. Using PDF viewing software, such as Adobe or Bluebeam PDF Revu,4
employees will still have the ability to annotate and make edits to files, as well as
share them electronically.
IPP-10 Paper and Printing Policy
Department> human Resources
> Building Maintenance
> IT Department
strategy target > Reduce costs and emissions
associated with paper use
and waste
related strategies> Green Purchasing Policy
> Employee Orientation
> Fostering Sustainable Workplace
timeline> One month to confirm changing
settings
Potential Partners> Green Print
> Missoula County
> Allied Waste
Potential funding sources> None identified.
StrategyImplementation
CostEstimated Annual Energy Savings Estimated Annual
Dollar SavingsAnnual Avoided
Emissions (mtCO2e)Simple PaybackTherms kWh Gallons of Fuel
Duplex Printing < $1000 -- -- -- $171,000 1.410 < 1 month
GreenPrint Software $9,500 -- -- -- $58,000 0.510 < 2 months
Electronic Files < $1000 -- -- -- $135,000 1.110 < 1 month
IPP-1012 $10,000 -- -- -- $115,000 0.95 1 month
CONSERVATION AND CLIMATE ACTION STRATEGIES

City of missoula Conservation & Climate aCtion Plan 54
ink efficient fonts. Using certain font types can save large amounts of
money by conserving ink and toner use. EcoFont, for example, boasts 28%
savings in printer and toner use11 by including unnoticeable white dots in the
font to reduce the amount of ink needed in each character.
Paper recycling. The City of Missoula recycles office paper. however, the
City could improve the rate of paper recycling. The average office employee
discards 1.5 pounds of paper daily,8 or 97.5 tons annually for the City of
Missoula. This is equivalent to 1,600 trees or 18.8 million tons of air pollution
mitigated. Improving the rate of recycling would make a significant dent in
reducing waste from City operations. Presently, workers must take paper
from their workstations to centralized recycling locations. Reducing the
distance to recycling locations is an effective means of improving the rate
of recycling.5 Other measures include additional signage and employee
orientation for recycling.
references
1. University of Iowa. Duplex Printing Information: http://its.uiowa.edu/apps2/support/article/437
2. Rutgers University. Printing Conservation Program. http://www.nbcs.rutgers.edu/ccf/main/print/transition.php
3. Electronic files Management (pdf slideshow with background savings data): http://www.atlantaarma.org/userfiles/file/Going%20Green-%20Electronic%20Records%20Management%2010-14%20(2).pdf
4. Bluebeam PDF Revu. http://www.bluebeam.com/us/solutions/case-studies/grant-thornton.asp
5. Makower, Joel. “Between the Sheets: Taking the Wrinkles Out of Paper Recycling.” http://environment.about.com/od/recycling/a/officepaper.htm
6. hilkevitch, Jon, “To use less paper, Chicago transportation officials spend green on GreenPrint.” August 2010, Chicago Tribune. http://articles.chicagotribune.com/2010-08-10/news/ct-met-green-print-cdot-20100810_1_print-job-greenprint-technologies-cdot
7. GreenPrint. http://www.printgreener.com/
8. Lane County Public Works Waste Management Division. “Recycler’s Guide to The Glenwood Central Receiving Station.” July 2011. http://www.lanecounty.org/Departments/PW/WMD/Recycle/Documents/GlenwoodCentralReceiving.pdf
9. McCool, Caitlin. “how to Reduce Printing Costs by 17%: A guide to Doing Well and Doing Good by Printing Less”. GreenPrint Technologies White Paper. September 2008.
10. Calculations demonstrate the amount of carbon that would have been sequestered had the trees not been cut down and used to make paper. References: USE EPA: http://www.epa.gov/cleanenergy/energy-resources/refs.html and ConserveATree.org: http://conservatree.org/learn/EnviroIssues/TreeStats.shtml.
11. EcoFont.com http://www.ecofont.com/en/help/ecofont/faq/0030.html
a. Example test page: http://www.ecofont.com/assets/files/ecofontsans/EcofontSans-Example.pdf
12. Implementation cost is the total estimated cost for all three listed costs. The annual dollar savings and estimated avoided emissions presented in this row of the table are the mean of the highest and lowest estimates.
IPP-10 Paper and Printing Policy Continued
CONSERVATION AND CLIMATE ACTION STRATEGIES
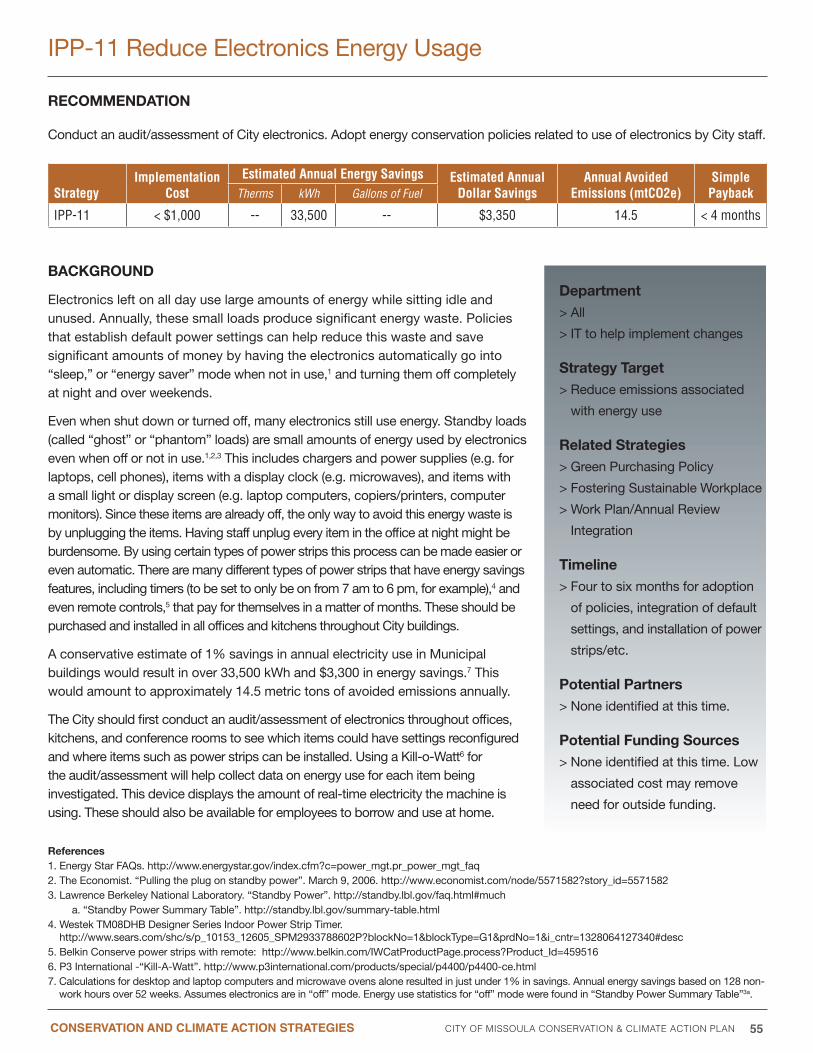
City of missoula Conservation & Climate aCtion Plan 55
StrategyImplementation
CostEstimated Annual Energy Savings Estimated Annual
Dollar SavingsAnnual Avoided
Emissions (mtCO2e)Simple PaybackTherms kWh Gallons of Fuel
IPP-11 < $1,000 -- 33,500 -- $3,350 14.5 < 4 months
reCommenDation
Conduct an audit/assessment of City electronics. Adopt energy conservation policies related to use of electronics by City staff.
BaCkGrounD
Electronics left on all day use large amounts of energy while sitting idle and unused. Annually, these small loads produce significant energy waste. Policies that establish default power settings can help reduce this waste and save significant amounts of money by having the electronics automatically go into “sleep,” or “energy saver” mode when not in use,1 and turning them off completely at night and over weekends.
Even when shut down or turned off, many electronics still use energy. Standby loads (called “ghost” or “phantom” loads) are small amounts of energy used by electronics even when off or not in use.1,2,3 This includes chargers and power supplies (e.g. for laptops, cell phones), items with a display clock (e.g. microwaves), and items with a small light or display screen (e.g. laptop computers, copiers/printers, computer monitors). Since these items are already off, the only way to avoid this energy waste is by unplugging the items. having staff unplug every item in the office at night might be burdensome. By using certain types of power strips this process can be made easier or even automatic. There are many different types of power strips that have energy savings features, including timers (to be set to only be on from 7 am to 6 pm, for example),4 and even remote controls,5 that pay for themselves in a matter of months. These should be purchased and installed in all offices and kitchens throughout City buildings.
A conservative estimate of 1% savings in annual electricity use in Municipal buildings would result in over 33,500 kWh and $3,300 in energy savings.7 This would amount to approximately 14.5 metric tons of avoided emissions annually.
The City should first conduct an audit/assessment of electronics throughout offices, kitchens, and conference rooms to see which items could have settings reconfigured and where items such as power strips can be installed. Using a Kill-o-Watt6 for the audit/assessment will help collect data on energy use for each item being investigated. This device displays the amount of real-time electricity the machine is using. These should also be available for employees to borrow and use at home.
IPP-11 Reduce Electronics Energy Usage
Department> All
> IT to help implement changes
strategy target > Reduce emissions associated
with energy use
related strategies> Green Purchasing Policy
> Fostering Sustainable Workplace
> Work Plan/Annual Review
Integration
timeline> Four to six months for adoption
of policies, integration of default
settings, and installation of power
strips/etc.
Potential Partners> None identified at this time.
Potential funding sources> None identified at this time. Low
associated cost may remove
need for outside funding.
references1. Energy Star FAQs. http://www.energystar.gov/index.cfm?c=power_mgt.pr_power_mgt_faq2. The Economist. “Pulling the plug on standby power”. March 9, 2006. http://www.economist.com/node/5571582?story_id=55715823. Lawrence Berkeley National Laboratory. “Standby Power”. http://standby.lbl.gov/faq.html#much
a. “Standby Power Summary Table”. http://standby.lbl.gov/summary-table.html4. Westek TM08DhB Designer Series Indoor Power Strip Timer.
http://www.sears.com/shc/s/p_10153_12605_SPM2933788602P?blockNo=1&blockType=G1&prdNo=1&i_cntr=1328064127340#desc5. Belkin Conserve power strips with remote: http://www.belkin.com/IWCatProductPage.process?Product_Id=4595166. P3 International -“Kill-A-Watt”. http://www.p3international.com/products/special/p4400/p4400-ce.html7. Calculations for desktop and laptop computers and microwave ovens alone resulted in just under 1% in savings. Annual energy savings based on 128 non-
work hours over 52 weeks. Assumes electronics are in “off” mode. Energy use statistics for “off” mode were found in “Standby Power Summary Table”3a.
CONSERVATION AND CLIMATE ACTION STRATEGIES
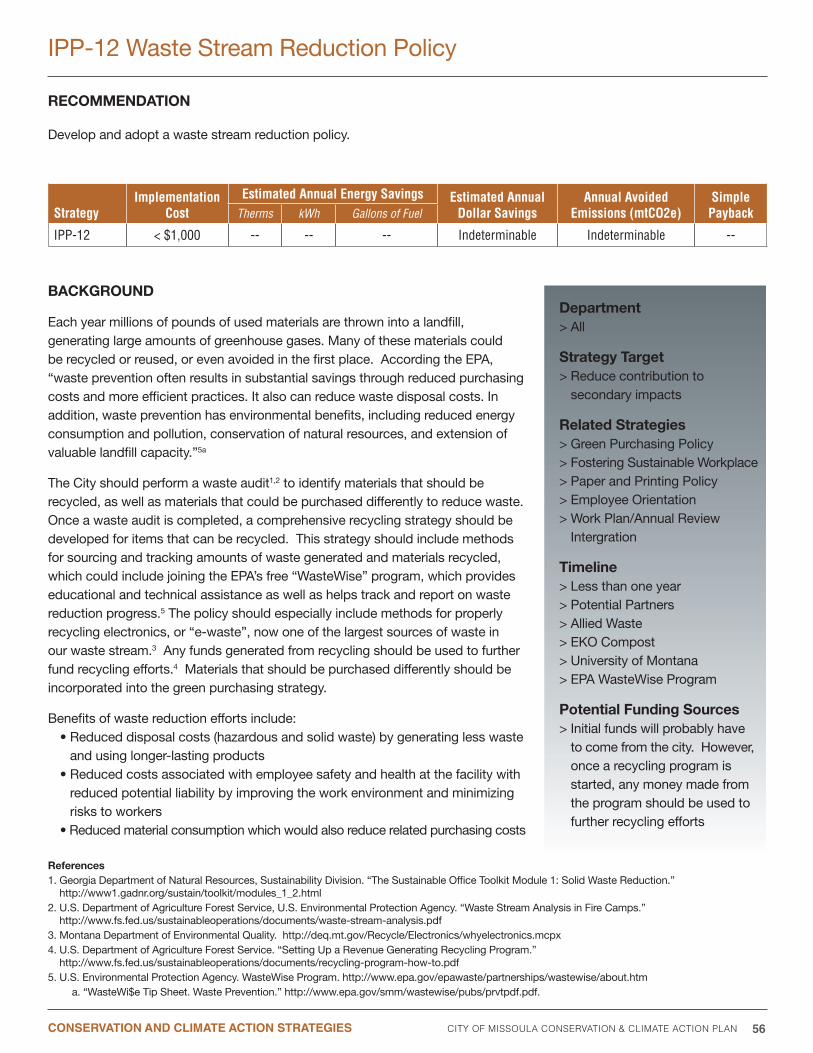
City of missoula Conservation & Climate aCtion Plan 56
StrategyImplementation
CostEstimated Annual Energy Savings Estimated Annual
Dollar SavingsAnnual Avoided
Emissions (mtCO2e)Simple PaybackTherms kWh Gallons of Fuel
IPP-12 < $1,000 -- -- -- Indeterminable Indeterminable --
reCommenDation
Develop and adopt a waste stream reduction policy.
BaCkGrounD
Each year millions of pounds of used materials are thrown into a landfill, generating large amounts of greenhouse gases. Many of these materials could be recycled or reused, or even avoided in the first place. According the EPA, “waste prevention often results in substantial savings through reduced purchasing costs and more efficient practices. It also can reduce waste disposal costs. In addition, waste prevention has environmental benefits, including reduced energy consumption and pollution, conservation of natural resources, and extension of valuable landfill capacity.”5a
The City should perform a waste audit1,2 to identify materials that should be recycled, as well as materials that could be purchased differently to reduce waste. Once a waste audit is completed, a comprehensive recycling strategy should be developed for items that can be recycled. This strategy should include methods for sourcing and tracking amounts of waste generated and materials recycled, which could include joining the EPA’s free “WasteWise” program, which provides educational and technical assistance as well as helps track and report on waste reduction progress.5 The policy should especially include methods for properly recycling electronics, or “e-waste”, now one of the largest sources of waste in our waste stream.3 Any funds generated from recycling should be used to further fund recycling efforts.4 Materials that should be purchased differently should be incorporated into the green purchasing strategy.
Benefits of waste reduction efforts include: • Reduced disposal costs (hazardous and solid waste) by generating less waste
and using longer-lasting products• Reduced costs associated with employee safety and health at the facility with
reduced potential liability by improving the work environment and minimizing risks to workers
• Reduced material consumption which would also reduce related purchasing costs
IPP-12 Waste Stream Reduction Policy
Department> All
strategy target > Reduce contribution to
secondary impacts
related strategies> Green Purchasing Policy> Fostering Sustainable Workplace> Paper and Printing Policy> Employee Orientation> Work Plan/Annual Review
Intergration
timeline> Less than one year> Potential Partners> Allied Waste> EKO Compost> University of Montana> EPA WasteWise Program
Potential funding sources> Initial funds will probably have
to come from the city. however, once a recycling program is started, any money made from the program should be used to further recycling efforts
references1. Georgia Department of Natural Resources, Sustainability Division. “The Sustainable Office Toolkit Module 1: Solid Waste Reduction.”
http://www1.gadnr.org/sustain/toolkit/modules_1_2.html2. U.S. Department of Agriculture Forest Service, U.S. Environmental Protection Agency. “Waste Stream Analysis in Fire Camps.”
http://www.fs.fed.us/sustainableoperations/documents/waste-stream-analysis.pdf3. Montana Department of Environmental Quality. http://deq.mt.gov/Recycle/Electronics/whyelectronics.mcpx4. U.S. Department of Agriculture Forest Service. “Setting Up a Revenue Generating Recycling Program.”
http://www.fs.fed.us/sustainableoperations/documents/recycling-program-how-to.pdf5. U.S. Environmental Protection Agency. WasteWise Program. http://www.epa.gov/epawaste/partnerships/wastewise/about.htm
a. “WasteWi$e Tip Sheet. Waste Prevention.” http://www.epa.gov/smm/wastewise/pubs/prvtpdf.pdf.
CONSERVATION AND CLIMATE ACTION STRATEGIES

City of missoula Conservation & Climate aCtion Plan 57
workinG GrouP memBers
Bryan von lossberg, Alternative Energy
Resources Organization (Working Group Chair)
Brian kearns, University of Montana
Greg howard, Watershed Consulting, LLC
Jeff Crouch, CTA Architects
molly white, ClearSky Climate Solutions
ross keogh, Sagebrush Energy
Renewable energy reduces the amount of emissions associated with fossil fuel sources. Combining the use of Renewable
Energy with conservation, efficiency, and staff practices will amplify their effectiveness.
Renewable Energy strategies focus on using energy from renewable, domestic sources and utilize innovative technology
such as solar photovoltaic, solar thermal systems, and methane recovery and reuse to augment a portion of the City’s
operational energy needs. Renewable energy is already being utilized by the City and as costs drop and new technologies
are developed, new opportunities will be available to expand the use renewable systems to generate the City’s energy.
Strategies also focus on sequestration of greenhouse gases, through activities that absorb carbon dioxide and other
greenhouse gases from the atmosphere. Finally, these strategies address Offsets. The City recognizes that in order to
reach carbon neutrality, Carbon Offsets must play a role in the future. however, current Offset options are being considered
only in our long-term strategy.
renewable energy and offsets Completed actions
Table 3-6 below lists actions already taken by the City within the scope of the Renewable Energy and Offsets working
group categories. It is important to recognize these projects and programs and they be kept in place as we pursue greater
reductions in operational costs, energy use, and emissions.
Table 3-6 Renewable Energy and Offsets Completed ActionsAction Year Implemented4.8 kW Solar PV Array Installed on Fire Station #4 2001Methane Capture and Use at Missoula Wastewater Treatment Plant (WWTP) 20022.1 kW Solar PV Array Installed on City Hall 2005Solar Hot Water Heater Installed on Fire Station #2 200512.96 kW Solar PV Array Installed on Fire Station #2 2009Poplar Tree Pilot Project at Wastewater Treatment Plant 2009Resolution 7398: City Sponsored Renewable Energy Certificates Program ("Green Power Missoula") 2009
renewaBle enerGy anD offsets workinG GrouP
CONSERVATION AND CLIMATE ACTION STRATEGIES

City of missoula Conservation & Climate aCtion Plan 58
renewable energy and offsets strategies
Table 3-7 below summarizes the Renewable Energy and Offsets working group strategies. Further details are described
in the narratives below.
Table 3-7: Renewable Energy and Offsets Strategies
StrategyImplementation
CostEst. Annual
Dollar SavingsAnnual Avoided
Emissions (mtCO2e)Simple
Payback (yrs)
rEnEwAblE EnErgY
REO-1 Expand Methane Capture at WWTP $300k - $1,000,000 $55,357 259.7 5-18REO-2 Micro-hydropower Electricity Generation
at the WWTP < $100,000 $10,000 43 10
REO-3 Solar PV Installations on Municipal Buildings $1,100,000 $39,000 168.5 28REO-4 Solar Thermal Heating System and Thermal
Pool Blanket at Splash Montana and Similar Energy Efficiency Improvements at Currents
$515,000 $33,600 224 15-16
OFFSEtS
REO-5 Carbon Offset Development $10,000-$250,000 per project -- -- --
REO-6 Carbon Offset Purchasing $69,240 / $167,907 $0 11,540 / 4,836 n/a
CArbOn SEquEStrAtIOn
REO-7 Missoula Open Space Portfolio $237,000 -- 57.99 UnknownREO-8 Poplar Plantation near Wastewater
Treatment Plant $797,000 -- 240.73-924.33 Unknown
REO-9 Urban Tree Planting and Maintenance $44,000-$57,000 $4,750 20.8 9-12
CONSERVATION AND CLIMATE ACTION STRATEGIES
“Parks and Recreation is committed to continually improving and evaluating our processes, systems and training as we work to provide our citizens with sustainably maintained spaces for active, healthy lifestyles. Through parks, trails, open spaces and recreation programs, citizens can enjoy the many benefits of green infrastructure. These benefits range from enhanced personal and mental health, to community economic vitality, to important connections with nature.
– DONNA GAUKLER

City of missoula Conservation & Climate aCtion Plan 59
StrategyImplementation
CostEstimated Annual Energy Savings Estimated Annual
Dollar SavingsAnnual Avoided
Emissions (mtCO2e)Simple PaybackTherms kWh Gallons of Fuel
REO-1 $300k - $1,000,000 10,390 466,214 -- $55,357 259.7 5-18
reCommenDation
Consider authorizing $5,000 to $30,000 in City funds to prepare a feasibility study, preliminary engineering, and cost
estimates for increased utilization of biogas currently being flared at the Wastewater Treatment Plant via combined heat and
power energy production.
BaCkGrounD
The Missoula Greenhouse Gas Emissions Inventory reports that the wastewater
treatment plant produced 808,872 cubic meters of biogas in Fy 08. Approximately
49% of total biogas was used to produce boiler heat, approximately 49% was
flared, and approximately 2% escaped as fugitive emissions. This produced
237,808 cubic meters of unutilized flared methane. Annual Electrical use is
5,014,224 kWh. Annual Natural Gas use is 25,920 Th. Annual Methane use is
17,785,296 ft3. Note the Methane use represents partial capture and reuse of
treatment by-products.1,2
Electrical generation efficiency of a methane-fired internal combustion engine
coupled to an induction generator is approximately 35% - 36% on larger
horsepower systems (for example, a 750 hp engine). The efficiency would not be
this high on smaller engines. If waste heat is recovered off the engine/generator
and used for space heating, the heat recovery efficiency is approximately 20%.
If the co-generation system is used for both electric power generation and for
space heating, the total efficiency would be (35% + 20%) or approximately 55%.4
The examples here are for a cogeneration system.
Preliminary approximations estimate that the unutilized methane could be
converted to approximately 466,214 kWh of usable electricity, 10,400 Th of
natural gas, and save approximately $55,000 and 260 metric tons of CO2e per
year.3,4 More accurate values would be produced through the recommended
feasibility study.
REO-1 Enhanced Methane Utilization at Wastewater Treatment Plant
Department> Public Works
strategy target > Decrease use of purchased
natural gas and electricity, and
decrease methane emissions.
related strategies
timeline> One year
Potential Partners> None Identified
Potential funding sources> None Identified
references
1. Starr Sullivan, Wastewater Treatment Superintendent, 406-552-6600 (office), [email protected]
2. Molly White, ClearSky Project Developer, 406-721-3000, ext. 1242 (office), [email protected]
3. Calculations were derived from those in “Anaerobic Digester at Wastewater Treatment Facility.” CAPPA v1.5. ICLEI ©2010.
4. John Campbell, ERM Inc., 406-565-1691.
CONSERVATION AND CLIMATE ACTION STRATEGIES

City of missoula Conservation & Climate aCtion Plan 60
StrategyImplementation
CostEstimated Annual Energy Savings Estimated Annual
Dollar SavingsAnnual Avoided
Emissions (mtCO2e)Simple PaybackTherms kWh Gallons of Fuel
REO-2 <$100,000 - 100,000 - $10,000 43 10 years
reCommenDation
Issue an RFP for development of a Micro-hydropower electrical generation facility at Missoula’s Wastewater Treatment Plant.
BaCkGrounD
It is estimated that a Micro-hydropower facility at the Wastewater Treatment
Plant (WWTP) could generate approximately 100,000 kWh1 of electricity annually
utilizing the 6-9 million gallons per day of effluent flow.2 Installed system cost
is estimated at $100,0003 with a simple payback of 10 years. 100,000 kWh
would represent about 2% of the WWTP’s approximately 5,000,000 kWh annual
electrical use.4
references
1. Estimates derived from two Micro-hydropower calculators:
a. Micro hydro calculator #1: http://www.reuk.co.uk/Calculation-of-hydro-Power.htm (power (W) = head (m) * flow (L/s) * gravity (m/s2) * efficiency; assumes: 6-9 million gallons of daily flow, 15’ head, and 60% system efficiency)
1. Calc. #1 yields 62,000 – 93,000 kWh per year
b. Micro hydro calculator #2: From 2011 document “A Quick Guide to Micro-hydro Power Generation in Colorado”; potential power (kW) = (water flow rate (cfs) * available head (ft) *0.8) /11.82
1. Calc. #2 yields 82,000 – 124,000 kWh per year
2. City of Missoula website; Treatment Facility section: http://www.ci.missoula.mt.us/index.aspx?NID=579
3. Conservative rule of thumb used: ~$10,000 system cost per kW installed; thus, $100,000 for ~ 10 kW system.
4. Annual electrical use at WWTP per Energy Efficiency and Conservation Block Grant – Water/Wastewater Treatment Facilities – Criteria Questions – City of Missoula.
REO-2 Micro-hydropower Electricity Generation at the Wastewater Treatment Plant
Department> Wastewater Division of
Public Works
strategy target > Generate 100,000 kWh of
renewable energy annually
to offset approximately 2% of
the WWTP’s annual electrical
energy usage, estimated at
5,000,000 kWh.
related strategies> None
timeline> Issue RFP and assess responses
in 2012.
Potential Partners> AERO (outreach)
Potential funding sources> The project would be financed
as a capital investment in the
Wastewater Treatment Plant.
CONSERVATION AND CLIMATE ACTION STRATEGIES

City of missoula Conservation & Climate aCtion Plan 61
StrategyImplementation
CostEstimated Annual Energy Savings Estimated Annual
Dollar SavingsAnnual Avoided
Emissions (mtCO2e)Simple PaybackTherms kWh Gallons of Fuel
REO-3 <$1,100,000 - <390,000 - <$39,000 < 168.5 28 years
reCommenDation
Issue an RFP for development of solar (PV) systems on municipal buildings.
BaCkGrounD
Several municipal buildings currently have PV systems installed on their roofs.
These include City hall and Fire Stations 2 and 4, which combine for approximately
20 kW of total installed capacity.
It is estimated that expanding the installations of solar PV systems on up
to 23 suitable municipal buildings (273 kW of total capacity) could generate
approximately 390,000 kWh of electricity annually with a total cost of installed
systems estimated at $1,100,000, yielding a simple payback of 28 years.
Actual paybacks would depend on anticipated electricity escalation, monetization
of federal and state subsidies, building specific costs, and the financial structure
of capital costs. Federal and State subsidies can reduce fixed costs by 20-40%.3
Given the long-run nature of the project, specific pro forma models should be
developed to assess feasibility with the RFP results.
To boost public visibility and awareness of these projects, public outreach
campaigns should be developed to inform the public of the City’s efforts.
references
1. Estimates assume the following:
a. Avg. installation cost (per kW) = $4,000
b. Avg. building install size: 12 kW
c. Number of buildings: 23
d. Net capacity factor: 0.16
2. SBS Solar. http://www.sbslink.com/
3. Ross Keogh, Sagebrush Energy.
REO-3 Solar PV Installations on Municipal Buildings
Department> Vehicle Maintenance & Facilities
strategy target > Generate renewable energy
annually for municipal buildings’
annual electrical energy usage,
kWh.
related strategiesNone
timeline> Two years, to complete projects
on all suitable buildings.
Potential Partners> SBS Solar, AERO (outreach)
Potential funding sources> Municipal debt
> Municipal renewable energy
grants
CONSERVATION AND CLIMATE ACTION STRATEGIES

City of missoula Conservation & Climate aCtion Plan 62
StrategyImplementation
CostEstimated Annual Energy Savings Estimated Annual
Dollar SavingsAnnual Avoided
Emissions (mtCO2e)Simple PaybackTherms kWh Gallons of Fuel
REO-4 $515,0005 40,000 - - $33,600 224 15-16
reCommenDation
Release a set of RFPs to: install a solar water heater to heat the Lazy River, Catch Pool, and the Pond at Splash Montana; an
energy blanket to cover the Lap Pool; and to conduct similar energy efficiency improvements made at Splash at Currents.
BaCkGrounD
Operation of Splash begins Memorial Day through mid-September of each
calendar year (approx. 3.5 months). The design would be for 269 solar thermal
panels to cover 13,400 ft2 (with a solar fraction of 45%) and an energy blanket
(164’ by 75’). The new demand of the system would be approximately 66,000
therms4 (compared to existing demand of approx. 106,000 Th). The heater and
blanket will create approximately 14,340 Th/yr and 25,660 Th/yr of savings,
respectively. The life expectancy of the heater is approximately 25 yrs and the
blanket is approximately 15 yrs. The estimated figures shown in the table above
are based on values from the existing Splash systems.
In addition to these various savings, this project could be used as an educational
interpretive center for solar energy.
references
1. ClearSky Climate Solutions NWE RFP response 4/30/10
2. Jack Stucky, Fleet and Facilities Superintendent, 406-552-6387 (office), [email protected]
3. Molly White, ClearSky Project Developer, 406-721-3000, ext. 1242 (office), [email protected]
4. Estimated using a RET screen.
5. This estimate does not include future operating or management costs; assumed both improvements would be under limited or lifetime warranty.
REO-4 Solar Thermal heating System and Thermal Pool Blanket at Splash Montana and Similar Energy Efficiency Improvements at Currents
Department> Parks and Recreation –
Aquatics Program
strategy target > Reduce natural gas usage by
40,000 therms per year.
related strategies> Continuous Building Retro
and Re Commissioning
> Expansion of Solar Thermal
at Fire Stations
timeline> Six months or less, to complete
installation
Potential Partners> None identified at this time.
Potential funding sources> None identified at this time
(Parks and Recreation
Department Budget, Carbon
offset generating RFPs, or
Municipal Renewable Energy
grants)
CONSERVATION AND CLIMATE ACTION STRATEGIES

City of missoula Conservation & Climate aCtion Plan 63
StrategyImplementation
CostEstimated Annual Energy Savings Estimated Annual
Dollar SavingsAnnual Avoided
Emissions (mtCO2e)Simple PaybackTherms kWh Gallons of Fuel
REO-5 $10,000-$250,000 per project -- -- -- -- -- --
reCommenDation
Release an RFP to conduct pre-feasibility assessment(s) and bid(s) for developing carbon offsets from Missoula City projects contingent upon the,
1) Need for additional project financing, and
2) The project meeting carbon offset development “economy of scale” (see Background).
If either (1) and (2) are not identified, it does not make sense to create carbon offsets in terms of mitigating the City’s own carbon footprint, and the City should rather quantify the emission reductions and claim them as a direct benefit within their annual greenhouse gas assessment.
BaCkGrounD
A carbon offset is one metric ton of carbon dioxide equivalent (CO2e) that is taken out of the atmosphere, or one metric ton of CO2e that is not emitted to the atmosphere.
Eligible carbon offset generating activities include projects which either remove CO2e from the atmosphere or avoid CO2e from being released into the atmosphere. If the City wants to command a decent price, the projects must also demonstrate carbon offset best practices (real, additional, permanent, mitigate leakage, certified, registered, contain ancillary benefits, etc.).
Fixed costs associated with certifying carbon offsets within a Voluntary Carbon Market Standard include: One validation event and multiple verification events (est. $10,000-$30,000/visit), issuance and registry fees (est. $0.10/carbon offset), and project development services either by an external consultant or internal staff. These fixed costs do not include operations and maintenance of the actual project activity, nor do they include operations and maintenance sometimes associated with producing carbon offsets, for example: costs associated with measuring and monitoring the emission reductions.
Before conducting pre-feasibility of a carbon offset generating activity, a rough rule-of-thumb for “economy of scale” can be used: Is it greater than 1,000 acres or produces or avoids greater than 100 MWh/year?
While the Ecosystem Marketplace Report reports a 2010 price average of $6/offset, note that the average credit price by project types ranged from $1-$20. Further, $6/offset reflects both wholesale and retail exchanges and takes into account a unique market event in 2010, namely the collapse of one voluntary market place (CCX).
references
1. ClearSky Climate Solutions: www.clearskyclimatesolutions.com2. Molly White, ClearSky Project Developer, 406-721-3000, ext. 1242 (office),
[email protected]. Back to the Future: State of the Voluntary Carbon Markets 2011: http://www.ecosystemmarketplace.
com/pages/dynamic/resources.library.page.php?page_id=8351§ion=our_publications&eod=1
REO-5 Carbon Offset Development
Department> Public Works> Parks and Recreation> Planning and Grants
strategy target > To help finance an emission
reduction activity.
related strategies> Internal Policies & Practices
timeline> One to two years, to complete
the carbon offset certification process prior to or at the beginning of emission reduction project activity.
Potential Partners> ClearSky Climate Solutions
Potential funding sources> Average price per offset based
on 2011 Ecosystem Marketplace Report3 was $6/offset in 2010.
CONSERVATION AND CLIMATE ACTION STRATEGIES
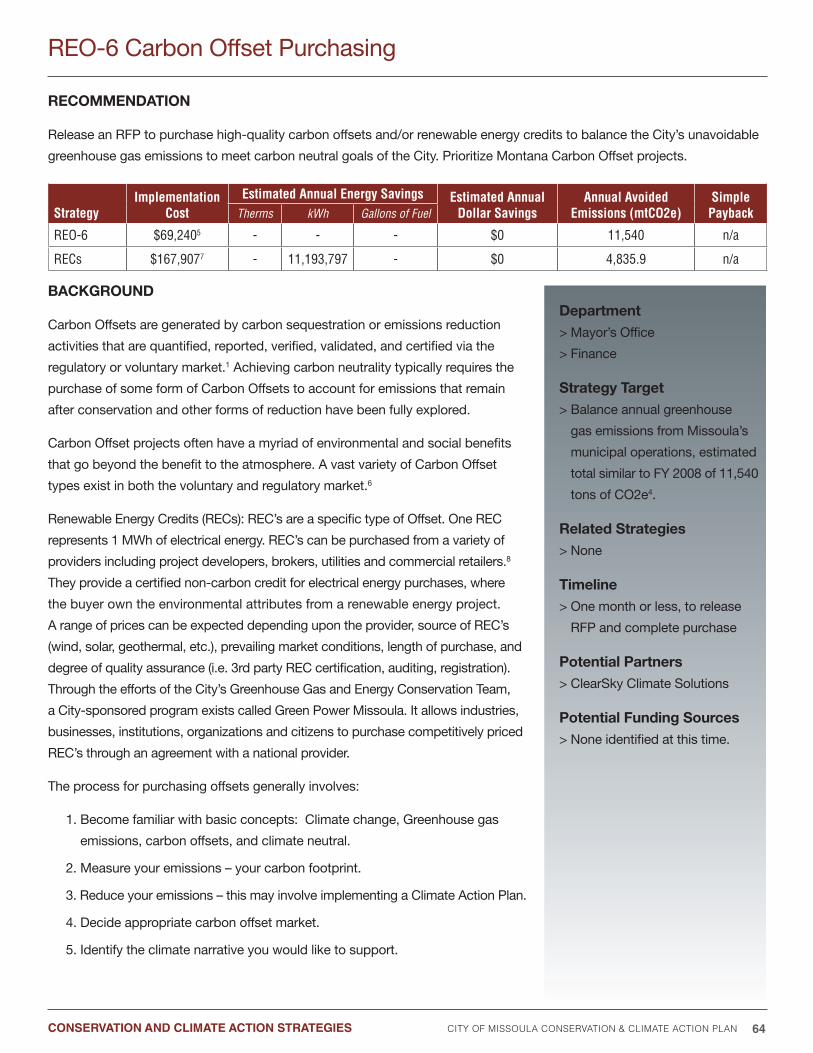
City of missoula Conservation & Climate aCtion Plan 64
StrategyImplementation
CostEstimated Annual Energy Savings Estimated Annual
Dollar SavingsAnnual Avoided
Emissions (mtCO2e)Simple PaybackTherms kWh Gallons of Fuel
REO-6 $69,2405 - - - $0 11,540 n/a
RECs $167,9077 - 11,193,797 - $0 4,835.9 n/a
reCommenDation
Release an RFP to purchase high-quality carbon offsets and/or renewable energy credits to balance the City’s unavoidable
greenhouse gas emissions to meet carbon neutral goals of the City. Prioritize Montana Carbon Offset projects.
BaCkGrounD
Carbon Offsets are generated by carbon sequestration or emissions reduction
activities that are quantified, reported, verified, validated, and certified via the
regulatory or voluntary market.1 Achieving carbon neutrality typically requires the
purchase of some form of Carbon Offsets to account for emissions that remain
after conservation and other forms of reduction have been fully explored.
Carbon Offset projects often have a myriad of environmental and social benefits
that go beyond the benefit to the atmosphere. A vast variety of Carbon Offset
types exist in both the voluntary and regulatory market.6
Renewable Energy Credits (RECs): REC’s are a specific type of Offset. One REC
represents 1 MWh of electrical energy. REC’s can be purchased from a variety of
providers including project developers, brokers, utilities and commercial retailers.8
They provide a certified non-carbon credit for electrical energy purchases, where
the buyer own the environmental attributes from a renewable energy project.
A range of prices can be expected depending upon the provider, source of REC’s
(wind, solar, geothermal, etc.), prevailing market conditions, length of purchase, and
degree of quality assurance (i.e. 3rd party REC certification, auditing, registration).
Through the efforts of the City’s Greenhouse Gas and Energy Conservation Team,
a City-sponsored program exists called Green Power Missoula. It allows industries,
businesses, institutions, organizations and citizens to purchase competitively priced
REC’s through an agreement with a national provider.
The process for purchasing offsets generally involves:
1. Become familiar with basic concepts: Climate change, Greenhouse gas
emissions, carbon offsets, and climate neutral.
2. Measure your emissions – your carbon footprint.
3. Reduce your emissions – this may involve implementing a Climate Action Plan.
4. Decide appropriate carbon offset market.
5. Identify the climate narrative you would like to support.
REO-6 Carbon Offset Purchasing
Department> Mayor’s Office
> Finance
strategy target > Balance annual greenhouse
gas emissions from Missoula’s
municipal operations, estimated
total similar to Fy 2008 of 11,540
tons of CO2e4.
related strategies> None
timeline> One month or less, to release
RFP and complete purchase
Potential Partners> ClearSky Climate Solutions
Potential funding sources> None identified at this time.
CONSERVATION AND CLIMATE ACTION STRATEGIES
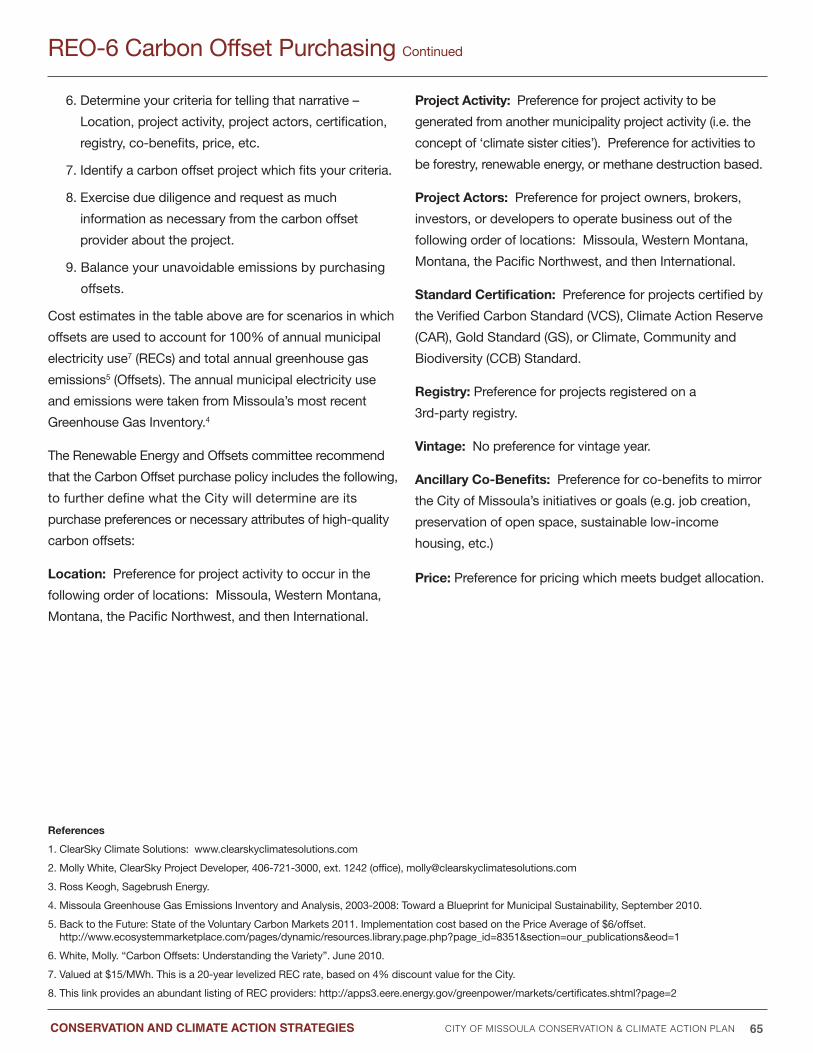
City of missoula Conservation & Climate aCtion Plan 65
REO-6 Carbon Offset Purchasing Continued
6. Determine your criteria for telling that narrative –
Location, project activity, project actors, certification,
registry, co-benefits, price, etc.
7. Identify a carbon offset project which fits your criteria.
8. Exercise due diligence and request as much
information as necessary from the carbon offset
provider about the project.
9. Balance your unavoidable emissions by purchasing
offsets.
Cost estimates in the table above are for scenarios in which
offsets are used to account for 100% of annual municipal
electricity use7 (RECs) and total annual greenhouse gas
emissions5 (Offsets). The annual municipal electricity use
and emissions were taken from Missoula’s most recent
Greenhouse Gas Inventory.4
The Renewable Energy and Offsets committee recommend
that the Carbon Offset purchase policy includes the following,
to further define what the City will determine are its
purchase preferences or necessary attributes of high-quality
carbon offsets:
location: Preference for project activity to occur in the
following order of locations: Missoula, Western Montana,
Montana, the Pacific Northwest, and then International.
Project activity: Preference for project activity to be
generated from another municipality project activity (i.e. the
concept of ‘climate sister cities’). Preference for activities to
be forestry, renewable energy, or methane destruction based.
Project actors: Preference for project owners, brokers,
investors, or developers to operate business out of the
following order of locations: Missoula, Western Montana,
Montana, the Pacific Northwest, and then International.
standard Certification: Preference for projects certified by
the Verified Carbon Standard (VCS), Climate Action Reserve
(CAR), Gold Standard (GS), or Climate, Community and
Biodiversity (CCB) Standard.
registry: Preference for projects registered on a
3rd-party registry.
vintage: No preference for vintage year.
ancillary Co-Benefits: Preference for co-benefits to mirror
the City of Missoula’s initiatives or goals (e.g. job creation,
preservation of open space, sustainable low-income
housing, etc.)
Price: Preference for pricing which meets budget allocation.
references
1. ClearSky Climate Solutions: www.clearskyclimatesolutions.com
2. Molly White, ClearSky Project Developer, 406-721-3000, ext. 1242 (office), [email protected]
3. Ross Keogh, Sagebrush Energy.
4. Missoula Greenhouse Gas Emissions Inventory and Analysis, 2003-2008: Toward a Blueprint for Municipal Sustainability, September 2010.
5. Back to the Future: State of the Voluntary Carbon Markets 2011. Implementation cost based on the Price Average of $6/offset. http://www.ecosystemmarketplace.com/pages/dynamic/resources.library.page.php?page_id=8351§ion=our_publications&eod=1
6. White, Molly. “Carbon Offsets: Understanding the Variety”. June 2010.
7. Valued at $15/MWh. This is a 20-year levelized REC rate, based on 4% discount value for the City.
8. This link provides an abundant listing of REC providers: http://apps3.eere.energy.gov/greenpower/markets/certificates.shtml?page=2
CONSERVATION AND CLIMATE ACTION STRATEGIES
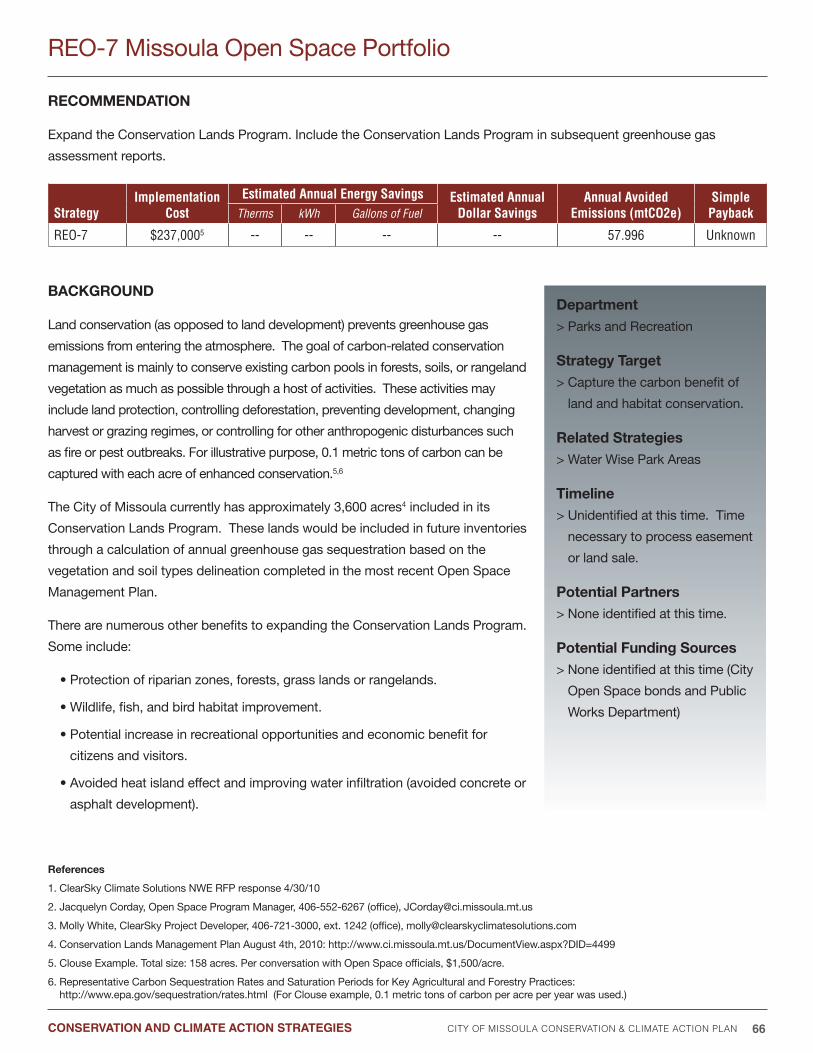
City of missoula Conservation & Climate aCtion Plan 66
StrategyImplementation
CostEstimated Annual Energy Savings Estimated Annual
Dollar SavingsAnnual Avoided
Emissions (mtCO2e)Simple PaybackTherms kWh Gallons of Fuel
REO-7 $237,0005 -- -- -- -- 57.996 Unknown
reCommenDation
Expand the Conservation Lands Program. Include the Conservation Lands Program in subsequent greenhouse gas
assessment reports.
BaCkGrounD
Land conservation (as opposed to land development) prevents greenhouse gas
emissions from entering the atmosphere. The goal of carbon-related conservation
management is mainly to conserve existing carbon pools in forests, soils, or rangeland
vegetation as much as possible through a host of activities. These activities may
include land protection, controlling deforestation, preventing development, changing
harvest or grazing regimes, or controlling for other anthropogenic disturbances such
as fire or pest outbreaks. For illustrative purpose, 0.1 metric tons of carbon can be
captured with each acre of enhanced conservation.5,6
The City of Missoula currently has approximately 3,600 acres4 included in its
Conservation Lands Program. These lands would be included in future inventories
through a calculation of annual greenhouse gas sequestration based on the
vegetation and soil types delineation completed in the most recent Open Space
Management Plan.
There are numerous other benefits to expanding the Conservation Lands Program.
Some include:
• Protection of riparian zones, forests, grass lands or rangelands.
• Wildlife, fish, and bird habitat improvement.
• Potential increase in recreational opportunities and economic benefit for
citizens and visitors.
• Avoided heat island effect and improving water infiltration (avoided concrete or
asphalt development).
REO-7 Missoula Open Space Portfolio
Department> Parks and Recreation
strategy target > Capture the carbon benefit of
land and habitat conservation.
related strategies> Water Wise Park Areas
timeline> Unidentified at this time. Time
necessary to process easement
or land sale.
Potential Partners> None identified at this time.
Potential funding sources> None identified at this time (City
Open Space bonds and Public
Works Department)
references
1. ClearSky Climate Solutions NWE RFP response 4/30/10
2. Jacquelyn Corday, Open Space Program Manager, 406-552-6267 (office), [email protected]
3. Molly White, ClearSky Project Developer, 406-721-3000, ext. 1242 (office), [email protected]
4. Conservation Lands Management Plan August 4th, 2010: http://www.ci.missoula.mt.us/DocumentView.aspx?DID=4499
5. Clouse Example. Total size: 158 acres. Per conversation with Open Space officials, $1,500/acre.
6. Representative Carbon Sequestration Rates and Saturation Periods for Key Agricultural and Forestry Practices: http://www.epa.gov/sequestration/rates.html (For Clouse example, 0.1 metric tons of carbon per acre per year was used.)
CONSERVATION AND CLIMATE ACTION STRATEGIES
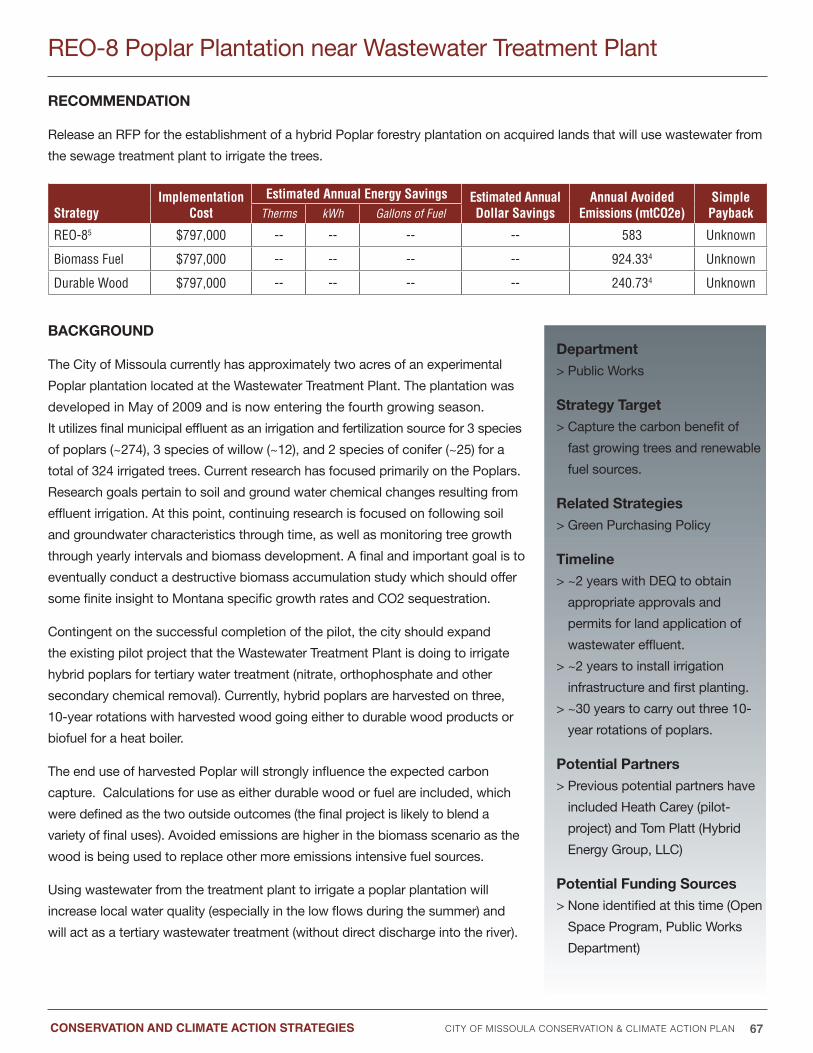
City of missoula Conservation & Climate aCtion Plan 67
StrategyImplementation
CostEstimated Annual Energy Savings Estimated Annual
Dollar SavingsAnnual Avoided
Emissions (mtCO2e)Simple PaybackTherms kWh Gallons of Fuel
REO-85 $797,000 -- -- -- -- 583 Unknown
Biomass Fuel $797,000 -- -- -- -- 924.334 Unknown
Durable Wood $797,000 -- -- -- -- 240.734 Unknown
reCommenDation
Release an RFP for the establishment of a hybrid Poplar forestry plantation on acquired lands that will use wastewater from
the sewage treatment plant to irrigate the trees.
BaCkGrounD
The City of Missoula currently has approximately two acres of an experimental
Poplar plantation located at the Wastewater Treatment Plant. The plantation was
developed in May of 2009 and is now entering the fourth growing season.
It utilizes final municipal effluent as an irrigation and fertilization source for 3 species
of poplars (~274), 3 species of willow (~12), and 2 species of conifer (~25) for a
total of 324 irrigated trees. Current research has focused primarily on the Poplars.
Research goals pertain to soil and ground water chemical changes resulting from
effluent irrigation. At this point, continuing research is focused on following soil
and groundwater characteristics through time, as well as monitoring tree growth
through yearly intervals and biomass development. A final and important goal is to
eventually conduct a destructive biomass accumulation study which should offer
some finite insight to Montana specific growth rates and CO2 sequestration.
Contingent on the successful completion of the pilot, the city should expand
the existing pilot project that the Wastewater Treatment Plant is doing to irrigate
hybrid poplars for tertiary water treatment (nitrate, orthophosphate and other
secondary chemical removal). Currently, hybrid poplars are harvested on three,
10-year rotations with harvested wood going either to durable wood products or
biofuel for a heat boiler.
The end use of harvested Poplar will strongly influence the expected carbon
capture. Calculations for use as either durable wood or fuel are included, which
were defined as the two outside outcomes (the final project is likely to blend a
variety of final uses). Avoided emissions are higher in the biomass scenario as the
wood is being used to replace other more emissions intensive fuel sources.
Using wastewater from the treatment plant to irrigate a poplar plantation will
increase local water quality (especially in the low flows during the summer) and
will act as a tertiary wastewater treatment (without direct discharge into the river).
REO-8 Poplar Plantation near Wastewater Treatment Plant
Department> Public Works
strategy target > Capture the carbon benefit of
fast growing trees and renewable
fuel sources.
related strategies> Green Purchasing Policy
timeline> ~2 years with DEQ to obtain
appropriate approvals and
permits for land application of
wastewater effluent.
> ~2 years to install irrigation
infrastructure and first planting.
> ~30 years to carry out three 10-
year rotations of poplars.
Potential Partners> Previous potential partners have
included heath Carey (pilot-
project) and Tom Platt (hybrid
Energy Group, LLC)
Potential funding sources> None identified at this time (Open
Space Program, Public Works
Department)
CONSERVATION AND CLIMATE ACTION STRATEGIES

City of missoula Conservation & Climate aCtion Plan 68
Cost breakdown in either scenario includes: $35,000
(permits), $200,000 (irrigation system), $462,000 (three
rotations of plantation and operation and maintenance),
$100,000 (admin, reporting and monitoring for 30 years).
Cost does not take into account the benefit from the sale
of product, either biomass fuel or durable wood. The
estimated cost also does not include the capital cost
avoidance of potential necessary upgrades/expansion to
the Wastewater Treatment Plant by effluent land/Poplar
Plantation application. A full cost benefit analysis should be
conducted at part of recommended RFP.
references
1. Molly White, ClearSky Project Developer, 406-721-3000, ext. 1242 (office), [email protected]
2. heath N. Carey, Founder, Terra Mater Solutions, www.terramatersolutions.com. Environmental Scientist, Bioroot Energy, www.biorootenergy.com. 406-396-5147
3. Starr Sullivan, Wastewater Treatment Superintendent, 406-552-6600 (office), [email protected]
4. ClearSky Climate Solutions NWE RFP response 4/30/10
5. The likely outcome of the plantation will be a mix of the two, so average values are presented for the final estimates.
REO-8 Poplar Plantation near Wastewater Treatment Plant Continued
CONSERVATION AND CLIMATE ACTION STRATEGIES
Working on this team helped the Wastewater Treatment Plant strategize how to continually work to preserve the environment and public health in the most energy efficient way possible.
- STARR SULLIVAN
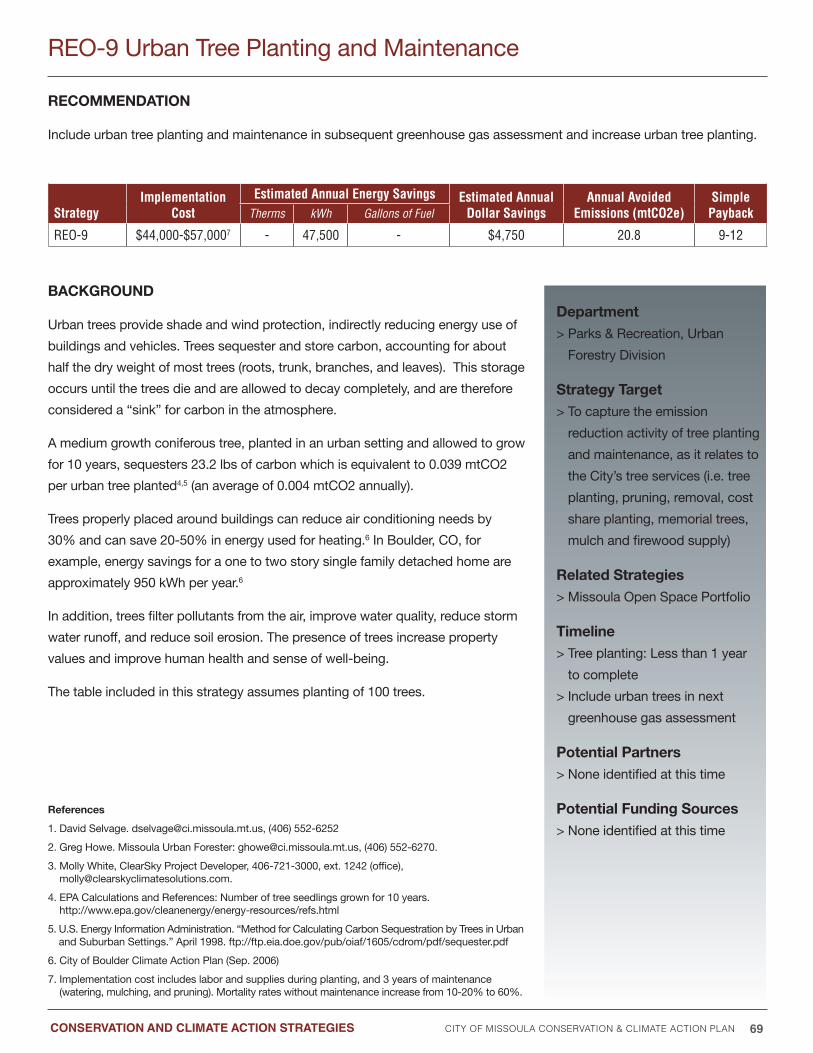
City of missoula Conservation & Climate aCtion Plan 69
StrategyImplementation
CostEstimated Annual Energy Savings Estimated Annual
Dollar SavingsAnnual Avoided
Emissions (mtCO2e)Simple PaybackTherms kWh Gallons of Fuel
REO-9 $44,000-$57,0007 - 47,500 - $4,750 20.8 9-12
reCommenDation
Include urban tree planting and maintenance in subsequent greenhouse gas assessment and increase urban tree planting.
BaCkGrounD
Urban trees provide shade and wind protection, indirectly reducing energy use of
buildings and vehicles. Trees sequester and store carbon, accounting for about
half the dry weight of most trees (roots, trunk, branches, and leaves). This storage
occurs until the trees die and are allowed to decay completely, and are therefore
considered a “sink” for carbon in the atmosphere.
A medium growth coniferous tree, planted in an urban setting and allowed to grow
for 10 years, sequesters 23.2 lbs of carbon which is equivalent to 0.039 mtCO2
per urban tree planted4,5 (an average of 0.004 mtCO2 annually).
Trees properly placed around buildings can reduce air conditioning needs by
30% and can save 20-50% in energy used for heating.6 In Boulder, CO, for
example, energy savings for a one to two story single family detached home are
approximately 950 kWh per year.6
In addition, trees filter pollutants from the air, improve water quality, reduce storm
water runoff, and reduce soil erosion. The presence of trees increase property
values and improve human health and sense of well-being.
The table included in this strategy assumes planting of 100 trees.
references
1. David Selvage. [email protected], (406) 552-6252
2. Greg howe. Missoula Urban Forester: [email protected], (406) 552-6270.
3. Molly White, ClearSky Project Developer, 406-721-3000, ext. 1242 (office), [email protected].
4. EPA Calculations and References: Number of tree seedlings grown for 10 years. http://www.epa.gov/cleanenergy/energy-resources/refs.html
5. U.S. Energy Information Administration. “Method for Calculating Carbon Sequestration by Trees in Urban and Suburban Settings.” April 1998. ftp://ftp.eia.doe.gov/pub/oiaf/1605/cdrom/pdf/sequester.pdf
6. City of Boulder Climate Action Plan (Sep. 2006)
7. Implementation cost includes labor and supplies during planting, and 3 years of maintenance (watering, mulching, and pruning). Mortality rates without maintenance increase from 10-20% to 60%.
REO-9 Urban Tree Planting and Maintenance
Department > Parks & Recreation, Urban
Forestry Division
strategy target > To capture the emission
reduction activity of tree planting
and maintenance, as it relates to
the City’s tree services (i.e. tree
planting, pruning, removal, cost
share planting, memorial trees,
mulch and firewood supply)
related strategies > Missoula Open Space Portfolio
timeline> Tree planting: Less than 1 year
to complete
> Include urban trees in next
greenhouse gas assessment
Potential Partners> None identified at this time
Potential funding sources> None identified at this time
CONSERVATION AND CLIMATE ACTION STRATEGIES

City of missoula Conservation & Climate aCtion Plan 70
aDDitional aCtions anD strateGies iDentifieDThere were many ideas and suggestions for reduction
measures that were not included as strategies for
various reasons. These were organized into three
categories: Recommended Actions, Demonstration
Projects, and Strategies for the Community
Conservation & Climate Action Plan.
recommended actions. These recommended
actions are known to have positive impacts in
many sectors, including energy conservation,
water conservation, air quality, and greenhouse
gas reduction. Recommended actions differ from
strategies and demonstration projects in that they
are supportive in nature and enhance existing
City programs and practices as well as strategies
included herein.
Demonstration Projects. Like recommended
actions, demonstration projects are known to have
positive impacts in many sectors, including energy
conservation, water conservation, air quality, and
overall greenhouse gas reduction. The level to which
these projects will benefit a City or community is
often contingent upon region, climate, or availability
of physical space for implementation, budget,
and other such factors. As such, the benefits of
implementation in Missoula are not fully understood
or known. These projects are recommended
as small scale demonstration projects, to be
used to better understand the level to which full
implementation of each project will benefit the City
and community. With successful demonstration,
each of these projects could and should become
full strategies in future revisions of Missoula’s
Conservation & Climate Action Plan and should be
implemented at appropriate larger scales.
strategies for the Community Conservation
& Climate action Plan. These strategies
were determined to be outside the scope of the
Municipal Conservation & Climate Action Plan,
but were important enough to be preserved for
future community wide Climate Action efforts. The
narratives give a brief synopsis of the strategy and its
relation to the reduction of greenhouse gases in the
Missoula Community, however further development
and research of the strategies may be required.
City of missoula Conservation & Climate aCtion Plan 71ADDITIONAL ACTIONS AND STRATEGIES IDENTIfIED
fleet anD faCilities
aeration Blower retrofit at the wastewater treatment Plant
A study conducted by Energy Resource Management, Inc.
investigated the implementation of a retrofit of the aeration
blower system at the Missoula Wastewater Treatment Plant.
Typical benefits from a retrofit of older systems include
updated efficiency and new technology, e.g. variable
frequency drives and dissolved oxygen control.1 The
Missoula blowers already have these two technologies, thus
reducing the overall impact of the retrofit to 8-12% in annual
electrical savings, as opposed to a typical 35-33% savings.
This increases the simple payback period to 17-26 years.
The aeration blowers should continue to be monitored as
they age and decrease in efficiency until such a time when
they become more economically feasible to retrofit.
Deconstruction, reuse and recycling in future municipal Building Demolitions and renovations
The City of Missoula should require a Deconstruction, Reuse and
Recycling plan for future building demolitions and renovations.
Deconstruction plans reduce unnecessary landfill contributions,
related Greenhouse Gas emissions (primarily Methane),
and waste disposal fees. Past Projects have demonstrated
savings ranging from $50,000 to over $150,000.2 In addition
deconstruction can create revenue streams with sale of salvaged
and recyclable materials, creates jobs and conserves energy and
natural resources. According to the EPA, the waste from building
demolition removal constitutes nearly half of all building related
construction and demolition debris. Renovation and remodeling
projects are estimated to generate an additional 40% of the
total debris, and new construction makes up the rest.1 Missoula
is uniquely positioned for successfully implementing these
activities with the existence of home ReSource – who serves
both as a provider of Deconstruction services and established
building material reuse retail outlet.
This Recommended Action integrates with LEED New
Construction & Major Renovations, LEED Existing Buildings
Operations & Maintenance, Waste Stream Reduction Policy,
and Sustainable Operations and Maintenance strategies.
references
1. Environmental Protection Agency, “Analyzing What’s Recyclable in C&D Waste,” Ken Sandler, BioCycle, November 2003. http://www.epa.gov/epawaste/conserve/rrr/imr/cdm/index.htm
2. Environmental Protection Agency, “Building Savings: Strategies for Waste Reduction of Construction and Demolition Debris from Buildings”. EPA-530-F-00-001. June 2000. “Model Programs”, Page 3. http://www.epa.gov/epawaste/nonhaz/municipal/pubs/combined.pdf
references
1. Energy Resource Management, Inc. “Energy Optimization Study for the Missoula Wastewater Treatment Plant”. October 2011.
recommended actions
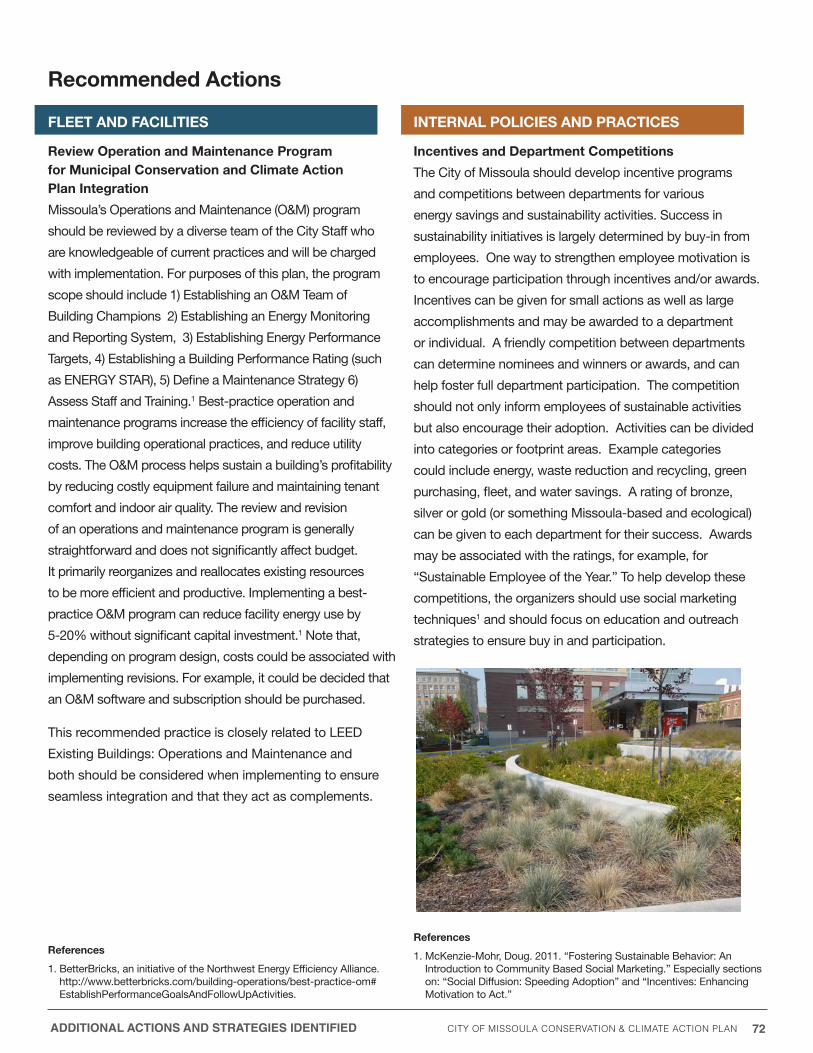
City of missoula Conservation & Climate aCtion Plan 72ADDITIONAL ACTIONS AND STRATEGIES IDENTIfIED
references
1. BetterBricks, an initiative of the Northwest Energy Efficiency Alliance. http://www.betterbricks.com/building-operations/best-practice-om# EstablishPerformanceGoalsAndFollowUpActivities.
references
1. McKenzie-Mohr, Doug. 2011. “Fostering Sustainable Behavior: An Introduction to Community Based Social Marketing.” Especially sections on: “Social Diffusion: Speeding Adoption” and “Incentives: Enhancing Motivation to Act.”
recommended actions
fleet anD faCilities
review operation and maintenance Program for municipal Conservation and Climate action Plan integration
Missoula’s Operations and Maintenance (O&M) program
should be reviewed by a diverse team of the City Staff who
are knowledgeable of current practices and will be charged
with implementation. For purposes of this plan, the program
scope should include 1) Establishing an O&M Team of
Building Champions 2) Establishing an Energy Monitoring
and Reporting System, 3) Establishing Energy Performance
Targets, 4) Establishing a Building Performance Rating (such
as ENERGy STAR), 5) Define a Maintenance Strategy 6)
Assess Staff and Training.1 Best-practice operation and
maintenance programs increase the efficiency of facility staff,
improve building operational practices, and reduce utility
costs. The O&M process helps sustain a building’s profitability
by reducing costly equipment failure and maintaining tenant
comfort and indoor air quality. The review and revision
of an operations and maintenance program is generally
straightforward and does not significantly affect budget.
It primarily reorganizes and reallocates existing resources
to be more efficient and productive. Implementing a best-
practice O&M program can reduce facility energy use by
5-20% without significant capital investment.1 Note that,
depending on program design, costs could be associated with
implementing revisions. For example, it could be decided that
an O&M software and subscription should be purchased.
This recommended practice is closely related to LEED
Existing Buildings: Operations and Maintenance and
both should be considered when implementing to ensure
seamless integration and that they act as complements.
internal PoliCies anD PraCtiCes
incentives and Department Competitions
The City of Missoula should develop incentive programs
and competitions between departments for various
energy savings and sustainability activities. Success in
sustainability initiatives is largely determined by buy-in from
employees. One way to strengthen employee motivation is
to encourage participation through incentives and/or awards.
Incentives can be given for small actions as well as large
accomplishments and may be awarded to a department
or individual. A friendly competition between departments
can determine nominees and winners or awards, and can
help foster full department participation. The competition
should not only inform employees of sustainable activities
but also encourage their adoption. Activities can be divided
into categories or footprint areas. Example categories
could include energy, waste reduction and recycling, green
purchasing, fleet, and water savings. A rating of bronze,
silver or gold (or something Missoula-based and ecological)
can be given to each department for their success. Awards
may be associated with the ratings, for example, for
“Sustainable Employee of the year.” To help develop these
competitions, the organizers should use social marketing
techniques1 and should focus on education and outreach
strategies to ensure buy in and participation.

City of missoula Conservation & Climate aCtion Plan 73ADDITIONAL ACTIONS AND STRATEGIES IDENTIfIED
references
1. U.S. Department of Energy – National Renewable Energy Laboratory. “A Consumer’s Guide: heat your water with the sun.” http://www.nrel.gov/docs/fy04osti/34279.pdf
recommended actionsConservation & Climate action Plan Demonstration Projects
renewaBle enerGy anD offsets
solar thermal hot water systems at fire stations
Solar thermal hot water systems are systems that use the
sun’s energy to heat water, which is then used for indoor water
heating and use, space conditioning, and other applications.
“Research shows that the average household with an electric
water heater spends about 25% of its home energy costs
on heating water.”1 Much or all of this cost could be offset
with a solar thermal system. During the extensive remodel of
Missoula’s Fire Station 2 in 2008, a solar thermal hot water
system was integrated into the design and installed in the
building. The system was deemed feasible due to economies
of scale. In general, fire stations are good candidates for this
technology because of consistent activity through all hours of
the day. Opportunities for solar thermal hot water should be
considered in all future renovations and new construction of fire
stations to realize the potential energy and cost savings, and
environmental benefits.
fleet anD faCilities
Green roofs
A green roof is a vegetative layer grown on a rooftop. Green
roofs provide shade and remove heat from the air, reducing
temperatures of the roof surface and the surrounding air.1 General
green roof components include conventional structural support,
waterproof roofing membrane, root repellent system, drainage
system, filtering layer, growing medium and plants.2 The benefits
of green roofs include reduced energy use through insulation,
reduced air pollution and Greenhouse Gas emissions, reduced
urban heat island effects, enhanced storm water management
and quality, increased lifespan of roof surfaces, creation of
wildlife habitat, and improved human health and comfort.1,3
Common obstacles to green roof installation include higher than
conventional roofing costs, possible increased maintenance, and
need for additional structural support. Green Roof installation
can result in 6-25% whole-building cooling energy savings.3
It is estimated that Green Roofs can be installed for $10-$25/
square foot.1 The City of Missoula could implement a green roof
demonstration project on all or part of a City of Missoula building
to better understand the net impacts of widespread installations
on municipal buildings considering our cooler, northern climate
and unique storm water management system.
references
1. U.S. Environmental Protection Agency. http://www.epa.gov/heatisland/mitigation/greenroofs.htm.
2. Ecolife.com. http://www.ecolife.com/define/green-roof.html
3. hodges, Matthew. “Green Roofs in the Garden City: Exploring the Opportunities for Green Roof Policies in Missoula, Montana” 2009.
City of missoula Conservation & Climate aCtion Plan 74ADDITIONAL ACTIONS AND STRATEGIES IDENTIfIED
fleet anD faCilities
Composting
Organic trash in the waste stream is a major generator of
methane gas in landfills.1 Methane gas is 21 times more
potent than carbon dioxide, so reducing methane gas
production is very important in the fight against greenhouse
gas emissions.1 The average office worker produces over
one pound of organic waste daily1,2 in the office. Though
the composting process itself produces some greenhouse
gases doing so still results in a net reduction of greenhouse
gas emissions through ancillary benefits. These include
reduced time, money, and transport costs associated with
conventional disposal and reduced cost of fertilizer when
used on local gardens.1 Most importantly, composting
reduces the stress put on local landfills. The City of
Missoula could implement a composting program in the
office kitchens, parks waste facilities, and other organic
waste sites to be removed and taken to EKO Compost.3
native and water wise Garden at City hall
City hall stands at the center of Missoula as a public hub of
activity. While it is in an urbanized area, there are landscaped
areas or beds on the perimeter of most of the building.
Current landscaping, while beautiful, is completed each year
with labor, water and fertilizer-intensive plants and practices.
The City of Missoula should convert these areas to a mix of
native and water wise perennial grasses, wildflowers, shrubs,
trees and features. In addition, water wise practices such as
rainwater harvesting, drip irrigation (if needed), and mulching/
composting should be implemented. These practices will
reduce operations costs over time by reducing labor costs
of planting and maintenance and eliminating annual plant
and fertilizer costs. Converted areas, such as those around
municipal buildings, should also include interpretive signs as a
public education tool to promote how these landscapes make
fiscal sense at work and at home, contribute to a healthier
environment, and how they encourage and celebrate local
cultural heritage and promote urban wildlife habitat.
Permeable surfaces
Non-permeable paved surfaces are direct conduits for
pollutants to reach surface waterways. Permeable or
pervious surfaces allow air and water to penetrate the soil
strata underneath; however, CO2 outputs and inputs are
believed to be negligible. Cook and Knapton 20091 suggest
that permeable surfaces reduce “embodied carbon” by
50% when considering a given non-permeable paved site -
due, largely in part, to the elimination of traditional drainage
provisions. Moreover, the authors suggest that the entire
paving project could be rendered carbon neutral with the
addition of planting trees per paving project. The authors
state that planting approximately 10 trees per 100 m2 of
permeable surface will render the project carbon neutral
within 50 years. Permeable surfaces have numerous other
benefits as well, including glare reduction, heat reduction
(through reduction of the urban heat island effect), and
provide an opportunity to use recycled materials.2 Missoula
could partner with Terra Firm Enterprises3 and also with the
Missoula Institute for Sustainable Transportation,4 who has
already expressed interest in establishing a pilot project.
references
1. Greenyour.com. “Compost organic office waste.” http://www.greenyour.com/node/13264
2. CanWest News Service. “Office compost system for green-conscious businesses.” http://www.financialpost.com/story.html?id=1301c697-79d8-47e5-acbc-f9c5314b9fbe&k=10858
3. EKO Compost. http://www.ekocompost.com/
references
1. Cook, Ian and Knapton, John. “Assessment of Embodied Carbon in Conventional and Permeable Pavements Surfaced with Pavers.” 2009. http://www.icpi.org/sites/default/files/techpapers/1453.pdf
2. City of Chicago Department of Transportation. “The Chicago Green Alley handbook.” http://brandavenue.typepad.com/brand_avenue/files/greenalleyhandbook.pdf
3. Terra Firm Enterprises. http://www.terrafirmenterprises.com/
4. Missoula Institute for Sustainable Transportation. http://www.strans.org/
Conservation & Climate action Plan Demonstration Projects
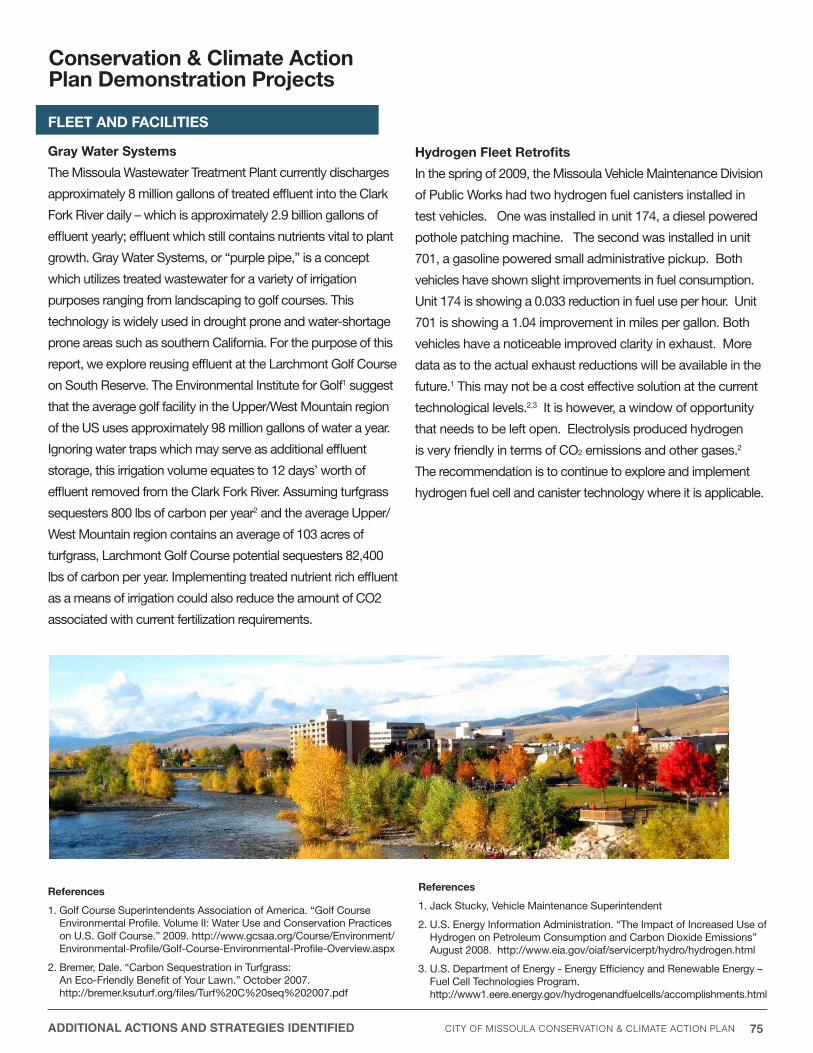
City of missoula Conservation & Climate aCtion Plan 75ADDITIONAL ACTIONS AND STRATEGIES IDENTIfIED
fleet anD faCilities
Gray water systems
The Missoula Wastewater Treatment Plant currently discharges
approximately 8 million gallons of treated effluent into the Clark
Fork River daily – which is approximately 2.9 billion gallons of
effluent yearly; effluent which still contains nutrients vital to plant
growth. Gray Water Systems, or “purple pipe,” is a concept
which utilizes treated wastewater for a variety of irrigation
purposes ranging from landscaping to golf courses. This
technology is widely used in drought prone and water-shortage
prone areas such as southern California. For the purpose of this
report, we explore reusing effluent at the Larchmont Golf Course
on South Reserve. The Environmental Institute for Golf1 suggest
that the average golf facility in the Upper/West Mountain region
of the US uses approximately 98 million gallons of water a year.
Ignoring water traps which may serve as additional effluent
storage, this irrigation volume equates to 12 days’ worth of
effluent removed from the Clark Fork River. Assuming turfgrass
sequesters 800 lbs of carbon per year2 and the average Upper/
West Mountain region contains an average of 103 acres of
turfgrass, Larchmont Golf Course potential sequesters 82,400
lbs of carbon per year. Implementing treated nutrient rich effluent
as a means of irrigation could also reduce the amount of CO2
associated with current fertilization requirements.
hydrogen fleet retrofits
In the spring of 2009, the Missoula Vehicle Maintenance Division
of Public Works had two hydrogen fuel canisters installed in
test vehicles. One was installed in unit 174, a diesel powered
pothole patching machine. The second was installed in unit
701, a gasoline powered small administrative pickup. Both
vehicles have shown slight improvements in fuel consumption.
Unit 174 is showing a 0.033 reduction in fuel use per hour. Unit
701 is showing a 1.04 improvement in miles per gallon. Both
vehicles have a noticeable improved clarity in exhaust. More
data as to the actual exhaust reductions will be available in the
future.1 This may not be a cost effective solution at the current
technological levels.2,3 It is however, a window of opportunity
that needs to be left open. Electrolysis produced hydrogen
is very friendly in terms of CO2 emissions and other gases.2
The recommendation is to continue to explore and implement
hydrogen fuel cell and canister technology where it is applicable.
references
1. Golf Course Superintendents Association of America. “Golf Course Environmental Profile. Volume II: Water Use and Conservation Practices on U.S. Golf Course.” 2009. http://www.gcsaa.org/Course/Environment/Environmental-Profile/Golf-Course-Environmental-Profile-Overview.aspx
2. Bremer, Dale. “Carbon Sequestration in Turfgrass: An Eco-Friendly Benefit of your Lawn.” October 2007. http://bremer.ksuturf.org/files/Turf%20C%20seq%202007.pdf
Conservation & Climate action Plan Demonstration Projects
references
1. Jack Stucky, Vehicle Maintenance Superintendent
2. U.S. Energy Information Administration. “The Impact of Increased Use of hydrogen on Petroleum Consumption and Carbon Dioxide Emissions” August 2008. http://www.eia.gov/oiaf/servicerpt/hydro/hydrogen.html
3. U.S. Department of Energy - Energy Efficiency and Renewable Energy – Fuel Cell Technologies Program. http://www1.eere.energy.gov/hydrogenandfuelcells/accomplishments.html
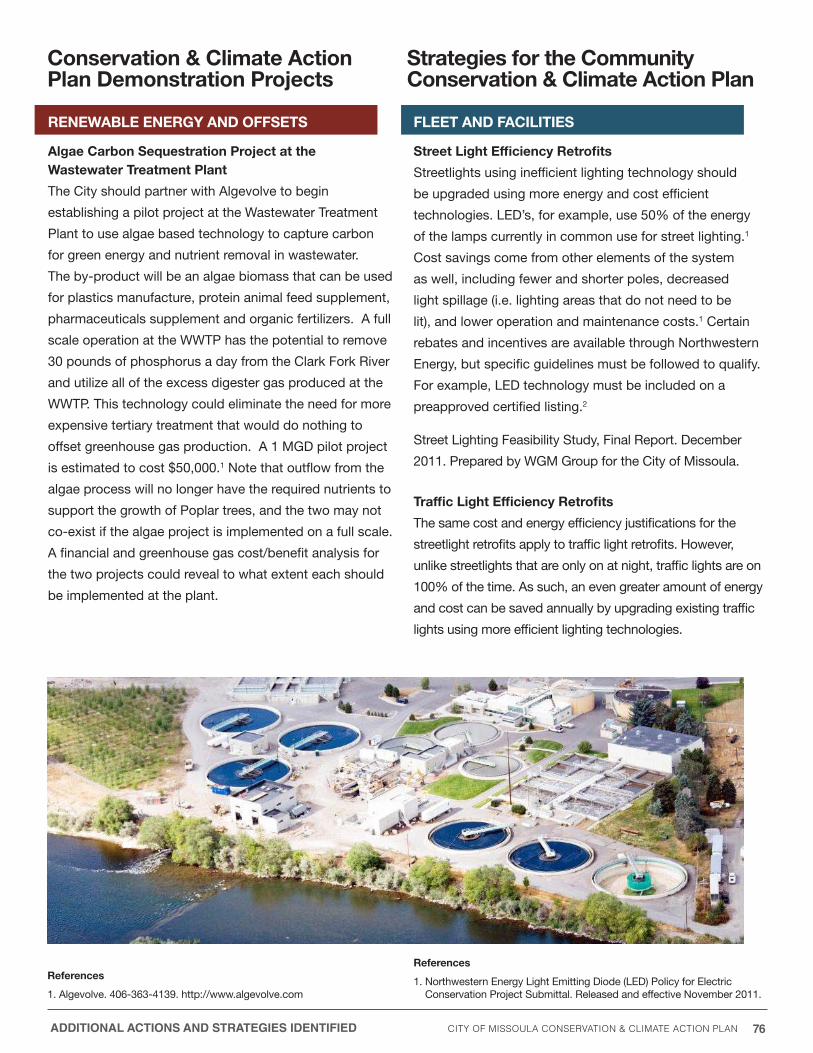
City of missoula Conservation & Climate aCtion Plan 76
Conservation & Climate action Plan Demonstration Projects
strategies for the Community Conservation & Climate action Plan
ADDITIONAL ACTIONS AND STRATEGIES IDENTIfIED
renewaBle enerGy anD offsets
algae Carbon sequestration Project at the wastewater treatment Plant
The City should partner with Algevolve to begin
establishing a pilot project at the Wastewater Treatment
Plant to use algae based technology to capture carbon
for green energy and nutrient removal in wastewater.
The by-product will be an algae biomass that can be used
for plastics manufacture, protein animal feed supplement,
pharmaceuticals supplement and organic fertilizers. A full
scale operation at the WWTP has the potential to remove
30 pounds of phosphorus a day from the Clark Fork River
and utilize all of the excess digester gas produced at the
WWTP. This technology could eliminate the need for more
expensive tertiary treatment that would do nothing to
offset greenhouse gas production. A 1 MGD pilot project
is estimated to cost $50,000.1 Note that outflow from the
algae process will no longer have the required nutrients to
support the growth of Poplar trees, and the two may not
co-exist if the algae project is implemented on a full scale.
A financial and greenhouse gas cost/benefit analysis for
the two projects could reveal to what extent each should
be implemented at the plant.
fleet anD faCilities
street light efficiency retrofits
Streetlights using inefficient lighting technology should
be upgraded using more energy and cost efficient
technologies. LED’s, for example, use 50% of the energy
of the lamps currently in common use for street lighting.1
Cost savings come from other elements of the system
as well, including fewer and shorter poles, decreased
light spillage (i.e. lighting areas that do not need to be
lit), and lower operation and maintenance costs.1 Certain
rebates and incentives are available through Northwestern
Energy, but specific guidelines must be followed to qualify.
For example, LED technology must be included on a
preapproved certified listing.2
Street Lighting Feasibility Study, Final Report. December
2011. Prepared by WGM Group for the City of Missoula.
traffic light efficiency retrofits
The same cost and energy efficiency justifications for the
streetlight retrofits apply to traffic light retrofits. however,
unlike streetlights that are only on at night, traffic lights are on
100% of the time. As such, an even greater amount of energy
and cost can be saved annually by upgrading existing traffic
lights using more efficient lighting technologies.
references
1. Algevolve. 406-363-4139. http://www.algevolve.com
references
1. Northwestern Energy Light Emitting Diode (LED) Policy for Electric Conservation Project Submittal. Released and effective November 2011.
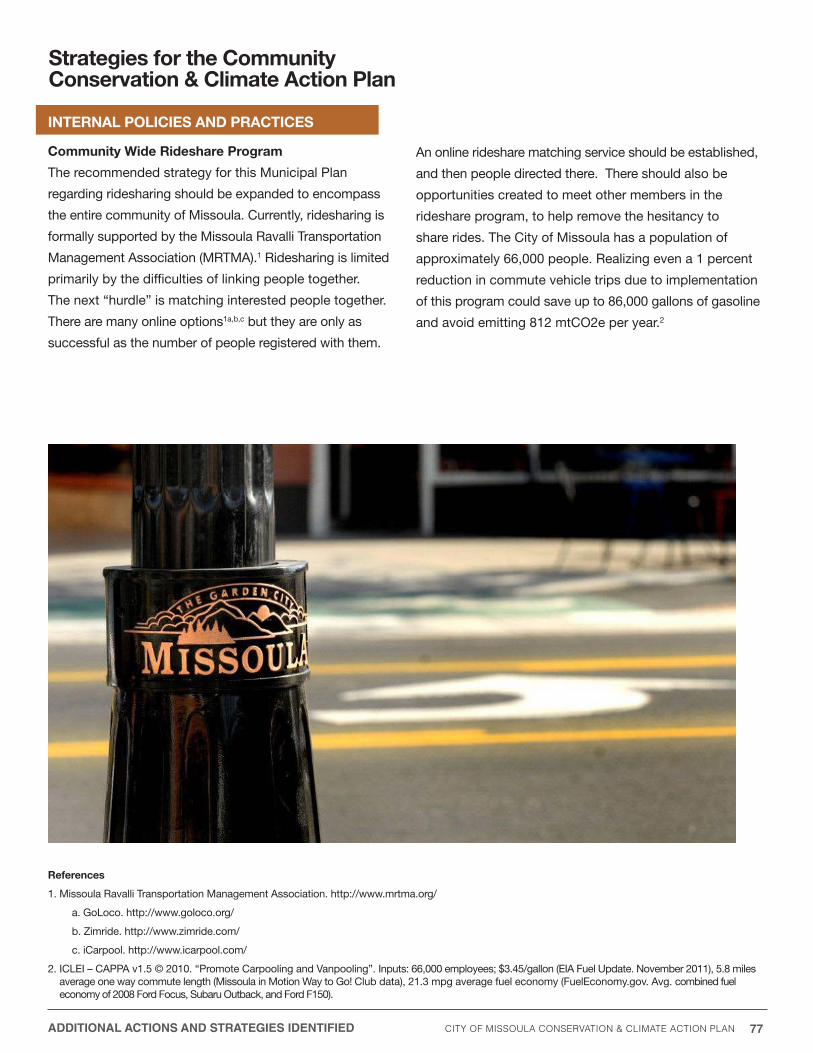
City of missoula Conservation & Climate aCtion Plan 77
strategies for the Community Conservation & Climate action Plan
ADDITIONAL ACTIONS AND STRATEGIES IDENTIfIED
internal PoliCies anD PraCtiCes
Community wide rideshare Program
The recommended strategy for this Municipal Plan
regarding ridesharing should be expanded to encompass
the entire community of Missoula. Currently, ridesharing is
formally supported by the Missoula Ravalli Transportation
Management Association (MRTMA).1 Ridesharing is limited
primarily by the difficulties of linking people together.
The next “hurdle” is matching interested people together.
There are many online options1a,b,c but they are only as
successful as the number of people registered with them.
An online rideshare matching service should be established,
and then people directed there. There should also be
opportunities created to meet other members in the
rideshare program, to help remove the hesitancy to
share rides. The City of Missoula has a population of
approximately 66,000 people. Realizing even a 1 percent
reduction in commute vehicle trips due to implementation
of this program could save up to 86,000 gallons of gasoline
and avoid emitting 812 mtCO2e per year.2
references
1. Missoula Ravalli Transportation Management Association. http://www.mrtma.org/
a. GoLoco. http://www.goloco.org/
b. Zimride. http://www.zimride.com/
c. iCarpool. http://www.icarpool.com/
2. ICLEI – CAPPA v1.5 © 2010. “Promote Carpooling and Vanpooling”. Inputs: 66,000 employees; $3.45/gallon (EIA Fuel Update. November 2011), 5.8 miles average one way commute length (Missoula in Motion Way to Go! Club data), 21.3 mpg average fuel economy (FuelEconomy.gov. Avg. combined fuel economy of 2008 Ford Focus, Subaru Outback, and Ford F150).

City of missoula Conservation & Climate aCtion Plan 78
strategies for the Community Conservation & Climate action Plan
renewaBle enerGy anD offsets
Community solar Pv Project
A community solar project can be defined as “a solar-
electric system that, through a voluntary program, provides
power and/or financial benefit to, or is owned by, multiple
community members.”1 Essentially, community members
interested in solar installations pool resources to build
a large, centralized project where economies of scale
come into play. Many different ownership models exist
depending upon the circumstances of the proposed
project. A compelling reason for such a project is that
many interested citizens may not be able to independently
install solar PV on their residences due to terrain obstacles
(tree, buildings), ownership issues (rental tenants or deed
restrictions) or financial reasons. Before setting up a
program, further research and public input should be used
to determine which model(s) would best fit the Missoula
Community. Models to explore include installations placed
on residences of some of the investors,2 or installations
placed in a separate, central location.1 The included
reference from the DOE1 provides detailed information on
several models and the differences in allocation of costs
and benefits of each.
Further investigations into tax incentives and credits
and utility incentives3,4,5 should also be included in future
development of such projects, which can significantly lower
implementation and life cycle costs.
wetland Development and riparian enhancement
Wetland Development and Riparian Enhancement strategies
have potential to act as an offset to the City’s Greenhouse
Gas emissions through carbon sequestration as well as
a source of renewable energy through aquatic biomass.
In addition, such strategies could contribute to improved
wastewater treatment and river health. Success of these
strategies would require application that includes City
property as well as adjacent lands not owned by the City.
The following sites are being presented as potential location
for implementation of strategies.
eko Compost and Clouse Property. EKO Compost is
located adjacent to the treatment plant and has land feasible
for wetland development. The Clouse Property is also within
close proximity to the treatment plant and located on the west
side of the EKO Compost Property. The Clouse Property is
currently being considered for a Poplar plantation to utilize
wastewater and operate a sustainable wood business.
The Clouse Property has additional lands that exist outside
the proposed plantation that may be useful for wetland
development or enhancement to the floodplain and riparian
areas. These areas and proposed strategies will provide
emissions offsetting, wastewater treatment, and / or wetland
mitigation / banking.
Grant and rattlesnake Creeks. Both creeks have
segments within the city limits. Sites may exist along
the floodplain and riparian areas with potential for
enhancements. These areas offer potential sites that
would provide emissions offsetting, wetland development
and the other intrinsic benefits for natural resources.
references
1. U.S. Department of Energy - Energy Efficiency and Renewable Energy. “A Guide to Community Solar: Utility, Private, and Non-profit Project Development.” November 2010.
2. “Clean Energy Collective, LLC, Colorado” Page 17.
3. Solarize Portland. http://www.portlandonline.com/bps/index.cfm?c=51902
4. Database of State Incentives for Renewables and Efficiency: Montana http://www.dsireusa.org/
5. Northwestern Energy E+/Renewable Energy Program. http://www.northwesternenergy.com/display.aspx?Page=Renewable_Energy_Program
ADDITIONAL ACTIONS AND STRATEGIES IDENTIfIED
City of missoula Conservation & Climate aCtion Plan 79
imPlementation

City of missoula Conservation & Climate aCtion Plan 80IMpLEMENTATION
establish a full-time, Dedicated staff
A dedicated, full-time staff member to oversee this Plan is
needed to successfully implement recommended strategies
across all departments and staff and produce the desired
results and expected benefits. This staff person would take
responsibility for coordinating the City’s conservation and
climate action efforts. The job functions would include:
providing vision and leadership in the implementation of
this plan, dedicating time to researching and developing
projects and activities not yet identified, researching and
establishing funding mechanisms, establishing metrics and
tracking systems to document the impact of the strategies,
fostering a culture of sustainability in City government,
communicating the City’s efforts to City committees and
to the public, and building coalitions and partnerships
within the community to further and amplify the City’s
efforts. Research on the impact of having staff oversight
of conservation and climate action plan implementation
and activities has shown that cities without a dedicated
staff member working to implement the plan have failed to
make progress towards interim and overall emissions goals.
Without a dedicated staff person to fulfill the duties listed
above, Missoula runs the same risk.
The Task Force recognizes that implementation success
increases with strong, top-down support and cross-
departmental collaboration therefore, it is recognized that
the Mayor/Administration and Administrative Leadership
Team (ALT) are to be tasked with identification of project
initiatives, priorities, and assessment of options in
coordination with dedicated, full-time energy conservation
staff. Each City department Director has the requisite
knowledge of their programs, staffing needs, service
delivery model, legal obligations, and costs to ensure
initiatives/projects can be appropriate and properly
integrated without negative impacts on legal obligations,
baseline services and budget, therefore individual
projects and initiatives must be the responsibility of the
corresponding Director of each City department with full
support, coordination and tracking by full-time, dedicated
energy conservation staff.
The importance of establishing a full-time, dedicated staff
to oversee the City of Missoula’s Conservation & Climate
Action Plan and associated activities was recognized
and approved in the budget for Fiscal year 2013 with
an FTE. Specific job description, details and hiring will
occur in fiscal year 2013. Once hired, the FTE will interact
and collaborate where appropriate with all levels of City
government including the Mayor/Administration, Staff,
City Council, Mayor’s Advisory Group on Climate Change
and Sustainability, Greenhouse Gas Energy Conservation
Team and stakeholders to ensure success.
At the Clark Fork Coalition, we believe that clean water is our community’s most vital natural asset. We’re excited to endorse and support the common-sense solutions outlined in this plan, which will help the City of Missoula to conserve water, reduce energy use, and save money.
- JILL ALBAN
City of missoula Conservation & Climate aCtion Plan 81IMpLEMENTATION
establish a Data monitoring and reporting system
Collecting data and reporting on the impacts of each strategy
is essential to the climate action planning process. Tracking
and monitoring provides evidence of energy, fuel, water, and
cost savings, feedback on project success, and progress
toward goals. In addition, it provides sound reasoning and
results to justify continued internal and external investment
and funding. This task must be conducted regularly, ideally
by the above mentioned FTE. Although some strategy
recommendations cannot be specifically quantified, the
majority can with thoughtful planning, software and other
technology application, and a responsible staff. The Task
Force believes that all are critical to maximizing efficiency,
saving money, maintaining a healthy environment, and
addressing climate change.
Programs and software should be used to monitor and
report on progress and establish new baseline measures of
greenhouse gas emissions. Using a third party software tool
will remove the time cost and burden of data management on
City staff. Data can be logged, organized, and presented using
software or via an online database for the user to download
and analyze. The graphs and tables that these systems
present can be used and directly inserted in reports and other
communications to City staff and the public as needed.
establish a timeline for updates, Presentations, and reports
Reporting on the City’s sustainability efforts should be
presented annually in a public forum. In addition, brief, informal
updates, especially regarding specific efforts and projects,
should be made to appropriate City committees, groups,
and staff as needed and when possible. Reporting and
communicating the City’s efforts to the public, specifically, is
essential. The Missoula community has provided invaluable
input and assistance with the development of this plan.
Reporting on the implementation of their efforts will validate
their work, increase stakeholder buy in, and help develop
partnerships that will be essential for future community-wide
efforts. Communication efforts should include a regularly
updated website, a newsletter, and potentially an annual public
“State of Sustainability” presentation.
establish a working timeline for implementation of the strategies
The above mentioned FTE should lay out a working timeline
for implementation of each strategy. This person should use
the established suites, or phases, included and described
in this document to guide this effort. The collection of
strategies should be continually assessed and updated. This
timeline should provide guidance, and should not restrict
implementation of other strategies should opportunity arise.
As described in ChAPTER 1, each strategy was placed in
a grouping, called “suites”, to be implemented within a set
time frame, acknowledging that availability of funding and
staff time will influence the actual timing of implementation.
The placement into the different suites was based on both
quantitative and qualitative factors. The quantitative factors
were primarily annual GhG reduction and simple payback.
The qualitative factors included simplicity of implementation,
pre-existence of groundwork related to the strategy,
ability to be a “quick win”, and time required for full scale
implementation. Once the suites were established, interim
GhG emission reductions goals were created based on the
reduction potential from the suites.
In the tables below, the Working Group and intended
implementation year are identified for each strategy included
in each suite. The table also details the interim reduction
goal and associated timeframe for each suite. Note that the
intended implementation year for some of the strategies
does not coincide with that suite’s time frame. This is due to
factors such as time to implement, and required background
work before implementation can begin. The implementation
year is the year that implementation is intended to begin,
acknowledging that some strategies will take longer than
one year to implement.

City of missoula Conservation & Climate aCtion Plan 82IMpLEMENTATION
working group StrategyIntended
Implementation yearInternal Policies and Practices Conservation and Sustainability in Work Plans and Annual Review 2013Fleet and Facilities Eco Drivers Manual 2013Fleet and Facilities Efficient Fleet Vehicle Purchasing (Fuel economy) 2013Internal Policies and Practices Employee Commuting Incentive Program 2013Fleet and Facilities Expand Route Optimization Software/GPS 2013Internal Policies and Practices Fostering Sustainable Workplace 2013Fleet and Facilities Hybrid/Electric Vehicle Purchasing 2013Internal Policies and Practices Include Sustainability in Employee Orientation 2013Internal Policies and Practices Paper and Printing Policies 2013Internal Policies and Practices Reduce Electronics Energy Use 2013Renewable Energy and Offsets Solar PV Installations on Municipal Buildings 2013Renewable Energy and Offsets Urban Tree Planting and Maintenance 2013Fleet and Facilities Continuous Building Retro and Re-commissioning for Existing Buildings 2014Renewable Energy and Offsets Enhance Methane Utilization at WWTP 2014Internal Policies and Practices Flexible Work Scheduling 2014Internal Policies and Practices Green Purchasing Policy 2014Renewable Energy and Offsets Solar Thermal Heating System and Thermal Pool Blanket at Splash
Montana and Similar Energy Efficiency Improvements at Currents2014
Fleet and Facilities LEED Existing Buildings: Operations & Maintenance Policy 2014
working group StrategyIntended
Implementation yearFleet and Facilities Real-time Energy Monitoring Systems 2016Fleet and Facilities Bike Fleet Infrastructure 2016Internal Policies and Practices Include Conservation and Sustainability in Job Descriptions 2016Internal Policies and Practices LEED for New Construction and Major Renovations Policy 2016Internal Policies and Practices Rideshare Scheduling plan for Employees 2016Fleet and Facilities Shut Off/ Remove Water Fountain Cooling 2016Internal Policies and Practices Waste Stream Reduction Policy 2016Fleet and Facilities Water Wise Bathroom Features 2016Fleet and Facilities Sustainable Commute Infrastructure (Bike, etc) 2017Fleet and Facilities Utilize Cleaner Fuels 2017
Table 4-1: Suite 1 Strategies and Intended Implementation yearssuite 1 Goal: achieve 10% reduction from 2008 baseline by 2015
Table 4-2: Suite 2 Strategies and Intended Implementation yearssuite 2 Goal: achieve 30% reduction from 2008 baseline by 2017
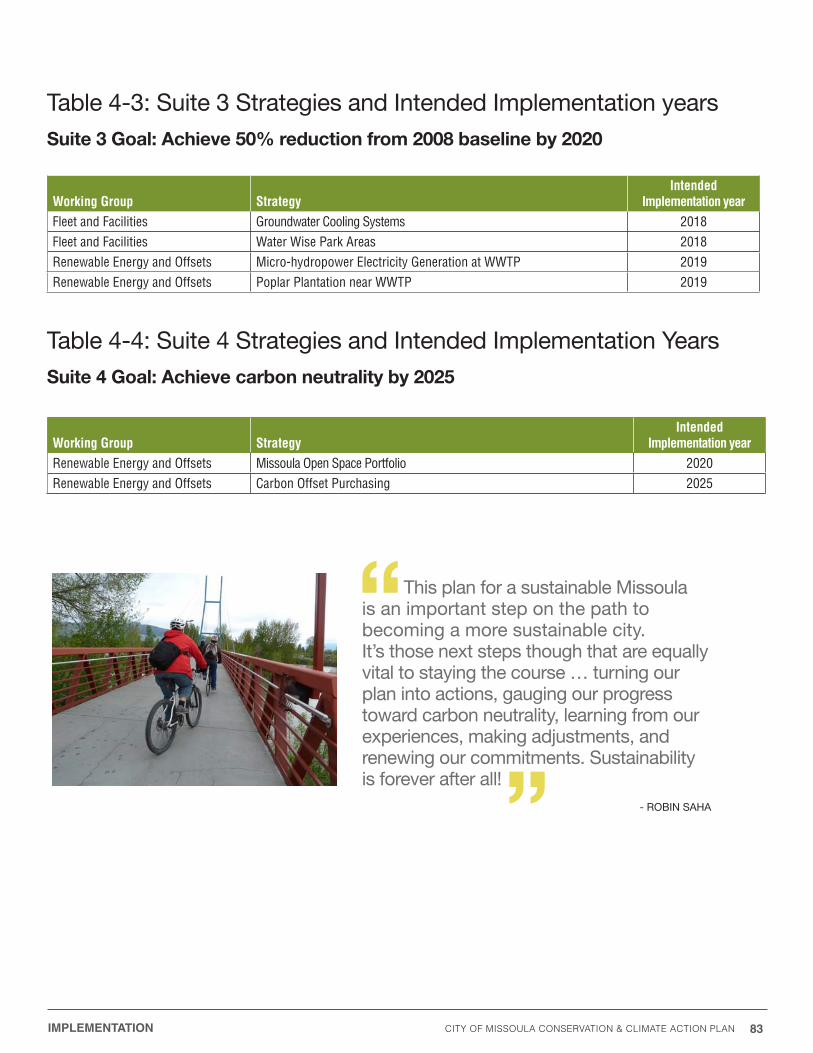
City of missoula Conservation & Climate aCtion Plan 83IMpLEMENTATION
Table 4-3: Suite 3 Strategies and Intended Implementation yearssuite 3 Goal: achieve 50% reduction from 2008 baseline by 2020
Table 4-4: Suite 4 Strategies and Intended Implementation yearssuite 4 Goal: achieve carbon neutrality by 2025
working group StrategyIntended
Implementation yearFleet and Facilities Groundwater Cooling Systems 2018Fleet and Facilities Water Wise Park Areas 2018Renewable Energy and Offsets Micro-hydropower Electricity Generation at WWTP 2019Renewable Energy and Offsets Poplar Plantation near WWTP 2019
working group StrategyIntended
Implementation yearRenewable Energy and Offsets Missoula Open Space Portfolio 2020Renewable Energy and Offsets Carbon Offset Purchasing 2025
This plan for a sustainable Missoula is an important step on the path to becoming a more sustainable city. It’s those next steps though that are equally vital to staying the course … turning our plan into actions, gauging our progress toward carbon neutrality, learning from our experiences, making adjustments, and renewing our commitments. Sustainability is forever after all!
- ROBIN SAhA

City of missoula Conservation & Climate aCtion Plan 84IMpLEMENTATION
establish a review Cycle for the action Plan
This Action Plan is a living document, and should be
continually updated. As mentioned in ChAPTER 1,
advances and changes in technology, pricing, and
incentives will affect the impacts and cost effectiveness of
the strategies included in this plan, as well as present new
opportunities and strategies that will contribute to achieving
the interim and carbon neutrality goals. These newly
identified strategies should be included in future versions of
the plan and implemented on an opportunistic basis. Formal
publication of revisions to this plan should be produced
every other year, starting in 2014.
establish a timeline for updating the Greenhouse Gas inventory
Missoula’s Municipal Greenhouse Gas Inventory needs
updating. City operations are dynamic and constantly
changing, and concerted efforts have been made to reduce
the City’s emissions since the inventory was published.
Continually updating the inventory as new data and methods
become available will help track and show progress and
allow for analysis of the effectiveness of each strategy. It will
help identify areas for improvement and continue to guide
the timing and implementation of new and documented
strategies. The Task Force recommends that the Inventory for
municipal operations be regularly updated every two years
starting in 2013 to offset revisions of the Action Plan. After the
2013 update, the two year update cycle should be evaluated
for feasibility by the Administration and City staff, and
lengthened if a longer update cycle is deemed more effective
and economically viable.
establish a Budget and financing strategy
This plan presents a wide variety of strategies, and thus
requires a robust mix of funding mechanisms. Many
recommendations will require both financial and human
investment. One of the primary functions of the dedicated
City staff in charge of conservation and climate action
activities will be to research and establish funding and
financing mechanisms needed to implement strategies.
Below is a list of commonly used mechanisms to be
included and used as appropriate and available.
• Integration and Inclusion in annual City Budget
• Grants
• Energy Savings Performance Contracts
• Bonds
• Revolving Loan Funds
• Utility Rebates and Incentives
• Reinvestment of Rebates, Incentives, and/or Energy Savings*
• Public/Private Partnerships
*The Task Force strongly recommends incentivizing departmental action by reinvesting all or part of rebates, incentives and savings into the department responsible for additional energy saving/emissions reduction activities.
Creating a sustainable community takes collaboration like the partnership between UM, the City, and other community members to develop Missoula’s Conservation & Climate Action Plan.
- ChERIE PEACOCK
City of missoula Conservation & Climate aCtion Plan 85
aPPenDix

City of missoula Conservation & Climate aCtion Plan 86AppENDIx
abbreviations
BTU British Thermal Unit (measure of heat energy,
roughly equivalent to the amount of energy in a
kitchen match)
CAP Climate Action Plan
CAPPA Climate and Air Pollution Planning Assistant
(produced by ICLEI)
CO2e CO2 equivalent
DKT Dekatherms (10 therms)
FF Fleet and Facilities (reference to working group)
GhG Greenhouse Gas
GhGEC Greenhouse Gas and Energy Conservation Team
ICLEI International Council for Local Environmental
Initiatives (goes by ICLEI - Local Governments
for Sustainability)
IPP Internal Policies and Practices (reference
to working group)
kW Kilowatt (1,000 watts of power)
kWh Kilowatt-hour (1kW of power used for one hour)
MCCAP Municipal Conservation and Climate Action Plan
mt Metric tons or “tonnes” (1 mt = 2,204 lbs)
MWh Megawatt-hour (1,000 kWh)
PV Photovoltaic (Type of solar electrical energy
generation)
REO Renewable Energy and Offsets (reference to
working group)
Th Therms (10,000 BTU’s of heat energy)
key Definitions
Climate Change: Climate change refers to any significant
change in the measures of climate lasting for an extended
period of time. In other words, climate change includes
major changes in temperature, precipitation, or wind
patterns, among others, that occur over several decades or
longer.13
Carbon Dioxide equivalent (Co2e): the common unit used
to express the global warming potential for greenhouse
gases. A unit of CO2e is the amount of CO2 that would be
needed to produce the equivalent warming effect as a given
amount of another greenhouse gases. CO2 is used because
it is the most common of the greenhouse gases.
Carbon neutrality: through conservation and reduction
measures, along with the purchase of Carbon Offsets, net
greenhouse gas emissions will be zero. Achieving carbon
neutrality requires the purchase of some form of Carbon
Offsets to account for emissions that remain after conservation
and other forms of reduction have been fully explored.
Carbon offset: one metric ton of carbon dioxide equivalent
(CO2e) that is taken out of the atmosphere, or one metric
ton of CO2e that is not emitted to the atmosphere. Carbon
Offsets are generated by carbon sequestration or emissions
reduction activities that are quantified, reported, verified,
validated, and certified via the regulatory or voluntary market.12
Greenhouse Gas: Any gas that absorbs infrared radiation in
the atmosphere. Greenhouse gases include, carbon dioxide,
methane, nitrous oxide, ozone, chlorofluorocarbons,
hydrochlorofluorocarbons, hydrofluorocarbons,
perfluorocarbons, sulfur hexafluoride.
Global warming Potential: A measure of the total energy
that a gas absorbs over a particular period of time (usually
100 years), compared to carbon dioxide.13
aPPenDix
references
12. ClearSky Climate Solutions: www.clearskyclimatesolutions.com
13. Environmental Protection Agency: http://epa.gov/climatechange/glossary.html#G
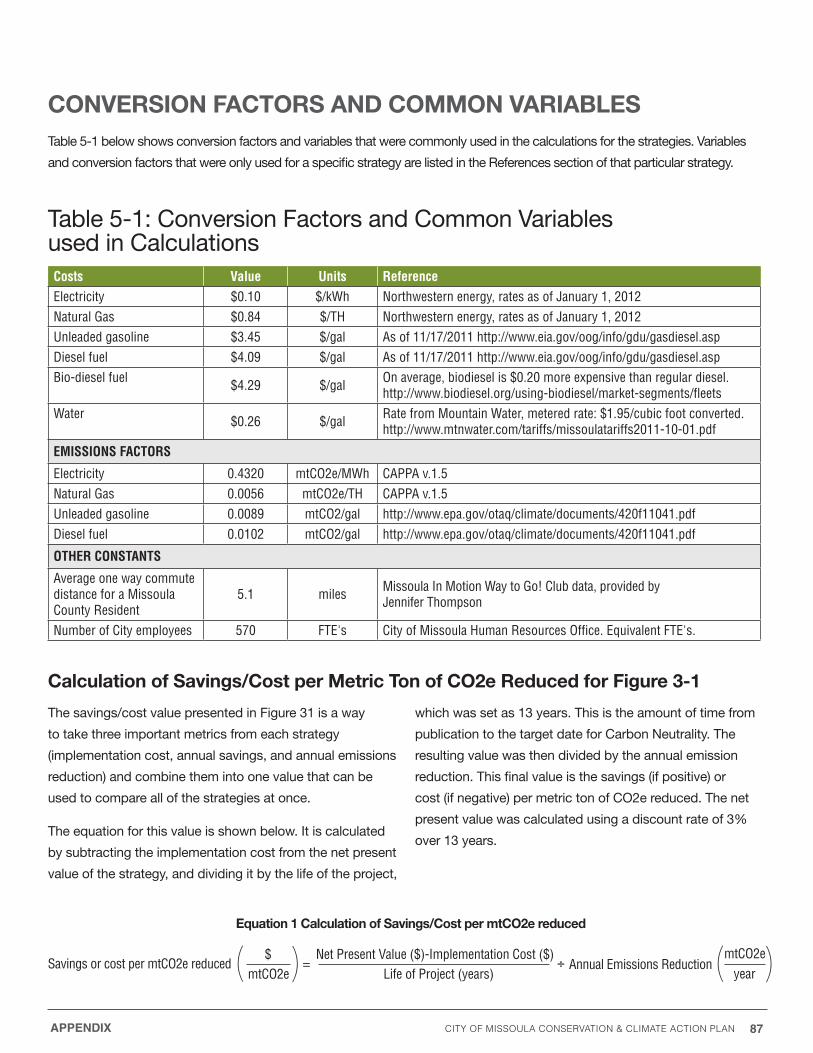
City of missoula Conservation & Climate aCtion Plan 87AppENDIx
The savings/cost value presented in Figure 31 is a way
to take three important metrics from each strategy
(implementation cost, annual savings, and annual emissions
reduction) and combine them into one value that can be
used to compare all of the strategies at once.
The equation for this value is shown below. It is calculated
by subtracting the implementation cost from the net present
value of the strategy, and dividing it by the life of the project,
which was set as 13 years. This is the amount of time from
publication to the target date for Carbon Neutrality. The
resulting value was then divided by the annual emission
reduction. This final value is the savings (if positive) or
cost (if negative) per metric ton of CO2e reduced. The net
present value was calculated using a discount rate of 3%
over 13 years.
Conversion faCtors anD Common variaBlesTable 5-1 below shows conversion factors and variables that were commonly used in the calculations for the strategies. Variables
and conversion factors that were only used for a specific strategy are listed in the References section of that particular strategy.
Table 5-1: Conversion Factors and Common Variables used in CalculationsCosts Value units referenceElectricity $0.10 $/kWh Northwestern energy, rates as of January 1, 2012Natural Gas $0.84 $/TH Northwestern energy, rates as of January 1, 2012Unleaded gasoline $3.45 $/gal As of 11/17/2011 http://www.eia.gov/oog/info/gdu/gasdiesel.aspDiesel fuel $4.09 $/gal As of 11/17/2011 http://www.eia.gov/oog/info/gdu/gasdiesel.aspBio-diesel fuel $4.29 $/gal On average, biodiesel is $0.20 more expensive than regular diesel.
http://www.biodiesel.org/using-biodiesel/market-segments/fleetsWater $0.26 $/gal Rate from Mountain Water, metered rate: $1.95/cubic foot converted.
http://www.mtnwater.com/tariffs/missoulatariffs2011-10-01.pdf
EmISSIOnS FACtOrS
Electricity 0.4320 mtCO2e/MWh CAPPA v.1.5Natural Gas 0.0056 mtCO2e/TH CAPPA v.1.5Unleaded gasoline 0.0089 mtCO2/gal http://www.epa.gov/otaq/climate/documents/420f11041.pdfDiesel fuel 0.0102 mtCO2/gal http://www.epa.gov/otaq/climate/documents/420f11041.pdf
OthEr COnStAntS
Average one way commute distance for a Missoula County Resident
5.1 miles Missoula In Motion Way to Go! Club data, provided by Jennifer Thompson
Number of City employees 570 FTE's City of Missoula Human Resources Office. Equivalent FTE's.
Savings or cost per mtCO2e reduced =$ Net Present Value ($)-Implementation Cost ($)
mtCO2emtCO2e
yearLife of Project (years)Annual Emissions Reduction
equation 1 Calculation of savings/Cost per mtCo2e reduced
Calculation of savings/Cost per metric ton of Co2e reduced for figure 3-1

Conservation & Climate aCtion Plan | Office of the Mayor | City of Missoula | (406) 552-6001