Embed Size (px)
Citation preview

SINGLE AUDIT REPORTFOR THE YEAR ENDED JUNE 30, 2010
CITY OF OAKLAND,C A L I F O R N I A
CITY OF OAKLAND CALIFORNIA
SINGLE AUDIT REPORT FISCAL YEAR ENDED JUNE 30, 2010
PREPARED BY THE FINANCE AND MANAGEMENT AGENCY
JOSEPH T. YEW, JR DIRECTOR OSBORN K. SOLITEI CONTROLLER
PRINTED ON RECYCLED PAPER

SINGLE AUDIT REPORT
FISCAL YEAR ENDED JUNE 30, 2010
TABLE OF CONTENTS Page FINANCIAL SECTION
Independent Auditor’s Report ............................................................................................ 1
Management’s Discussion and Analysis ............................................................................ 3
BASIC FINANCIAL STATEMENTS: Government-wide Financial Statements:
Statement of Net Assets .......................................................................................... 19 Statement of Activities ........................................................................................... 20 Fund Financial Statements: Balance Sheet – Governmental Funds .................................................................... 21 Reconciliation of Governmental Funds Balance Sheet to the Statement of Net Assets for Governmental Activities ...................................... 22 Statement of Revenues, Expenditures and Changes in Fund Balances – Governmental Funds…..………………………….. ......................... ………… 23 Reconciliation of the Statement of Revenues, Expenditures and Changes in Fund Balances of Governmental Funds to the Statement of Activities of Governmental Activities ................................................................................... 24 Statement of Fund Net Assets – Proprietary Funds ................................................ 25 Statement of Revenues, Expenses and Changes in Fund Net Assets – Proprietary Funds ........................................................................ 26 Statement of Cash Flows – Proprietary Funds ....................................................... 27 Statement of Fiduciary Net Assets – Fiduciary Funds ........................................... 28 Statement of Changes in Fiduciary Net Assets – Fiduciary Funds ........................ 29
Page
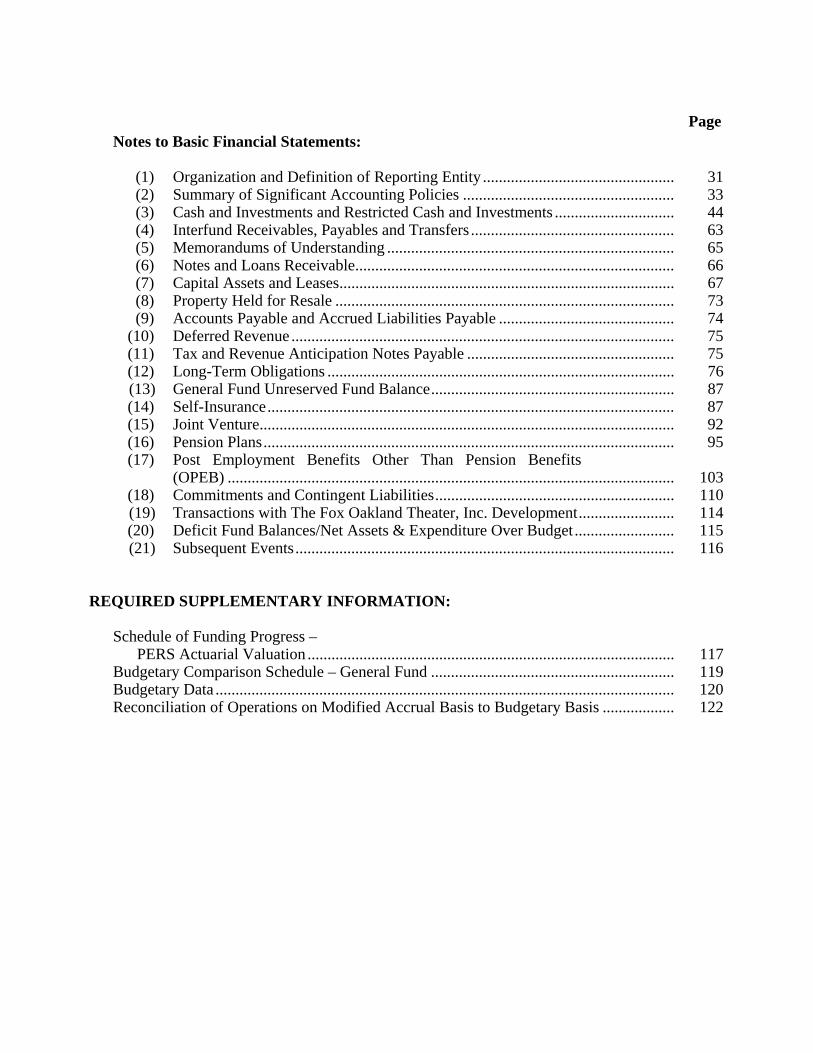
Notes to Basic Financial Statements: (1) Organization and Definition of Reporting Entity ................................................ 31 (2) Summary of Significant Accounting Policies ..................................................... 33 (3) Cash and Investments and Restricted Cash and Investments .............................. 44 (4) Interfund Receivables, Payables and Transfers ................................................... 63 (5) Memorandums of Understanding ........................................................................ 65 (6) Notes and Loans Receivable ................................................................................ 66 (7) Capital Assets and Leases .................................................................................... 67 (8) Property Held for Resale ..................................................................................... 73 (9) Accounts Payable and Accrued Liabilities Payable ............................................ 74 (10) Deferred Revenue ................................................................................................ 75 (11) Tax and Revenue Anticipation Notes Payable .................................................... 75 (12) Long-Term Obligations ....................................................................................... 76 (13) General Fund Unreserved Fund Balance ............................................................. 87 (14) Self-Insurance ...................................................................................................... 87 (15) Joint Venture ........................................................................................................ 92 (16) Pension Plans ....................................................................................................... 95 (17) Post Employment Benefits Other Than Pension Benefits
(OPEB) ................................................................................................................ 103 (18) Commitments and Contingent Liabilities ............................................................ 110 (19) Transactions with The Fox Oakland Theater, Inc. Development ........................ 114 (20) Deficit Fund Balances/Net Assets & Expenditure Over Budget ......................... 115 (21) Subsequent Events ............................................................................................... 116
REQUIRED SUPPLEMENTARY INFORMATION: Schedule of Funding Progress – PERS Actuarial Valuation ............................................................................................ 117 Budgetary Comparison Schedule – General Fund ............................................................. 119 Budgetary Data ................................................................................................................... 120 Reconciliation of Operations on Modified Accrual Basis to Budgetary Basis .................. 122
Page
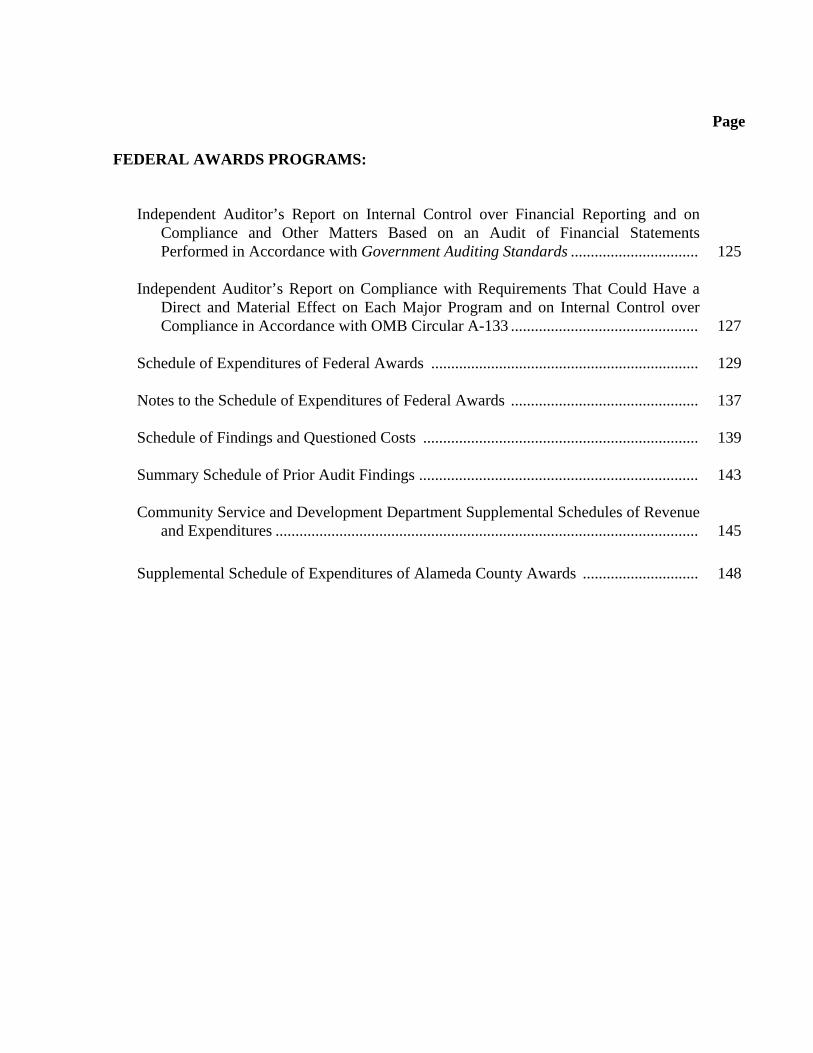
FEDERAL AWARDS PROGRAMS:
Independent Auditor’s Report on Internal Control over Financial Reporting and on
Compliance and Other Matters Based on an Audit of Financial Statements Performed in Accordance with Government Auditing Standards ................................ 125
Independent Auditor’s Report on Compliance with Requirements That Could Have a
Direct and Material Effect on Each Major Program and on Internal Control over Compliance in Accordance with OMB Circular A-133 ............................................... 127
Schedule of Expenditures of Federal Awards ................................................................... 129 Notes to the Schedule of Expenditures of Federal Awards ............................................... 137 Schedule of Findings and Questioned Costs ..................................................................... 139 Summary Schedule of Prior Audit Findings ...................................................................... 143 Community Service and Development Department Supplemental Schedules of Revenue
and Expenditures .......................................................................................................... 145
Supplemental Schedule of Expenditures of Alameda County Awards ............................. 148
CITY OF OAKLAND SINGLE AUDIT REPORT
PROJECT TEAM
Joseph T. Yew, Jr Osborn K. Solitei Finance Director/City Treasurer Controller
AUDIT/FINANCIAL STATEMENT COORDINATOR
Osborn K. Solitei, Controller
FINANCIAL STATEMENT PREPARATION
Financial Statement Leaders
Theresa Woo Felipe Kiocho Acting Financial Analyst Accountant III
Accounting Team
Connie L. Chu Erico Parras Rogelio Medalla Jennifer Luong Michelle Wong Andy Yang David Warner
ADMINISTRATIVE SUPPORT
Deborah Griffin, Administrative Assistant
SPECIAL ASSISTANCE
Donna Treglown Katano Kasaine Gregoria Torres Sharon Holman
SPECIAL ASSISTANCE - DEPARTMENTS & OFFICES
City Administrator’s Office City Attorney’s Office Police Services Community & Economic Development Agency, Human Services

FINANCIAL SECTION

1
Honorable Mayor and Members of the City Council City of Oakland, California
Independent Auditor’s Report We have audited the accompanying financial statements of the governmental activities, the business-type activities, the discretely presented component unit, each major fund, and the aggregate remaining fund information of the City of Oakland, California (City), as of and for the year ended June 30, 2010, which collectively comprise the City’s basic financial statements as listed in the table of contents. These financial statements are the responsibility of the City’s management. Our responsibility is to express opinions on these financial statements based on our audit. We did not audit the financial statements of the Oakland Municipal Employees Retirement System (OMERS) and the Oakland Police and Fire Retirement System (PFRS), which collectively represent 57%, 69% and 16%, respectively, of the assets, net assets/fund balances, and revenues/additions of the aggregate remaining fund information as of and for the year ended June 30, 2010. The OMERS and PFRS financial statements were audited by other auditors whose reports thereon have been furnished to us, and our opinion, insofar as it relates to the amounts included for those entities, is based on the report of the other auditors. We conducted our audit in accordance with auditing standards generally accepted in the United States of America and the standards applicable to financial audits contained in Government Auditing Standards, issued by the Comptroller General of the United States. Those standards require that we plan and perform the audit to obtain reasonable assurance about whether the financial statements are free of material misstatement. An audit includes consideration of internal control over financial reporting as a basis for designing audit procedures that are appropriate in the circumstances, but not for the purpose of expressing an opinion on the effectiveness of the City’s internal control over financial reporting. Accordingly, we express no such opinion. An audit also includes examining, on a test basis, evidence supporting the amounts and disclosures in the financial statements, assessing the accounting principles used and the significant estimates made by management, as well as evaluating the overall financial statement presentation. We believe that our audit and the reports of the other auditors provide a reasonable basis for our opinions. In our opinion, based on our audit and the reports of the other auditors, the financial statements referred to above present fairly, in all material respects, the respective financial position of the governmental activities, the business-type activities, the discretely presented component unit, each major fund, and the aggregate remaining fund information of the City as of June 30, 2010, and the respective changes in financial position and, where applicable, cash flows thereof for the year then ended in conformity with accounting principles generally accepted in the United States of America.
2
As discussed in Note 2 to the basic financial statements, the City adopted the provisions of Governmental Accounting Standards Board (GASB) Statement No. 51, Accounting and Financial Reporting for Intangible Assets, and GASB Statement No. 53, Accounting and Financial Reporting for Derivative Instruments, effective July 1, 2009. In accordance with Government Auditing Standards, we have also issued our report dated December 8, 2010, on our consideration of the City’s internal control over financial reporting and on our tests of its compliance with certain provisions of laws, regulations, contracts, and grant agreements and other matters. The purpose of that report is to describe the scope of our testing of internal control over financial reporting and compliance and the results of that testing, and not to provide an opinion on the internal control over financial reporting or on compliance. That report is an integral part of an audit performed in accordance with Government Auditing Standards and should be considered in assessing the results of our audit. The management’s discussion and analysis, the schedules of funding progress and the budgetary comparison information for the general fund listed in the table of contents are not a required part of the basic financial statements but are supplementary information required by accounting principles generally accepted in the United States of America. We have applied certain limited procedures, which consisted principally of inquiries of management regarding the methods of measurement and presentation of the required supplementary information. However, we did not audit the information and express no opinion on it. Our audit was conducted for the purpose of forming opinions on the financial statements that collectively comprise the City’s basic financial statements. The schedule of expenditures of federal awards, supplemental schedules of revenue and expenditures prepared by the City’s Department of Human Services, and supplemental schedule of expenditures of Alameda County Awards are presented for purposes of additional analysis as required by U.S. Office of Management and Budget (OMB) Circular A-133, the State of California Department of Community Service and Development, and the County of Alameda, respectively, and are not a required part of the basic financial statements. Such information has been subjected to the auditing procedures applied in the audit of basic financial statements and, in our opinion, is fairly stated, in all material respects, in relation to the basic financial statements taken as a whole. Certified Public Accountants Oakland, California December 8, 2010

3
MANAGEMENT’S DISCUSSION AND ANALYSIS This section of the City of Oakland’s (the City) Comprehensive Annual Financial Report presents a narrative overview and analysis of the financial activities of the City for the fiscal year ended June 30, 2010. We encourage readers to consider the information presented here in conjunction with the additional information contained in the City’s financial statements and related notes and our letter of transmittal that precedes this section.
FINANCIAL HIGHLIGHTS
• The City’s total assets exceeded its total liabilities by $689.3 million as of June 30, 2010, compared to $735.0 million at June 30, 2009. This represents a net decrease of $64.7 million or 8.6 percent compared to the previous year. Assets decreased by 0.9 percent or net of $27.4 million, the net decrease is primarily attributed to a decrease of net pension assets in the amount of $43.8 million to reflect annual pension cost, an increase in capital assets by $32.6 million and an offset of a combined decrease of $60.9 million in pooled and restricted cash and investments attributable to spending bond proceeds for capital improvement. Conversely, liabilities increased by 1.7 percent or $37.3 million compared to the prior fiscal year primarily as a result of debt issuance for a total of $67.7 million and interest rate swap agreement negative fair value of $19.1 million.
• The City’s governmental cumulative fund balances decreased by 3.0 percent or
$31.9 million to $1,044.4 million compared to $1,076.3 million for the prior fiscal year. This decrease is primarily attributed to a $39.2 million or 3.6 percent increase in overall governmental expenditures for its operations and a $17.7 million or 1.9 percent the decrease in overall governmental revenue.
• As of June 30, 2010, the City had total long-term obligations outstanding of $2.0
billion compared to $1.99 billion outstanding for the prior fiscal year for an increase of 0.6 percent or $11.4 million. Of this amount, $366.2 million is general obligation bonds backed by the full faith and credit of the City. The remaining $1.63 billion is comprised of various long-term debt instruments including accruals of year-end estimates for other long-term liabilities.
• The City’s General Fund unreserved/undesignated fund balance at June 30, 2010
was $41.4 million compared to $40.7 million for the previous year, an increase of 1.7 percent or $0.7 million. The unreserved/undesignated fund balance met the requirements of the City Council’s 7.5% reserve policy based on the total General Fund expenditures for fiscal year 2010.
4
OVERVIEW OF THE FINANCIAL STATEMENTS This discussion and analysis are intended to introduce the City’s basic financial statements. The City’s basic financial statements consist of four components:
• Government-wide Financial Statements • Fund Financial Statements • Notes to the Basic Financial Statements • Required Supplemental Information
In addition this report also contain other supplementary information. Government-wide Financial Statements The government-wide financial statements are designed to provide readers with a broad overview of the City’s finances, in a manner similar to the financial statements for a private-sector business. The statement of net assets presents information on all of the City’s assets and liabilities, with the difference between the two reported as net assets. Over time, increases or decreases in net assets may serve as a useful indicator of whether or not the financial position of the City is improving or deteriorating. The statement of activities presents information showing how the City’s net assets changed during the most recent fiscal year. All changes in net assets are reported as soon as the underlying event giving rise to the change occurs, regardless of the timing of the related cash flows. Thus, revenues and expenses are reported in this statement for some items that will only result in cash flows in future fiscal periods, such as revenues pertaining to uncollected taxes and expenses pertaining to earned but unused vacation and sick leave. Both of the government-wide financial statements distinguish functions of the City that are principally supported by taxes and intergovernmental revenues (governmental activities) from other functions that are intended to recover all or a significant portion of their costs through user fees and charges (business-type activities). The governmental activities of the City include general government, public safety, life enrichment, community and economic development, and public works. The business-type activities of the City include the sewer service system and the parks and recreation. Fund Financial Statements The fund financial statements are designed to report information about groupings of related accounts that are used to maintain control over resources that have been segregated for specific activities or objectives. The City, like other state and local governments, uses fund accounting to ensure and demonstrate compliance with finance-

5
related legal requirements. All of the funds of the City can be divided into the following three categories: governmental funds, proprietary funds and fiduciary funds. Governmental funds. Governmental funds are used to account for essentially the same functions reported as governmental activities in the government-wide financial statements. Most of the City’s basic services are reported in governmental funds. However, unlike the government-wide financial statements, governmental fund financial statements focus on the near-term inflows and outflows of spendable resources, as well as on the balances of spendable resources available at the end of the fiscal year. Such information may be useful in evaluating the City’s near-term financing requirements. Because the focus of governmental funds is narrower than that of the government-wide financial statements, it is useful to compare the information presented for governmental funds with similar information presented for governmental activities in the government-wide financial statements. By doing so, readers may better understand the long-term impact of the City’s near-term financing decisions. Both the governmental fund balance sheet and the governmental fund statement of revenues, expenditures and changes in fund balances provide a reconciliation to facilitate this comparison between governmental funds and governmental activities. The City maintains several individual governmental funds organized according to their type (special revenue, capital projects, debt service and general fund). Information is presented separately in the governmental fund balance sheet and in the governmental fund statement of revenues, expenditures and changes in fund balances for the general fund, federal and state grant special revenue fund, Oakland Redevelopment Agency (Agency) as a blended component unit of the City, and municipal capital improvement fund, all of which are considered to be major funds. Data from the remaining funds are combined in a single, aggregated presentation. Individual fund data for each of the non-major governmental funds is provided in the form of combining statements elsewhere in this report. The City adopts an annual appropriated budget for its general fund. A budgetary comparison schedule has been provided for the general fund in the required supplementary information to demonstrate compliance with this budget. Proprietary funds. Proprietary funds are generally used to account for services for which the City charges customers, either outside customers or internal units or departments of the City. Proprietary funds provide the same type of information shown in the government-wide statements only in more detail. The City maintains the following two types of proprietary funds:
Enterprise funds are used to report the same functions presented as business-type activities in the government-wide financial statements. The City uses enterprise funds to account for the operations of the Sewer Service System and the Parks and Recreation operations. The Sewer Service Fund is considered to be a major fund of the City.
6
Internal service funds are used to report activities that provide services and supplies for certain City programs and activities. The City uses internal service funds to account for its fleet of vehicles, radio and communication equipment, facilities management, printing and reproduction, central stores and purchasing. Because these services predominantly benefit governmental rather than business-type functions, they have been included within governmental activities in the government-wide financial statements. The internal service funds are combined into a single, aggregated presentation in the proprietary fund financial statements. Individual fund data for the internal service funds is provided in the form of combining statements elsewhere in this report.
Fiduciary funds. Fiduciary funds are used to account for resources held for the benefit of employees and parties outside the City. The Oakland Municipal Employees Retirement System (OMERS) Fund and the Police and Fire Retirement System (PFRS) Fund are reported as pension trust funds. The private purpose trust fund along with the private pension trust fund are reported as trust funds since their resources are not available to support the City’s own programs. For this reason, they are not reflected in the government-wide financial statements. The accounting used for fiduciary funds is much like that used for proprietary funds. Notes to the Basic Financial Statements The notes to the basic financial statements provide additional information that is essential to a full understanding of the data provided in the government-wide and fund financial statements. Required Supplementary Information The required supplementary information includes the budgetary schedule for the General Fund and schedules of funding progress for pension and other postemployment benefits that show the City’s progress towards funding its obligation to provide future pension and other postemployment benefits for its active and retired employees. Other Information In addition, this report presents combining statements referred to earlier in connection with nonmajor governmental funds, internal service funds and fiduciary funds are immediately following the required supplementary information along with budgetary comparison schedules.
7
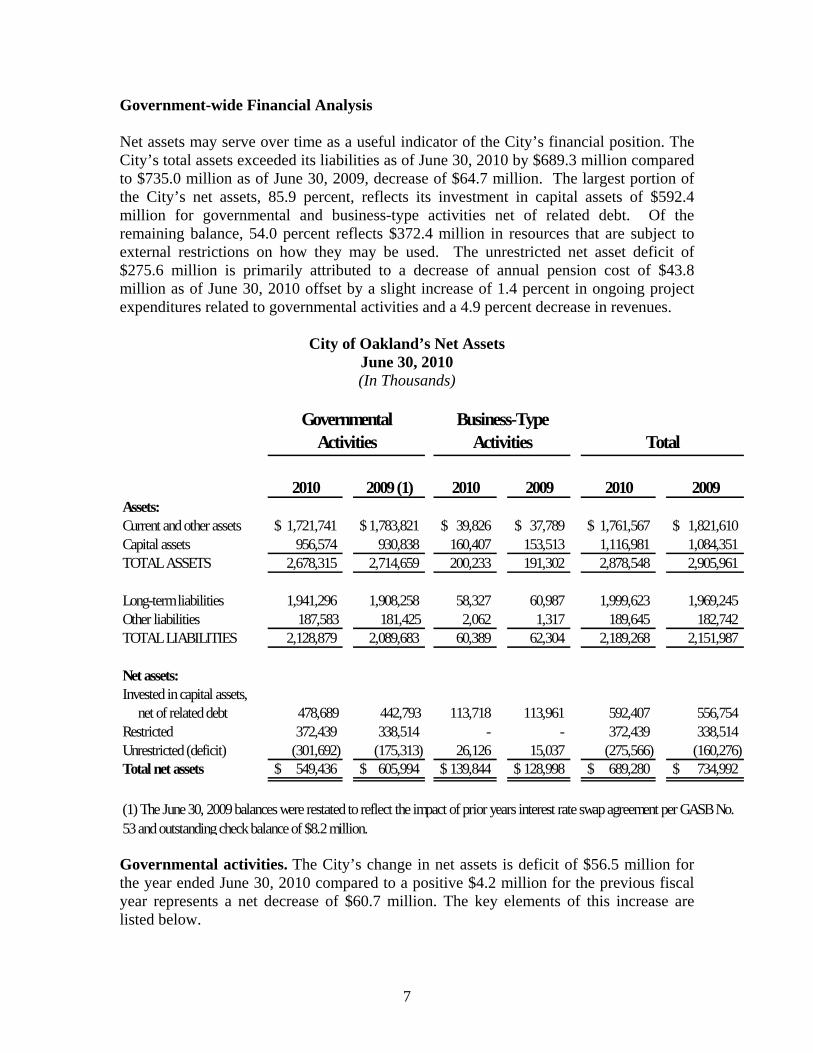
Government-wide Financial Analysis Net assets may serve over time as a useful indicator of the City’s financial position. The City’s total assets exceeded its liabilities as of June 30, 2010 by $689.3 million compared to $735.0 million as of June 30, 2009, decrease of $64.7 million. The largest portion of the City’s net assets, 85.9 percent, reflects its investment in capital assets of $592.4 million for governmental and business-type activities net of related debt. Of the remaining balance, 54.0 percent reflects $372.4 million in resources that are subject to external restrictions on how they may be used. The unrestricted net asset deficit of $275.6 million is primarily attributed to a decrease of annual pension cost of $43.8 million as of June 30, 2010 offset by a slight increase of 1.4 percent in ongoing project expenditures related to governmental activities and a 4.9 percent decrease in revenues.
City of Oakland’s Net Assets June 30, 2010 (In Thousands)
2010 2009 (1) 2010 2009 2010 2009Assets:Current and other assets 1,721,741$ 1,783,821$ 39,826$ 37,789$ 1,761,567$ 1,821,610$ Capital assets 956,574 930,838 160,407 153,513 1,116,981 1,084,351 TOTAL ASSETS 2,678,315 2,714,659 200,233 191,302 2,878,548 2,905,961
Long-term liabilities 1,941,296 1,908,258 58,327 60,987 1,999,623 1,969,245 Other liabilities 187,583 181,425 2,062 1,317 189,645 182,742 TOTAL LIABILITIES 2,128,879 2,089,683 60,389 62,304 2,189,268 2,151,987
Net assets:Invested in capital assets, net of related debt 478,689 442,793 113,718 113,961 592,407 556,754 Restricted 372,439 338,514 - - 372,439 338,514 Unrestricted (deficit) (301,692) (175,313) 26,126 15,037 (275,566) (160,276) Total net assets 549,436$ 605,994$ 139,844$ 128,998$ 689,280$ 734,992$
Governmental Activities
Business-Type Activities Total
(1) The June 30, 2009 balances were restated to reflect the impact of prior years interest rate swap agreement per GASB No. 53 and outstanding check balance of $8.2 million. Governmental activities. The City’s change in net assets is deficit of $56.5 million for the year ended June 30, 2010 compared to a positive $4.2 million for the previous fiscal year represents a net decrease of $60.7 million. The key elements of this increase are listed below.
8
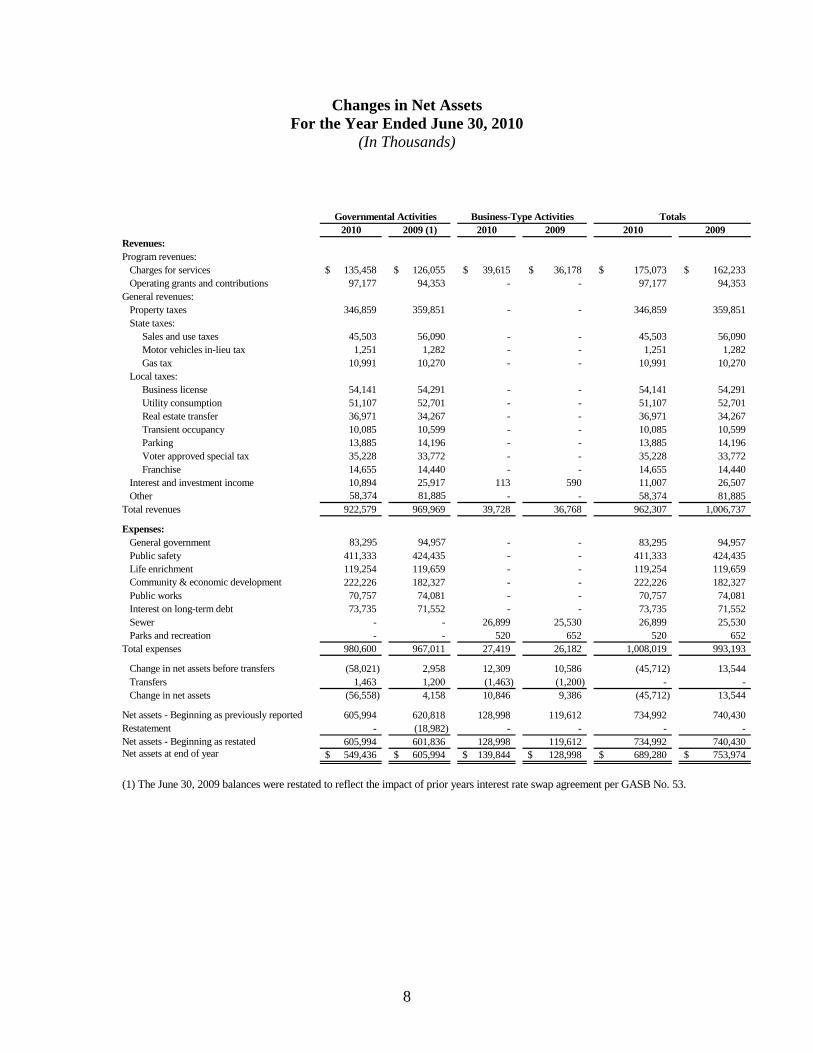
Changes in Net Assets For the Year Ended June 30, 2010
(In Thousands)
2010 2009 (1) 2010 2009 2010 2009Revenues:Program revenues: Charges for services 135,458$ 126,055$ 39,615$ 36,178$ 175,073$ 162,233$ Operating grants and contributions 97,177 94,353 - - 97,177 94,353 General revenues: Property taxes 346,859 359,851 - - 346,859 359,851 State taxes: Sales and use taxes 45,503 56,090 - - 45,503 56,090 Motor vehicles in-lieu tax 1,251 1,282 - - 1,251 1,282 Gas tax 10,991 10,270 - - 10,991 10,270 Local taxes: Business license 54,141 54,291 - - 54,141 54,291 Utility consumption 51,107 52,701 - - 51,107 52,701 Real estate transfer 36,971 34,267 - - 36,971 34,267 Transient occupancy 10,085 10,599 - - 10,085 10,599 Parking 13,885 14,196 - - 13,885 14,196 Voter approved special tax 35,228 33,772 - - 35,228 33,772 Franchise 14,655 14,440 - - 14,655 14,440 Interest and investment income 10,894 25,917 113 590 11,007 26,507 Other 58,374 81,885 - - 58,374 81,885 Total revenues 922,579 969,969 39,728 36,768 962,307 1,006,737
Expenses: General government 83,295 94,957 - - 83,295 94,957 Public safety 411,333 424,435 - - 411,333 424,435 Life enrichment 119,254 119,659 - - 119,254 119,659 Community & economic development 222,226 182,327 - - 222,226 182,327 Public works 70,757 74,081 - - 70,757 74,081 Interest on long-term debt 73,735 71,552 - - 73,735 71,552 Sewer - - 26,899 25,530 26,899 25,530 Parks and recreation - - 520 652 520 652 Total expenses 980,600 967,011 27,419 26,182 1,008,019 993,193
Change in net assets before transfers (58,021) 2,958 12,309 10,586 (45,712) 13,544 Transfers 1,463 1,200 (1,463) (1,200) - - Change in net assets (56,558) 4,158 10,846 9,386 (45,712) 13,544
Net assets - Beginning as previously reported 605,994 620,818 128,998 119,612 734,992 740,430 Restatement - (18,982) - - - - Net assets - Beginning as restated 605,994 601,836 128,998 119,612 734,992 740,430 Net assets at end of year 549,436$ 605,994$ 139,844$ 128,998$ 689,280$ 753,974$
Governmental Activities Business-Type Activities Totals
(1) The June 30, 2009 balances were restated to reflect the impact of prior years interest rate swap agreement per GASB No. 53.
-
50,000
100,000
150,000
200,000
250,000
300,000
350,000
400,000
450,000
General government Public safety Life enrichment Community andEconomic
Development
Public Works Interest on long-term debt
Program Expenses
Program Revenue
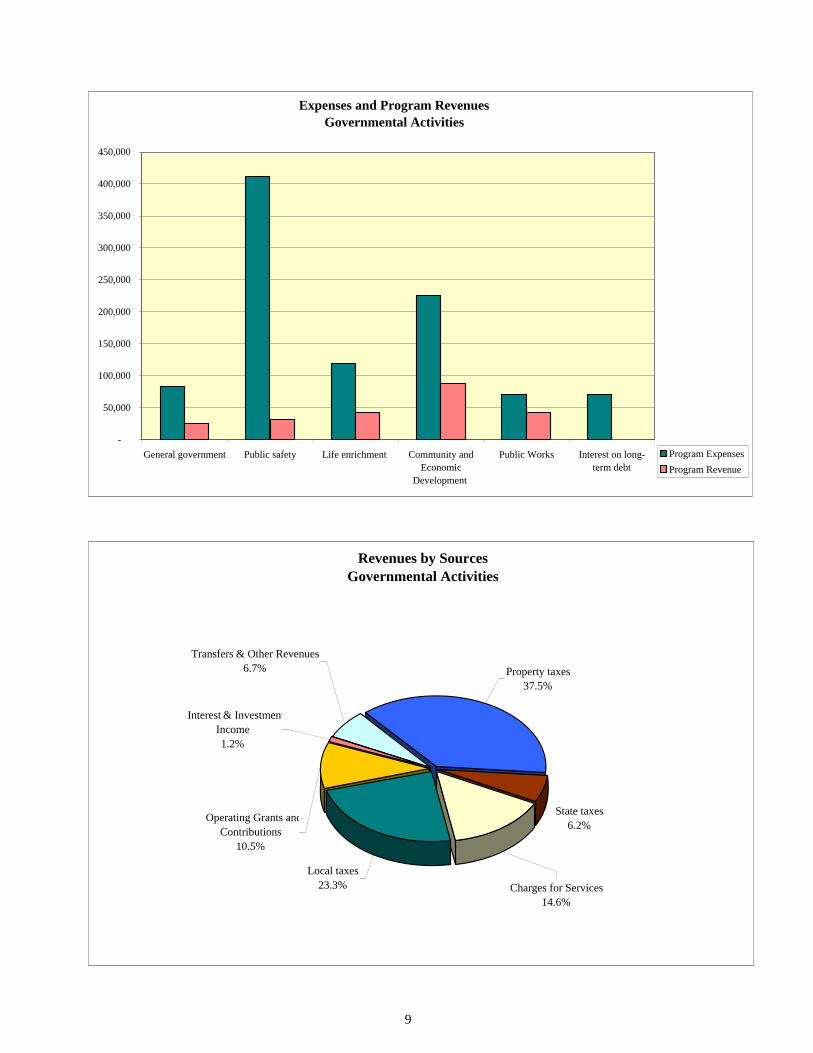
Expenses and Program RevenuesGovernmental Activities
Revenues by SourcesGovernmental Activities
Local taxes23.3%
Operating Grants andContributions
10.5%
Interest & InvestmentIncome1.2%
Transfers & Other Revenues6.7% Property taxes
37.5%
State taxes6.2%
Charges for Services14.6%
9
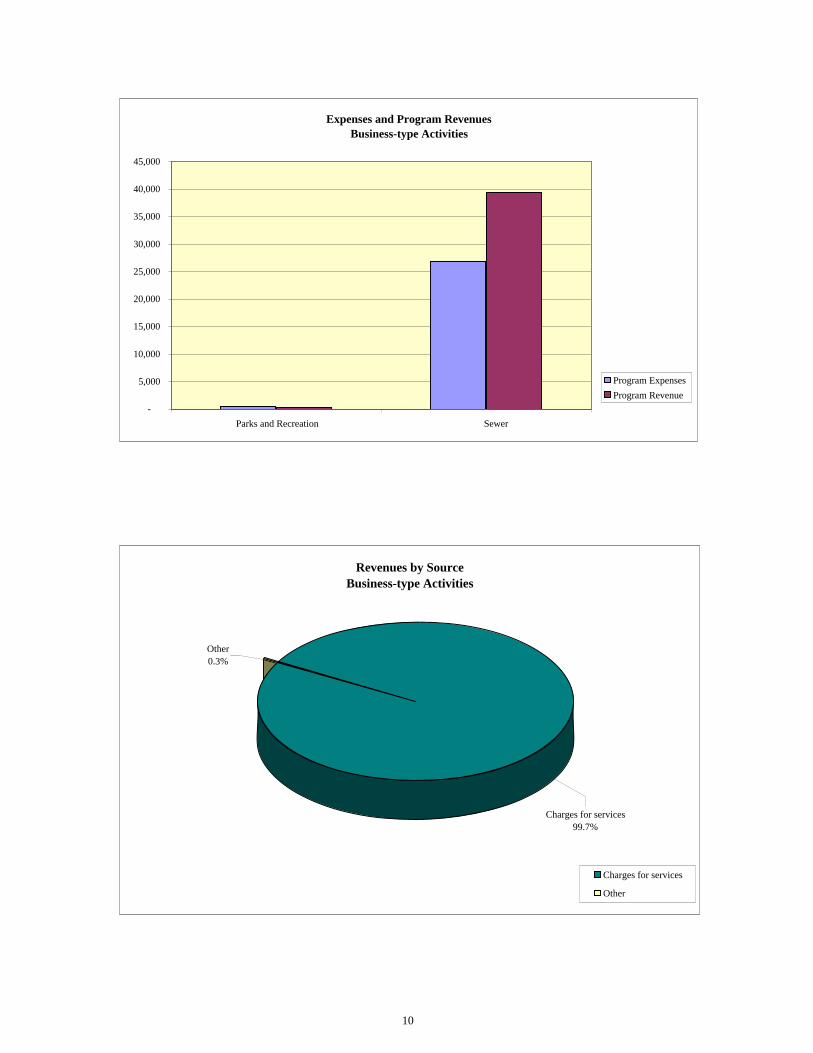
Expenses and Program Revenues Business-type Activities
-
5,000
10,000
15,000
20,000
25,000
30,000
35,000
40,000
45,000
Parks and Recreation Sewer
Program Expenses
Program Revenue
Revenues by Source Business-type Activities
Other0.3%
Charges for services99.7%
Charges for services
Other
10
11
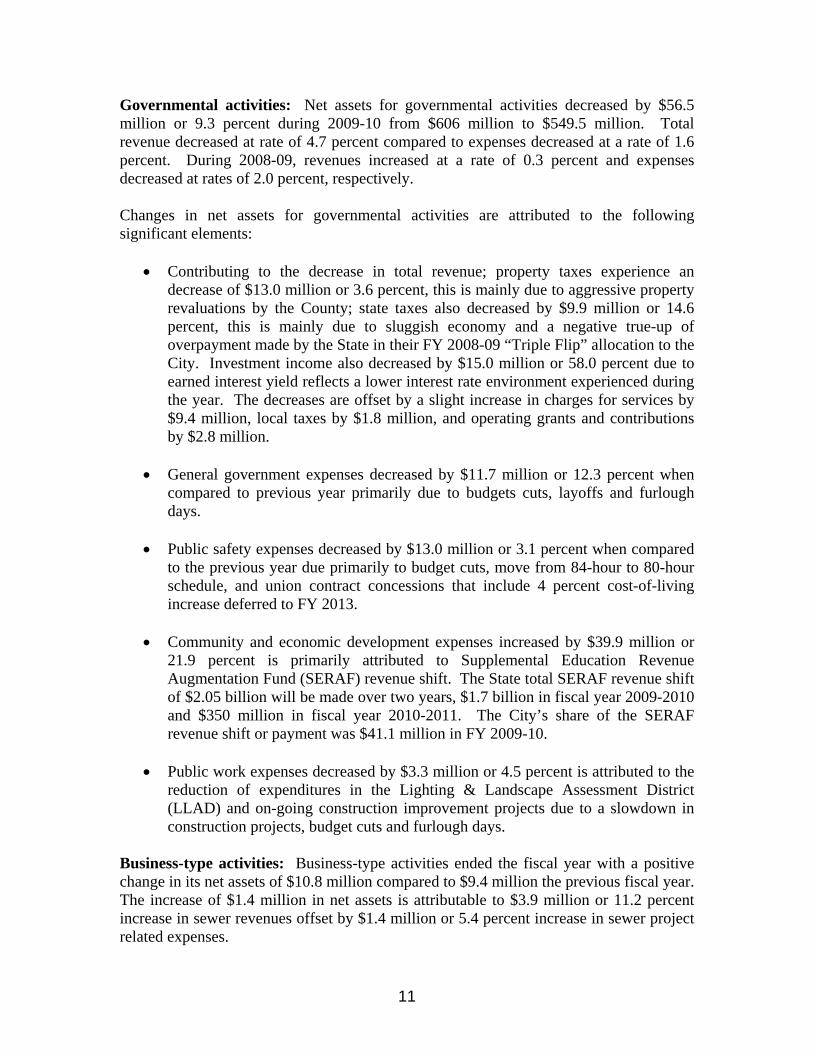
Governmental activities: Net assets for governmental activities decreased by $56.5 million or 9.3 percent during 2009-10 from $606 million to $549.5 million. Total revenue decreased at rate of 4.7 percent compared to expenses decreased at a rate of 1.6 percent. During 2008-09, revenues increased at a rate of 0.3 percent and expenses decreased at rates of 2.0 percent, respectively. Changes in net assets for governmental activities are attributed to the following significant elements:
• Contributing to the decrease in total revenue; property taxes experience an decrease of $13.0 million or 3.6 percent, this is mainly due to aggressive property revaluations by the County; state taxes also decreased by $9.9 million or 14.6 percent, this is mainly due to sluggish economy and a negative true-up of overpayment made by the State in their FY 2008-09 “Triple Flip” allocation to the City. Investment income also decreased by $15.0 million or 58.0 percent due to earned interest yield reflects a lower interest rate environment experienced during the year. The decreases are offset by a slight increase in charges for services by $9.4 million, local taxes by $1.8 million, and operating grants and contributions by $2.8 million.
• General government expenses decreased by $11.7 million or 12.3 percent when
compared to previous year primarily due to budgets cuts, layoffs and furlough days.
• Public safety expenses decreased by $13.0 million or 3.1 percent when compared
to the previous year due primarily to budget cuts, move from 84-hour to 80-hour schedule, and union contract concessions that include 4 percent cost-of-living increase deferred to FY 2013.
• Community and economic development expenses increased by $39.9 million or
21.9 percent is primarily attributed to Supplemental Education Revenue Augmentation Fund (SERAF) revenue shift. The State total SERAF revenue shift of $2.05 billion will be made over two years, $1.7 billion in fiscal year 2009-2010 and $350 million in fiscal year 2010-2011. The City’s share of the SERAF revenue shift or payment was $41.1 million in FY 2009-10.
• Public work expenses decreased by $3.3 million or 4.5 percent is attributed to the
reduction of expenditures in the Lighting & Landscape Assessment District (LLAD) and on-going construction improvement projects due to a slowdown in construction projects, budget cuts and furlough days.
Business-type activities: Business-type activities ended the fiscal year with a positive change in its net assets of $10.8 million compared to $9.4 million the previous fiscal year. The increase of $1.4 million in net assets is attributable to $3.9 million or 11.2 percent increase in sewer revenues offset by $1.4 million or 5.4 percent increase in sewer project related expenses.
12
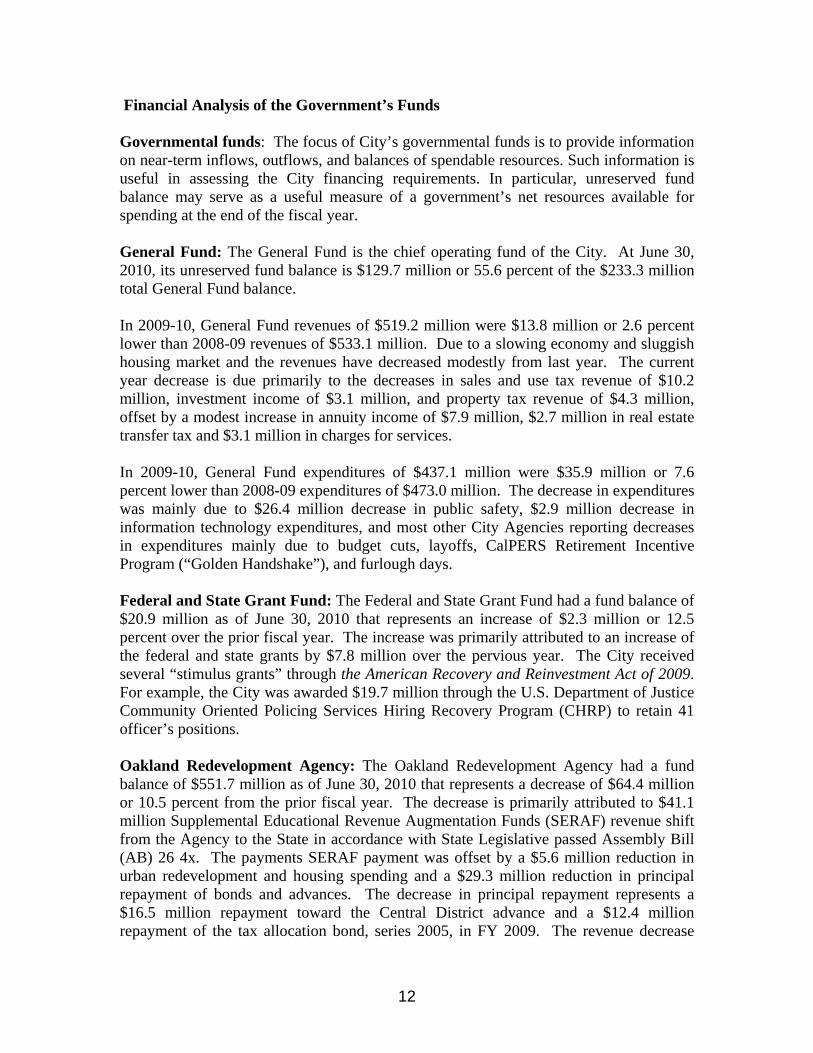
Financial Analysis of the Government’s Funds Governmental funds: The focus of City’s governmental funds is to provide information on near-term inflows, outflows, and balances of spendable resources. Such information is useful in assessing the City financing requirements. In particular, unreserved fund balance may serve as a useful measure of a government’s net resources available for spending at the end of the fiscal year. General Fund: The General Fund is the chief operating fund of the City. At June 30, 2010, its unreserved fund balance is $129.7 million or 55.6 percent of the $233.3 million total General Fund balance. In 2009-10, General Fund revenues of $519.2 million were $13.8 million or 2.6 percent lower than 2008-09 revenues of $533.1 million. Due to a slowing economy and sluggish housing market and the revenues have decreased modestly from last year. The current year decrease is due primarily to the decreases in sales and use tax revenue of $10.2 million, investment income of $3.1 million, and property tax revenue of $4.3 million, offset by a modest increase in annuity income of $7.9 million, $2.7 million in real estate transfer tax and $3.1 million in charges for services. In 2009-10, General Fund expenditures of $437.1 million were $35.9 million or 7.6 percent lower than 2008-09 expenditures of $473.0 million. The decrease in expenditures was mainly due to $26.4 million decrease in public safety, $2.9 million decrease in information technology expenditures, and most other City Agencies reporting decreases in expenditures mainly due to budget cuts, layoffs, CalPERS Retirement Incentive Program (“Golden Handshake”), and furlough days. Federal and State Grant Fund: The Federal and State Grant Fund had a fund balance of $20.9 million as of June 30, 2010 that represents an increase of $2.3 million or 12.5 percent over the prior fiscal year. The increase was primarily attributed to an increase of the federal and state grants by $7.8 million over the pervious year. The City received several “stimulus grants” through the American Recovery and Reinvestment Act of 2009. For example, the City was awarded $19.7 million through the U.S. Department of Justice Community Oriented Policing Services Hiring Recovery Program (CHRP) to retain 41 officer’s positions. Oakland Redevelopment Agency: The Oakland Redevelopment Agency had a fund balance of $551.7 million as of June 30, 2010 that represents a decrease of $64.4 million or 10.5 percent from the prior fiscal year. The decrease is primarily attributed to $41.1 million Supplemental Educational Revenue Augmentation Funds (SERAF) revenue shift from the Agency to the State in accordance with State Legislative passed Assembly Bill (AB) 26 4x. The payments SERAF payment was offset by a $5.6 million reduction in urban redevelopment and housing spending and a $29.3 million reduction in principal repayment of bonds and advances. The decrease in principal repayment represents a $16.5 million repayment toward the Central District advance and a $12.4 million repayment of the tax allocation bond, series 2005, in FY 2009. The revenue decrease

13
mainly attributed to a $17.1 million decrease in tax increment; a $12.7 million decrease in other revenue, and an $8.2 million decrease in interest and investment income by a $1.7 million increase in rents and reimbursements. Municipal Capital Improvement Fund: The Municipal Capital Improvement Fund had a fund balance of $86.8 million as of June 30, 2010 that represents an increase of $44.7 million or 106.4 percent over the prior fiscal year. The net increase of $44.7 million is attributed to two issuance of debt: a) $64.5 million of General Obligation Bond (Series 2009B, Measure DD) to preserve and acquire open space, renovate parks, provide educational and recreation facilities for children, clean up Lake Merritt and restore Oakland’s creeks, waterfront and estuary and b) $3.1 million of Piedmont Pines Phase I 2010 Limited Obligation Improvement Bonds for under grounding of street lighting, electric power, telephone and other communication lines of special benefits to the property within the City’s Utility Underground Assessment District No. 2007-232. Proprietary Funds: The City’s proprietary funds provide the same type of information found in the government-wide financial statements under the business-type column but in more detail. The portion of net assets invested in capital assets, net of related debt amounted to $113.7 million as of June 30, 2010, compared to $114.0 million for the previous fiscal year. The $0.2 million or 0.2 percent decrease is related to proceeds spent from debt issued to finance sewer projects. During the fiscal year, the City capitalized $6.9 million in sewer system completed projects, net of depreciation. General Fund Budgetary Highlights During the fiscal year ended June 30, 2010, General Fund had a $16.4 million decrease in budgeted revenues between the original and final amended operating budget. The decrease is due to a slow economy and the City budget was revised April 29, 2010 to reflect shortfalls in revenues from various funding sources. Actual budgetary basis revenues of $518.8 million were $17.5 million more than the final amended budget. The increase is due primarily to increased property tax, real estate transfer tax and sales and use tax revenues. In addition, there was a $24.5 million increase in appropriations between the original and final amended operating budget for the General Fund. The increase in appropriation is due primarily to the determination of actual project carryforwards for continuing appropriations for various multi-year projects, capital improvement projects, and other projects authorized by the City Council. The original approved expenditure budget contained only estimates of project carryforwards. Actual budgetary basis expenditures of $438.8 million were $2.0 million less than the amended budget. The net budget savings is attributed to (1) general budget cuts, (2) layoffs, and (3) furlough days.
14
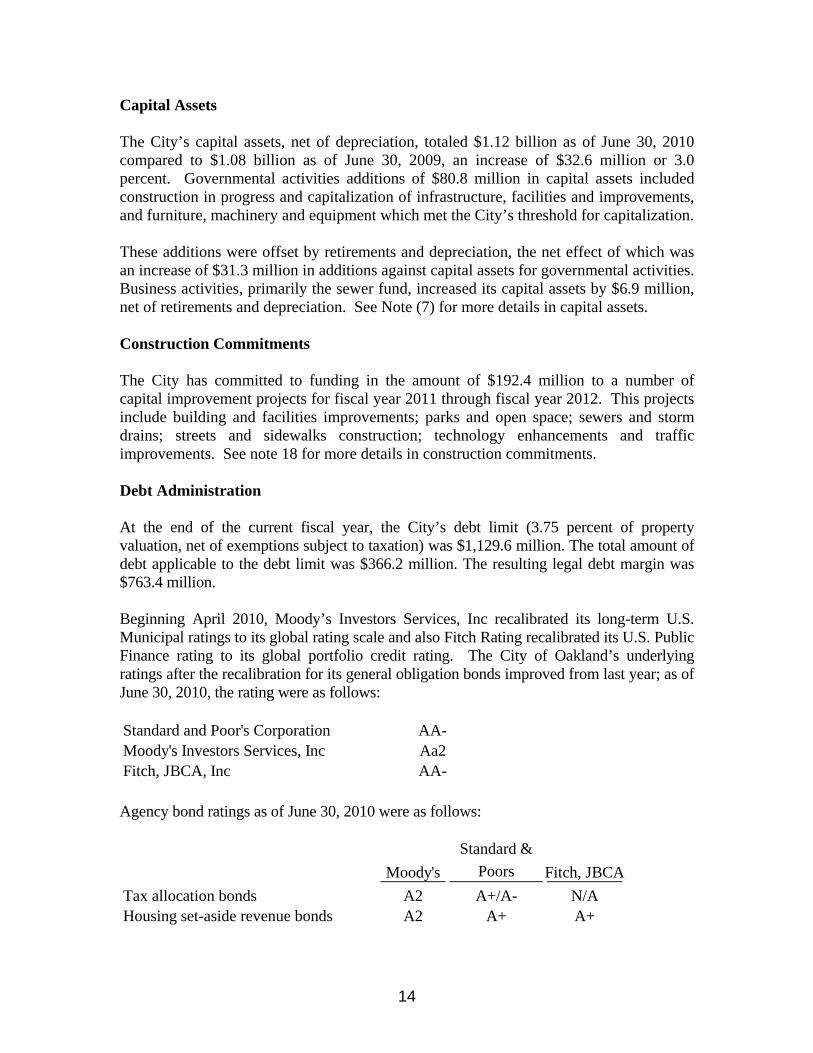
Capital Assets The City’s capital assets, net of depreciation, totaled $1.12 billion as of June 30, 2010 compared to $1.08 billion as of June 30, 2009, an increase of $32.6 million or 3.0 percent. Governmental activities additions of $80.8 million in capital assets included construction in progress and capitalization of infrastructure, facilities and improvements, and furniture, machinery and equipment which met the City’s threshold for capitalization. These additions were offset by retirements and depreciation, the net effect of which was an increase of $31.3 million in additions against capital assets for governmental activities. Business activities, primarily the sewer fund, increased its capital assets by $6.9 million, net of retirements and depreciation. See Note (7) for more details in capital assets. Construction Commitments The City has committed to funding in the amount of $192.4 million to a number of capital improvement projects for fiscal year 2011 through fiscal year 2012. This projects include building and facilities improvements; parks and open space; sewers and storm drains; streets and sidewalks construction; technology enhancements and traffic improvements. See note 18 for more details in construction commitments. Debt Administration At the end of the current fiscal year, the City’s debt limit (3.75 percent of property valuation, net of exemptions subject to taxation) was $1,129.6 million. The total amount of debt applicable to the debt limit was $366.2 million. The resulting legal debt margin was $763.4 million. Beginning April 2010, Moody’s Investors Services, Inc recalibrated its long-term U.S. Municipal ratings to its global rating scale and also Fitch Rating recalibrated its U.S. Public Finance rating to its global portfolio credit rating. The City of Oakland’s underlying ratings after the recalibration for its general obligation bonds improved from last year; as of June 30, 2010, the rating were as follows: Standard and Poor's Corporation AA-Moody's Investors Services, Inc Aa2Fitch, JBCA, Inc AA-
Agency bond ratings as of June 30, 2010 were as follows:
Moody's
Standard &
Poors Fitch, JBCA
Tax allocation bonds A2 A+/A- N/AHousing set-aside revenue bonds A2 A+ A+
15
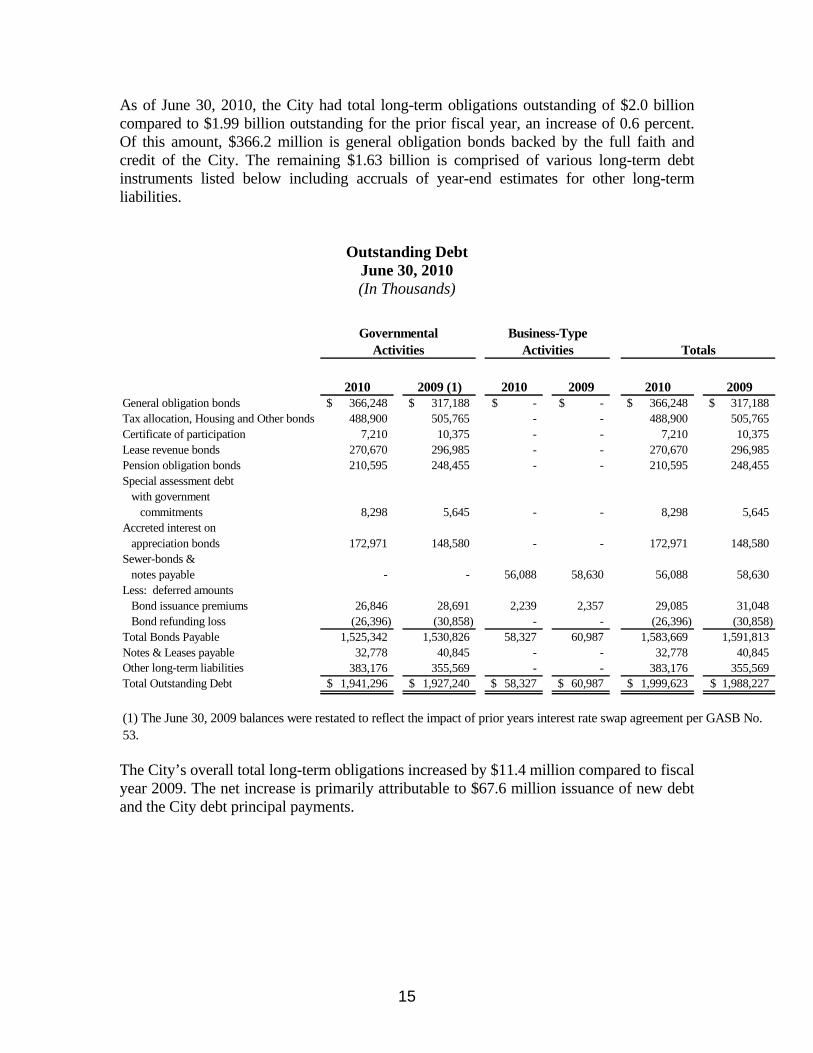
As of June 30, 2010, the City had total long-term obligations outstanding of $2.0 billion compared to $1.99 billion outstanding for the prior fiscal year, an increase of 0.6 percent. Of this amount, $366.2 million is general obligation bonds backed by the full faith and credit of the City. The remaining $1.63 billion is comprised of various long-term debt instruments listed below including accruals of year-end estimates for other long-term liabilities.
Outstanding Debt June 30, 2010 (In Thousands)
2010 2009 (1) 2010 2009 2010 2009General obligation bonds 366,248$ 317,188$ -$ -$ 366,248$ 317,188$ Tax allocation, Housing and Other bonds 488,900 505,765 - - 488,900 505,765 Certificate of participation 7,210 10,375 - - 7,210 10,375 Lease revenue bonds 270,670 296,985 - - 270,670 296,985 Pension obligation bonds 210,595 248,455 - - 210,595 248,455 Special assessment debt with government commitments 8,298 5,645 - - 8,298 5,645 Accreted interest on appreciation bonds 172,971 148,580 - - 172,971 148,580 Sewer-bonds & notes payable - - 56,088 58,630 56,088 58,630 Less: deferred amounts Bond issuance premiums 26,846 28,691 2,239 2,357 29,085 31,048 Bond refunding loss (26,396) (30,858) - - (26,396) (30,858) Total Bonds Payable 1,525,342 1,530,826 58,327 60,987 1,583,669 1,591,813 Notes & Leases payable 32,778 40,845 - - 32,778 40,845 Other long-term liabilities 383,176 355,569 - - 383,176 355,569 Total Outstanding Debt 1,941,296$ 1,927,240$ 58,327$ 60,987$ 1,999,623$ 1,988,227$
Governmental Activities
Business-Type Activities Totals
(1) The June 30, 2009 balances were restated to reflect the impact of prior years interest rate swap agreement per GASB No. 53. The City’s overall total long-term obligations increased by $11.4 million compared to fiscal year 2009. The net increase is primarily attributable to $67.6 million issuance of new debt and the City debt principal payments.

16
Summary of New Debt: Current Year Long-Term Debt Financing Utility Underground Assessment District No. 2007-232, Piedmont Pines Phase I, 2010 Limited Obligation Improvement Bonds: On February 23, 2010, the City of Oakland (the “City”) issued $3,148,483 of the above mentioned bond issue to finance the costs of the under grounding of street lighting, electric power, telephone and other communication lines of special benefit to the property with the Piedmont Pines District. The Bonds are payable from ad valorem taxes, which is from the unpaid assessments levied upon real property within the District.
General Obligation Bonds, Series 2009B, Measure DD: On July 22, 2009, the City of Oakland issued $64,545,000 of the above mentioned bond issue to provide funds to improve water quality, provide educational and recreational facilities for children, clean up Lake Merritt, restore Oakland’s creeks, waterfront and Estuary, preserve and acquire open space, renovate parks, and provide safe public spaces. Additional information on the City’s long-term debt obligations can be found in Note 12 to the financial statements. Economic Factors and Next Year’s Budgets and Tax Rates The economic indicators highlighted below, among others and including labor union contracts and concessions, were factored into the City’s budget formulation process as they relate to revenue forecasting, program planning, and resource allocation for fiscal years 2011-12. The current unprecedented state of the economy has had direct and significant impacts on the City’s declining revenue base. The fiscal issues addressed in the budget were deep and widespread, touching virtually every government service that Oakland provides. The City had to address a $91 – 97 million annual General Purpose Fund shortfall in FY 2009-11 (18 – 19 percent of the baseline budget) This was on top of the $42 million budget gap balanced just in November 2008 and further adjustments made in May 2009 to avoid and $8 million shortfall. As a result, the policy and management decisions required by this budget were among the most difficult ever faced by this City. In closing the funding gap the City use a combination service reduction and union concessions, budget cuts, hiring freeze or position eliminations, furlough days and 2009 CalPERS two-year additional service credit retirement incentive program (“Golden Handshake”). Sluggish growth is projected in fiscal years 2011-12 for the City’s major sensitive revenues including property tax, sales tax, vehicle license fees, business license tax, real estate transfer tax, and parking tax, due to uncertainties brought about by the continuing housing recession, the increase in home foreclosures, and tightened lending policies. The remaining areas, while impacted by overall economic performance, are driven by other factors, for
17
example, franchise fee is typically more heavily impacted by rate changes than economic growth. On July 24, 2009, the State Legislature passed Assembly Bill (AB) 26 4x, which requires redevelopment agencies statewide to deposit a total of $2.05 billion of property tax increment in county Supplemental Educational Revenue Augmentation Funds (SERAF) to be distributed to meet the State’s Proposition 98 obligations to schools. The SERAF revenue shift of $2.05 billion will be made over two years, $1.7 billion in fiscal year 2009-2010 and $350 million in fiscal year 2010-2011. The Agency’s share of the revenue shift was $41,074,866 in fiscal year 2009-2010. As of June 30, 2010, the Agency remaining share of the SERAF payments is $8,497,000 and its due on May 10, 2011. Further information regarding the City’s response and SERAF impact is contained in the subsequent events footnote (18) to the basic financial statements. The City of Oakland’s unemployment rate increased to 17.2% in June 2010 compared to an average unemployment rate of 17.1% for July 2009. The Bay Area’s consumer price index for all urban consumers in June 2010 was 228.110 compared to the U.S. city average consumer price index (CPI-U) for all urban consumers at 217.965 (Base period: 1982 – 84 = 100). Estimated population for January 1, 2010 is 430,666 with an estimated total number of households of 149,443, an average household size of 2.88 persons, and a per capita personal income of $27,145. CalPERS pension rates, and health care costs have been factored into the City’s Fiscal Years 2011-12 budget and amending the municipal code to provide for a three (3) percent surcharge on the City’s transient occupancy tax. Requests for Information This financial report is designed to provide a general overview of the City of Oakland’s finances for all those with an interest in the City’s fiscal and economic affairs. Requests for additional financial information should be addressed to the Finance and Management Agency, Accounting Division, City of Oakland, 150 Frank H. Ogawa Plaza, Suite 6353; Oakland, California 94612-2093.

18
THIS PAGE LEFT INTENTIONALLY BLANK

BASIC FINANCIAL STATEMENTS
Component UnitGovernmental Business-Type
Total
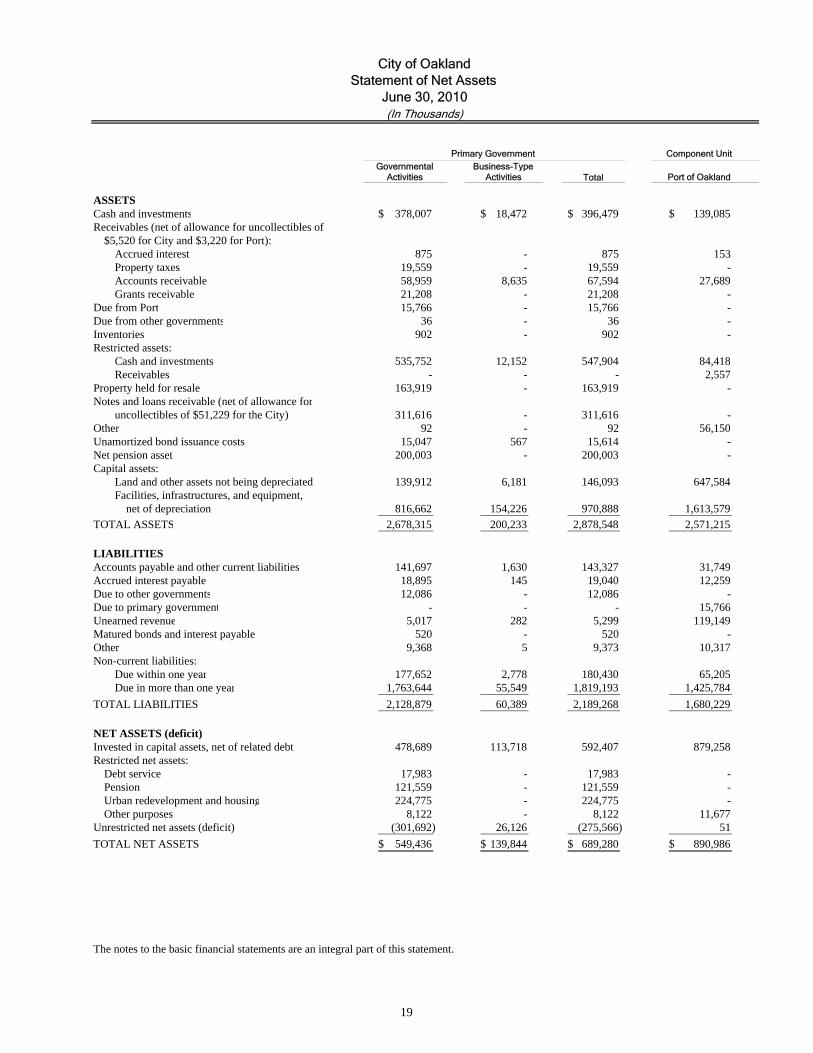
ASSETSCash and investments 378,007$ 18,472$ 396,479$ 139,085$ Receivables (net of allowance for uncollectibles of
$5,520 for City and $3,220 for Port):Accrued interest 875 - 875 153 Property taxes 19,559 - 19,559 - Accounts receivable 58,959 8,635 67,594 27,689 Grants receivable 21,208 - 21,208 -
Due from Port 15,766 - 15,766 - Due from other governments 36 - 36 - Inventories 902 - 902 - Restricted assets:
Cash and investments 535,752 12,152 547,904 84,418 Receivables - - - 2,557
Property held for resale 163,919 - 163,919 - Notes and loans receivable (net of allowance for
uncollectibles of $51,229 for the City) 311,616 - 311,616 - Other 92 - 92 56,150 Unamortized bond issuance costs 15,047 567 15,614 - Net pension asset 200,003 - 200,003 - Capital assets:
Land and other assets not being depreciated 139,912 6,181 146,093 647,584 Facilities, infrastructures, and equipment, net of depreciation 816,662 154,226 970,888 1,613,579
TOTAL ASSETS 2,678,315 200,233 2,878,548 2,571,215
LIABILITIESAccounts payable and other current liabilities 141,697 1,630 143,327 31,749 Accrued interest payable 18,895 145 19,040 12,259 Due to other governments 12,086 - 12,086 - Due to primary government - - - 15,766 Unearned revenue 5,017 282 5,299 119,149 Matured bonds and interest payable 520 - 520 - Other 9,368 5 9,373 10,317 Non-current liabilities:
Due within one year 177,652 2,778 180,430 65,205 Due in more than one year 1,763,644 55,549 1,819,193 1,425,784
TOTAL LIABILITIES 2,128,879 60,389 2,189,268 1,680,229
NET ASSETS (deficit)Invested in capital assets, net of related debt 478,689 113,718 592,407 879,258 Restricted net assets:
Debt service 17,983 - 17,983 - Pension 121,559 - 121,559 - Urban redevelopment and housing 224,775 - 224,775 - Other purposes 8,122 - 8,122 11,677
Unrestricted net assets (deficit) (301,692) 26,126 (275,566) 51
TOTAL NET ASSETS 549,436$ 139,844$ 689,280$ 890,986$
The notes to the basic financial statements are an integral part of this statement.
Activities Activities Port of Oakland
Statement of Net AssetsCity of Oakland
Primary Government
(In Thousands)June 30, 2010
19

Operating Capital
Charges for Grants and Grants and Governmental Business-typeFunctions/Programs Expenses Services Contributions Contributions Activities Activities TotalPrimary government: Governmental activities: General government 83,295$ 24,382$ 972$ -$ (57,941)$ -$ (57,941)$
Public safety 411,333 14,900 17,491 - (378,942) - (378,942) Life enrichment 119,254 8,128 34,984 - (76,142) - (76,142) Community and economic development 222,226 48,765 39,843 - (133,618) - (133,618) Public works 70,757 39,283 3,887 - (27,587) - (27,587) Interest on long-term debt 73,735 - - - (73,735) - (73,735)
TOTAL GOVERNMENTAL ACTIVITIES 980,600 135,458 97,177 - (747,965) - (747,965)
Business-type activities: Sewer 26,899 39,329 - - - 12,430 12,430 Parks and recreation 520 286 - - - (234) (234)
TOTAL BUSINESS-TYPE ACTIVITIES 27,419 39,615 - - - 12,196 12,196
TOTAL PRIMARY GOVERNMENT 1,008,019$ 175,073$ 97,177$ -$ (747,965) 12,196 (735,769)
Component unit: Port of Oakland 337,947$ 285,225$ -$ 21,343$ (31,379)$
General revenues:
Property taxes 346,859 - 346,859 - State taxes: Sales and use taxes 45,503 - 45,503 - Motor vehicle in-lieu tax 1,251 - 1,251 - Gas tax 10,991 - 10,991 - Local taxes:
Business license 54,141 - 54,141 - Utility consumption 51,107 - 51,107 - Real estate transfer 36,971 - 36,971 - Transient occupancy 10,085 - 10,085 - Parking 13,885 - 13,885 - Voter approved special tax 35,228 - 35,228 - Franchise 14,655 - 14,655 - Interest and investment income 10,894 113 11,007 8,635 Other 58,374 - 58,374 24,524 Transfers 1,463 (1,463) - -
TOTAL GENERAL REVENUES AND TRANSFERS 691,407 (1,350) 690,057 33,159
Changes in net assets (56,558) 10,846 (45,712) 1,780
Net Assets - Beginning, as originally reported 624,976 128,998 753,974 889,206
Adoption of Governmental Accounting Standards Board Statement No. 53 (18,982) - (18,982) -
Net Assets - Beginning, as restated 605,994 128,998 734,992 889,206
NET ASSETS - ENDING 549,436$ 139,844$ 689,280$ 890,986$
The notes to the basic financial statements are an integral part of this statement.
City of Oakland
Changes in Net AssetsPrimary Government
Net (Expense) Revenue andProgram Revenue
(In Thousands)
Statement of ActivitiesFor the Year Ended June 30, 2010
Component Unit
Port of Oakland
20
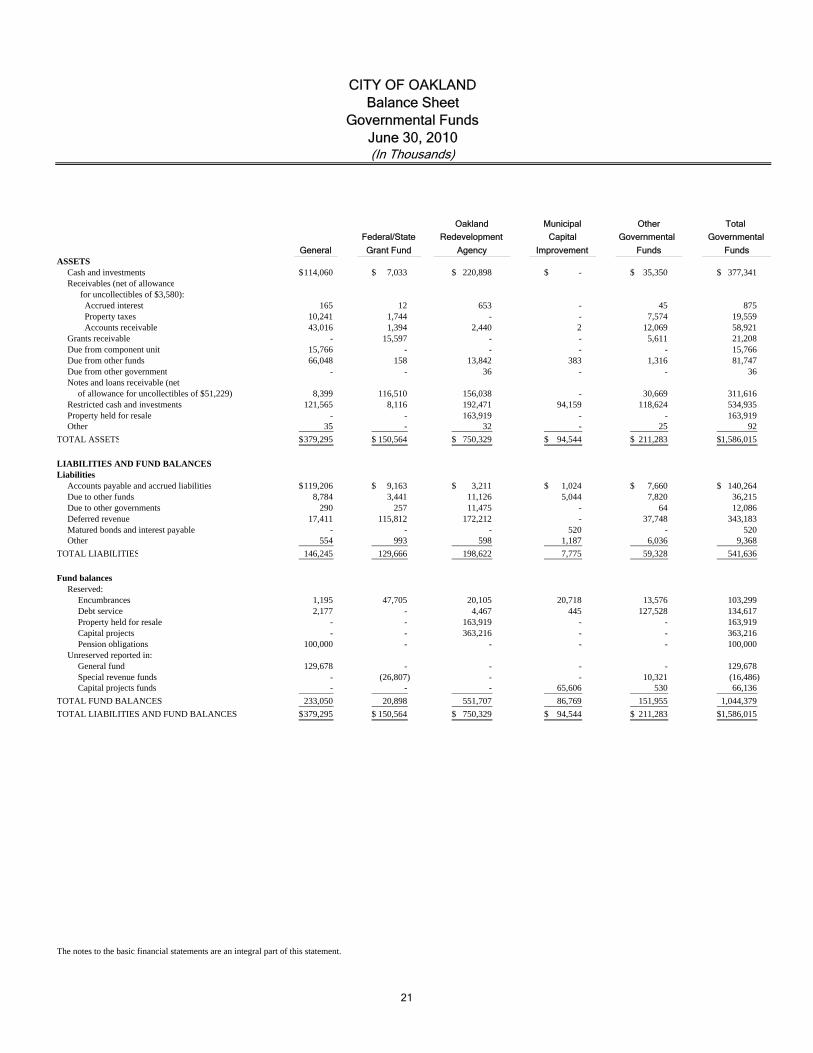
GeneralASSETS
Cash and investments 114,060$ 7,033$ 220,898$ -$ 35,350$ 377,341$ Receivables (net of allowance
for uncollectibles of $3,580): Accrued interest 165 12 653 - 45 875 Property taxes 10,241 1,744 - - 7,574 19,559 Accounts receivable 43,016 1,394 2,440 2 12,069 58,921
Grants receivable - 15,597 - - 5,611 21,208 Due from component unit 15,766 - - - - 15,766 Due from other funds 66,048 158 13,842 383 1,316 81,747 Due from other government - - 36 - - 36 Notes and loans receivable (net
of allowance for uncollectibles of $51,229) 8,399 116,510 156,038 - 30,669 311,616 Restricted cash and investments 121,565 8,116 192,471 94,159 118,624 534,935 Property held for resale - - 163,919 - - 163,919 Other 35 - 32 - 25 92
TOTAL ASSETS 379,295$ 150,564$ 750,329$ 94,544$ 211,283$ 1,586,015$
LIABILITIES AND FUND BALANCESLiabilities
Accounts payable and accrued liabilities 119,206$ 9,163$ 3,211$ 1,024$ 7,660$ 140,264$ Due to other funds 8,784 3,441 11,126 5,044 7,820 36,215 Due to other governments 290 257 11,475 - 64 12,086 Deferred revenue 17,411 115,812 172,212 - 37,748 343,183 Matured bonds and interest payable - - - 520 - 520 Other 554 993 598 1,187 6,036 9,368
TOTAL LIABILITIES 146,245 129,666 198,622 7,775 59,328 541,636
Fund balancesReserved:
Encumbrances 1,195 47,705 20,105 20,718 13,576 103,299 Debt service 2,177 - 4,467 445 127,528 134,617 Property held for resale - - 163,919 - - 163,919 Capital projects - - 363,216 - - 363,216 Pension obligations 100,000 - - - - 100,000
Unreserved reported in:General fund 129,678 - - - - 129,678 Special revenue funds - (26,807) - - 10,321 (16,486) Capital projects funds - - - 65,606 530 66,136
TOTAL FUND BALANCES 233,050 20,898 551,707 86,769 151,955 1,044,379
TOTAL LIABILITIES AND FUND BALANCES 379,295$ 150,564$ 750,329$ 94,544$ 211,283$ 1,586,015$
The notes to the basic financial statements are an integral part of this statement.
(In Thousands)
CITY OF OAKLANDBalance Sheet
Governmental FundsJune 30, 2010
Federal/State
Grant Fund
Redevelopment Governmental Capital
Improvement
Total
Governmental
Funds
Oakland
Agency
Other
Funds
Municipal
21
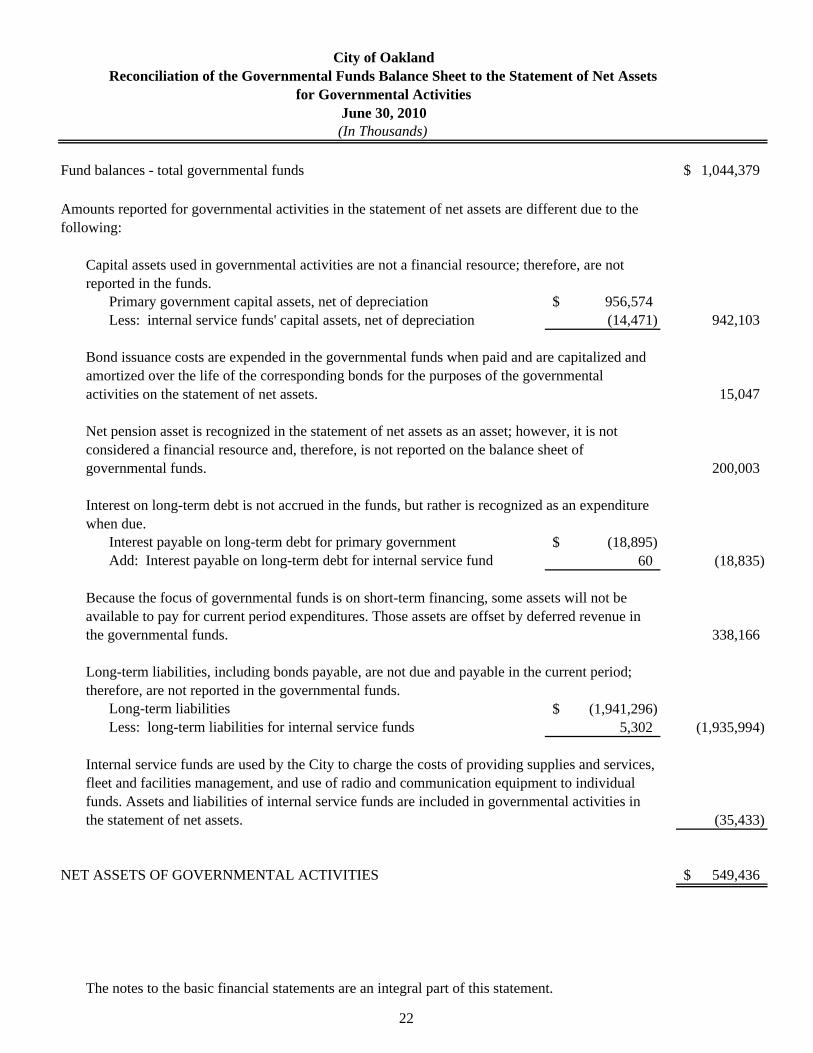
Fund balances - total governmental funds 1,044,379$
Primary government capital assets, net of depreciation 956,574$ Less: internal service funds' capital assets, net of depreciation (14,471) 942,103
15,047
200,003
Interest payable on long-term debt for primary government (18,895)$ Add: Interest payable on long-term debt for internal service fund 60 (18,835)
338,166
Long-term liabilities (1,941,296)$ Less: long-term liabilities for internal service funds 5,302 (1,935,994)
(35,433)
NET ASSETS OF GOVERNMENTAL ACTIVITIES 549,436$
The notes to the basic financial statements are an integral part of this statement.
Because the focus of governmental funds is on short-term financing, some assets will not be available to pay for current period expenditures. Those assets are offset by deferred revenue in the governmental funds.
Long-term liabilities, including bonds payable, are not due and payable in the current period; therefore, are not reported in the governmental funds.
Reconciliation of the Governmental Funds Balance Sheet to the Statement of Net Assets for Governmental Activities
Internal service funds are used by the City to charge the costs of providing supplies and services, fleet and facilities management, and use of radio and communication equipment to individual funds. Assets and liabilities of internal service funds are included in governmental activities in the statement of net assets.
Capital assets used in governmental activities are not a financial resource; therefore, are not reported in the funds.
Bond issuance costs are expended in the governmental funds when paid and are capitalized and amortized over the life of the corresponding bonds for the purposes of the governmental activities on the statement of net assets.
Net pension asset is recognized in the statement of net assets as an asset; however, it is not considered a financial resource and, therefore, is not reported on the balance sheet of governmental funds.
Interest on long-term debt is not accrued in the funds, but rather is recognized as an expenditure when due.
City of Oakland
June 30, 2010(In Thousands)
Amounts reported for governmental activities in the statement of net assets are different due to the following:
22
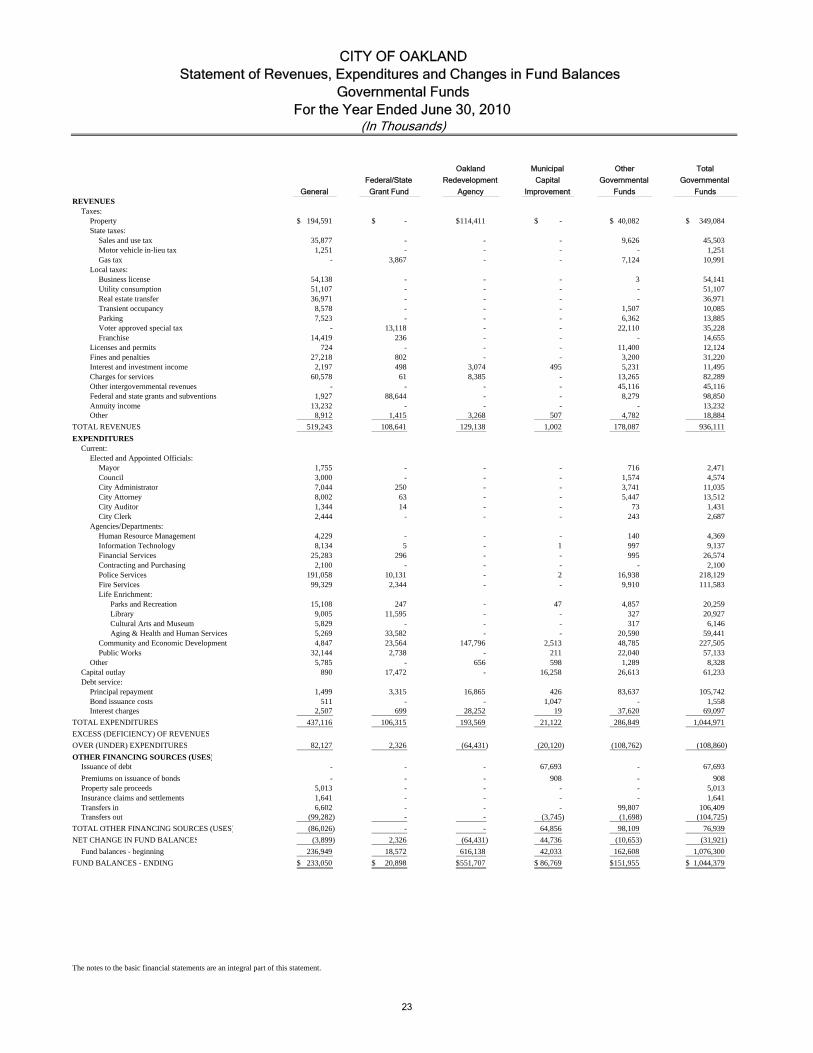
GeneralREVENUES
Taxes:Property 194,591$ -$ 114,411$ -$ 40,082$ 349,084$ State taxes:
Sales and use tax 35,877 - - - 9,626 45,503 Motor vehicle in-lieu tax 1,251 - - - - 1,251 Gas tax - 3,867 - - 7,124 10,991
Local taxes:Business license 54,138 - - - 3 54,141 Utility consumption 51,107 - - - - 51,107 Real estate transfer 36,971 - - - - 36,971 Transient occupancy 8,578 - - - 1,507 10,085 Parking 7,523 - - - 6,362 13,885 Voter approved special tax - 13,118 - - 22,110 35,228 Franchise 14,419 236 - - - 14,655
Licenses and permits 724 - - - 11,400 12,124 Fines and penalties 27,218 802 - - 3,200 31,220 Interest and investment income 2,197 498 3,074 495 5,231 11,495 Charges for services 60,578 61 8,385 - 13,265 82,289 Other intergovernmental revenues - - - - 45,116 45,116 Federal and state grants and subventions 1,927 88,644 - - 8,279 98,850 Annuity income 13,232 - - - - 13,232 Other 8,912 1,415 3,268 507 4,782 18,884
TOTAL REVENUES 519,243 108,641 129,138 1,002 178,087 936,111
EXPENDITURESCurrent:
Elected and Appointed Officials:Mayor 1,755 - - - 716 2,471 Council 3,000 - - - 1,574 4,574 City Administrator 7,044 250 - - 3,741 11,035 City Attorney 8,002 63 - - 5,447 13,512 City Auditor 1,344 14 - - 73 1,431 City Clerk 2,444 - - - 243 2,687
Agencies/Departments:Human Resource Management 4,229 - - - 140 4,369 Information Technology 8,134 5 - 1 997 9,137 Financial Services 25,283 296 - - 995 26,574 Contracting and Purchasing 2,100 - - - - 2,100 Police Services 191,058 10,131 - 2 16,938 218,129 Fire Services 99,329 2,344 - - 9,910 111,583 Life Enrichment: Parks and Recreation 15,108 247 - 47 4,857 20,259 Library 9,005 11,595 - - 327 20,927 Cultural Arts and Museum 5,829 - - - 317 6,146 Aging & Health and Human Services 5,269 33,582 - - 20,590 59,441 Community and Economic Development 4,847 23,564 147,796 2,513 48,785 227,505 Public Works 32,144 2,738 - 211 22,040 57,133
Other 5,785 - 656 598 1,289 8,328 Capital outlay 890 17,472 - 16,258 26,613 61,233 Debt service:
Principal repayment 1,499 3,315 16,865 426 83,637 105,742 Bond issuance costs 511 - - 1,047 - 1,558 Interest charges 2,507 699 28,252 19 37,620 69,097
TOTAL EXPENDITURES 437,116 106,315 193,569 21,122 286,849 1,044,971
EXCESS (DEFICIENCY) OF REVENUES
OVER (UNDER) EXPENDITURES 82,127 2,326 (64,431) (20,120) (108,762) (108,860)
OTHER FINANCING SOURCES (USES)Issuance of debt - - - 67,693 - 67,693
Premiums on issuance of bonds - - - 908 - 908 Property sale proceeds 5,013 - - - - 5,013 Insurance claims and settlements 1,641 - - - - 1,641 Transfers in 6,602 - - - 99,807 106,409 Transfers out (99,282) - - (3,745) (1,698) (104,725)
TOTAL OTHER FINANCING SOURCES (USES) (86,026) - - 64,856 98,109 76,939
NET CHANGE IN FUND BALANCES (3,899) 2,326 (64,431) 44,736 (10,653) (31,921)
Fund balances - beginning 236,949 18,572 616,138 42,033 162,608 1,076,300
FUND BALANCES - ENDING 233,050$ 20,898$ 551,707$ 86,769$ 151,955$ 1,044,379$
The notes to the basic financial statements are an integral part of this statement.
Statement of Revenues, Expenditures and Changes in Fund BalancesCITY OF OAKLAND
Funds FundsGrant Fund
(In Thousands)
TotalOther
GovernmentalFederal/State
Agency
Governmental
For the Year Ended June 30, 2010Governmental Funds
Oakland
Redevelopment
Municipal
Capital
Improvement
23
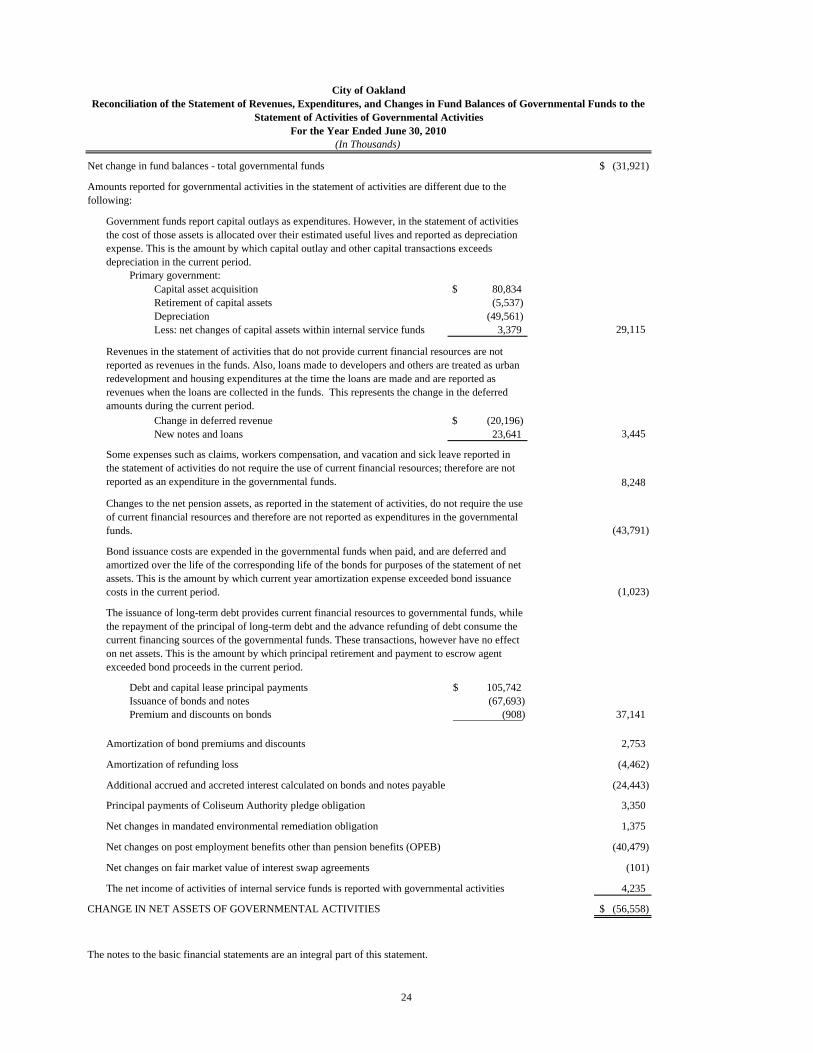
Net change in fund balances - total governmental funds (31,921)$
Primary government:Capital asset acquisition $ 80,834 Retirement of capital assets (5,537)Depreciation (49,561)Less: net changes of capital assets within internal service funds 3,379 29,115
Change in deferred revenue $ (20,196)New notes and loans 23,641 3,445
8,248
(43,791)
(1,023)
Debt and capital lease principal payments 105,742$ Issuance of bonds and notes (67,693) Premium and discounts on bonds (908) 37,141
Amortization of bond premiums and discounts 2,753
Amortization of refunding loss (4,462)
Additional accrued and accreted interest calculated on bonds and notes payable (24,443)
Principal payments of Coliseum Authority pledge obligation 3,350
Net changes in mandated environmental remediation obligation 1,375
Net changes on post employment benefits other than pension benefits (OPEB) (40,479)
Net changes on fair market value of interest swap agreements (101)
The net income of activities of internal service funds is reported with governmental activities 4,235
(56,558)$
The notes to the basic financial statements are an integral part of this statement.
CHANGE IN NET ASSETS OF GOVERNMENTAL ACTIVITIES
Government funds report capital outlays as expenditures. However, in the statement of activities the cost of those assets is allocated over their estimated useful lives and reported as depreciation expense. This is the amount by which capital outlay and other capital transactions exceeds depreciation in the current period.
Changes to the net pension assets, as reported in the statement of activities, do not require the use of current financial resources and therefore are not reported as expenditures in the governmental funds.
Amounts reported for governmental activities in the statement of activities are different due to the following:
City of OaklandReconciliation of the Statement of Revenues, Expenditures, and Changes in Fund Balances of Governmental Funds to the
Statement of Activities of Governmental Activities For the Year Ended June 30, 2010
(In Thousands)
Bond issuance costs are expended in the governmental funds when paid, and are deferred and amortized over the life of the corresponding life of the bonds for purposes of the statement of net assets. This is the amount by which current year amortization expense exceeded bond issuance costs in the current period.
Some expenses such as claims, workers compensation, and vacation and sick leave reported in the statement of activities do not require the use of current financial resources; therefore are not reported as an expenditure in the governmental funds.
The issuance of long-term debt provides current financial resources to governmental funds, while the repayment of the principal of long-term debt and the advance refunding of debt consume the current financing sources of the governmental funds. These transactions, however have no effect on net assets. This is the amount by which principal retirement and payment to escrow agent exceeded bond proceeds in the current period.
Revenues in the statement of activities that do not provide current financial resources are not reported as revenues in the funds. Also, loans made to developers and others are treated as urban redevelopment and housing expenditures at the time the loans are made and are reported as revenues when the loans are collected in the funds. This represents the change in the deferred amounts during the current period.
24
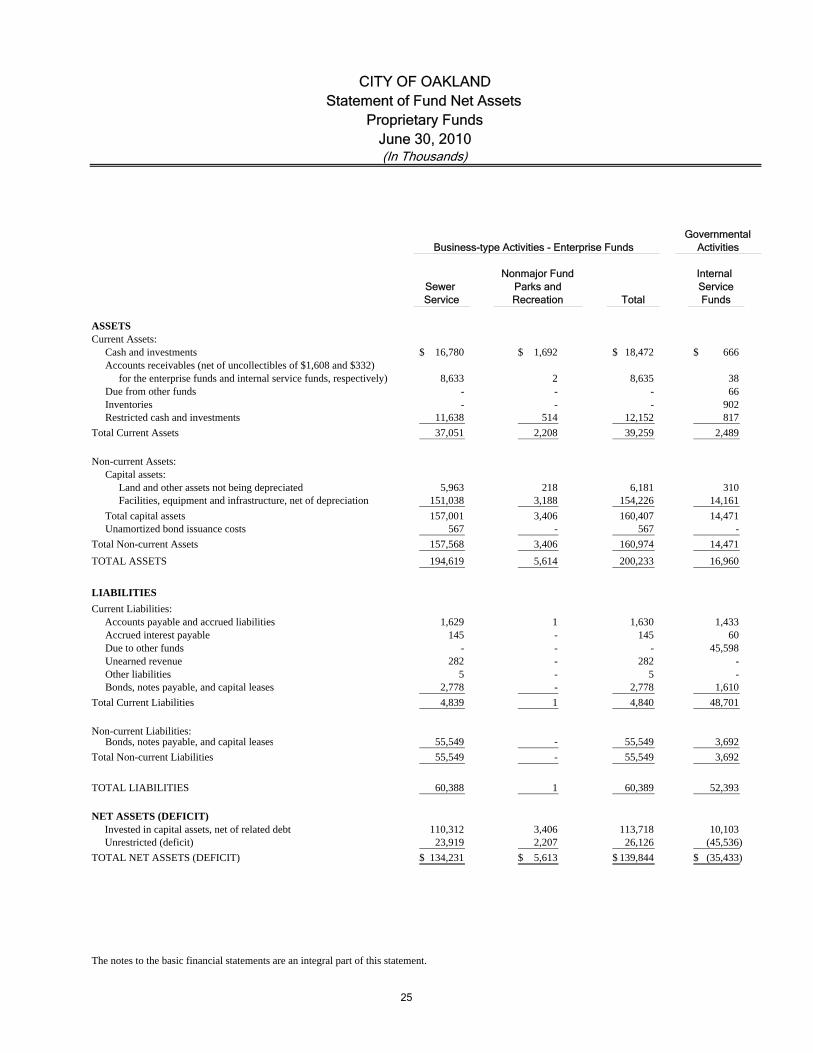
Internal Sewer ServiceService Total Funds
ASSETSCurrent Assets:
Cash and investments 16,780$ 1,692$ 18,472$ 666$ Accounts receivables (net of uncollectibles of $1,608 and $332)
for the enterprise funds and internal service funds, respectively) 8,633 2 8,635 38 Due from other funds - - - 66 Inventories - - - 902 Restricted cash and investments 11,638 514 12,152 817
Total Current Assets 37,051 2,208 39,259 2,489
Non-current Assets:Capital assets:
Land and other assets not being depreciated 5,963 218 6,181 310 Facilities, equipment and infrastructure, net of depreciation 151,038 3,188 154,226 14,161
Total capital assets 157,001 3,406 160,407 14,471 Unamortized bond issuance costs 567 - 567 -
Total Non-current Assets 157,568 3,406 160,974 14,471
TOTAL ASSETS 194,619 5,614 200,233 16,960
LIABILITIES
Current Liabilities: Accounts payable and accrued liabilities 1,629 1 1,630 1,433
Accrued interest payable 145 - 145 60 Due to other funds - - - 45,598 Unearned revenue 282 - 282 - Other liabilities 5 - 5 -
Bonds, notes payable, and capital leases 2,778 - 2,778 1,610
Total Current Liabilities 4,839 1 4,840 48,701
Non-current Liabilities:Bonds, notes payable, and capital leases 55,549 - 55,549 3,692
Total Non-current Liabilities 55,549 - 55,549 3,692
TOTAL LIABILITIES 60,388 1 60,389 52,393
NET ASSETS (DEFICIT) Invested in capital assets, net of related debt 110,312 3,406 113,718 10,103 Unrestricted (deficit) 23,919 2,207 26,126 (45,536)
TOTAL NET ASSETS (DEFICIT) 134,231$ 5,613$ 139,844$ (35,433)$
The notes to the basic financial statements are an integral part of this statement.
Parks andRecreation
ActivitiesGovernmental
(In Thousands)
Business-type Activities - Enterprise Funds
Nonmajor Fund
CITY OF OAKLANDStatement of Fund Net Assets
Proprietary FundsJune 30, 2010
25
Internal Sewer Service
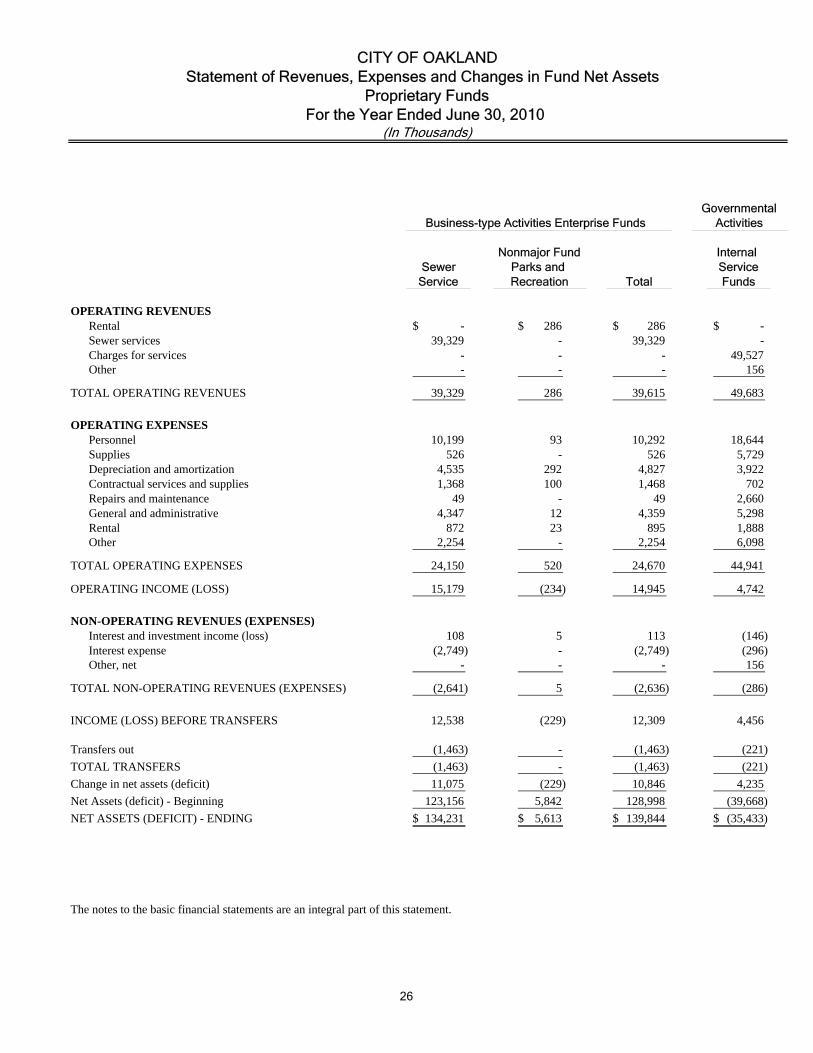
Service Total Funds
OPERATING REVENUESRental -$ 286$ 286$ -$ Sewer services 39,329 - 39,329 - Charges for services - - - 49,527 Other - - - 156
TOTAL OPERATING REVENUES 39,329 286 39,615 49,683
OPERATING EXPENSESPersonnel 10,199 93 10,292 18,644 Supplies 526 - 526 5,729 Depreciation and amortization 4,535 292 4,827 3,922 Contractual services and supplies 1,368 100 1,468 702 Repairs and maintenance 49 - 49 2,660 General and administrative 4,347 12 4,359 5,298 Rental 872 23 895 1,888 Other 2,254 - 2,254 6,098
TOTAL OPERATING EXPENSES 24,150 520 24,670 44,941
OPERATING INCOME (LOSS) 15,179 (234) 14,945 4,742
NON-OPERATING REVENUES (EXPENSES)Interest and investment income (loss) 108 5 113 (146) Interest expense (2,749) - (2,749) (296) Other, net - - - 156
TOTAL NON-OPERATING REVENUES (EXPENSES) (2,641) 5 (2,636) (286)
INCOME (LOSS) BEFORE TRANSFERS 12,538 (229) 12,309 4,456
Transfers out (1,463) - (1,463) (221)
TOTAL TRANSFERS (1,463) - (1,463) (221)
Change in net assets (deficit) 11,075 (229) 10,846 4,235
Net Assets (deficit) - Beginning 123,156 5,842 128,998 (39,668)
NET ASSETS (DEFICIT) - ENDING 134,231$ 5,613$ 139,844$ (35,433)$
The notes to the basic financial statements are an integral part of this statement.
(In Thousands)
CITY OF OAKLANDStatement of Revenues, Expenses and Changes in Fund Net Assets
Proprietary FundsFor the Year Ended June 30, 2010
RecreationParks and
Nonmajor Fund
GovernmentalBusiness-type Activities Enterprise Funds Activities
26
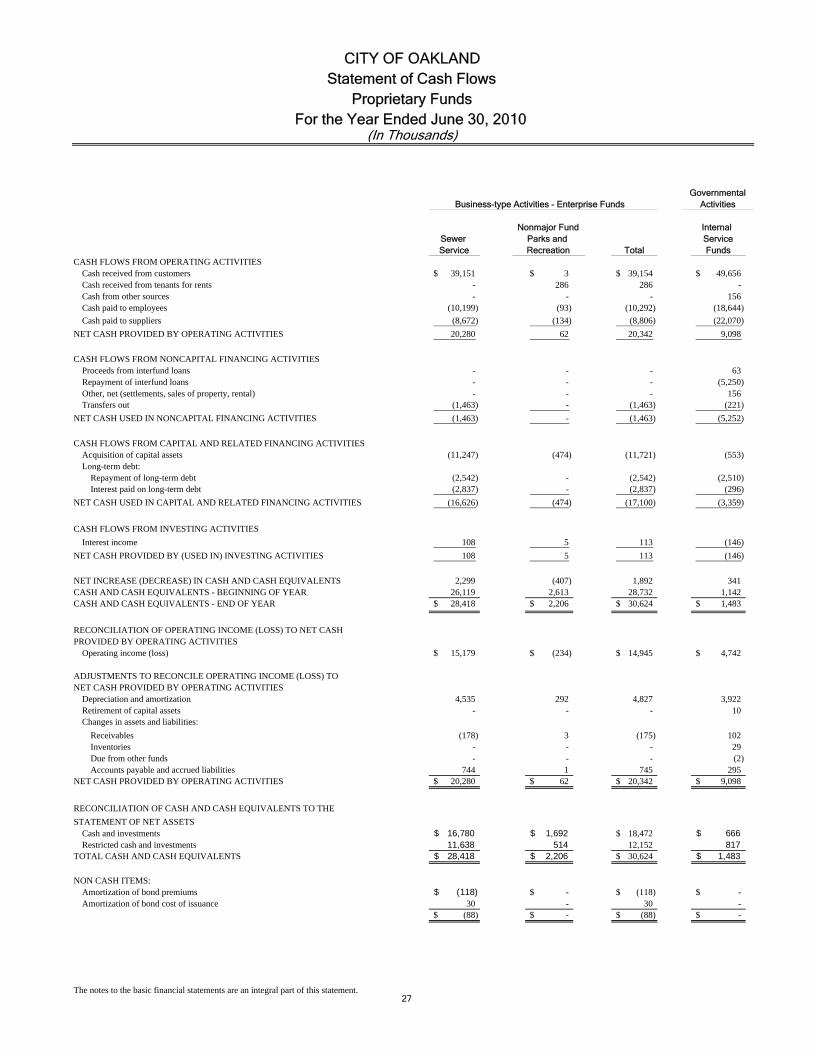
Internal Sewer ServiceService Total Funds
CASH FLOWS FROM OPERATING ACTIVITIESCash received from customers 39,151$ 3$ 39,154$ 49,656$ Cash received from tenants for rents - 286 286 - Cash from other sources - - - 156 Cash paid to employees (10,199) (93) (10,292) (18,644)
Cash paid to suppliers (8,672) (134) (8,806) (22,070)
NET CASH PROVIDED BY OPERATING ACTIVITIES 20,280 62 20,342 9,098
CASH FLOWS FROM NONCAPITAL FINANCING ACTIVITIESProceeds from interfund loans - - - 63 Repayment of interfund loans - - - (5,250) Other, net (settlements, sales of property, rental) - - - 156 Transfers out (1,463) - (1,463) (221)
NET CASH USED IN NONCAPITAL FINANCING ACTIVITIES (1,463) - (1,463) (5,252)
CASH FLOWS FROM CAPITAL AND RELATED FINANCING ACTIVITIESAcquisition of capital assets (11,247) (474) (11,721) (553) Long-term debt:
Repayment of long-term debt (2,542) - (2,542) (2,510) Interest paid on long-term debt (2,837) - (2,837) (296)
NET CASH USED IN CAPITAL AND RELATED FINANCING ACTIVITIES (16,626) (474) (17,100) (3,359)
CASH FLOWS FROM INVESTING ACTIVITIES
Interest income 108 5 113 (146)
NET CASH PROVIDED BY (USED IN) INVESTING ACTIVITIES 108 5 113 (146)
NET INCREASE (DECREASE) IN CASH AND CASH EQUIVALENTS 2,299 (407) 1,892 341 CASH AND CASH EQUIVALENTS - BEGINNING OF YEAR 26,119 2,613 28,732 1,142 CASH AND CASH EQUIVALENTS - END OF YEAR 28,418$ 2,206$ 30,624$ 1,483$
RECONCILIATION OF OPERATING INCOME (LOSS) TO NET CASHPROVIDED BY OPERATING ACTIVITIES
Operating income (loss) 15,179$ (234)$ 14,945$ 4,742$
ADJUSTMENTS TO RECONCILE OPERATING INCOME (LOSS) TONET CASH PROVIDED BY OPERATING ACTIVITIES
Depreciation and amortization 4,535 292 4,827 3,922 Retirement of capital assets - - - 10 Changes in assets and liabilities:
Receivables (178) 3 (175) 102 Inventories - - - 29 Due from other funds - - - (2) Accounts payable and accrued liabilities 744 1 745 295
NET CASH PROVIDED BY OPERATING ACTIVITIES 20,280$ 62$ 20,342$ 9,098$
RECONCILIATION OF CASH AND CASH EQUIVALENTS TO THE
STATEMENT OF NET ASSETSCash and investments 16,780$ 1,692$ 18,472$ 666$ Restricted cash and investments 11,638 514 12,152 817
TOTAL CASH AND CASH EQUIVALENTS 28,418$ 2,206$ 30,624$ 1,483$
NON CASH ITEMS:Amortization of bond premiums (118)$ -$ (118)$ -$ Amortization of bond cost of issuance 30 - 30 -
(88)$ -$ (88)$ -$
The notes to the basic financial statements are an integral part of this statement.
CITY OF OAKLANDStatement of Cash Flows
Proprietary FundsFor the Year Ended June 30, 2010
RecreationParks and
Nonmajor Fund
(In Thousands)
Business-type Activities - Enterprise Funds ActivitiesGovernmental
27
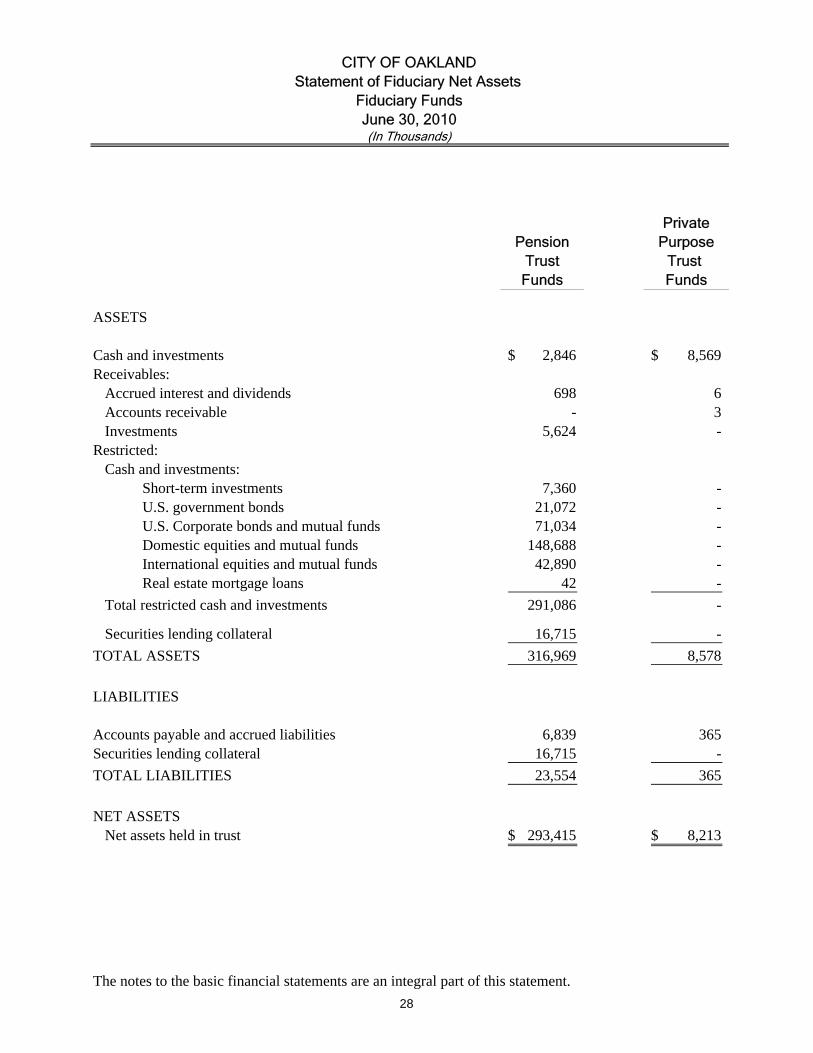
PrivatePension Purpose
Trust Trust Funds Funds
ASSETS
Cash and investments 2,846$ 8,569$ Receivables:
Accrued interest and dividends 698 6 Accounts receivable - 3 Investments 5,624 -
Restricted:Cash and investments: Short-term investments 7,360 - U.S. government bonds 21,072 - U.S. Corporate bonds and mutual funds 71,034 - Domestic equities and mutual funds 148,688 - International equities and mutual funds 42,890 - Real estate mortgage loans 42 -
Total restricted cash and investments 291,086 -
Securities lending collateral 16,715 -
TOTAL ASSETS 316,969 8,578
LIABILITIES
Accounts payable and accrued liabilities 6,839 365 Securities lending collateral 16,715 -
TOTAL LIABILITIES 23,554 365
NET ASSETS Net assets held in trust 293,415$ 8,213$
The notes to the basic financial statements are an integral part of this statement.
(In Thousands)
CITY OF OAKLANDStatement of Fiduciary Net Assets
Fiduciary FundsJune 30, 2010
28

PrivatePension Purpose
Trust TrustFunds Funds
ADDITIONS:Contributions:
Member contributions 7$ -$
Total contributions 7 -
Trust receipts - 478
Investment income:Net appreciation in fair value of investments 36,766 - Interest 3,840 25 Dividends 4,923 - Securities lending 169 -
TOTAL INVESTMENT INCOME (LOSS) 45,698 25 Less investment expenses:
Investment expenses (1,373) - Borrowers rebates and other agent fees on securities lending transactions (63) -
Total investment expenses (1,436) -
NET INVESTMENT INCOME (LOSS) 44,262 25
Other income 93 2,653
TOTAL ADDITIONS (DEDUCTIONS) 44,362 3,156
DEDUCTIONS:Benefits to members and beneficiaries:
Retirement 42,546 - Disability 25,506 - Death 2,287 -
TOTAL BENEFITS TO MEMBERS AND BENEFICIARIES 70,339 - Administrative expenses 1,209 137 CEDA - 134 Other - 2,631 Police services - 142
TOTAL DEDUCTIONS 71,548 3,044
Change in net assets (27,186) 112 NET ASSETS - BEGINNING 320,601 8,101
NET ASSETS - ENDING 293,415$ 8,213$
The notes to the basic financial statements are an integral part of this statement.
CITY OF OAKLAND
(In Thousands)For the Year Ended June 30, 2010
Fiduciary Funds Statement of Changes in Fiduciary Net Assets
29

30
THIS PAGE LEFT INTENTIONALLY BLANK

NOTES TO BASIC FINANCIAL STATEMENTS
CITY OF OAKLAND Notes to Basic Financial Statements
Year Ended June 30, 2010
31
(1) ORGANIZATION AND DEFINITION OF REPORTING ENTITY
The City of Oakland, California, (the City or Primary Government) was incorporated on May 25, 1854, by the State of California and is organized and exists under and pursuant to the provisions of State law. The Mayor/Council form of government was established in November 1998 through Charter amendment. The legislative authority is vested in the City Council and the executive authority is vested in the Mayor with administrative authority resting with the City Administrator. The accompanying financial statements present the City and its component units, entities for which the City is considered to be financially accountable. Blended component units, although legally separate entities, are, in substance, part of the City’s operations and are combined with the data of the Primary Government within the governmental activities column in the government-wide financial statements and governmental funds in the fund financial statements. The Port of Oakland (Port) is the City’s discretely presented component unit and is reported in a separate column in the government-wide financial statements to emphasize it possesses characteristics that it is legally separate from the City. Although the Port has a significant relationship with the City, it is fiscally independent and does not provide services solely to the City and, therefore, is presented discretely. Blended Component Units The Redevelopment Agency of the City of Oakland (Agency) was activated on October 11, 1956, for the purpose of redeveloping certain areas of the City designated as project areas. Its principal activities are acquiring real property for the purpose of removing or preventing blight, constructing improvements thereon, and rehabilitating and restoring existing properties. The Oakland City Council serves as the Board of the Agency. The Agency’s funds are reported as a major governmental fund. The Civic Improvement Corporation (Corporation) was created to provide a lease financing arrangement for the City. The Oakland City Council serves as the governing body for the Corporation. The Corporation’s activities are reported in other governmental funds. The Oakland Joint Powers Financing Authority (JPFA) was formed to assist in the financing of public capital improvements. JPFA is a joint exercise agency organized under the laws of the State of California and is composed of the City and the Agency. The Oakland City Council serves as the governing board for JPFA. JPFA transactions are reported in other governmental funds. Related debt is included in the long-term obligations of the City in the governmental activities column of the government-wide statement of net assets.

CITY OF OAKLAND Notes to Basic Financial Statements, (continued)
Year Ended June 30, 2010
32
Discretely Presented Component Unit The Port is a legally separate component unit established in 1927 by the City. Operations include the Oakland International Airport and the Port of Oakland Marine Terminal Facilities. All interfund transactions have been eliminated. The Port is governed by a seven-member Board of Port Commissioners (the Board) that is appointed by the City Council, upon nomination by the Mayor. The Board appoints an Executive Director to administer operations. The Port prepares and controls its own budget, administers and controls its fiscal activities, and is responsible for all Port construction and operations. The Port is required by City charter to deposit its operating revenues in the City Treasury. The City is responsible for investing and managing such funds. The Port is presented in a separate column in the government-wide financial statements. Complete financial statements of the individual component units may be obtained from:
Finance and Management Agency, Accounting Division City of Oakland 150 Frank H. Ogawa Plaza, Suite 6353 Oakland, CA 94612-2093 In accordance with Governmental Accounting Standards Board Statement No. 39, Determining Whether Certain Organizations Are Component Units, the City evaluated potential component units and determined that none of the remaining potential component units were individually significant to the City’s reporting entity.
CITY OF OAKLAND Notes to Basic Financial Statements, (continued)
Year Ended June 30, 2010
33
(2) SUMMARY OF SIGNIFICANT ACCOUNTING POLICIES Government-wide and Fund Financial Statements The government-wide financial statements (the statement of net assets and the statement of activities) report information on all of the non-fiduciary activities of the City and its component units. The effect of inter-fund activity has been removed from these statements except for interfund services provided among funds. Governmental activities, which are normally supported by taxes and intergovernmental revenues, are reported separately from business-type activities, which rely to a significant extent on fees and charges for support. Likewise, the Primary Government is reported separately from its discretely presented component units and legally separate entities for which the Primary Government is financially accountable. The statement of activities demonstrates the degree to which the direct expenses of a given function or segment are offset by program revenues. Direct expenses are those that are clearly identifiable with a specific function or segment. Program revenues include (1) charges to customers or applicants who purchase, use or directly benefit from goods, services, or privileges provided by a given function or segment; and (2) grants and contributions that are restricted to meeting the operational or capital requirements of a particular function or segment. Taxes and other items not properly included among program revenues are reported as general revenues. Separate financial statements are provided for governmental funds, proprietary funds, and fiduciary funds, even though the latter is excluded from the government-wide financial statements. Major individual governmental funds and a major individual enterprise fund are reported as separate columns in the fund financial statements. Measurement Focus, Basis of Accounting, and Financial Statement Presentation The government-wide financial statements are reported using the economic resources measurement focus and the accrual basis of accounting, as are the proprietary fund and fiduciary fund financial statements. Revenues are recorded when earned and expenses are recorded when a liability is incurred, regardless of the timing of related cash flows. Property taxes are recognized as revenues in the year for which they are levied. Grants and similar items are recognized as revenues as soon as all eligibility requirements have been met. Governmental fund financial statements are reported using the current financial resources measurement focus and the modified accrual basis of accounting. Revenues are recognized as soon as they are both measurable and available. Revenues are considered to be available
CITY OF OAKLAND Notes to Basic Financial Statements, (continued)
Year Ended June 30, 2010
34
when they are collected within the current period or soon enough thereafter to pay liabilities of the current period. The City considers property tax revenues to be available for the year levied and if they are collected within 60 days of the end of the current fiscal period. All other revenues are considered to be available if they are collected within 120 days of the end of the current fiscal period. Expenditures are recorded when a liability is incurred, as under accrual accounting. However, debt service expenditures, as well as expenditures related to compensated absences and claims and judgments, are recorded only when payment is due. Property taxes, state and local taxes, grants, licenses, charges for services, and interest and investment income associated with the current fiscal period are all considered to be susceptible to accrual and so have been recognized as revenues of the current fiscal period. Special assessments are recorded as revenues and receivables to the extent installments are considered current. The estimated installments receivable not considered available, as defined above, are recorded as receivables and offset by deferred revenue. All other revenues are reported on a cash basis. Property Taxes The County of Alameda is responsible for assessing, collecting and distributing property taxes in accordance with enabling state law, and for remitting such amounts to the City. Property taxes are assessed and levied as of July 1 on all taxable property located in the City, and result in a lien on real property. Property taxes are then due in two equal installments; the first on November 1 and the second on February 1 of the following calendar year, and are delinquent after December 10 and April 10, respectively. General property taxes are limited to a flat 1% rate applied to the 1975-76 full value of the property, or 1% of the sales price of the property or of the construction value added after the 1975-76 valuation. Assessed values on properties (exclusive of increases related to sales and construction) can rise a maximum of 2% per year. Taxes were levied at the maximum 1% rate during the year ended June 30, 2010. Proposition 1A Borrowing by the State of California: Under the provisions of Proposition 1A and as part of the 2009-10 budget package passed by the California state legislature on July 28, 2009, the State of California borrowed 8% of the amount of property tax revenue, including those property taxes associated with the in-lieu motor vehicle license fee, the triple flip in lieu sales tax, and supplemental property tax, apportioned to cities, counties and special districts (excluding redevelopment agencies). The state is required to repay this borrowing plus interest by June 30, 2013. After repayment of this initial borrowing, the California legislature may consider only one additional borrowing within a ten-year period. The amount of this borrowing pertaining to the City was $11,217,005. Authorized with the 2009-10 State budget package, the Proposition 1A Securitization Program was instituted by the California Statewide Communities Development Authority
CITY OF OAKLAND Notes to Basic Financial Statements, (continued)
Year Ended June 30, 2010
35
(“California Communities”), a joint powers authority sponsored by the California State Association of Counties and the League of California Cities, to enable local governments to sell their Proposition 1A receivables to California Communities. Under the Securitization Program, California Communities simultaneously purchased the Proposition 1A receivables and issued bonds (“Prop 1A Bonds”) to provide local agencies with cash proceeds in two equal installments, on January 15, 2010 and May 3, 2010. The purchase price paid to the local agencies equaled 100% of the amount of the property tax reduction. All transaction costs of issuance and interest were paid by the State of California. Participating local agencies have no obligation on the bonds and no credit exposure to the State. The City participated in the securitization program and accordingly property taxes have been recorded in the same manner as if the State had not exercised its rights under Proposition 1A. The receivable sale proceeds were equal to the book value and, as a result no gain or loss was recorded. The City reports the following major governmental funds:
The General Fund is the City’s primary operating fund. It accounts for all financial activities and resources of the general government except those required to be accounted for in another fund. These activities are funded principally by property taxes, sales and use taxes, business, utility and real estate transfer taxes, interest and investment income, and charges for services.
The Federal/State Grant Fund accounts for various Federal and State grants used or expended for a specific purpose, activity or program. The Oakland Redevelopment Agency Fund accounts for federal grants, land sales, rents and other revenues relating to redevelopment projects. Expenditures are comprised of land acquisitions and improvements and all other costs inherent to redevelopment activities. The Municipal Capital Improvement Fund accounts primarily for monies pertaining to the Museum and the Scotlan Convention Center financings. This fund may be used for the lease, acquisition, construction or other improvements of public facilities.
The City reports the following major enterprise fund:
The Sewer Service Fund accounts for the sewer service charges received by the City based on the use of water by East Bay Municipal Utility District customers residing in the City. The proceeds from the sewer charges are used for the construction and maintenance of sanitary sewers and storm drains and the administrative costs of the program.

CITY OF OAKLAND Notes to Basic Financial Statements, (continued)
Year Ended June 30, 2010
36
Additionally, the City reports the following fund types:
The Internal Service Funds account for the purchase of automotive and rolling equipment; radio and other communication equipment; the repair and maintenance of City facilities; acquisition, maintenance and provision of reproduction equipment and services; acquisition of inventory provided to various City departments on a cost reimbursement basis; and procurement of materials, supplies and services for City departments. The Pension Trust Funds account for closed benefit plans that cover uniformed employees hired prior to July 1976 and non-uniformed employees hired prior to September 1970. Private Purpose Trust Funds: (a) Private Purpose Trust Fund accounts for the operations of the Youth Opportunity Program and certain gifts that are not related to Agency projects or parks, recreation and cultural activities and (b) The Private Pension Trust Fund accounts for employee deferred compensation fund.
Private-sector standards of accounting and financial reporting issued prior to December 1, 1989, are followed in both the business-type activities in the government-wide and the proprietary fund financial statements to the extent that those standards do not conflict with or contradict guidance of the Governmental Accounting Standards Board. The City also has the option of following subsequent private-sector guidance for their business-type activities and enterprise funds, subject to the same limitation. The City has elected not to follow subsequent private-sector guidance. Charges between the City and the Port are not eliminated because the elimination of these charges would distort the direct costs and revenues reported. Proprietary funds distinguish operating revenues and expenses from nonoperating items. Operating revenues and expenses generally result from providing services in connection with the fund’s principal ongoing operations. The principal operating revenues of the City’s enterprise and internal service funds are charges for customer services including: sewers, golf courses, vehicle acquisition and maintenance, radio and telecommunication support charges, charges for facilities maintenance, and reproduction services. Operating expenses for enterprise funds and internal service funds include the cost of services, administrative expenses, and depreciation on capital assets. All other revenues and expenses not meeting this definition are reported as nonoperating revenues and expenses. When both restricted and unrestricted resources are available for use, it is the City’s policy to use restricted resources first, then unrestricted resources as they are needed.

CITY OF OAKLAND Notes to Basic Financial Statements, (continued)
Year Ended June 30, 2010
37
Cash and Investments The City follows the practice of pooling cash of all operating funds for investment, except for the Oakland Redevelopment Agency Fund, and funds held by outside custodians. Investments are generally carried at fair value. Money market investments (such as short-term, highly liquid debt instruments including commercial paper, banker’s acceptances, U.S. Treasury and agency obligations) that have a remaining maturity at the time of purchase of one year or less, and participating interest-earning investment contracts (such as negotiable certificates of deposit, repurchase agreements and guaranteed or bank investment contracts) are carried at amortized cost. Changes in fair value of investments are recognized as a component of interest and investment income. Proceeds from debt and other cash and investments held by fiscal agents by agreement are classified as restricted assets. Income earned or losses arising from the investment of pooled cash are allocated on a monthly basis to the participating funds and component units based on their proportionate share of the average daily cash balance. Short-term investments are reported at cost, which approximates fair value. Securities traded on national or international exchanges are valued at the last reported sales price at current exchange rates. Mortgages are reported based on the remaining principal balances which approximate the value of future principal and interest payments discounted at prevailing interest rates for similar instruments. The fair value of real estate investments is based on prices in a competitive market as determined by a specialist. For purposes of the statement of cash flows, the City considers all highly liquid investments with a maturity of three months or less when purchased to be cash equivalents. The proprietary funds’ investments in the City’s cash and investment pool are, in substance, demand deposits and are therefore considered to be cash equivalents. Due From/Due To Other Funds and Internal Balances During the course of operations, numerous transactions and borrowings occur between individual funds for goods provided or services rendered and funds that have overdrawn their share of pooled cash and inter-fund loans. In the fund financial statements, these receivables and payables are classified as “due from other funds” and “due to other funds”, respectively. In the government-wide financial statements, these receivables and payables are eliminated within the governmental activities and business-type activities columns. Net receivables and payables between the governmental activities and business-type activities are classified as internal balances.

CITY OF OAKLAND Notes to Basic Financial Statements, (continued)
Year Ended June 30, 2010
38
Interest Rate Swap Agreement The City entered into an interest rate swap agreement to modify the interest rate on outstanding debt. Refer to Note 12 for additional information. Inter-fund Transfers In the fund financial statements, inter-fund transfers are recorded as transfers in/out except for certain types of transactions that are described below:
Charges for services are recorded as revenues of the performing fund and expenditures of the requesting fund. Unbilled costs are recognized as an asset of the performing fund and a liability of the requesting fund at the end of the fiscal year. Reimbursements for expenditures, initially made by one fund that are properly applicable to another fund, are recorded as expenditures in the reimbursing fund and as a reduction of expenditures in the fund that is reimbursed. Reimbursements are eliminated for purposes of government-wide reporting.
Bond Issuance Costs and Discounts/Premiums In the government-wide financial statements and in the proprietary fund financial statements, long-term debt and other long-term obligations are reported as liabilities in the applicable governmental activities, business-type activities, or proprietary fund statement of net assets. Bond premiums and discounts, as well as issuance costs, are deferred and amortized over the life of the bonds using the effective interest method. Bonds payable are reported net of the applicable bond premium or discount. Bond issuance costs are reported as deferred charges and amortized over the term of the related debt. In the fund financial statements, governmental funds recognize bond premiums and discounts as other financing sources and uses, respectively, and bond issuance costs as debt service expenditures. Issuance costs, whether or not withheld from the actual debt proceeds received are reported as debt service expenditures. Inventories Inventories, consisting of materials and supplies held for consumption, are stated at cost. Cost is calculated using the average cost method. Inventory items are considered expensed when consumed rather than when purchased.

CITY OF OAKLAND Notes to Basic Financial Statements, (continued)
Year Ended June 30, 2010
39
Capital Assets Primary Government Capital assets, which include land, museum collections, intangibles, construction in progress, facilities and improvements, furniture, machinery and equipment, infrastructure (e.g., streets, streetlights, traffic signals, and parks), sewers and storm drains, and capital assets acquired prior to 1980, are reported in the applicable governmental or business-type activities columns in the government-wide financial statements. Capital assets are defined by the City as assets with an initial, individual cost of $5,000 or more and an estimated useful life in excess of one year. Such assets are recorded at historical cost or estimated historical cost if purchased or constructed. Donated capital assets are recorded at estimated fair market value at the date of donation. Capital outlay is recorded as expenditures in the general, federal/state grant, the Agency, municipal capital improvements, and other governmental funds and as assets in the government-wide and proprietary financial statements to the extent the City’s capitalization threshold is met. The cost of normal maintenance and repairs that do not add to the value of the asset or materially extend its useful life are not capitalized. The City has a collection of artwork presented for public exhibition and education that is being preserved for future generations. These items are protected, kept unencumbered, cared for and preserved by the City. The proceeds from the sale of any pieces of the collection are used to purchase other acquisitions for the collection. However, future acquisitions purchased with authorized budgeted City funds during a fiscal year will be reported as non-depreciable assets in the City’s financial statements. The City depreciation of capital assets is provided on the straight-line basis over the following estimated useful lives: Facilities and improvements 5-40 years Furniture, machinery and equipment 2-20 years Sewer and storm drains 50 years Infrastructure 5-50 years The City implemented GASB Statement No. 51, Accounting and Financial Reporting for Intangible Assets. This Statement requires that all intangible assets not specifically excluded by its scope provisions be classified as capital assets. Accordingly, existing authoritative guidance related to the accounting and financial reporting for capital assets should be applied to these intangible assets, as applicable. This Statement also provides authoritative guidance that specifically addresses the nature of these intangible assets. Such guidance should be applied in addition to the existing authoritative guidance for
CITY OF OAKLAND Notes to Basic Financial Statements, (continued)
Year Ended June 30, 2010
40
capital assets. The requirements of this Statement are effective for financial statements for periods beginning after June 15, 2009. The City reclassed these intangible assets from land as of July 1, 2009 in the amount of $2,607,000. See Note 7 for additional information Discretely Presented Component Unit The Port depreciation of capital assets is provided on the straight-line basis over the following estimated useful lives: Building and improvements 5-50 years Container cranes 25 years Infrastructure 10-50 years Other equipment 5-10 years Property Held for Resale Property held for resale is acquired as part of the Agency’s redevelopment program. These properties are both residential and commercial. Costs of administering Agency projects are charged to capital outlay expenditures as incurred. A primary function of the redevelopment process is to prepare land for specific private development. For financial statement presentation, property held for resale is stated at the lower of estimated cost or estimated conveyance value. Estimated conveyance value is management’s estimate of net realizable value of each property parcel based on its current intended use. During the period it is held by the Agency, property held for resale may generate rental or operating income. This income is recognized as it is earned in the Agency’s statement of activities and generally is recognized in the Agency’s governmental funds in the same period depending on when the income becomes available on a modified accrual basis of accounting. The Agency does not depreciate property held for resale, as it is the intention of the Agency to only hold the property for a period of time until it can be resold for development. Net Pension Asset In February 1997, the City issued pension obligation bonds to reduce the actuarial accrued liability of the Police and Fire Retirement System (PFRS). The net pension asset represents a prepaid asset amortized over the same period used by the actuary at the time of the bond issuance, as it allows for the matching of the asset with the related pension obligation bond liability. See Note 16 for the accounting treatment of the net pension asset.
CITY OF OAKLAND Notes to Basic Financial Statements, (continued)
Year Ended June 30, 2010
41
Compensated Absences – Accrued Vacation, Sick Leave, and Compensatory Time It is the City’s policy and its agreements with employee groups permit employees to accumulate earned but unused vested vacation, sick leave and other compensatory time. All earned compensatory time is accrued when incurred in the government-wide financial statements and the proprietary fund financial statements. A liability for these amounts is reported in the governmental funds only if they are due and payable. Retirement Plans City employees participate in one of three defined benefit retirement plans: Oakland Police and Fire Retirement System (PFRS), Oakland Municipal Employees’ Retirement System (OMERS), and California Public Employees’ Retirement System (PERS), collectively the Plans. Employer contributions and member contributions made by the employer to the Plans are recognized when due and the employer has made a formal commitment to provide the contributions. Benefits and refunds are recognized when due and payable in accordance with the provisions of the Plans. Refer to Note 16 for additional information. Other Post Employment Benefits (OPEB) The OPEB obligation covers Police, Fire and Miscellaneous employees. The City retirees are eligible for retiree health benefits if they meet certain requirements relating to age and service. The retiree health benefits are described in the labor agreements between the City and Local Unions and in City resolutions. The demographic rates used for the California Public Employee Retirement System (PERS) were public safety employees retirements benefits under a 3% @ 50 formula and miscellaneous employees retirement benefits under a 2.7% @ 55 formula. At June 30, 2010, the City reported a net OPEB obligation of $126,237,306. See Note 17 for additional information. Pollution Remediation Obligations (GASB 49) Under the provisions of GASB Statement No. 49, Accounting and Financial Reporting for Pollution Remediation Obligations, the City recorded remediation liabilities related to its pollution remediation activities. See Note 12 for additional information. Refunding of Debt Gains or losses occurring from advance refundings are deferred and amortized into expense for both business-type activities and proprietary funds. For governmental activities reported

CITY OF OAKLAND Notes to Basic Financial Statements, (continued)
Year Ended June 30, 2010
42
in the government-wide financial statements, they are deferred and amortized into expense if they occurred subsequent to June 30, 2001. Fund Balances Reservations of fund balances of the governmental funds indicate those portions of fund equity that are not available for appropriation or expenditure or which have been legally restricted to a specific use. The following is a brief description of the nature of certain reserves.
1. Reserve for Encumbrances – Encumbrances outstanding at fiscal year end are reported as reservations of fund balances and the related appropriation is automatically carried forward into the next fiscal year. Encumbrances do not constitute expenditures or liabilities because the commitments will be honored during the subsequent fiscal year.
2. Reserve for Debt Service – This fund balance is reserved for the payment of debt
service requirements in subsequent years. 3. Reserve for Property Held for Resale – This fund balance is reserved for the cost
of developing and administering residential and commercial properties intended for resale.
4. Reserve for Capital Projects – This fund balance is reserved for ongoing projects
in specific areas excluding the General Fund. This reservation includes $91,251,000 reserved for low and moderate housing projects.
5. Reserve for Pension Obligations – This fund balance is reserved for the City’s
pension obligations and is restricted with New York Life Annuity Company. Designations of portions of the General Fund unreserved fund balance have been made to indicate those portions of the fund balances which the City has tentative plans to utilize in a future period. These amounts may or may not result in actual expenditures. See Note 13 for specific designations. Restricted Net Assets Restricted net assets are those assets, net of their related liabilities that have constraints placed on their use by laws and regulations of other governments, creditors, grantors, or contributors and restrictions imposed by law through constitutional provisions or enabling legislation. Accordingly, restricted assets may include principal and interest amounts accumulated to pay debt service, unspent grant revenues, certain fees and charges, and restricted tax revenues. At June 30, 2010, the government-wide statement of net assets
CITY OF OAKLAND Notes to Basic Financial Statements, (continued)
Year Ended June 30, 2010
43
reported restricted net assets of $372.4 million in governmental activities, none of which was restricted by enabling legislation. Adoption of New Pronouncement Beginning Net Assets as of June 30, 2009 have been restated by $18,981,573 to account for the Interest Rate Swap Agreement fair value, as required by implementating the provisions of GASB Statement No. 53, Accounting and Financial Reporting for Derivative Instruments. See Note 12 for further information. Effects of New Pronouncements In March 2009, GASB issued Statement No. 54, Fund Balance Reporting and Governmental Fund Type Definitions. This Statement is intended to improve the usefulness of information provided to financial report users about fund balance by providing clearer, more structured fund balance classifications, and by clarifying the definitions of existing governmental fund types. It establishes a hierarchy of fund balance classifications based primarily on the extent to which a government is bound to observe spending constraints imposed upon how resources reported in governmental funds may be used. Specifically, GASB Statement No. 54 distinguishes fund balances between amounts that are considered nonspendable and other amounts that are classified based on the relative strength of the constraints that control the purposes for which specific amounts can be spent. Fund balance amounts will be reported in the following classifications:
• Restricted – amounts constrained by external parties, constitutional provision or enabling legislation;
• Committed – amounts constrained by a government using its highest level of decision-making authority;
• Assigned – amounts a government intends to use for a particular purpose; and • Unassigned – amounts that are not constrained at all will be reported in the general
fund. The requirements of this Statement are effective for financial statements for periods beginning after June 15, 2010. In June 2010, GASB issued Statement No. 59, Financial Instruments Omnibus. The Statement updates and improves existing standards regarding financial reporting of certain financial instruments and external investment pools. The Statement is effective for financial statements prepared by state and local governments for periods beginning after June 15, 2010, with earlier application encouraged.
CITY OF OAKLAND Notes to Basic Financial Statements, (continued)
Year Ended June 30, 2010
44
Use of Estimates The preparation of financial statements in conformity with U.S. generally accepted accounting principles requires management to make estimates and assumptions that affect certain reported amounts and disclosures. Actual results could differ from those estimates.
(3) CASH AND INVESTMENTS AND RESTRICTED CASH AND INVESTMENTS Primary Government The City maintains a cash and investment pool consisting of City funds and cash held for OMERS, PFRS, and Port. The City’s funds are invested according to the investment policy adopted by the City Council. The objectives of the policy are legality, safety, liquidity, diversity, and yield. The policy addresses soundness of financial institutions in which the City can deposit funds, types of investment instruments permitted by the California Government Code, duration of the investments, and the percentage of the portfolio that may be invested in:
• United States Treasury securities (subject to restrictions by the Nuclear Free Ordinance);
• federal agency issues; • bankers’ acceptances; • commercial paper; • medium term corporate notes and deposit notes; • negotiable certificates of deposit; • certificates of deposit; • State of California Local Agency Investment Fund; • money market mutual funds; • local city/agency bonds; • State of California bonds; • secured obligations and agreements; • repurchase agreements; and • reverse repurchase agreements.
The City’s investment policy stipulates that the collateral to back up repurchase agreements be priced at market value and be held in safekeeping by the City’s primary custodian. Additionally, the City Council has adopted certain requirements prohibiting investments in nuclear weapons makers and restricting investments in U.S. Treasury bills and notes due to their use in funding nuclear weapons research and production.
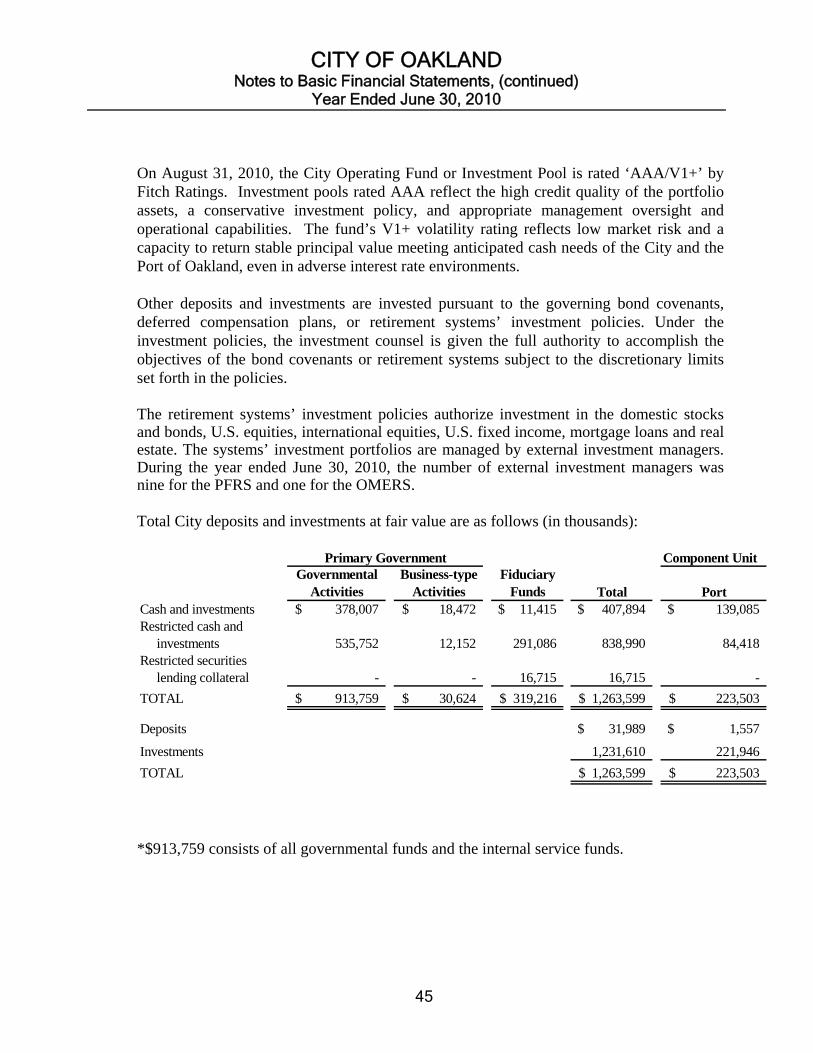
CITY OF OAKLAND Notes to Basic Financial Statements, (continued)
Year Ended June 30, 2010
45
On August 31, 2010, the City Operating Fund or Investment Pool is rated ‘AAA/V1+’ by Fitch Ratings. Investment pools rated AAA reflect the high credit quality of the portfolio assets, a conservative investment policy, and appropriate management oversight and operational capabilities. The fund’s V1+ volatility rating reflects low market risk and a capacity to return stable principal value meeting anticipated cash needs of the City and the Port of Oakland, even in adverse interest rate environments. Other deposits and investments are invested pursuant to the governing bond covenants, deferred compensation plans, or retirement systems’ investment policies. Under the investment policies, the investment counsel is given the full authority to accomplish the objectives of the bond covenants or retirement systems subject to the discretionary limits set forth in the policies. The retirement systems’ investment policies authorize investment in the domestic stocks and bonds, U.S. equities, international equities, U.S. fixed income, mortgage loans and real estate. The systems’ investment portfolios are managed by external investment managers. During the year ended June 30, 2010, the number of external investment managers was nine for the PFRS and one for the OMERS. Total City deposits and investments at fair value are as follows (in thousands):
Component UnitGovernmental
ActivitiesBusiness-type
ActivitiesFiduciary
Funds Total PortCash and investments 378,007$ 18,472$ 11,415$ 407,894$ 139,085$ Restricted cash and investments 535,752 12,152 291,086 838,990 84,418 Restricted securities lending collateral - - 16,715 16,715 -
TOTAL 913,759$ 30,624$ 319,216$ 1,263,599$ 223,503$
Deposits 31,989$ 1,557$
Investments 1,231,610 221,946
TOTAL 1,263,599$ 223,503$
Primary Government
*$913,759 consists of all governmental funds and the internal service funds.
CITY OF OAKLAND Notes to Basic Financial Statements, (continued)
Year Ended June 30, 2010
46
Investments – Primary Government Custodial Credit Risk: For investments, custodial risk is the risk that in the event of a failure of a depository financial institution or counterparty to a transaction, the inability to recover the value of the investments or collateral securities in the possession of an outside party. To protect against fraud and potential losses from the financial collapse of securities dealers, all securities owned by the City shall be held in the name of the City for safekeeping by a third party bank trust department, acting as an agent for the City under the terms of the Custody Agreement. The City’s investments subject to Custodial Credit Risk Category is very low. At June 30, 2010, the carrying amount of the City’s deposits and bank balance was $32.0 million. Deposits include checking accounts, interest earning savings accounts, money market accounts, and nonnegotiable certificates of deposit. Of the bank balance, $1.9 million was FDIC insured and $30.1 million was collateralized with securities held by the pledging financial institution in the City’s name, in accordance with Section 53652 of the California Government Code. The California Government Code requires that governmental securities or first trust deed mortgage notes be used as collateral for demand deposits and certificates of deposit at 110 percent and 150 percent, respectively, of all deposits not covered by federal deposit insurance. The collateral must be held by the pledging financial institution’s trust department and is considered held in the City’s name. Credit Risk: Credit risk represents the possibility that the issuer/counterparty to an investment will be unable to fulfill its obligations. The most effective method for minimizing the risk of default by an issuer is to invest in high quality obligations. Under the City investment policy, short term debt shall be rated at least A-1 by Standard and Poor’s (S&P), P-1 by Moody’s Investors Service or F-1 by Fitch Ratings. Long term debt shall be rated at least A by Standard and Poor’s, Moody’s Investors Service or Fitch Ratings. Since these obligations are the only ones permitted by State law, investing in them is also the most effective way to maintain legal compliance. The City invests only in securities from highly rated entities. As of June 30, 2010, approximately 70% of the pooled investments was invested in “AAA” quality securities.

CITY OF OAKLAND Notes to Basic Financial Statements, (continued)
Year Ended June 30, 2010
47
The following tables show the City’s credit risk for the Pool and Restricted portfolios as of June 30, 2010 (in thousands): Pooled Investments
Fair Value AAA/Aaa A1/P1/F1 Not RatedU.S. Govt. Agency Securities 87,841$ 87,841$ -$ -$ U.S. Govt. Agency Securities (Disc) 188,937 188,937 - - Money Market Funds 90,310 90,310 - - Local Agency Investment Fund (LAIF) 98,727 - - 98,727 Negotiable Certificates of Deposit 21,992 - 21,992 - Commercial Paper (Disc) 36,957 - 36,957 - Total Investment Pool 524,764$ 367,088$ 58,949$ 98,727$
Rating as of 06-30-10
Restricted Investments
Fair Value AAA/Aaa A1/P1/F1 Ba1 Not RatedU.S. Govt. Agency Securities 13,042$ 13,042$ -$ -$ -$ U.S. Govt. Agency Securities (Disc) 159,952 159,952 - - - U.S. Treasury Securities 1,507 1,507 - - - U.S. Treasury Securities (Disc) 1,499 1,499 - - - Money Market Funds 170,715 170,597 - - 118 Local Agency Investment Fund (LAIF) 3,413 - - - 3,413 Commercial Paper 576 - 576 - - Corporate Bonds 2,145 - - 2,145 - Local Government Bond 94,503 - - - 94,503 Annuity 100,000 - - - 100,000 Total 547,352$ 346,597$ 576$ 2,145$ 198,034$
Rating as of 06-30-10
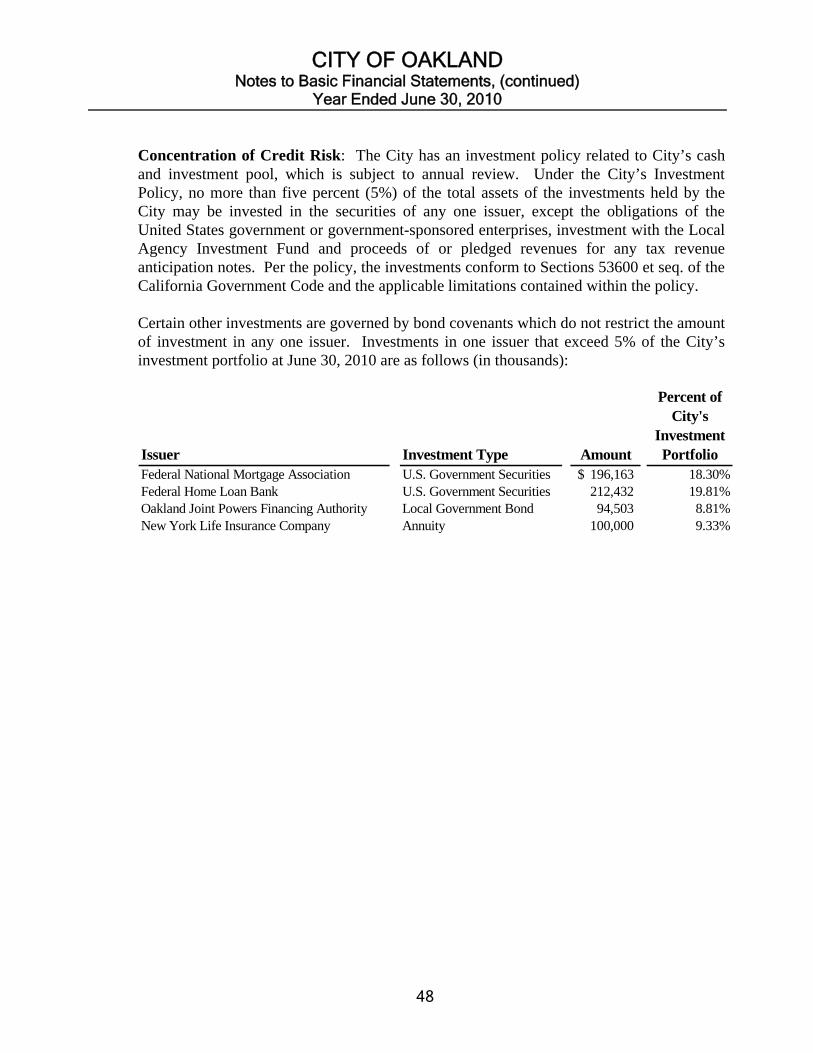
CITY OF OAKLAND Notes to Basic Financial Statements, (continued)
Year Ended June 30, 2010
48
Concentration of Credit Risk: The City has an investment policy related to City’s cash and investment pool, which is subject to annual review. Under the City’s Investment Policy, no more than five percent (5%) of the total assets of the investments held by the City may be invested in the securities of any one issuer, except the obligations of the United States government or government-sponsored enterprises, investment with the Local Agency Investment Fund and proceeds of or pledged revenues for any tax revenue anticipation notes. Per the policy, the investments conform to Sections 53600 et seq. of the California Government Code and the applicable limitations contained within the policy. Certain other investments are governed by bond covenants which do not restrict the amount of investment in any one issuer. Investments in one issuer that exceed 5% of the City’s investment portfolio at June 30, 2010 are as follows (in thousands):
Issuer Investment Type Amount
Percent of City's
Investment Portfolio
Federal National Mortgage Association U.S. Government Securities 196,163$ 18.30%Federal Home Loan Bank U.S. Government Securities 212,432 19.81%Oakland Joint Powers Financing Authority Local Government Bond 94,503 8.81%New York Life Insurance Company Annuity 100,000 9.33%

CITY OF OAKLAND Notes to Basic Financial Statements, (continued)
Year Ended June 30, 2010
49
The following table shows the diversification of the City’s portfolio (in thousands): Pooled Investments
Fair ValuePercent (%) of
PortfolioU.S. Govt. Agency Securities 87,841$ 16.74%U.S. Govt. Agency Securities (Disc) 188,937 36.00%Money Market Funds 90,310 17.21%Local Agency Investment Fund (LAIF) 98,727 18.82%Negotiable Certificates of Deposit 21,992 4.19%Commercial Paper (Disc) 36,957 7.04%Total Investment Pool 524,764$ 100%
Rating as of 06-30-10
Restricted Investments
Fair ValuePercent (%) of
PortfolioU.S. Govt. Agency Securities 13,042$ 2.38%U.S. Govt. Agency Securities (Disc) 159,952 29.22%U.S. Treasury Securities 1,507 0.28%U.S. Treasury Securities (Disc) 1,499 0.27%Money Market Funds 170,715 31.19%Local Agency Investment Fund (LAIF) 3,413 0.62%Commercial Paper 576 0.11%Corporate Bonds 2,145 0.39%Local Government Bond 94,503 17.27%Annuity 100,000 18.27%Total 547,352$ 100.00%
Rating as of 06-30-10
Interest Rate Risk: This risk represents the possibility that an interest rate change could adversely affect an investment’s fair value. The longer the maturity of an investment, the greater the sensitivity of its fair value to changes in market interest rates. As a means for limiting its exposure to changing interest rates, Section 53601 of the State of California Government Code and the City’s Investment Policy limits certain investments to short maturities such as Certificates of Deposit and Commercial Paper, whose maturities are 360 days and 270 days respectively. Also, Section 53601 of the State of California Government Code limits the maximum maturity of any investment to be no longer than 5 years unless authority for such investment is expressly granted in advance by the City

CITY OF OAKLAND Notes to Basic Financial Statements, (continued)
Year Ended June 30, 2010
50
Council or authorized by bond covenants. The City continues to purchase a combination of shorter term and longer-term investments to minimize such risks. The City has elected to use the segmented time distribution method of disclosure for its interest rate risk. As of June 30, 2010, the City’s pooled portfolio had a weighted average days to maturity of 145 days and had the following investments and original maturities (in thousands): Pooled Investments
Fair ValueInterest Rates
(%)12 Months
or Less 1 - 3 Years 3 - 5 YearsU.S. Govt. Agency Securities 87,841$ 0.343 - 2.68 24,354$ 42,068$ 21,419$ U.S. Govt. Agency Securities (Disc) 188,937 0.00 - 0.225 188,937 - - Money Market Funds* 90,310 0.14 - 0.210 90,310 - - Local Agency Investment Fund (LAIF)* 98,727 0.53 98,727 - - Negotiable Certificates of Deposit 21,992 0.36 - 0.573 21,992 - - Commercial Paper (Disc) 36,957 0.12 - 0.265 36,957 - - Total Investment Pool 524,764$ 461,277$ 42,068$ 21,419$
Maturity
* weighted average maturity used. Restricted Investments
Fair ValueInterest
Rates (%)12 Months
or Less 1 - 3 Years 3 - 5 Years 5 Years +U.S. Gov't Agency Securities 13,042$ 0.300 - 0.659 10,019$ 3,023$ -$ -$ U.S. Gov't Agency Securities (Disc) 159,952 0.00 - 0.437 159,952 - - - U.S. Treasuries 1,507 0.359 1,507 - - - U.S. Treasuries (Disc) 1,499 0.152 - 0.172 1,499 - - - Money Market Funds* 170,715 0.00 - 0.96 170,715 - - - Local Agency Investment Fund* 3,413 0.53 - 4.85 3,413 - - - Commercial Paper 576 0.889 - 1.985 576 - - - Corporate Bonds 2,145 11.365 - - - 2,145 Local Government Bond 94,503 4.86 6,492 14,054 15,617 58,340 Annuity 100,000 3.60 - - - 100,000 Total 547,352$ 354,173$ 17,077$ 15,617$ 160,485$
Maturity
* weighted average maturity used.

CITY OF OAKLAND Notes to Basic Financial Statements, (continued)
Year Ended June 30, 2010
51
Foreign Currency Risk: This is the risk that changes in exchange rates between the U.S. dollar and foreign currencies which could adversely affect an investment’s fair value. The City only invests in U.S. dollar denominated obligations. This successfully eliminates all risk of principal erosion due to fluctuations in the values of foreign currencies. Other Disclosures: As of June 30, 2010, the City’s investment in LAIF is $102.1 million ($98.7 million in pooled investments and $3.4 million in restricted investments). The total amount invested by all public agencies in LAIF at that date is approximately $23.3 billion. LAIF is part of the Pooled Money Investment Account (PMIA) with a total portfolio of approximately $69.4 billion, 94.58% is invested in non-derivative financial products and 5.42% in structured notes and asset-backed securities. As of June 30, 2010, LAIF has a average life-month end of 203 days. The Local Investment Advisory Board (Board) has oversight responsibility for LAIF. The Board consists of five members as designated by State Statute. The value of the pool shares in LAIF, which may be withdrawn, is determined on an amortized cost basis that is different than the fair value of the City’s position in the pool. Pensions Cash and Investments Oakland Municipal Employee’s Retirement System (OMERS) City’s Investment Pool and Deposits Cash and cash deposits consisted of cash in treasury held in the City’s cash and investment pool. These funds are invested according to the investment policy adopted by the City Council. Interest earned on these pooled accounts is allocated monthly to all funds based on the average daily cash balance maintained by the respective funds. As of June 30, 2010, OMERS share of the City’s investment pool totaled $45,086. Investments OMERS investment policy authorizes investments in domestic common stocks and bonds. During the year ended June 30, 2010, OMERS investment portfolio was managed by one external investment manager. OMERS investment policy states that the asset allocation of the investment portfolio target shall be 70% Domestic Equity and 30% Domestic Fixed Income. As of June 30, 2010, OMERS investment portfolio consists of shares of two investment funds (Funds). OMERS invests in the American Century Equity Fund and the HighMark Employee Benefit Flexible Bond Fund Commingled Fund. Specific guidelines for the Funds are detailed in the prospectus or declaration of Trust, for each individual fund.
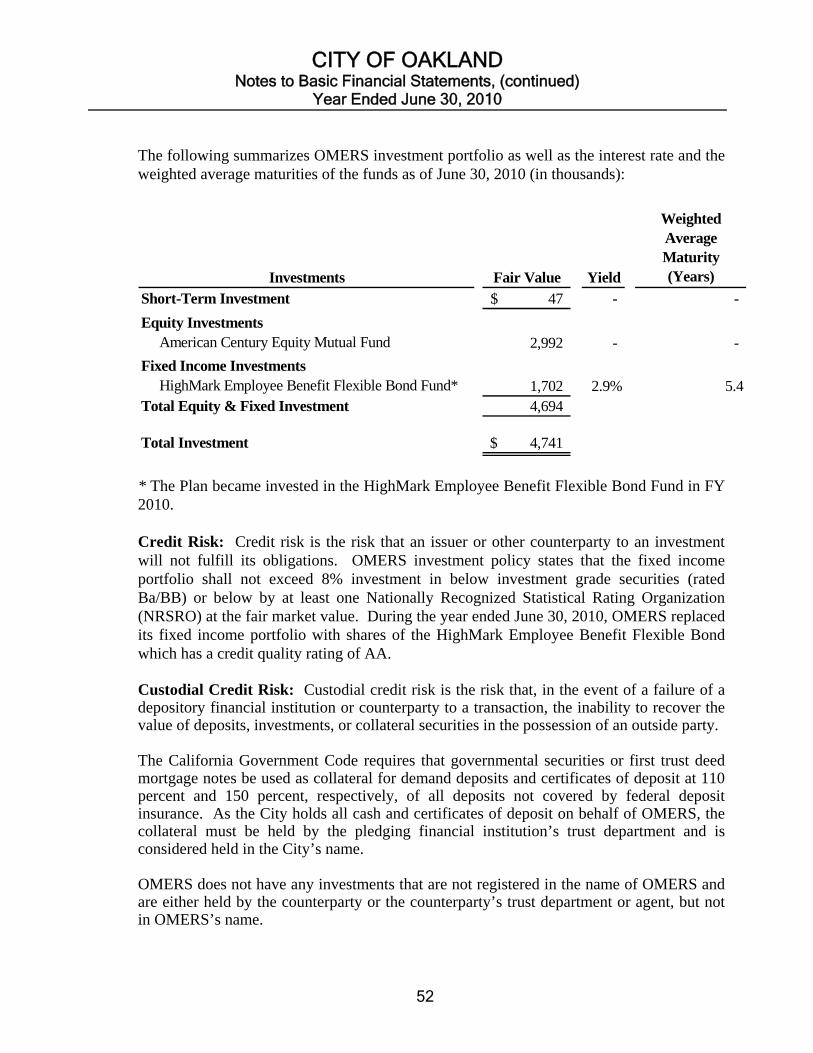
CITY OF OAKLAND Notes to Basic Financial Statements, (continued)
Year Ended June 30, 2010
52
The following summarizes OMERS investment portfolio as well as the interest rate and the weighted average maturities of the funds as of June 30, 2010 (in thousands):
Investments Fair Value Yield
Weighted Average Maturity (Years)
Short-Term Investment 47$ - -
Equity Investments American Century Equity Mutual Fund 2,992 - -
Fixed Income Investments HighMark Employee Benefit Flexible Bond Fund* 1,702 2.9% 5.4Total Equity & Fixed Investment 4,694
Total Investment 4,741$
* The Plan became invested in the HighMark Employee Benefit Flexible Bond Fund in FY 2010. Credit Risk: Credit risk is the risk that an issuer or other counterparty to an investment will not fulfill its obligations. OMERS investment policy states that the fixed income portfolio shall not exceed 8% investment in below investment grade securities (rated Ba/BB) or below by at least one Nationally Recognized Statistical Rating Organization (NRSRO) at the fair market value. During the year ended June 30, 2010, OMERS replaced its fixed income portfolio with shares of the HighMark Employee Benefit Flexible Bond which has a credit quality rating of AA. Custodial Credit Risk: Custodial credit risk is the risk that, in the event of a failure of a depository financial institution or counterparty to a transaction, the inability to recover the value of deposits, investments, or collateral securities in the possession of an outside party. The California Government Code requires that governmental securities or first trust deed mortgage notes be used as collateral for demand deposits and certificates of deposit at 110 percent and 150 percent, respectively, of all deposits not covered by federal deposit insurance. As the City holds all cash and certificates of deposit on behalf of OMERS, the collateral must be held by the pledging financial institution’s trust department and is considered held in the City’s name. OMERS does not have any investments that are not registered in the name of OMERS and are either held by the counterparty or the counterparty’s trust department or agent, but not in OMERS’s name.

CITY OF OAKLAND Notes to Basic Financial Statements, (continued)
Year Ended June 30, 2010
53
Derivatives: OMERS has adopted GASB Statement No. 53 Accounting and Financial Reporting for Derivative Instruments, effective July 1, 2009. The statement addresses hedge accounting requirements and improves disclosures, providing a summary of the government’s derivative instrument activity, its objectives for entering into derivative instruments, and their significant terms and risks. OMERS has no derivatives as of June 30, 2010. Oakland Police and Fire Retirement System (PFRS) Cash and Cash Deposits As of June 30, 2010, cash and cash deposits consisted of cash in treasury held in the City’s cash and investment pool as well as cash deposits held in bank and with a custodian. These funds are invested according to the investment policy adopted by the City Council. Interest earned on these pooled accounts is allocated monthly to all funds based on the average daily cash balance maintained by the respective funds. As of June 30, 2010, PFRS share of the City’s investment pool totaled $1,693,428. PFRS has a money market account with Alta Alliance Bank in the amount of $1,089,286 and a cash balance of $18,002 in their international custodian accounts. Of the total cash and cash deposits not held in the City’s investment pool, $286,002 was FDIC insured and $839,286 was collateralized with securities held by the pledging financial institution in PFRS name, in accordance with Section 53652 of the California Government Code. Investments PFRS investment policy authorizes investment in U.S. equities, international equities, U.S. fixed income, instruments including U.S. Treasury notes and bonds, government agency mortgage backed securities, U.S. corporate notes and bonds, collateralized mortgage obligations, yankee bonds and non U.S. issued fixed income securities denominated in foreign currencies. PFRS investment portfolio is managed by external investment managers, except for the bond iShares which are managed internally. During the year ended June 30, 2010, the number of external investment managers was nine. The PFRS investments are also restricted by the City Charter. In November 2006, City voters passed Measure M to amend the City Charter to allow the PFRS Board to invest in non-dividend paying stocks and to change the asset allocation structure from 50% equities and 50% fixed income to the Prudent Person Standard as defined by the California Constitution. PFRS investment policy limits fixed income investments to a maximum average duration of 10 years and a maximum remaining term to maturity (single issue) at purchase of 30 years, with targeted portfolio duration of between 3 to 8 years and targeted portfolio
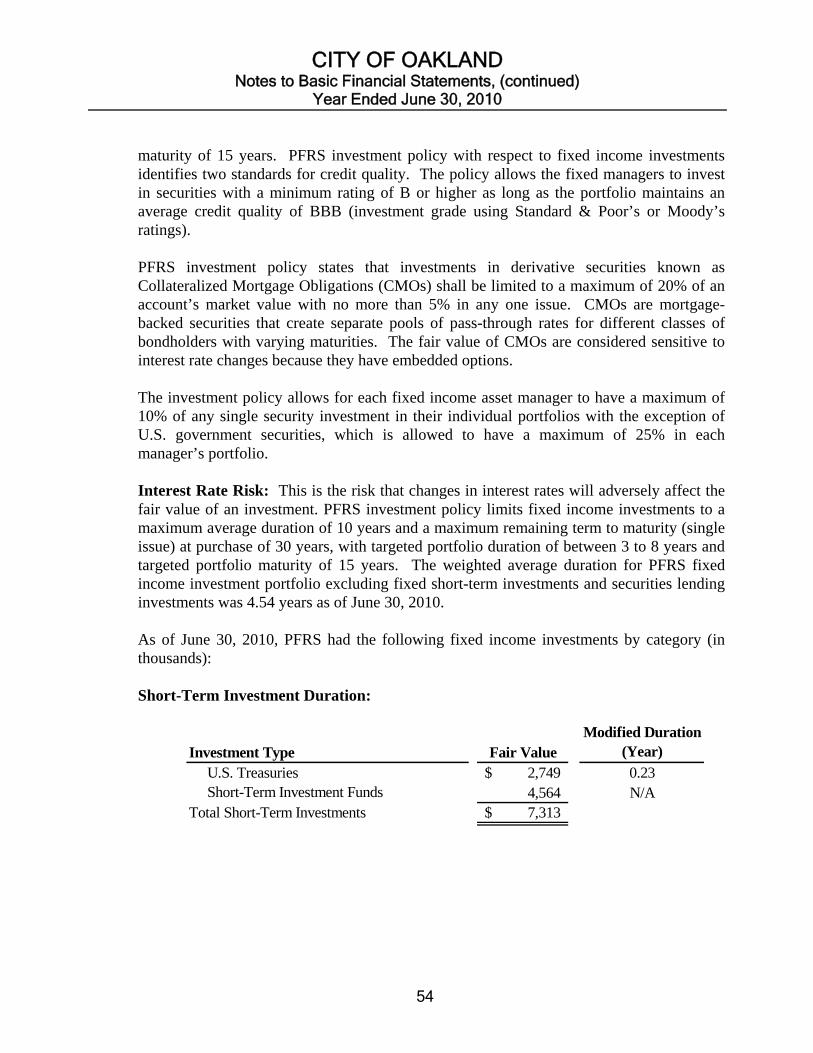
CITY OF OAKLAND Notes to Basic Financial Statements, (continued)
Year Ended June 30, 2010
54
maturity of 15 years. PFRS investment policy with respect to fixed income investments identifies two standards for credit quality. The policy allows the fixed managers to invest in securities with a minimum rating of B or higher as long as the portfolio maintains an average credit quality of BBB (investment grade using Standard & Poor’s or Moody’s ratings). PFRS investment policy states that investments in derivative securities known as Collateralized Mortgage Obligations (CMOs) shall be limited to a maximum of 20% of an account’s market value with no more than 5% in any one issue. CMOs are mortgage-backed securities that create separate pools of pass-through rates for different classes of bondholders with varying maturities. The fair value of CMOs are considered sensitive to interest rate changes because they have embedded options. The investment policy allows for each fixed income asset manager to have a maximum of 10% of any single security investment in their individual portfolios with the exception of U.S. government securities, which is allowed to have a maximum of 25% in each manager’s portfolio. Interest Rate Risk: This is the risk that changes in interest rates will adversely affect the fair value of an investment. PFRS investment policy limits fixed income investments to a maximum average duration of 10 years and a maximum remaining term to maturity (single issue) at purchase of 30 years, with targeted portfolio duration of between 3 to 8 years and targeted portfolio maturity of 15 years. The weighted average duration for PFRS fixed income investment portfolio excluding fixed short-term investments and securities lending investments was 4.54 years as of June 30, 2010. As of June 30, 2010, PFRS had the following fixed income investments by category (in thousands): Short-Term Investment Duration:
Investment Type Fair ValueModified Duration
(Year)
U.S. Treasuries 2,749$ 0.23 Short-Term Investment Funds 4,564 N/ATotal Short-Term Investments 7,313$
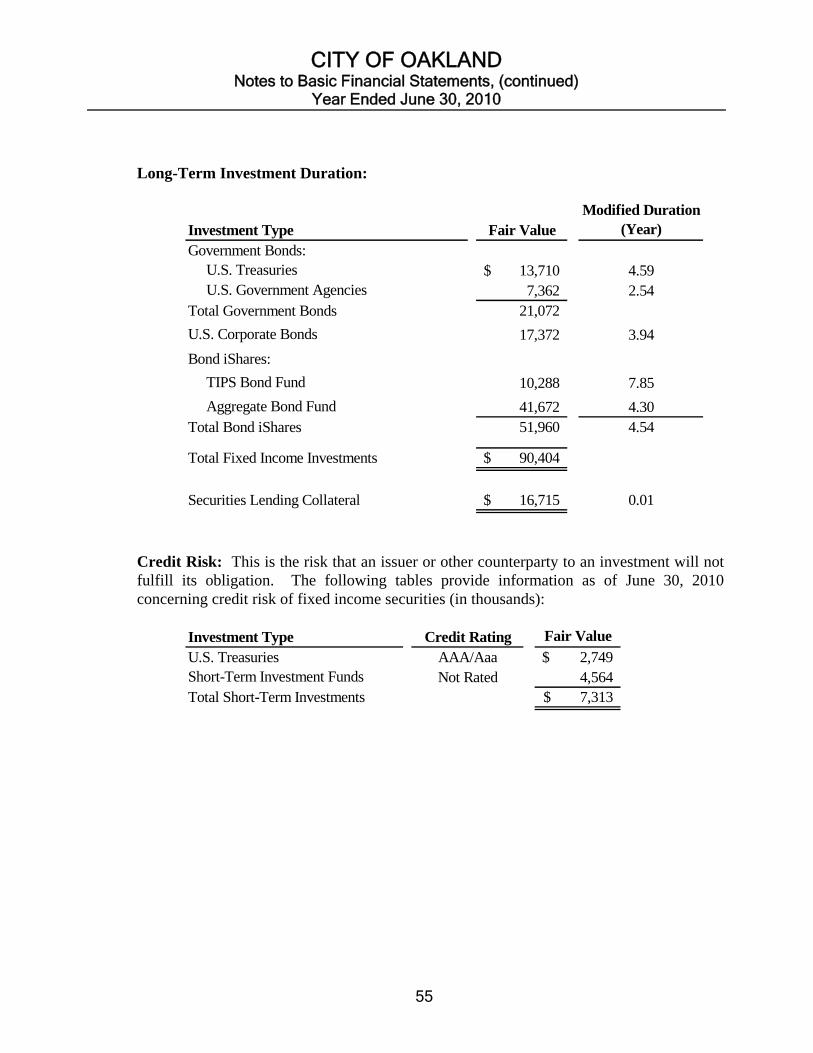
CITY OF OAKLAND Notes to Basic Financial Statements, (continued)
Year Ended June 30, 2010
55
Long-Term Investment Duration:
Investment Type Fair ValueModified Duration
(Year)
Government Bonds: U.S. Treasuries 13,710$ 4.59 U.S. Government Agencies 7,362 2.54Total Government Bonds 21,072
U.S. Corporate Bonds 17,372 3.94
Bond iShares:
TIPS Bond Fund 10,288 7.85
Aggregate Bond Fund 41,672 4.30Total Bond iShares 51,960 4.54
Total Fixed Income Investments 90,404$
Securities Lending Collateral 16,715$ 0.01
Credit Risk: This is the risk that an issuer or other counterparty to an investment will not fulfill its obligation. The following tables provide information as of June 30, 2010 concerning credit risk of fixed income securities (in thousands):
Investment Type Credit Rating Fair Value
U.S. Treasuries AAA/Aaa 2,749$ Short-Term Investment Funds Not Rated 4,564 Total Short-Term Investments 7,313$
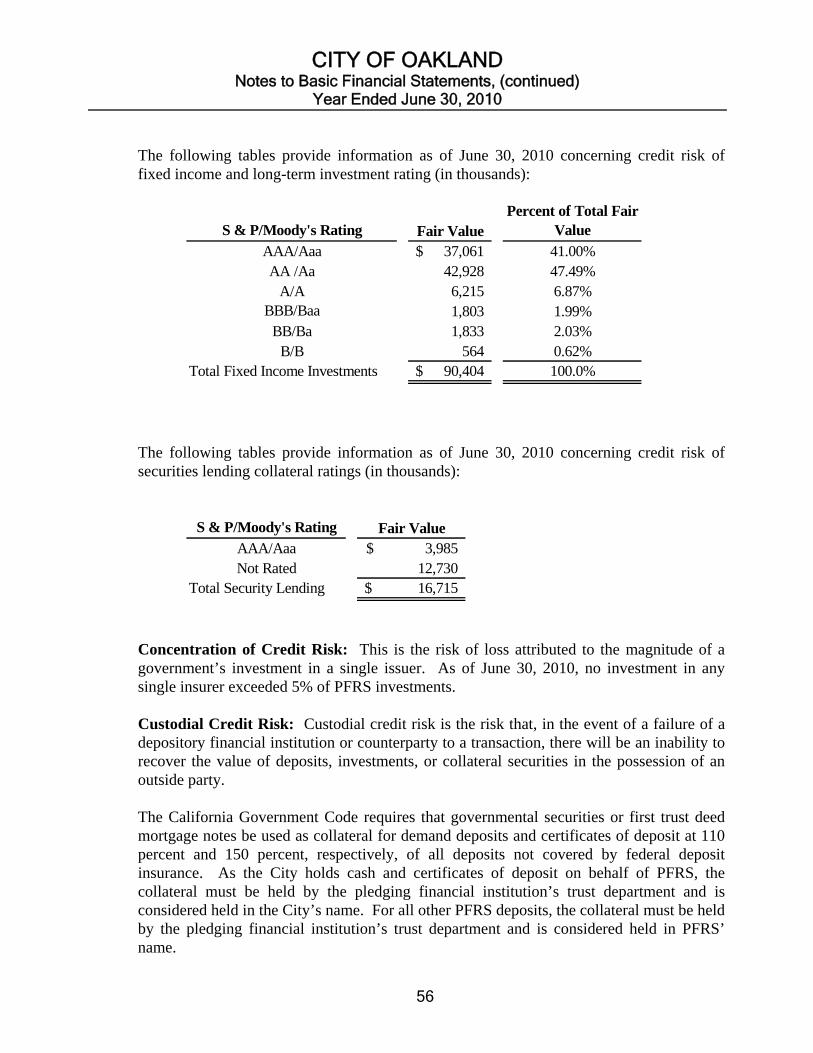
CITY OF OAKLAND Notes to Basic Financial Statements, (continued)
Year Ended June 30, 2010
56
The following tables provide information as of June 30, 2010 concerning credit risk of fixed income and long-term investment rating (in thousands):
S & P/Moody's Rating Fair ValuePercent of Total Fair
Value
AAA/Aaa 37,061$ 41.00%AA /Aa 42,928 47.49%
A/A 6,215 6.87%BBB/Baa 1,803 1.99%
BB/Ba 1,833 2.03%B/B 564 0.62%
Total Fixed Income Investments 90,404$ 100.0%
The following tables provide information as of June 30, 2010 concerning credit risk of securities lending collateral ratings (in thousands):
S & P/Moody's Rating Fair ValueAAA/Aaa 3,985$ Not Rated 12,730
Total Security Lending 16,715$
Concentration of Credit Risk: This is the risk of loss attributed to the magnitude of a government’s investment in a single issuer. As of June 30, 2010, no investment in any single insurer exceeded 5% of PFRS investments. Custodial Credit Risk: Custodial credit risk is the risk that, in the event of a failure of a depository financial institution or counterparty to a transaction, there will be an inability to recover the value of deposits, investments, or collateral securities in the possession of an outside party. The California Government Code requires that governmental securities or first trust deed mortgage notes be used as collateral for demand deposits and certificates of deposit at 110 percent and 150 percent, respectively, of all deposits not covered by federal deposit insurance. As the City holds cash and certificates of deposit on behalf of PFRS, the collateral must be held by the pledging financial institution’s trust department and is considered held in the City’s name. For all other PFRS deposits, the collateral must be held by the pledging financial institution’s trust department and is considered held in PFRS’ name.
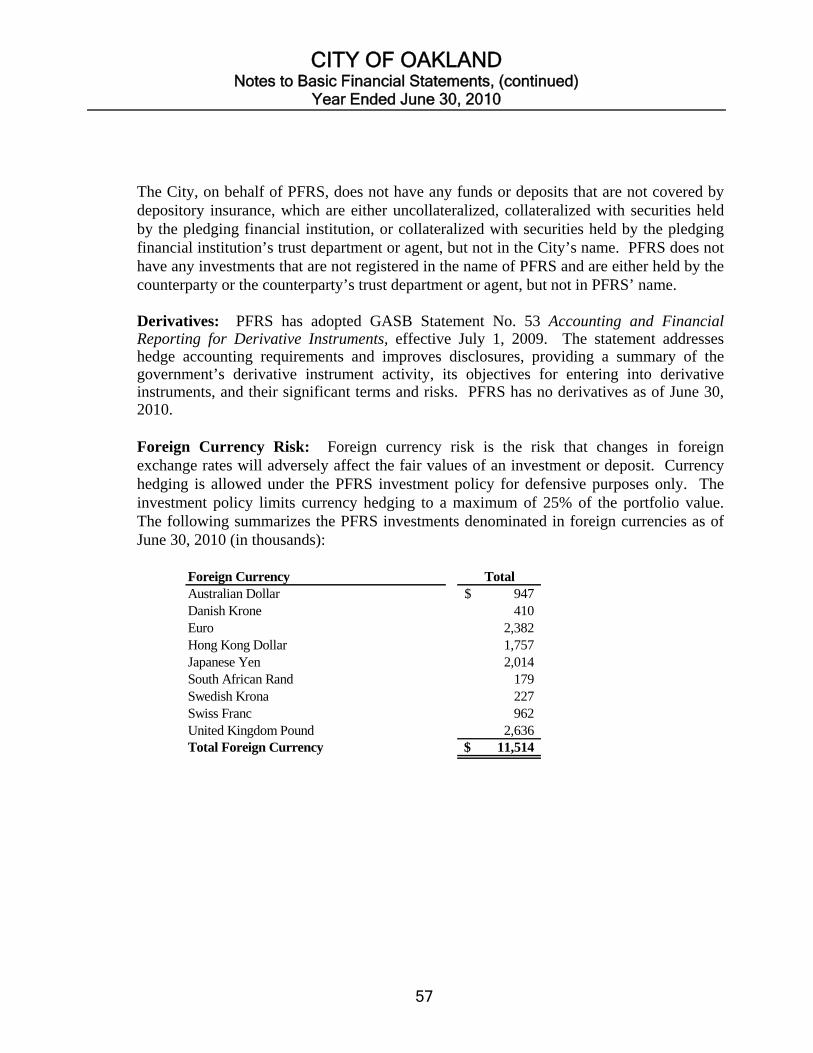
CITY OF OAKLAND Notes to Basic Financial Statements, (continued)
Year Ended June 30, 2010
57
The City, on behalf of PFRS, does not have any funds or deposits that are not covered by depository insurance, which are either uncollateralized, collateralized with securities held by the pledging financial institution, or collateralized with securities held by the pledging financial institution’s trust department or agent, but not in the City’s name. PFRS does not have any investments that are not registered in the name of PFRS and are either held by the counterparty or the counterparty’s trust department or agent, but not in PFRS’ name. Derivatives: PFRS has adopted GASB Statement No. 53 Accounting and Financial Reporting for Derivative Instruments, effective July 1, 2009. The statement addresses hedge accounting requirements and improves disclosures, providing a summary of the government’s derivative instrument activity, its objectives for entering into derivative instruments, and their significant terms and risks. PFRS has no derivatives as of June 30, 2010. Foreign Currency Risk: Foreign currency risk is the risk that changes in foreign exchange rates will adversely affect the fair values of an investment or deposit. Currency hedging is allowed under the PFRS investment policy for defensive purposes only. The investment policy limits currency hedging to a maximum of 25% of the portfolio value. The following summarizes the PFRS investments denominated in foreign currencies as of June 30, 2010 (in thousands):
Foreign Currency TotalAustralian Dollar 947$ Danish Krone 410 Euro 2,382 Hong Kong Dollar 1,757 Japanese Yen 2,014 South African Rand 179 Swedish Krona 227 Swiss Franc 962 United Kingdom Pound 2,636 Total Foreign Currency 11,514$
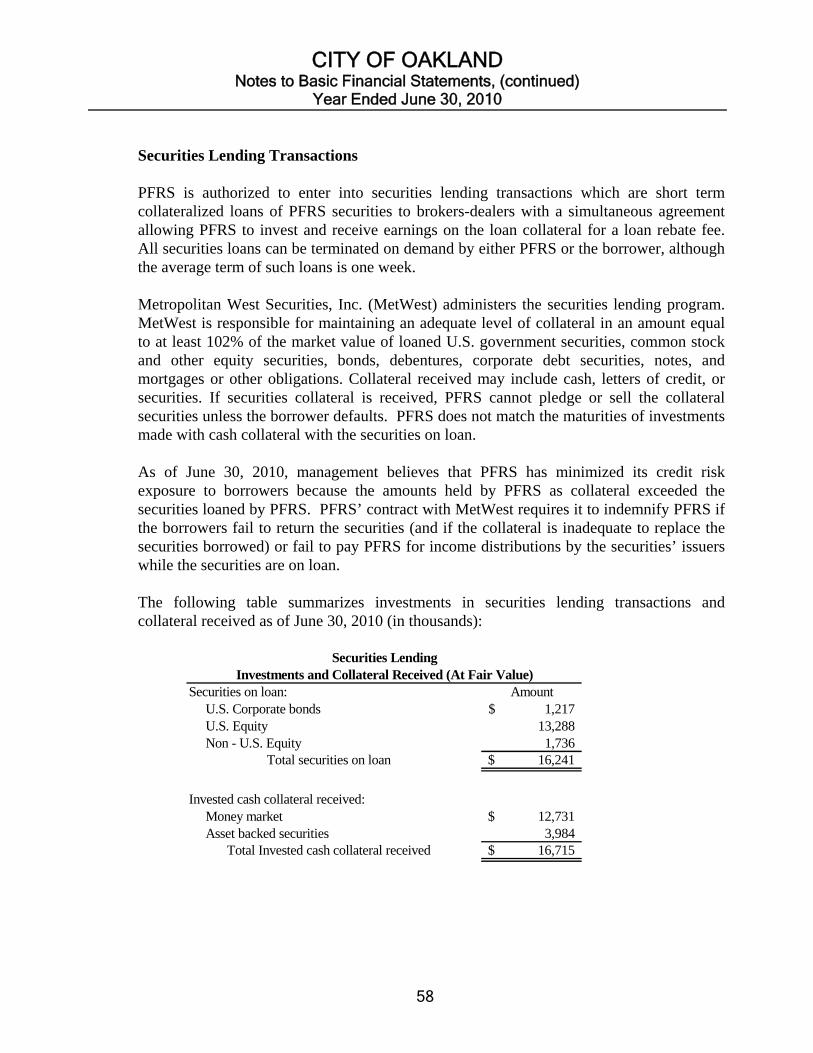
CITY OF OAKLAND Notes to Basic Financial Statements, (continued)
Year Ended June 30, 2010
58
Securities Lending Transactions PFRS is authorized to enter into securities lending transactions which are short term collateralized loans of PFRS securities to brokers-dealers with a simultaneous agreement allowing PFRS to invest and receive earnings on the loan collateral for a loan rebate fee. All securities loans can be terminated on demand by either PFRS or the borrower, although the average term of such loans is one week. Metropolitan West Securities, Inc. (MetWest) administers the securities lending program. MetWest is responsible for maintaining an adequate level of collateral in an amount equal to at least 102% of the market value of loaned U.S. government securities, common stock and other equity securities, bonds, debentures, corporate debt securities, notes, and mortgages or other obligations. Collateral received may include cash, letters of credit, or securities. If securities collateral is received, PFRS cannot pledge or sell the collateral securities unless the borrower defaults. PFRS does not match the maturities of investments made with cash collateral with the securities on loan. As of June 30, 2010, management believes that PFRS has minimized its credit risk exposure to borrowers because the amounts held by PFRS as collateral exceeded the securities loaned by PFRS. PFRS’ contract with MetWest requires it to indemnify PFRS if the borrowers fail to return the securities (and if the collateral is inadequate to replace the securities borrowed) or fail to pay PFRS for income distributions by the securities’ issuers while the securities are on loan. The following table summarizes investments in securities lending transactions and collateral received as of June 30, 2010 (in thousands):
Securities on loan: Amount U.S. Corporate bonds 1,217$ U.S. Equity 13,288 Non - U.S. Equity 1,736
Total securities on loan 16,241$
Invested cash collateral received: Money market 12,731$ Asset backed securities 3,984
Total Invested cash collateral received 16,715$
Investments and Collateral Received (At Fair Value)Securities Lending

CITY OF OAKLAND Notes to Basic Financial Statements, (continued)
Year Ended June 30, 2010
59
Fair Value Highly Sensitive to Change in Interest Rates: The terms of a debt investment may cause its fair value to be highly sensitive to interest rate changes. PFRS has invested in collateralized mortgage obligations (CMOs), which are mortgage-backed bonds that pay pass-through rates with varying maturities. The fair values of CMOs are considered sensitive to interest rate changes because they have embedded options, which are triggers related to quantities of delinquencies or defaults in the loans backing the mortgage pool. If a balance of delinquent loans reaches a certain threshold, interest and principal that would be used to pay junior bondholders is instead directed to pay off the principal balance of senior bondholders and shortening the life of the senior bonds. The following table shows PFRS investments in CMOs as of June 30, 2010 (in thousands):
Securities Name
Weighted Average
Coupon Rate
Weighted Average Maturity Fair Value
Percent of Total Investment Fair
Value
Commercial Mortgage Pass-Through 4.64% 4/28/2032 1,435$ 0.50%
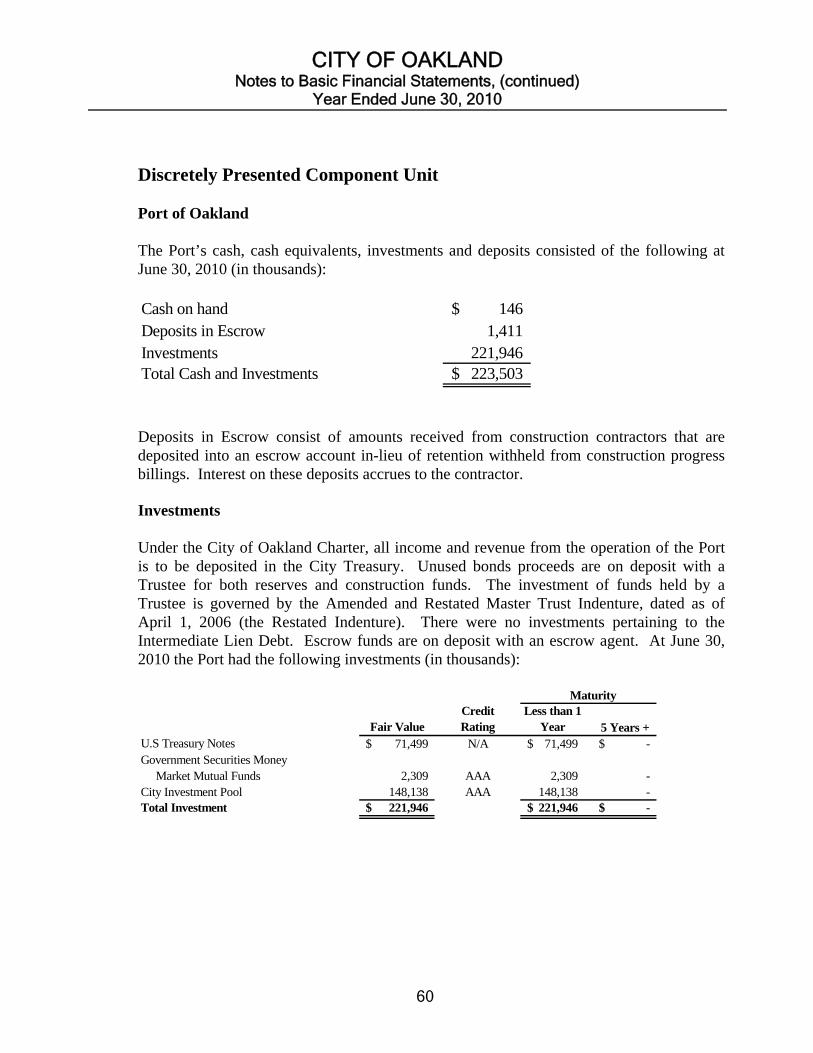
CITY OF OAKLAND Notes to Basic Financial Statements, (continued)
Year Ended June 30, 2010
60
Discretely Presented Component Unit Port of Oakland The Port’s cash, cash equivalents, investments and deposits consisted of the following at June 30, 2010 (in thousands): Cash on hand 146$ Deposits in Escrow 1,411 Investments 221,946 Total Cash and Investments 223,503$
Deposits in Escrow consist of amounts received from construction contractors that are deposited into an escrow account in-lieu of retention withheld from construction progress billings. Interest on these deposits accrues to the contractor. Investments Under the City of Oakland Charter, all income and revenue from the operation of the Port is to be deposited in the City Treasury. Unused bonds proceeds are on deposit with a Trustee for both reserves and construction funds. The investment of funds held by a Trustee is governed by the Amended and Restated Master Trust Indenture, dated as of April 1, 2006 (the Restated Indenture). There were no investments pertaining to the Intermediate Lien Debt. Escrow funds are on deposit with an escrow agent. At June 30, 2010 the Port had the following investments (in thousands):
Fair ValueCredit Rating
Less than 1 Year 5 Years +
U.S Treasury Notes 71,499$ N/A 71,499$ -$ Government Securities Money Market Mutual Funds 2,309 AAA 2,309 - City Investment Pool 148,138 AAA 148,138 - Total Investment 221,946$ 221,946$ -$
Maturity
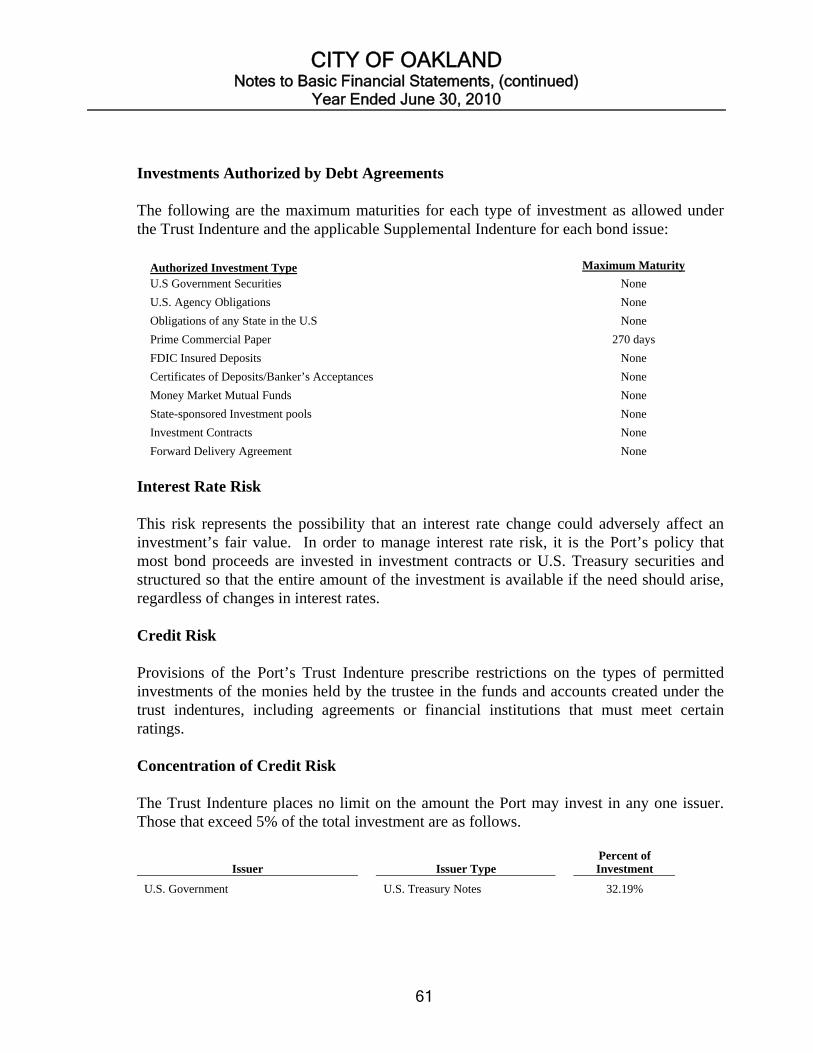
CITY OF OAKLAND Notes to Basic Financial Statements, (continued)
Year Ended June 30, 2010
61
Investments Authorized by Debt Agreements The following are the maximum maturities for each type of investment as allowed under the Trust Indenture and the applicable Supplemental Indenture for each bond issue:
Authorized Investment Type Maximum Maturity
U.S Government Securities None
U.S. Agency Obligations None
Obligations of any State in the U.S None
Prime Commercial Paper 270 days
FDIC Insured Deposits None
Certificates of Deposits/Banker’s Acceptances None
Money Market Mutual Funds None
State-sponsored Investment pools None
Investment Contracts None
Forward Delivery Agreement None
Interest Rate Risk This risk represents the possibility that an interest rate change could adversely affect an investment’s fair value. In order to manage interest rate risk, it is the Port’s policy that most bond proceeds are invested in investment contracts or U.S. Treasury securities and structured so that the entire amount of the investment is available if the need should arise, regardless of changes in interest rates. Credit Risk Provisions of the Port’s Trust Indenture prescribe restrictions on the types of permitted investments of the monies held by the trustee in the funds and accounts created under the trust indentures, including agreements or financial institutions that must meet certain ratings. Concentration of Credit Risk The Trust Indenture places no limit on the amount the Port may invest in any one issuer. Those that exceed 5% of the total investment are as follows.
Issuer Issuer Type Percent of Investment
U.S. Government U.S. Treasury Notes 32.19%
CITY OF OAKLAND Notes to Basic Financial Statements, (continued)
Year Ended June 30, 2010
62
Custodial Credit Risk
For investments, custodial credit risk is the risk that in the event of a failure of a depository financial institution or counterparty to a transaction, the ability to recover the value of the investments or collateral securities in the possession of an outside party may be doubtful. Custodial risks also can include, but not limited to, fluctuation in the investment market and the Port, or its representatives to monitor the investments purchased are within the investment policy. To protect against fraud and potential losses from the financial collapse of securities dealers, all securities owned by the Port shall be held in the name of the Port for safekeeping by a third party bank trust department, acting as an agent for the Port under the terms of the Restated Indenture. The carrying amount of Port deposits in escrow was $1,411,000 at June 30, 2010. Bank balances and escrow deposits of $250,000 at June 30, 2010 are insured or collateralized with securities held by the pledging financial institution’s trust department in the Port’s name. The remaining balance of $1,161,000 as of June 30, 2010, was exposed to custodial credit risk by not being insured or collateralized. Cash and Investments with the City of Oakland Pursuant to the City Charter, Port operating revenues are deposited in the City Treasury. These funds are commingled in the City’s investment pool. The Port receives a monthly interest allocation from investment earnings of the City based on the average daily balance on deposit and the earnings of the investments.
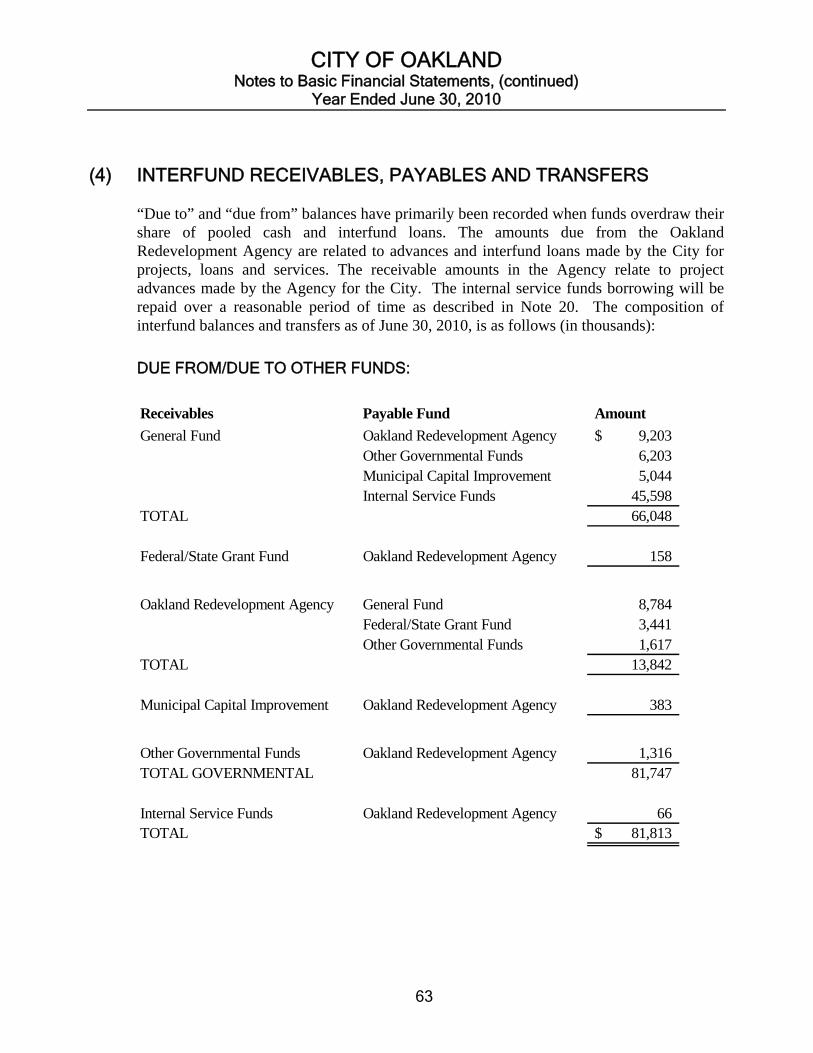
CITY OF OAKLAND Notes to Basic Financial Statements, (continued)
Year Ended June 30, 2010
63
(4) INTERFUND RECEIVABLES, PAYABLES AND TRANSFERS “Due to” and “due from” balances have primarily been recorded when funds overdraw their share of pooled cash and interfund loans. The amounts due from the Oakland Redevelopment Agency are related to advances and interfund loans made by the City for projects, loans and services. The receivable amounts in the Agency relate to project advances made by the Agency for the City. The internal service funds borrowing will be repaid over a reasonable period of time as described in Note 20. The composition of interfund balances and transfers as of June 30, 2010, is as follows (in thousands):
DUE FROM/DUE TO OTHER FUNDS:
Receivables Payable Fund Amount
General Fund Oakland Redevelopment Agency 9,203$ Other Governmental Funds 6,203 Municipal Capital Improvement 5,044 Internal Service Funds 45,598
TOTAL 66,048
Federal/State Grant Fund Oakland Redevelopment Agency 158
Oakland Redevelopment Agency General Fund 8,784 Federal/State Grant Fund 3,441 Other Governmental Funds 1,617
TOTAL 13,842
Municipal Capital Improvement Oakland Redevelopment Agency 383
Other Governmental Funds Oakland Redevelopment Agency 1,316 TOTAL GOVERNMENTAL 81,747
Internal Service Funds Oakland Redevelopment Agency 66 TOTAL 81,813$

CITY OF OAKLAND Notes to Basic Financial Statements, (continued)
Year Ended June 30, 2010
64
INTERFUND TRANSFERS:
TRANSFERS OUTGeneral
Fund
Other Governmental
FundsTotal
Governmental General Fund -$ 99,282$ 99,282$ Municipal Capital Improvement 3,220 525 3,745 Other Governmental Funds 1,698 - 1,698 Sewer Service Fund 1,463 - 1,463 Internal Service Funds 221 - 221 Total 6,602$ 99,807$ 106,409$
TRANSFERS IN
The $99.3 million transferred from the General Fund consists of transfers made to provide funding for the following:
• $11.4 million for the Kids’ First Children’s Program • $87.7 million for debt service payments • $0.2 million for City-owned parcels of land in the Wildfire Prevention Assessment
District The $3.2 million transferred from Municipal Capital Improvement to the General Fund consists of unspent insurance proceeds from the 1989 Loma Prieta earthquake damage to City Hall. The $1.7 million transfer from Other Governmental Funds to General Fund is to provide funding for the following:
• $0.4 million for City’s claims and liability payments • $0.9 million excess from 1985 Certificate of Participation debt payoff • $0.4 million for Motorola IPSS support and maintenance cost
The $1.5 million transfer from the Sewer Service Fund to the General Fund to provide funding for the following:
• $0.6 million for City-wide lease payments • $0.9 million for City’s claims and liability payments
The $0.2 million transfer from the Internal Service Fund to the General Fund is to provide funds for City’s claims and liability payments The $0.5 million transfer from Municipal Capital Improvement Fund to Other Governmental Funds is for deposit to the debt reserve and redemption accounts.

CITY OF OAKLAND Notes to Basic Financial Statements, (continued)
Year Ended June 30, 2010
65
INTERFUND LOANS: Certain interfund loans made from the General Fund to the Oakland Redevelopment Fund have been removed as they are not expected to be repaid within a reasonable period of time. The loans continue to be obligations of the Agency, and will be recognized as other financing sources in the General Fund upon receipt. The table below shows the total amount of interfund loan due as of June 30, 2010 (in thousands).
Balance June 30, 2009 Additions Deductions
Balance June 30, 2010
Oakland Center Project 13,853$ -$ 583$ 13,270$
On July 20, 2010, the City Council approved a resolution forgiving the remaining balance of interest and principal owed by the Oakland Redevelopment Agency under the 1966 Oak Center repayment contract. The total amount of the interfund loan due as of June 30, 2010 is $13,270,000.
(5) MEMORANDUMS OF UNDERSTANDING The City and the Port have Memorandums of Understanding (MOUs) relating to: general obligation bonds issued by the City for the benefit of the Port; various administrative, personnel, south airport police security, aircraft rescue and fire fighters, and financial services (Special Services); police, fire, public street cleaning and maintenance, and similar services (General Services) provided by the City to the Port; and Lake Merritt payments. Payments are made upon execution of appropriate agreements and periodic findings and authorizations from the Board. Special Services Payments for Special Services are treated as a cost of Port operations pursuant to the City Charter Section 717(3) Third Clause and have priority over certain other expenditures of Port revenues. Special Services totaled $6,566,000 and are included in “Operating Expenses.” At June 30, 2010, $9,284,000 was accrued as a current liability by the Port and as a receivable by the City. General Services and Lake Merritt Payments for General Services from the City are payable only to the extent the Port determines annually that surplus monies are available under the Charter for such purposes. As of June 30, 2010, the Port accrued approximately $3,617,000 of payments for General
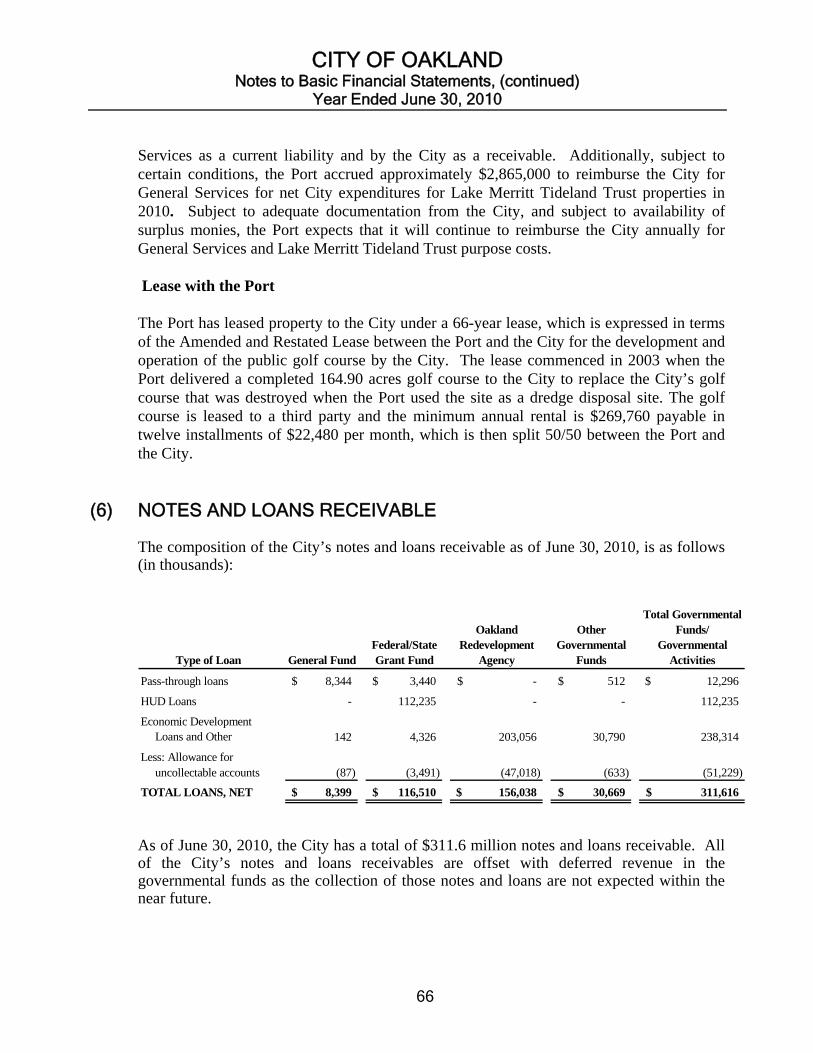
CITY OF OAKLAND Notes to Basic Financial Statements, (continued)
Year Ended June 30, 2010
66
Services as a current liability and by the City as a receivable. Additionally, subject to certain conditions, the Port accrued approximately $2,865,000 to reimburse the City for General Services for net City expenditures for Lake Merritt Tideland Trust properties in 2010. Subject to adequate documentation from the City, and subject to availability of surplus monies, the Port expects that it will continue to reimburse the City annually for General Services and Lake Merritt Tideland Trust purpose costs. Lease with the Port The Port has leased property to the City under a 66-year lease, which is expressed in terms of the Amended and Restated Lease between the Port and the City for the development and operation of the public golf course by the City. The lease commenced in 2003 when the Port delivered a completed 164.90 acres golf course to the City to replace the City’s golf course that was destroyed when the Port used the site as a dredge disposal site. The golf course is leased to a third party and the minimum annual rental is $269,760 payable in twelve installments of $22,480 per month, which is then split 50/50 between the Port and the City.
(6) NOTES AND LOANS RECEIVABLE The composition of the City’s notes and loans receivable as of June 30, 2010, is as follows (in thousands):
Type of Loan General FundFederal/State Grant Fund
Oakland Redevelopment
Agency
Other Governmental
Funds
Total Governmental Funds/
Governmental Activities
Pass-through loans 8,344$ 3,440$ -$ 512$ 12,296$
HUD Loans - 112,235 - - 112,235
Economic Development Loans and Other 142 4,326 203,056 30,790 238,314
Less: Allowance for uncollectable accounts (87) (3,491) (47,018) (633) (51,229)
TOTAL LOANS, NET 8,399$ 116,510$ 156,038$ 30,669$ 311,616$
As of June 30, 2010, the City has a total of $311.6 million notes and loans receivable. All of the City’s notes and loans receivables are offset with deferred revenue in the governmental funds as the collection of those notes and loans are not expected within the near future.
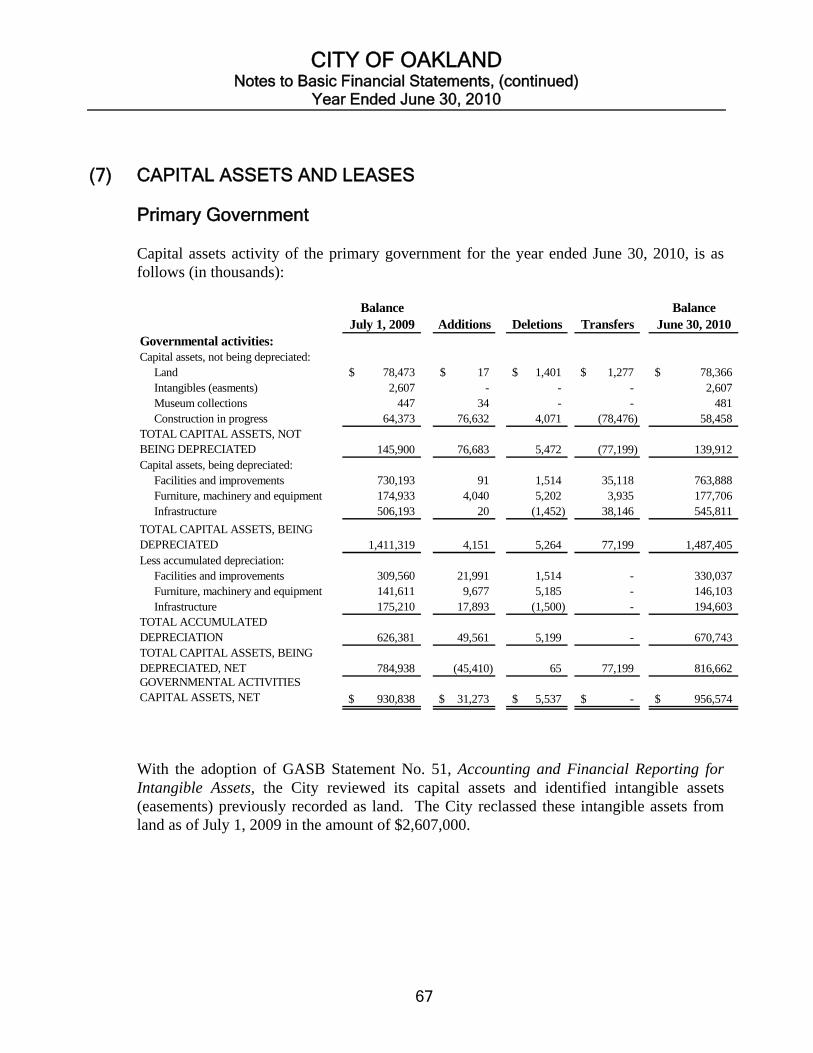
CITY OF OAKLAND Notes to Basic Financial Statements, (continued)
Year Ended June 30, 2010
67
(7) CAPITAL ASSETS AND LEASES Primary Government Capital assets activity of the primary government for the year ended June 30, 2010, is as follows (in thousands):
Balance July 1, 2009 Additions Deletions Transfers
Balance June 30, 2010
Governmental activities:Capital assets, not being depreciated: Land 78,473$ 17$ 1,401$ 1,277$ 78,366$ Intangibles (easments) 2,607 - - - 2,607 Museum collections 447 34 - - 481 Construction in progress 64,373 76,632 4,071 (78,476) 58,458 TOTAL CAPITAL ASSETS, NOT BEING DEPRECIATED 145,900 76,683 5,472 (77,199) 139,912 Capital assets, being depreciated: Facilities and improvements 730,193 91 1,514 35,118 763,888 Furniture, machinery and equipment 174,933 4,040 5,202 3,935 177,706 Infrastructure 506,193 20 (1,452) 38,146 545,811
TOTAL CAPITAL ASSETS, BEING DEPRECIATED 1,411,319 4,151 5,264 77,199 1,487,405 Less accumulated depreciation: Facilities and improvements 309,560 21,991 1,514 - 330,037 Furniture, machinery and equipment 141,611 9,677 5,185 - 146,103 Infrastructure 175,210 17,893 (1,500) - 194,603 TOTAL ACCUMULATED DEPRECIATION 626,381 49,561 5,199 - 670,743 TOTAL CAPITAL ASSETS, BEING DEPRECIATED, NET 784,938 (45,410) 65 77,199 816,662 GOVERNMENTAL ACTIVITIES CAPITAL ASSETS, NET 930,838$ 31,273$ 5,537$ -$ 956,574$
With the adoption of GASB Statement No. 51, Accounting and Financial Reporting for Intangible Assets, the City reviewed its capital assets and identified intangible assets (easements) previously recorded as land. The City reclassed these intangible assets from land as of July 1, 2009 in the amount of $2,607,000.
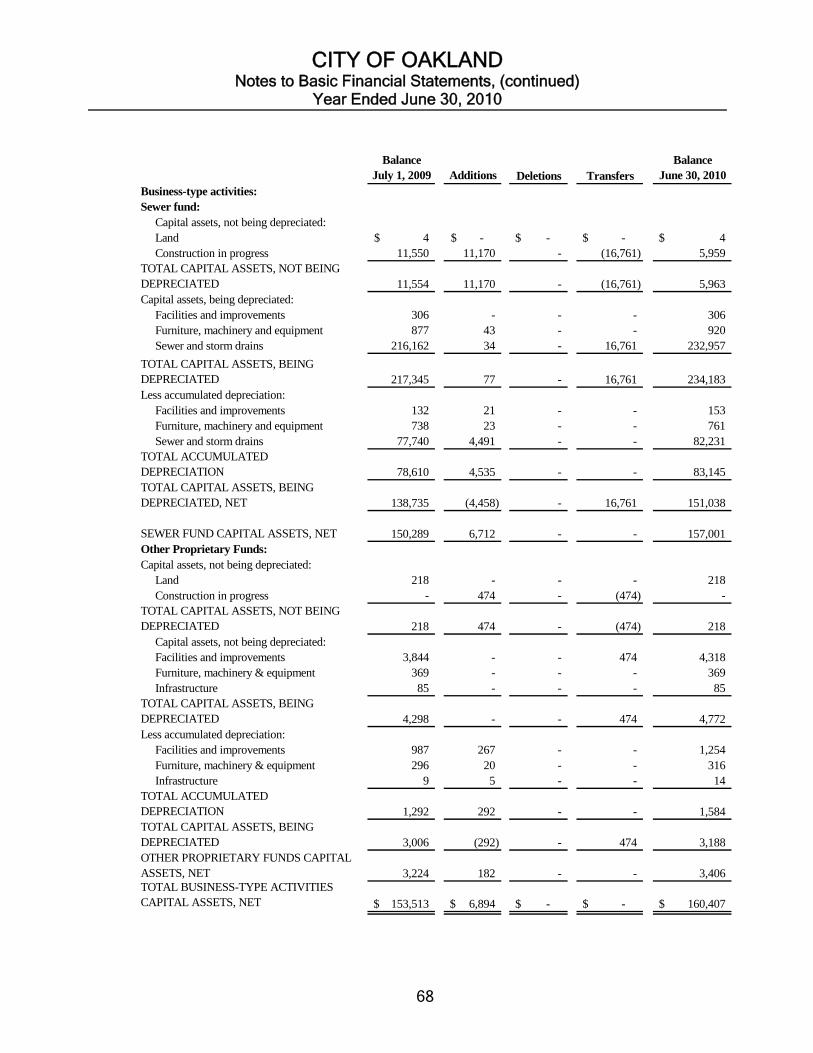
CITY OF OAKLAND Notes to Basic Financial Statements, (continued)
Year Ended June 30, 2010
68
Balance July 1, 2009 Additions Deletions Transfers
Balance June 30, 2010
Business-type activities:Sewer fund: Capital assets, not being depreciated: Land 4$ -$ -$ -$ 4$ Construction in progress 11,550 11,170 - (16,761) 5,959 TOTAL CAPITAL ASSETS, NOT BEING DEPRECIATED 11,554 11,170 - (16,761) 5,963 Capital assets, being depreciated: Facilities and improvements 306 - - - 306 Furniture, machinery and equipment 877 43 - - 920 Sewer and storm drains 216,162 34 - 16,761 232,957
TOTAL CAPITAL ASSETS, BEING DEPRECIATED 217,345 77 - 16,761 234,183 Less accumulated depreciation: Facilities and improvements 132 21 - - 153 Furniture, machinery and equipment 738 23 - - 761 Sewer and storm drains 77,740 4,491 - - 82,231 TOTAL ACCUMULATED DEPRECIATION 78,610 4,535 - - 83,145 TOTAL CAPITAL ASSETS, BEING DEPRECIATED, NET 138,735 (4,458) - 16,761 151,038
SEWER FUND CAPITAL ASSETS, NET 150,289 6,712 - - 157,001 Other Proprietary Funds:Capital assets, not being depreciated: Land 218 - - - 218 Construction in progress - 474 - (474) - TOTAL CAPITAL ASSETS, NOT BEING DEPRECIATED 218 474 - (474) 218 Capital assets, not being depreciated: Facilities and improvements 3,844 - - 474 4,318 Furniture, machinery & equipment 369 - - - 369 Infrastructure 85 - - - 85 TOTAL CAPITAL ASSETS, BEING DEPRECIATED 4,298 - - 474 4,772 Less accumulated depreciation: Facilities and improvements 987 267 - - 1,254 Furniture, machinery & equipment 296 20 - - 316 Infrastructure 9 5 - - 14 TOTAL ACCUMULATED DEPRECIATION 1,292 292 - - 1,584 TOTAL CAPITAL ASSETS, BEING DEPRECIATED 3,006 (292) - 474 3,188 OTHER PROPRIETARY FUNDS CAPITAL ASSETS, NET 3,224 182 - - 3,406 TOTAL BUSINESS-TYPE ACTIVITIES CAPITAL ASSETS, NET 153,513$ 6,894$ -$ -$ 160,407$
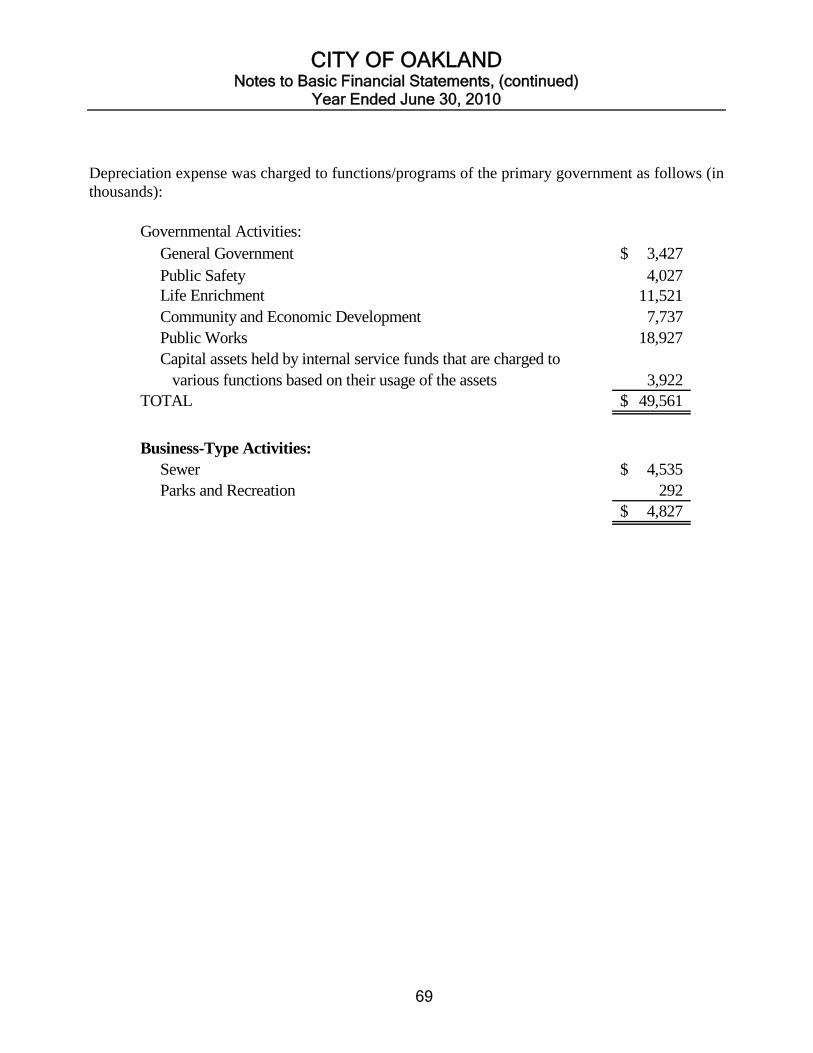
CITY OF OAKLAND Notes to Basic Financial Statements, (continued)
Year Ended June 30, 2010
69
Depreciation expense was charged to functions/programs of the primary government as follows (in thousands):
Governmental Activities: General Government 3,427$ Public Safety 4,027 Life Enrichment 11,521 Community and Economic Development 7,737 Public Works 18,927 Capital assets held by internal service funds that are charged to various functions based on their usage of the assets 3,922 TOTAL 49,561$
Business-Type Activities: Sewer 4,535$ Parks and Recreation 292
4,827$

CITY OF OAKLAND Notes to Basic Financial Statements, (continued)
Year Ended June 30, 2010
70
Discretely Presented Component Units Port of Oakland Capital assets activity for the Port for the year ended June 30, 2010, is as follows (in thousands):
Balance July 1, 2009 Additions
Adjustments & Retirements
Transfers of Completed
ConstructionBalance
June 30, 2010 Capital assets, not being depreciated: Land 499,284$ 20,898$ -$ -$ 520,182$ Intangibles (noise easements and air rights) 7,628 4,927 - - 12,555 Construction in progress 127,714 35,769 - (48,636) 114,847 TOTAL CAPITAL ASSETS, NOT BEING DEPRECIATED 634,626 61,594 - (48,636) 647,584 Capital assets, being depreciated: Building and improvements 809,563 - (465) 36,237 845,335 Container cranes 177,980 - (24,205) - 153,775 Systems and structures 1,535,415 4 460 9,563 1,545,442 Other equipment 73,079 455 (710) 2,836 75,660
TOTAL CAPITAL ASSETS, BEING DEPRECIATED 2,596,037 459 (24,920) 48,636 2,620,212 Less accumulated depreciation: Building and improvements 372,784 34,130 - - 406,914 Container cranes 84,567 6,401 18,001 - 72,967 Systems and structures 433,131 52,703 - - 485,834 Other equipment 36,106 5,576 764 - 40,918
TOTAL ACCUMULATED DEPRECIATION 926,588 98,810 18,765 - 1,006,633 TOTAL CAPITAL ASSETS, BEING DEPRECIATED, NET 1,669,449 98,351 (6,155) 48,636 1,613,579
CAPITAL ASSETS, NET 2,304,075$ (36,757)$ (6,155)$ -$ 2,261,163$
During fiscal year 2010, the Port’s Maritime Division disposed of three container cranes for a loss of $6,204,000. With the adoption of GASB Statement No. 51, Accounting and Financial Reporting for Intangible Assets, the Port reviewed its capital assets and identified intangible assets (easements and air rights) previously recorded as land. The Port reclassified these intangible assets from land as of July 1, 2008 in the amount of $7,628,000.
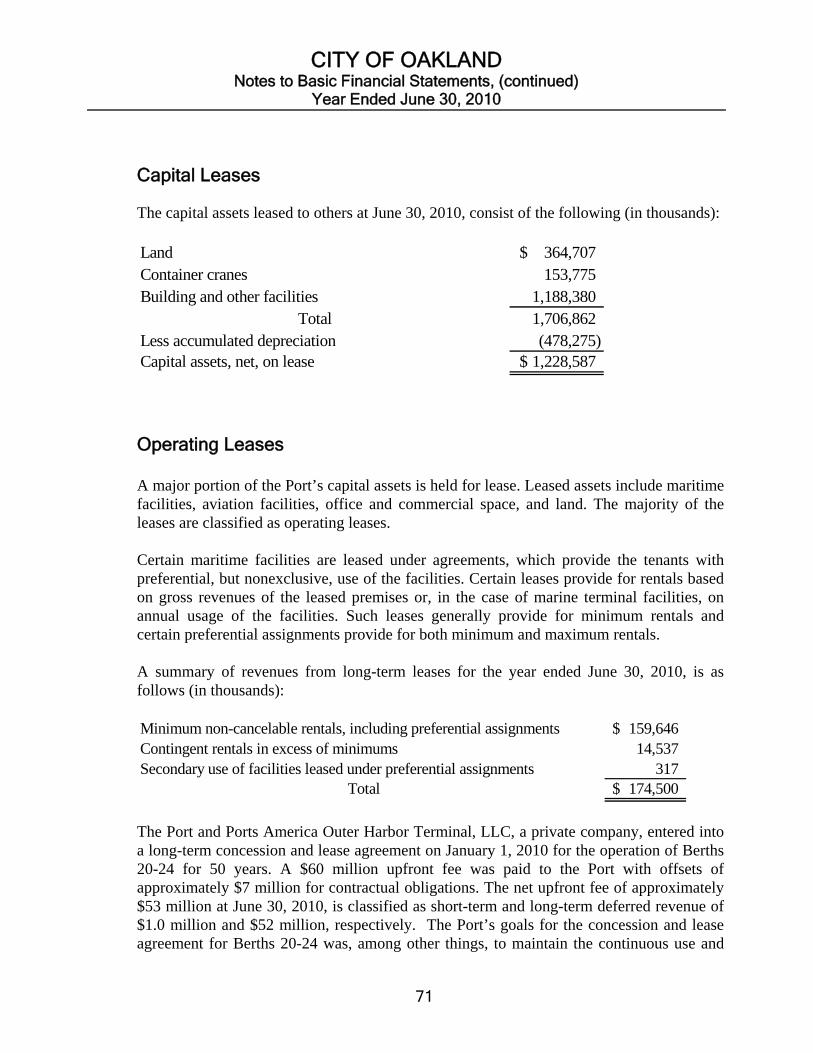
CITY OF OAKLAND Notes to Basic Financial Statements, (continued)
Year Ended June 30, 2010
71
Capital Leases
The capital assets leased to others at June 30, 2010, consist of the following (in thousands):
Land 364,707$ Container cranes 153,775 Building and other facilities 1,188,380
Total 1,706,862 Less accumulated depreciation (478,275) Capital assets, net, on lease 1,228,587$
Operating Leases
A major portion of the Port’s capital assets is held for lease. Leased assets include maritime facilities, aviation facilities, office and commercial space, and land. The majority of the leases are classified as operating leases. Certain maritime facilities are leased under agreements, which provide the tenants with preferential, but nonexclusive, use of the facilities. Certain leases provide for rentals based on gross revenues of the leased premises or, in the case of marine terminal facilities, on annual usage of the facilities. Such leases generally provide for minimum rentals and certain preferential assignments provide for both minimum and maximum rentals. A summary of revenues from long-term leases for the year ended June 30, 2010, is as follows (in thousands): Minimum non-cancelable rentals, including preferential assignments 159,646$ Contingent rentals in excess of minimums 14,537 Secondary use of facilities leased under preferential assignments 317
Total 174,500$
The Port and Ports America Outer Harbor Terminal, LLC, a private company, entered into a long-term concession and lease agreement on January 1, 2010 for the operation of Berths 20-24 for 50 years. A $60 million upfront fee was paid to the Port with offsets of approximately $7 million for contractual obligations. The net upfront fee of approximately $53 million at June 30, 2010, is classified as short-term and long-term deferred revenue of $1.0 million and $52 million, respectively. The Port’s goals for the concession and lease agreement for Berths 20-24 was, among other things, to maintain the continuous use and
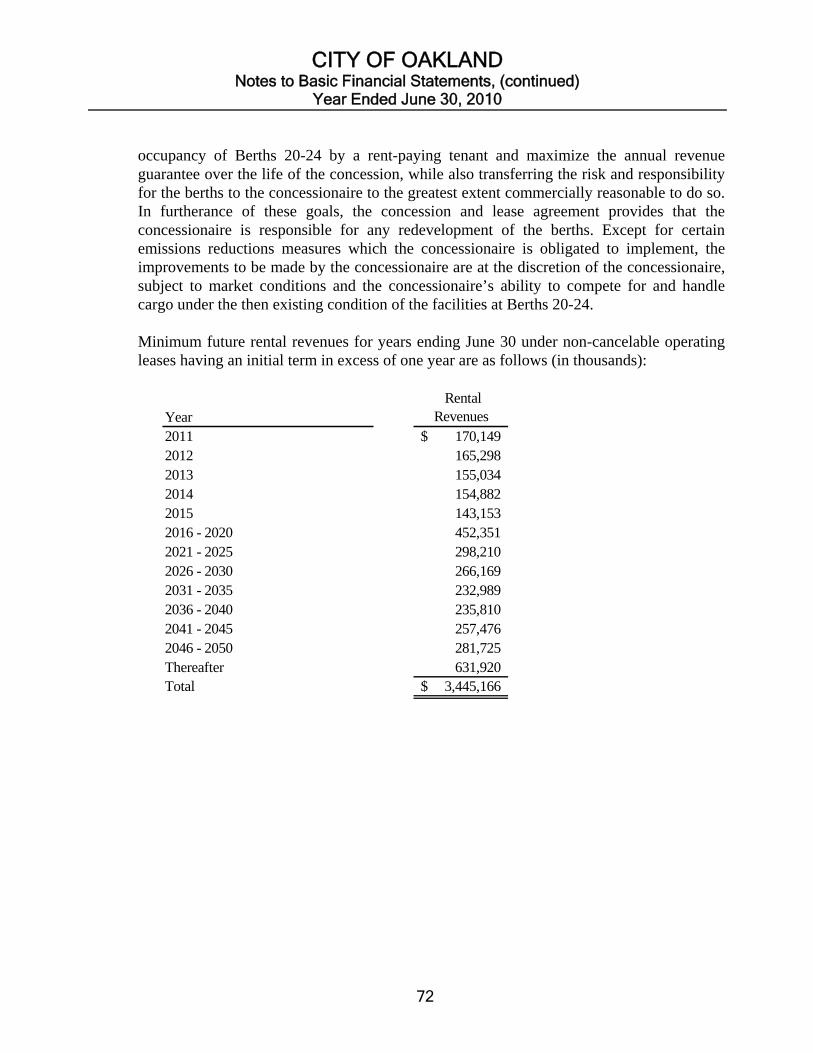
CITY OF OAKLAND Notes to Basic Financial Statements, (continued)
Year Ended June 30, 2010
72
occupancy of Berths 20-24 by a rent-paying tenant and maximize the annual revenue guarantee over the life of the concession, while also transferring the risk and responsibility for the berths to the concessionaire to the greatest extent commercially reasonable to do so. In furtherance of these goals, the concession and lease agreement provides that the concessionaire is responsible for any redevelopment of the berths. Except for certain emissions reductions measures which the concessionaire is obligated to implement, the improvements to be made by the concessionaire are at the discretion of the concessionaire, subject to market conditions and the concessionaire’s ability to compete for and handle cargo under the then existing condition of the facilities at Berths 20-24. Minimum future rental revenues for years ending June 30 under non-cancelable operating leases having an initial term in excess of one year are as follows (in thousands):
Year Rental
Revenues 2011 170,149$ 2012 165,298 2013 155,034 2014 154,882 2015 143,153 2016 - 2020 452,351 2021 - 2025 298,210 2026 - 2030 266,169 2031 - 2035 232,989 2036 - 2040 235,810 2041 - 2045 257,476 2046 - 2050 281,725 Thereafter 631,920 Total 3,445,166$
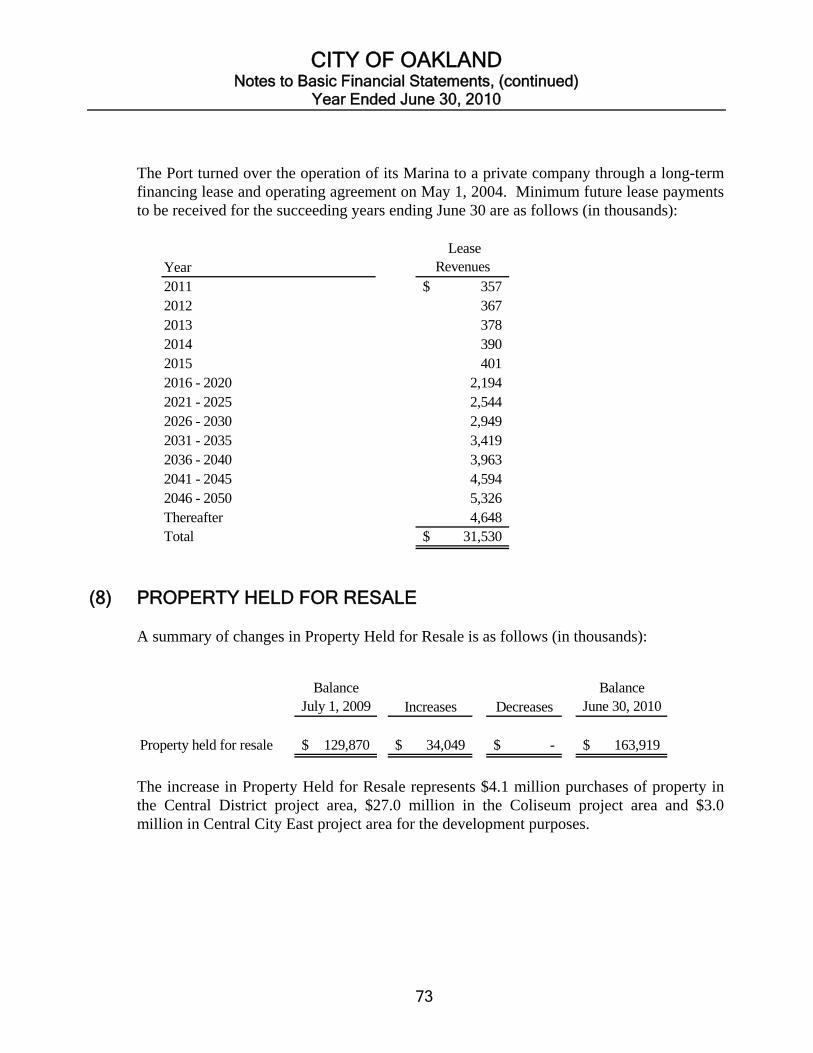
CITY OF OAKLAND Notes to Basic Financial Statements, (continued)
Year Ended June 30, 2010
73
The Port turned over the operation of its Marina to a private company through a long-term financing lease and operating agreement on May 1, 2004. Minimum future lease payments to be received for the succeeding years ending June 30 are as follows (in thousands):
Year Lease
Revenues 2011 357$ 2012 367 2013 378 2014 390 2015 401 2016 - 2020 2,194 2021 - 2025 2,544 2026 - 2030 2,949 2031 - 2035 3,419 2036 - 2040 3,963 2041 - 2045 4,594 2046 - 2050 5,326 Thereafter 4,648 Total 31,530$
(8) PROPERTY HELD FOR RESALE
A summary of changes in Property Held for Resale is as follows (in thousands):
Balance July 1, 2009 Increases Decreases
Balance June 30, 2010
Property held for resale 129,870$ 34,049$ -$ 163,919$
The increase in Property Held for Resale represents $4.1 million purchases of property in the Central District project area, $27.0 million in the Coliseum project area and $3.0 million in Central City East project area for the development purposes.
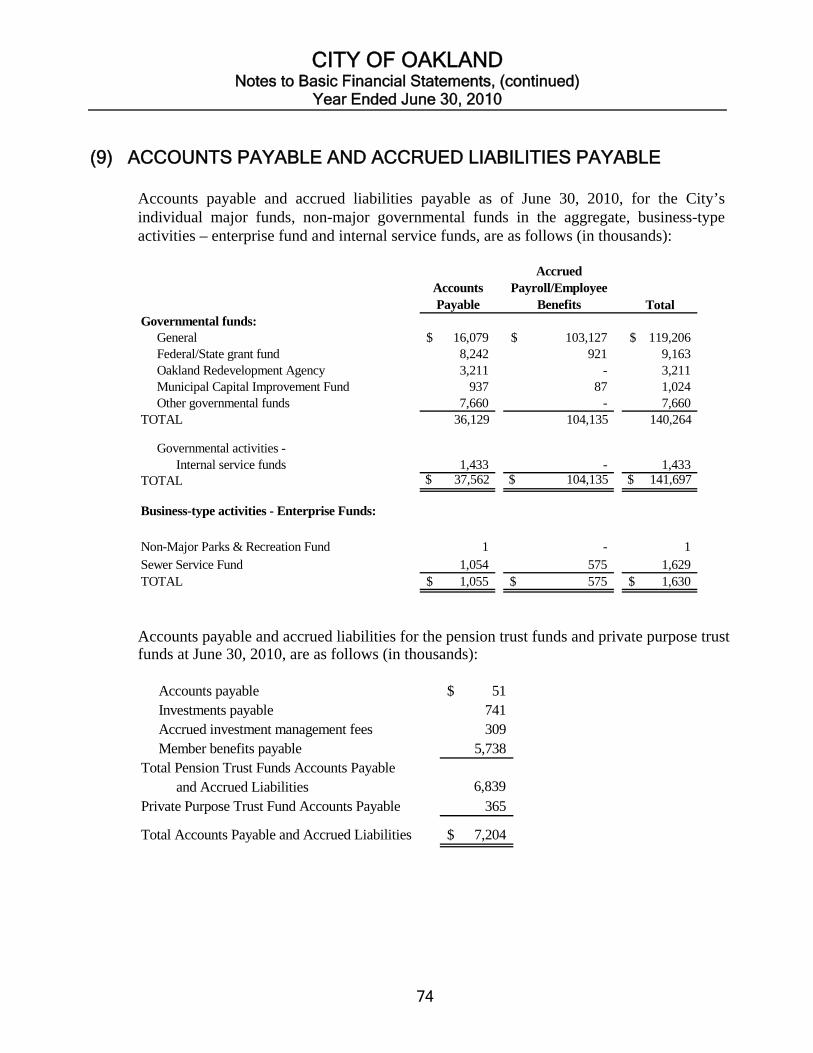
CITY OF OAKLAND Notes to Basic Financial Statements, (continued)
Year Ended June 30, 2010
74
(9) ACCOUNTS PAYABLE AND ACCRUED LIABILITIES PAYABLE
Accounts payable and accrued liabilities payable as of June 30, 2010, for the City’s individual major funds, non-major governmental funds in the aggregate, business-type activities – enterprise fund and internal service funds, are as follows (in thousands):
Accounts Payable
Accrued Payroll/Employee
Benefits TotalGovernmental funds: General 16,079$ 103,127$ 119,206$ Federal/State grant fund 8,242 921 9,163 Oakland Redevelopment Agency 3,211 - 3,211 Municipal Capital Improvement Fund 937 87 1,024 Other governmental funds 7,660 - 7,660 TOTAL 36,129 104,135 140,264
Governmental activities - Internal service funds 1,433 - 1,433 TOTAL $ 37,562 $ 104,135 $ 141,697
Business-type activities - Enterprise Funds:
Non-Major Parks & Recreation Fund 1 - 1 Sewer Service Fund 1,054 575 1,629 TOTAL 1,055$ 575$ 1,630$
Accounts payable and accrued liabilities for the pension trust funds and private purpose trust funds at June 30, 2010, are as follows (in thousands): Accounts payable 51$ Investments payable 741 Accrued investment management fees 309 Member benefits payable 5,738 Total Pension Trust Funds Accounts Payable and Accrued Liabilities 6,839 Private Purpose Trust Fund Accounts Payable 365
Total Accounts Payable and Accrued Liabilities 7,204$
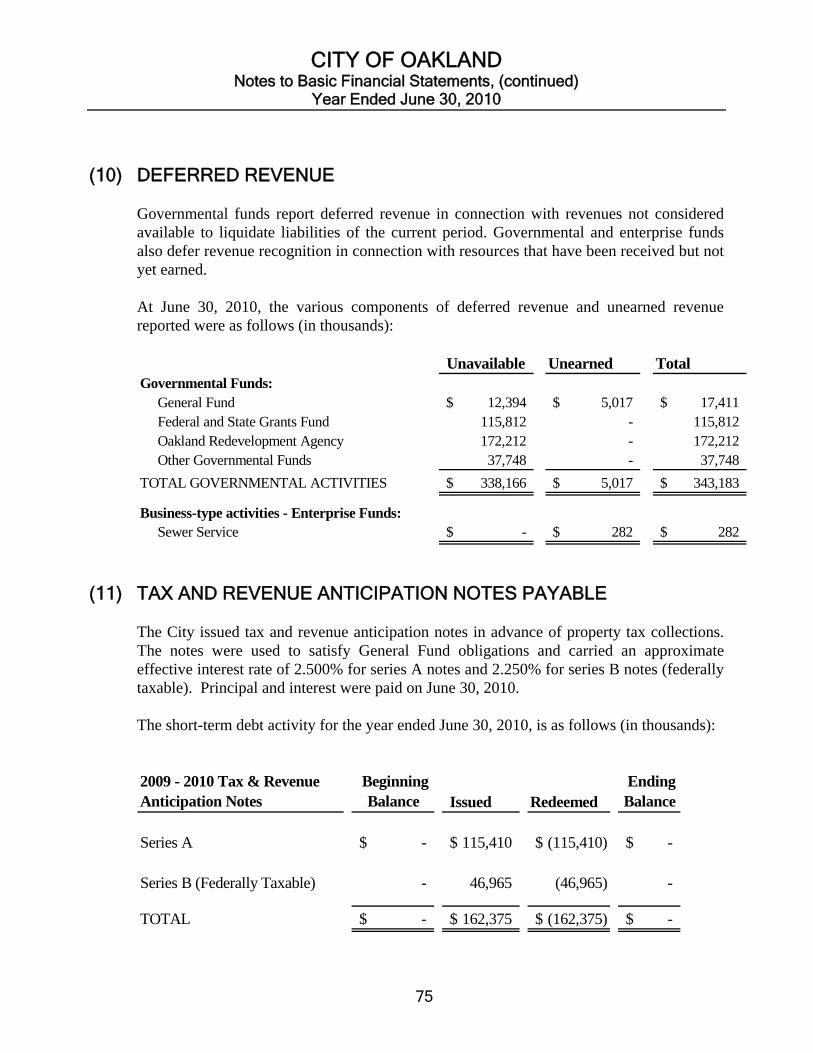
CITY OF OAKLAND Notes to Basic Financial Statements, (continued)
Year Ended June 30, 2010
75
(10) DEFERRED REVENUE Governmental funds report deferred revenue in connection with revenues not considered available to liquidate liabilities of the current period. Governmental and enterprise funds also defer revenue recognition in connection with resources that have been received but not yet earned. At June 30, 2010, the various components of deferred revenue and unearned revenue reported were as follows (in thousands):
Unavailable Unearned TotalGovernmental Funds: General Fund 12,394$ 5,017$ 17,411$ Federal and State Grants Fund 115,812 - 115,812 Oakland Redevelopment Agency 172,212 - 172,212 Other Governmental Funds 37,748 - 37,748
TOTAL GOVERNMENTAL ACTIVITIES 338,166$ 5,017$ 343,183$
Business-type activities - Enterprise Funds: Sewer Service -$ 282$ 282$
(11) TAX AND REVENUE ANTICIPATION NOTES PAYABLE
The City issued tax and revenue anticipation notes in advance of property tax collections. The notes were used to satisfy General Fund obligations and carried an approximate effective interest rate of 2.500% for series A notes and 2.250% for series B notes (federally taxable). Principal and interest were paid on June 30, 2010. The short-term debt activity for the year ended June 30, 2010, is as follows (in thousands): 2009 - 2010 Tax & Revenue Anticipation Notes
Beginning Balance Issued Redeemed
Ending Balance
Series A -$ 115,410$ (115,410)$ -$
Series B (Federally Taxable) - 46,965 (46,965) -
TOTAL -$ 162,375$ (162,375)$ -$

CITY OF OAKLAND Notes to Basic Financial Statements, (continued)
Year Ended June 30, 2010
76
(12) LONG-TERM OBLIGATIONS
Long-term Obligations The following is a summary of long-term obligations as of June 30, 2010 (in thousands):
Type of ObligationFinal Maturity
YearRemaining Interest
Rates AmountGeneral obligation bonds (A) 2039 2.50 - 6.25% 366,248$ Tax allocation, Housing and Other Bonds (B) 2037 2.50 - 8.50% 488,900 Certificate of participation (C) 2012 4.00 - 5.0% 7,210 Lease revenue bonds (C) 2027 3.0 - 5.50% 270,670 Pension obligation bonds (D) 2023 6.09 - 7.31% 210,595 Accreted interest (C) and (D) 172,971 City guaranteed special assessment district bonds (D) 2039 2.0 - 6.70% 8,298 Notes payable (C) and (E) 2016 1.70 - 8.27% 14,295 Capital leases (C) and (E) 2022 3.54 - 5.52% 18,483 Accrued vacation and sick leave (C) 39,460 Self-insurance liability - workers compensation (C) 75,695 Self-insurance liability - general liability (C) 40,067 Estimated environmental cost (B) and (C) 6,634 Pledge obligation for Coliseum Authority debt (C) 76,000 Net OPEB obligation (C) 126,237 Interest rate swap agreement (C) 19,083
GOVERNMENTAL ACTIVITIES TOTAL LONG-TERM OBLIGATIONS 1,940,846
DEFERRED AMOUNTS: Bond issuance premiums 26,846 Bond refunding loss (26,396) GOVERNMENTAL ACTIVITIES TOTAL LONG-TERM OBLIGATIONS, NET 1,941,296$
Governmental Activities
Debt service payments are made from the following sources: (A) Property tax recorded in the debt service funds
(B) Property tax allocated to the Oakland Redevelopment Agency based on increased assessed
valuations in the project area
(C) Revenues recorded in the general fund
(D) Property tax voter approved debt
(E) Revenues recorded in the special revenue funds
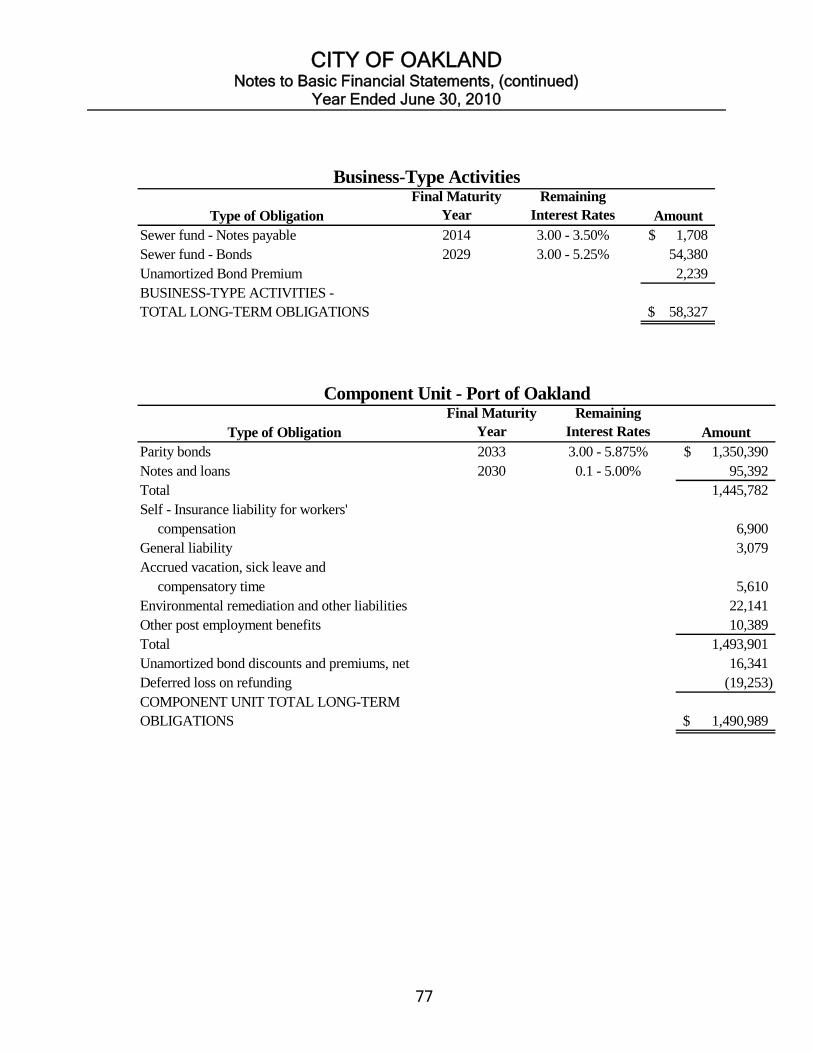
CITY OF OAKLAND Notes to Basic Financial Statements, (continued)
Year Ended June 30, 2010
77
Type of ObligationFinal Maturity
YearRemaining
Interest Rates AmountSewer fund - Notes payable 2014 3.00 - 3.50% 1,708$ Sewer fund - Bonds 2029 3.00 - 5.25% 54,380 Unamortized Bond Premium 2,239 BUSINESS-TYPE ACTIVITIES - TOTAL LONG-TERM OBLIGATIONS 58,327$
Business-Type Activities
Type of ObligationFinal Maturity
YearRemaining
Interest Rates AmountParity bonds 2033 3.00 - 5.875% 1,350,390$ Notes and loans 2030 0.1 - 5.00% 95,392 Total 1,445,782 Self - Insurance liability for workers' compensation 6,900 General liability 3,079 Accrued vacation, sick leave and compensatory time 5,610 Environmental remediation and other liabilities 22,141 Other post employment benefits 10,389 Total 1,493,901 Unamortized bond discounts and premiums, net 16,341 Deferred loss on refunding (19,253) COMPONENT UNIT TOTAL LONG-TERMOBLIGATIONS 1,490,989$
Component Unit - Port of Oakland
CITY OF OAKLAND Notes to Basic Financial Statements, (continued)
Year Ended June 30, 2010
78
Revenues Pledged for the Repayment of Debt Service Tax Allocation Bonds The Tax Allocation Bonds (TAB), which are comprised of Series 1992, Series 2003, Series 2005, Series 2006T, Series 2009T, Series 2006A TE/T, Series 2006B TE/T, and Series 2006C TE/T, are all secured primarily by a pledge of tax increment revenues, consisting of a portion of all taxes levied upon all taxable properties within each of the redevelopment project areas, and are equally and ratably secured on a parity with each TAB series. The total projected tax increment revenue through the period of the bonds is approximately $3,100,961,349. These revenues have been pledged until the year 2037, the final maturity date of the bonds. Debt service payments for these TABs is payable semi-annually on March 1 and September 1. The total principal and interest remaining on these TABs is $657,153,936 which is 21.2 percent of the total projected tax increment revenues. The pledged tax increment revenue recognized during the year ended June 30, 2010 was $84,974,716 of which $36,725,380 was used to pay debt service. Housing Bonds
The Housing Set-Aside TAB, which comprised of Series 2000T, Series 2006A, and Series 2006A-T are equally and ratably secured by the pledge and lien of the 20% tax increment revenue set-aside and voluntary 5% for the low and moderate income housing fund. The total projected 20% set-aside and 5% voluntary revenue through the period of the bonds is approximately $812,044,115 and $203,011,029, respectively. These revenues have been pledged until the year 2037, the final maturity date of the bonds. Debt service payment for these TABs is payable semi-annually on February 1 and August 1. The total principal and interest remaining on these Housing TABs is $147,965,903, which is 14.6 percent of the total projected set-aside and voluntary tax increment revenues. The pledged 20% set-aside and 5% voluntary tax increment revenue recognized during the year ended June 30, 2010was $28,324,000, of which $7,506,111 was used to pay debt service. Debt Compliance There are a number of limitations and restrictions contained in the various bond indentures held by the City and Agency. Management believes that the City and Agency are in compliance. Legal Debt Limit and Legal Debt Margin As of June 30, 2010, the City’s debt limit (3.75% of valuation subject to taxation) was $1,129,612,382. The total amount of debt applicable to the debt limit was $366,247,851. The resulting legal debt margin was $763,364,531.
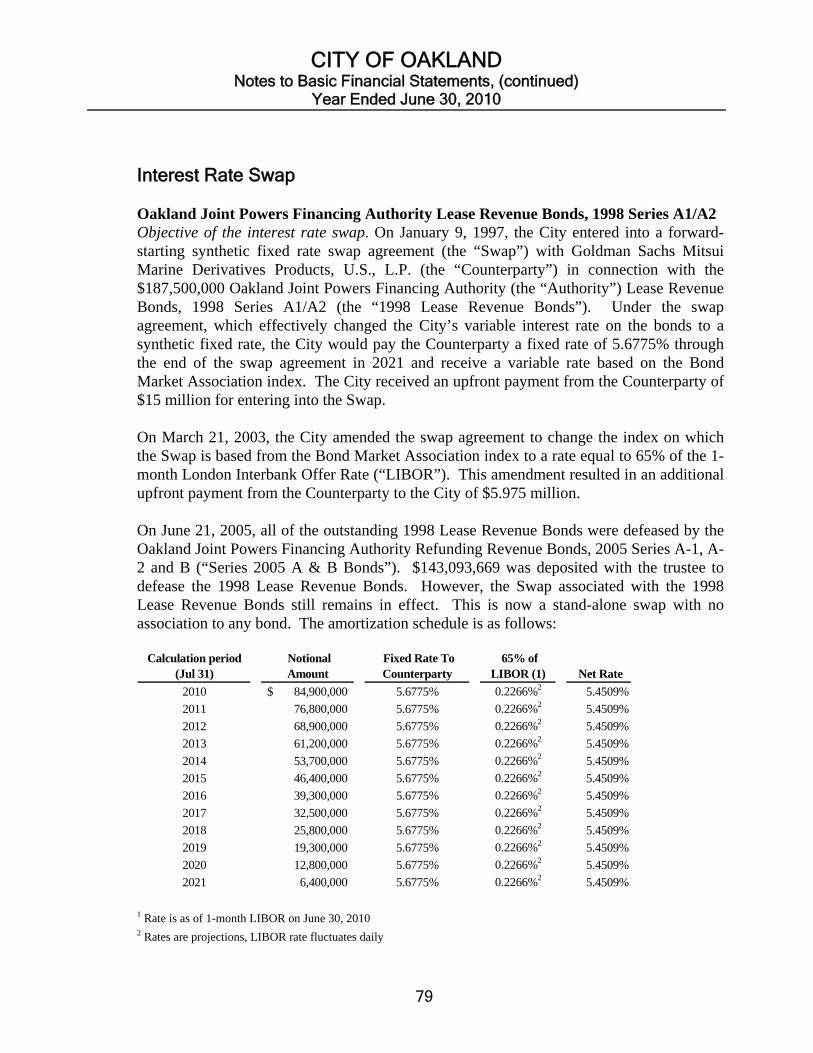
CITY OF OAKLAND Notes to Basic Financial Statements, (continued)
Year Ended June 30, 2010
79
Interest Rate Swap Oakland Joint Powers Financing Authority Lease Revenue Bonds, 1998 Series A1/A2 Objective of the interest rate swap. On January 9, 1997, the City entered into a forward-starting synthetic fixed rate swap agreement (the “Swap”) with Goldman Sachs Mitsui Marine Derivatives Products, U.S., L.P. (the “Counterparty”) in connection with the $187,500,000 Oakland Joint Powers Financing Authority (the “Authority”) Lease Revenue Bonds, 1998 Series A1/A2 (the “1998 Lease Revenue Bonds”). Under the swap agreement, which effectively changed the City’s variable interest rate on the bonds to a synthetic fixed rate, the City would pay the Counterparty a fixed rate of 5.6775% through the end of the swap agreement in 2021 and receive a variable rate based on the Bond Market Association index. The City received an upfront payment from the Counterparty of $15 million for entering into the Swap. On March 21, 2003, the City amended the swap agreement to change the index on which the Swap is based from the Bond Market Association index to a rate equal to 65% of the 1-month London Interbank Offer Rate (“LIBOR”). This amendment resulted in an additional upfront payment from the Counterparty to the City of $5.975 million. On June 21, 2005, all of the outstanding 1998 Lease Revenue Bonds were defeased by the Oakland Joint Powers Financing Authority Refunding Revenue Bonds, 2005 Series A-1, A-2 and B (“Series 2005 A & B Bonds”). $143,093,669 was deposited with the trustee to defease the 1998 Lease Revenue Bonds. However, the Swap associated with the 1998 Lease Revenue Bonds still remains in effect. This is now a stand-alone swap with no association to any bond. The amortization schedule is as follows:
Calculation period (Jul 31)
Notional Amount
Fixed Rate To Counterparty
65% of LIBOR (1) Net Rate
2010 84,900,000$ 5.6775% 0.2266%2 5.4509%
2011 76,800,000 5.6775% 0.2266%2 5.4509%
2012 68,900,000 5.6775% 0.2266%2 5.4509%
2013 61,200,000 5.6775% 0.2266%2 5.4509%
2014 53,700,000 5.6775% 0.2266%2 5.4509%
2015 46,400,000 5.6775% 0.2266%2 5.4509%
2016 39,300,000 5.6775% 0.2266%2 5.4509%
2017 32,500,000 5.6775% 0.2266%2 5.4509%
2018 25,800,000 5.6775% 0.2266%2 5.4509%
2019 19,300,000 5.6775% 0.2266%2 5.4509%
2020 12,800,000 5.6775% 0.2266%2 5.4509%
2021 6,400,000 5.6775% 0.2266%2 5.4509%
1 Rate is as of 1-month LIBOR on June 30, 2010
2 Rates are projections, LIBOR rate fluctuates daily
CITY OF OAKLAND Notes to Basic Financial Statements, (continued)
Year Ended June 30, 2010
80
Terms. The swap agreement terminates on July 31, 2021, and has a notional amount as of June 30, 2010 of $84,900,000. The notional amount of the swap declines through 2021. Under the Swap, the City pays the counterparty a fixed payment of 5.6775% and receives a variable payment computed at 65% of LIBOR rate (total rate not to exceed 12%). The City’s payments to the counterparty under the Swap agreement are insured by the third party bond insurer. Fair Value. Because interest rates have declined since the execution of the Swap, the Swap had a negative fair value of $19,082,908 as of June 30, 2010. The fair value was estimated using the zero-coupon method. This method calculates the future net settlement payments required by the Swap, assuming that the current forward rates implied by the yield curve correctly anticipate future spot interest rates. These payments are then discounted using the spot rates implied by the current yield curve for hypothetical zero-coupon bonds due on the date of each future net settlement on the Swap. Credit Risk. The issuer and the counterparty take a credit risk to each other over the life of the swap agreement. This is the risk that either the issuer or the counterparty will fail to meet its contractual obligations under the swap agreement. The Counterparty was rated Aa1 by Moody’s Investors Service, and AAA by Standard and Poor’s as of June 30, 2010. To mitigate the potential for credit risk, if the counterparty’s credit quality falls below “A3” by Moody’s Investors Service or “A-” by Standard and Poor’s, the swap agreement provides the counterparty, the City, the bond insurer for the Bonds and a third party collateral agent to execute a collateral agreement within 30 days of such a downgrade. Termination Risk. An interest rate swap has some degree of termination risk. Linked to counterparty risk, a termination of the swap will result in a payment being made or received by the City depending on the then prevailing interest rate environment. The City may terminate the Swap if the counterparty fails to perform under the terms of the contract. The City also may terminate the Swap if the counterparty fails to execute a collateral agreement satisfactory to the City and the bond insurer within 30 days of the counterparty’s ratings falling below “A3” by Moody’s Investors Service or “A-“ by Standard and Poor’s. The counterparty may terminate the Swap if the City fails to perform under the terms of the contract. The counterparty also may terminate the Swap if the City falls below “Baa3” by Moody’s Investors Service or “BBB-” by Standard and Poor’s. If at the time of termination the Swap has a negative fair value, the Authority would be liable to the counterparty for a payment equal to the Swap’s fair value.
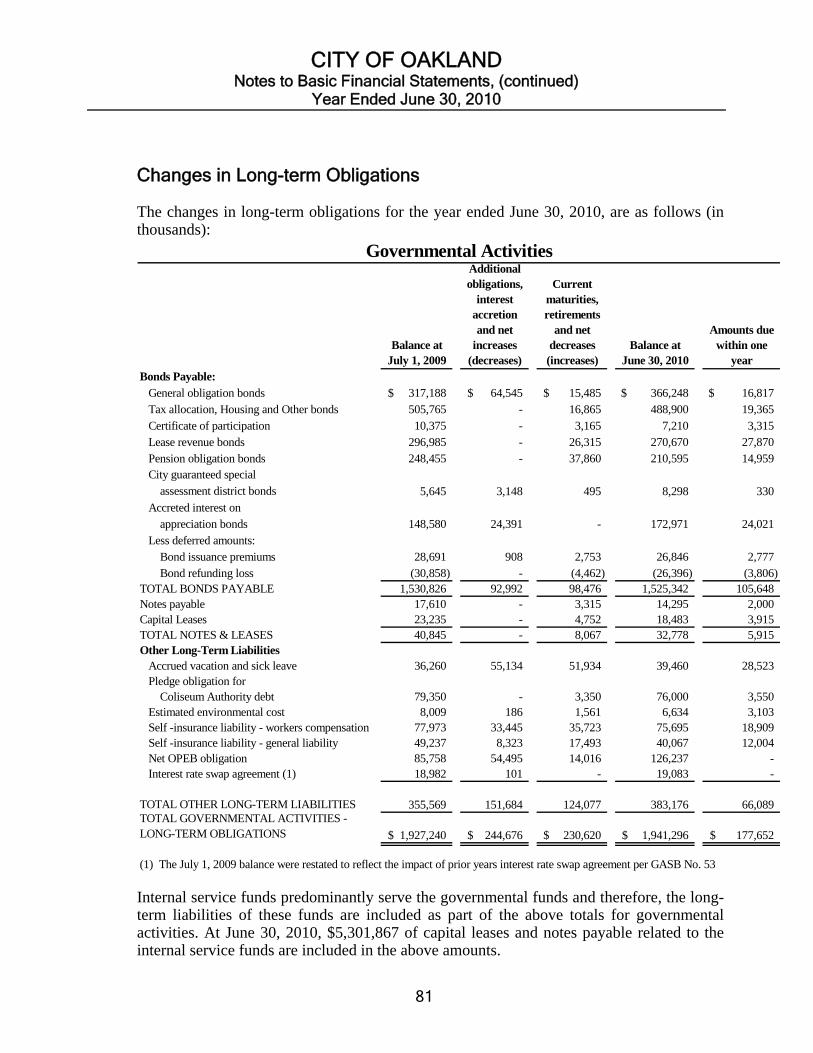
CITY OF OAKLAND Notes to Basic Financial Statements, (continued)
Year Ended June 30, 2010
81
Changes in Long-term Obligations The changes in long-term obligations for the year ended June 30, 2010, are as follows (in thousands):
Balance at July 1, 2009
Additional obligations,
interest accretion and net
increases (decreases)
Current maturities, retirements
and net decreases (increases)
Balance at June 30, 2010
Amounts due within one
yearBonds Payable: General obligation bonds 317,188$ 64,545$ 15,485$ 366,248$ 16,817$ Tax allocation, Housing and Other bonds 505,765 - 16,865 488,900 19,365 Certificate of participation 10,375 - 3,165 7,210 3,315 Lease revenue bonds 296,985 - 26,315 270,670 27,870 Pension obligation bonds 248,455 - 37,860 210,595 14,959 City guaranteed special assessment district bonds 5,645 3,148 495 8,298 330 Accreted interest on appreciation bonds 148,580 24,391 - 172,971 24,021 Less deferred amounts: Bond issuance premiums 28,691 908 2,753 26,846 2,777 Bond refunding loss (30,858) - (4,462) (26,396) (3,806) TOTAL BONDS PAYABLE 1,530,826 92,992 98,476 1,525,342 105,648 Notes payable 17,610 - 3,315 14,295 2,000 Capital Leases 23,235 - 4,752 18,483 3,915 TOTAL NOTES & LEASES 40,845 - 8,067 32,778 5,915 Other Long-Term Liabilities Accrued vacation and sick leave 36,260 55,134 51,934 39,460 28,523 Pledge obligation for Coliseum Authority debt 79,350 - 3,350 76,000 3,550 Estimated environmental cost 8,009 186 1,561 6,634 3,103 Self -insurance liability - workers compensation 77,973 33,445 35,723 75,695 18,909 Self -insurance liability - general liability 49,237 8,323 17,493 40,067 12,004 Net OPEB obligation 85,758 54,495 14,016 126,237 - Interest rate swap agreement (1) 18,982 101 - 19,083 -
TOTAL OTHER LONG-TERM LIABILITIES 355,569 151,684 124,077 383,176 66,089 TOTAL GOVERNMENTAL ACTIVITIES - LONG-TERM OBLIGATIONS 1,927,240$ 244,676$ 230,620$ 1,941,296$ 177,652$
(1) The July 1, 2009 balance were restated to reflect the impact of prior years interest rate swap agreement per GASB No. 53
Governmental Activities
Internal service funds predominantly serve the governmental funds and therefore, the long-term liabilities of these funds are included as part of the above totals for governmental activities. At June 30, 2010, $5,301,867 of capital leases and notes payable related to the internal service funds are included in the above amounts.
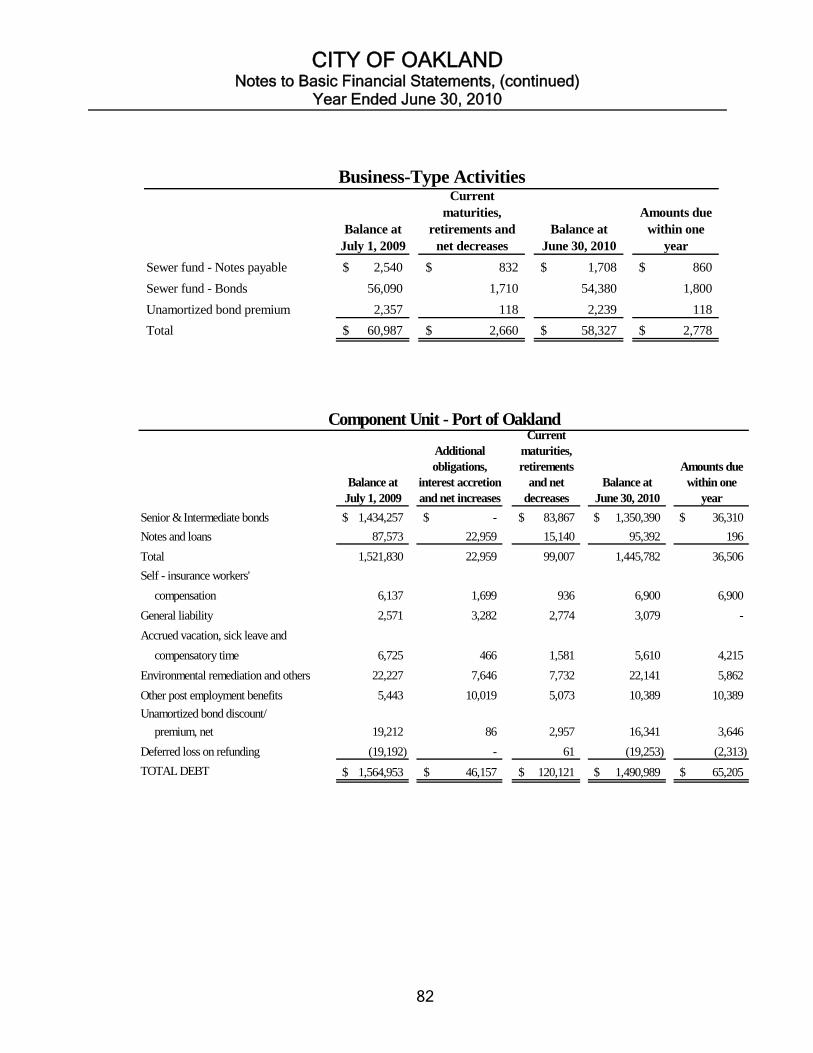
CITY OF OAKLAND Notes to Basic Financial Statements, (continued)
Year Ended June 30, 2010
82
Balance at July 1, 2009
Current maturities,
retirements and net decreases
Balance at June 30, 2010
Amounts due within one
year
Sewer fund - Notes payable 2,540$ 832$ 1,708$ 860$
Sewer fund - Bonds 56,090 1,710 54,380 1,800
Unamortized bond premium 2,357 118 2,239 118
Total 60,987$ 2,660$ 58,327$ 2,778$
Business-Type Activities
Balance at July 1, 2009
Additional obligations,
interest accretion and net increases
Current maturities, retirements
and net decreases
Balance at June 30, 2010
Amounts due within one
year
Senior & Intermediate bonds 1,434,257$ -$ 83,867$ 1,350,390$ 36,310$
Notes and loans 87,573 22,959 15,140 95,392 196
Total 1,521,830 22,959 99,007 1,445,782 36,506
Self - insurance workers'
compensation 6,137 1,699 936 6,900 6,900
General liability 2,571 3,282 2,774 3,079 -
Accrued vacation, sick leave and
compensatory time 6,725 466 1,581 5,610 4,215
Environmental remediation and others 22,227 7,646 7,732 22,141 5,862
Other post employment benefits 5,443 10,019 5,073 10,389 10,389
Unamortized bond discount/
premium, net 19,212 86 2,957 16,341 3,646
Deferred loss on refunding (19,192) - 61 (19,253) (2,313)
TOTAL DEBT 1,564,953$ 46,157$ 120,121$ 1,490,989$ 65,205$
Component Unit - Port of Oakland
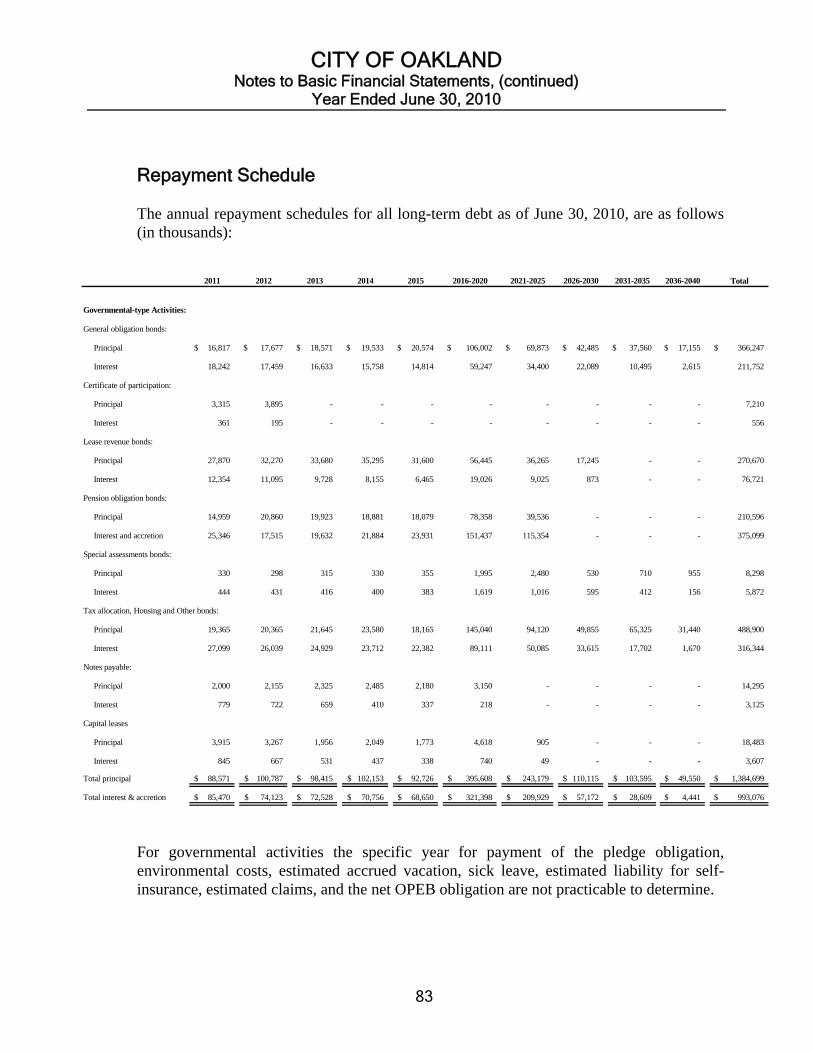
CITY OF OAKLAND Notes to Basic Financial Statements, (continued)
Year Ended June 30, 2010
83
Repayment Schedule The annual repayment schedules for all long-term debt as of June 30, 2010, are as follows (in thousands):
2011 2012 2013 2014 2015 2016-2020 2021-2025 2026-2030 2031-2035 2036-2040 Total
Governmental-type Activities:
General obligation bonds:
Principal 16,817$ 17,677$ 18,571$ 19,533$ 20,574$ 106,002$ 69,873$ 42,485$ 37,560$ 17,155$ 366,247$
Interest 18,242 17,459 16,633 15,758 14,814 59,247 34,400 22,089 10,495 2,615 211,752
Certificate of participation:
Principal 3,315 3,895 - - - - - - - - 7,210
Interest 361 195 - - - - - - - - 556
Lease revenue bonds:
Principal 27,870 32,270 33,680 35,295 31,600 56,445 36,265 17,245 - - 270,670
Interest 12,354 11,095 9,728 8,155 6,465 19,026 9,025 873 - - 76,721
Pension obligation bonds:
Principal 14,959 20,860 19,923 18,881 18,079 78,358 39,536 - - - 210,596
Interest and accretion 25,346 17,515 19,632 21,884 23,931 151,437 115,354 - - - 375,099
Special assessments bonds:
Principal 330 298 315 330 355 1,995 2,480 530 710 955 8,298
Interest 444 431 416 400 383 1,619 1,016 595 412 156 5,872
Tax allocation, Housing and Other bonds:
Principal 19,365 20,365 21,645 23,580 18,165 145,040 94,120 49,855 65,325 31,440 488,900
Interest 27,099 26,039 24,929 23,712 22,382 89,111 50,085 33,615 17,702 1,670 316,344
Notes payable:
Principal 2,000 2,155 2,325 2,485 2,180 3,150 - - - - 14,295
Interest 779 722 659 410 337 218 - - - - 3,125
Capital leases
Principal 3,915 3,267 1,956 2,049 1,773 4,618 905 - - - 18,483
Interest 845 667 531 437 338 740 49 - - - 3,607
Total principal 88,571$ 100,787$ 98,415$ 102,153$ 92,726$ 395,608$ 243,179$ 110,115$ 103,595$ 49,550$ 1,384,699$
Total interest & accretion 85,470$ 74,123$ 72,528$ 70,756$ 68,650$ 321,398$ 209,929$ 57,172$ 28,609$ 4,441$ 993,076$
For governmental activities the specific year for payment of the pledge obligation, environmental costs, estimated accrued vacation, sick leave, estimated liability for self-insurance, estimated claims, and the net OPEB obligation are not practicable to determine.
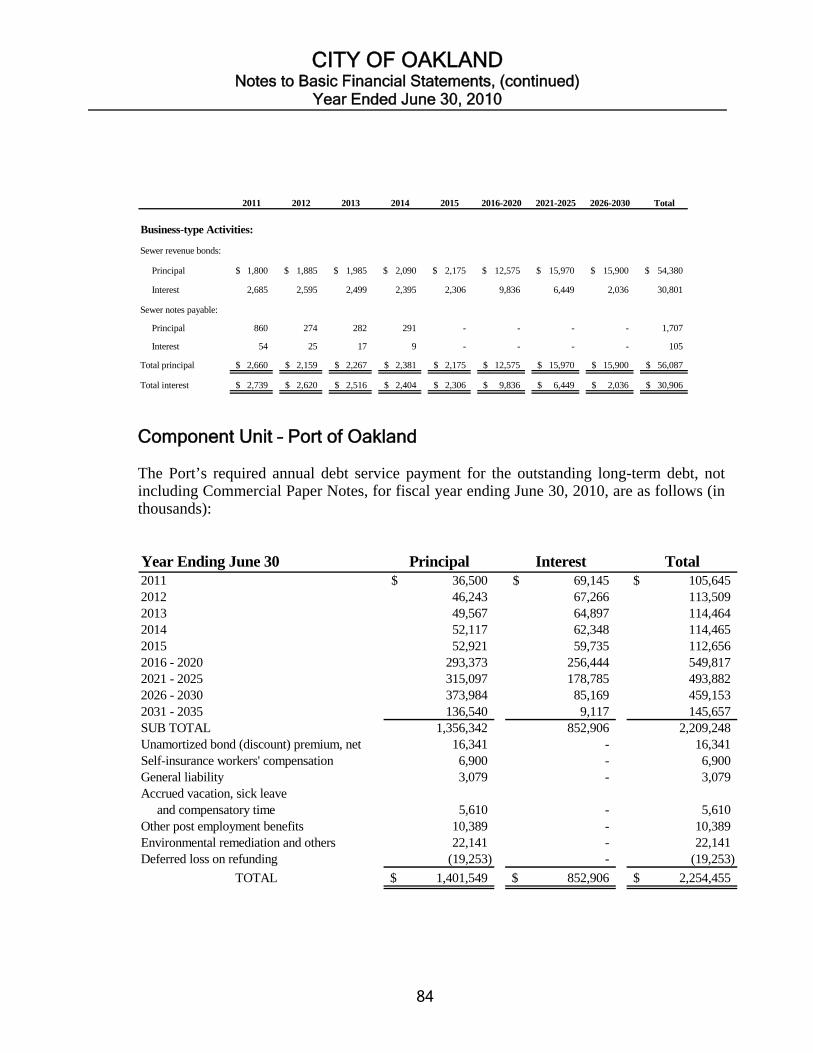
CITY OF OAKLAND Notes to Basic Financial Statements, (continued)
Year Ended June 30, 2010
84
2011 2012 2013 2014 2015 2016-2020 2021-2025 2026-2030 Total
Business-type Activities:
Sewer revenue bonds:
Principal 1,800$ 1,885$ 1,985$ 2,090$ 2,175$ 12,575$ 15,970$ 15,900$ 54,380$
Interest 2,685 2,595 2,499 2,395 2,306 9,836 6,449 2,036 30,801
Sewer notes payable:
Principal 860 274 282 291 - - - - 1,707
Interest 54 25 17 9 - - - - 105
Total principal 2,660$ 2,159$ 2,267$ 2,381$ 2,175$ 12,575$ 15,970$ 15,900$ 56,087$
Total interest 2,739$ 2,620$ 2,516$ 2,404$ 2,306$ 9,836$ 6,449$ 2,036$ 30,906$
Component Unit – Port of Oakland The Port’s required annual debt service payment for the outstanding long-term debt, not including Commercial Paper Notes, for fiscal year ending June 30, 2010, are as follows (in thousands):
Year Ending June 30 Principal Interest Total2011 36,500$ 69,145$ 105,645$ 2012 46,243 67,266 113,509 2013 49,567 64,897 114,464 2014 52,117 62,348 114,465 2015 52,921 59,735 112,656 2016 - 2020 293,373 256,444 549,817 2021 - 2025 315,097 178,785 493,882 2026 - 2030 373,984 85,169 459,153 2031 - 2035 136,540 9,117 145,657 SUB TOTAL 1,356,342 852,906 2,209,248 Unamortized bond (discount) premium, net 16,341 - 16,341 Self-insurance workers' compensation 6,900 - 6,900 General liability 3,079 - 3,079 Accrued vacation, sick leave and compensatory time 5,610 - 5,610 Other post employment benefits 10,389 - 10,389 Environmental remediation and others 22,141 - 22,141 Deferred loss on refunding (19,253) - (19,253)
TOTAL 1,401,549$ 852,906$ 2,254,455$

CITY OF OAKLAND Notes to Basic Financial Statements, (continued)
Year Ended June 30, 2010
85
In January 2010, the Port defeased $44,505,000 of Series L Bonds with maturity dates from 2020 to 2032 and $3,950,000 of Series N Bonds with maturity dates of 2010 and 2022 with proceeds from monies received from the Concession and Lease Agreement with Ports America Outer Harbor Terminal LLC. Funds were deposited in an escrow with the trustee, US Bank, and invested in United States Treasury Securities - State and Local Government Series (SLGS) in amounts sufficient to pay the principal and interest until November 1, 2012 on which date the outstanding defeased Series L Bonds and Series N Bonds are to be called for redemption. As of June 30, 2010, the trustee held $48,455,000 in the escrow (along with interest earned in the escrow) to pay the remaining principal and interest on the defeased Series L Bonds and Series N Bonds until the call date of November 1, 2012. The Port incurred a defeasance loss of $4,158,000, $3,965,000 for Series L and $193,000 for Series N. Net interest costs of $40,000 were capitalized in fiscal 2010. These amounts represented capitalized interest expense of $40,000, net of interest revenue of zero for fiscal 2010. Current Year Long-Term Debt Financings Utility Underground Assessment District No. 2007-232 Piedmont Pines Phase I, 2010 Limited Obligation Improvement Bonds On February 23, 2010, the City of Oakland (the “City”) issued $3,148,483 of Utility Underground Assessment District No. 2007-232, Piedmont Pines Phase I, 2010 Limited Obligation Improvement Bonds (the “Bonds”). The Bonds were issued to finance the costs of the under grounding of street lighting, electric power, telephone and other communication lines of special benefit to the property with the City’s Utility Underground Assessment District No. 2007-232, Piedmont Pines Phase I (the “District”). The Bonds are tax-exempt bonds with a final maturity of September 2, 2035; the interest rates of these bonds range from 2.00% to 6.25%. The Bonds are payable from ad valorem taxes, which is from the unpaid assessments levied upon real property within the District. General Obligation Bonds, Series 2009B, Measure DD On July 22, 2009, the City of Oakland issued $64,545,000 of General Obligation Bonds, Series 2009B, Measure DD (the “2009B Bonds”). The 2009B Bonds have interest rates ranging from 3.00% to 6.25% with a final maturity in January 15, 2039. The proceeds of the 2009B Bonds will fund existing projects as well as execute new projects The City of Oakland Trust for Clean Water and Safe Parks (Measure DD) program was implemented by the City in November 2002 upon receiving voter approval authorizing the City to issue $198,250,000 in general obligation bonds to preserve and acquire open space, renovate parks, provide educational and recreation facilities for children, clean up Lake Merritt and restore Oakland’s creeks, waterfront and estuary. In August 2003, the City
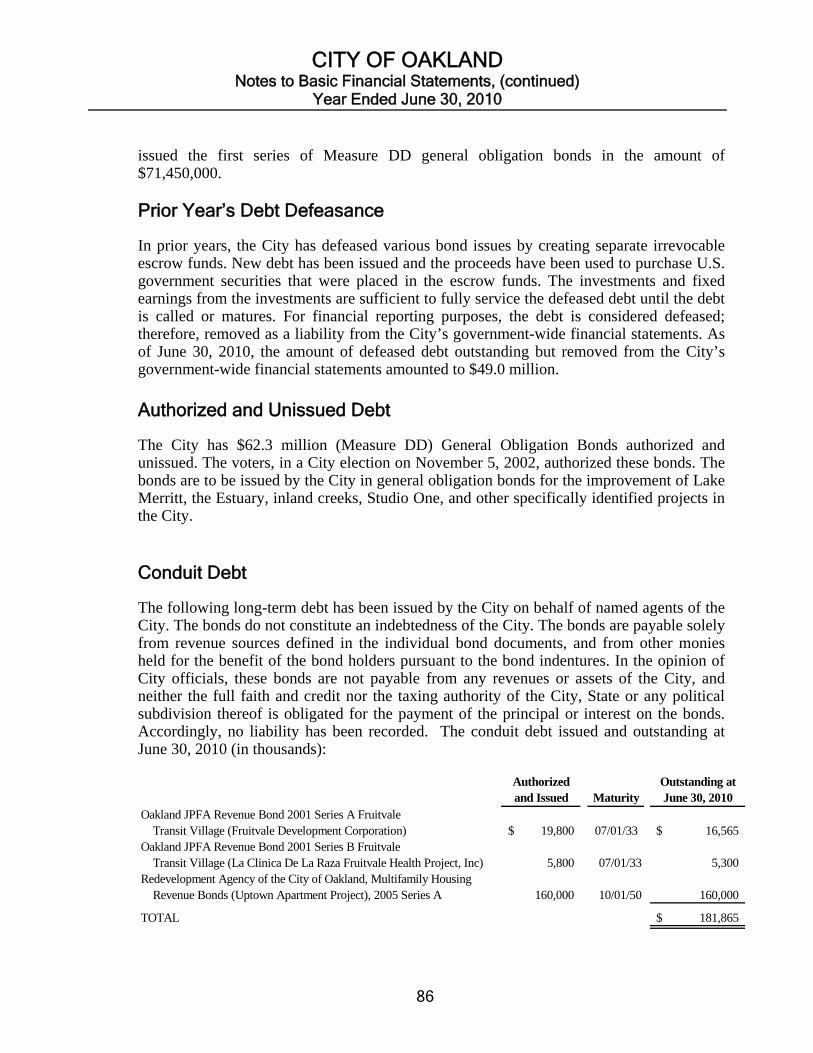
CITY OF OAKLAND Notes to Basic Financial Statements, (continued)
Year Ended June 30, 2010
86
issued the first series of Measure DD general obligation bonds in the amount of $71,450,000. Prior Year’s Debt Defeasance
In prior years, the City has defeased various bond issues by creating separate irrevocable escrow funds. New debt has been issued and the proceeds have been used to purchase U.S. government securities that were placed in the escrow funds. The investments and fixed earnings from the investments are sufficient to fully service the defeased debt until the debt is called or matures. For financial reporting purposes, the debt is considered defeased; therefore, removed as a liability from the City’s government-wide financial statements. As of June 30, 2010, the amount of defeased debt outstanding but removed from the City’s government-wide financial statements amounted to $49.0 million. Authorized and Unissued Debt
The City has $62.3 million (Measure DD) General Obligation Bonds authorized and unissued. The voters, in a City election on November 5, 2002, authorized these bonds. The bonds are to be issued by the City in general obligation bonds for the improvement of Lake Merritt, the Estuary, inland creeks, Studio One, and other specifically identified projects in the City. Conduit Debt
The following long-term debt has been issued by the City on behalf of named agents of the City. The bonds do not constitute an indebtedness of the City. The bonds are payable solely from revenue sources defined in the individual bond documents, and from other monies held for the benefit of the bond holders pursuant to the bond indentures. In the opinion of City officials, these bonds are not payable from any revenues or assets of the City, and neither the full faith and credit nor the taxing authority of the City, State or any political subdivision thereof is obligated for the payment of the principal or interest on the bonds. Accordingly, no liability has been recorded. The conduit debt issued and outstanding at June 30, 2010 (in thousands):
Authorized and Issued Maturity
Outstanding at June 30, 2010
Oakland JPFA Revenue Bond 2001 Series A Fruitvale Transit Village (Fruitvale Development Corporation) 19,800$ 07/01/33 16,565$ Oakland JPFA Revenue Bond 2001 Series B Fruitvale Transit Village (La Clinica De La Raza Fruitvale Health Project, Inc) 5,800 07/01/33 5,300 Redevelopment Agency of the City of Oakland, Multifamily Housing Revenue Bonds (Uptown Apartment Project), 2005 Series A 160,000 10/01/50 160,000
TOTAL 181,865$
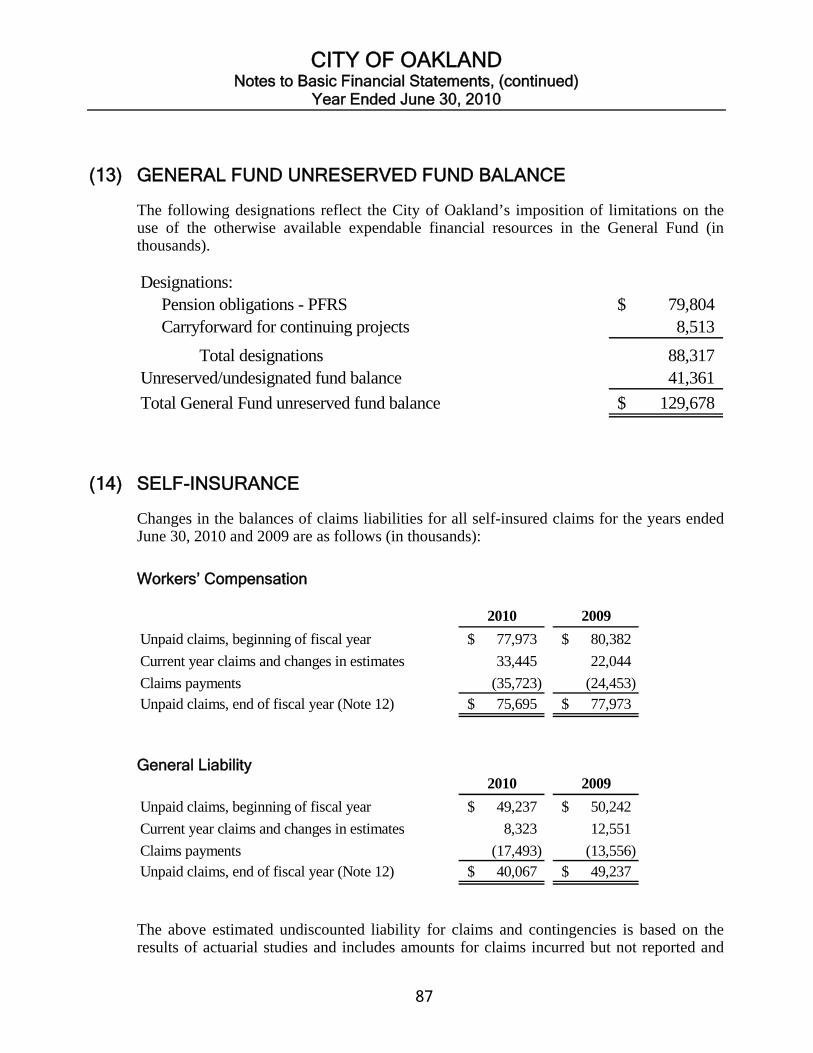
CITY OF OAKLAND Notes to Basic Financial Statements, (continued)
Year Ended June 30, 2010
87
(13) GENERAL FUND UNRESERVED FUND BALANCE
The following designations reflect the City of Oakland’s imposition of limitations on the use of the otherwise available expendable financial resources in the General Fund (in thousands).
Designations: Pension obligations - PFRS 79,804$ Carryforward for continuing projects 8,513
Total designations 88,317 Unreserved/undesignated fund balance 41,361
Total General Fund unreserved fund balance 129,678$
(14) SELF-INSURANCE
Changes in the balances of claims liabilities for all self-insured claims for the years ended June 30, 2010 and 2009 are as follows (in thousands):
Workers’ Compensation
2010 2009
Unpaid claims, beginning of fiscal year 77,973$ 80,382$
Current year claims and changes in estimates 33,445 22,044
Claims payments (35,723) (24,453) Unpaid claims, end of fiscal year (Note 12) 75,695$ 77,973$
General Liability
2010 2009
Unpaid claims, beginning of fiscal year 49,237$ 50,242$
Current year claims and changes in estimates 8,323 12,551
Claims payments (17,493) (13,556) Unpaid claims, end of fiscal year (Note 12) 40,067$ 49,237$
The above estimated undiscounted liability for claims and contingencies is based on the results of actuarial studies and includes amounts for claims incurred but not reported and
CITY OF OAKLAND Notes to Basic Financial Statements, (continued)
Year Ended June 30, 2010
88
allocated loss adjustment expenses. The estimated liability is calculated considering the effects of inflation, recent claim settlement trends, including frequency and amount of payouts, and other economic and social factors. Primary Government
The City is exposed to various risks of loss related to torts: theft of, damage to, and destruction of assets; errors and omissions; employee’s injuries; natural disasters; unemployment coverage; and providing health benefits to employees, retirees and their dependents. For the past three years, there have been no significant reductions in any of the City’s insurance coverage and no settlement amounts have exceeded commercial insurance coverage. The City’s self-insured retention level have been increased by $2 million except for workers’ compensation effective July 1, 2009.
The City is self-insured for its general liability, malpractice liability, public official’s errors and omissions, products & completed operations, employment practices liability, and auto liability up to $4,000,000 retention level and up to $750,000 retention level for worker’s compensation and has excess reinsurance with the California State Association of Counties – Excess Insurance Authority as described below. Property Damage
Property damage risks are covered on an occurrence basis by commercial insurance purchased from independent third parties. All properties are insured at full replacement values after a $25,000 deductible to be paid by the City. General Liability
Numerous lawsuits are pending or threatened against the City. The City estimates that as of June 30, 2010, the amount of liability determined to be probable of occurrence is approximately $40,067,000. Of this amount, claims and litigation approximating $12,004,000 are estimated to be due within one year. The recorded liability is the City’s best estimate based on available information and may be revised as further information is obtained and as pending cases are litigated. The City and the Agency are involved in various claims and litigation arising in the ordinary course of its activities. In the opinion of the Agency’s in-house counsel, the City Attorney’s Office for the City, none of these claims are expected to have a significant impact on the financial condition or changes in financial position of the City and the Agency.
The City has not accumulated or segregated assets or reserved fund balances for the payment of estimated claims and judgments.

CITY OF OAKLAND Notes to Basic Financial Statements, (continued)
Year Ended June 30, 2010
89
Workers’ Compensation
The City is self-insured for workers’ compensation. Payment of claims is provided through annual appropriations, which are based on claim payment experience and supplemental appropriations. Of the $75,695,000 in claims liabilities as of June 30, 2010, approximately $18,909,000 is estimated to be due within one year. Insurance Coverage
On July 15, 2002, the City entered into a contract with the California State Association of Counties - Excess Insurance Authority (CSAC EIA), a joint powers authority, whose purpose is to develop and fund programs of excess insurance for its member counties and cities. Effective July 1, 2009, the self-insured retention levels and purchased insurance per occurrence are as follows:
Type of Coverage Self-Insurance Retention Insurance Authority/Purchase Insurance
General Liability up to $4,000,000 $4,000,000 to $29,000,000 per occurrence
Automobile Liability up to $4,000,000 $4,000,000 to $29,000,000 per occurrence
Public Officials Errors up to $4,000,000 $4,000,000 to $29,000,000 per occurrence/annual and Omissions aggregate
Products and Completed up to $4,000,000 $4,000,000 to $29,000,000 per occurrence/annual Operations aggregate
Employment Practices up to $4,000,000 $4,000,000 to $29,000,000 per occurrence/annual Liability aggregate
Worker's Compensation up to $750,000 $750,000 to $100,000,000 per occurrence/annual aggregate

CITY OF OAKLAND Notes to Basic Financial Statements, (continued)
Year Ended June 30, 2010
90
Discretely Presented Component Unit Workers’ Compensation
The Port is exposed to risk of loss related to injuries of employees. The Port is self-insured and self-administered for workers’ compensation up to a maximum of $750,000 per accident. The Port carries commercial insurance for claims in excess of $750,000 per accident. There were no workers’ compensation claims paid in fiscal years 2010, 2009, and 2008 above the $750,000 per accident limit
Claim expenses and liabilities are reported when it is probable that a loss has occurred and the amount of the loss can be reasonably estimated. These losses are based on an actuarial valuation performed as of June 30, 2010 and include an estimate of claims that have been incurred but not reported. Estimated Reserves can be defined as “actuarial central estimates” which represent the expected range of reasonably possible outcomes. The probability level refers to the probability that actual future payments will not exceed the indicated reserve amount.
The June 30, 2010 Worker’s Compensation Loss Reserve amount of $6,900,000 has been based upon an actuarial study. Total reserve is equal to case reserves plus incurred but not reported (IBNR) reserves. Case reserves are established by individual claims adjusters. The IBNR reserves are estimated by the Actuary and include reserves for late reported claims as well as developments on known claims. The reserve amount is net of excess insurance on an expected value, undiscounted basis. The loss reserve amount represents an estimated reserve amount required to satisfy the Port’s retained liability without a contingency provision for unanticipated development. Changes in the reported liability resulted from the following (in thousands):
2010 2009Workers' compensation liability at beginning of fiscal year 6,137$ 6,000$ Current year claims and changes in estimates 1,699 962 Claims payments (936) (825) Workers' compensation liability at end of fiscal year 6,900$ 6,137$

CITY OF OAKLAND Notes to Basic Financial Statements, (continued)
Year Ended June 30, 2010
91
General Liability
The Port maintains general liability insurance in excess of specified deductibles. For the Airport, coverage is provided in excess of $200,000 in the aggregate up to a maximum of $200,000,000. For the harbor area and the Port’s real estate holdings, coverage is provided in excess of $1,000,000 per occurrence up to an aggregate amount of $150,000,000 per occurrence. Additionally, the Port maintains a Public Officials Errors & Omissions and Employment Practices policy. The policy limits are $25,000,000 with a $500,000 per claim deductible. Defense costs are in addition to the policy limits, but are included in the deductible. The Port is uninsured for losses in excess of these amounts. Casualty losses are accrued when it is determined that a loss to the Port is probable and the amount is estimable.
As of June 30, 2010, the Port was a defendant in various lawsuits arising in the normal course of constructing public improvements or construction related claims for unspecified amounts. The ultimate disposition of these suits and claims is not known. The Port’s insurance may cover a portion of any losses. For additional information, contact the Port of Oakland, 530 Water Street, Oakland, California 94607. Changes in the reported liabilities, which is included as part of long-term obligations is as follows:
2010 2009General liability at beginning of fiscal year 2,571$ 3,925$ Current year claims and changes in estimates 3,282 1,131 Vendor payments (2,774) (2,485) General liability at end of fiscal year 3,079$ 2,571$

CITY OF OAKLAND Notes to Basic Financial Statements, (continued)
Year Ended June 30, 2010
92
(15) JOINT VENTURE Oakland-Alameda County Coliseum
The City is a participant with the County of Alameda (the County) in a joint exercise of powers agreement known as the Oakland-Alameda County Coliseum Authority (the Authority), which was formed on July 1, 1995, to assist the City and County in the financing of public capital improvements in the Oakland-Alameda County Coliseum Complex (Coliseum Complex) pursuant to the Mark-Roos Local Bond Pooling Act of 1985. The Oakland-Alameda County Coliseum Financing Corporation (the Corporation) is reported as a blended component unit of the Authority. The eight-member Board of Commissioners of the Authority consists of two council members from the City, two members of the Board of Supervisors from the County, two appointees of the City Council, and two appointees of the Board of Supervisors. The Board of Directors of the Corporation consists of the City Administrator and the County Administrator.
In August 1995, the Authority issued $9,200,000 in Fixed Rate Refunding Lease Revenue Bonds and $188,500,000 in Variable Rate Lease Revenue Bonds (collectively known as the Stadium Bonds) to satisfy certain obligations of the Authority, the City, the County, the Corporation and Oakland-Alameda County Coliseum Inc. (Coliseum Inc.), which manages the operations of the Coliseum Complex, to finance the costs of remodeling the stadium portion of the Coliseum complex as well as relocating the Raiders football franchise to the City.
On May 25, 2000, the Authority issued $201,300,000 in series 2000 C and D Refunding Bonds to retire $181,900,000 of the 1995 Variable Rate Lease Revenue Stadium Bonds ($188,500,000 less $6,600,000 principal payment). In February 2004, the 1995 Fixed Rate Refunding Lease Revenue Bond was fully repaid from the escrow established in 1995 at the time the Coliseum Authority issued the Stadium Bonds.
The Stadium Bonds are limited obligations of the Authority payable solely from revenues of the Authority, consisting primarily of base rental payments to be received by the Authority from the City and the County. The source of the Coliseum Authority’s revenues relating to football games consists primarily of a portion of club dues, concession and parking payments. In the event that such football revenues and other revenues received in connection with the Stadium are insufficient to make base rental payments, the City and the County are obligated to make up the shortfall in the base rental payments from their respective General Funds. The City and the County each have covenanted to appropriate $11 million annually to cover such shortfalls in revenue; however, the City and the County are jointly and severally liable to cover such shortfall, which means that the City could have to pay up to $22 million annually in the event of default by the County.
On August 2, 1996, the Authority issued $70,000,000 Series A-1 and $70,000,000 Series A-2 Variable Rate Lease Revenue Bonds (Arena Bonds) to finance the costs of remodeling the Coliseum Arena (Arena) and to satisfy certain obligations of the Authority, the City, the County and Coliseum Inc. in connection with the retention of the Golden State Warriors

CITY OF OAKLAND Notes to Basic Financial Statements, (continued)
Year Ended June 30, 2010
93
(the Warriors) to play professional basketball at the Arena for at least 20 basketball seasons, beginning with the 1997-98 season. These obligations are evidenced in a series of agreements (the Warriors Agreements) between the Warriors, the City, the County, Coliseum Inc. and the Authority.
Under the Warriors Agreements, the Arena Bonds were limited obligations of the Authority, payable solely from base rental revenues of the Authority received by the Authority on behalf of the City and the County. These revenues consist of base rental payments from the City and County and certain payments from the Warriors of up to $7,428,000 annually from premium seating revenues, and other payments from Arena operations. If the revenues received from the Warriors and from Arena operations are not sufficient to cover the debt service requirements in any fiscal year, the City and County are obligated to make up the shortfall in the base rental payment from their respective General Funds. The City and the County each have covenanted to appropriate up to $9,500,000 annually to cover such revenue shortfalls; however, the City and the County are jointly and severally liable to cover such shortfalls, which means that the City could have to pay up to $19,000,000 annually in the event of default by the County.
The Coliseum Authority entered into an agreement with the Oakland Coliseum Joint Venture to manage the entire Coliseum complex beginning July 1, 1998. On January 1, 2001, the Coliseum Authority terminated its agreement with Oakland Coliseum Joint Venture and reinstated its Operating Agreement with Oakland-Alameda County Coliseum, Inc. Oakland-Alameda County Coliseum, Inc. subcontracted all of the operations of the Coliseum Complex to the Oakland Coliseum Joint Venture. The Operating Agreement between the Coliseum Authority and Coliseum Inc. expired, by its terms, on July 31, 2006. The Authority entered into a Termination Agreement whereby, in return for certain consideration, the Authority agreed to perform the duties of Coliseum, Inc. on and after August 1, 2006. The Authority’s Management Agreement with Oakland Coliseum Joint Venture expires in June, 2012.
Debt service requirements for the Coliseum Authority debt are as follows (in thousands):
For the PeriodEnding June 30, Principal Interest Principal Interest
2011 7,100$ 5,212$ 3,950$ 6,720$ 2012 7,500 4,951 4,050 6,474 2013 7,900 4,669 4,400 6,221 2014 8,300 4,399 4,750 5,948 2015 8,700 4,106 5,150 5,652
2016-2020 49,600 15,674 31,000 23,050 2021-2025 62,900 6,031 43,850 11,916
2026 - - 8,605 520 Total 152,000$ 45,042$ 105,755$ 66,501$
Stadium Debt Arena Debt
CITY OF OAKLAND Notes to Basic Financial Statements, (continued)
Year Ended June 30, 2010
94
Complete financial statements for the Authority can be obtained from the County Auditor-Controller’s office at 1221 Oak Street, Oakland, CA 94612.
Under the joint exercise of power agreement, which formed the Authority, the City is responsible for funding up to 50% of the Authority’s operating costs and debt service requirements, to the extent such funding is necessary. During the year ended June 30, 2010, the City made contributions of $10,063,000 to fund its share of operating deficits and debt service payments of the Authority.
The Coliseum Authority has anticipated a deficit for operating costs and repayment of its Stadium bonds, such that the City and County may have to contribute to base rental payments. Of the $20,500,000 appropriated in the General Fund as part of the above agreements, it is estimated that the City may have to contribute $10,034,000 for the 2010-11 fiscal year. There are many uncertainties in the estimation of revenues for the Authority beyond one year into the future; therefore, the City has established a liability to fund the Authority deficit in the statement of net assets in an amount equal to its contingent share (50%) of the outstanding Stadium bonds in the amount of $76,000,000. The City has not established a contingent liability for the Arena Bonds because management is of the opinion that revenues from the Arena, including payments from the Warriors and revenues from Arena operations, will be sufficient to cover the debt payments.
CITY OF OAKLAND Notes to Basic Financial Statements, (continued)
Year Ended June 30, 2010
95
(16) PENSION PLANS
The City has three defined benefit retirement plans: Police and Fire Retirement System (PFRS), Oakland Municipal Employees’ Retirement System (OMERS) and California Public Employees’ Retirement System (PERS). PFRS and OMERS are closed plans that cover employees hired prior to July 1976 and September 1970, respectively. These two plans are considered part of the City’s reporting entity and are included in the City’s basic financial statements as pension trust funds. City employees hired subsequent to the plans’ closure dates are covered by PERS, which is administered by the State of California.
Member and employer contributions are recognized in the period in which the contributions are due pursuant to formal commitments, as well as contractual or statutory requirements, and benefits and refunds are recognized when due and payable, in accordance with the terms of the plans.
PFRS OMERS PERS
Type of plan Single employer Single employer Agent multi-employer Reporting entity City City State Last complete actuarial study July 01, 2010 July 01, 2010 June 30, 2009
Police and Fire Retirement System (PFRS)
PFRS provides death, disability and service retirement benefits to uniformed employees and their beneficiaries. Members who complete at least 25 years of service, or 20 years of service and have reached the age of 55, or have reached the age of 65, are eligible for retirement benefits. The basic retirement allowance equals 50% of the compensation attached to the average rank held during the three years immediately preceding retirement, plus an additional allowance of 1-2/3% of such compensation for each year of service (up to ten) subsequent to: a) qualifying for retirement, and b) July 1, 1951. Early retirees will receive reduced benefits based on the number of years of service. Benefit provisions and all other requirements are established by the City Charter (Charter). The June 30, 2010 stand alone financial statements are available by contacting the City Administrator’s Office, One Frank Ogawa Plaza, Oakland, California 94612.
In accordance with the Charter, active members of PFRS contribute a percentage of earned salaries based upon entry age as determined by the City’s consulting actuary. During the year ended June 30, 2010, these contributions ranged from 5.47% to 6.05%. By statute, employee contributions are limited to 13% of earned salaries. Employee contributions are refundable with interest at 4% per annum if an employee elects to withdraw from PFRS upon termination of employment with the City.
The City contributes, at a minimum, such amounts that are necessary, determined on an actuarial basis, to provide assets sufficient to meet benefits to be paid to PFRS members. The City is required to fund all liabilities for future benefits for all members by June 30,
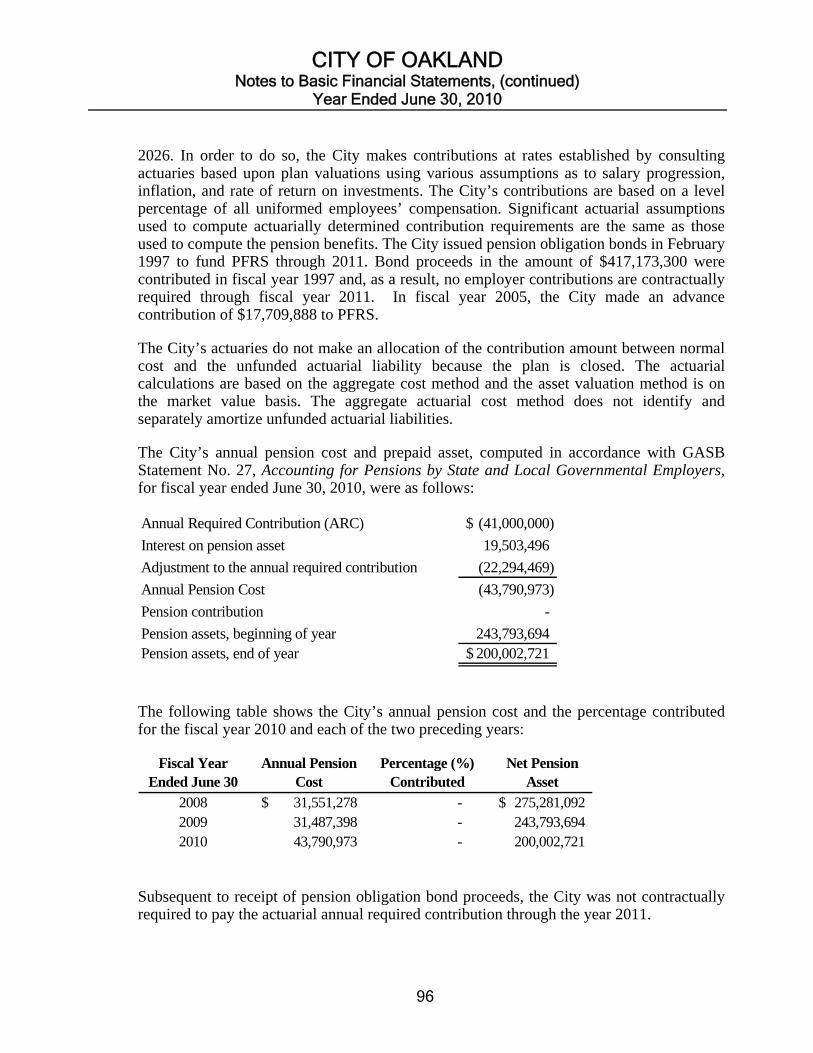
CITY OF OAKLAND Notes to Basic Financial Statements, (continued)
Year Ended June 30, 2010
96
2026. In order to do so, the City makes contributions at rates established by consulting actuaries based upon plan valuations using various assumptions as to salary progression, inflation, and rate of return on investments. The City’s contributions are based on a level percentage of all uniformed employees’ compensation. Significant actuarial assumptions used to compute actuarially determined contribution requirements are the same as those used to compute the pension benefits. The City issued pension obligation bonds in February 1997 to fund PFRS through 2011. Bond proceeds in the amount of $417,173,300 were contributed in fiscal year 1997 and, as a result, no employer contributions are contractually required through fiscal year 2011. In fiscal year 2005, the City made an advance contribution of $17,709,888 to PFRS.
The City’s actuaries do not make an allocation of the contribution amount between normal cost and the unfunded actuarial liability because the plan is closed. The actuarial calculations are based on the aggregate cost method and the asset valuation method is on the market value basis. The aggregate actuarial cost method does not identify and separately amortize unfunded actuarial liabilities.
The City’s annual pension cost and prepaid asset, computed in accordance with GASB Statement No. 27, Accounting for Pensions by State and Local Governmental Employers, for fiscal year ended June 30, 2010, were as follows:
Annual Required Contribution (ARC) (41,000,000)$
Interest on pension asset 19,503,496
Adjustment to the annual required contribution (22,294,469)
Annual Pension Cost (43,790,973)
Pension contribution -
Pension assets, beginning of year 243,793,694 Pension assets, end of year 200,002,721$
The following table shows the City’s annual pension cost and the percentage contributed for the fiscal year 2010 and each of the two preceding years:
Fiscal Year Ended June 30
Annual Pension Cost
Percentage (%) Contributed
Net Pension Asset
2008 31,551,278$ - 275,281,092$ 2009 31,487,398 - 243,793,694 2010 43,790,973 - 200,002,721
Subsequent to receipt of pension obligation bond proceeds, the City was not contractually required to pay the actuarial annual required contribution through the year 2011.
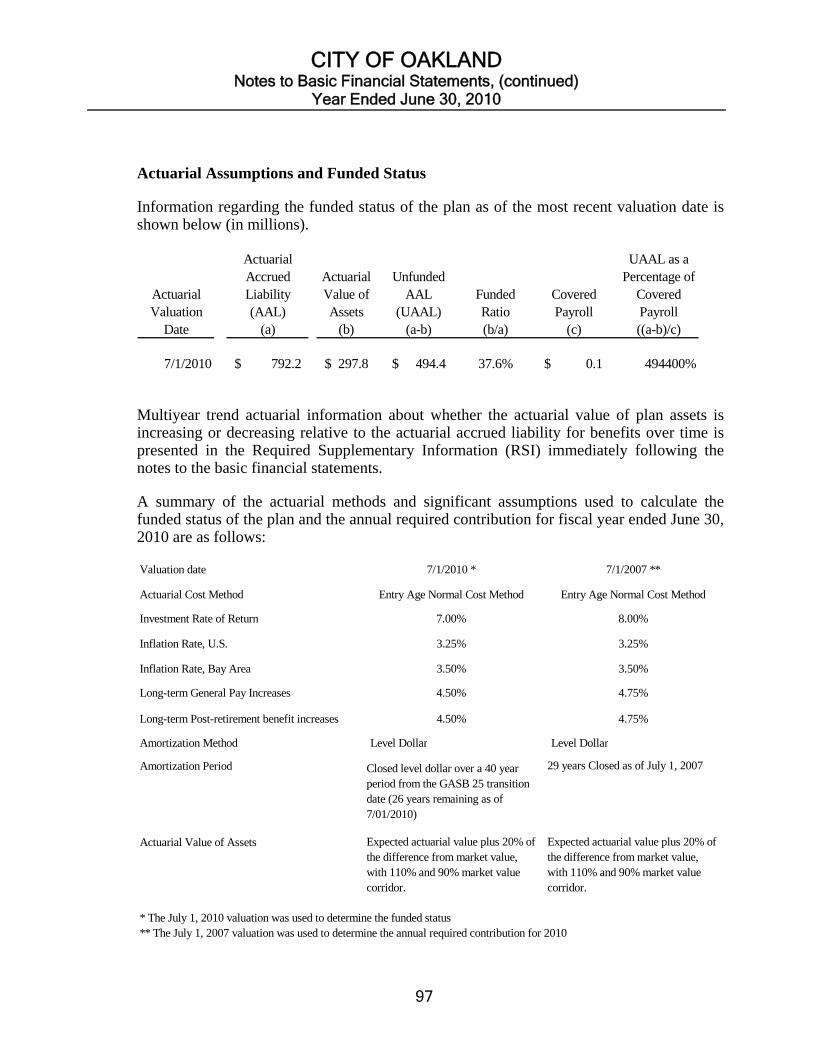
CITY OF OAKLAND Notes to Basic Financial Statements, (continued)
Year Ended June 30, 2010
97
Actuarial Assumptions and Funded Status
Information regarding the funded status of the plan as of the most recent valuation date is shown below (in millions).
Actuarial Valuation
Date
Actuarial Accrued Liability (AAL)
(a)
Actuarial Value of Assets
(b)
Unfunded AAL
(UAAL) (a-b)
Funded Ratio (b/a)
Covered Payroll
(c)
UAAL as a Percentage of
Covered Payroll ((a-b)/c)
7/1/2010 792.2$ 297.8$ 494.4$ 37.6% 0.1$ 494400%
Multiyear trend actuarial information about whether the actuarial value of plan assets is increasing or decreasing relative to the actuarial accrued liability for benefits over time is presented in the Required Supplementary Information (RSI) immediately following the notes to the basic financial statements.
A summary of the actuarial methods and significant assumptions used to calculate the funded status of the plan and the annual required contribution for fiscal year ended June 30, 2010 are as follows:
Valuation date 7/1/2010 * 7/1/2007 **
Actuarial Cost Method Entry Age Normal Cost Method Entry Age Normal Cost Method
Investment Rate of Return 7.00% 8.00%
Inflation Rate, U.S. 3.25% 3.25%
Inflation Rate, Bay Area 3.50% 3.50%
Long-term General Pay Increases 4.50% 4.75%
Long-term Post-retirement benefit increases 4.50% 4.75%
Amortization Method Level Dollar Level Dollar
Amortization Period 29 years Closed as of July 1, 2007
Actuarial Value of Assets
* The July 1, 2010 valuation was used to determine the funded status** The July 1, 2007 valuation was used to determine the annual required contribution for 2010
Closed level dollar over a 40 year period from the GASB 25 transition date (26 years remaining as of 7/01/2010)
Expected actuarial value plus 20% of the difference from market value, with 110% and 90% market value corridor.
Expected actuarial value plus 20% of the difference from market value, with 110% and 90% market value corridor.
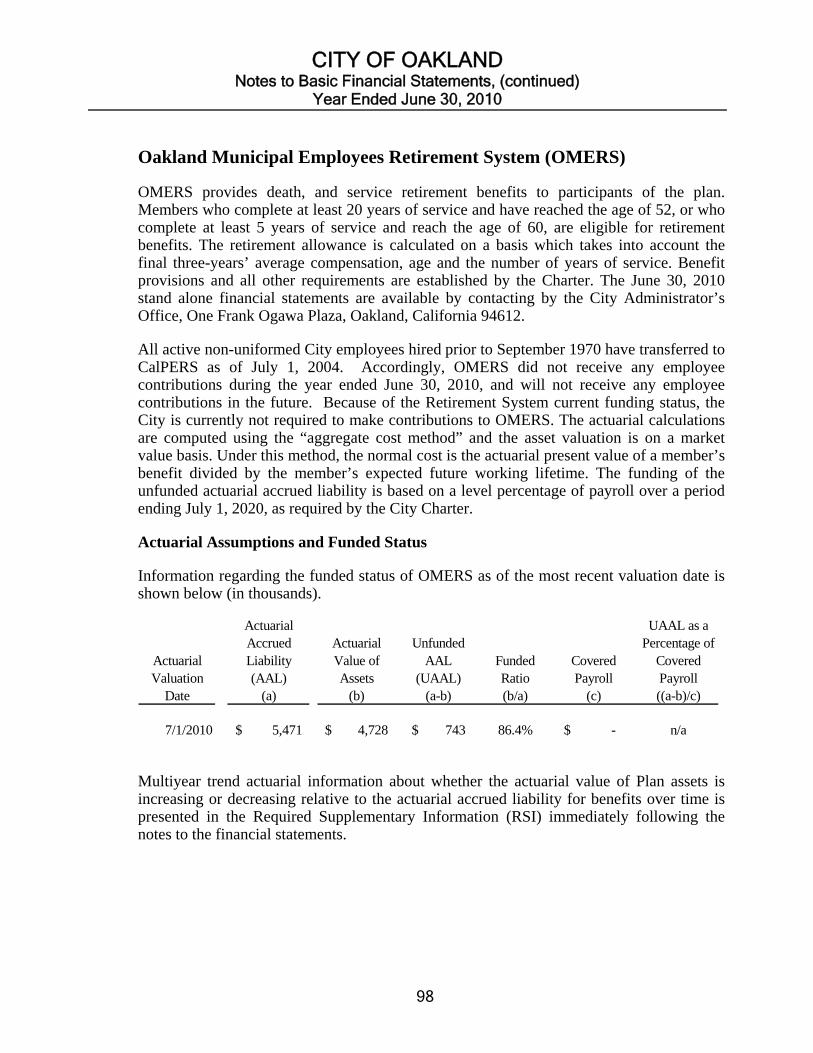
CITY OF OAKLAND Notes to Basic Financial Statements, (continued)
Year Ended June 30, 2010
98
Oakland Municipal Employees Retirement System (OMERS)
OMERS provides death, and service retirement benefits to participants of the plan. Members who complete at least 20 years of service and have reached the age of 52, or who complete at least 5 years of service and reach the age of 60, are eligible for retirement benefits. The retirement allowance is calculated on a basis which takes into account the final three-years’ average compensation, age and the number of years of service. Benefit provisions and all other requirements are established by the Charter. The June 30, 2010 stand alone financial statements are available by contacting by the City Administrator’s Office, One Frank Ogawa Plaza, Oakland, California 94612.
All active non-uniformed City employees hired prior to September 1970 have transferred to CalPERS as of July 1, 2004. Accordingly, OMERS did not receive any employee contributions during the year ended June 30, 2010, and will not receive any employee contributions in the future. Because of the Retirement System current funding status, the City is currently not required to make contributions to OMERS. The actuarial calculations are computed using the “aggregate cost method” and the asset valuation is on a market value basis. Under this method, the normal cost is the actuarial present value of a member’s benefit divided by the member’s expected future working lifetime. The funding of the unfunded actuarial accrued liability is based on a level percentage of payroll over a period ending July 1, 2020, as required by the City Charter.
Actuarial Assumptions and Funded Status
Information regarding the funded status of OMERS as of the most recent valuation date is shown below (in thousands).
Actuarial Valuation
Date
Actuarial Accrued Liability (AAL)
(a)
Actuarial Value of Assets
(b)
Unfunded AAL
(UAAL) (a-b)
Funded Ratio (b/a)
Covered Payroll
(c)
UAAL as a Percentage of
Covered Payroll ((a-b)/c)
7/1/2010 5,471$ 4,728$ 743$ 86.4% -$ n/a
Multiyear trend actuarial information about whether the actuarial value of Plan assets is increasing or decreasing relative to the actuarial accrued liability for benefits over time is presented in the Required Supplementary Information (RSI) immediately following the notes to the financial statements.
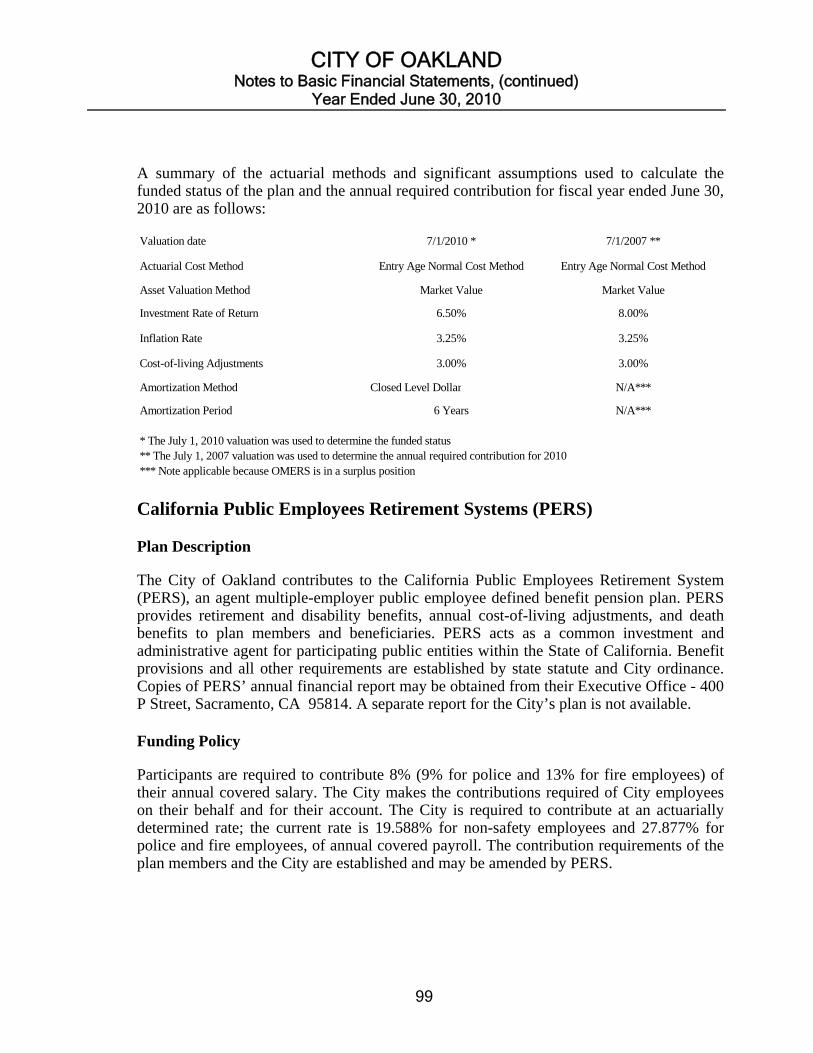
CITY OF OAKLAND Notes to Basic Financial Statements, (continued)
Year Ended June 30, 2010
99
A summary of the actuarial methods and significant assumptions used to calculate the funded status of the plan and the annual required contribution for fiscal year ended June 30, 2010 are as follows:
Valuation date 7/1/2010 * 7/1/2007 **
Actuarial Cost Method Entry Age Normal Cost Method Entry Age Normal Cost Method
Asset Valuation Method Market Value Market Value
Investment Rate of Return 6.50% 8.00%
Inflation Rate 3.25% 3.25%
Cost-of-living Adjustments 3.00% 3.00%
Amortization Method Closed Level Dollar N/A***
Amortization Period 6 Years N/A***
* The July 1, 2010 valuation was used to determine the funded status** The July 1, 2007 valuation was used to determine the annual required contribution for 2010*** Note applicable because OMERS is in a surplus position California Public Employees Retirement Systems (PERS) Plan Description
The City of Oakland contributes to the California Public Employees Retirement System (PERS), an agent multiple-employer public employee defined benefit pension plan. PERS provides retirement and disability benefits, annual cost-of-living adjustments, and death benefits to plan members and beneficiaries. PERS acts as a common investment and administrative agent for participating public entities within the State of California. Benefit provisions and all other requirements are established by state statute and City ordinance. Copies of PERS’ annual financial report may be obtained from their Executive Office - 400 P Street, Sacramento, CA 95814. A separate report for the City’s plan is not available. Funding Policy
Participants are required to contribute 8% (9% for police and 13% for fire employees) of their annual covered salary. The City makes the contributions required of City employees on their behalf and for their account. The City is required to contribute at an actuarially determined rate; the current rate is 19.588% for non-safety employees and 27.877% for police and fire employees, of annual covered payroll. The contribution requirements of the plan members and the City are established and may be amended by PERS.

CITY OF OAKLAND Notes to Basic Financial Statements, (continued)
Year Ended June 30, 2010
100
Annual Pension Cost
For 2009-10, the City’s annual pension cost of $94,316,018 was equal to the City’s required and actual contribution. The required contribution was determined as part of the June 30, 2007, actuarial valuation using the entry age normal actuarial cost method. The actuarial assumptions included (a) 7.75% investment rate of return (net of administrative expenses), (b) projected annual salary increases that vary by duration of service (3.25% to 14.45%), and (c) payroll growth of 3.25%. Both (a) and (b) included an inflation component of 3.00%. The actuarial value of PERS assets was determined using techniques that smooth the effects of short-term volatility in the market value of investments over a four-year period (smoothed market value). PERS unfunded actuarial accrued liability is being amortized as a level percentage of projected payroll over a closed 20 year period.
Three-Year Trend Information for PERS (in millions)
Funded Status and Funding Progress for Pension Plans Safety Plan
As of June 30, 2009, the most recent actuarial valuation date, the Public Safety plan was 74.4% funded. The actuarial accrued liability for benefits was $1,194,359,091, and the actuarial value assets was $888,250,432, resulting in an unfunded actuarial accrued liability (UAAL) of $306,108,659. The annual covered payroll was $150,306,150, and the ratio of the UAAL to the annual covered payroll was 203.7%.
Fiscal Year Ended June 30,
Annual Pension Cost (APC)
Percentage of APC Contributed
Net Pension Obligation
2008 $ 97.9 100% $ - 2009 98.2 100 - 2010 94.3 100 -
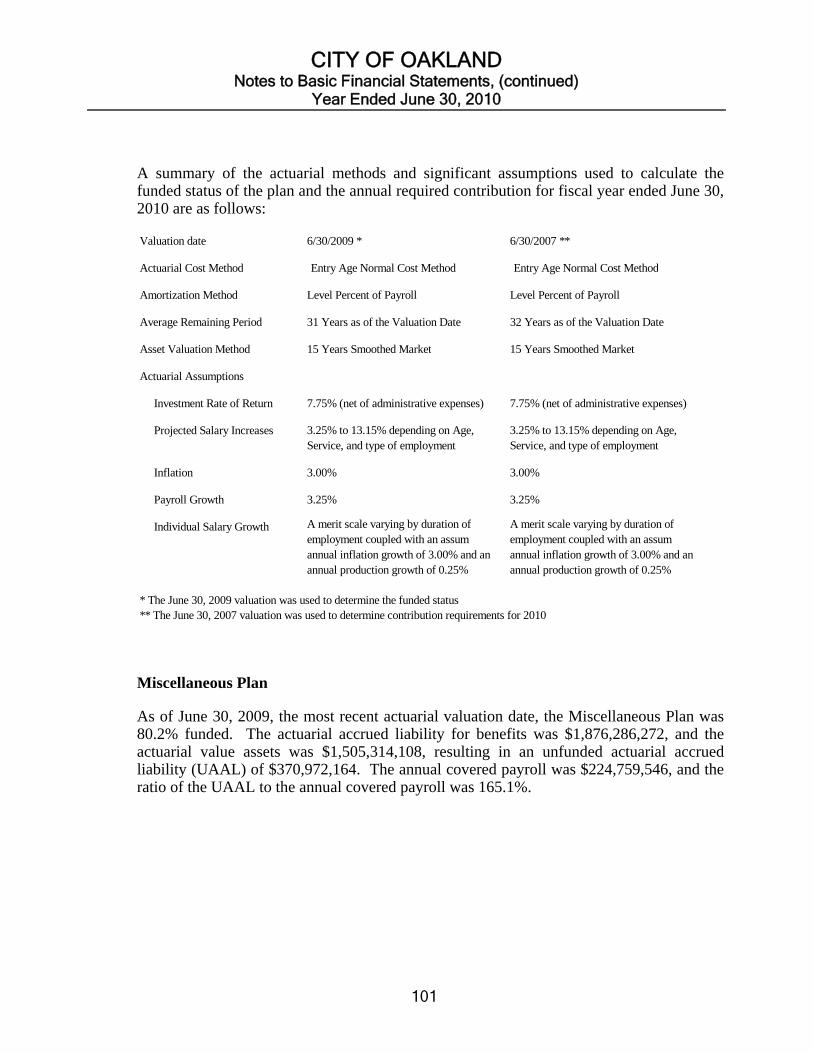
CITY OF OAKLAND Notes to Basic Financial Statements, (continued)
Year Ended June 30, 2010
101
A summary of the actuarial methods and significant assumptions used to calculate the funded status of the plan and the annual required contribution for fiscal year ended June 30, 2010 are as follows:
Valuation date 6/30/2009 * 6/30/2007 **
Actuarial Cost Method Entry Age Normal Cost Method Entry Age Normal Cost Method
Amortization Method Level Percent of Payroll Level Percent of Payroll
Average Remaining Period 31 Years as of the Valuation Date 32 Years as of the Valuation Date
Asset Valuation Method 15 Years Smoothed Market 15 Years Smoothed Market
Actuarial Assumptions
Investment Rate of Return 7.75% (net of administrative expenses) 7.75% (net of administrative expenses)
Projected Salary Increases
Inflation 3.00% 3.00%
Payroll Growth 3.25% 3.25%
Individual Salary Growth
* The June 30, 2009 valuation was used to determine the funded status** The June 30, 2007 valuation was used to determine contribution requirements for 2010
A merit scale varying by duration of employment coupled with an assum annual inflation growth of 3.00% and an annual production growth of 0.25%
A merit scale varying by duration of employment coupled with an assum annual inflation growth of 3.00% and an annual production growth of 0.25%
3.25% to 13.15% depending on Age, Service, and type of employment
3.25% to 13.15% depending on Age, Service, and type of employment
Miscellaneous Plan
As of June 30, 2009, the most recent actuarial valuation date, the Miscellaneous Plan was 80.2% funded. The actuarial accrued liability for benefits was $1,876,286,272, and the actuarial value assets was $1,505,314,108, resulting in an unfunded actuarial accrued liability (UAAL) of $370,972,164. The annual covered payroll was $224,759,546, and the ratio of the UAAL to the annual covered payroll was 165.1%.
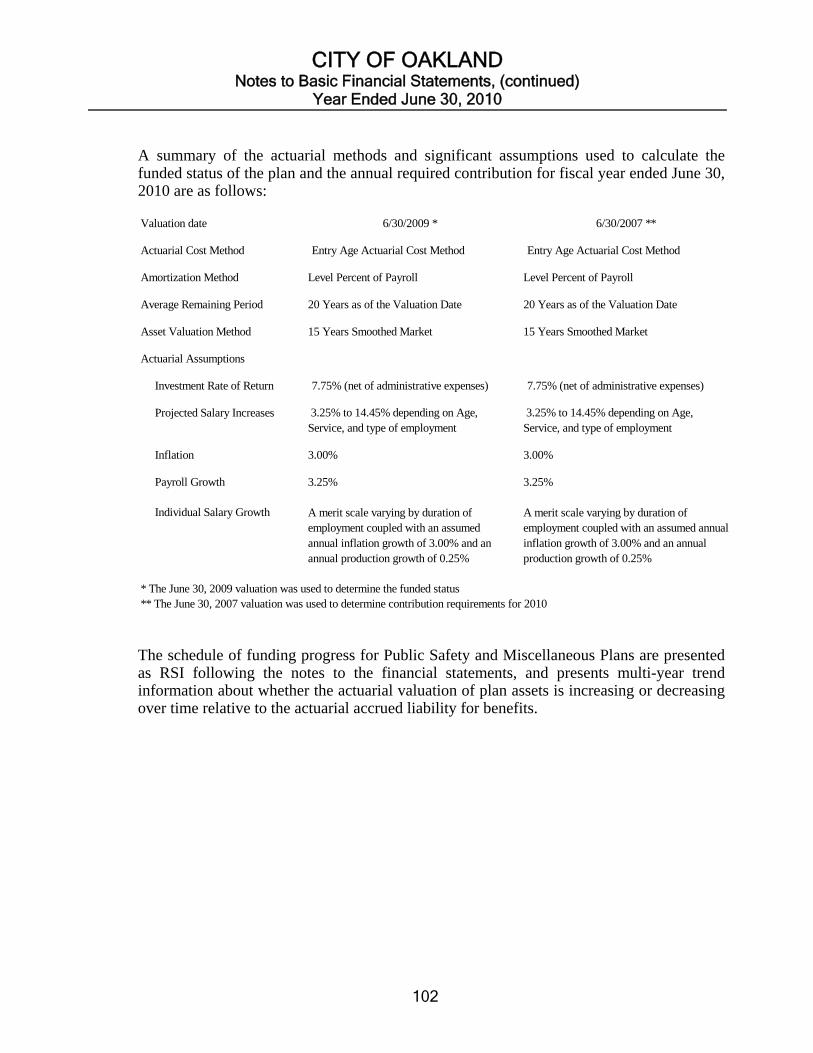
CITY OF OAKLAND Notes to Basic Financial Statements, (continued)
Year Ended June 30, 2010
102
A summary of the actuarial methods and significant assumptions used to calculate the funded status of the plan and the annual required contribution for fiscal year ended June 30, 2010 are as follows:
Valuation date 6/30/2009 * 6/30/2007 **
Actuarial Cost Method Entry Age Actuarial Cost Method Entry Age Actuarial Cost Method
Amortization Method Level Percent of Payroll Level Percent of Payroll
Average Remaining Period 20 Years as of the Valuation Date 20 Years as of the Valuation Date
Asset Valuation Method 15 Years Smoothed Market 15 Years Smoothed Market
Actuarial Assumptions
Investment Rate of Return 7.75% (net of administrative expenses) 7.75% (net of administrative expenses)
Projected Salary Increases
Inflation 3.00% 3.00%
Payroll Growth 3.25% 3.25%
Individual Salary Growth
* The June 30, 2009 valuation was used to determine the funded status** The June 30, 2007 valuation was used to determine contribution requirements for 2010
3.25% to 14.45% depending on Age, Service, and type of employment
3.25% to 14.45% depending on Age, Service, and type of employment
A merit scale varying by duration of employment coupled with an assumed annual inflation growth of 3.00% and an annual production growth of 0.25%
A merit scale varying by duration of employment coupled with an assumed annual inflation growth of 3.00% and an annual production growth of 0.25%
The schedule of funding progress for Public Safety and Miscellaneous Plans are presented as RSI following the notes to the financial statements, and presents multi-year trend information about whether the actuarial valuation of plan assets is increasing or decreasing over time relative to the actuarial accrued liability for benefits.
CITY OF OAKLAND Notes to Basic Financial Statements, (continued)
Year Ended June 30, 2010
103
(17) POST EMPLOYMENT BENEFITS OTHER THAN PENSION BENEFITS (OPEB)
Primary Government Plan Description
The City has three programs in place to partially pay health insurance premiums for certain classes of retirees from City employment. The City retirees are eligible for retiree health benefits if they meet certain requirements relating to age and service. The retiree health benefits are described in the labor agreements between the City and Local Unions and in City resolutions. The demographic rates used for the California Public Employee Retirement System (PERS) were public safety employees retirements benefits under a 3% @ 50 formula and miscellaneous employees retirement benefits under a 2.7% @ 55 formula.
The City’s agent multi-employer defined benefit retiree health plan allows eligible retirees and their dependents to receive employer paid medical insurance benefits through CALPERS. The medical insurance reimbursement is not to exceed the Kaiser-HMO family plan rate. The Retiree Health Plan also includes dental, and vision benefits and reimbursement of Medicare part B monthly insurance premium. The Retiree Health plan does not issue a separate financial report. Funding Policy
The City pays part of the health insurance premiums for all retirees from City employment receiving a pension annuity earned through City service and participating in a City-sponsored PERS health benefit plan on a pay-as-you-go basis. The City paid $14,016,359 for retirees under this program for the year ended June 30, 2010.
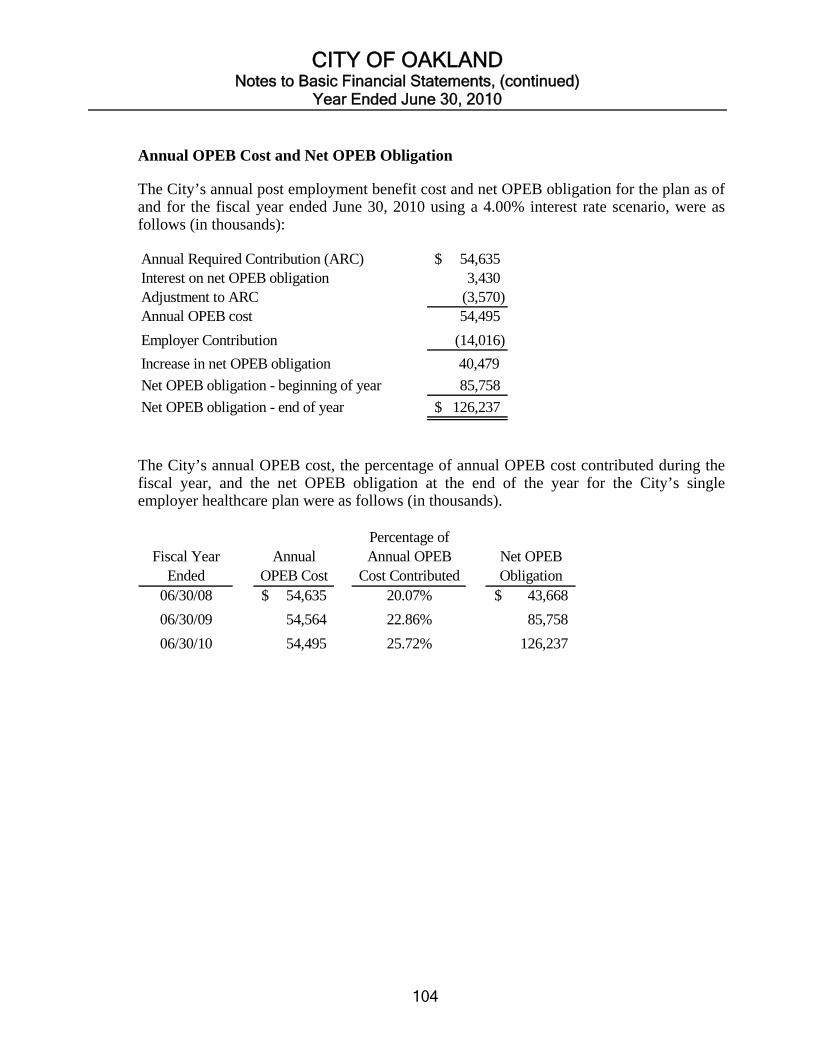
CITY OF OAKLAND Notes to Basic Financial Statements, (continued)
Year Ended June 30, 2010
104
Annual OPEB Cost and Net OPEB Obligation
The City’s annual post employment benefit cost and net OPEB obligation for the plan as of and for the fiscal year ended June 30, 2010 using a 4.00% interest rate scenario, were as follows (in thousands):
Annual Required Contribution (ARC) 54,635$ Interest on net OPEB obligation 3,430 Adjustment to ARC (3,570) Annual OPEB cost 54,495
Employer Contribution (14,016)
Increase in net OPEB obligation 40,479
Net OPEB obligation - beginning of year 85,758
Net OPEB obligation - end of year 126,237$
The City’s annual OPEB cost, the percentage of annual OPEB cost contributed during the fiscal year, and the net OPEB obligation at the end of the year for the City’s single employer healthcare plan were as follows (in thousands).
Fiscal Year Ended
Annual OPEB Cost
Percentage of Annual OPEB
Cost ContributedNet OPEB Obligation
06/30/08 54,635$ 20.07% 43,668$
06/30/09 54,564 22.86% 85,758
06/30/10 54,495 25.72% 126,237
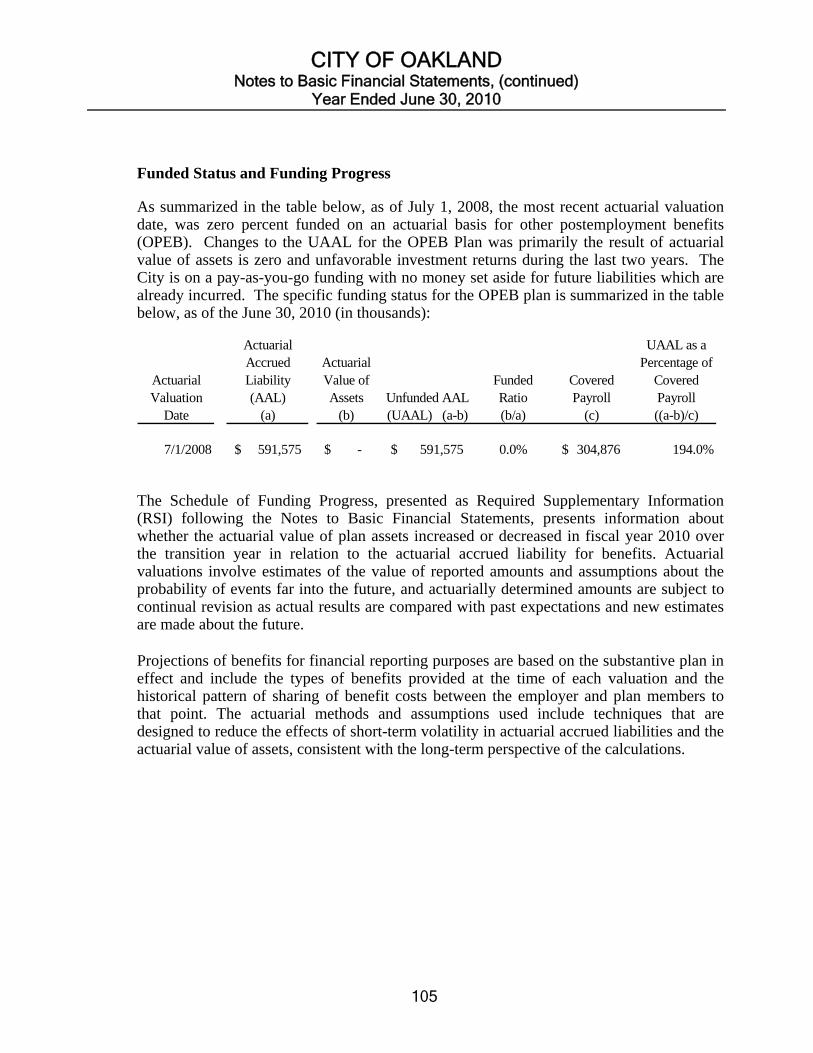
CITY OF OAKLAND Notes to Basic Financial Statements, (continued)
Year Ended June 30, 2010
105
Funded Status and Funding Progress
As summarized in the table below, as of July 1, 2008, the most recent actuarial valuation date, was zero percent funded on an actuarial basis for other postemployment benefits (OPEB). Changes to the UAAL for the OPEB Plan was primarily the result of actuarial value of assets is zero and unfavorable investment returns during the last two years. The City is on a pay-as-you-go funding with no money set aside for future liabilities which are already incurred. The specific funding status for the OPEB plan is summarized in the table below, as of the June 30, 2010 (in thousands):
Actuarial Valuation
Date
Actuarial Accrued Liability (AAL)
(a)
Actuarial Value of Assets
(b)Unfunded AAL (UAAL) (a-b)
Funded Ratio (b/a)
Covered Payroll
(c)
UAAL as a Percentage of
Covered Payroll ((a-b)/c)
7/1/2008 591,575$ -$ 591,575$ 0.0% 304,876$ 194.0%
The Schedule of Funding Progress, presented as Required Supplementary Information (RSI) following the Notes to Basic Financial Statements, presents information about whether the actuarial value of plan assets increased or decreased in fiscal year 2010 over the transition year in relation to the actuarial accrued liability for benefits. Actuarial valuations involve estimates of the value of reported amounts and assumptions about the probability of events far into the future, and actuarially determined amounts are subject to continual revision as actual results are compared with past expectations and new estimates are made about the future. Projections of benefits for financial reporting purposes are based on the substantive plan in effect and include the types of benefits provided at the time of each valuation and the historical pattern of sharing of benefit costs between the employer and plan members to that point. The actuarial methods and assumptions used include techniques that are designed to reduce the effects of short-term volatility in actuarial accrued liabilities and the actuarial value of assets, consistent with the long-term perspective of the calculations.
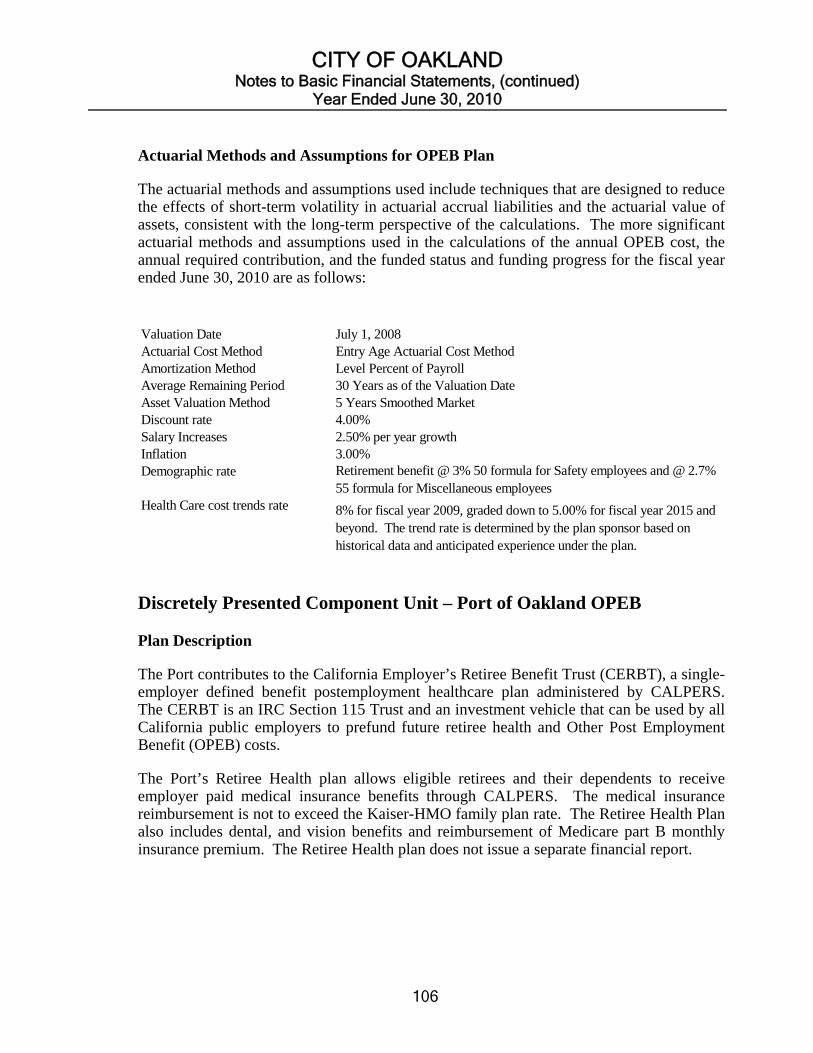
CITY OF OAKLAND Notes to Basic Financial Statements, (continued)
Year Ended June 30, 2010
106
Actuarial Methods and Assumptions for OPEB Plan
The actuarial methods and assumptions used include techniques that are designed to reduce the effects of short-term volatility in actuarial accrual liabilities and the actuarial value of assets, consistent with the long-term perspective of the calculations. The more significant actuarial methods and assumptions used in the calculations of the annual OPEB cost, the annual required contribution, and the funded status and funding progress for the fiscal year ended June 30, 2010 are as follows:
Valuation Date July 1, 2008Actuarial Cost Method Entry Age Actuarial Cost MethodAmortization Method Level Percent of PayrollAverage Remaining Period 30 Years as of the Valuation DateAsset Valuation Method 5 Years Smoothed MarketDiscount rate 4.00%Salary Increases 2.50% per year growthInflation 3.00%Demographic rate
Health Care cost trends rate 8% for fiscal year 2009, graded down to 5.00% for fiscal year 2015 and beyond. The trend rate is determined by the plan sponsor based on historical data and anticipated experience under the plan.
Retirement benefit @ 3% 50 formula for Safety employees and @ 2.7% 55 formula for Miscellaneous employees
Discretely Presented Component Unit – Port of Oakland OPEB
Plan Description
The Port contributes to the California Employer’s Retiree Benefit Trust (CERBT), a single-employer defined benefit postemployment healthcare plan administered by CALPERS. The CERBT is an IRC Section 115 Trust and an investment vehicle that can be used by all California public employers to prefund future retiree health and Other Post Employment Benefit (OPEB) costs.
The Port’s Retiree Health plan allows eligible retirees and their dependents to receive employer paid medical insurance benefits through CALPERS. The medical insurance reimbursement is not to exceed the Kaiser-HMO family plan rate. The Retiree Health Plan also includes dental, and vision benefits and reimbursement of Medicare part B monthly insurance premium. The Retiree Health plan does not issue a separate financial report.

CITY OF OAKLAND Notes to Basic Financial Statements, (continued)
Year Ended June 30, 2010
107
Funding Policy
Benefit provisions are established and may be amended through negotiations between the Port and the various bargaining units during each bargaining period. The Port contributes on a pay-as-you-go basis.
As of June 30, 2010, there were approximately 500 employees who had retired from the Port and were in the Port’s retiree benefit plan. During the fiscal year ended June 30, 2010, the Port made payments of $5,073,000 on behalf of OPEB eligible retirees to third parties outside of CERBT. For fiscal year 2010, the CERBT had net investment earning of $1,500,000. Eligible Retirees Defined
Employees must have attained the age of fifty or over at the time of retirement, have five or more years of CALPERS service, and must be eligible to receive PERS retirement benefits in order to be classified as an Eligible Retiree.
Annual OPEB Cost and Net OPEB Obligation
The Port’s annual other post employment benefit (OPEB) cost is equal to (a) the annual required contribution (ARC) plus (b) one year’s interest on the beginning balance of the net OPEB obligation, and minus (c) an adjustment of the ARC. The ARC represents a level of funding that, if paid on an ongoing basis, is projected to cover the normal cost of each year and any unfunded actuarial liabilities (or funding excess) amortized over a period of thirty years.
The following table shows the components of the Port’s annual OPEB cost for the year, the amount contributed to the Plan, and changes in the Port’s net OPEB obligation (in thousands):
Annual required contribution $ 10,019
Interest on prior year net OPEB obligation 422
Adjustment to annual required contribution (422)
Annual OPEB cost 10,019
Contribution made (5,073) Decrease in net OPEB obligation 4,946
Net OPEB obligation - beginning of year 5,443
Net OPEB obligation - end of year $ 10,389

CITY OF OAKLAND Notes to Basic Financial Statements, (continued)
Year Ended June 30, 2010
108
The Port’s annual OPEB cost and net OPEB obligation are as follows (in thousands):
Fiscal Year Ended
Annual OPEB Cost
Percentage of Annual OPEB Cost
ContributedNet OPEB Obligation
06/30/08 11,683$ 34% 7,754$
06/30/09 10,019 123% 5,443
06/30/10 10,019 51% 10,389
Funding Status and Funding Progress
The unfunded actuarial accrued liability is being amortized as level percentage of expected payroll over 30 years. The table below indicated the funded status of the Plan as of January 1, 2009, the most recent actuarial valuation date (in thousands):
Actuarial accrued liability (AAL) 100,412$ Actuarial value of plan assets - Unfunded actuarial accrued liability (UAAL) 100,412$
Funded ratio (actuarial value of plan assets/AAL) 0%Annual covered payroll (active plan members) 48,400$ UAAL as a percentage of annual covered payroll 207%
GASB Statement No. 45 requires that the interest rate used to discount future benefits payments back to the present be based on the expected rate of return on any investments set aside to pay for these benefits. As of January 1, 2009 actuarial valuation, the Port intended to fully fund its OPEB liabilities by contributing the annual OPEB cost to the CERBT trust and used a discount rate of 7.75 percent for this valuation based on CalPERS’ expected return on assets held in the Port’s OPEB Trust.
For the year ended June 30, 2010, the Port funded its annual OPEB cost at 51 percent. However, if the Port used a lower discount rate of 4 percent to reflect a pay-as-you-go funding policy, the Port’s UAAL, as of January 1, 2009 actuarial valuation, would increase by approximately $68.4 million to $168.8 million and its annual OPEB cost would increase by $4.0 million to $14.0 million. The Port is currently evaluating its funding policy and its other economic actuarial assumptions in preparation for its January 1, 2011 actuarial valuation.
CITY OF OAKLAND Notes to Basic Financial Statements, (continued)
Year Ended June 30, 2010
109
Actuarial Methods and Assumptions The actuarial cost method used for determining the benefit obligations of the Port is the Entry Age Normal Cost Method. Under the principles of this method, the actuarial present value of the projected benefits of each individual included in the valuation is allocated as a level percentage of expected salary for each year of employment between entry age (defined as age at hire) and assumed exit. Actuarial valuations of an ongoing plan involve estimates of the value of reported amounts and assumptions about the probability of occurrence of events far into the future. Examples include assumptions about future employment, mortality, and the healthcare cost trend. Actuarially determined amounts are subject to continual revision as actual results are compared with past expectations and new estimates are made about the future. Projections of benefits for financial reporting purposes are based on the substantive plan in effect and include the types of benefits provided at the time of each valuation and the historical pattern of sharing of benefit costs between the employer and plan members to that point. The actuarial methods and assumptions used include techniques that are designed to reduce the effects of short-term volatility in actuarial accrued liabilities and the actuarial value of assets, consistent with the long-term perspective of the calculations. The actuarial assumptions used included a discount rate of 7.75%, and an annual health cost trend rate of 5% to 6.5% in health premiums. Annual salary increases were assumed at 3.25%. The demographic assumptions regarding turnover and retirement are based on statistics from reports for California PERS under a “2.7% @ 55” benefit schedule. The schedules presented as required supplementary information following the notes to the financial statements, present multiyear trend information. The Schedule of Funding Progress - Other Postemployment Benefits presents information about whether the actuarial values of plan assets are increasing or decreasing over time relative to the actuarial accrued liabilities for benefits.
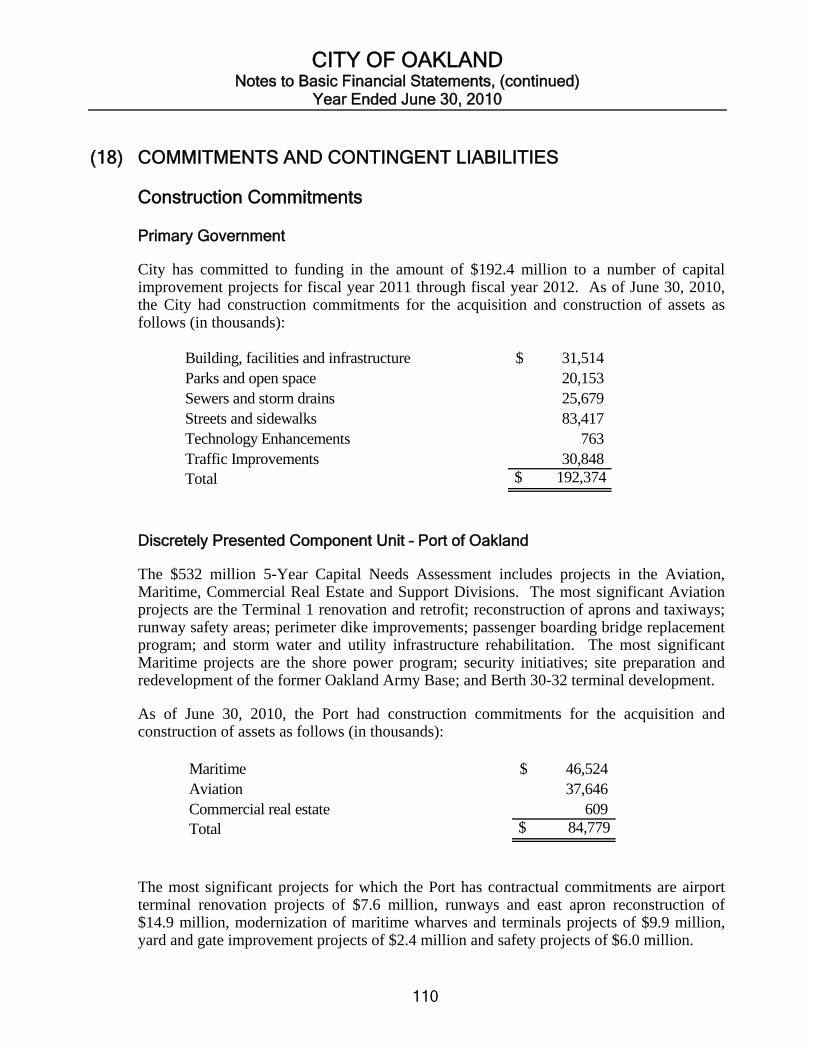
CITY OF OAKLAND Notes to Basic Financial Statements, (continued)
Year Ended June 30, 2010
110
(18) COMMITMENTS AND CONTINGENT LIABILITIES Construction Commitments Primary Government
City has committed to funding in the amount of $192.4 million to a number of capital improvement projects for fiscal year 2011 through fiscal year 2012. As of June 30, 2010, the City had construction commitments for the acquisition and construction of assets as follows (in thousands):
Building, facilities and infrastructure 31,514$ Parks and open space 20,153 Sewers and storm drains 25,679 Streets and sidewalks 83,417 Technology Enhancements 763 Traffic Improvements 30,848 Total $ 192,374
Discretely Presented Component Unit – Port of Oakland
The $532 million 5-Year Capital Needs Assessment includes projects in the Aviation, Maritime, Commercial Real Estate and Support Divisions. The most significant Aviation projects are the Terminal 1 renovation and retrofit; reconstruction of aprons and taxiways; runway safety areas; perimeter dike improvements; passenger boarding bridge replacement program; and storm water and utility infrastructure rehabilitation. The most significant Maritime projects are the shore power program; security initiatives; site preparation and redevelopment of the former Oakland Army Base; and Berth 30-32 terminal development.
As of June 30, 2010, the Port had construction commitments for the acquisition and construction of assets as follows (in thousands):
Maritime 46,524$ Aviation 37,646 Commercial real estate 609 Total $ 84,779
The most significant projects for which the Port has contractual commitments are airport terminal renovation projects of $7.6 million, runways and east apron reconstruction of $14.9 million, modernization of maritime wharves and terminals projects of $9.9 million, yard and gate improvement projects of $2.4 million and safety projects of $6.0 million.
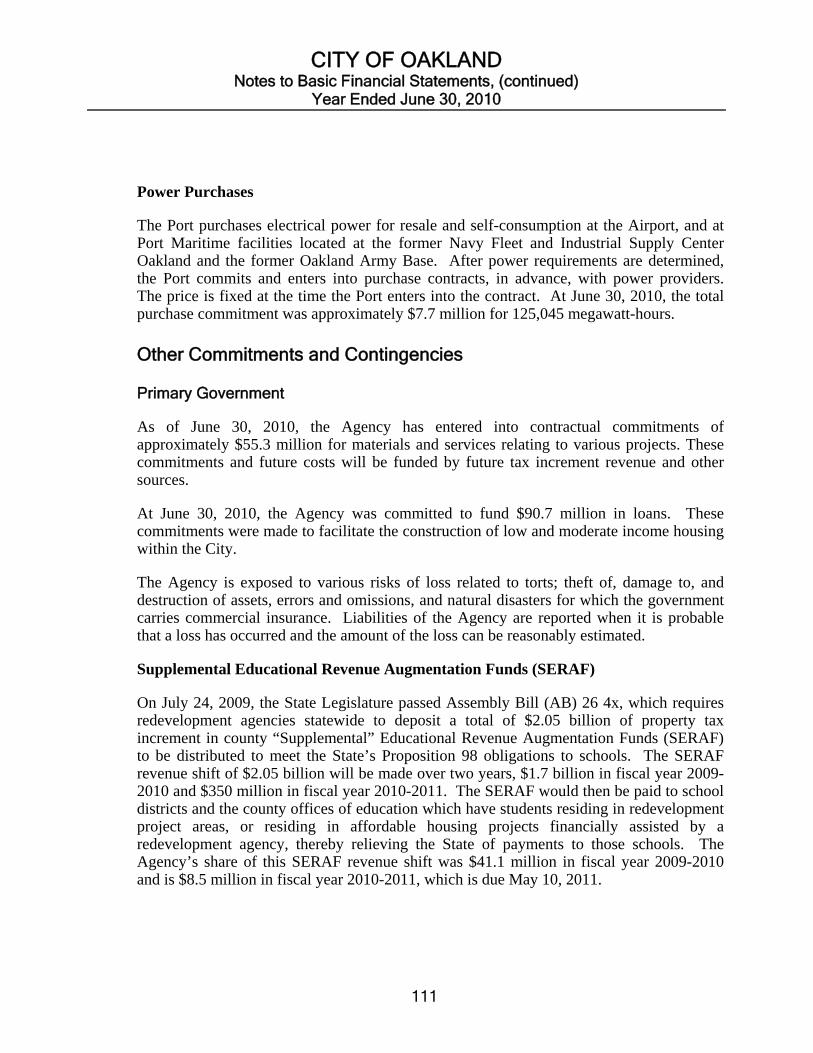
CITY OF OAKLAND Notes to Basic Financial Statements, (continued)
Year Ended June 30, 2010
111
Power Purchases
The Port purchases electrical power for resale and self-consumption at the Airport, and at Port Maritime facilities located at the former Navy Fleet and Industrial Supply Center Oakland and the former Oakland Army Base. After power requirements are determined, the Port commits and enters into purchase contracts, in advance, with power providers. The price is fixed at the time the Port enters into the contract. At June 30, 2010, the total purchase commitment was approximately $7.7 million for 125,045 megawatt-hours. Other Commitments and Contingencies Primary Government
As of June 30, 2010, the Agency has entered into contractual commitments of approximately $55.3 million for materials and services relating to various projects. These commitments and future costs will be funded by future tax increment revenue and other sources.
At June 30, 2010, the Agency was committed to fund $90.7 million in loans. These commitments were made to facilitate the construction of low and moderate income housing within the City.
The Agency is exposed to various risks of loss related to torts; theft of, damage to, and destruction of assets, errors and omissions, and natural disasters for which the government carries commercial insurance. Liabilities of the Agency are reported when it is probable that a loss has occurred and the amount of the loss can be reasonably estimated.
Supplemental Educational Revenue Augmentation Funds (SERAF)
On July 24, 2009, the State Legislature passed Assembly Bill (AB) 26 4x, which requires redevelopment agencies statewide to deposit a total of $2.05 billion of property tax increment in county “Supplemental” Educational Revenue Augmentation Funds (SERAF) to be distributed to meet the State’s Proposition 98 obligations to schools. The SERAF revenue shift of $2.05 billion will be made over two years, $1.7 billion in fiscal year 2009-2010 and $350 million in fiscal year 2010-2011. The SERAF would then be paid to school districts and the county offices of education which have students residing in redevelopment project areas, or residing in affordable housing projects financially assisted by a redevelopment agency, thereby relieving the State of payments to those schools. The Agency’s share of this SERAF revenue shift was $41.1 million in fiscal year 2009-2010 and is $8.5 million in fiscal year 2010-2011, which is due May 10, 2011.
CITY OF OAKLAND Notes to Basic Financial Statements, (continued)
Year Ended June 30, 2010
112
Wood Street Affordable Housing Project Environmental Remediation
The Wood Street Affordable Housing Project analytical results show concentrations of arsenic, lead, total petroleum hydrocarbons as diesel and polycyclic aromatic hydrocarbons in site soils and or ground water sample. As of June 30, 2010, environmental remediation clean up activities has not been completed yet. The Agency has set-aside $300 thousand in escrow to cover the remaining environmental obligations.
Oakland Army Base Environmental Remediation
Land held by the Oakland Army Base project area may be subject to environmental remediation as required by the Comprehensive Environmental Response, Compensation and Liability Act. If and when such environmental remediation is required, the Agency and the Port are responsible for the first $13.0 million of environmental remediation costs; including environmental remediation insurance. The Agency has received a federal grant of $13 million to pay for the above-mentioned environmental remediation costs including a $3.5 million insurance premium. As of June 30, 2010 the Agency has spent approximately $13.0 million on this project. $10.9 million has been reimbursed by the and the Agency is working with the U.S. Department of the Army on the remaining balance of $2.1 million.
The next $11.0 million of environmental remediation costs are to be shared equally by the Agency and the Port. As a result, the Agency reports its share of $5.5 million remediation obligation on the Oakland Army Base project. The next $9.0 million will be paid from insurance proceeds from the environmental remediation policy. If subsequent environmental remediation is required after the initially-required remediation is complete, then the environmental site liability policy will cover up to $30 million in additional environmental remediation-related costs. The Agency and the Port have agreed to share equally in any environmental remediation-related costs above $21 million that are not covered by insurance.
The Agency management believes that none of the estimated environmental remediation costs will cause the recorded amounts of any properties held for resale to exceed their estimated net realizable values.
Discretely Presented Component Unit – Port of Oakland
The Port is required to comply with a number of federal, state and local laws and regulations designed to protect human health, safety and the environment. In conforming to these laws and the implementing regulations, the Port has instituted a number of compliance programs and procedures.
It is the Port’s intent that its environmental compliance programs be compliant with regulatory and legal requirements while effectively managing financial resources.
The Port’s financial statements include liabilities, established and adjusted periodically, based on new information, in accordance with applicable generally accepted accounting
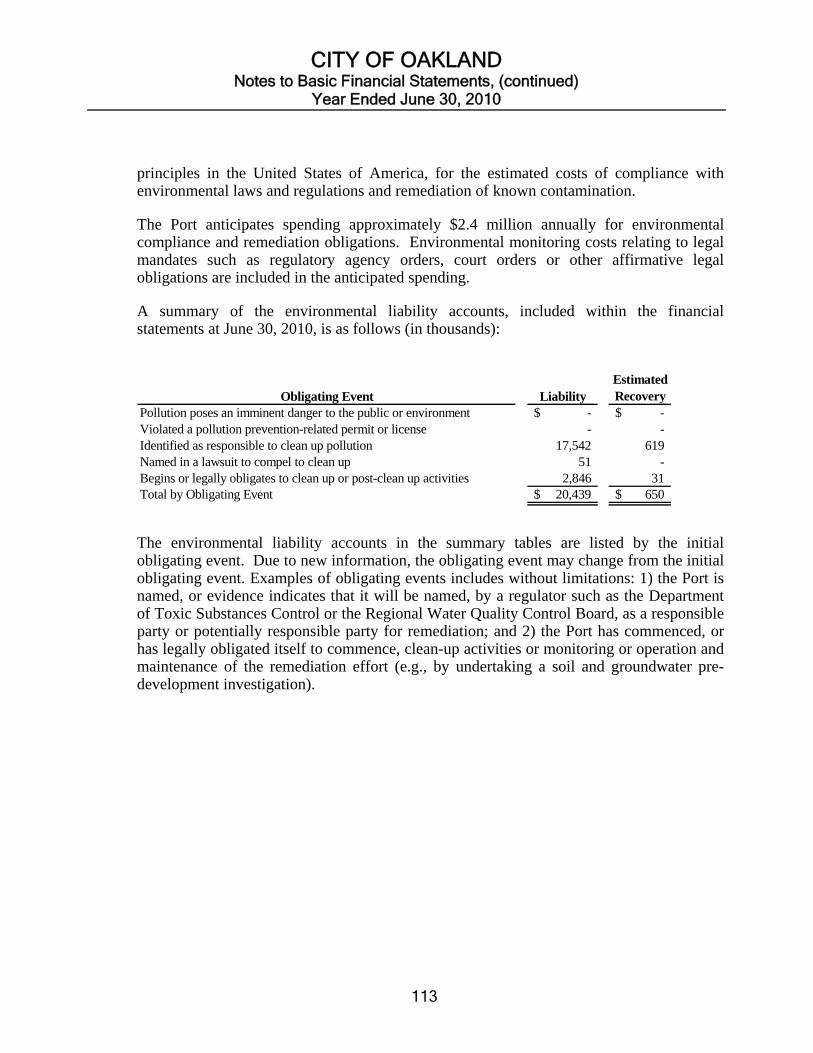
CITY OF OAKLAND Notes to Basic Financial Statements, (continued)
Year Ended June 30, 2010
113
principles in the United States of America, for the estimated costs of compliance with environmental laws and regulations and remediation of known contamination.
The Port anticipates spending approximately $2.4 million annually for environmental compliance and remediation obligations. Environmental monitoring costs relating to legal mandates such as regulatory agency orders, court orders or other affirmative legal obligations are included in the anticipated spending.
A summary of the environmental liability accounts, included within the financial statements at June 30, 2010, is as follows (in thousands):
Obligating Event LiabilityEstimated Recovery
Pollution poses an imminent danger to the public or environment -$ -$ Violated a pollution prevention-related permit or license - - Identified as responsible to clean up pollution 17,542 619 Named in a lawsuit to compel to clean up 51 - Begins or legally obligates to clean up or post-clean up activities 2,846 31 Total by Obligating Event 20,439$ 650$
The environmental liability accounts in the summary tables are listed by the initial obligating event. Due to new information, the obligating event may change from the initial obligating event. Examples of obligating events includes without limitations: 1) the Port is named, or evidence indicates that it will be named, by a regulator such as the Department of Toxic Substances Control or the Regional Water Quality Control Board, as a responsible party or potentially responsible party for remediation; and 2) the Port has commenced, or has legally obligated itself to commence, clean-up activities or monitoring or operation and maintenance of the remediation effort (e.g., by undertaking a soil and groundwater pre-development investigation).
CITY OF OAKLAND Notes to Basic Financial Statements, (continued)
Year Ended June 30, 2010
114
(19) TRANSACTIONS WITH THE FOX OAKLAND THEATER, INC. (“FOT”) DEVELOPMENT
FOT is a Internal Revenue Code section 501(C)(3) organization set up by and for the benefit of the Agency and the City set up to renovate the Fox Theater. The Agency transferred the Fox Theater property to FOT in August 2006 through a long-term lease and a Disposition and Development Agreement (“DDA”) which included a $25.5 million loan. The Fox Theater property was held by the Agency as property held for resale. During 2008, the property was transferred to FOT as a long-term capital lease which was valued at $6.5 million in the lease and DDA. All FOT board members are City employees and FOT has no staff. FOT set up a for profit entity, Fox Theater Manager, Inc (“FT Manager”), and then two LLCs managed by FT Manager, Fox Theater Landlord LLC and Fox Theater Master Tenant LLC. These new entities were used to syndicate Historic and New Markets Tax Credits. The Fox Theater property was transferred to the LLCs in December 2006, but the loan remains with FOT and is secured by a pledge and assignment of borrowers ninety nine and nine-tenths percent (99.9%) interests in the Community Development Entities (CDEs) loans entered into between FOT and Fox Oakland Investment Fund (FOIF).
The outstanding principal balance of the FOT loan shall accrue interest at the rate of 2.5 percent, commencing on the date of disbursement and compounded annually, which will only be payable to the extent of borrower’s net cash flow from operations. The loan terminates at the end of ten years unless the borrower defaults on the agreement in which case the lender declares an acceleration of the maturity.
In FY 2009-10 the Agency loaned an additional $1.4 million to Fox Theater Master Tenant LLC to complete the project. The $1.4 million Fox Theater Master Tenant LLC loan has a 15 year term. The Agency also provided an additional loan of $2.0 million to Fox Oakland Theater Inc.
CITY OF OAKLAND Notes to Basic Financial Statements, (continued)
Year Ended June 30, 2010
115
(20) DEFICIT FUND BALANCES/NET ASSETS AND EXPENDITURES OVER BUDGET
As of June 30, 2010, the following funds reported deficits in fund balance/net assets (in thousands):
Special Revenue: ORA Projects (1,114)$ Landscape & Lighting Assessment District (4,620)
Capital Project Fund : Emergency Services (52)
The ORA projects fund deficit is expected to be cured by reimbursements from the Agency. The State Gas Tax, the Landscape & Lighting Assessment District and Emergency Services will be cleared by future revenues.
Internal Service: Facilities (28,648)$ Equipment (1,768) Central Stores (4,524) Purchasing (948) Reproduction (98)
The City’s facilities, equipment, central stores and radio funds deficits are expected to be funded through increased user charges for future years. During the 2009-11 Budget, the City revised the repayment plan for the internal service funds to eliminate the funds net assets deficit by 2019. In addition, the City adopted a financial policy that requires half of one-time revenues to be used to eliminate negative internal service fund balances and half be used to pay off other negative funds balances. As of June 30, 2010, the following fund reported expenditures in excess of budgets (in thousands):
Debt Service Fund: Other Assessment Bonds (26)$
The excess of expenditures over budget in Other Assessment Bonds is primarily attributed to administrative and commission costs associated with property tax collection and levy.
CITY OF OAKLAND Notes to Basic Financial Statements, (continued)
Year Ended June 30, 2010
116
(21) SUBSEQUENT EVENTS
Tax and Revenue Anticipation Notes On July 8, 2010, the City closed the 2010-2011 Tax and Revenue Anticipation Notes (the “Notes”) in the principal amount of $100,000,000 with maturity date of March 30, 2011 and June 15, 2011. The Notes are tax-exempt with interest rate of 2.0% on both maturities. The Notes were issued to finance General Fund expenditures, including but not limited to, current expenses, capital expenditures and the discharge of other obligations of the City. The notes will mature on July 8, 2011. Broadway/Macarthur/San Pablo Redevelopment Project Second Lien Tax Allocation Bonds, Series 2010-T (Federally Taxable Recovery Zone Economic Development Bonds) On November 12, 2010, the Redevelopment Agency of the City of Oakland (the “Agency”) closed the Broadway/MacArthur/San Pablo Development Project Second Lien Tax Allocation Bonds, Series 2010-T (Federally Taxable Recovery Zone Economic Development Bonds-Direct Payment) (the “Bonds”) in the principal amount of $7,390,000 with a maturity dates of September 1, 2030 and September 1, 2040. The Bonds are taxable with an interest rates of 7.20% and 7.40% respectively. The Bonds were issued through the American Recovery and Reinvestment Act of 2009, to finance certain redevelopment activities within or to the benefit of the Agency’s Broadway/MacArthur/San Pablo Redevelopment Project Area. The Agency expects to receive $6.2 million or 45% interest subsidy from the federal government as part of the bond issue.

REQUIRED SUPPLEMENTARY INFORMATION
CITY OF OAKLAND Required Supplementary Information
June 30, 2010
117
PERS ACTUARIAL VALUATION
SCHEDULE OF FUNDING PROGRESS
The schedule of funding progress below shows the recent history of the actuarial value of assets, actuarial accrued liability,
their relationship, and the relationship of the unfunded actuarial accrued liability to payroll. The required contribution was determined as part of the actuarial valuation using the entry age normal actuarial cost method.
Unfunded Actuarial Actuarial (Overfunded) UAAL as aAccrued Value of AAL Funded Covered percent of
Valuation Liability (AAL) Assets (UAAL) Ratio Payroll Covered PayrollDate (a) (b) (a-b) (b)/(a) (c) ((a-b) / c)
7/1/2007 989,095,209$ 757,340,889$ 231,754,320$ 76.6% 127,434,797$ 181.9%7/1/2008 1,084,370,034 829,712,579 254,657,455 76.5% 138,606,908 183.7%7/1/2009 1,194,359,091 888,250,432 306,108,659 74.4% 150,306,150 203.7%
Public Safety Retirement Plan (Police and Fire)
Unfunded Actuarial Actuarial (Overfunded) UAAL as aAccrued Value of AAL Funded Covered percent of
Valuation Liability (AAL) Assets (UAAL) Ratio Payroll Covered PayrollDate (a) (b) (a-b) (b)/(a) (c) ((a-b) / c)
7/1/2007 1,617,214,275$ 1,353,435,664$ 263,778,611$ 83.7% 225,726,055$ 116.9%7/1/2008 1,727,976,732 1,445,373,281 282,603,451 83.6% 237,455,347 119.0%7/1/2009 1,876,286,272 1,505,314,108 370,972,164 80.2% 224,759,546 165.1%
Miscellaneous Retirement Plan
Unfunded Actuarial Actuarial (Overfunded) UAAL as aAccrued Value of AAL Funded Covered percent of
Valuation Liability (AAL) Assets (UAAL) Ratio Payroll Covered PayrollDate (a) (b) (a-b) (b)/(a) (c) ((a-b) / c)
7/1/2008 591,575,250$ -$ 591,575,250$ 0.0% 304,875,561$ 194.0%
City Other Post Employment Benefits (OPEB)
Unfunded Actuarial Actuarial (Overfunded) UAAL as aAccrued Value of AAL Funded Covered percent of
Valuation Liability (AAL) Assets (UAAL) Ratio Payroll Covered PayrollDate (a) (b) (a-b) (b)/(a) (c) ((a-b) / c)
1/1/2007 143,594,000$ -$ 143,594,000$ 0.0% 49,400,000$ 291%
1/1/2009 100,412,000 - 100,412,000 0.0% 48,400,000 207%
Port of Oakland Post Employment Benefits (OPEB)

CITY OF OAKLAND Required Supplementary Information
June 30, 2010
118
PERS ACTUARIAL VALUATION
SCHEDULE OF FUNDING PROGRESS
Unfunded Actuarial Actuarial (Overfunded) UAAL as aAccrued Value of AAL Funded Covered percent of
Valuation Liability (AAL) Assets (UAAL) Ratio Payroll Covered PayrollDate (a) (b) (a-b) (b)/(a) (c) ((a-b) / c)
7/1/2007 * 7,516,000$ 9,371,000$ (1,855,000)$ 124.7% -$ N/A
7/1/2009 * 5,499,000 4,981,000 518,000 90.6% - N/A
7/1/2010 * 5,471,000 4,728,000 743,000 86.4% - N/A
Oakland Municipal Employees' Retirement System - Pension
* The decline in the funded ratio was primarily due to explicit recognition of future administrative expenses in the Plan’s actuarial accrued liability. The entry age normal cost method was used for disclosure and annual required contribution rates starting with July 1, 2009 valuation.
Unfunded Actuarial Actuarial (Overfunded) UAAL as aAccrued Value of AAL Funded Covered percent of
Valuation Liability (AAL) Assets (UAAL) Ratio Payroll Covered PayrollDate (a) (b) (a-b) (b)/(a) (c) ((a-b) / c)
7/1/2007 ** 888,100,000$ 566,000,000$ 322,100,000$ 63.7% 400,000$ 80525%
7/1/2009 ** 782,500,000 347,200,000 435,300,000 44.4% 100,000 435300%
7/1/2010 ** 792,200,000 297,800,000 494,400,000 37.6% 100,000 494400%
Oakland Police and Fire Retirement System - Pension
** The decline in the funded ratio was primarily due to implementation of a smoothed market value asset valuation method and strengthening of mortality and cost of living increase assumptions.
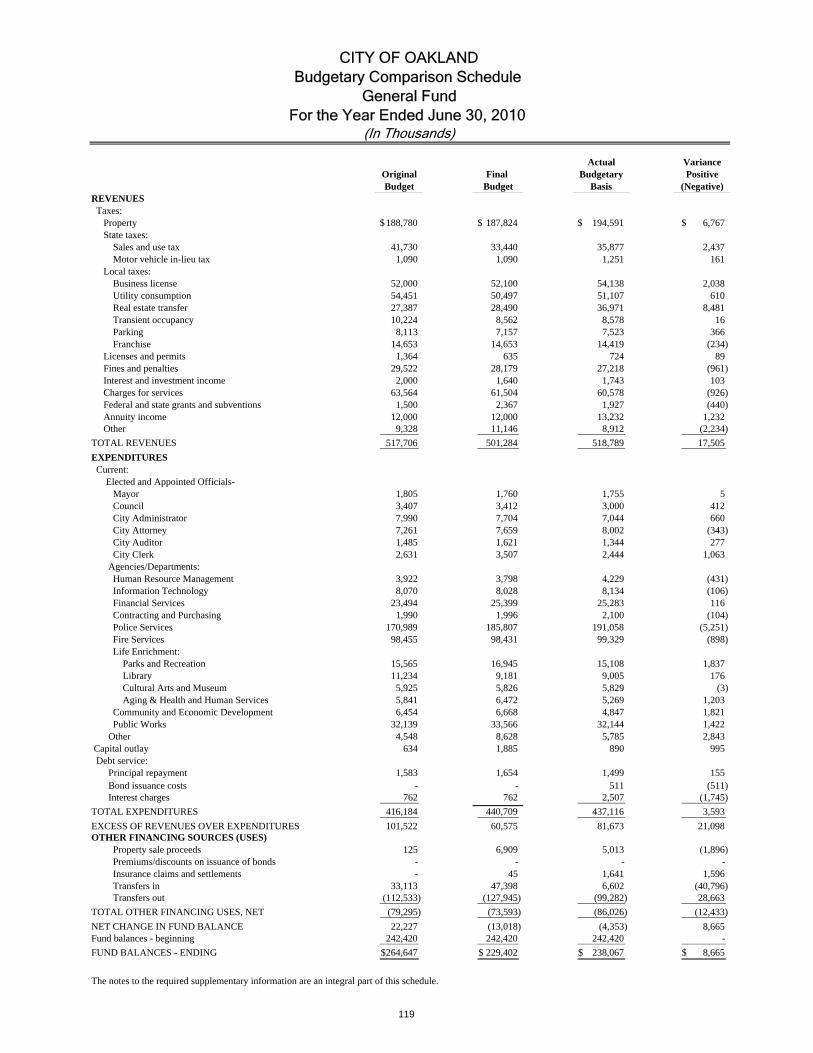
ActualOriginal Final BudgetaryBudget Budget Basis
REVENUES Taxes: Property 188,780$ 187,824$ 194,591$ 6,767$ State taxes:
Sales and use tax 41,730 33,440 35,877 2,437 Motor vehicle in-lieu tax 1,090 1,090 1,251 161
Local taxes:Business license 52,000 52,100 54,138 2,038 Utility consumption 54,451 50,497 51,107 610 Real estate transfer 27,387 28,490 36,971 8,481 Transient occupancy 10,224 8,562 8,578 16 Parking 8,113 7,157 7,523 366 Franchise 14,653 14,653 14,419 (234)
Licenses and permits 1,364 635 724 89 Fines and penalties 29,522 28,179 27,218 (961) Interest and investment income 2,000 1,640 1,743 103 Charges for services 63,564 61,504 60,578 (926) Federal and state grants and subventions 1,500 2,367 1,927 (440) Annuity income 12,000 12,000 13,232 1,232 Other 9,328 11,146 8,912 (2,234)
TOTAL REVENUES 517,706 501,284 518,789 17,505
EXPENDITURES Current: Elected and Appointed Officials-
Mayor 1,805 1,760 1,755 5 Council 3,407 3,412 3,000 412 City Administrator 7,990 7,704 7,044 660 City Attorney 7,261 7,659 8,002 (343) City Auditor 1,485 1,621 1,344 277 City Clerk 2,631 3,507 2,444 1,063
Agencies/Departments:Human Resource Management 3,922 3,798 4,229 (431) Information Technology 8,070 8,028 8,134 (106) Financial Services 23,494 25,399 25,283 116 Contracting and Purchasing 1,990 1,996 2,100 (104) Police Services 170,989 185,807 191,058 (5,251) Fire Services 98,455 98,431 99,329 (898) Life Enrichment: Parks and Recreation 15,565 16,945 15,108 1,837 Library 11,234 9,181 9,005 176 Cultural Arts and Museum 5,925 5,826 5,829 (3) Aging & Health and Human Services 5,841 6,472 5,269 1,203 Community and Economic Development 6,454 6,668 4,847 1,821 Public Works 32,139 33,566 32,144 1,422
Other 4,548 8,628 5,785 2,843 Capital outlay 634 1,885 890 995 Debt service: Principal repayment 1,583 1,654 1,499 155 Bond issuance costs - - 511 (511) Interest charges 762 762 2,507 (1,745)
TOTAL EXPENDITURES 416,184 440,709 437,116 3,593
EXCESS OF REVENUES OVER EXPENDITURES 101,522 60,575 81,673 21,098 OTHER FINANCING SOURCES (USES)
Property sale proceeds 125 6,909 5,013 (1,896) Premiums/discounts on issuance of bonds - - - - Insurance claims and settlements - 45 1,641 1,596 Transfers in 33,113 47,398 6,602 (40,796) Transfers out (112,533) (127,945) (99,282) 28,663
TOTAL OTHER FINANCING USES, NET (79,295) (73,593) (86,026) (12,433)
NET CHANGE IN FUND BALANCE 22,227 (13,018) (4,353) 8,665 Fund balances - beginning 242,420 242,420 242,420 -
FUND BALANCES - ENDING 264,647$ 229,402$ 238,067$ 8,665$
The notes to the required supplementary information are an integral part of this schedule.
(Negative)Positive
Variance
CITY OF OAKLAND
(In Thousands)
Budgetary Comparison Schedule
For the Year Ended June 30, 2010General Fund
119
CITY OF OAKLAND Notes to Required Supplementary Information
June 30, 2010
120
(1) BUDGETARY DATA
In accordance with the provisions of the City Charter, the City prepares and adopts a budget on or before June 30 for each fiscal year. The City Charter prohibits expending funds for which there is no legal appropriation. Therefore, the City is required to adopt budgets for all City funds. Prior to July 1, the original adopted budget is finalized through the passage of a resolution by the City Council. The level of legal budgetary control by the City Council is established at the fund level. For management purposes, the budget is controlled at the departmental level of expenditure within funds. In June 2009, the City Council approved the City’s two-year budget for fiscal years 2010 and 2011. Although appropriations are adopted for a 24-month period, they are divided into two one-year spending plans. Agencies/departments ending the first year with budgetary non-project surplus, according to Council policy, will be allowed to carry-forward 1/3 for their operating budget, 1/3 for their capital spending, and 1/3 for reverting to the General Fund balance. The final budgetary data presented in the required supplementary information reflects approved changes to the original 2009-10 budget. Certain projects are appropriated on a multi-year rather than annual basis. If such projects or programs are not completed at the end of the fiscal year, unexpended appropriations are carried forward to the following year with the approval of the City Administrator. Transfers of appropriations between funds must be approved by the City Council. Supplemental appropriations financed by unanticipated revenues must be approved by the City Council. Transfers of appropriations between projects within the same fund must be approved by the City Administrator. Final budget amounts reported in the required supplementary information reflect both the appropriation changes approved by the City Council and the transfers approved by the City Administrator.
CITY OF OAKLAND Notes to Required Supplementary Information
June 30, 2010
121
Budgetary Basis of Accounting The City adopts budgets each fiscal year on a basis of accounting which is substantially the same as GAAP except for certain investment earnings. Certain funds of the City contain capital projects, grant projects, loan programs or other programs that are budgeted on a multi-year basis. The amounts of the projects and programs budgeted on a multi-year basis are significant compared to the items budgeted on an annual basis; therefore, a comparison of budget to actual for the fund would not be meaningful. As a result, such funds that are excluded from budgetary reporting are:
Major Funds Federal and State Grants Oakland Redevelopment Agency Municipal Capital Improvement Nonmajor Funds Special Revenue Funds ORA Projects Parks, Recreation and Cultural
While the City adopts budgets for all funds, the budget to actual comparisons for proprietary and fiduciary funds are not presented because some projects and programs are adopted on a multi-year basis.
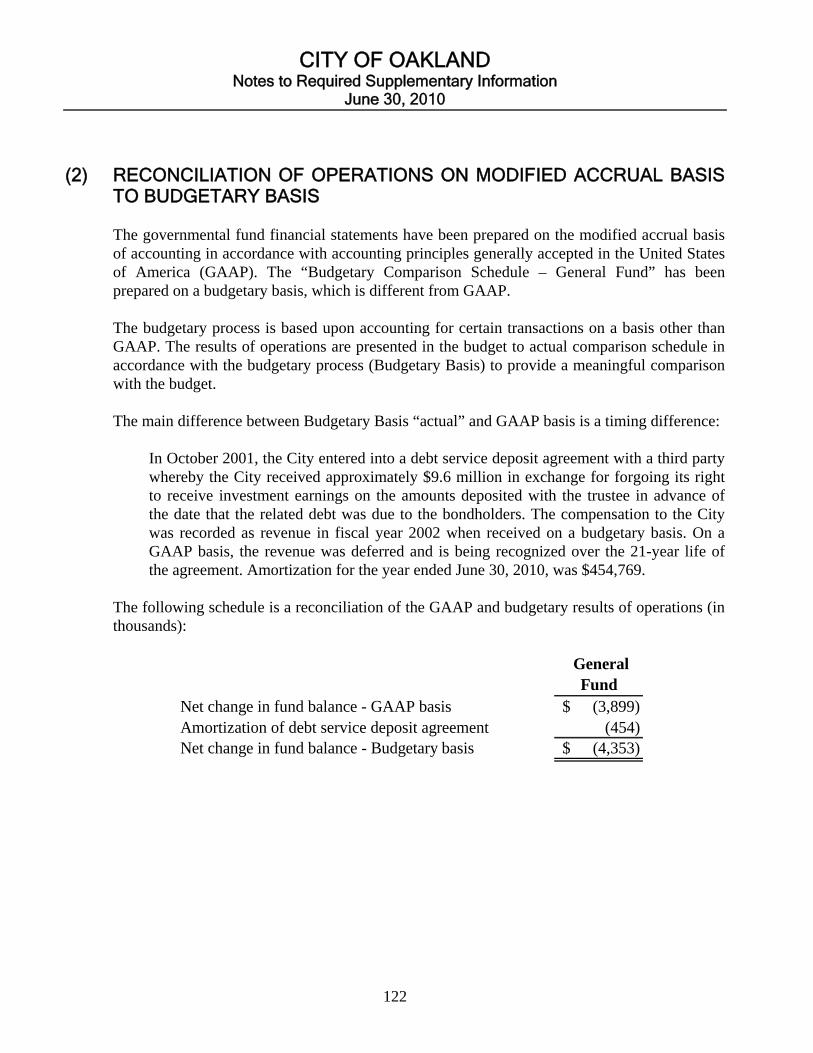
CITY OF OAKLAND Notes to Required Supplementary Information
June 30, 2010
122
(2) RECONCILIATION OF OPERATIONS ON MODIFIED ACCRUAL BASIS TO BUDGETARY BASIS The governmental fund financial statements have been prepared on the modified accrual basis of accounting in accordance with accounting principles generally accepted in the United States of America (GAAP). The “Budgetary Comparison Schedule – General Fund” has been prepared on a budgetary basis, which is different from GAAP. The budgetary process is based upon accounting for certain transactions on a basis other than GAAP. The results of operations are presented in the budget to actual comparison schedule in accordance with the budgetary process (Budgetary Basis) to provide a meaningful comparison with the budget. The main difference between Budgetary Basis “actual” and GAAP basis is a timing difference: In October 2001, the City entered into a debt service deposit agreement with a third party
whereby the City received approximately $9.6 million in exchange for forgoing its right to receive investment earnings on the amounts deposited with the trustee in advance of the date that the related debt was due to the bondholders. The compensation to the City was recorded as revenue in fiscal year 2002 when received on a budgetary basis. On a GAAP basis, the revenue was deferred and is being recognized over the 21-year life of the agreement. Amortization for the year ended June 30, 2010, was $454,769.
The following schedule is a reconciliation of the GAAP and budgetary results of operations (in thousands):
General Fund
Net change in fund balance - GAAP basis (3,899)$ Amortization of debt service deposit agreement (454) Net change in fund balance - Budgetary basis (4,353)$
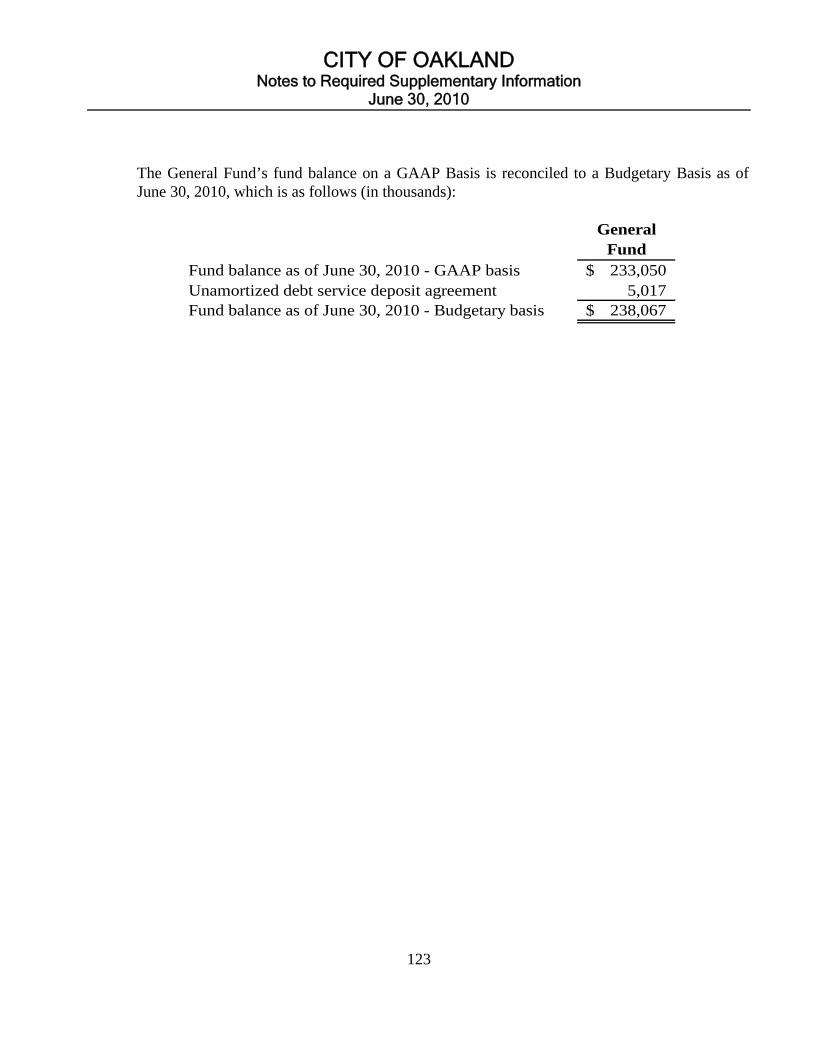
CITY OF OAKLAND Notes to Required Supplementary Information
June 30, 2010
123
The General Fund’s fund balance on a GAAP Basis is reconciled to a Budgetary Basis as of June 30, 2010, which is as follows (in thousands):
General Fund
Fund balance as of June 30, 2010 - GAAP basis 233,050$ Unamortized debt service deposit agreement 5,017 Fund balance as of June 30, 2010 - Budgetary basis 238,067$

124
This page left intentionally blank.

FEDERAL AWARDS PROGRAMS

125
The Honorable Mayor and Members of the City Council City of Oakland, California
Independent Auditor’s Report On Internal Control Over Financial Reporting and On Compliance and Other Matters Based On An Audit of Financial Statements Performed
In Accordance with Government Auditing Standards
We have audited the financial statements of the governmental activities, the business-type activities, the discretely presented component unit, each major fund, and the aggregate remaining fund information of the City of Oakland, California (City), as of and for the year ended June 30, 2010, which collectively comprise the City’s basic financial statements and have issued our report thereon dated December 8, 2010. Our report includes a reference to other auditors. Our report also contained an explanatory paragraph describing the City’s adoption of the provisions of Governmental Accounting Standards Board (GASB) Statement No. 51, Accounting and Financial Reporting for Intangible Assets, and GASB Statement No. 53, Accounting and Financial Reporting for Derivative Instruments, effective July 1, 2009. We conducted our audit in accordance with auditing standards generally accepted in the United States of America and the standards applicable to financial audits contained in Government Auditing Standards, issued by the Comptroller General of the United States. Other auditors audited the financial statements of the Oakland Municipal Employees Retirement System (OMERS) and the Oakland Police and Fire Retirement System (PFRS) which collectively represent 57%, 69% and 16%, respectively, of the assets, net assets/fund balances, and revenues/additions of the aggregate remaining fund information as of and for the year ended June 30, 2010 as described in our report on the City’s financial statements. The financial statements of OMERS and PFRS were not audited in accordance with Government Auditing Standards. Internal Control Over Financial Reporting In planning and performing our audit, we considered the City’s internal control over financial reporting as a basis for designing our auditing procedures for the purpose of expressing our opinions on the financial statements, but not for the purpose of expressing an opinion on the effectiveness of the City’s internal control over financial reporting. Accordingly, we do not express an opinion on the effectiveness of the City’s internal control over financial reporting. A deficiency in internal control exists when the design or operation of a control does not allow management or employees, in the normal course of performing their assigned functions, to prevent, or detect and correct misstatements on a timely basis. A material weakness is a deficiency, or combination of deficiencies, in internal control such that there is a reasonable possibility that a material misstatement of the entity’s financial statements will not be prevented, or detected and corrected on a timely basis.

126
Our consideration of internal control over financial reporting was for the limited purpose described in the first paragraph of this section and was not designed to identify all deficiencies in internal control over financial reporting that might be deficiencies, significant deficiencies or material weaknesses. We did not identify any deficiencies in internal control over financial reporting that we consider to be material weaknesses, as defined above. However, we identified certain deficiencies in internal control over financial reporting, described in the accompanying schedule of findings and questioned costs that we consider to be significant deficiencies in internal control over financial reporting (2010-1, 2010-2 and 2010-3). A significant deficiency is a deficiency, or a combination of deficiencies, in internal control that is less severe than a material weakness, yet important enough to merit attention by those charged with governance. Compliance and Other Matters As part of obtaining reasonable assurance about whether the City’s financial statements are free of material misstatement, we performed tests of its compliance with certain provisions of laws, regulations, contracts, and grant agreements, noncompliance with which could have a direct and material effect on the determination of financial statement amounts. However, providing an opinion on compliance with those provisions was not an objective of our audit, and accordingly, we do not express such an opinion. The results of our tests disclosed no instances of noncompliance or other matters that are required to be reported under Government Auditing Standards. We noted certain matters that we reported to management of the City in a separate letter dated December 8, 2010. The City’s response to the findings identified in our audit is described in the accompanying schedule of findings and questioned costs. We did not audit the City’s response and, accordingly, we express no opinion on it. This report is intended solely for the information and use of the Finance and Management Committee, management, City Council, and federal awarding agencies and pass-through entities and is not intended to be and should not be used by anyone other than these specified parties. Certified Public Accountants Oakland, California December 8, 2010

127
The Honorable Mayor and Members of the City Council of Oakland City of Oakland, California
Independent Auditor’s Report On Compliance With Requirements That Could Have a Direct and Material Effect on Each Major Program and
On Internal Control Over Compliance In Accordance With OMB Circular A-133 Compliance We have audited the City of Oakland’s (the City) compliance with the types of compliance requirements described in the OMB Circular A-133 Compliance Supplement that could have a direct and material effect on each of the City’s major federal programs for the year ended June 30, 2010. The City’s major federal programs are identified in the summary of auditor’s results section of the accompanying schedule of findings and questioned costs. Compliance with the requirements of laws, regulations, contracts and grants applicable to each of its major federal programs is the responsibility of the City’s management. Our responsibility is to express an opinion on the City’s compliance based on our audit. The City’s basic financial statements include the operations of the Port of Oakland (Port), which expended $18,404,196 in federal awards, which are not included in the accompanying schedule of expenditures of federal awards for the year ended June 30, 2010. Our audit of compliance, described below, did not include the operations of the Port because we audited and reported on the Port’s compliance in accordance with OMB Circular A-133 separately. We conducted our audit of compliance in accordance with auditing standards generally accepted in the United States of America; the standards applicable to financial audits contained in Government Auditing Standards, issued by the Comptroller General of the United States; and OMB Circular A-133, Audits of States, Local Governments, and Non-Profit Organizations. Those standards and OMB Circular A-133 require that we plan and perform the audit to obtain reasonable assurance about whether noncompliance with the types of compliance requirements referred to above that could have a direct and material effect on a major federal program occurred. An audit includes examining, on a test basis, evidence about the City’s compliance with those requirements and performing such other procedures as we considered necessary in the circumstances. We believe that our audit provides a reasonable basis for our opinion. Our audit does not provide a legal determination of the City’s compliance with those requirements. In our opinion, the City complied, in all material respects, with the requirements referred to above that could have a direct and material effect on each of its major federal programs for the year ended June 30, 2010.
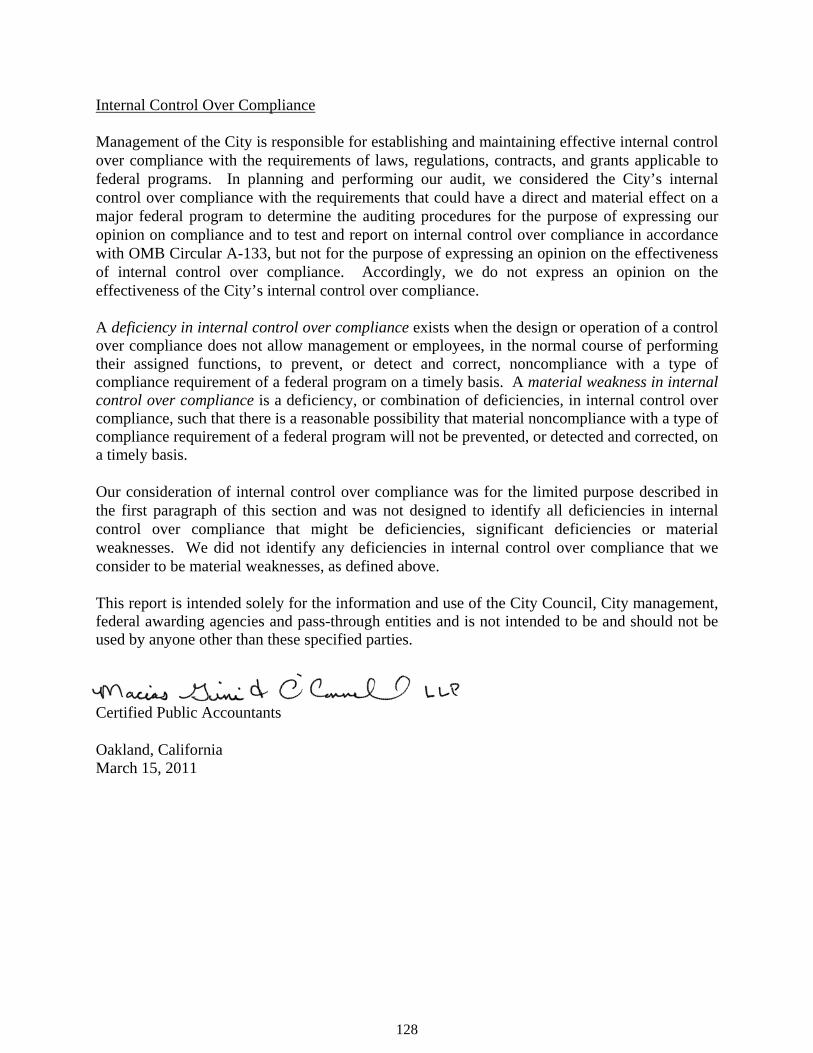
128
Internal Control Over Compliance Management of the City is responsible for establishing and maintaining effective internal control over compliance with the requirements of laws, regulations, contracts, and grants applicable to federal programs. In planning and performing our audit, we considered the City’s internal control over compliance with the requirements that could have a direct and material effect on a major federal program to determine the auditing procedures for the purpose of expressing our opinion on compliance and to test and report on internal control over compliance in accordance with OMB Circular A-133, but not for the purpose of expressing an opinion on the effectiveness of internal control over compliance. Accordingly, we do not express an opinion on the effectiveness of the City’s internal control over compliance. A deficiency in internal control over compliance exists when the design or operation of a control over compliance does not allow management or employees, in the normal course of performing their assigned functions, to prevent, or detect and correct, noncompliance with a type of compliance requirement of a federal program on a timely basis. A material weakness in internal control over compliance is a deficiency, or combination of deficiencies, in internal control over compliance, such that there is a reasonable possibility that material noncompliance with a type of compliance requirement of a federal program will not be prevented, or detected and corrected, on a timely basis. Our consideration of internal control over compliance was for the limited purpose described in the first paragraph of this section and was not designed to identify all deficiencies in internal control over compliance that might be deficiencies, significant deficiencies or material weaknesses. We did not identify any deficiencies in internal control over compliance that we consider to be material weaknesses, as defined above. This report is intended solely for the information and use of the City Council, City management, federal awarding agencies and pass-through entities and is not intended to be and should not be used by anyone other than these specified parties. Certified Public Accountants Oakland, California March 15, 2011
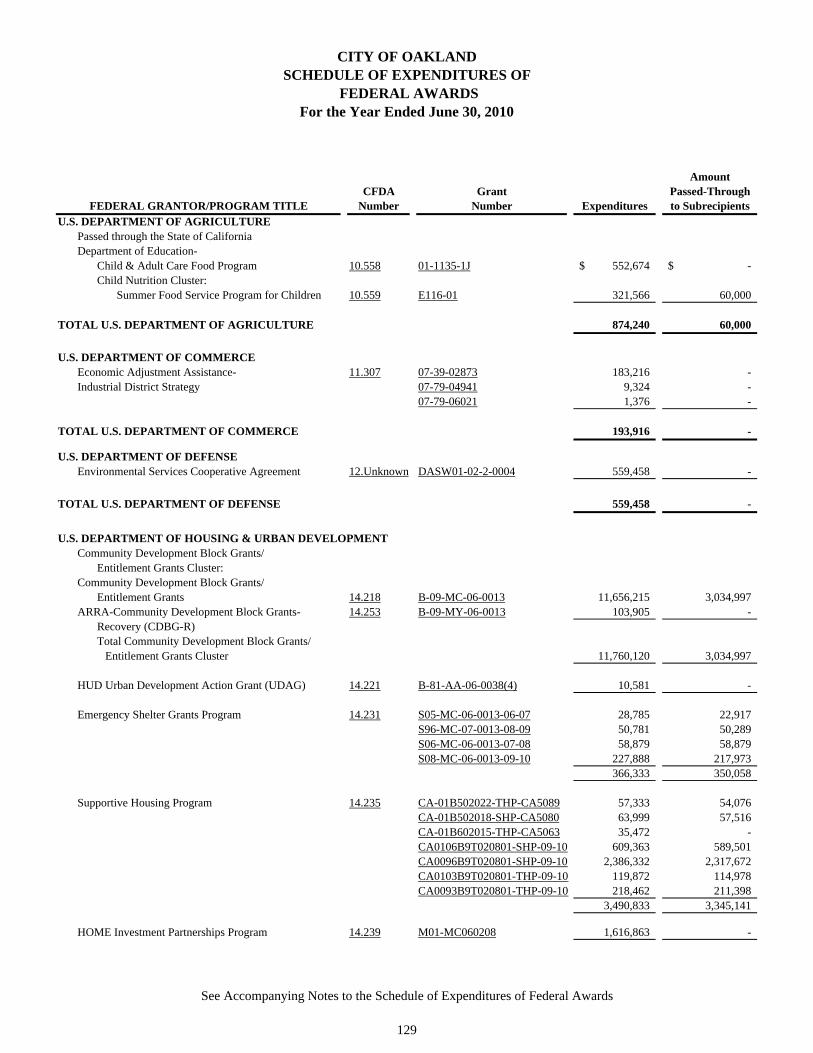
CITY OF OAKLANDSCHEDULE OF EXPENDITURES OF
FEDERAL AWARDSFor the Year Ended June 30, 2010
AmountCFDA Grant Passed-Through
Number Number Expenditures to SubrecipientsU.S. DEPARTMENT OF AGRICULTURE
Passed through the State of CaliforniaDepartment of Education-
Child & Adult Care Food Program 10.558 01-1135-1J 552,674$ -$ Child Nutrition Cluster:
Summer Food Service Program for Children 10.559 E116-01 321,566 60,000
TOTAL U.S. DEPARTMENT OF AGRICULTURE 874,240 60,000
U.S. DEPARTMENT OF COMMERCEEconomic Adjustment Assistance- 11.307 07-39-02873 183,216 - Industrial District Strategy 07-79-04941 9,324 -
07-79-06021 1,376 -
TOTAL U.S. DEPARTMENT OF COMMERCE 193,916 -
U.S. DEPARTMENT OF DEFENSEEnvironmental Services Cooperative Agreement 12.Unknown DASW01-02-2-0004 559,458 -
TOTAL U.S. DEPARTMENT OF DEFENSE 559,458 -
U.S. DEPARTMENT OF HOUSING & URBAN DEVELOPMENTCommunity Development Block Grants/
Entitlement Grants Cluster:Community Development Block Grants/
Entitlement Grants 14.218 B-09-MC-06-0013 11,656,215 3,034,997 ARRA-Community Development Block Grants- 14.253 B-09-MY-06-0013 103,905 -
Recovery (CDBG-R)Total Community Development Block Grants/
Entitlement Grants Cluster 11,760,120 3,034,997
HUD Urban Development Action Grant (UDAG) 14.221 B-81-AA-06-0038(4) 10,581 -
Emergency Shelter Grants Program 14.231 S05-MC-06-0013-06-07 28,785 22,917 S96-MC-07-0013-08-09 50,781 50,289 S06-MC-06-0013-07-08 58,879 58,879 S08-MC-06-0013-09-10 227,888 217,973
366,333 350,058
Supportive Housing Program 14.235 CA-01B502022-THP-CA5089 57,333 54,076 CA-01B502018-SHP-CA5080 63,999 57,516 CA-01B602015-THP-CA5063 35,472 - CA0106B9T020801-SHP-09-10 609,363 589,501 CA0096B9T020801-SHP-09-10 2,386,332 2,317,672 CA0103B9T020801-THP-09-10 119,872 114,978 CA0093B9T020801-THP-09-10 218,462 211,398
3,490,833 3,345,141
HOME Investment Partnerships Program 14.239 M01-MC060208 1,616,863 -
FEDERAL GRANTOR/PROGRAM TITLE
See Accompanying Notes to the Schedule of Expenditures of Federal Awards
129
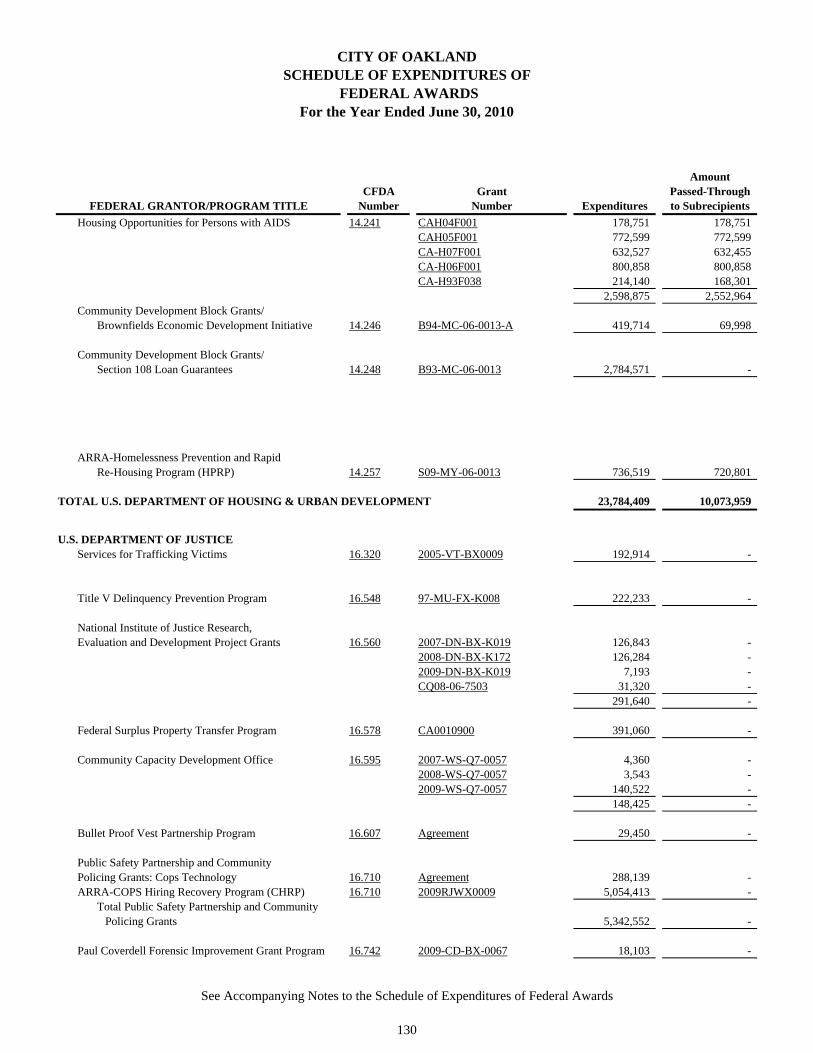
CITY OF OAKLANDSCHEDULE OF EXPENDITURES OF
FEDERAL AWARDSFor the Year Ended June 30, 2010
AmountCFDA Grant Passed-Through
Number Number Expenditures to SubrecipientsFEDERAL GRANTOR/PROGRAM TITLE
Housing Opportunities for Persons with AIDS 14.241 CAH04F001 178,751 178,751 CAH05F001 772,599 772,599 CA-H07F001 632,527 632,455 CA-H06F001 800,858 800,858 CA-H93F038 214,140 168,301
2,598,875 2,552,964 Community Development Block Grants/
Brownfields Economic Development Initiative 14.246 B94-MC-06-0013-A 419,714 69,998
Community Development Block Grants/Section 108 Loan Guarantees 14.248 B93-MC-06-0013 2,784,571 -
ARRA-Homelessness Prevention and Rapid Re-Housing Program (HPRP) 14.257 S09-MY-06-0013 736,519 720,801
TOTAL U.S. DEPARTMENT OF HOUSING & URBAN DEVELOPMENT 23,784,409 10,073,959
U.S. DEPARTMENT OF JUSTICEServices for Trafficking Victims 16.320 2005-VT-BX0009 192,914 -
Title V Delinquency Prevention Program 16.548 97-MU-FX-K008 222,233 -
National Institute of Justice Research,Evaluation and Development Project Grants 16.560 2007-DN-BX-K019 126,843 -
2008-DN-BX-K172 126,284 - 2009-DN-BX-K019 7,193 - CQ08-06-7503 31,320 -
291,640 -
Federal Surplus Property Transfer Program 16.578 CA0010900 391,060 -
Community Capacity Development Office 16.595 2007-WS-Q7-0057 4,360 - 2008-WS-Q7-0057 3,543 - 2009-WS-Q7-0057 140,522 -
148,425 -
Bullet Proof Vest Partnership Program 16.607 Agreement 29,450 -
Public Safety Partnership and Community Policing Grants: Cops Technology 16.710 Agreement 288,139 - ARRA-COPS Hiring Recovery Program (CHRP) 16.710 2009RJWX0009 5,054,413 -
Total Public Safety Partnership and CommunityPolicing Grants 5,342,552 -
Paul Coverdell Forensic Improvement Grant Program 16.742 2009-CD-BX-0067 18,103 -
See Accompanying Notes to the Schedule of Expenditures of Federal Awards
130
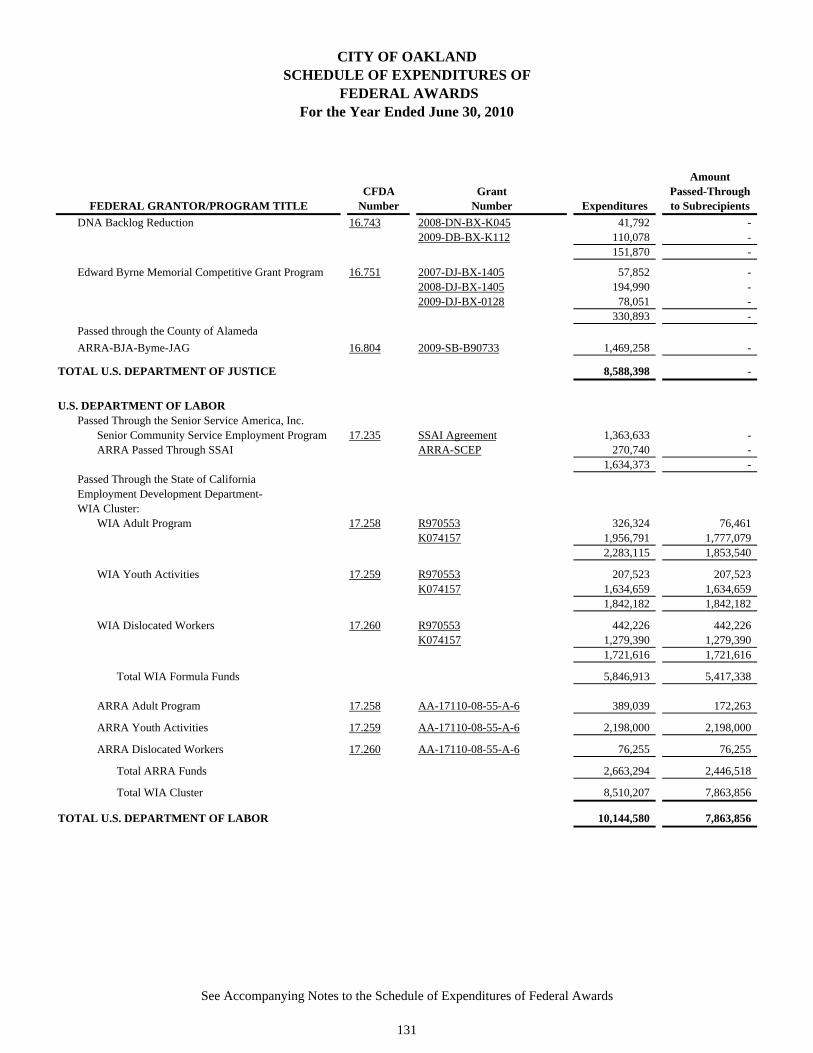
CITY OF OAKLANDSCHEDULE OF EXPENDITURES OF
FEDERAL AWARDSFor the Year Ended June 30, 2010
AmountCFDA Grant Passed-Through
Number Number Expenditures to SubrecipientsFEDERAL GRANTOR/PROGRAM TITLE
DNA Backlog Reduction 16.743 2008-DN-BX-K045 41,792 - 2009-DB-BX-K112 110,078 -
151,870 -
Edward Byrne Memorial Competitive Grant Program 16.751 2007-DJ-BX-1405 57,852 - 2008-DJ-BX-1405 194,990 - 2009-DJ-BX-0128 78,051 -
330,893 - Passed through the County of Alameda
ARRA-BJA-Byme-JAG 16.804 2009-SB-B90733 1,469,258 -
TOTAL U.S. DEPARTMENT OF JUSTICE 8,588,398 -
U.S. DEPARTMENT OF LABORPassed Through the Senior Service America, Inc.
Senior Community Service Employment Program 17.235 SSAI Agreement 1,363,633 - ARRA Passed Through SSAI ARRA-SCEP 270,740 -
1,634,373 - Passed Through the State of CaliforniaEmployment Development Department-WIA Cluster:
WIA Adult Program 17.258 R970553 326,324 76,461 K074157 1,956,791 1,777,079
2,283,115 1,853,540
WIA Youth Activities 17.259 R970553 207,523 207,523 K074157 1,634,659 1,634,659
1,842,182 1,842,182
WIA Dislocated Workers 17.260 R970553 442,226 442,226 K074157 1,279,390 1,279,390
1,721,616 1,721,616
Total WIA Formula Funds 5,846,913 5,417,338
ARRA Adult Program 17.258 AA-17110-08-55-A-6 389,039 172,263
ARRA Youth Activities 17.259 AA-17110-08-55-A-6 2,198,000 2,198,000
ARRA Dislocated Workers 17.260 AA-17110-08-55-A-6 76,255 76,255
Total ARRA Funds 2,663,294 2,446,518
Total WIA Cluster 8,510,207 7,863,856
TOTAL U.S. DEPARTMENT OF LABOR 10,144,580 7,863,856
See Accompanying Notes to the Schedule of Expenditures of Federal Awards
131
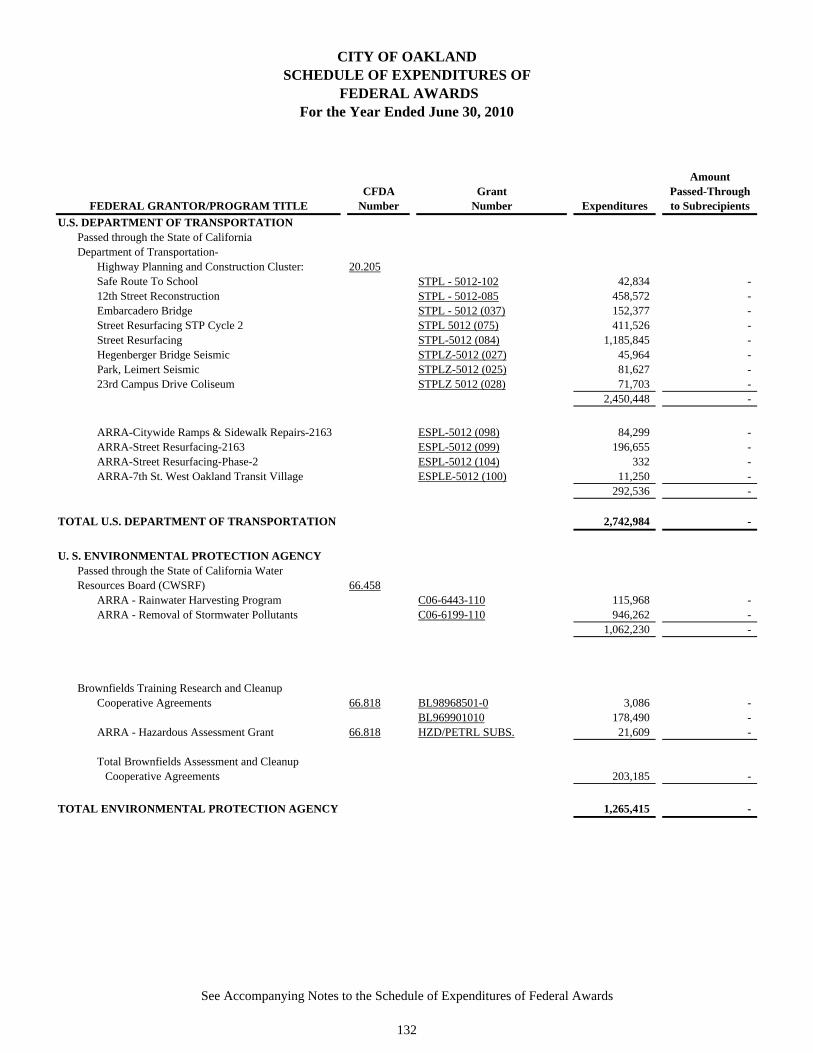
CITY OF OAKLANDSCHEDULE OF EXPENDITURES OF
FEDERAL AWARDSFor the Year Ended June 30, 2010
AmountCFDA Grant Passed-Through
Number Number Expenditures to SubrecipientsFEDERAL GRANTOR/PROGRAM TITLE
U.S. DEPARTMENT OF TRANSPORTATIONPassed through the State of CaliforniaDepartment of Transportation-
Highway Planning and Construction Cluster: 20.205Safe Route To School STPL - 5012-102 42,834 - 12th Street Reconstruction STPL - 5012-085 458,572 - Embarcadero Bridge STPL - 5012 (037) 152,377 - Street Resurfacing STP Cycle 2 STPL 5012 (075) 411,526 - Street Resurfacing STPL-5012 (084) 1,185,845 - Hegenberger Bridge Seismic STPLZ-5012 (027) 45,964 - Park, Leimert Seismic STPLZ-5012 (025) 81,627 - 23rd Campus Drive Coliseum STPLZ 5012 (028) 71,703 -
2,450,448 -
ARRA-Citywide Ramps & Sidewalk Repairs-2163 ESPL-5012 (098) 84,299 - ARRA-Street Resurfacing-2163 ESPL-5012 (099) 196,655 - ARRA-Street Resurfacing-Phase-2 ESPL-5012 (104) 332 - ARRA-7th St. West Oakland Transit Village ESPLE-5012 (100) 11,250 -
292,536 -
TOTAL U.S. DEPARTMENT OF TRANSPORTATION 2,742,984 -
U. S. ENVIRONMENTAL PROTECTION AGENCYPassed through the State of California Water Resources Board (CWSRF) 66.458
ARRA - Rainwater Harvesting Program C06-6443-110 115,968 - ARRA - Removal of Stormwater Pollutants C06-6199-110 946,262 -
1,062,230 -
Brownfields Training Research and Cleanup Cooperative Agreements 66.818 BL98968501-0 3,086 -
BL969901010 178,490 - ARRA - Hazardous Assessment Grant 66.818 HZD/PETRL SUBS. 21,609 -
Total Brownfields Assessment and Cleanup Cooperative Agreements 203,185 -
TOTAL ENVIRONMENTAL PROTECTION AGENCY 1,265,415 -
See Accompanying Notes to the Schedule of Expenditures of Federal Awards
132
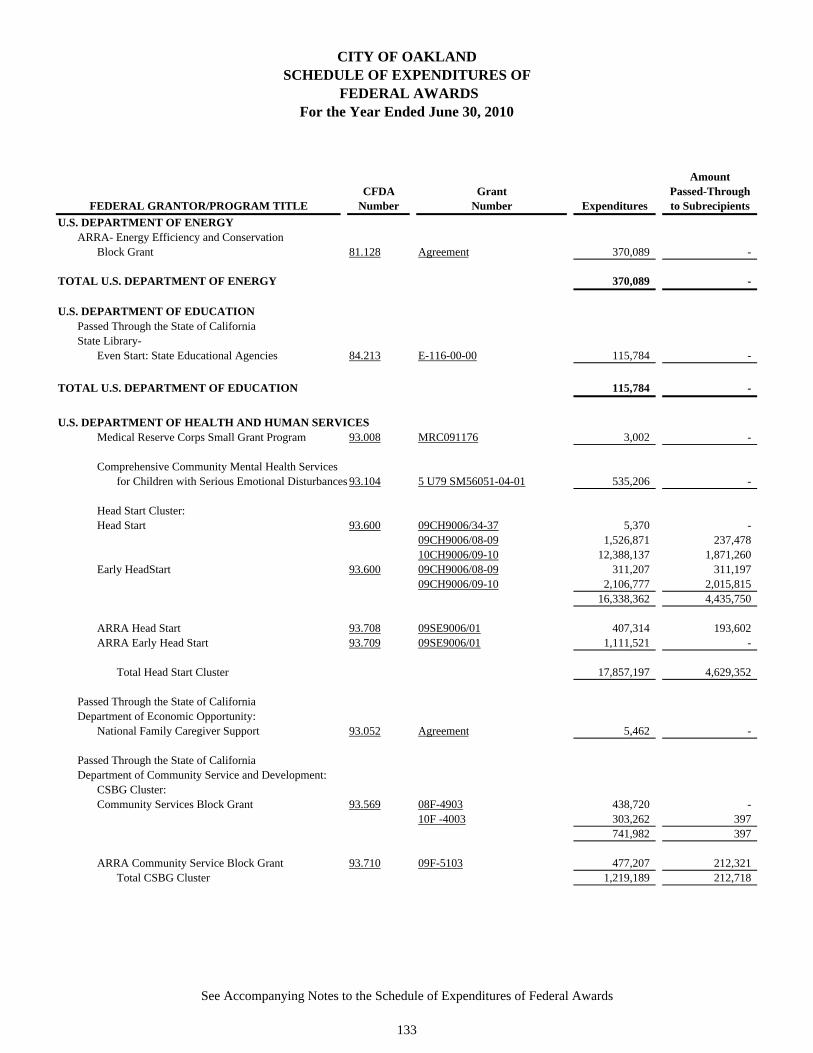
CITY OF OAKLANDSCHEDULE OF EXPENDITURES OF
FEDERAL AWARDSFor the Year Ended June 30, 2010
AmountCFDA Grant Passed-Through
Number Number Expenditures to SubrecipientsFEDERAL GRANTOR/PROGRAM TITLE
U.S. DEPARTMENT OF ENERGYARRA- Energy Efficiency and Conservation
Block Grant 81.128 Agreement 370,089 -
TOTAL U.S. DEPARTMENT OF ENERGY 370,089 -
U.S. DEPARTMENT OF EDUCATIONPassed Through the State of CaliforniaState Library-
Even Start: State Educational Agencies 84.213 E-116-00-00 115,784 -
TOTAL U.S. DEPARTMENT OF EDUCATION 115,784 -
U.S. DEPARTMENT OF HEALTH AND HUMAN SERVICESMedical Reserve Corps Small Grant Program 93.008 MRC091176 3,002 -
Comprehensive Community Mental Health Servicesfor Children with Serious Emotional Disturbances 93.104 5 U79 SM56051-04-01 535,206 -
Head Start Cluster:Head Start 93.600 09CH9006/34-37 5,370 -
09CH9006/08-09 1,526,871 237,478 10CH9006/09-10 12,388,137 1,871,260
Early HeadStart 93.600 09CH9006/08-09 311,207 311,197 09CH9006/09-10 2,106,777 2,015,815
16,338,362 4,435,750
ARRA Head Start 93.708 09SE9006/01 407,314 193,602 ARRA Early Head Start 93.709 09SE9006/01 1,111,521 -
Total Head Start Cluster 17,857,197 4,629,352
Passed Through the State of CaliforniaDepartment of Economic Opportunity:
National Family Caregiver Support 93.052 Agreement 5,462 -
Passed Through the State of CaliforniaDepartment of Community Service and Development:
CSBG Cluster:Community Services Block Grant 93.569 08F-4903 438,720 -
10F -4003 303,262 397 741,982 397
ARRA Community Service Block Grant 93.710 09F-5103 477,207 212,321 Total CSBG Cluster 1,219,189 212,718
See Accompanying Notes to the Schedule of Expenditures of Federal Awards
133

CITY OF OAKLANDSCHEDULE OF EXPENDITURES OF
FEDERAL AWARDSFor the Year Ended June 30, 2010
AmountCFDA Grant Passed-Through
Number Number Expenditures to SubrecipientsFEDERAL GRANTOR/PROGRAM TITLE
Passed Through the State of CaliforniaDepartment of Aging:
Medical Assistance Program (Medicaid) 93.778 MS-08-09 43,398 - MS-09-10 1,554,723 -
1,598,121 -
TOTAL DEPARTMENT OF HEALTH AND HUMAN SERVICES 21,218,177 4,842,070
U.S. CORPORATION FOR NATIONAL AND COMMUNITY SERVICESFoster Grandparent/Senior Companion Cluster:
Foster Grandparent Program 94.011 03SFPCA010 292 - 06SFPCA009 4,150 - 09SFPCA010 30,280 -
Senior Companion Program 94.016 06SCPCA005 314,224 - Total Foster Grandparent/Senior Companion Cluster 348,946 -
TOTAL U.S. CORPORATION FOR NATIONAL AND COMMUNITY SERVICES 348,946 -
U.S. DEPARTMENT OF HOMELAND SECURITYNational Urban Search and Rescue (US&R) Response System 97.025 USAR Grant-08-09 205,922 -
USAR Grant-08-09 900,444 - 1,106,366 -
Disaster Grants - Public Assistance 97.036FEMA OES -98 01-089 6 -
Disaster Resistant Community 97.039 EMW-97-GR-0521 100,971 -
Assistance To Firefighter grant 97.044 EMW/2007/FP/01889 3,500 - Driving Simulator EMW/2008/FO/11173 584,148 -
587,648 -
See Accompanying Notes to the Schedule of Expenditures of Federal Awards
134
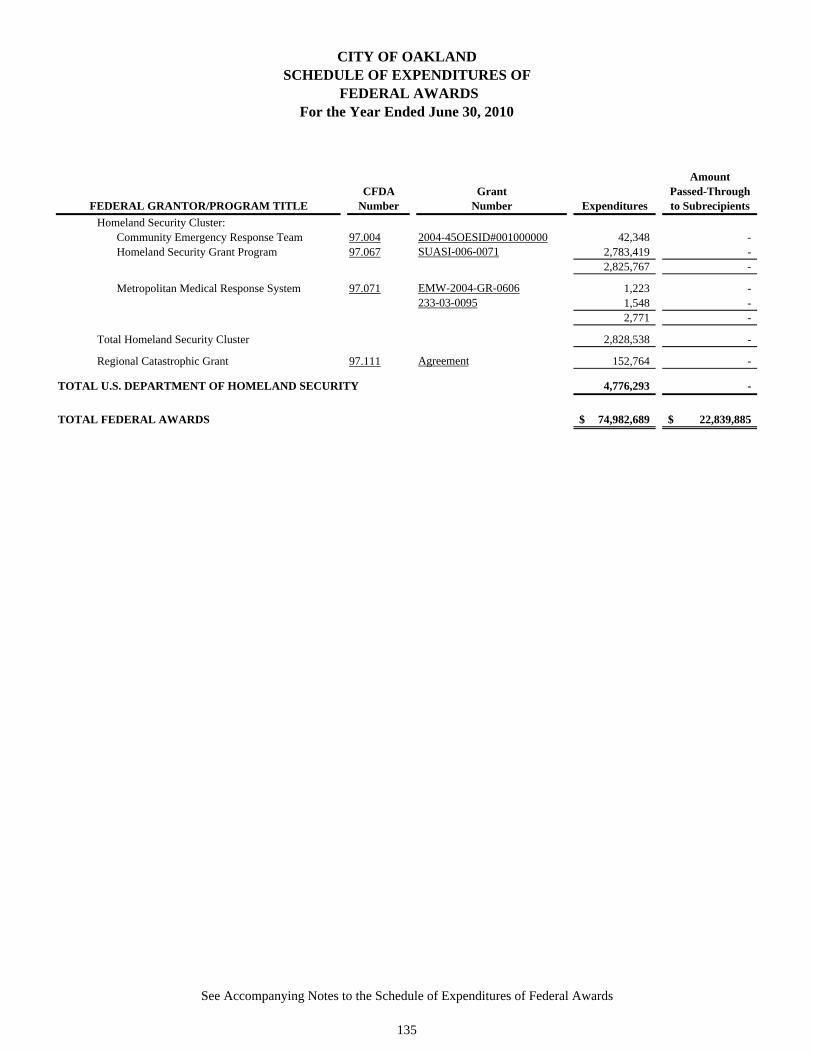
CITY OF OAKLANDSCHEDULE OF EXPENDITURES OF
FEDERAL AWARDSFor the Year Ended June 30, 2010
AmountCFDA Grant Passed-Through
Number Number Expenditures to SubrecipientsFEDERAL GRANTOR/PROGRAM TITLE
Homeland Security Cluster:Community Emergency Response Team 97.004 2004-45OESID#001000000 42,348 - Homeland Security Grant Program 97.067 SUASI-006-0071 2,783,419 -
2,825,767 -
Metropolitan Medical Response System 97.071 EMW-2004-GR-0606 1,223 - 233-03-0095 1,548 -
2,771 -
Total Homeland Security Cluster 2,828,538 -
Regional Catastrophic Grant 97.111 Agreement 152,764 -
TOTAL U.S. DEPARTMENT OF HOMELAND SECURITY 4,776,293 -
TOTAL FEDERAL AWARDS 74,982,689$ 22,839,885$
See Accompanying Notes to the Schedule of Expenditures of Federal Awards
135

136
This page left intentionally blank.
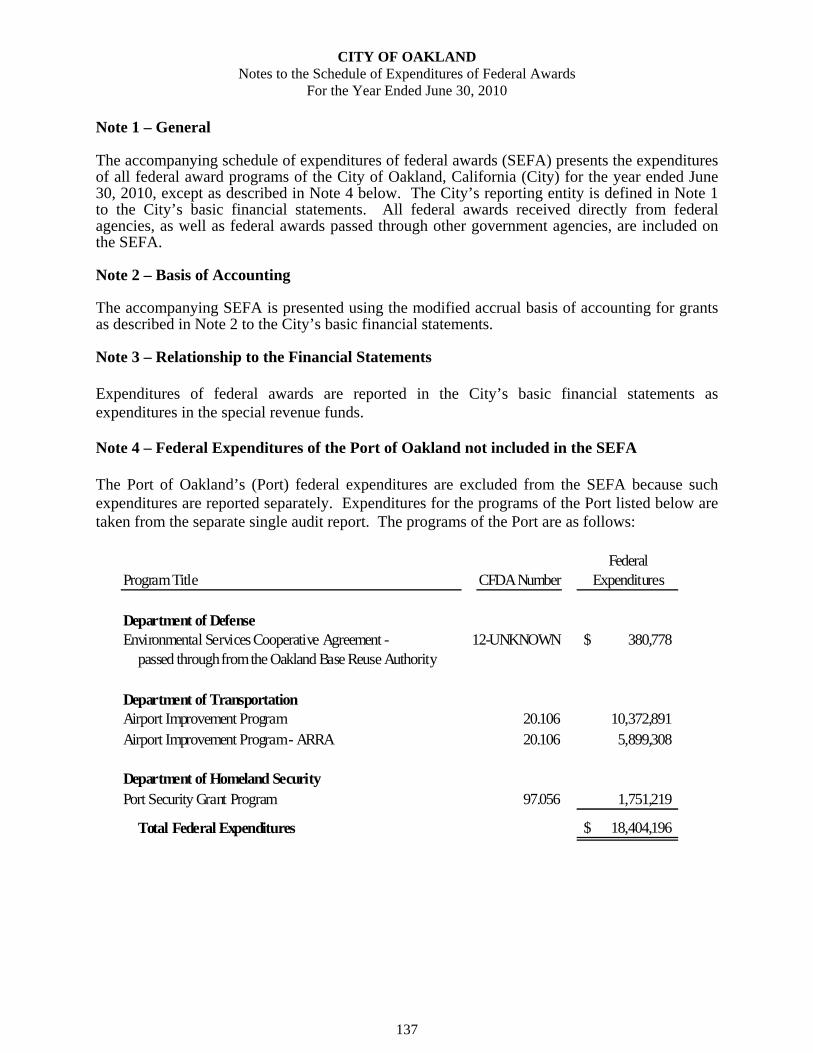
CITY OF OAKLAND Notes to the Schedule of Expenditures of Federal Awards
For the Year Ended June 30, 2010
137
Note 1 – General The accompanying schedule of expenditures of federal awards (SEFA) presents the expenditures of all federal award programs of the City of Oakland, California (City) for the year ended June 30, 2010, except as described in Note 4 below. The City’s reporting entity is defined in Note 1 to the City’s basic financial statements. All federal awards received directly from federal agencies, as well as federal awards passed through other government agencies, are included on the SEFA. Note 2 – Basis of Accounting The accompanying SEFA is presented using the modified accrual basis of accounting for grants as described in Note 2 to the City’s basic financial statements. Note 3 – Relationship to the Financial Statements Expenditures of federal awards are reported in the City’s basic financial statements as expenditures in the special revenue funds. Note 4 – Federal Expenditures of the Port of Oakland not included in the SEFA The Port of Oakland’s (Port) federal expenditures are excluded from the SEFA because such expenditures are reported separately. Expenditures for the programs of the Port listed below are taken from the separate single audit report. The programs of the Port are as follows:
FederalProgram Title CFDA Number Expenditures
Department of DefenseEnvironmental Services Cooperative Agreement - 12-UNKNOWN 380,778$
passed through from the Oakland Base Reuse Authority
Department of TransportationAirport Improvement Program 20.106 10,372,891 Airport Improvement Program - ARRA 20.106 5,899,308
Department of Homeland SecurityPort Security Grant Program 97.056 1,751,219
Total Federal Expenditures 18,404,196$
CITY OF OAKLAND Notes to the Schedule of Expenditures of Federal Awards
For the Year Ended June 30, 2010
138
Note 5 – Loans Outstanding The City participates in certain federal award programs of the U.S. Department of Housing and Urban Development (HUD) that sponsor revolving loan and loan guarantee programs, which are administered by the City. These programs maintain servicing and trust arrangements with the City to collect loan repayments. These repayments are made available for new loans. Of these revolving loan and loan guarantee programs, the HOME Investment Partnerships Program (CFDA No. 14.239) is the only loan program with continuing compliance requirements. The following is a summary of the changes in outstanding loans receivable used to determine the value at June 30, 2010:
Balance Balance Balance, NetJuly 1, 2009 Increases Decreases June 30, 2010 June 30, 2010
54,654,468$ 2,319,086$ (275,131)$ 56,698,423$ (163,608)$ 56,534,815$
Allowance for Doubtful Accounts

CITY OF OAKLAND Schedule of Findings and Questioned Costs
For the Year Ended June 30, 2010
139
Section I – Summary of Auditor’s Results
Financial Statements:
Type of auditor’s report issued: Unqualified
Internal control over financial reporting:
Material weaknesses identified? No Significant deficiencies identified that are
not considered to be material weaknesses? Yes
Noncompliance material to financial statements noted? No
Federal Awards:
Internal control over major programs:
Material weaknesses identified? No Significant deficiencies identified that are
not considered to be material weaknesses? None reported
Type of auditor’s report issued on compliance for major programs: Unqualified
Any audit findings disclosed that are required to be reported in accordance with section 510(a) of Circular A-133? No
Identification of major programs: CFDA Number Program name14.218/14.253 Community Development Block Grants –
Entitlement Grants Cluster 14.235 Supportive Housing Program 14.239 HOME Investment Partnerships Program14.248 Community Development Block Grants – Section
108 Loan Guarantees16.710 Public Safety Partnership and Community
Policing Grants16.804 Edward Byrne Memorial Justice Assistance Grant
Program17.258/17.259/17.260 WIA Cluster20.205 Highway Planning and Construction Grants93.600/93.708/93.709 Head Start Cluster93.778 Medical Assistance Program (Medicaid)
Dollar threshold used to distinguish between
Type A and Type B programs: $2,249,481
Auditee qualified as low-risk auditee? No

CITY OF OAKLAND Schedule of Findings and Questioned Costs
For the Year Ended June 30, 2010
140
Section II – Financial Statement Findings Comment No. 2010-1 – Significant Deficiency Evaluation of Allowances on Notes and Loans Receivable During the year, the City had identified approximately $14 million in outstanding loans that should have been written off as bad debt during fiscal year 2006-07 and removed from its assets. The need for the reduction in outstanding loans was not discovered on a timely basis, due to the complex restructuring agreements for multiple loans and entities. This error was subsequently corrected in fiscal year 2009-10 during a performance audit of the Community and Economic Development Agency loan programs. In addition, MGO detected smaller inaccuracies in the calculation of the allowance for bad debt on notes and loans receivables during our audit procedures. The City could have detected the $14 million and other smaller inaccuracies on a timely basis with stronger analysis of the collectability of outstanding notes and loans on a periodic basis. The City should improve the process and frequency of its evaluation of allowances on notes and loans receivable in order to strengthen internal controls and ensure that notes and loans receivable are reported in accordance with GAAP. Management Response: Management concurs with the recommendation and the reduction in the notes and loan receivable has no financial impact to the City’s fund balance. Finance and Management Agency (FMA) in consultation with other City Agencies and/or departments will review current policies and procedures to improve the process and frequency of its evaluation of allowances on notes and loans receivable in order to strengthen internal controls and ensure that notes and loans receivable are reported in accordance with GAAP. FMA will implement the following:
1. Perform an aging analysis of the City’s notes and loan receivable portfolio on a periodic basis
2. Establish an allowance for doubtful accounts policy that includes preparing periodic estimates of uncollectible loan balances for review and authorization by management.
3. Develop a comprehensive Administrative Instruction (AI) for notes and loan receivables. Comment No. 2010-2 – Significant Deficiency Lack of IT Risk Assessments Industry best practices suggest that agencies, departments and business units perform a risk assessment. An IT risk assessment is a process to determine what information resources exists that require protection, and to understand and document potential risks from IT security failures that may cause loss of information confidentiality, integrity, or availability. The purpose of a risk assessment is to help management create appropriate strategies and controls for stewardship of information assessments.

CITY OF OAKLAND Schedule of Findings and Questioned Costs
For the Year Ended June 30, 2010
141
The City has not conducted an IT risk assessment and therefore has no mechanism to determine whether current operations are designed to effectively mitigate risk within its environment. It currently does not have a comprehensive risk assessment processes whereby operations are evaluated for risk. Without a risk assessment process, the City cannot fully develop mitigation plans for the various risks that may exist within its environment. Due to the current economic situation of the City, risk assessments are more significant because they can assist in identifying where budgetary savings can be gained and the impact that layoffs and other budgetary based decisions may have on the City. Because risk assessments are not currently performed, the IT department has no way to determine the risk impact that recent layoffs have had on its environment. This could pose a significant risk to the City in the event that internal control procedures do not provide for the appropriate segregation of duties within the operations because staffing levels are inadequate. The City should begin efforts to develop a risk assessment process within its IT department and consider developing a City-wide risk assessment process. The risk assessment could either be 1) performed internally by the City’s internal audit function in unison with the IT department management and staff or 2) conducted by an external third party experienced in performing IT risk assessments. Management Response: The Department of Information Technology (DIT) has continually performed an internal department assessment to understand and take immediate action on potential risks. Our internal assessment covers risks associated with failures and security breaches that could potentially compromise the confidentiality, integrity, and availability of the systems that we support. The last risk assessment was conducted in August 2009 when DIT upgraded the Oracle system. In response to the findings, DIT completely reengineered external and internal security systems and installed additional system redundancies to fortify our Data Centers from attacks and failures. DIT also conducts an assessment of risks for layoffs. Impacts and risks from layoffs are routinely communicated to the City Administrator and City Council through Staff Reports when there is a reduction in staff. DIT completed a comprehensive IT risk assessment for all agencies/departments in 2005. An assessment of the kind conducted in 2005 is very expensive. Budget cuts have not allowed DIT to conduct a similar citywide IT risk assessment since that time. Comment No. 2010-3 – Significant Deficiency Inadequate IT Back-Up Recovery Site Location Best practices for disaster recovery suggest that a back-up location should be at least 20 miles away from the main location and in a location that is not susceptible to the same types of disasters (flood, fire, terrorist acts, etc.) as the main location. The reason for this control is to ensure that the City’s systems can be restored in the event of a disaster. If the primary and back-up locations are geographically close, it increases the risk of both locations being unavailable in the event of a disaster. Currently, the City’s back-up location is four blocks away from the main data center. This second location was chosen because it is a City building with good safety features, including a recent upgrade to withstand significant earthquakes. By not having a second location outside of the 20 mile radius, the City is at an increased risk of longer recovery times if a disaster event occurs.
CITY OF OAKLAND Schedule of Findings and Questioned Costs
For the Year Ended June 30, 2010
142
The City should research back-up locations outside of the 20 mile radius of the main location. Once back-up location options are determined, budgetary resources should be granted to fund the establishment of a back-up location that aligns with best practices and assures the City’s backup financial information and data are secured. Management Response: DIT has routinely backed up its critical data assets (i.e. programs and information) and rotated the data assets to a vendor’s “harden” site in Sacramento, California. In the case of a disaster, the data assets could be restored on newly purchased computer hardware, if the existing computers in our local Data Centers are destroyed. However, recovery would require a lengthy lead time of 30 to 45 days to purchase and install new computer hardware. To reduce this recovery lead time, DIT recommends the use of a remote recovery site or a reciprocal agreement with a sister city which would allow DIT to locate its recovery system in their data center. DIT has had some discussions with the City of Burbank, California Data Center for this purpose, but has not come to an agreement that is agreeable to both parties.
Section III Federal Award Findings and Questioned Costs No matters were reported.
CITY OF OAKLAND Summary Schedule of Prior Audit Findings
For the Year Ended June 30, 2010
143
Reference Number: Financial Statement Finding 2009-1 Audit Finding: The City has not set user fees to recover the full cost of services.
Due to the deficiency in charges for services, the internal service funds have essentially borrowed monies from the General Fund in order to maintain operations. The City has acknowledged this matter as significant and has made an effort to take corrective measures. The City prepared a “rebalancing plan” for its internal service funds, which was first adopted for the fiscal year 2005-07 policy budget, which attempted to cure the internal service fund deficit by fiscal year 2014-15. However, the rebalancing plans put in place in fiscal years 2006 and 2007 were not followed correctly due to the lack of general fund resources to make the required annual payments. As such, the City restructured its rebalancing plan as part of the adopted fiscal year 2009-11 budget. The restructured rebalancing plan was modified to cure the net assets deficit of internal service funds by fiscal year 2018-19. In addition, the City adopted a financial policy during the 2009-11 budget that requires one-half of one-time revenues received be used specifically to reduce the net assets deficits of internal service funds.
We recommend that the City monitor the progress of its restricted
rebalancing plan very closely to ensure its feasibility. If it is determined that the plan is not feasible and that the City does not intend to or cannot recover the full cost of providing goods or services within a reasonable period of time, then the use of internal service funds is no longer appropriate under GAAP and should not be used for financial reporting purposes.
Status of Corrective Action: As discussed over the years, we became increasingly concerned
with the growth in both the net assets deficits of certain internal service funds and the interfund borrowings needed to support those services. For fiscal year 2010, the City was able to achieve a positive change in net assets for each of the internal service funds that had a beginning deficit net assets balance. In addition the improvement to net assets for each of these funds was greater than the change projected in the restructured rebalancing plan. The interfund borrowing has been reduced to $45.6 million as of June 30, 2010, an improvement over the $50.8 million that was due as of June 30, 2009.
CITY OF OAKLAND Summary Schedule of Prior Audit Findings
For the Year Ended June 30, 2010
144
Reference Number: Federal Award Finding 2009-2 Audit Finding: The City did not submit the monthly written statements during
fiscal year 2009 as required by the Contract for Loan Guarantee Assistance Under Section 108 of the Housing and Community Development Act of 1974, as Amended, 42 U.S.C. Section 5308 (Loan Contract). Per paragraphs 1(b) and 6(b) of the Loan Contract, the City is required by the fifteenth day of each month to provide the Secretary of Housing and Urban Development with a written statement showing the balance of funds in the Guaranteed Loan Funds Investment Account and the Loan Repayment Account and the deposits and withdrawals from such accounts during the preceding calendar month and a statement identifying the obligations and their assignments in the Guaranteed Loan Funds Investment Account and the Loan Repayment Account.
We recommended that the City implement internal controls over the monthly preparation and review and approval of the written statement required by the Loan Contract. As part of the implementation of the internal controls, the City should identify qualified individuals to be responsible for the preparation and review and approval processes.
Status of Corrective Action: Implemented

SUPPLEMENTARY SCHEDULES

CONTRACT NO. 09F-5103, PROJECT NO. G358430/40
Total Total
Actual Reported 1 Budget
RevenueGrant Amount 460,238$ 460,238$ 1,212,696$ Interest Income - - - Total Revenue 460,238$ 460,238$ 1,212,696$
ExpendituresPersonnel Costs: Salaries and Wages 10,531$ 4,993$ 6,346$ Fringe Benefits 6,049 2,868 3,645
Subtotal Personnel Costs 16,580 7,861 9,991
Non-Personnel Costs Travel - - 10,000 Consumable Supplies 88 - 11,280 Equipment Lease/Purchase - - 5,000 Consultant Services - - - Sub-Contractors 425,899 425,899 1,129,648 Other Costs 34,640 43,447 46,777
Subtotal Non-Personnel Costs 460,627 469,346 1,202,705
Total Expenditures 477,207$ 477,207$ 1,212,696$
1 - The reported column represents expenditures reported to the State of California Department of Community Services and Development for the period July 1, 2009 to June 30, 2010.
For the Period July 1, 2009 to June 30, 2010
CITY OF OAKLANDSUPPLEMENTAL SCHEDULE OF REVENUE AND EXPENDITURES
STATE OF CALIFORNIA DEPARTMENT OF COMMUNITY SERVICE AND DEVELOPMENT (CSD)COMMUNITY SERVICE BLOCK GRANT-ARRA (CSBG-ARRA)-CFDA NO. 93.710
145
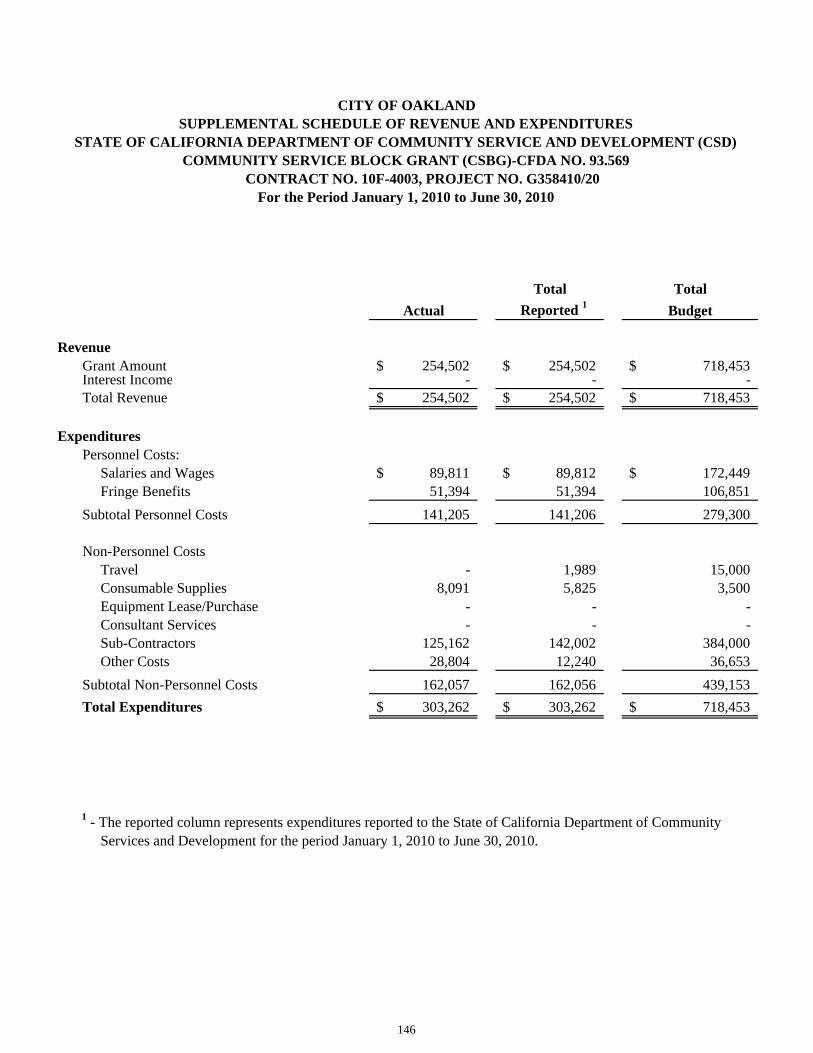
CONTRACT NO. 10F-4003, PROJECT NO. G358410/20
Total Total
Actual Reported 1 Budget
RevenueGrant Amount 254,502$ 254,502$ 718,453$ Interest Income - - - Total Revenue 254,502$ 254,502$ 718,453$
ExpendituresPersonnel Costs: Salaries and Wages 89,811$ 89,812$ 172,449$ Fringe Benefits 51,394 51,394 106,851
Subtotal Personnel Costs 141,205 141,206 279,300
Non-Personnel Costs Travel - 1,989 15,000 Consumable Supplies 8,091 5,825 3,500 Equipment Lease/Purchase - - - Consultant Services - - - Sub-Contractors 125,162 142,002 384,000 Other Costs 28,804 12,240 36,653
Subtotal Non-Personnel Costs 162,057 162,056 439,153
Total Expenditures 303,262$ 303,262$ 718,453$
1 - The reported column represents expenditures reported to the State of California Department of Community Services and Development for the period January 1, 2010 to June 30, 2010.
For the Period January 1, 2010 to June 30, 2010
CITY OF OAKLANDSUPPLEMENTAL SCHEDULE OF REVENUE AND EXPENDITURES
STATE OF CALIFORNIA DEPARTMENT OF COMMUNITY SERVICE AND DEVELOPMENT (CSD)COMMUNITY SERVICE BLOCK GRANT (CSBG)-CFDA NO. 93.569
146
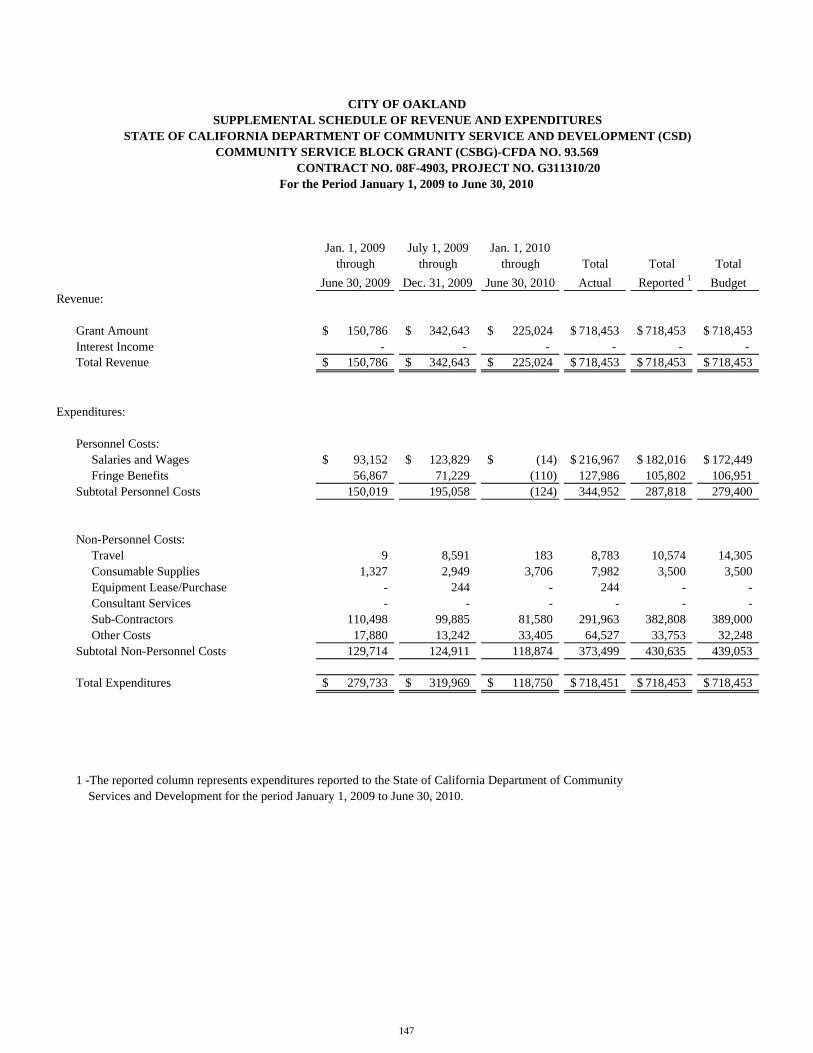
CONTRACT NO. 08F-4903, PROJECT NO. G311310/20
Jan. 1, 2009 July 1, 2009 Jan. 1, 2010 through through through Total Total Total
June 30, 2009 Dec. 31, 2009 June 30, 2010 Actual Reported 1 BudgetRevenue:
Grant Amount 150,786$ 342,643$ 225,024$ 718,453$ 718,453$ 718,453$ Interest Income - - - - - - Total Revenue 150,786$ 342,643$ 225,024$ 718,453$ 718,453$ 718,453$
Expenditures:
Personnel Costs: Salaries and Wages 93,152$ 123,829$ (14)$ 216,967$ 182,016$ 172,449$ Fringe Benefits 56,867 71,229 (110) 127,986 105,802 106,951 Subtotal Personnel Costs 150,019 195,058 (124) 344,952 287,818 279,400
Non-Personnel Costs: Travel 9 8,591 183 8,783 10,574 14,305 Consumable Supplies 1,327 2,949 3,706 7,982 3,500 3,500 Equipment Lease/Purchase - 244 - 244 - - Consultant Services - - - - - - Sub-Contractors 110,498 99,885 81,580 291,963 382,808 389,000 Other Costs 17,880 13,242 33,405 64,527 33,753 32,248 Subtotal Non-Personnel Costs 129,714 124,911 118,874 373,499 430,635 439,053
Total Expenditures 279,733$ 319,969$ 118,750$ 718,451$ 718,453$ 718,453$
1 -The reported column represents expenditures reported to the State of California Department of Community Services and Development for the period January 1, 2009 to June 30, 2010.
For the Period January 1, 2009 to June 30, 2010
CITY OF OAKLANDSUPPLEMENTAL SCHEDULE OF REVENUE AND EXPENDITURES
STATE OF CALIFORNIA DEPARTMENT OF COMMUNITY SERVICE AND DEVELOPMENT (CSD)COMMUNITY SERVICE BLOCK GRANT (CSBG)-CFDA NO. 93.569
147

CITY OF OAKLANDSUPPLEMENTAL SCHEDULE OF EXPENDITURES OF
ALAMEDA COUNTY AWARDSFor the year ended June 30, 2010
CONTRACT EXHIBIT/PONUMBER NUMBER EXPENDITURES
DEPARTMENT OF ADULT & AGING SERVICES
Linkages SOCSA-900163 SE08-140 128,626$
Linkages/Respite SOCSA-900163 SE08-140 5,601
Information and Assistance SOCSA-900163 SE06-148 42,166
TOTAL DEPARTMENT OF ADULT & AGING SERVICES 176,393
HOUSING & COMMUNITY DEVELOPMENT DEPARTMENTTemporary Winter Shelter Program OABTWS C-2335 21,628Temporary Winter Shelter Program OABTWS C-4790 123,190
TOTAL HOUSING AND COMMUNITY DEVELOPMENT DEPARTMENT 144,818
HEALTH CARE SERVICES AGENCY
Target Case Management MOU SEO-136 230,591
TOTAL HEALTH CARE SERVICES AGENCY 230,591
PUBLIC HEALTH DEPARTMENT
Tobacco Control Program CONTRACT PHSVC-5940 15,000
TOTAL DEPARTMENT OF PUBLIC HEALTH 15,000
DEPARTMENT OF WORKFORCE & BENEFITS ADMINISTRATION
Henry J. Robinson Multi-Service Center SOCSA-7418 C-2879 229,669
TOTAL DEPARTMENT OF WORKFORCE & BENEFITS ADMINISTRATION 229,669
TOTAL ALAMEDA COUNTY AWARDS 796,471$
ALAMEDA COUNTY AWARD/PROGRAM TITLE
148