Embed Size (px)
Citation preview
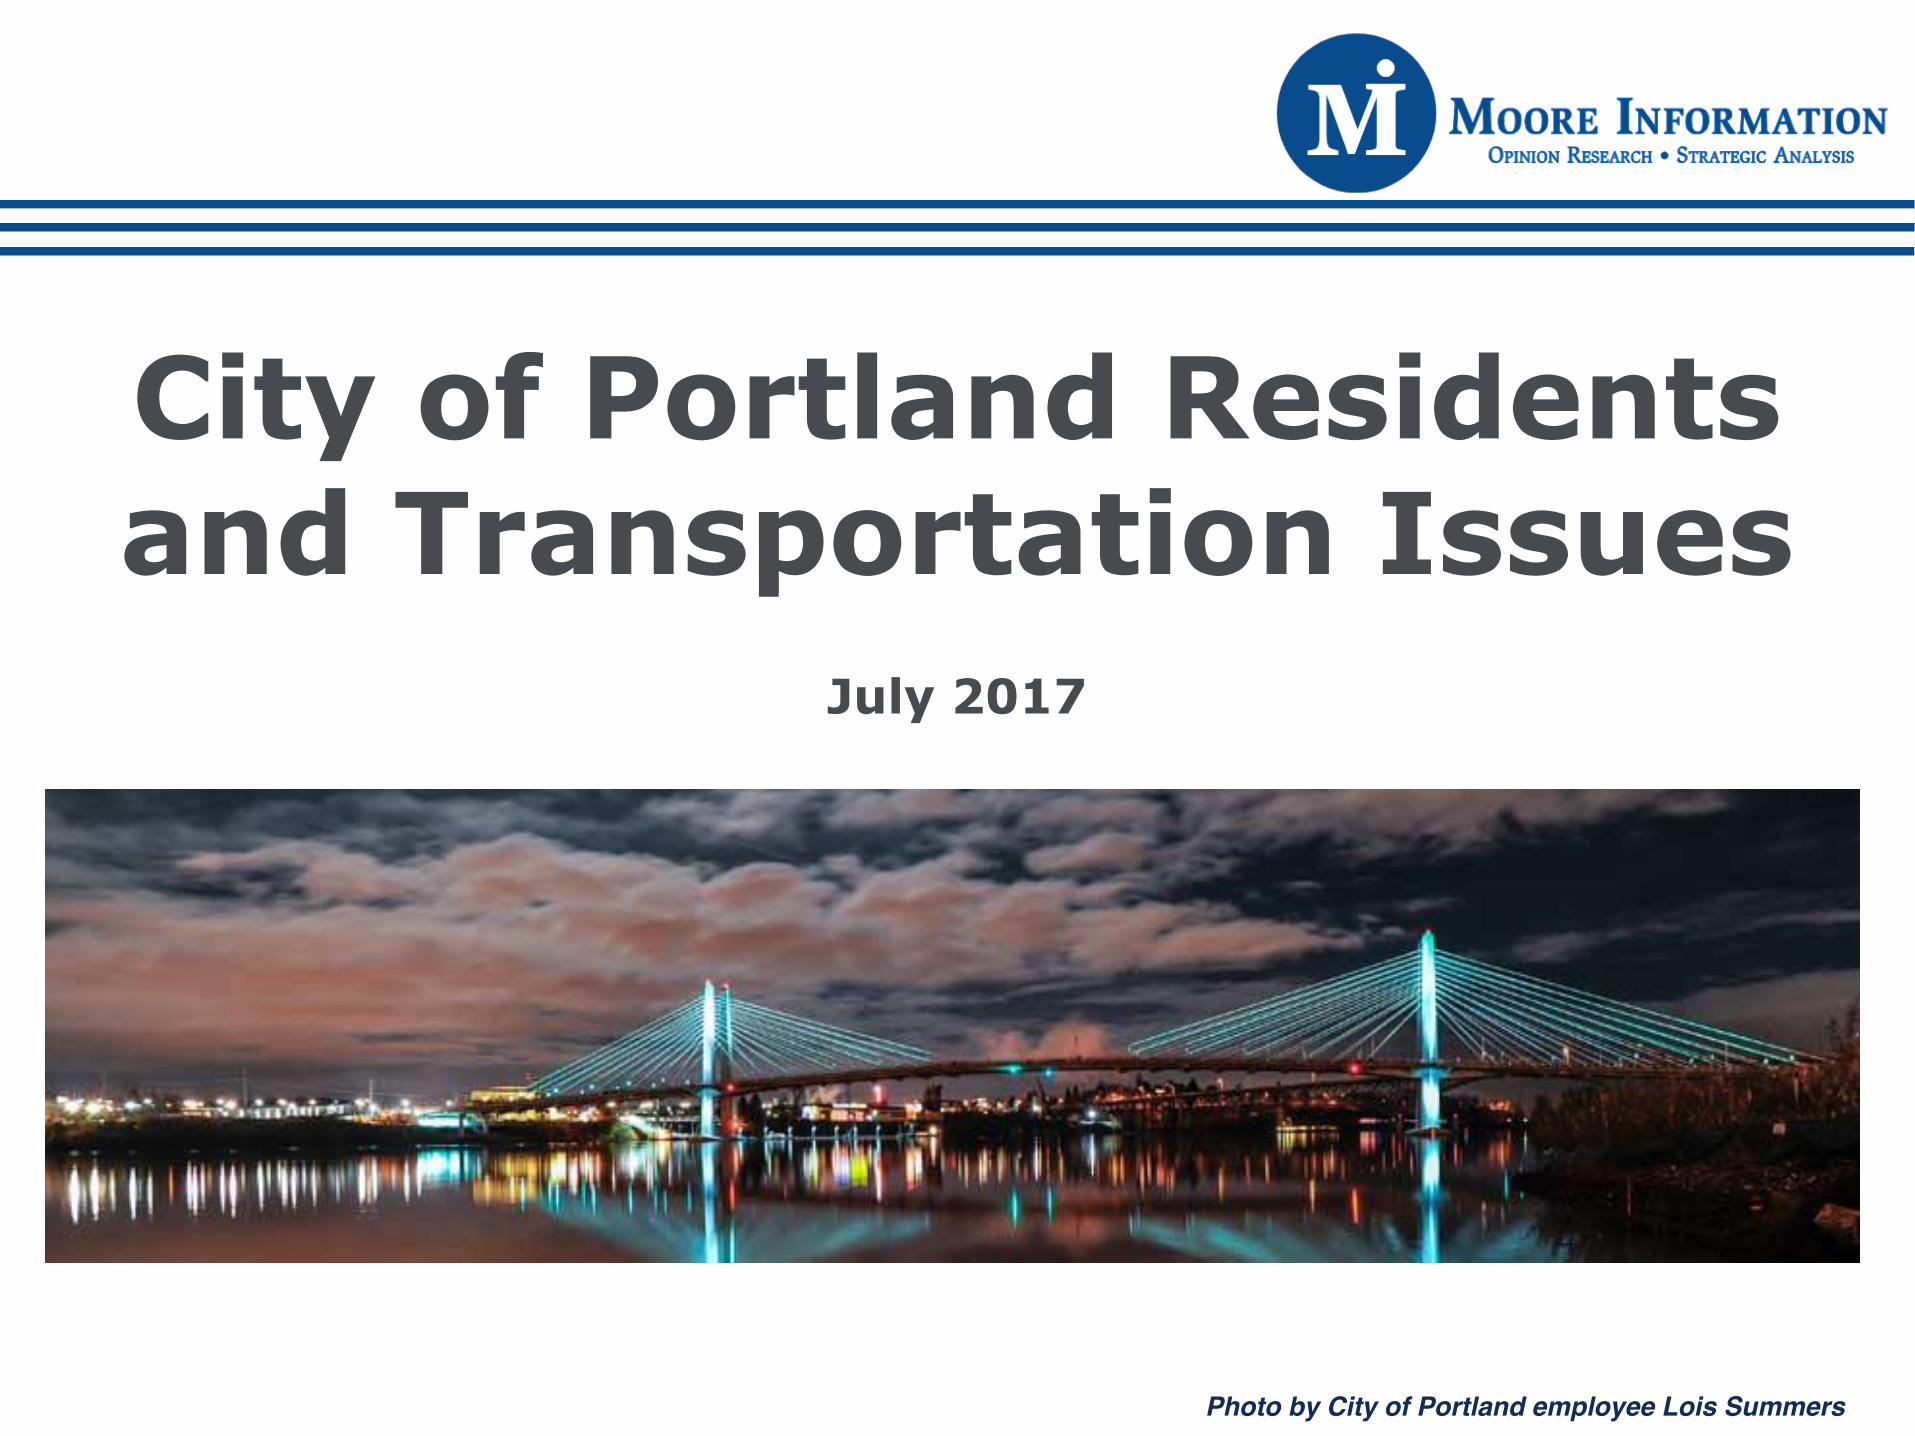
City of Portland Residents and Transportation Issues
July 2017
Photo by City of Portland employee Lois Summers

2
400 live interviews among a representative sample of adult
residents age 18 and older in the City of Portland, plus an
oversample in Zip Codes 97236 & 97266, for a total of N=100
interviews in this Outer East area.
Landline and cell phone interviews conducted July 13-16, 2017.
+/-5% for the N=400 sample; +/-10% for the N=100 sample,
computed at the 95% confidence level.
Methodology
Sample
Method
Sampling Error
3
Right direction
36%Don’t know16%
Wrong track48%
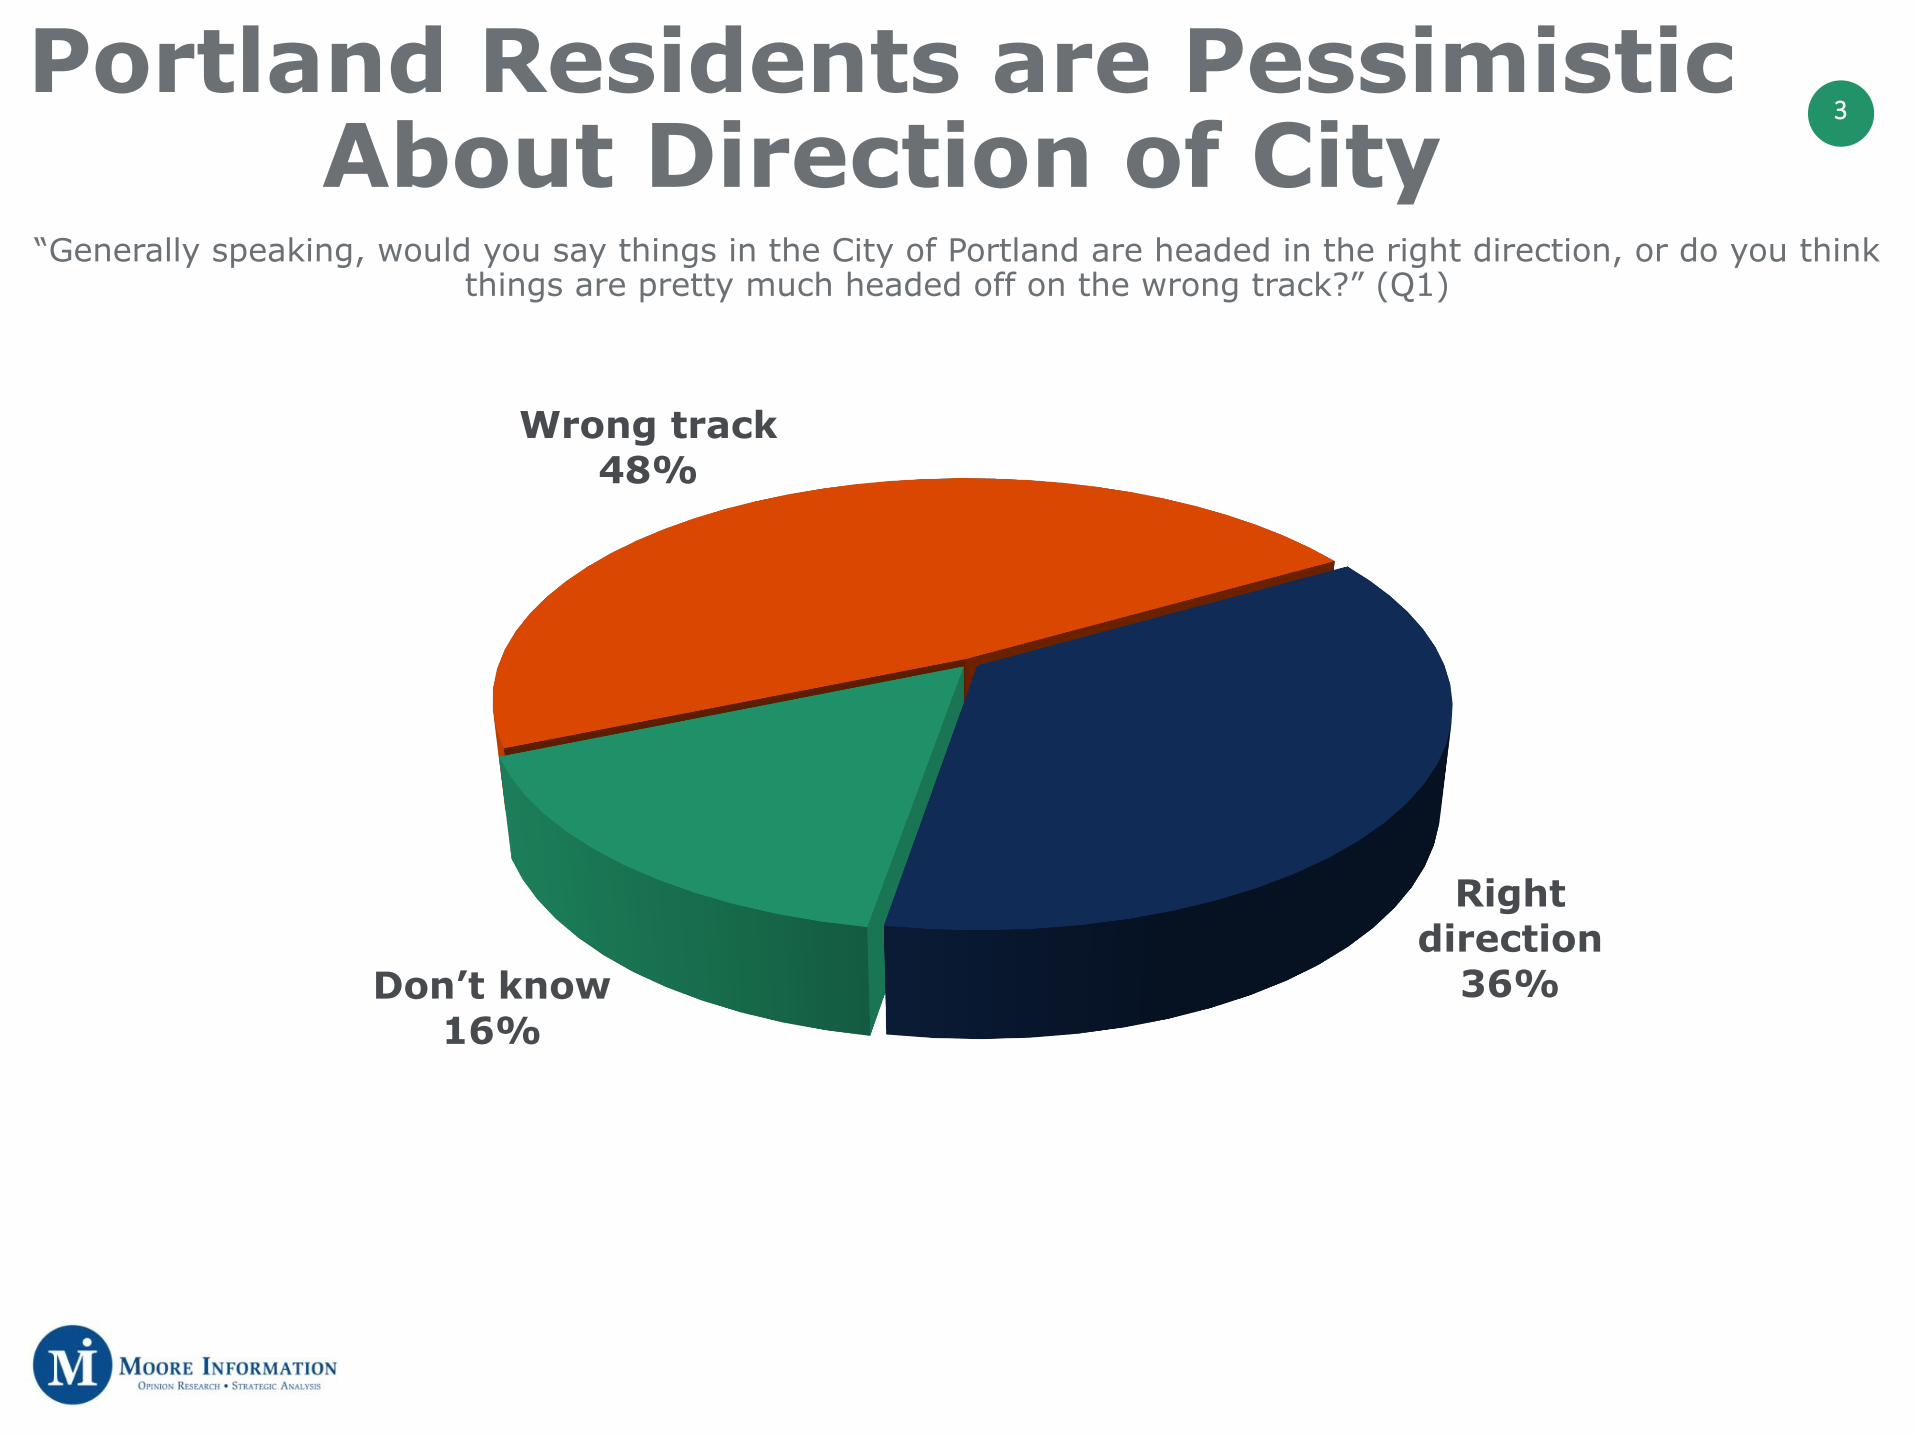
Portland Residents are Pessimistic About Direction of City
“Generally speaking, would you say things in the City of Portland are headed in the right direction, or do you think things are pretty much headed off on the wrong track?” (Q1)

4Mood in Portland: Key Subgroups (1)Right direction Don’t know Wrong track
Net right direction
All 36% 16% 48% -12%Region
N 35% 15% 50% -15%NE 38% 14% 48% -10%SW 46% 16% 38% +8%SE 34% 18% 48% -14%NW (N=26) 30% 8% 62% -32%Outer East (N=100) 35% 12% 53% -18%
Age18-34 43% 18% 40% +3%35-44 23% 18% 59% -36%45-54 48% 10% 41% +7%55-64 26% 14% 60% -34%65+ 37% 17% 46% -9%
SW Portland residents and those age 45-54 and 18-34 are among the most optimistic. Majorities or pluralities of most other key subgroups are pessimistic.

5Mood in Portland: Key Subgroups (2)
Right direction Don’t know Wrong track
Net right direction
All 36% 16% 48% -12%Distance from Downtown Portland
Less than 3 miles 45% 14% 41% +4%3-4 miles 36% 20% 44% -8%5-6 miles 36% 16% 49% -13%7-11+ miles 29% 12% 57% -28%
Change in commute time last 3 years?
Yes 27% 17% 56% -29%No 58% 15% 27% +31%
IncomeLess than $35K 45% 17% 38% +7%$35-$49K 41% 15% 44% -3%$50K+ 31% 15% 54% -23%
Pessimism increases with distance from downtown Portland, and with income.Commuters who have experienced a change in their commute time in last three years are
among the most pessimistic, while those commuters who have not, are among most optimistic.
6
27%
9%
7%
6%
5%
5%
1%
10%
0% 10% 20% 30% 40%
Traffic/congestion
Poor roadconditions/maintenance
Highway traffic
Lack of mass transit/publictransportation (general)
Highways/roads needwidening/more lanes
Overpopulation/populationgrowth
None/nothing
Don't know
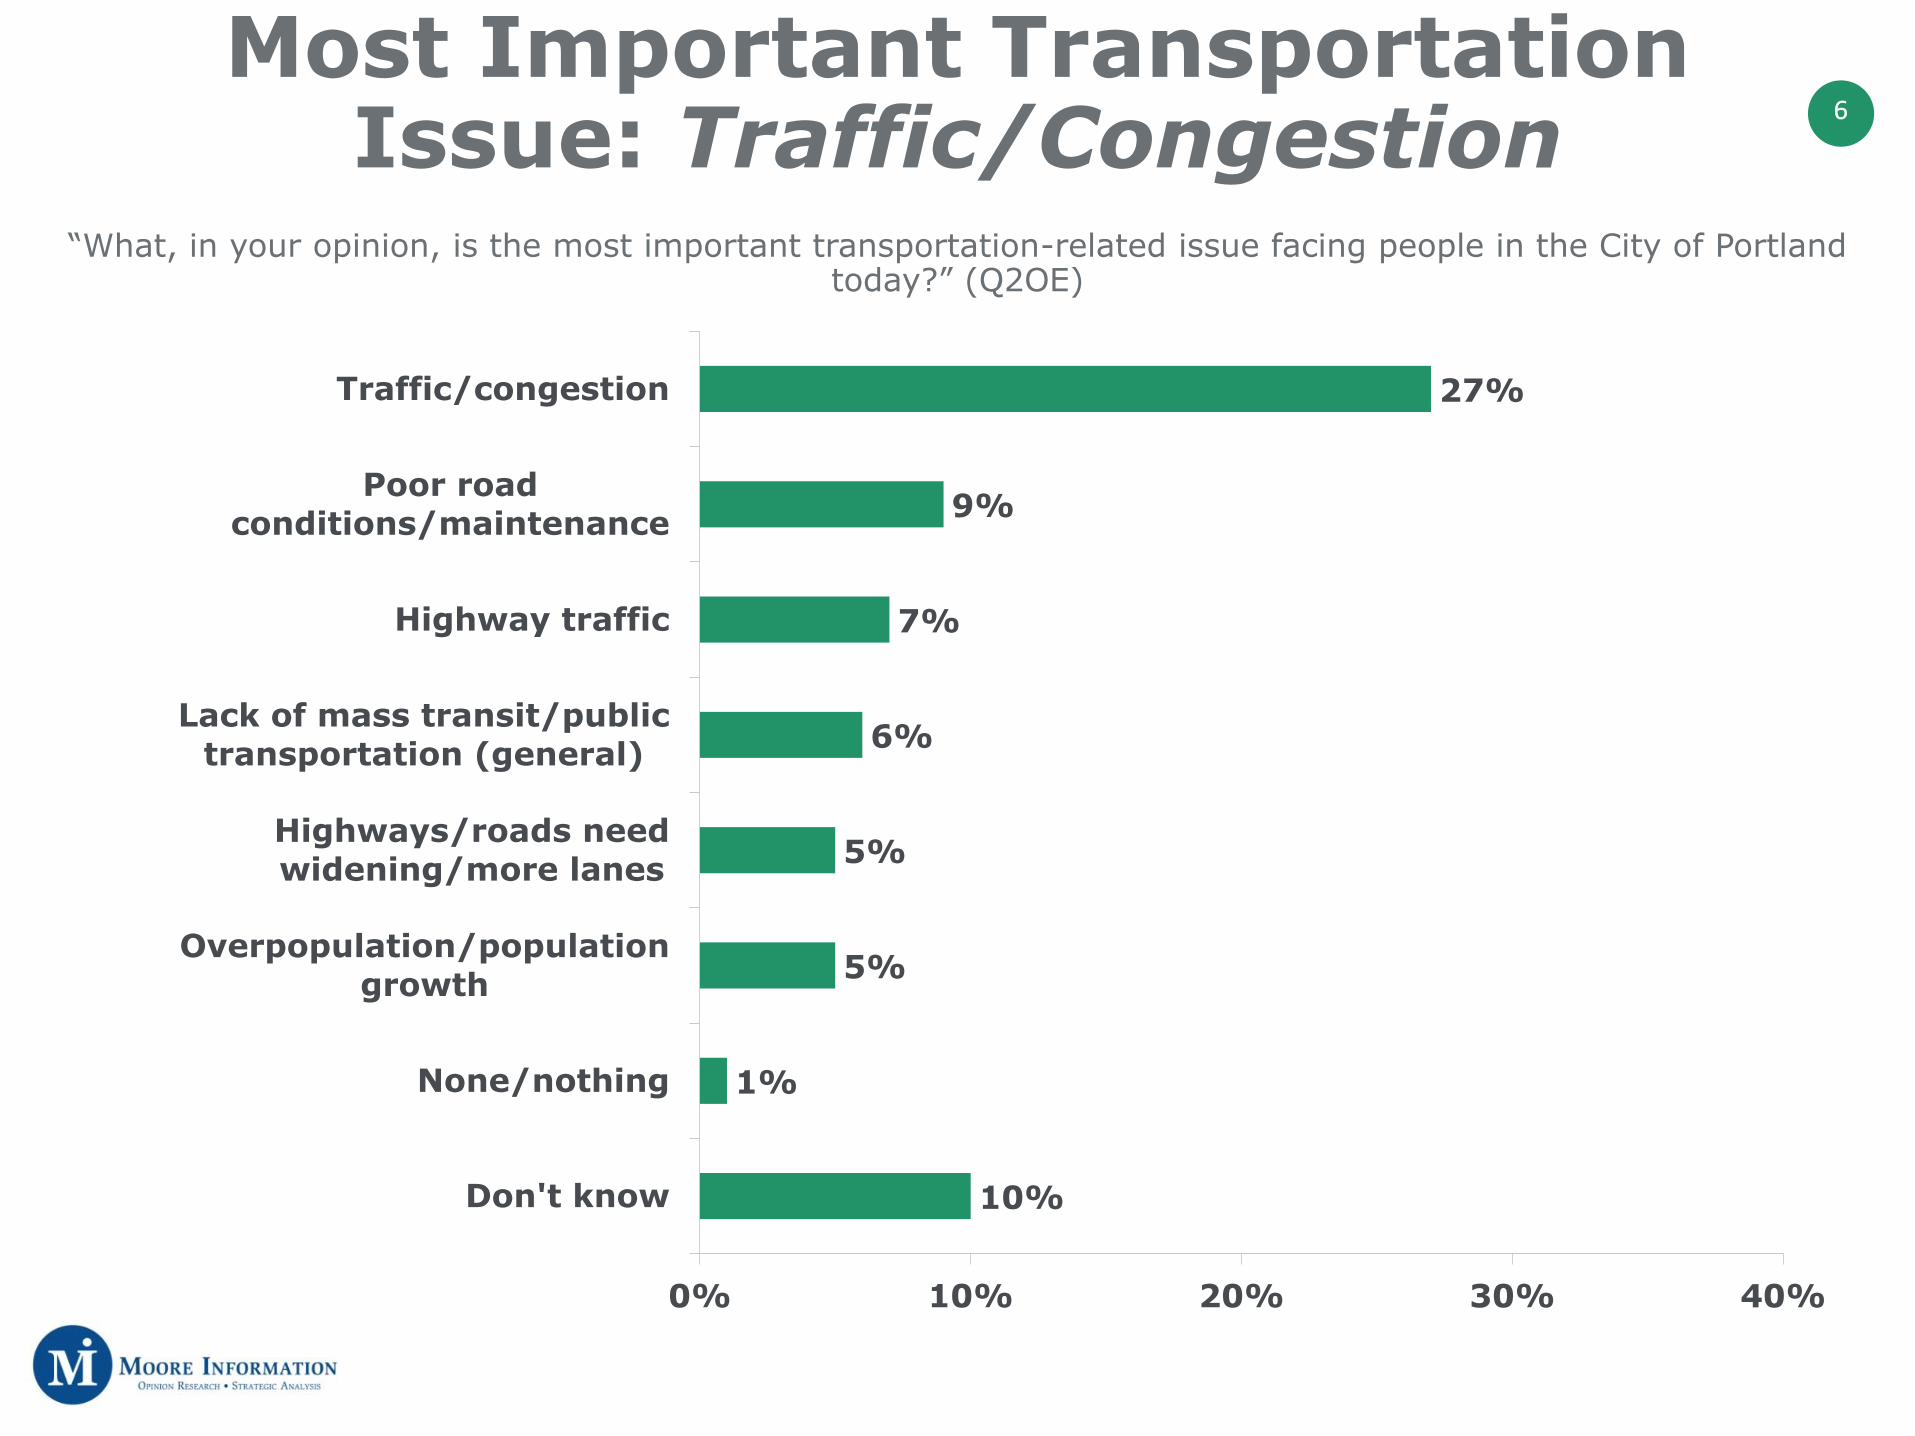
“What, in your opinion, is the most important transportation-related issue facing people in the City of Portland today?” (Q2OE)
Most Important Transportation Issue: Traffic/Congestion
7Most Important Transportation
Issue: RegionRegion
All N NE SW SENW
(N=26)
Outer East
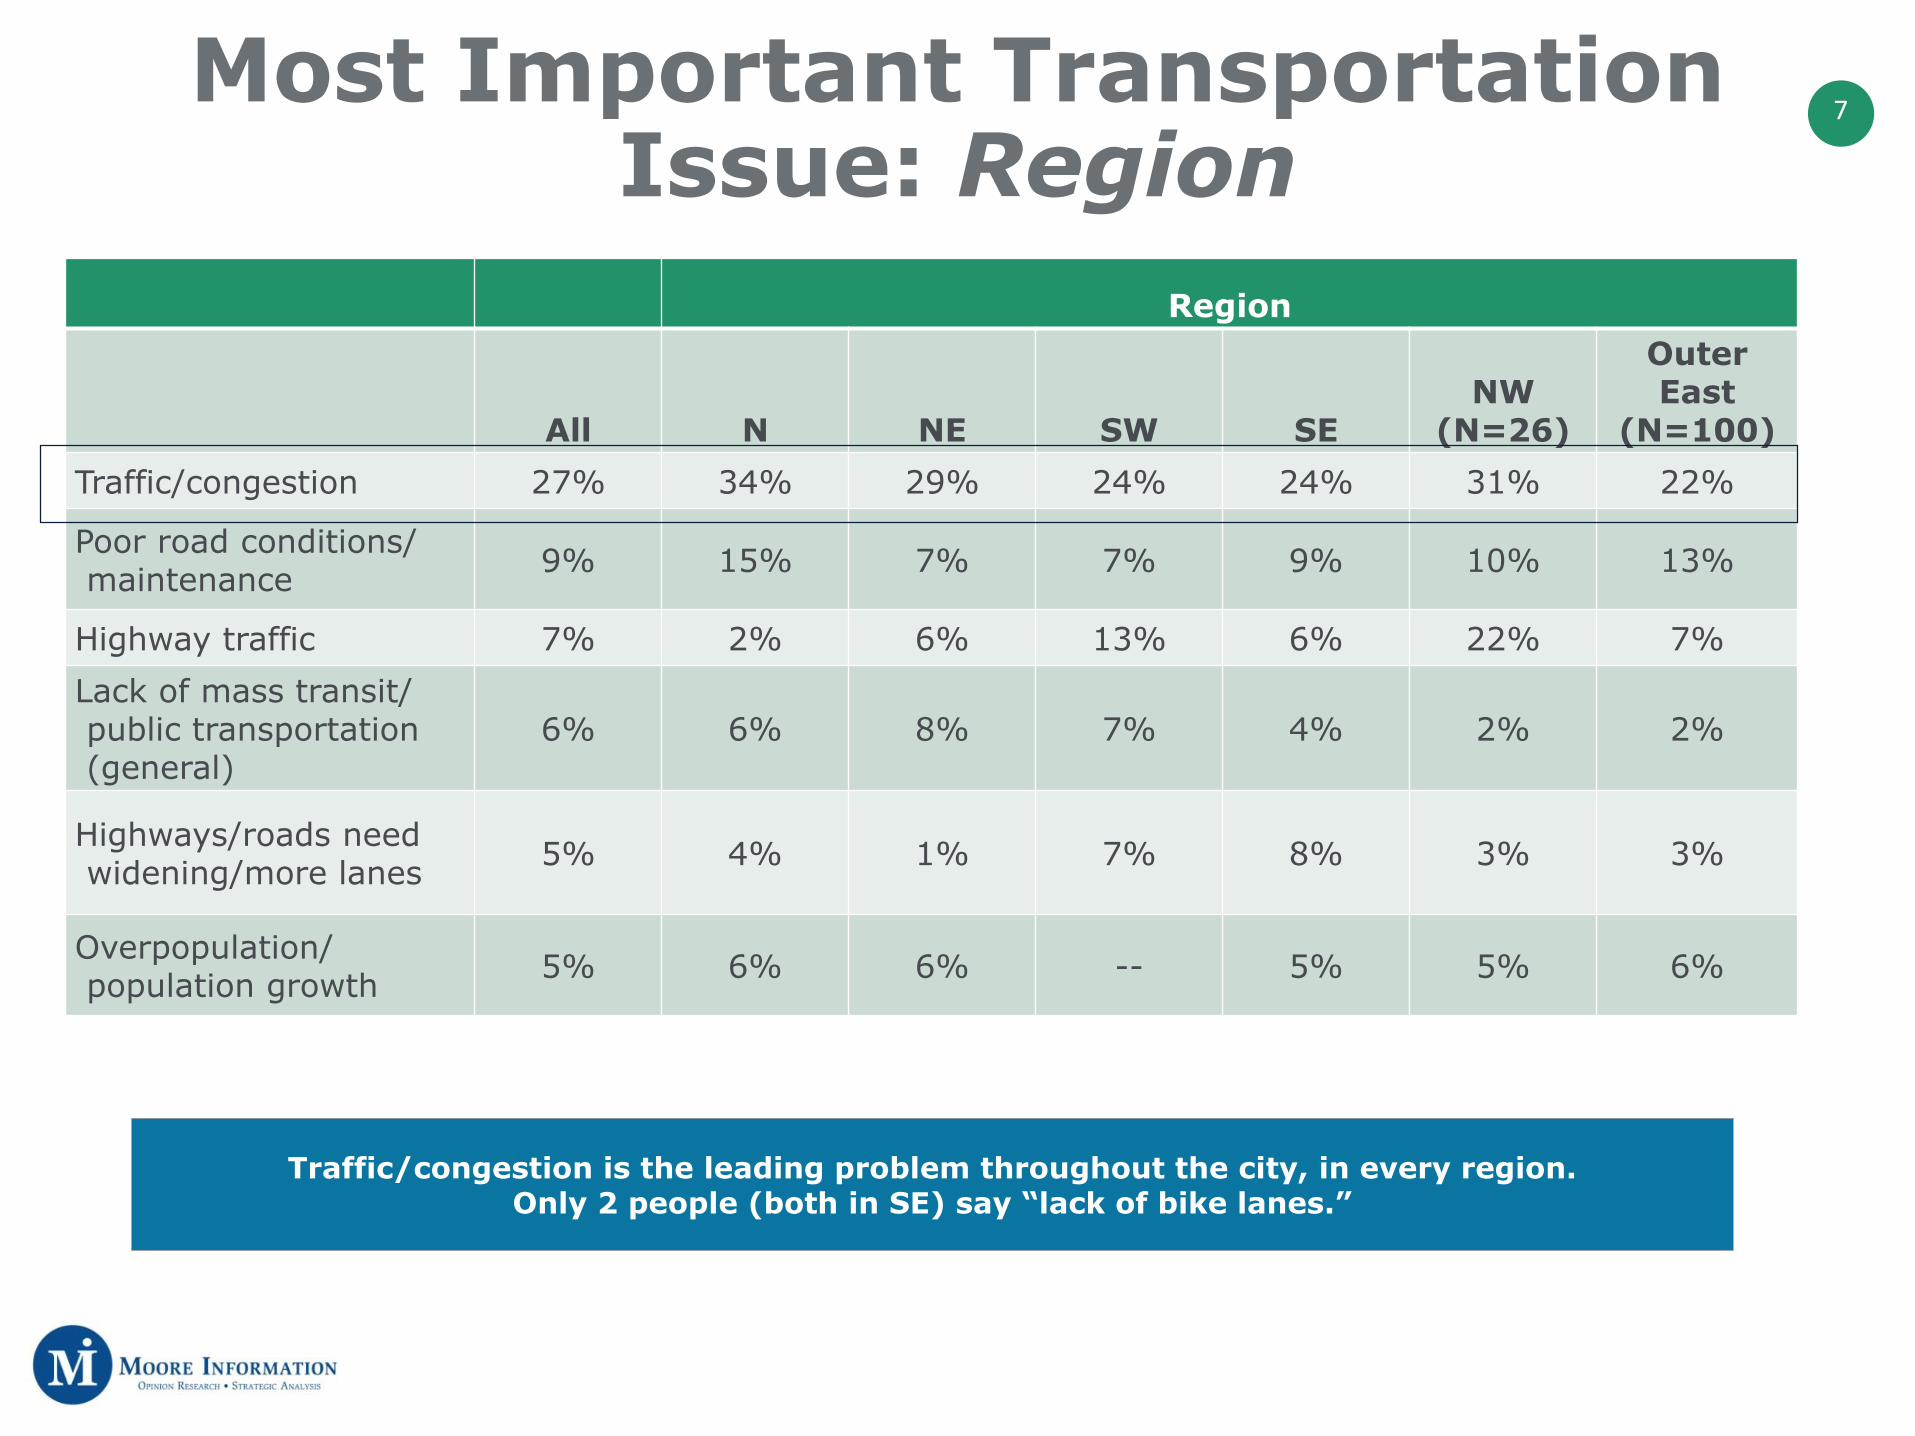
(N=100)Traffic/congestion 27% 34% 29% 24% 24% 31% 22%
Poor road conditions/ maintenance 9% 15% 7% 7% 9% 10% 13%
Highway traffic 7% 2% 6% 13% 6% 22% 7%Lack of mass transit/ public transportation (general)
6% 6% 8% 7% 4% 2% 2%
Highways/roads need widening/more lanes 5% 4% 1% 7% 8% 3% 3%
Overpopulation/ population growth 5% 6% 6% -- 5% 5% 6%
Traffic/congestion is the leading problem throughout the city, in every region. Only 2 people (both in SE) say “lack of bike lanes.”

8
6%
42%
48%
27%
22%
14%
8%3%
0%
20%
40%
60%
Excellent Good Totalexcellent/
good
Average Totalbelow
average/poor
Belowaverage
Poor Don’t know
Rating the City of Portland Transportation System
“How would you rate the transportation system throughout the City of Portland overall?” (Q3)

9City of Portland Transportation
System: Key Subgroups (1)Excellent/
good AverageBelow
average/poorNet
excellent/goodAll 48% 27% 22% +26%Region
N 48% 29% 22% +26%NE 43% 30% 23% +20%SW 61% 23% 16% +45%SE 49% 26% 20% +29%NW (N=26) 36% 31% 33% +3%Outer East (N=100) 40% 30% 25% +15%
GenderMen 42% 31% 24% +18%Women 54% 24% 19% +35%
Age18-34 54% 25% 18% +36%35-44 44% 28% 24% +20%45-54 55% 33% 10% +45%55-64 42% 18% 35% +7%65+ 39% 33% 25% +14%
IncomeLess than $35K 58% 22% 14% +44%$35-$49K 47% 35% 15% +32%$50-$74K 48% 25% 27% +21%$75K or more 39% 28% 30% +9%
SW residents, women and residents age 18-34 and 45-54 are among the most positive. Lower income households are also more likely than higher income households to give higher ratings.

10City of Portland Transportation System: Key Subgroups (2)
Excellent/ good Average
Below average/poor
Net excellent/
goodAll 48% 27% 22% +26%Ethnicity
Caucasians 45% 29% 23% +22%Non-Caucasians 56% 24% 19% +37%
Distance from Downtown Portland
Less than 3 miles 58% 25% 14% +44%3-4 miles 53% 26% 17% +36%5-6 miles 41% 28% 27% +14%7-10 miles 46% 29% 21% +25%11+ miles 33% 38% 29% +4%
Change in commute time last 3 years?
Yes 41% 29% 27% +14%No 61% 18% 17% +44%
Non-Caucasians are more positive than Caucasians, and residents who live closer to downtown are more positive than those who live further away. By commute status, those whose commute
hasn’t changed in the past three years are more positive.
11
27%
9%
8%
7%
7%
6%
6%
4%
0% 10% 20% 30% 40%
Sufficient public transportationavailability (general)
Sufficient MAX/light railavailability
Good system/works well(general)
System could be improved/conditions vary
Better than other cities
Sufficient bus/bus routeavailability
Easy to get around/travel
Reliable system
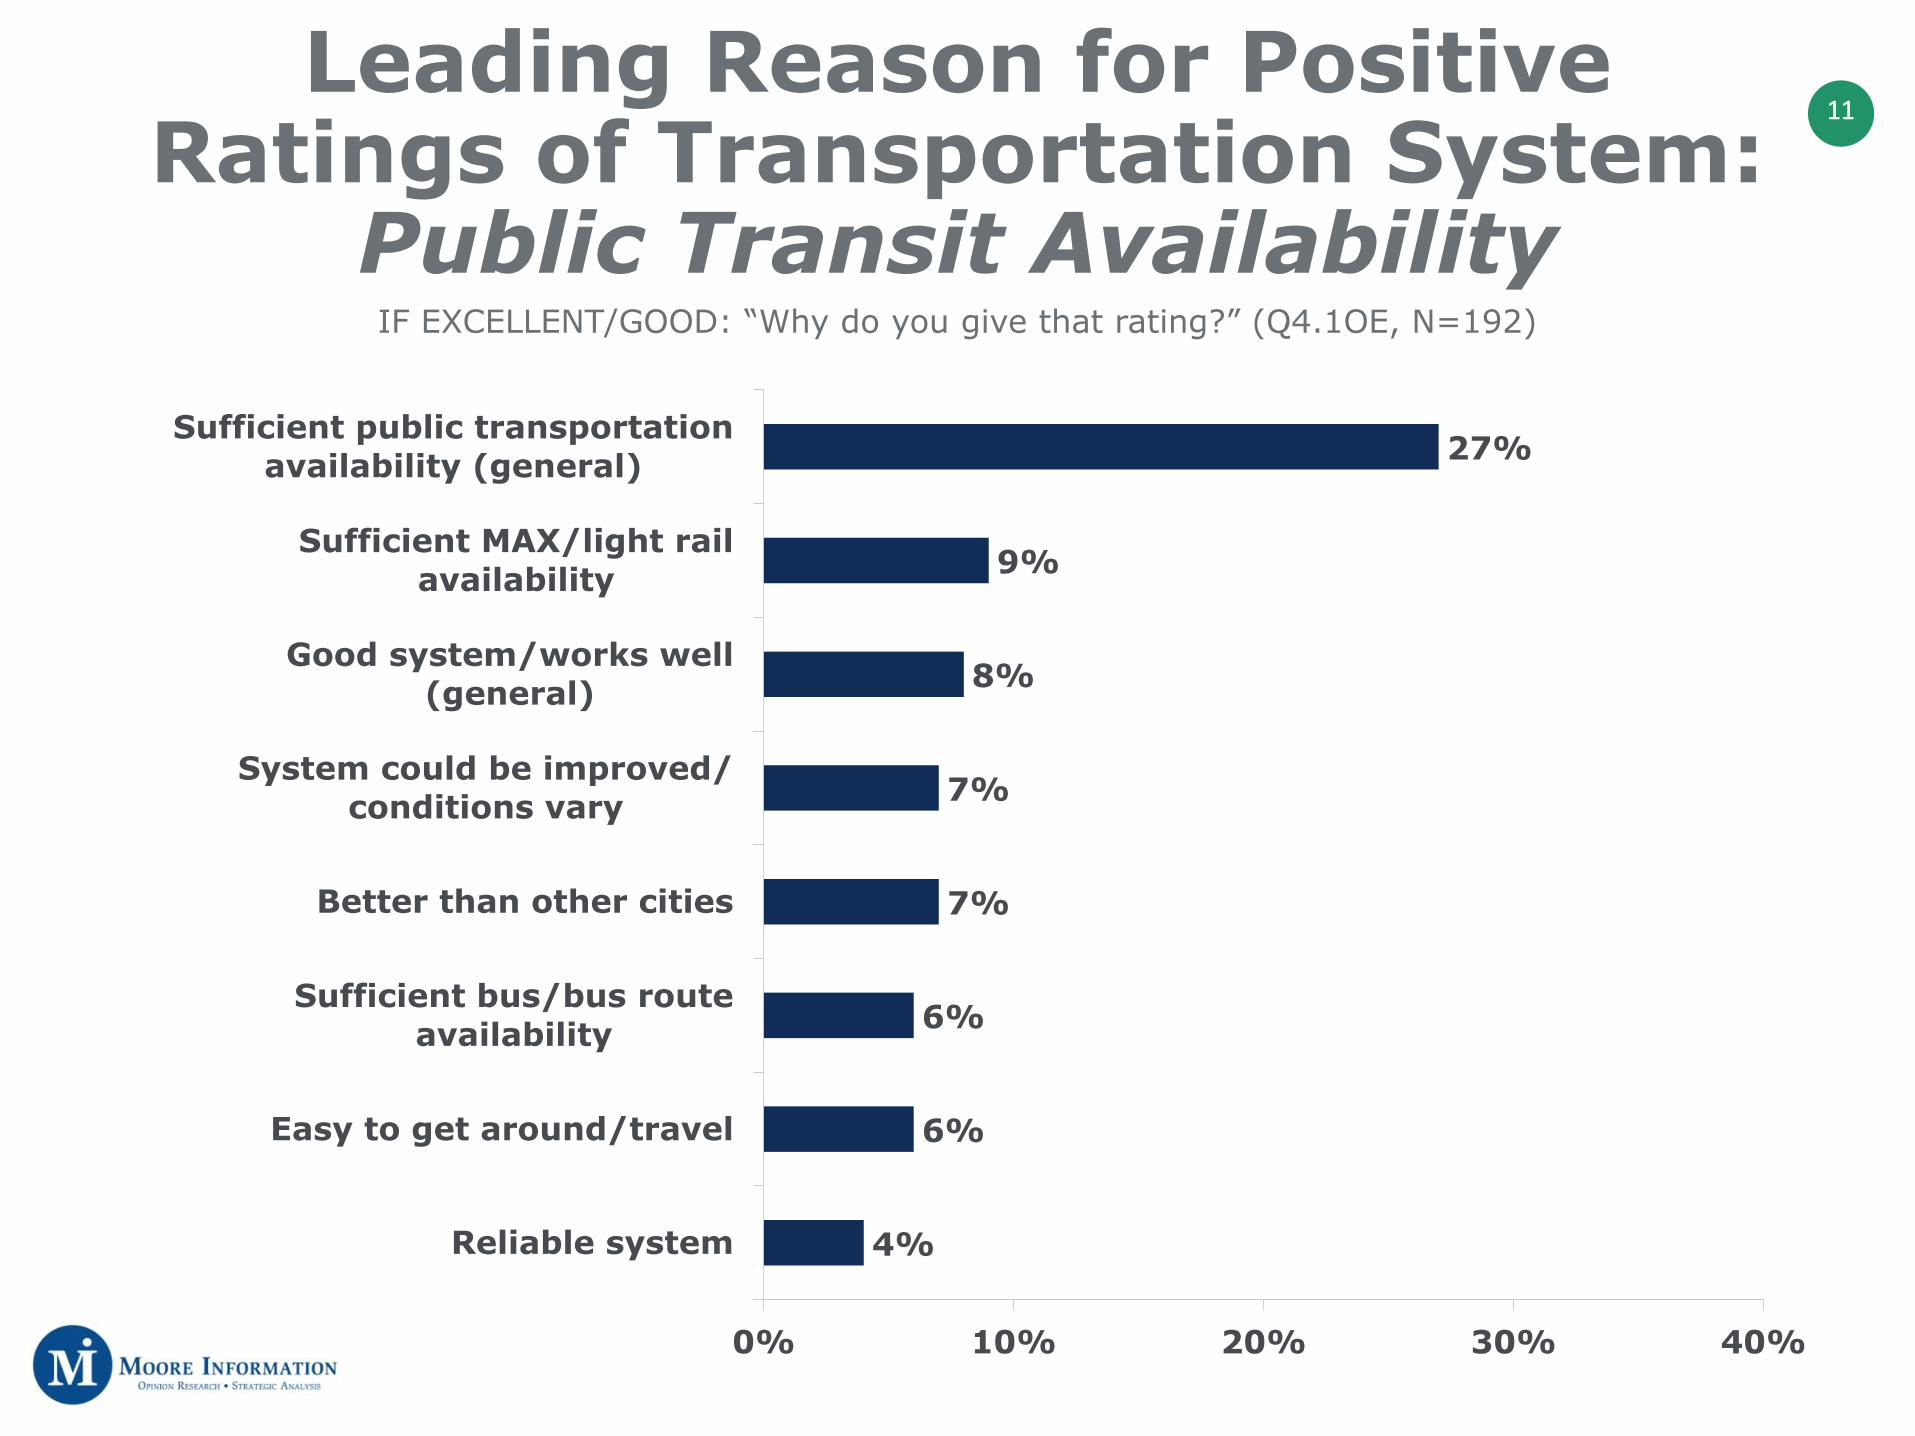
IF EXCELLENT/GOOD: “Why do you give that rating?” (Q4.1OE, N=192)
Leading Reason for Positive Ratings of Transportation System:
Public Transit Availability

12
11%
14%
17%
8%
2%
5%
7%
1%
20%
15%
1%
4%
10%
6%
0%
8%
0% 10% 20% 30% 40%
Poor road conditions/maintenance
Heavy traffic
System could beimproved/conditions vary/average
Lack of public transportation/routeavailability (general)
Overpopulation/many people onroads
Slow system/long commute
Sufficient public transportation availability (general)
Inefficient city planning/no room for growth
Average (N=110)Below average/poor (N=86)
IF AVERAGE/BELOW AVERAGE/POOR: “Why do you give that rating?” (Q4.2OE, N=196)
Variety of Reasons for Neutral/Negative Ratings
13
14%
35%
49%
22%
16%
7% 9%13%
0%
20%
40%
60%
Excellent Good Totalexcellent/
good
Average Totalbelow
average/poor
Belowaverage
Poor Don’t know
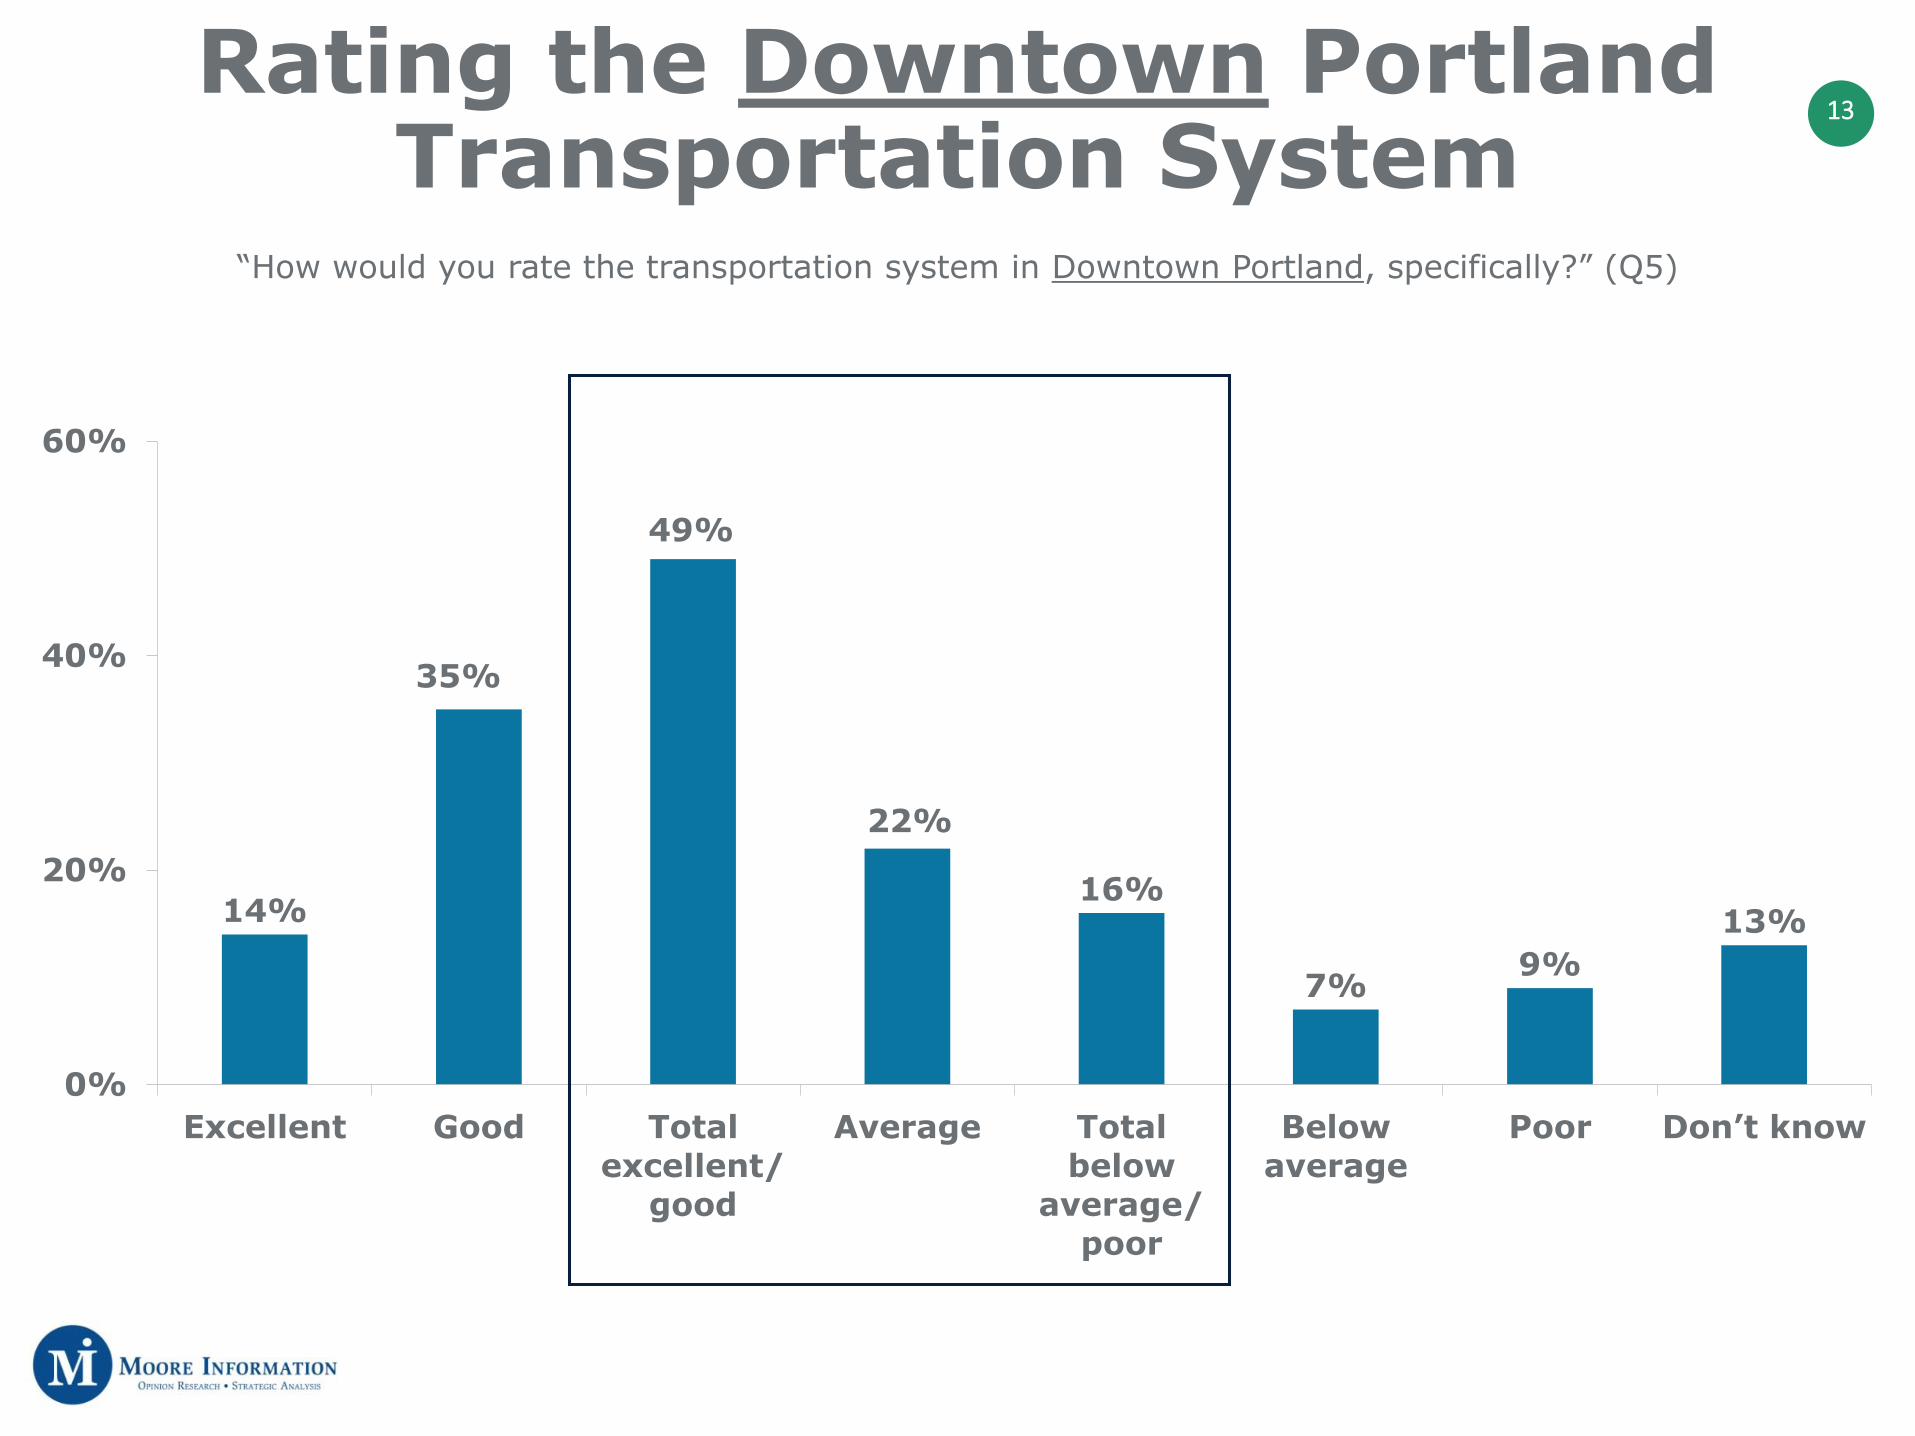
Rating the Downtown Portland Transportation System
“How would you rate the transportation system in Downtown Portland, specifically?” (Q5)
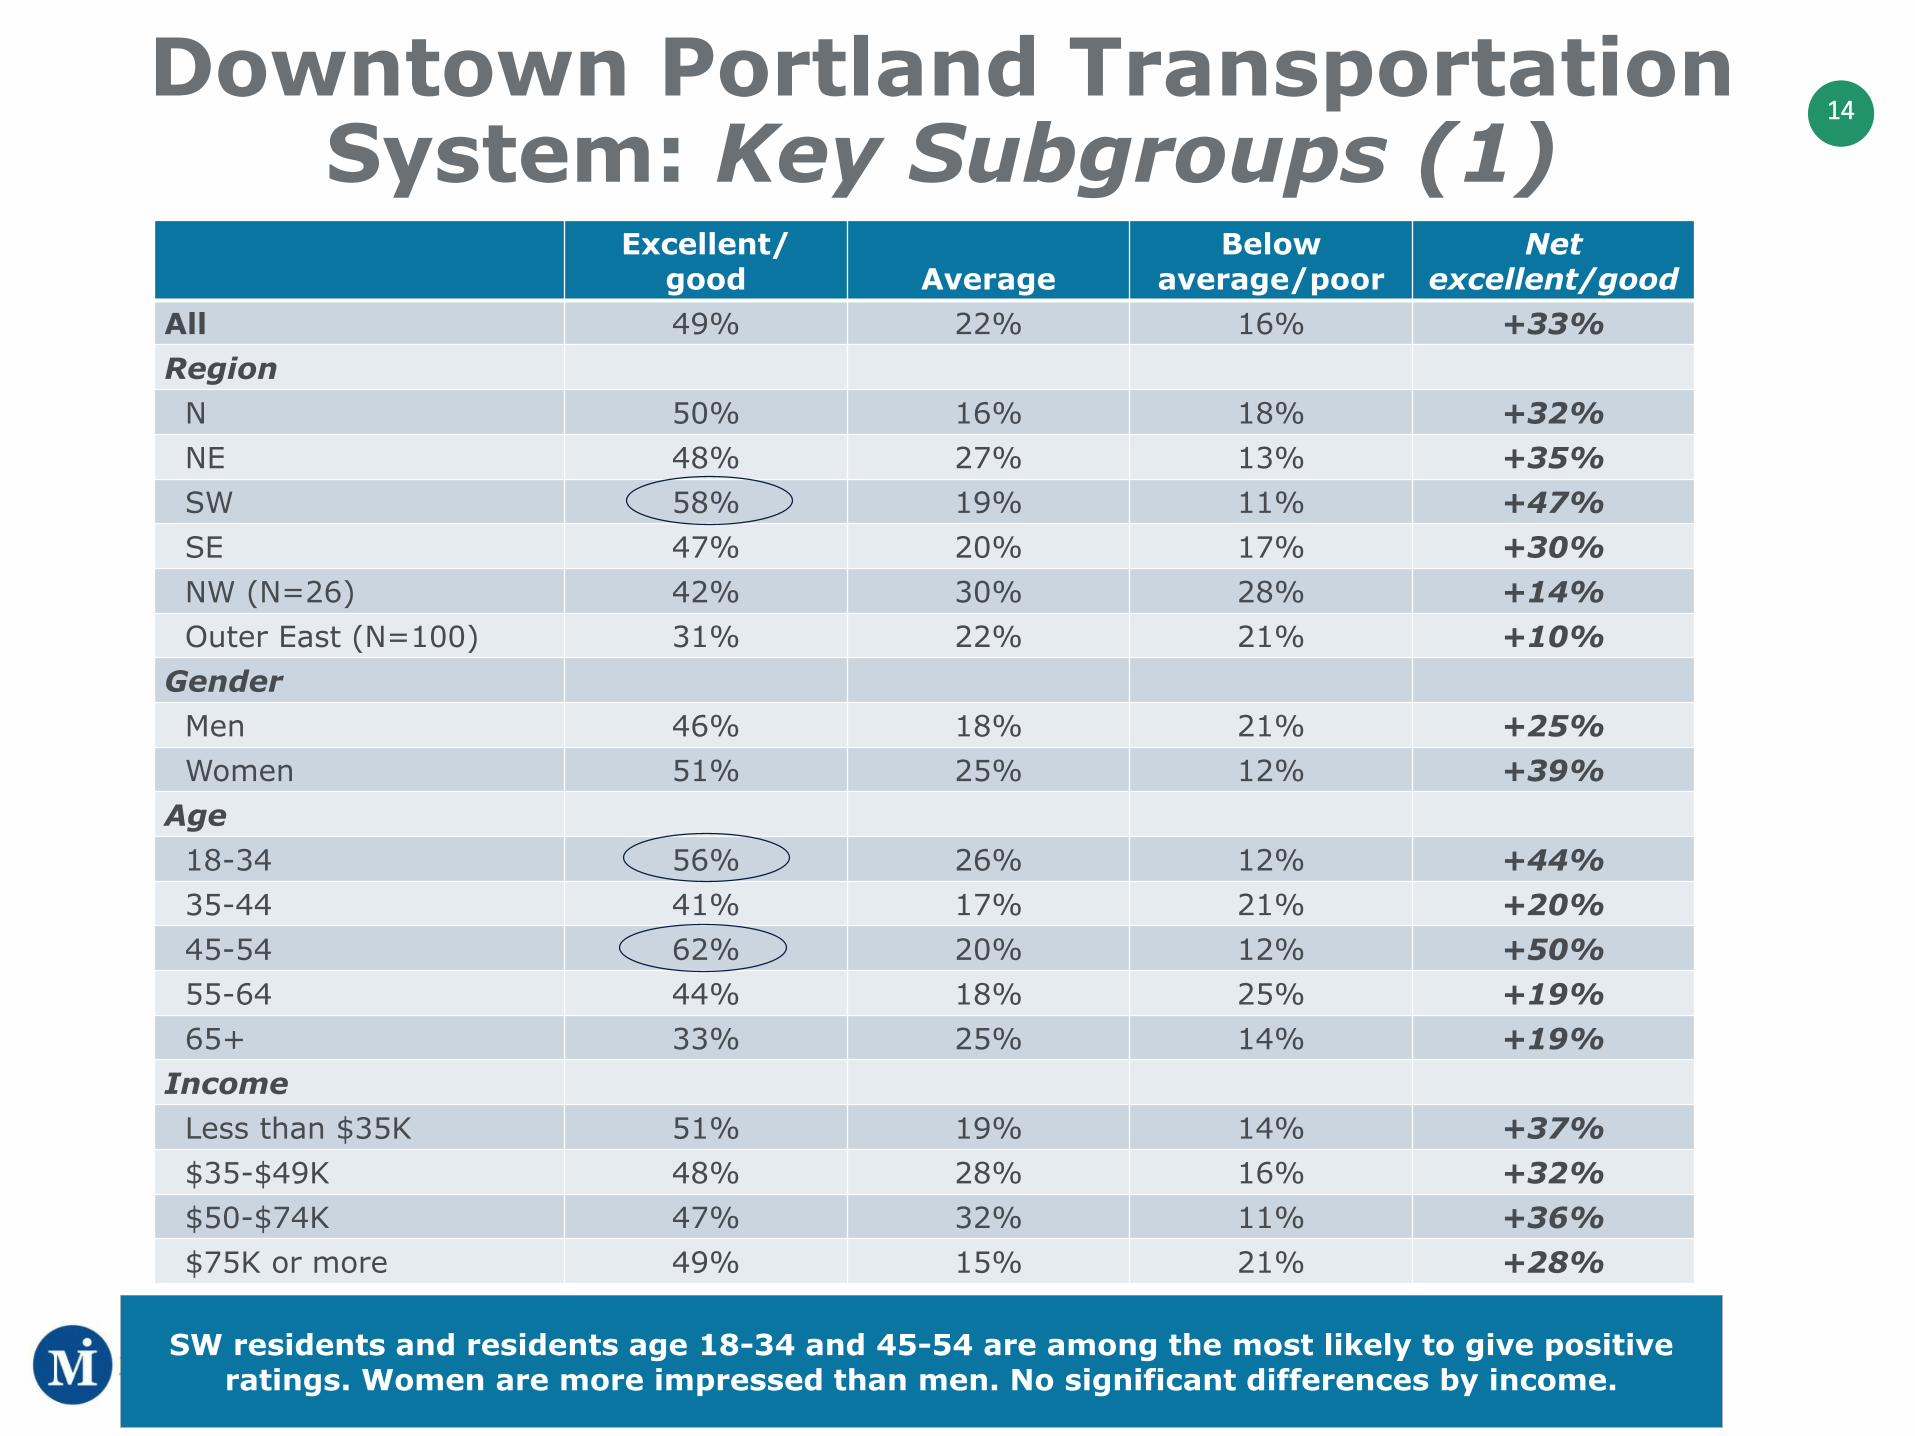
14Downtown Portland Transportation
System: Key Subgroups (1)Excellent/
good AverageBelow
average/poorNet
excellent/goodAll 49% 22% 16% +33%Region
N 50% 16% 18% +32%NE 48% 27% 13% +35%SW 58% 19% 11% +47%SE 47% 20% 17% +30%NW (N=26) 42% 30% 28% +14%Outer East (N=100) 31% 22% 21% +10%
GenderMen 46% 18% 21% +25%Women 51% 25% 12% +39%
Age18-34 56% 26% 12% +44%35-44 41% 17% 21% +20%45-54 62% 20% 12% +50%55-64 44% 18% 25% +19%65+ 33% 25% 14% +19%
IncomeLess than $35K 51% 19% 14% +37%$35-$49K 48% 28% 16% +32%$50-$74K 47% 32% 11% +36%$75K or more 49% 15% 21% +28%
SW residents and residents age 18-34 and 45-54 are among the most likely to give positive ratings. Women are more impressed than men. No significant differences by income.

15Downtown Portland Transportation System: Key Subgroups (2)
Excellent/ good Average
Below average/
poor
Net excellent/
goodAll 49% 22% 16% +33%Ethnicity
Caucasians 49% 22% 12% +37%Non-Caucasians 48% 20% 21% +27%
Distance from Downtown PortlandLess than 3 miles 57% 23% 12% +45%3-4 miles 51% 21% 17% +34%5-6 miles 46% 26% 15% +31%7-10 miles 46% 15% 20% +26%11+ miles 42% 28% 18% +24%
Change in commute time in last 3 years?
Yes 47% 18% 23% +24%No 65% 17% 10% +55%
Residents who live closer to Downtown are more positive than those who live farther away. Commuters who have not experienced a change in their commute time in past 3 years are more
positive.
16
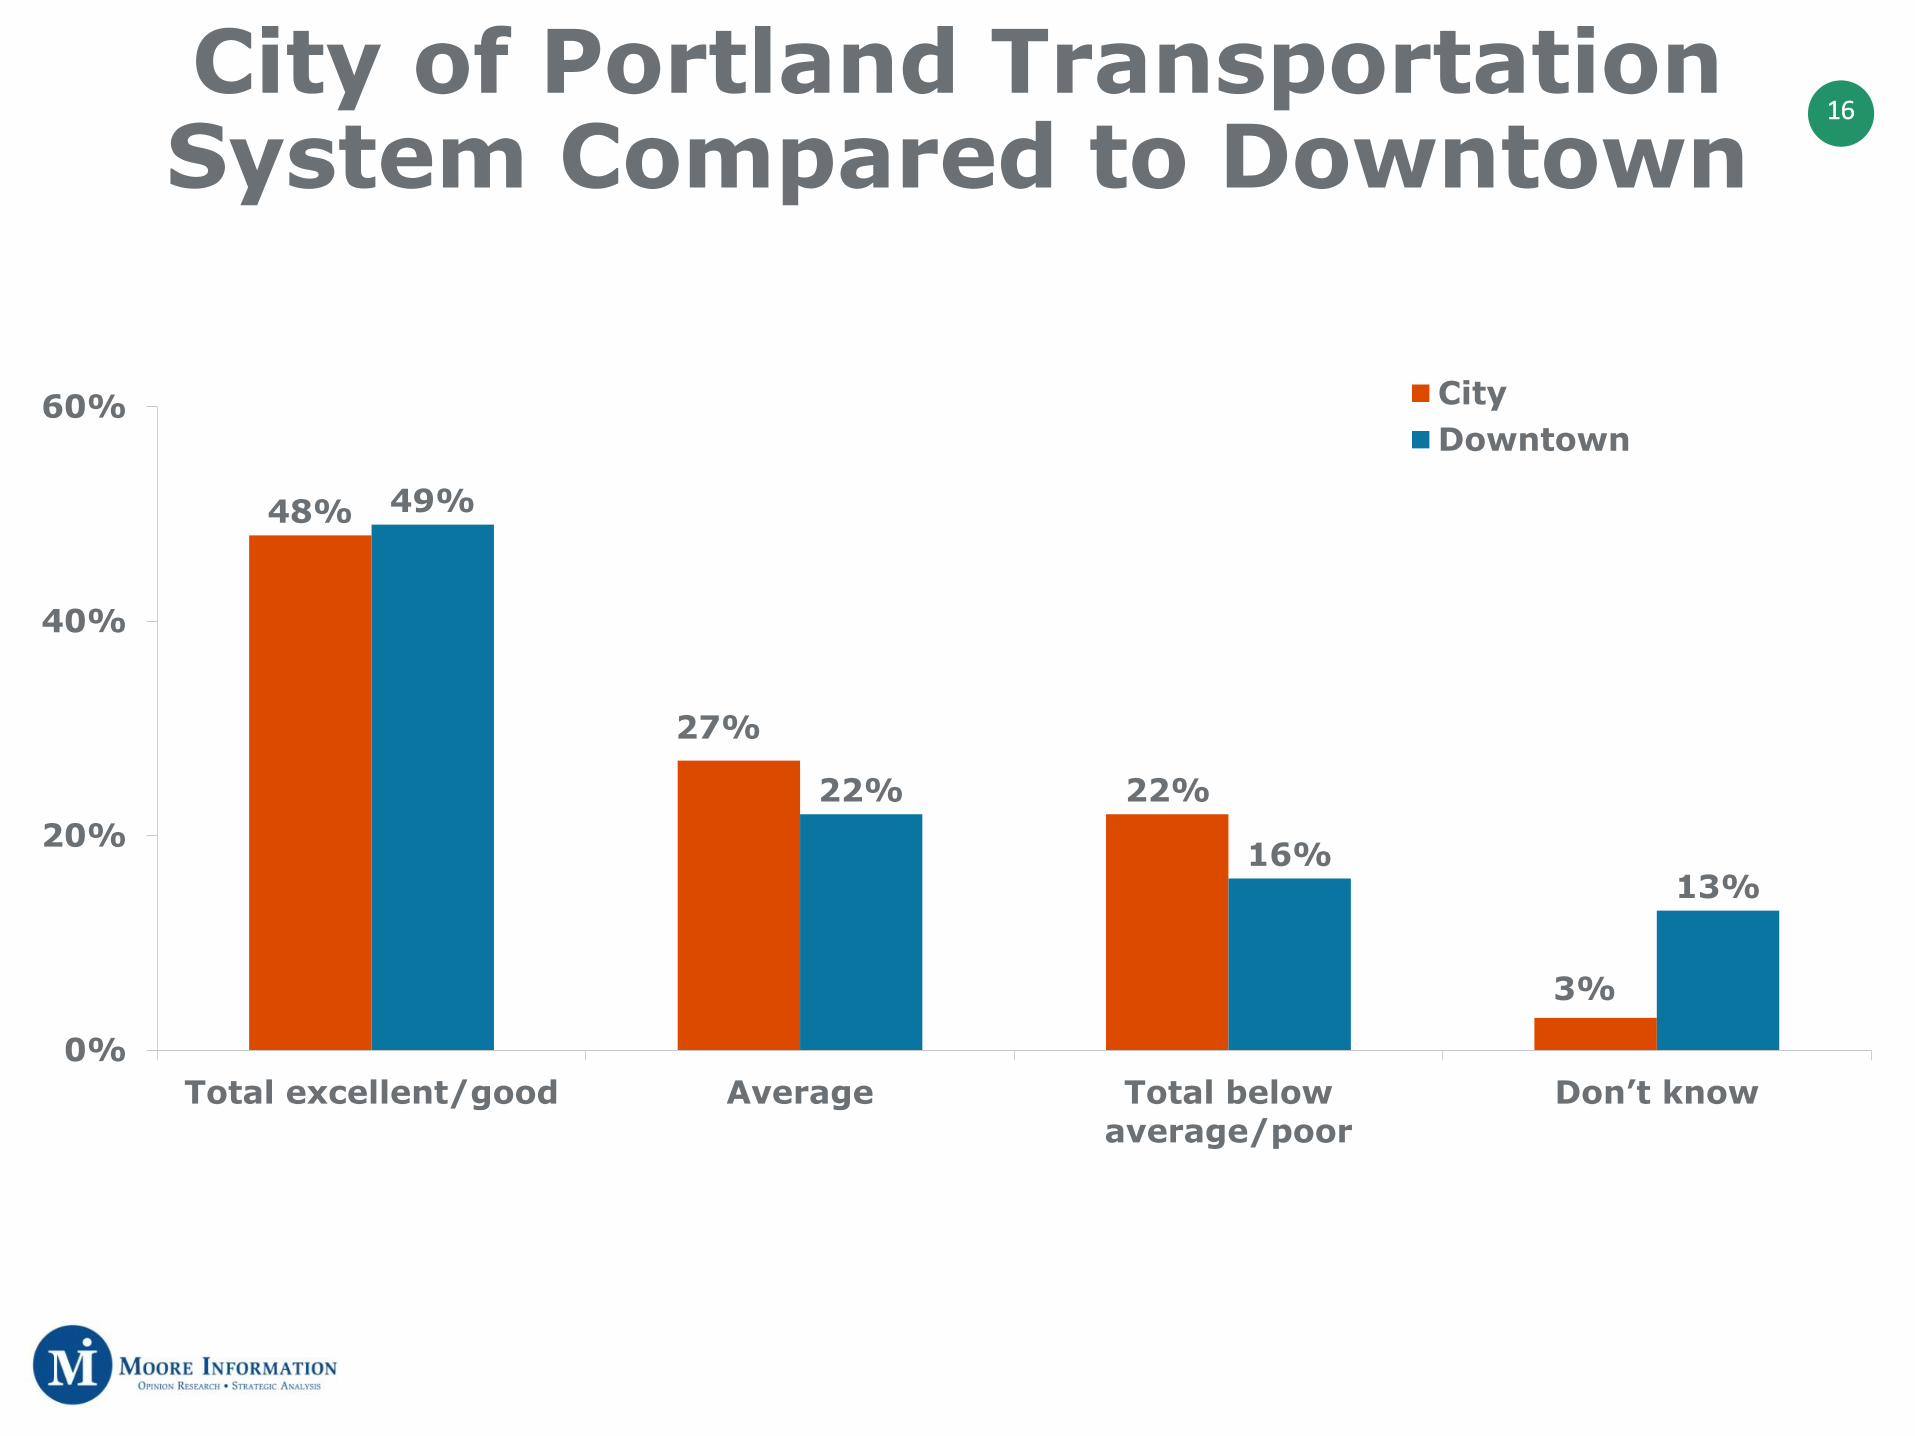
48%
27%
22%
3%
49%
22%
16%13%
0%
20%
40%
60%
Total excellent/good Average Total belowaverage/poor
Don’t know
CityDowntown
City of Portland Transportation System Compared to Downtown

17
4%
12%16%
24%
59%
22%
37%
1%0%
20%
40%
60%
Excellent Good Totalexcellent/
good
Average Totalbelow
average/poor
Belowaverage
Poor Don’t know
City’s Job Performance: Rating Pothole/Street/Road Repair
“How would you rate the job the City of Portland has done repairing potholes and improving the quality of City streets and roads?” (Q6)
All key subgroups rate the City’s performance as “below average/poor.”
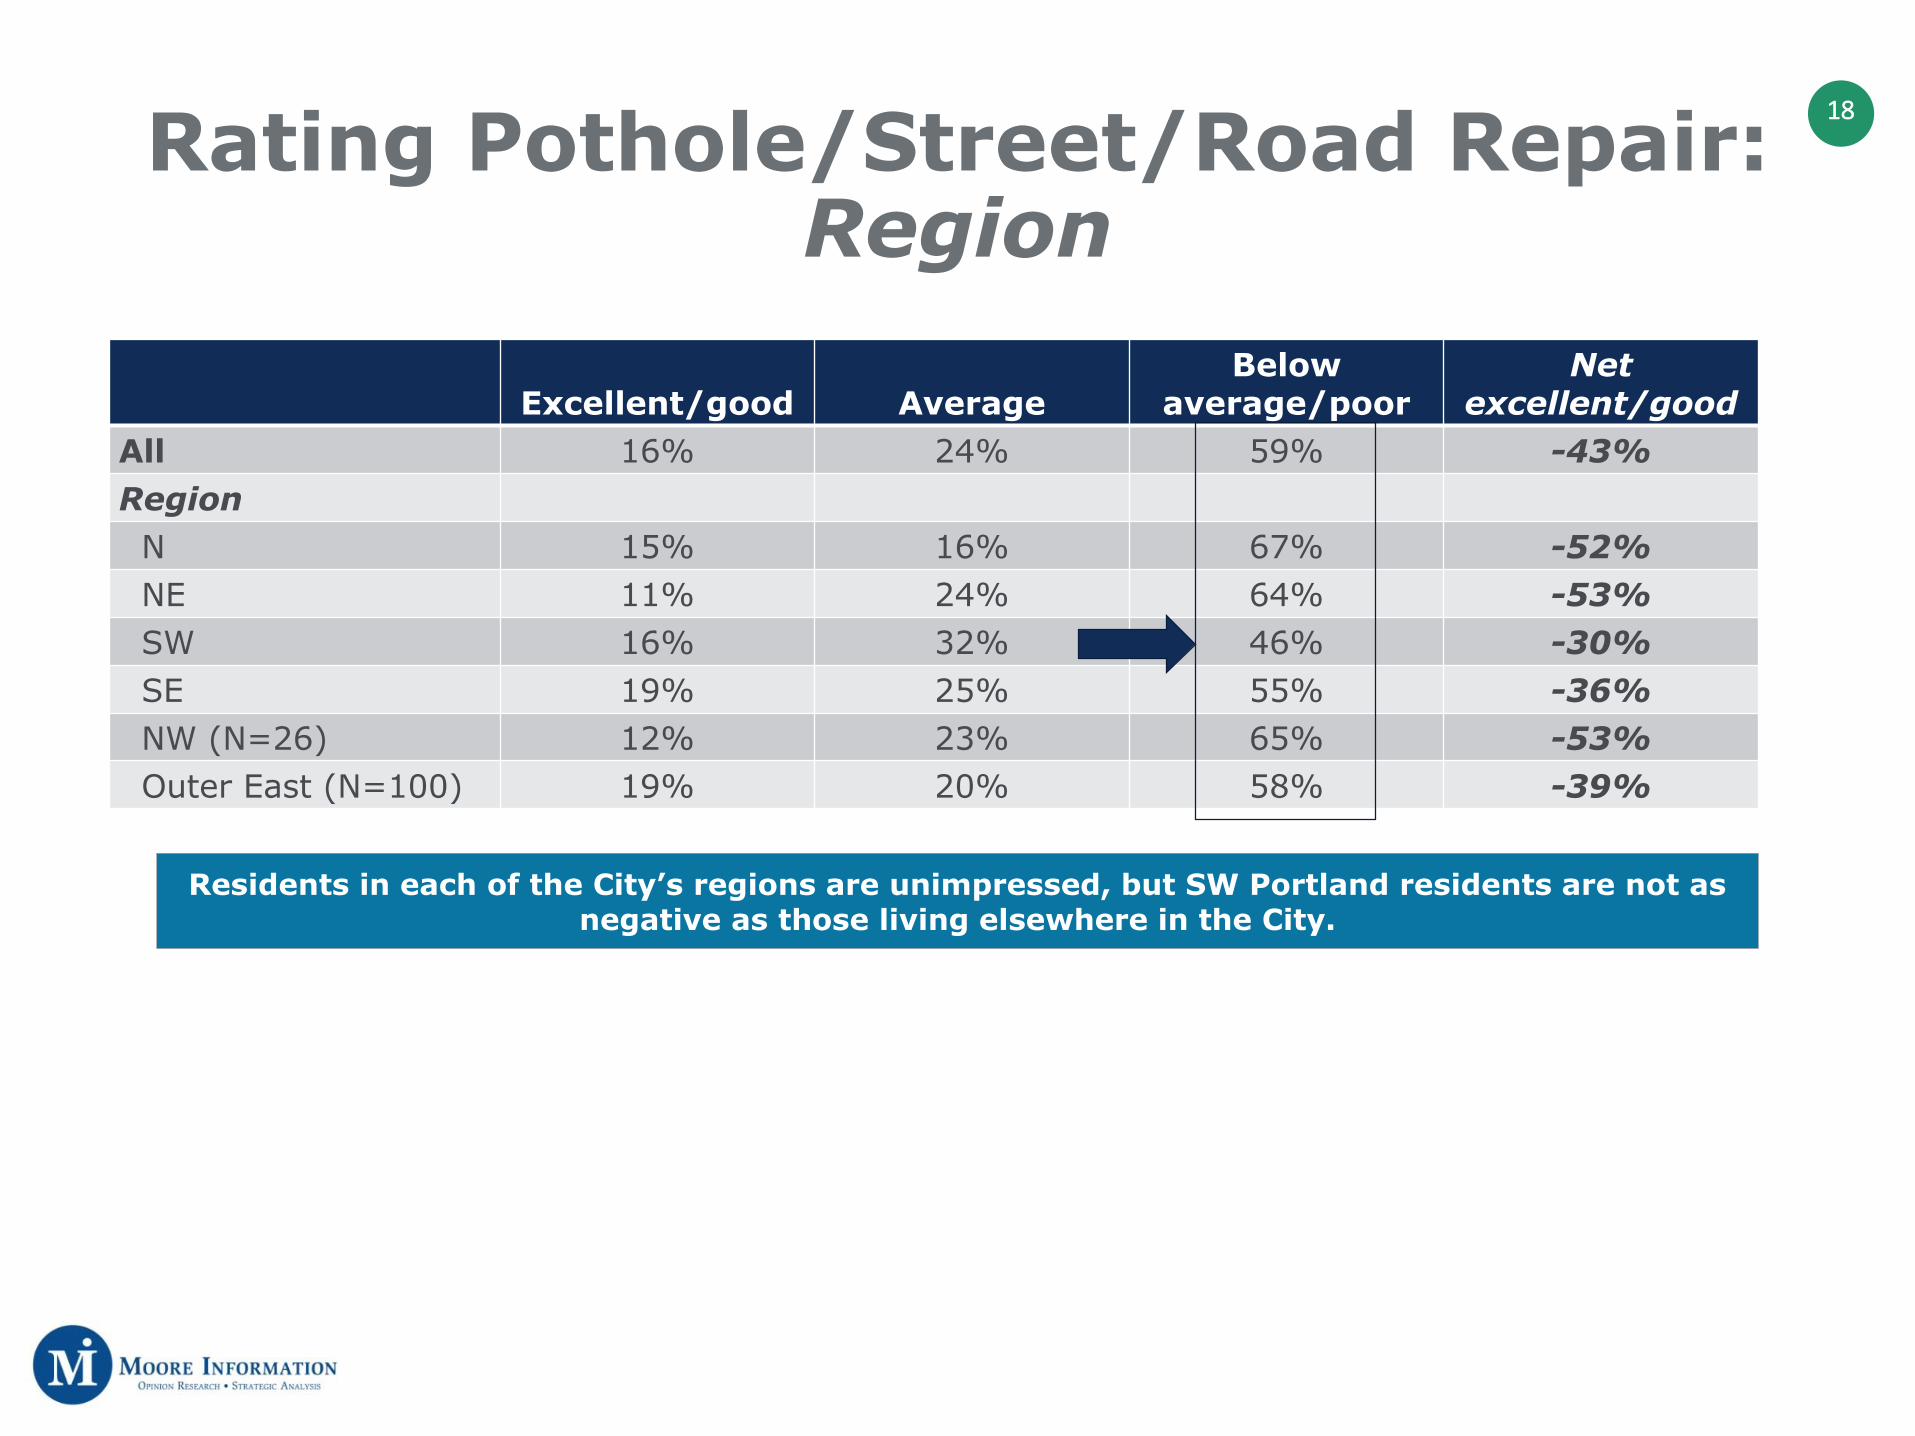
18Rating Pothole/Street/Road Repair:Region
Excellent/good AverageBelow
average/poorNet
excellent/goodAll 16% 24% 59% -43%Region
N 15% 16% 67% -52%NE 11% 24% 64% -53%SW 16% 32% 46% -30%SE 19% 25% 55% -36%NW (N=26) 12% 23% 65% -53%Outer East (N=100) 19% 20% 58% -39%
Residents in each of the City’s regions are unimpressed, but SW Portland residents are not as negative as those living elsewhere in the City.
19
56%
11%
9%
5%
3%
3%
3%
3%
1%
5%
2%
0% 20% 40% 60%
Congestion
Lack of certainty about how long it will take toget there by car
Parking issues
Lack of certainty about how long it will take toget there by bus, light rail or street car service
Lack of bus, light rail or street car service
Road construction
Lack of sidewalks
Safety issues when biking and walking
Lack of bike ways
Other
Don’t know
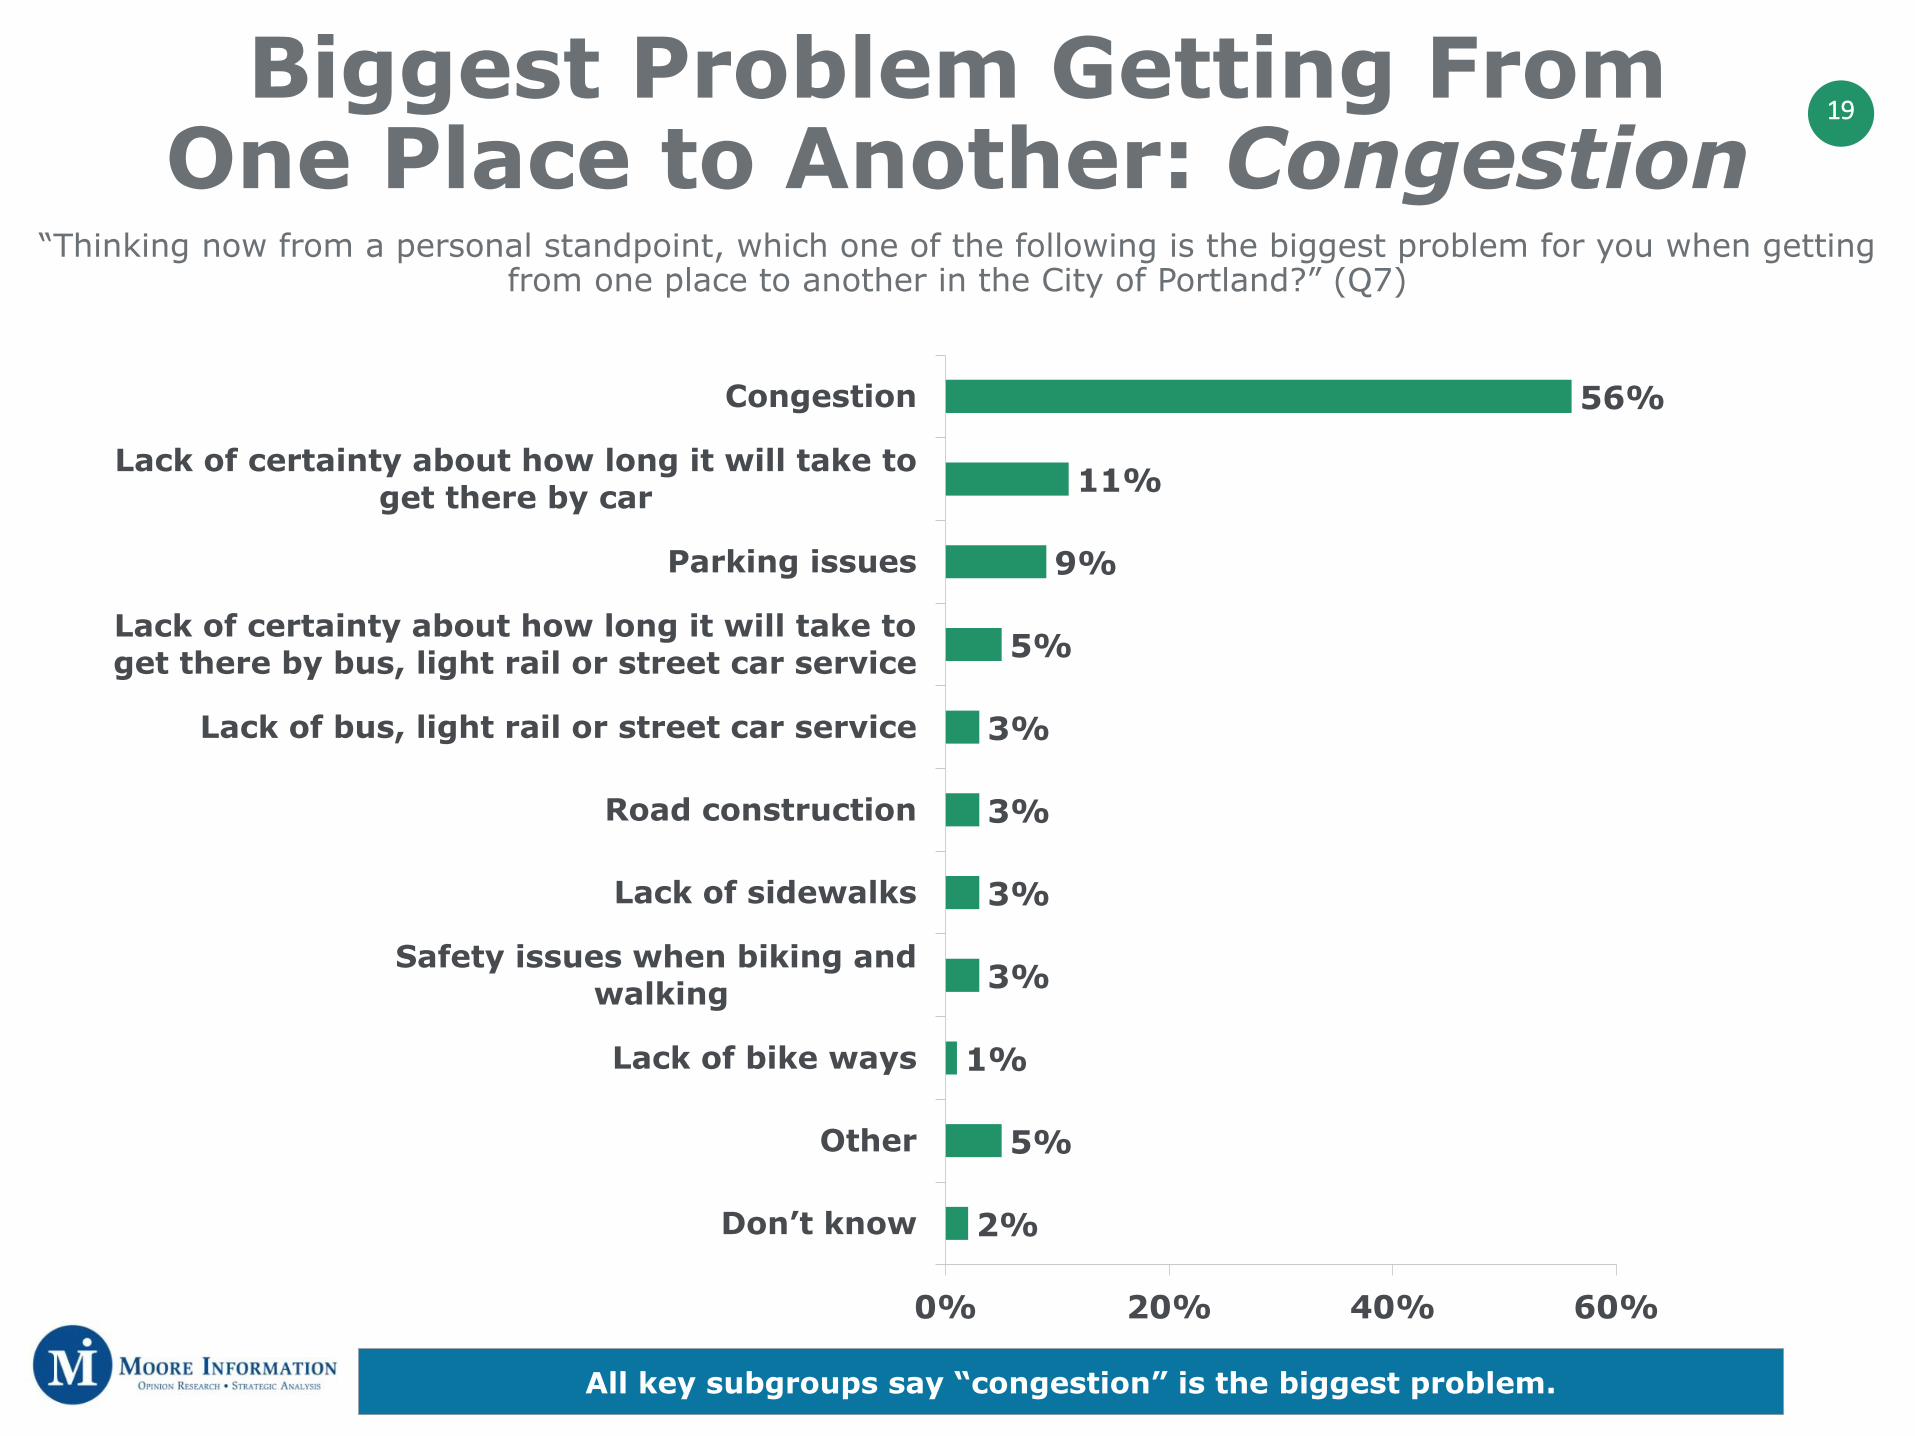
“Thinking now from a personal standpoint, which one of the following is the biggest problem for you when getting from one place to another in the City of Portland?” (Q7)
Biggest Problem Getting From One Place to Another: Congestion
All key subgroups say “congestion” is the biggest problem.
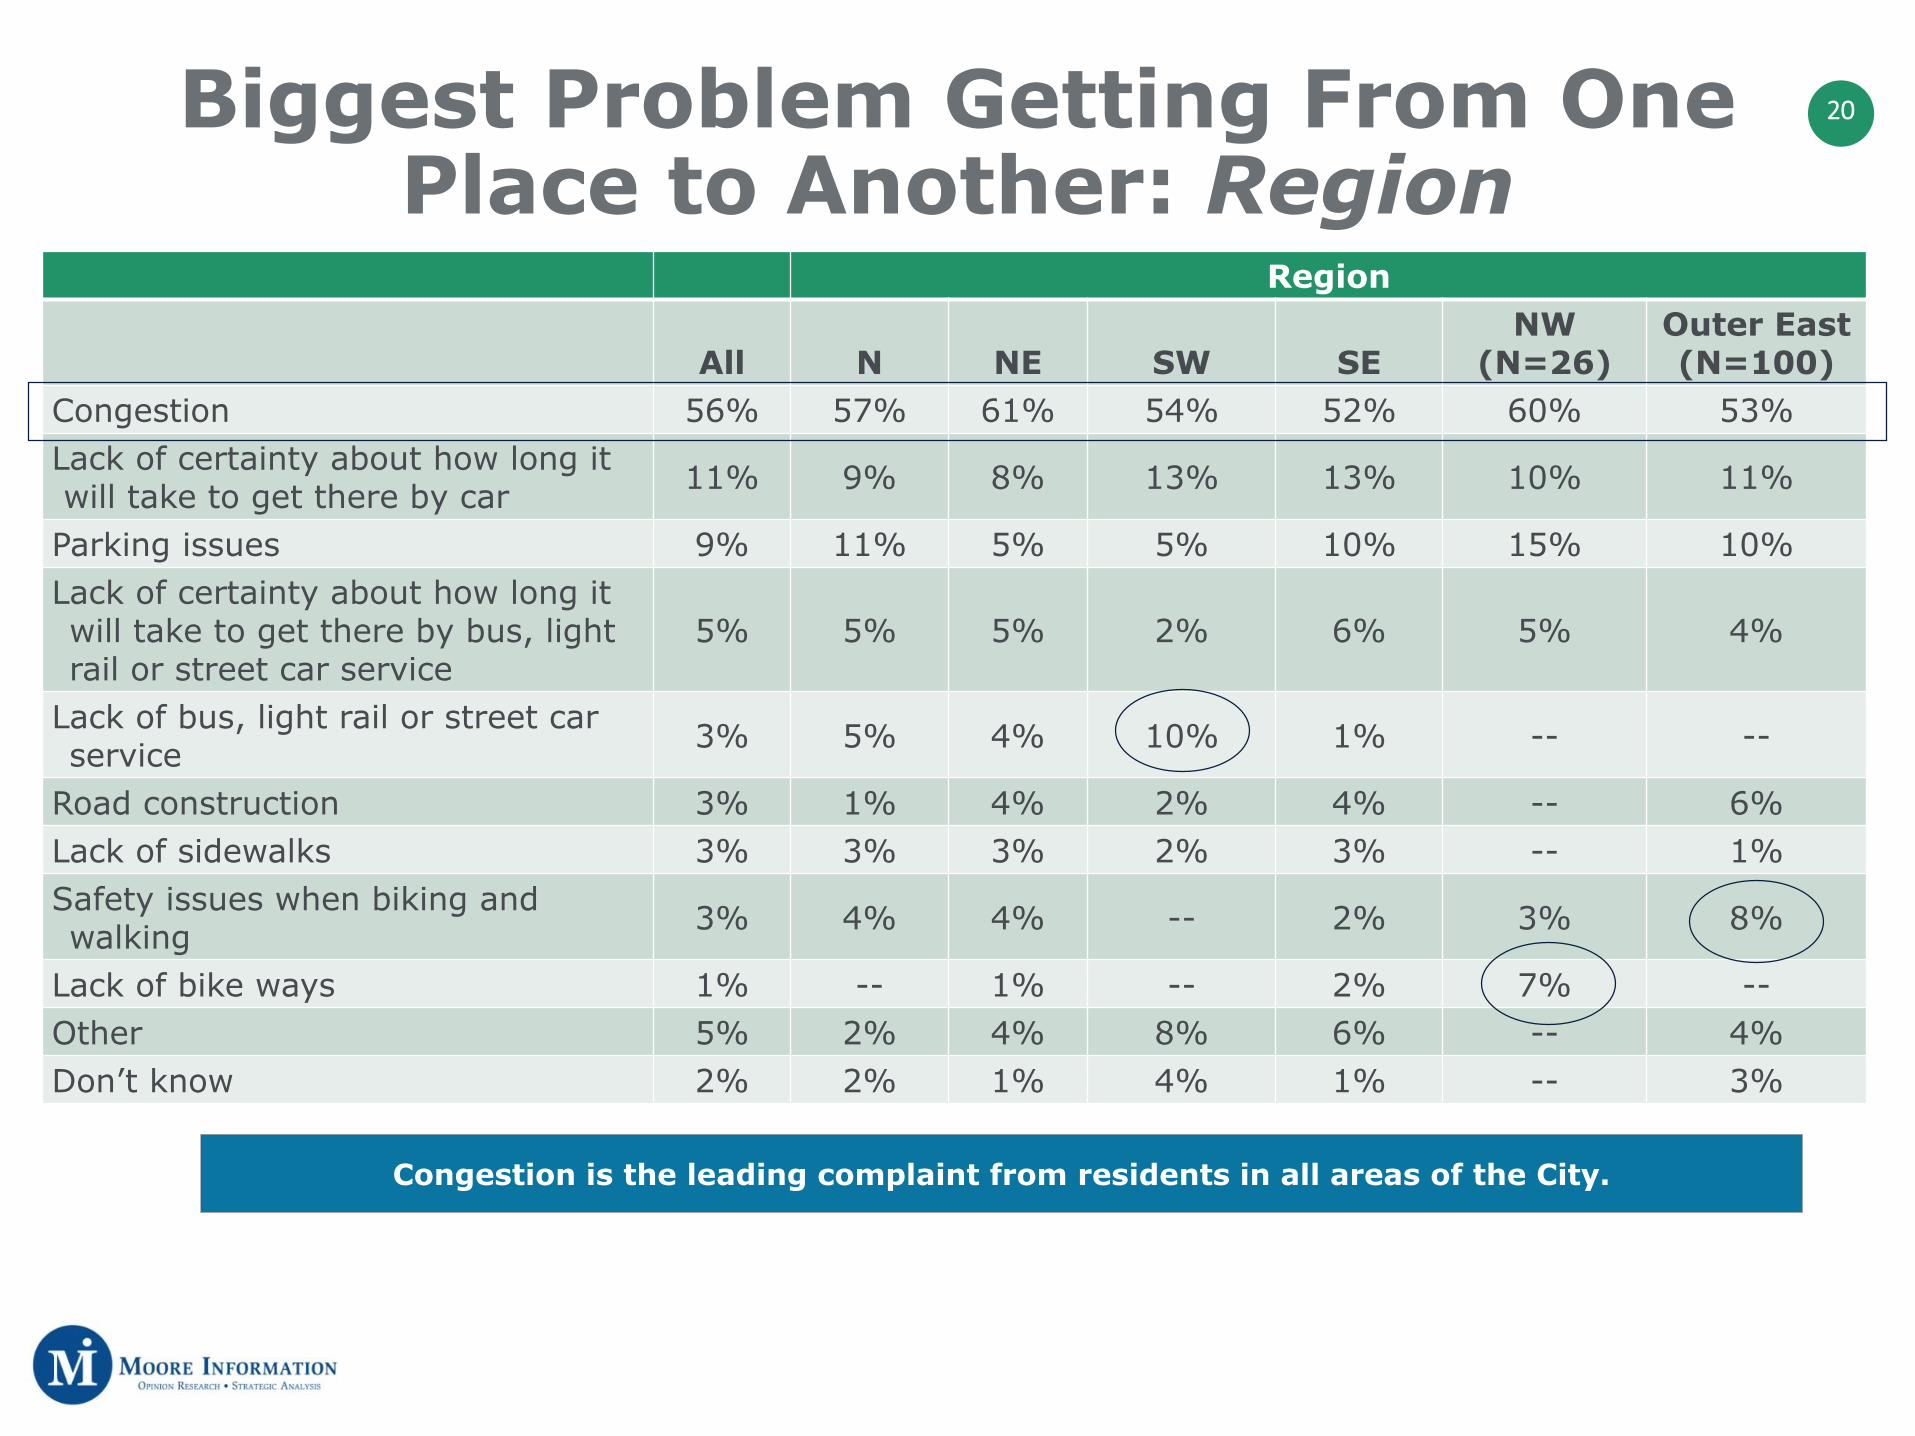
20Biggest Problem Getting From One Place to Another: Region
Region
All N NE SW SENW
(N=26)Outer East (N=100)
Congestion 56% 57% 61% 54% 52% 60% 53%Lack of certainty about how long it will take to get there by car 11% 9% 8% 13% 13% 10% 11%
Parking issues 9% 11% 5% 5% 10% 15% 10%Lack of certainty about how long it will take to get there by bus, light rail or street car service
5% 5% 5% 2% 6% 5% 4%
Lack of bus, light rail or street car service 3% 5% 4% 10% 1% -- --
Road construction 3% 1% 4% 2% 4% -- 6%Lack of sidewalks 3% 3% 3% 2% 3% -- 1%Safety issues when biking and walking 3% 4% 4% -- 2% 3% 8%
Lack of bike ways 1% -- 1% -- 2% 7% --Other 5% 2% 4% 8% 6% -- 4%Don’t know 2% 2% 1% 4% 1% -- 3%
Congestion is the leading complaint from residents in all areas of the City.
21
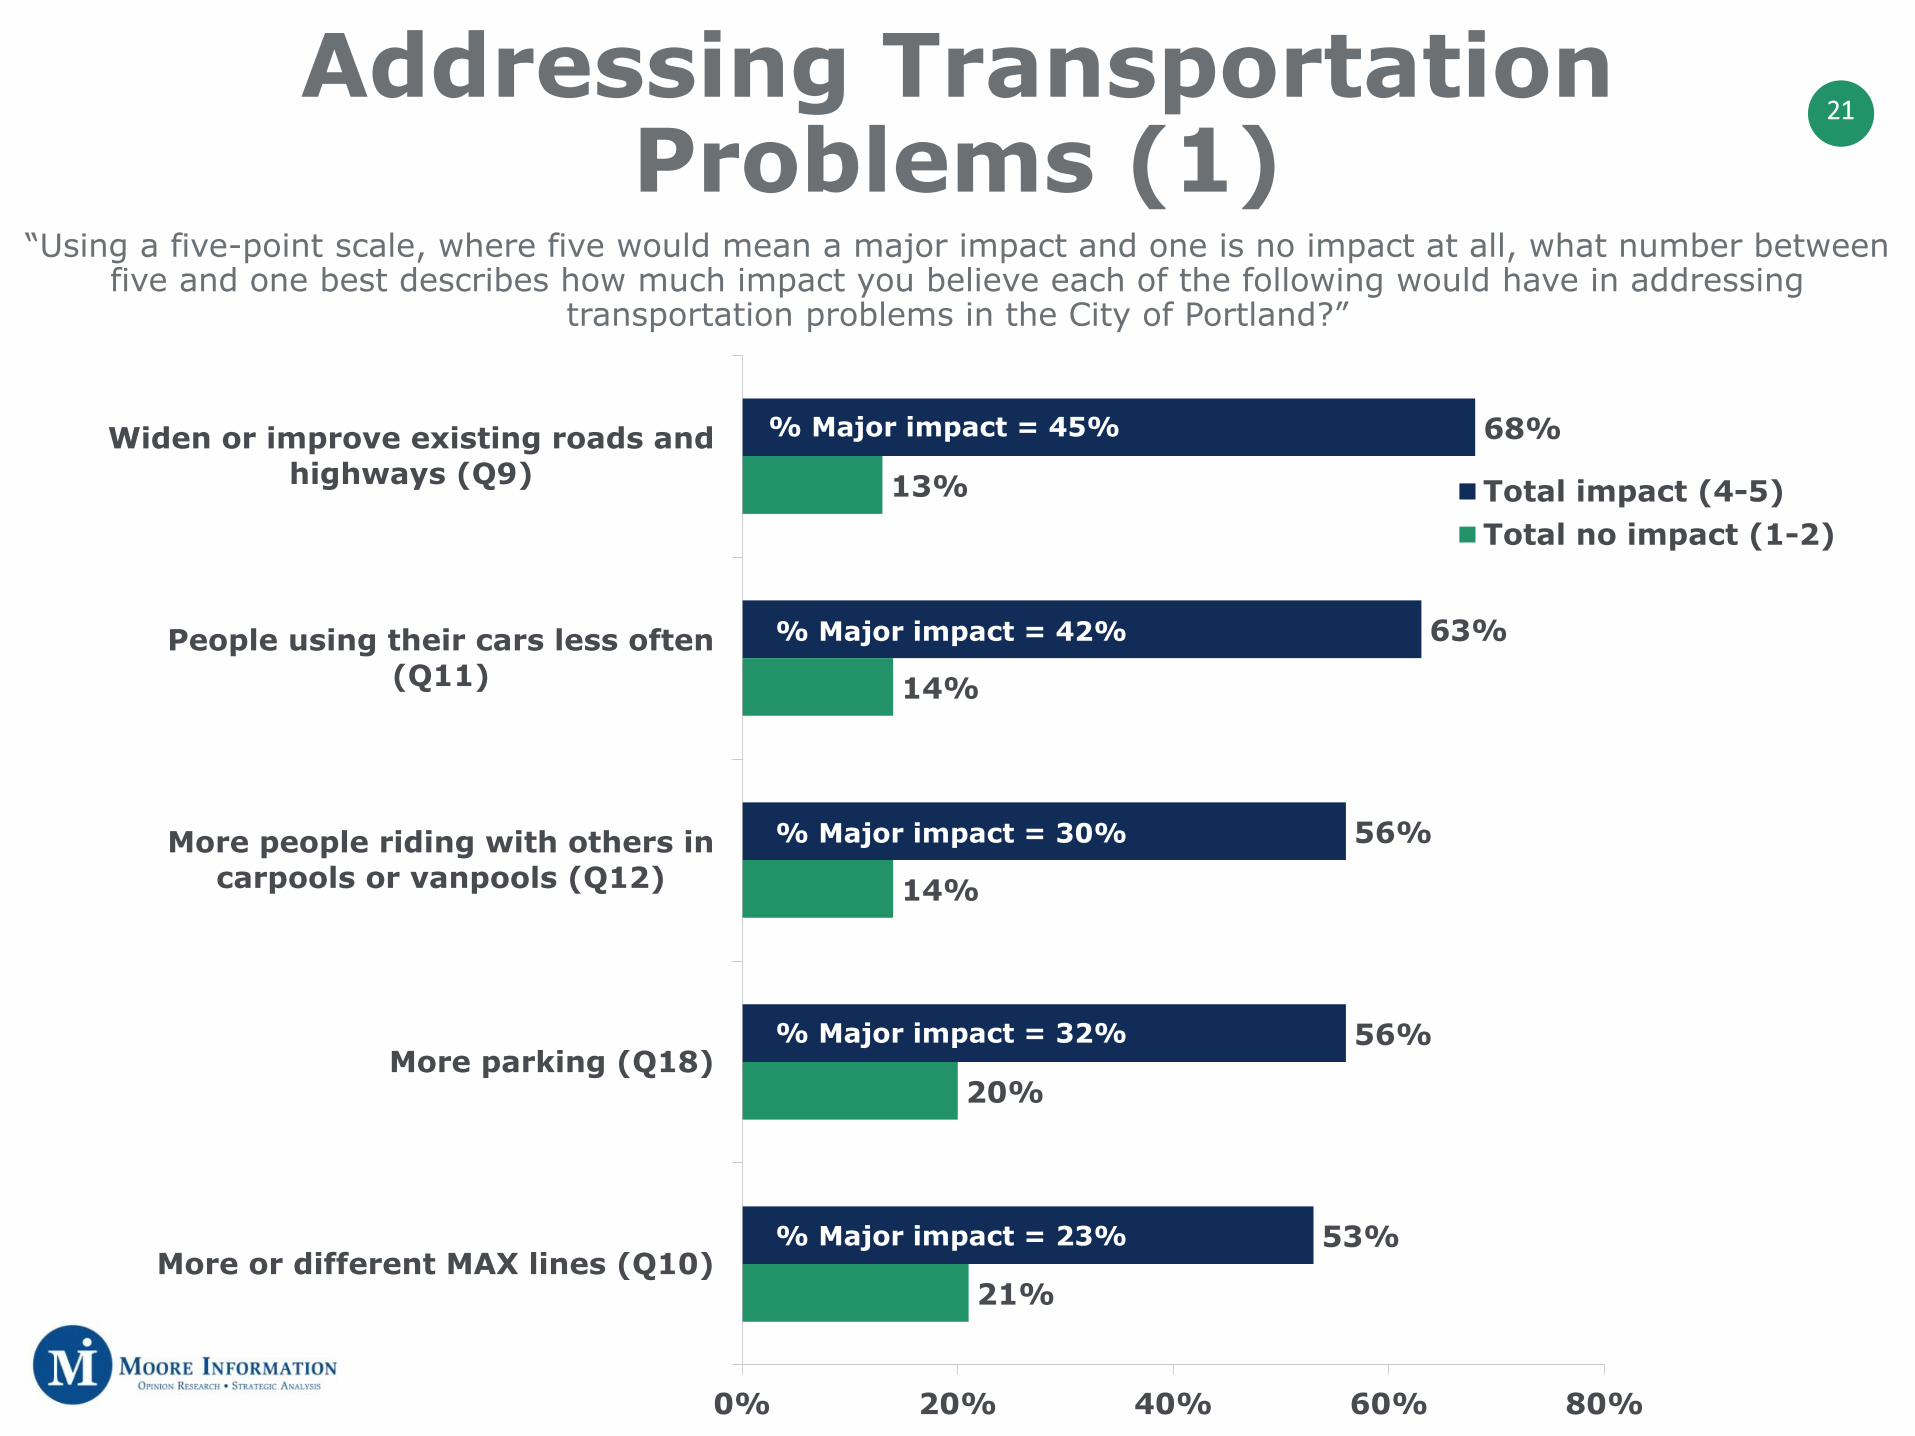
68%
63%
56%
56%
53%
13%
14%
14%
20%
21%
0% 20% 40% 60% 80%
Widen or improve existing roads andhighways (Q9)
People using their cars less often(Q11)
More people riding with others incarpools or vanpools (Q12)
More parking (Q18)
More or different MAX lines (Q10)
Total impact (4-5)Total no impact (1-2)
% Major impact = 45%
% Major impact = 42%
% Major impact = 30%
% Major impact = 32%
% Major impact = 23%
“Using a five-point scale, where five would mean a major impact and one is no impact at all, what number between five and one best describes how much impact you believe each of the following would have in addressing
transportation problems in the City of Portland?”
Addressing Transportation Problems (1)
22
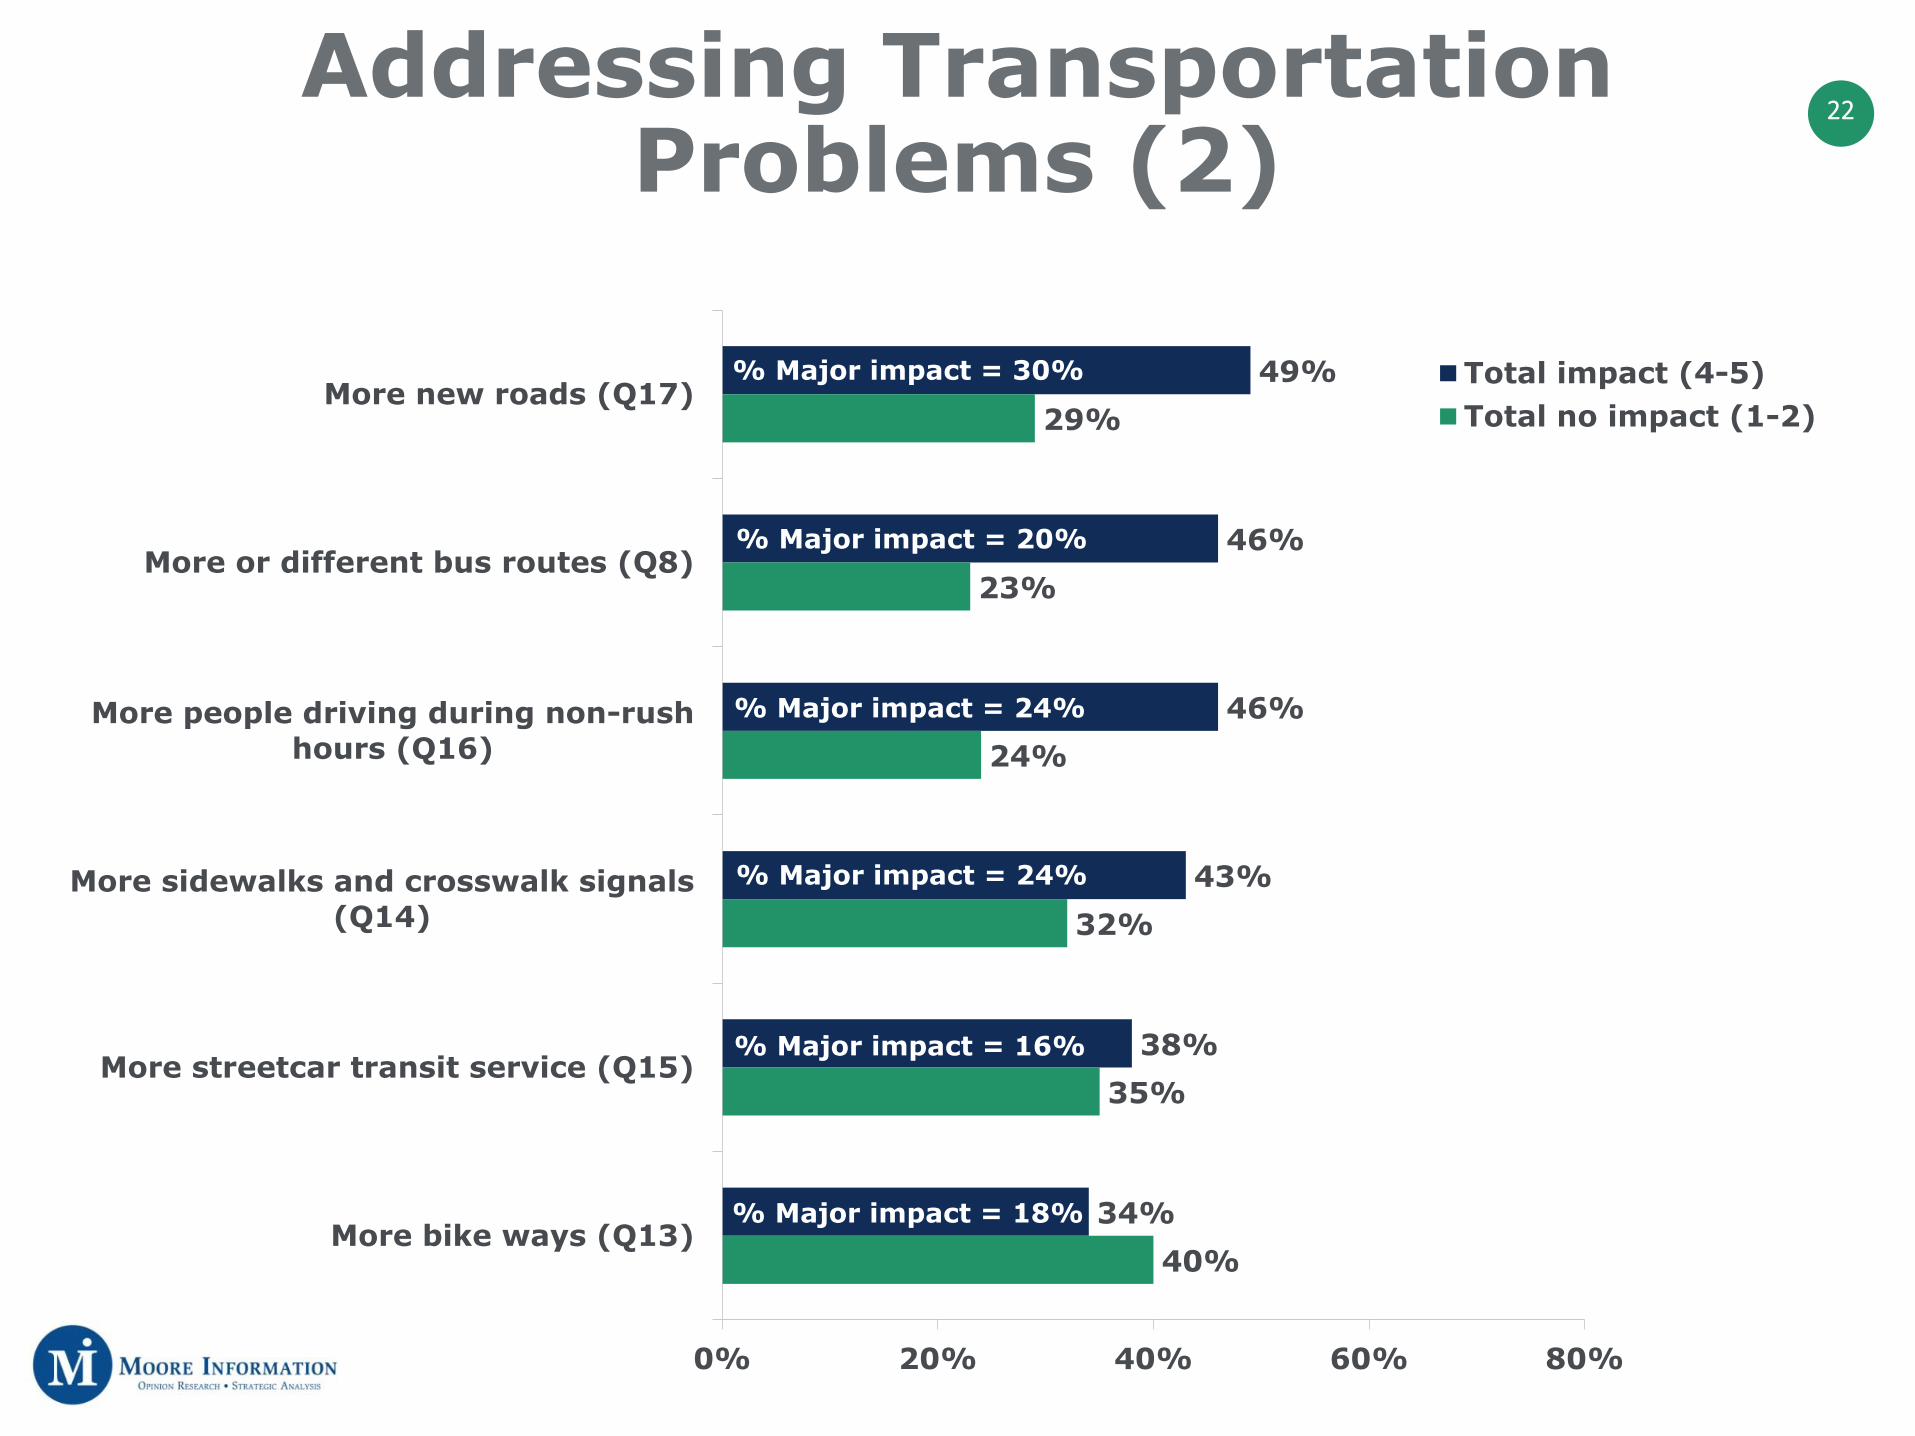
49%
46%
46%
43%
38%
34%
29%
23%
24%
32%
35%
40%
0% 20% 40% 60% 80%
More new roads (Q17)
More or different bus routes (Q8)
More people driving during non-rushhours (Q16)
More sidewalks and crosswalk signals(Q14)
More streetcar transit service (Q15)
More bike ways (Q13)
Total impact (4-5)Total no impact (1-2)
% Major impact = 30%
% Major impact = 20%
% Major impact = 24%
% Major impact = 24%
% Major impact = 16%
% Major impact = 18%
Addressing Transportation Problems (2)

23Addressing Transportation Problems: Key Subgroups (1)
% Major Impact (5) Region
All N NE SW SENW
(N=26)Outer East (N=100)
Widen or improve existing roads and highways (Q9) 45% 40% 43% 41% 48% 51% 50%
People using their cars less often (Q11) 42% 46% 41% 52% 39% 28% 26%
More parking (Q18) 32% 33% 32% 27% 34% 31% 40%More people riding with others in carpools or vanpools (Q12) 30% 38% 25% 25% 32% 31% 26%
More new roads (Q17) 30% 28% 33% 30% 28% 33% 35%More sidewalks and crosswalk signals (Q14) 24% 32% 27% 25% 22% -- 26%
More people driving during non-rush hours (Q16) 24% 24% 19% 24% 29% 16% 27%
More or different MAX lines (Q10) 23% 31% 18% 27% 20% 32% 14%More or different bus routes (Q8) 20% 25% 23% 12% 20% 12% 13%More bike ways (Q13) 18% 18% 15% 29% 18% 18% 16%More streetcar transit service (Q15) 16% 25% 12% 19% 14% 22% 12%
At least four-in-ten residents in all areas of the city say widened/improved existing roads/highways would have a major impact.
Outer East residents are less apt to see using cars less often as something that would have an impact.
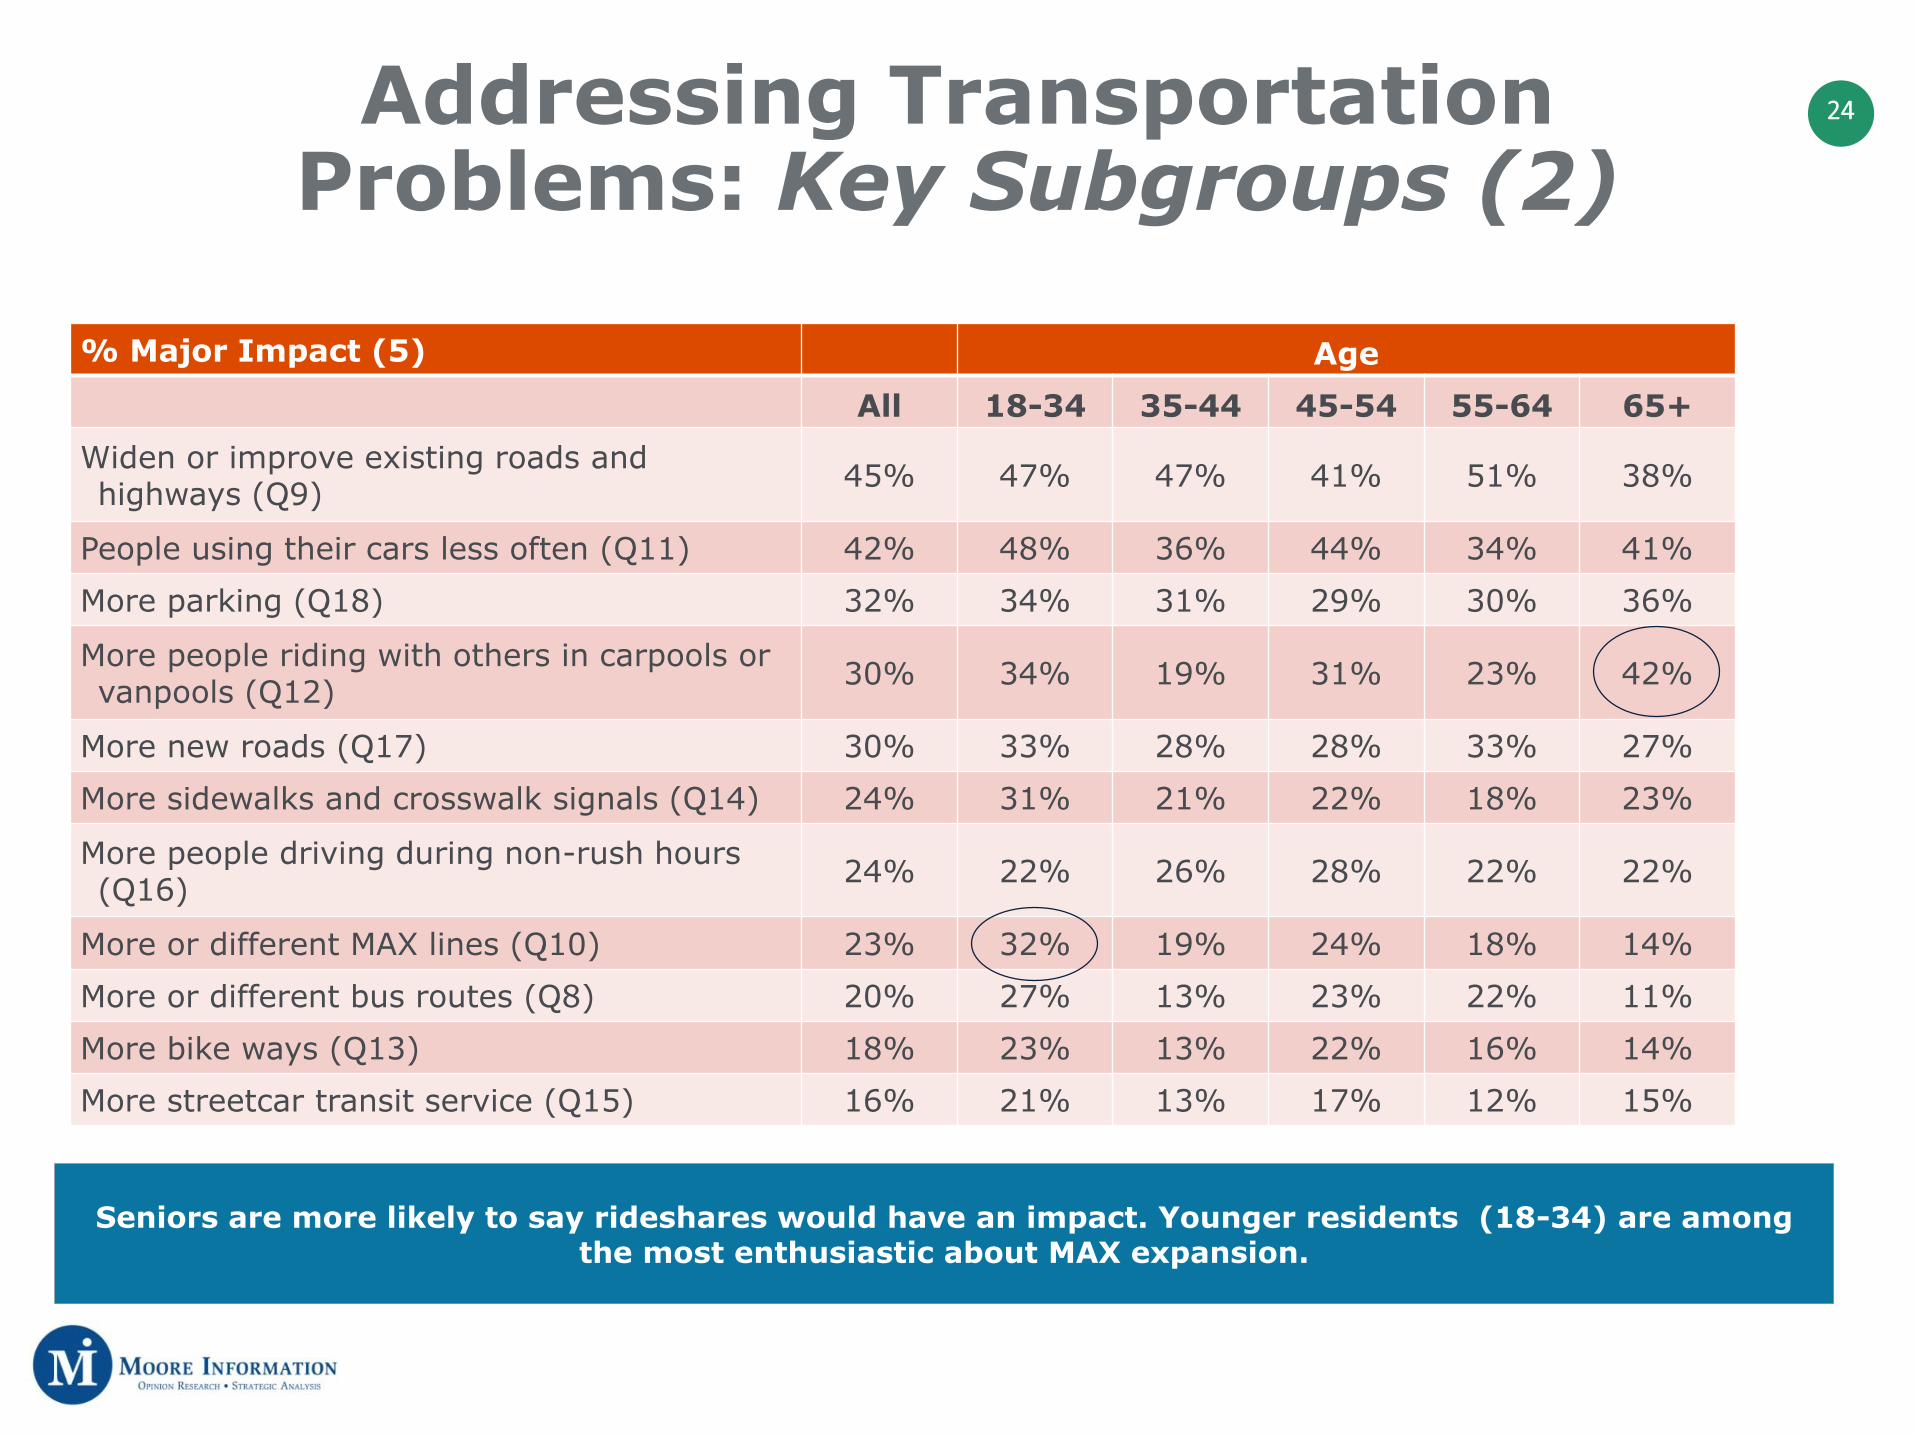
24Addressing Transportation Problems: Key Subgroups (2)
% Major Impact (5) AgeAll 18-34 35-44 45-54 55-64 65+
Widen or improve existing roads and highways (Q9) 45% 47% 47% 41% 51% 38%
People using their cars less often (Q11) 42% 48% 36% 44% 34% 41%
More parking (Q18) 32% 34% 31% 29% 30% 36%
More people riding with others in carpools or vanpools (Q12) 30% 34% 19% 31% 23% 42%
More new roads (Q17) 30% 33% 28% 28% 33% 27%
More sidewalks and crosswalk signals (Q14) 24% 31% 21% 22% 18% 23%
More people driving during non-rush hours (Q16) 24% 22% 26% 28% 22% 22%
More or different MAX lines (Q10) 23% 32% 19% 24% 18% 14%
More or different bus routes (Q8) 20% 27% 13% 23% 22% 11%
More bike ways (Q13) 18% 23% 13% 22% 16% 14%
More streetcar transit service (Q15) 16% 21% 13% 17% 12% 15%
Seniors are more likely to say rideshares would have an impact. Younger residents (18-34) are among the most enthusiastic about MAX expansion.

25Addressing Transportation Problems: Key Subgroups (3)
% Major Impact (5) Income
AllLess
than $35K$35-$49K
$50-$74K
$75Kor more
Widen or improve existing roads and highways (Q9) 45% 39% 50% 45% 47%
People using their cars less often (Q11) 42% 50% 37% 37% 42%
More parking (Q18) 32% 29% 43% 36% 26%
More people riding with others in carpools or vanpools (Q12) 30% 39% 23% 27% 28%
More new roads (Q17) 30% 28% 31% 32% 32%More sidewalks and crosswalk signals (Q14) 24% 33% 23% 21% 17%
More people driving during non-rush hours (Q16) 24% 24% 28% 22% 21%
More or different MAX lines (Q10) 23% 31% 20% 22% 18%
More or different bus routes (Q8) 20% 33% 10% 21% 11%
More bike ways (Q13) 18% 25% 17% 20% 13%
More streetcar transit service (Q15) 16% 16% 19% 19% 13%
Higher income households are more likely to say road improvements will have an impact, while lower income households are more supportive of alternatives/public transit projects.
Parking is more of a concern for middle-income households.

26Addressing Transportation Problems: Key Subgroups (4)
% Major Impact (5) Distance From Downtown Portland
Change in Commute Time Last 3 Years?
All<3
miles3-4
miles5-6
miles7-10miles
11+miles Yes No
Widen or improve existing roads and highways (Q9) 45% 32% 42% 47% 47% 63% 51% 48%
People using their cars less often (Q11) 42% 56% 41% 41% 40% 30% 38% 47%
More parking (Q18) 32% 37% 20% 30% 32% 54% 36% 23%More people riding with others in carpools or vanpools (Q12) 30% 47% 22% 22% 39% 23% 25% 34%
More new roads (Q17) 30% 23% 26% 32% 30% 49% 33% 31%More sidewalks and crosswalk signals (Q14) 24% 25% 21% 19% 27% 30% 25% 33%
More people driving during non-rush hours (Q16) 24% 33% 15% 20% 33% 18% 23% 29%
More or different MAX lines (Q10) 23% 32% 24% 20% 17% 23% 27% 18%More or different bus routes (Q8) 20% 19% 20% 18% 22% 18% 21% 24%More bike ways (Q13) 18% 22% 21% 10% 20% 15% 22% 21%More streetcar transit service (Q15) 16% 18% 18% 10% 15% 27% 15% 21%
Support for road improvements increases the farther people get from downtown.
27
42%
13%
11%
7%
5%
4%
4%
3%
2%
1%
1%
5%
2%
0% 20% 40% 60%
Widen or improve existing roads and highways
More or different MAX lines
More or different bus routes
More new roads
People using their cars less often
More parking
More people driving during non-rush hours
More people riding with others in carpools or vanpools
More sidewalks and crosswalk signals
More streetcar transit service
More bike ways
Other
Don’t know
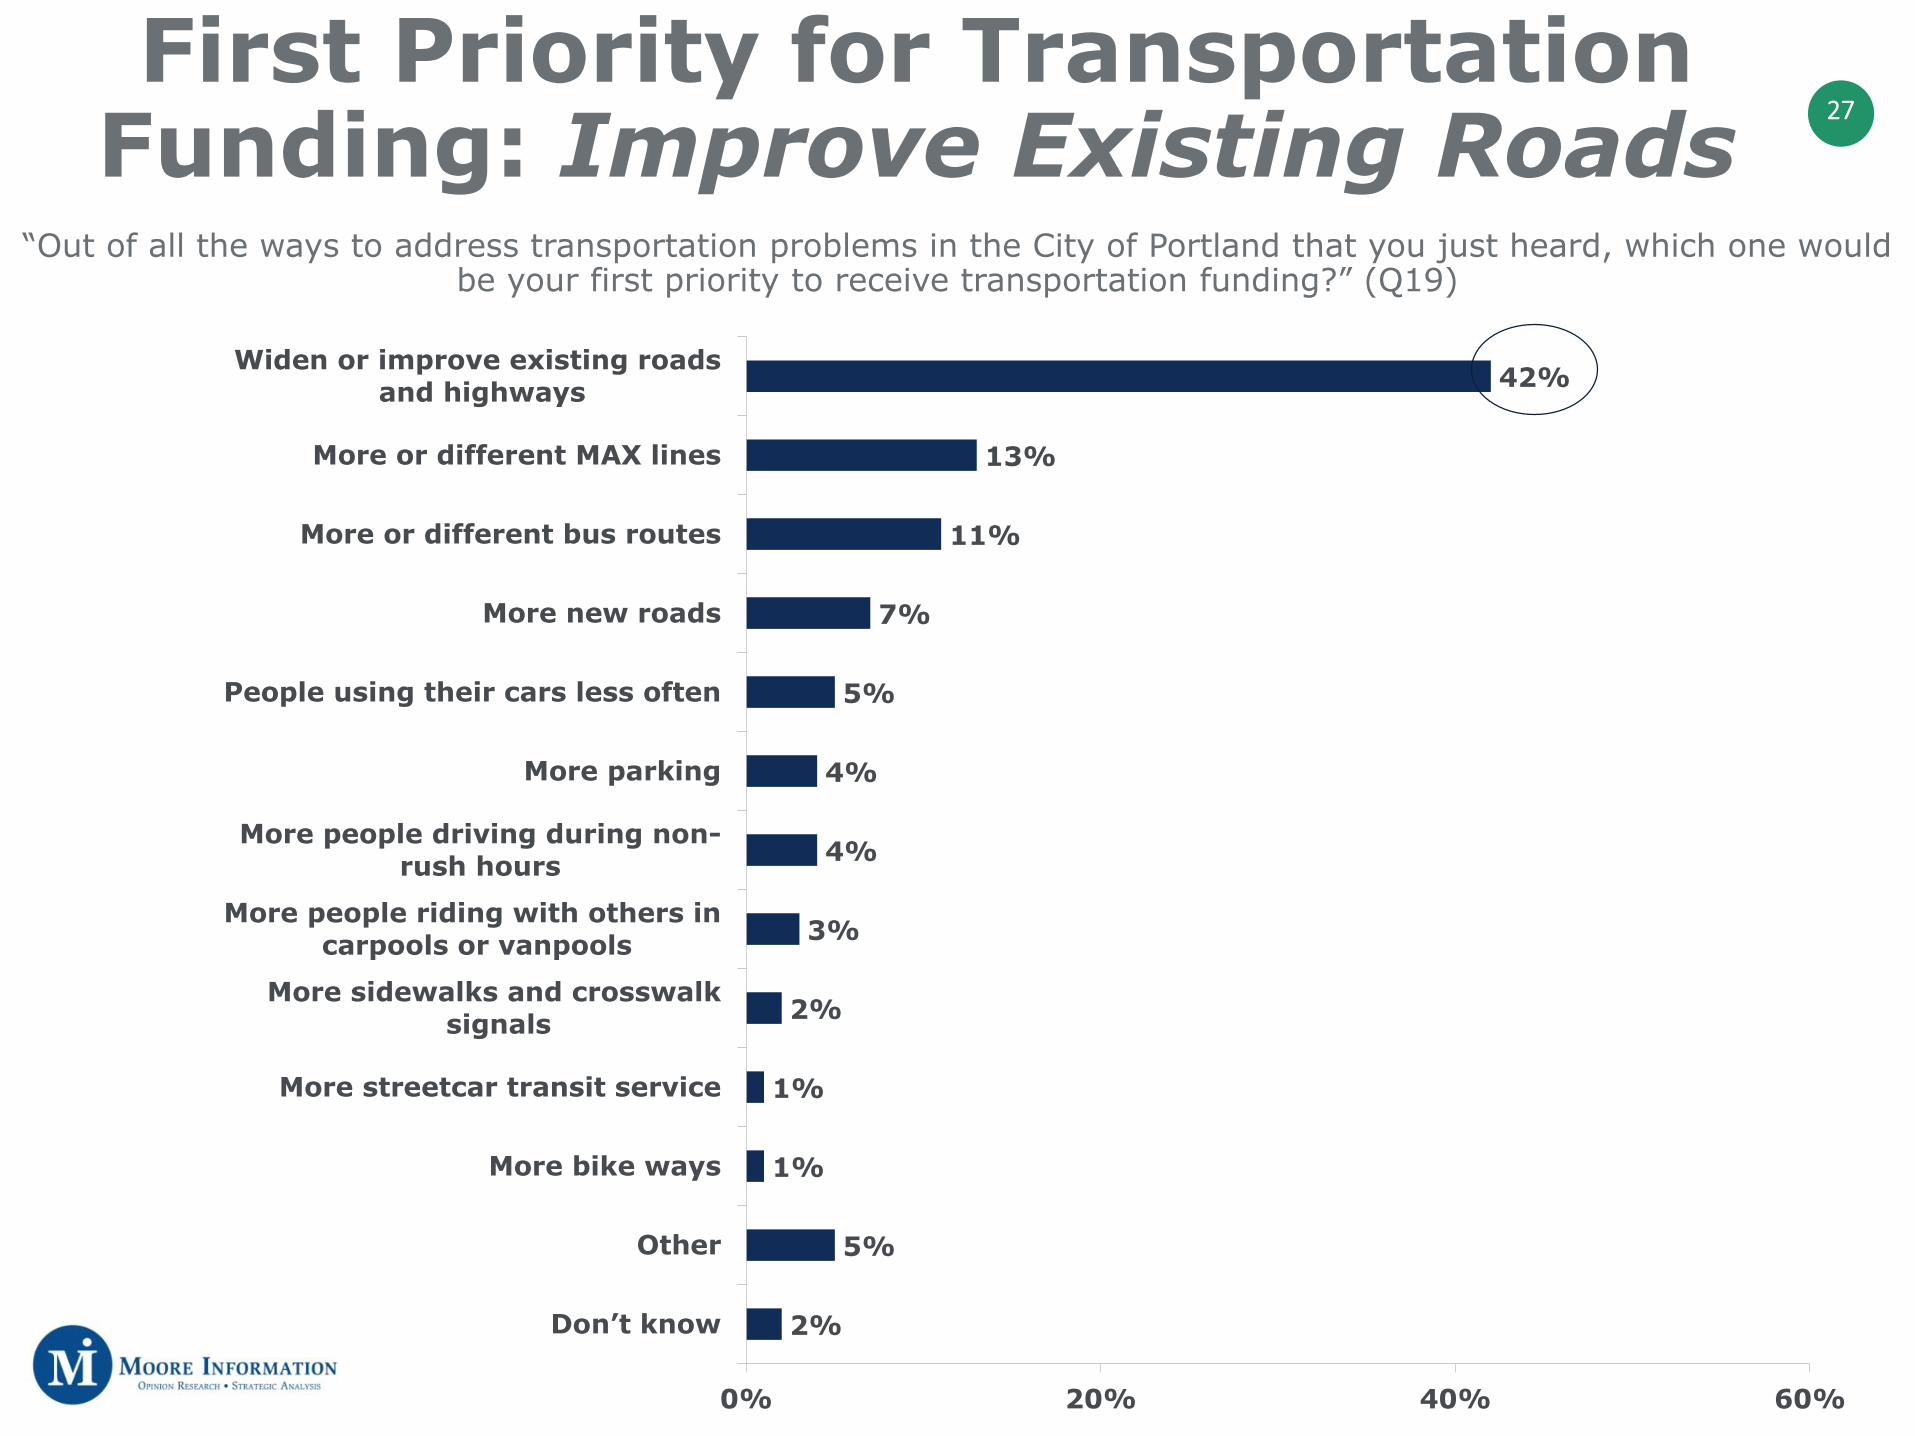
“Out of all the ways to address transportation problems in the City of Portland that you just heard, which one would be your first priority to receive transportation funding?” (Q19)
First Priority for Transportation Funding: Improve Existing Roads

28First Priority for Transportation Funding: Region
All N NE SW SENW
(N=26)
Outer East
(N=100)Widen or improve existing roads and
highways 42% 35% 42% 36% 47% 33% 47%
More or different MAX lines 13% 18% 10% 10% 9% 32% 8%More or different bus routes 11% 18% 12% 17% 8% 2% 9%More new roads 7% 2% 12% 8% 6% 12% 10%People using their cars less often 5% 3% 4% 4% 7% -- --More parking 4% 3% 2% -- 6% 9% 4%More people driving during non-rush hours 4% 5% 3% 2% 4% -- 6%
More people riding with others in carpools or vanpools 3% 9% 1% 2% 3% -- 6%
More sidewalks and crosswalk signals 2% 2% 4% 5% 1% -- 3%More streetcar transit service 1% -- 1% 7% 1% -- 1%More bike ways 1% 2% 1% -- * -- --
* Less than one-half of one percent
Funding existing roads is a top priority.
29
56%
23%
79%
4%
17%
6%12%
0%
20%
40%
60%
80%
Stronglymaintainexisting
capacity forcars
Maintainexisting
capacity forcars
Total maintainexisting
capacity forcars
Don’t know Total removingcar lanes to
make way formore bike
lanes
Removing carlanes to makeway for more
bike lanes
Stronglyremoving carlanes to makeway for more
bike lanes
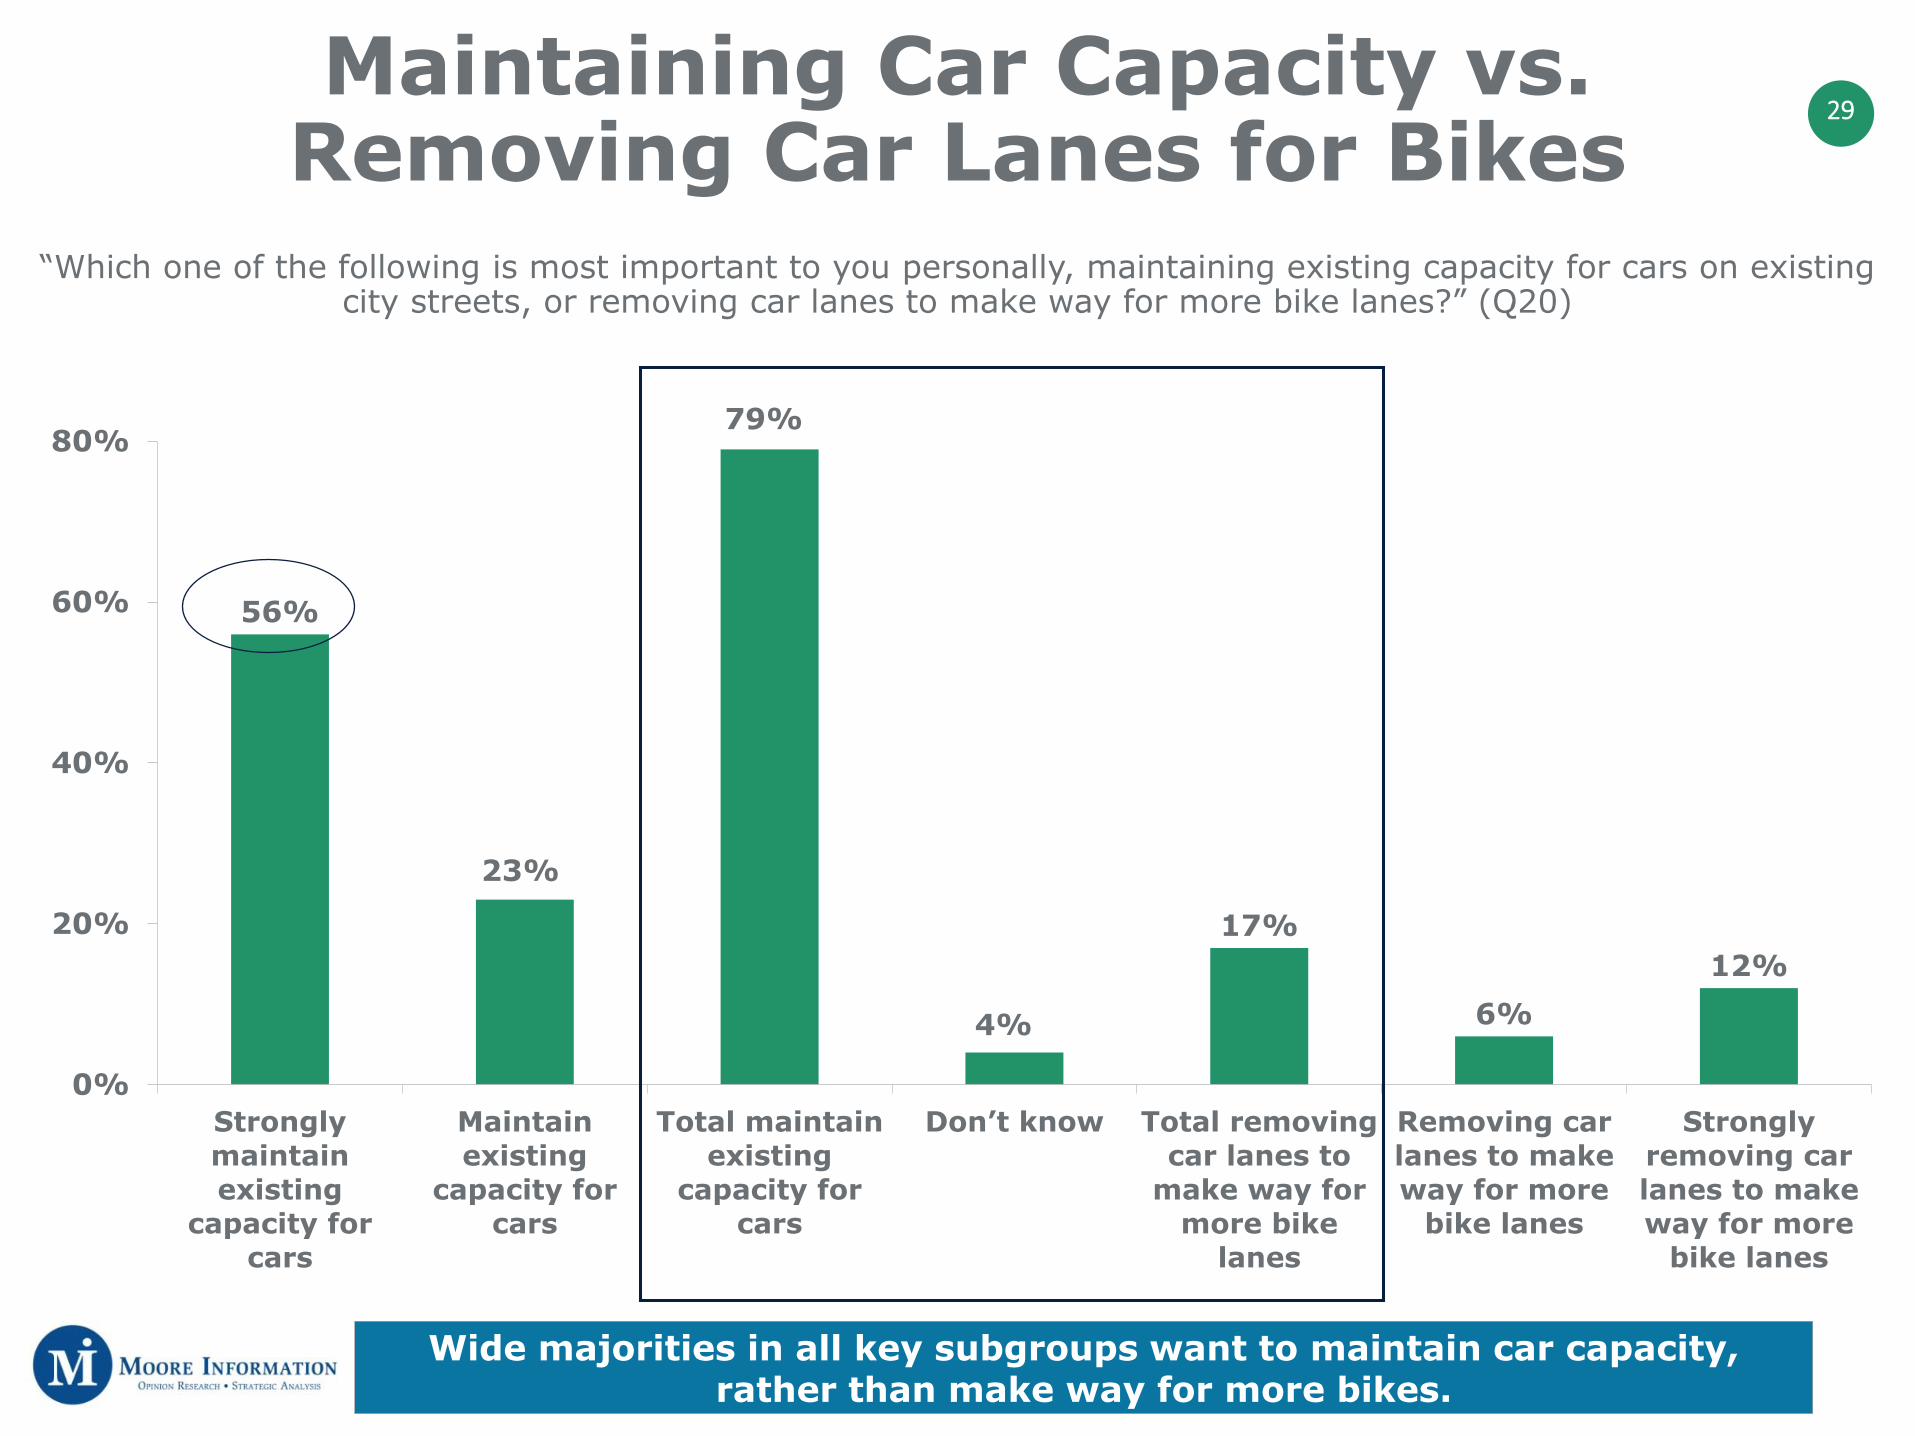
Maintaining Car Capacity vs. Removing Car Lanes for Bikes
“Which one of the following is most important to you personally, maintaining existing capacity for cars on existing city streets, or removing car lanes to make way for more bike lanes?” (Q20)
Wide majorities in all key subgroups want to maintain car capacity, rather than make way for more bikes.

30Maintaining Car Capacity vs. Removing Car Lanes: Region
Strongly maintain Total maintainAll 56% 79%Region
N 47% 72%NE 56% 83%SW 43% 69%SE 63% 83%NW (N=26) 59% 76%Outer East (N=100) 68% 89%
All regions want to maintain car capacity. Support reaches nearly 90% in Outer East Portland.

31
“How often do you use each of the following transportation methods in getting from one place to another in the City of Portland?”
Transportation MethodsHow Often Do You…?
Daily
Total more than
once a week
Once a week
Total less
often Never
Your own car (Q24) 62% 82% 4% 4% 9%
Walk (Q26) 38% 56% 10% 20% 14%
Bike (Q21) 7% 20% 6% 22% 51%
Carpool (Q25) 5% 16% 7% 27% 51%
Bus (Q23) 6% 15% 5% 43% 36%
MAX (Q22) 5% 13% 6% 56% 26%
Lyft/Uber (Q27) 1% 3% 3% 39% 55%
Rideshare (Q28) 1% 3% 1% 9% 83%
City of Portland residents are heavily car-dependent.
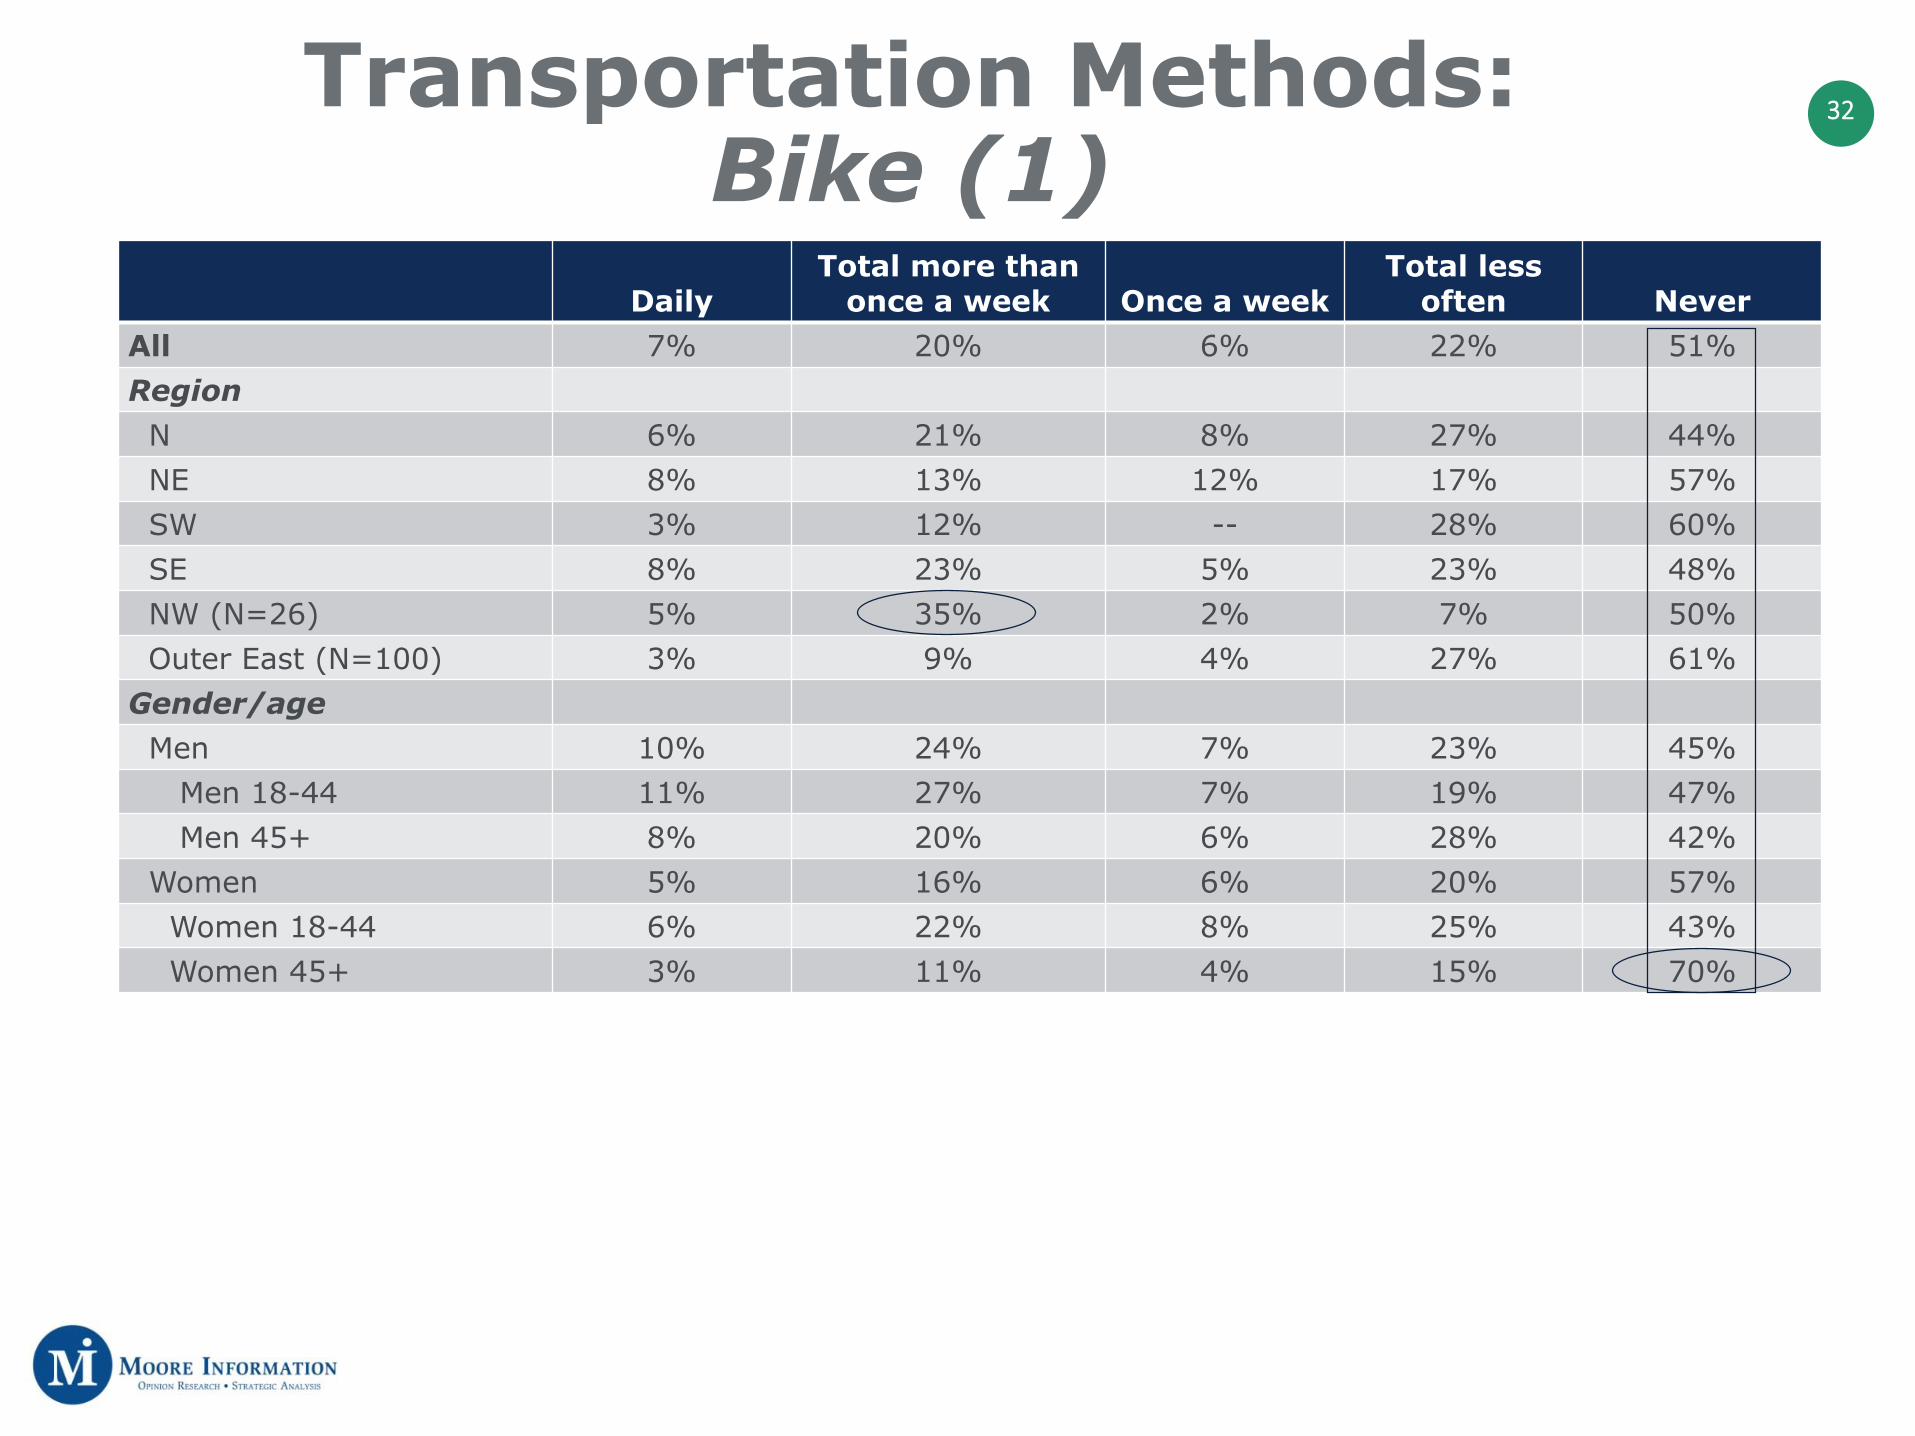
32Transportation Methods:Bike (1)
DailyTotal more than
once a week Once a weekTotal less
often NeverAll 7% 20% 6% 22% 51%Region
N 6% 21% 8% 27% 44%NE 8% 13% 12% 17% 57%SW 3% 12% -- 28% 60%SE 8% 23% 5% 23% 48%NW (N=26) 5% 35% 2% 7% 50%Outer East (N=100) 3% 9% 4% 27% 61%
Gender/ageMen 10% 24% 7% 23% 45%
Men 18-44 11% 27% 7% 19% 47%Men 45+ 8% 20% 6% 28% 42%
Women 5% 16% 6% 20% 57%Women 18-44 6% 22% 8% 25% 43%Women 45+ 3% 11% 4% 15% 70%

33Transportation Methods:Bike (2)
DailyTotal more than
once a week Once a weekTotal less
often NeverAll 7% 20% 6% 22% 51%Income
Less than $35K 7% 16% 6% 20% 57%$35-$49K 8% 24% -- 22% 53%$50-$74K 4% 19% 8% 17% 55%$75K or more 9% 23% 8% 27% 42%
EthnicityCaucasians 8% 22% 7% 21% 48%Non-Caucasians 3% 9% 2% 27% 61%
Distance from Downtown Portland
Less than 3 miles 7% 23% 6% 24% 46%3-4 miles 10% 24% 9% 25% 42%5-6 miles 6% 26% 4% 20% 47%7-10 miles 6% 12% 4% 17% 65%11+ miles 4% 10% 4% 27% 59%
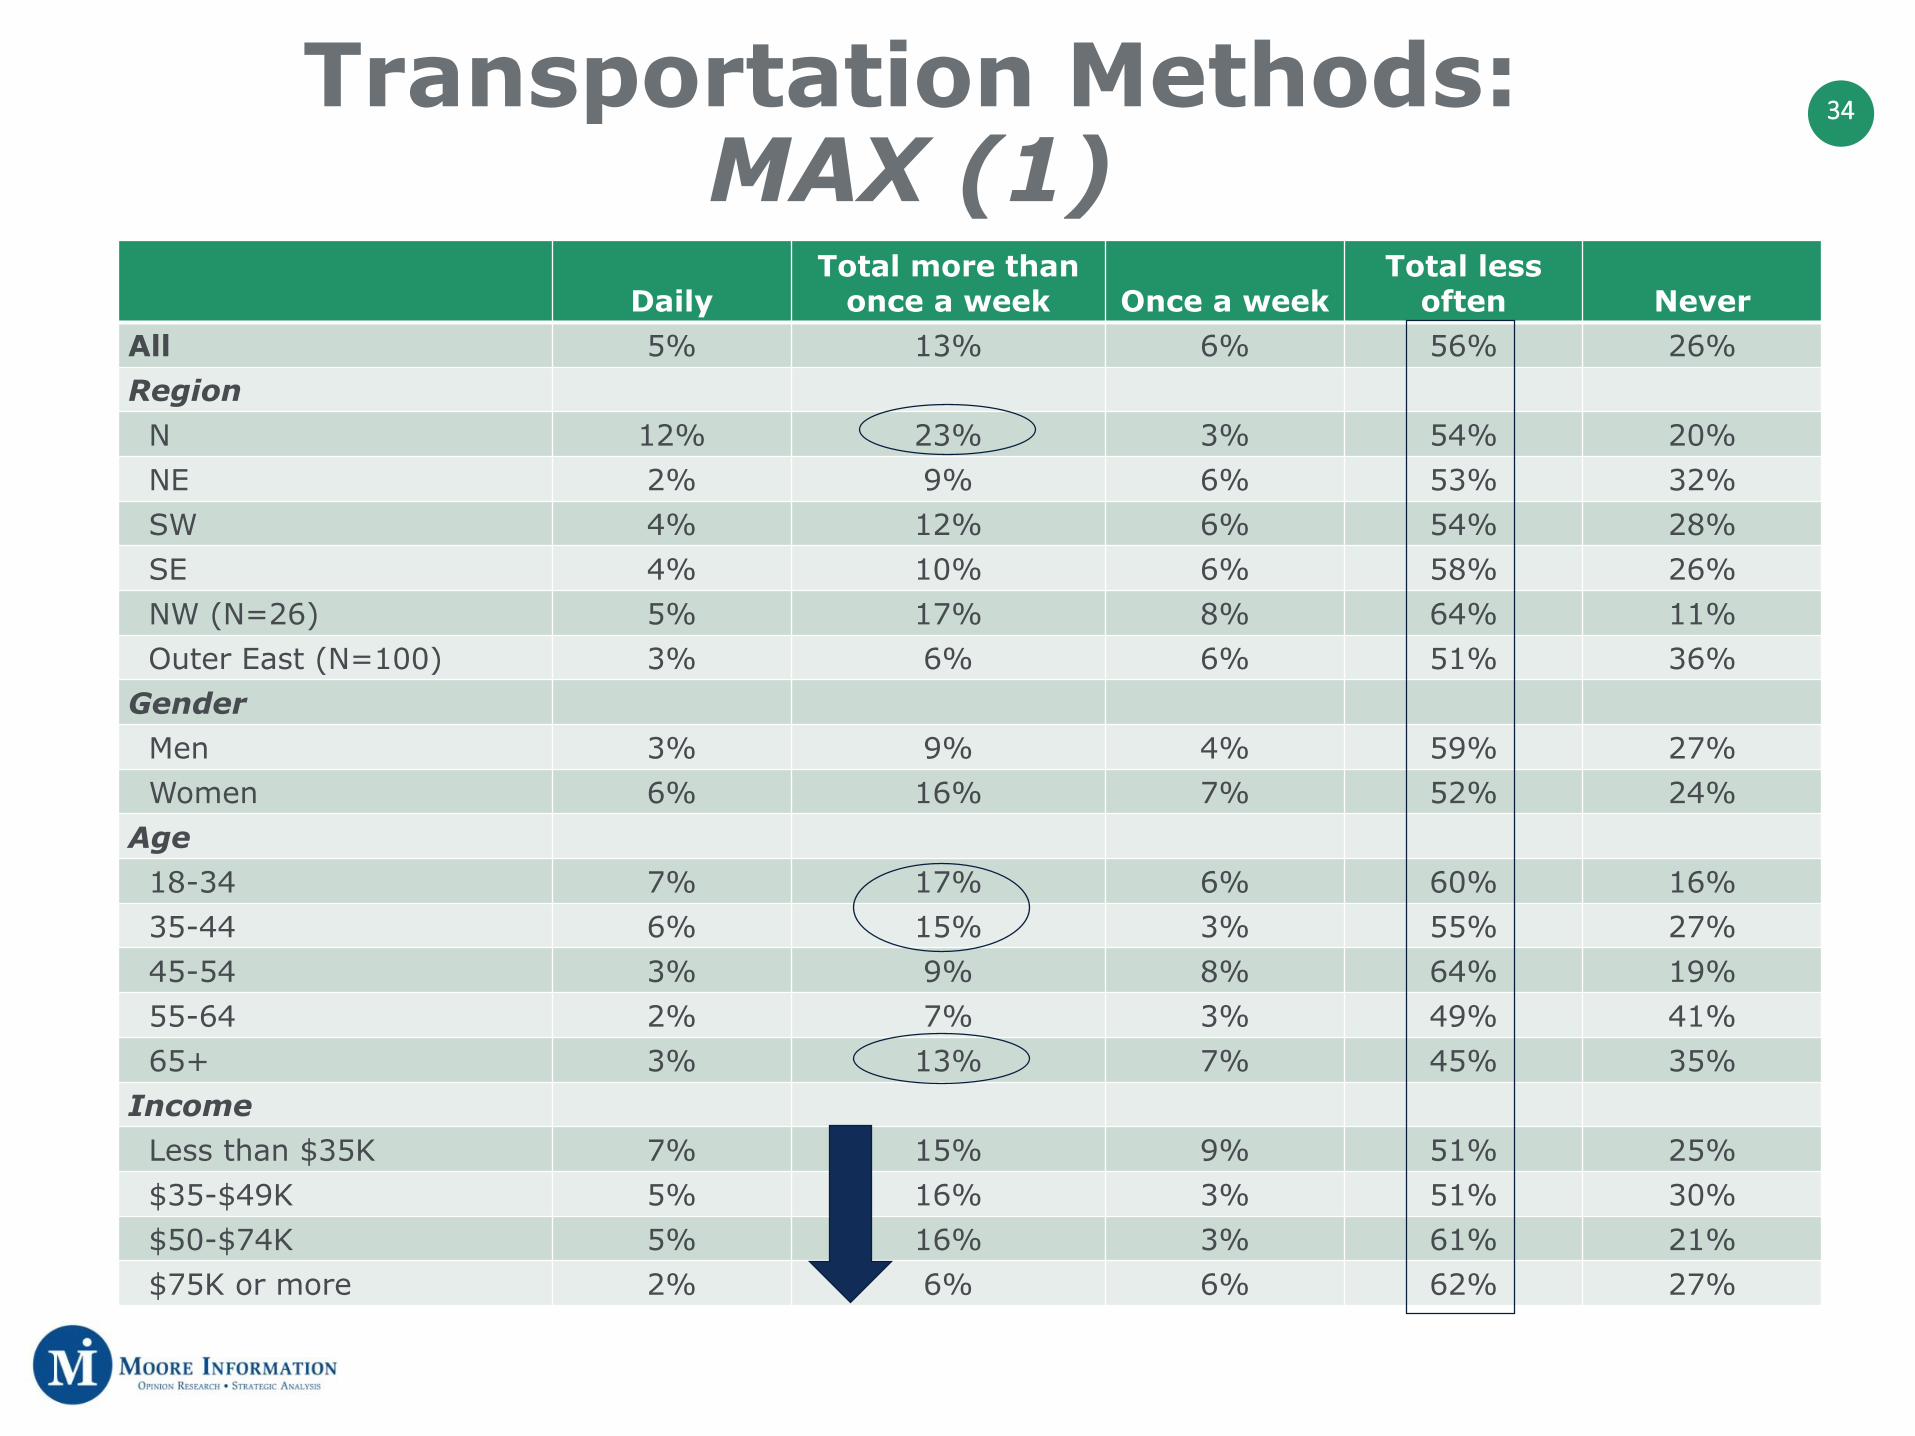
34Transportation Methods:MAX (1)
DailyTotal more than
once a week Once a weekTotal less
often NeverAll 5% 13% 6% 56% 26%Region
N 12% 23% 3% 54% 20%NE 2% 9% 6% 53% 32%SW 4% 12% 6% 54% 28%SE 4% 10% 6% 58% 26%NW (N=26) 5% 17% 8% 64% 11%Outer East (N=100) 3% 6% 6% 51% 36%
GenderMen 3% 9% 4% 59% 27%Women 6% 16% 7% 52% 24%
Age18-34 7% 17% 6% 60% 16%35-44 6% 15% 3% 55% 27%45-54 3% 9% 8% 64% 19%55-64 2% 7% 3% 49% 41%65+ 3% 13% 7% 45% 35%
IncomeLess than $35K 7% 15% 9% 51% 25%$35-$49K 5% 16% 3% 51% 30%$50-$74K 5% 16% 3% 61% 21%$75K or more 2% 6% 6% 62% 27%

35Transportation Methods:MAX (2)
DailyTotal more than
once a week Once a weekTotal less
often NeverAll 5% 13% 6% 56% 26%Ethnicity
Caucasians 3% 9% 6% 58% 26%Non-Caucasians 5% 19% 6% 51% 24%
Distance from Downtown Portland
Less than 3 miles 8% 14% 4% 54% 29%3-4 miles 2% 13% 5% 58% 23%5-6 miles 3% 9% 7% 62% 22%7-10 miles 5% 13% 9% 51% 27%11+ miles 9% 11% 5% 58% 26%
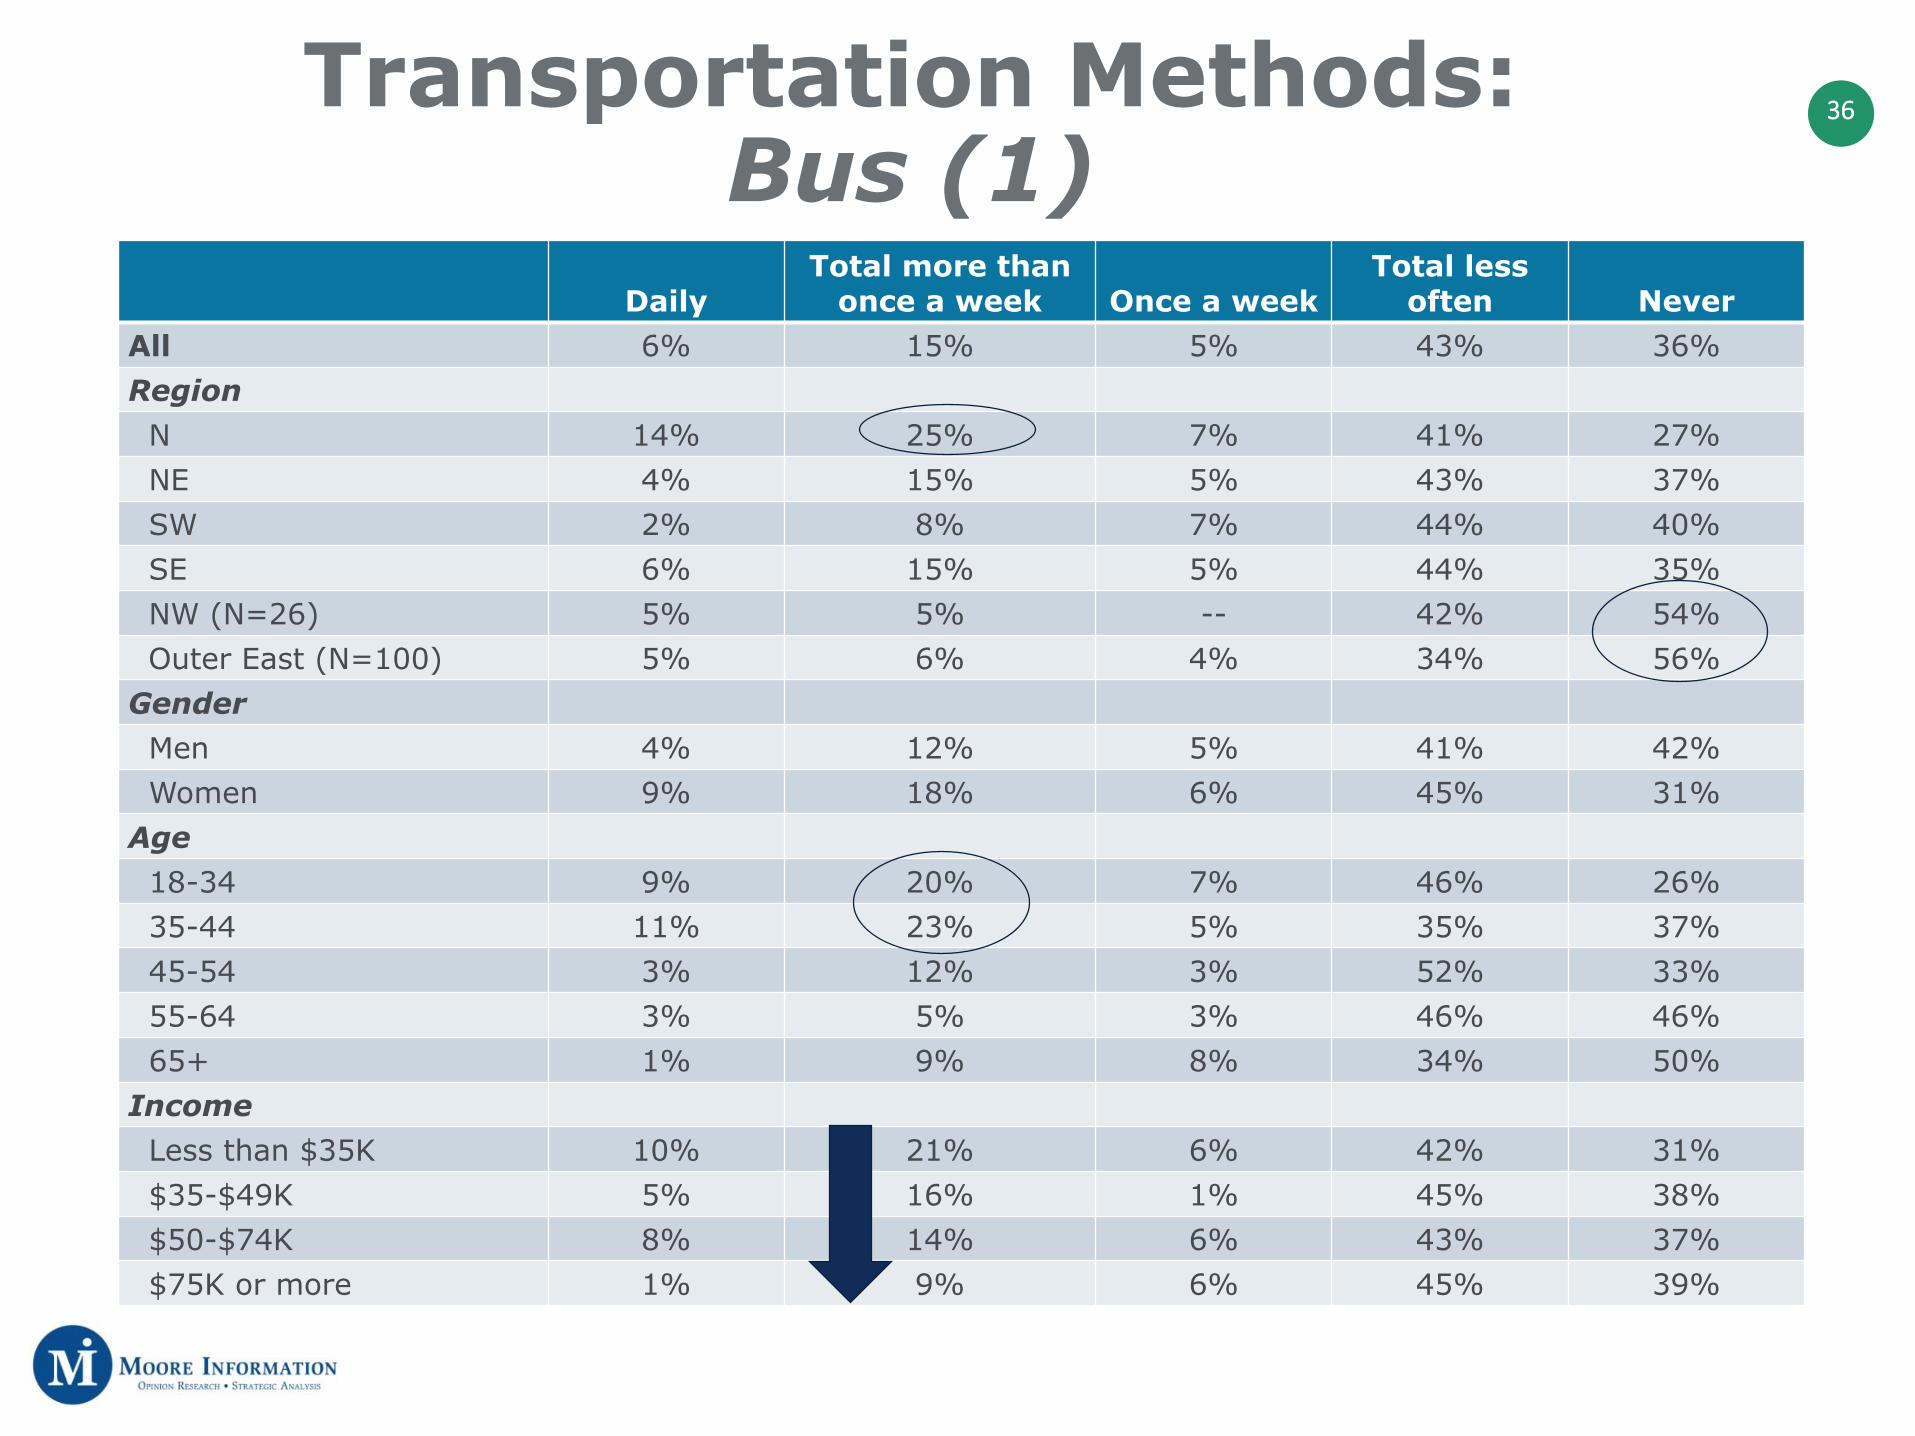
36Transportation Methods:Bus (1)
DailyTotal more than
once a week Once a weekTotal less
often NeverAll 6% 15% 5% 43% 36%Region
N 14% 25% 7% 41% 27%NE 4% 15% 5% 43% 37%SW 2% 8% 7% 44% 40%SE 6% 15% 5% 44% 35%NW (N=26) 5% 5% -- 42% 54%Outer East (N=100) 5% 6% 4% 34% 56%
GenderMen 4% 12% 5% 41% 42%Women 9% 18% 6% 45% 31%
Age18-34 9% 20% 7% 46% 26%35-44 11% 23% 5% 35% 37%45-54 3% 12% 3% 52% 33%55-64 3% 5% 3% 46% 46%65+ 1% 9% 8% 34% 50%
IncomeLess than $35K 10% 21% 6% 42% 31%$35-$49K 5% 16% 1% 45% 38%$50-$74K 8% 14% 6% 43% 37%$75K or more 1% 9% 6% 45% 39%
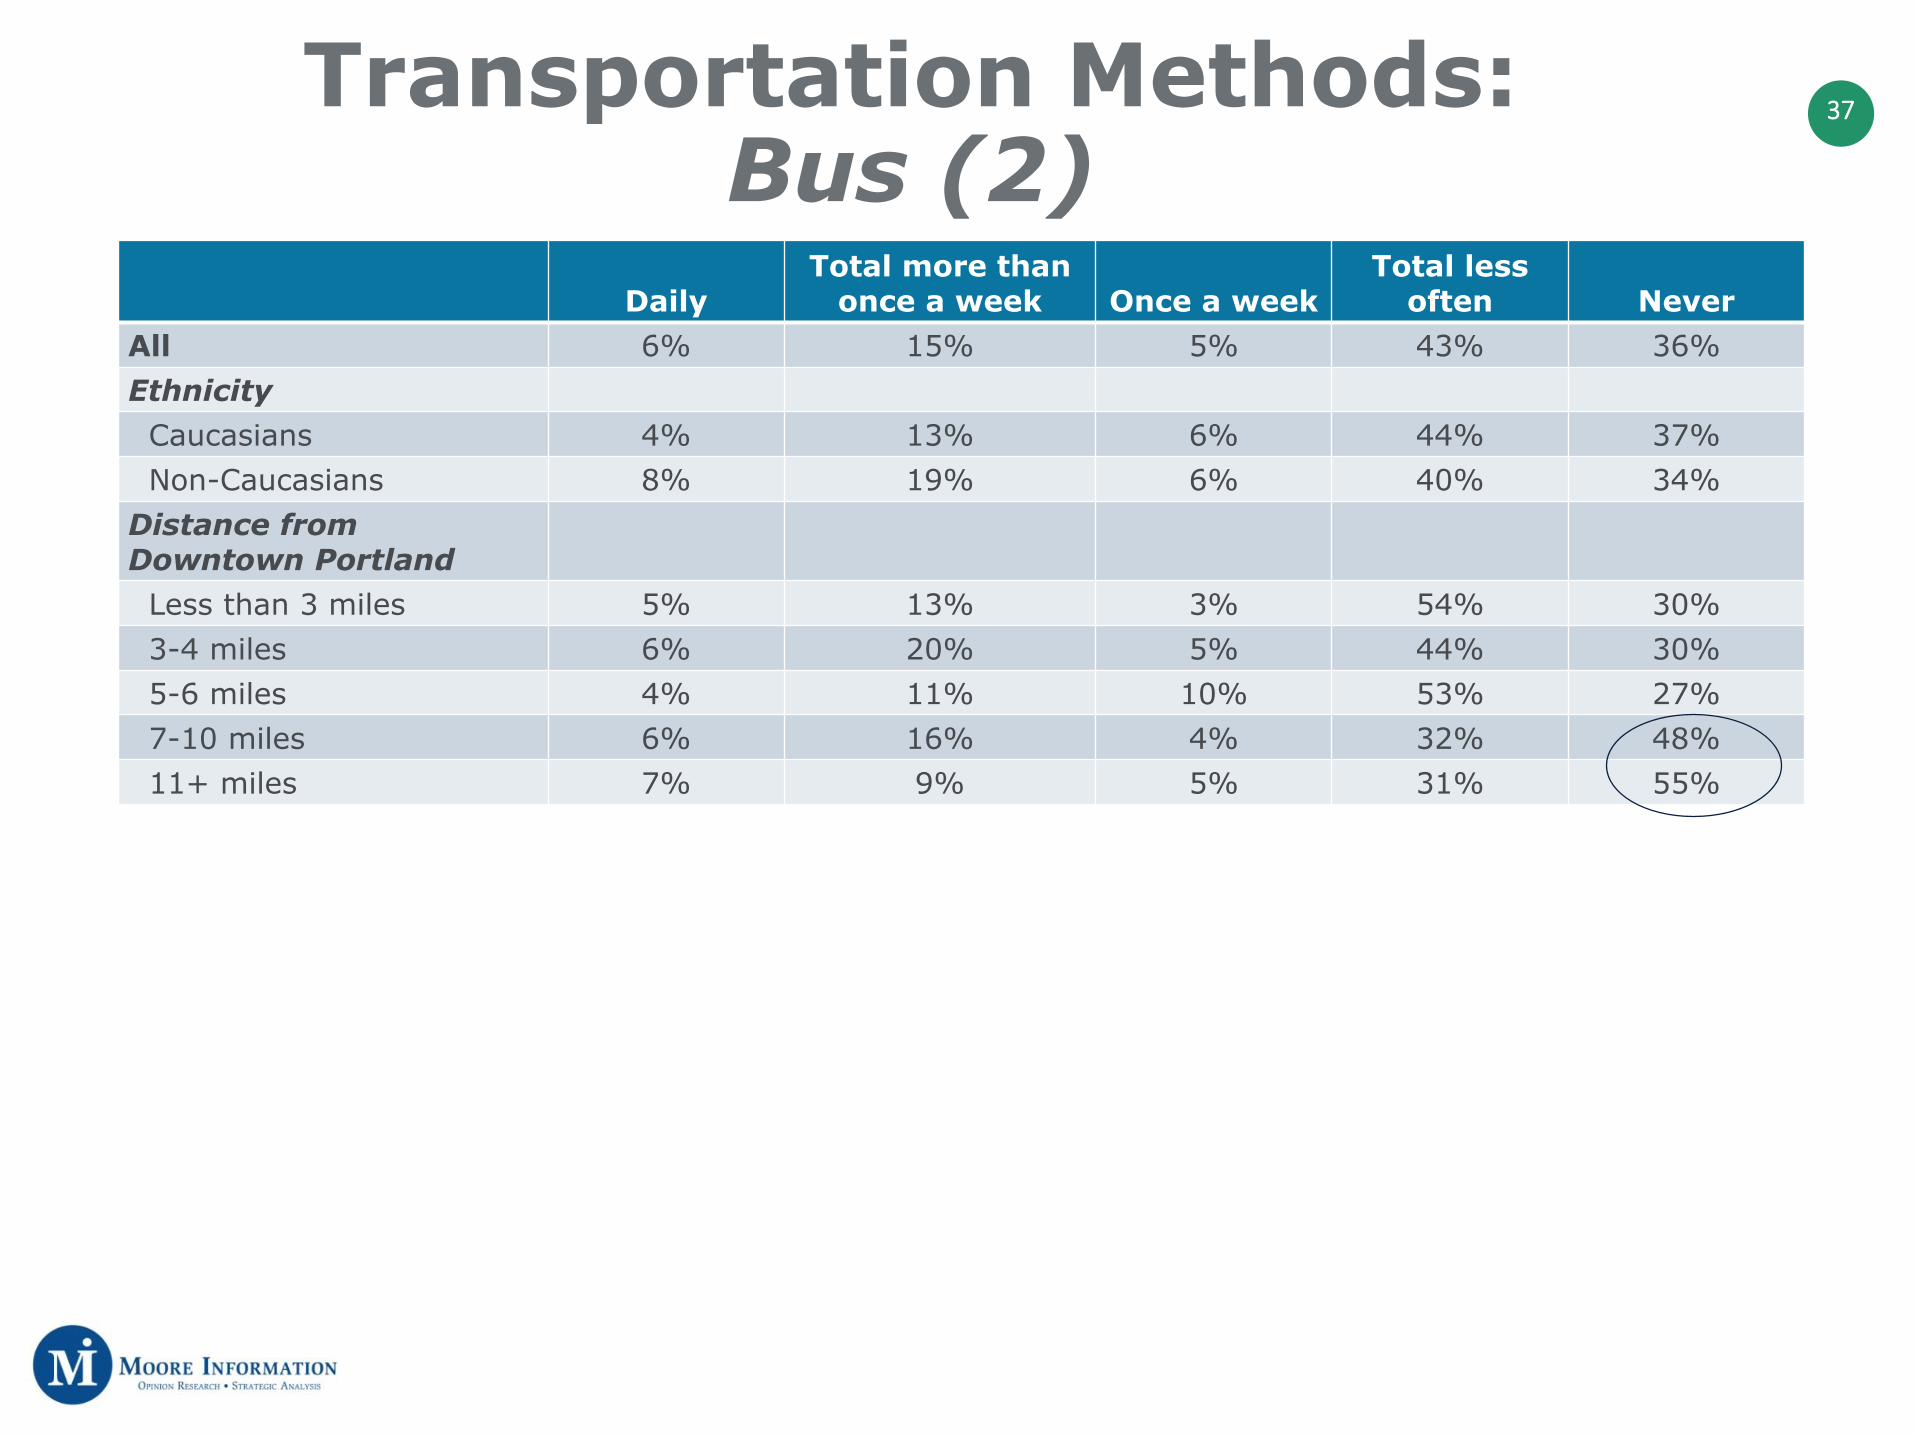
37Transportation Methods:Bus (2)
DailyTotal more than
once a week Once a weekTotal less
often NeverAll 6% 15% 5% 43% 36%Ethnicity
Caucasians 4% 13% 6% 44% 37%Non-Caucasians 8% 19% 6% 40% 34%
Distance from Downtown Portland
Less than 3 miles 5% 13% 3% 54% 30%3-4 miles 6% 20% 5% 44% 30%5-6 miles 4% 11% 10% 53% 27%7-10 miles 6% 16% 4% 32% 48%11+ miles 7% 9% 5% 31% 55%
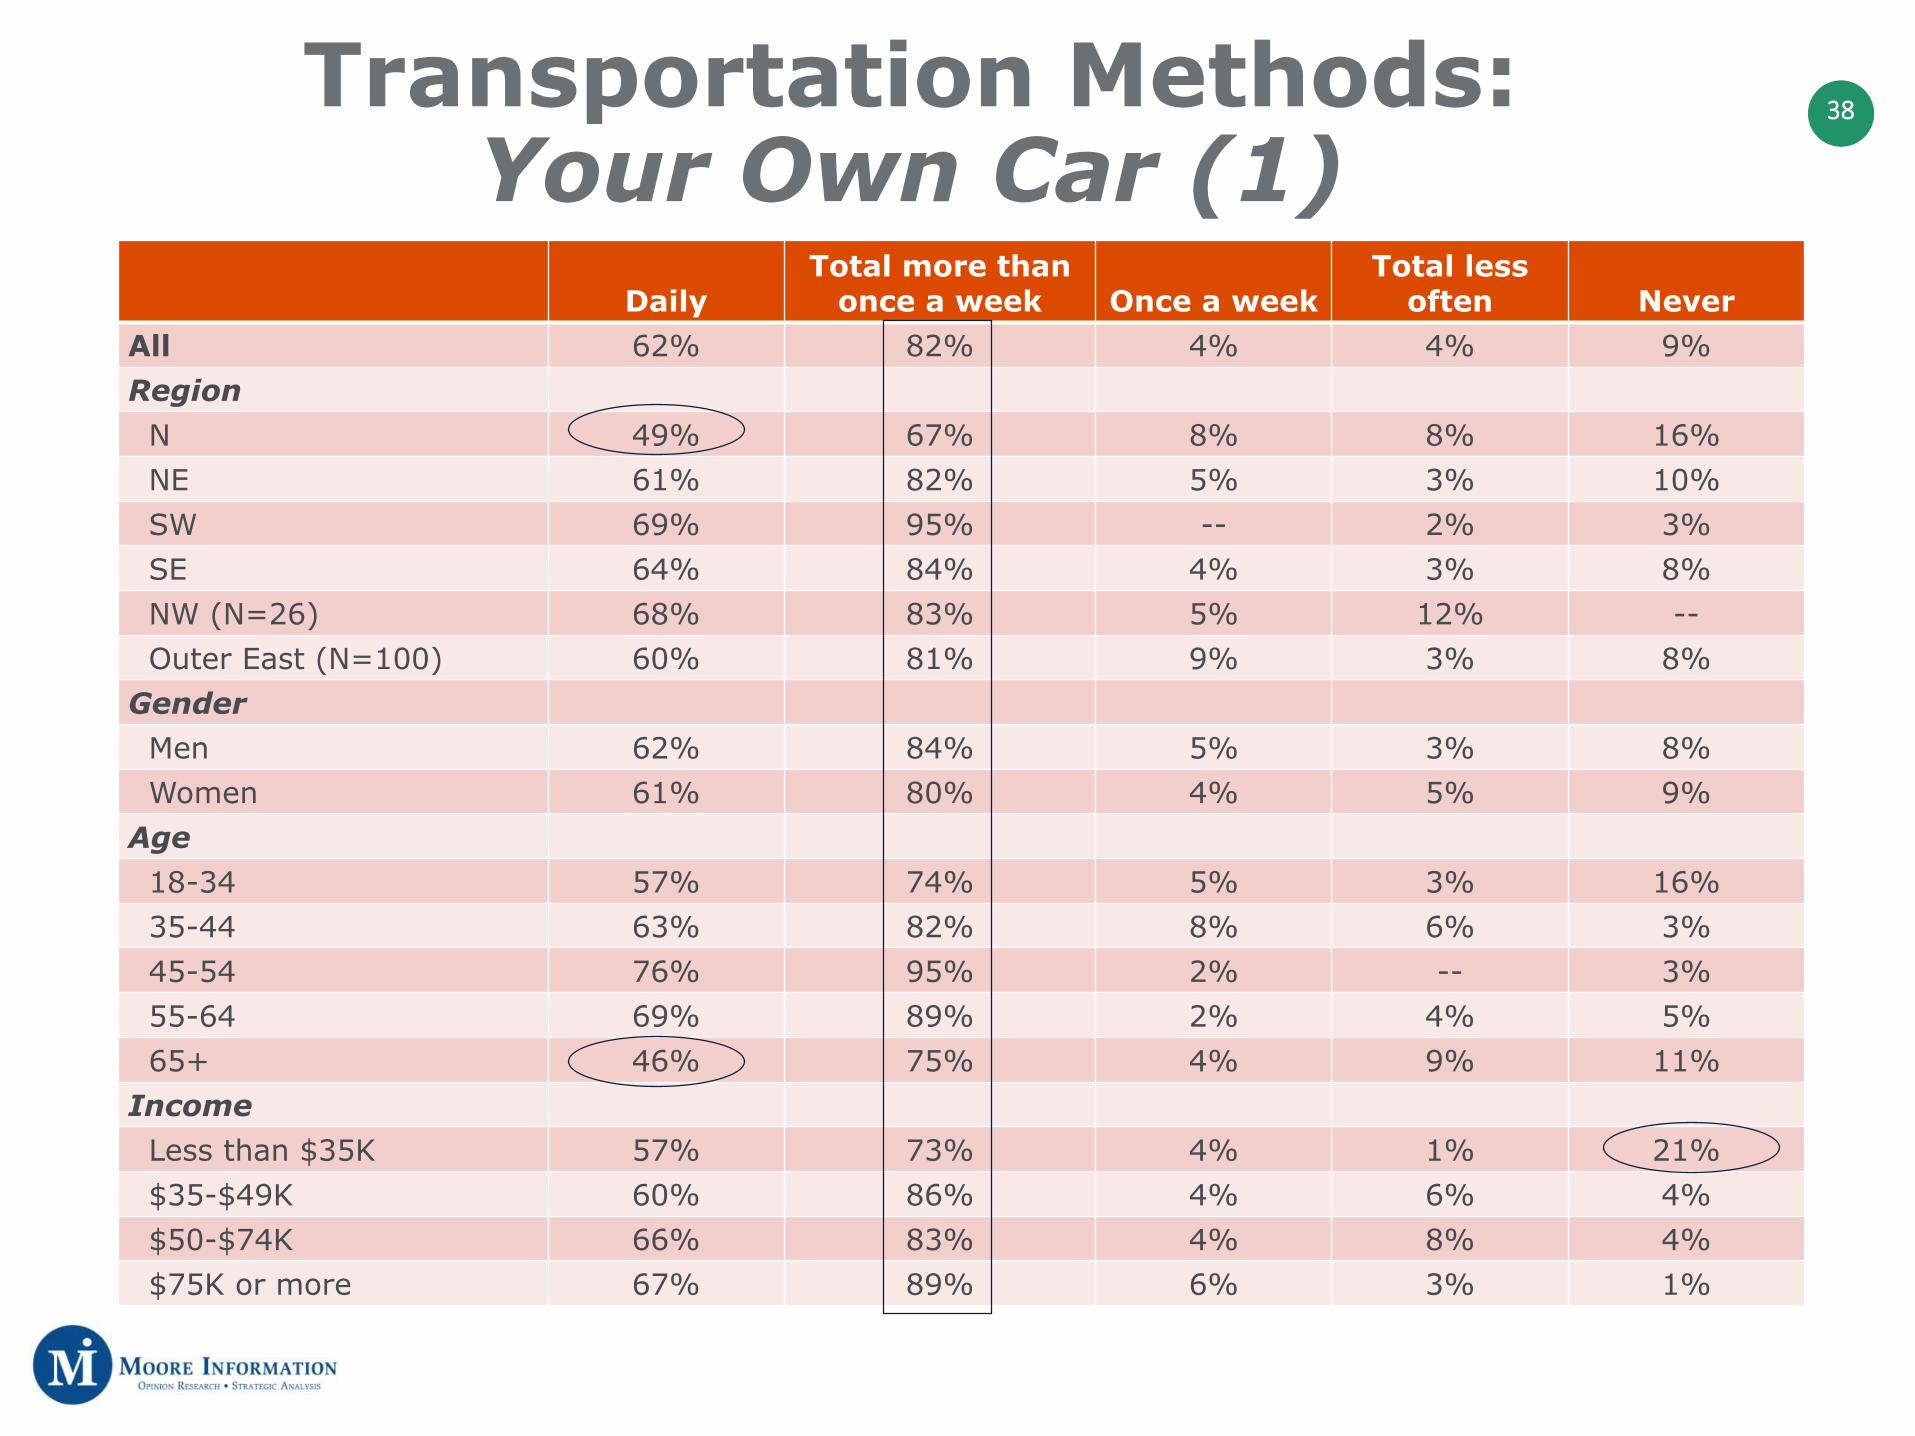
38Transportation Methods:Your Own Car (1)
DailyTotal more than
once a week Once a weekTotal less
often NeverAll 62% 82% 4% 4% 9%Region
N 49% 67% 8% 8% 16%NE 61% 82% 5% 3% 10%SW 69% 95% -- 2% 3%SE 64% 84% 4% 3% 8%NW (N=26) 68% 83% 5% 12% --Outer East (N=100) 60% 81% 9% 3% 8%
GenderMen 62% 84% 5% 3% 8%Women 61% 80% 4% 5% 9%
Age18-34 57% 74% 5% 3% 16%35-44 63% 82% 8% 6% 3%45-54 76% 95% 2% -- 3%55-64 69% 89% 2% 4% 5%65+ 46% 75% 4% 9% 11%
IncomeLess than $35K 57% 73% 4% 1% 21%$35-$49K 60% 86% 4% 6% 4%$50-$74K 66% 83% 4% 8% 4%$75K or more 67% 89% 6% 3% 1%

39Transportation Methods:Your Own Car (2)
DailyTotal more than
once a week Once a weekTotal less
often NeverAll 62% 82% 4% 4% 9%Ethnicity
Caucasians 64% 84% 4% 4% 7%Non-Caucasians 59% 77% 5% 4% 13%
Distance from Downtown Portland
Less than 3 miles 48% 83% -- 8% 9%3-4 miles 66% 80% 8% 2% 10%5-6 miles 67% 87% 5% 2% 5%7-10 miles 62% 85% 4% 5% 4%11+ miles 74% 77% 6% 3% 13%

40Transportation Methods:Carpool (1)
DailyTotal more than
once a week Once a weekTotal less
often NeverAll 5% 16% 7% 27% 51%Region
N -- 14% 4% 34% 48%NE 6% 18% 6% 25% 51%SW 6% 12% 7% 26% 54%SE 6% 16% 10% 25% 50%NW (N=26) 11% 17% -- 27% 56%Outer East (N=100) 9% 21% 10% 19% 50%
GenderMen 5% 15% 4% 24% 57%Women 6% 16% 10% 29% 45%
Age18-34 6% 25% 15% 26% 34%35-44 7% 18% 3% 31% 48%45-54 7% 10% 2% 34% 54%55-64 5% 9% 6% 17% 68%65+ 1% 9% 2% 22% 65%
IncomeLess than $35K 6% 17% 15% 27% 41%$35-$49K 2% 15% 2% 31% 51%$50-$74K 6% 17% 1% 27% 55%$75K or more 5% 13% 6% 25% 56%
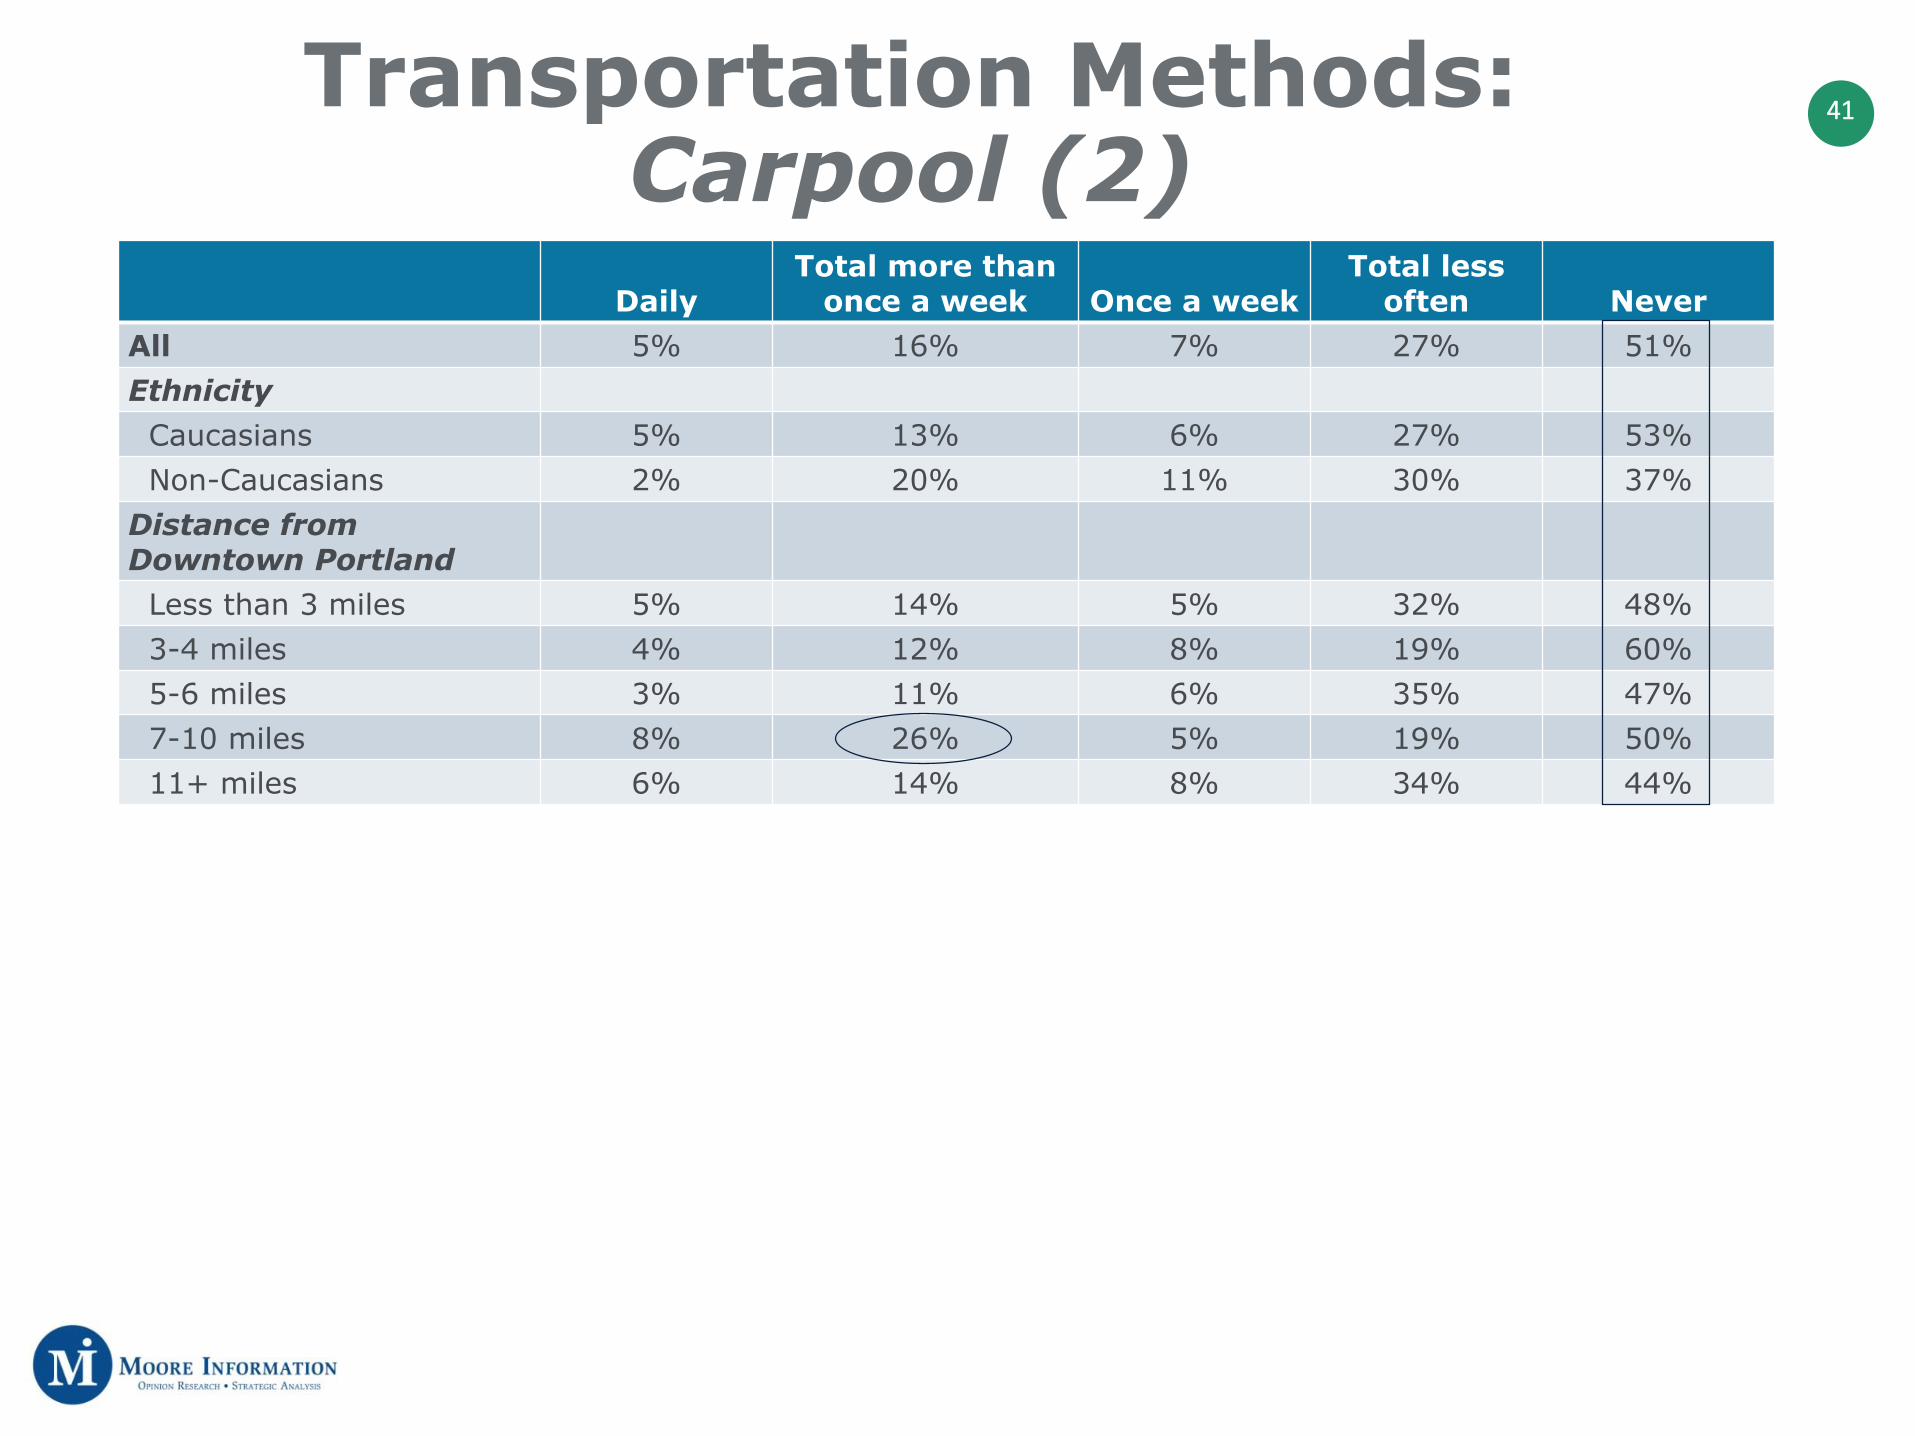
41Transportation Methods:Carpool (2)
DailyTotal more than
once a week Once a weekTotal less
often NeverAll 5% 16% 7% 27% 51%Ethnicity
Caucasians 5% 13% 6% 27% 53%Non-Caucasians 2% 20% 11% 30% 37%
Distance from Downtown Portland
Less than 3 miles 5% 14% 5% 32% 48%3-4 miles 4% 12% 8% 19% 60%5-6 miles 3% 11% 6% 35% 47%7-10 miles 8% 26% 5% 19% 50%11+ miles 6% 14% 8% 34% 44%
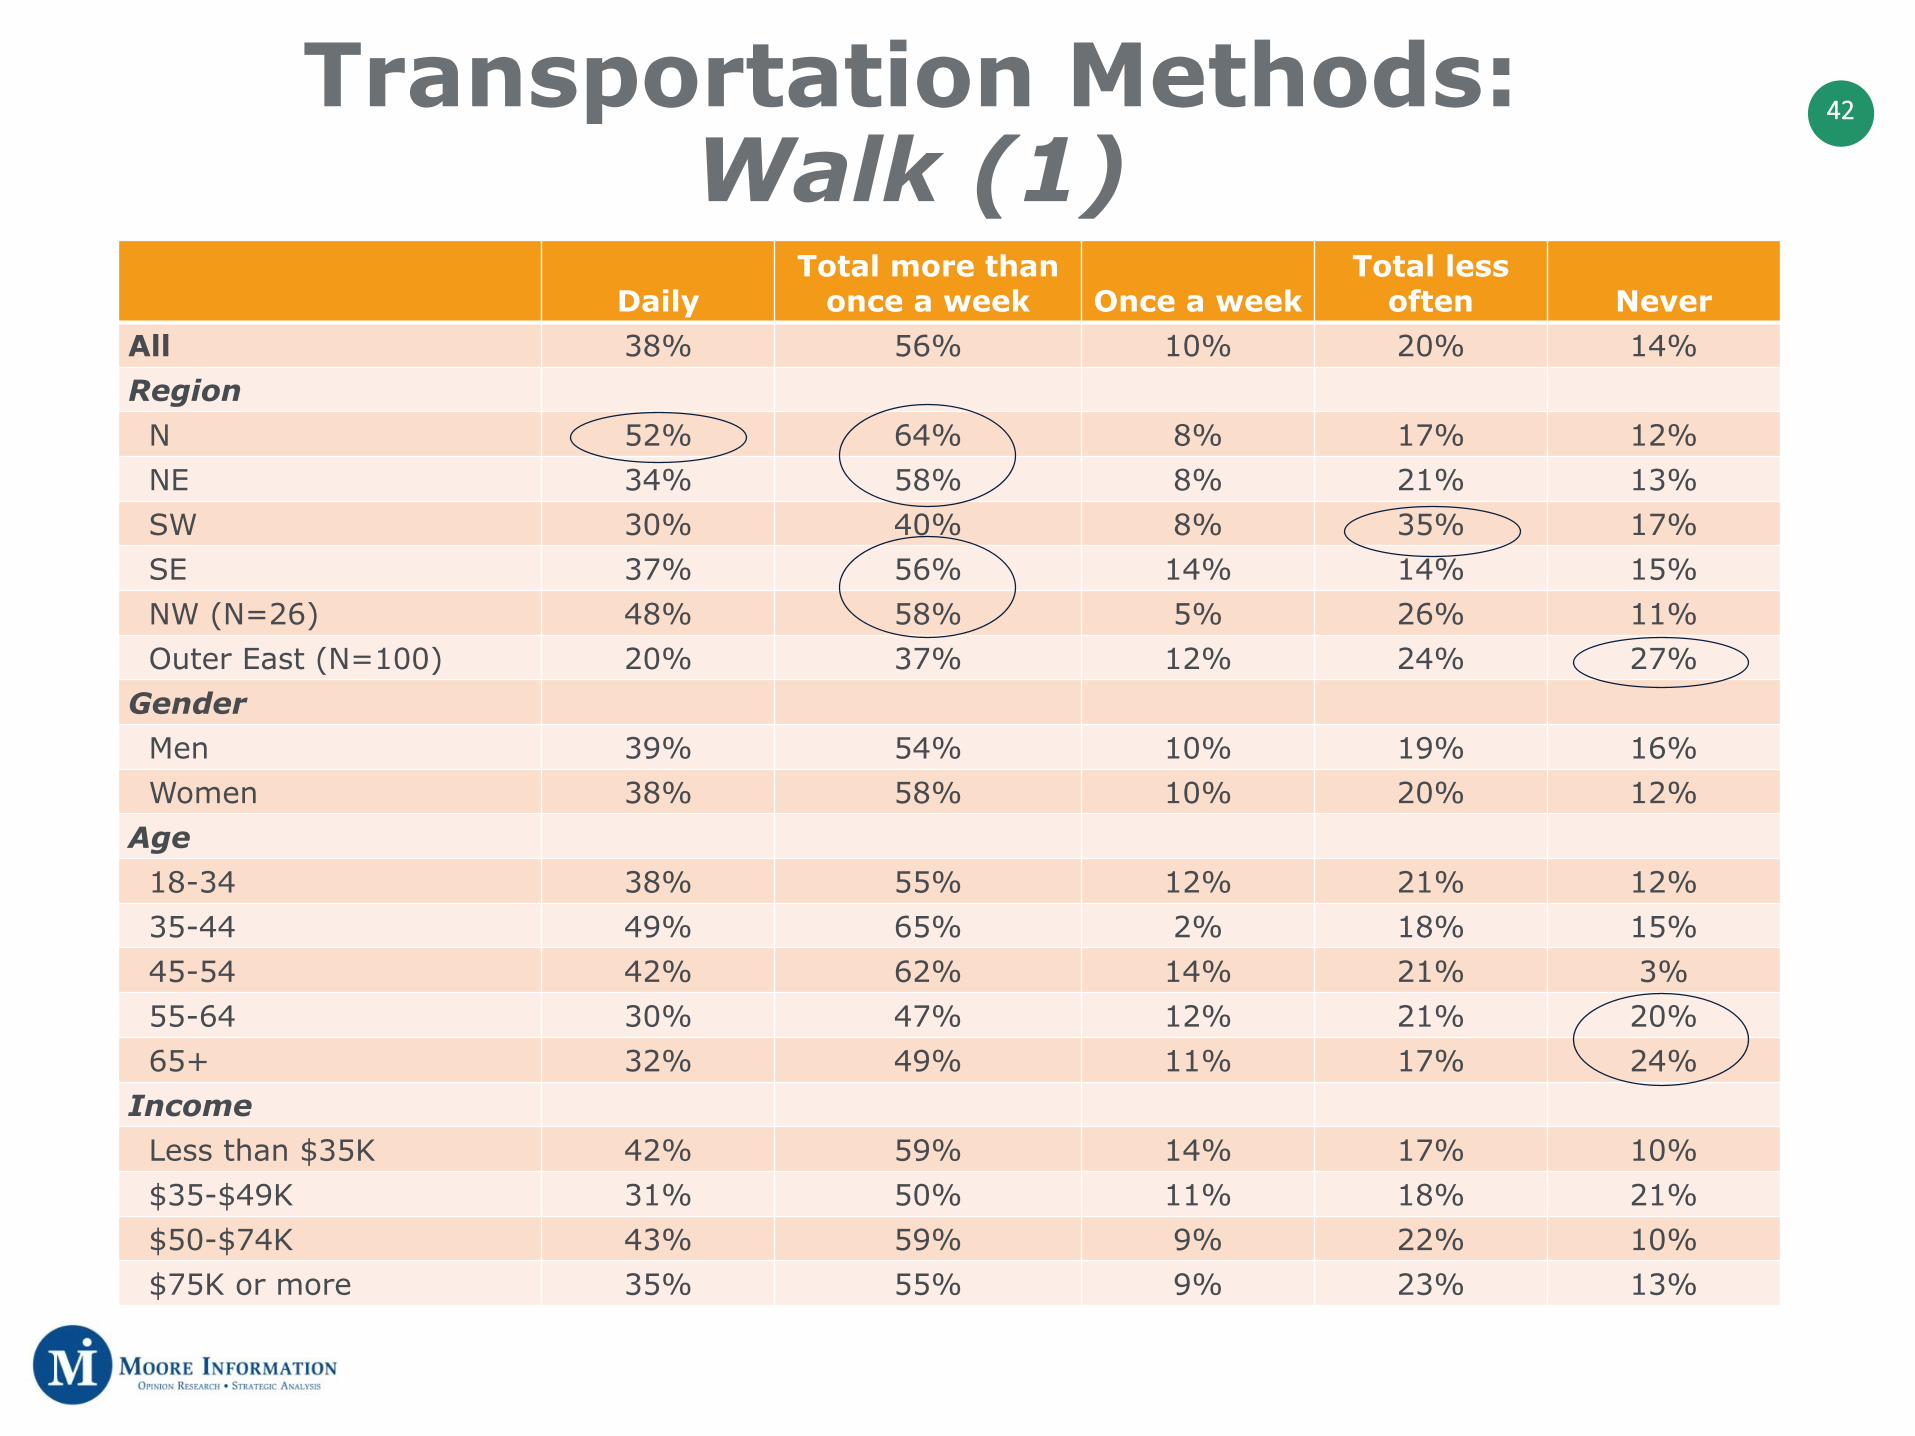
42Transportation Methods:Walk (1)
DailyTotal more than
once a week Once a weekTotal less
often NeverAll 38% 56% 10% 20% 14%Region
N 52% 64% 8% 17% 12%NE 34% 58% 8% 21% 13%SW 30% 40% 8% 35% 17%SE 37% 56% 14% 14% 15%NW (N=26) 48% 58% 5% 26% 11%Outer East (N=100) 20% 37% 12% 24% 27%
GenderMen 39% 54% 10% 19% 16%Women 38% 58% 10% 20% 12%
Age18-34 38% 55% 12% 21% 12%35-44 49% 65% 2% 18% 15%45-54 42% 62% 14% 21% 3%55-64 30% 47% 12% 21% 20%65+ 32% 49% 11% 17% 24%
IncomeLess than $35K 42% 59% 14% 17% 10%$35-$49K 31% 50% 11% 18% 21%$50-$74K 43% 59% 9% 22% 10%$75K or more 35% 55% 9% 23% 13%
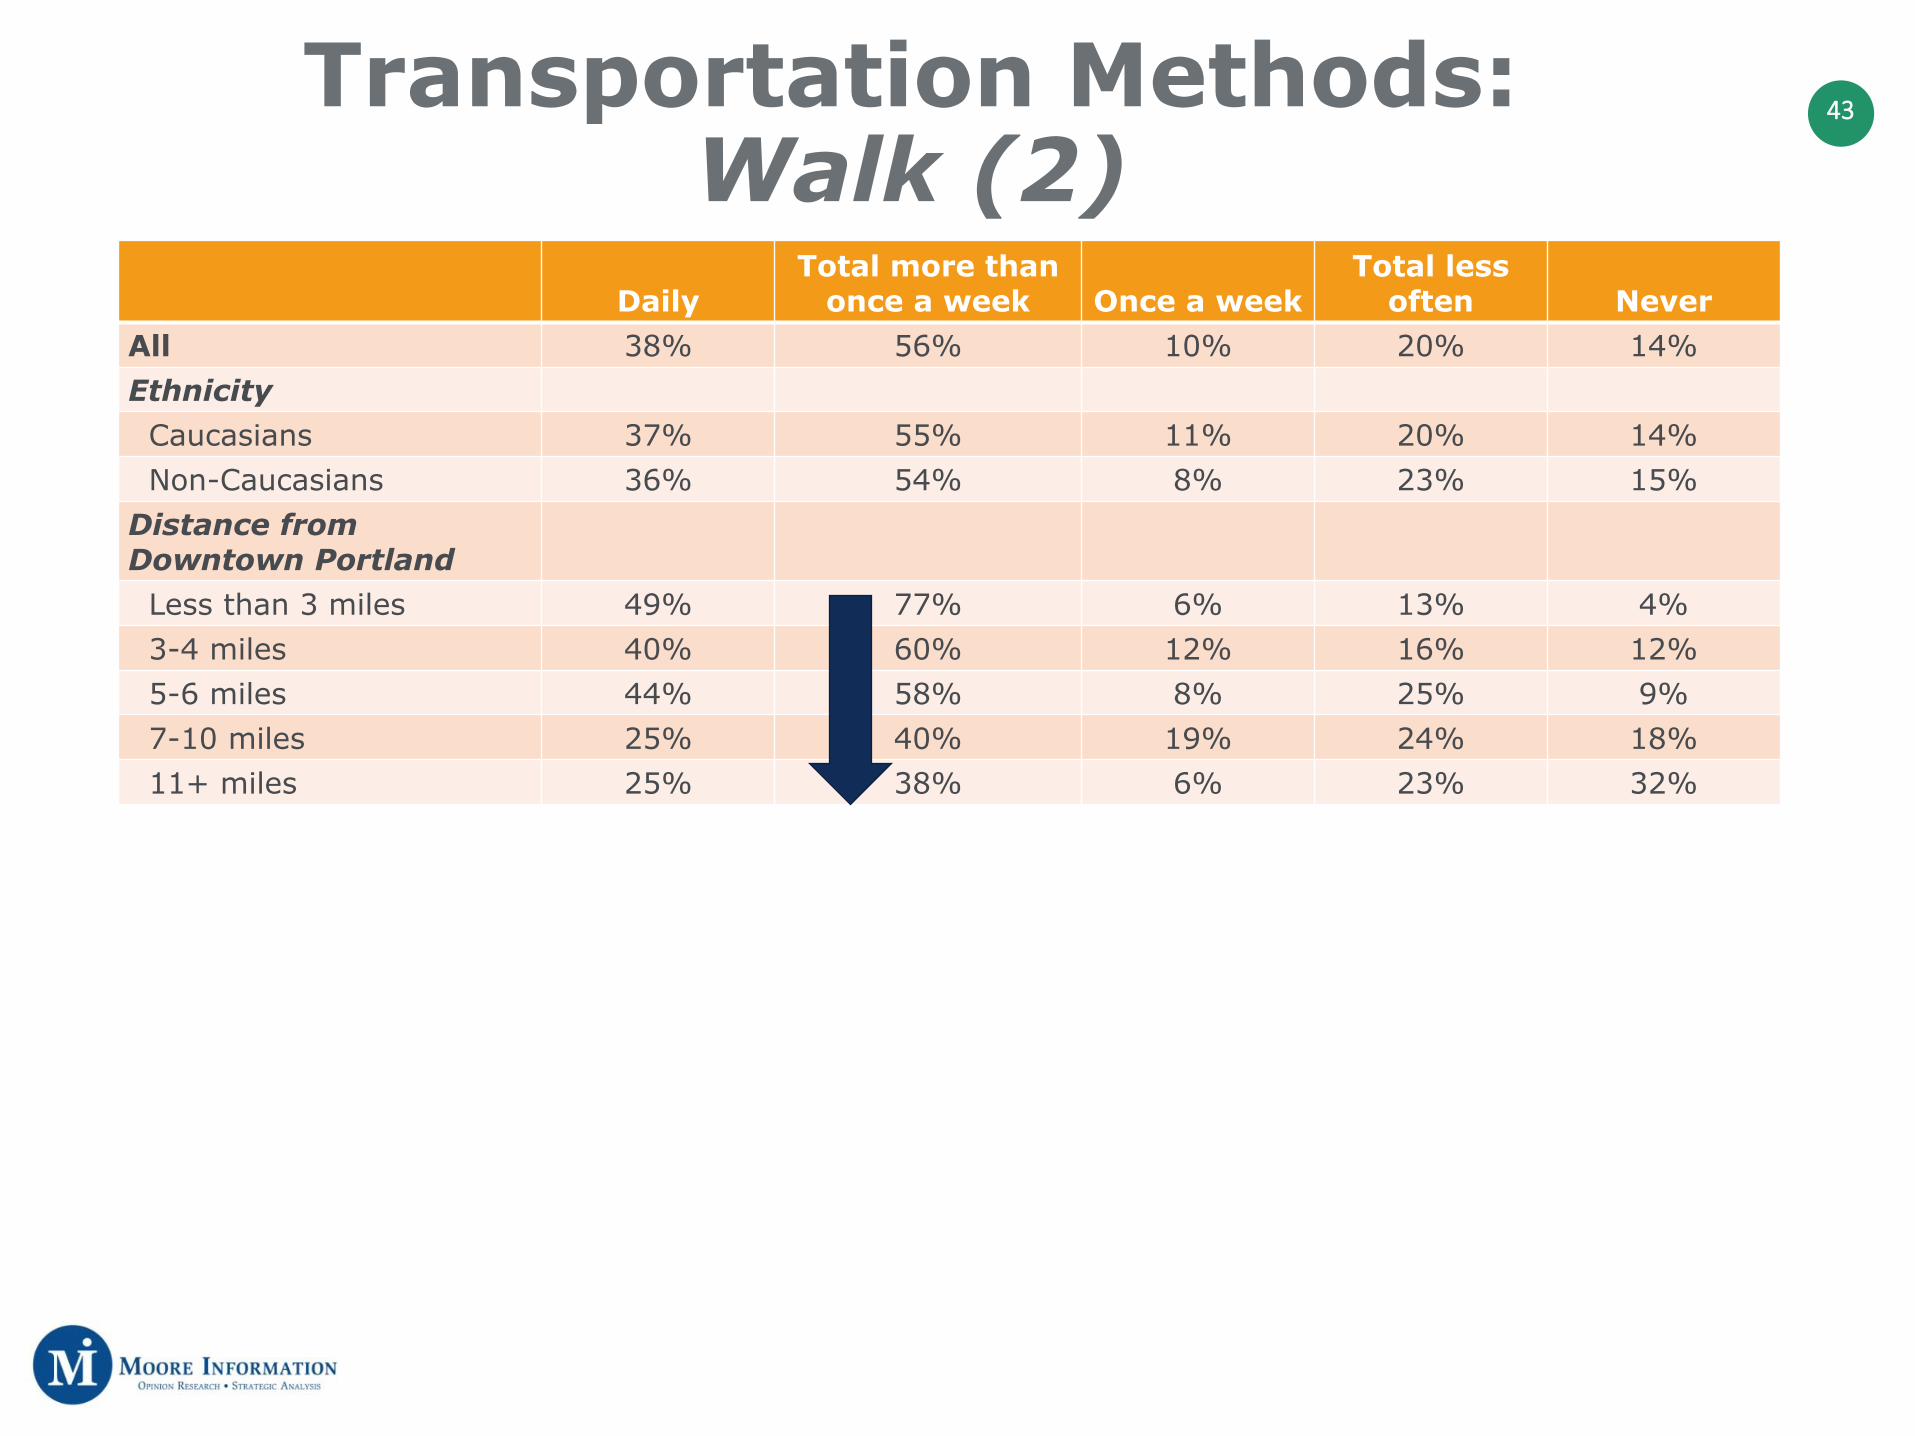
43Transportation Methods:Walk (2)
DailyTotal more than
once a week Once a weekTotal less
often NeverAll 38% 56% 10% 20% 14%Ethnicity
Caucasians 37% 55% 11% 20% 14%Non-Caucasians 36% 54% 8% 23% 15%
Distance from Downtown Portland
Less than 3 miles 49% 77% 6% 13% 4%3-4 miles 40% 60% 12% 16% 12%5-6 miles 44% 58% 8% 25% 9%7-10 miles 25% 40% 19% 24% 18%11+ miles 25% 38% 6% 23% 32%
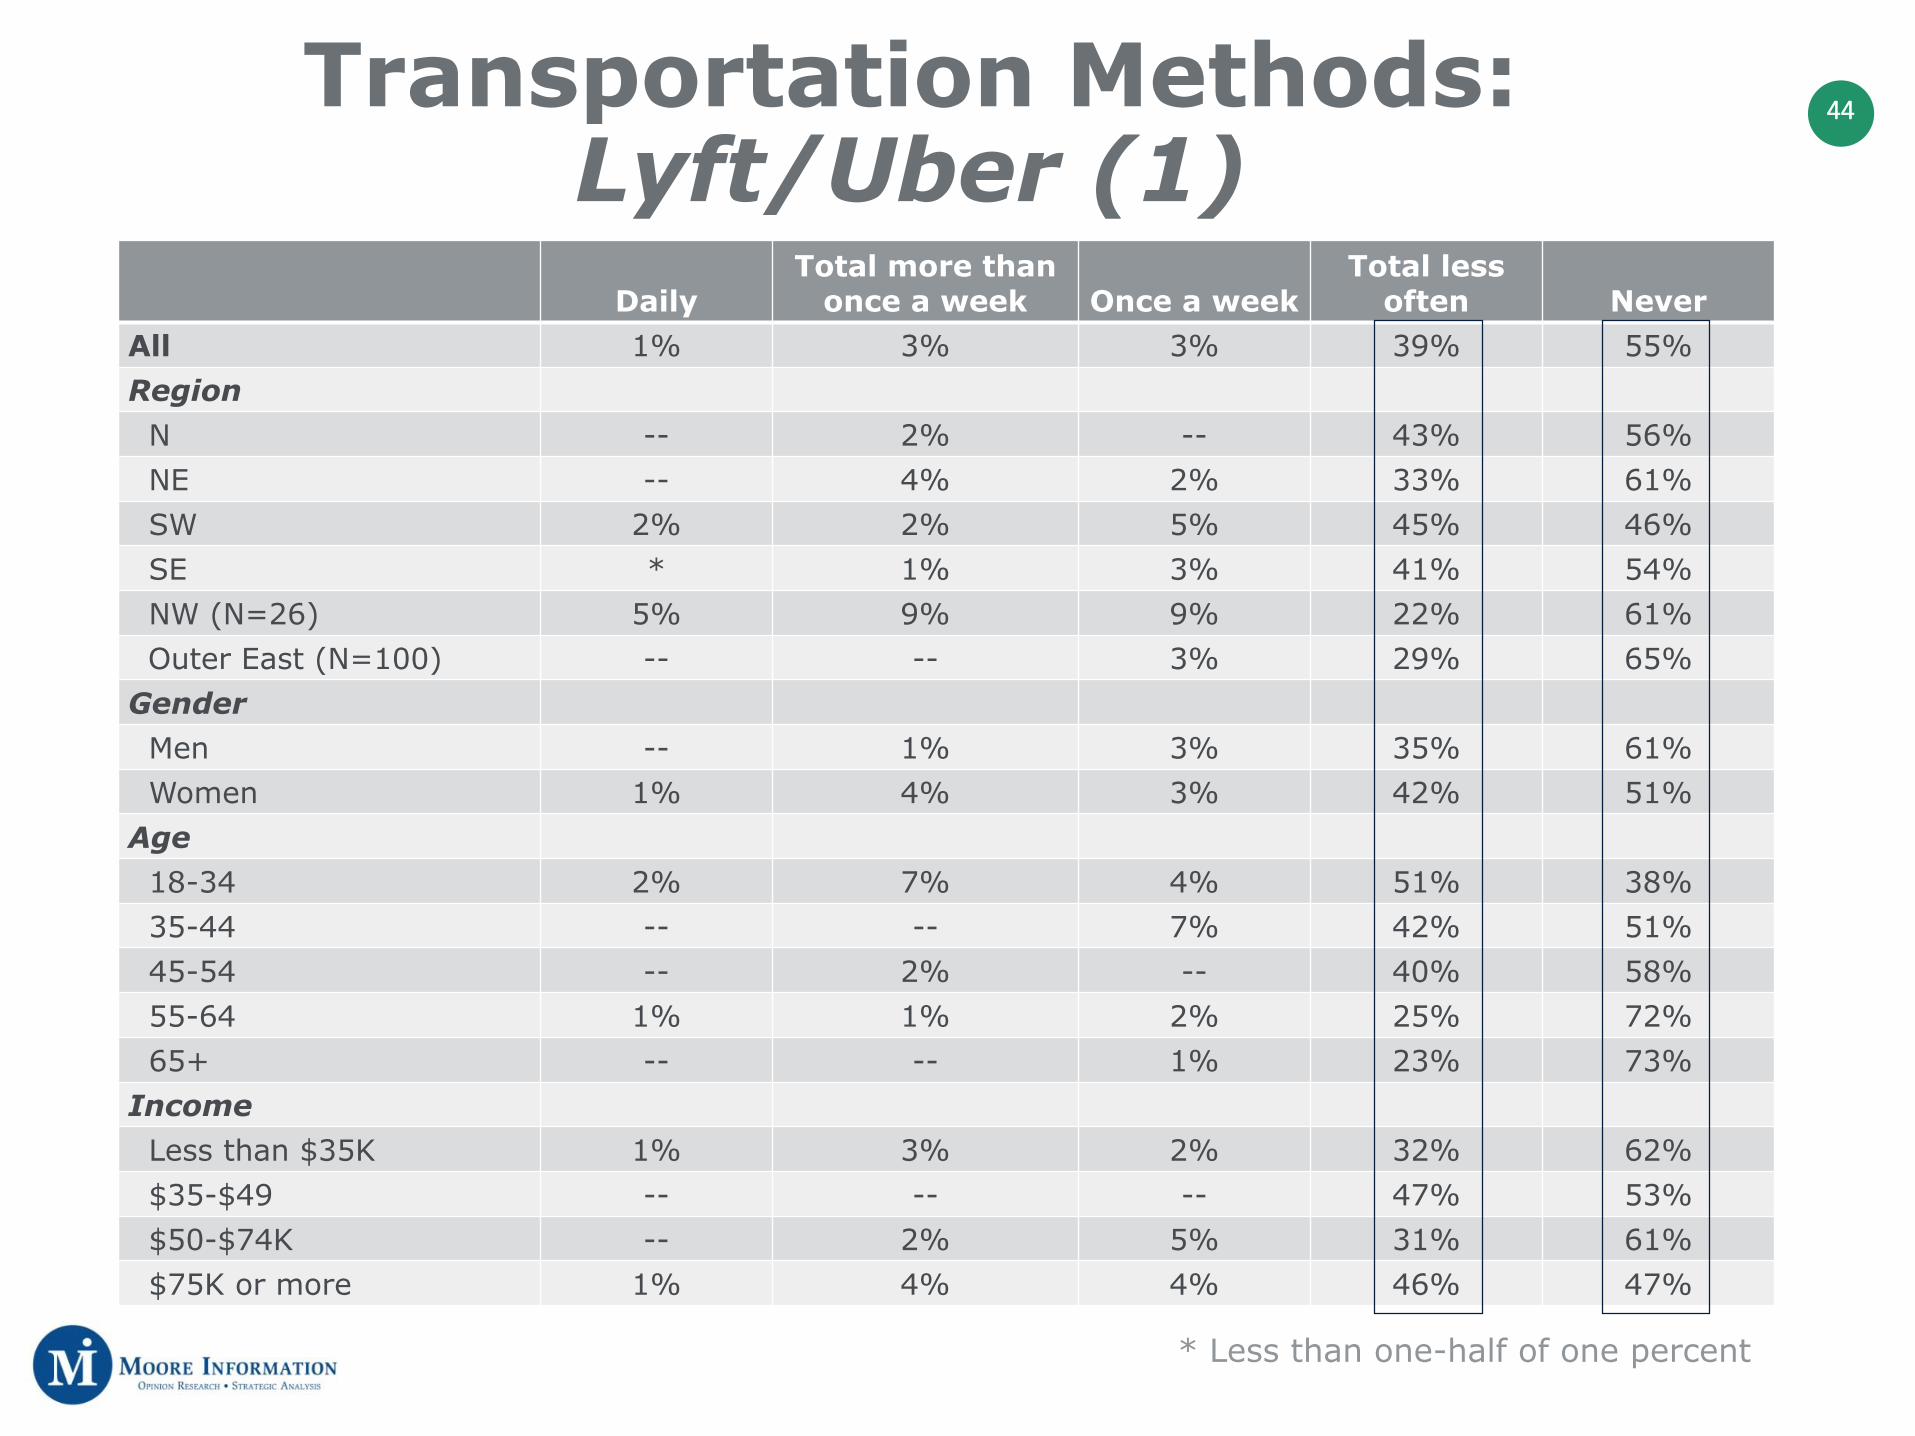
44Transportation Methods:Lyft/Uber (1)
DailyTotal more than
once a week Once a weekTotal less
often NeverAll 1% 3% 3% 39% 55%Region
N -- 2% -- 43% 56%NE -- 4% 2% 33% 61%SW 2% 2% 5% 45% 46%SE * 1% 3% 41% 54%NW (N=26) 5% 9% 9% 22% 61%Outer East (N=100) -- -- 3% 29% 65%
GenderMen -- 1% 3% 35% 61%Women 1% 4% 3% 42% 51%
Age18-34 2% 7% 4% 51% 38%35-44 -- -- 7% 42% 51%45-54 -- 2% -- 40% 58%55-64 1% 1% 2% 25% 72%65+ -- -- 1% 23% 73%
IncomeLess than $35K 1% 3% 2% 32% 62%$35-$49 -- -- -- 47% 53%$50-$74K -- 2% 5% 31% 61%$75K or more 1% 4% 4% 46% 47%
* Less than one-half of one percent
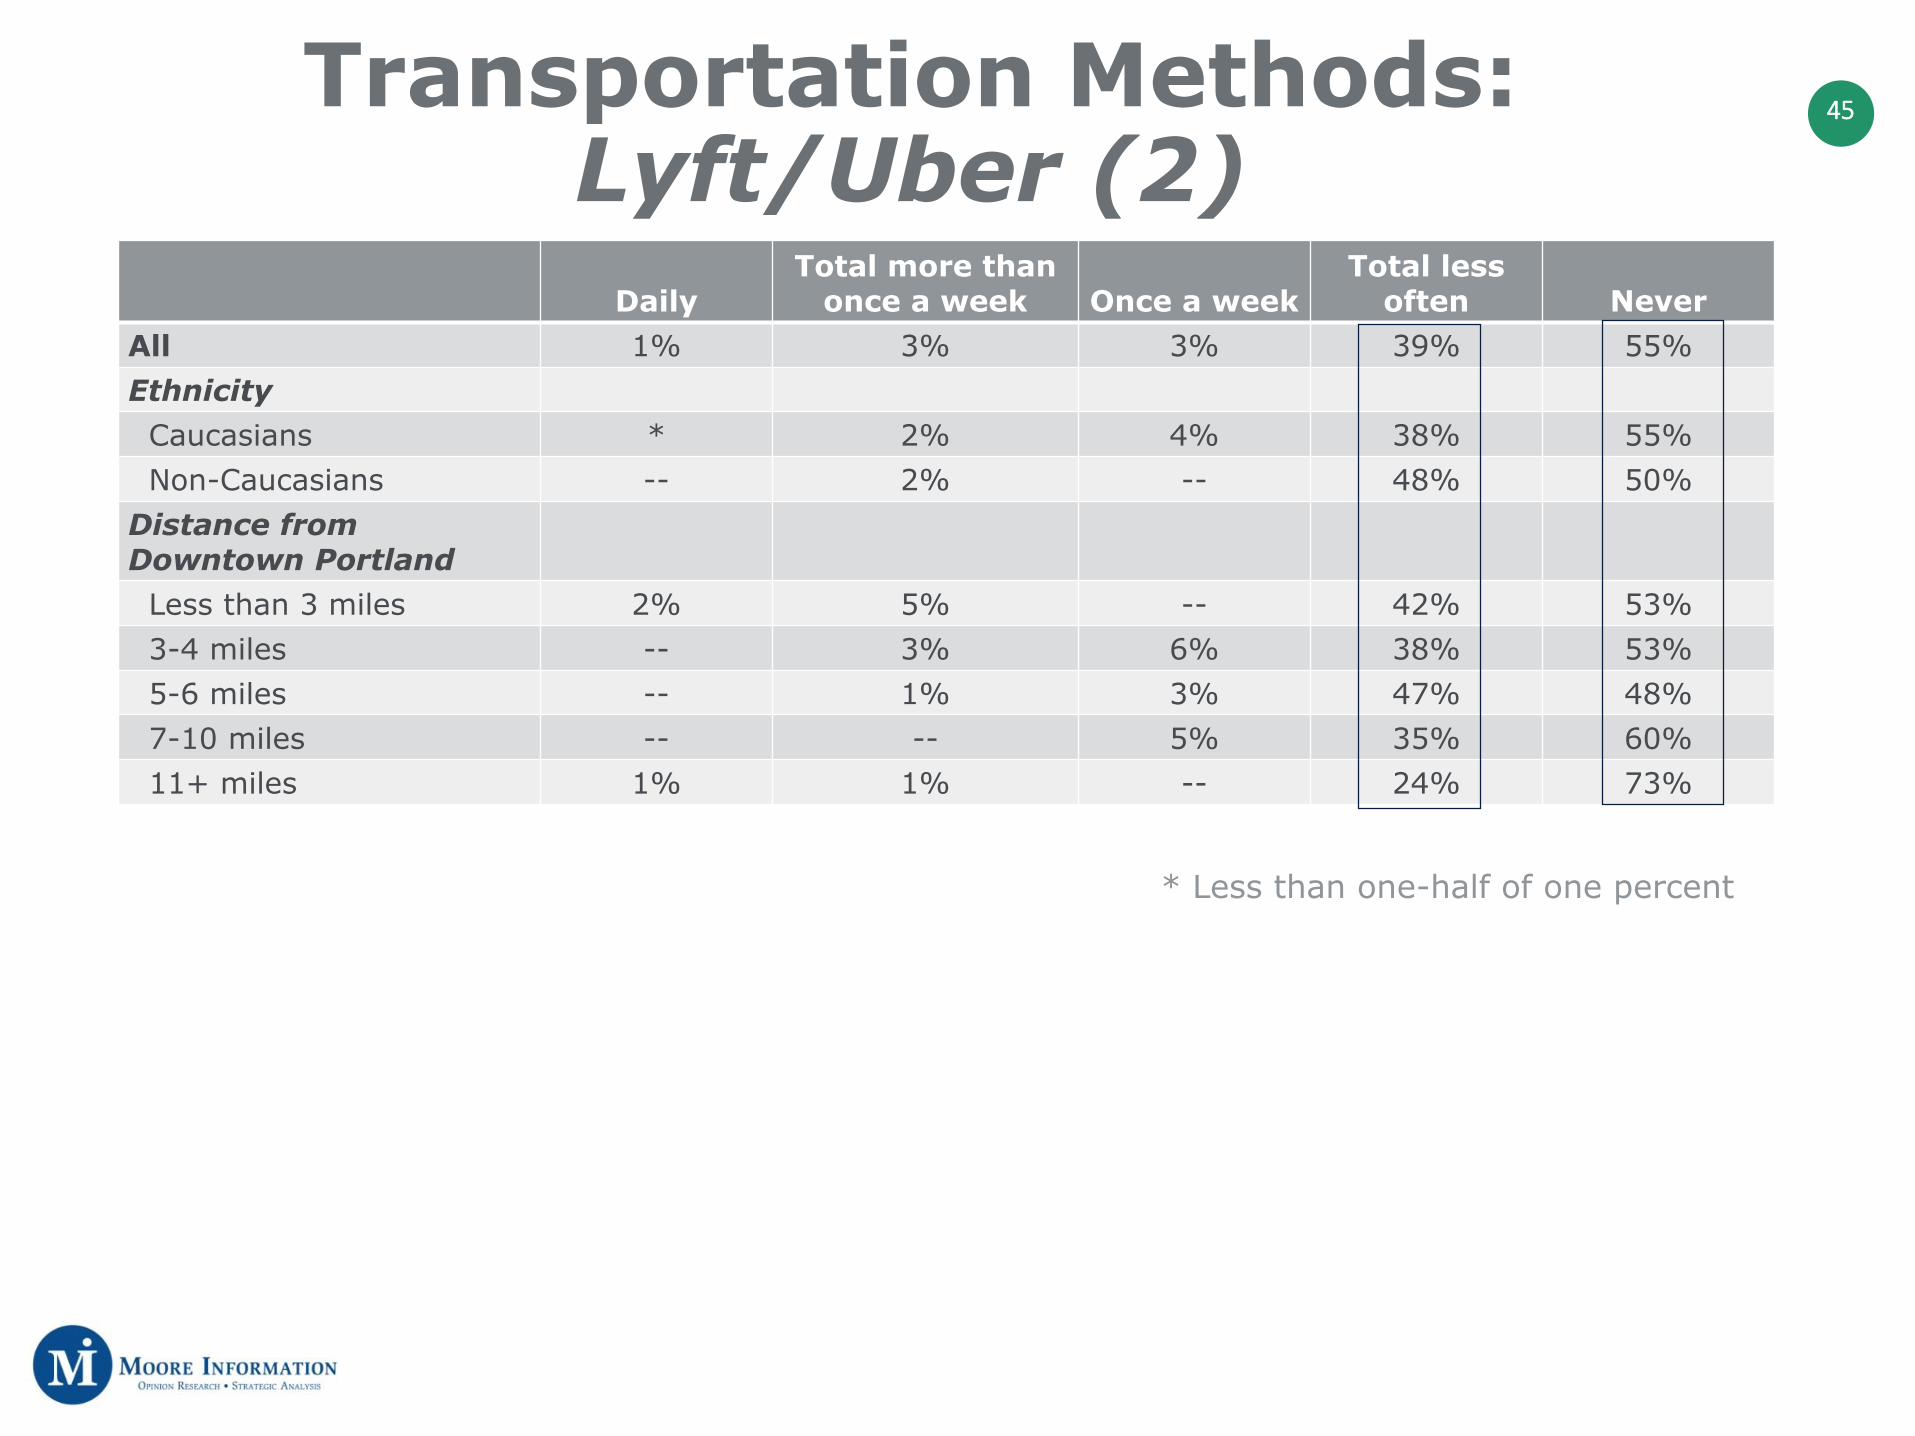
45Transportation Methods:Lyft/Uber (2)
DailyTotal more than
once a week Once a weekTotal less
often NeverAll 1% 3% 3% 39% 55%Ethnicity
Caucasians * 2% 4% 38% 55%Non-Caucasians -- 2% -- 48% 50%
Distance from Downtown Portland
Less than 3 miles 2% 5% -- 42% 53%3-4 miles -- 3% 6% 38% 53%5-6 miles -- 1% 3% 47% 48%7-10 miles -- -- 5% 35% 60%11+ miles 1% 1% -- 24% 73%
* Less than one-half of one percent
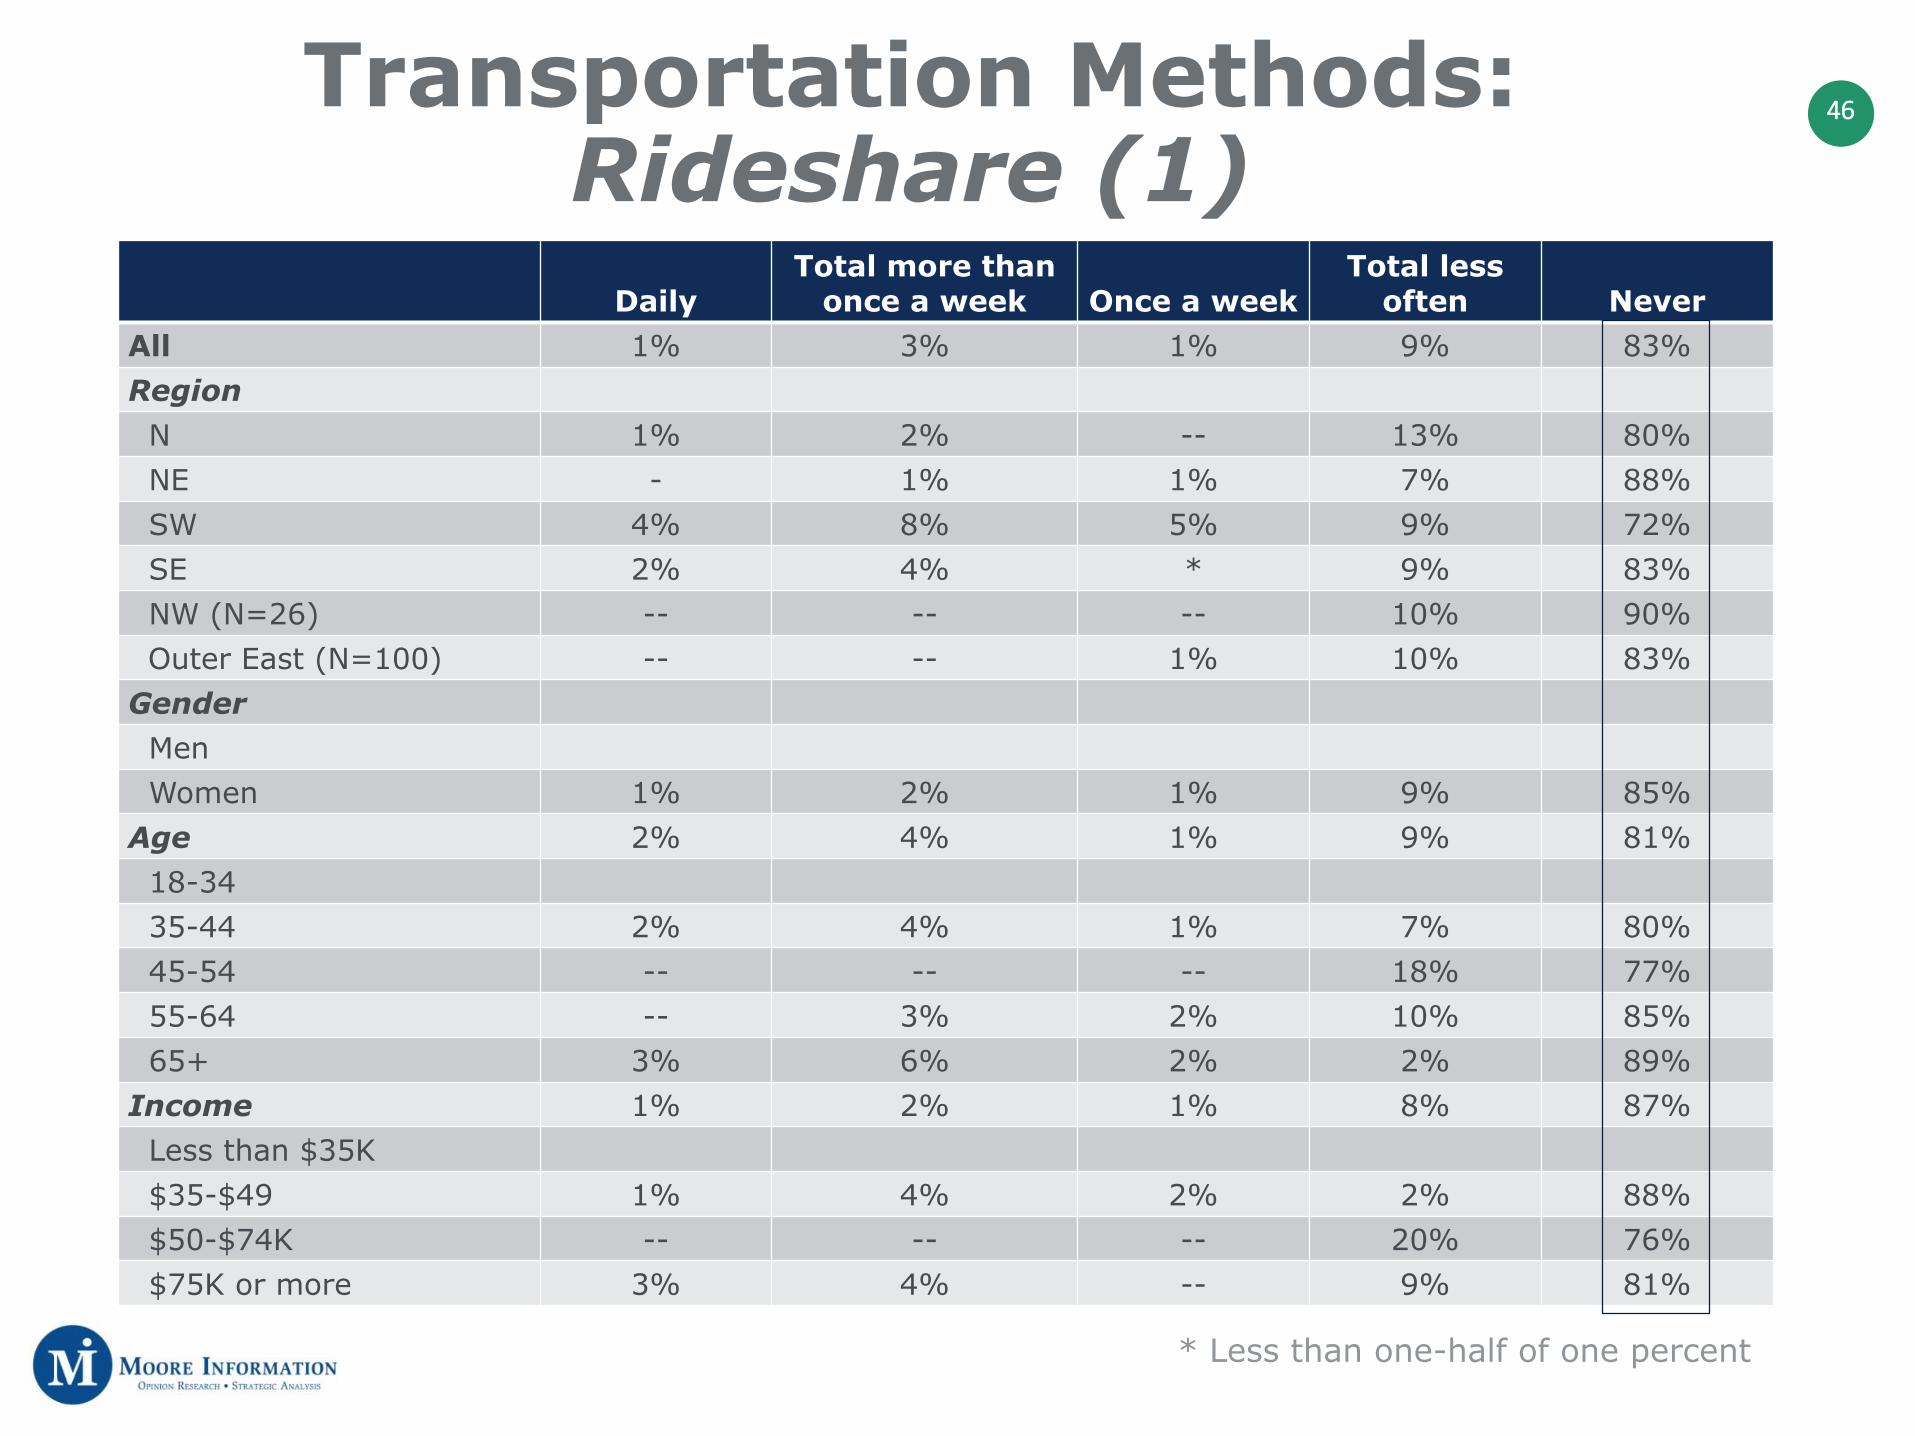
46Transportation Methods:Rideshare (1)
DailyTotal more than
once a week Once a weekTotal less
often NeverAll 1% 3% 1% 9% 83%Region
N 1% 2% -- 13% 80%NE - 1% 1% 7% 88%SW 4% 8% 5% 9% 72%SE 2% 4% * 9% 83%NW (N=26) -- -- -- 10% 90%Outer East (N=100) -- -- 1% 10% 83%
GenderMenWomen 1% 2% 1% 9% 85%
Age 2% 4% 1% 9% 81%18-3435-44 2% 4% 1% 7% 80%45-54 -- -- -- 18% 77%55-64 -- 3% 2% 10% 85%65+ 3% 6% 2% 2% 89%
Income 1% 2% 1% 8% 87%Less than $35K$35-$49 1% 4% 2% 2% 88%$50-$74K -- -- -- 20% 76%$75K or more 3% 4% -- 9% 81%
* Less than one-half of one percent
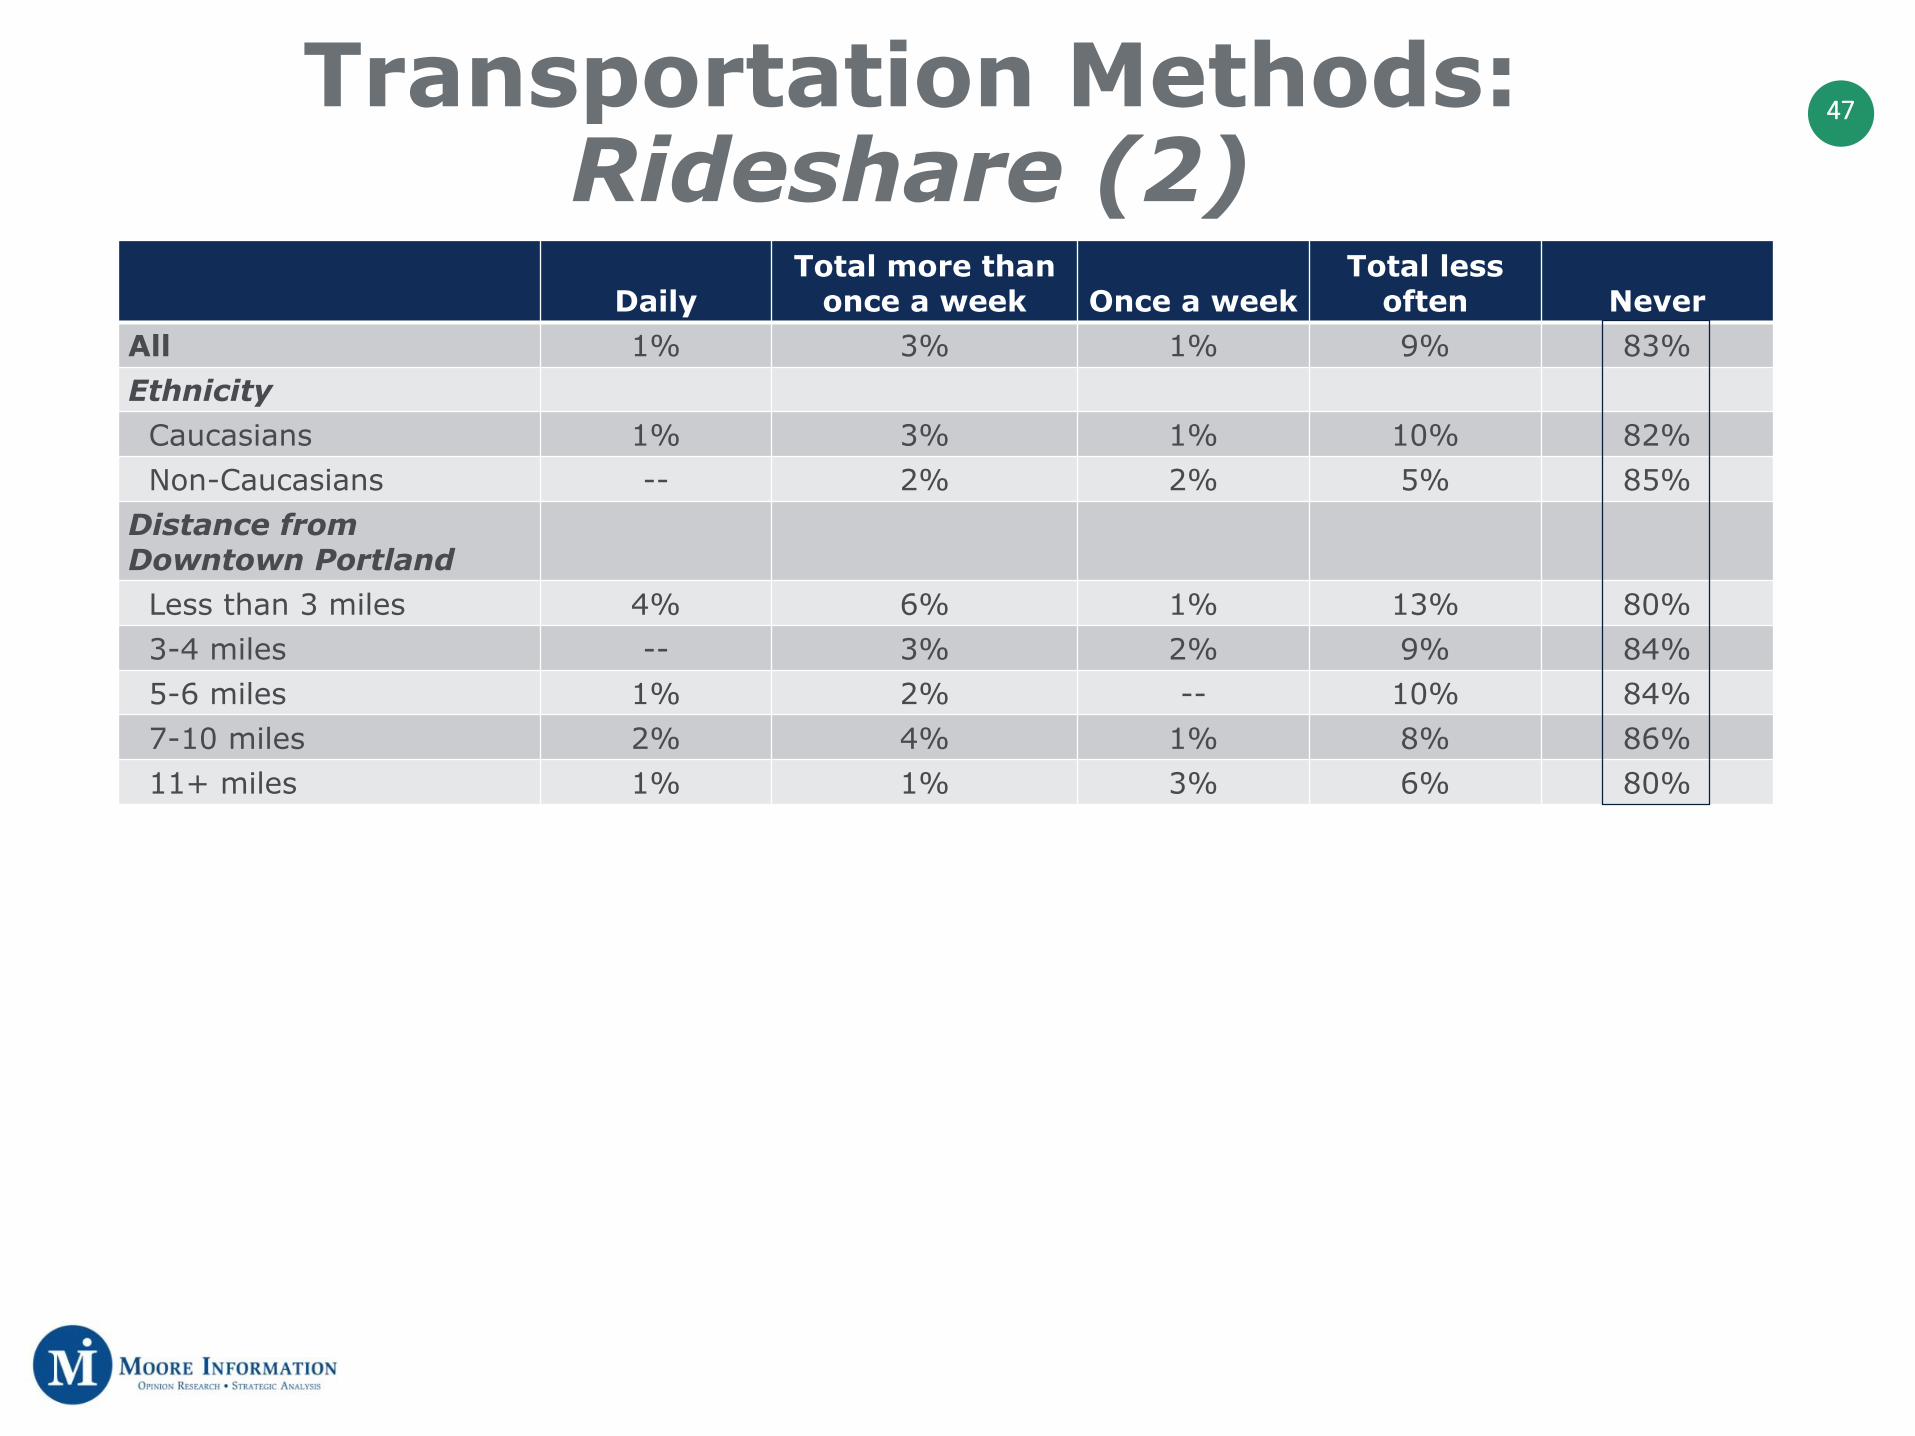
47Transportation Methods:Rideshare (2)
DailyTotal more than
once a week Once a weekTotal less
often NeverAll 1% 3% 1% 9% 83%Ethnicity
Caucasians 1% 3% 1% 10% 82%Non-Caucasians -- 2% 2% 5% 85%
Distance from Downtown Portland
Less than 3 miles 4% 6% 1% 13% 80%3-4 miles -- 3% 2% 9% 84%5-6 miles 1% 2% -- 10% 84%7-10 miles 2% 4% 1% 8% 86%11+ miles 1% 1% 3% 6% 80%

48
Minor problem17%
Major problem80% No problem at
all2%
Don’t know1%
Traffic Congestion is a Major Problem
“Would you say traffic congestion in the City of Portland is a minor problem, a major problem, or no problem at all?” (Q29)
Wide majorities in all key subgroups say traffic congestion is a major problem.
Total problem: 97%

49Traffic Congestion is a Major Problem: Region
Major problem Total problemAll 80% 97%Region
N 84% 100%NE 84% 97%SW 77% 97%SE 76% 97%NW (N=26) 84% 97%Outer East (N=100) 83% 97%
Sentiment is universal, traffic congestion is a problem.
50
Yes80%
No20%
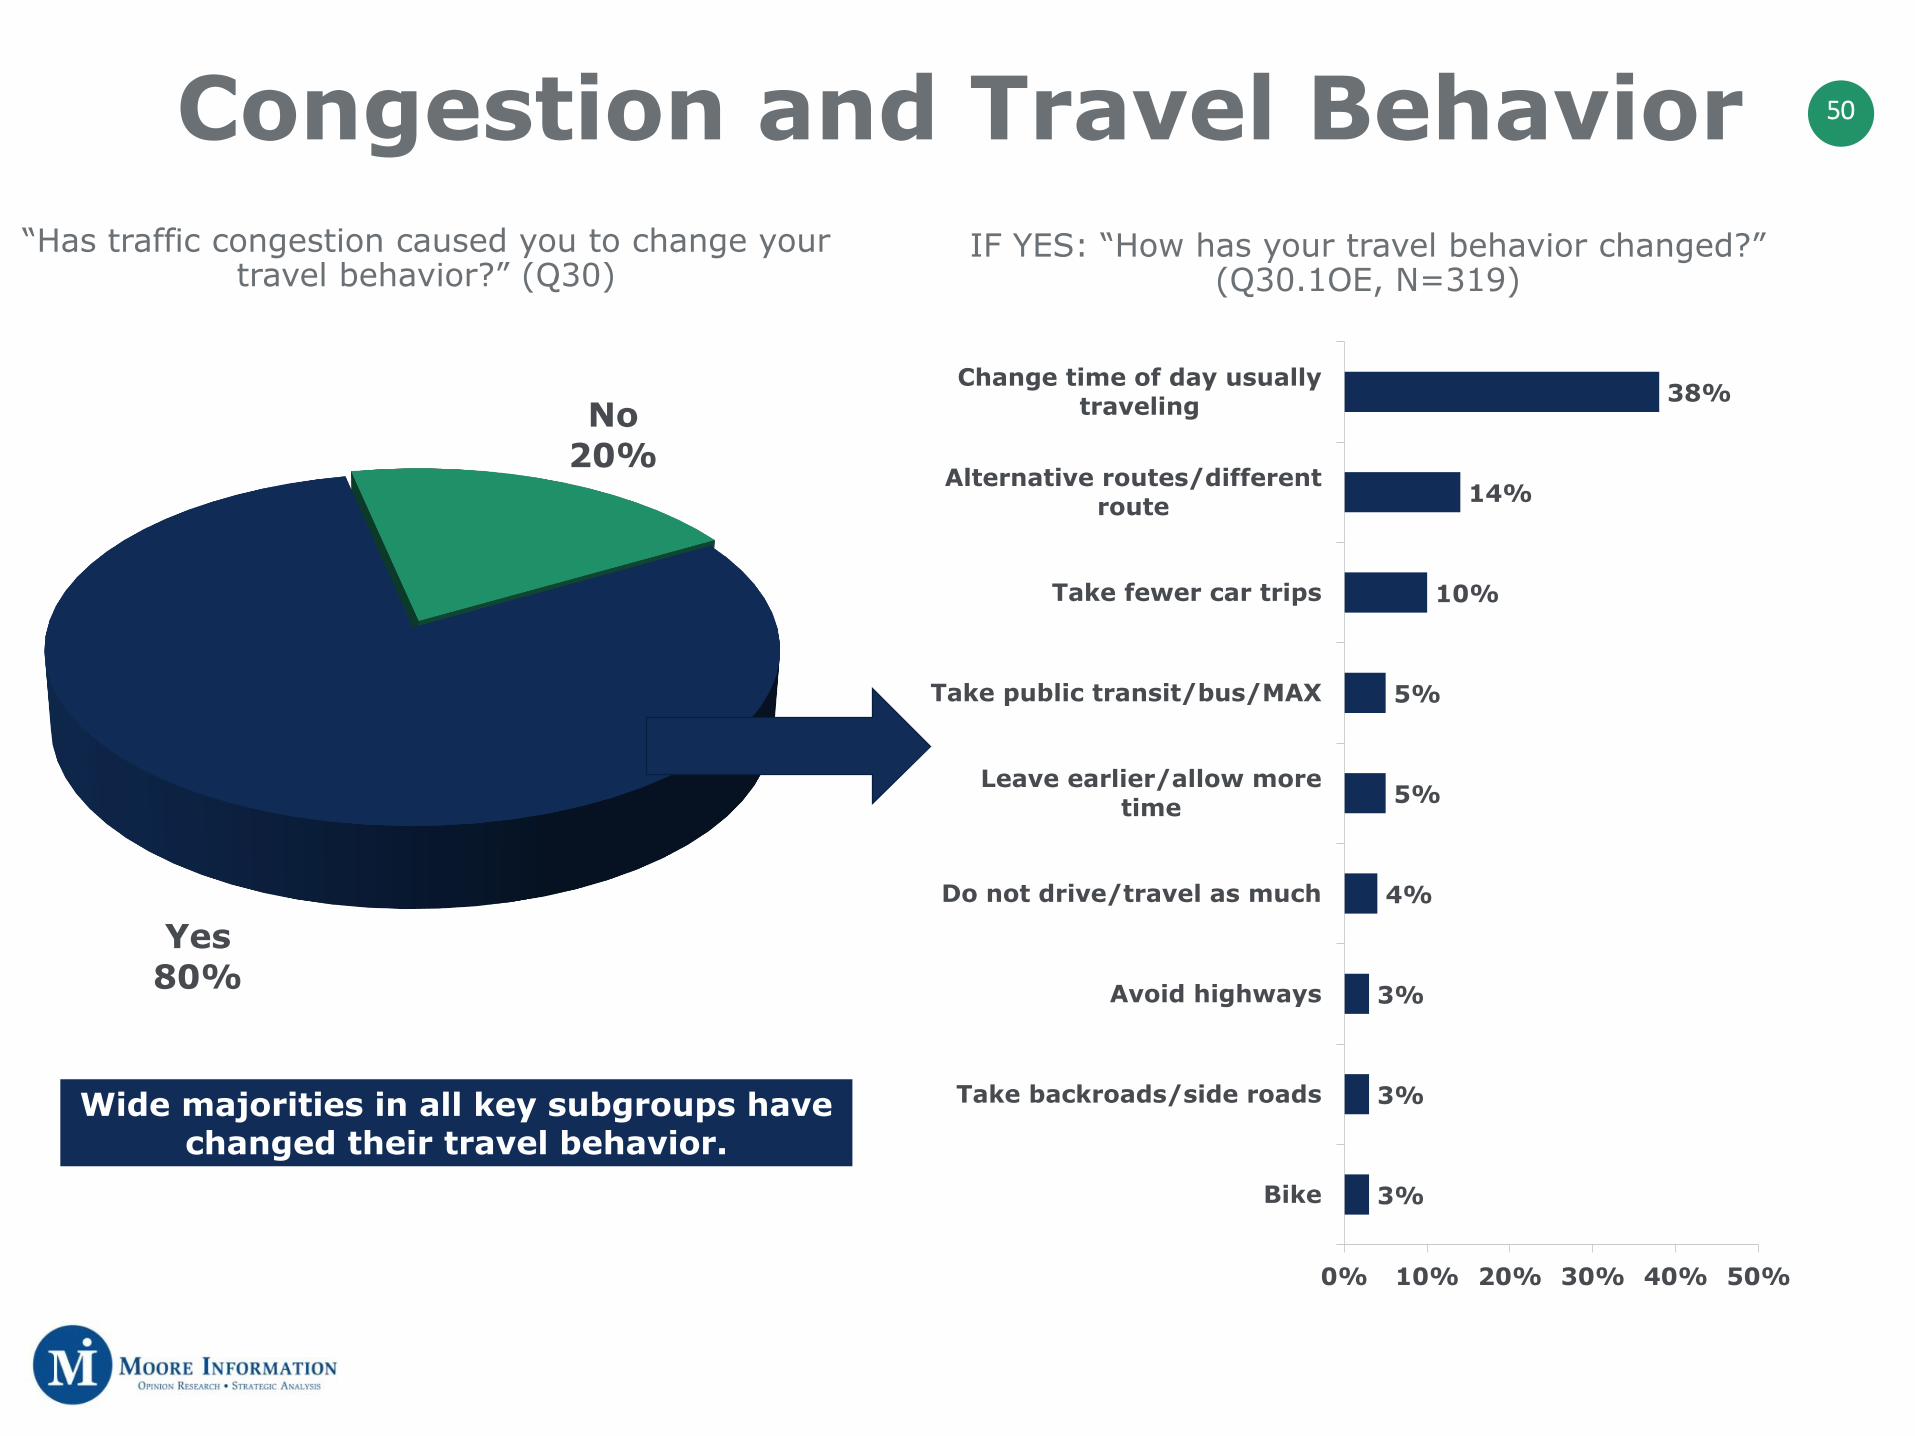
Congestion and Travel Behavior“Has traffic congestion caused you to change your
travel behavior?” (Q30)
Wide majorities in all key subgroups have changed their travel behavior.
38%
14%
10%
5%
5%
4%
3%
3%
3%
0% 10% 20% 30% 40% 50%
Change time of day usuallytraveling
Alternative routes/differentroute
Take fewer car trips
Take public transit/bus/MAX
Leave earlier/allow moretime
Do not drive/travel as much
Avoid highways
Take backroads/side roads
Bike
IF YES: “How has your travel behavior changed?” (Q30.1OE, N=319)

51Congestion and Travel Behavior: Region
Region
All N NE SW SENW
(N=26)Outer East (N=100)
Change time of day usuallytraveling 38% 47% 35% 49% 34% 27% 44%
Alternative routes/different route 14% 8% 17% 3% 18% 9% 17%
Take fewer car trips 10% 7% 15% 12% 6% 12% 8%Take public transit/bus/MAX 5% 6% 4% 2% 8% -- 3%
Leave earlier/allow morecommute times 5% 5% 5% 6% 3% 12% 4%
Do not drive/travel as much 4% -- 4% 15% 2% 3% 3%Avoid highways 3% 1% 6% 4% 3% -- 4%Take backroads/side roads 3% 3% 3% 3% 4% -- --Bike 3% 5% 4% -- 3% -- 1%Combine car trips 2% 5% 2% -- 1% 9% --Walk 2% 2% 2% -- 2% 11% 2%
Monitor traffic conditions/accidents 2% -- 1% -- 4% -- 4%
Moved 2% -- -- 3% 3% -- 2%
Residents throughout the city are changing the times they travel.
52
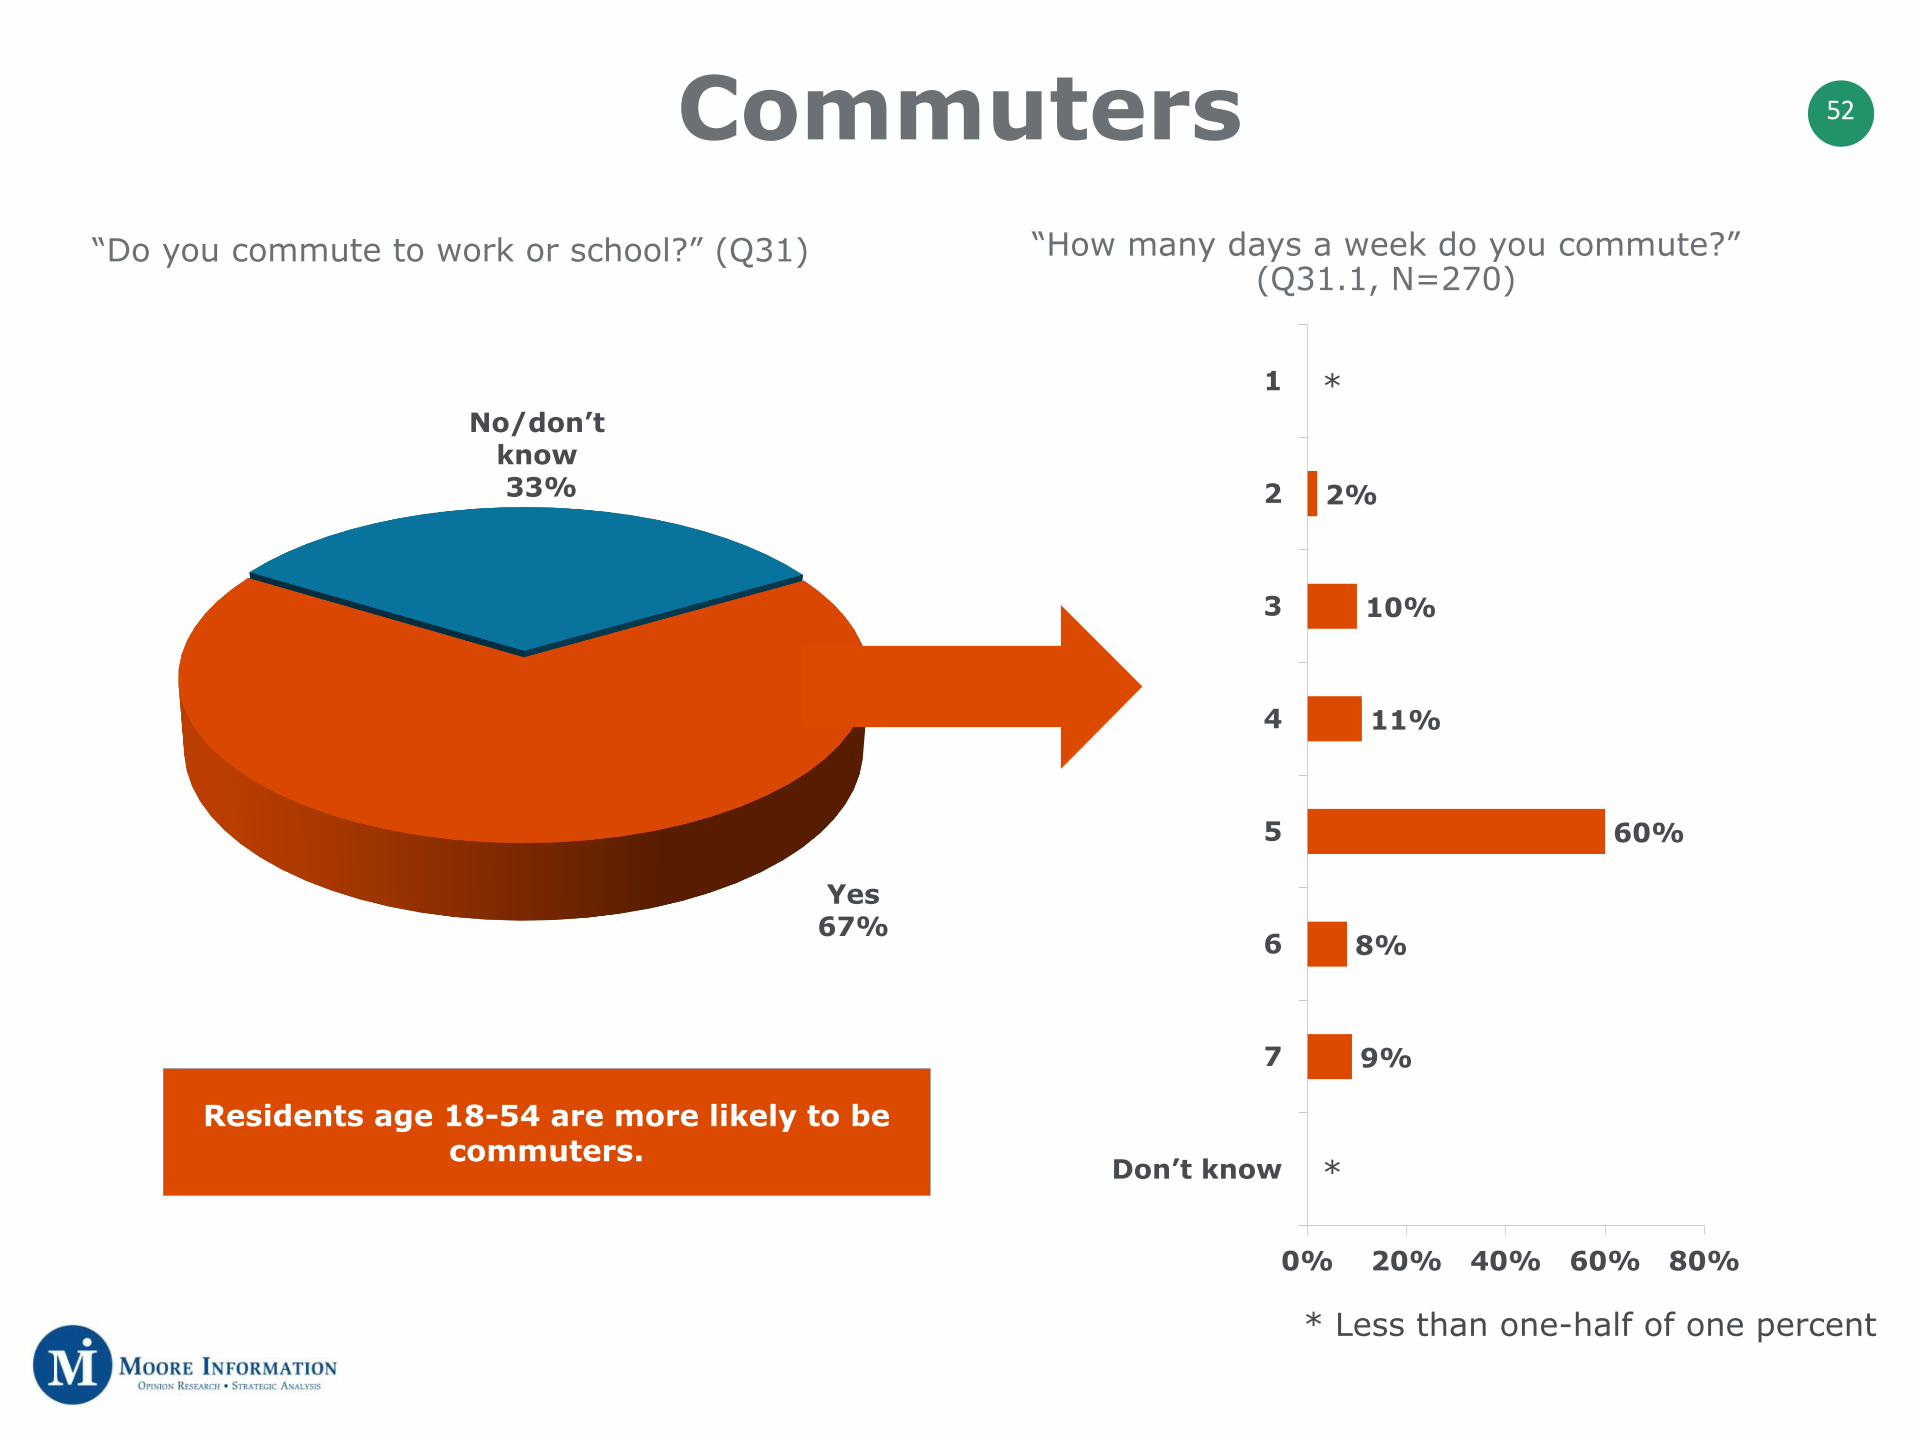
Yes67%
No/don’t know33%
Commuters“Do you commute to work or school?” (Q31)
2%
10%
11%
60%
8%
9%
0% 20% 40% 60% 80%
1
2
3
4
5
6
7
Don’t know
*
*
* Less than one-half of one percent
“How many days a week do you commute?” (Q31.1, N=270)
Residents age 18-54 are more likely to be commuters.
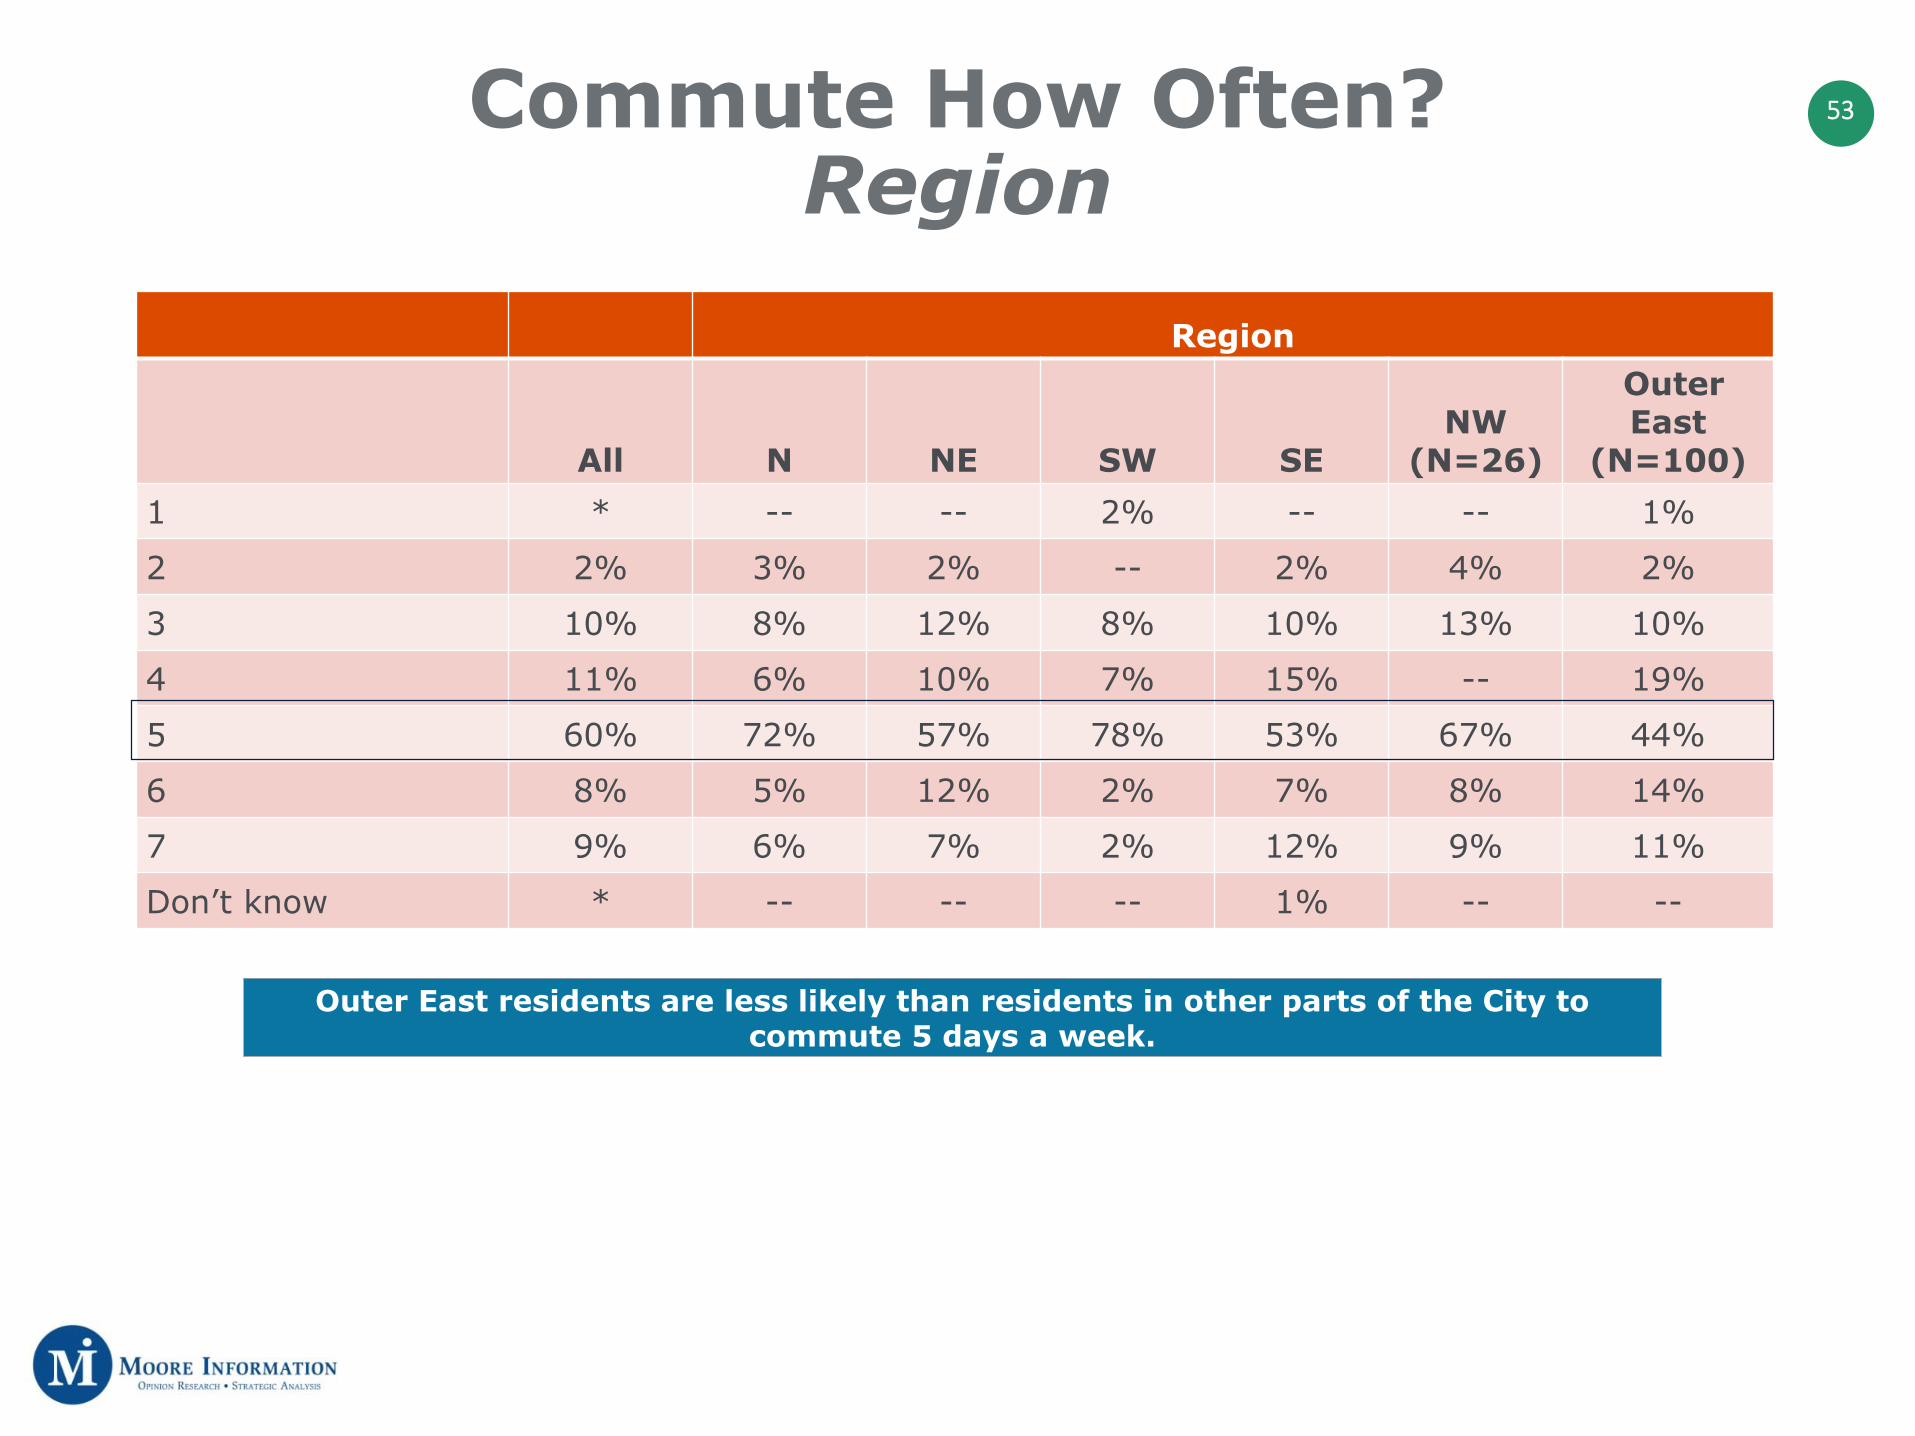
53Commute How Often?Region
Region
All N NE SW SENW
(N=26)
Outer East
(N=100)1 * -- -- 2% -- -- 1%
2 2% 3% 2% -- 2% 4% 2%
3 10% 8% 12% 8% 10% 13% 10%
4 11% 6% 10% 7% 15% -- 19%
5 60% 72% 57% 78% 53% 67% 44%
6 8% 5% 12% 2% 7% 8% 14%
7 9% 6% 7% 2% 12% 9% 11%
Don’t know * -- -- -- 1% -- --
Outer East residents are less likely than residents in other parts of the City to commute 5 days a week.
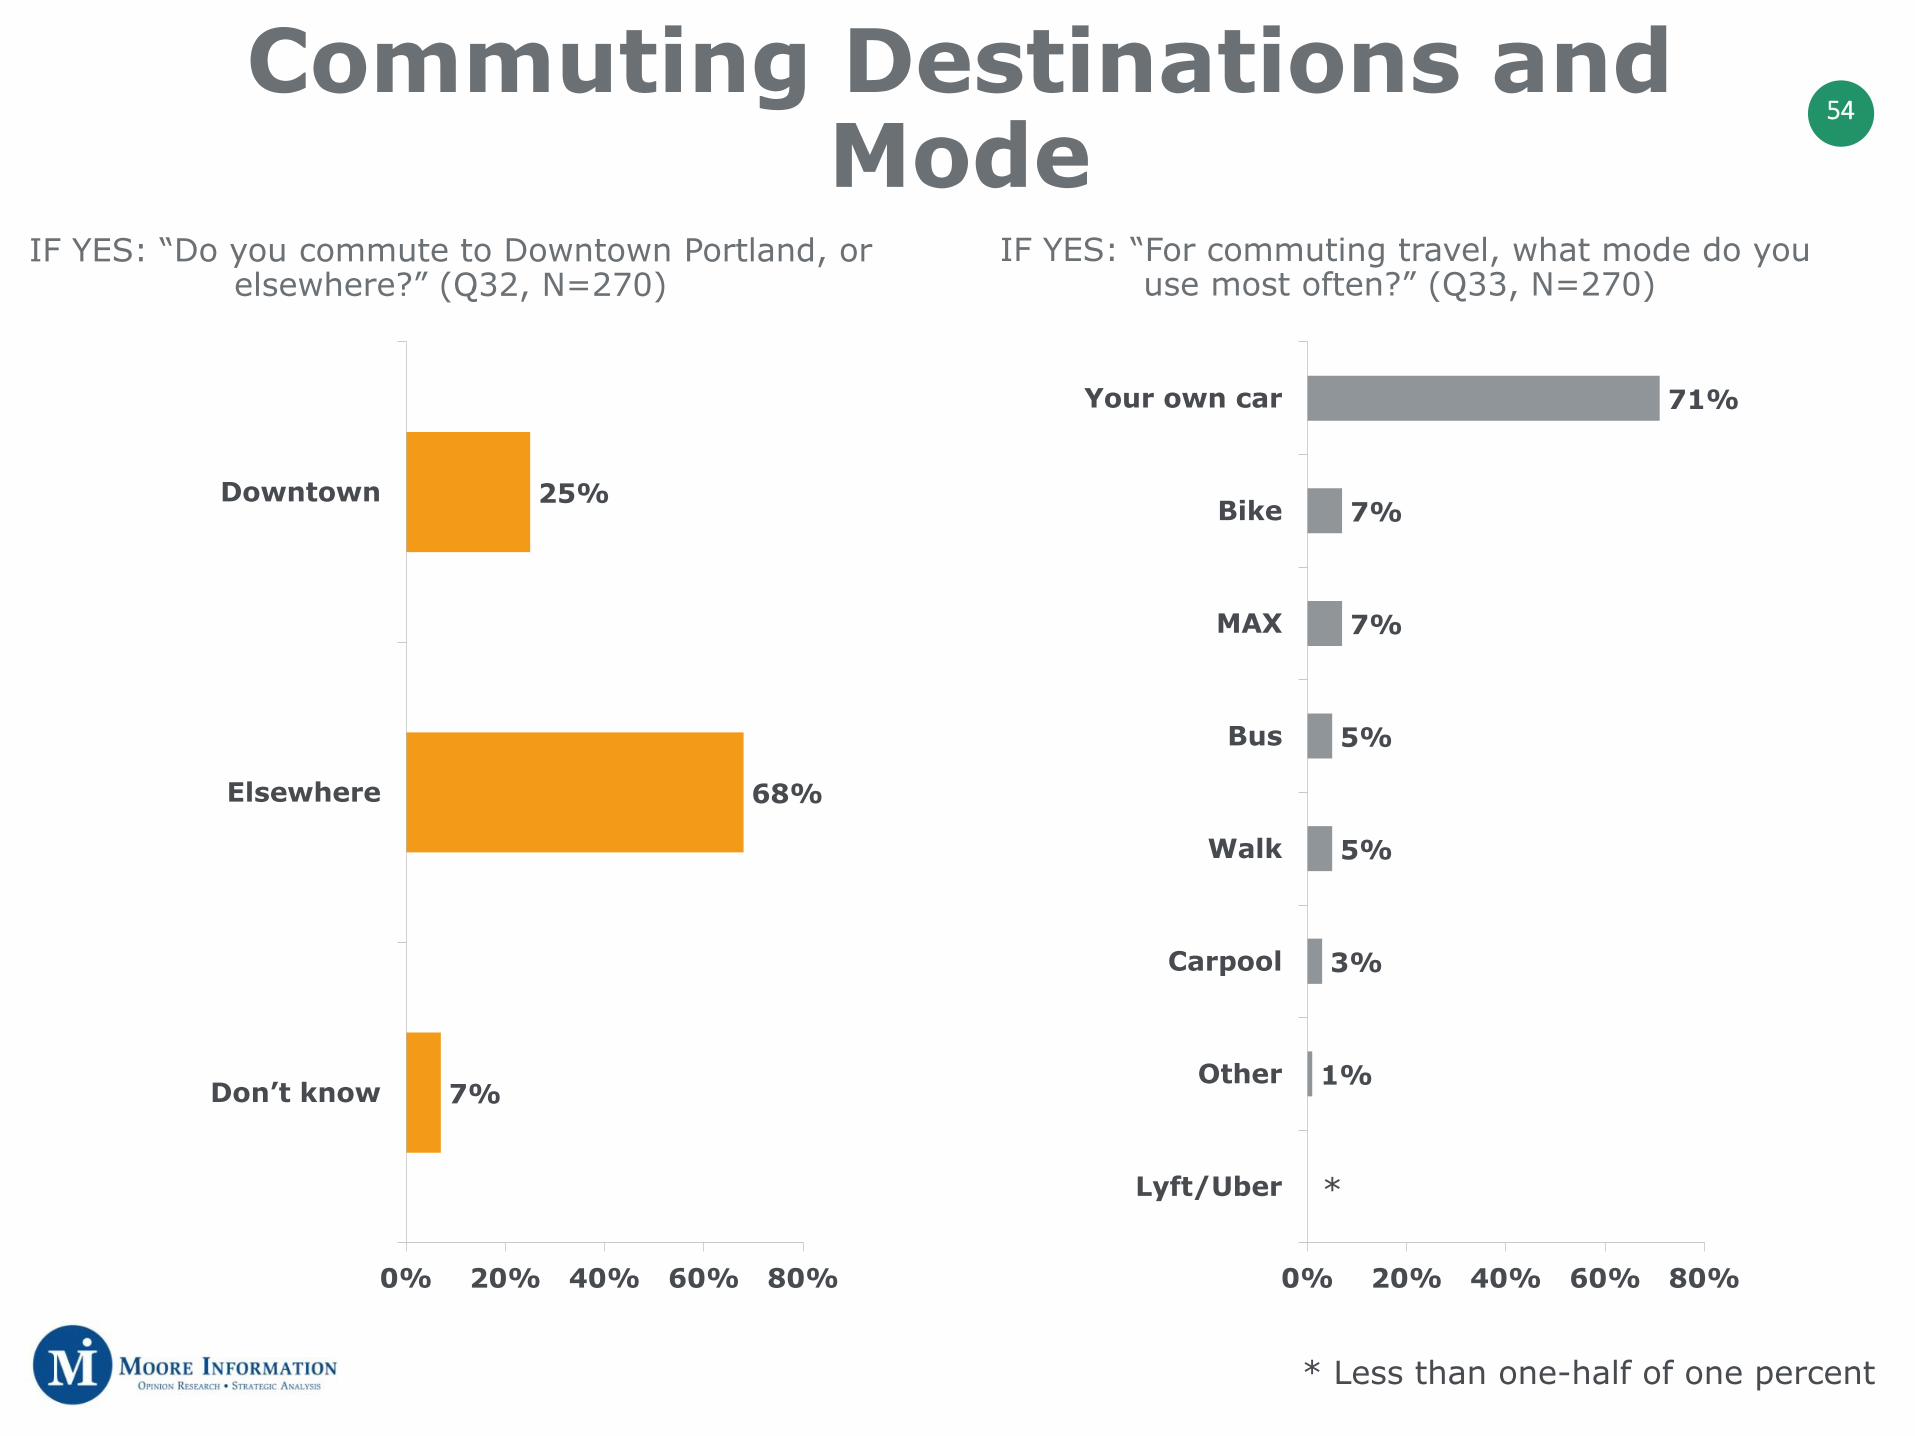
54Commuting Destinations and
ModeIF YES: “Do you commute to Downtown Portland, or
elsewhere?” (Q32, N=270)
71%
7%
7%
5%
5%
3%
1%
0% 20% 40% 60% 80%
Your own car
Bike
MAX
Bus
Walk
Carpool
Other
Lyft/Uber *
* Less than one-half of one percent
IF YES: “For commuting travel, what mode do you use most often?” (Q33, N=270)
25%
68%
7%
0% 20% 40% 60% 80%
Downtown
Elsewhere
Don’t know

55Commuting Destinations and Mode: Region
(Q32) Region
All N NE SW SENW
(N=26)
Outer East
(N=100)
Downtown 25% 37% 26% 25% 19% 34% 11%
Elsewhere 68% 59% 70% 65% 71% 58% 75%
(Q33) Region
All N NE SW SENW
(N=26)
Outer East
(N=100)
Bike 7% 9% 8% 3% 8% -- 2%
MAX 7% 17% 4% 4% 5% 7% 2%
Bus 5% 5% 10% -- 5% -- 2%
Your own car 71% 48% 74% 82% 75% 76% 82%
Carpool 3% 3% 3% 11% -- 9% --
Walk 5% 12% -- -- 7% 8% 8%
North residents are most likely to commute downtown and most likely to take the MAX. Elsewhere, a wide majority use their own car. More than half (54%) of
downtown commuters are using their own car.
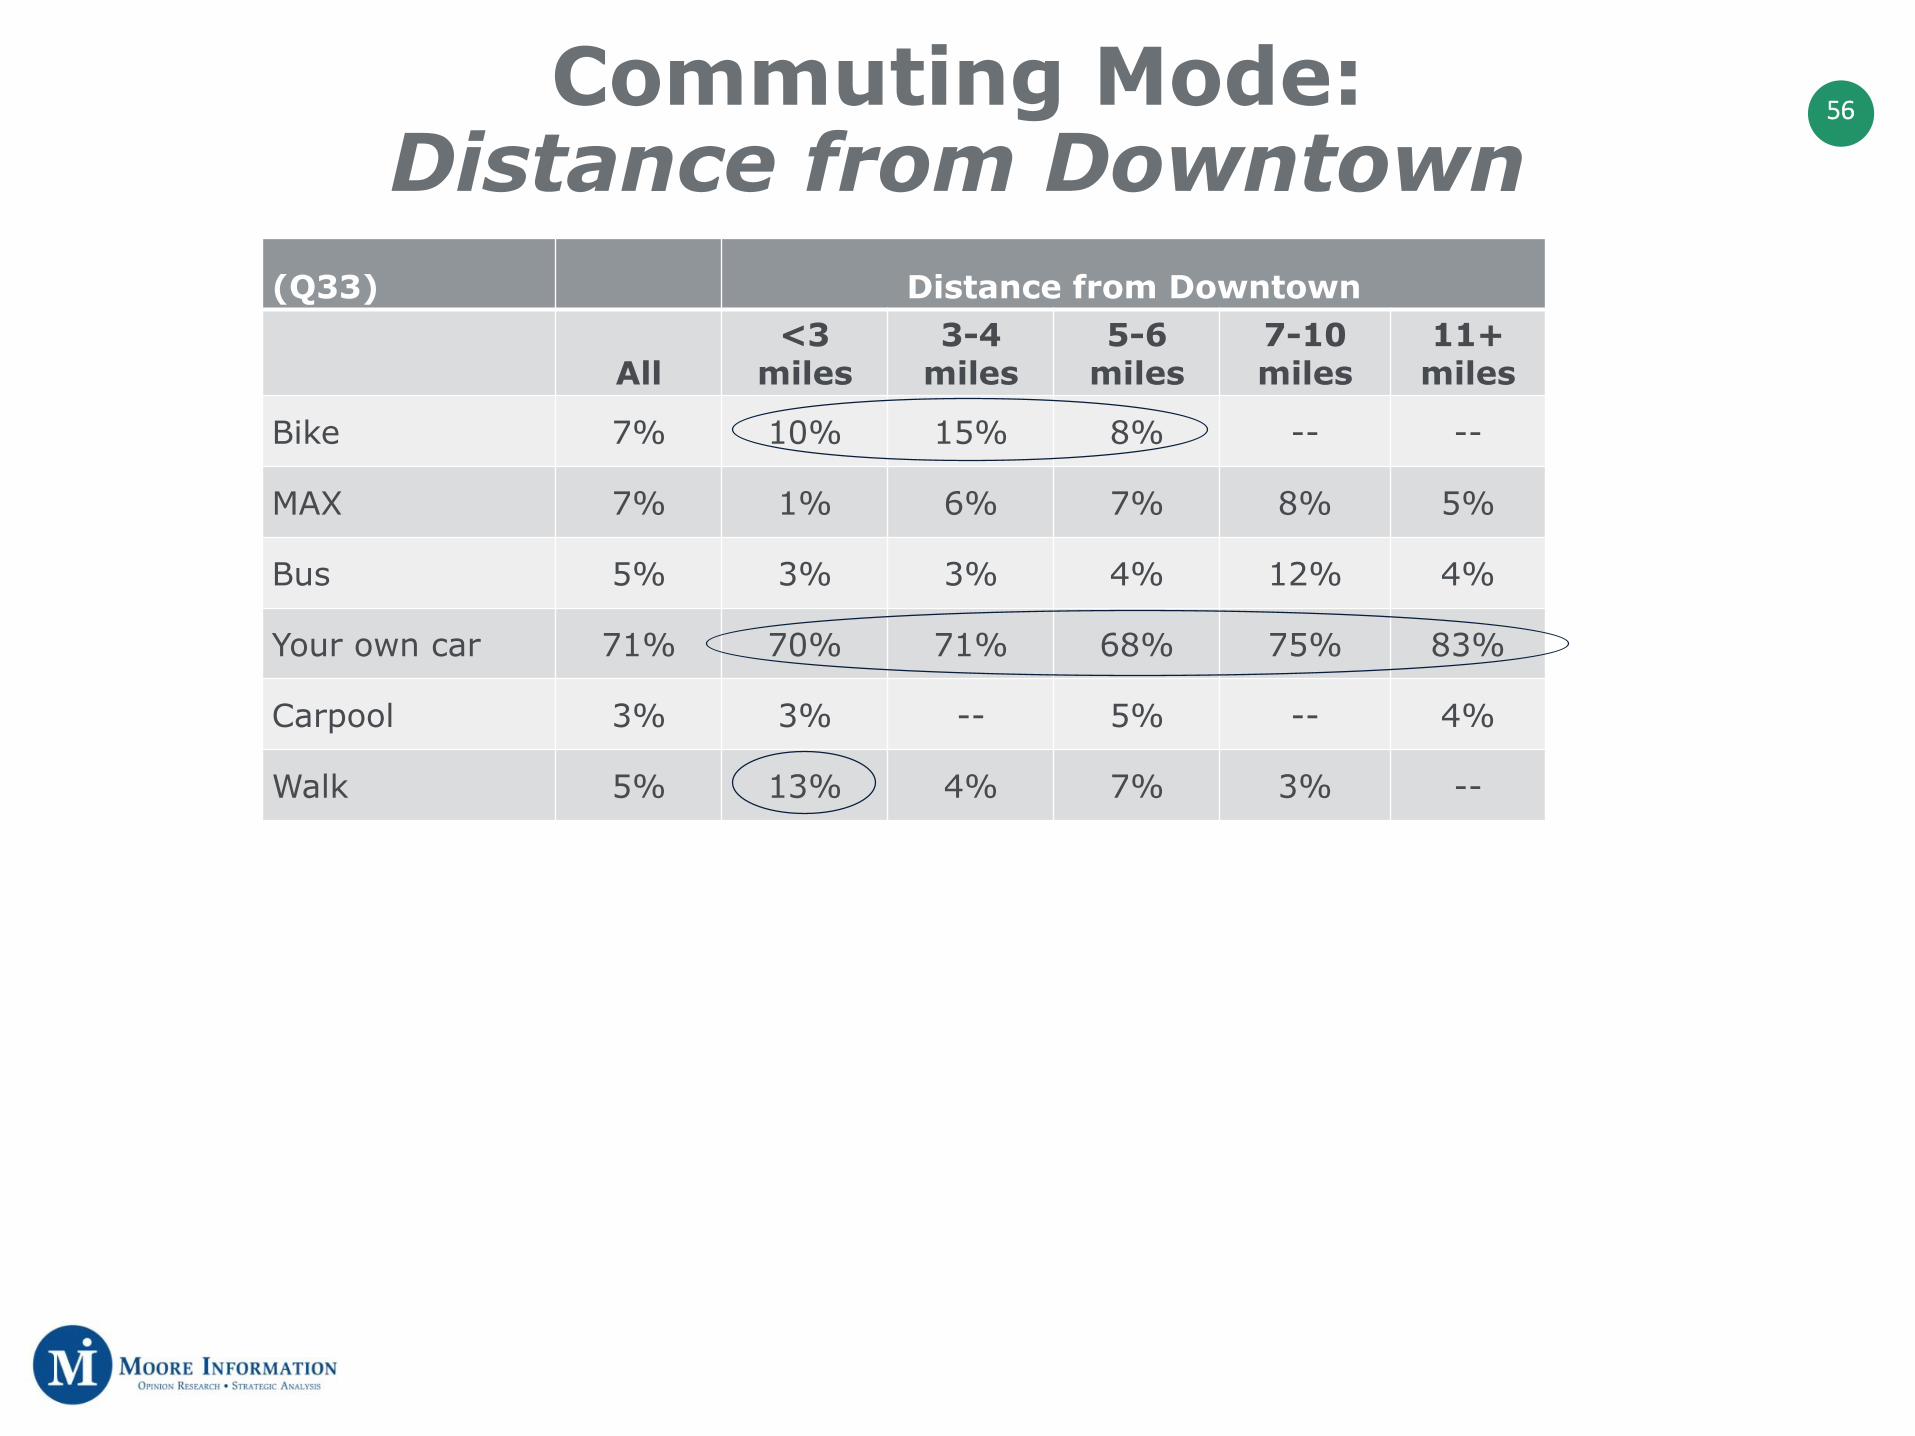
56Commuting Mode: Distance from Downtown
(Q33) Distance from Downtown
All<3
miles3-4
miles5-6
miles7-10miles
11+miles
Bike 7% 10% 15% 8% -- --
MAX 7% 1% 6% 7% 8% 5%
Bus 5% 3% 3% 4% 12% 4%
Your own car 71% 70% 71% 68% 75% 83%
Carpool 3% 3% -- 5% -- 4%
Walk 5% 13% 4% 7% 3% --
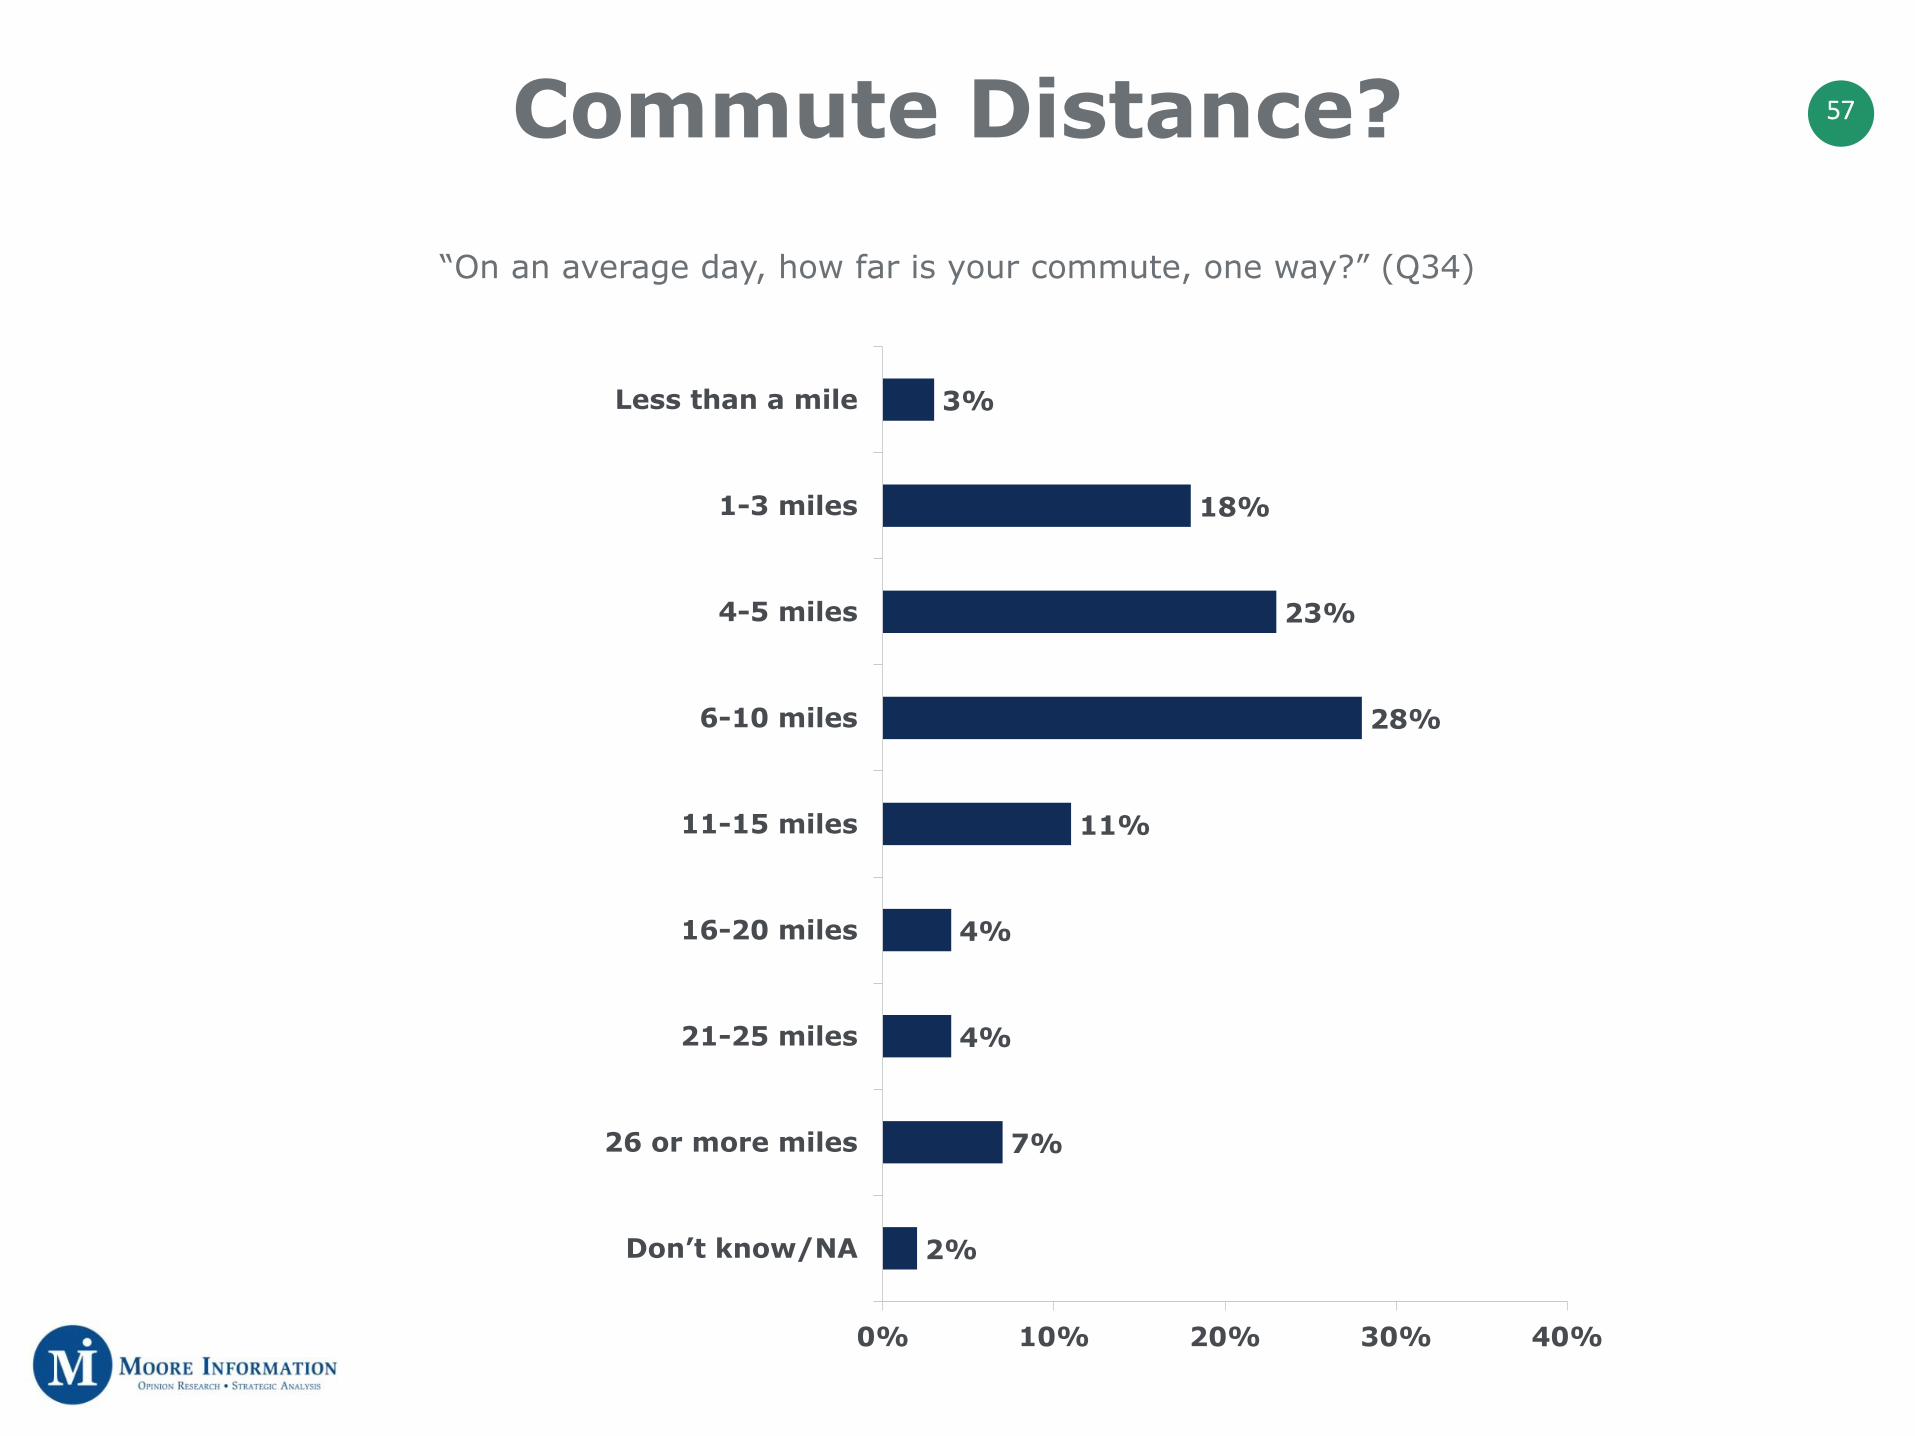
57Commute Distance?
“On an average day, how far is your commute, one way?” (Q34)
3%
18%
23%
28%
11%
4%
4%
7%
2%
0% 10% 20% 30% 40%
Less than a mile
1-3 miles
4-5 miles
6-10 miles
11-15 miles
16-20 miles
21-25 miles
26 or more miles
Don’t know/NA
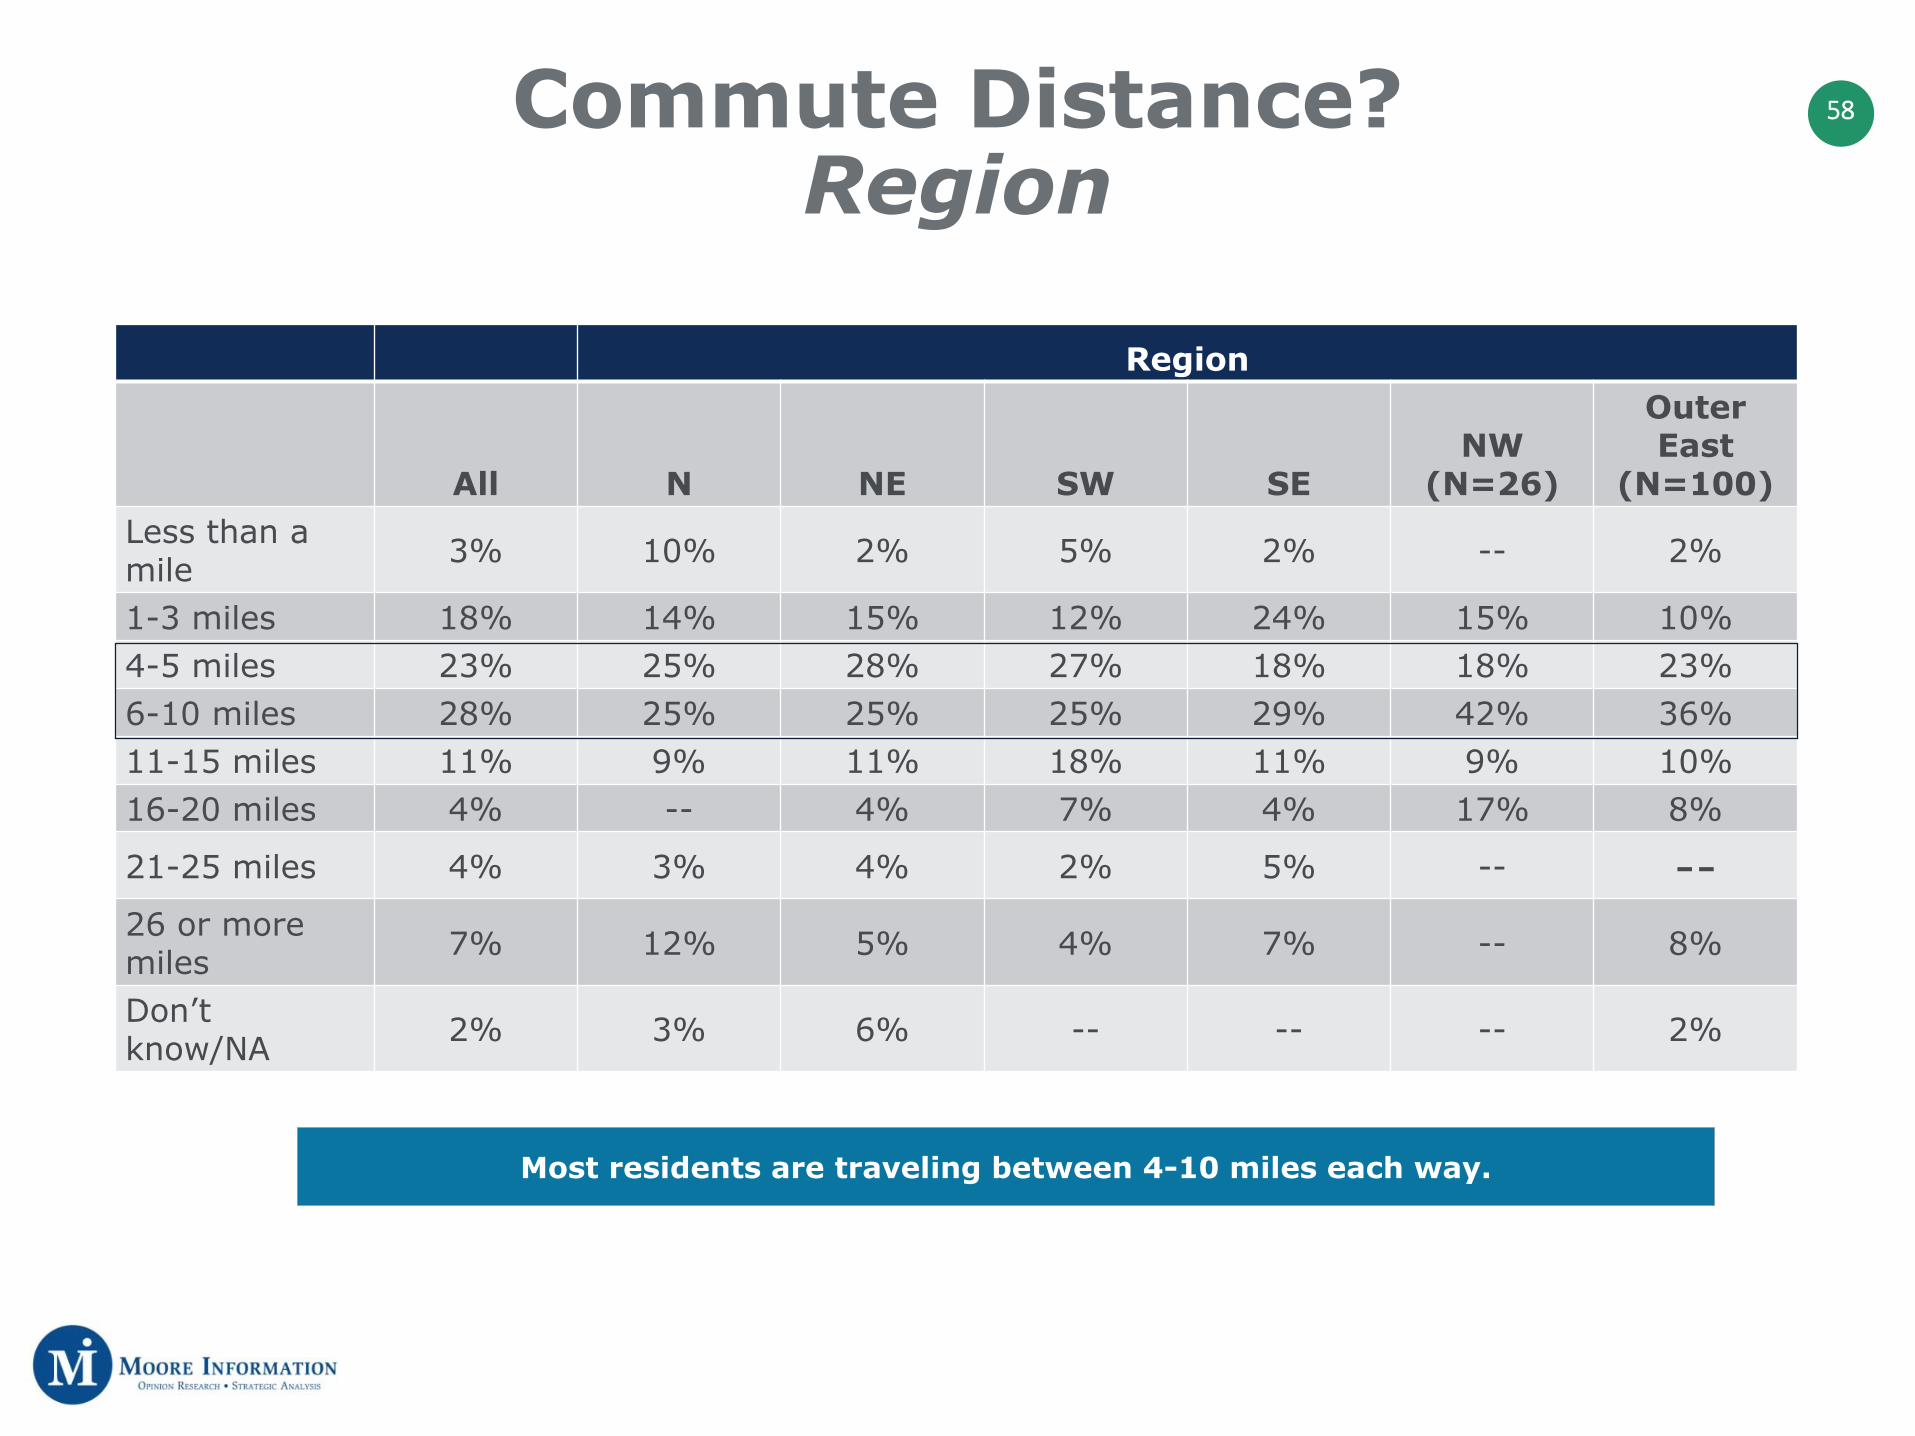
58Commute Distance?Region
Region
All N NE SW SENW
(N=26)
Outer East
(N=100)Less than a mile 3% 10% 2% 5% 2% -- 2%
1-3 miles 18% 14% 15% 12% 24% 15% 10%4-5 miles 23% 25% 28% 27% 18% 18% 23%6-10 miles 28% 25% 25% 25% 29% 42% 36%11-15 miles 11% 9% 11% 18% 11% 9% 10%16-20 miles 4% -- 4% 7% 4% 17% 8%
21-25 miles 4% 3% 4% 2% 5% -- --26 or more miles 7% 12% 5% 4% 7% -- 8%
Don’t know/NA 2% 3% 6% -- -- -- 2%
Most residents are traveling between 4-10 miles each way.

59
Yes, changed
62%
No/don’t know38%
Commute Time Over Last Three Years?
“Has the length of time you spend commuting changed over the last three years, or not?” (Q35)
52%
38%
91%
8%
3%
5%
1%
0% 20% 40% 60% 80% 100%
Significantly longer
Somewhat longer
Total longer
Total shorter
Somewhat shorter
Significantly shorter
Don’t know
IF YES, CHANGED: “Over the last three years, has your commute gotten…” (Q35.1, N=168)
Majorities among all key subgroups have seen a change in the length of time they spend
commuting.

60Commute Time Over Last Three Years? Region
Region
All N NE SW SENW
(N=26)
Outer East
(N=100)
Yes, changed 62% 53% 57% 59% 69% 66% 73%
No/don’t know 38% 47% 43% 41% 31% 34% 27%
Region
All N NE SW SENW
(N=26)
Outer East
(N=100)
Longer 91% 94% 93% 93% 88% 94% 87%
Shorter 8% 6% 7% 7% 9% 6% 13%
Don’t know 1% -- -- -- 3% -- --
Majorities of commuters in all regions have seen a change and the vast majority has increased length of time.

61
Yes23%
No/don’t know77%
Transporting Children“Does your commute involve
transporting children or dependents to and from school, daycare or other
activities?” (Q36, N=270)
“In your opinion, does transportation of children or dependents limit your transportation options, or not?”
(Q37, N=61)
46%
22%
13%
9%
9%
8%
6%
5%
5%
5%
18%
0% 10% 20% 30% 40% 50%
Yes, limits
Time spent/longcommutes
Forced to use my car
Bike more
Unable to use publictransportation
Not within biking distance
Multiple destinations
No routes in my area
Need booster seat
The bus is gross
Don't know
IF YES: “How has it limited your transportation options?” (Q37OE, N=28)
More likely to be transporting children:
• Age 35-44• More than 3 miles from downtown• North residents
62
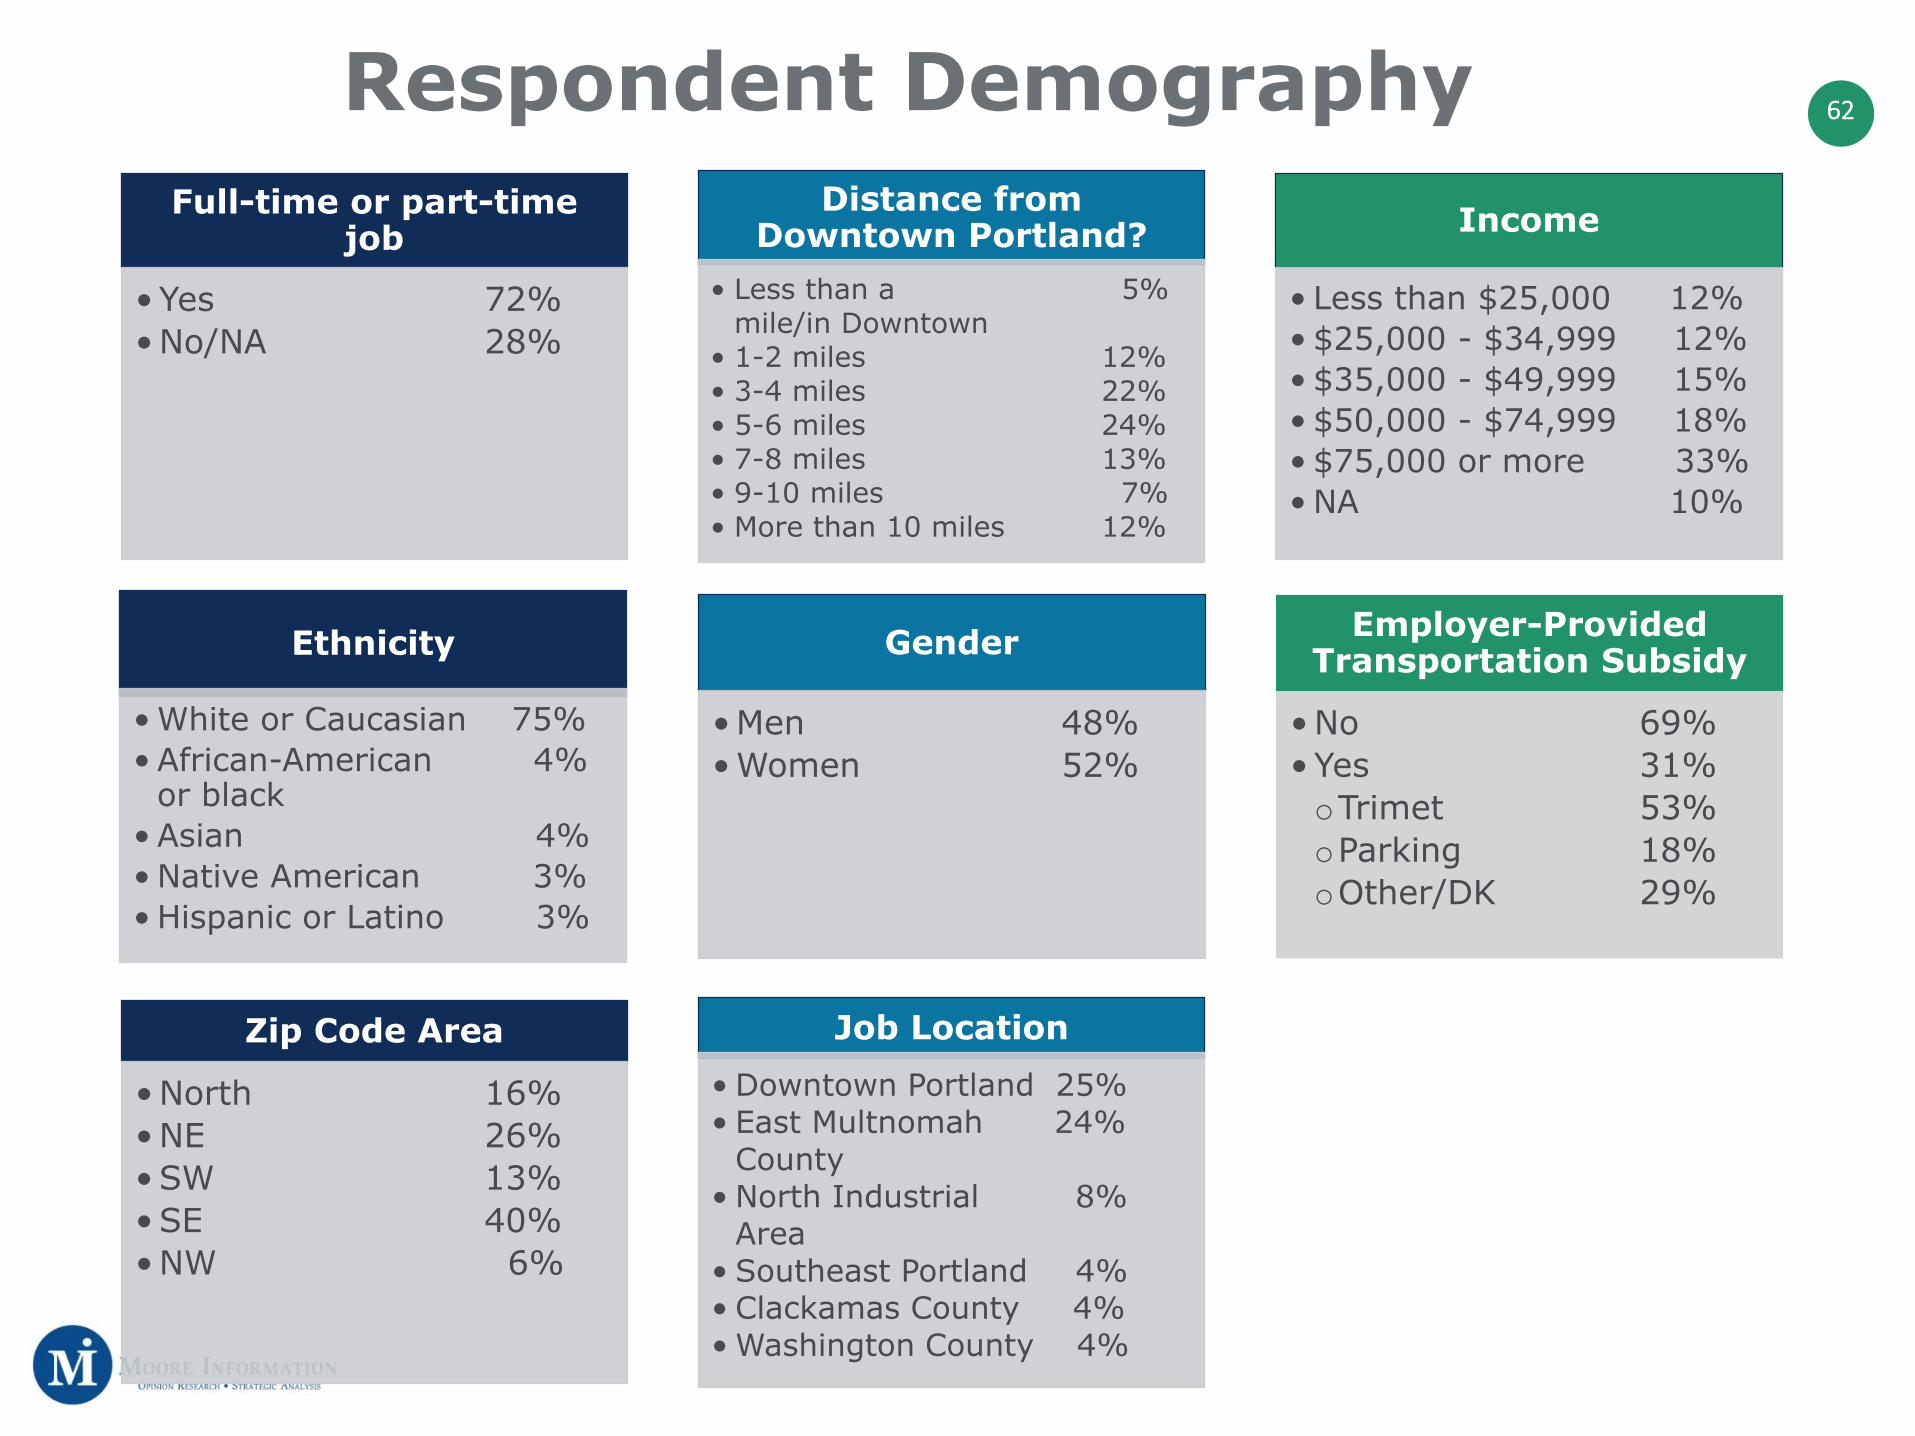
Full-time or part-time job
• Yes 72%• No/NA 28%
Distance from Downtown Portland?
• Less than a 5% mile/in Downtown
• 1-2 miles 12%• 3-4 miles 22%• 5-6 miles 24%• 7-8 miles 13%• 9-10 miles 7%• More than 10 miles 12%
Income
• Less than $25,000 12%• $25,000 - $34,999 12%• $35,000 - $49,999 15%• $50,000 - $74,999 18%• $75,000 or more 33%• NA 10%
Respondent Demography
Ethnicity
• White or Caucasian 75%• African-American 4%
or black• Asian 4%• Native American 3%• Hispanic or Latino 3%
Gender
• Men 48%• Women 52%
Employer-Provided Transportation Subsidy
• No 69%• Yes 31%oTrimet 53%oParking 18%oOther/DK 29%
Zip Code Area
• North 16%• NE 26%• SW 13%• SE 40%• NW 6%
Job Location• Downtown Portland 25%• East Multnomah 24%
County• North Industrial 8%
Area• Southeast Portland 4%• Clackamas County 4% • Washington County 4%

Summary and
Highlights (1)
➢ Traffic/congestion is the leading top-of-mind response (for 27%) when asked the most important transportation-related issue facing people in Portland today, along with many other traffic/road related responses –including “highway traffic” (7%) and “highway/road widening/more lanes” (5%).
➢ Fully 56% say congestion is the biggest problem getting from one place to another in the City, followed by another 11% who say the biggest problem is uncertainty about how long it will take to get someplace by car. Combined, fully two-in-three (67%) offered a congestion/traffic-related response.
➢ There is nearly universal agreement that traffic congestion is a “major” problem (80%) or “minor” problem (17%).
➢ Congestion has changed the travel behavior of 80% of residents, with the leading change being the time they are travelling (for 38%).
➢ 62% of residents say the length of time they spend commuting has changed over the last three years, with the overwhelming majority (91%) of commutes getting longer –including 52% who say their commute is “significantly” longer now than three years ago.
Traffic and congestion are a top concern for
Portland residents. No other transportation
issue even comes close.

When it comes to projects that could have a “major” impact
addressing transportation problems, the top projects are all
car/road/parking related.
Furthermore, after hearing all 11 potential projects, 42% of
residents say, “widen or improve existing roads and highways”
would be their priority to receive transportation funding.
➢ Nearly eight-in-ten (79%) say it is more important to maintain existing capacity for cars rather than removing car lanes to make way for more bike lanes (17%).
➢ 82% of residents are using their own car more than once a week/daily to get from one place to another in the City, compared to biking (20%), MAX (13%), bus (15%) and carpool (16%). Another 56% are walking more than once a week/daily to get from one place to another in the City.
➢ Two-in-three (67%) residents are commuting to work or school, with 60% commuting five days a week. Among commuters, 25% are going Downtown and 68% are going elsewhere, with fully 71% using their own car to get there.
Summary and
Highlights (2)

➢ However, on the whole, Outer East residents are more strongly committed to their car use and maintaining car capacity on roads.
➢ Outer East residents are far less likely to see “using cars less often” as having an impact, are among the most likely to want more parking, and are also among the least likely to want more or different MAX/bus lines/bike ways.
➢ Further proof of Outer East car dependence, these residents are among the most likely to say they never walk, bike, MAX or take the bus.
Summary and
Highlights (3)
Outer East residents are similar to residents in
other parts of the City in many ways, including their
concern with traffic/congestion.

66
www.moore-info.com
www.facebook.com/mooreinformation
Erik [email protected]
Hans [email protected]
1821 South Avenue WestSuite 406
Missoula, MT 59801
2130 SW Jefferson Street Suite 200
Portland, OR 97201
428 4th StreetSuite 8
Annapolis, MD 21403
406.544.8310 503.221.3100 410.216.9856