Embed Size (px)
Citation preview

CITY OF RICHMOND, VIRGINIA
COMPREHENSIVE ANNUAL REPORT
For Fiscal Year Ended June 30, 2019
Prepared by the Department of Finance


INTR
OD
UC
TOR
Y SEC
TION

INTRODUCTORY
SECTION

THE CITY OF RICHMOND, VIRGINIA COMPREHENSIVE ANNUAL FINANCIAL REPORT
FOR THE FISCAL YEAR ENDED JUNE 30, 2019
TABLE OF CONTENTS
INTRODUCTORY SECTION
Letter of Transmittal I Management Report on Responsibility for Financial Reporting IX Mayoral Form of Government XI Organization Chart XII
FINANCIAL SECTION
Report of Independent Auditor 1
A. MANAGEMENT'S DISCUSSION AND ANALYSIS (required supplementary information) 5
B. BASIC FINANCIAL STATEMENTS
1. Government-Wide Financial Statements Exhibit A: Statement of Net Position 17 Exhibit B: Statement of Activities 19
2. Governmental Funds' Financial Statements Exhibit C: Balance Sheet 20 Reconciliation of the Statement of Net Position to the Balance Sheet of Governmental Funds Exhibit D: Statement of Revenues, Expenditures, and Changes in Fund Balances 22 Reconciliation of the Statement of Revenues, Expenditures, and Changes in Fund Balances of Governmental Funds to the Statement of Activities-Governmental Funds
3. Proprietary Funds' Financial Statements Exhibit E-1: Statement of Net Position - Proprietary Funds 24 Exhibit E-2: Statement of Revenues, Expenses and Changes in Net Position - Proprietary Funds 25 Exhibit E-3: Statement of Cash Flows - Proprietary Funds 26
4. Fiduciary Funds' Financial Statements Exhibit F-1: Statement of Fiduciary Net Position 27 Exhibit F-2: Statement of Changes in Fiduciary Net Position 28
5. Component Units' Financial Statements Exhibit G-1: Statement of Net Position 29 Exhibit G-2: Statement of Activities 30
6. Notes to Financial Statements 31
THE CITY OF RICHMOND, VIRGINIACOMPREHENSIVE ANNUAL FINANCIAL REPORT
FOR THE FISCAL YEAR ENDED JUNE 30, 2019
TABLE OF CONTENTS
C. REQUIRED SUPPLEMENTARY INFORMATION Exhibit H-1: Budgetary Comparison Schedule - General Fund 80 Exhibit H-2: Note to Budgetary Comparison Schedule - General Fund 84 Schedule of Changes in Net Pension Liability Richmond Retirement System 85 Schedule of Employer Contributions and Investment Returns RRS 85 Schedule of Employer Contributions and Investment Returns RRS Notes 86 Schedule of Changes in Net Pension Liability Virginia Retirement System 87 Schedule of Contributions-VRS Pension Plan 88 Schedule of Contributions-VRS Pension Plan Notes 88 Schedule of Changes in Net OPEB Liability 89 Schedule of Contributions OPEB-Richmond Plan 89 Schedule of Investments and Returns OPEB 90 Schedule of Contributions OPEB-Richmond Plan Notes 90 Schedule of Richmond Share of Net OPEB Liability VRS-Group Life Insurance 91 Schedule of Contibutions Group Life Insurance 91 Schedule of Richmond Share of Net OPEB Liability VRS-Group Life Insurance Notes 91
D. SUPPLEMENTARY INFORMATION - COMBINING FINANCIAL STATEMENTS
1. Non-major Governmental Funds Exhibit I-1: Combining Balance Sheet 95 Exhibit I-2: Combining Statement of Revenues, Expenditures, and Changes in Fund Balances 96 Exhibit I-3: Budgetary Comparison Schedule - Capital Projects Funds 97 Exhibit I-4: Budgetary Comparison Schedule - Debt Service Fund 98
2. Non-major Proprietary Funds Exhibit J-1: Combining Statement of Net Position 100 Exhibit J-2: Combining Statement of Revenues, Expenses, and Changes in Fund Net Position 101 Exhibit J-3: Combining Statement of Cash Flows 112
3. Internal Service Funds Exhibit K-1: Combining Statement of Net Position 104 Exhibit K-2: Combining Statement of Revenues, Expenses, and Changes in Fund Net Position 105 Exhibit K-3: Combining Statement of Cash Flows 106
4. Fiduciary Funds Exhibit L-1: Combining Statement of Fiduciary Net Position 108 Exhibit L-2: Combining Statement of Changes in Fiduciary Net Position 109 Exhibit L-3: Statement of Changes in Assets and Liabilities - Agency Funds 110 STATISTICAL SECTION
Date of Incorporation 113 Area of City 113
Population 113 Form of Government 113 Segregation of Taxable Subjects for Local Taxation Only 113
Assessments 114 Tax Rates 114 Taxes Due 116 Delinquent Taxes 116 Overlapping Areas and Debt 116 City Indebtedness 116 Debt Management Policies 117 Fund Balance Policies 117
THE CITY OF RICHMOND, VIRGINIACOMPREHENSIVE ANNUAL FINANCIAL REPORT
FOR THE FISCAL YEAR ENDED JUNE 30, 2019
TABLE OF CONTENTS
Net Position by Component for the Last Ten Years 119 Changes in Net Position for the Last Ten Years 120 Governmental Activities Tax Revenue by Source for the Last Ten Years 122 Fund Balances of Governmental Funds for the Last Ten Years 123 Changes in Fund Balance of Governmental Funds for the Last Ten Years 124 General Governmental Tax Revenues by Source for the Last Ten Years 125
Assessed Value and Estimated Actual Value of Taxable Property for the Last Ten Years 126 Real Estate Assessed Value of Largest Taxpayers 127 Principal Employers 128 Real Estate Tax Levies and Collections for the Last Ten Years 129 Personal Property Tax Levies and Collections for the Last Ten Years 130 Ratios of Outstanding Debt by Type for the Last Ten Years 131 Ratios of General Bonded Debt Outstanding 132 Legal Debt Margin Information for the Last Ten Years 133 Pledged-Revenue Coverage for the Last Ten Years 134 Demographic and Economic Statistics for the Last Ten Years 135 Full-Time Equivalent City Government Employees by Function for the Last Ten Years 136 Operating Indicators by Function for the Last Ten Years 137 Capital Assets Statistics by Function for the Last Ten Years 138

Page | I
City of Richmond
LEVAR M. STONEY MAYOR
November 3, 2019
Members of the Governing Council and Citizens of the City of Richmond, Virginia:
We are pleased to present the City of Richmond, Virginia’s (City) Comprehensive Annual Financial Report (CAFR) for the fiscal year (FY) ended June 30, 2019. This report is intended to provide informative and relevant financial data to the residents of the City, the City Council, investors, creditors, and any other interested reader. It includes all statements and disclosures necessary for the reader to obtain a thorough understanding of the City’s financial activities. The reader should pay particular attention to the required Management’s Discussion and Analysis – a narrative overview and analysis of the financial statements – included in this document. Any individual with comments or questions concerning this report is encouraged to contact the City of Richmond’s Department of Finance at (804) 646-5700. This report may also be found online at www.RVA.gov/finance/finance-forms.
Management of the City is responsible for the establishment and maintenance of accounting and other internal controls to ensure compliance with applicable laws and City policies, safeguarding assets and properly recording reliable information for the preparation of the City’s financial statements in accordance with GAAP. City management is also responsible for the accuracy and fairness of the presentation of the financial statements and other information as presented herein and, to the best of management’s knowledge, the data presented in this report is accurate in all material respects. The financial statements included in this report conform to the accounting principles generally accepted in the United States of America (GAAP) established by the Governmental Accounting Standards Board (GASB).
CliftonLarsonAllen LLP (CLA), a certified public accounting firm, audited the City’s basic financial statements. As an independent auditor, CLA rendered an unmodified opinion stating that the City’s basic financial statements for the fiscal year ended June 30, 2019 are fairly presented in all material respects and in conformity with GAAP. The report of independent auditors is presented as the first component of the Financial Section of this report.
Overview of the City of Richmond, Virginia
The City, incorporated in 1782, is a municipal corporation of the Commonwealth of Virginia and is the state capital. The City occupies 62.55 square miles and serves a growing population of 228,783 as of the U.S. Census Bureau’s 2018 annual population estimate. In the Commonwealth, cities have sole jurisdiction over the entire area within their boundaries and operate independently of any county government. There are no overlapping jurisdictions and, consequently, citizens of Virginia cities are not subject to overlapping debt or taxation.
Richmond, because of its location in the middle of the eastern seaboard, is within 750 miles of two-thirds of the nation’s population and less than 100 miles from the nation’s capital. The City is ideally suited as a commerce hub because of the intersection of Interstates 95, 64 and 295, two major rail freight lines and Amtrak passenger service. The Port of Richmond and Richmond International Airport provide water and air transportation services to the region’s residents and businesses.
The results are a diverse economic base that includes research and development, manufacturing, retail, services, law, distribution, tourism, banking and state government, which contributes to a stable and positive business environment. Richmond is home to the Fifth District Federal Reserve Bank, one of 12 Federal Reserve Banks and is also home to the Fourth Circuit U.S. Court of
Appeals, one of 13 in the United States. Richmond has ten Fortune 1000 companies headquartered in the region including seven Fortune 500 firms – Altria Group, Performance Food Group, CarMax, Dominion Energy, Owens and Minor, Genworth Financial, and Markel.
Page | II
Accolades bestowed on the City in 2018-2019 include the following: Richmond was ranked fourth nationally in economic growth of mid-sized cities (Business Facilities Magazine, July 2019); one of the top 25 cities for new college grads (Smartasset.com); one of the 10 Coolest U.S. Cities to Visit in 2018 (Forbes); #3 on the list of “8 Cities Whose Entrepreneurship Communities are Booming” (Entrepreneur.com); #13 on the list of “Best Cities for Adventurous Travelers (Travel + Leisure); Top 10 Destination for 2018 (LonelyPlanet); One of the East Coast’s Most Intriguing Cities (New York Daily News); One of the Most Inspiring Art Cities in America (Departures Magazine); One of the South’s Best Food Towns (Garden & Gun); One of Most Exciting Food Cities in America (Zagat); Top 3 Best Beer Scene 2018 (USA Today); and One of the 5 U.S. Cities where Home Ownership is Affordable (Curbed). Other recognition's include the University of Richmond being ranked #61 on the Wall Street Journal’s Top 1,000 colleges, and the Lewis Ginter Botanical Garden being ranked #4 on Conde Nast Traveler’s Most Beautiful Botanical Gardens in the U.S.
Several higher education institutions, including Virginia Union University, Union Theological Seminary & Presbyterian School of Christian Education, University of Richmond, including its law school, J. Sergeant Reynolds Community College and Virginia Commonwealth University (VCU), including its health system schools, are located within the City. VCU is home to nationally ranked graduate and professional programs.
This active educational environment supports the City’s flourishing cultural community, numerous sports and entertainment attractions, and one of the nation’s largest river park systems. The Virginia Museum of Fine Arts, located in the City’s Fan District, is home to the largest public Fabergé collection outside Russia, and is considered a world class public museum. The Richmond Flying Squirrels, the Minor League AA affiliate of the San Francisco Giants Major League Baseball team, play at The Diamond in Richmond, and Richmond is currently home for the Washington Redskins’ summer training camp.
The James River, which runs through Richmond, has made the City the only urban U.S. city with Class IV white water rapids running through downtown. The City’s James River Park system, with 550 acres, is a large part of the reason The Huffington Post called Richmond “one of the top 10 cities to relocate to in the U.S.”
Profile of the Government
On January 1, 2005, the City government was re-organized under a strong Mayor-Council form of government, wherein the mayor serves as the chief executive officer and is responsible for the proper administration of city government.
The City remains focused on “Building a Better Richmond,” moving toward the goal of obtaining a Triple-A (AAA) bond rating, andsystematically implementing the building blocks required to accomplish these goals. The City has maintained strong credit ratings in recent years, and in August 2019, Moody’s, Standard & Poor's, and Fitch Ratings reaffirmed the City’s Aa2, AA+, AA+ General Obligation bond ratings, respectively, with Moody’s continuing its “positive” outlook. As this CAFR outlines, the City continues to make progress and is well on its way to achieving the primary goals of managing to balanced budgets and increasing the unassigned fund balance, maintainingexisting tax rates, increasing delinquent tax collections, and reducing spending.
The City’s daily operations are directed by a Chief Administrative Officer who is appointed by the Mayor and subject to the consent of a majority of the members of Council. The Chief Administrative Officer serves at the pleasure of the Mayor, carries out the City Council’s policies, and appoints administrative department heads as well as other officers and employees of the administration.
The Council establishes local laws, provides government policy and oversight, and approves the City budget. The Council is comprisedof nine members elected from single member districts to serve four year terms. The President of Council and the Vice President are selected by a majority vote of its members every two years. The Council appoints the City Assessor, City Auditor, and City Attorney. The City Attorney serves as the legal adviser to the Council, City administration, boards, commissions, and agencies of the City.
The City provides a full range of general governmental services for its citizens. These services include Police and Fire Protection, sanitation services, the construction and maintenance of roads, streets and other infrastructure, recreational activities, and cultural events. In addition to general government activities, the City’s gas, water and wastewater utilities are regional providers of services to customers in the City as well as in the surrounding counties. The City government also provides the majority of the funding for the public schools systems, though the schools are operated by a legally distinct entity and a separately elected school board.
The City’s CAFR includes all funds of the City, the primary government, as well as all of its component units. Five discretely presented component units (the Richmond Ambulance Authority, Richmond Redevelopment and Housing Authority, Richmond Behavioral Health Authority, School Board of the City of Richmond, and the Richmond Economic Development Authority) are included in the reporting entity because of the City’s financial accountability for these organizations. These component units are reported in separate columns in the City’s basic financial statements. Additional information concerning these legally separate organizations can be found in the notes to the financial statements.
Page | III
Budget Process
The budget serves as the foundation for the City’s financial planning and spending control. The City adopts an annual budget. The proposed Fiscal Year 2019 budget was presented to City Council in March 2018. City Council undertook an intensive review of the proposed budget in a series of public meetings and outlined their policy priorities. Prior to adopting the FY 2019 budget, a public hearing was held in April with final budget adoption in May 2018.
Legal budgetary restrictions for Fiscal Year 2019 were established at the governmental function (e.g. Department of Finance), with effective administrative controls maintained through detailed line-item budgets. Some agencies also maintained subtotal portions of theirappropriations at the program/cost center level (e.g. Sheriff’s Office) or service code level (e.g. Department of Public Works). Any revisions that alter the total budgeted amounts and/or appropriations of any fund must be approved by the City Council. Budget to actualcomparisons are provided in this report for governmental funds where an appropriated budget has been adopted. These comparisons are presented in the “Other Required Supplementary Information” section of the financial statements.
Expenditures
Most agencies did stay within range of their amended budget. Exhibit H-1 located in the financial section of this report provide budgetary comparison information for the City’s General Fund agencies.
Revenue
As part of the City’s Well Managed Government building blocks, many improvements have been made in the area of financial management. The City has continued to build on improvements made during prior years, including continued utilization of a five-year forecast for financial planning and the implementation of a comprehensive tax compliance plan.
General Fund revenues and other financing sources were under budget by $(14.8) million for fiscal year ended June 30, 2019.
Economic Overview
At the national level, real gross domestic product showed a 3.7% expansion in the second quarter as compared to the prior year. The national unemployment rate was 3.7% as of July 2019. At the local level, Richmond’s economy also showed steady strength. The City'sunemployment rate averaged 3.6% for all of 2018. This was 0.2% higher than the Virginia rate of 3.4%. Like some other urban areasthroughout the country, Richmond has seen a resurgence of people moving back into the City. The City’s population has grown eachyear since 2004 reaching 228,783 in 2018, according to US Census Bureau estimates.
There were a number of economic development initiatives underway during FY 2019. Richmond's desirable geographic location has positioned the City as a focal point of economic development along the east coast. The presence of the Commonwealth of Virginia'sprimary state offices, as well as, the colleges of Virginia Commonwealth University, the University of Richmond, and Virginia UnionUniversity add talented young graduates to the growing population. Richmond is home to the Fifth Federal Reserve
Bank and the Fourth Circuit U.S. Court of Appeals. After realizing a period of population declines during the 1970-1990s, the City's population has grown steadily during the last two decades reaching 228,783 in 2018. Since 2007, the City's labor force has grown steadily reaching 117,259 in 2018, its highest level in a decade, while unemployment has continued to decline.
In part, the growth in employment and population can be attributed to the significant number of public and private economic development projects underway. During the last two years there has been over $1.3 billion in new investment in the City, including 3,315 new residential apartments, 7+ million square feet of new/renovated office space, 137 new hotel rooms, and 2.5 million square feet of new/renovatedindustrial and warehouse space.

Page | IV
Just a few of the major new economic development projects include:
In July 2019, the new 20 story Dominion Energy Headquarters Tower opened containing 960,000 square feet of office space which will house over 1,200 of the Fortune 500 firm's employees. On May 6, 2019, Virginia Commonwealth University announced that it has secured State funding to support construction of a new 168,000 square foot College of Humanities and Sciences building estimated to cost $121.0
million. Virginia Commonwealth University Health Systems has begun construction of its $350.0 million expansion of the current Children's Hospital of Richmond. In October, 2018 Seacoast Builders completed its $25.0 million, 178 apartment unit development called Vida East in the City's Shockoe Bottom neighborhood. In one of the City's fastest growing neighborhoods, Scott's Addition, many commercial and residential projects are underway including "the Nest" project which is a $20.0 million, six story, 118 unit apartment building. In the Carytown area, the $45.0 million Carytown Exchange retail development is underway, which will be anchor by a new grocery store. In September 2018, Bon Secours Hospitals announced plans to develop the former Westhampton School anchored property into a $53.0 million medical campus to include medical offices and residential units. Nearing completion along the City's Canal Walk in downtown is the $58.0 million Locks Tower development, a 12 story commercial office building.
Major Initiatives and Accomplishments: Well Managed Government
The City Administration outlined a vision of making Richmond One City through a series of changes in the way government operates. This vision includes running a top-notch, well managed organization grounded in accountability and strong financial management that serves the community, manages resources and develops employees.
Throughout the fiscal year, a number of proactive financial reporting actions were continued through FY2019, including the continued utilization of a five-year revenue and expenditure forecast, monthly financial reports and quarterly budget projections, and introduction and adoption of a structurally balanced budget that maintains core services, protects the fiscal integrity of the City, ensures the City is poised for future growth, and budgets for priorities. Moving forward to FY 2020, the Administration will continue to expand on these accomplishments, making strides toward achieving the goal of a well-managed government with an AAA bond rating.
In August 2018, the City successfully sold $55.2 million of General Obligation Public Improvement bonds to finance ongoing capital projects. At the time of the bond sale, all three bond rating firms reaffirmed their strong, Aa2, AA+, and AA+ credit ratings of the City.
Financial Policies and Guidelines
The following policies and guidelines represent principles and practices that guide the City and help to foster the City’s financial stability. These are not the only financial guidelines, but are those that have had a major impact in recent years or will have a major impact on the City’s future financial positions. For a complete listing of the City’s Financial Guidelines, please see the City’s website www.RVA.gov.
Fund Balance Guidelines
As of June 30, 2019, the General Fund Unassigned Fund Balance was $111.6 million, which equals 15 percent of the adopted FY 2020 General Fund budgeted expenditures, including transfers. The City considers the Unassigned Fund Balance to be comprised of funds that have no limitations or restrictions or planned use.
Page | V
The City has had a fund balance policy in place since 1988. On December 11, 2017, the City Council adopted a revised unassigned fund balance policy, which states:
It is the goal of the City that the total of the “rainy day” fund be equal to at least 16.67 percent of budgeted general fund operating expenses for the latest fiscal year for which the City Council has adopted a general fund budget.
It is the goal of the City that the unassigned fund balance be equal to at least 13.67 percent of budgeted general fund operatingexpenses for the latest fiscal year for which the City Council has adopted a general fund budget.
It is the goal of the City that the Budget and Revenue Stabilization Contingency Reserve be equal to three percent of budgeted general fund operating expenses for the latest fiscal year for which the City Council has adopted a general fund budget.
It is the policy of the City that appropriations be made from the unassigned fund balance only in the event of unusual, unanticipated and seemingly insurmountable hardship.
Debt Guidelines
The City originally adopted a resolution in 1989 establishing guidelines for the planning, issuance and management of debt, for and on behalf of the City. These policy guidelines were revised by resolution adopted on December 11, 2017. The City issues debt for the purpose of acquiring and constructing capital projects and for making major renovations to existing capital assets.
It is the policy of the City to provide operating funds for projects that are perennial and/or of an ongoing maintenance type activity. In addition, it is the policy of the City that general fund supported debt, including bonds and notes authorized but unissued, will be limited by any of the following adopted policies:
Total debt service to be paid on general obligation, moral obligation, and subject to appropriation debt shall not exceed 10 percent of the General Fund and Richmond Public Schools’ budgets plus the non-local portion of the recurring special fund for Street Maintenance.
General obligation, moral obligation, and subject to appropriation debt will not exceed 3.75 percent of the assessed value of real estate, personal property, and machinery and tools in the City.
General Fund supported debt will be structured in a manner such that 60 percent of the outstanding debt will be repaid within ten years.
The City will issue General Fund supported debt with an average life consistent with the useful life of the asset being financed and with a maximum term of 30 years.
It is the goal of the City to provide cash funding from annual operating funds for a portion of the City's five year Capital Improvement Plan (pay-as-you-god funding).
A. No Overlapping Debt
The City is a separate and distinct political unit and is autonomous and independent of any county or any other political subdivision of the Commonwealth. The City is not coterminous with or subject to any county or school district taxation and is not liable for any indebtedness other than its own.
B. Legal Debt Margin
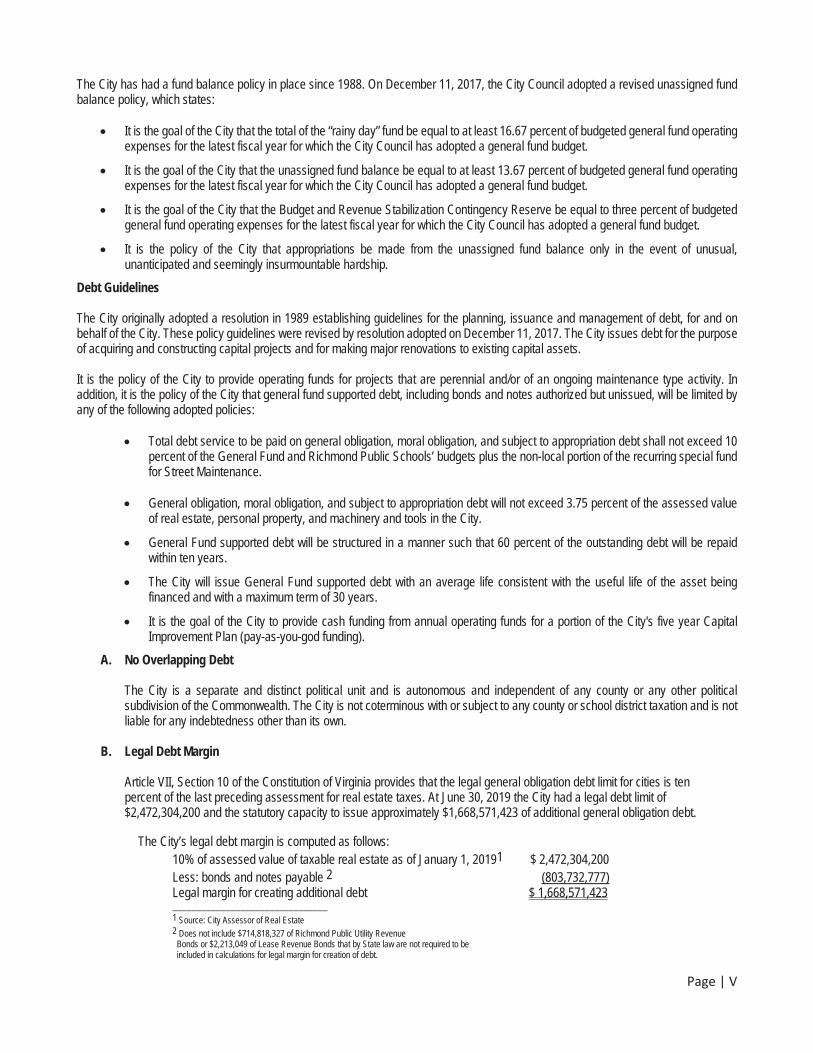
Article VII, Section 10 of the Constitution of Virginia provides that the legal general obligation debt limit for cities is ten percent of the last preceding assessment for real estate taxes. At June 30, 2019 the City had a legal debt limit of $2,472,304,200 and the statutory capacity to issue approximately $1,668,571,423 of additional general obligation debt.
The City’s legal debt margin is computed as follows: 10% of assessed value of taxable real estate as of January 1, 20191 $ 2,472,304,200 Less: bonds and notes payable 2 (803,732,777) Legal margin for creating additional debt $ 1,668,571,423
________________________________ 1 Source: City Assessor of Real Estate 2 Does not include $714,818,327 of Richmond Public Utility Revenue
Bonds or $2,213,049 of Lease Revenue Bonds that by State law are not required to be included in calculations for legal margin for creation of debt.
Page | VI
C. Short-Term Debt
As of June 30, 2019, the City had two Bond Anticipation Note Line of Credit Facilities (BAN) in place, including a $150.0 million BAN to finance new school construction projects, as well as, a $60.0 million BAN to provide interim financing of ongoing City capital projects. The City does not borrow to meet seasonal needs or day-to-day operations.
D. Long-Term Debt
Bonds of the City, including general obligation bonds, serial equipment notes and certain public utility bonds, and bond anticipation notes are direct general obligations, to which the full faith and credit of the City are pledged. The Council is authorized and required, unless other funds are lawfully available and appropriated for timely payment, to levy and collect on all propertytaxable by the City such ad valorem taxes as may be necessary to pay when due the principal of, premium, if any, and interest on such bonds and notes as the same shall become due and payable. The City has never defaulted in the payment of principal, premium or interest on any debt.
Enterprise Funds and Internal Service Funds pay from user fees the principal of and interest on certain general obligations bonds, revenue bonds and serial equipment notes issued for the program purposes of each fund. All other monies for the principal of and interest on such debt are appropriated in the General Fund budget. No long-term bonds are sold to finance current operations.
E. Authorized but Unissued Bonds and Notes
As of June 30, 2019, the City had a total of $407,604,900 of additional general obligation and revenue bonds authorized but notissued, for funding Capital Improvement Projects and the acquisition of Equipment. Of these authorized but not issued bonds and notes, $315,067,049 is earmarked for self-supporting Public Utility revenue bond funded projects, $6,189,722 of General Obligation bond funded projects of the Storm water Utility, $71,299,462 for various General Fund supported capital projects, and$15,048,667 for funding of equipment purchases.
Page | VII
Acknowledgments
The preparation of this report could not have been accomplished without the dedicated services of the entire staff of the Department of Finance. We would like to express our particular appreciation to all members of the Accounting and Reporting Division who directly assisted and contributed to its preparation. We would also like to thank the City Council for their interest, guidance, and support in planning and conducting the financial operations of the City in a responsible and progressive manner.

Page | IX
City of Richmond
LEVAR M. STONEY MAYOR
MANAGEMENT REPORT ON RESPONSIBILITY FOR FINANCIAL REPORTING
The management of the City of Richmond, Virginia has the responsibility for preparing the accompanying financial statements with integrity and objectivity. The School Board of the City of Richmond, Economic Development Authority of the City of Richmond, Virginia, Richmond Ambulance Authority, Richmond Behavioral Health Authority, and Richmond Redevelopment and Housing Authority are under the directcontrol of their respective governing boards and management. The financial statements were prepared in accordance with accounting principles generally accepted in the United States of America and, to the best of our knowledge, are not materially misstated. The financial statements include amounts that are, in some instances, based on management’s best estimates and judgments. Management also prepared the statistical information in this annual report and is responsible for its accuracy and consistency with the financial statements.
The City’s financial statements have been audited by CliftonLarsonAllen, LLP, independent certified public accountants, selected by the City Council. Management has made available to CliftonLarsonAllen, LLP, all of the City’s financial records and related data as well as the minutes of the City Council meetings. Furthermore, management believes that all representations made to CliftonLarsonAllen, LLP during its audit were valid and appropriate.
Management of the City is responsible for establishing and maintaining a system of internal controls that provides reasonable assuranceas to the integrity and reliability of the financial statements, the protection of assets from unauthorized use or disposition, and the prevention and detection of fraudulent financial reporting. The system of internal controls should provide for appropriate division of responsibility that is communicated to employees with significant roles in the financial reporting process and updated as necessary. Management continually monitors the system of internal controls for compliance.
The City maintains an internal program through the City Auditor. The City Auditor independently assesses the effectiveness of internal controls and recommends possible improvements thereto. Management has considered the City Auditor’s and CliftonLarsonAllen, LLP’s recommendations concerning the City’s system of internal control and has taken actions that we believe are cost-effective in thecircumstances to respond appropriately to these recommendations.
Management also recognizes its responsibility for fostering a strong ethical climate so that the City’s affairs are conducted according to the highest standards of personal and City conduct. Management communicates ethical standards to employees through personnel rules,administrative regulations, and city law.

Page | XI
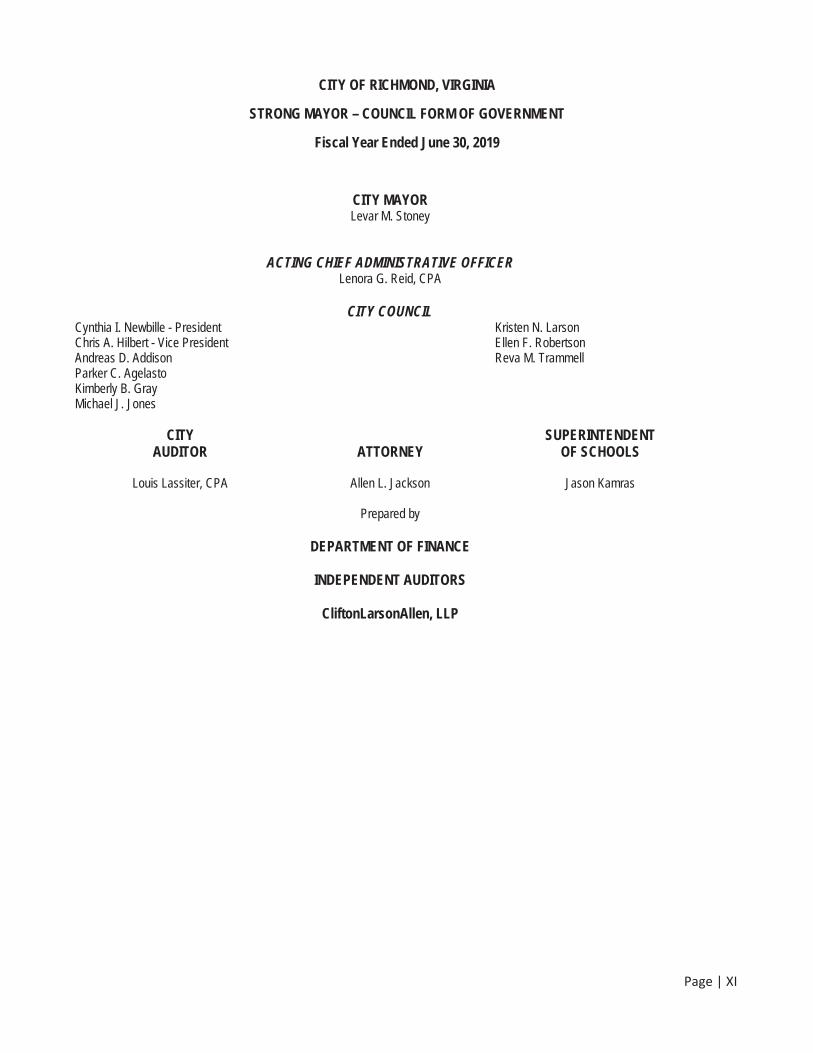
CITY OF RICHMOND, VIRGINIA
STRONG MAYOR – COUNCIL FORM OF GOVERNMENT
Fiscal Year Ended June 30, 2019
CITY MAYOR Levar M. Stoney
ACTING CHIEF ADMINISTRATIVE OFFICER Lenora G. Reid, CPA
CITY COUNCIL Cynthia I. Newbille - President Kristen N. Larson Chris A. Hilbert - Vice President Ellen F. Robertson Andreas D. Addison Reva M. Trammell Parker C. Agelasto Kimberly B. Gray Michael J. Jones
CITY SUPERINTENDENT
AUDITOR ATTORNEY OF SCHOOLS
Louis Lassiter, CPA Allen L. Jackson Jason Kamras Prepared by
DEPARTMENT OF FINANCE
INDEPENDENT AUDITORS
CliftonLarsonAllen, LLP
Page | XII

FINA
NC
IAL SEC
TION

FINANCIAL
SECTION
INDEPENDENT AUDITORS' REPORT
The Honorable Member of City Council The City of Richmond, Virginia
Report on the Financial Statements We have audited the accompanying financial statements of the governmental activities, the business-type activities, the aggregate discretely presented component units, each major fund, and the aggregate remaining fund information of the City of Richmond, Virginia (the City), as of and for the year ended June 30, 2019, and the related notes to the financial statements, which collectively comprise the City’s basic financial statements as listed in the table of contents.
Management’s Responsibility for the Financial Statements Management is responsible for the preparation and fair presentation of these financial statements in accordance with accounting principles generally accepted in the United States of America; this includes the design, implementation, and maintenance of internal control relevant to the preparation and fair presentation of financial statements that are free from material misstatement, whether due to fraud or error.
Auditors’ Responsibility Our responsibility is to express opinions on these financial statements based on our audit. We did not audit the financial statements of the following aggregate discretely presented component units: Richmond School Board, Richmond Economic Development Authority, and Richmond Behavioral Health Authority, which represent 59 percent, 196 percent, and 82 percent, respectively, of the assets and deferred outflows of resources, fund balance/net position, and revenues of the aggregate discretely presented component units. We also did not audit the financial statements of the Richmond Retirement System, which represent 64 percent, 77 percent, and 24 percent, respectively, of the assets and deferred outflows of resources, fund balance/net position, and revenues of the aggregate remaining fund information of the City. Those statements were audited by other auditors whose report has been furnished to us, and our opinion, insofar as it relates to the amount included for Richmond School Board, Richmond Economic Development Authority, Richmond Behavioral Health Authority and Richmond Retirement System, is based solely on the report of the other auditors. We conducted our audit in accordance with auditing standards generally accepted in the United States of America and the standards applicable to financial audits contained in Government Auditing Standards, issued by the Comptroller General of the United States, and the Specifications for Audits of Counties, Cities and Towns, issued by the Auditor of Public Accountants of the Commonwealth of Virginia (Specifications). Those standards require that we plan and perform the audit to obtain reasonable assurance about whether the financial statements are free from material misstatement.
The Honorable Member of City Council The City of Richmond, Virginia
An audit involves performing procedures to obtain audit evidence about the amounts and disclosures in the financial statements. The procedures selected depend on the auditors’ judgment, including the assessment of the risks of material misstatement of the financial statements, whether due to fraud or error. In making those risk assessments, the auditor considers internal control relevant to the City’s preparation and fair presentation of the financial statements in order to design audit procedures that are appropriate in the circumstances, but not for the purpose of expressing an opinion on the effectiveness of the City’s internal control. Accordingly, we express no such opinion. An audit also includes evaluating the appropriateness of accounting policies used and the reasonableness of significant accounting estimates made by management, as well as evaluating the overall presentation of the financial statements.
We believe that the audit evidence we have obtained is sufficient and appropriate to provide a basis for our audit opinions.
OpinionsIn our opinion, based on our audit and the report of other auditors, the financial statements referred to above present fairly, in all material respects, the respective financial position of the governmental activities, the business-type activities, the aggregate discretely presented component units, each major fund, and the aggregate remaining fund information of the City as of June 30, 2019, and the respective changes in financial position and, where applicable, cash flows thereof for the year then ended in accordance with accounting principles generally accepted in the United States of America.
Other Matters Required Supplementary Information Accounting principles generally accepted in the United States of America require that the management’s discussion and analysis, the budgetary comparison schedule – general fund, notes to the budgetary comparison schedule – general fund, and the pension and OPEB information as identified in the accompanying table of contents, be presented to supplement the basic financial statements, Such information, although not a required part of the basic financial statements, is required by the Governmental Accounting Standards Board who considers it to be an essential part of financial reporting for placing the basic financial statements in an appropriate operational, economic, or historical context. This required supplementary information is the responsibility of management. We have applied certain limited procedures to the required supplementary information in accordance with auditing standards generally accepted in the United States of America, which consisted of inquiries of management about the methods of preparing the information and comparing the information for consistency with management’s responses to our inquiries, the basic financial statements, and other knowledge we obtained during our audit of the basic financial statements. We do not express an opinion or provide any assurance on the information because the limited procedures do not provide us with sufficient evidence to express an opinion or provide any assurance.
Other Information Our audit was conducted for the purpose of forming opinions on the financial statements that collectively comprise the City of Richmond’s basic financial statements. The combining non-major, internal service, and fiduciary fund financial statements are presented for purposes of additional analysis and are not a required part of the basic financial statements.
The Honorable Member of City Council The City of Richmond, Virginia
The combining non-major, internal service, and fiduciary fund financial statements are the responsibility of management and were derived from and relate directly to the underlying accounting and other records used to prepare the basic financial statements. Such information has been subjected to the auditing procedures applied in the audit of the basic financial statements and certain additional procedures, including comparing and reconciling such information directly to the underlying accounting and other records used to prepare the basic financial statements or to the basic financial statements themselves, and other additional procedures in accordance with auditing standards generally accepted in the United States of America. In our opinion, the combining non-major, internal service, and fiduciary fund financial statements are fairly stated, in all material respects, in relation to the basic financial statements as a whole.
The introductory section and statistical section, as listed in accompanying table of contents, have not been subjected to the auditing procedures applied in the audit of the basic financial statements, and accordingly, we do not express an opinion or provide any assurance on it.
Other Reporting Required by Government Auditing StandardsIn accordance with Government Auditing Standards, we have also issued our report dated November 3, 2019, on our consideration of the City of Richmond, Virginia's internal control over financial reporting and on our tests of its compliance with certain provisions of laws, regulations, contracts, and grant agreements and other matters. The purpose of that report is solely to describe the scope of our testing of internal control over financial reporting and compliance and the results of that testing, and not to provide an opinion on the effectiveness of the City’s internal control over financial reporting or on compliance. That report is an integral part of an audit performed in accordance with Government Auditing Standards in considering the City’s internal control over financial reporting and compliance.
CliftonLarsonAllen LLP
Arlington, Virginia November 3, 2019

MA
NA
GEM
ENT
DISC
USSIO
N &
AN
ALY
SIS
Page | 5
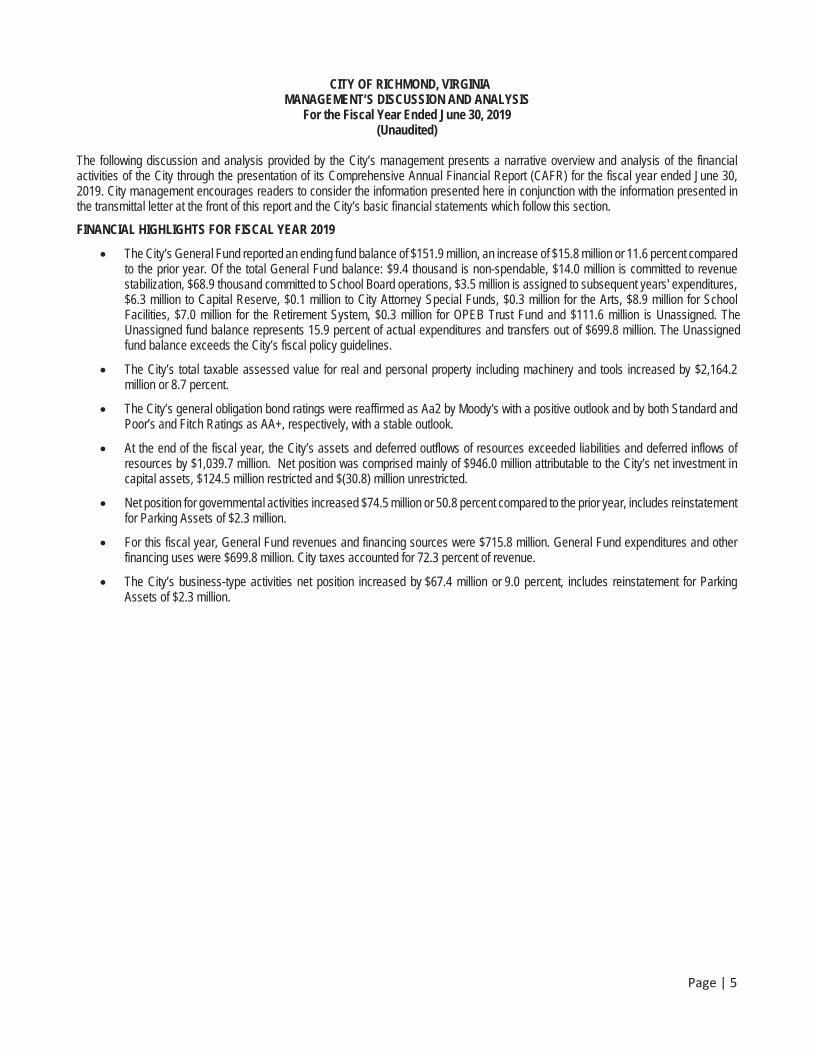
CITY OF RICHMOND, VIRGINIA MANAGEMENT’S DISCUSSION AND ANALYSIS
For the Fiscal Year Ended June 30, 2019 (Unaudited)
The following discussion and analysis provided by the City’s management presents a narrative overview and analysis of the financial activities of the City through the presentation of its Comprehensive Annual Financial Report (CAFR) for the fiscal year ended June 30, 2019. City management encourages readers to consider the information presented here in conjunction with the information presented in the transmittal letter at the front of this report and the City’s basic financial statements which follow this section.
FINANCIAL HIGHLIGHTS FOR FISCAL YEAR 2019
The City’s General Fund reported an ending fund balance of $151.9 million, an increase of $15.8 million or 11.6 percent comparedto the prior year. Of the total General Fund balance: $9.4 thousand is non-spendable, $14.0 million is committed to revenue stabilization, $68.9 thousand committed to School Board operations, $3.5 million is assigned to subsequent years' expenditures,$6.3 million to Capital Reserve, $0.1 million to City Attorney Special Funds, $0.3 million for the Arts, $8.9 million for School Facilities, $7.0 million for the Retirement System, $0.3 million for OPEB Trust Fund and $111.6 million is Unassigned. The Unassigned fund balance represents 15.9 percent of actual expenditures and transfers out of $699.8 million. The Unassigned fund balance exceeds the City’s fiscal policy guidelines.
The City’s total taxable assessed value for real and personal property including machinery and tools increased by $2,164.2million or 8.7 percent.
The City’s general obligation bond ratings were reaffirmed as Aa2 by Moody's with a positive outlook and by both Standard andPoor’s and Fitch Ratings as AA+, respectively, with a stable outlook.
At the end of the fiscal year, the City’s assets and deferred outflows of resources exceeded liabilities and deferred inflows ofresources by $1,039.7 million. Net position was comprised mainly of $946.0 million attributable to the City’s net investment incapital assets, $124.5 million restricted and $(30.8) million unrestricted.
Net position for governmental activities increased $74.5 million or 50.8 percent compared to the prior year, includes reinstatementfor Parking Assets of $2.3 million.
For this fiscal year, General Fund revenues and financing sources were $715.8 million. General Fund expenditures and otherfinancing uses were $699.8 million. City taxes accounted for 72.3 percent of revenue.
The City’s business-type activities net position increased by $67.4 million or 9.0 percent, includes reinstatement for ParkingAssets of $2.3 million.
Page | 6
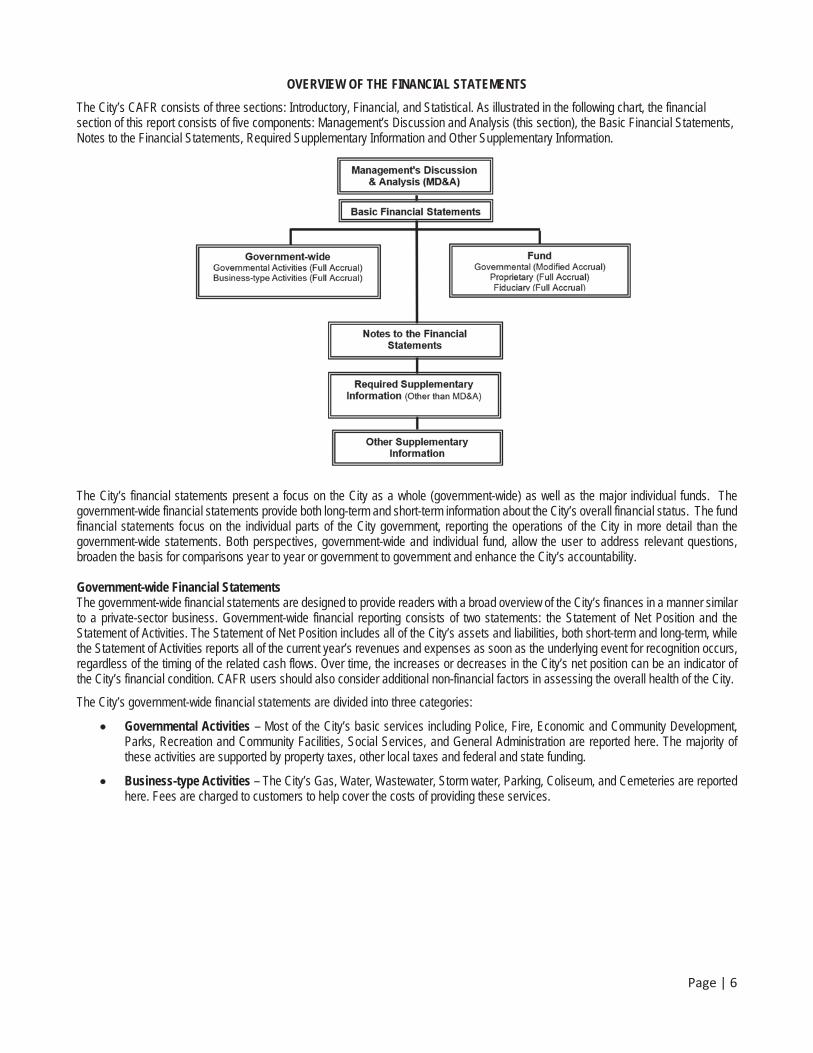
OVERVIEW OF THE FINANCIAL STATEMENTS
The City’s CAFR consists of three sections: Introductory, Financial, and Statistical. As illustrated in the following chart, the financial section of this report consists of five components: Management’s Discussion and Analysis (this section), the Basic Financial Statements, Notes to the Financial Statements, Required Supplementary Information and Other Supplementary Information.
The City’s financial statements present a focus on the City as a whole (government-wide) as well as the major individual funds. The government-wide financial statements provide both long-term and short-term information about the City’s overall financial status. The fund financial statements focus on the individual parts of the City government, reporting the operations of the City in more detail than the government-wide statements. Both perspectives, government-wide and individual fund, allow the user to address relevant questions,broaden the basis for comparisons year to year or government to government and enhance the City’s accountability.
Government-wide Financial Statements The government-wide financial statements are designed to provide readers with a broad overview of the City’s finances in a manner similar to a private-sector business. Government-wide financial reporting consists of two statements: the Statement of Net Position and the Statement of Activities. The Statement of Net Position includes all of the City’s assets and liabilities, both short-term and long-term, while the Statement of Activities reports all of the current year’s revenues and expenses as soon as the underlying event for recognition occurs, regardless of the timing of the related cash flows. Over time, the increases or decreases in the City’s net position can be an indicator of the City’s financial condition. CAFR users should also consider additional non-financial factors in assessing the overall health of the City.
The City’s government-wide financial statements are divided into three categories:
Governmental Activities – Most of the City’s basic services including Police, Fire, Economic and Community Development,Parks, Recreation and Community Facilities, Social Services, and General Administration are reported here. The majority ofthese activities are supported by property taxes, other local taxes and federal and state funding.
Business-type Activities – The City’s Gas, Water, Wastewater, Storm water, Parking, Coliseum, and Cemeteries are reportedhere. Fees are charged to customers to help cover the costs of providing these services.
Page | 7
Component Units – Five separate legal entities are included in this report: Richmond School Board, Richmond EconomicDevelopment Authority, Richmond Ambulance Authority, Richmond Behavioral Health Authority and Richmond Redevelopmentand Housing Authority. Although legally separate, these component units are important because the City is financiallyaccountable for them, and may provide significant operating or capital funding, or both.
Fund Financial Statements
The fund financial statements provide detailed information about the City’s most significant funds and not the City as a whole. Funds are an accounting tool that the City uses to track resources that are segregated for specific activities or objectives. Some funds are required by state law or by bond covenants. Other funds are established to control and manage money for particular purposes or to show that the City is using specific revenue sources such as taxes and grants for their intended purposes. The City has three types of funds:Governmental, Proprietary and Fiduciary.
Governmental Funds – The General Fund, Debt Service Fund, Capital Projects Fund, Special Revenue funds and PermanentFunds are governmental funds. These funds’ statements focus on near-term inflows and outflows of spendable resources aswell as balances of spendable resources available at the end of the fiscal year. Additional information is provided accompanyingthese statements that explains the relationship between the long-term focused government-wide statements and the short-termfocused governmental fund statements.
Proprietary Funds – Services for which the City charges customers a fee are generally reported in Proprietary Funds. Like thegovernment-wide statements, Proprietary fund statements provide both long and short-term financial information. The Citymaintains two types of proprietary funds:
o Enterprise Funds – Similar to business-type activities included in the government-wide statements, the EnterpriseFund financial statements provide more detail and additional information such as cash-flow.
o Internal Service Funds – The City uses internal service funds to report activities that provide supplies and servicesfor the City’s other programs and activities.
Fiduciary Funds – Fiduciary Funds are used to account for resources held for the benefit of parties outside the government.These fiduciary activities are excluded from the City’s government-wide financial statements because the City cannot use theseassets to finance its operations. The City maintains two fiduciary funds:
o Trust Funds – Provides retirement and disability benefits for all vested full time employees under a City deferredcompensation plan created in accordance with the Internal Revenue Code Section 457.
o Agency Funds – Agency Funds are custodial in nature and do not present results of operations or have ameasurement focus. The Agency Funds consist of the assets and liabilities of several organizations for which the Cityserves as fiscal agent, such as the Department of Parks, Recreation and Community Facilities, the Department ofPublic Works and the Law Department.
Notes to the Financial Statements
The notes to the financial statements provide information that is essential for a full understanding of the information provided in the government-wide and fund financial statements. The notes also present certain required supplementary information.
GOVERNMENT-WIDE ANALYSIS
Net Position
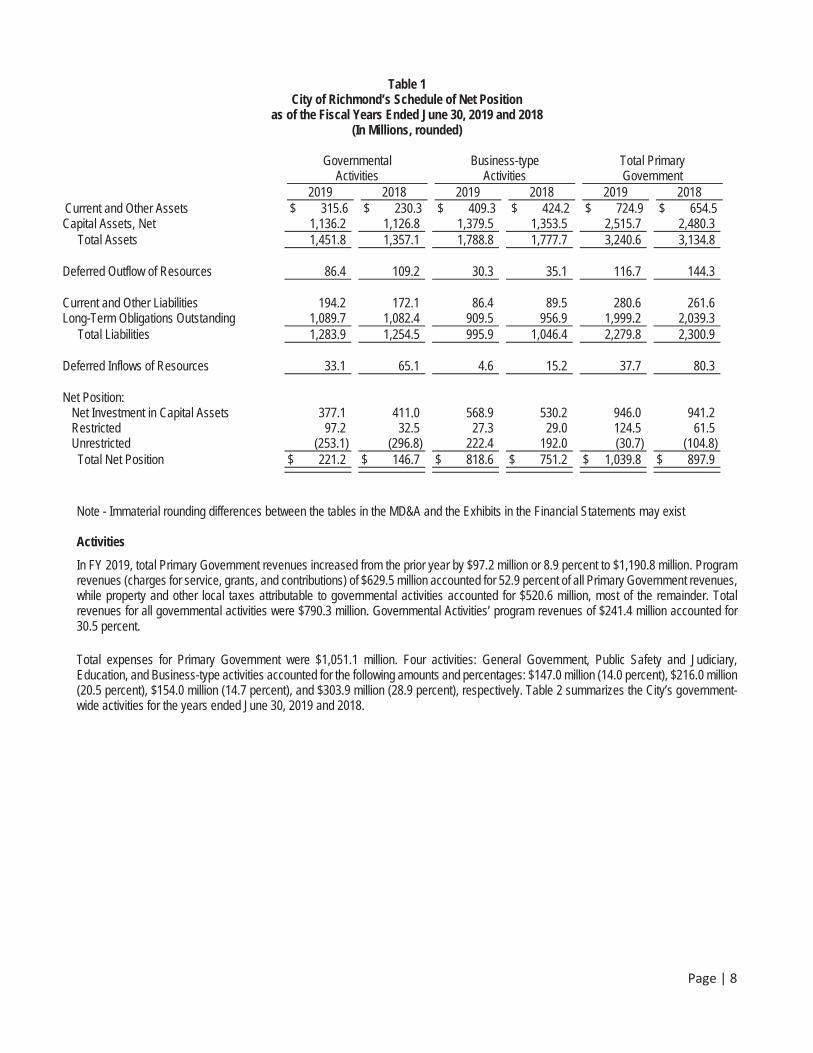
FY 2019, Total Assets for the Primary Government were $3,240.6 million, an increase from prior year total assets by $105.8 million. Total Assets for only governmental activities were $1,451.8 million, up by $94.7 million or 7.0 percent. Total Assets from business-type activities increased by $11.1 million and were still predominant in FY 2019, accounting for 55.2 percent of total Primary Government assetscompared to 56.7 percent in FY 2018.
Total Liabilities were $2,279.8 million down $(21.1) million from $2,300.9 million in FY 2018. Total Liabilities associated with governmental type activities increased by $29.4 million up 2.3 percent while total liabilities associated with business-type activities decreased $(50.5) million or (4.8) percent.
Total net position was $1,039.8 million up $141.9 million over the prior year’s balance. Table 1 summarizes the City’s government-widenet position at June 30, 2019 and 2018.
Page | 8
Table 1 City of Richmond’s Schedule of Net Position
as of the Fiscal Years Ended June 30, 2019 and 2018 (In Millions, rounded)
Governmental Activities
Business-typeActivities
Total Primary Government
2019 2018 2019 2018 2019 2018 Current and Other Assets $ 315.6 $ 230.3 $ 409.3 $ 424.2 $ 724.9 $ 654.5 Capital Assets, Net 1,136.2 1,126.8 1,379.5 1,353.5 2,515.7 2,480.3 Total Assets 1,451.8 1,357.1 1,788.8 1,777.7 3,240.6 3,134.8
Deferred Outflow of Resources 86.4 109.2 30.3 35.1 116.7 144.3
Current and Other Liabilities 194.2 172.1 86.4 89.5 280.6 261.6 Long-Term Obligations Outstanding 1,089.7 1,082.4 909.5 956.9 1,999.2 2,039.3 Total Liabilities 1,283.9 1,254.5 995.9 1,046.4 2,279.8 2,300.9
Deferred Inflows of Resources 33.1 65.1 4.6 15.2 37.7 80.3
Net Position: Net Investment in Capital Assets 377.1 411.0 568.9 530.2 946.0 941.2 Restricted 97.2 32.5 27.3 29.0 124.5 61.5 Unrestricted (253.1) (296.8) 222.4 192.0 (30.7) (104.8) Total Net Position $ 221.2 $ 146.7 $ 818.6 $ 751.2 $ 1,039.8 $ 897.9
Note - Immaterial rounding differences between the tables in the MD&A and the Exhibits in the Financial Statements may exist
Activities
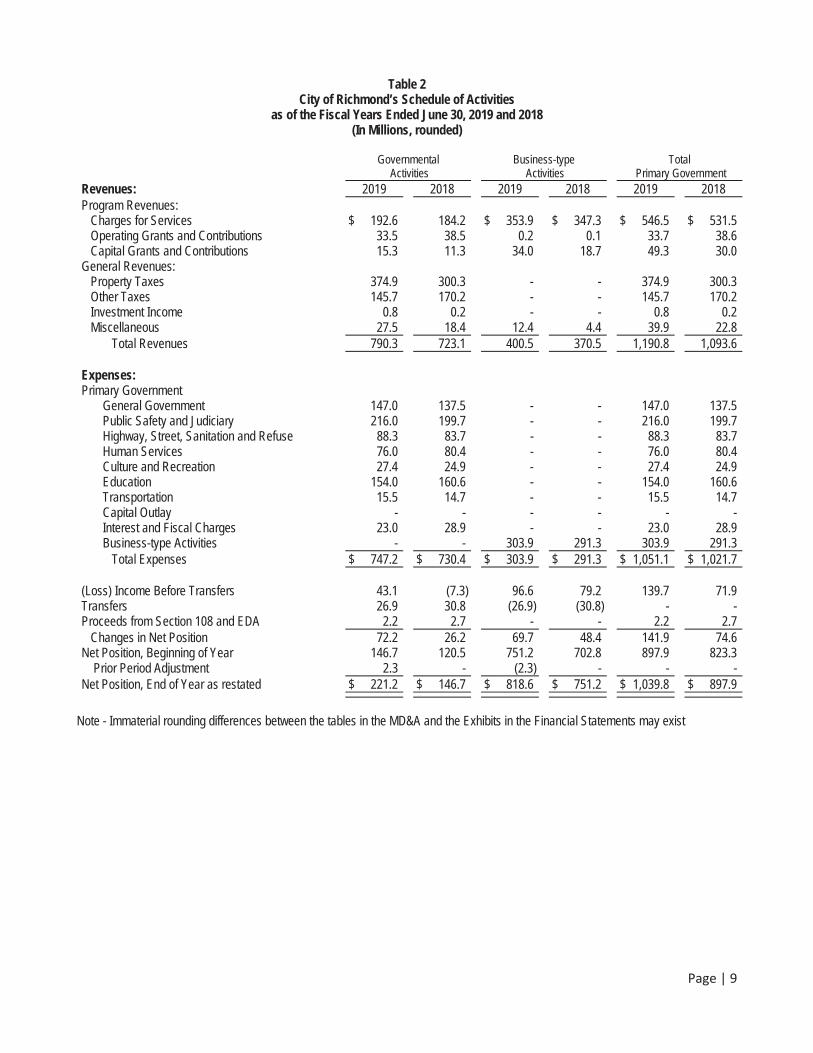
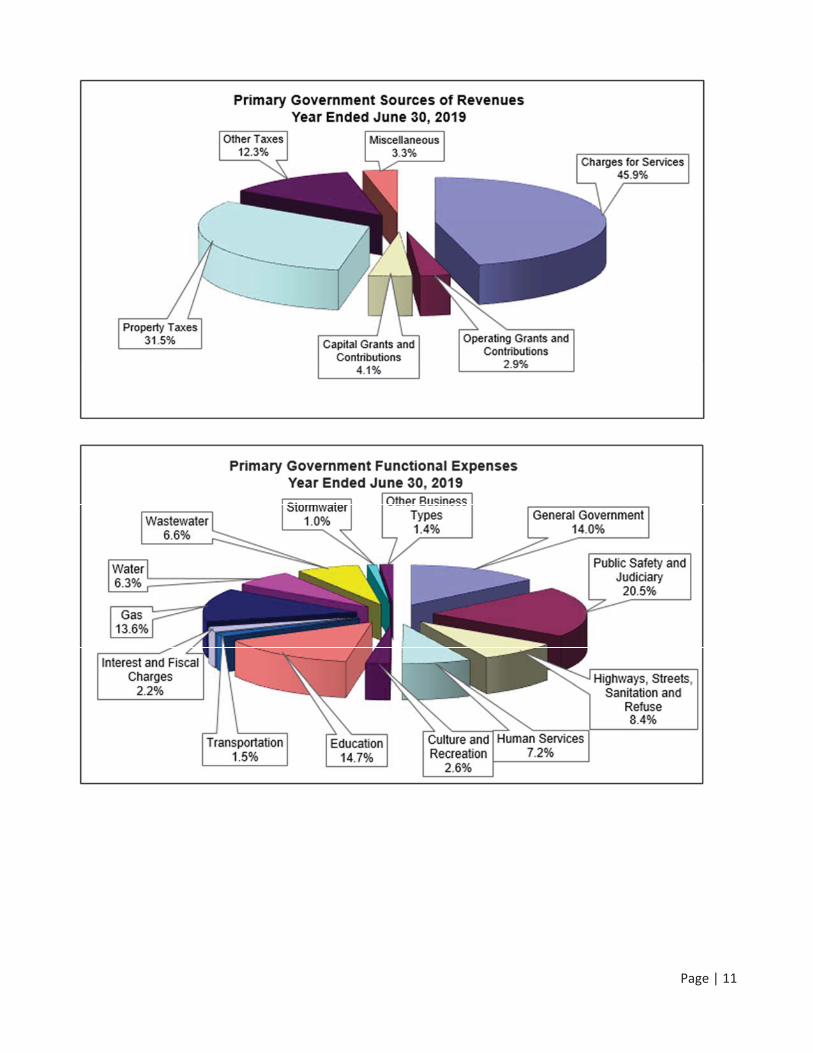
In FY 2019, total Primary Government revenues increased from the prior year by $97.2 million or 8.9 percent to $1,190.8 million. Program revenues (charges for service, grants, and contributions) of $629.5 million accounted for 52.9 percent of all Primary Government revenues, while property and other local taxes attributable to governmental activities accounted for $520.6 million, most of the remainder. Total revenues for all governmental activities were $790.3 million. Governmental Activities’ program revenues of $241.4 million accounted for 30.5 percent.
Total expenses for Primary Government were $1,051.1 million. Four activities: General Government, Public Safety and Judiciary, Education, and Business-type activities accounted for the following amounts and percentages: $147.0 million (14.0 percent), $216.0 million (20.5 percent), $154.0 million (14.7 percent), and $303.9 million (28.9 percent), respectively. Table 2 summarizes the City’s government-wide activities for the years ended June 30, 2019 and 2018.
Page | 9
Table 2 City of Richmond’s Schedule of Activities
as of the Fiscal Years Ended June 30, 2019 and 2018 (In Millions, rounded)
Governmental Activities
Business-type Activities
Total Primary Government
Revenues: 2019 2018 2019 2018 2019 2018 Program Revenues: Charges for Services $ 192.6 184.2 $ 353.9 $ 347.3 $ 546.5 $ 531.5 Operating Grants and Contributions 33.5 38.5 0.2 0.1 33.7 38.6 Capital Grants and Contributions 15.3 11.3 34.0 18.7 49.3 30.0 General Revenues: Property Taxes 374.9 300.3 - - 374.9 300.3 Other Taxes 145.7 170.2 - - 145.7 170.2 Investment Income 0.8 0.2 - - 0.8 0.2 Miscellaneous 27.5 18.4 12.4 4.4 39.9 22.8 Total Revenues 790.3 723.1 400.5 370.5 1,190.8 1,093.6
Expenses:Primary Government General Government 147.0 137.5 - - 147.0 137.5 Public Safety and Judiciary 216.0 199.7 - - 216.0 199.7 Highway, Street, Sanitation and Refuse 88.3 83.7 - - 88.3 83.7 Human Services 76.0 80.4 - - 76.0 80.4 Culture and Recreation 27.4 24.9 - - 27.4 24.9 Education 154.0 160.6 - - 154.0 160.6 Transportation 15.5 14.7 - - 15.5 14.7 Capital Outlay - - - - - - Interest and Fiscal Charges 23.0 28.9 - - 23.0 28.9 Business-type Activities - - 303.9 291.3 303.9 291.3 Total Expenses $ 747.2 $ 730.4 $ 303.9 $ 291.3 $ 1,051.1 $ 1,021.7
(Loss) Income Before Transfers 43.1 (7.3) 96.6 79.2 139.7 71.9 Transfers 26.9 30.8 (26.9) (30.8) - - Proceeds from Section 108 and EDA 2.2 2.7 - - 2.2 2.7 Changes in Net Position 72.2 26.2 69.7 48.4 141.9 74.6 Net Position, Beginning of Year 146.7 120.5 751.2 702.8 897.9 823.3
Prior Period Adjustment 2.3 - (2.3) - - - Net Position, End of Year as restated $ 221.2 $ 146.7 $ 818.6 $ 751.2 $ 1,039.8 $ 897.9
Note - Immaterial rounding differences between the tables in the MD&A and the Exhibits in the Financial Statements may exist
Page | 10
GENERAL FUND
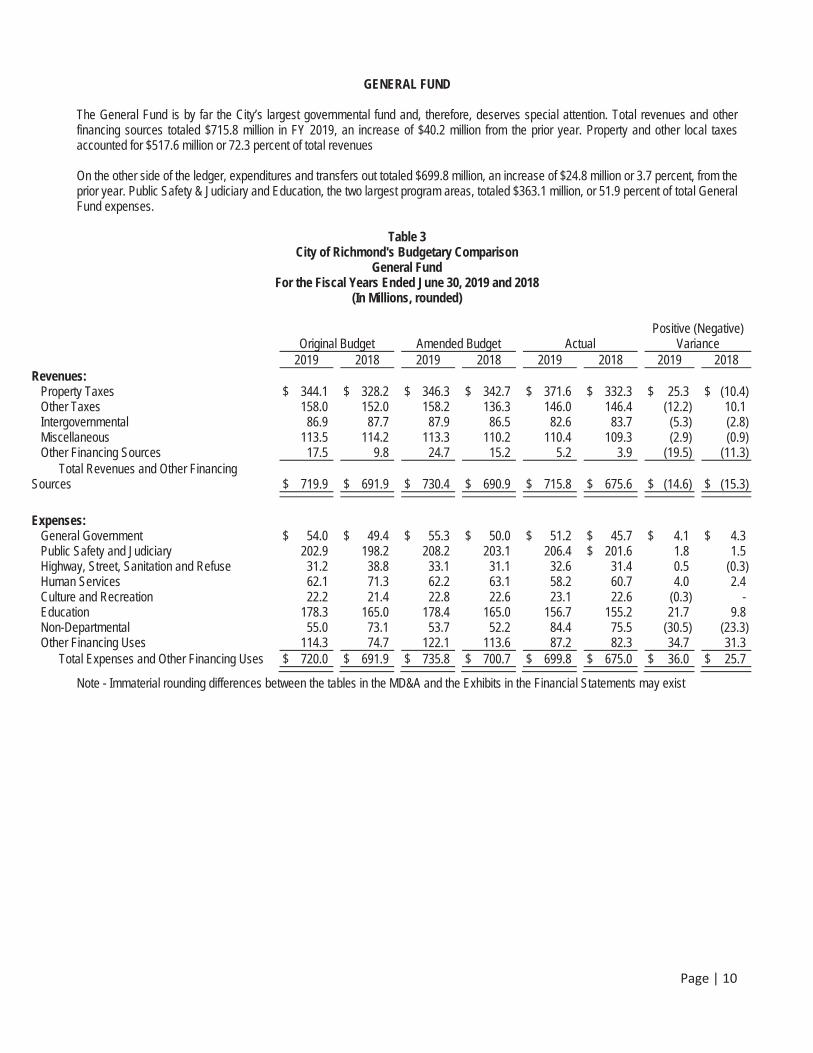
The General Fund is by far the City’s largest governmental fund and, therefore, deserves special attention. Total revenues and otherfinancing sources totaled $715.8 million in FY 2019, an increase of $40.2 million from the prior year. Property and other local taxes accounted for $517.6 million or 72.3 percent of total revenues
On the other side of the ledger, expenditures and transfers out totaled $699.8 million, an increase of $24.8 million or 3.7 percent, from the prior year. Public Safety & Judiciary and Education, the two largest program areas, totaled $363.1 million, or 51.9 percent of total General Fund expenses.
Table 3 City of Richmond's Budgetary Comparison
General Fund For the Fiscal Years Ended June 30, 2019 and 2018
(In Millions, rounded)
Original Budget Amended Budget Actual Positive (Negative)
Variance 2019 2018 2019 2018 2019 2018 2019 2018
Revenues: Property Taxes $ 344.1 $ 328.2 $ 346.3 $ 342.7 $ 371.6 $ 332.3 $ 25.3 $ (10.4) Other Taxes 158.0 152.0 158.2 136.3 146.0 146.4 (12.2) 10.1 Intergovernmental 86.9 87.7 87.9 86.5 82.6 83.7 (5.3) (2.8) Miscellaneous 113.5 114.2 113.3 110.2 110.4 109.3 (2.9) (0.9) Other Financing Sources 17.5 9.8 24.7 15.2 5.2 3.9 (19.5) (11.3) Total Revenues and Other Financing Sources $ 719.9 $ 691.9 $ 730.4 $ 690.9 $ 715.8 $ 675.6 $ (14.6) $ (15.3)
Expenses: General Government $ 54.0 $ 49.4 $ 55.3 $ 50.0 $ 51.2 $ 45.7 $ 4.1 $ 4.3 Public Safety and Judiciary 202.9 198.2 208.2 203.1 206.4 $ 201.6 1.8 1.5 Highway, Street, Sanitation and Refuse 31.2 38.8 33.1 31.1 32.6 31.4 0.5 (0.3) Human Services 62.1 71.3 62.2 63.1 58.2 60.7 4.0 2.4 Culture and Recreation 22.2 21.4 22.8 22.6 23.1 22.6 (0.3) - Education 178.3 165.0 178.4 165.0 156.7 155.2 21.7 9.8 Non-Departmental 55.0 73.1 53.7 52.2 84.4 75.5 (30.5) (23.3) Other Financing Uses 114.3 74.7 122.1 113.6 87.2 82.3 34.7 31.3 Total Expenses and Other Financing Uses $ 720.0 $ 691.9 $ 735.8 $ 700.7 $ 699.8 $ 675.0 $ 36.0 $ 25.7
Note - Immaterial rounding differences between the tables in the MD&A and the Exhibits in the Financial Statements may exist
Page | 11
Page | 12
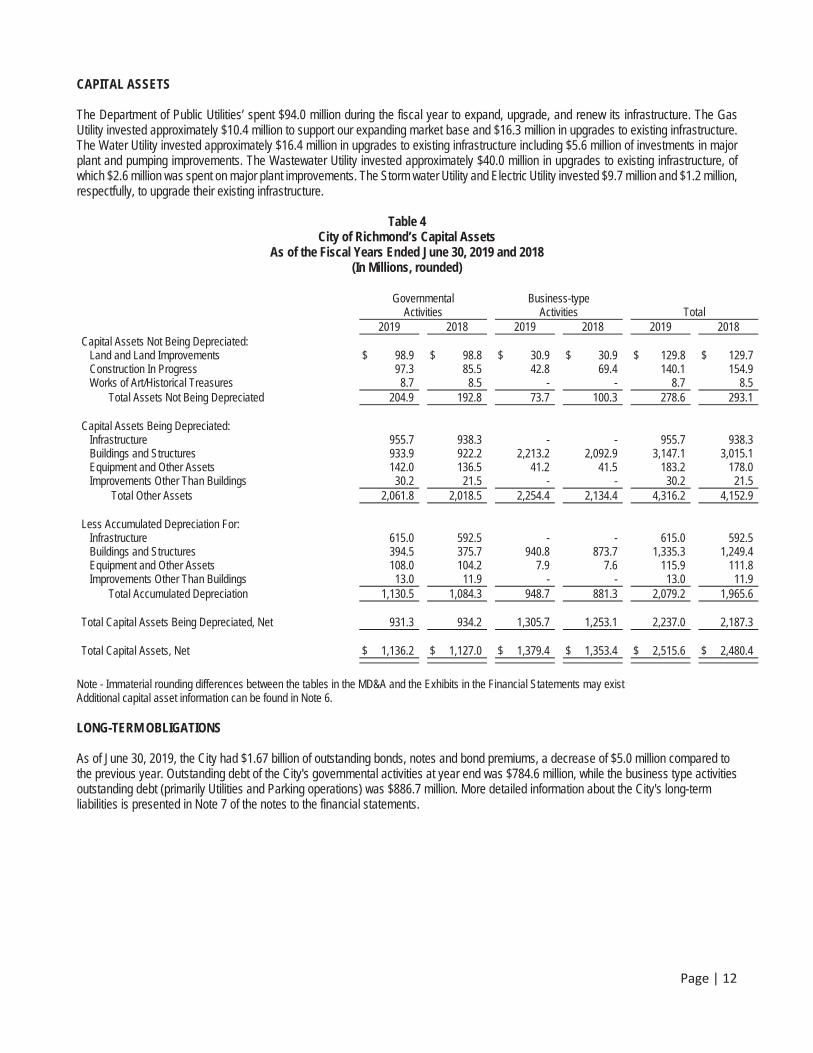
CAPITAL ASSETS
The Department of Public Utilities’ spent $94.0 million during the fiscal year to expand, upgrade, and renew its infrastructure. The Gas Utility invested approximately $10.4 million to support our expanding market base and $16.3 million in upgrades to existing infrastructure. The Water Utility invested approximately $16.4 million in upgrades to existing infrastructure including $5.6 million of investments in major plant and pumping improvements. The Wastewater Utility invested approximately $40.0 million in upgrades to existing infrastructure, of which $2.6 million was spent on major plant improvements. The Storm water Utility and Electric Utility invested $9.7 million and $1.2 million, respectfully, to upgrade their existing infrastructure.
Table 4 City of Richmond’s Capital Assets
As of the Fiscal Years Ended June 30, 2019 and 2018 (In Millions, rounded)
GovernmentalActivities
Business-type Activities Total
2019 2018 2019 2018 2019 2018 Capital Assets Not Being Depreciated: Land and Land Improvements $ 98.9 $ 98.8 $ 30.9 $ 30.9 $ 129.8 $ 129.7 Construction In Progress 97.3 85.5 42.8 69.4 140.1 154.9 Works of Art/Historical Treasures 8.7 8.5 - - 8.7 8.5
Total Assets Not Being Depreciated 204.9 192.8 73.7 100.3 278.6 293.1
Capital Assets Being Depreciated: Infrastructure 955.7 938.3 - - 955.7 938.3 Buildings and Structures 933.9 922.2 2,213.2 2,092.9 3,147.1 3,015.1 Equipment and Other Assets 142.0 136.5 41.2 41.5 183.2 178.0 Improvements Other Than Buildings 30.2 21.5 - - 30.2 21.5
Total Other Assets 2,061.8 2,018.5 2,254.4 2,134.4 4,316.2 4,152.9
Less Accumulated Depreciation For: Infrastructure 615.0 592.5 - - 615.0 592.5 Buildings and Structures 394.5 375.7 940.8 873.7 1,335.3 1,249.4 Equipment and Other Assets 108.0 104.2 7.9 7.6 115.9 111.8 Improvements Other Than Buildings 13.0 11.9 - - 13.0 11.9
Total Accumulated Depreciation 1,130.5 1,084.3 948.7 881.3 2,079.2 1,965.6
Total Capital Assets Being Depreciated, Net 931.3 934.2 1,305.7 1,253.1 2,237.0 2,187.3
Total Capital Assets, Net $ 1,136.2 $ 1,127.0 $ 1,379.4 $ 1,353.4 $ 2,515.6 $ 2,480.4
Note - Immaterial rounding differences between the tables in the MD&A and the Exhibits in the Financial Statements may exist Additional capital asset information can be found in Note 6.
LONG-TERM OBLIGATIONS
As of June 30, 2019, the City had $1.67 billion of outstanding bonds, notes and bond premiums, a decrease of $5.0 million compared to the previous year. Outstanding debt of the City's governmental activities at year end was $784.6 million, while the business type activities outstanding debt (primarily Utilities and Parking operations) was $886.7 million. More detailed information about the City's long-termliabilities is presented in Note 7 of the notes to the financial statements.
Page | 13
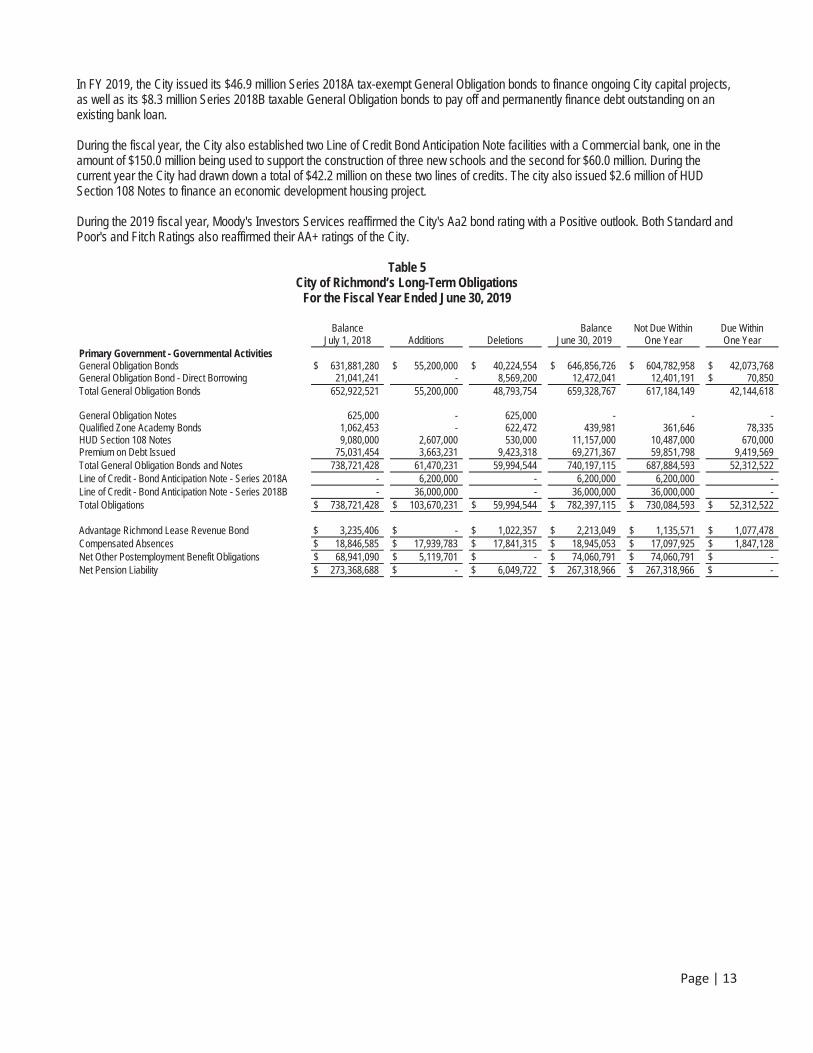
In FY 2019, the City issued its $46.9 million Series 2018A tax-exempt General Obligation bonds to finance ongoing City capital projects, as well as its $8.3 million Series 2018B taxable General Obligation bonds to pay off and permanently finance debt outstanding on an existing bank loan.
During the fiscal year, the City also established two Line of Credit Bond Anticipation Note facilities with a Commercial bank, one in the amount of $150.0 million being used to support the construction of three new schools and the second for $60.0 million. During thecurrent year the City had drawn down a total of $42.2 million on these two lines of credits. The city also issued $2.6 million of HUD Section 108 Notes to finance an economic development housing project.
During the 2019 fiscal year, Moody's Investors Services reaffirmed the City's Aa2 bond rating with a Positive outlook. Both Standard and Poor's and Fitch Ratings also reaffirmed their AA+ ratings of the City.
Table 5 City of Richmond’s Long-Term Obligations
For the Fiscal Year Ended June 30, 2019
BalanceJuly 1, 2018 Additions Deletions
Balance June 30, 2019
Not Due Within One Year
Due Within One Year
Primary Government - Governmental Activities General Obligation Bonds $ 631,881,280 $ 55,200,000 $ 40,224,554 $ 646,856,726 $ 604,782,958 $ 42,073,768General Obligation Bond - Direct Borrowing 21,041,241 - 8,569,200 12,472,041 12,401,191 $ 70,850 Total General Obligation Bonds 652,922,521 55,200,000 48,793,754 659,328,767 617,184,149 42,144,618
General Obligation Notes 625,000 - 625,000 - - - Qualified Zone Academy Bonds 1,062,453 - 622,472 439,981 361,646 78,335 HUD Section 108 Notes 9,080,000 2,607,000 530,000 11,157,000 10,487,000 670,000 Premium on Debt Issued 75,031,454 3,663,231 9,423,318 69,271,367 59,851,798 9,419,569 Total General Obligation Bonds and Notes 738,721,428 61,470,231 59,994,544 740,197,115 687,884,593 52,312,522 Line of Credit - Bond Anticipation Note - Series 2018A - 6,200,000 - 6,200,000 6,200,000 - Line of Credit - Bond Anticipation Note - Series 2018B - 36,000,000 - 36,000,000 36,000,000 - Total Obligations $ 738,721,428 $ 103,670,231 $ 59,994,544 $ 782,397,115 $ 730,084,593 $ 52,312,522
Advantage Richmond Lease Revenue Bond $ 3,235,406 $ - $ 1,022,357 $ 2,213,049 $ 1,135,571 $ 1,077,478 Compensated Absences $ 18,846,585 $ 17,939,783 $ 17,841,315 $ 18,945,053 $ 17,097,925 $ 1,847,128 Net Other Postemployment Benefit Obligations $ 68,941,090 $ 5,119,701 $ - $ 74,060,791 $ 74,060,791 $ - Net Pension Liability $ 273,368,688 $ - $ 6,049,722 $ 267,318,966 $ 267,318,966 $ -
Page | 14
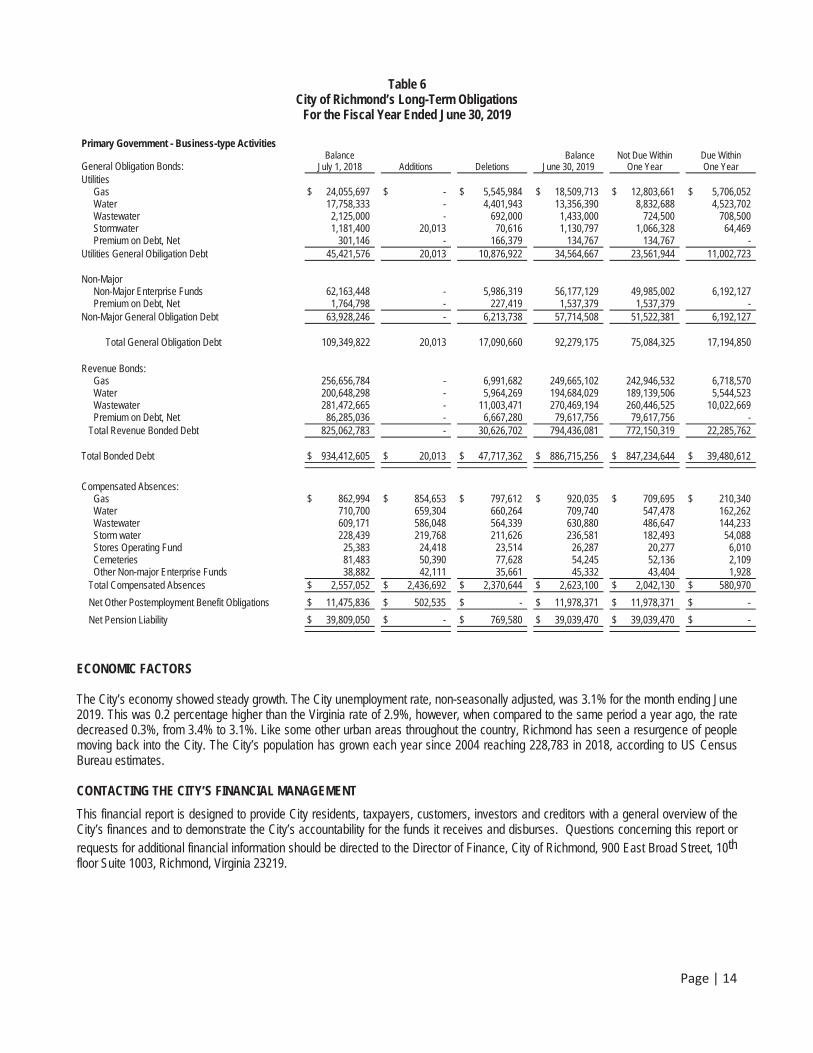
Table 6 City of Richmond’s Long-Term Obligations
For the Fiscal Year Ended June 30, 2019
Primary Government - Business-type Activities
General Obligation Bonds: Balance
July 1, 2018 Additions Deletions Balance
June 30, 2019 Not Due Within
One Year Due Within One Year
Utilities Gas $ 24,055,697 $ - $ 5,545,984 $ 18,509,713 $ 12,803,661 $ 5,706,052 Water 17,758,333 - 4,401,943 13,356,390 8,832,688 4,523,702 Wastewater 2,125,000 - 692,000 1,433,000 724,500 708,500 Stormwater 1,181,400 20,013 70,616 1,130,797 1,066,328 64,469 Premium on Debt, Net 301,146 - 166,379 134,767 134,767 -
Utilities General Obiligation Debt 45,421,576 20,013 10,876,922 34,564,667 23,561,944 11,002,723
Non-Major Non-Major Enterprise Funds 62,163,448 - 5,986,319 56,177,129 49,985,002 6,192,127
Premium on Debt, Net 1,764,798 - 227,419 1,537,379 1,537,379 - Non-Major General Obligation Debt 63,928,246 - 6,213,738 57,714,508 51,522,381 6,192,127
Total General Obligation Debt 109,349,822 20,013 17,090,660 92,279,175 75,084,325 17,194,850
Revenue Bonds: Gas 256,656,784 - 6,991,682 249,665,102 242,946,532 6,718,570 Water 200,648,298 - 5,964,269 194,684,029 189,139,506 5,544,523 Wastewater 281,472,665 - 11,003,471 270,469,194 260,446,525 10,022,669 Premium on Debt, Net 86,285,036 - 6,667,280 79,617,756 79,617,756 -
Total Revenue Bonded Debt 825,062,783 - 30,626,702 794,436,081 772,150,319 22,285,762
Total Bonded Debt $ 934,412,605 $ 20,013 $ 47,717,362 $ 886,715,256 $ 847,234,644 $ 39,480,612
Compensated Absences: Gas $ 862,994 $ 854,653 $ 797,612 $ 920,035 $ 709,695 $ 210,340 Water 710,700 659,304 660,264 709,740 547,478 162,262 Wastewater 609,171 586,048 564,339 630,880 486,647 144,233 Storm water 228,439 219,768 211,626 236,581 182,493 54,088 Stores Operating Fund 25,383 24,418 23,514 26,287 20,277 6,010 Cemeteries 81,483 50,390 77,628 54,245 52,136 2,109 Other Non-major Enterprise Funds 38,882 42,111 35,661 45,332 43,404 1,928
Total Compensated Absences $ 2,557,052 $ 2,436,692 $ 2,370,644 $ 2,623,100 $ 2,042,130 $ 580,970
Net Other Postemployment Benefit Obligations $ 11,475,836 $ 502,535 $ - $ 11,978,371 $ 11,978,371 $ -
Net Pension Liability $ 39,809,050 $ - $ 769,580 $ 39,039,470 $ 39,039,470 $ -
ECONOMIC FACTORS
The City’s economy showed steady growth. The City unemployment rate, non-seasonally adjusted, was 3.1% for the month ending June2019. This was 0.2 percentage higher than the Virginia rate of 2.9%, however, when compared to the same period a year ago, the ratedecreased 0.3%, from 3.4% to 3.1%. Like some other urban areas throughout the country, Richmond has seen a resurgence of peoplemoving back into the City. The City’s population has grown each year since 2004 reaching 228,783 in 2018, according to US CensusBureau estimates.
CONTACTING THE CITY’S FINANCIAL MANAGEMENT
This financial report is designed to provide City residents, taxpayers, customers, investors and creditors with a general overview of the City’s finances and to demonstrate the City’s accountability for the funds it receives and disburses. Questions concerning this report or requests for additional financial information should be directed to the Director of Finance, City of Richmond, 900 East Broad Street, 10thfloor Suite 1003, Richmond, Virginia 23219.

BA
SIC FIN
AN
CIA
LSTA
TEMEN
TS

BASIC FINANCIAL
STATEMENTS

Page | 17
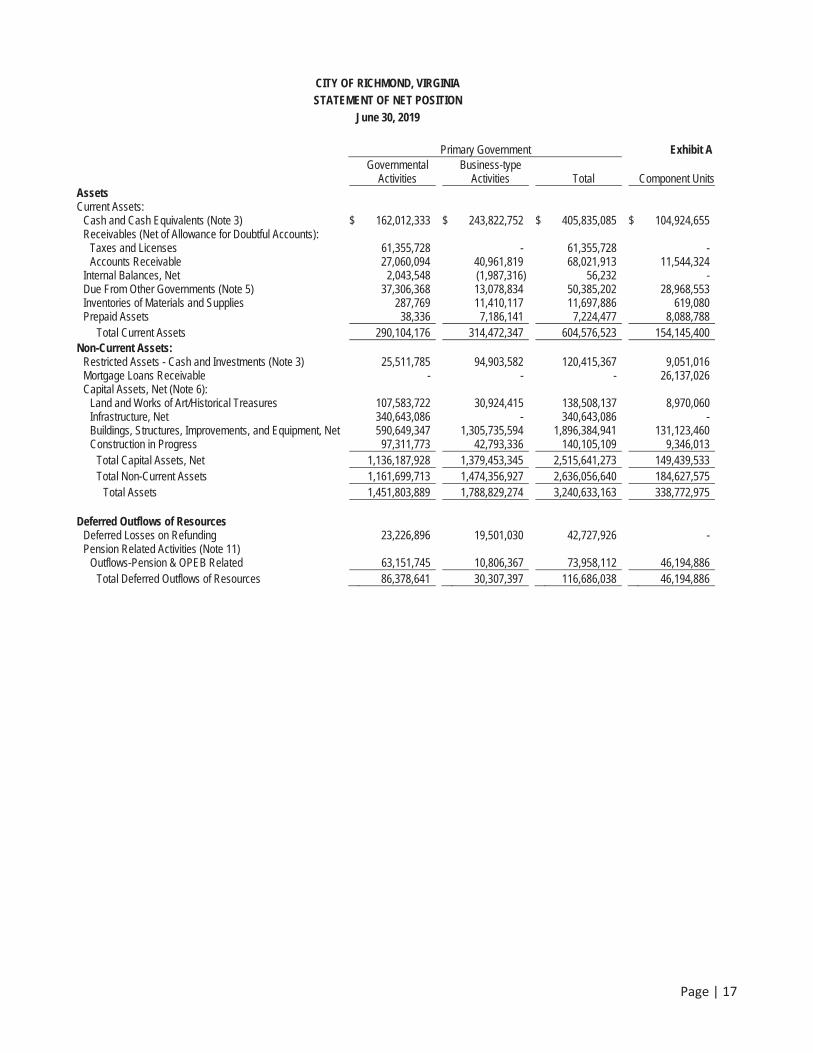
CITY OF RICHMOND, VIRGINIA STATEMENT OF NET POSITION
June 30, 2019
Primary Government Exhibit AGovernmental
ActivitiesBusiness-type
Activities Total Component UnitsAssets Current Assets:
Cash and Cash Equivalents (Note 3) $ 162,012,333 $ 243,822,752 $ 405,835,085 $ 104,924,655 Receivables (Net of Allowance for Doubtful Accounts):
Taxes and Licenses 61,355,728 - 61,355,728 -Accounts Receivable 27,060,094 40,961,819 68,021,913 11,544,324
Internal Balances, Net 2,043,548 (1,987,316) 56,232 -Due From Other Governments (Note 5) 37,306,368 13,078,834 50,385,202 28,968,553 Inventories of Materials and Supplies 287,769 11,410,117 11,697,886 619,080 Prepaid Assets 38,336 7,186,141 7,224,477 8,088,788
Total Current Assets 290,104,176 314,472,347 604,576,523 154,145,400 Non-Current Assets:
Restricted Assets - Cash and Investments (Note 3) 25,511,785 94,903,582 120,415,367 9,051,016 Mortgage Loans Receivable - - - 26,137,026 Capital Assets, Net (Note 6):
Land and Works of Art/Historical Treasures 107,583,722 30,924,415 138,508,137 8,970,060 Infrastructure, Net 340,643,086 - 340,643,086 -Buildings, Structures, Improvements, and Equipment, Net 590,649,347 1,305,735,594 1,896,384,941 131,123,460 Construction in Progress 97,311,773 42,793,336 140,105,109 9,346,013
Total Capital Assets, Net 1,136,187,928 1,379,453,345 2,515,641,273 149,439,533 Total Non-Current Assets 1,161,699,713 1,474,356,927 2,636,056,640 184,627,575
Total Assets 1,451,803,889 1,788,829,274 3,240,633,163 338,772,975
Deferred Outflows of Resources Deferred Losses on Refunding 23,226,896 19,501,030 42,727,926 -Pension Related Activities (Note 11)
Outflows-Pension & OPEB Related 63,151,745 10,806,367 73,958,112 46,194,886 Total Deferred Outflows of Resources 86,378,641 30,307,397 116,686,038 46,194,886
Page | 18
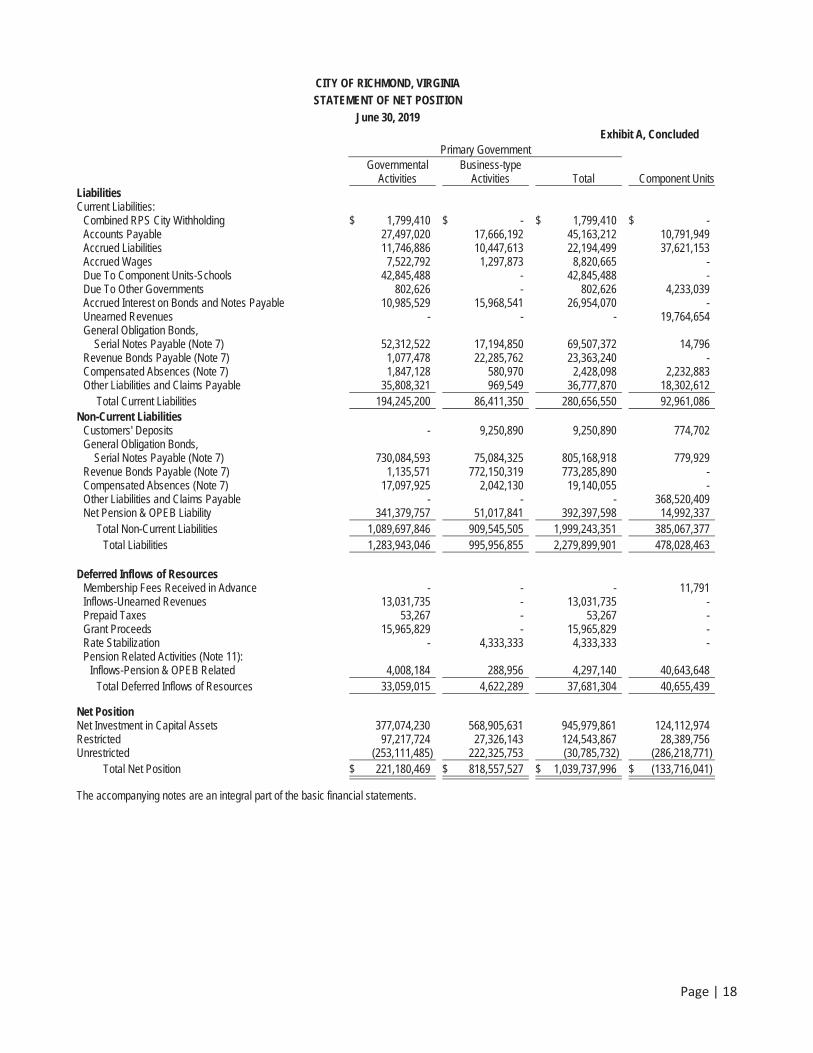
CITY OF RICHMOND, VIRGINIA STATEMENT OF NET POSITION
June 30, 2019 Exhibit A, Concluded
Primary Government Governmental
ActivitiesBusiness-type
Activities Total Component UnitsLiabilities Current Liabilities:
Combined RPS City Withholding $ 1,799,410 $ - $ 1,799,410 $ -Accounts Payable 27,497,020 17,666,192 45,163,212 10,791,949 Accrued Liabilities 11,746,886 10,447,613 22,194,499 37,621,153 Accrued Wages 7,522,792 1,297,873 8,820,665 -Due To Component Units-Schools 42,845,488 - 42,845,488 -Due To Other Governments 802,626 - 802,626 4,233,039 Accrued Interest on Bonds and Notes Payable 10,985,529 15,968,541 26,954,070 -Unearned Revenues - - - 19,764,654 General Obligation Bonds, Serial Notes Payable (Note 7) 52,312,522 17,194,850 69,507,372 14,796 Revenue Bonds Payable (Note 7) 1,077,478 22,285,762 23,363,240 -Compensated Absences (Note 7) 1,847,128 580,970 2,428,098 2,232,883 Other Liabilities and Claims Payable 35,808,321 969,549 36,777,870 18,302,612
Total Current Liabilities 194,245,200 86,411,350 280,656,550 92,961,086 Non-Current Liabilities
Customers' Deposits - 9,250,890 9,250,890 774,702 General Obligation Bonds, Serial Notes Payable (Note 7) 730,084,593 75,084,325 805,168,918 779,929 Revenue Bonds Payable (Note 7) 1,135,571 772,150,319 773,285,890 -Compensated Absences (Note 7) 17,097,925 2,042,130 19,140,055 -Other Liabilities and Claims Payable - - - 368,520,409 Net Pension & OPEB Liability 341,379,757 51,017,841 392,397,598 14,992,337
Total Non-Current Liabilities 1,089,697,846 909,545,505 1,999,243,351 385,067,377 Total Liabilities 1,283,943,046 995,956,855 2,279,899,901 478,028,463
Deferred Inflows of Resources Membership Fees Received in Advance - - - 11,791 Inflows-Unearned Revenues 13,031,735 - 13,031,735 -Prepaid Taxes 53,267 - 53,267 -Grant Proceeds 15,965,829 - 15,965,829 -Rate Stabilization - 4,333,333 4,333,333 -Pension Related Activities (Note 11):
Inflows-Pension & OPEB Related 4,008,184 288,956 4,297,140 40,643,648 Total Deferred Inflows of Resources 33,059,015 4,622,289 37,681,304 40,655,439
Net Position Net Investment in Capital Assets 377,074,230 568,905,631 945,979,861 124,112,974 Restricted 97,217,724 27,326,143 124,543,867 28,389,756Unrestricted (253,111,485) 222,325,753 (30,785,732) (286,218,771)
Total Net Position $ 221,180,469 $ 818,557,527 $ 1,039,737,996 $ (133,716,041)
The accompanying notes are an integral part of the basic financial statements.
Page
|19
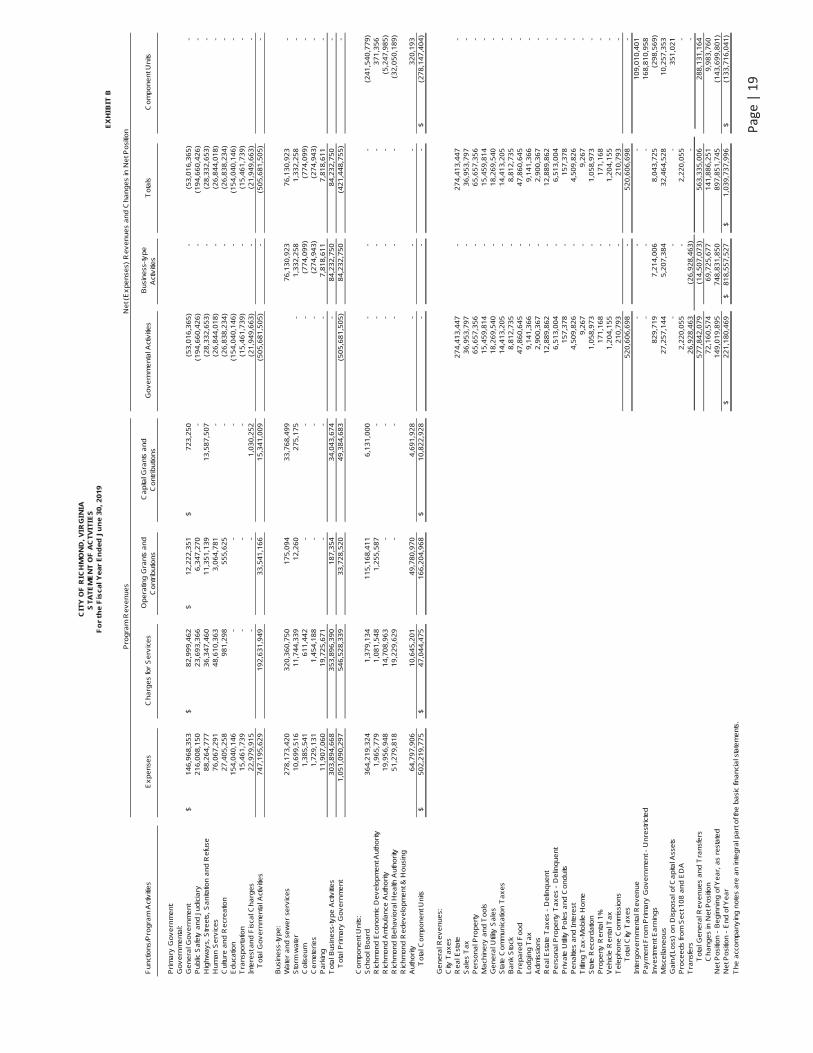
EX
HIB
IT B
Fu
nct
ion
s/P
rog
ram
Act
iviti
es
Ex
pe
nse
s C
ha
rge
s fo
r S
erv
ice
s O
pe
ratin
g G
ran
ts a
nd
C
on
trib
utio
ns
Ca
pita
l Gra
nts
an
d
Co
ntr
ibu
tion
s G
ov
ern
me
nta
l Act
iviti
es
Bu
sin
ess
-ty
pe
A
ctiv
itie
s T
ota
ls C
om
po
ne
nt U
nits
Pri
ma
ry G
ov
ern
me
nt:
Go
ve
rnm
en
tal:
Ge
ne
ral G
ov
ern
me
nt
14
6,9
68
,35
3$
8
2,9
99
,46
2$
12
,22
2,3
51
$
72
3,2
50
$
(5
3,0
16
,36
5)
-(5
3,0
16
,36
5)
-P
ub
lic S
afe
ty a
nd
Ju
dic
iary
21
6,0
08
,15
0
2
3,6
93
,36
6
6
,347
,27
0
-
(19
4,6
60
,42
6)
-(1
94
,66
0,4
26
)-
Hig
hw
ay
s, S
tre
ets
, S
an
itatio
n a
nd
Re
fuse
88
,26
4,7
77
36
,34
7,4
60
11
,35
1,1
39
13
,58
7,5
07
(28
,33
2,6
53
)
-
(28
,33
2,6
53
)-
Hu
ma
n S
erv
ice
s7
6,0
67
,29
1
4
8,6
10
,36
3
3
,064
,78
1
-
(26
,84
4,0
18
)
-
(26
,84
4,0
18
)-
Cu
lture
an
d R
ecr
ea
tion
27
,40
5,2
58
98
1,2
98
55
5,6
25
-(2
6,8
38
,23
4)
-(2
6,8
38
,23
4)
-E
du
catio
n1
54
,04
0,1
46
--
-(1
54
,04
0,1
46
)
-
(15
4,0
40
,14
6)
-T
ran
spo
rta
tion
15
,46
1,7
39
--
-(1
5,4
61
,73
9)
-(1
5,4
61
,73
9)
-In
tere
st a
nd
Fis
cal C
ha
rge
s2
2,9
79
,91
5
-
-1
,03
0,2
52
(21
,94
9,6
63
)
-
(21
,94
9,6
63
)-
T
ota
l Go
ve
rnm
en
tal A
ctiv
itie
s7
47
,19
5,6
29
19
2,6
31
,94
9
3
3,5
41
,16
6
1
5,3
41
,00
9
(5
05
,68
1,5
05
)
-
(50
5,6
81
,50
5)
-
Bu
sin
ess
-ty
pe
:W
ate
r a
nd
se
we
r se
rvic
es
27
8,1
73
,42
0
3
20
,36
0,7
50
17
5,0
94
33
,76
8,4
99
76
,13
0,9
23
76
,13
0,9
23
-S
torm
wa
ter
10
,69
9,5
16
11
,74
4,3
39
12
,26
0
2
75
,17
5
-
1,3
32
,25
81
,33
2,2
58
-C
olis
eu
m1
,38
5,5
41
61
1,4
42
--
-(7
74
,09
9)
(77
4,0
99
)
-
Ce
me
teri
es
1,7
29
,13
1
1
,45
4,1
88
--
-(2
74
,94
3)
(27
4,9
43
)
-
Pa
rkin
g1
1,9
07
,06
0
1
9,7
25
,67
1
-
--
7,8
18
,61
1
7
,81
8,6
11
-T
ota
l Bu
sin
ess
-ty
pe
Act
iviti
es
30
3,8
94
,66
8
3
53
,89
6,3
90
18
7,3
54
34
,04
3,6
74
-8
4,2
32
,75
08
4,2
32
,75
0
-
T
ota
l Pri
ma
ry G
ov
ern
me
nt
1,0
51
,09
0,2
97
54
6,5
28
,33
9
3
3,7
28
,52
0
4
9,3
84
,68
3
(5
05
,68
1,5
05
)
8
4,2
32
,75
0
(4
21
,44
8,7
55
)
-
Co
mp
on
en
t Un
its:
Sch
oo
l Bo
ard
36
4,2
19
,32
4
1
,37
9,1
34
11
5,1
68
,41
1
6
,13
1,0
00
--
-(2
41
,54
0,7
79
)
R
ich
mo
nd
Eco
no
mic
De
ve
lop
me
nt A
uth
ori
ty1
,96
5,7
79
1,0
81
,54
8
1
,255
,58
7
-
--
-3
71
,35
6
R
ich
mo
nd
Am
bu
lan
ce A
uth
ori
ty1
9,9
56
,94
8
1
4,7
08
,96
3
-
--
--
(5,2
47
,98
5)
Ric
hm
on
d B
eh
av
iora
l He
alth
Au
tho
rity
51
,27
9,8
18
19
,22
9,6
29
--
--
-(3
2,0
50
,18
9)
Ric
hm
on
d R
ed
ev
elo
pm
en
t & H
ou
sin
g
Au
tho
rity
64
,79
7,9
06
10
,64
5,2
01
49
,78
0,9
70
4,6
91
,92
8
-
--
32
0,1
93
T
ota
l Co
mp
on
en
t Un
its5
02
,21
9,7
75
$
47
,04
4,4
75
$
1
66
,20
4,9
68
10
,82
2,9
28
$
--
-(2
78
,14
7,4
04
)$
Ge
ne
ral R
ev
en
ue
s:C
ity T
ax
es
Re
al E
sta
te2
74
,41
3,4
47
-2
74
,41
3,4
47
-S
ale
s T
ax
36
,95
3,7
97
-3
6,9
53
,79
7
-
Pe
rso
na
l Pro
pe
rty
65
,65
7,3
56
-6
5,6
57
,35
6
-
Ma
chin
ery
an
d T
oo
ls1
5,4
59
,81
4
-
15
,45
9,8
14
-G
en
era
l Util
ity S
ale
s1
8,2
69
,54
0
-
18
,26
9,5
40
-S
tate
Co
mm
un
ica
tion
Ta
xe
s1
4,4
13
,20
5
-
14
,41
3,2
05
-B
an
k S
tock
8,8
12
,73
5
-
8,8
12
,73
5
-
Pre
pa
red
Fo
od
47
,86
0,6
45
-4
7,8
60
,64
5
-
Lo
dg
ing
Ta
x9
,14
1,3
66
-9
,14
1,3
66
-A
dm
issi
on
s2
,90
0,3
67
-2
,90
0,3
67
-R
ea
l Est
ate
Ta
xe
s -
De
linq
ue
nt
12
,88
9,8
62
-1
2,8
89
,86
2
-
Pe
rso
na
l Pro
pe
rty
Ta
xe
s -
De
linq
ue
nt
6,5
13
,00
4
-
6,5
13
,00
4
-
Pri
va
te U
tility
Po
les
an
d C
on
du
its1
57
,37
8
-
15
7,3
78
-P
en
alti
es
an
d I
nte
rest
4,5
09
,82
6
-
4,5
09
,82
6
-
Titl
ing
Ta
x-M
ob
ile H
om
e9
,26
7
-
9,2
67
-S
tate
Re
cord
atio
n1
,05
8,9
73
-1
,05
8,9
73
-P
rop
ert
y R
en
tal 1
%1
71
,16
8
-
17
1,1
68
-V
eh
icle
Re
nta
l Ta
x1
,20
4,1
55
-1
,20
4,1
55
-T
ele
ph
on
e C
om
mis
sio
ns
21
0,7
93
-2
10
,79
3
-
T
ota
l City
Ta
xe
s5
20
,60
6,6
98
-5
20
,60
6,6
98
-In
terg
ov
ern
me
nta
l Re
ve
nu
e-
--
10
9,0
10
,40
1
P
ay
me
nt F
rom
Pri
ma
ry G
ov
ern
me
nt -
Un
rest
rict
ed
--
-1
68
,81
0,9
58
Inv
est
me
nt E
arn
ing
s8
29
,71
9
7
,21
4,0
06
8,0
43
,72
5
(2
98
,56
9)
Mis
cella
ne
ou
s2
7,2
57
,14
4
5
,20
7,3
84
32
,46
4,5
28
10
,25
7,3
53
Ga
in/(
Lo
ss)
on
Dis
po
sal o
f Ca
pita
l Ass
ets
--
-3
51
,02
1
P
roce
ed
s fr
om
Se
ct 1
08
an
d E
DA
2,2
20
,05
5
-
2,2
20
,05
5
-
Tra
nsf
ers
26
,92
8,4
63
(26
,92
8,4
63
)
-
- T
ota
l Ge
ne
ral R
ev
en
ue
s a
nd
Tra
nsf
ers
57
7,8
42
,07
9
(1
4,5
07
,07
3)
56
3,3
35
,00
6
28
8,1
31
,16
4
C
ha
ng
es
in N
et P
osi
tion
72
,16
0,5
74
69
,72
5,6
77
14
1,8
86
,25
1
9,9
83
,76
0
N
et P
osi
tion
- B
eg
inn
ing
of Y
ea
r, a
s re
sta
ted
14
9,0
19
,89
5
7
48
,83
1,8
50
89
7,8
51
,74
5
(14
3,6
99
,80
1)
Ne
t Po
sitio
n -
En
d o
f Ye
ar
22
1,1
80
,46
9$
81
8,5
57
,52
7$
1
,03
9,7
37
,99
6$
(13
3,7
16
,04
1)
$
Th
e a
cco
mp
an
yin
g n
ote
s a
re a
n in
teg
ral p
art
of t
he
ba
sic
fina
nci
al s
tate
me
nts
.
CIT
Y O
F R
ICH
MO
ND
, V
IRG
INIA
ST
AT
EM
EN
T O
F A
CT
VIT
IES
Fo
r th
e F
isc
al
Ye
ar
En
de
d J
un
e 3
0,
20
19
Pro
gra
m R
ev
en
ue
s N
et (
Ex
pe
nse
s) R
ev
en
ue
s a
nd
Ch
an
ge
s in
Ne
t Po
sitio
n
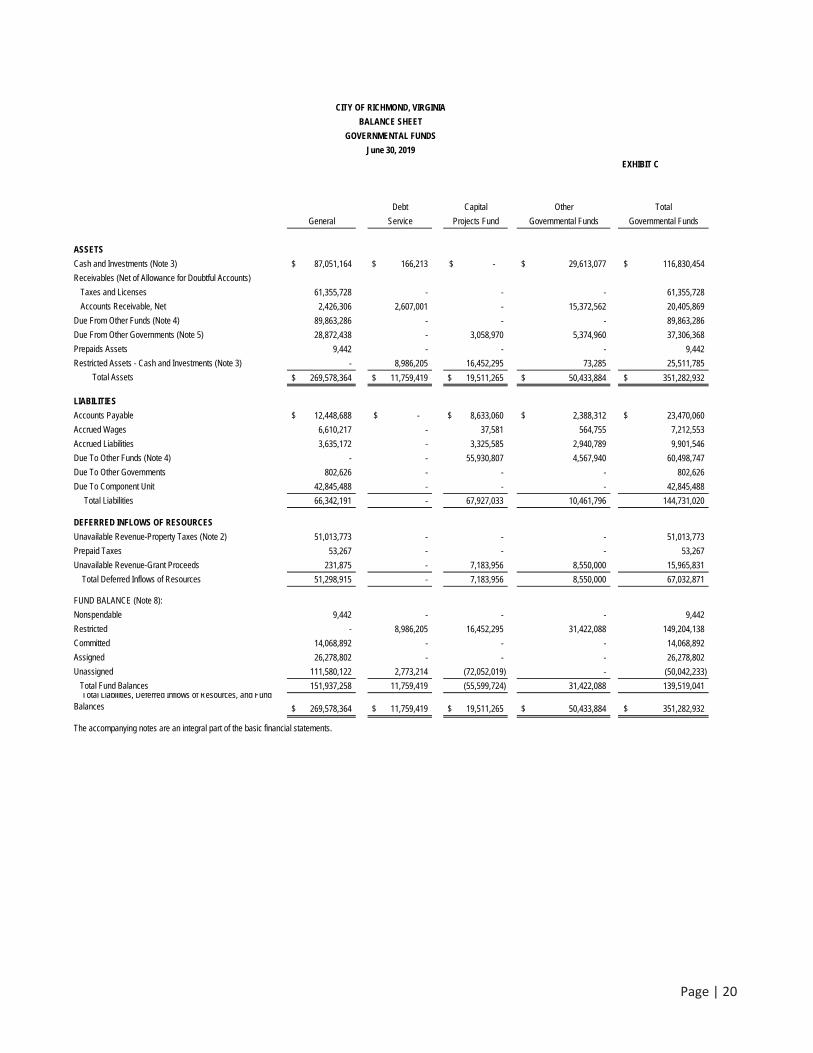
EXHIBIT C
Debt Capital Other Total
General Service Projects Fund Governmental Funds Governmental Funds
ASSETS
Cash and Investments (Note 3) 87,051,164$ 166,213$ -$ 29,613,077$ 116,830,454$
Receivables (Net of Allowance for Doubtful Accounts)
Taxes and Licenses 61,355,728 - - - 61,355,728
Accounts Receivable, Net 2,426,306 2,607,001 - 15,372,562 20,405,869
Due From Other Funds (Note 4) 89,863,286 - - - 89,863,286
Due From Other Governments (Note 5) 28,872,438 - 3,058,970 5,374,960 37,306,368
Prepaids Assets 9,442 - - - 9,442
Restricted Assets - Cash and Investments (Note 3) - 8,986,205 16,452,295 73,285 25,511,785
Total Assets 269,578,364$ 11,759,419$ 19,511,265$ 50,433,884$ 351,282,932$
LIABILITIES
Accounts Payable 12,448,688$ -$ 8,633,060$ 2,388,312$ 23,470,060$
Accrued Wages 6,610,217 - 37,581 564,755 7,212,553
Accrued Liabilities 3,635,172 - 3,325,585 2,940,789 9,901,546
Due To Other Funds (Note 4) - - 55,930,807 4,567,940 60,498,747
Due To Other Governments 802,626 - - - 802,626
Due To Component Unit 42,845,488 - - - 42,845,488
Total Liabilities 66,342,191 - 67,927,033 10,461,796 144,731,020
DEFERRED INFLOWS OF RESOURCES
Unavailable Revenue-Property Taxes (Note 2) 51,013,773 - - - 51,013,773
Prepaid Taxes 53,267 - - - 53,267
Unavailable Revenue-Grant Proceeds 231,875 - 7,183,956 8,550,000 15,965,831
Total Deferred Inflows of Resources 51,298,915 - 7,183,956 8,550,000 67,032,871
FUND BALANCE (Note 8):
Nonspendable 9,442 - - - 9,442
Restricted - 8,986,205 16,452,295 31,422,088 149,204,138
Committed 14,068,892 - - - 14,068,892
Assigned 26,278,802 - - - 26,278,802
Unassigned 111,580,122 2,773,214 (72,052,019) - (50,042,233)
Total Fund Balances 151,937,258 11,759,419 (55,599,724) 31,422,088 139,519,041 Total Liabilities, Deferred Inflows of Resources, and Fund Balances 269,578,364$ 11,759,419$ 19,511,265$ 50,433,884$ 351,282,932$
The accompanying notes are an integral part of the basic financial statements.
CITY OF RICHMOND, VIRGINIA
BALANCE SHEET
GOVERNMENTAL FUNDS
June 30, 2019
Page | 20
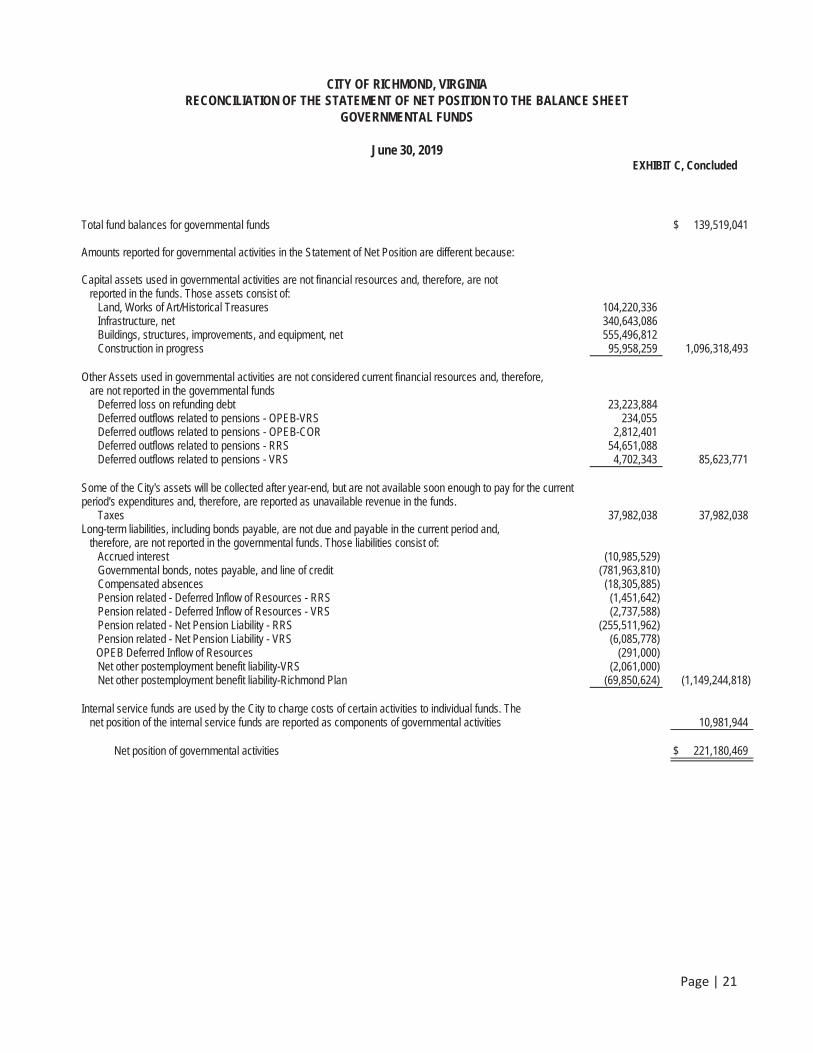
Page | 21
CITY OF RICHMOND, VIRGINIA RECONCILIATION OF THE STATEMENT OF NET POSITION TO THE BALANCE SHEET
GOVERNMENTAL FUNDS
June 30, 2019 EXHIBIT C, Concluded
Total fund balances for governmental funds $ 139,519,041
Amounts reported for governmental activities in the Statement of Net Position are different because:
Capital assets used in governmental activities are not financial resources and, therefore, are not reported in the funds. Those assets consist of: Land, Works of Art/Historical Treasures 104,220,336 Infrastructure, net 340,643,086 Buildings, structures, improvements, and equipment, net 555,496,812 Construction in progress 95,958,259 1,096,318,493
Other Assets used in governmental activities are not considered current financial resources and, therefore, are not reported in the governmental funds Deferred loss on refunding debt 23,223,884 Deferred outflows related to pensions - OPEB-VRS 234,055 Deferred outflows related to pensions - OPEB-COR 2,812,401 Deferred outflows related to pensions - RRS 54,651,088 Deferred outflows related to pensions - VRS 4,702,343 85,623,771
Some of the City's assets will be collected after year-end, but are not available soon enough to pay for the current period's expenditures and, therefore, are reported as unavailable revenue in the funds. Taxes 37,982,038 37,982,038 Long-term liabilities, including bonds payable, are not due and payable in the current period and, therefore, are not reported in the governmental funds. Those liabilities consist of:
Accrued interest (10,985,529) Governmental bonds, notes payable, and line of credit (781,963,810) Compensated absences (18,305,885) Pension related - Deferred Inflow of Resources - RRS (1,451,642) Pension related - Deferred Inflow of Resources - VRS (2,737,588) Pension related - Net Pension Liability - RRS (255,511,962) Pension related - Net Pension Liability - VRS (6,085,778)
OPEB Deferred Inflow of Resources (291,000) Net other postemployment benefit liability-VRS (2,061,000) Net other postemployment benefit liability-Richmond Plan (69,850,624) (1,149,244,818)
Internal service funds are used by the City to charge costs of certain activities to individual funds. The net position of the internal service funds are reported as components of governmental activities 10,981,944
Net position of governmental activities $ 221,180,469
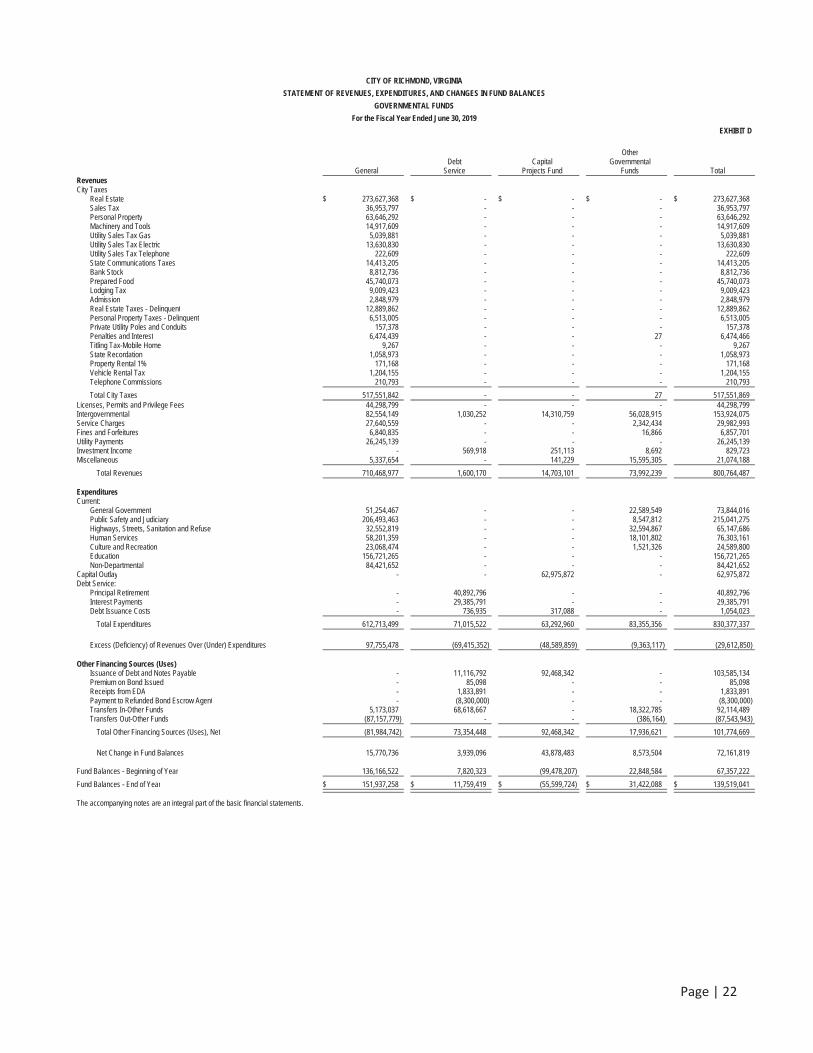
Page | 22
CITY OF RICHMOND, VIRGINIA
STATEMENT OF REVENUES, EXPENDITURES, AND CHANGES IN FUND BALANCES
GOVERNMENTAL FUNDS
For the Fiscal Year Ended June 30, 2019
EXHIBIT D
General Debt
ServiceCapital
Projects Fund
OtherGovernmental
Funds TotalRevenues City Taxes
Real Estate $ 273,627,368 $ - $ - $ - $ 273,627,368 Sales Tax 36,953,797 - - - 36,953,797Personal Property 63,646,292 - - - 63,646,292Machinery and Tools 14,917,609 - - - 14,917,609 Utility Sales Tax Gas 5,039,881 - - - 5,039,881 Utility Sales Tax Electric 13,630,830 - - - 13,630,830 Utility Sales Tax Telephone 222,609 - - - 222,609State Communications Taxes 14,413,205 - - - 14,413,205 Bank Stock 8,812,736 - - - 8,812,736Prepared Food 45,740,073 - - - 45,740,073 Lodging Tax 9,009,423 - - - 9,009,423Admission 2,848,979 - - - 2,848,979Real Estate Taxes - Delinquent 12,889,862 - - - 12,889,862Personal Property Taxes - Delinquent 6,513,005 - - - 6,513,005Private Utility Poles and Conduits 157,378 - - - 157,378 Penalties and Interest 6,474,439 - - 27 6,474,466Titling Tax-Mobile Home 9,267 - - - 9,267 State Recordation 1,058,973 - - - 1,058,973 Property Rental 1% 171,168 - - - 171,168 Vehicle Rental Tax 1,204,155 - - - 1,204,155Telephone Commissions 210,793 - - - 210,793
Total City Taxes 517,551,842 - - 27 517,551,869 Licenses, Permits and Privilege Fees 44,298,799 - - - 44,298,799 Intergovernmental 82,554,149 1,030,252 14,310,759 56,028,915 153,924,075Service Charges 27,640,559 - - 2,342,434 29,982,993 Fines and Forfeitures 6,840,835 - - 16,866 6,857,701 Utility Payments 26,245,139 - - - 26,245,139 Investment Income - 569,918 251,113 8,692 829,723Miscellaneous 5,337,654 - 141,229 15,595,305 21,074,188
Total Revenues 710,468,977 1,600,170 14,703,101 73,992,239 800,764,487
Expenditures Current:
General Government 51,254,467 - - 22,589,549 73,844,016Public Safety and Judiciary 206,493,463 - - 8,547,812 215,041,275 Highways, Streets, Sanitation and Refuse 32,552,819 - - 32,594,867 65,147,686 Human Services 58,201,359 - - 18,101,802 76,303,161 Culture and Recreation 23,068,474 - - 1,521,326 24,589,800 Education 156,721,265 - - - 156,721,265Non-Departmental 84,421,652 - - - 84,421,652
Capital Outlay - - 62,975,872 - 62,975,872Debt Service:
Principal Retirement - 40,892,796 - - 40,892,796Interest Payments - 29,385,791 - - 29,385,791 Debt Issuance Costs - 736,935 317,088 - 1,054,023
Total Expenditures 612,713,499 71,015,522 63,292,960 83,355,356 830,377,337
Excess (Deficiency) of Revenues Over (Under) Expenditures 97,755,478 (69,415,352) (48,589,859) (9,363,117) (29,612,850)
Other Financing Sources (Uses) Issuance of Debt and Notes Payable - 11,116,792 92,468,342 - 103,585,134 Premium on Bond Issued - 85,098 - - 85,098 Receipts from EDA - 1,833,891 - - 1,833,891Payment to Refunded Bond Escrow Agent - (8,300,000) - - (8,300,000)Transfers In-Other Funds 5,173,037 68,618,667 - 18,322,785 92,114,489 Transfers Out-Other Funds (87,157,779) - - (386,164) (87,543,943)
Total Other Financing Sources (Uses), Net (81,984,742) 73,354,448 92,468,342 17,936,621 101,774,669
Net Change in Fund Balances 15,770,736 3,939,096 43,878,483 8,573,504 72,161,819
Fund Balances - Beginning of Year 136,166,522 7,820,323 (99,478,207) 22,848,584 67,357,222
Fund Balances - End of Year $ 151,937,258 $ 11,759,419 $ (55,599,724) $ 31,422,088 $ 139,519,041
The accompanying notes are an integral part of the basic financial statements.
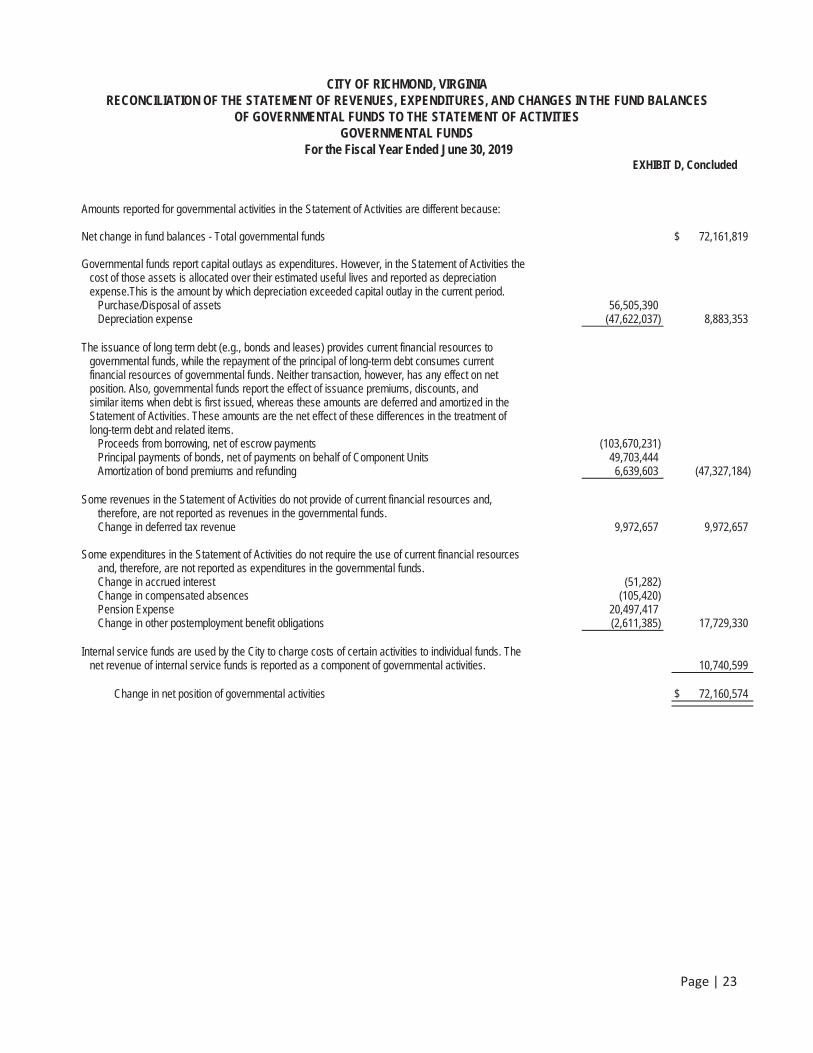
Page | 23
CITY OF RICHMOND, VIRGINIA RECONCILIATION OF THE STATEMENT OF REVENUES, EXPENDITURES, AND CHANGES IN THE FUND BALANCES
OF GOVERNMENTAL FUNDS TO THE STATEMENT OF ACTIVITIES GOVERNMENTAL FUNDS
For the Fiscal Year Ended June 30, 2019 EXHIBIT D, Concluded
Amounts reported for governmental activities in the Statement of Activities are different because:
Net change in fund balances - Total governmental funds $ 72,161,819
Governmental funds report capital outlays as expenditures. However, in the Statement of Activities the cost of those assets is allocated over their estimated useful lives and reported as depreciation expense.This is the amount by which depreciation exceeded capital outlay in the current period. Purchase/Disposal of assets 56,505,390 Depreciation expense (47,622,037) 8,883,353
The issuance of long term debt (e.g., bonds and leases) provides current financial resources to governmental funds, while the repayment of the principal of long-term debt consumes current financial resources of governmental funds. Neither transaction, however, has any effect on net position. Also, governmental funds report the effect of issuance premiums, discounts, and similar items when debt is first issued, whereas these amounts are deferred and amortized in the Statement of Activities. These amounts are the net effect of these differences in the treatment of long-term debt and related items. Proceeds from borrowing, net of escrow payments (103,670,231) Principal payments of bonds, net of payments on behalf of Component Units 49,703,444
Amortization of bond premiums and refunding 6,639,603 (47,327,184)
Some revenues in the Statement of Activities do not provide of current financial resources and, therefore, are not reported as revenues in the governmental funds. Change in deferred tax revenue 9,972,657 9,972,657
Some expenditures in the Statement of Activities do not require the use of current financial resources and, therefore, are not reported as expenditures in the governmental funds. Change in accrued interest (51,282) Change in compensated absences (105,420) Pension Expense 20,497,417 Change in other postemployment benefit obligations (2,611,385) 17,729,330
Internal service funds are used by the City to charge costs of certain activities to individual funds. The net revenue of internal service funds is reported as a component of governmental activities. 10,740,599
Change in net position of governmental activities $ 72,160,574
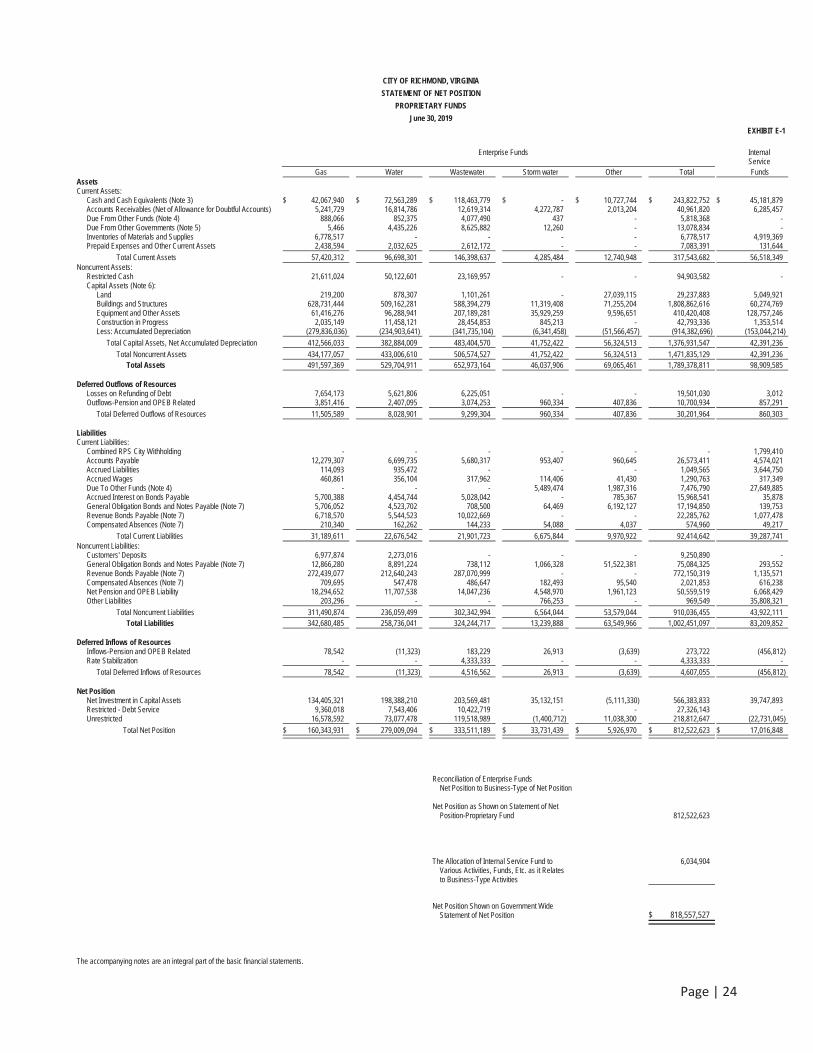
Page | 24
CITY OF RICHMOND, VIRGINIA
STATEMENT OF NET POSITION
PROPRIETARY FUNDS
June 30, 2019
EXHIBIT E-1
Enterprise Funds Internal Service
Gas Water Wastewater Storm water Other Total Funds Assets Current Assets:
Cash and Cash Equivalents (Note 3) $ 42,067,940 $ 72,563,289 $ 118,463,779 $ - $ 10,727,744 $ 243,822,752 $ 45,181,879 Accounts Receivables (Net of Allowance for Doubtful Accounts) 5,241,729 16,814,786 12,619,314 4,272,787 2,013,204 40,961,820 6,285,457Due From Other Funds (Note 4) 888,066 852,375 4,077,490 437 - 5,818,368 -Due From Other Governments (Note 5) 5,466 4,435,226 8,625,882 12,260 - 13,078,834 -Inventories of Materials and Supplies 6,778,517 - - - - 6,778,517 4,919,369Prepaid Expenses and Other Current Assets 2,438,594 2,032,625 2,612,172 - - 7,083,391 131,644
Total Current Assets 57,420,312 96,698,301 146,398,637 4,285,484 12,740,948 317,543,682 56,518,349Noncurrent Assets:
Restricted Cash 21,611,024 50,122,601 23,169,957 - - 94,903,582 -Capital Assets (Note 6):
Land 219,200 878,307 1,101,261 - 27,039,115 29,237,883 5,049,921Buildings and Structures 628,731,444 509,162,281 588,394,279 11,319,408 71,255,204 1,808,862,616 60,274,769Equipment and Other Assets 61,416,276 96,288,941 207,189,281 35,929,259 9,596,651 410,420,408 128,757,246Construction in Progress 2,035,149 11,458,121 28,454,853 845,213 - 42,793,336 1,353,514Less: Accumulated Depreciation (279,836,036) (234,903,641) (341,735,104) (6,341,458) (51,566,457) (914,382,696) (153,044,214)
Total Capital Assets, Net Accumulated Depreciation 412,566,033 382,884,009 483,404,570 41,752,422 56,324,513 1,376,931,547 42,391,236
Total Noncurrent Assets 434,177,057 433,006,610 506,574,527 41,752,422 56,324,513 1,471,835,129 42,391,236Total Assets 491,597,369 529,704,911 652,973,164 46,037,906 69,065,461 1,789,378,811 98,909,585
Deferred Outflows of Resources Losses on Refunding of Debt 7,654,173 5,621,806 6,225,051 - - 19,501,030 3,012Outflows-Pension and OPEB Related 3,851,416 2,407,095 3,074,253 960,334 407,836 10,700,934 857,291
Total Deferred Outflows of Resources 11,505,589 8,028,901 9,299,304 960,334 407,836 30,201,964 860,303
Liabilities Current Liabilities:
Combined RPS City Withholding - - - - - - 1,799,410Accounts Payable 12,279,307 6,699,735 5,680,317 953,407 960,645 26,573,411 4,574,021Accrued Liabilities 114,093 935,472 - - - 1,049,565 3,644,750Accrued Wages 460,861 356,104 317,962 114,406 41,430 1,290,763 317,349Due To Other Funds (Note 4) - - - 5,489,474 1,987,316 7,476,790 27,649,885Accrued Interest on Bonds Payable 5,700,388 4,454,744 5,028,042 - 785,367 15,968,541 35,878General Obligation Bonds and Notes Payable (Note 7) 5,706,052 4,523,702 708,500 64,469 6,192,127 17,194,850 139,753Revenue Bonds Payable (Note 7) 6,718,570 5,544,523 10,022,669 - - 22,285,762 1,077,478Compensated Absences (Note 7) 210,340 162,262 144,233 54,088 4,037 574,960 49,217
Total Current Liabilities 31,189,611 22,676,542 21,901,723 6,675,844 9,970,922 92,414,642 39,287,741Noncurrent Liabilities:
Customers' Deposits 6,977,874 2,273,016 - - - 9,250,890 -General Obligation Bonds and Notes Payable (Note 7) 12,866,280 8,891,224 738,112 1,066,328 51,522,381 75,084,325 293,552Revenue Bonds Payable (Note 7) 272,439,077 212,640,243 287,070,999 - - 772,150,319 1,135,571Compensated Absences (Note 7) 709,695 547,478 486,647 182,493 95,540 2,021,853 616,238Net Pension and OPEB Liability 18,294,652 11,707,538 14,047,236 4,548,970 1,961,123 50,559,519 6,068,429Other Liabilities 203,296 - - 766,253 - 969,549 35,808,321
Total Noncurrent Liabilities 311,490,874 236,059,499 302,342,994 6,564,044 53,579,044 910,036,455 43,922,111Total Liabilities 342,680,485 258,736,041 324,244,717 13,239,888 63,549,966 1,002,451,097 83,209,852
Deferred Inflows of Resources Inflows-Pension and OPEB Related 78,542 (11,323) 183,229 26,913 (3,639) 273,722 (456,812)Rate Stabilization - - 4,333,333 - - 4,333,333 -
Total Deferred Inflows of Resources 78,542 (11,323) 4,516,562 26,913 (3,639) 4,607,055 (456,812)
Net Position Net Investment in Capital Assets 134,405,321 198,388,210 203,569,481 35,132,151 (5,111,330) 566,383,833 39,747,893Restricted - Debt Service 9,360,018 7,543,406 10,422,719 - - 27,326,143 -Unrestricted 16,578,592 73,077,478 119,518,989 (1,400,712) 11,038,300 218,812,647 (22,731,045)
Total Net Position $ 160,343,931 $ 279,009,094 $ 333,511,189 $ 33,731,439 $ 5,926,970 $ 812,522,623 $ 17,016,848
Reconciliation of Enterprise Funds Net Position to Business-Type of Net Position
Net Position as Shown on Statement of Net Position-Proprietary Fund 812,522,623
The Allocation of Internal Service Fund to Various Activities, Funds, Etc. as it Relates to Business-Type Activities
6,034,904
Net Position Shown on Government Wide Statement of Net Position $ 818,557,527
The accompanying notes are an integral part of the basic financial statements.
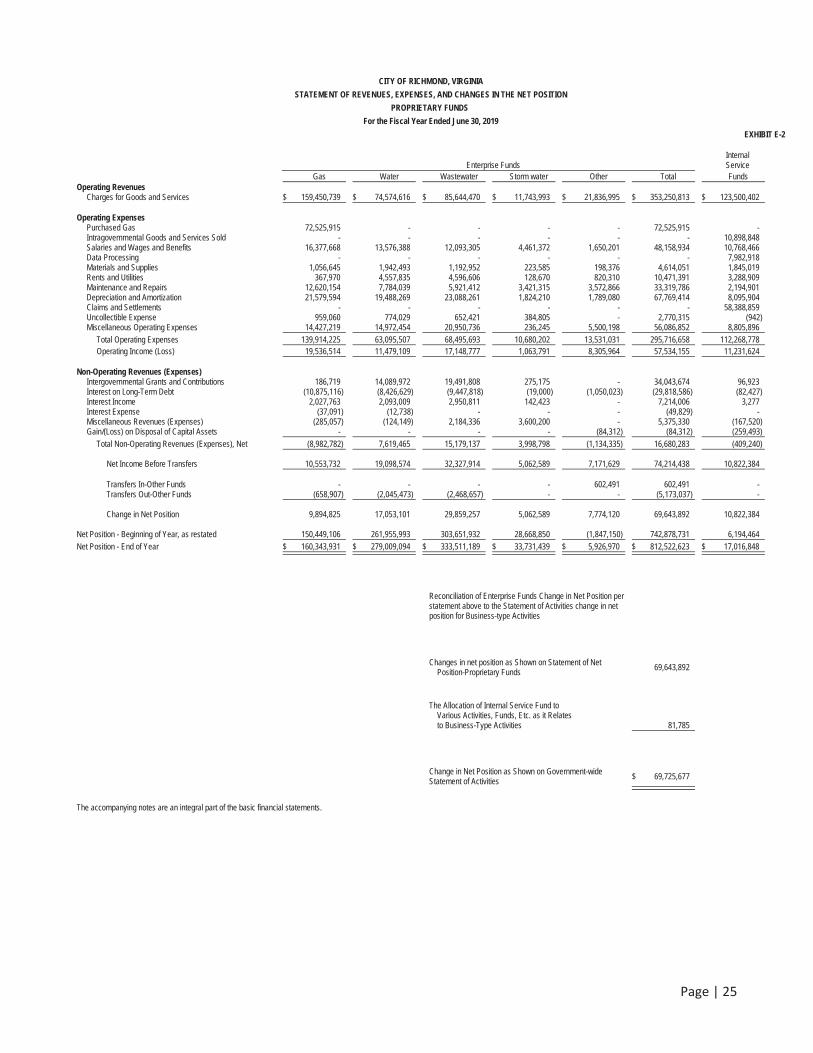
Page | 25
CITY OF RICHMOND, VIRGINIA
STATEMENT OF REVENUES, EXPENSES, AND CHANGES IN THE NET POSITION
PROPRIETARY FUNDS
For the Fiscal Year Ended June 30, 2019
EXHIBIT E-2
Enterprise Funds Internal Service
Gas Water Wastewater Storm water Other Total Funds Operating Revenues
Charges for Goods and Services $ 159,450,739 $ 74,574,616 $ 85,644,470 $ 11,743,993 $ 21,836,995 $ 353,250,813 $ 123,500,402
Operating Expenses Purchased Gas 72,525,915 - - - - 72,525,915 -Intragovernmental Goods and Services Sold - - - - - - 10,898,848Salaries and Wages and Benefits 16,377,668 13,576,388 12,093,305 4,461,372 1,650,201 48,158,934 10,768,466 Data Processing - - - - - - 7,982,918Materials and Supplies 1,056,645 1,942,493 1,192,952 223,585 198,376 4,614,051 1,845,019Rents and Utilities 367,970 4,557,835 4,596,606 128,670 820,310 10,471,391 3,288,909Maintenance and Repairs 12,620,154 7,784,039 5,921,412 3,421,315 3,572,866 33,319,786 2,194,901Depreciation and Amortization 21,579,594 19,488,269 23,088,261 1,824,210 1,789,080 67,769,414 8,095,904Claims and Settlements - - - - - - 58,388,859Uncollectible Expense 959,060 774,029 652,421 384,805 - 2,770,315 (942)Miscellaneous Operating Expenses 14,427,219 14,972,454 20,950,736 236,245 5,500,198 56,086,852 8,805,896
Total Operating Expenses 139,914,225 63,095,507 68,495,693 10,680,202 13,531,031 295,716,658 112,268,778Operating Income (Loss) 19,536,514 11,479,109 17,148,777 1,063,791 8,305,964 57,534,155 11,231,624
Non-Operating Revenues (Expenses) Intergovernmental Grants and Contributions 186,719 14,089,972 19,491,808 275,175 - 34,043,674 96,923 Interest on Long-Term Debt (10,875,116) (8,426,629) (9,447,818) (19,000) (1,050,023) (29,818,586) (82,427) Interest Income 2,027,763 2,093,009 2,950,811 142,423 - 7,214,006 3,277Interest Expense (37,091) (12,738) - - - (49,829) -Miscellaneous Revenues (Expenses) (285,057) (124,149) 2,184,336 3,600,200 - 5,375,330 (167,520) Gain/(Loss) on Disposal of Capital Assets - - - - (84,312) (84,312) (259,493)
Total Non-Operating Revenues (Expenses), Net (8,982,782) 7,619,465 15,179,137 3,998,798 (1,134,335) 16,680,283 (409,240)
Net Income Before Transfers 10,553,732 19,098,574 32,327,914 5,062,589 7,171,629 74,214,438 10,822,384
Transfers In-Other Funds - - - - 602,491 602,491 -Transfers Out-Other Funds (658,907) (2,045,473) (2,468,657) - - (5,173,037) -
Change in Net Position 9,894,825 17,053,101 29,859,257 5,062,589 7,774,120 69,643,892 10,822,384
Net Position - Beginning of Year, as restated 150,449,106 261,955,993 303,651,932 28,668,850 (1,847,150) 742,878,731 6,194,464 Net Position - End of Year $ 160,343,931 $ 279,009,094 $ 333,511,189 $ 33,731,439 $ 5,926,970 $ 812,522,623 $ 17,016,848
Reconciliation of Enterprise Funds Change in Net Position per statement above to the Statement of Activities change in net position for Business-type Activities
Changes in net position as Shown on Statement of Net Position-Proprietary Funds
69,643,892
The Allocation of Internal Service Fund to Various Activities, Funds, Etc. as it Relates to Business-Type Activities 81,785
Change in Net Position as Shown on Government-wide Statement of Activities
$ 69,725,677
The accompanying notes are an integral part of the basic financial statements.
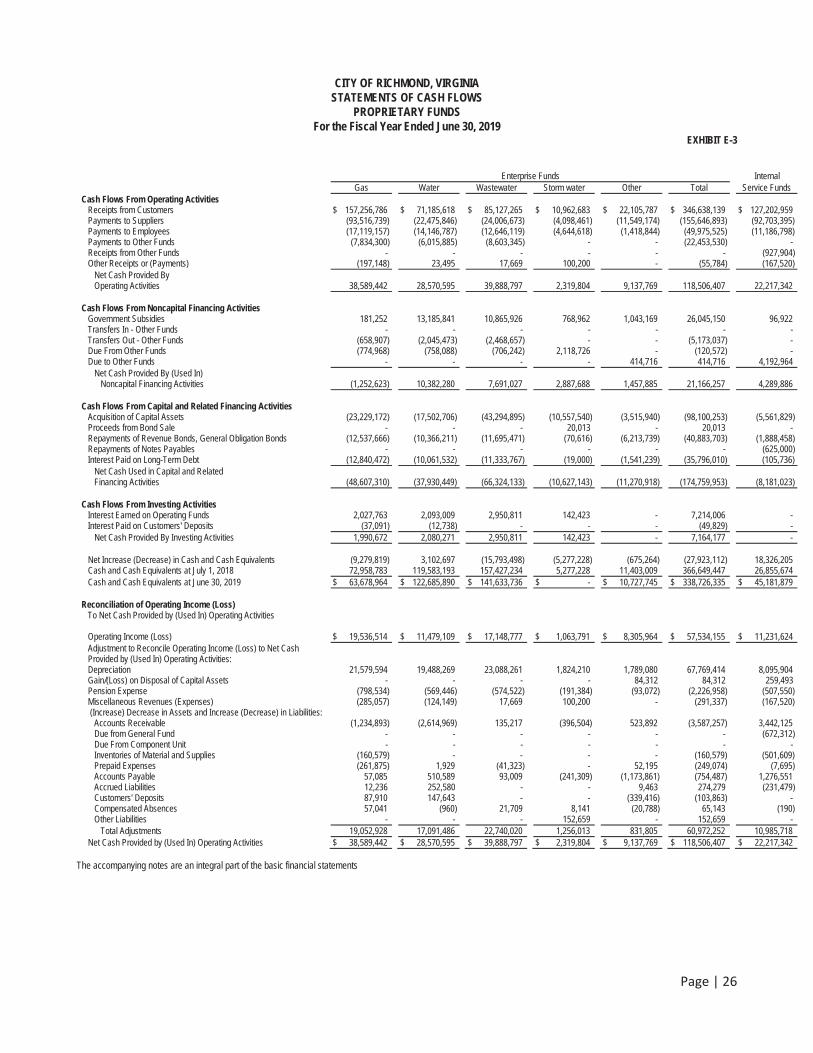
Page | 26
CITY OF RICHMOND, VIRGINIA STATEMENTS OF CASH FLOWS
PROPRIETARY FUNDS For the Fiscal Year Ended June 30, 2019
EXHIBIT E-3
Enterprise Funds Internal Gas Water Wastewater Storm water Other Total Service Funds
Cash Flows From Operating Activities Receipts from Customers $ 157,256,786 $ 71,185,618 $ 85,127,265 $ 10,962,683 $ 22,105,787 $ 346,638,139 $ 127,202,959 Payments to Suppliers (93,516,739) (22,475,846) (24,006,673) (4,098,461) (11,549,174) (155,646,893) (92,703,395) Payments to Employees (17,119,157) (14,146,787) (12,646,119) (4,644,618) (1,418,844) (49,975,525) (11,186,798) Payments to Other Funds (7,834,300) (6,015,885) (8,603,345) - - (22,453,530) - Receipts from Other Funds - - - - - - (927,904) Other Receipts or (Payments) (197,148) 23,495 17,669 100,200 - (55,784) (167,520)
Net Cash Provided By Operating Activities 38,589,442 28,570,595 39,888,797 2,319,804 9,137,769 118,506,407 22,217,342
Cash Flows From Noncapital Financing Activities Government Subsidies 181,252 13,185,841 10,865,926 768,962 1,043,169 26,045,150 96,922 Transfers In - Other Funds - - - - - - - Transfers Out - Other Funds (658,907) (2,045,473) (2,468,657) - - (5,173,037) - Due From Other Funds (774,968) (758,088) (706,242) 2,118,726 - (120,572) - Due to Other Funds - - - - 414,716 414,716 4,192,964
Net Cash Provided By (Used In) Noncapital Financing Activities (1,252,623) 10,382,280 7,691,027 2,887,688 1,457,885 21,166,257 4,289,886
Cash Flows From Capital and Related Financing Activities Acquisition of Capital Assets (23,229,172) (17,502,706) (43,294,895) (10,557,540) (3,515,940) (98,100,253) (5,561,829) Proceeds from Bond Sale - - - 20,013 - 20,013 - Repayments of Revenue Bonds, General Obligation Bonds (12,537,666) (10,366,211) (11,695,471) (70,616) (6,213,739) (40,883,703) (1,888,458) Repayments of Notes Payables - - - - - - (625,000) Interest Paid on Long-Term Debt (12,840,472) (10,061,532) (11,333,767) (19,000) (1,541,239) (35,796,010) (105,736)
Net Cash Used in Capital and Related Financing Activities (48,607,310) (37,930,449) (66,324,133) (10,627,143) (11,270,918) (174,759,953) (8,181,023)
Cash Flows From Investing Activities Interest Earned on Operating Funds 2,027,763 2,093,009 2,950,811 142,423 - 7,214,006 - Interest Paid on Customers' Deposits (37,091) (12,738) - - - (49,829) -
Net Cash Provided By Investing Activities 1,990,672 2,080,271 2,950,811 142,423 - 7,164,177 -
Net Increase (Decrease) in Cash and Cash Equivalents (9,279,819) 3,102,697 (15,793,498) (5,277,228) (675,264) (27,923,112) 18,326,205 Cash and Cash Equivalents at July 1, 2018 72,958,783 119,583,193 157,427,234 5,277,228 11,403,009 366,649,447 26,855,674 Cash and Cash Equivalents at June 30, 2019 $ 63,678,964 $ 122,685,890 $ 141,633,736 $ - $ 10,727,745 $ 338,726,335 $ 45,181,879
Reconciliation of Operating Income (Loss) To Net Cash Provided by (Used In) Operating Activities
Operating Income (Loss) $ 19,536,514 $ 11,479,109 $ 17,148,777 $ 1,063,791 $ 8,305,964 $ 57,534,155 $ 11,231,624 Adjustment to Reconcile Operating Income (Loss) to Net Cash Provided by (Used In) Operating Activities: Depreciation 21,579,594 19,488,269 23,088,261 1,824,210 1,789,080 67,769,414 8,095,904 Gain/(Loss) on Disposal of Capital Assets - - - - 84,312 84,312 259,493 Pension Expense (798,534) (569,446) (574,522) (191,384) (93,072) (2,226,958) (507,550) Miscellaneous Revenues (Expenses) (285,057) (124,149) 17,669 100,200 - (291,337) (167,520) (Increase) Decrease in Assets and Increase (Decrease) in Liabilities:
Accounts Receivable (1,234,893) (2,614,969) 135,217 (396,504) 523,892 (3,587,257) 3,442,125 Due from General Fund - - - - - - (672,312) Due From Component Unit - - - - - - - Inventories of Material and Supplies (160,579) - - - - (160,579) (501,609) Prepaid Expenses (261,875) 1,929 (41,323) - 52,195 (249,074) (7,695) Accounts Payable 57,085 510,589 93,009 (241,309) (1,173,861) (754,487) 1,276,551 Accrued Liabilities 12,236 252,580 - - 9,463 274,279 (231,479) Customers' Deposits 87,910 147,643 - - (339,416) (103,863) - Compensated Absences 57,041 (960) 21,709 8,141 (20,788) 65,143 (190) Other Liabilities - - - 152,659 - 152,659 -
Total Adjustments 19,052,928 17,091,486 22,740,020 1,256,013 831,805 60,972,252 10,985,718 Net Cash Provided by (Used In) Operating Activities $ 38,589,442 $ 28,570,595 $ 39,888,797 $ 2,319,804 $ 9,137,769 $ 118,506,407 $ 22,217,342
The accompanying notes are an integral part of the basic financial statements
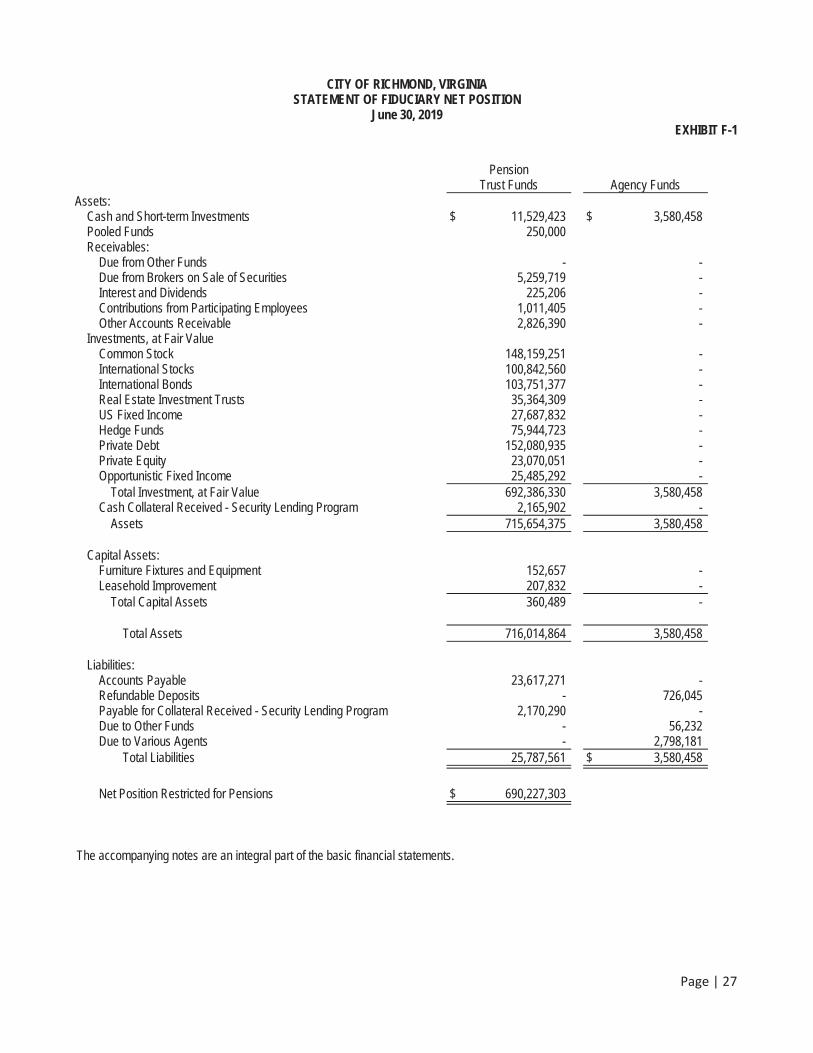
Page | 27
CITY OF RICHMOND, VIRGINIA STATEMENT OF FIDUCIARY NET POSITION
June 30, 2019 EXHIBIT F-1
PensionTrust Funds Agency Funds
Assets:Cash and Short-term Investments $ 11,529,423 $ 3,580,458 Pooled Funds 250,000Receivables:
Due from Other Funds - -Due from Brokers on Sale of Securities 5,259,719 - Interest and Dividends 225,206 - Contributions from Participating Employees 1,011,405 - Other Accounts Receivable 2,826,390 -
Investments, at Fair Value Common Stock 148,159,251 - International Stocks 100,842,560 - International Bonds 103,751,377 - Real Estate Investment Trusts 35,364,309 - US Fixed Income 27,687,832 - Hedge Funds 75,944,723 - Private Debt 152,080,935 - Private Equity 23,070,051 - Opportunistic Fixed Income 25,485,292 -
Total Investment, at Fair Value 692,386,330 3,580,458Cash Collateral Received - Security Lending Program 2,165,902 -
Assets 715,654,375 3,580,458
Capital Assets: Furniture Fixtures and Equipment 152,657 - Leasehold Improvement 207,832 -
Total Capital Assets 360,489 -
Total Assets 716,014,864 3,580,458
Liabilities: Accounts Payable 23,617,271 - Refundable Deposits - 726,045Payable for Collateral Received - Security Lending Program 2,170,290 - Due to Other Funds - 56,232Due to Various Agents - 2,798,181
Total Liabilities 25,787,561 $ 3,580,458
Net Position Restricted for Pensions $ 690,227,303
The accompanying notes are an integral part of the basic financial statements.
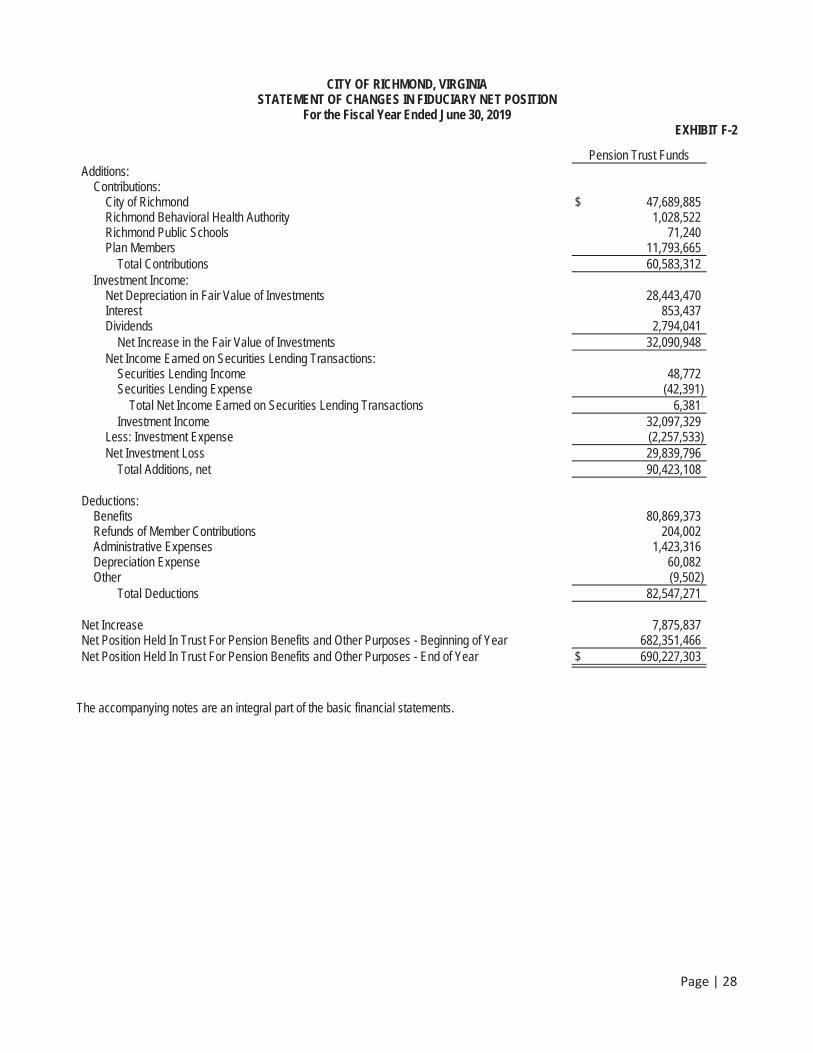
Page | 28
CITY OF RICHMOND, VIRGINIA STATEMENT OF CHANGES IN FIDUCIARY NET POSITION
For the Fiscal Year Ended June 30, 2019 EXHIBIT F-2
Pension Trust Funds Additions:
Contributions:City of Richmond $ 47,689,885 Richmond Behavioral Health Authority 1,028,522Richmond Public Schools 71,240Plan Members 11,793,665
Total Contributions 60,583,312Investment Income:
Net Depreciation in Fair Value of Investments 28,443,470Interest 853,437Dividends 2,794,041
Net Increase in the Fair Value of Investments 32,090,948Net Income Earned on Securities Lending Transactions:
Securities Lending Income 48,772Securities Lending Expense (42,391)
Total Net Income Earned on Securities Lending Transactions 6,381Investment Income 32,097,329
Less: Investment Expense (2,257,533)Net Investment Loss 29,839,796
Total Additions, net 90,423,108
Deductions: Benefits 80,869,373Refunds of Member Contributions 204,002 Administrative Expenses 1,423,316Depreciation Expense 60,082Other (9,502)
Total Deductions 82,547,271
Net Increase 7,875,837Net Position Held In Trust For Pension Benefits and Other Purposes - Beginning of Year 682,351,466 Net Position Held In Trust For Pension Benefits and Other Purposes - End of Year $ 690,227,303
The accompanying notes are an integral part of the basic financial statements.
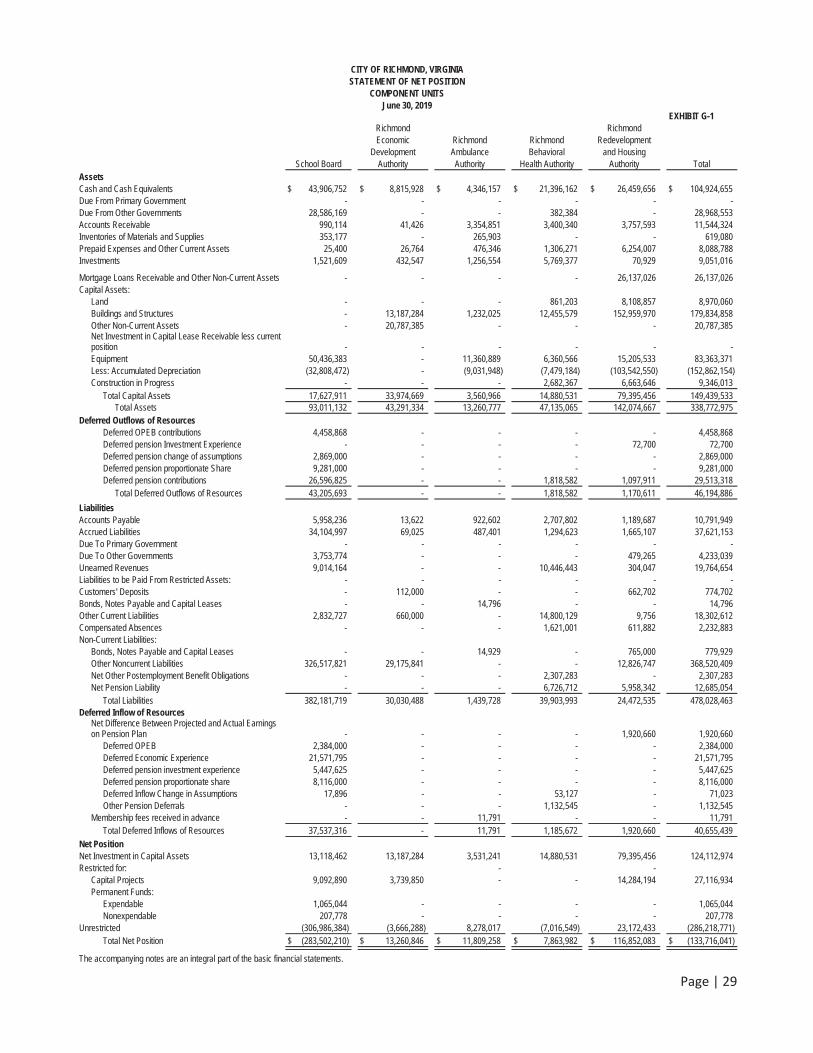
Page | 29
CITY OF RICHMOND, VIRGINIA STATEMENT OF NET POSITION
COMPONENT UNITS June 30, 2019
EXHIBIT G-1 Richmond Richmond Economic Richmond Richmond Redevelopment Development Ambulance Behavioral and Housing
School Board Authority Authority Health Authority Authority Total Assets Cash and Cash Equivalents $ 43,906,752 $ 8,815,928 $ 4,346,157 $ 21,396,162 $ 26,459,656 $ 104,924,655 Due From Primary Government - - - - - - Due From Other Governments 28,586,169 - - 382,384 - 28,968,553Accounts Receivable 990,114 41,426 3,354,851 3,400,340 3,757,593 11,544,324Inventories of Materials and Supplies 353,177 - 265,903 - - 619,080Prepaid Expenses and Other Current Assets 25,400 26,764 476,346 1,306,271 6,254,007 8,088,788Investments 1,521,609 432,547 1,256,554 5,769,377 70,929 9,051,016
Mortgage Loans Receivable and Other Non-Current Assets - - - - 26,137,026 26,137,026Capital Assets:
Land - - - 861,203 8,108,857 8,970,060Buildings and Structures - 13,187,284 1,232,025 12,455,579 152,959,970 179,834,858Other Non-Current Assets - 20,787,385 - - - 20,787,385Net Investment in Capital Lease Receivable less current position - - - - - - Equipment 50,436,383 - 11,360,889 6,360,566 15,205,533 83,363,371 Less: Accumulated Depreciation (32,808,472) - (9,031,948) (7,479,184) (103,542,550) (152,862,154) Construction in Progress - - - 2,682,367 6,663,646 9,346,013
Total Capital Assets 17,627,911 33,974,669 3,560,966 14,880,531 79,395,456 149,439,533 Total Assets 93,011,132 43,291,334 13,260,777 47,135,065 142,074,667 338,772,975
Deferred Outflows of Resources Deferred OPEB contributions 4,458,868 - - - - 4,458,868 Deferred pension Investment Experience - - - - 72,700 72,700 Deferred pension change of assumptions 2,869,000 - - - - 2,869,000 Deferred pension proportionate Share 9,281,000 - - - - 9,281,000 Deferred pension contributions 26,596,825 - - 1,818,582 1,097,911 29,513,318
Total Deferred Outflows of Resources 43,205,693 - - 1,818,582 1,170,611 46,194,886
Liabilities Accounts Payable 5,958,236 13,622 922,602 2,707,802 1,189,687 10,791,949 Accrued Liabilities 34,104,997 69,025 487,401 1,294,623 1,665,107 37,621,153 Due To Primary Government - - - - - - Due To Other Governments 3,753,774 - - - 479,265 4,233,039 Unearned Revenues 9,014,164 - - 10,446,443 304,047 19,764,654 Liabilities to be Paid From Restricted Assets: - - - - - - Customers' Deposits - 112,000 - - 662,702 774,702 Bonds, Notes Payable and Capital Leases - - 14,796 - - 14,796 Other Current Liabilities 2,832,727 660,000 - 14,800,129 9,756 18,302,612 Compensated Absences - - - 1,621,001 611,882 2,232,883 Non-Current Liabilities:
Bonds, Notes Payable and Capital Leases - - 14,929 - 765,000 779,929 Other Noncurrent Liabilities 326,517,821 29,175,841 - - 12,826,747 368,520,409 Net Other Postemployment Benefit Obligations - - - 2,307,283 - 2,307,283Net Pension Liability - - - 6,726,712 5,958,342 12,685,054
Total Liabilities 382,181,719 30,030,488 1,439,728 39,903,993 24,472,535 478,028,463 Deferred Inflow of Resources
Net Difference Between Projected and Actual Earnings on Pension Plan - - - - 1,920,660 1,920,660
Deferred OPEB 2,384,000 - - - - 2,384,000 Deferred Economic Experience 21,571,795 - - - - 21,571,795 Deferred pension investment experience 5,447,625 - - - - 5,447,625 Deferred pension proportionate share 8,116,000 - - - - 8,116,000 Deferred Inflow Change in Assumptions 17,896 - - 53,127 - 71,023Other Pension Deferrals - - - 1,132,545 - 1,132,545
Membership fees received in advance - - 11,791 - - 11,791Total Deferred Inflows of Resources 37,537,316 - 11,791 1,185,672 1,920,660 40,655,439
Net Position Net Investment in Capital Assets 13,118,462 13,187,284 3,531,241 14,880,531 79,395,456 124,112,974 Restricted for: - -
Capital Projects 9,092,890 3,739,850 - - 14,284,194 27,116,934 Permanent Funds:
Expendable 1,065,044 - - - - 1,065,044 Nonexpendable 207,778 - - - - 207,778
Unrestricted (306,986,384) (3,666,288) 8,278,017 (7,016,549) 23,172,433 (286,218,771) Total Net Position $ (283,502,210) $ 13,260,846 $ 11,809,258 $ 7,863,982 $ 116,852,083 $ (133,716,041)
The accompanying notes are an integral part of the basic financial statements.
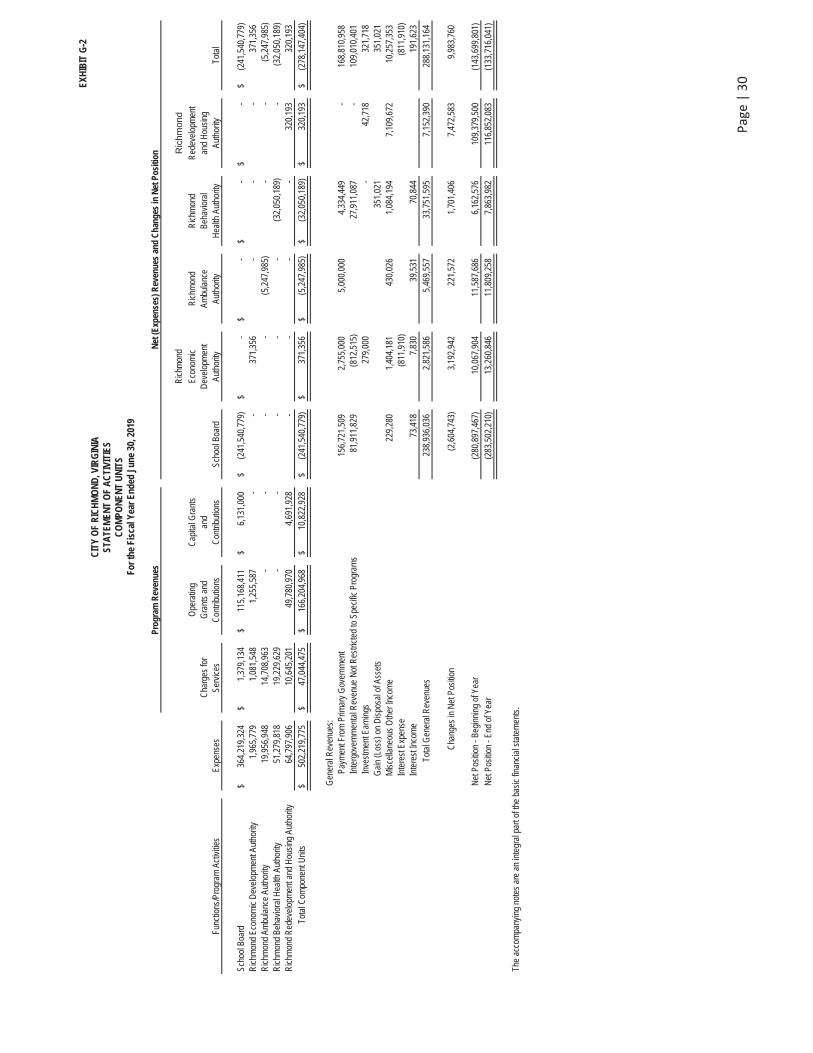
Page
|30 EX
HIB
IT G
-2
CIT
Y O
F R
ICH
MO
ND
, VIR
GIN
IA
STA
TEM
ENT
OF
AC
TIVI
TIES
C
OM
PON
ENT
UN
ITS
For t
he F
isca
l Yea
r End
ed J
une
30, 2
019
Pro
gram
Rev
enue
s
Net
(Exp
ense
s) R
even
ues
and
Cha
nges
in N
et P
ositi
on
Ric
hmon
dR
ichm
ond
O
pera
ting
C
apita
l Gra
nts
Ec
onom
ic
R
ichm
ond
Ric
hmon
d
Red
evel
opm
ent
Cha
rges
for
Gra
nts
and
and
Dev
elop
men
t Am
bula
nce
Beha
vior
al
and
Hou
sing
Fu
nctio
ns/P
rogr
am A
ctiv
ities
E
xpen
ses
Se
rvic
es
Con
tribu
tions
C
ontri
butio
ns
Sch
ool B
oard
Au
thor
ity
Auth
ority
H
ealth
Aut
horit
y
Auth
ority
To
tal
Scho
ol B
oard
$
3
64,2
19,3
24
$
1,3
79,1
34
$
115
,168
,411
$
6
,131
,000
$
(2
41,5
40,7
79)
$
- $
-
$
- $
-
$
(241
,540
,779
)R
ichm
ond
Econ
omic
Dev
elop
men
t Aut
horit
y 1
,965
,779
1
,081
,548
1
,255
,587
-
-
3
71,3
56
- -
-
3
71,3
56
Ric
hmon
d Am
bula
nce
Auth
ority
1
9,95
6,94
8
14,
708,
963
-
-
-
-
(5
,247
,985
) -
-
(5
,247
,985
) R
ichm
ond
Beha
vior
al H
ealth
Aut
horit
y 5
1,27
9,81
8
19,
229,
629
-
-
-
-
-
(32,
050,
189)
- (3
2,05
0,18
9)R
ichm
ond
Red
evel
opm
ent a
nd H
ousi
ng A
utho
rity
64,
797,
906
1
0,64
5,20
1
49,
780,
970
4
,691
,928
-
-
-
-
3
20,1
93
320
,193
To
tal C
ompo
nent
Uni
ts
$
502
,219
,775
$
4
7,04
4,47
5
$
166
,204
,968
$
1
0,82
2,92
8
$
(241
,540
,779
) $
3
71,3
56
$
(5,2
47,9
85)
$
(32,
050,
189)
$
3
20,1
93
$
(278
,147
,404
)
G
ener
al R
even
ues:
P
aym
ent F
rom
Prim
ary
Gov
ernm
ent
156
,721
,509
2
,755
,000
5
,000
,000
4
,334
,449
-
168
,810
,958
Inte
rgov
ernm
enta
l Rev
enue
Not
Res
trict
ed to
Spe
cific
Pro
gram
s
81,
911,
829
(8
12,5
15)
27,
911,
087
-
109
,010
,401
Inve
stm
ent E
arni
ngs
2
79,0
00
- 4
2,71
8 3
21,7
18
Gai
n (L
oss)
on
Dis
posa
l of A
sset
s 3
51,0
21 3
51,0
21M
isce
llane
ous
Oth
er In
com
e 2
29,2
80
1,4
04,1
81
430
,026
1
,084
,194
7
,109
,672
10,
257,
353
In
tere
st E
xpen
se
(811
,910
)
(811
,910
) In
tere
st In
com
e 7
3,41
8
7,8
30
39,
531
7
0,84
4
191
,623
T
otal
Gen
eral
Rev
enue
s
238
,936
,036
2
,821
,586
5
,469
,557
3
3,75
1,59
5
7,1
52,3
90
288
,131
,164
Cha
nges
in N
et P
ositi
on
(2,6
04,7
43)
3,1
92,9
42
221
,572
1
,701
,406
7
,472
,583
9
,983
,760
Net
Pos
ition
- Be
ginn
ing
of Y
ear
(280
,897
,467
) 1
0,06
7,90
4
11,
587,
686
6
,162
,576
1
09,3
79,5
00
(143
,699
,801
) N
et P
ositi
on -
End
of Y
ear
(283
,502
,210
) 1
3,26
0,84
6
11,
809,
258
7
,863
,982
1
16,8
52,0
83
(133
,716
,041
)
The
acco
mpa
nyin
g no
tes
are
an in
tegr
al p
art o
f the
bas
ic fi
nanc
ial s
tate
men
ts.

NO
TES TO FIN
AN
CIA
LSTA
TEMEN
TS
CITY OF RICHMOND, VIRGINIA NOTES TO BASIC FINANCIAL STATEMENTS JUNE 30, 2019
Page | 31
1. SUMMARY OF SIGNIFICANT ACCOUNTING POLICIES
The City of Richmond, Virginia (City) was founded by William Byrd in 1737, established as a town in May 1742 and incorporated asa City on July 19, 1782. The City operates on a Mayoral-Council form of government and provides all municipal services to itsresidents. The more significant of the City's accounting policies are described below.
A. Financial Reporting Entity
The City's financial statements are prepared in conformity with generally accepted accounting principles in the United States ofAmerica (GAAP) as applicable to government units. The Governmental Accounting Standards Board (GASB) is the acceptedstandard-setting body for establishing governmental accounting and financial reporting principles. The City’s financial reportingentity is defined and its financial statements are presented in accordance with GAAP, which defines the distinction between theCity as a Primary Government and its related entities. Accordingly, these financial statements present the City and its componentunits, entities for which the City is considered to be financially accountable, hereafter referred to as the reporting entity. The Cityhas two types of component units – blended and discrete. The blended component units are separate legal entities, in substance,that are part of the City's operations; thus, financial data from these units are combined with that of the City and reported in theappropriate fund type. Each blended component unit has a June 30 fiscal year-end. The discretely presented component units,on the other hand, are reported in a separate column in the government-wide financial statements to emphasize that they arelegally separate from the primary government. Each discretely presented component unit has a June 30 fiscal year-end, exceptfor the Richmond Redevelopment and Housing Authority, which has a September 30 year-end.
Component Units
Blended Component Units:
The City reports two blended component units, the Richmond Retirement System (RRS) and the Advantage RichmondCorporation (ARC). These component units are reported as a Fiduciary Pension Trust Fund and an Internal Service Fund,respectively.
The Richmond Retirement System (RRS)
The purpose of the RRS is to manage retirement plans for the City. RRS is fiscally dependent upon the City and providesservices primarily to the City’s employees. RRS issues a publicly available annual financial report that includes financialstatements and required supplementary information. That report can be requested at 900 East Broad Street, Richmond, VA23219 or may be accessed on the RRS website at the following address:
http://www.RVA.gov/retirement-system/annual-reports.
Advantage Richmond Corporation (ARC)
The purpose of the ARC is to assist the City, when authorized by the City Council, in acquiring, constructing, renovating, equipping, maintaining, and operating public buildings and other public structures for or on behalf of the City and in providing financing for such activities. ARC is fiscally dependent upon and performs services primarily for the City.
Discretely Presented Component Units:
The Component Unit column in the government-wide financial statements comprises financial data on the City's discretely presented component units. The governing bodies of all Component Units are appointed by the City Council, except the School Board of the City of Richmond, which is elected. The following Component Units are included in the reporting entity because they are financially accountable to the City and there is a financial burden and/or a benefit relationship between the City and the component unit.
CITY OF RICHMOND, VIRGINIA NOTES TO BASIC FINANCIAL STATEMENTS JUNE 30, 2019
Page | 32
The School Board of the City of Richmond (School Board)
The School Board administers the Richmond Public School system. The City Council approves the School Board's annual operating budget and provides a major portion of the funding through annual appropriations. Complete financial statements of the School Board may be obtained from the administrative offices located at 301 North Ninth Street, Richmond, VA 23219.
Proprietary Component Units
Economic Development Authority of the City of Richmond, Virginia (EDA)
The EDA promotes industry and develops trade by inducing entities to locate in or remain in the City. The City annually provides significant operating subsidies to the EDA, thus, a financial burden/benefit relationship exists between the entities.Complete financial statements for EDA may be requested at 501 E. Franklin Street, Richmond, VA 23219.
Richmond Ambulance Authority (RAA)
RAA provides emergency and non-emergency medical care and transportation services for the City. The City annually provides significant operating subsidies to RAA, thus, a financial burden relationship exists between the City and RAA. Complete financial statements for RAA may be requested at Post Office Box 26286, Richmond, VA 23260.
Richmond Behavioral Health Authority (RBHA)
RBHA provides behavioral health services to residents of the City under Sections 15.1-1676 of the Code of Virginia (1950), as amended. The City annually provides significant operating subsidies to RBHA, thus, a financial burden relationship exists between the City and RBHA. Complete financial statements for RBHA may be obtained from the administrative offices located at 107 S. 5th Street, Richmond, VA 23219.
Richmond Redevelopment and Housing Authority (RRHA)
RRHA is responsible for operating a low-rent housing program, which provides housing for eligible families, for operating redevelopment and conservation programs in accordance with the City’s Master Plan, and for the delivery of services to citizens of low-rent housing and urban renewal areas through the encouragement and development of social and economic opportunities. The City Council appoints the Commissioners of RRHA and is financially accountable for RRHA's operations. RRHA’s September 30, 2018 year-end Audited Financial Statements are included in the City’s component unit combining financial statements. Complete financial statements for RRHA may be obtained from the administrative offices located at 901 Chamberlayne Avenue, Richmond, VA 23220.
RRHA and the City have different fiscal years, which can result in timing differences in transactions between RRHA and the City as noted in the basic financial statement balances for Due To and From Primary Government and Component Units.
Joint Ventures
Greater Richmond Transit Company (GRTC)
The City retains an ongoing financial responsibility for the Greater Richmond Transit Company, which under joint venture agreement between the City and the County of Chesterfield, Virginia, provides mass transportation for passengers on a regional basis and associated para-transit service mandated by the Americans with Disabilities Act for the purposes of providing continuous service within and between the jurisdictions of the City, Chesterfield County and Henrico County. Greater Richmond Transit Company, a public service corporation incorporated on April 12, 1973, is governed by a six-member board of directors; three of which are appointed by the City and three by the County of Chesterfield. MV Contract Transportation Inc., is under contract with the Greater Richmond Transit Company to provide the executive management team that manages the operations of the 100 percent owned subsidiary, Old Dominion Transit Management Company, which does business as GRTC Transit System.
Fare revenues and route subsidies pay all costs associated with each locality utilizing the GRTC Transit System services only to the extent that each locality operates routes within their jurisdiction. The City expended $15,172,248 for operating subsidies for bus routes and para-transit services within the City for the year ended June 30, 2019. The City also expended $344,492 for local match funds needed to secure 80 percent of Federal grant funds that are used for the Company’s capital purchases. Complete financial statements for the Greater Richmond Transit Company can be obtained from the Finance Department, GRTC Transit System, 301 East Belt Boulevard, Richmond, VA 23224.
CITY OF RICHMOND, VIRGINIA NOTES TO BASIC FINANCIAL STATEMENTS JUNE 30, 2019
Page | 33
Jointly Governed Organizations
Capital Region Airport Commission (Commission) was created in 1975 under Chapter 380 (as amended by Chapter 410) of the Code of Virginia (Code) when the City and the County of Henrico adopted a resolution declaring a need for the Commission. Since that time, the Counties of Chesterfield and Hanover have become Commission participants.
The Commission is comprised of a fourteen-member board of directors, with four members each appointed by the City, County of Henrico and County of Chesterfield and two members appointed by the County of Hanover. The Commission generates its revenues from service charges to users of the Airport facilities to recover the costs of maintaining, repairing and operating theAirport. Virginia law requires that the Commission submit an annual budget showing estimated revenues and estimated expenditures to the governing bodies. If the Commission’s budget contains estimated expenditures which exceed estimated revenues, the governing bodies are required to fund the deficit in proportion to their financial interest in the Commission. If, however, actual revenues are less than estimated revenues identified in the budget (resulting in a deficit), the City and Counties may, at their discretion, appropriate funds necessary to fund the deficit. The City did not provide funding to the Commission during the fiscal year ended June 30, 2019.
Central Virginia Waste Management Authority (CVWMA) was created pursuant to the Virginia Water and Waste Authorities Act (Chapter 51, Title 15.2 of the Code of Virginia (1950), as amended). CVWMA's purpose is to plan, acquire, construct, reconstruct,improve, extend, operate, contract for and maintain any garbage and refuse collection, transfer and disposal program or system,including waste reduction, waste material recovery, recycling as mandated by law or otherwise, resource recovery, waste incineration, landfill operation, ash management, sludge disposal from water and wastewater treatment facilities, household hazardous waste management and disposal, and similar programs within one or more political subdivisions which are members of the CVWMA. The City is a member of the CVWMA. The CVWMA is governed by a Board of Directors consisting of one or more representatives appointed by each of the thirteen member cities, town and counties. The City appointed three of the twenty-member board of directors. The City provided $2,824,595 in funding to CVWMA for the fiscal year ended June 30, 2019.
The Greater Richmond Partnership (GRP) is comprised of members from the City and the counties of Chesterfield, Hanover, and Henrico. Together in partnership with the business leadership of the area, the GRP’s purpose is to further economic development of the metropolitan Richmond area. The City has one member on the board that is an elected official and one alternate member. The City provided $385,000 in funding to GRP for the year ended June 30, 2019.
The Richmond Metropolitan Convention and Visitors Bureau (RMCVB) – also “DBA” Richmond Region Tourism - serves the City and the Counties of Chesterfield, Hanover, Henrico and New Kent by promoting conventions, tourism and development in the Metropolitan Richmond area in order to increase revenues, provide increased employment and improve the economic health of all jurisdictions involved. The City has three representatives serving on the RMCVB Board of Directors. The City contributed $1,744,092 to RMCVB for the year ended June 30, 2019.
The Richmond Regional Planning District Commission (RRPDC) is comprised of representatives from nine local jurisdictions which include Counties of Charles City, Chesterfield, Goochland, Hanover, Henrico, New Kent, Powhatan, the City of Richmond, and the Town of Ashland. The major functions of the RRPDC are to promote regional cooperation; coordinate the activities and policies of local member governments; resolve service delivery challenges involving more than one government within the region;and provide planning assistance to local governments. The City has seven representatives serving on the RRPDC. The City provided funding to RRPDC in the amount of $143,451 for the year ended June 30, 2019.
The Greater Richmond Convention Center Authority (GRCCA), a political subdivision of the Commonwealth of Virginia, was created on January 9, 1998 pursuant to the Public Recreational Facilities Authority Act, Chapter 56 of Title 15.2, Code of Virginia.The GRCCA was created to acquire, finance, expand, renovate, construct, lease, operate, and maintain the facility and grounds of a visitors and convention center. The political subdivisions participating in the incorporation of the GRCCA are the City and the Counties of Chesterfield, Hanover and Henrico. The GRCCA is governed by a five-member commission comprised of the chief administrative officer of each of the four incorporating political subdivisions and the President/CEO of the Retail MerchantsAssociation of Counties of Chesterfield, Hanover and Henrico. The City contributed $9,001,579 in transient occupancy tax revenue for the year ending June 30, 2019.
CITY OF RICHMOND, VIRGINIA NOTES TO BASIC FINANCIAL STATEMENTS JUNE 30, 2019
Page | 34
B. Basis of Presentation
Government-wide and Fund Financial Statements
The basic financial statements include both government-wide (based on the City as a whole) and the fund financial statements,including the major individual funds of the governmental funds (General, Capital Projects and Debt Service Funds) andproprietary funds (Gas, Water, Wastewater, and Storm water), as well as the fiduciary funds and the Component Units. Both thegovernment-wide and fund financial statements categorize primary activities as either governmental or business-type. In thegovernment-wide Statement of Net Position, both the governmental and business-type activities columns are presented on anaggregated basis by column and are reflected on a full accrual, economic resource measurement focus basis, which incorporates long-term assets and receivables as well as long-term debt and obligations. Each presentation provides valuable informationthat can be analyzed and compared (between years and between governments) to enhance the usefulness of the information.
The government-wide Statement of Activities reflects both the gross and net cost per functional category (e.g. Public Safety,Public Works, Human Services, etc.) that are otherwise being supported by general government revenues (property, sales anduse taxes, certain intergovernmental revenues, fines, permits and charges, etc.). The Statement of Activities reduces grossexpenses (including depreciation) by directly related program revenues, operating and capital grants, and contributions. Programrevenues include charges to customers or applicants who purchase, use, or directly benefit from goods, services or privilegesprovided by a given function and grants and contributions that are restricted to meeting the operation or capital requirements ofa particular function or segment. Taxes and other items not specifically restricted to the various programs are reported as generalrevenues. Operating grants presented include operating-specific and discretionary (either operating or capital) grants, while thecapital grants column reflects capital-specific grants.
In the fund financial statements, financial transactions, and accounts of the City are organized on the basis of funds. Theoperation of each fund is considered to be an independent fiscal and separate accounting entity, with a self-balancing set ofaccounts recording cash and/or other financial resources together with all related liabilities and residual equities or balances,and changes therein, which are segregated for the purpose of carrying on specific activities or attaining certain objectives inaccordance with special regulations and restrictions, or limitations. GAAP sets forth minimum criteria (percentage of the assetsand deferred outflows of resources, liabilities and deferred inflows of resources, revenues or expenditures/expenses of eitherfund category or the governmental and enterprise combined) for the determination of major funds. The non-major funds arecombined in a single column in the fund financial statements and detailed in the combining statements. The governmental fundfinancial statements are presented on current financial resources measurement focus and modified accrual basis of accounting.This is the manner in which these funds are normally budgeted. Since the governmental fund financial statements are presented on a different measurement focus and basis of accounting than the government-wide financial statements’ governmentalactivities column, a reconciliation is presented, which briefly explains the adjustments necessary to reconcile the fund financialstatements to the governmental activities column of the government-wide financial statements.
Internal Service Funds of the City, which traditionally provide services primarily to other funds of the government, are presentedin summary form as part of the Proprietary Fund financial statements. In the government-wide financial statements, assets,deferred outflows of resources, liabilities, deferred inflows of resources, revenues and expenses of the funds are allocated toeither the governmental or business-type activities, based on their predominate use of the fund’s services. To the extent possible,the costs of these services are reflected in the appropriate functional activity (e.g., Public Safety and Judiciary, Human Services,etc.). See Exhibits E-1 and E-2 for specific allocation of the Stores and Transportation Division Internal Service Fund results tothe business-type activities.
The City’s Fiduciary Funds are presented in the fund financial statements by type (pension and agency). Since by definitionthese assets are being held for the benefit of a third party (e.g. private parties, pension participants, etc.) and cannot be used toaddress activities or obligations of the City, these funds are not incorporated into the government-wide financial statements.
CITY OF RICHMOND, VIRGINIA NOTES TO BASIC FINANCIAL STATEMENTS JUNE 30, 2019
Page | 35
The following is a brief description of the specific funds used by the City:
Governmental Funds
Governmental Funds are those through which most governmental functions typically are financed. The City reports the following Governmental Funds:
General Fund (Major Fund) – The General Fund is the City's primary operating fund. It accounts for and reports all financialresources of the City's general government not accounted for and reported in another fund.
Debt Service Fund (Major Fund) – The Debt Service Fund accounts for and reports the accumulation of resources for andthe payment of principal and interest and fiscal charges not being financed by proprietary funds or financial resources thatare restricted, committed, or assigned to expenditures for principal and interest. The Debt Service Fund reports resourcesif legally mandated. Financial resources that are being accumulated for principal and interest maturing in future years alsoare reported in the Debt Service Fund.
Capital Projects Fund (Major Fund) – The Capital Projects Fund is used to account for and report financial resources thatare restricted, committed, or assigned for capital outlays, including the acquisition or construction of capital facilities andother capital assets approved by City Council. The Capital Projects Fund excludes those types of capital-related outflowsfinanced by proprietary funds or for assets that will be held in trust for individuals, private organizations, or othergovernments. Its principal source of funding is the sale of General Obligation Bonds.
Special Revenue Funds – Special Revenue Funds are used to account for and report the proceeds of specific revenuesources (other than expendable trust or major capital projects) that are legally restricted, committed, or assigned toexpenditures for specified purposes other than debt service or capital projects. Each fund is established on a functionalbasis and may include one or more grants or other funding sources.
Permanent Funds – Permanent Funds are used to account for and report resources that are restricted to the extent thatonly earnings, not principal, may be used for purposes that support the City programs, that is, for the benefit of thegovernment or its citizenry.
Proprietary Funds
Proprietary Funds are accounted for on the flow of economic resources measurement focus and use the accrual basis of accounting. Under this method, revenues are recorded when earned and expenses are recorded at the time liabilities are incurred. The City reports the following Proprietary Funds:
Enterprise Funds -Enterprise Funds are used to report activities for which a fee is charged to external usersfor goods and services. The City maintains seven Enterprise Funds consisting of the gas, water, wastewateroperations and storm water operations (all of which are considered major funds), Cemeteries, RichmondColiseum (Coliseum) and Parking Enterprise (which are combined into a single, aggregated presentation as non-
major proprietary funds). A description of the major enterprise funds are as follows:
Gas – The Gas Utility provides natural gas service to the City and surrounding counties. Operation of the GasUtility is designed to be self-supporting through user charges.
Water – The Water Utility provides retail water service to the City and surrounding counties. Operation of theWater Utility is designed to be self-supporting through user charges.
Wastewater – The Wastewater Utility provides wastewater service to the City and portions of the surroundingcounties. Operation of the Wastewater Utility is designed to be self-supporting through user charges.
Storm water Utility – The Storm-water Utility provides storm-water service to the City. Operation of the Storm-water Utility is designed to be self-supporting through user charges.
Internal Service Funds - Internal Service Funds account for operations that provide services to Citydepartments/agencies on a cost reimbursement basis. The city maintains eight internal service funds consistingof Fleet Management, Radio Management, Health Self-Insurance, Advantage Richmond Corporation, InformationTechnology, Risk Management, Electric Utility, and Stores and Transportation, which exclusively serves the City’smajor proprietary funds.
CITY OF RICHMOND, VIRGINIA NOTES TO BASIC FINANCIAL STATEMENTS JUNE 30, 2019
Page | 36
Fiduciary Funds - Fiduciary Funds account for assets held by the City in a trustee capacity or as an agent forindividuals, private organizations or other governments.
Pension Trust Funds – For accounting measurement purposes, the Pension Trust Funds are accounted for inessentially the same manner as proprietary funds. The Trust Funds consist of the City’s Retirement Plan, OPEB Trustand Deferred Compensation Plan.
Agency Funds – Agency Funds are custodial in nature and do not present results of operations or have a measurementfocus. The Agency Funds consist of the assets and liabilities of several organizations for which the City serves asfiscal agent, such as the Department of Parks, Recreation and Community Facilities, the Department of Public Worksand the Law Department.
Reconciliation of Government-wide and Fund Financial Statements
A summary reconciliation of the difference between total fund balances, as reflected on the Governmental Funds’ Balance Sheet, and total net position for governmental activities, as shown on the government-wide Statement of Net Position, is presented in aschedule accompanying the Governmental Funds’ Balance Sheet. The assets and deferred outflows of resources and liabilities and deferred inflows of resources elements, which comprise the reconciliation differences, stem from Governmental Funds, using the current financial resources measurement focus and the modified accrual basis of accounting, while the government-wide financial statements use the economic resources measurement focus and the accrual basis of accounting. A summary reconciliation of the differences between net change in total fund balances as reflected on the Governmental Funds’ Statement of Revenues, Expenditures, and Changes in Fund Balances and the change in net position for governmental activities, as shown on the government-wide Statement of Activities, is presented in a schedule accompanying the Governmental Funds’ Statement of Revenues, Expenditures, and Changes in Fund Balances. The revenue and expense elements, which comprise the reconciliation differences, stem from the governmental funds using the current financial resources measurement focus and the modified accrual basis of accounting, while the government-wide financial statements use the economic resources measurement focus and the accrual basis of accounting.
C. Basis of Accounting
The accounting and financial reporting treatment applied to a fund is determined by its measurement focus. All GovernmentalFunds are accounted for using the current financial resources measurement focus wherein only current assets and currentliabilities are included on the Balance Sheet in the fund statements whereas long-term assets and long-term liabilities are includedin the government-wide statements. Operating statements of the Governmental Funds present increases (e.g. revenues andother financial sources) and decreases (e.g. expenditures and other financing uses) in fund balances.
Revenues are recognized in the accounting period in which they become both measurable and available to finance expendituresof the fiscal period. Revenues from taxes are generally considered available if received within two months after the fiscal yearend. Revenue from categorical and other grants are generally considered available when all eligibility criteria have been metand if received within one year. Expenditures are recorded when the related liability is incurred and payment is due, except forprincipal and interest on long-term debt, and compensated absences and claims.
The government-wide financial statements are reported and accounted for on the economic resources measurement focus andthe accrual basis of accounting, which include all assets and deferred outflows of resources and liabilities and deferred inflowsof resources associated with governmental and business-type activities. Assets and liabilities associated with fiduciary activitiesare included in the Statement of Fiduciary Net Position. Revenues are recorded when earned and expenses are recorded at thetime liabilities are incurred, regardless of when the related cash flows take place. Non-exchange transactions, in which the Cityeither gives or receives value without directly receiving or giving equal value in exchange, include sales and income taxes, realestate and personal property taxes, grants, entitlements, and donations. On an accrual basis, revenue from sales taxes arerecognized when the underlying exchange transaction takes place. Revenue from property taxes is recognized in the fiscal yearfor which the taxes are levied. Revenue from grants, entitlements, and donations is recognized in the fiscal year in which alleligibility requirements have been satisfied.
Operating revenues and expenses in the Proprietary Funds result from providing goods and services in connection with theirprincipal ongoing operations (e.g., charges for services). Operating expenses for the Enterprise and Internal Service Fundsinclude the cost of services, administrative expenses, contractual services, and depreciation on capital assets. All revenues andexpenses not meeting this definition are reported as non-operating revenues and expenses.
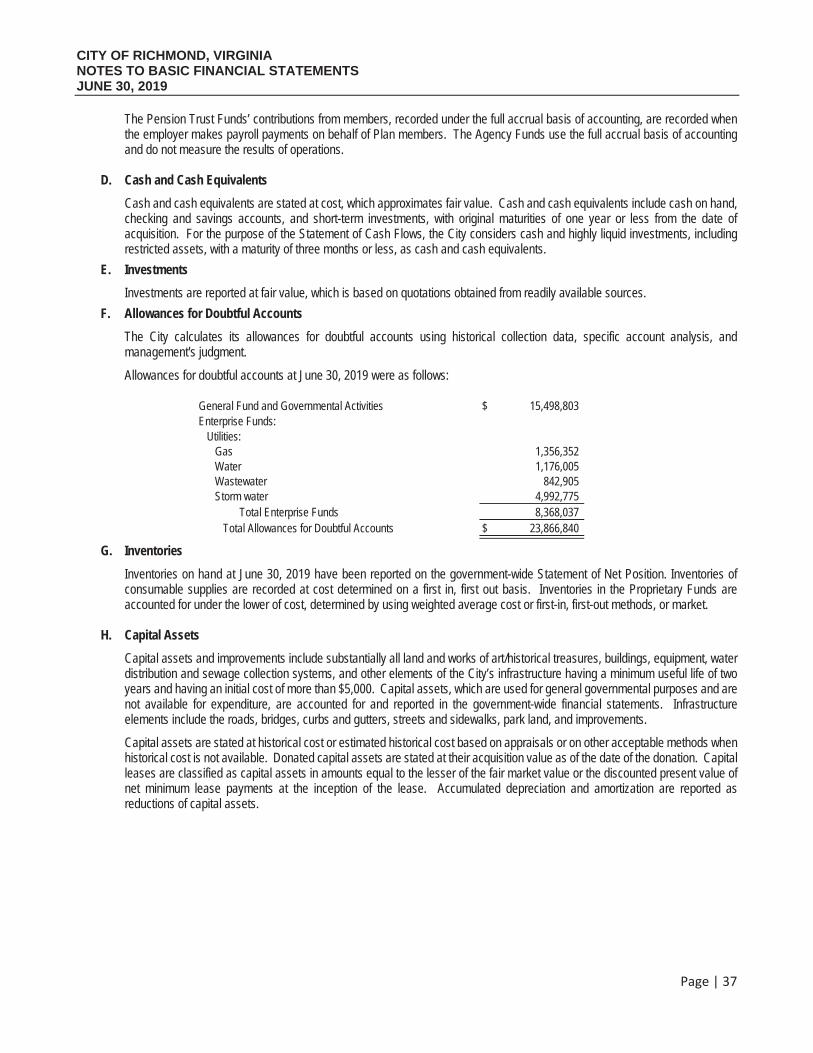
CITY OF RICHMOND, VIRGINIA NOTES TO BASIC FINANCIAL STATEMENTS JUNE 30, 2019
Page | 37
The Pension Trust Funds’ contributions from members, recorded under the full accrual basis of accounting, are recorded when the employer makes payroll payments on behalf of Plan members. The Agency Funds use the full accrual basis of accounting and do not measure the results of operations.
D. Cash and Cash Equivalents
Cash and cash equivalents are stated at cost, which approximates fair value. Cash and cash equivalents include cash on hand,checking and savings accounts, and short-term investments, with original maturities of one year or less from the date ofacquisition. For the purpose of the Statement of Cash Flows, the City considers cash and highly liquid investments, includingrestricted assets, with a maturity of three months or less, as cash and cash equivalents.
E. Investments
Investments are reported at fair value, which is based on quotations obtained from readily available sources.
F. Allowances for Doubtful Accounts
The City calculates its allowances for doubtful accounts using historical collection data, specific account analysis, andmanagement's judgment.
Allowances for doubtful accounts at June 30, 2019 were as follows:
General Fund and Governmental Activities $ 15,498,803 Enterprise Funds: Utilities: Gas 1,356,352 Water 1,176,005 Wastewater 842,905 Storm water 4,992,775
Total Enterprise Funds 8,368,037 Total Allowances for Doubtful Accounts $ 23,866,840
G. Inventories
Inventories on hand at June 30, 2019 have been reported on the government-wide Statement of Net Position. Inventories ofconsumable supplies are recorded at cost determined on a first in, first out basis. Inventories in the Proprietary Funds areaccounted for under the lower of cost, determined by using weighted average cost or first-in, first-out methods, or market.
H. Capital Assets
Capital assets and improvements include substantially all land and works of art/historical treasures, buildings, equipment, waterdistribution and sewage collection systems, and other elements of the City’s infrastructure having a minimum useful life of twoyears and having an initial cost of more than $5,000. Capital assets, which are used for general governmental purposes and arenot available for expenditure, are accounted for and reported in the government-wide financial statements. Infrastructureelements include the roads, bridges, curbs and gutters, streets and sidewalks, park land, and improvements.
Capital assets are stated at historical cost or estimated historical cost based on appraisals or on other acceptable methods whenhistorical cost is not available. Donated capital assets are stated at their acquisition value as of the date of the donation. Capitalleases are classified as capital assets in amounts equal to the lesser of the fair market value or the discounted present value ofnet minimum lease payments at the inception of the lease. Accumulated depreciation and amortization are reported asreductions of capital assets.
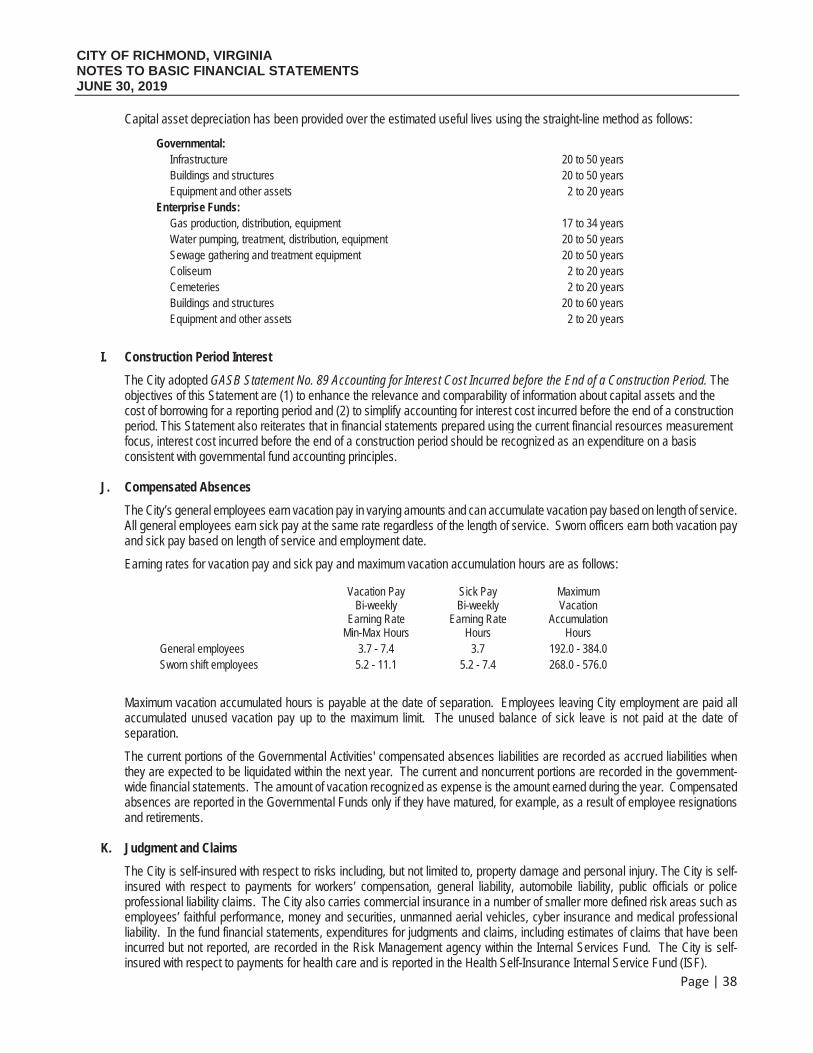
CITY OF RICHMOND, VIRGINIA NOTES TO BASIC FINANCIAL STATEMENTS JUNE 30, 2019
Page | 38
Capital asset depreciation has been provided over the estimated useful lives using the straight-line method as follows:
Governmental: Infrastructure 20 to 50 years Buildings and structures 20 to 50 years Equipment and other assets 2 to 20 years Enterprise Funds: Gas production, distribution, equipment 17 to 34 years Water pumping, treatment, distribution, equipment 20 to 50 years Sewage gathering and treatment equipment 20 to 50 years Coliseum 2 to 20 years Cemeteries 2 to 20 years Buildings and structures 20 to 60 years Equipment and other assets 2 to 20 years
I. Construction Period Interest
The City adopted GASB Statement No. 89 Accounting for Interest Cost Incurred before the End of a Construction Period. Theobjectives of this Statement are (1) to enhance the relevance and comparability of information about capital assets and thecost of borrowing for a reporting period and (2) to simplify accounting for interest cost incurred before the end of a constructionperiod. This Statement also reiterates that in financial statements prepared using the current financial resources measurementfocus, interest cost incurred before the end of a construction period should be recognized as an expenditure on a basisconsistent with governmental fund accounting principles.
J. Compensated Absences
The City’s general employees earn vacation pay in varying amounts and can accumulate vacation pay based on length of service.All general employees earn sick pay at the same rate regardless of the length of service. Sworn officers earn both vacation payand sick pay based on length of service and employment date.
Earning rates for vacation pay and sick pay and maximum vacation accumulation hours are as follows:
Vacation PayBi-weekly
Earning Rate Min-Max Hours
Sick Pay Bi-weekly
Earning Rate Hours
Maximum Vacation
Accumulation Hours
General employees 3.7 - 7.4 3.7 192.0 - 384.0 Sworn shift employees 5.2 - 11.1 5.2 - 7.4 268.0 - 576.0
Maximum vacation accumulated hours is payable at the date of separation. Employees leaving City employment are paid all accumulated unused vacation pay up to the maximum limit. The unused balance of sick leave is not paid at the date of separation.
The current portions of the Governmental Activities' compensated absences liabilities are recorded as accrued liabilities when they are expected to be liquidated within the next year. The current and noncurrent portions are recorded in the government-wide financial statements. The amount of vacation recognized as expense is the amount earned during the year. Compensated absences are reported in the Governmental Funds only if they have matured, for example, as a result of employee resignations and retirements.
K. Judgment and Claims
The City is self-insured with respect to risks including, but not limited to, property damage and personal injury. The City is self-insured with respect to payments for workers’ compensation, general liability, automobile liability, public officials or policeprofessional liability claims. The City also carries commercial insurance in a number of smaller more defined risk areas such asemployees’ faithful performance, money and securities, unmanned aerial vehicles, cyber insurance and medical professionalliability. In the fund financial statements, expenditures for judgments and claims, including estimates of claims that have beenincurred but not reported, are recorded in the Risk Management agency within the Internal Services Fund. The City is self-insured with respect to payments for health care and is reported in the Health Self-Insurance Internal Service Fund (ISF).
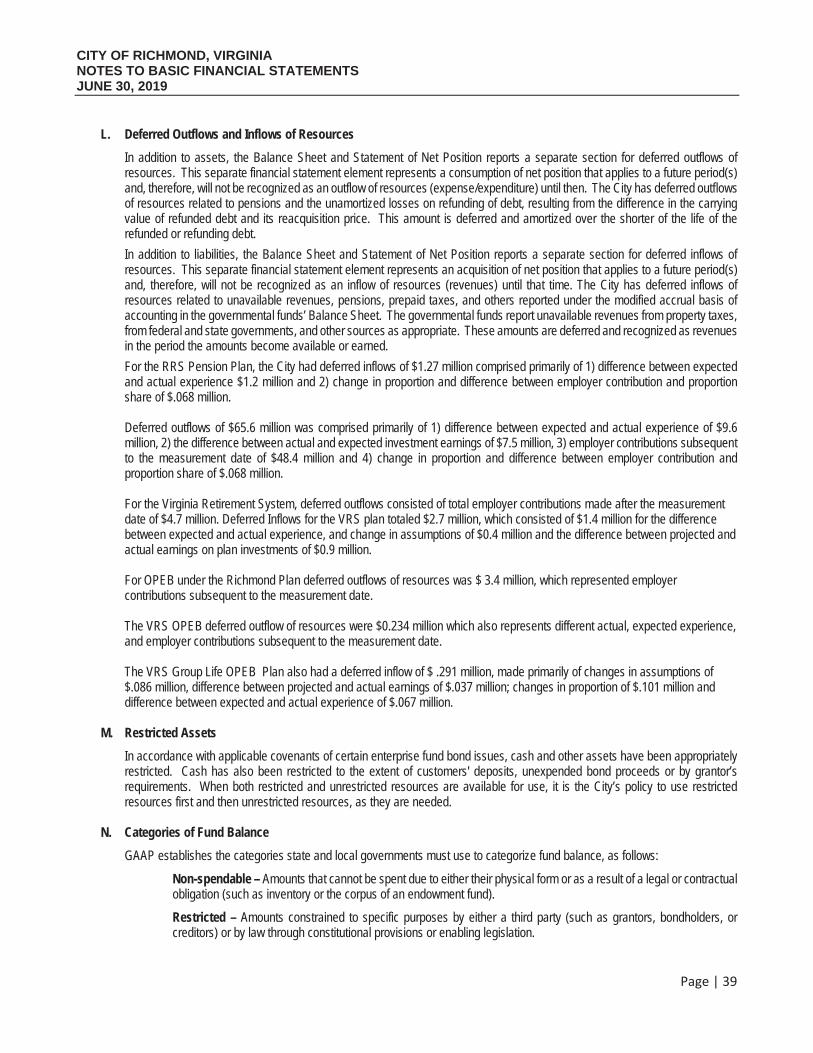
CITY OF RICHMOND, VIRGINIA NOTES TO BASIC FINANCIAL STATEMENTS JUNE 30, 2019
Page | 39
L. Deferred Outflows and Inflows of Resources
In addition to assets, the Balance Sheet and Statement of Net Position reports a separate section for deferred outflows ofresources. This separate financial statement element represents a consumption of net position that applies to a future period(s)and, therefore, will not be recognized as an outflow of resources (expense/expenditure) until then. The City has deferred outflowsof resources related to pensions and the unamortized losses on refunding of debt, resulting from the difference in the carryingvalue of refunded debt and its reacquisition price. This amount is deferred and amortized over the shorter of the life of therefunded or refunding debt.
In addition to liabilities, the Balance Sheet and Statement of Net Position reports a separate section for deferred inflows ofresources. This separate financial statement element represents an acquisition of net position that applies to a future period(s)and, therefore, will not be recognized as an inflow of resources (revenues) until that time. The City has deferred inflows ofresources related to unavailable revenues, pensions, prepaid taxes, and others reported under the modified accrual basis ofaccounting in the governmental funds’ Balance Sheet. The governmental funds report unavailable revenues from property taxes, from federal and state governments, and other sources as appropriate. These amounts are deferred and recognized as revenues in the period the amounts become available or earned.
For the RRS Pension Plan, the City had deferred inflows of $1.27 million comprised primarily of 1) difference between expectedand actual experience $1.2 million and 2) change in proportion and difference between employer contribution and proportionshare of $.068 million.
Deferred outflows of $65.6 million was comprised primarily of 1) difference between expected and actual experience of $9.6million, 2) the difference between actual and expected investment earnings of $7.5 million, 3) employer contributions subsequentto the measurement date of $48.4 million and 4) change in proportion and difference between employer contribution andproportion share of $.068 million.
For the Virginia Retirement System, deferred outflows consisted of total employer contributions made after the measurementdate of $4.7 million. Deferred Inflows for the VRS plan totaled $2.7 million, which consisted of $1.4 million for the differencebetween expected and actual experience, and change in assumptions of $0.4 million and the difference between projected andactual earnings on plan investments of $0.9 million.
For OPEB under the Richmond Plan deferred outflows of resources was $ 3.4 million, which represented employercontributions subsequent to the measurement date.
The VRS OPEB deferred outflow of resources were $0.234 million which also represents different actual, expected experience,and employer contributions subsequent to the measurement date.
The VRS Group Life OPEB Plan also had a deferred inflow of $ .291 million, made primarily of changes in assumptions of$.086 million, difference between projected and actual earnings of $.037 million; changes in proportion of $.101 million anddifference between expected and actual experience of $.067 million.
M. Restricted Assets
In accordance with applicable covenants of certain enterprise fund bond issues, cash and other assets have been appropriatelyrestricted. Cash has also been restricted to the extent of customers' deposits, unexpended bond proceeds or by grantor’srequirements. When both restricted and unrestricted resources are available for use, it is the City’s policy to use restrictedresources first and then unrestricted resources, as they are needed.
N. Categories of Fund Balance
GAAP establishes the categories state and local governments must use to categorize fund balance, as follows:
Non-spendable – Amounts that cannot be spent due to either their physical form or as a result of a legal or contractual obligation (such as inventory or the corpus of an endowment fund).
Restricted – Amounts constrained to specific purposes by either a third party (such as grantors, bondholders, or creditors) or by law through constitutional provisions or enabling legislation.
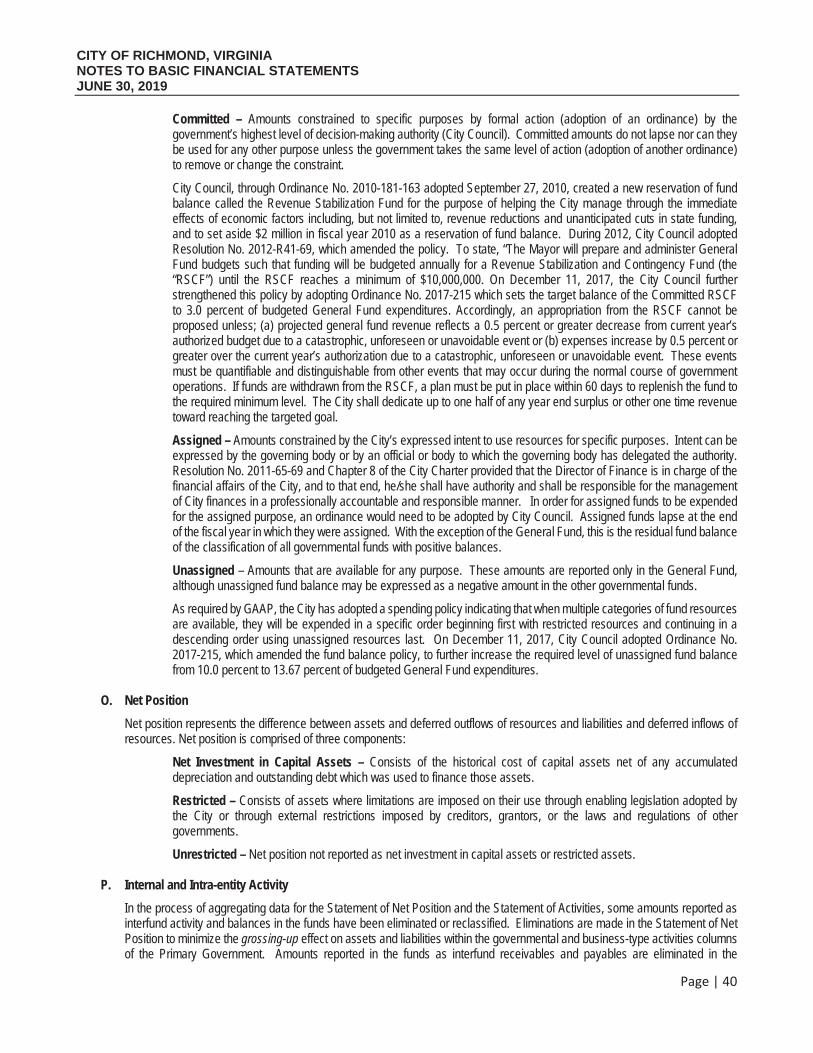
CITY OF RICHMOND, VIRGINIA NOTES TO BASIC FINANCIAL STATEMENTS JUNE 30, 2019
Page | 40
Committed – Amounts constrained to specific purposes by formal action (adoption of an ordinance) by the government’s highest level of decision-making authority (City Council). Committed amounts do not lapse nor can they be used for any other purpose unless the government takes the same level of action (adoption of another ordinance) to remove or change the constraint.
City Council, through Ordinance No. 2010-181-163 adopted September 27, 2010, created a new reservation of fund balance called the Revenue Stabilization Fund for the purpose of helping the City manage through the immediate effects of economic factors including, but not limited to, revenue reductions and unanticipated cuts in state funding, and to set aside $2 million in fiscal year 2010 as a reservation of fund balance. During 2012, City Council adopted Resolution No. 2012-R41-69, which amended the policy. To state, “The Mayor will prepare and administer General Fund budgets such that funding will be budgeted annually for a Revenue Stabilization and Contingency Fund (the “RSCF”) until the RSCF reaches a minimum of $10,000,000. On December 11, 2017, the City Council further strengthened this policy by adopting Ordinance No. 2017-215 which sets the target balance of the Committed RSCF to 3.0 percent of budgeted General Fund expenditures. Accordingly, an appropriation from the RSCF cannot be proposed unless; (a) projected general fund revenue reflects a 0.5 percent or greater decrease from current year’s authorized budget due to a catastrophic, unforeseen or unavoidable event or (b) expenses increase by 0.5 percent or greater over the current year’s authorization due to a catastrophic, unforeseen or unavoidable event. These events must be quantifiable and distinguishable from other events that may occur during the normal course of government operations. If funds are withdrawn from the RSCF, a plan must be put in place within 60 days to replenish the fund to the required minimum level. The City shall dedicate up to one half of any year end surplus or other one time revenue toward reaching the targeted goal.
Assigned – Amounts constrained by the City’s expressed intent to use resources for specific purposes. Intent can be expressed by the governing body or by an official or body to which the governing body has delegated the authority. Resolution No. 2011-65-69 and Chapter 8 of the City Charter provided that the Director of Finance is in charge of the financial affairs of the City, and to that end, he/she shall have authority and shall be responsible for the management of City finances in a professionally accountable and responsible manner. In order for assigned funds to be expended for the assigned purpose, an ordinance would need to be adopted by City Council. Assigned funds lapse at the end of the fiscal year in which they were assigned. With the exception of the General Fund, this is the residual fund balance of the classification of all governmental funds with positive balances.
Unassigned – Amounts that are available for any purpose. These amounts are reported only in the General Fund, although unassigned fund balance may be expressed as a negative amount in the other governmental funds.
As required by GAAP, the City has adopted a spending policy indicating that when multiple categories of fund resources are available, they will be expended in a specific order beginning first with restricted resources and continuing in a descending order using unassigned resources last. On December 11, 2017, City Council adopted Ordinance No. 2017-215, which amended the fund balance policy, to further increase the required level of unassigned fund balance from 10.0 percent to 13.67 percent of budgeted General Fund expenditures.
O. Net Position
Net position represents the difference between assets and deferred outflows of resources and liabilities and deferred inflows ofresources. Net position is comprised of three components:
Net Investment in Capital Assets – Consists of the historical cost of capital assets net of any accumulated depreciation and outstanding debt which was used to finance those assets.
Restricted – Consists of assets where limitations are imposed on their use through enabling legislation adopted by the City or through external restrictions imposed by creditors, grantors, or the laws and regulations of other governments.
Unrestricted – Net position not reported as net investment in capital assets or restricted assets.
P. Internal and Intra-entity Activity
In the process of aggregating data for the Statement of Net Position and the Statement of Activities, some amounts reported asinterfund activity and balances in the funds have been eliminated or reclassified. Eliminations are made in the Statement of NetPosition to minimize the grossing-up effect on assets and liabilities within the governmental and business-type activities columnsof the Primary Government. Amounts reported in the funds as interfund receivables and payables are eliminated in the
CITY OF RICHMOND, VIRGINIA NOTES TO BASIC FINANCIAL STATEMENTS JUNE 30, 2019
Page | 41
governmental and business-type activities columns of the government-wide financial statements, except for net residual amounts due between governmental and business type activities, which are presented as internal balances. Also, eliminations are made in the Statement of Activities to remove the doubling-up effect of Internal Service Fund activity. Payments from a fund receiving revenue to a fund through which the revenue is to be expended are reported as operating transfers. Such payments include transfers for debt service and capital construction. In the government-wide financial statements, resource flows between the Primary Government and the discretely presented component units are reported as if they were external transactions.
Q. Advances to Other Funds
Movement of money representing a loan extending beyond one year are recorded as advances to other funds.
R. Rate Stabilization
City Code section 106-37 authorizes the Utilities Enterprise Funds to establish rate stabilization accounts within each utility. Thepurpose of rate stabilization is to mitigate and smooth any rate increases that otherwise might be required from year to year byincreasing the rate stabilization amounts in years when revenues exceed those needed to meet reasonable rates of return. Forthe year ended June 30, 2019, Wastewater Utility has approximately $4.3 million for rate stabilization funds.
The Wastewater Utility expects to utilize these funds over the next two years to mitigate a portion of the expenses that will berequired to meet total maximum daily load requirements as imposed by the United States Environmental Protection Agency andthe Virginia Department of Environmental Quality.
S. Estimates and Assumptions
A number of estimates and assumptions relating to the reporting of revenues, expenditures, assets, liabilities, and the disclosureof contingent liabilities were used to prepare these basic financial statements in conformity with GAAP. Actual results could differfrom those estimates.
T. Identification of Major Revenue Sources Susceptible to Accrual
In the Governmental Funds, property taxes, sales taxes, franchise taxes, licenses, intergovernmental grants, and interestassociated with the current fiscal period are all considered to be susceptible to accrual and so have been recognized as revenuesof the current fiscal period. All other revenue items are considered to be measurable and available only when the City receivescash.
U. Permanent Funds
Principal portion of permanent funds are reported as nonspendable while the net revenue of permanent funds is available forexpenditure. Authorization for spending the investment income is derived from the specifications as prescribed by the donor.
V. Unearned Revenues
Unearned revenue represents a liability related to amounts received but not yet earned or an asset for which an enforceable lienis in place but the tax has not been received. At the government-wide level, unearned revenue is primarily comprised of moneyreceived from federal and/or state grants in advance of services to be provided. At the fund level, unearned revenue is primarilycomprised of taxes with an enforceable lien but not available, prepaid taxes and money received from federal and/or state grantsin advance of services to be provided.
W. Adoption of New Accounting Pronouncements
During the year ended June 30, 2019, the City implemented the provisions of the following GASB statements:
In April 2018, GASB Statement No. 88 Certain Disclosures Related to Debt, including Direct Borrowings and Direct Placementswas issued. The primary objective of this Statement is to improve the information that is disclosed in government financialstatement notes related to debt, including direct borrowings and direct placements. It also clarifies which liabilities governmentsshould include when disclosing information related to debt.
In November 2016, GASB issued Statement No. 83 Certain Asset Retirement Obligations. This Statement addresses accounting and financial reporting for certain asset retirement obligations (AROs). An ARO is a legally enforceable liability associated withthe retirement of a tangible capital asset. A government that has legal obligations to perform future asset retirement activities
CITY OF RICHMOND, VIRGINIA NOTES TO BASIC FINANCIAL STATEMENTS JUNE 30, 2019
Page | 42
related to its tangible capital assets should recognize a liability based on the guidance in this Statement. This Statement establishes criteria for determining the timing and pattern of recognition of a liability and a corresponding deferred outflow ofresources for AROs. This Statement requires that recognition occur when the liability is both incurred and reasonably estimable.This statement had no impact on the City.
X. Future Accounting Pronouncements
GASB Statement No. 91, Conduit Debt Obligations. The primary objectives of this Statement are to provide a method of reporting conduit debt obligations by issuers and eliminate diversity in practice associated with (1) commitments extended by issuers, (2)arrangements associated with conduit debt obligations, and (3) related note disclosures. This Statement achieves thoseobjectives by clarifying the existing definition of a conduit debt obligation; establishing that a conduit debt obligation is not aliability of the issuer; establishing standards for accounting and financial reporting of additional commitments and voluntarycommitments extended by issuers and arrangements associated with conduit debt obligations; and improving required notedisclosures.The City is reviewing the impact of this statement and will implement it in 2021.
GASB Statement No 90, Majority Equity Interests—An Amendment Of GASB Statements No. 14 And No. 61. The primaryobjectives of this Statement are to improve the consistency and comparability of reporting a government’s majority equity interestin a legally separate organization and to improve the relevance of financial statement information for certain component units. Itdefines a majority equity interest and specifies that a majority equity interest in a legally separate organization should be reportedas an investment if a government’s holding of the equity interest meets the definition of an investment. A majority equity interestthat meets the definition of an investment should be measured using the equity method, unless it is held by a special-purposegovernment engaged only in fiduciary activities, a fiduciary fund, or an endowment (including permanent and term endowments)or permanent fund. Those governments and funds should measure the majority equity interest at fair value.
This Statement establishes that ownership of a majority equity interest in a legally separate organization results in the governmentbeing financially accountable for the legally separate organization and, therefore, the government should report that organizationas a component unit.
This Statement also requires that a component unit in which a government has a 100 percent equity interest account for itsassets, deferred outflows of resources, liabilities, and deferred inflows of resources at acquisition value at the date thegovernment acquired a 100 percent equity interest in the component unit. Transactions presented in flows statements of thecomponent unit in that circumstance should include only transactions that occurred subsequent to the acquisition.The City isreviewing the impact of this statement and will implement it in 2020.
In June 2017, GASB issued Statement No. 87 Leases. This Statement increases the usefulness of governments’ financialstatements by requiring recognition of lease assets and liabilities for leases that previously were classified as operating leasesand recognized as inflows of resources or outflows of resources based on the payment provisions of the contract. Under thisStatement, a lessee is required to recognize a lease liability and an intangible right-to-use lease asset, and a lessor is requiredto recognize a lease receivable and a deferred inflow of resources, thereby enhancing the relevance and consistency ofinformation about governments’ leasing activities. The City will implement this statement in 2021.
Issued in January 2017, Statement No. 84 Fiduciary Activities seeks to improve guidance regarding the identification of fiduciaryactivities for accounting and financial reporting purposes and how those activities should be reported. This Statement establishescriteria for identifying fiduciary activities of all state and local governments. The focus of the criteria generally is on (1) whether agovernment is controlling the assets of the fiduciary activity and (2) the beneficiaries with whom a fiduciary relationship exists.Separate criteria are included to identify fiduciary component units and post employment benefit arrangements that are fiduciaryactivities. The City will review the impact of this statement and implement in 2020.
2. REAL AND PERSONAL PROPERTY TAXES
Real and personal property taxes are levied on a calendar year basis on January 1, the assessment date, with an assessed value asof that date. Real property taxes become a lien on the property as of assessment. Personal property tax on motor vehicles acquiringor losing situs (location where property is principally parked or garaged) throughout the year are prorated on a monthly basis. Forpartial months in situs, assessments, abatement, and refunds are rounded to the nearest full month.
Personal property taxes may be paid without penalty and interest on or before June 5 or 60 days from the date the vehicle acquiredsitus in Richmond. Effective January 1, 2011, real estate taxes are billed on a semi-annual basis. These taxes may be paid without
CITY OF RICHMOND, VIRGINIA NOTES TO BASIC FINANCIAL STATEMENTS JUNE 30, 2019
Page | 43
penalty and interest on or before January 14 and June 14. Penalty for late payment is 10 percent or $10, whichever is greater not to exceed the full amount of the tax.
The City bills and collects its own property taxes. Delinquent property taxes may be sent to collection services. Property taxes levied January 1, 2019, are intended to finance operations of the fiscal year ended June 30, 2019. The real estate taxes assessed and due on January 14, 2019, and June 14, 2019, are intended to finance operations of the fiscal year ended June 30, 2019.
3. CASH AND CASH EQUIVALENTS AND INVESTMENTS
A. Cash and Cash Equivalents – Primary Government
At June 30, 2019, cash on hand, cash items and petty cash totaled approximately $49,099 and the carrying value of the City'sdemand deposits, savings accounts, and time certificates of deposit with institutions totaled $92,139,276 and is included in cashand cash equivalents. The City's deposits of $92,139,276 were covered by federal depository insurance or insured in accordance with provisions of the Virginia Security for Public Deposit Act (the Act). This Act requires financial institutions holding publicdeposits in excess of amounts covered by federal insurance to pledge collateral in the amount of 50 percent of excess deposits,while savings and loans are required to collateralize 100 percent of excess deposits. The State Treasury Board can assessadditional collateral from participating financial institutions to cover collateral shortfalls in the event of default and is responsiblefor monitoring compliance with the collateralization and reporting requirements of the Act and for notifying local governments ofcompliance by financial institutions. All funds, unless otherwise classified as restricted, are deposited into pooled bank accounts;the major account defined as the General Fund concentration account. As disbursements are made from the payroll, budget andsocial services bank accounts, funds from the general fund concentration account are automatically transferred to those bankaccounts to cover those disbursements on a daily basis. All cash classified as restricted are related to grantor or debtorrequirements.
Custodial credit risk for deposits: All cash of the City is maintained in accounts collateralized in accordance with the Virginia Security for Public Deposits Act (theAct), Section 2.2-4400 et. Seq. of the Code of Virginia or covered by Federal Depository Insurance Corporation (FDIC). Under the Act, banks holding public deposits in excess of the amounts insured by the FDIC must pledge collateral of 50 percent of theexcess deposits to a collateral pool in the name of the State Treasury Board. Savings and loan institutions are required to collateralize 100 percent of deposits in excess of the FDIC limits and are considered insured. At June 30, 2019, the City did nothave any deposits that were not covered by depository insurance or collateralized under the Virginia Security for Public DepositsAct.
B. Investments
Investment Policy:City policy is consistent with the statutes of the Commonwealth of Virginia governing investment, wherein permissibleinvestments include obligations of the Commonwealth, the United States, its agencies and instrumentalities, time certificates ofdeposit, bankers' acceptances, repurchase agreements, demand notes, commercial paper, the State Treasurer’s LocalGovernment Investments Pool (the Virginia LGIP), and the State Non-Arbitrage Program (SNAP). As of June 30, 2019, all non-system investments were in either LGIP or SNAP, which were both rated AAAm, and the length of the investments for bothprograms was less than 90 days. Additionally, the City is authorized to place investments of the RRS in common stocks, corporatedebt securities, U.S. Government and Agency Securities, international stocks and bonds, money market, and mutual funds. Atno time, shall more than 35 percent of the portfolio be invested in commercial paper. No more than 5 percent of the portfolio shallbe invested in the commercial paper of a single entity.
Custodial credit risk for investments:As of June 30, 2019, the City holds its investment securities primarily in external investment pools and thus is not subject tocustodial credit risk disclosure.
Concentration Risk:As of June 30, 2019, the City does not have concentration of credit risk, as no investments were with any one issuer representingmore than 5 percent of total investments.
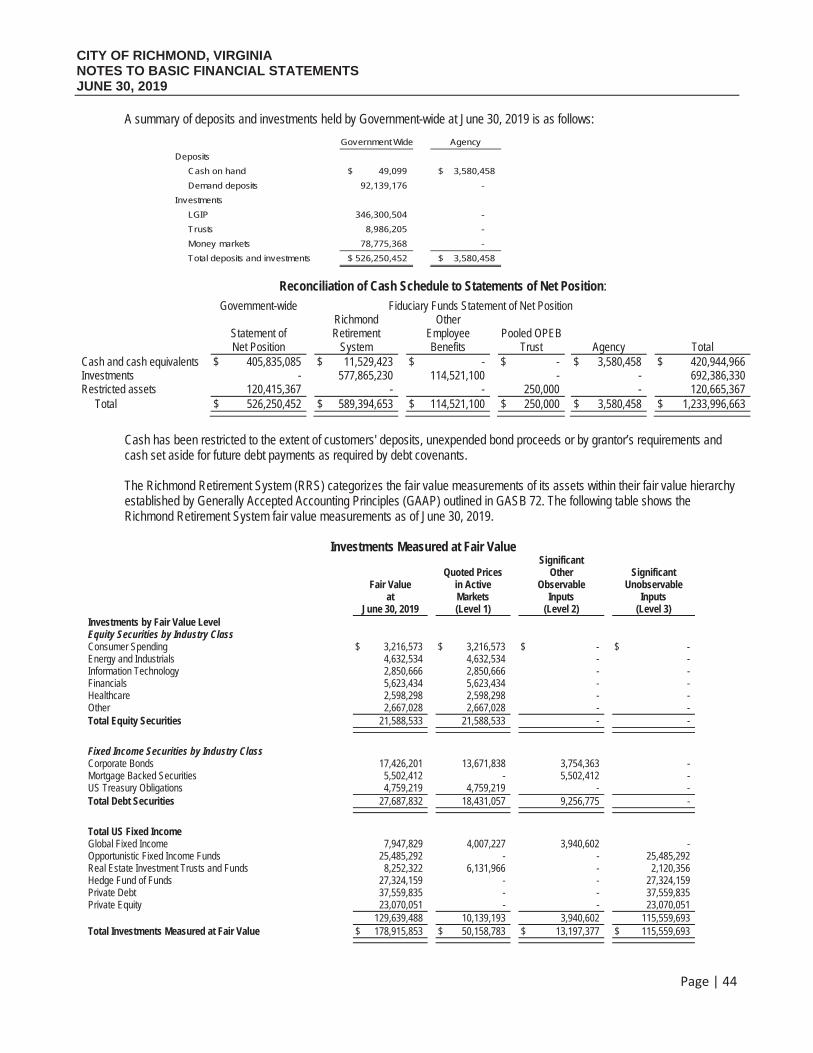
CITY OF RICHMOND, VIRGINIA NOTES TO BASIC FINANCIAL STATEMENTS JUNE 30, 2019
Page | 44
A summary of deposits and investments held by Government-wide at June 30, 2019 is as follows:
Reconciliation of Cash Schedule to Statements of Net Position:
Government-wide Fiduciary Funds Statement of Net Position
Statement of Net Position
RichmondRetirement
System
Other Employee Benefits
Pooled OPEB Trust Agency Total
Cash and cash equivalents $ 405,835,085 $ 11,529,423 $ - $ - $ 3,580,458 $ 420,944,966 Investments - 577,865,230 114,521,100 - - 692,386,330 Restricted assets 120,415,367 - - 250,000 - 120,665,367 Total $ 526,250,452 $ 589,394,653 $ 114,521,100 $ 250,000 $ 3,580,458 $ 1,233,996,663
Cash has been restricted to the extent of customers' deposits, unexpended bond proceeds or by grantor’s requirements and cash set aside for future debt payments as required by debt covenants.
The Richmond Retirement System (RRS) categorizes the fair value measurements of its assets within their fair value hierarchy established by Generally Accepted Accounting Principles (GAAP) outlined in GASB 72. The following table shows the Richmond Retirement System fair value measurements as of June 30, 2019.
Investments Measured at Fair Value
Fair Value at
June 30, 2019
Quoted Prices in Active Markets (Level 1)
Significant Other
Observable Inputs
(Level 2)
Significant Unobservable
Inputs (Level 3)
Investments by Fair Value Level Equity Securities by Industry Class Consumer Spending $ 3,216,573 $ 3,216,573 $ - $ - Energy and Industrials 4,632,534 4,632,534 - - Information Technology 2,850,666 2,850,666 - - Financials 5,623,434 5,623,434 - - Healthcare 2,598,298 2,598,298 - - Other 2,667,028 2,667,028 - - Total Equity Securities 21,588,533 21,588,533 - -
Fixed Income Securities by Industry ClassCorporate Bonds 17,426,201 13,671,838 3,754,363 - Mortgage Backed Securities 5,502,412 - 5,502,412 - US Treasury Obligations 4,759,219 4,759,219 - - Total Debt Securities 27,687,832 18,431,057 9,256,775 -
Total US Fixed Income Global Fixed Income 7,947,829 4,007,227 3,940,602 - Opportunistic Fixed Income Funds 25,485,292 - - 25,485,292 Real Estate Investment Trusts and Funds 8,252,322 6,131,966 - 2,120,356Hedge Fund of Funds 27,324,159 - - 27,324,159Private Debt 37,559,835 - - 37,559,835Private Equity 23,070,051 - - 23,070,051
129,639,488 10,139,193 3,940,602 115,559,693 Total Investments Measured at Fair Value $ 178,915,853 $ 50,158,783 $ 13,197,377 $ 115,559,693
Government Wide Agency
Deposits
Cash on hand 49,099$ 3,580,458$
Demand deposits 92,139,176 -
Investments
LGIP 346,300,504 -
Trusts 8,986,205 -
Money markets 78,775,368 -
Total deposits and investments $ 526,250,452 3,580,458$
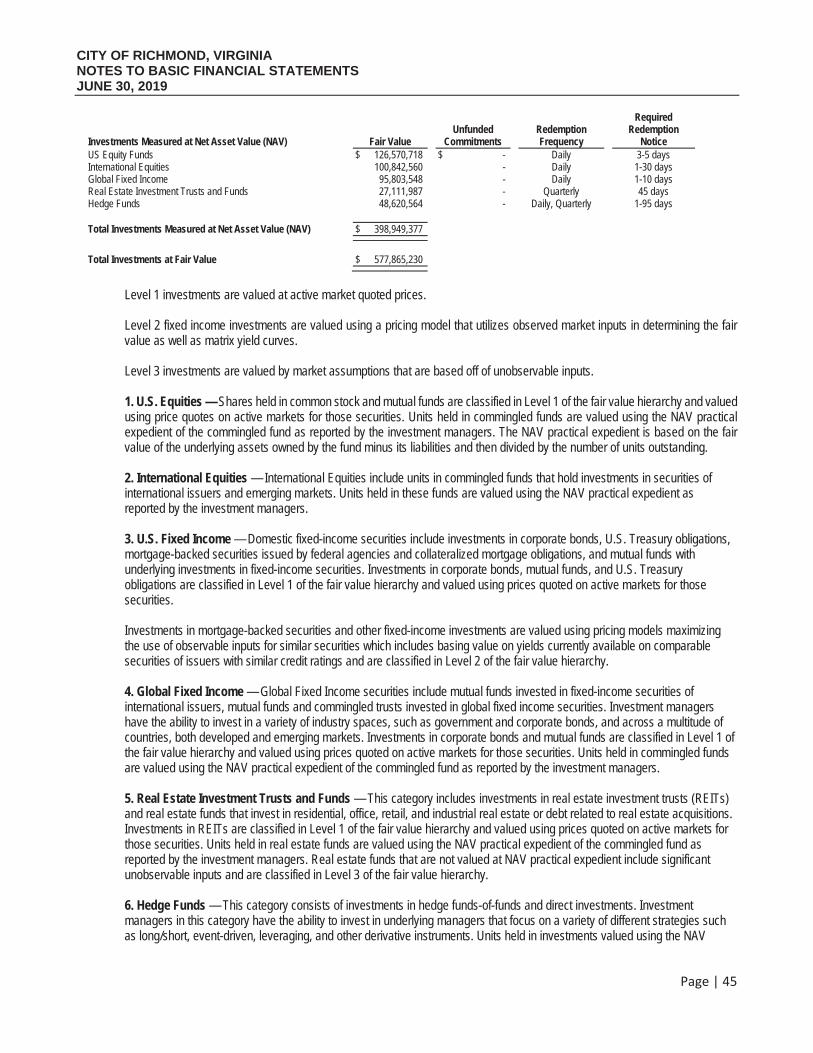
CITY OF RICHMOND, VIRGINIA NOTES TO BASIC FINANCIAL STATEMENTS JUNE 30, 2019
Page | 45
Investments Measured at Net Asset Value (NAV) Fair Value Unfunded
Commitments Redemption Frequency
Required Redemption
Notice US Equity Funds $ 126,570,718 $ - Daily 3-5 days International Equities 100,842,560 - Daily 1-30 days Global Fixed Income 95,803,548 - Daily 1-10 days Real Estate Investment Trusts and Funds 27,111,987 - Quarterly 45 days Hedge Funds 48,620,564 - Daily, Quarterly 1-95 days
Total Investments Measured at Net Asset Value (NAV) $ 398,949,377
Total Investments at Fair Value $ 577,865,230
Level 1 investments are valued at active market quoted prices.
Level 2 fixed income investments are valued using a pricing model that utilizes observed market inputs in determining the fair value as well as matrix yield curves.
Level 3 investments are valued by market assumptions that are based off of unobservable inputs.
1. U.S. Equities — Shares held in common stock and mutual funds are classified in Level 1 of the fair value hierarchy and valued using price quotes on active markets for those securities. Units held in commingled funds are valued using the NAV practicalexpedient of the commingled fund as reported by the investment managers. The NAV practical expedient is based on the fairvalue of the underlying assets owned by the fund minus its liabilities and then divided by the number of units outstanding.
2. International Equities — International Equities include units in commingled funds that hold investments in securities ofinternational issuers and emerging markets. Units held in these funds are valued using the NAV practical expedient asreported by the investment managers.
3. U.S. Fixed Income — Domestic fixed-income securities include investments in corporate bonds, U.S. Treasury obligations,mortgage-backed securities issued by federal agencies and collateralized mortgage obligations, and mutual funds withunderlying investments in fixed-income securities. Investments in corporate bonds, mutual funds, and U.S. Treasuryobligations are classified in Level 1 of the fair value hierarchy and valued using prices quoted on active markets for thosesecurities.
Investments in mortgage-backed securities and other fixed-income investments are valued using pricing models maximizing the use of observable inputs for similar securities which includes basing value on yields currently available on comparable securities of issuers with similar credit ratings and are classified in Level 2 of the fair value hierarchy.
4. Global Fixed Income — Global Fixed Income securities include mutual funds invested in fixed-income securities ofinternational issuers, mutual funds and commingled trusts invested in global fixed income securities. Investment managershave the ability to invest in a variety of industry spaces, such as government and corporate bonds, and across a multitude ofcountries, both developed and emerging markets. Investments in corporate bonds and mutual funds are classified in Level 1 ofthe fair value hierarchy and valued using prices quoted on active markets for those securities. Units held in commingled fundsare valued using the NAV practical expedient of the commingled fund as reported by the investment managers.
5. Real Estate Investment Trusts and Funds — This category includes investments in real estate investment trusts (REITs)and real estate funds that invest in residential, office, retail, and industrial real estate or debt related to real estate acquisitions.Investments in REITs are classified in Level 1 of the fair value hierarchy and valued using prices quoted on active markets forthose securities. Units held in real estate funds are valued using the NAV practical expedient of the commingled fund asreported by the investment managers. Real estate funds that are not valued at NAV practical expedient include significantunobservable inputs and are classified in Level 3 of the fair value hierarchy.
6. Hedge Funds — This category consists of investments in hedge funds-of-funds and direct investments. Investmentmanagers in this category have the ability to invest in underlying managers that focus on a variety of different strategies suchas long/short, event-driven, leveraging, and other derivative instruments. Units held in investments valued using the NAV
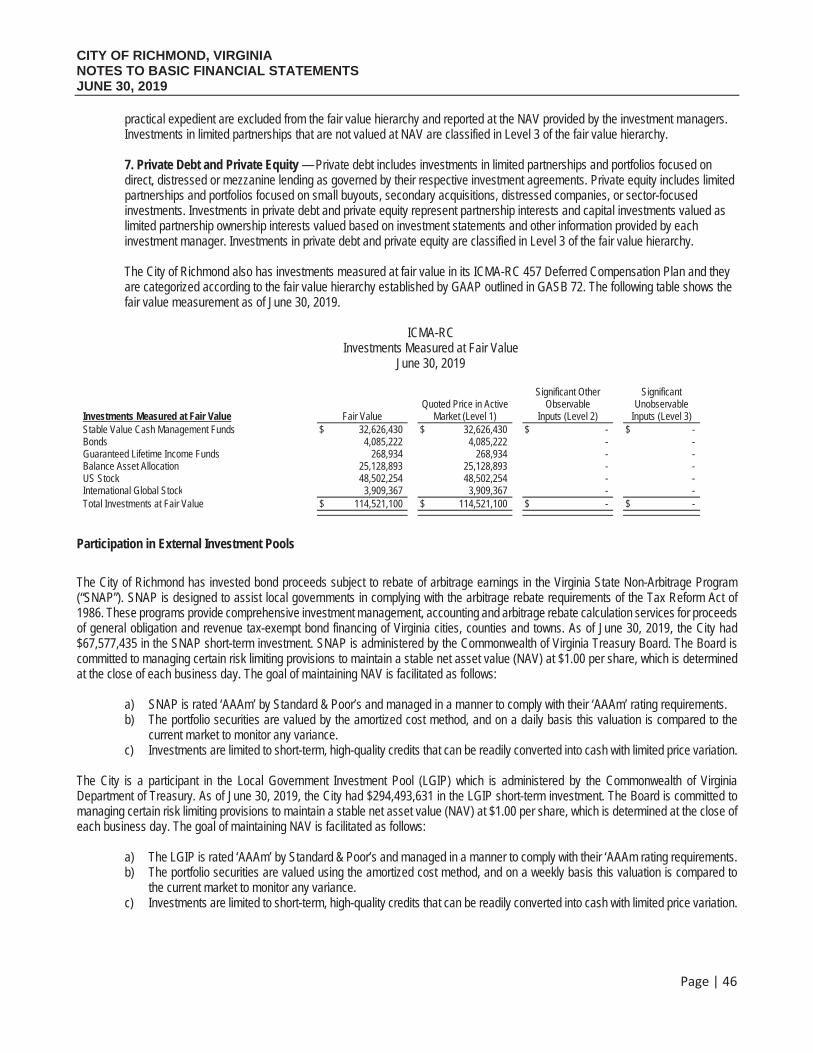
CITY OF RICHMOND, VIRGINIA NOTES TO BASIC FINANCIAL STATEMENTS JUNE 30, 2019
Page | 46
practical expedient are excluded from the fair value hierarchy and reported at the NAV provided by the investment managers. Investments in limited partnerships that are not valued at NAV are classified in Level 3 of the fair value hierarchy.
7. Private Debt and Private Equity — Private debt includes investments in limited partnerships and portfolios focused ondirect, distressed or mezzanine lending as governed by their respective investment agreements. Private equity includes limitedpartnerships and portfolios focused on small buyouts, secondary acquisitions, distressed companies, or sector-focusedinvestments. Investments in private debt and private equity represent partnership interests and capital investments valued aslimited partnership ownership interests valued based on investment statements and other information provided by eachinvestment manager. Investments in private debt and private equity are classified in Level 3 of the fair value hierarchy.
The City of Richmond also has investments measured at fair value in its ICMA-RC 457 Deferred Compensation Plan and they are categorized according to the fair value hierarchy established by GAAP outlined in GASB 72. The following table shows the fair value measurement as of June 30, 2019.
ICMA-RCInvestments Measured at Fair Value
June 30, 2019
Investments Measured at Fair Value Fair Value Quoted Price in Active
Market (Level 1)
Significant Other Observable
Inputs (Level 2)
Significant Unobservable
Inputs (Level 3) Stable Value Cash Management Funds $ 32,626,430 $ 32,626,430 $ - $ - Bonds 4,085,222 4,085,222 - - Guaranteed Lifetime Income Funds 268,934 268,934 - - Balance Asset Allocation 25,128,893 25,128,893 - - US Stock 48,502,254 48,502,254 - - International Global Stock 3,909,367 3,909,367 - - Total Investments at Fair Value $ 114,521,100 $ 114,521,100 $ - $ -
Participation in External Investment Pools
The City of Richmond has invested bond proceeds subject to rebate of arbitrage earnings in the Virginia State Non-Arbitrage Program(“SNAP”). SNAP is designed to assist local governments in complying with the arbitrage rebate requirements of the Tax Reform Act of 1986. These programs provide comprehensive investment management, accounting and arbitrage rebate calculation services for proceedsof general obligation and revenue tax-exempt bond financing of Virginia cities, counties and towns. As of June 30, 2019, the City had $67,577,435 in the SNAP short-term investment. SNAP is administered by the Commonwealth of Virginia Treasury Board. The Board iscommitted to managing certain risk limiting provisions to maintain a stable net asset value (NAV) at $1.00 per share, which is determined at the close of each business day. The goal of maintaining NAV is facilitated as follows:
a) SNAP is rated ‘AAAm’ by Standard & Poor’s and managed in a manner to comply with their ‘AAAm’ rating requirements.b) The portfolio securities are valued by the amortized cost method, and on a daily basis this valuation is compared to the
current market to monitor any variance.c) Investments are limited to short-term, high-quality credits that can be readily converted into cash with limited price variation.
The City is a participant in the Local Government Investment Pool (LGIP) which is administered by the Commonwealth of Virginia Department of Treasury. As of June 30, 2019, the City had $294,493,631 in the LGIP short-term investment. The Board is committed to managing certain risk limiting provisions to maintain a stable net asset value (NAV) at $1.00 per share, which is determined at the close of each business day. The goal of maintaining NAV is facilitated as follows:
a) The LGIP is rated ‘AAAm’ by Standard & Poor’s and managed in a manner to comply with their ‘AAAm rating requirements.b) The portfolio securities are valued using the amortized cost method, and on a weekly basis this valuation is compared to
the current market to monitor any variance.c) Investments are limited to short-term, high-quality credits that can be readily converted into cash with limited price variation.
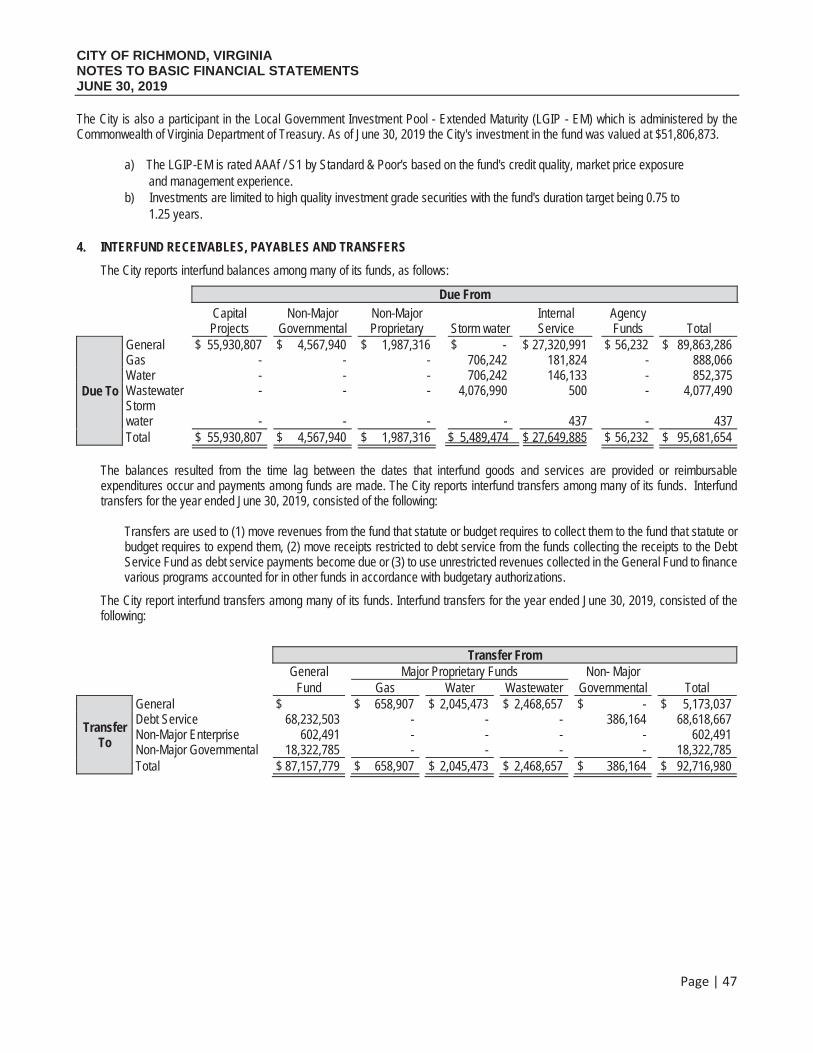
CITY OF RICHMOND, VIRGINIA NOTES TO BASIC FINANCIAL STATEMENTS JUNE 30, 2019
Page | 47
The City is also a participant in the Local Government Investment Pool - Extended Maturity (LGIP - EM) which is administered by the Commonwealth of Virginia Department of Treasury. As of June 30, 2019 the City's investment in the fund was valued at $51,806,873.
a) The LGIP-EM is rated AAAf / S1 by Standard & Poor's based on the fund's credit quality, market price exposureand management experience.
b) Investments are limited to high quality investment grade securities with the fund's duration target being 0.75 to1.25 years.
4. INTERFUND RECEIVABLES, PAYABLES AND TRANSFERS
The City reports interfund balances among many of its funds, as follows:
Due From CapitalProjects
Non-MajorGovernmental
Non-MajorProprietary Storm water
InternalService
AgencyFunds Total
Due To
General $ 55,930,807 $ 4,567,940 $ 1,987,316 $ - $ 27,320,991 $ 56,232 $ 89,863,286Gas - - - 706,242 181,824 - 888,066Water - - - 706,242 146,133 - 852,375Wastewater - - - 4,076,990 500 - 4,077,490Stormwater - - - - 437 - 437Total $ 55,930,807 $ 4,567,940 $ 1,987,316 $ 5,489,474 $ 27,649,885 $ 56,232 $ 95,681,654
The balances resulted from the time lag between the dates that interfund goods and services are provided or reimbursable expenditures occur and payments among funds are made. The City reports interfund transfers among many of its funds. Interfund transfers for the year ended June 30, 2019, consisted of the following:
Transfers are used to (1) move revenues from the fund that statute or budget requires to collect them to the fund that statute orbudget requires to expend them, (2) move receipts restricted to debt service from the funds collecting the receipts to the DebtService Fund as debt service payments become due or (3) to use unrestricted revenues collected in the General Fund to finance various programs accounted for in other funds in accordance with budgetary authorizations.
The City report interfund transfers among many of its funds. Interfund transfers for the year ended June 30, 2019, consisted of the following:
Transfer From General Major Proprietary Funds Non- Major
Fund Gas Water Wastewater Governmental Total
TransferTo
General $ $ 658,907 $ 2,045,473 $ 2,468,657 $ - $ 5,173,037Debt Service 68,232,503 - - - 386,164 68,618,667 Non-Major Enterprise 602,491 - - - - 602,491 Non-Major Governmental 18,322,785 - - - - 18,322,785 Total $ 87,157,779 $ 658,907 $ 2,045,473 $ 2,468,657 $ 386,164 $ 92,716,980
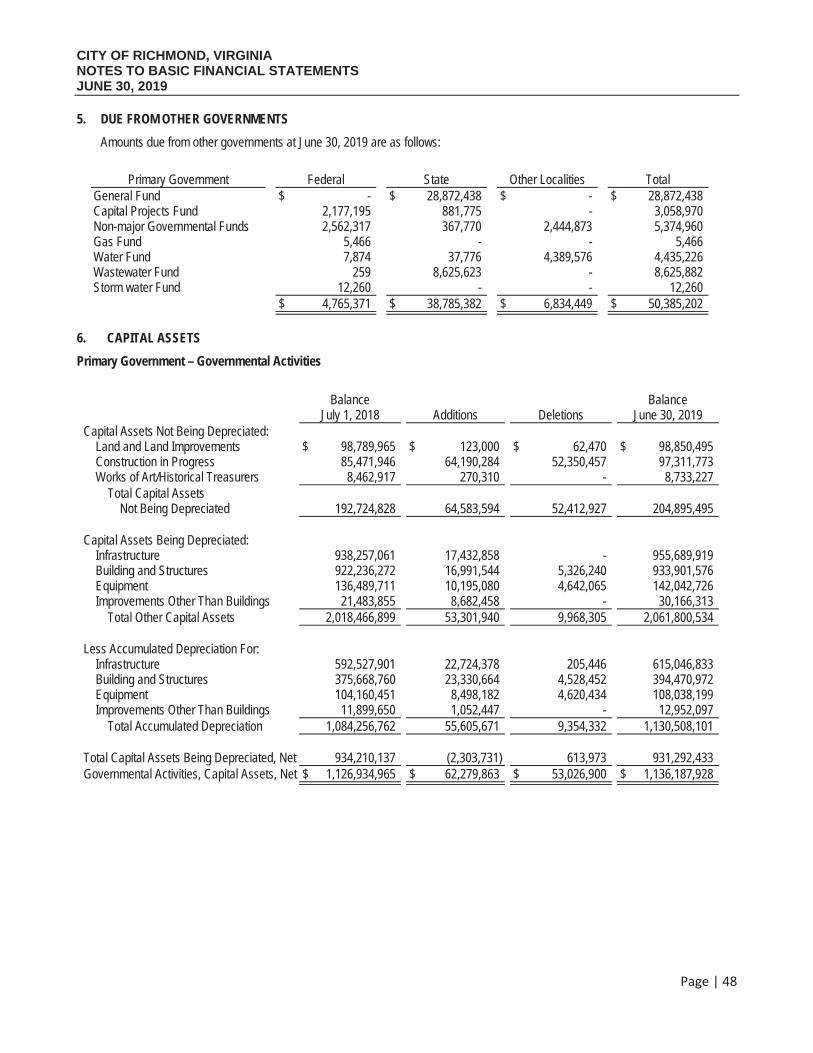
CITY OF RICHMOND, VIRGINIA NOTES TO BASIC FINANCIAL STATEMENTS JUNE 30, 2019
Page | 48
5. DUE FROM OTHER GOVERNMENTS
Amounts due from other governments at June 30, 2019 are as follows:
Primary Government Federal State Other Localities Total General Fund $ - $ 28,872,438 $ - $ 28,872,438Capital Projects Fund 2,177,195 881,775 - 3,058,970Non-major Governmental Funds 2,562,317 367,770 2,444,873 5,374,960 Gas Fund 5,466 - - 5,466Water Fund 7,874 37,776 4,389,576 4,435,226 Wastewater Fund 259 8,625,623 - 8,625,882Storm water Fund 12,260 - - 12,260
$ 4,765,371 $ 38,785,382 $ 6,834,449 $ 50,385,202
6. CAPITAL ASSETS
Primary Government – Governmental Activities
BalanceJuly 1, 2018 Additions Deletions
Balance June 30, 2019
Capital Assets Not Being Depreciated: Land and Land Improvements $ 98,789,965 $ 123,000 $ 62,470 $ 98,850,495 Construction in Progress 85,471,946 64,190,284 52,350,457 97,311,773 Works of Art/Historical Treasurers 8,462,917 270,310 - 8,733,227 Total Capital Assets Not Being Depreciated 192,724,828 64,583,594 52,412,927 204,895,495
Capital Assets Being Depreciated: Infrastructure 938,257,061 17,432,858 - 955,689,919 Building and Structures 922,236,272 16,991,544 5,326,240 933,901,576 Equipment 136,489,711 10,195,080 4,642,065 142,042,726 Improvements Other Than Buildings 21,483,855 8,682,458 - 30,166,313 Total Other Capital Assets 2,018,466,899 53,301,940 9,968,305 2,061,800,534
Less Accumulated Depreciation For: Infrastructure 592,527,901 22,724,378 205,446 615,046,833 Building and Structures 375,668,760 23,330,664 4,528,452 394,470,972 Equipment 104,160,451 8,498,182 4,620,434 108,038,199 Improvements Other Than Buildings 11,899,650 1,052,447 - 12,952,097 Total Accumulated Depreciation 1,084,256,762 55,605,671 9,354,332 1,130,508,101
Total Capital Assets Being Depreciated, Net 934,210,137 (2,303,731) 613,973 931,292,433 Governmental Activities, Capital Assets, Net $ 1,126,934,965 $ 62,279,863 $ 53,026,900 $ 1,136,187,928
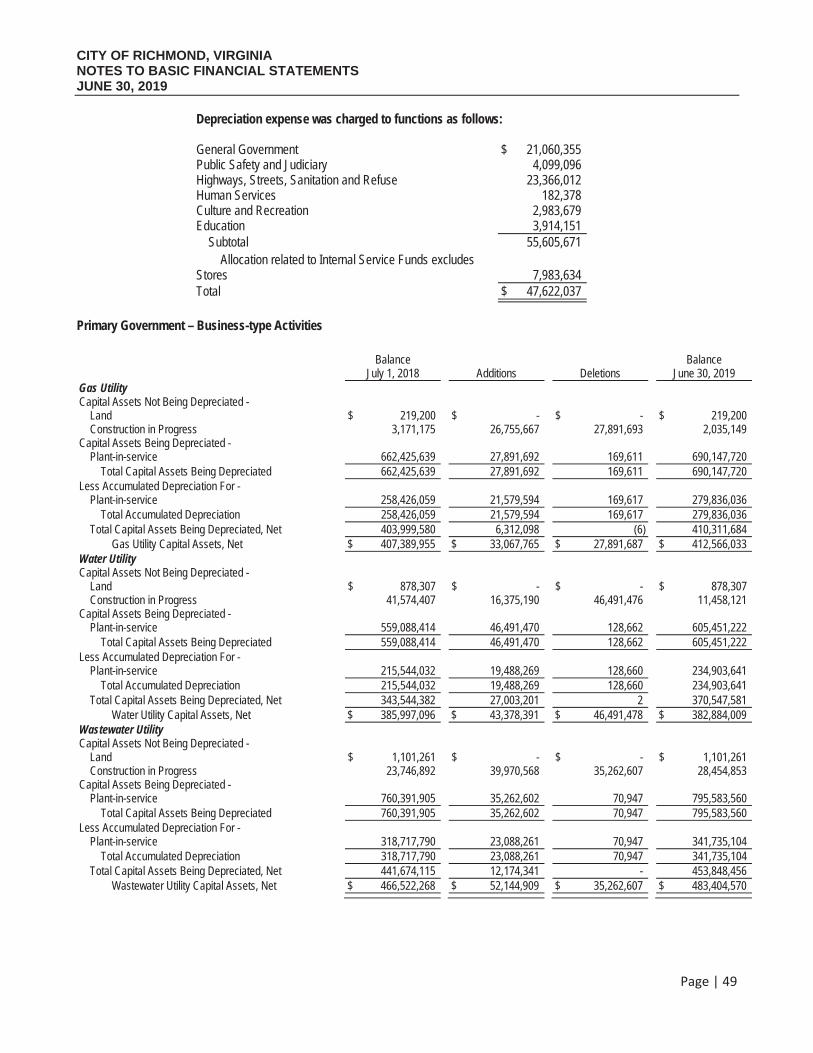
CITY OF RICHMOND, VIRGINIA NOTES TO BASIC FINANCIAL STATEMENTS JUNE 30, 2019
Page | 49
Depreciation expense was charged to functions as follows:
General Government $ 21,060,355 Public Safety and Judiciary 4,099,096Highways, Streets, Sanitation and Refuse 23,366,012Human Services 182,378Culture and Recreation 2,983,679Education 3,914,151 Subtotal 55,605,671
Allocation related to Internal Service Funds excludes Stores 7,983,634 Total $ 47,622,037
Primary Government – Business-type Activities
Balance July 1, 2018 Additions Deletions
Balance June 30, 2019
Gas Utility Capital Assets Not Being Depreciated - Land $ 219,200 $ - $ - $ 219,200 Construction in Progress 3,171,175 26,755,667 27,891,693 2,035,149 Capital Assets Being Depreciated - Plant-in-service 662,425,639 27,891,692 169,611 690,147,720 Total Capital Assets Being Depreciated 662,425,639 27,891,692 169,611 690,147,720 Less Accumulated Depreciation For - Plant-in-service 258,426,059 21,579,594 169,617 279,836,036
Total Accumulated Depreciation 258,426,059 21,579,594 169,617 279,836,036 Total Capital Assets Being Depreciated, Net 403,999,580 6,312,098 (6) 410,311,684 Gas Utility Capital Assets, Net $ 407,389,955 $ 33,067,765 $ 27,891,687 $ 412,566,033 Water Utility Capital Assets Not Being Depreciated - Land $ 878,307 $ - $ - $ 878,307 Construction in Progress 41,574,407 16,375,190 46,491,476 11,458,121 Capital Assets Being Depreciated - Plant-in-service 559,088,414 46,491,470 128,662 605,451,222 Total Capital Assets Being Depreciated 559,088,414 46,491,470 128,662 605,451,222 Less Accumulated Depreciation For - Plant-in-service 215,544,032 19,488,269 128,660 234,903,641
Total Accumulated Depreciation 215,544,032 19,488,269 128,660 234,903,641 Total Capital Assets Being Depreciated, Net 343,544,382 27,003,201 2 370,547,581 Water Utility Capital Assets, Net $ 385,997,096 $ 43,378,391 $ 46,491,478 $ 382,884,009 Wastewater Utility Capital Assets Not Being Depreciated - Land $ 1,101,261 $ - $ - $ 1,101,261 Construction in Progress 23,746,892 39,970,568 35,262,607 28,454,853 Capital Assets Being Depreciated - Plant-in-service 760,391,905 35,262,602 70,947 795,583,560 Total Capital Assets Being Depreciated 760,391,905 35,262,602 70,947 795,583,560 Less Accumulated Depreciation For - Plant-in-service 318,717,790 23,088,261 70,947 341,735,104 Total Accumulated Depreciation 318,717,790 23,088,261 70,947 341,735,104 Total Capital Assets Being Depreciated, Net 441,674,115 12,174,341 - 453,848,456
Wastewater Utility Capital Assets, Net $ 466,522,268 $ 52,144,909 $ 35,262,607 $ 483,404,570
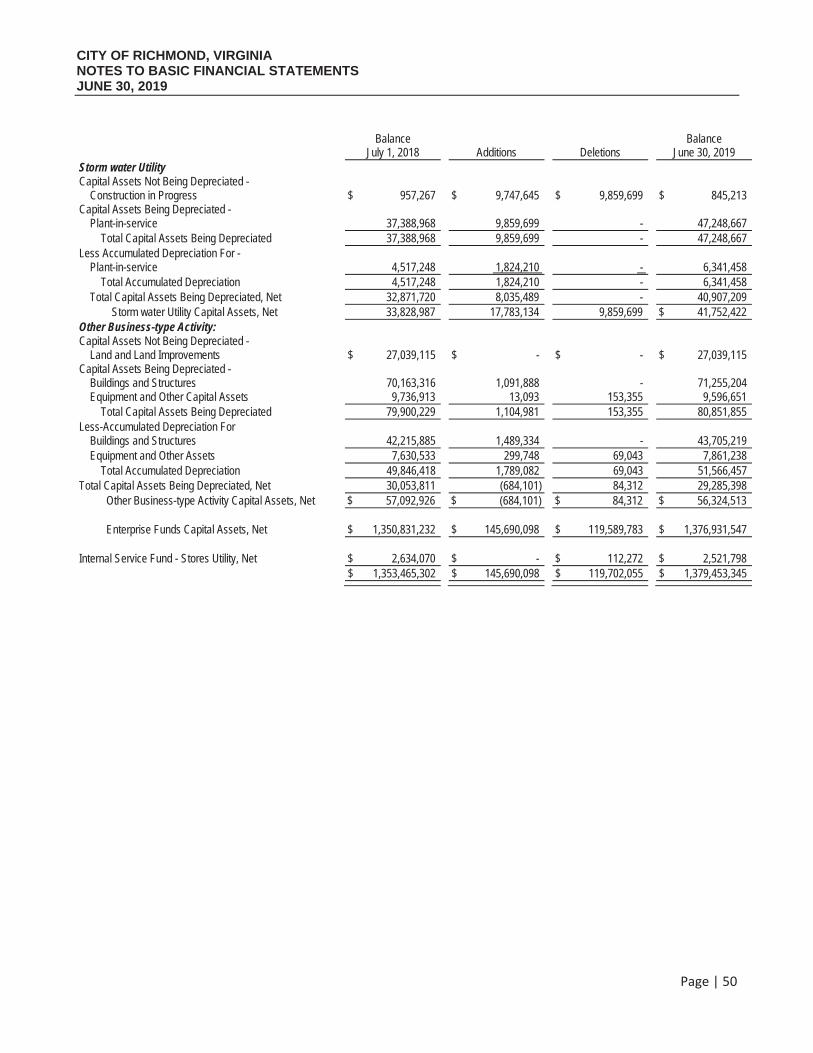
CITY OF RICHMOND, VIRGINIA NOTES TO BASIC FINANCIAL STATEMENTS JUNE 30, 2019
Page | 50
Balance July 1, 2018 Additions Deletions
Balance June 30, 2019
Storm water Utility Capital Assets Not Being Depreciated - Construction in Progress $ 957,267 $ 9,747,645 $ 9,859,699 $ 845,213 Capital Assets Being Depreciated - Plant-in-service 37,388,968 9,859,699 - 47,248,667 Total Capital Assets Being Depreciated 37,388,968 9,859,699 - 47,248,667Less Accumulated Depreciation For - Plant-in-service 4,517,248 1,824,210 - 6,341,458
Total Accumulated Depreciation 4,517,248 1,824,210 - 6,341,458 Total Capital Assets Being Depreciated, Net 32,871,720 8,035,489 - 40,907,209 Storm water Utility Capital Assets, Net 33,828,987 17,783,134 9,859,699 $ 41,752,422 Other Business-type Activity: Capital Assets Not Being Depreciated - Land and Land Improvements $ 27,039,115 $ - $ - $ 27,039,115 Capital Assets Being Depreciated - Buildings and Structures 70,163,316 1,091,888 - 71,255,204 Equipment and Other Capital Assets 9,736,913 13,093 153,355 9,596,651 Total Capital Assets Being Depreciated 79,900,229 1,104,981 153,355 80,851,855 Less-Accumulated Depreciation For Buildings and Structures 42,215,885 1,489,334 - 43,705,219 Equipment and Other Assets 7,630,533 299,748 69,043 7,861,238 Total Accumulated Depreciation 49,846,418 1,789,082 69,043 51,566,457 Total Capital Assets Being Depreciated, Net 30,053,811 (684,101) 84,312 29,285,398
Other Business-type Activity Capital Assets, Net $ 57,092,926 $ (684,101) $ 84,312 $ 56,324,513
Enterprise Funds Capital Assets, Net $ 1,350,831,232 $ 145,690,098 $ 119,589,783 $ 1,376,931,547
Internal Service Fund - Stores Utility, Net $ 2,634,070 $ - $ 112,272 $ 2,521,798 $ 1,353,465,302 $ 145,690,098 $ 119,702,055 $ 1,379,453,345
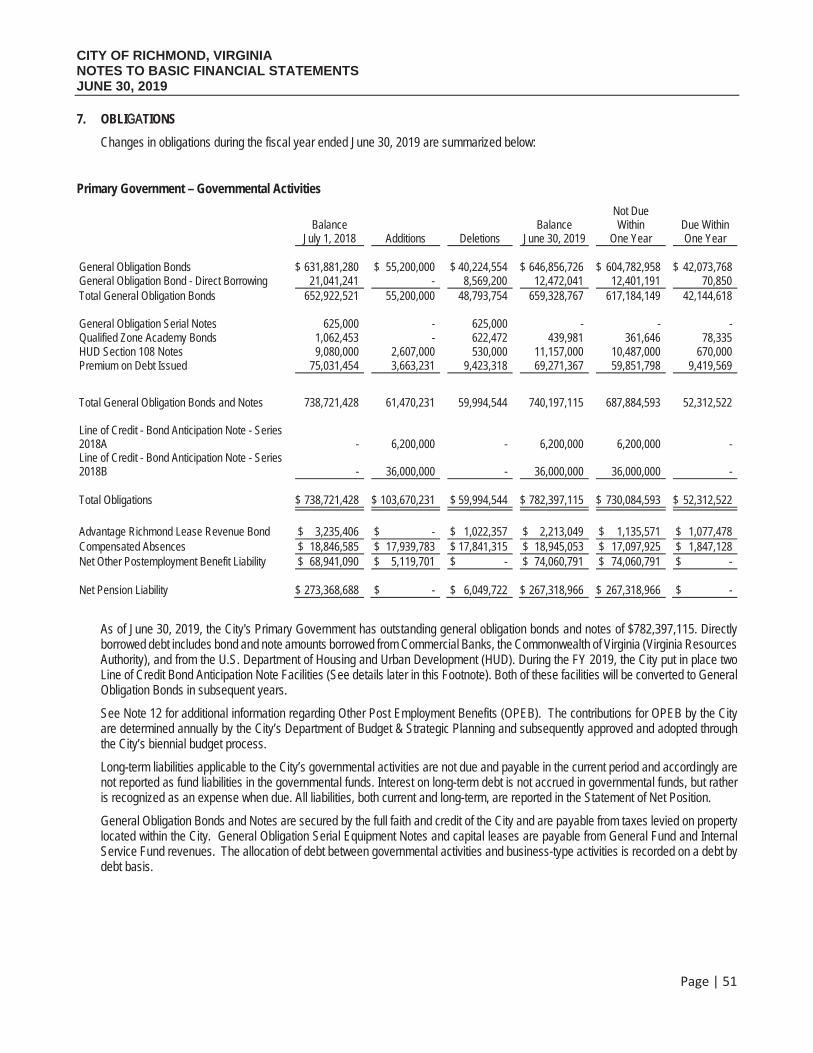
CITY OF RICHMOND, VIRGINIA NOTES TO BASIC FINANCIAL STATEMENTS JUNE 30, 2019
Page | 51
7. OBLIGATIONS
Changes in obligations during the fiscal year ended June 30, 2019 are summarized below:
Primary Government – Governmental Activities
Balance July 1, 2018 Additions Deletions
Balance June 30, 2019
Not Due Within
One Year Due Within One Year
General Obligation Bonds $ 631,881,280 $ 55,200,000 $ 40,224,554 $ 646,856,726 $ 604,782,958 $ 42,073,768 General Obligation Bond - Direct Borrowing 21,041,241 - 8,569,200 12,472,041 12,401,191 70,850 Total General Obligation Bonds 652,922,521 55,200,000 48,793,754 659,328,767 617,184,149 42,144,618
General Obligation Serial Notes 625,000 - 625,000 - - -Qualified Zone Academy Bonds 1,062,453 - 622,472 439,981 361,646 78,335 HUD Section 108 Notes 9,080,000 2,607,000 530,000 11,157,000 10,487,000 670,000 Premium on Debt Issued 75,031,454 3,663,231 9,423,318 69,271,367 59,851,798 9,419,569
Total General Obligation Bonds and Notes 738,721,428 61,470,231 59,994,544 740,197,115 687,884,593 52,312,522
Line of Credit - Bond Anticipation Note - Series 2018A - 6,200,000 - 6,200,000 6,200,000 -Line of Credit - Bond Anticipation Note - Series 2018B - 36,000,000 - 36,000,000 36,000,000 -
Total Obligations $ 738,721,428 $ 103,670,231 $ 59,994,544 $ 782,397,115 $ 730,084,593 $ 52,312,522
Advantage Richmond Lease Revenue Bond $ 3,235,406 $ - $ 1,022,357 $ 2,213,049 $ 1,135,571 $ 1,077,478Compensated Absences $ 18,846,585 $ 17,939,783 $ 17,841,315 $ 18,945,053 $ 17,097,925 $ 1,847,128 Net Other Postemployment Benefit Liability $ 68,941,090 $ 5,119,701 $ - $ 74,060,791 $ 74,060,791 $ -
Net Pension Liability $ 273,368,688 $ - $ 6,049,722 $ 267,318,966 $ 267,318,966 $ -
As of June 30, 2019, the City's Primary Government has outstanding general obligation bonds and notes of $782,397,115. Directlyborrowed debt includes bond and note amounts borrowed from Commercial Banks, the Commonwealth of Virginia (Virginia Resources Authority), and from the U.S. Department of Housing and Urban Development (HUD). During the FY 2019, the City put in place two Line of Credit Bond Anticipation Note Facilities (See details later in this Footnote). Both of these facilities will be converted to General Obligation Bonds in subsequent years.
See Note 12 for additional information regarding Other Post Employment Benefits (OPEB). The contributions for OPEB by the Cityare determined annually by the City’s Department of Budget & Strategic Planning and subsequently approved and adopted through the City’s biennial budget process.
Long-term liabilities applicable to the City’s governmental activities are not due and payable in the current period and accordingly are not reported as fund liabilities in the governmental funds. Interest on long-term debt is not accrued in governmental funds, but rather is recognized as an expense when due. All liabilities, both current and long-term, are reported in the Statement of Net Position.
General Obligation Bonds and Notes are secured by the full faith and credit of the City and are payable from taxes levied on propertylocated within the City. General Obligation Serial Equipment Notes and capital leases are payable from General Fund and InternalService Fund revenues. The allocation of debt between governmental activities and business-type activities is recorded on a debt by debt basis.
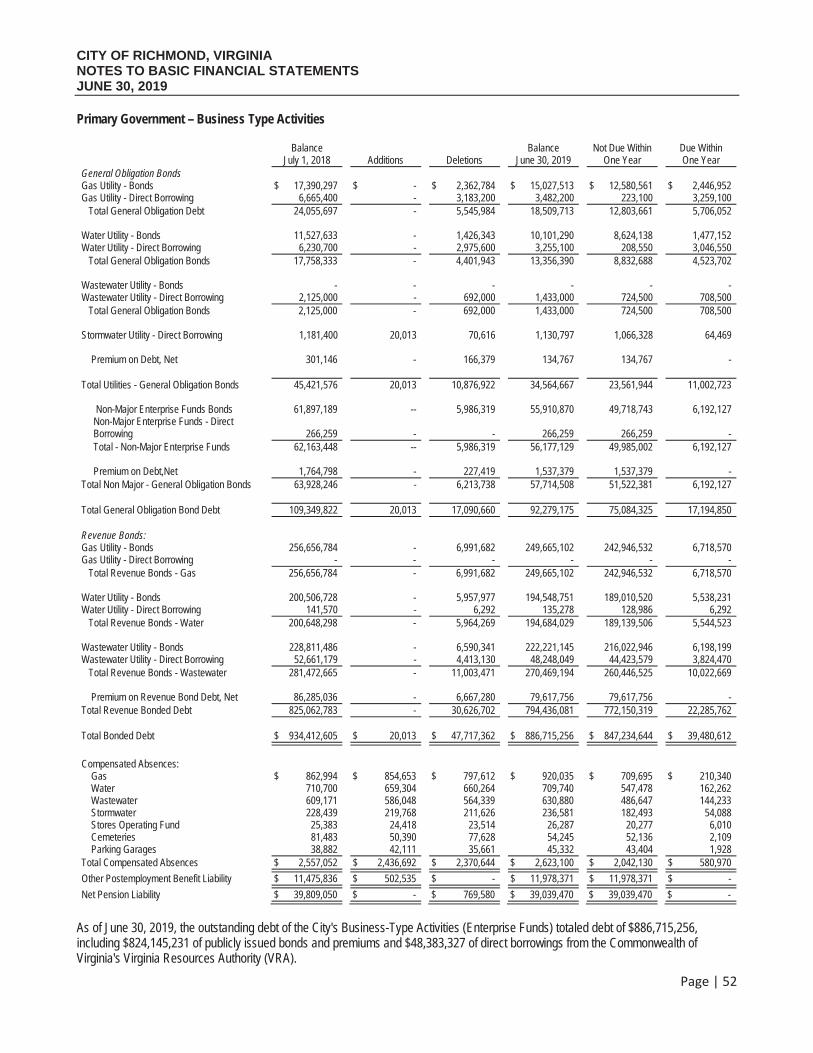
CITY OF RICHMOND, VIRGINIA NOTES TO BASIC FINANCIAL STATEMENTS JUNE 30, 2019
Page | 52
Primary Government – Business Type Activities
BalanceJuly 1, 2018 Additions Deletions
Balance June 30, 2019
Not Due Within One Year
Due Within One Year
General Obligation BondsGas Utility - Bonds $ 17,390,297 $ - $ 2,362,784 $ 15,027,513 $ 12,580,561 $ 2,446,952Gas Utility - Direct Borrowing 6,665,400 - 3,183,200 3,482,200 223,100 3,259,100 Total General Obligation Debt 24,055,697 - 5,545,984 18,509,713 12,803,661 5,706,052
Water Utility - Bonds 11,527,633 - 1,426,343 10,101,290 8,624,138 1,477,152 Water Utility - Direct Borrowing 6,230,700 - 2,975,600 3,255,100 208,550 3,046,550 Total General Obligation Bonds 17,758,333 - 4,401,943 13,356,390 8,832,688 4,523,702
Wastewater Utility - Bonds - - - - - -Wastewater Utility - Direct Borrowing 2,125,000 - 692,000 1,433,000 724,500 708,500 Total General Obligation Bonds 2,125,000 - 692,000 1,433,000 724,500 708,500
Stormwater Utility - Direct Borrowing 1,181,400 20,013 70,616 1,130,797 1,066,328 64,469
Premium on Debt, Net 301,146 - 166,379 134,767 134,767 -
Total Utilities - General Obligation Bonds 45,421,576 20,013 10,876,922 34,564,667 23,561,944 11,002,723
Non-Major Enterprise Funds Bonds 61,897,189 -- 5,986,319 55,910,870 49,718,743 6,192,127 Non-Major Enterprise Funds - Direct Borrowing 266,259 - - 266,259 266,259 - Total - Non-Major Enterprise Funds 62,163,448 -- 5,986,319 56,177,129 49,985,002 6,192,127
Premium on Debt,Net 1,764,798 - 227,419 1,537,379 1,537,379 - Total Non Major - General Obligation Bonds 63,928,246 - 6,213,738 57,714,508 51,522,381 6,192,127
Total General Obligation Bond Debt 109,349,822 20,013 17,090,660 92,279,175 75,084,325 17,194,850
Revenue Bonds: Gas Utility - Bonds 256,656,784 - 6,991,682 249,665,102 242,946,532 6,718,570 Gas Utility - Direct Borrowing - - - - - - Total Revenue Bonds - Gas 256,656,784 - 6,991,682 249,665,102 242,946,532 6,718,570
Water Utility - Bonds 200,506,728 - 5,957,977 194,548,751 189,010,520 5,538,231 Water Utility - Direct Borrowing 141,570 - 6,292 135,278 128,986 6,292 Total Revenue Bonds - Water 200,648,298 - 5,964,269 194,684,029 189,139,506 5,544,523
Wastewater Utility - Bonds 228,811,486 - 6,590,341 222,221,145 216,022,946 6,198,199 Wastewater Utility - Direct Borrowing 52,661,179 - 4,413,130 48,248,049 44,423,579 3,824,470 Total Revenue Bonds - Wastewater 281,472,665 - 11,003,471 270,469,194 260,446,525 10,022,669
Premium on Revenue Bond Debt, Net 86,285,036 - 6,667,280 79,617,756 79,617,756 - Total Revenue Bonded Debt 825,062,783 - 30,626,702 794,436,081 772,150,319 22,285,762
Total Bonded Debt $ 934,412,605 $ 20,013 $ 47,717,362 $ 886,715,256 $ 847,234,644 $ 39,480,612
Compensated Absences: Gas $ 862,994 $ 854,653 $ 797,612 $ 920,035 $ 709,695 $ 210,340 Water 710,700 659,304 660,264 709,740 547,478 162,262 Wastewater 609,171 586,048 564,339 630,880 486,647 144,233 Stormwater 228,439 219,768 211,626 236,581 182,493 54,088 Stores Operating Fund 25,383 24,418 23,514 26,287 20,277 6,010 Cemeteries 81,483 50,390 77,628 54,245 52,136 2,109 Parking Garages 38,882 42,111 35,661 45,332 43,404 1,928 Total Compensated Absences $ 2,557,052 $ 2,436,692 $ 2,370,644 $ 2,623,100 $ 2,042,130 $ 580,970
Other Postemployment Benefit Liability $ 11,475,836 $ 502,535 $ - $ 11,978,371 $ 11,978,371 $ -
Net Pension Liability $ 39,809,050 $ - $ 769,580 $ 39,039,470 $ 39,039,470 $ -
As of June 30, 2019, the outstanding debt of the City's Business-Type Activities (Enterprise Funds) totaled debt of $886,715,256,including $824,145,231 of publicly issued bonds and premiums and $48,383,327 of direct borrowings from the Commonwealth of Virginia's Virginia Resources Authority (VRA).
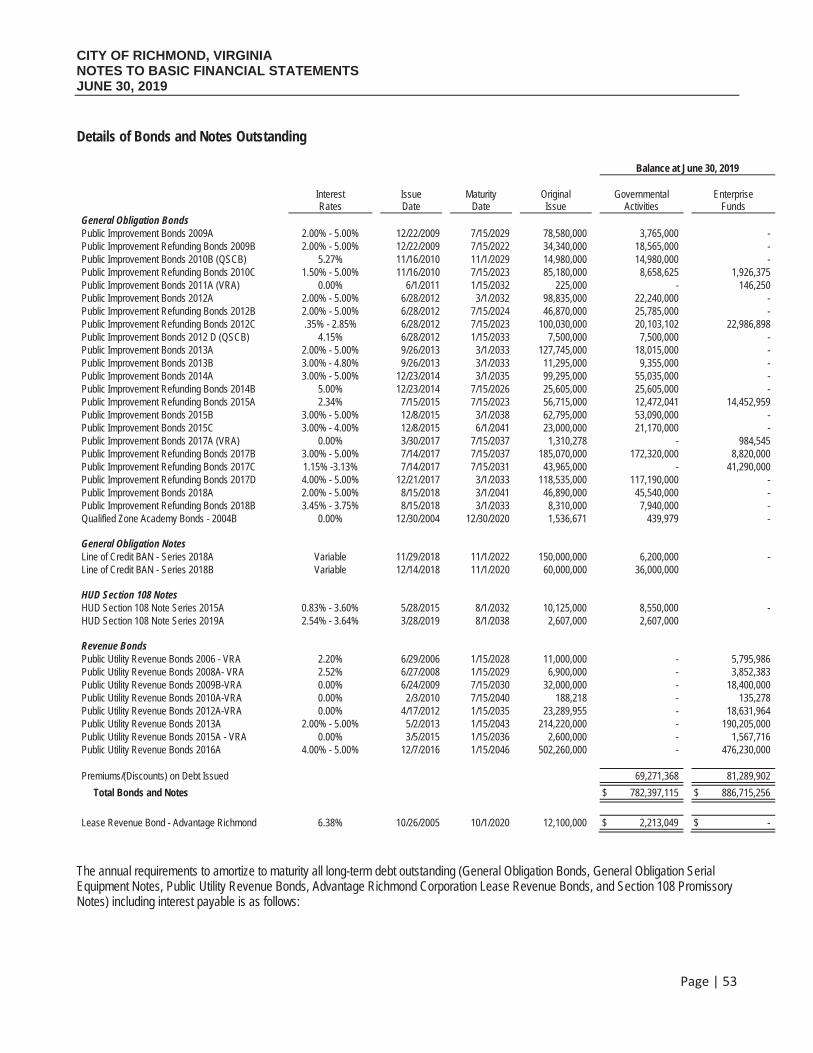
CITY OF RICHMOND, VIRGINIA NOTES TO BASIC FINANCIAL STATEMENTS JUNE 30, 2019
Page | 53
Details of Bonds and Notes Outstanding
Balance at June 30, 2019
Interest Rates
IssueDate
Maturity Date
OriginalIssue
Governmental Activities
Enterprise Funds
General Obligation Bonds Public Improvement Bonds 2009A 2.00% - 5.00% 12/22/2009 7/15/2029 78,580,000 3,765,000 - Public Improvement Refunding Bonds 2009B 2.00% - 5.00% 12/22/2009 7/15/2022 34,340,000 18,565,000 - Public Improvement Bonds 2010B (QSCB) 5.27% 11/16/2010 11/1/2029 14,980,000 14,980,000 - Public Improvement Refunding Bonds 2010C 1.50% - 5.00% 11/16/2010 7/15/2023 85,180,000 8,658,625 1,926,375 Public Improvement Bonds 2011A (VRA) 0.00% 6/1/2011 1/15/2032 225,000 - 146,250Public Improvement Bonds 2012A 2.00% - 5.00% 6/28/2012 3/1/2032 98,835,000 22,240,000 - Public Improvement Refunding Bonds 2012B 2.00% - 5.00% 6/28/2012 7/15/2024 46,870,000 25,785,000 - Public Improvement Refunding Bonds 2012C .35% - 2.85% 6/28/2012 7/15/2023 100,030,000 20,103,102 22,986,898 Public Improvement Bonds 2012 D (QSCB) 4.15% 6/28/2012 1/15/2033 7,500,000 7,500,000 - Public Improvement Bonds 2013A 2.00% - 5.00% 9/26/2013 3/1/2033 127,745,000 18,015,000 - Public Improvement Bonds 2013B 3.00% - 4.80% 9/26/2013 3/1/2033 11,295,000 9,355,000 - Public Improvement Bonds 2014A 3.00% - 5.00% 12/23/2014 3/1/2035 99,295,000 55,035,000 - Public Improvement Refunding Bonds 2014B 5.00% 12/23/2014 7/15/2026 25,605,000 25,605,000 - Public Improvement Refunding Bonds 2015A 2.34% 7/15/2015 7/15/2023 56,715,000 12,472,041 14,452,959 Public Improvement Bonds 2015B 3.00% - 5.00% 12/8/2015 3/1/2038 62,795,000 53,090,000 - Public Improvement Bonds 2015C 3.00% - 4.00% 12/8/2015 6/1/2041 23,000,000 21,170,000 - Public Improvement Bonds 2017A (VRA) 0.00% 3/30/2017 7/15/2037 1,310,278 - 984,545Public Improvement Refunding Bonds 2017B 3.00% - 5.00% 7/14/2017 7/15/2037 185,070,000 172,320,000 8,820,000Public Improvement Refunding Bonds 2017C 1.15% -3.13% 7/14/2017 7/15/2031 43,965,000 - 41,290,000Public Improvement Refunding Bonds 2017D 4.00% - 5.00% 12/21/2017 3/1/2033 118,535,000 117,190,000 - Public Improvement Bonds 2018A 2.00% - 5.00% 8/15/2018 3/1/2041 46,890,000 45,540,000 - Public Improvement Refunding Bonds 2018B 3.45% - 3.75% 8/15/2018 3/1/2033 8,310,000 7,940,000 - Qualified Zone Academy Bonds - 2004B 0.00% 12/30/2004 12/30/2020 1,536,671 439,979 -
General Obligation Notes Line of Credit BAN - Series 2018A Variable 11/29/2018 11/1/2022 150,000,000 6,200,000 - Line of Credit BAN - Series 2018B Variable 12/14/2018 11/1/2020 60,000,000 36,000,000
HUD Section 108 Notes HUD Section 108 Note Series 2015A 0.83% - 3.60% 5/28/2015 8/1/2032 10,125,000 8,550,000 - HUD Section 108 Note Series 2019A 2.54% - 3.64% 3/28/2019 8/1/2038 2,607,000 2,607,000
Revenue Bonds Public Utility Revenue Bonds 2006 - VRA 2.20% 6/29/2006 1/15/2028 11,000,000 - 5,795,986Public Utility Revenue Bonds 2008A- VRA 2.52% 6/27/2008 1/15/2029 6,900,000 - 3,852,383Public Utility Revenue Bonds 2009B-VRA 0.00% 6/24/2009 7/15/2030 32,000,000 - 18,400,000Public Utility Revenue Bonds 2010A-VRA 0.00% 2/3/2010 7/15/2040 188,218 - 135,278Public Utility Revenue Bonds 2012A-VRA 0.00% 4/17/2012 1/15/2035 23,289,955 - 18,631,964Public Utility Revenue Bonds 2013A 2.00% - 5.00% 5/2/2013 1/15/2043 214,220,000 - 190,205,000Public Utility Revenue Bonds 2015A - VRA 0.00% 3/5/2015 1/15/2036 2,600,000 - 1,567,716Public Utility Revenue Bonds 2016A 4.00% - 5.00% 12/7/2016 1/15/2046 502,260,000 - 476,230,000
Premiums/(Discounts) on Debt Issued 69,271,368 81,289,902
Total Bonds and Notes $ 782,397,115 $ 886,715,256
Lease Revenue Bond - Advantage Richmond 6.38% 10/26/2005 10/1/2020 12,100,000 $ 2,213,049 $ -
The annual requirements to amortize to maturity all long-term debt outstanding (General Obligation Bonds, General Obligation SerialEquipment Notes, Public Utility Revenue Bonds, Advantage Richmond Corporation Lease Revenue Bonds, and Section 108 Promissory Notes) including interest payable is as follows:
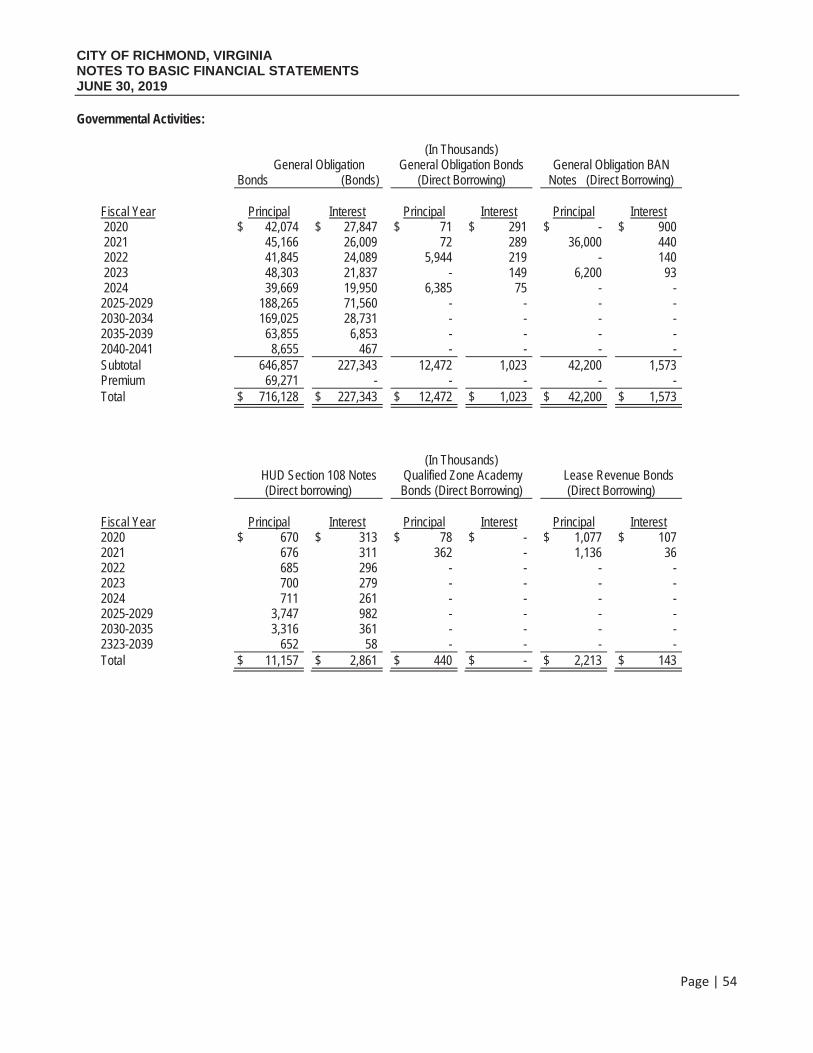
CITY OF RICHMOND, VIRGINIA NOTES TO BASIC FINANCIAL STATEMENTS JUNE 30, 2019
Page | 54
Governmental Activities:
(In Thousands) General Obligation
Bonds (Bonds) General Obligation Bonds
(Direct Borrowing)General Obligation BAN
Notes (Direct Borrowing)
Fiscal Year Principal Interest Principal Interest Principal Interest 2020 $ 42,074 $ 27,847 $ 71 $ 291 $ - $ 900 2021 45,166 26,009 72 289 36,000 440 2022 41,845 24,089 5,944 219 - 140 2023 48,303 21,837 - 149 6,200 93 2024 39,669 19,950 6,385 75 - - 2025-2029 188,265 71,560 - - - - 2030-2034 169,025 28,731 - - - - 2035-2039 63,855 6,853 - - - - 2040-2041 8,655 467 - - - - Subtotal 646,857 227,343 12,472 1,023 42,200 1,573 Premium 69,271 - - - - - Total $ 716,128 $ 227,343 $ 12,472 $ 1,023 $ 42,200 $ 1,573
(In Thousands) HUD Section 108 Notes
(Direct borrowing) Qualified Zone Academy Bonds (Direct Borrowing)
Lease Revenue Bonds(Direct Borrowing)
Fiscal Year Principal Interest Principal Interest Principal Interest 2020 $ 670 $ 313 $ 78 $ - $ 1,077 $ 1072021 676 311 362 - 1,136 362022 685 296 - - - - 2023 700 279 - - - - 2024 711 261 - - - - 2025-2029 3,747 982 - - - - 2030-2035 3,316 361 - - - - 2323-2039 652 58 - - - - Total $ 11,157 $ 2,861 $ 440 $ - $ 2,213 $ 143
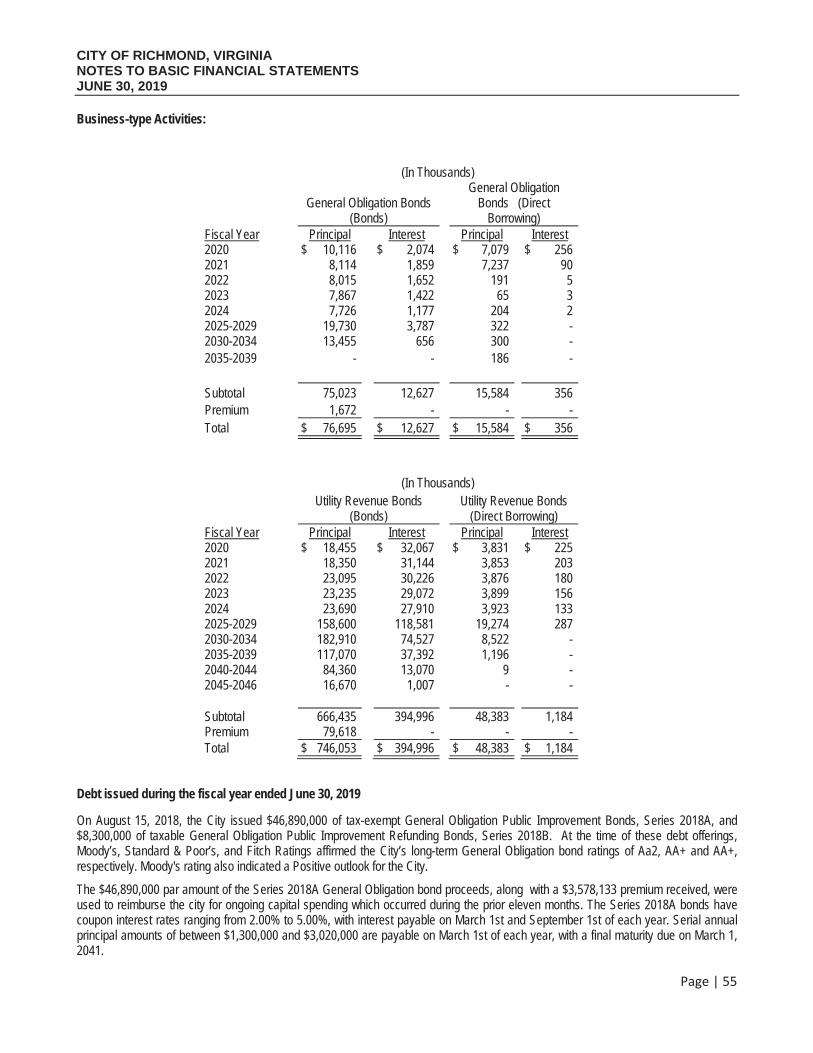
CITY OF RICHMOND, VIRGINIA NOTES TO BASIC FINANCIAL STATEMENTS JUNE 30, 2019
Page | 55
Business-type Activities:
(In Thousands)
General Obligation Bonds(Bonds)
General Obligation Bonds (Direct
Borrowing)Fiscal Year Principal Interest Principal Interest 2020 $ 10,116 $ 2,074 $ 7,079 $ 256 2021 8,114 1,859 7,237 90 2022 8,015 1,652 191 5 2023 7,867 1,422 65 3 2024 7,726 1,177 204 2 2025-2029 19,730 3,787 322 - 2030-2034 13,455 656 300 - 2035-2039 - - 186 -
Subtotal 75,023 12,627 15,584 356 Premium 1,672 - - - Total $ 76,695 $ 12,627 $ 15,584 $ 356
(In Thousands)Utility Revenue Bonds
(Bonds)Utility Revenue Bonds
(Direct Borrowing) Fiscal Year Principal Interest Principal Interest 2020 $ 18,455 $ 32,067 $ 3,831 $ 225 2021 18,350 31,144 3,853 203 2022 23,095 30,226 3,876 180 2023 23,235 29,072 3,899 156 2024 23,690 27,910 3,923 133 2025-2029 158,600 118,581 19,274 287 2030-2034 182,910 74,527 8,522 - 2035-2039 117,070 37,392 1,196 - 2040-2044 84,360 13,070 9 - 2045-2046 16,670 1,007 - -
Subtotal 666,435 394,996 48,383 1,184 Premium 79,618 - - - Total $ 746,053 $ 394,996 $ 48,383 $ 1,184
Debt issued during the fiscal year ended June 30, 2019
On August 15, 2018, the City issued $46,890,000 of tax-exempt General Obligation Public Improvement Bonds, Series 2018A, and $8,300,000 of taxable General Obligation Public Improvement Refunding Bonds, Series 2018B. At the time of these debt offerings,Moody’s, Standard & Poor’s, and Fitch Ratings affirmed the City’s long-term General Obligation bond ratings of Aa2, AA+ and AA+,respectively. Moody's rating also indicated a Positive outlook for the City.
The $46,890,000 par amount of the Series 2018A General Obligation bond proceeds, along with a $3,578,133 premium received, wereused to reimburse the city for ongoing capital spending which occurred during the prior eleven months. The Series 2018A bonds havecoupon interest rates ranging from 2.00% to 5.00%, with interest payable on March 1st and September 1st of each year. Serial annualprincipal amounts of between $1,300,000 and $3,020,000 are payable on March 1st of each year, with a final maturity due on March 1, 2041.
CITY OF RICHMOND, VIRGINIA NOTES TO BASIC FINANCIAL STATEMENTS JUNE 30, 2019
Page | 56
The $8,310,000 Series 2018B taxable General Obligation Refunding bond proceeds, along with $85,098 of premiums received, were used to refinance the City’s maturing Series 2013C Variable rate, interest only, General Obligation Bond. At closing of the Series 2018B bonds on August 15, 2018, the City used the total proceeds received, along with $200,000 of available cash, to completely payoff the Series2013C Variable Rate General Obligation bonds, and to pay for the costs of issuance.
Prior to the refinancing, the 2013C Variable Rate bond was borrowed from a commercial bank for a five year period and required the City to pay interest only each month at a variable rate of LIBOR + 50bp. As a result of the refunding, the City will now pay fixed amounts of principal between $370,000 and $710,000, which are payable on March 1st of each year, with a final principal maturity on March 1, 2033. Because the transaction involved the refunding of interest only, variable rate debt by fixed rate principal and interest rate debt, there was no economic gain.
On November 29, 2018, the City established with a commercial bank a $150.0 Million Line of Credit Bond Anticipation Note, Series 2018A to provide interim financing for the construction of new public schools being built in the City. Interest on the bank Line of Credit is priced at 79% of One Month LIBOR plus 32.5 basis points (2.25% on 6/30/2019) with the interest rate reset monthly and the payment of interest due on the first day of each month. The Line of Credit has a final maturity date of November 1, 2022, at which time or before, the outstanding balance will be rolled into a long term General Obligation bond issue. Effective July 1, 2018, the City increased its Prepared Food (meals) tax rate and earmarked this new tax revenue toward the repayment of this School construction debt. As of June 30, 2019, the City had drawn $6.2 million on the 201A Line of Credit.
On December 14, 2018, the City established with a commercial bank a $60.0 Million Line of Credit Bond Anticipation Note, Series 2018B to provide interim financing for the construction of general City Capital Improvement Projects (CIP). Interest on the bank Line of Credit is priced at 79% of One Month LIBOR plus 32.5 basis points (2.25% on 6/30/2019) with the interest rate reset monthly and the payment of interest due on the first day of each month. The Line of Credit has a final maturity date of November 1, 2020, at which time or before, the outstanding balance will be rolled into a long term General Obligation bond issue. As of June 30, 2019, the City had drawn $36.0 million on the 2018B Lineof Credit.
On March 28, 2019, the City issued $2,607,000 of General Obligation HUD Section 108 Notes, Series 2019A. The proceeds of this financing were used to finance a portion of the City's contribution to an economic development housing project. The Series 2019A HUD Notes are repayable over 20 years and have coupon interest rates ranging from 2.54% to 3.64%, with interest being payable on August 1st and February 1st of each year beginning on August 1, 2019. Series principal payments of $130,000 to $131,000 are due annually beginning August 1, 2019, with the final maturity due August 1, 2038.
Defeasance of DebtOn December 23, 2014, the City purchased U.S. Government Securities with proceeds of the General Obligation Public Improvement Refunding Bonds Series 2014B to advance refund $23,125,000 of the outstanding General Obligation Bonds, Series 2009A. These U.S.Government Securities were deposited into an irrevocable trust with an escrow agent to provide for all future debt service payments due on the refunded Series 2009A bonds. Accordingly, the trust account assets and the liability for the defeased bonds are not included in the City's financial statements. The call date for the Series 2009A Bonds was July 15, 2019 at which time the 2009A General Obligation bonds were called by the Trustee and paid off.
On July 14, 2017, the City purchased U.S. Government Securities with proceeds of the General Obligation Public Improvement Refunding Bonds, Series 2017B and 2017C to advance refund principal maturities of the Series 2009A, 2010D and 2012A General Obligation Bonds.These U.S. Government Securities were deposited into an irrevocable trust with an escrow agent to provide for all future debt service payments due on the refunded bonds. Accordingly, the trust account assets and the liability for the defeased bonds are not included in the City's financial statements. As of June 30, 2019, the remaining principal amount of defeased bonds is $124,910,000. The call date for the Series 2009A is July 15, 2019, 2010D is July 15, 2020, and for the 2012A is March 1, 2022.
On December 21, 2017 the City purchased U.S. Government Securities with proceeds of the General Obligation Public Improvement Refunding Bonds, Series 2017D to advance refund principal maturities of the Series 2013A, and 2014A General Obligation Bonds. These U.S. Government Securities were deposited into an irrevocable trust with an escrow agent to provide for all future debt service payments due on the refunded bonds. Accordingly, the trust account assets and the liability for the defeased bonds are not included in the City's financial statements. As of June 30, 2019, the principal amount of defeased bonds is $125,420,000. The call date for the Series 2013A Bonds is March 1, 2023 and for the Series 2014A is March 1, 2024.
Legal Debt Limit
Article VII, Section 10 of the Constitution of Virginia provides that the legal debt limit for cities for issuing General Obligation debt is ten (10) percent of the last preceding assessment for real estate taxes. At June 30, 2019, the City had a legal debt limit of $2,472,304,200
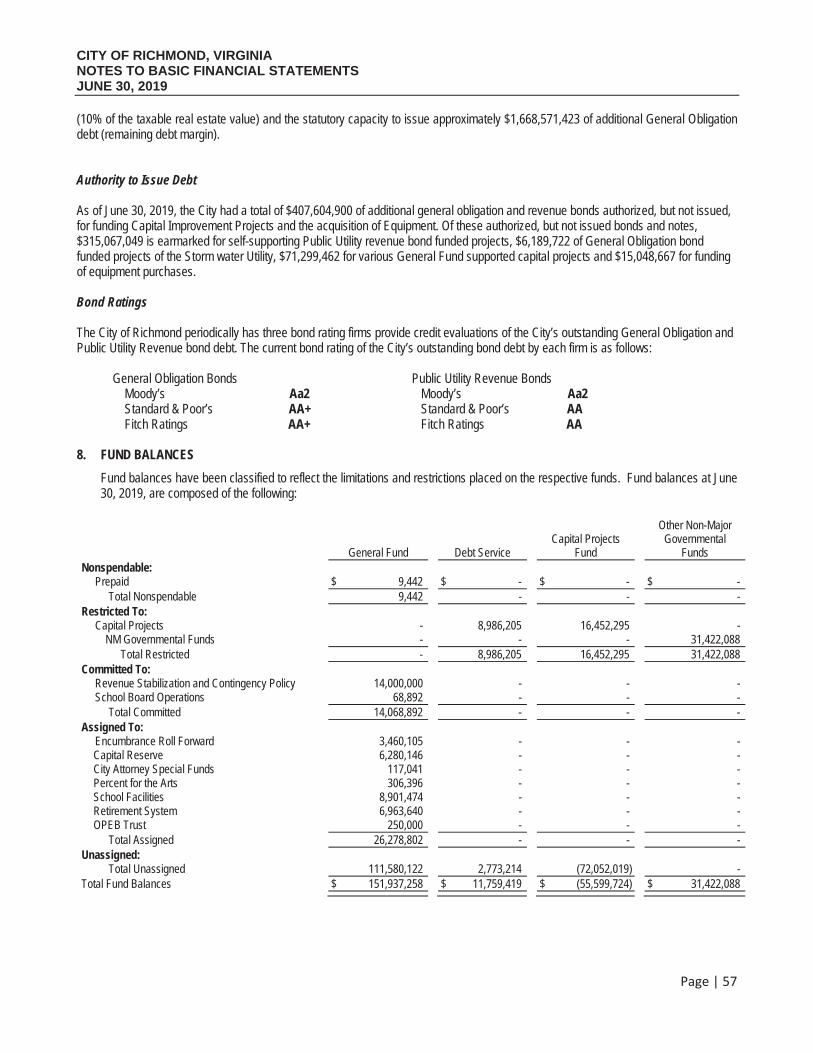
CITY OF RICHMOND, VIRGINIA NOTES TO BASIC FINANCIAL STATEMENTS JUNE 30, 2019
Page | 57
(10% of the taxable real estate value) and the statutory capacity to issue approximately $1,668,571,423 of additional General Obligation debt (remaining debt margin).
Authority to Issue Debt
As of June 30, 2019, the City had a total of $407,604,900 of additional general obligation and revenue bonds authorized, but not issued, for funding Capital Improvement Projects and the acquisition of Equipment. Of these authorized, but not issued bonds and notes,$315,067,049 is earmarked for self-supporting Public Utility revenue bond funded projects, $6,189,722 of General Obligation bondfunded projects of the Storm water Utility, $71,299,462 for various General Fund supported capital projects and $15,048,667 for funding of equipment purchases.
Bond Ratings
The City of Richmond periodically has three bond rating firms provide credit evaluations of the City’s outstanding General Obligation and Public Utility Revenue bond debt. The current bond rating of the City’s outstanding bond debt by each firm is as follows:
General Obligation Bonds Public Utility Revenue Bonds Moody’s Aa2 Moody’s Aa2Standard & Poor’s AA+ Standard & Poor’s AAFitch Ratings AA+ Fitch Ratings AA
8. FUND BALANCES
Fund balances have been classified to reflect the limitations and restrictions placed on the respective funds. Fund balances at June30, 2019, are composed of the following:
General Fund Debt Service Capital Projects
Fund
Other Non-Major Governmental
Funds Nonspendable: Prepaid $ 9,442 $ - $ - $ - Total Nonspendable 9,442 - - -Restricted To: Capital Projects - 8,986,205 16,452,295 -
NM Governmental Funds - - - 31,422,088 Total Restricted - 8,986,205 16,452,295 31,422,088
Committed To: Revenue Stabilization and Contingency Policy 14,000,000 - - - School Board Operations 68,892 - - - Total Committed 14,068,892 - - -Assigned To: Encumbrance Roll Forward 3,460,105 - - -
Capital Reserve 6,280,146 - - -City Attorney Special Funds 117,041 - - -Percent for the Arts 306,396 - - -School Facilities 8,901,474 - - -Retirement System 6,963,640 - - -OPEB Trust 250,000 - - -
Total Assigned 26,278,802 - - -Unassigned: Total Unassigned 111,580,122 2,773,214 (72,052,019) -Total Fund Balances $ 151,937,258 $ 11,759,419 $ (55,599,724) $ 31,422,088
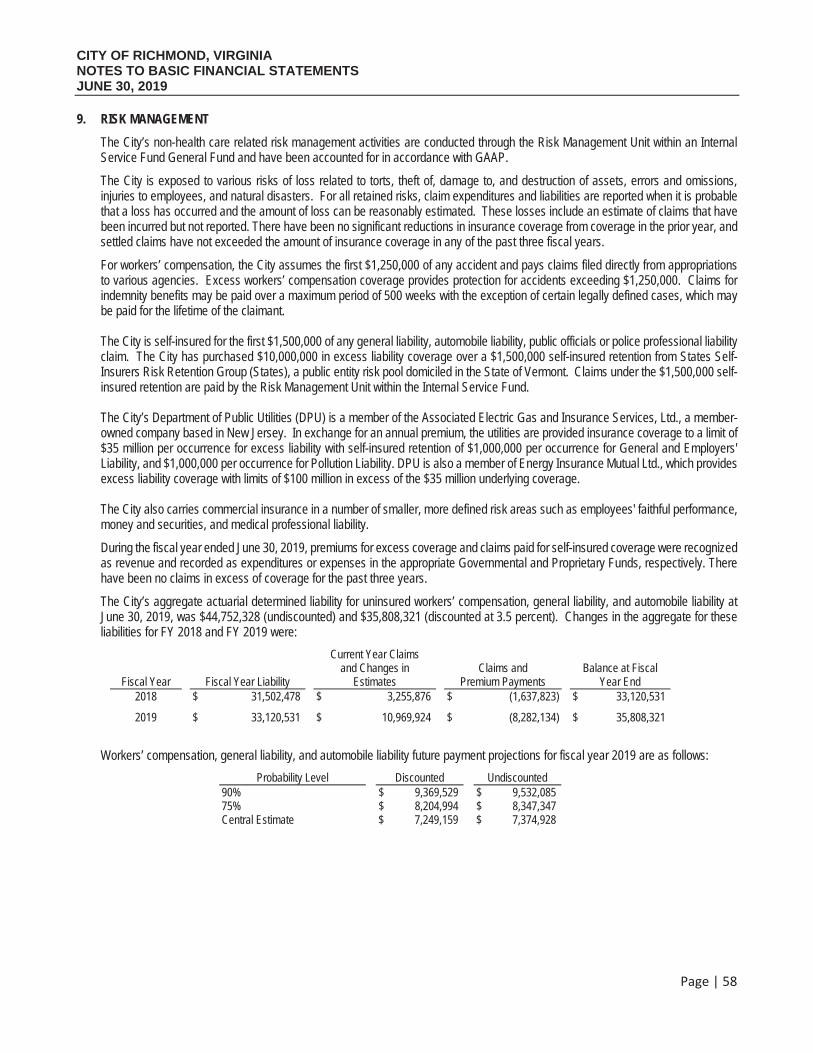
CITY OF RICHMOND, VIRGINIA NOTES TO BASIC FINANCIAL STATEMENTS JUNE 30, 2019
Page | 58
9. RISK MANAGEMENT
The City’s non-health care related risk management activities are conducted through the Risk Management Unit within an InternalService Fund General Fund and have been accounted for in accordance with GAAP.
The City is exposed to various risks of loss related to torts, theft of, damage to, and destruction of assets, errors and omissions,injuries to employees, and natural disasters. For all retained risks, claim expenditures and liabilities are reported when it is probablethat a loss has occurred and the amount of loss can be reasonably estimated. These losses include an estimate of claims that havebeen incurred but not reported. There have been no significant reductions in insurance coverage from coverage in the prior year, andsettled claims have not exceeded the amount of insurance coverage in any of the past three fiscal years.
For workers’ compensation, the City assumes the first $1,250,000 of any accident and pays claims filed directly from appropriationsto various agencies. Excess workers’ compensation coverage provides protection for accidents exceeding $1,250,000. Claims forindemnity benefits may be paid over a maximum period of 500 weeks with the exception of certain legally defined cases, which maybe paid for the lifetime of the claimant.
The City is self-insured for the first $1,500,000 of any general liability, automobile liability, public officials or police professional liabilityclaim. The City has purchased $10,000,000 in excess liability coverage over a $1,500,000 self-insured retention from States Self-Insurers Risk Retention Group (States), a public entity risk pool domiciled in the State of Vermont. Claims under the $1,500,000 self-insured retention are paid by the Risk Management Unit within the Internal Service Fund.
The City’s Department of Public Utilities (DPU) is a member of the Associated Electric Gas and Insurance Services, Ltd., a member-owned company based in New Jersey. In exchange for an annual premium, the utilities are provided insurance coverage to a limit of$35 million per occurrence for excess liability with self-insured retention of $1,000,000 per occurrence for General and Employers'Liability, and $1,000,000 per occurrence for Pollution Liability. DPU is also a member of Energy Insurance Mutual Ltd., which providesexcess liability coverage with limits of $100 million in excess of the $35 million underlying coverage.
The City also carries commercial insurance in a number of smaller, more defined risk areas such as employees' faithful performance,money and securities, and medical professional liability.
During the fiscal year ended June 30, 2019, premiums for excess coverage and claims paid for self-insured coverage were recognizedas revenue and recorded as expenditures or expenses in the appropriate Governmental and Proprietary Funds, respectively. Therehave been no claims in excess of coverage for the past three years.
The City’s aggregate actuarial determined liability for uninsured workers’ compensation, general liability, and automobile liability atJune 30, 2019, was $44,752,328 (undiscounted) and $35,808,321 (discounted at 3.5 percent). Changes in the aggregate for theseliabilities for FY 2018 and FY 2019 were:
Fiscal Year Fiscal Year Liability
Current Year Claims and Changes in
Estimates Claims and
Premium Payments Balance at Fiscal
Year End 2018 $ 31,502,478 $ 3,255,876 $ (1,637,823) $ 33,120,531
2019 $ 33,120,531 $ 10,969,924 $ (8,282,134) $ 35,808,321
Workers’ compensation, general liability, and automobile liability future payment projections for fiscal year 2019 are as follows:
Probability Level Discounted Undiscounted 90% $ 9,369,529 $ 9,532,085 75% $ 8,204,994 $ 8,347,347 Central Estimate $ 7,249,159 $ 7,374,928
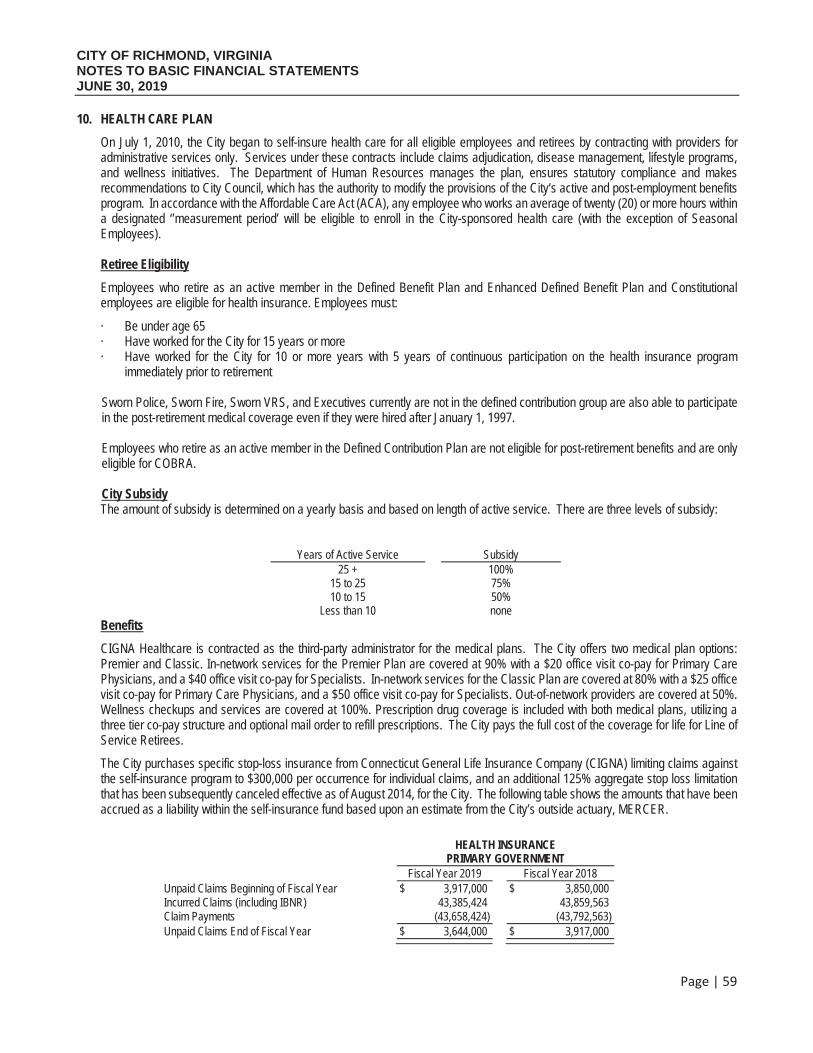
CITY OF RICHMOND, VIRGINIA NOTES TO BASIC FINANCIAL STATEMENTS JUNE 30, 2019
Page | 59
10. HEALTH CARE PLAN
On July 1, 2010, the City began to self-insure health care for all eligible employees and retirees by contracting with providers foradministrative services only. Services under these contracts include claims adjudication, disease management, lifestyle programs,and wellness initiatives. The Department of Human Resources manages the plan, ensures statutory compliance and makesrecommendations to City Council, which has the authority to modify the provisions of the City‘s active and post-employment benefitsprogram. In accordance with the Affordable Care Act (ACA), any employee who works an average of twenty (20) or more hours withina designated ‘’measurement period’ will be eligible to enroll in the City-sponsored health care (with the exception of SeasonalEmployees).
Retiree Eligibility
Employees who retire as an active member in the Defined Benefit Plan and Enhanced Defined Benefit Plan and Constitutionalemployees are eligible for health insurance. Employees must:
· Be under age 65· Have worked for the City for 15 years or more· Have worked for the City for 10 or more years with 5 years of continuous participation on the health insurance program
immediately prior to retirement
Sworn Police, Sworn Fire, Sworn VRS, and Executives currently are not in the defined contribution group are also able to participate in the post-retirement medical coverage even if they were hired after January 1, 1997.
Employees who retire as an active member in the Defined Contribution Plan are not eligible for post-retirement benefits and are only eligible for COBRA.
City SubsidyThe amount of subsidy is determined on a yearly basis and based on length of active service. There are three levels of subsidy:
Years of Active Service Subsidy 25 + 100%
15 to 25 75% 10 to 15 50%
Less than 10 none Benefits
CIGNA Healthcare is contracted as the third-party administrator for the medical plans. The City offers two medical plan options: Premier and Classic. In-network services for the Premier Plan are covered at 90% with a $20 office visit co-pay for Primary CarePhysicians, and a $40 office visit co-pay for Specialists. In-network services for the Classic Plan are covered at 80% with a $25 office visit co-pay for Primary Care Physicians, and a $50 office visit co-pay for Specialists. Out-of-network providers are covered at 50%. Wellness checkups and services are covered at 100%. Prescription drug coverage is included with both medical plans, utilizing athree tier co-pay structure and optional mail order to refill prescriptions. The City pays the full cost of the coverage for life for Line of Service Retirees.
The City purchases specific stop-loss insurance from Connecticut General Life Insurance Company (CIGNA) limiting claims againstthe self-insurance program to $300,000 per occurrence for individual claims, and an additional 125% aggregate stop loss limitation that has been subsequently canceled effective as of August 2014, for the City. The following table shows the amounts that have been accrued as a liability within the self-insurance fund based upon an estimate from the City’s outside actuary, MERCER.
HEALTH INSURANCE PRIMARY GOVERNMENT
Fiscal Year 2019 Fiscal Year 2018 Unpaid Claims Beginning of Fiscal Year $ 3,917,000 $ 3,850,000 Incurred Claims (including IBNR) 43,385,424 43,859,563 Claim Payments (43,658,424) (43,792,563) Unpaid Claims End of Fiscal Year $ 3,644,000 $ 3,917,000
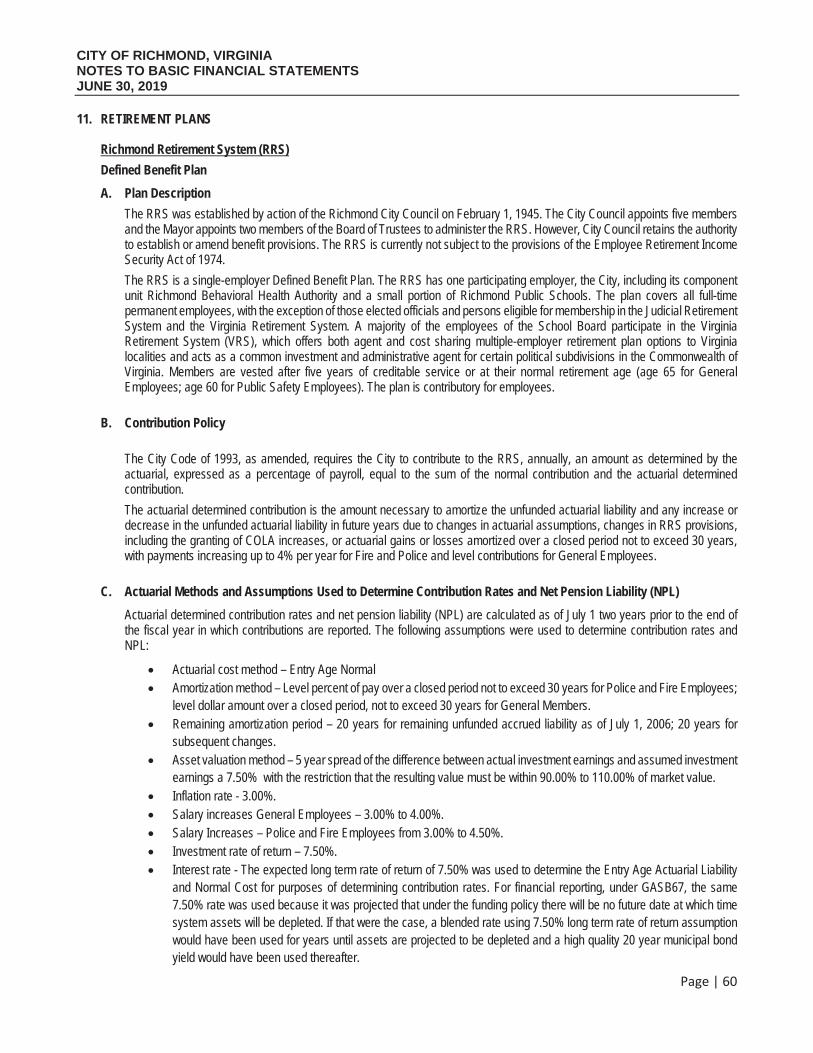
CITY OF RICHMOND, VIRGINIA NOTES TO BASIC FINANCIAL STATEMENTS JUNE 30, 2019
Page | 60
11. RETIREMENT PLANS
Richmond Retirement System (RRS)
Defined Benefit Plan
A. Plan Description
The RRS was established by action of the Richmond City Council on February 1, 1945. The City Council appoints five membersand the Mayor appoints two members of the Board of Trustees to administer the RRS. However, City Council retains the authority to establish or amend benefit provisions. The RRS is currently not subject to the provisions of the Employee Retirement IncomeSecurity Act of 1974.
The RRS is a single-employer Defined Benefit Plan. The RRS has one participating employer, the City, including its componentunit Richmond Behavioral Health Authority and a small portion of Richmond Public Schools. The plan covers all full-timepermanent employees, with the exception of those elected officials and persons eligible for membership in the Judicial RetirementSystem and the Virginia Retirement System. A majority of the employees of the School Board participate in the VirginiaRetirement System (VRS), which offers both agent and cost sharing multiple-employer retirement plan options to Virginialocalities and acts as a common investment and administrative agent for certain political subdivisions in the Commonwealth ofVirginia. Members are vested after five years of creditable service or at their normal retirement age (age 65 for GeneralEmployees; age 60 for Public Safety Employees). The plan is contributory for employees.
B. Contribution Policy
The City Code of 1993, as amended, requires the City to contribute to the RRS, annually, an amount as determined by theactuarial, expressed as a percentage of payroll, equal to the sum of the normal contribution and the actuarial determinedcontribution.
The actuarial determined contribution is the amount necessary to amortize the unfunded actuarial liability and any increase ordecrease in the unfunded actuarial liability in future years due to changes in actuarial assumptions, changes in RRS provisions,including the granting of COLA increases, or actuarial gains or losses amortized over a closed period not to exceed 30 years,with payments increasing up to 4% per year for Fire and Police and level contributions for General Employees.
C. Actuarial Methods and Assumptions Used to Determine Contribution Rates and Net Pension Liability (NPL)
Actuarial determined contribution rates and net pension liability (NPL) are calculated as of July 1 two years prior to the end ofthe fiscal year in which contributions are reported. The following assumptions were used to determine contribution rates andNPL:
Actuarial cost method – Entry Age NormalAmortization method – Level percent of pay over a closed period not to exceed 30 years for Police and Fire Employees; level dollar amount over a closed period, not to exceed 30 years for General Members.Remaining amortization period – 20 years for remaining unfunded accrued liability as of July 1, 2006; 20 years forsubsequent changes.Asset valuation method – 5 year spread of the difference between actual investment earnings and assumed investment earnings a 7.50% with the restriction that the resulting value must be within 90.00% to 110.00% of market value.Inflation rate - 3.00%.Salary increases General Employees – 3.00% to 4.00%.Salary Increases – Police and Fire Employees from 3.00% to 4.50%.Investment rate of return – 7.50%.Interest rate - The expected long term rate of return of 7.50% was used to determine the Entry Age Actuarial Liabilityand Normal Cost for purposes of determining contribution rates. For financial reporting, under GASB67, the same7.50% rate was used because it was projected that under the funding policy there will be no future date at which timesystem assets will be depleted. If that were the case, a blended rate using 7.50% long term rate of return assumptionwould have been used for years until assets are projected to be depleted and a high quality 20 year municipal bondyield would have been used thereafter.
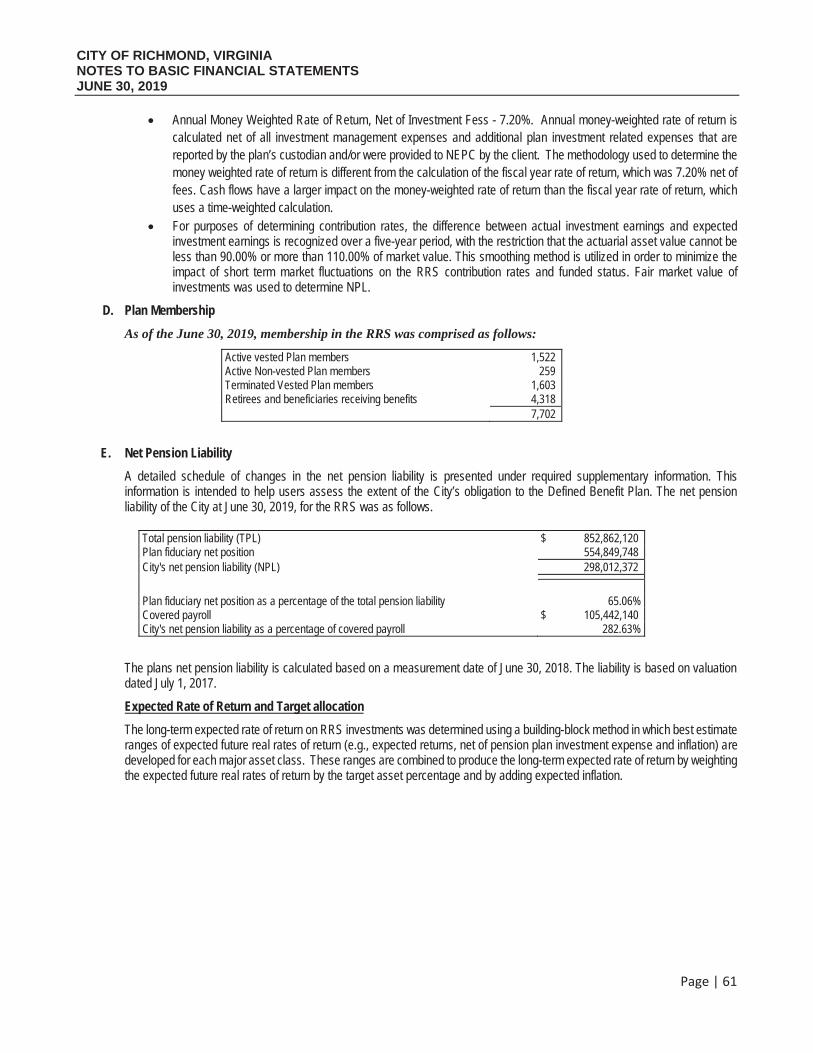
CITY OF RICHMOND, VIRGINIA NOTES TO BASIC FINANCIAL STATEMENTS JUNE 30, 2019
Page | 61
Annual Money Weighted Rate of Return, Net of Investment Fess - 7.20%. Annual money-weighted rate of return iscalculated net of all investment management expenses and additional plan investment related expenses that arereported by the plan’s custodian and/or were provided to NEPC by the client. The methodology used to determine themoney weighted rate of return is different from the calculation of the fiscal year rate of return, which was 7.20% net offees. Cash flows have a larger impact on the money-weighted rate of return than the fiscal year rate of return, whichuses a time-weighted calculation.For purposes of determining contribution rates, the difference between actual investment earnings and expectedinvestment earnings is recognized over a five-year period, with the restriction that the actuarial asset value cannot beless than 90.00% or more than 110.00% of market value. This smoothing method is utilized in order to minimize theimpact of short term market fluctuations on the RRS contribution rates and funded status. Fair market value ofinvestments was used to determine NPL.
D. Plan Membership
As of the June 30, 2019, membership in the RRS was comprised as follows:
Active vested Plan members 1,522 Active Non-vested Plan members 259 Terminated Vested Plan members 1,603 Retirees and beneficiaries receiving benefits 4,318
7,702
E. Net Pension Liability
A detailed schedule of changes in the net pension liability is presented under required supplementary information. Thisinformation is intended to help users assess the extent of the City’s obligation to the Defined Benefit Plan. The net pensionliability of the City at June 30, 2019, for the RRS was as follows.
Total pension liability (TPL) $ 852,862,120 Plan fiduciary net position 554,849,748 City's net pension liability (NPL) 298,012,372
Plan fiduciary net position as a percentage of the total pension liability 65.06% Covered payroll $ 105,442,140 City's net pension liability as a percentage of covered payroll 282.63%
The plans net pension liability is calculated based on a measurement date of June 30, 2018. The liability is based on valuation dated July 1, 2017.
Expected Rate of Return and Target allocation
The long-term expected rate of return on RRS investments was determined using a building-block method in which best estimate ranges of expected future real rates of return (e.g., expected returns, net of pension plan investment expense and inflation) are developed for each major asset class. These ranges are combined to produce the long-term expected rate of return by weighting the expected future real rates of return by the target asset percentage and by adding expected inflation.
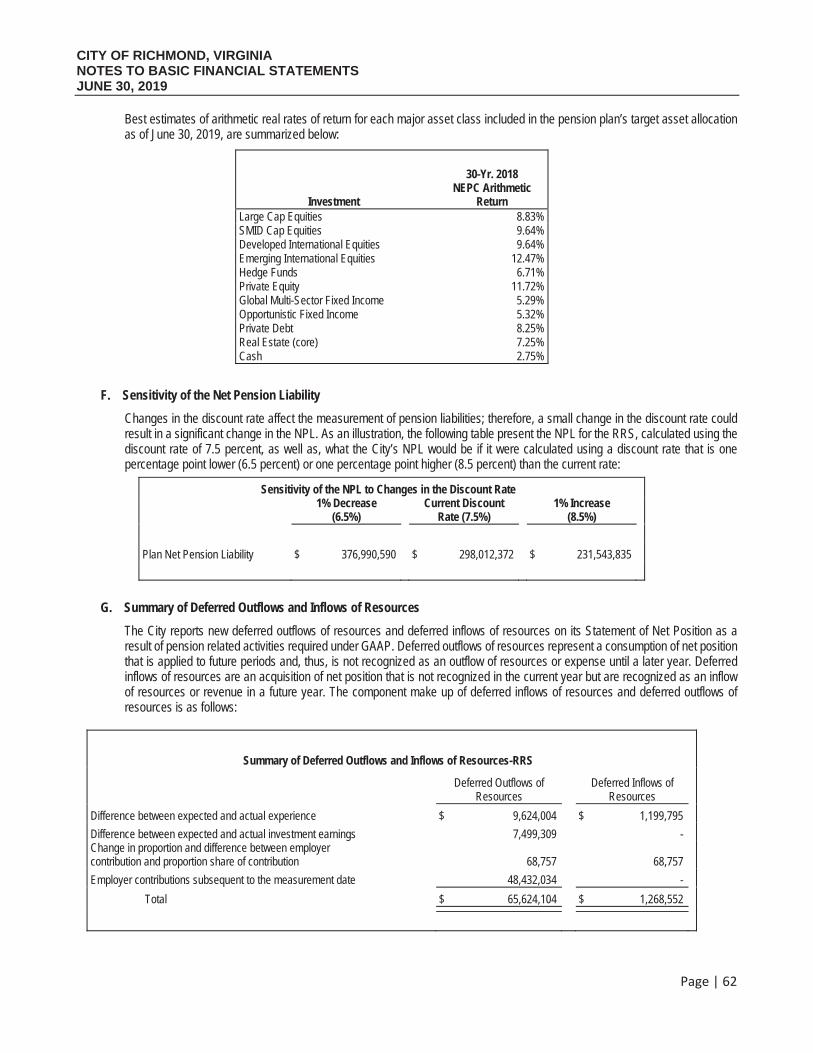
CITY OF RICHMOND, VIRGINIA NOTES TO BASIC FINANCIAL STATEMENTS JUNE 30, 2019
Page | 62
Best estimates of arithmetic real rates of return for each major asset class included in the pension plan’s target asset allocation as of June 30, 2019, are summarized below:
Investment
30-Yr. 2018NEPC Arithmetic
ReturnLarge Cap Equities 8.83% SMID Cap Equities 9.64% Developed International Equities 9.64% Emerging International Equities 12.47% Hedge Funds 6.71% Private Equity 11.72% Global Multi-Sector Fixed Income 5.29% Opportunistic Fixed Income 5.32% Private Debt 8.25% Real Estate (core) 7.25% Cash 2.75%
F. Sensitivity of the Net Pension Liability
Changes in the discount rate affect the measurement of pension liabilities; therefore, a small change in the discount rate couldresult in a significant change in the NPL. As an illustration, the following table present the NPL for the RRS, calculated using thediscount rate of 7.5 percent, as well as, what the City’s NPL would be if it were calculated using a discount rate that is onepercentage point lower (6.5 percent) or one percentage point higher (8.5 percent) than the current rate:
Sensitivity of the NPL to Changes in the Discount Rate 1% Decrease
(6.5%) Current Discount
Rate (7.5%) 1% Increase
(8.5%)
Plan Net Pension Liability $ 376,990,590 $ 298,012,372 $ 231,543,835
G. Summary of Deferred Outflows and Inflows of Resources
The City reports new deferred outflows of resources and deferred inflows of resources on its Statement of Net Position as aresult of pension related activities required under GAAP. Deferred outflows of resources represent a consumption of net positionthat is applied to future periods and, thus, is not recognized as an outflow of resources or expense until a later year. Deferredinflows of resources are an acquisition of net position that is not recognized in the current year but are recognized as an inflowof resources or revenue in a future year. The component make up of deferred inflows of resources and deferred outflows ofresources is as follows:
Summary of Deferred Outflows and Inflows of Resources-RRS
Deferred Outflows of Resources
Deferred Inflows of Resources
Difference between expected and actual experience $ 9,624,004 $ 1,199,795
Difference between expected and actual investment earnings 7,499,309 -Change in proportion and difference between employer contribution and proportion share of contribution 68,757 68,757
Employer contributions subsequent to the measurement date 48,432,034 -
Total $ 65,624,104 $ 1,268,552
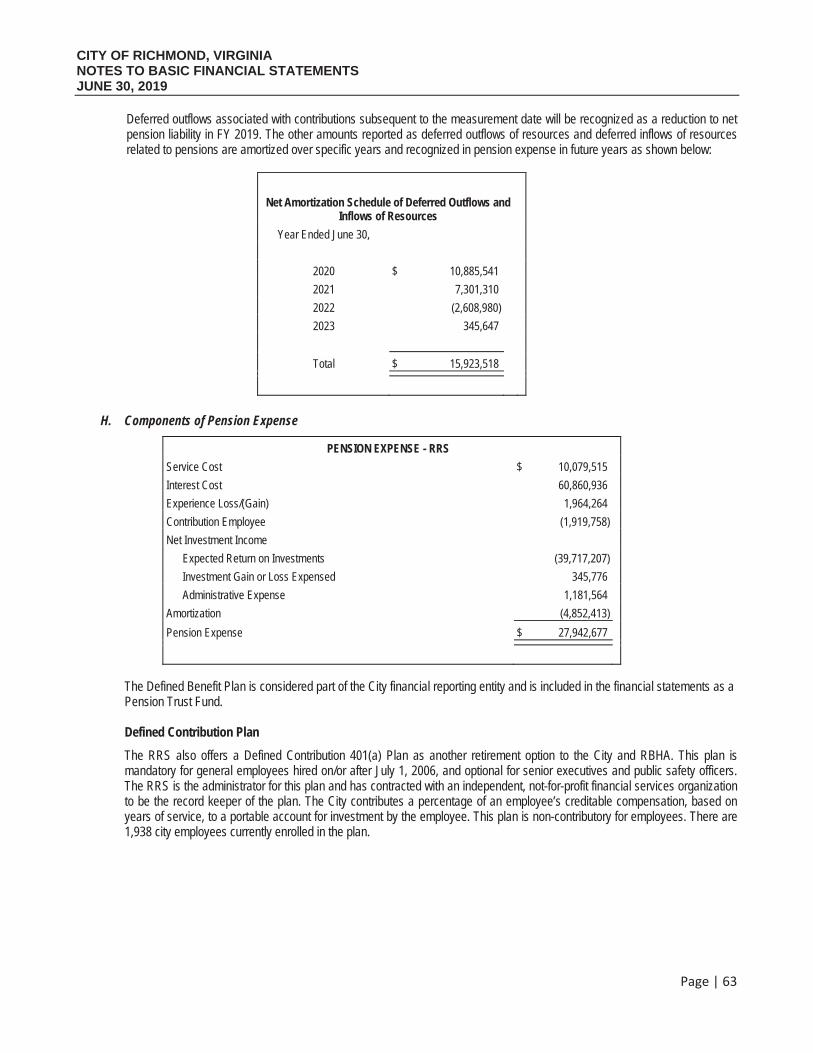
CITY OF RICHMOND, VIRGINIA NOTES TO BASIC FINANCIAL STATEMENTS JUNE 30, 2019
Page | 63
Deferred outflows associated with contributions subsequent to the measurement date will be recognized as a reduction to net pension liability in FY 2019. The other amounts reported as deferred outflows of resources and deferred inflows of resources related to pensions are amortized over specific years and recognized in pension expense in future years as shown below:
Net Amortization Schedule of Deferred Outflows and Inflows of Resources
Year Ended June 30,
2020 $ 10,885,541
2021 7,301,310
2022 (2,608,980)
2023 345,647
Total $ 15,923,518
H. Components of Pension Expense
PENSION EXPENSE - RRS
Service Cost $ 10,079,515
Interest Cost 60,860,936
Experience Loss/(Gain) 1,964,264
Contribution Employee (1,919,758)
Net Investment Income
Expected Return on Investments (39,717,207)
Investment Gain or Loss Expensed 345,776
Administrative Expense 1,181,564
Amortization (4,852,413)
Pension Expense $ 27,942,677
The Defined Benefit Plan is considered part of the City financial reporting entity and is included in the financial statements as a Pension Trust Fund.
Defined Contribution Plan
The RRS also offers a Defined Contribution 401(a) Plan as another retirement option to the City and RBHA. This plan is mandatory for general employees hired on/or after July 1, 2006, and optional for senior executives and public safety officers. The RRS is the administrator for this plan and has contracted with an independent, not-for-profit financial services organizationto be the record keeper of the plan. The City contributes a percentage of an employee’s creditable compensation, based on years of service, to a portable account for investment by the employee. This plan is non-contributory for employees. There are 1,938 city employees currently enrolled in the plan.
CITY OF RICHMOND, VIRGINIA NOTES TO BASIC FINANCIAL STATEMENTS JUNE 30, 2019
Page | 64
The Defined Contribution Plan is a 401(a) account which grows through contributions from the participating employers and investment earnings. The Defined Contribution Plan is funded entirely by employer contributions, and no employee contributions are required. Participating employers contribute a percentage of the member’s salary to an account each pay period in accordance with the following schedule, which is based on years of creditable service:
Less than 5 years of service – 5%5 - 10 years of service - 6%10 – 15 years of service – 8%15 or more years of service – 10%
The contribution to the RRS plan by the City is determined annually by the City’s Department of Budget & Strategic Planning and subsequently approved and adopted through the City’s biennial budget process.
RRS Financial can be accessed at: www.RVA.gov/retirement-system/annual-reports
Virginia Retirement System (VRS)
A. Plan Description
The City contributes to the Virginia Retirement System (VRS), a cost-sharing and agent multiple-employer defined benefitpension plan administered by the VRS. City members include constitutional offices of the Sheriff, Courts, Registrar and Treasurer.Benefits vest after five years of service credit. Members earn one month of service credit for each month they are employed andtheir employer is paying into the VRS. Members are eligible to purchase prior public service, active duty military service, certainperiods of leave and previously refunded VRS service as credit in their plan. There are three defined benefit plans for localgovernment employees – Plan 1 and Plan 2 and Hybrid Plan.
Members hired before July 1, 2010 and who were vested as of January 1, 2013, are covered under Plan 1. Non-hazardous duty members are eligible for an unreduced retirement benefit beginning at age 65 with at least five years of service creditor age 50 with at least 30 years of service credit. They may retire with a reduced benefit as early as age 55 with at leastfive years of service credit or age 50 with at least 10 years of service creditMembers hired or rehired on or after July 1, 2010, and who were not vested on January 1, 2013 are covered under Plan2. Non-hazardous duty members are eligible for an unreduced benefit beginning at their normal Social Security retirementage with at least five years of service credit or when the sum of their age and service equals 90. They may retire with areduced benefit as early as age 60 with at least five years of service credit.Non-hazardous duty employees hired on or after January 1, 2014, are covered under the Hybrid Plan. The VRS HybridRetirement Plan combines features of a defined benefit and a defined contribution plan. Employees covered under theVRS Hybrid Plan are eligible for an unreduced benefit when they reach their normal Social Security retirement age or when their age and service equal the sum of 90. Benefits are payable monthly for life in an amount equal to 1% of their AverageFinal Salary (AFS) for each year of credited service. Hybrid members make mandatory contributions to the definedcontribution component of the plan and may make additional voluntary contributions to the plan, which the employer isrequired to match. Employees vest in the matching employer contributions based upon a tiered schedule. Employees are100% vested in all matching employer contributions upon reaching 4 years of creditable service.
The VRS Basic Benefit is a lifetime monthly benefit based on a retirement multiplier as a percentage of the member’s average final compensation multiplied by the member’s total service credit. Under Plan 1, average final compensation is the average of the member’s 36 consecutive months of highest compensation. Under Plan 2, average final compensation is the average of the member’s 60 consecutive months of highest compensation. The retirement multiplier for non-hazardous duty members is 1.70 percent. The retirement multiplier for sheriffs and regional jail superintendents is 1.85 percent. The retirement multiplier foreligible political subdivision hazardous duty employees other than sheriffs and jail superintendents is 1.70 percent or 1.85 percent as elected by the employer. The multiplier for Plan 2 members was reduced to 1.65 percent effective January 1, 2013, unless they are hazardous duty employees and their employer has elected the enhanced retirement multiplier. At retirement, members can elect the Basic Benefit, the Survivor Option, a Partial Lump-Sum Option Payment (PLOP) or the Advance Pension Option. A retirement reduction factor is applied to the Basic Benefit amount for members electing the Survivor Option, PLOP or Advance Pension Option or those retiring with a reduced benefit.
Eligible hazardous duty members in Plan 1 and Plan 2 are eligible for an unreduced benefit beginning at age 60 with at least 5 years of service credit or age 50 with at least 25 years of service credit. These members include sheriffs, deputy sheriffs andhazardous duty employees of political subdivisions that have elected to provide enhanced coverage for hazardous duty service.
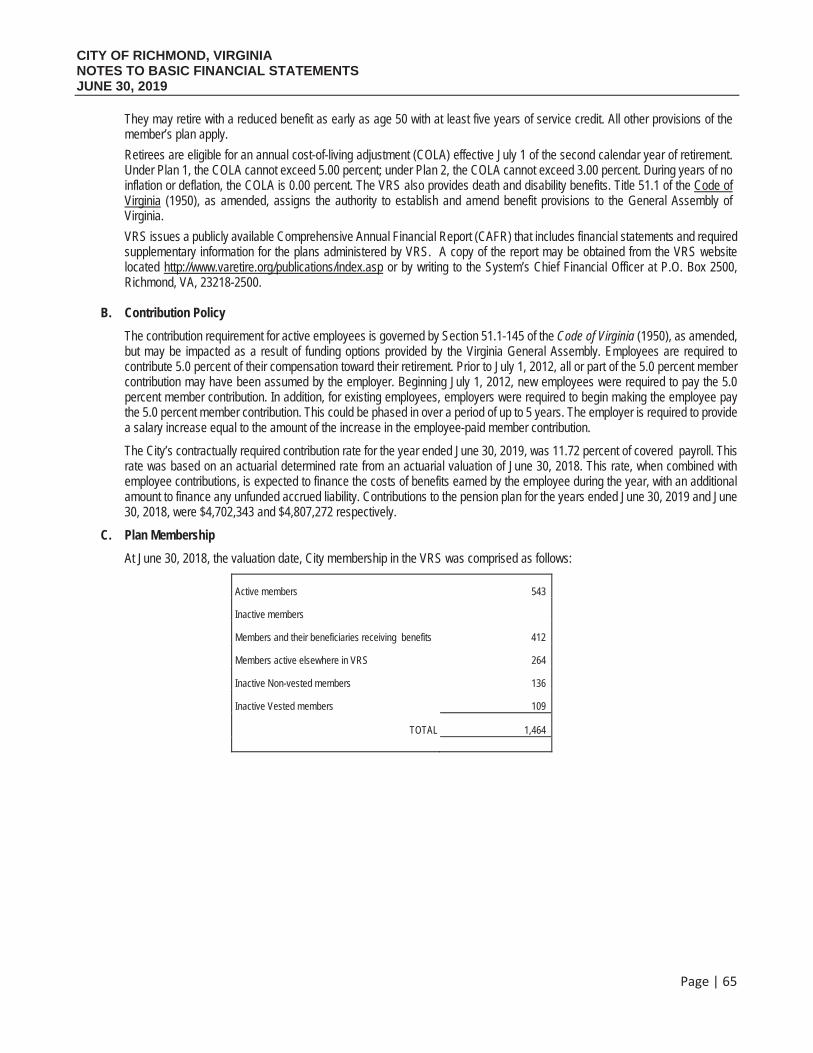
CITY OF RICHMOND, VIRGINIA NOTES TO BASIC FINANCIAL STATEMENTS JUNE 30, 2019
Page | 65
They may retire with a reduced benefit as early as age 50 with at least five years of service credit. All other provisions of the member’s plan apply.
Retirees are eligible for an annual cost-of-living adjustment (COLA) effective July 1 of the second calendar year of retirement.Under Plan 1, the COLA cannot exceed 5.00 percent; under Plan 2, the COLA cannot exceed 3.00 percent. During years of no inflation or deflation, the COLA is 0.00 percent. The VRS also provides death and disability benefits. Title 51.1 of the Code ofVirginia (1950), as amended, assigns the authority to establish and amend benefit provisions to the General Assembly of Virginia.
VRS issues a publicly available Comprehensive Annual Financial Report (CAFR) that includes financial statements and required supplementary information for the plans administered by VRS. A copy of the report may be obtained from the VRS website located http://www.varetire.org/publications/index.asp or by writing to the System’s Chief Financial Officer at P.O. Box 2500, Richmond, VA, 23218-2500.
B. Contribution Policy
The contribution requirement for active employees is governed by Section 51.1-145 of the Code of Virginia (1950), as amended,but may be impacted as a result of funding options provided by the Virginia General Assembly. Employees are required tocontribute 5.0 percent of their compensation toward their retirement. Prior to July 1, 2012, all or part of the 5.0 percent membercontribution may have been assumed by the employer. Beginning July 1, 2012, new employees were required to pay the 5.0percent member contribution. In addition, for existing employees, employers were required to begin making the employee paythe 5.0 percent member contribution. This could be phased in over a period of up to 5 years. The employer is required to providea salary increase equal to the amount of the increase in the employee-paid member contribution.
The City’s contractually required contribution rate for the year ended June 30, 2019, was 11.72 percent of covered payroll. Thisrate was based on an actuarial determined rate from an actuarial valuation of June 30, 2018. This rate, when combined withemployee contributions, is expected to finance the costs of benefits earned by the employee during the year, with an additionalamount to finance any unfunded accrued liability. Contributions to the pension plan for the years ended June 30, 2019 and June30, 2018, were $4,702,343 and $4,807,272 respectively.
C. Plan Membership
At June 30, 2018, the valuation date, City membership in the VRS was comprised as follows:
Active members 543
Inactive members
Members and their beneficiaries receiving benefits 412
Members active elsewhere in VRS 264
Inactive Non-vested members 136
Inactive Vested members 109
TOTAL 1,464
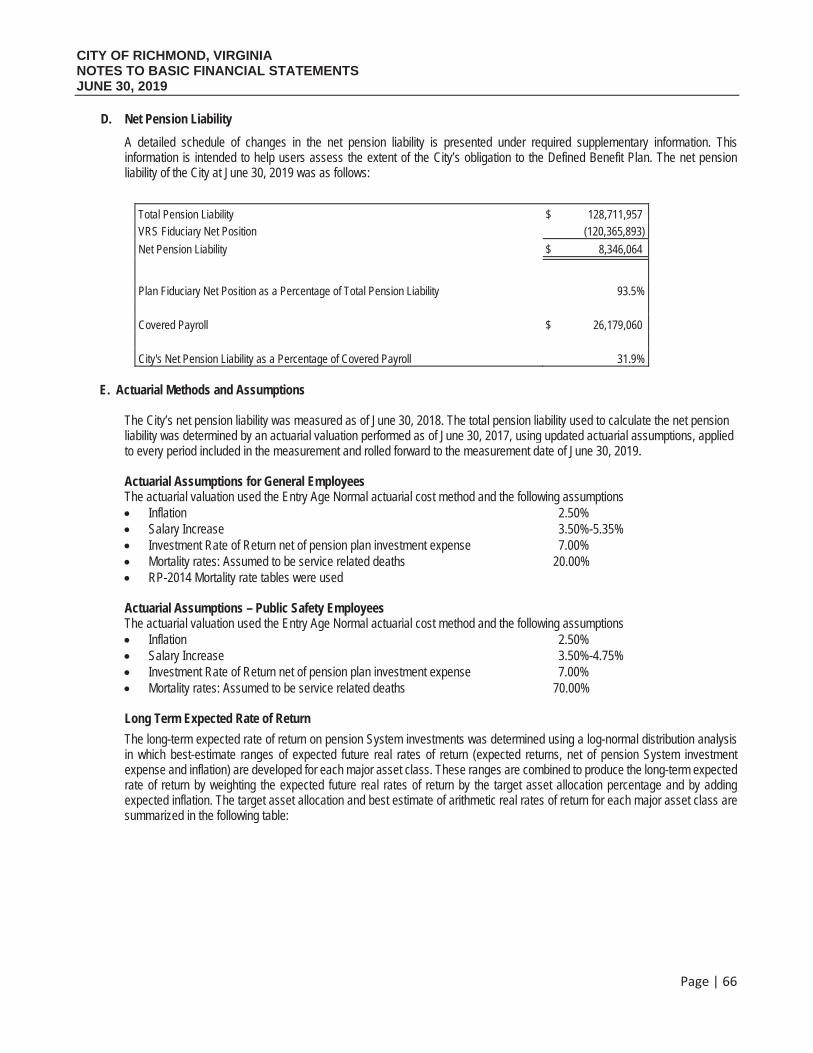
CITY OF RICHMOND, VIRGINIA NOTES TO BASIC FINANCIAL STATEMENTS JUNE 30, 2019
Page | 66
D. Net Pension Liability
A detailed schedule of changes in the net pension liability is presented under required supplementary information. Thisinformation is intended to help users assess the extent of the City’s obligation to the Defined Benefit Plan. The net pensionliability of the City at June 30, 2019 was as follows:
Total Pension Liability $ 128,711,957 VRS Fiduciary Net Position (120,365,893)
Net Pension Liability $ 8,346,064
Plan Fiduciary Net Position as a Percentage of Total Pension Liability 93.5%
Covered Payroll $ 26,179,060
City's Net Pension Liability as a Percentage of Covered Payroll 31.9%
E. Actuarial Methods and Assumptions
The City’s net pension liability was measured as of June 30, 2018. The total pension liability used to calculate the net pensionliability was determined by an actuarial valuation performed as of June 30, 2017, using updated actuarial assumptions, applied to every period included in the measurement and rolled forward to the measurement date of June 30, 2019.
Actuarial Assumptions for General Employees The actuarial valuation used the Entry Age Normal actuarial cost method and the following assumptions
Inflation 2.50% Salary Increase 3.50%-5.35% Investment Rate of Return net of pension plan investment expense 7.00% Mortality rates: Assumed to be service related deaths 20.00% RP-2014 Mortality rate tables were used
Actuarial Assumptions – Public Safety Employees The actuarial valuation used the Entry Age Normal actuarial cost method and the following assumptions
Inflation 2.50% Salary Increase 3.50%-4.75% Investment Rate of Return net of pension plan investment expense 7.00% Mortality rates: Assumed to be service related deaths 70.00%
Long Term Expected Rate of Return
The long-term expected rate of return on pension System investments was determined using a log-normal distribution analysis in which best-estimate ranges of expected future real rates of return (expected returns, net of pension System investment expense and inflation) are developed for each major asset class. These ranges are combined to produce the long-term expected rate of return by weighting the expected future real rates of return by the target asset allocation percentage and by adding expected inflation. The target asset allocation and best estimate of arithmetic real rates of return for each major asset class are summarized in the following table:
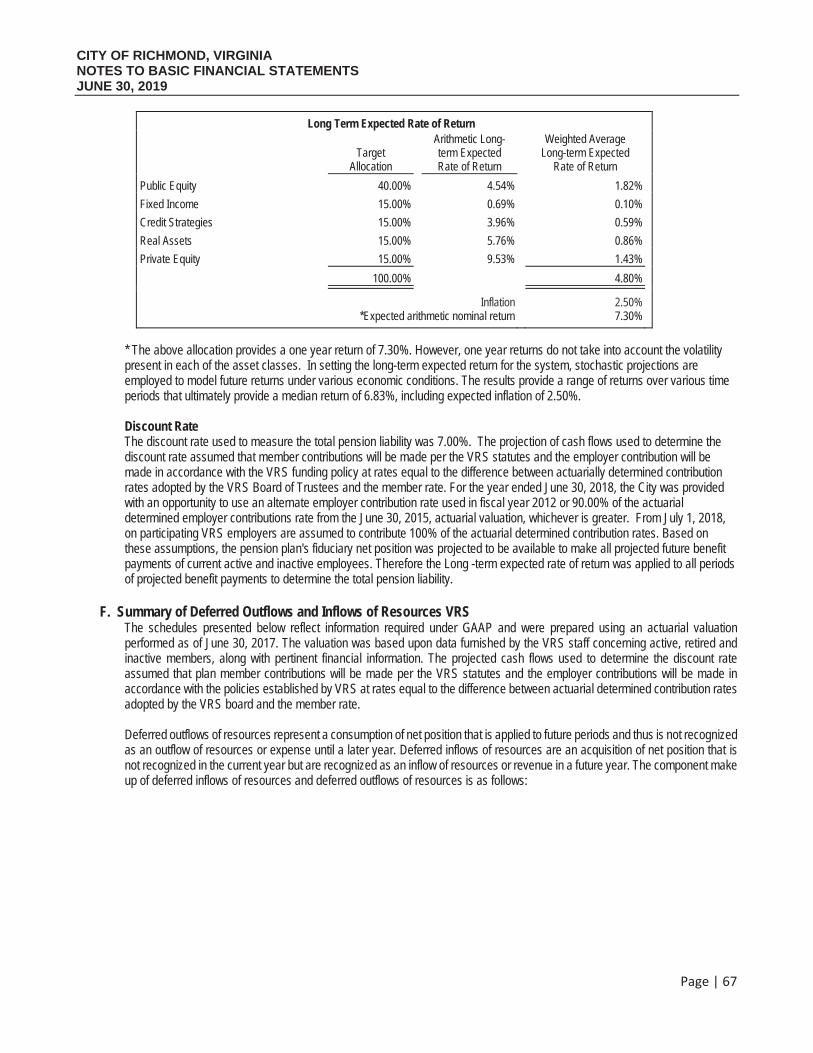
CITY OF RICHMOND, VIRGINIA NOTES TO BASIC FINANCIAL STATEMENTS JUNE 30, 2019
Page | 67
Long Term Expected Rate of Return
TargetAllocation
Arithmetic Long- term Expected Rate of Return
Weighted Average Long-term Expected
Rate of Return
Public Equity 40.00% 4.54% 1.82%
Fixed Income 15.00% 0.69% 0.10%
Credit Strategies 15.00% 3.96% 0.59%
Real Assets 15.00% 5.76% 0.86%
Private Equity 15.00% 9.53% 1.43%
100.00% 4.80%
Inflation 2.50%*Expected arithmetic nominal return 7.30%
* The above allocation provides a one year return of 7.30%. However, one year returns do not take into account the volatilitypresent in each of the asset classes. In setting the long-term expected return for the system, stochastic projections areemployed to model future returns under various economic conditions. The results provide a range of returns over various timeperiods that ultimately provide a median return of 6.83%, including expected inflation of 2.50%.
Discount RateThe discount rate used to measure the total pension liability was 7.00%. The projection of cash flows used to determine the discount rate assumed that member contributions will be made per the VRS statutes and the employer contribution will be made in accordance with the VRS funding policy at rates equal to the difference between actuarially determined contribution rates adopted by the VRS Board of Trustees and the member rate. For the year ended June 30, 2018, the City was provided with an opportunity to use an alternate employer contribution rate used in fiscal year 2012 or 90.00% of the actuarial determined employer contributions rate from the June 30, 2015, actuarial valuation, whichever is greater. From July 1, 2018, on participating VRS employers are assumed to contribute 100% of the actuarial determined contribution rates. Based on these assumptions, the pension plan's fiduciary net position was projected to be available to make all projected future benefitpayments of current active and inactive employees. Therefore the Long -term expected rate of return was applied to all periods of projected benefit payments to determine the total pension liability.
F. Summary of Deferred Outflows and Inflows of Resources VRSThe schedules presented below reflect information required under GAAP and were prepared using an actuarial valuationperformed as of June 30, 2017. The valuation was based upon data furnished by the VRS staff concerning active, retired and inactive members, along with pertinent financial information. The projected cash flows used to determine the discount rate assumed that plan member contributions will be made per the VRS statutes and the employer contributions will be made in accordance with the policies established by VRS at rates equal to the difference between actuarial determined contribution ratesadopted by the VRS board and the member rate.
Deferred outflows of resources represent a consumption of net position that is applied to future periods and thus is not recognized as an outflow of resources or expense until a later year. Deferred inflows of resources are an acquisition of net position that is not recognized in the current year but are recognized as an inflow of resources or revenue in a future year. The component makeup of deferred inflows of resources and deferred outflows of resources is as follows:
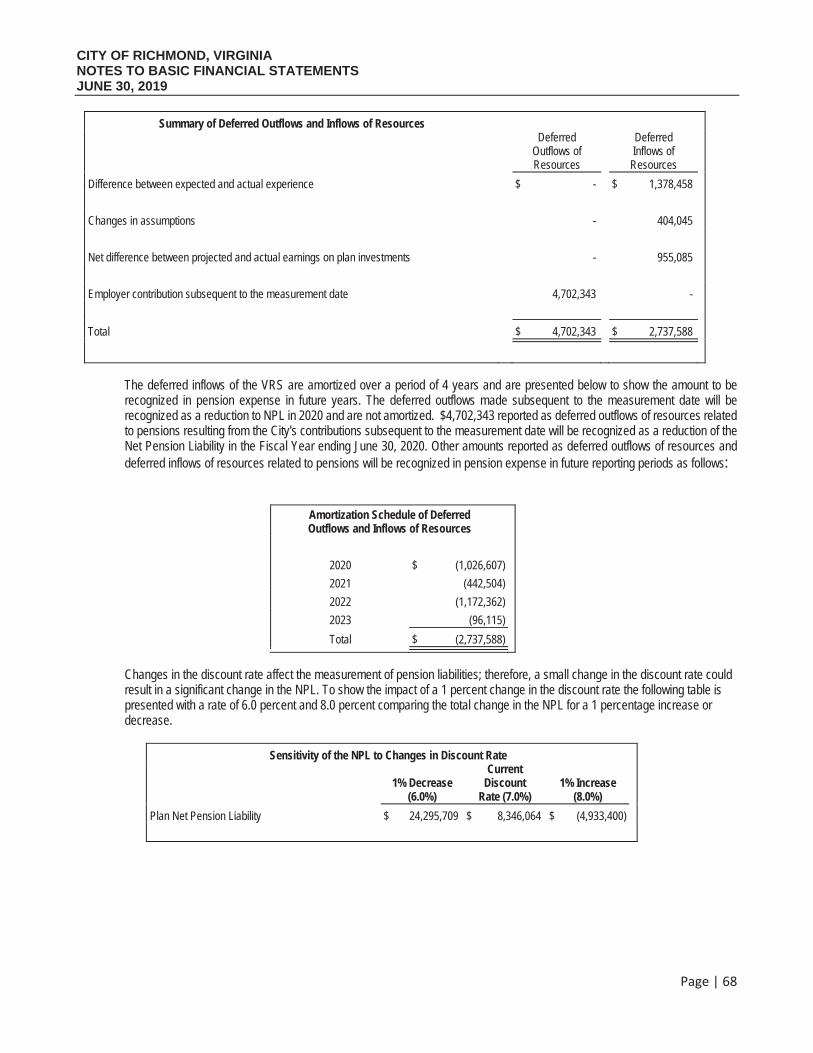
CITY OF RICHMOND, VIRGINIA NOTES TO BASIC FINANCIAL STATEMENTS JUNE 30, 2019
Page | 68
Summary of Deferred Outflows and Inflows of Resources Deferred
Outflows of Resources
DeferredInflows of Resources
Difference between expected and actual experience $ - $ 1,378,458
Changes in assumptions - 404,045
Net difference between projected and actual earnings on plan investments - 955,085
Employer contribution subsequent to the measurement date 4,702,343 -
Total $ 4,702,343 $ 2,737,588
The deferred inflows of the VRS are amortized over a period of 4 years and are presented below to show the amount to be recognized in pension expense in future years. The deferred outflows made subsequent to the measurement date will be recognized as a reduction to NPL in 2020 and are not amortized. $4,702,343 reported as deferred outflows of resources related to pensions resulting from the City's contributions subsequent to the measurement date will be recognized as a reduction of theNet Pension Liability in the Fiscal Year ending June 30, 2020. Other amounts reported as deferred outflows of resources and deferred inflows of resources related to pensions will be recognized in pension expense in future reporting periods as follows:
Amortization Schedule of Deferred Outflows and Inflows of Resources
2020 $ (1,026,607)
2021 (442,504)
2022 (1,172,362)
2023 (96,115)
Total $ (2,737,588)
Changes in the discount rate affect the measurement of pension liabilities; therefore, a small change in the discount rate couldresult in a significant change in the NPL. To show the impact of a 1 percent change in the discount rate the following table ispresented with a rate of 6.0 percent and 8.0 percent comparing the total change in the NPL for a 1 percentage increase or decrease.
Sensitivity of the NPL to Changes in Discount Rate
1% Decrease (6.0%)
CurrentDiscount
Rate (7.0%) 1% Increase
(8.0%)
Plan Net Pension Liability $ 24,295,709 $ 8,346,064 $ (4,933,400)
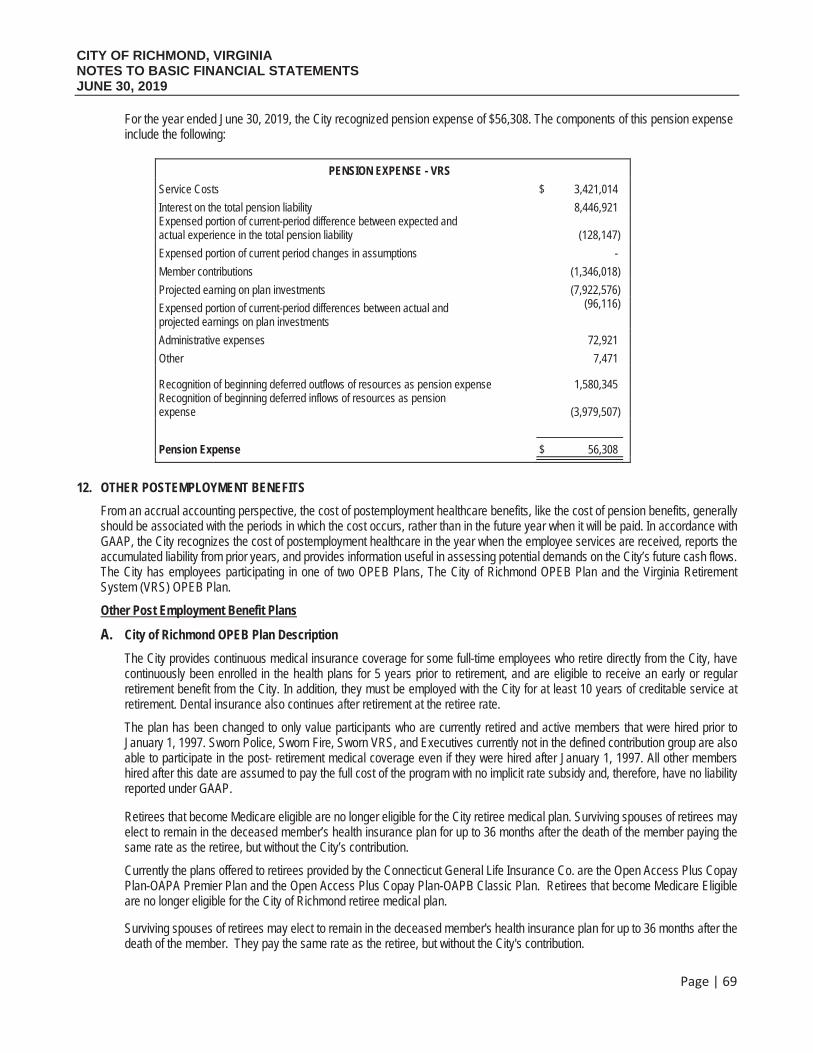
CITY OF RICHMOND, VIRGINIA NOTES TO BASIC FINANCIAL STATEMENTS JUNE 30, 2019
Page | 69
For the year ended June 30, 2019, the City recognized pension expense of $56,308. The components of this pension expense include the following:
PENSION EXPENSE - VRS
Service Costs $ 3,421,014
Interest on the total pension liability 8,446,921 Expensed portion of current-period difference between expected and actual experience in the total pension liability (128,147)
Expensed portion of current period changes in assumptions -
Member contributions (1,346,018)
Projected earning on plan investments (7,922,576)
Expensed portion of current-period differences between actual and projected earnings on plan investments
(96,116)
Administrative expenses 72,921
Other 7,471
Recognition of beginning deferred outflows of resources as pension expense 1,580,345 Recognition of beginning deferred inflows of resources as pension expense (3,979,507)
Pension Expense $ 56,308
12. OTHER POSTEMPLOYMENT BENEFITS
From an accrual accounting perspective, the cost of postemployment healthcare benefits, like the cost of pension benefits, generallyshould be associated with the periods in which the cost occurs, rather than in the future year when it will be paid. In accordance withGAAP, the City recognizes the cost of postemployment healthcare in the year when the employee services are received, reports theaccumulated liability from prior years, and provides information useful in assessing potential demands on the City’s future cash flows.The City has employees participating in one of two OPEB Plans, The City of Richmond OPEB Plan and the Virginia RetirementSystem (VRS) OPEB Plan.
Other Post Employment Benefit Plans
A. City of Richmond OPEB Plan Description
The City provides continuous medical insurance coverage for some full-time employees who retire directly from the City, havecontinuously been enrolled in the health plans for 5 years prior to retirement, and are eligible to receive an early or regularretirement benefit from the City. In addition, they must be employed with the City for at least 10 years of creditable service atretirement. Dental insurance also continues after retirement at the retiree rate.
The plan has been changed to only value participants who are currently retired and active members that were hired prior toJanuary 1, 1997. Sworn Police, Sworn Fire, Sworn VRS, and Executives currently not in the defined contribution group are alsoable to participate in the post- retirement medical coverage even if they were hired after January 1, 1997. All other membershired after this date are assumed to pay the full cost of the program with no implicit rate subsidy and, therefore, have no liabilityreported under GAAP.
Retirees that become Medicare eligible are no longer eligible for the City retiree medical plan. Surviving spouses of retirees mayelect to remain in the deceased member’s health insurance plan for up to 36 months after the death of the member paying thesame rate as the retiree, but without the City’s contribution.
Currently the plans offered to retirees provided by the Connecticut General Life Insurance Co. are the Open Access Plus CopayPlan-OAPA Premier Plan and the Open Access Plus Copay Plan-OAPB Classic Plan. Retirees that become Medicare Eligibleare no longer eligible for the City of Richmond retiree medical plan.
Surviving spouses of retirees may elect to remain in the deceased member's health insurance plan for up to 36 months after thedeath of the member. They pay the same rate as the retiree, but without the City's contribution.
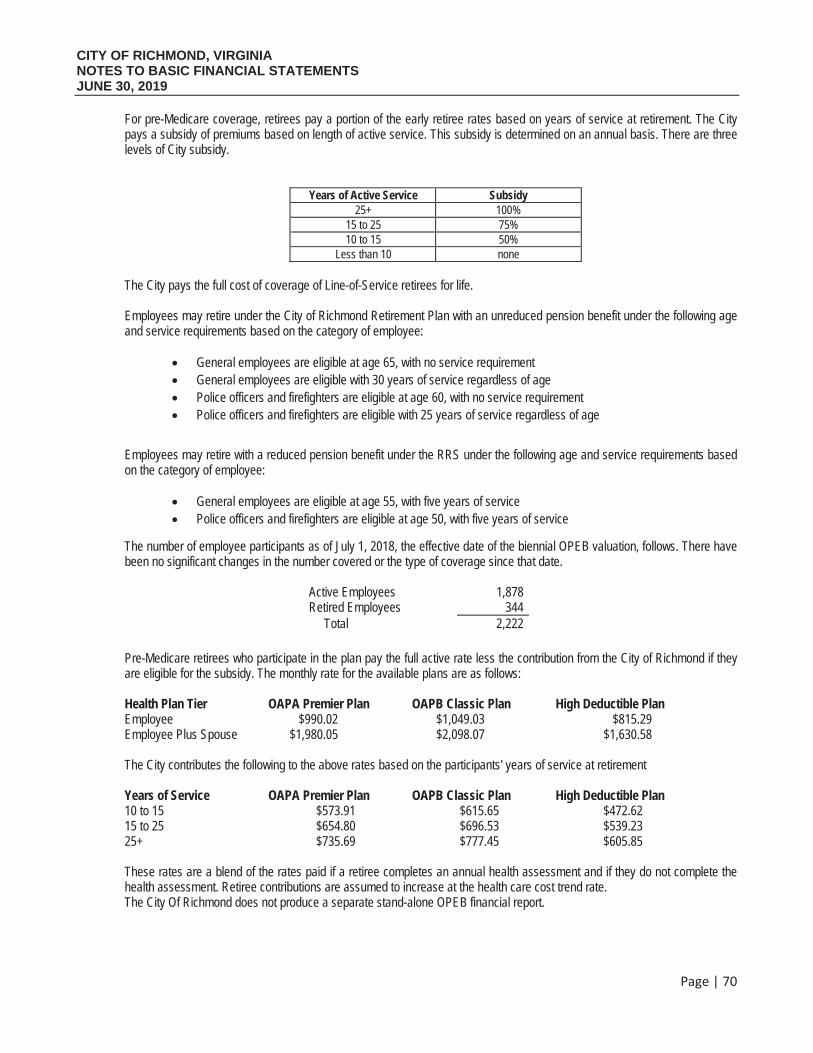
CITY OF RICHMOND, VIRGINIA NOTES TO BASIC FINANCIAL STATEMENTS JUNE 30, 2019
Page | 70
For pre-Medicare coverage, retirees pay a portion of the early retiree rates based on years of service at retirement. The City pays a subsidy of premiums based on length of active service. This subsidy is determined on an annual basis. There are three levels of City subsidy.
Years of Active Service Subsidy 25+ 100%
15 to 25 75% 10 to 15 50%
Less than 10 none
The City pays the full cost of coverage of Line-of-Service retirees for life.
Employees may retire under the City of Richmond Retirement Plan with an unreduced pension benefit under the following age and service requirements based on the category of employee:
General employees are eligible at age 65, with no service requirementGeneral employees are eligible with 30 years of service regardless of agePolice officers and firefighters are eligible at age 60, with no service requirementPolice officers and firefighters are eligible with 25 years of service regardless of age
Employees may retire with a reduced pension benefit under the RRS under the following age and service requirements based on the category of employee:
General employees are eligible at age 55, with five years of servicePolice officers and firefighters are eligible at age 50, with five years of service
The number of employee participants as of July 1, 2018, the effective date of the biennial OPEB valuation, follows. There have been no significant changes in the number covered or the type of coverage since that date.
Active Employees 1,878Retired Employees 344 Total 2,222
Pre-Medicare retirees who participate in the plan pay the full active rate less the contribution from the City of Richmond if theyare eligible for the subsidy. The monthly rate for the available plans are as follows:
Health Plan Tier OAPA Premier Plan OAPB Classic Plan High Deductible Plan Employee $990.02 $1,049.03 $815.29 Employee Plus Spouse $1,980.05 $2,098.07 $1,630.58
The City contributes the following to the above rates based on the participants' years of service at retirement
Years of Service OAPA Premier Plan OAPB Classic Plan High Deductible Plan 10 to 15 $573.91 $615.65 $472.6215 to 25 $654.80 $696.53 $539.2325+ $735.69 $777.45 $605.85
These rates are a blend of the rates paid if a retiree completes an annual health assessment and if they do not complete the health assessment. Retiree contributions are assumed to increase at the health care cost trend rate. The City Of Richmond does not produce a separate stand-alone OPEB financial report.
CITY OF RICHMOND, VIRGINIA NOTES TO BASIC FINANCIAL STATEMENTS JUNE 30, 2019
Page | 71
a. Funding Policy
The City currently pays for post employment healthcare benefits on a pay-as-you-go basis. The City funds on a cash basis asbenefits are paid. In February 2019, the City began participating in the Virginia Pooled OPEB Trust Fund, an irrevocable trust.The City began making contributions to the trust for investment purposes. In fiscal year 2019, the basis of $250,000 wascontributed to this pooled investment trust and the assets of the trust have been segregated or restricted to provide for otherpost-retirement benefits in the future..
b. Actuarial Methods and Assumptions
Projections of benefits for financial reporting purposes are based on the substantive plan (the plan as understood by the employerand the plan members) and include the types of benefits provided at the time of each valuation and the historical pattern ofsharing benefit costs between the employer and plan members to that point. Most included coverage is community-rated andannual premiums for community-rated coverage’s were used as a proxy for claims costs without age adjustment.
Actuarial valuations of an ongoing plan involve estimates of the value of reported amounts and assumptions about the probabilityof occurrence of events far into the future. Examples include assumptions about future employment, mortality, and the healthcarecost trend. Amounts determined, regarding the funded status of the plan and the annual required contributions of the employer,are subject to continual revision as actual results are compared with past expectations and new estimates are made about thefuture.
The actuarial methods and assumptions used include techniques that are designed to reduce the effects of short-term volatilityin actuarial accrued liabilities and the actuarial value of assets, consistent with the long-term perspective of the calculations. Therequired schedule of funding progress presents multi-year trend information about whether the actuarial value of plan assets isincreasing or decreasing over time, relative to the actuarial accrued liability for benefits.
These estimates reflect the potential impact of the Patient Protection and Affordable Care Act (PPACA).
The assumptions used in the basis of the July 2018 valuation include:
Salary Increases – Not applicable
Discount Rate – For GASB Statement No. 74 and No. 75 the discount rate is 3.11% per annum based on the S&P MunicipalBond 20 Year High Grade Index as of June 30, 2018
Valuation Date - July 1, 2018
Expected Long – Term Rate of Return on Plan Assets – Not applicable
Plan Participation – 65% of employees will elect coverage at retirement.Dependent Coverage – 30% of retirees who elect coverage at retirement will also cover their spouse at retirement
The Healthcare cost trend rate- for Medical is 8.0% to grade uniformly to 5.0% over a 6 year period.Administrative Expenses- are assumed to be included in the medical claims costs.Investment Policy- Not ApplicableCoordination with Medicare - The OPEB program provides primary coverage for pre- Medicare eligible participants.Retiree coverage terminates once a retiree becomes Medicare Eligible
Actuarial Methods:Actuarial Method - Retiree postemployment benefit expenses are determined under the Entry Age Normal cost method.Asset Valuation Method – Not applicable
Amortization Period-For GASB Statements No. 74 and No.75 contribution calculations: 20 Years (closed). Experience gainsand losses are amortized over the average working lifetime of all participants which for the current year is 11 year
Mortality Rates - were based on the RP- 2000 Employee Mortality Table for constitutional officers and the 1983 Group AnnuityMortality Table for all other employees.
The actuarial projections are based on established patterns of practice as promulgated by the Actuarial Standards Board.
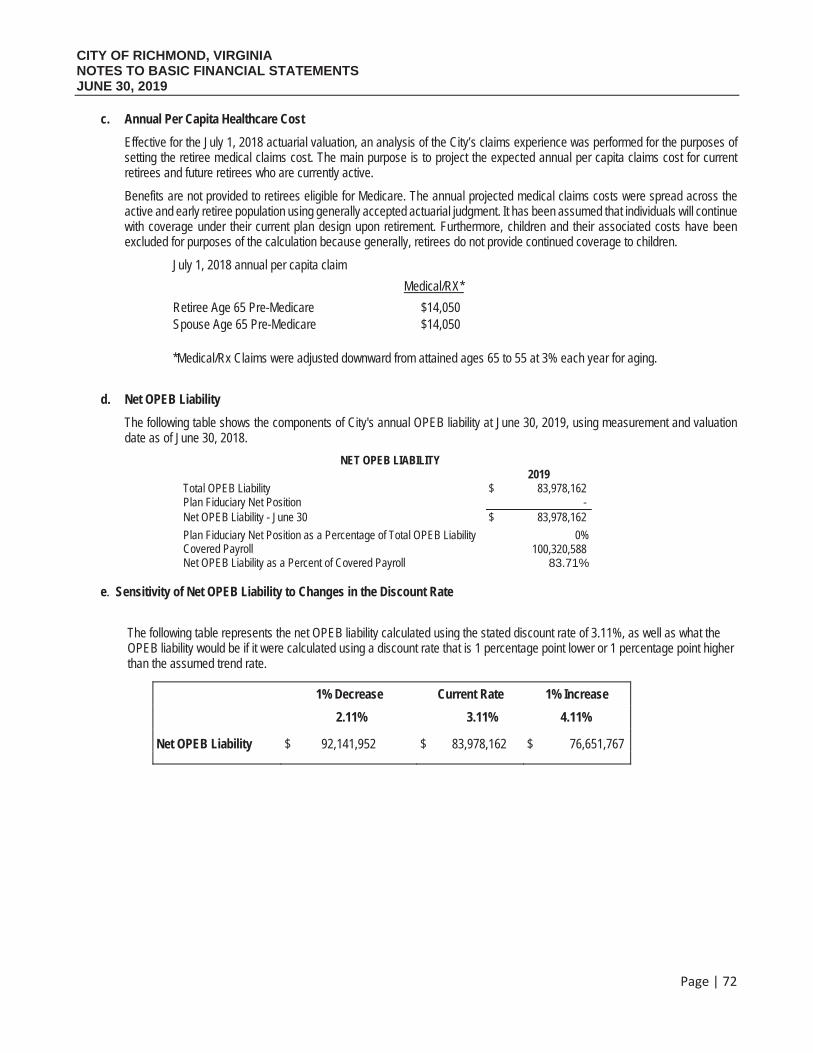
CITY OF RICHMOND, VIRGINIA NOTES TO BASIC FINANCIAL STATEMENTS JUNE 30, 2019
Page | 72
c. Annual Per Capita Healthcare Cost
Effective for the July 1, 2018 actuarial valuation, an analysis of the City’s claims experience was performed for the purposes ofsetting the retiree medical claims cost. The main purpose is to project the expected annual per capita claims cost for currentretirees and future retirees who are currently active.
Benefits are not provided to retirees eligible for Medicare. The annual projected medical claims costs were spread across theactive and early retiree population using generally accepted actuarial judgment. It has been assumed that individuals will continuewith coverage under their current plan design upon retirement. Furthermore, children and their associated costs have beenexcluded for purposes of the calculation because generally, retirees do not provide continued coverage to children.
July 1, 2018 annual per capita claim
Medical/RX*
Retiree Age 65 Pre-Medicare $14,050 Spouse Age 65 Pre-Medicare $14,050
*Medical/Rx Claims were adjusted downward from attained ages 65 to 55 at 3% each year for aging.
d. Net OPEB Liability
The following table shows the components of City's annual OPEB liability at June 30, 2019, using measurement and valuationdate as of June 30, 2018.
NET OPEB LIABILITY 2019
Total OPEB Liability $ 83,978,162 Plan Fiduciary Net Position - Net OPEB Liability - June 30 $ 83,978,162
Plan Fiduciary Net Position as a Percentage of Total OPEB Liability 0% Covered Payroll 100,320,588 Net OPEB Liability as a Percent of Covered Payroll 83.71%
e. Sensitivity of Net OPEB Liability to Changes in the Discount Rate
The following table represents the net OPEB liability calculated using the stated discount rate of 3.11%, as well as what the OPEB liability would be if it were calculated using a discount rate that is 1 percentage point lower or 1 percentage point higherthan the assumed trend rate.
1% Decrease Current Rate 1% Increase
2.11% 3.11% 4.11%
Net OPEB Liability $ 92,141,952 $ 83,978,162 $ 76,651,767
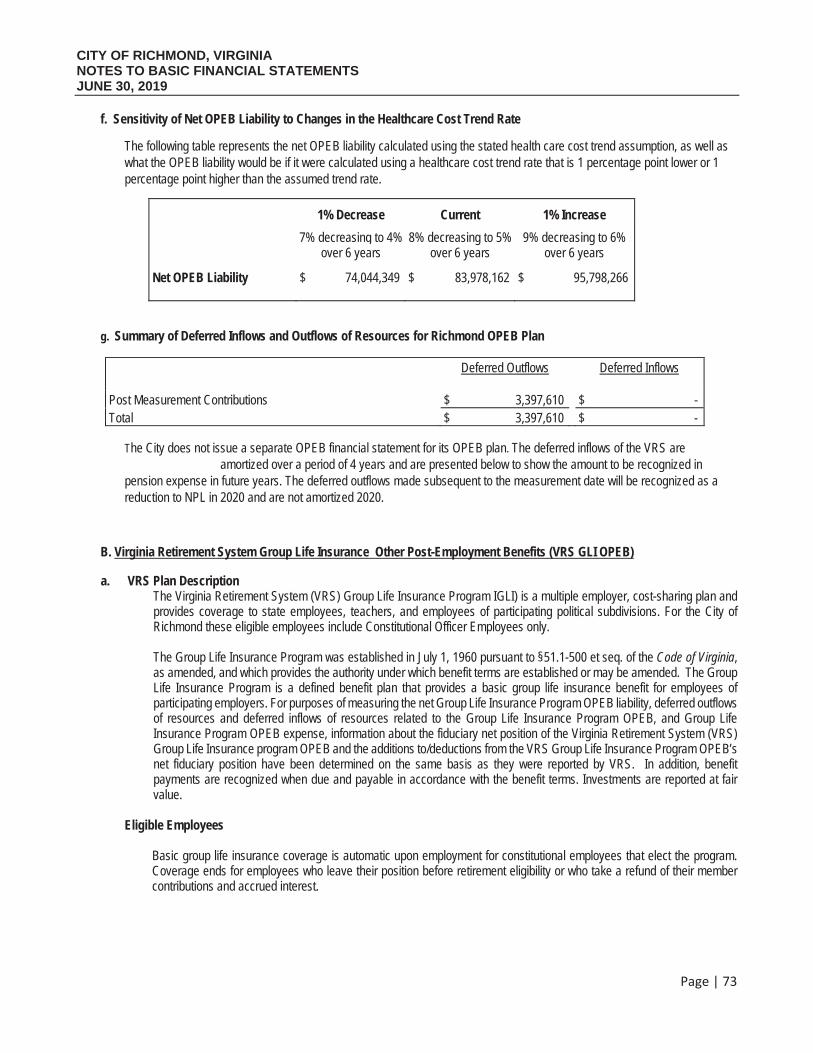
CITY OF RICHMOND, VIRGINIA NOTES TO BASIC FINANCIAL STATEMENTS JUNE 30, 2019
Page | 73
f. Sensitivity of Net OPEB Liability to Changes in the Healthcare Cost Trend Rate
The following table represents the net OPEB liability calculated using the stated health care cost trend assumption, as well aswhat the OPEB liability would be if it were calculated using a healthcare cost trend rate that is 1 percentage point lower or 1percentage point higher than the assumed trend rate.
1% Decrease Current 1% Increase
7% decreasing to 4% over 6 years
8% decreasing to 5% over 6 years
9% decreasing to 6% over 6 years
Net OPEB Liability $ 74,044,349 $ 83,978,162 $ 95,798,266
g. Summary of Deferred Inflows and Outflows of Resources for Richmond OPEB Plan
Deferred Outflows Deferred Inflows
Post Measurement Contributions $ 3,397,610 $ - Total $ 3,397,610 $ -
The City does not issue a separate OPEB financial statement for its OPEB plan. The deferred inflows of the VRS are amortized over a period of 4 years and are presented below to show the amount to be recognized in
pension expense in future years. The deferred outflows made subsequent to the measurement date will be recognized as a reduction to NPL in 2020 and are not amortized 2020.
B. Virginia Retirement System Group Life Insurance Other Post-Employment Benefits (VRS GLI OPEB)
a. VRS Plan DescriptionThe Virginia Retirement System (VRS) Group Life Insurance Program IGLI) is a multiple employer, cost-sharing plan and provides coverage to state employees, teachers, and employees of participating political subdivisions. For the City of Richmond these eligible employees include Constitutional Officer Employees only.
The Group Life Insurance Program was established in July 1, 1960 pursuant to §51.1-500 et seq. of the Code of Virginia,as amended, and which provides the authority under which benefit terms are established or may be amended. The Group Life Insurance Program is a defined benefit plan that provides a basic group life insurance benefit for employees of participating employers. For purposes of measuring the net Group Life Insurance Program OPEB liability, deferred outflows of resources and deferred inflows of resources related to the Group Life Insurance Program OPEB, and Group Life Insurance Program OPEB expense, information about the fiduciary net position of the Virginia Retirement System (VRS) Group Life Insurance program OPEB and the additions to/deductions from the VRS Group Life Insurance Program OPEB’s net fiduciary position have been determined on the same basis as they were reported by VRS. In addition, benefit payments are recognized when due and payable in accordance with the benefit terms. Investments are reported at fair value.
Eligible Employees
Basic group life insurance coverage is automatic upon employment for constitutional employees that elect the program. Coverage ends for employees who leave their position before retirement eligibility or who take a refund of their member contributions and accrued interest.
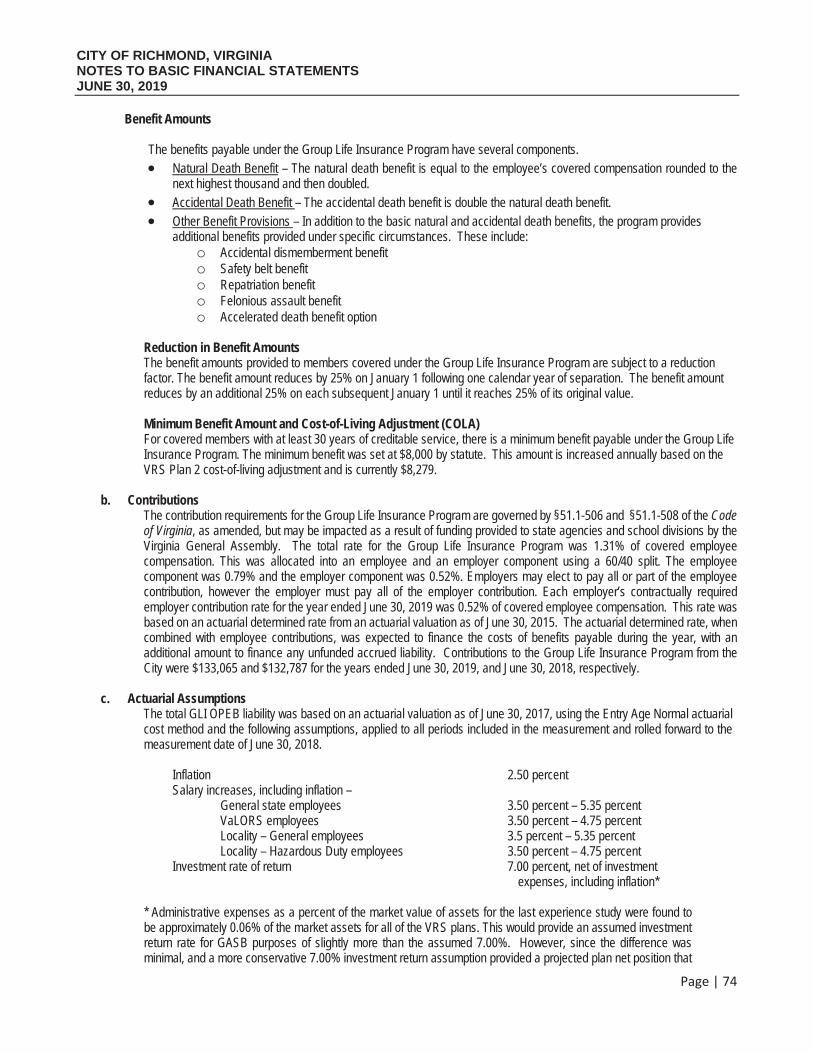
CITY OF RICHMOND, VIRGINIA NOTES TO BASIC FINANCIAL STATEMENTS JUNE 30, 2019
Page | 74
Benefit Amounts
The benefits payable under the Group Life Insurance Program have several components. Natural Death Benefit – The natural death benefit is equal to the employee’s covered compensation rounded to thenext highest thousand and then doubled.Accidental Death Benefit – The accidental death benefit is double the natural death benefit.Other Benefit Provisions – In addition to the basic natural and accidental death benefits, the program providesadditional benefits provided under specific circumstances. These include:
o Accidental dismemberment benefito Safety belt benefito Repatriation benefito Felonious assault benefito Accelerated death benefit option
Reduction in Benefit Amounts The benefit amounts provided to members covered under the Group Life Insurance Program are subject to a reduction factor. The benefit amount reduces by 25% on January 1 following one calendar year of separation. The benefit amount reduces by an additional 25% on each subsequent January 1 until it reaches 25% of its original value.
Minimum Benefit Amount and Cost-of-Living Adjustment (COLA) For covered members with at least 30 years of creditable service, there is a minimum benefit payable under the Group Life Insurance Program. The minimum benefit was set at $8,000 by statute. This amount is increased annually based on the VRS Plan 2 cost-of-living adjustment and is currently $8,279.
b. ContributionsThe contribution requirements for the Group Life Insurance Program are governed by §51.1-506 and §51.1-508 of the Code of Virginia, as amended, but may be impacted as a result of funding provided to state agencies and school divisions by the Virginia General Assembly. The total rate for the Group Life Insurance Program was 1.31% of covered employee compensation. This was allocated into an employee and an employer component using a 60/40 split. The employee component was 0.79% and the employer component was 0.52%. Employers may elect to pay all or part of the employee contribution, however the employer must pay all of the employer contribution. Each employer’s contractually required employer contribution rate for the year ended June 30, 2019 was 0.52% of covered employee compensation. This rate was based on an actuarial determined rate from an actuarial valuation as of June 30, 2015. The actuarial determined rate, when combined with employee contributions, was expected to finance the costs of benefits payable during the year, with an additional amount to finance any unfunded accrued liability. Contributions to the Group Life Insurance Program from the City were $133,065 and $132,787 for the years ended June 30, 2019, and June 30, 2018, respectively.
c. Actuarial AssumptionsThe total GLI OPEB liability was based on an actuarial valuation as of June 30, 2017, using the Entry Age Normal actuarial cost method and the following assumptions, applied to all periods included in the measurement and rolled forward to the measurement date of June 30, 2018.
Inflation 2.50 percentSalary increases, including inflation –
General state employees 3.50 percent – 5.35 percent VaLORS employees 3.50 percent – 4.75 percent Locality – General employees 3.5 percent – 5.35 percent Locality – Hazardous Duty employees 3.50 percent – 4.75 percent
Investment rate of return 7.00 percent, net of investmentexpenses, including inflation*
* Administrative expenses as a percent of the market value of assets for the last experience study were found tobe approximately 0.06% of the market assets for all of the VRS plans. This would provide an assumed investmentreturn rate for GASB purposes of slightly more than the assumed 7.00%. However, since the difference wasminimal, and a more conservative 7.00% investment return assumption provided a projected plan net position that
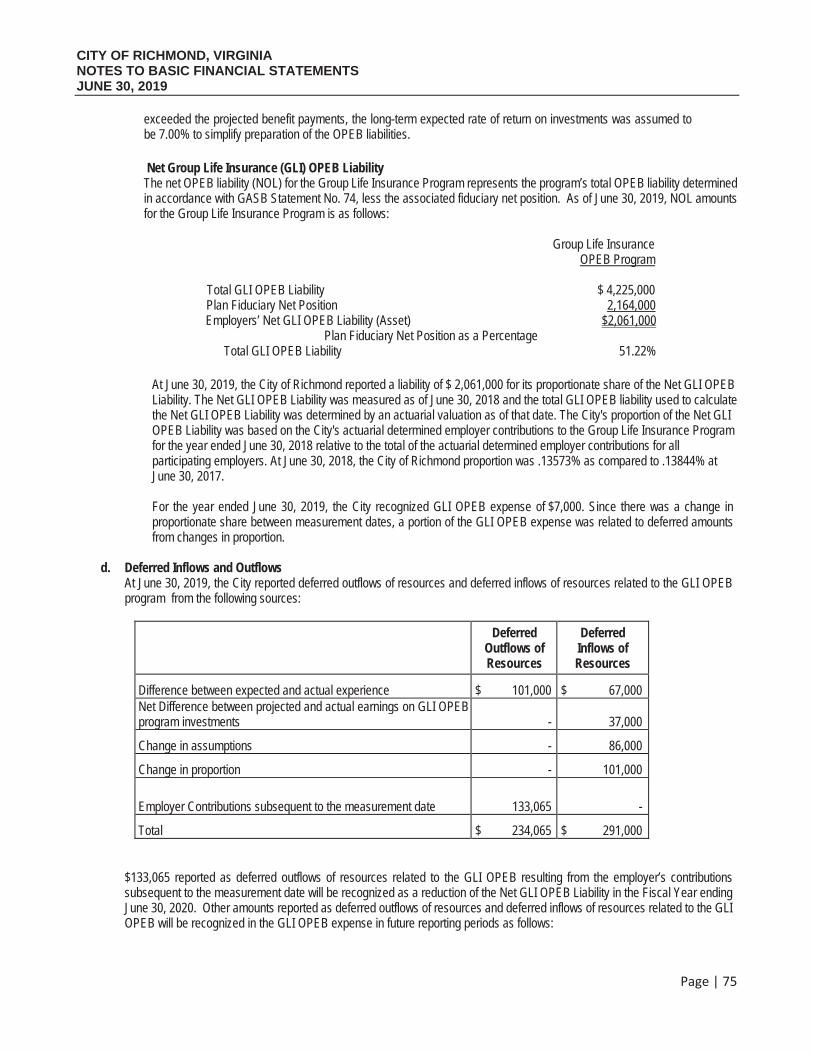
CITY OF RICHMOND, VIRGINIA NOTES TO BASIC FINANCIAL STATEMENTS JUNE 30, 2019
Page | 75
exceeded the projected benefit payments, the long-term expected rate of return on investments was assumed to be 7.00% to simplify preparation of the OPEB liabilities.
Net Group Life Insurance (GLI) OPEB LiabilityThe net OPEB liability (NOL) for the Group Life Insurance Program represents the program’s total OPEB liability determined in accordance with GASB Statement No. 74, less the associated fiduciary net position. As of June 30, 2019, NOL amounts for the Group Life Insurance Program is as follows:
Group Life Insurance OPEB Program
Total GLI OPEB Liability $ 4,225,000 Plan Fiduciary Net Position 2,164,000Employers’ Net GLI OPEB Liability (Asset) $2,061,000
Plan Fiduciary Net Position as a Percentage Total GLI OPEB Liability 51.22%
At June 30, 2019, the City of Richmond reported a liability of $ 2,061,000 for its proportionate share of the Net GLI OPEB Liability. The Net GLI OPEB Liability was measured as of June 30, 2018 and the total GLI OPEB liability used to calculate the Net GLI OPEB Liability was determined by an actuarial valuation as of that date. The City's proportion of the Net GLI OPEB Liability was based on the City's actuarial determined employer contributions to the Group Life Insurance Program for the year ended June 30, 2018 relative to the total of the actuarial determined employer contributions for all participating employers. At June 30, 2018, the City of Richmond proportion was .13573% as compared to .13844% at June 30, 2017.
For the year ended June 30, 2019, the City recognized GLI OPEB expense of $7,000. Since there was a change in proportionate share between measurement dates, a portion of the GLI OPEB expense was related to deferred amounts from changes in proportion.
d. Deferred Inflows and OutflowsAt June 30, 2019, the City reported deferred outflows of resources and deferred inflows of resources related to the GLI OPEBprogram from the following sources:
DeferredOutflows of Resources
DeferredInflows of Resources
Difference between expected and actual experience $ 101,000 $ 67,000 Net Difference between projected and actual earnings on GLI OPEB program investments - 37,000
Change in assumptions - 86,000
Change in proportion - 101,000
Employer Contributions subsequent to the measurement date 133,065 -
Total $ 234,065 $ 291,000
$133,065 reported as deferred outflows of resources related to the GLI OPEB resulting from the employer’s contributions subsequent to the measurement date will be recognized as a reduction of the Net GLI OPEB Liability in the Fiscal Year ending June 30, 2020. Other amounts reported as deferred outflows of resources and deferred inflows of resources related to the GLI OPEB will be recognized in the GLI OPEB expense in future reporting periods as follows:
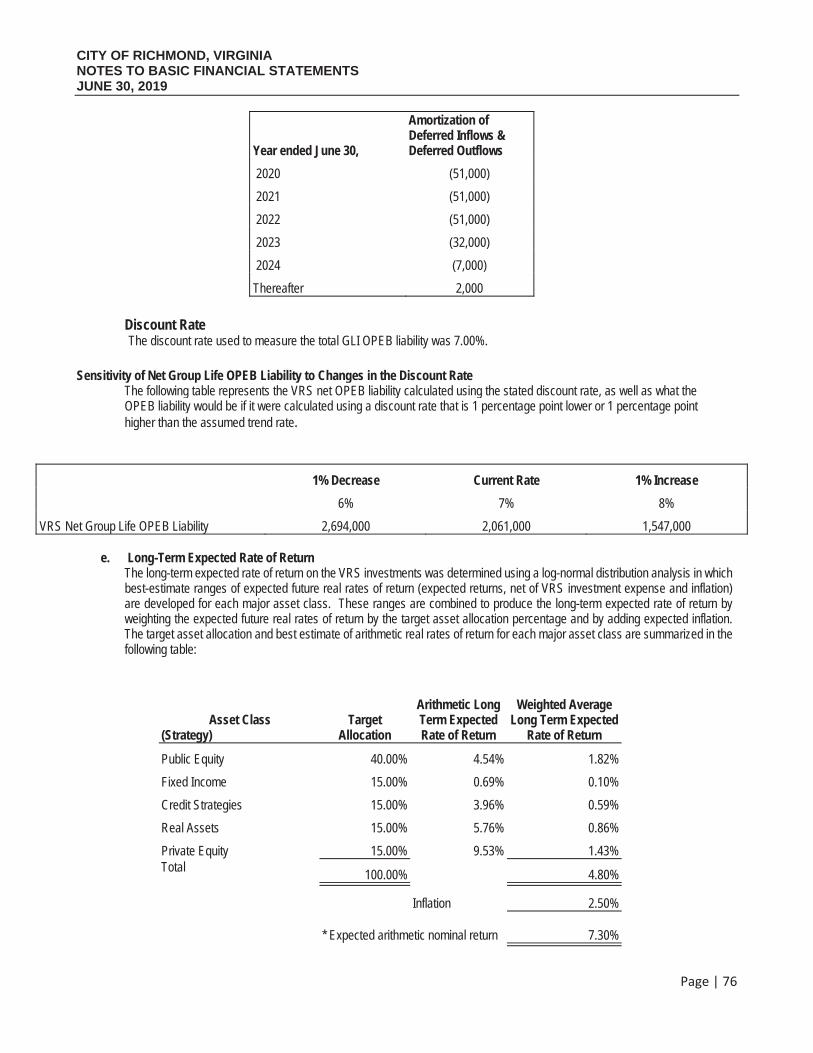
CITY OF RICHMOND, VIRGINIA NOTES TO BASIC FINANCIAL STATEMENTS JUNE 30, 2019
Page | 76
Year ended June 30,
Amortization of Deferred Inflows & Deferred Outflows
2020 (51,000)
2021 (51,000)
2022 (51,000)
2023 (32,000)
2024 (7,000)
Thereafter 2,000
Discount RateThe discount rate used to measure the total GLI OPEB liability was 7.00%.
Sensitivity of Net Group Life OPEB Liability to Changes in the Discount RateThe following table represents the VRS net OPEB liability calculated using the stated discount rate, as well as what the OPEB liability would be if it were calculated using a discount rate that is 1 percentage point lower or 1 percentage point higher than the assumed trend rate.
1% Decrease Current Rate 1% Increase
6% 7% 8%
VRS Net Group Life OPEB Liability 2,694,000 2,061,000 1,547,000
e. Long-Term Expected Rate of ReturnThe long-term expected rate of return on the VRS investments was determined using a log-normal distribution analysis in whichbest-estimate ranges of expected future real rates of return (expected returns, net of VRS investment expense and inflation)are developed for each major asset class. These ranges are combined to produce the long-term expected rate of return byweighting the expected future real rates of return by the target asset allocation percentage and by adding expected inflation.The target asset allocation and best estimate of arithmetic real rates of return for each major asset class are summarized in thefollowing table:
Asset Class (Strategy)
TargetAllocation
Arithmetic Long Term Expected Rate of Return
Weighted Average Long Term Expected
Rate of Return
Public Equity 40.00% 4.54% 1.82%
Fixed Income 15.00% 0.69% 0.10%
Credit Strategies 15.00% 3.96% 0.59%
Real Assets 15.00% 5.76% 0.86%
Private Equity 15.00% 9.53% 1.43% Total
100.00% 4.80%
Inflation 2.50%
* Expected arithmetic nominal return 7.30%
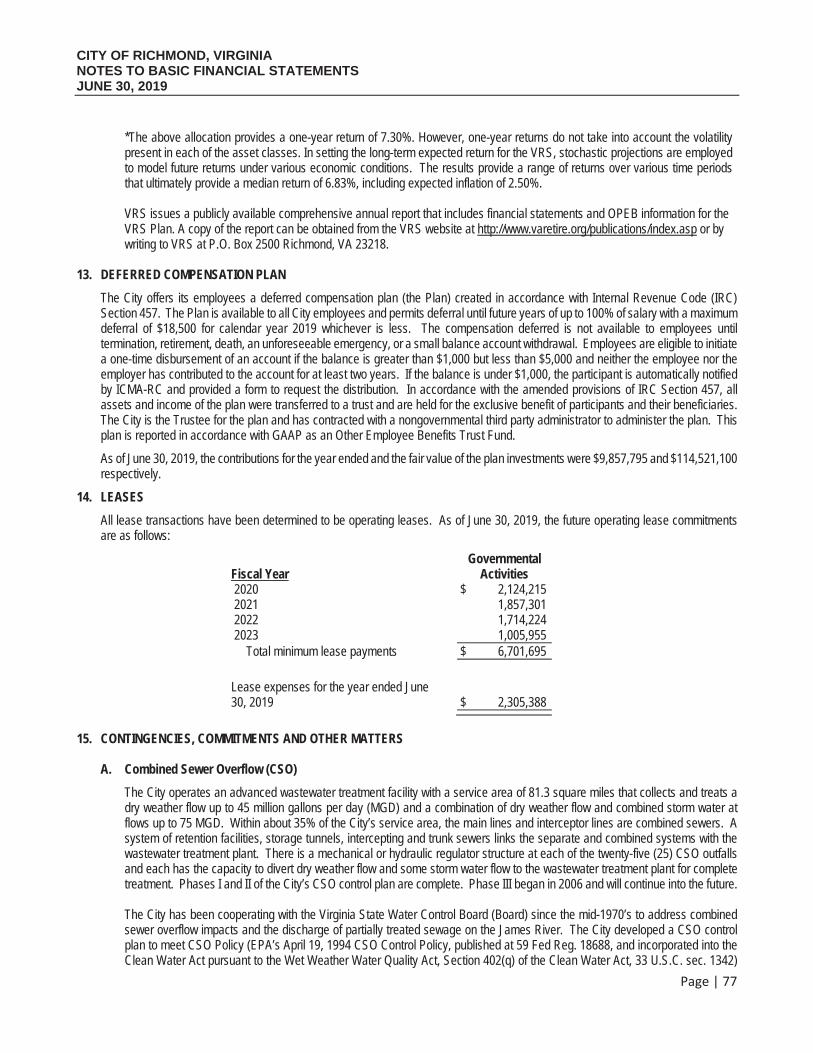
CITY OF RICHMOND, VIRGINIA NOTES TO BASIC FINANCIAL STATEMENTS JUNE 30, 2019
Page | 77
*The above allocation provides a one-year return of 7.30%. However, one-year returns do not take into account the volatilitypresent in each of the asset classes. In setting the long-term expected return for the VRS, stochastic projections are employedto model future returns under various economic conditions. The results provide a range of returns over various time periodsthat ultimately provide a median return of 6.83%, including expected inflation of 2.50%.
VRS issues a publicly available comprehensive annual report that includes financial statements and OPEB information for the VRS Plan. A copy of the report can be obtained from the VRS website at http://www.varetire.org/publications/index.asp or by writing to VRS at P.O. Box 2500 Richmond, VA 23218.
13. DEFERRED COMPENSATION PLAN
The City offers its employees a deferred compensation plan (the Plan) created in accordance with Internal Revenue Code (IRC)Section 457. The Plan is available to all City employees and permits deferral until future years of up to 100% of salary with a maximum deferral of $18,500 for calendar year 2019 whichever is less. The compensation deferred is not available to employees untiltermination, retirement, death, an unforeseeable emergency, or a small balance account withdrawal. Employees are eligible to initiate a one-time disbursement of an account if the balance is greater than $1,000 but less than $5,000 and neither the employee nor theemployer has contributed to the account for at least two years. If the balance is under $1,000, the participant is automatically notifiedby ICMA-RC and provided a form to request the distribution. In accordance with the amended provisions of IRC Section 457, allassets and income of the plan were transferred to a trust and are held for the exclusive benefit of participants and their beneficiaries.The City is the Trustee for the plan and has contracted with a nongovernmental third party administrator to administer the plan. Thisplan is reported in accordance with GAAP as an Other Employee Benefits Trust Fund.
As of June 30, 2019, the contributions for the year ended and the fair value of the plan investments were $9,857,795 and $114,521,100respectively.
14. LEASES
All lease transactions have been determined to be operating leases. As of June 30, 2019, the future operating lease commitmentsare as follows:
Fiscal Year Governmental
Activities 2020 $ 2,124,215 2021 1,857,301 2022 1,714,224 2023 1,005,955 Total minimum lease payments $ 6,701,695
Lease expenses for the year ended June 30, 2019 $ 2,305,388
15. CONTINGENCIES, COMMITMENTS AND OTHER MATTERS
A. Combined Sewer Overflow (CSO)
The City operates an advanced wastewater treatment facility with a service area of 81.3 square miles that collects and treats adry weather flow up to 45 million gallons per day (MGD) and a combination of dry weather flow and combined storm water atflows up to 75 MGD. Within about 35% of the City’s service area, the main lines and interceptor lines are combined sewers. Asystem of retention facilities, storage tunnels, intercepting and trunk sewers links the separate and combined systems with thewastewater treatment plant. There is a mechanical or hydraulic regulator structure at each of the twenty-five (25) CSO outfallsand each has the capacity to divert dry weather flow and some storm water flow to the wastewater treatment plant for completetreatment. Phases I and II of the City’s CSO control plan are complete. Phase III began in 2006 and will continue into the future.
The City has been cooperating with the Virginia State Water Control Board (Board) since the mid-1970’s to address combinedsewer overflow impacts and the discharge of partially treated sewage on the James River. The City developed a CSO controlplan to meet CSO Policy (EPA’s April 19, 1994 CSO Control Policy, published at 59 Fed Reg. 18688, and incorporated into theClean Water Act pursuant to the Wet Weather Water Quality Act, Section 402(q) of the Clean Water Act, 33 U.S.C. sec. 1342)
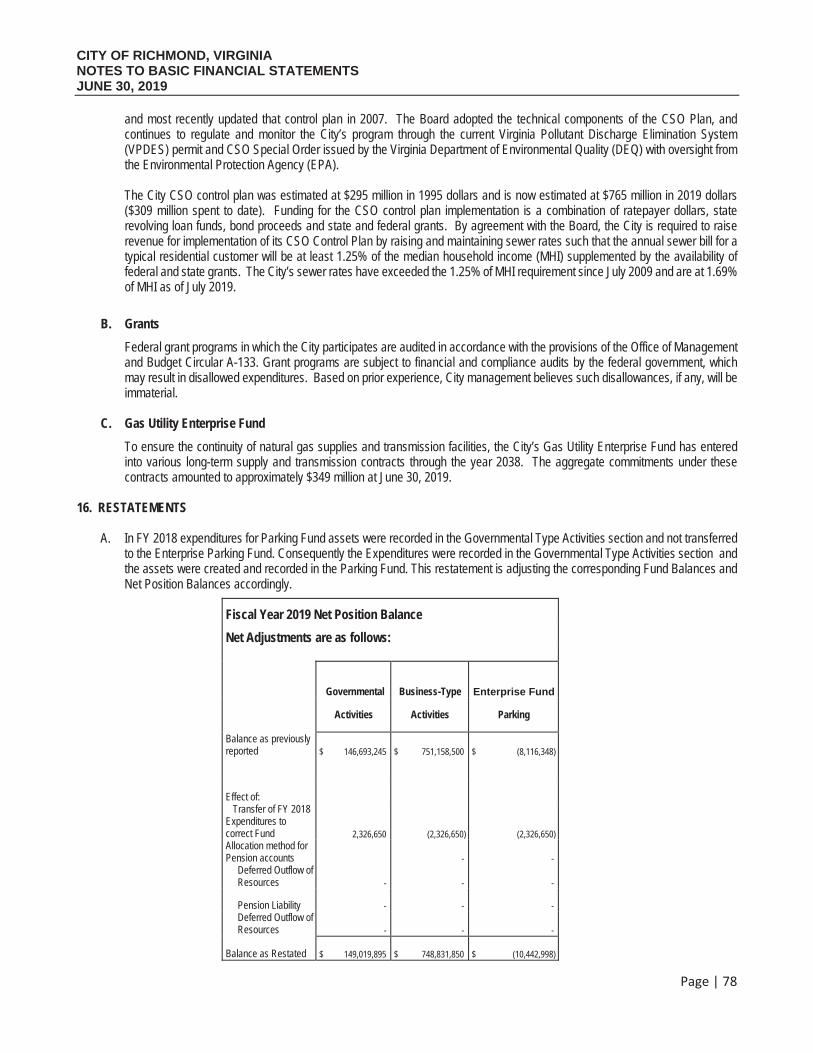
CITY OF RICHMOND, VIRGINIA NOTES TO BASIC FINANCIAL STATEMENTS JUNE 30, 2019
Page | 78
and most recently updated that control plan in 2007. The Board adopted the technical components of the CSO Plan, and continues to regulate and monitor the City’s program through the current Virginia Pollutant Discharge Elimination System (VPDES) permit and CSO Special Order issued by the Virginia Department of Environmental Quality (DEQ) with oversight from the Environmental Protection Agency (EPA).
The City CSO control plan was estimated at $295 million in 1995 dollars and is now estimated at $765 million in 2019 dollars ($309 million spent to date). Funding for the CSO control plan implementation is a combination of ratepayer dollars, state revolving loan funds, bond proceeds and state and federal grants. By agreement with the Board, the City is required to raise revenue for implementation of its CSO Control Plan by raising and maintaining sewer rates such that the annual sewer bill for atypical residential customer will be at least 1.25% of the median household income (MHI) supplemented by the availability of federal and state grants. The City’s sewer rates have exceeded the 1.25% of MHI requirement since July 2009 and are at 1.69% of MHI as of July 2019.
B. Grants
Federal grant programs in which the City participates are audited in accordance with the provisions of the Office of Managementand Budget Circular A-133. Grant programs are subject to financial and compliance audits by the federal government, whichmay result in disallowed expenditures. Based on prior experience, City management believes such disallowances, if any, will beimmaterial.
C. Gas Utility Enterprise Fund
To ensure the continuity of natural gas supplies and transmission facilities, the City’s Gas Utility Enterprise Fund has enteredinto various long-term supply and transmission contracts through the year 2038. The aggregate commitments under thesecontracts amounted to approximately $349 million at June 30, 2019.
16. RESTATEMENTS
A. In FY 2018 expenditures for Parking Fund assets were recorded in the Governmental Type Activities section and not transferredto the Enterprise Parking Fund. Consequently the Expenditures were recorded in the Governmental Type Activities section andthe assets were created and recorded in the Parking Fund. This restatement is adjusting the corresponding Fund Balances andNet Position Balances accordingly.
Fiscal Year 2019 Net Position Balance
Net Adjustments are as follows:
Governmental Business-Type Enterprise Fund
Activities Activities Parking
Balance as previously reported $ 146,693,245 $ 751,158,500 $ (8,116,348)
Effect of: Transfer of FY 2018 Expenditures to correct Fund 2,326,650 (2,326,650) (2,326,650) Allocation method for Pension accounts - -
Deferred Outflow of Resources - - -
Pension Liability - - - Deferred Outflow of Resources - - -
Balance as Restated $ 149,019,895 $ 748,831,850 $ (10,442,998)

REQ
UIR
EDSU
PPLEMEN
TAR
Y IN
FO

REQUIRED SUPPLEMENTARY
INFORMATION

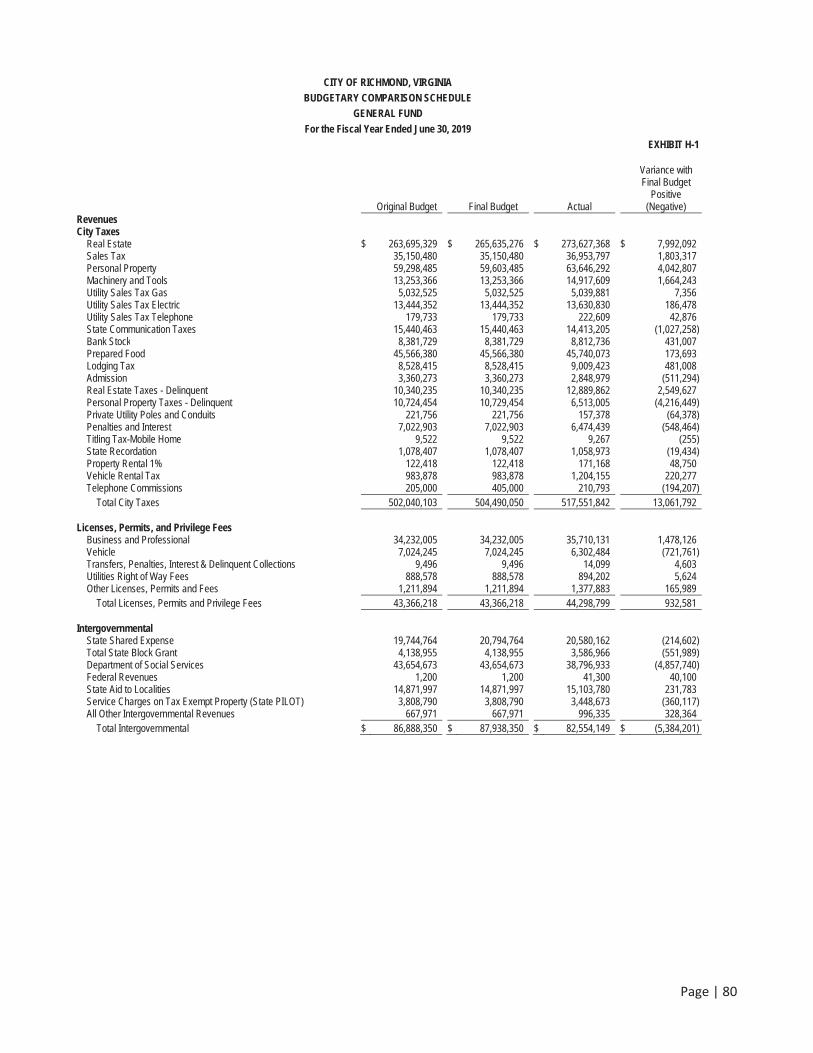
Page | 80
CITY OF RICHMOND, VIRGINIA
BUDGETARY COMPARISON SCHEDULE
GENERAL FUND
For the Fiscal Year Ended June 30, 2019
EXHIBIT H-1
Original Budget Final Budget Actual
Variance with Final Budget
Positive (Negative)
Revenues City Taxes
Real Estate $ 263,695,329 $ 265,635,276 $ 273,627,368 $ 7,992,092 Sales Tax 35,150,480 35,150,480 36,953,797 1,803,317Personal Property 59,298,485 59,603,485 63,646,292 4,042,807Machinery and Tools 13,253,366 13,253,366 14,917,609 1,664,243Utility Sales Tax Gas 5,032,525 5,032,525 5,039,881 7,356Utility Sales Tax Electric 13,444,352 13,444,352 13,630,830 186,478Utility Sales Tax Telephone 179,733 179,733 222,609 42,876State Communication Taxes 15,440,463 15,440,463 14,413,205 (1,027,258)Bank Stock 8,381,729 8,381,729 8,812,736 431,007Prepared Food 45,566,380 45,566,380 45,740,073 173,693Lodging Tax 8,528,415 8,528,415 9,009,423 481,008Admission 3,360,273 3,360,273 2,848,979 (511,294)Real Estate Taxes - Delinquent 10,340,235 10,340,235 12,889,862 2,549,627Personal Property Taxes - Delinquent 10,724,454 10,729,454 6,513,005 (4,216,449)Private Utility Poles and Conduits 221,756 221,756 157,378 (64,378)Penalties and Interest 7,022,903 7,022,903 6,474,439 (548,464)Titling Tax-Mobile Home 9,522 9,522 9,267 (255)State Recordation 1,078,407 1,078,407 1,058,973 (19,434)Property Rental 1% 122,418 122,418 171,168 48,750 Vehicle Rental Tax 983,878 983,878 1,204,155 220,277Telephone Commissions 205,000 405,000 210,793 (194,207)
Total City Taxes 502,040,103 504,490,050 517,551,842 13,061,792
Licenses, Permits, and Privilege Fees Business and Professional 34,232,005 34,232,005 35,710,131 1,478,126Vehicle 7,024,245 7,024,245 6,302,484 (721,761)Transfers, Penalties, Interest & Delinquent Collections 9,496 9,496 14,099 4,603 Utilities Right of Way Fees 888,578 888,578 894,202 5,624Other Licenses, Permits and Fees 1,211,894 1,211,894 1,377,883 165,989
Total Licenses, Permits and Privilege Fees 43,366,218 43,366,218 44,298,799 932,581
Intergovernmental State Shared Expense 19,744,764 20,794,764 20,580,162 (214,602)Total State Block Grant 4,138,955 4,138,955 3,586,966 (551,989)Department of Social Services 43,654,673 43,654,673 38,796,933 (4,857,740)Federal Revenues 1,200 1,200 41,300 40,100 State Aid to Localities 14,871,997 14,871,997 15,103,780 231,783Service Charges on Tax Exempt Property (State PILOT) 3,808,790 3,808,790 3,448,673 (360,117)All Other Intergovernmental Revenues 667,971 667,971 996,335 328,364
Total Intergovernmental $ 86,888,350 $ 87,938,350 $ 82,554,149 $ (5,384,201)
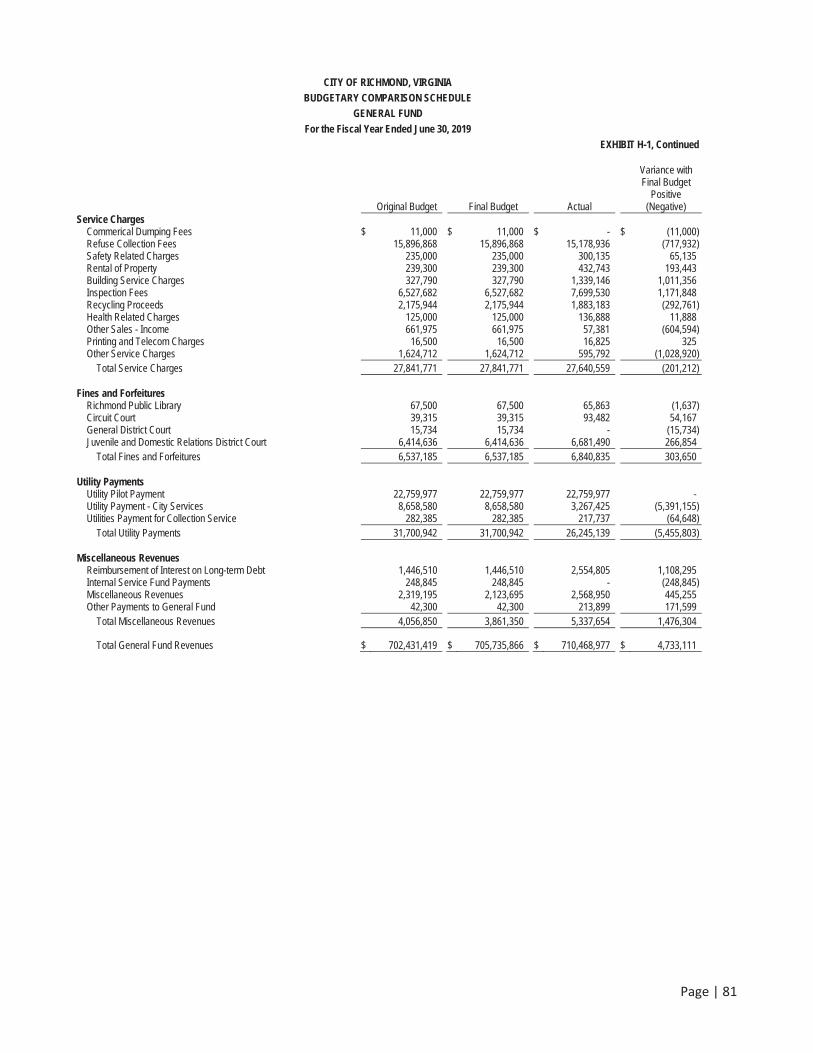
Page | 81
CITY OF RICHMOND, VIRGINIA
BUDGETARY COMPARISON SCHEDULE
GENERAL FUND
For the Fiscal Year Ended June 30, 2019
EXHIBIT H-1, Continued
Original Budget Final Budget Actual
Variance with Final Budget
Positive (Negative)
Service Charges Commerical Dumping Fees $ 11,000 $ 11,000 $ - $ (11,000) Refuse Collection Fees 15,896,868 15,896,868 15,178,936 (717,932) Safety Related Charges 235,000 235,000 300,135 65,135 Rental of Property 239,300 239,300 432,743 193,443 Building Service Charges 327,790 327,790 1,339,146 1,011,356 Inspection Fees 6,527,682 6,527,682 7,699,530 1,171,848Recycling Proceeds 2,175,944 2,175,944 1,883,183 (292,761)Health Related Charges 125,000 125,000 136,888 11,888 Other Sales - Income 661,975 661,975 57,381 (604,594) Printing and Telecom Charges 16,500 16,500 16,825 325 Other Service Charges 1,624,712 1,624,712 595,792 (1,028,920)
Total Service Charges 27,841,771 27,841,771 27,640,559 (201,212)
Fines and Forfeitures Richmond Public Library 67,500 67,500 65,863 (1,637) Circuit Court 39,315 39,315 93,482 54,167General District Court 15,734 15,734 - (15,734)Juvenile and Domestic Relations District Court 6,414,636 6,414,636 6,681,490 266,854
Total Fines and Forfeitures 6,537,185 6,537,185 6,840,835 303,650
Utility Payments Utility Pilot Payment 22,759,977 22,759,977 22,759,977 -Utility Payment - City Services 8,658,580 8,658,580 3,267,425 (5,391,155) Utilities Payment for Collection Service 282,385 282,385 217,737 (64,648)
Total Utility Payments 31,700,942 31,700,942 26,245,139 (5,455,803)
Miscellaneous Revenues Reimbursement of Interest on Long-term Debt 1,446,510 1,446,510 2,554,805 1,108,295 Internal Service Fund Payments 248,845 248,845 - (248,845) Miscellaneous Revenues 2,319,195 2,123,695 2,568,950 445,255Other Payments to General Fund 42,300 42,300 213,899 171,599
Total Miscellaneous Revenues 4,056,850 3,861,350 5,337,654 1,476,304
Total General Fund Revenues $ 702,431,419 $ 705,735,866 $ 710,468,977 $ 4,733,111
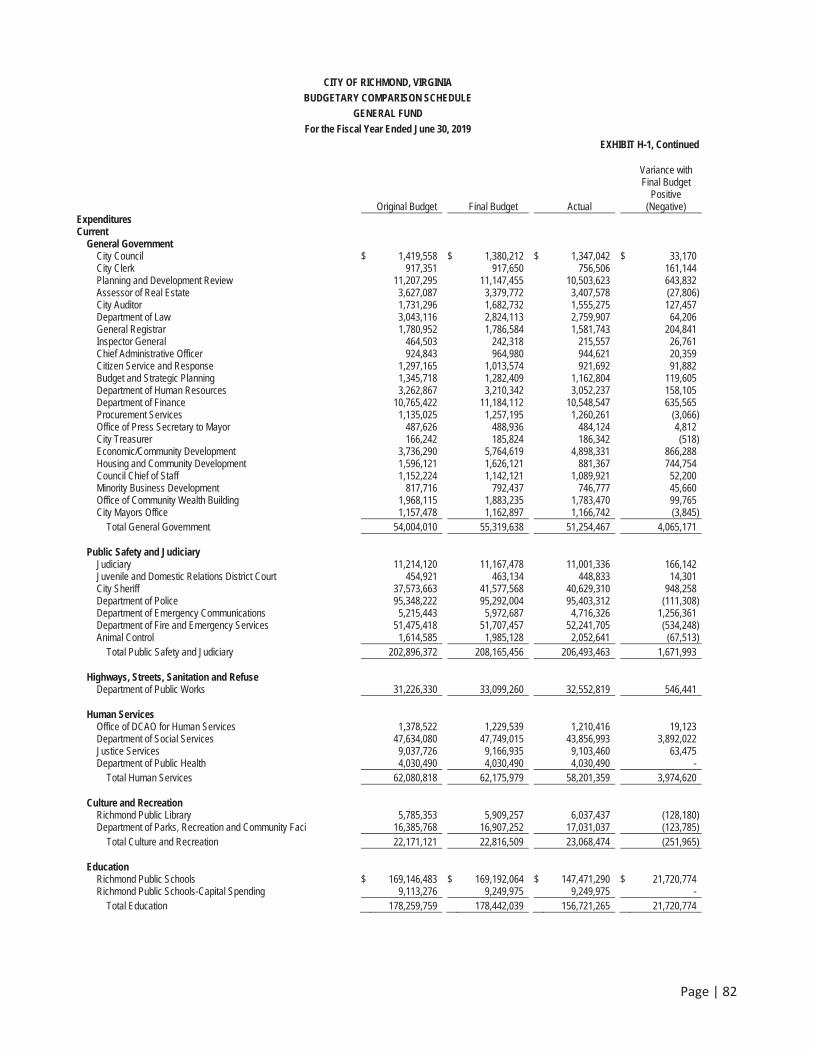
Page | 82
CITY OF RICHMOND, VIRGINIA
BUDGETARY COMPARISON SCHEDULE
GENERAL FUND
For the Fiscal Year Ended June 30, 2019
EXHIBIT H-1, Continued
Original Budget Final Budget Actual
Variance with Final Budget
Positive (Negative)
Expenditures Current
General Government City Council $ 1,419,558 $ 1,380,212 $ 1,347,042 $ 33,170 City Clerk 917,351 917,650 756,506 161,144Planning and Development Review 11,207,295 11,147,455 10,503,623 643,832Assessor of Real Estate 3,627,087 3,379,772 3,407,578 (27,806)City Auditor 1,731,296 1,682,732 1,555,275 127,457Department of Law 3,043,116 2,824,113 2,759,907 64,206General Registrar 1,780,952 1,786,584 1,581,743 204,841Inspector General 464,503 242,318 215,557 26,761Chief Administrative Officer 924,843 964,980 944,621 20,359Citizen Service and Response 1,297,165 1,013,574 921,692 91,882Budget and Strategic Planning 1,345,718 1,282,409 1,162,804 119,605Department of Human Resources 3,262,867 3,210,342 3,052,237 158,105Department of Finance 10,765,422 11,184,112 10,548,547 635,565Procurement Services 1,135,025 1,257,195 1,260,261 (3,066)Office of Press Secretary to Mayor 487,626 488,936 484,124 4,812City Treasurer 166,242 185,824 186,342 (518)Economic/Community Development 3,736,290 5,764,619 4,898,331 866,288Housing and Community Development 1,596,121 1,626,121 881,367 744,754Council Chief of Staff 1,152,224 1,142,121 1,089,921 52,200Minority Business Development 817,716 792,437 746,777 45,660Office of Community Wealth Building 1,968,115 1,883,235 1,783,470 99,765City Mayors Office 1,157,478 1,162,897 1,166,742 (3,845)
Total General Government 54,004,010 55,319,638 51,254,467 4,065,171
Public Safety and Judiciary Judiciary 11,214,120 11,167,478 11,001,336 166,142Juvenile and Domestic Relations District Court 454,921 463,134 448,833 14,301City Sheriff 37,573,663 41,577,568 40,629,310 948,258Department of Police 95,348,222 95,292,004 95,403,312 (111,308)Department of Emergency Communications 5,215,443 5,972,687 4,716,326 1,256,361Department of Fire and Emergency Services 51,475,418 51,707,457 52,241,705 (534,248)Animal Control 1,614,585 1,985,128 2,052,641 (67,513)
Total Public Safety and Judiciary 202,896,372 208,165,456 206,493,463 1,671,993
Highways, Streets, Sanitation and Refuse Department of Public Works 31,226,330 33,099,260 32,552,819 546,441
Human Services Office of DCAO for Human Services 1,378,522 1,229,539 1,210,416 19,123Department of Social Services 47,634,080 47,749,015 43,856,993 3,892,022Justice Services 9,037,726 9,166,935 9,103,460 63,475Department of Public Health 4,030,490 4,030,490 4,030,490 -
Total Human Services 62,080,818 62,175,979 58,201,359 3,974,620
Culture and Recreation Richmond Public Library 5,785,353 5,909,257 6,037,437 (128,180)Department of Parks, Recreation and Community Faci 16,385,768 16,907,252 17,031,037 (123,785)
Total Culture and Recreation 22,171,121 22,816,509 23,068,474 (251,965)
Education Richmond Public Schools $ 169,146,483 $ 169,192,064 $ 147,471,290 $ 21,720,774 Richmond Public Schools-Capital Spending 9,113,276 9,249,975 9,249,975 -
Total Education 178,259,759 178,442,039 156,721,265 21,720,774
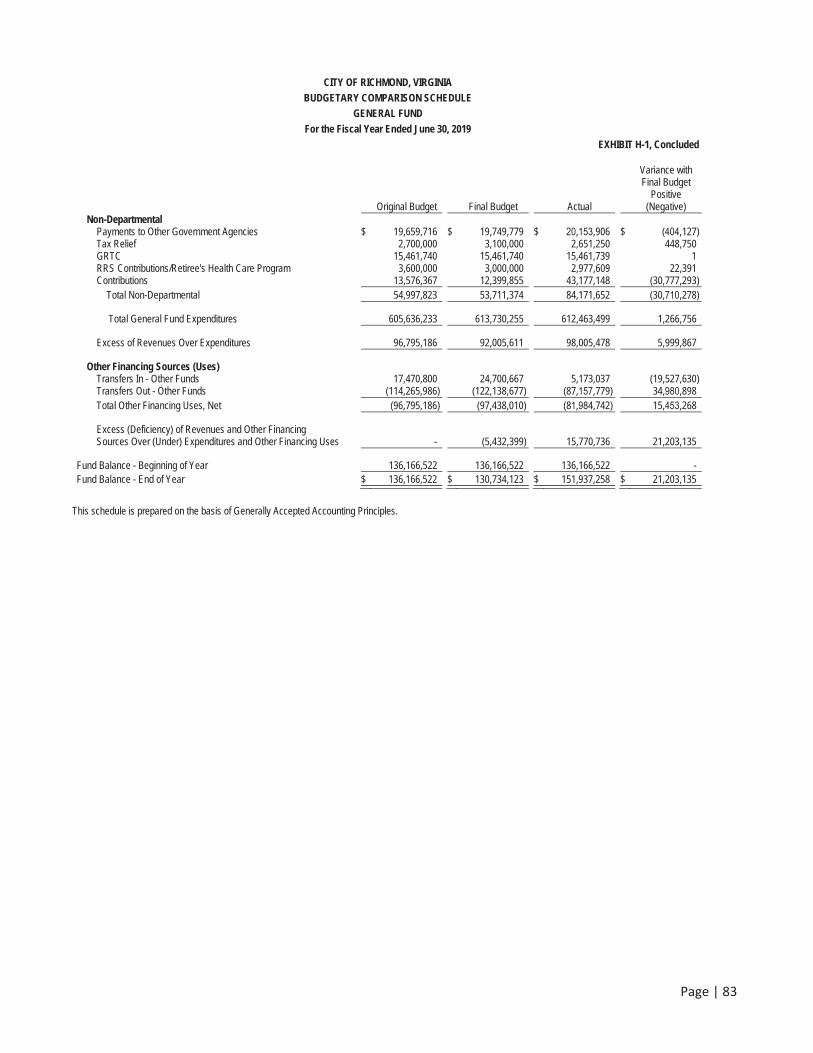
Page | 83
CITY OF RICHMOND, VIRGINIA
BUDGETARY COMPARISON SCHEDULE
GENERAL FUND
For the Fiscal Year Ended June 30, 2019
EXHIBIT H-1, Concluded
Original Budget Final Budget Actual
Variance with Final Budget
Positive (Negative)
Non-Departmental Payments to Other Government Agencies $ 19,659,716 $ 19,749,779 $ 20,153,906 $ (404,127) Tax Relief 2,700,000 3,100,000 2,651,250 448,750GRTC 15,461,740 15,461,740 15,461,739 1RRS Contributions/Retiree's Health Care Program 3,600,000 3,000,000 2,977,609 22,391Contributions 13,576,367 12,399,855 43,177,148 (30,777,293)
Total Non-Departmental 54,997,823 53,711,374 84,171,652 (30,710,278)
Total General Fund Expenditures 605,636,233 613,730,255 612,463,499 1,266,756
Excess of Revenues Over Expenditures 96,795,186 92,005,611 98,005,478 5,999,867
Other Financing Sources (Uses) Transfers In - Other Funds 17,470,800 24,700,667 5,173,037 (19,527,630) Transfers Out - Other Funds (114,265,986) (122,138,677) (87,157,779) 34,980,898 Total Other Financing Uses, Net (96,795,186) (97,438,010) (81,984,742) 15,453,268
Excess (Deficiency) of Revenues and Other Financing Sources Over (Under) Expenditures and Other Financing Uses - (5,432,399) 15,770,736 21,203,135
Fund Balance - Beginning of Year 136,166,522 136,166,522 136,166,522 -Fund Balance - End of Year $ 136,166,522 $ 130,734,123 $ 151,937,258 $ 21,203,135
This schedule is prepared on the basis of Generally Accepted Accounting Principles.
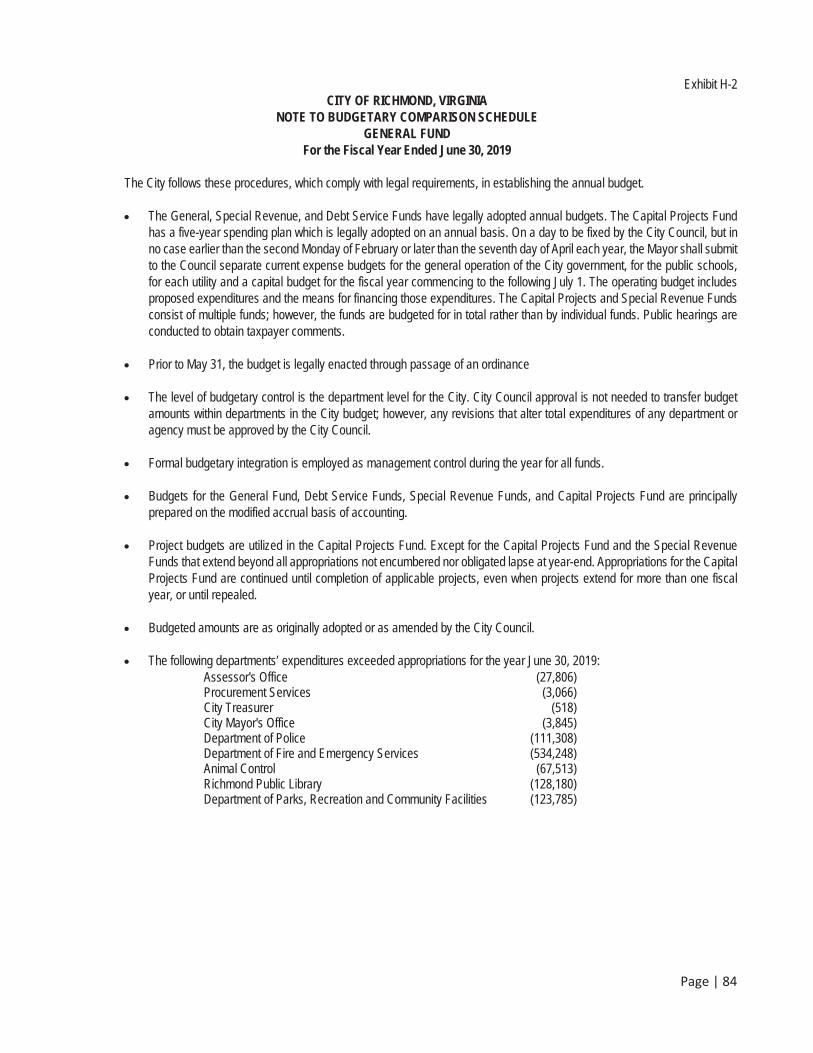
Page | 84
Exhibit H-2 CITY OF RICHMOND, VIRGINIA
NOTE TO BUDGETARY COMPARISON SCHEDULE GENERAL FUND
For the Fiscal Year Ended June 30, 2019
The City follows these procedures, which comply with legal requirements, in establishing the annual budget.
The General, Special Revenue, and Debt Service Funds have legally adopted annual budgets. The Capital Projects Fundhas a five-year spending plan which is legally adopted on an annual basis. On a day to be fixed by the City Council, but inno case earlier than the second Monday of February or later than the seventh day of April each year, the Mayor shall submitto the Council separate current expense budgets for the general operation of the City government, for the public schools,for each utility and a capital budget for the fiscal year commencing to the following July 1. The operating budget includesproposed expenditures and the means for financing those expenditures. The Capital Projects and Special Revenue Fundsconsist of multiple funds; however, the funds are budgeted for in total rather than by individual funds. Public hearings areconducted to obtain taxpayer comments.
Prior to May 31, the budget is legally enacted through passage of an ordinance
The level of budgetary control is the department level for the City. City Council approval is not needed to transfer budgetamounts within departments in the City budget; however, any revisions that alter total expenditures of any department oragency must be approved by the City Council.
Formal budgetary integration is employed as management control during the year for all funds.
Budgets for the General Fund, Debt Service Funds, Special Revenue Funds, and Capital Projects Fund are principallyprepared on the modified accrual basis of accounting.
Project budgets are utilized in the Capital Projects Fund. Except for the Capital Projects Fund and the Special RevenueFunds that extend beyond all appropriations not encumbered nor obligated lapse at year-end. Appropriations for the Capital Projects Fund are continued until completion of applicable projects, even when projects extend for more than one fiscalyear, or until repealed.
Budgeted amounts are as originally adopted or as amended by the City Council.
The following departments’ expenditures exceeded appropriations for the year June 30, 2019:Assessor's Office (27,806)Procurement Services (3,066)City Treasurer (518)City Mayor's Office (3,845)Department of Police (111,308)Department of Fire and Emergency Services (534,248)Animal Control (67,513)Richmond Public Library (128,180)Department of Parks, Recreation and Community Facilities (123,785)
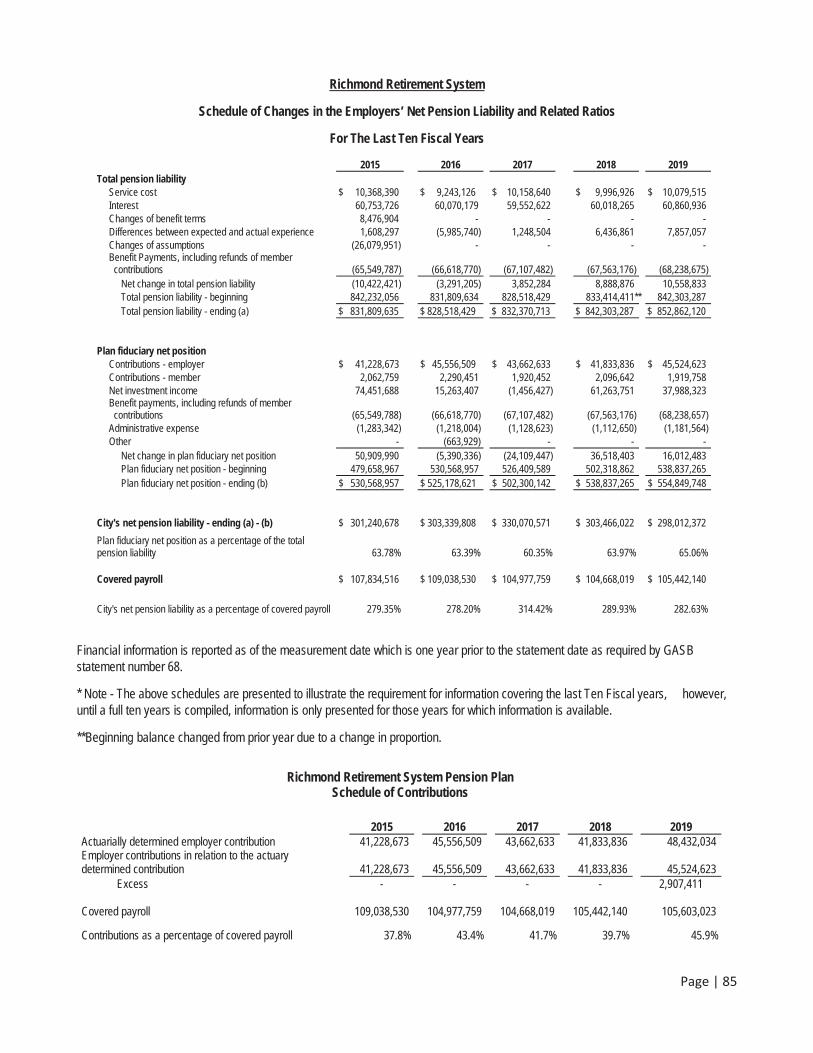
Page | 85
Richmond Retirement System
Schedule of Changes in the Employers’ Net Pension Liability and Related Ratios
For The Last Ten Fiscal Years
2015 2016 2017 2018 2019 Total pension liability
Service cost $ 10,368,390 $ 9,243,126 $ 10,158,640 $ 9,996,926 $ 10,079,515 Interest 60,753,726 60,070,179 59,552,622 60,018,265 60,860,936 Changes of benefit terms 8,476,904 - - - - Differences between expected and actual experience 1,608,297 (5,985,740) 1,248,504 6,436,861 7,857,057 Changes of assumptions (26,079,951) - - - - Benefit Payments, including refunds of member contributions (65,549,787) (66,618,770) (67,107,482) (67,563,176) (68,238,675)
Net change in total pension liability (10,422,421) (3,291,205) 3,852,284 8,888,876 10,558,833 Total pension liability - beginning 842,232,056 831,809,634 828,518,429 833,414,411** 842,303,287 Total pension liability - ending (a) $ 831,809,635 $ 828,518,429 $ 832,370,713 $ 842,303,287 $ 852,862,120
Plan fiduciary net position Contributions - employer $ 41,228,673 $ 45,556,509 $ 43,662,633 $ 41,833,836 $ 45,524,623 Contributions - member 2,062,759 2,290,451 1,920,452 2,096,642 1,919,758 Net investment income 74,451,688 15,263,407 (1,456,427) 61,263,751 37,988,323 Benefit payments, including refunds of member contributions (65,549,788) (66,618,770) (67,107,482) (67,563,176) (68,238,657) Administrative expense (1,283,342) (1,218,004) (1,128,623) (1,112,650) (1,181,564) Other - (663,929) - - -
Net change in plan fiduciary net position 50,909,990 (5,390,336) (24,109,447) 36,518,403 16,012,483 Plan fiduciary net position - beginning 479,658,967 530,568,957 526,409,589 502,318,862 538,837,265 Plan fiduciary net position - ending (b) $ 530,568,957 $ 525,178,621 $ 502,300,142 $ 538,837,265 $ 554,849,748
City's net pension liability - ending (a) - (b) $ 301,240,678 $ 303,339,808 $ 330,070,571 $ 303,466,022 $ 298,012,372
Plan fiduciary net position as a percentage of the total pension liability 63.78% 63.39% 60.35% 63.97% 65.06%
Covered payroll $ 107,834,516 $ 109,038,530 $ 104,977,759 $ 104,668,019 $ 105,442,140
City's net pension liability as a percentage of covered payroll 279.35% 278.20% 314.42% 289.93% 282.63%
Financial information is reported as of the measurement date which is one year prior to the statement date as required by GASB statement number 68.
* Note - The above schedules are presented to illustrate the requirement for information covering the last Ten Fiscal years, however,until a full ten years is compiled, information is only presented for those years for which information is available.
**Beginning balance changed from prior year due to a change in proportion.
Richmond Retirement System Pension Plan Schedule of Contributions
2015 2016 2017 2018 2019 Actuarially determined employer contribution 41,228,673 45,556,509 43,662,633 41,833,836 48,432,034 Employer contributions in relation to the actuary determined contribution 41,228,673 45,556,509 43,662,633 41,833,836 45,524,623
Excess - - - - 2,907,411
Covered payroll 109,038,530 104,977,759 104,668,019 105,442,140 105,603,023
Contributions as a percentage of covered payroll 37.8% 43.4% 41.7% 39.7% 45.9%
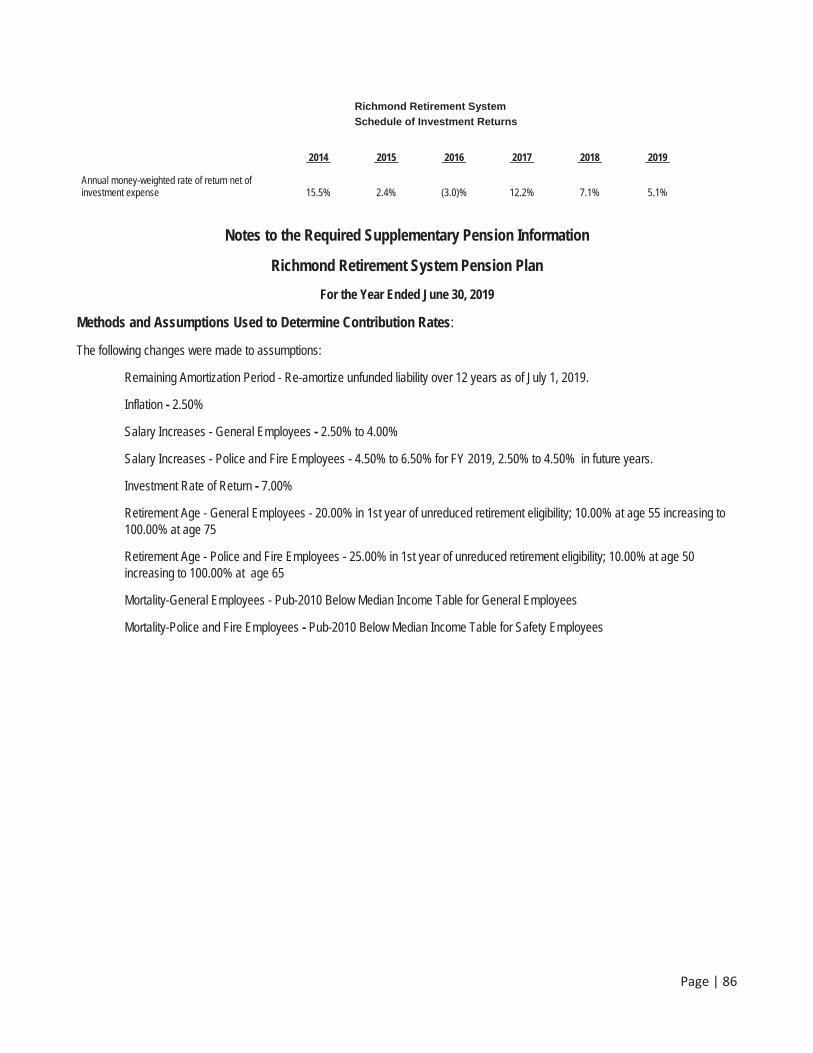
Page | 86
Richmond Retirement System Schedule of Investment Returns
2014 2015 2016 2017 2018 2019
Annual money-weighted rate of return net of investment expense 15.5% 2.4% (3.0)% 12.2% 7.1% 5.1%
Notes to the Required Supplementary Pension Information
Richmond Retirement System Pension Plan
For the Year Ended June 30, 2019
Methods and Assumptions Used to Determine Contribution Rates:
The following changes were made to assumptions:
Remaining Amortization Period - Re-amortize unfunded liability over 12 years as of July 1, 2019.
Inflation - 2.50%
Salary Increases - General Employees - 2.50% to 4.00%
Salary Increases - Police and Fire Employees - 4.50% to 6.50% for FY 2019, 2.50% to 4.50% in future years.
Investment Rate of Return - 7.00%
Retirement Age - General Employees - 20.00% in 1st year of unreduced retirement eligibility; 10.00% at age 55 increasing to 100.00% at age 75
Retirement Age - Police and Fire Employees - 25.00% in 1st year of unreduced retirement eligibility; 10.00% at age 50 increasing to 100.00% at age 65
Mortality-General Employees - Pub-2010 Below Median Income Table for General Employees
Mortality-Police and Fire Employees - Pub-2010 Below Median Income Table for Safety Employees
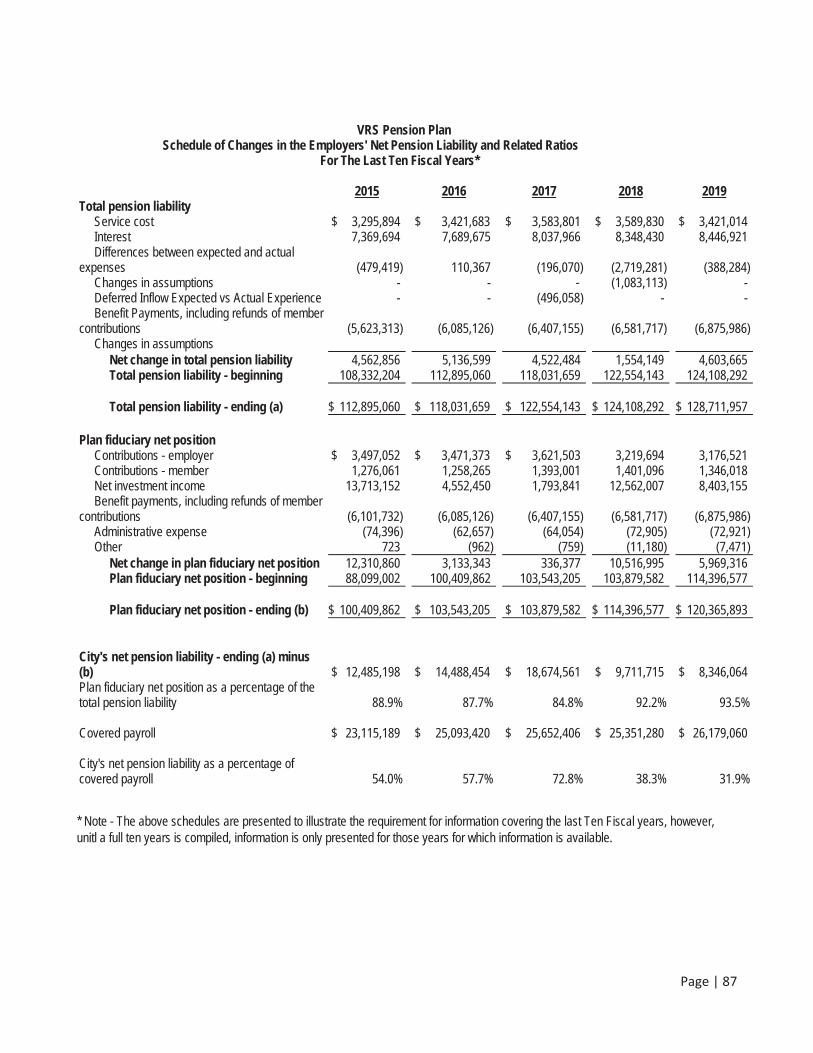
Page | 87
VRS Pension Plan Schedule of Changes in the Employers' Net Pension Liability and Related Ratios
For The Last Ten Fiscal Years*
2015 2016 2017 2018 2019 Total pension liability Service cost $ 3,295,894 $ 3,421,683 $ 3,583,801 $ 3,589,830 $ 3,421,014 Interest 7,369,694 7,689,675 8,037,966 8,348,430 8,446,921 Differences between expected and actual expenses (479,419) 110,367 (196,070) (2,719,281) (388,284) Changes in assumptions - - - (1,083,113) - Deferred Inflow Expected vs Actual Experience - - (496,058) - - Benefit Payments, including refunds of member contributions (5,623,313) (6,085,126) (6,407,155) (6,581,717) (6,875,986) Changes in assumptions Net change in total pension liability 4,562,856 5,136,599 4,522,484 1,554,149 4,603,665 Total pension liability - beginning 108,332,204 112,895,060 118,031,659 122,554,143 124,108,292
Total pension liability - ending (a) $ 112,895,060 $ 118,031,659 $ 122,554,143 $ 124,108,292 $ 128,711,957
Plan fiduciary net position Contributions - employer $ 3,497,052 $ 3,471,373 $ 3,621,503 3,219,694 3,176,521 Contributions - member 1,276,061 1,258,265 1,393,001 1,401,096 1,346,018 Net investment income 13,713,152 4,552,450 1,793,841 12,562,007 8,403,155 Benefit payments, including refunds of member contributions (6,101,732) (6,085,126) (6,407,155) (6,581,717) (6,875,986) Administrative expense (74,396) (62,657) (64,054) (72,905) (72,921) Other 723 (962) (759) (11,180) (7,471) Net change in plan fiduciary net position 12,310,860 3,133,343 336,377 10,516,995 5,969,316 Plan fiduciary net position - beginning 88,099,002 100,409,862 103,543,205 103,879,582 114,396,577
Plan fiduciary net position - ending (b) $ 100,409,862 $ 103,543,205 $ 103,879,582 $ 114,396,577 $ 120,365,893
City's net pension liability - ending (a) minus (b) $ 12,485,198 $ 14,488,454 $ 18,674,561 $ 9,711,715 $ 8,346,064 Plan fiduciary net position as a percentage of the total pension liability 88.9% 87.7% 84.8% 92.2% 93.5%
Covered payroll $ 23,115,189 $ 25,093,420 $ 25,652,406 $ 25,351,280 $ 26,179,060
City's net pension liability as a percentage of covered payroll 54.0% 57.7% 72.8% 38.3% 31.9%
* Note - The above schedules are presented to illustrate the requirement for information covering the last Ten Fiscal years, however,unitl a full ten years is compiled, information is only presented for those years for which information is available.
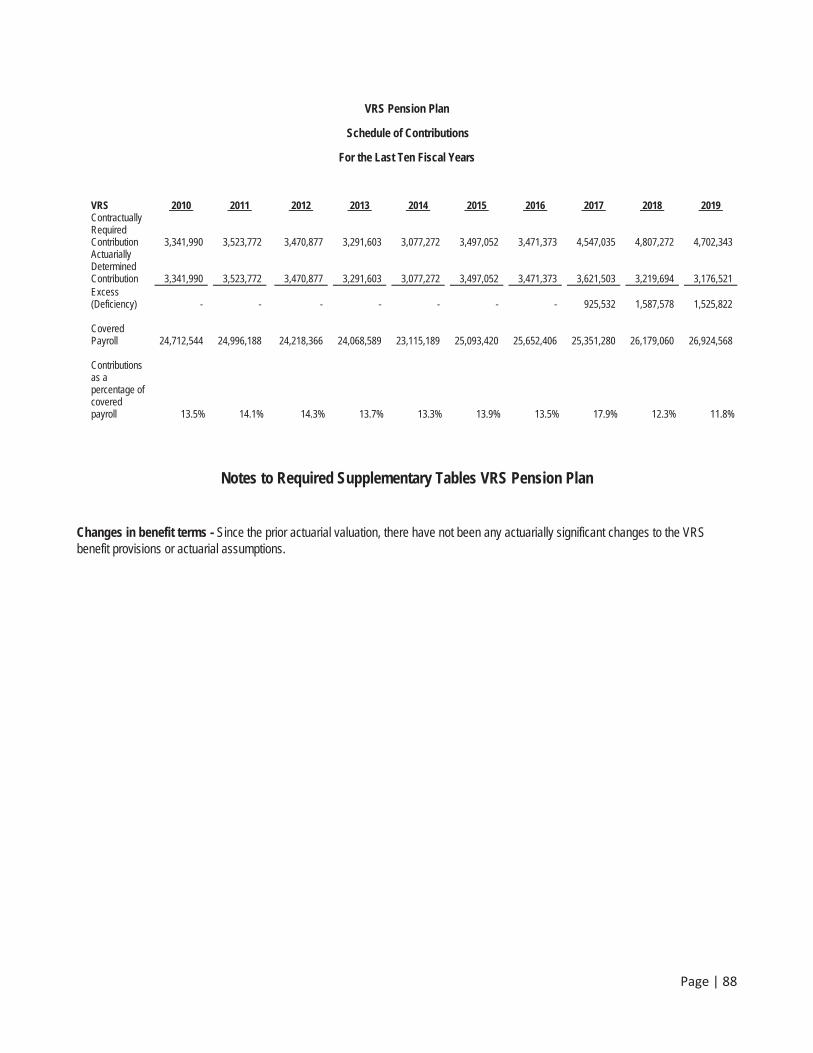
Page | 88
VRS Pension Plan
Schedule of Contributions
For the Last Ten Fiscal Years
VRS 2010 2011 2012 2013 2014 2015 2016 2017 2018 2019Contractually RequiredContribution 3,341,990 3,523,772 3,470,877 3,291,603 3,077,272 3,497,052 3,471,373 4,547,035 4,807,272 4,702,343 Actuarially Determined Contribution 3,341,990 3,523,772 3,470,877 3,291,603 3,077,272 3,497,052 3,471,373 3,621,503 3,219,694 3,176,521 Excess (Deficiency) - - - - - - - 925,532 1,587,578 1,525,822
CoveredPayroll 24,712,544 24,996,188 24,218,366 24,068,589 23,115,189 25,093,420 25,652,406 25,351,280 26,179,060 26,924,568
Contributions as a percentage of covered payroll 13.5% 14.1% 14.3% 13.7% 13.3% 13.9% 13.5% 17.9% 12.3% 11.8%
Notes to Required Supplementary Tables VRS Pension Plan
Changes in benefit terms - Since the prior actuarial valuation, there have not been any actuarially significant changes to the VRS benefit provisions or actuarial assumptions.
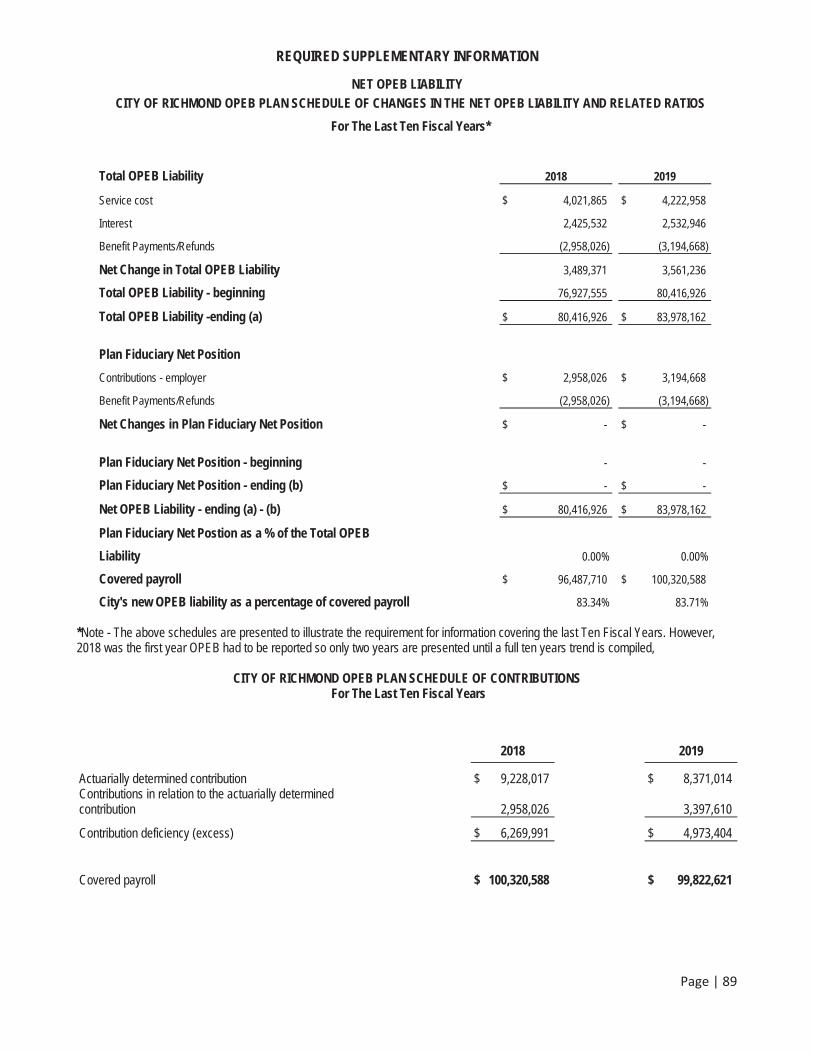
REQUIRED SUPPLEMENTARY INFORMATION
Page | 89
NET OPEB LIABILITY CITY OF RICHMOND OPEB PLAN SCHEDULE OF CHANGES IN THE NET OPEB LIABILITY AND RELATED RATIOS
For The Last Ten Fiscal Years*
Total OPEB Liability 2018 2019
Service cost $ 4,021,865 $ 4,222,958
Interest 2,425,532 2,532,946
Benefit Payments/Refunds (2,958,026) (3,194,668)
Net Change in Total OPEB Liability 3,489,371 3,561,236
Total OPEB Liability - beginning 76,927,555 80,416,926
Total OPEB Liability -ending (a) $ 80,416,926 $ 83,978,162
Plan Fiduciary Net Position
Contributions - employer $ 2,958,026 $ 3,194,668
Benefit Payments/Refunds (2,958,026) (3,194,668)
Net Changes in Plan Fiduciary Net Position $ - $ -
Plan Fiduciary Net Position - beginning - -
Plan Fiduciary Net Position - ending (b) $ - $ -
Net OPEB Liability - ending (a) - (b) $ 80,416,926 $ 83,978,162
Plan Fiduciary Net Postion as a % of the Total OPEB
Liability 0.00% 0.00%
Covered payroll $ 96,487,710 $ 100,320,588
City's new OPEB liability as a percentage of covered payroll 83.34% 83.71%
*Note - The above schedules are presented to illustrate the requirement for information covering the last Ten Fiscal Years. However,2018 was the first year OPEB had to be reported so only two years are presented until a full ten years trend is compiled,
CITY OF RICHMOND OPEB PLAN SCHEDULE OF CONTRIBUTIONS For The Last Ten Fiscal Years
2018 2019
Actuarially determined contribution $ 9,228,017 $ 8,371,014 Contributions in relation to the actuarially determined contribution 2,958,026 3,397,610
Contribution deficiency (excess) $ 6,269,991 $ 4,973,404
Covered payroll $ 100,320,588 $ 99,822,621
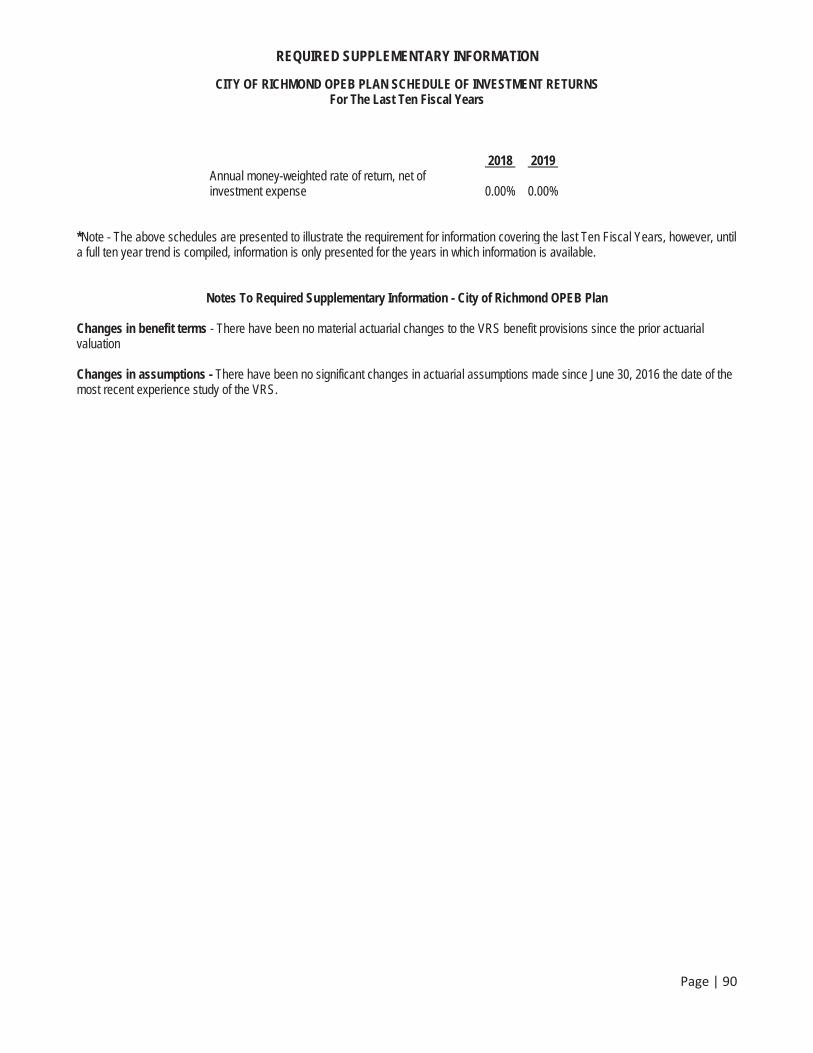
REQUIRED SUPPLEMENTARY INFORMATION
Page | 90
CITY OF RICHMOND OPEB PLAN SCHEDULE OF INVESTMENT RETURNS For The Last Ten Fiscal Years
2018 2019Annual money-weighted rate of return, net of investment expense 0.00% 0.00%
*Note - The above schedules are presented to illustrate the requirement for information covering the last Ten Fiscal Years, however, untila full ten year trend is compiled, information is only presented for the years in which information is available.
Notes To Required Supplementary Information - City of Richmond OPEB Plan
Changes in benefit terms - There have been no material actuarial changes to the VRS benefit provisions since the prior actuarial valuation
Changes in assumptions - There have been no significant changes in actuarial assumptions made since June 30, 2016 the date of the most recent experience study of the VRS.
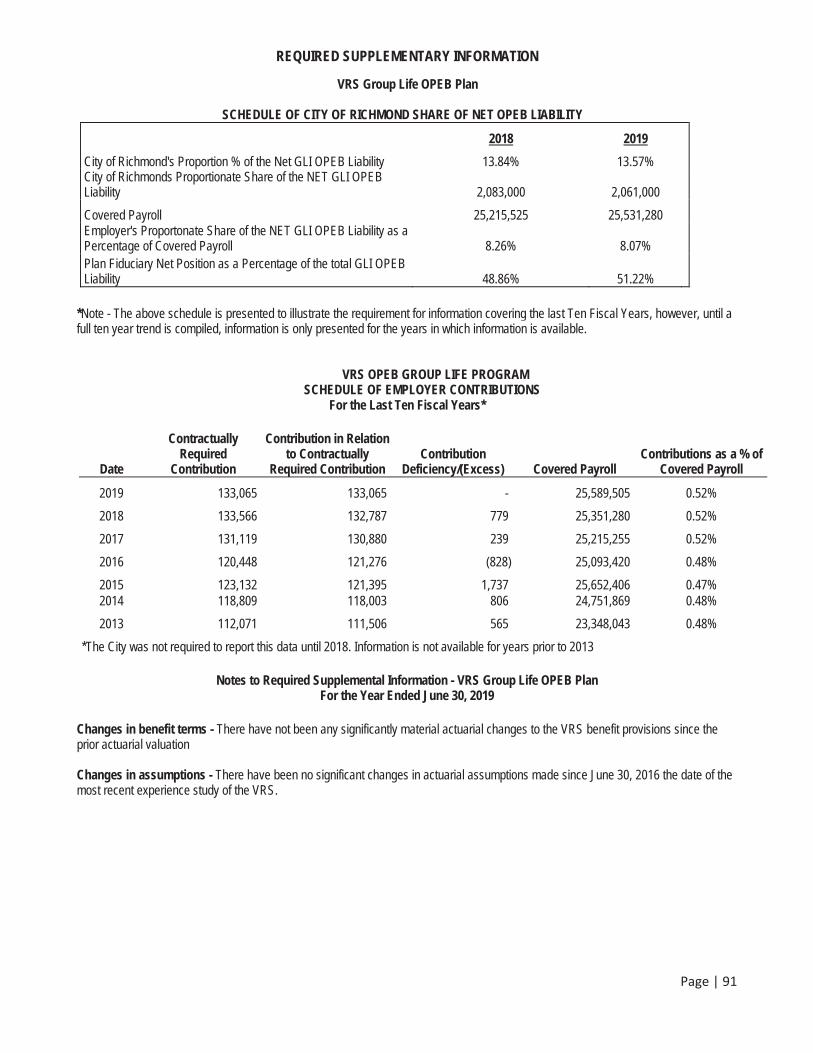
REQUIRED SUPPLEMENTARY INFORMATION
Page | 91
VRS Group Life OPEB Plan
SCHEDULE OF CITY OF RICHMOND SHARE OF NET OPEB LIABILITY
2018 2019
City of Richmond's Proportion % of the Net GLI OPEB Liability 13.84% 13.57% City of Richmonds Proportionate Share of the NET GLI OPEB Liability 2,083,000 2,061,000
Covered Payroll 25,215,525 25,531,280Employer's Proportonate Share of the NET GLI OPEB Liability as a Percentage of Covered Payroll 8.26% 8.07% Plan Fiduciary Net Position as a Percentage of the total GLI OPEB Liability 48.86% 51.22%
*Note - The above schedule is presented to illustrate the requirement for information covering the last Ten Fiscal Years, however, until afull ten year trend is compiled, information is only presented for the years in which information is available.
VRS OPEB GROUP LIFE PROGRAM SCHEDULE OF EMPLOYER CONTRIBUTIONS
For the Last Ten Fiscal Years*
Date
ContractuallyRequired
Contribution
Contribution in Relation to Contractually
Required Contribution Contribution
Deficiency/(Excess) Covered Payroll Contributions as a % of
Covered Payroll
2019 133,065 133,065 - 25,589,505 0.52%
2018 133,566 132,787 779 25,351,280 0.52%
2017 131,119 130,880 239 25,215,255 0.52%
2016 120,448 121,276 (828) 25,093,420 0.48%
2015 123,132 121,395 1,737 25,652,406 0.47% 2014 118,809 118,003 806 24,751,869 0.48%
2013 112,071 111,506 565 23,348,043 0.48%
*The City was not required to report this data until 2018. Information is not available for years prior to 2013
Notes to Required Supplemental Information - VRS Group Life OPEB PlanFor the Year Ended June 30, 2019
Changes in benefit terms - There have not been any significantly material actuarial changes to the VRS benefit provisions since the prior actuarial valuation
Changes in assumptions - There have been no significant changes in actuarial assumptions made since June 30, 2016 the date of the most recent experience study of the VRS.

SUPPLEM
ENTA
RY
INFO
RM
ATIO
N

SUPPLEMENTARY INFORMATION SCHEDULES
&
COMBINING FINANCIAL STATEMENTS

Page | 94
Non-Major Governmental Funds
Special Revenue Funds
Special Revenue Funds are used to account for and report the proceeds of specific revenue sources (other than expendable trust or major capital projects) that are legally restricted or committed to expenditures for specified purposes other than debt service or capital projects. Each fund is established on a functional basis and may include one or more grants or other funding sources.
Grant Revenue Funds These funds are used to account for federal and state grants, private donations and other program revenue.
Consolidated HUD Funds These funds account for activities for the Community Development Block Grant (CDBG), Emergency Shelter (ESG), Home Investment Partnerships Programs (HOME), Housing Opportunities for Persons with AIDS (HOPWA) and Section 108 Loan Program administered by the Department of Community Development.
Permanent Funds
Permanent funds are used to report resources that are legally restricted to the extent that only earnings, not principal, may be used for purposes that support the City programs.
Memorial These bequests provide specific reservation of the principal and use of the income by the City for specific memorial purposes.
RecreationA gift to be used to maintain cemeteries. The principal of the gift is carried as a nonexpendable trust and the accumulated netrevenue is the expendable trust.
Richmond Public Library Certain bequests compose the nonexpendable trust, and the net revenue accumulated is classified as the expendable trust.
Capital Projects FundThe Capital Projects Fund is used to account for and report financial resources that are restricted, committed, or assigned for capital outlays, including the acquisition or construction of capital facilities and other capital assets approved by City Council. The Capital Projects Fund excludes those types of capital-related outflows financed by proprietary funds or for assets that will be held in trust for individuals, private organizations, or other governments. Its principal source of funding is the sale of General Obligation Bonds.
Debt Service Fund
The Debt Service Fund accounts for and reports the accumulation of resources for and the payment of principal and interest and fiscalcharges not being financed by proprietary funds or financial resources that are restricted, committed, or assigned to expenditures for principal and interest. The Debt Service Fund reports resources if legally mandated. Financial resources that are being accumulated for principal and interest maturing in future years also are reported in the Debt Service Fund.
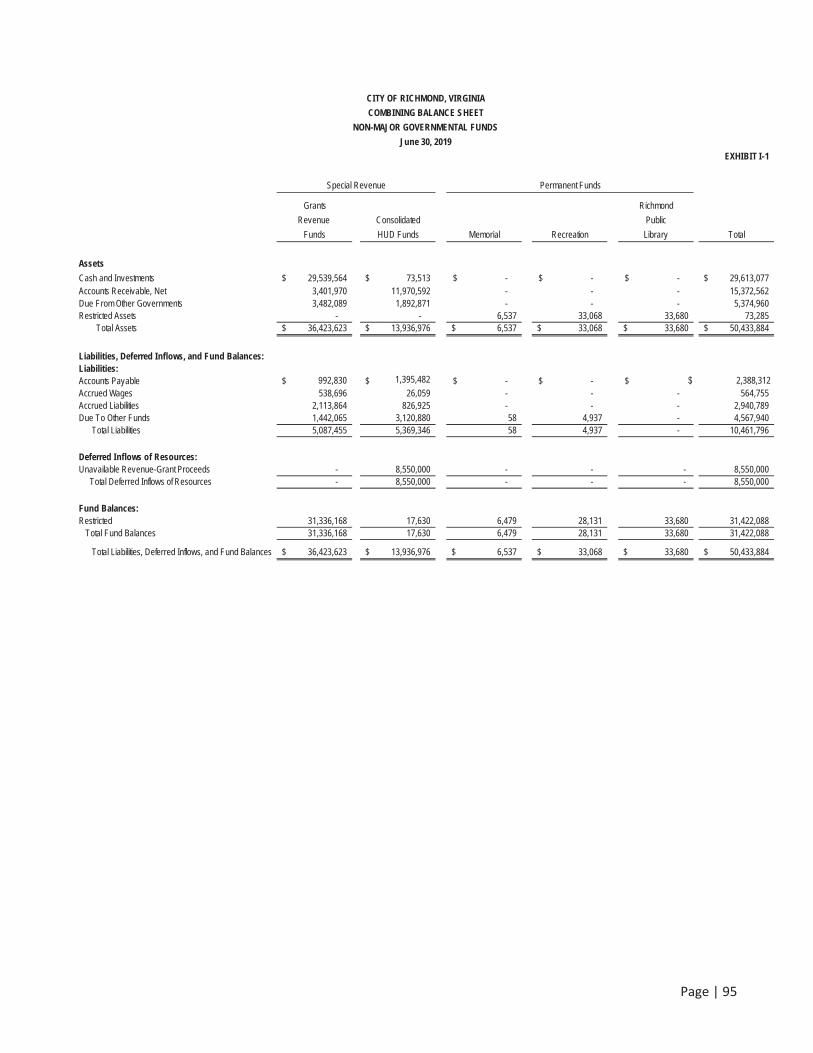
Page | 95
EXHIBIT I-1
Grants Richmond
Revenue Consolidated Public
Funds HUD Funds Memorial Recreation Library Total
Assets
Cash and Investments 29,539,564$ 73,513$ -$ -$ -$ 29,613,077$ Accounts Receivable, Net 3,401,970 11,970,592 - - - 15,372,562 Due From Other Governments 3,482,089 1,892,871 - - - 5,374,960Restricted Assets - - 6,537 33,068 33,680 73,285
Total Assets 36,423,623$ 13,936,976$ 6,537$ 33,068$ 33,680$ 50,433,884$
Liabilities, Deferred Inflows, and Fund Balances:Liabilities:Accounts Payable 992,830$ $ 1,395,482 -$ -$ $ $ 2,388,312Accrued Wages 538,696 26,059 - - - 564,755 Accrued Liabilities 2,113,864 826,925 - - - 2,940,789Due To Other Funds 1,442,065 3,120,880 58 4,937 - 4,567,940
Total Liabilities 5,087,455 5,369,346 58 4,937 - 10,461,796
Deferred Inflows of Resources:Unavailable Revenue-Grant Proceeds - 8,550,000 - - - 8,550,000
Total Deferred Inflows of Resources - 8,550,000 - - - 8,550,000
Fund Balances:Restricted 31,336,168 17,630 6,479 28,131 33,680 31,422,088
Total Fund Balances 31,336,168 17,630 6,479 28,131 33,680 31,422,088
Total Liabilities, Deferred Inflows, and Fund Balances 36,423,623$ 13,936,976$ 6,537$ 33,068$ 33,680$ 50,433,884$
CITY OF RICHMOND, VIRGINIA
COMBINING BALANCE SHEET
NON-MAJOR GOVERNMENTAL FUNDS
June 30, 2019
Permanent FundsSpecial Revenue
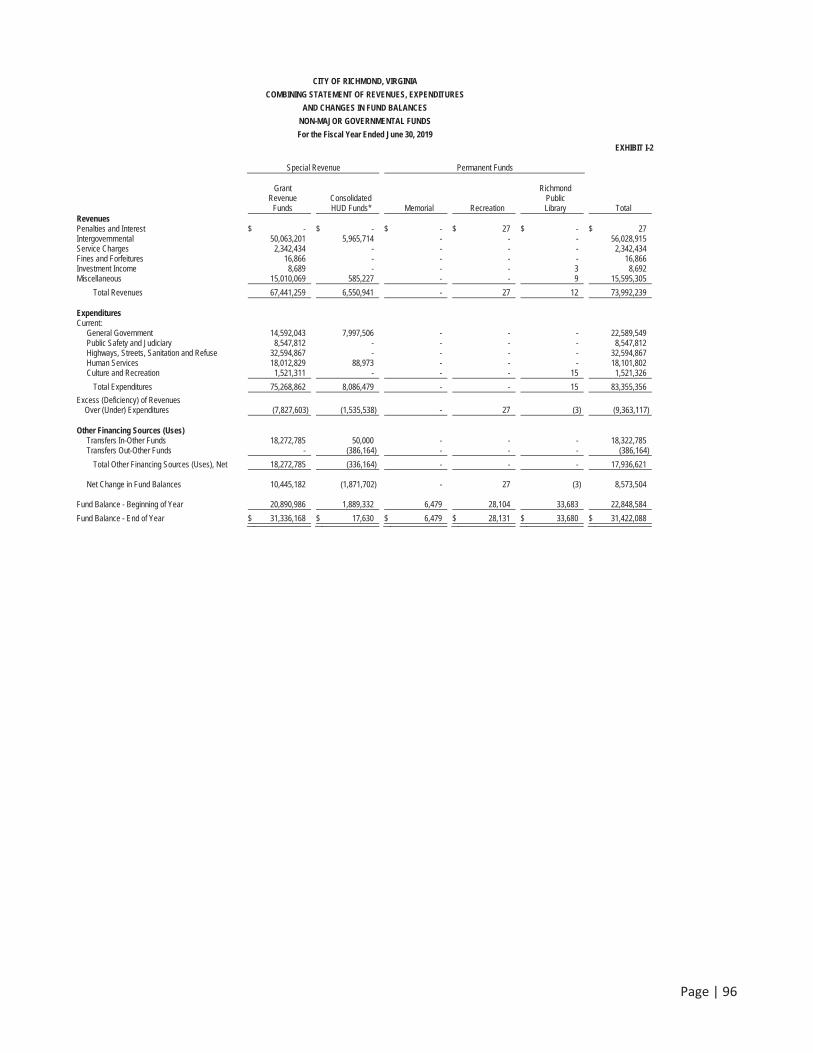
Page | 96
CITY OF RICHMOND, VIRGINIA
COMBINING STATEMENT OF REVENUES, EXPENDITURES
AND CHANGES IN FUND BALANCES
NON-MAJOR GOVERNMENTAL FUNDS
For the Fiscal Year Ended June 30, 2019
EXHIBIT I-2
Special Revenue Permanent Funds
Grant Revenue
Funds Consolidated HUD Funds* Memorial Recreation
Richmond Public Library Total
Revenues Penalties and Interest $ - $ - $ - $ 27 $ - $ 27Intergovernmental 50,063,201 5,965,714 - - - 56,028,915Service Charges 2,342,434 - - - - 2,342,434Fines and Forfeitures 16,866 - - - - 16,866Investment Income 8,689 - - - 3 8,692Miscellaneous 15,010,069 585,227 - - 9 15,595,305
Total Revenues 67,441,259 6,550,941 - 27 12 73,992,239
Expenditures Current:
General Government 14,592,043 7,997,506 - - - 22,589,549Public Safety and Judiciary 8,547,812 - - - - 8,547,812Highways, Streets, Sanitation and Refuse 32,594,867 - - - - 32,594,867Human Services 18,012,829 88,973 - - - 18,101,802Culture and Recreation 1,521,311 - - - 15 1,521,326
Total Expenditures 75,268,862 8,086,479 - - 15 83,355,356
Excess (Deficiency) of Revenues Over (Under) Expenditures (7,827,603) (1,535,538) - 27 (3) (9,363,117)
Other Financing Sources (Uses) Transfers In-Other Funds 18,272,785 50,000 - - - 18,322,785Transfers Out-Other Funds - (386,164) - - - (386,164)
Total Other Financing Sources (Uses), Net 18,272,785 (336,164) - - - 17,936,621
Net Change in Fund Balances 10,445,182 (1,871,702) - 27 (3) 8,573,504
Fund Balance - Beginning of Year 20,890,986 1,889,332 6,479 28,104 33,683 22,848,584
Fund Balance - End of Year $ 31,336,168 $ 17,630 $ 6,479 $ 28,131 $ 33,680 $ 31,422,088
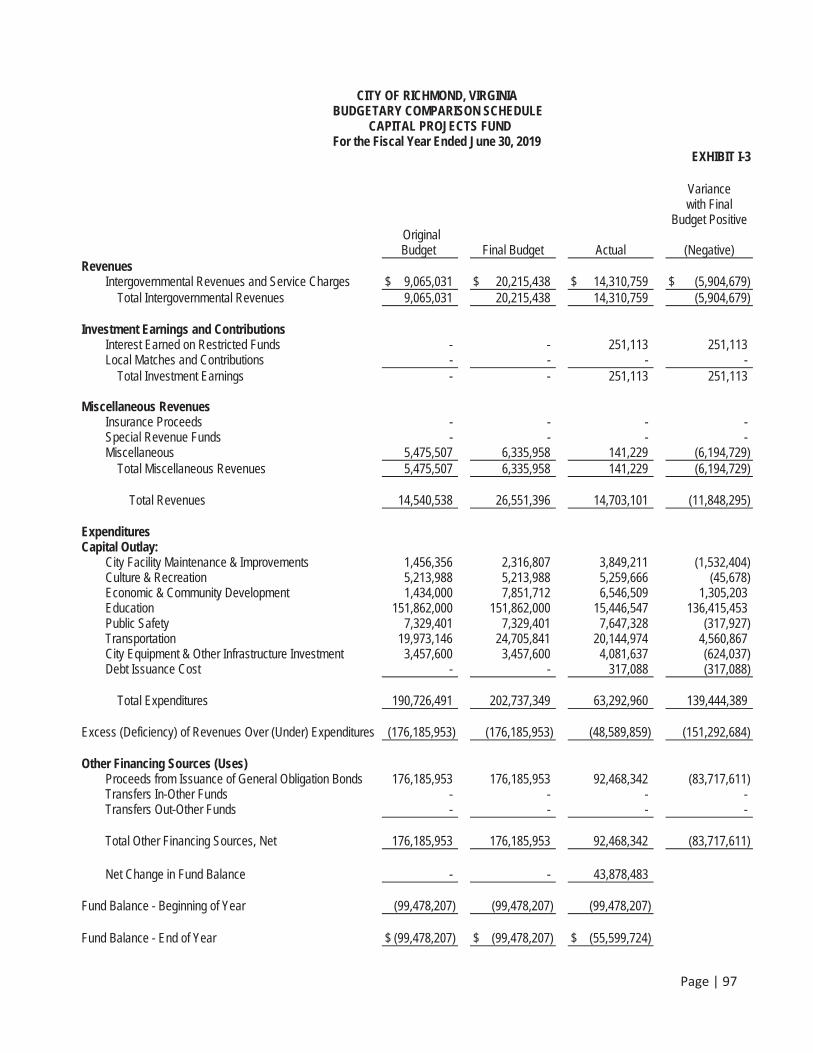
Page | 97
CITY OF RICHMOND, VIRGINIA BUDGETARY COMPARISON SCHEDULE
CAPITAL PROJECTS FUND For the Fiscal Year Ended June 30, 2019
EXHIBIT I-3
Variance with Final Budget Positive
Original Budget Final Budget Actual (Negative)
Revenues Intergovernmental Revenues and Service Charges $ 9,065,031 $ 20,215,438 $ 14,310,759 $ (5,904,679)
Total Intergovernmental Revenues 9,065,031 20,215,438 14,310,759 (5,904,679)
Investment Earnings and Contributions Interest Earned on Restricted Funds - - 251,113 251,113 Local Matches and Contributions - - - -
Total Investment Earnings - - 251,113 251,113
Miscellaneous RevenuesInsurance Proceeds - - - - Special Revenue Funds - - - - Miscellaneous 5,475,507 6,335,958 141,229 (6,194,729)
Total Miscellaneous Revenues 5,475,507 6,335,958 141,229 (6,194,729)
Total Revenues 14,540,538 26,551,396 14,703,101 (11,848,295)
Expenditures Capital Outlay:
City Facility Maintenance & Improvements 1,456,356 2,316,807 3,849,211 (1,532,404) Culture & Recreation 5,213,988 5,213,988 5,259,666 (45,678) Economic & Community Development 1,434,000 7,851,712 6,546,509 1,305,203 Education 151,862,000 151,862,000 15,446,547 136,415,453 Public Safety 7,329,401 7,329,401 7,647,328 (317,927) Transportation 19,973,146 24,705,841 20,144,974 4,560,867 City Equipment & Other Infrastructure Investment 3,457,600 3,457,600 4,081,637 (624,037) Debt Issuance Cost - - 317,088 (317,088)
Total Expenditures 190,726,491 202,737,349 63,292,960 139,444,389
Excess (Deficiency) of Revenues Over (Under) Expenditures (176,185,953) (176,185,953) (48,589,859) (151,292,684)
Other Financing Sources (Uses) Proceeds from Issuance of General Obligation Bonds 176,185,953 176,185,953 92,468,342 (83,717,611) Transfers In-Other Funds - - - - Transfers Out-Other Funds - - - -
Total Other Financing Sources, Net 176,185,953 176,185,953 92,468,342 (83,717,611)
Net Change in Fund Balance - - 43,878,483
Fund Balance - Beginning of Year (99,478,207) (99,478,207) (99,478,207)
Fund Balance - End of Year $ (99,478,207) $ (99,478,207) $ (55,599,724)
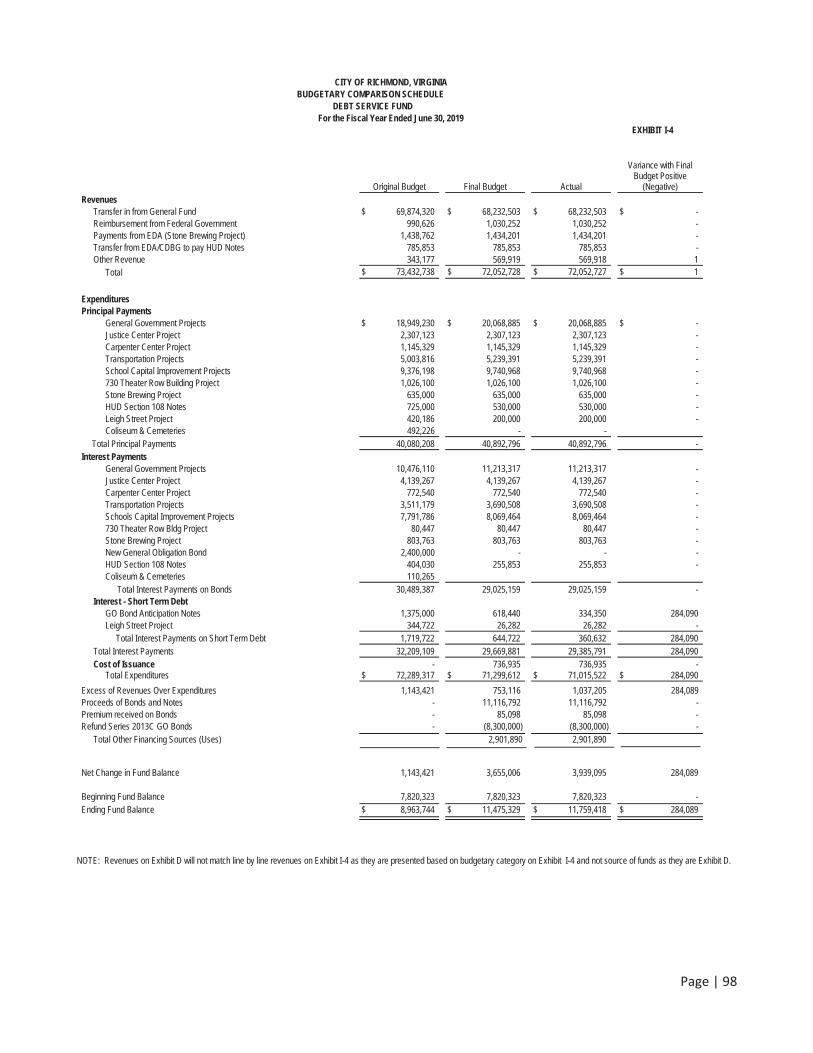
Page | 98
CITY OF RICHMOND, VIRGINIA BUDGETARY COMPARISON SCHEDULE
DEBT SERVICE FUND For the Fiscal Year Ended June 30, 2019
EXHIBIT I-4
Original Budget Final Budget Actual
Variance with Final Budget Positive
(Negative) Revenues
Transfer in from General Fund $ 69,874,320 $ 68,232,503 $ 68,232,503 $ - Reimbursement from Federal Government 990,626 1,030,252 1,030,252 - Payments from EDA (Stone Brewing Project) 1,438,762 1,434,201 1,434,201 - Transfer from EDA/CDBG to pay HUD Notes 785,853 785,853 785,853 - Other Revenue 343,177 569,919 569,918 1
Total $ 73,432,738 $ 72,052,728 $ 72,052,727 $ 1
Expenditures Principal Payments
General Government Projects $ 18,949,230 $ 20,068,885 $ 20,068,885 $ - Justice Center Project 2,307,123 2,307,123 2,307,123 - Carpenter Center Project 1,145,329 1,145,329 1,145,329 - Transportation Projects 5,003,816 5,239,391 5,239,391 - School Capital Improvement Projects 9,376,198 9,740,968 9,740,968 - 730 Theater Row Building Project 1,026,100 1,026,100 1,026,100 - Stone Brewing Project 635,000 635,000 635,000 - HUD Section 108 Notes 725,000 530,000 530,000 - Leigh Street Project 420,186 200,000 200,000 - Coliseum & Cemeteries 492,226 - -
Total Principal Payments 40,080,208 40,892,796 40,892,796 - Interest Payments
General Government Projects 10,476,110 11,213,317 11,213,317 - Justice Center Project 4,139,267 4,139,267 4,139,267 - Carpenter Center Project 772,540 772,540 772,540 - Transportation Projects 3,511,179 3,690,508 3,690,508 - Schools Capital Improvement Projects 7,791,786 8,069,464 8,069,464 - 730 Theater Row Bldg Project 80,447 80,447 80,447 - Stone Brewing Project 803,763 803,763 803,763 - New General Obligation Bond 2,400,000 - - - HUD Section 108 Notes 404,030 255,853 255,853 - Coliseum & Cemeteries 110,265
Total Interest Payments on Bonds 30,489,387 29,025,159 29,025,159 - Interest - Short Term Debt
GO Bond Anticipation Notes 1,375,000 618,440 334,350 284,090 Leigh Street Project 344,722 26,282 26,282 - Total Interest Payments on Short Term Debt 1,719,722 644,722 360,632 284,090
Total Interest Payments 32,209,109 29,669,881 29,385,791 284,090 Cost of Issuance - 736,935 736,935 -
Total Expenditures $ 72,289,317 $ 71,299,612 $ 71,015,522 $ 284,090
Excess of Revenues Over Expenditures 1,143,421 753,116 1,037,205 284,089Proceeds of Bonds and Notes - 11,116,792 11,116,792 - Premium received on Bonds - 85,098 85,098 - Refund Series 2013C GO Bonds - (8,300,000) (8,300,000) -
Total Other Financing Sources (Uses) 2,901,890 2,901,890
Net Change in Fund Balance 1,143,421 3,655,006 3,939,095 284,089
Beginning Fund Balance 7,820,323 7,820,323 7,820,323 - Ending Fund Balance $ 8,963,744 $ 11,475,329 $ 11,759,418 $ 284,089
NOTE: Revenues on Exhibit D will not match line by line revenues on Exhibit I-4 as they are presented based on budgetary category on Exhibit I-4 and not source of funds as they are Exhibit D.
Page | 99
Non-Major Proprietary Funds
Non-Major Proprietary Funds are used for operations (a) that are financed and operated in a manner similar to private business enterprise– when the intent of the governing body is that the costs (expenses, including depreciation) of providing goods or services to the generalpublic on a continuing basis be financed or recovered primarily through user charges or (b) where the City has decided that periodicdetermination of revenues earned, expenses incurred, and/or net income is appropriate for capital maintenance, public policy, managementcontrol, accountability, or other purposes.
Richmond ColiseumPromotes and operates the Coliseum facility.
Cemeteries Maintains and operates cemeteries.
Parking Enterprise Maintains parking related revenue streams, operations and maintenance, and existing debt service.
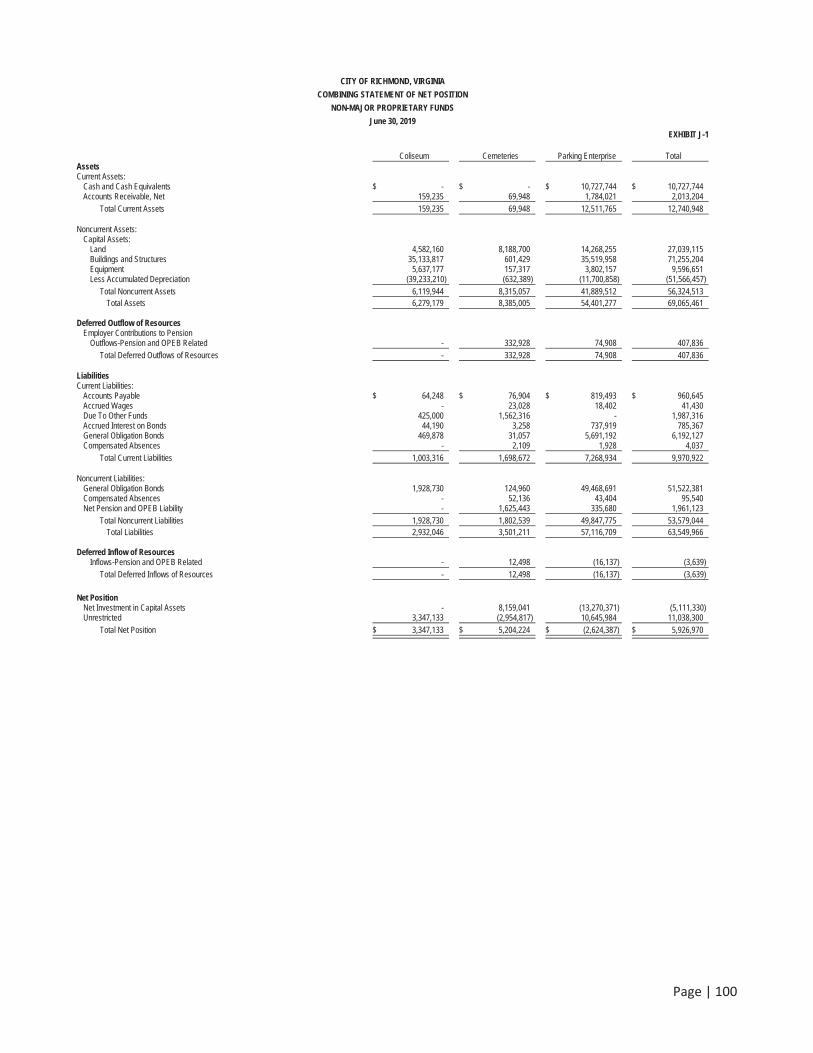
Page | 100
CITY OF RICHMOND, VIRGINIA
COMBINING STATEMENT OF NET POSITION
NON-MAJOR PROPRIETARY FUNDS
June 30, 2019
EXHIBIT J-1
Coliseum Cemeteries Parking Enterprise Total Assets Current Assets:
Cash and Cash Equivalents $ - $ - $ 10,727,744 $ 10,727,744 Accounts Receivable, Net 159,235 69,948 1,784,021 2,013,204
Total Current Assets 159,235 69,948 12,511,765 12,740,948
Noncurrent Assets: Capital Assets:
Land 4,582,160 8,188,700 14,268,255 27,039,115 Buildings and Structures 35,133,817 601,429 35,519,958 71,255,204 Equipment 5,637,177 157,317 3,802,157 9,596,651 Less Accumulated Depreciation (39,233,210) (632,389) (11,700,858) (51,566,457)
Total Noncurrent Assets 6,119,944 8,315,057 41,889,512 56,324,513 Total Assets 6,279,179 8,385,005 54,401,277 69,065,461
Deferred Outflow of Resources Employer Contributions to Pension
Outflows-Pension and OPEB Related - 332,928 74,908 407,836 Total Deferred Outflows of Resources - 332,928 74,908 407,836
Liabilities Current Liabilities:
Accounts Payable $ 64,248 $ 76,904 $ 819,493 $ 960,645 Accrued Wages - 23,028 18,402 41,430 Due To Other Funds 425,000 1,562,316 - 1,987,316Accrued Interest on Bonds 44,190 3,258 737,919 785,367 General Obligation Bonds 469,878 31,057 5,691,192 6,192,127 Compensated Absences - 2,109 1,928 4,037
Total Current Liabilities 1,003,316 1,698,672 7,268,934 9,970,922
Noncurrent Liabilities: General Obligation Bonds 1,928,730 124,960 49,468,691 51,522,381 Compensated Absences - 52,136 43,404 95,540 Net Pension and OPEB Liability - 1,625,443 335,680 1,961,123
Total Noncurrent Liabilities 1,928,730 1,802,539 49,847,775 53,579,044 Total Liabilities 2,932,046 3,501,211 57,116,709 63,549,966
Deferred Inflow of Resources Inflows-Pension and OPEB Related - 12,498 (16,137) (3,639)
Total Deferred Inflows of Resources - 12,498 (16,137) (3,639)
Net Position Net Investment in Capital Assets - 8,159,041 (13,270,371) (5,111,330) Unrestricted 3,347,133 (2,954,817) 10,645,984 11,038,300
Total Net Position $ 3,347,133 $ 5,204,224 $ (2,624,387) $ 5,926,970
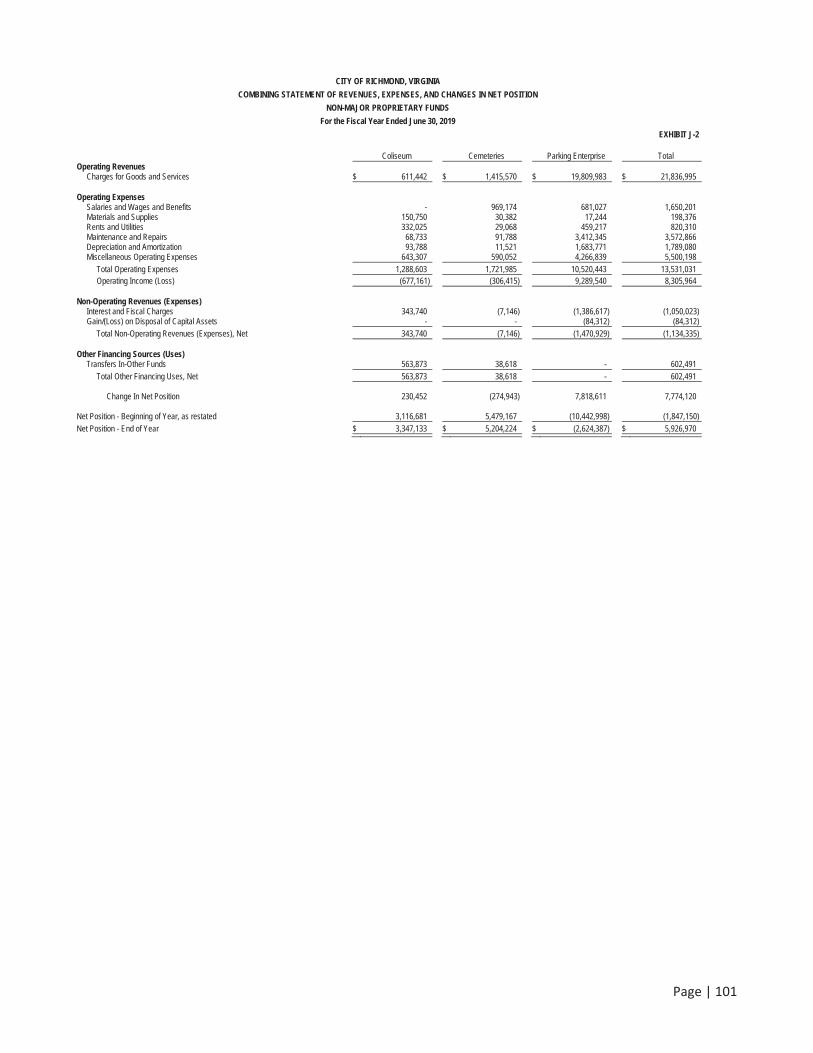
Page | 101
CITY OF RICHMOND, VIRGINIA
COMBINING STATEMENT OF REVENUES, EXPENSES, AND CHANGES IN NET POSITION
NON-MAJOR PROPRIETARY FUNDS
For the Fiscal Year Ended June 30, 2019
EXHIBIT J-2
Coliseum Cemeteries Parking Enterprise Total Operating Revenues
Charges for Goods and Services $ 611,442 $ 1,415,570 $ 19,809,983 $ 21,836,995
Operating Expenses Salaries and Wages and Benefits - 969,174 681,027 1,650,201 Materials and Supplies 150,750 30,382 17,244 198,376 Rents and Utilities 332,025 29,068 459,217 820,310 Maintenance and Repairs 68,733 91,788 3,412,345 3,572,866 Depreciation and Amortization 93,788 11,521 1,683,771 1,789,080 Miscellaneous Operating Expenses 643,307 590,052 4,266,839 5,500,198
Total Operating Expenses 1,288,603 1,721,985 10,520,443 13,531,031 Operating Income (Loss) (677,161) (306,415) 9,289,540 8,305,964
Non-Operating Revenues (Expenses) Interest and Fiscal Charges 343,740 (7,146) (1,386,617) (1,050,023) Gain/(Loss) on Disposal of Capital Assets - - (84,312) (84,312)
Total Non-Operating Revenues (Expenses), Net 343,740 (7,146) (1,470,929) (1,134,335)
Other Financing Sources (Uses) Transfers In-Other Funds 563,873 38,618 - 602,491
Total Other Financing Uses, Net 563,873 38,618 - 602,491
Change In Net Position 230,452 (274,943) 7,818,611 7,774,120
Net Position - Beginning of Year, as restated 3,116,681 5,479,167 (10,442,998) (1,847,150) Net Position - End of Year $ 3,347,133 $ 5,204,224 $ (2,624,387) $ 5,926,970
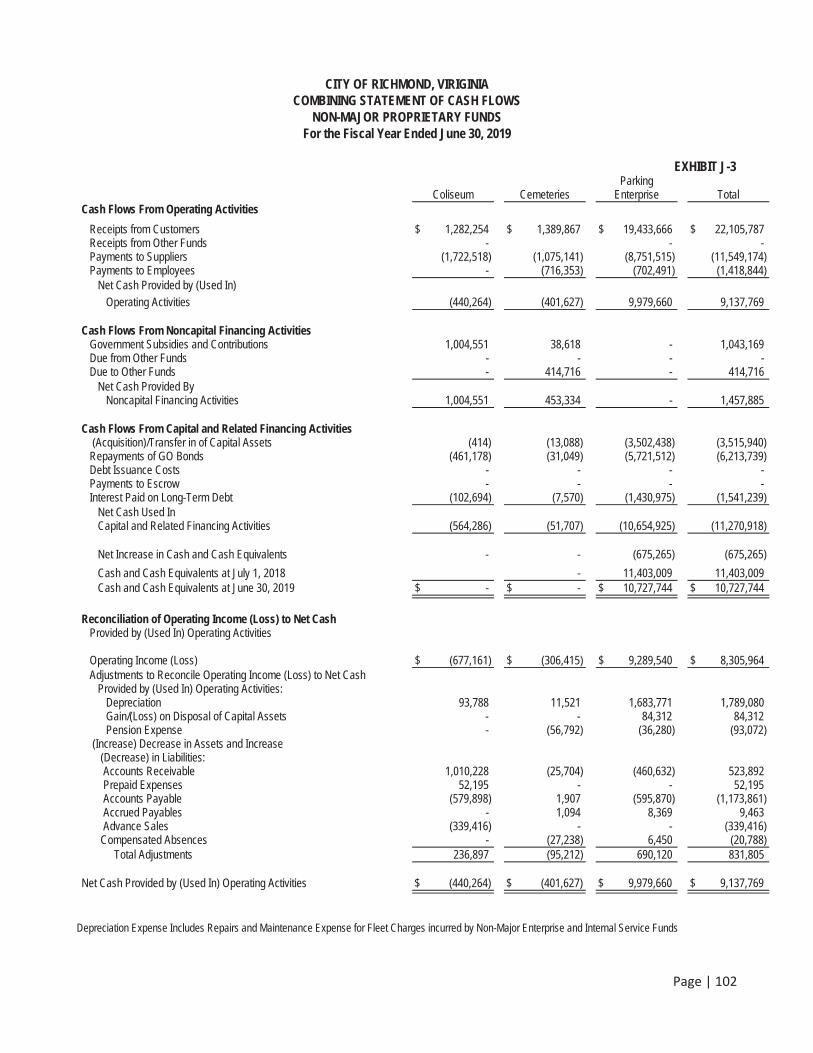
Page | 102
CITY OF RICHMOND, VIRIGINIA COMBINING STATEMENT OF CASH FLOWS
NON-MAJOR PROPRIETARY FUNDS For the Fiscal Year Ended June 30, 2019
EXHIBIT J-3
Coliseum Cemeteries Parking
Enterprise Total Cash Flows From Operating Activities
Receipts from Customers $ 1,282,254 $ 1,389,867 $ 19,433,666 $ 22,105,787 Receipts from Other Funds - - - Payments to Suppliers (1,722,518) (1,075,141) (8,751,515) (11,549,174) Payments to Employees - (716,353) (702,491) (1,418,844) Net Cash Provided by (Used In)
Operating Activities (440,264) (401,627) 9,979,660 9,137,769
Cash Flows From Noncapital Financing Activities Government Subsidies and Contributions 1,004,551 38,618 - 1,043,169 Due from Other Funds - - - - Due to Other Funds - 414,716 - 414,716 Net Cash Provided By
Noncapital Financing Activities 1,004,551 453,334 - 1,457,885
Cash Flows From Capital and Related Financing Activities (Acquisition)/Transfer in of Capital Assets (414) (13,088) (3,502,438) (3,515,940) Repayments of GO Bonds (461,178) (31,049) (5,721,512) (6,213,739) Debt Issuance Costs - - - - Payments to Escrow - - - - Interest Paid on Long-Term Debt (102,694) (7,570) (1,430,975) (1,541,239) Net Cash Used In Capital and Related Financing Activities (564,286) (51,707) (10,654,925) (11,270,918)
Net Increase in Cash and Cash Equivalents - - (675,265) (675,265)
Cash and Cash Equivalents at July 1, 2018 - 11,403,009 11,403,009 Cash and Cash Equivalents at June 30, 2019 $ - $ - $ 10,727,744 $ 10,727,744
Reconciliation of Operating Income (Loss) to Net Cash Provided by (Used In) Operating Activities
Operating Income (Loss) $ (677,161) $ (306,415) $ 9,289,540 $ 8,305,964 Adjustments to Reconcile Operating Income (Loss) to Net Cash
Provided by (Used In) Operating Activities: Depreciation 93,788 11,521 1,683,771 1,789,080 Gain/(Loss) on Disposal of Capital Assets - - 84,312 84,312 Pension Expense - (56,792) (36,280) (93,072)
(Increase) Decrease in Assets and Increase (Decrease) in Liabilities:
Accounts Receivable 1,010,228 (25,704) (460,632) 523,892 Prepaid Expenses 52,195 - - 52,195 Accounts Payable (579,898) 1,907 (595,870) (1,173,861) Accrued Payables - 1,094 8,369 9,463 Advance Sales (339,416) - - (339,416)
Compensated Absences - (27,238) 6,450 (20,788) Total Adjustments 236,897 (95,212) 690,120 831,805
Net Cash Provided by (Used In) Operating Activities $ (440,264) $ (401,627) $ 9,979,660 $ 9,137,769
Depreciation Expense Includes Repairs and Maintenance Expense for Fleet Charges incurred by Non-Major Enterprise and Internal Service Funds
Page | 103
Internal Service Funds
Internal Service Funds are used to account for the financing of goods or services provided by one department or agency to otherdepartments or agencies of the City Reporting Entity on a cost-reimbursement basis.
Fleet Management Provides for repairs and maintenance to City-owned vehicles and related equipment, as well as monthly and daily leasing services.
Radio Maintenance Provides for installation, repairs and maintenance of radio and other emergency communication equipment in City-owned vehicles.
Health Self-Insurance A joint healthcare plan between the City and Richmond Public Schools, which is a self-insured healthcare plan. The healthcare plan is available to all full-time and part-time employees in permanent positions, working 20 hours or more per week. The plan is a self-insured agreement, which includes individual stop loss and aggregate stop loss.
Advantage Richmond Corporation Provides leased office space for the City’s Social Service Department.
Information Technology Provides the computing, communications, IT infrastructure, and application development for the City of Richmond departments to support their business operations and service delivery to the public.
Risk Management Responsible for the preservation and protection of the human, physical, and financial assets of the City, including administration of the safety & loss prevention and worker's compensation claims against the City, and processsing certificate ofinsurance requests.
Electric Utility Provides street lighting and other electric service to part of the City.
Stores and Transportation Division Provides supplies and vehicle related services exclusively to utility departments.
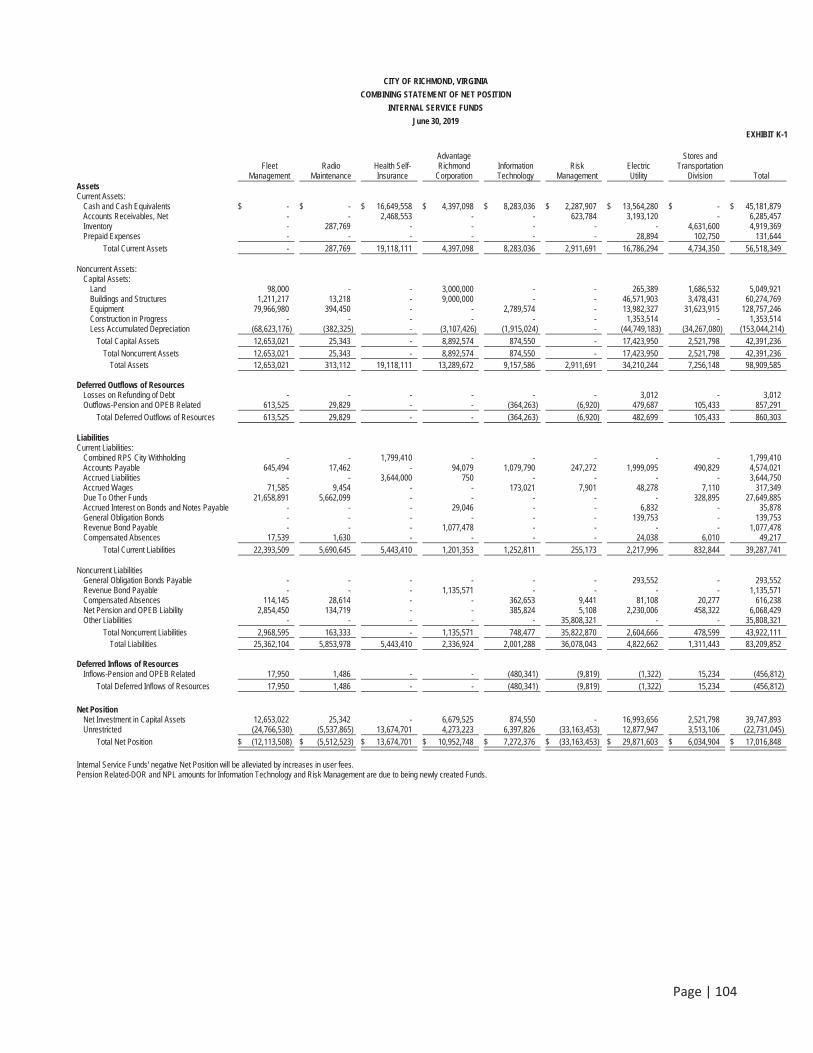
Page | 104
CITY OF RICHMOND, VIRGINIA
COMBINING STATEMENT OF NET POSITION
INTERNAL SERVICE FUNDS
June 30, 2019
EXHIBIT K-1
FleetManagement
Radio Maintenance
Health Self-Insurance
Advantage Richmond
Corporation Information Technology
Risk Management
Electric Utility
Stores and Transportation
Division Total Assets Current Assets:
Cash and Cash Equivalents $ - $ - $ 16,649,558 $ 4,397,098 $ 8,283,036 $ 2,287,907 $ 13,564,280 $ - $ 45,181,879Accounts Receivables, Net - - 2,468,553 - - 623,784 3,193,120 - 6,285,457Inventory - 287,769 - - - - - 4,631,600 4,919,369Prepaid Expenses - - - - - - 28,894 102,750 131,644
Total Current Assets - 287,769 19,118,111 4,397,098 8,283,036 2,911,691 16,786,294 4,734,350 56,518,349
Noncurrent Assets: Capital Assets:
Land 98,000 - - 3,000,000 - - 265,389 1,686,532 5,049,921 Buildings and Structures 1,211,217 13,218 - 9,000,000 - - 46,571,903 3,478,431 60,274,769 Equipment 79,966,980 394,450 - - 2,789,574 - 13,982,327 31,623,915 128,757,246 Construction in Progress - - - - - - 1,353,514 - 1,353,514Less Accumulated Depreciation (68,623,176) (382,325) - (3,107,426) (1,915,024) - (44,749,183) (34,267,080) (153,044,214)
Total Capital Assets 12,653,021 25,343 - 8,892,574 874,550 - 17,423,950 2,521,798 42,391,236
Total Noncurrent Assets 12,653,021 25,343 - 8,892,574 874,550 - 17,423,950 2,521,798 42,391,236 Total Assets 12,653,021 313,112 19,118,111 13,289,672 9,157,586 2,911,691 34,210,244 7,256,148 98,909,585
Deferred Outflows of Resources Losses on Refunding of Debt - - - - - - 3,012 - 3,012Outflows-Pension and OPEB Related 613,525 29,829 - - (364,263) (6,920) 479,687 105,433 857,291
Total Deferred Outflows of Resources 613,525 29,829 - - (364,263) (6,920) 482,699 105,433 860,303
Liabilities Current Liabilities:
Combined RPS City Withholding - - 1,799,410 - - - - - 1,799,410Accounts Payable 645,494 17,462 - 94,079 1,079,790 247,272 1,999,095 490,829 4,574,021Accrued Liabilities - - 3,644,000 750 - - - - 3,644,750Accrued Wages 71,585 9,454 - - 173,021 7,901 48,278 7,110 317,349Due To Other Funds 21,658,891 5,662,099 - - - - - 328,895 27,649,885Accrued Interest on Bonds and Notes Payable - - - 29,046 - - 6,832 - 35,878General Obligation Bonds - - - - - - 139,753 - 139,753Revenue Bond Payable - - - 1,077,478 - - - - 1,077,478Compensated Absences 17,539 1,630 - - - - 24,038 6,010 49,217
Total Current Liabilities 22,393,509 5,690,645 5,443,410 1,201,353 1,252,811 255,173 2,217,996 832,844 39,287,741
Noncurrent Liabilities General Obligation Bonds Payable - - - - - - 293,552 - 293,552Revenue Bond Payable - - - 1,135,571 - - - - 1,135,571Compensated Absences 114,145 28,614 - - 362,653 9,441 81,108 20,277 616,238Net Pension and OPEB Liability 2,854,450 134,719 - - 385,824 5,108 2,230,006 458,322 6,068,429Other Liabilities - - - - - 35,808,321 - - 35,808,321
Total Noncurrent Liabilities 2,968,595 163,333 - 1,135,571 748,477 35,822,870 2,604,666 478,599 43,922,111 Total Liabilities 25,362,104 5,853,978 5,443,410 2,336,924 2,001,288 36,078,043 4,822,662 1,311,443 83,209,852
Deferred Inflows of Resources Inflows-Pension and OPEB Related 17,950 1,486 - - (480,341) (9,819) (1,322) 15,234 (456,812)
Total Deferred Inflows of Resources 17,950 1,486 - - (480,341) (9,819) (1,322) 15,234 (456,812)
Net Position Net Investment in Capital Assets 12,653,022 25,342 - 6,679,525 874,550 - 16,993,656 2,521,798 39,747,893 Unrestricted (24,766,530) (5,537,865) 13,674,701 4,273,223 6,397,826 (33,163,453) 12,877,947 3,513,106 (22,731,045)
Total Net Position $ (12,113,508) $ (5,512,523) $ 13,674,701 $ 10,952,748 $ 7,272,376 $ (33,163,453) $ 29,871,603 $ 6,034,904 $ 17,016,848
Internal Service Funds' negative Net Position will be alleviated by increases in user fees. Pension Related-DOR and NPL amounts for Information Technology and Risk Management are due to being newly created Funds.
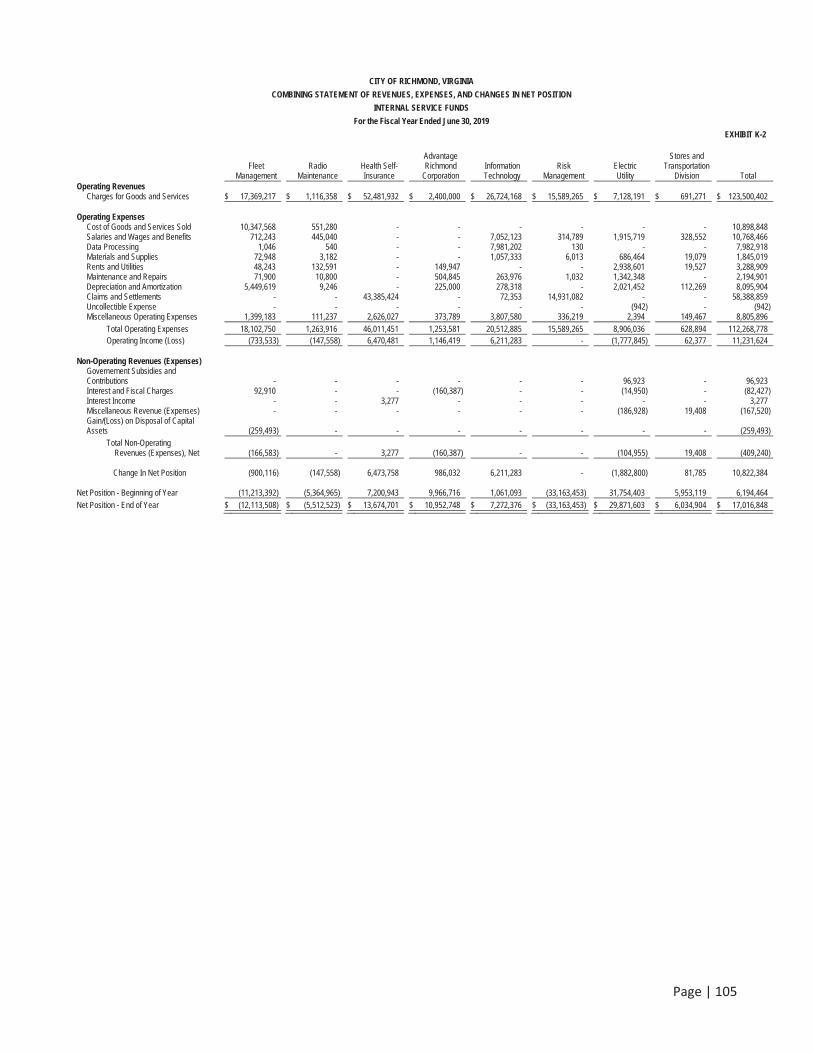
Page | 105
CITY OF RICHMOND, VIRGINIA
COMBINING STATEMENT OF REVENUES, EXPENSES, AND CHANGES IN NET POSITION
INTERNAL SERVICE FUNDS
For the Fiscal Year Ended June 30, 2019
EXHIBIT K-2
FleetManagement
RadioMaintenance
Health Self-Insurance
Advantage Richmond
Corporation Information Technology
RiskManagement
Electric Utility
Stores and Transportation
Division Total Operating Revenues
Charges for Goods and Services $ 17,369,217 $ 1,116,358 $ 52,481,932 $ 2,400,000 $ 26,724,168 $ 15,589,265 $ 7,128,191 $ 691,271 $ 123,500,402
Operating Expenses Cost of Goods and Services Sold 10,347,568 551,280 - - - - - - 10,898,848Salaries and Wages and Benefits 712,243 445,040 - - 7,052,123 314,789 1,915,719 328,552 10,768,466Data Processing 1,046 540 - - 7,981,202 130 - - 7,982,918Materials and Supplies 72,948 3,182 - - 1,057,333 6,013 686,464 19,079 1,845,019Rents and Utilities 48,243 132,591 - 149,947 - - 2,938,601 19,527 3,288,909Maintenance and Repairs 71,900 10,800 - 504,845 263,976 1,032 1,342,348 - 2,194,901Depreciation and Amortization 5,449,619 9,246 - 225,000 278,318 - 2,021,452 112,269 8,095,904Claims and Settlements - - 43,385,424 - 72,353 14,931,082 - - 58,388,859Uncollectible Expense - - - - - - (942) - (942)Miscellaneous Operating Expenses 1,399,183 111,237 2,626,027 373,789 3,807,580 336,219 2,394 149,467 8,805,896
Total Operating Expenses 18,102,750 1,263,916 46,011,451 1,253,581 20,512,885 15,589,265 8,906,036 628,894 112,268,778Operating Income (Loss) (733,533) (147,558) 6,470,481 1,146,419 6,211,283 - (1,777,845) 62,377 11,231,624
Non-Operating Revenues (Expenses) Governement Subsidies and Contributions - - - - - - 96,923 - 96,923Interest and Fiscal Charges 92,910 - - (160,387) - - (14,950) - (82,427)Interest Income - - 3,277 - - - - - 3,277Miscellaneous Revenue (Expenses) - - - - - - (186,928) 19,408 (167,520)Gain/(Loss) on Disposal of Capital Assets (259,493) - - - - - - - (259,493)
Total Non-Operating Revenues (Expenses), Net (166,583) - 3,277 (160,387) - - (104,955) 19,408 (409,240)
Change In Net Position (900,116) (147,558) 6,473,758 986,032 6,211,283 - (1,882,800) 81,785 10,822,384
Net Position - Beginning of Year (11,213,392) (5,364,965) 7,200,943 9,966,716 1,061,093 (33,163,453) 31,754,403 5,953,119 6,194,464 Net Position - End of Year $ (12,113,508) $ (5,512,523) $ 13,674,701 $ 10,952,748 $ 7,272,376 $ (33,163,453) $ 29,871,603 $ 6,034,904 $ 17,016,848

Page
|10
6
CIT
Y O
F R
ICH
MO
ND
, VIR
IGIN
IA
CO
MB
ININ
G S
TATE
MEN
T O
F C
ASH
FLO
WS
INTE
RN
AL
SER
VIC
E FU
ND
S Fo
r the
Fis
cal Y
ear E
nded
Jun
e 30
, 201
9EX
HIB
IT K
-3
Flee
tM
anag
emen
t
Rad
ioM
aint
enan
ce
H
ealth
Se
lf-In
sura
nce
Adva
ntag
e R
ichm
ond
Cor
pora
tion
In
form
atio
n Te
chno
logy
Ris
k M
anag
emen
t
Elec
tric
Util
ity
Stor
es a
nd
Tran
spor
tatio
n D
ivis
i on
Tota
l C
ash
Flow
s Fr
om O
pera
ting
Act
iviti
es
R
ecei
pts
from
Cus
tom
ers
$
17,
683,
830
$
1
,120
,478
$
5
4,32
3,53
4
$
2,8
00,0
00
$
26,
724,
169
$
1
5,58
5,47
7
$
8,2
74,2
00
$
691
,271
$
127
,202
,959
Paym
ents
to S
uppl
iers
(1
2,41
1,92
1)
(939
,451
)
(44,
485,
041)
(1
,091
,174
)
(13,
289,
133)
(15,
056,
014)
(5,1
36,4
14)
(2
94,2
47)
(9
2,70
3,39
5)
Pa
ymen
ts to
Em
ploy
ees
(819
,577
) (4
50,3
44)
-
-
(7
,291
,131
)
(315
,211
)
(1,9
67,9
69)
(3
42,5
66)
(1
1,18
6,79
8)
R
ecei
pts
From
Oth
er F
unds
-
-
-
-
-
(672
,312
)(6
1,15
3)
(1
94,4
39)
(9
27,9
04)
O
ther
Rec
eipt
s or
(Pay
men
ts)
-
-
- -
-
- (1
86,9
28)
1
9,40
8
(1
67,5
20)
N
et C
ash
Prov
ided
by
(Use
d In
)
Ope
ratin
g Ac
tiviti
es
4,4
52,3
32
(269
,317
) 9
,838
,493
1
,708
,826
6
,143
,905
(4
58,0
60)
921
,736
(1
20,5
73)
22,
217,
342
C
ash
Flow
s Fr
om N
on-C
apita
l Fin
anci
ng A
ctiv
ities
Gov
ernm
ent S
ubsi
dies
and
Con
tribu
tions
-
-
-
-
-
-
9
6,92
2
- 9
6,92
2
Due
Fro
m O
ther
Fun
ds
-
-
-
-
-
-
-
-
-
D
ue to
Oth
er F
unds
1
,115
,284
2
69,3
17
-
-
-
2,6
87,7
90
- 1
20,5
73 4
,192
,964
Net
Cas
h Pr
ovid
ed B
y (U
sed
In)
Non
capi
tal F
inan
cing
Act
iviti
es
1,1
15,2
84
269
,317
-
-
-
2
,687
,790
9
6,92
2
120
,573
4
,289
,886
Cas
h Fl
ows
From
Cap
ital a
nd R
elat
ed F
inan
cing
Act
iviti
es
Acqu
isiti
on/A
cqui
sitio
n of
Cap
ital A
sset
s (4
,296
,025
) -
-
-
(55,
438)
-(1
,210
,366
)-
(5,5
61,8
29)
R
epay
men
ts o
f Rev
enue
and
GO
Bon
ds
(728
,570
) -
-
(1
,022
,357
)
-
-
(1
37,5
31)
-(1
,888
,458
)
Rep
aym
ents
of N
otes
Pay
able
(6
25,0
00)
-
-
-
-
-
-
-
(625
,000
)
Inte
rest
Pai
d on
Lon
g-Te
rm D
ebt
81,
979
-
3,2
77(1
73,8
07)
-
-
(17,
185)
-(1
05,7
36)
N
et C
ash
Prov
ided
by
(Use
d In
)
Cap
ital a
nd R
elat
ed F
inan
cing
Act
iviti
es
(5,5
67,6
16)
- 3
,277
(1,1
96,1
64)
(5
5,43
8)
-
(1,3
65,0
82)
-(8
,181
,023
) N
et In
crea
se (D
ecre
ase)
in C
ash
and
Cas
h Eq
uiva
lent
s -
-
9
,841
,770
5
12,6
62
6,0
88,4
67
2,2
29,7
30
(346
,424
) -
18,
326,
205
C
ash
and
Cas
h Eq
uiva
lent
s at
Jul
y 1,
201
8 -
-
6
,807
,788
3
,884
,436
2
,194
,569
5
8,17
7
13,
910,
704
-
26,
855,
674
C
ash
and
Cas
h Eq
uiva
lent
s at
Jun
e 30
, 201
9 $
-
$ -
$ 1
6,64
9,55
8
$
4,3
97,0
98
$
8,2
83,0
36
$
2,2
87,9
07
$
13,
564,
280
$
-
$ 4
5,18
1,87
9
Rec
onci
liatio
n of
Ope
ratin
g In
com
e (L
oss)
To
Net
Cas
h Pr
ovid
ed b
y (U
sed
In) O
pera
ting
Activ
ities
Ope
ratin
g In
com
e (L
oss)
$
(7
33,5
33)
$
(147
,558
) $
6
,470
,481
$
1
,146
,419
$
6
,211
,283
$
-
$
(1,7
77,8
45)
$
62,
377
$
1
1,23
1,62
4
Adju
stm
ents
to R
econ
cile
Ope
ratin
g In
com
e (L
oss)
to N
et
Cas
h Pr
ovid
ed b
y (U
sed
In) O
pera
ting
Activ
ities
:
Dep
reci
atio
n 5
,449
,619
9
,246
-
225
,000
278
,318
-
2,0
21,4
52 1
12,2
69
8,0
95,9
04
G
ain/
(Los
s) o
n D
ispo
sal o
f Cap
ital A
sset
s 2
59,4
93
-
-
-
-
- -
-
259
,493
Pens
ion
Expe
nse
(124
,721
) (6
,281
) -
-
(256
,142
)
(4,9
95)
(1
00,4
93)
(1
4,91
8)
(5
07,5
50)
M
isce
llane
ous
Inco
me/
(Exp
ense
) -
-
(1
86,9
28)
1
9,40
8
(1
67,5
20)
(I
ncre
ase)
Dec
reas
e in
Ass
ets
and
Incr
ease
(Dec
reas
e) in
Lia
bilit
ies:
Ac
coun
ts R
ecei
vabl
e 5
5,12
0
4,1
20
1,8
41,6
02
400
,000
-
(3,7
84)
1,1
45,0
67
- 3
,442
,125
D
ue F
rom
Gen
eral
Fun
d -
-
-
-
-
(672
,312
) -
-
(6
72,3
12)
D
ue F
rom
Com
pone
nt U
nit
-
-
-
-
- -
-
-
-
Inve
ntor
ies
of M
ater
ial a
nd S
uppl
ies
-
-
-
-
-
- -
(501
,609
)
(501
,609
)
Prep
aid
Expe
nses
-
-
-
-
-
- 3
,367
(1
1,06
2)
(7,6
95)
Acco
unts
Pay
able
(4
67,7
70)
(129
,821
) 1
,799
,410
(6
2,59
3)
(106
,689
) 2
18,4
59
(186
,502
) 2
12,0
57
1,2
76,5
51Ac
crue
d Li
abilit
ies
11,
341
(1
,083
) (2
73,0
00)
- 2
9,17
6 2
,087
-
-
(2
31,4
79)
C
ompe
nsat
ed A
bsen
ces
2,7
83
2,0
60
-
-
(12,
041)
2
,485
3
,618
9
05
(190
)
Tota
l Adj
ustm
ents
5
,185
,865
(1
21,7
59)
3,3
68,0
12
562
,407
(6
7,37
8)
(458
,060
)
2,6
99,5
81
(1
82,9
50)
1
0,98
5,71
8
N
et C
ash
Prov
ided
by
(Use
d In
) Ope
ratin
g Ac
tiviti
es
$
4,4
52,3
32
$
(269
,317
) $
9
,838
,493
$
1
,708
,826
$
6
,143
,905
$
(4
58,0
60)
$
921
,736
$
(1
20,5
73)
$
22,
217,
342
Dep
reci
atio
n Ex
pens
e In
clud
es R
epai
rs a
nd M
aint
enan
ce E
xpen
se fo
r Fle
et C
harg
es in
curre
d by
Non
-Maj
or E
nter
pris
e an
d In
tern
al S
ervi
ce F
unds
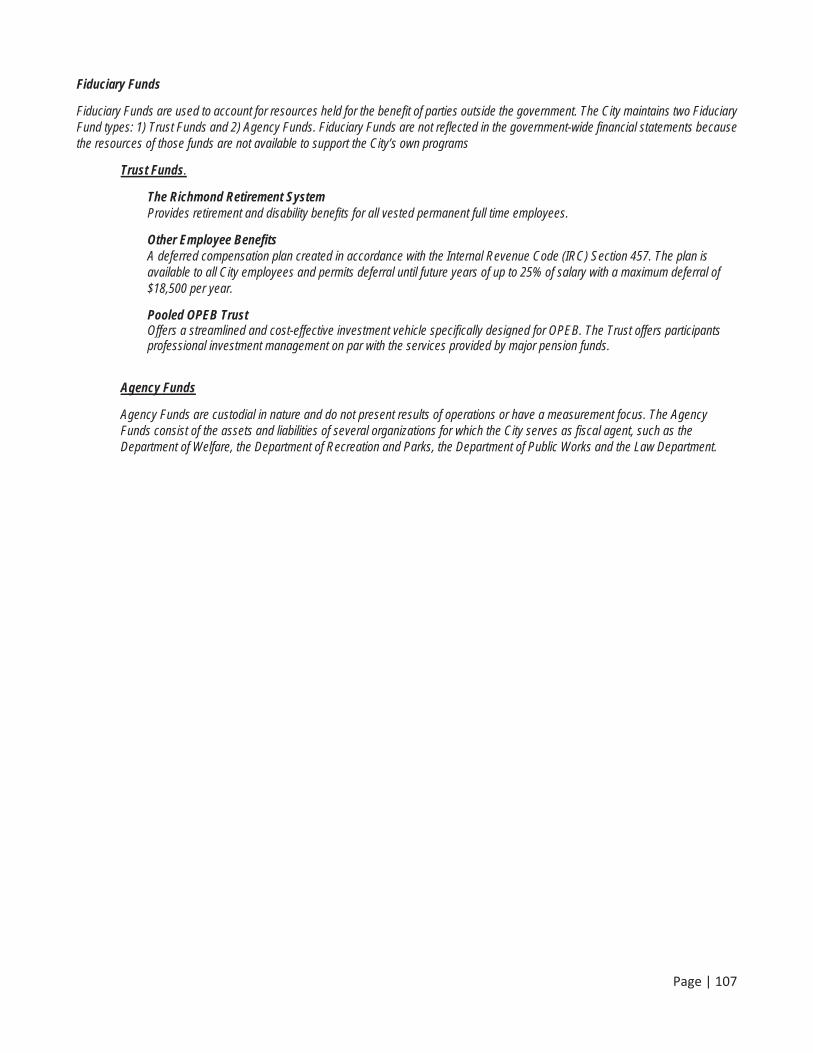
Page | 107
Fiduciary Funds
Fiduciary Funds are used to account for resources held for the benefit of parties outside the government. The City maintains two Fiduciary Fund types: 1) Trust Funds and 2) Agency Funds. Fiduciary Funds are not reflected in the government-wide financial statements because the resources of those funds are not available to support the City’s own programs
Trust Funds.
The Richmond Retirement System Provides retirement and disability benefits for all vested permanent full time employees.
Other Employee Benefits A deferred compensation plan created in accordance with the Internal Revenue Code (IRC) Section 457. The plan is available to all City employees and permits deferral until future years of up to 25% of salary with a maximum deferral of $18,500 per year.
Pooled OPEB TrustOffers a streamlined and cost-effective investment vehicle specifically designed for OPEB. The Trust offers participants professional investment management on par with the services provided by major pension funds.
Agency Funds
Agency Funds are custodial in nature and do not present results of operations or have a measurement focus. The Agency Funds consist of the assets and liabilities of several organizations for which the City serves as fiscal agent, such as the Department of Welfare, the Department of Recreation and Parks, the Department of Public Works and the Law Department.
Page | 108
CITY OF RICHMOND, VIRGINIACOMBINING STATEMENT OF FIDUCIARY NET POSITION
FIDUCIARY FUNDSJune 30, 2019
EXHIBIT L-1
Richmond Other PooledRetirement Employee OPEB
System Benefits Trust Total Assets:
Cash and Short-term Investments $ 11,529,423 $ - $ - $ 11,529,423Pooled Funds 250,000 250,000 Receivables: - -
Due from Brokers on Sale of Securities 5,259,719 - - 5,259,719 Interest and Dividends 225,206 - - 225,206 Contributions from Participating Employees 1,011,405 - - 1,011,405 Other Accounts Receivable 5,292 2,821,098 - 2,826,390
Investments, at Fair Value: -Common Stock 148,159,251 - - 148,159,251 International Stocks 100,842,560 - - 100,842,560 International Bonds 103,751,377 - - 103,751,377 Real Estate Investment Trusts 35,364,309 - - 35,364,309 US Fixed Income 27,687,832 - - 27,687,832 Hedge Funds 75,944,723 - - 75,944,723 Private Debt 37,559,835 114,521,100 - 152,080,935Private Equity 23,070,051 - - 23,070,051Opportunistic Fixed Income 25,485,292 - - 25,485,292
Total Investments, at Fair Value 577,865,230 114,521,100 - 692,386,330Cash Collateral Received - Security Lending Program 2,165,902 - - 2,165,902
Assets 598,062,177 117,342,198 250,000 715,654,375
Fixed Assets: Furniture Fixtures and Equipment 152,657 - - 152,657 Leasehold Improvements 207,832 - - 207,832 Total Fixed Assets 360,489 - - 360,489 Total Assets 598,422,666 117,342,198 250,000 716,014,864
Liabilities: Accounts Payable 23,617,271 - - 23,617,271 Payable for Collateral Received - Security Lending Program 2,170,290 - - 2,170,290
Total Liabilities 25,787,561 - - 25,787,561
Net Position Held in Trust for Pension Benefits and Other Purposes $ 572,635,105 $ 117,342,198 $ 250,000 $ 690,227,303
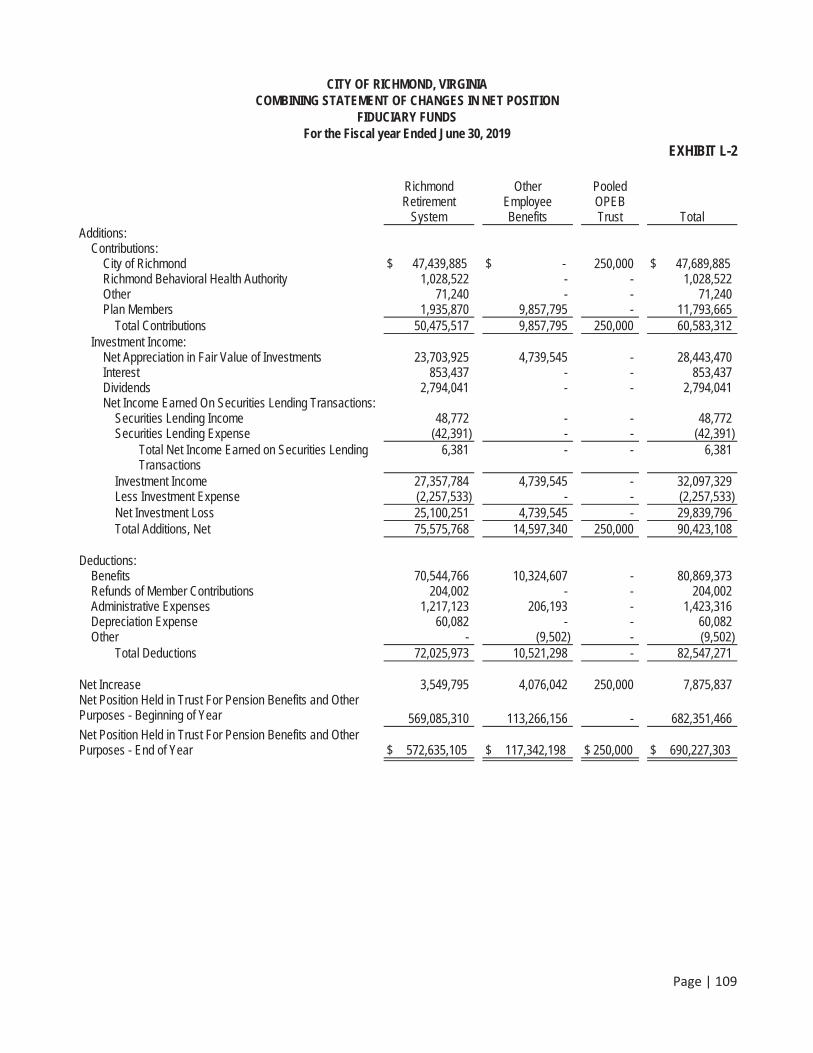
Page | 109
CITY OF RICHMOND, VIRGINIACOMBINING STATEMENT OF CHANGES IN NET POSITION
FIDUCIARY FUNDSFor the Fiscal year Ended June 30, 2019
EXHIBIT L-2
Richmond Other Pooled Retirement Employee OPEB
System Benefits Trust Total Additions:
Contributions:City of Richmond $ 47,439,885 $ - 250,000 $ 47,689,885Richmond Behavioral Health Authority 1,028,522 - - 1,028,522 Other 71,240 - - 71,240 Plan Members 1,935,870 9,857,795 - 11,793,665
Total Contributions 50,475,517 9,857,795 250,000 60,583,312 Investment Income:
Net Appreciation in Fair Value of Investments 23,703,925 4,739,545 - 28,443,470Interest 853,437 - - 853,437Dividends 2,794,041 - - 2,794,041Net Income Earned On Securities Lending Transactions:
Securities Lending Income 48,772 - - 48,772 Securities Lending Expense (42,391) - - (42,391)
Total Net Income Earned on Securities Lending Transactions
6,381 - - 6,381
Investment Income 27,357,784 4,739,545 - 32,097,329Less Investment Expense (2,257,533) - - (2,257,533)Net Investment Loss 25,100,251 4,739,545 - 29,839,796Total Additions, Net 75,575,768 14,597,340 250,000 90,423,108
Deductions: Benefits 70,544,766 10,324,607 - 80,869,373Refunds of Member Contributions 204,002 - - 204,002 Administrative Expenses 1,217,123 206,193 - 1,423,316Depreciation Expense 60,082 - - 60,082 Other - (9,502) - (9,502)
Total Deductions 72,025,973 10,521,298 - 82,547,271
Net Increase 3,549,795 4,076,042 250,000 7,875,837 Net Position Held in Trust For Pension Benefits and Other Purposes - Beginning of Year 569,085,310 113,266,156 - 682,351,466Net Position Held in Trust For Pension Benefits and Other Purposes - End of Year $ 572,635,105 $ 117,342,198 $ 250,000 $ 690,227,303
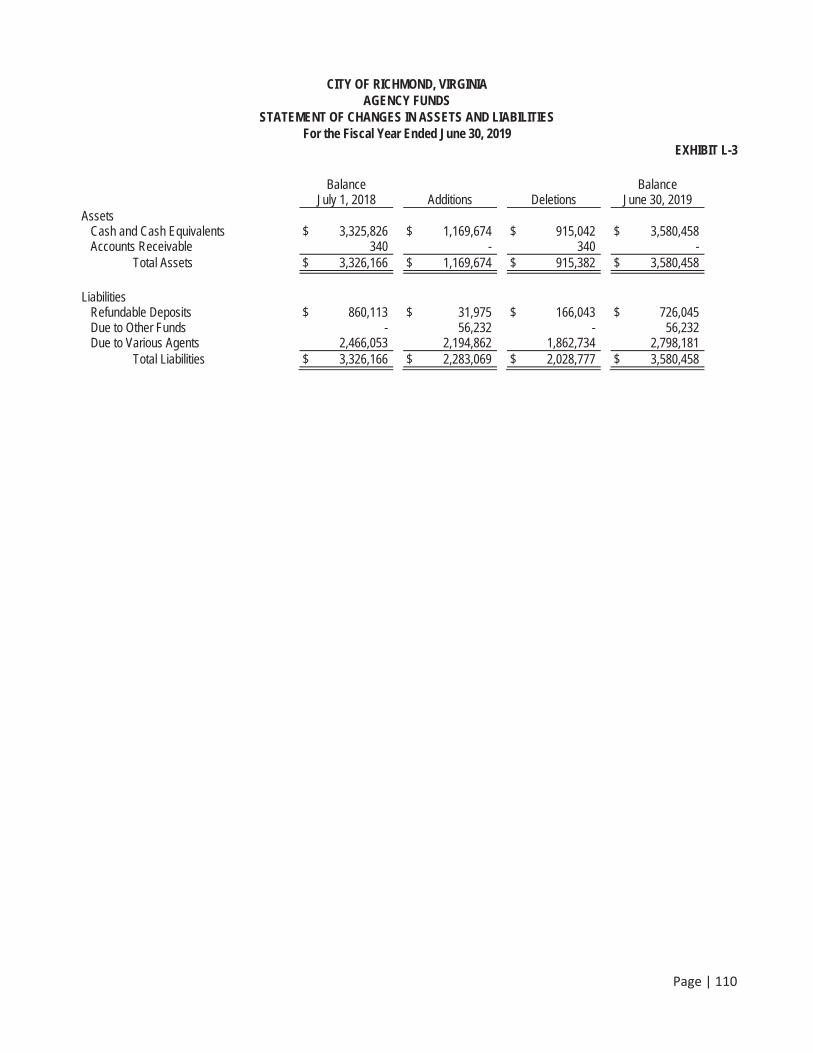
Page | 110
CITY OF RICHMOND, VIRGINIA AGENCY FUNDS
STATEMENT OF CHANGES IN ASSETS AND LIABILITIES For the Fiscal Year Ended June 30, 2019
EXHIBIT L-3
Balance July 1, 2018 Additions Deletions
Balance June 30, 2019
Assets Cash and Cash Equivalents $ 3,325,826 $ 1,169,674 $ 915,042 $ 3,580,458 Accounts Receivable 340 - 340 - Total Assets $ 3,326,166 $ 1,169,674 $ 915,382 $ 3,580,458
Liabilities Refundable Deposits $ 860,113 $ 31,975 $ 166,043 $ 726,045 Due to Other Funds - 56,232 - 56,232 Due to Various Agents 2,466,053 2,194,862 1,862,734 2,798,181 Total Liabilities $ 3,326,166 $ 2,283,069 $ 2,028,777 $ 3,580,458


STATISTIC
AL SEC
TION

STATISTICAL
SECTION

Page | 112
Statistical Section
This part of the City’s Comprehensive Annual Financial Report presents detailed information as a context for understanding what the information in the financial statements, note disclosures, and required supplementary information says about the government’s overall financial health.
Contents
Financial Trends These schedules contain trend information to help the reader understand how the City’s financial performance and well-being have changed over time.
Revenue Capacity These schedules contain information to help the reader assess the City’s most significant local revenue source, the property tax.
Debt Capacity These schedules present information to help the reader assess the affordability of the City’s current levels of outstanding debtand the City’s ability to issue additional debt in the future.
Demographic and Economic Information These schedules offer demographic and economic indicators to help the reader understand the environment within which the City’s financial activities take place.
Operating Information These schedules contain service and infrastructure data to help the reader understand how the information in the City’s financial report relates to the services the city provides and the activities it performs.
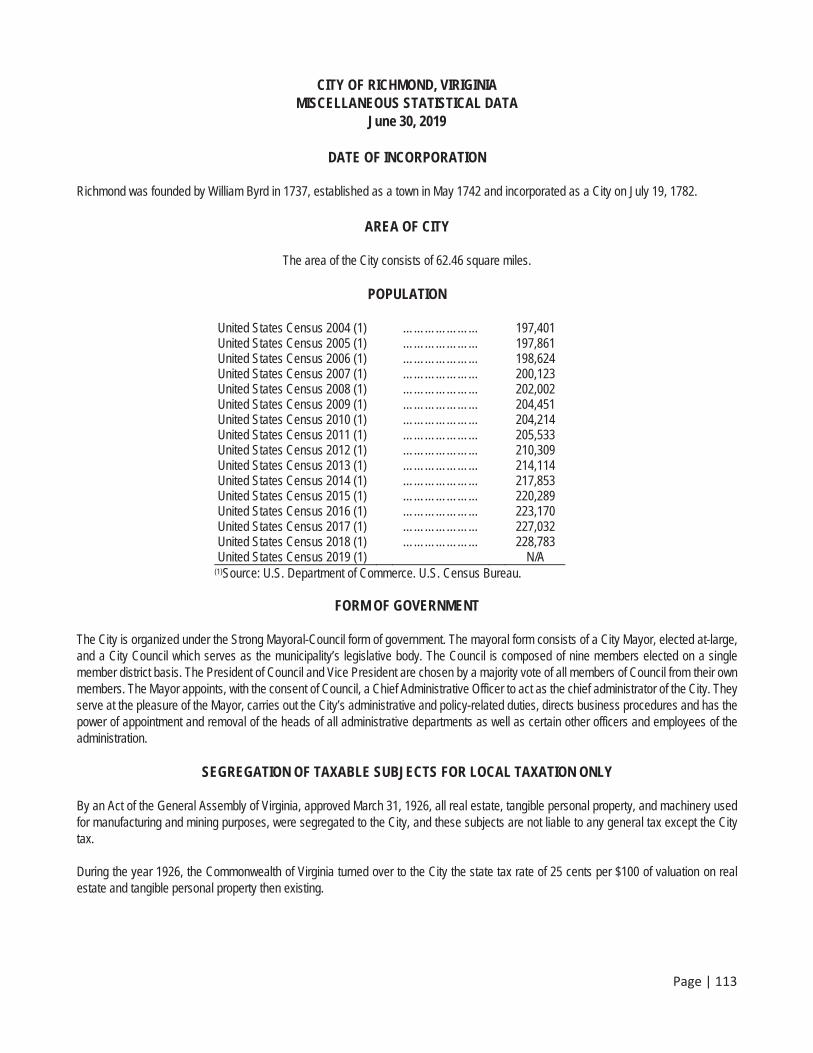
Page | 113
CITY OF RICHMOND, VIRIGINIA MISCELLANEOUS STATISTICAL DATA
June 30, 2019
DATE OF INCORPORATION
Richmond was founded by William Byrd in 1737, established as a town in May 1742 and incorporated as a City on July 19, 1782.
AREA OF CITY
The area of the City consists of 62.46 square miles.
POPULATION
United States Census 2004 (1) ………………… 197,401 United States Census 2005 (1) ………………… 197,861 United States Census 2006 (1) ………………… 198,624 United States Census 2007 (1) ………………… 200,123 United States Census 2008 (1) ………………… 202,002 United States Census 2009 (1) ………………… 204,451 United States Census 2010 (1) ………………… 204,214 United States Census 2011 (1) ………………… 205,533 United States Census 2012 (1) ………………… 210,309 United States Census 2013 (1) ………………… 214,114 United States Census 2014 (1) ………………… 217,853 United States Census 2015 (1) ………………… 220,289 United States Census 2016 (1) ………………… 223,170 United States Census 2017 (1) ………………… 227,032 United States Census 2018 (1) ………………… 228,783 United States Census 2019 (1) N/A
(1)Source: U.S. Department of Commerce. U.S. Census Bureau.
FORM OF GOVERNMENT
The City is organized under the Strong Mayoral-Council form of government. The mayoral form consists of a City Mayor, elected at-large,and a City Council which serves as the municipality’s legislative body. The Council is composed of nine members elected on a single member district basis. The President of Council and Vice President are chosen by a majority vote of all members of Council from their own members. The Mayor appoints, with the consent of Council, a Chief Administrative Officer to act as the chief administrator of the City. They serve at the pleasure of the Mayor, carries out the City’s administrative and policy-related duties, directs business procedures and has the power of appointment and removal of the heads of all administrative departments as well as certain other officers and employees of the administration.
SEGREGATION OF TAXABLE SUBJECTS FOR LOCAL TAXATION ONLY
By an Act of the General Assembly of Virginia, approved March 31, 1926, all real estate, tangible personal property, and machinery used for manufacturing and mining purposes, were segregated to the City, and these subjects are not liable to any general tax except the City tax.
During the year 1926, the Commonwealth of Virginia turned over to the City the state tax rate of 25 cents per $100 of valuation on real estate and tangible personal property then existing.
Page | 114
ASSESSMENTS
The City Assessor of Real Estate assesses real estate annually at “fair market value”. The assessment to sales ratio is estimated to be 95.0%. The real estate assessments for the semi-annual real estate billing were based on an effective valuation date of January 1, 2018. The due dates for the semi billing were January 14 and June 14 in the 2019 tax year. The 2019 Land Book will be updated with fair market values as of July 1, 2019. New construction and renovations will be added to the land book through December 31, 2019.
Areas, vaults, marquees, gasoline tanks, electric wires and conduits on, above and under public property are assessed by the City Assessor of Real Estate as certified to the Assessor by the Department of Public Works, since taxes on these subjects are included in the real estate tax bill.
Special assessments for sidewalk and alley paving, boarding, demolition of unsafe structures, weed and refuse lot clearance, if not paid during the current year, charges are added to the real estate tax bill of the upcoming year and become a lien on the property.
The Director of Finance, as required by the State Code, assesses tangible personal property and machinery and tools in manufacturingand mining. Tangible personal property includes automobiles, mobile homes, business equipment and pleasure boats.
TAX RATES
Real Estate:$1.20 per $100 of Assessed Value: 2008-2019$1.23 per $100 of Assessed Value: 2007$1.29 per $100 of Assessed Value: 2006$1.33 per $100 of Assessed Value: 2005$1.38 per $100 of Assessed Value: 2003-2004$1.39 per $100 of Assessed Value: 2002
Tangible Personal Property: $3.70 per $100 of Assessed Value: 1992-2019
Machinery and Tools Used for Manufacturing and Mining:$2.30 per $100 of Assessed Value: 1992-2019
Other taxes and fees imposed include:
PILOT (Payment In Lieu of Taxes): companies that do not pay taxes but instead pay a fee for trash collections and disposal, police protection and fire protection. PILOT is billed twice a year in June and December. The PILOT rate is computed based on several different figures from the CAFR, Assessor’s Office and other financial reports. Certain companies (e.g. Commonwealth of Virginia)have rates set by the General Assembly.
PSC (Public Service Corporation): companies that deliver public services considered essential to the public interest. These companies are assessed based on the Virginia State Corporation Commission. PSC is billed twice a year June and December. The tax rate for all companies is the same as regular real state and personal property accounts.
Page | 115
Utility Consumers’ Tax:
Monthly Residential Billing:Electricity - $1.40 plus .015116 per kilowatt-hour and the amount of tax shall not exceed $4.00 per month.Gas - $1.78 plus .010091 per 100 CCF delivered per month and the amount of tax shall not exceed $4.00 per month
Monthly Commercial and Industrial Billing:Commercial Metered Electricity - $2.75 plus .016462 per kilowatt-hour (kWh) first 8,945kWh and .002160 per kWh inexcess of 8,945kWhIndustrial Metered Electricity - $2.75 plus .0119521 per kilowatt-hour (kWh) first 1,242kWh .001837 per kWh in excessof 1,242kWhCommercial Gas - $2.88 plus $.01739027 per CCF delivered (small volume)Commercial Gas - $24.00 plus $.07163081 per CCF delivered (large volume)Industrial Metered Gas - $120.00 plus $.0011835 per CCF deliveredCommercial Telephone – 5% Communication Tax*
Electric Utility Consumption Tax:Less than 2,500kWh per month .00038 per kWh.Excess of 2,501kWh per month but not in excess of 50,000kWh per month .00024 per kWh.All excess of 50,000kWh per month .00018 per kWh.
Business, Professional, and Occupational Licenses:
For Business with Gross Receipts Exceeding Threshold: Wholesale Merchants - $.22 per $100 of gross purchasesRetail Merchants - $.20 per $100 of gross receiptsProfessional Occupations - $.58 per $100 of gross receiptsContractors - $.19 per $100 gross contracts and/or 1.50% of fees from contracts on a fee basisPersonal Service Contracts - $.36 per $100 gross receiptsThresholdReceipts less than $5,000 - no tax, no $30 feeReceipts greater than $5,000 - less than $100,000, $30 fee onlyReceipts greater than $100,000 - rate per merchant classification multiplied by amount of receipts
Motor Vehicle License:Private passenger vehicles - $40.74 on 4,000lbs. or less; $45.74 on 4,001lbs. or moreTrucks – Rates graduated in accordance with gross weight; minimum rate $17, maximum rate $250
Admission Tax: A tax of 7% of any charge for admission of a place of amusement or entertainment where such a charge is $.50 or more
Bank Franchise Tax: $.80 on each $100 of value of bank stock
Sales and Use Tax: 4.3% State and 1% Local: 2004-2019
Prepared Meals Tax: A tax of 7.5% on prepared meals sold in the City in addition to the Sales Tax, effective July 1, 2018.
Page | 116
Lodging Tax:A tax of 8% of the charge made for each room rented by a transient in a hotel or motel100% of the City’s transient lodging tax revenue is allocated to the Greater Richmond Convention Center Authority
Cable TV Tax:5% Communications Tax**Effective January 1, 2007, the local consumer tax on communications services, including the 5% Cable TV service taxwas replaced with a 5% Communications Tax collected and administered by the Virginia Department of Taxation anddistributed to the City on a pro-raga basis as determined by the Auditor of Public Accounts in October 2006.
TAXES DUE
Real estate properties are assessed by the City of Richmond Assessor’s office and assessments are mailed to tax payers by mid-June of each year. As of tax year 2011 real estate taxes are billed on a semi-annual basis with the payments due on January 14 and June 14 of each tax year. Penalty and interest will be assessed after each of the payment due dates in if the taxes due on the respective due dates are paid thereafter.
Personal property taxes are assessed as of the first day of January of each year. Personal property taxes on motor vehicles are prorated on a monthly basis for vehicles acquiring taxable situs in the City after January 1. The full tax bill must be paid on or before June 5 to avoid penalty and interest.
DELINQUENT TAXES
As of January 1, 2019, real estate taxes are billed semi-annually with due dates of January 14 and June 14. Taxes will be reported as delinquent on January 15 and June 15, respectively of the tax year for which assessed. Personal property taxes are reported as delinquent
on June 6th of the tax year for which assessed or 61 days after acquiring taxable situs. A penalty of 10% and a $30 administrative fee is added to all delinquent taxes. In FY 2019, the interest rate for unpaid taxes was10%. Business personal property taxes incur an additional 10% late payment penalty if not paid within 60 days of the due date.
OVERLAPPING AREAS AND DEBT
The City is autonomous and entirely independent of any county or any other political subdivision of the state, being a separate and distinct political unit. It is not coterminous with nor subject to any county or school district taxation and is not liable for any indebtedness other than its own. It has the power to levy taxes on all real estate and tangible personal property without limitation of rate or amount.
CITY INDEBTEDNESS
All of the City’s General Obligation bonds and notes are a direct obligation, and the full faith and credit of the City is pledged for the payment of all these obligations.
Enterprise Funds and Internal Service Funds pay the principal and interest on certain debt (general obligation bonds, revenue and refunding bonds and serial equipment notes) issued for the program purposes of each fund from user fees. All other debt redemption and interest requirements are appropriated in the General Fund budget. Neither long-term bonds nor revenue anticipation notes are sold to financecurrent operations.
There are neither special assessments nor special revenue bonds issued or outstanding. Bonds of the City are legal investments for savings banks and trust funds.
Page | 117
DEBT MANAGEMENT POLICIES
The City Council adopted a resolution in 1989 that was amended in 1991, 2012, and again in 2017 (Resolution No. 2017-R088), establishing guidelines for the planning, issuance and management of debt, for and on behalf of, the City of Richmond. The City will issue long-term debt for the purpose of planning, designing, purchasing, and constructing capital projects and for making major renovations to existing City infrastructure. The City may also incur debt for acquiring vehicles, machinery and equipment with the maturity of any debt offering not exceeding the expected useful life of the acquired asset. It will be the policy of the City to budget annual operating funds for expenditures that are primarily of an on-going maintenance type activity.
It is the policy of the City that Tax Supported debt shall include all general obligation, moral obligation, and subject to appropriation debt (ice. capital leases), collectively referred to as Total Debt, which are paid from the general revenues of the City. The tax supported debt policies listed will not include any self-supporting General Obligation or Revenue Bond debt issued on behalf of a City Enterprise Fund (ice. Utilities and Parking). It will be the policy of the City that Tax Supported debt, including bonds and notes authorized but unmissed, will be limited by any one of the following:
Total Debt shall not exceed 3.75% of the combined total assessed taxable valuation of taxable real estate, personal property,and machinery and tools.
Debt Service to be paid on total debt shall not exceed 10% of the sum of the General Fund budget, the Richmond Public Schools (RPS) budget, and the City funding from the State for Highway and Street Maintenance, less the transfer portion RPS receivesfrom the City’s General Fund to prevent double counting in the calculation.
The City’s ten-year payout ratio of the City’s total debt (ie. the principal amount of debt retired within ten years) shall not be lessthan 60%
The City will issue tax supported debt with an average life consistent with the useful life of the assets being financed, with amaximum maturity not to exceed 30 years.
The City will issue general fund supported debt with an average life that is consistent with the useful life of the project.
The City shall target to provide cash funding from the annual operating budget for a portion of the five-year Capital ImprovementPlan (CIP) budget.
FUND BALANCE POLICIES
The City Council adopted a Fund Balance Policy on March 14, 1988, which established major policy goals. On October 26, 1992, the City Council amended the Fund Balance Policy, raising the required level of the unassigned fund balance from 3% to 5% and again November26, 2001, from 5% to 7% of budgeted General Fund expenditures over a period of years. During 2012, City Council adopted a which further increased the required level of unassigned fund balance to 10% of budgeted General Fund expenditures.
On December 11, 2017, the City Council adopted Ordinance No. 2017-215 amending the prior Fund Balance Policies. The Ordinance establishes goals for the Unassigned Fund Balance and the Budget and Revenue Stabilization Contingency Reserve.
Page | 118
Unassigned Fund Balance Policy
It is the goal of the City that the General Fund's Unassigned Fund Balance be equal to at least 13.67% of budgeted GeneralFund operating expenses for the latest fiscal year for which City Council has adopted a General Fund Budget.
It is the policy of the City that appropriations from the Unassigned Fund Balance will be made (i) only in the event of unusual,unanticipated, and seemingly insurmountable hardship, and (ii) only after all other reserves or contingency funds have beenexhausted.
To the extent that the Unassigned Fund Balance is ever drawn upon, the Mayor shall submit to City Council, within 90 days afterthe date on which such funds have been expended, a plan to restore the amount expended within three years. As of June 30,2019, the Unassigned Fund Balance was $111.6 million, which is 15% of annual adopted FY 2020 budgeted expenditures andtransfers out.
Budget and Revenue Stabilization Contingency Reserve
It is the goal of the City that the Budget and Revenue Stabilization Contingency Reserve be equal to at least 3.00% of budgetedGeneral Fund operating expenses for the latest fiscal year in which City Council has adopted a General Fund Budget.
To the extent that the Budget and revenue Stabilization Contingency Reserve is ever drawn upon , the mayor shall submit to cityCouncil, within 90 days after the date on which such funds were expended, a plan to restore the amount expended within threeyears. As of June 30, 2019, the Budget and Revenue Stabilization Contingency Reserve balance was $14 million, which is 1.6% of annual adopted budgeted FY 2020 expenditures and transfers out.
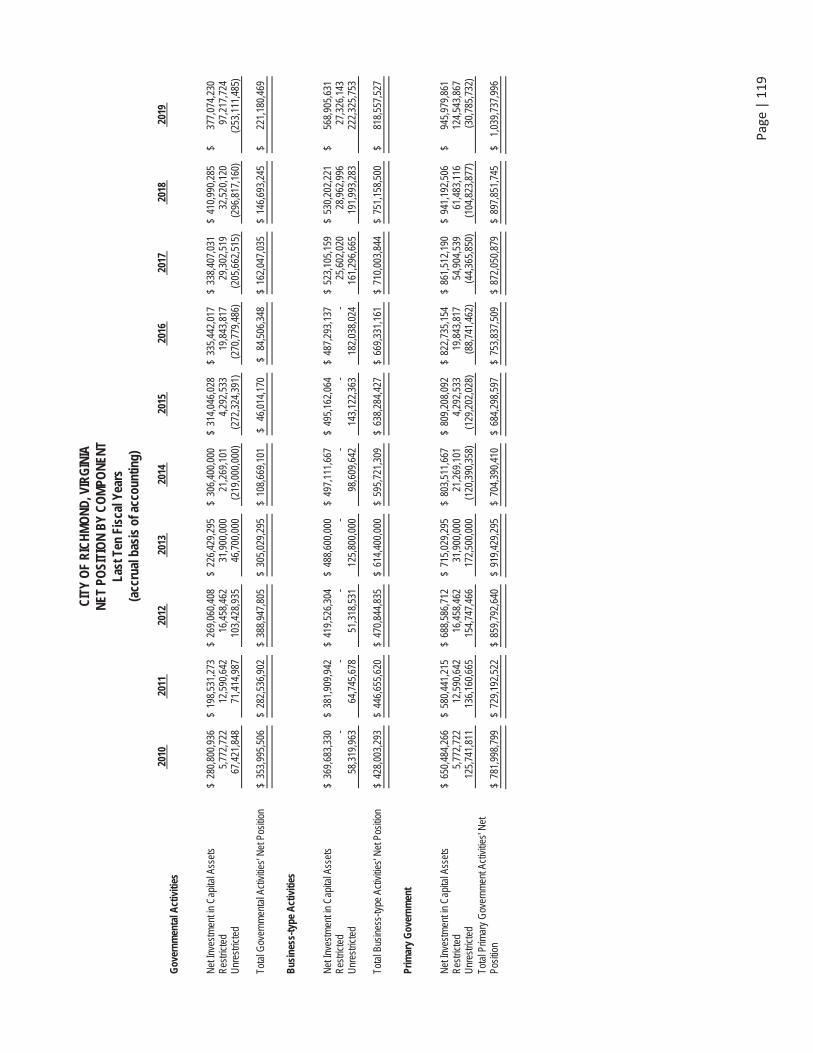
Page
|11
9
CIT
Y O
F R
ICH
MO
ND
, VIR
GIN
IA
NET
PO
SITI
ON
BY
CO
MPO
NEN
T La
st T
en F
isca
l Yea
rs
(acc
rual
bas
is o
f acc
ount
ing)
201
0 2
011
201
2 2
013
201
4 2
015
201
6 2
017
201
8 2
019
Gov
ernm
enta
l Act
iviti
es
Net
Inve
stm
ent i
n C
apita
l Ass
ets
$ 2
80,8
00,9
36
$ 1
98,5
31,2
73
$ 2
69,0
60,4
08
$ 2
26,4
29,2
95
$ 3
06,4
00,0
00
$ 3
14,0
46,0
28
$ 3
35,4
42,0
17
$ 3
38,4
07,0
31
$ 4
10,9
90,2
85
$
377
,074
,230
R
estri
cted
5
,772
,722
1
2,59
0,64
2
16,
458,
462
3
1,90
0,00
0
21,
269,
101
4
,292
,533
1
9,84
3,81
7
29,
302,
519
3
2,52
0,12
0
97,
217,
724
U
nres
trict
ed
67,
421,
848
7
1,41
4,98
7
103
,428
,935
4
6,70
0,00
0
(2
19,0
00,0
00)
(2
72,3
24,3
91)
(2
70,7
79,4
86)
(2
05,6
62,5
15)
(2
96,8
17,1
60)
(2
53,1
11,4
85)
Tota
l Gov
ernm
enta
l Act
iviti
es' N
et P
ositi
on
$ 3
53,9
95,5
06
$ 2
82,5
36,9
02
$ 3
88,9
47,8
05
$ 3
05,0
29,2
95
$ 1
08,6
69,1
01
$
46,0
14,1
70
$
84,5
06,3
48
$ 1
62,0
47,0
35
$ 1
46,6
93,2
45
$
221
,180
,469
Bus
ines
s-ty
pe A
ctiv
ities
Net
Inve
stm
ent i
n C
apita
l Ass
ets
$ 3
69,6
83,3
30
$ 3
81,9
09,9
42
$ 4
19,5
26,3
04
$ 4
88,6
00,0
00
$ 4
97,1
11,6
67
$ 4
95,1
62,0
64
$ 4
87,2
93,1
37
$ 5
23,1
05,1
59
$ 5
30,2
02,2
21
$
568
,905
,631
R
estri
cted
-
-
-
-
-
-
-
2
5,60
2,02
0
28,
962,
996
2
7,32
6,14
3
Unr
estri
cted
5
8,31
9,96
3
64,
745,
678
5
1,31
8,53
1
125
,800
,000
9
8,60
9,64
2
143
,122
,363
1
82,0
38,0
24
161
,296
,665
1
91,9
93,2
83
222
,325
,753
Tota
l Bus
ines
s-ty
pe A
ctiv
ities
' Net
Pos
ition
$
428
,003
,293
$
446
,655
,620
$
470
,844
,835
$
614
,400
,000
$
595
,721
,309
$
638
,284
,427
$
669
,331
,161
$
710
,003
,844
$
751
,158
,500
$
8
18,5
57,5
27
Prim
ary
Gov
ernm
ent
Net
Inve
stm
ent i
n C
apita
l Ass
ets
$ 6
50,4
84,2
66
$ 5
80,4
41,2
15
$ 6
88,5
86,7
12
$ 7
15,0
29,2
95
$ 8
03,5
11,6
67
$ 8
09,2
08,0
92
$ 8
22,7
35,1
54
$ 8
61,5
12,1
90
$ 9
41,1
92,5
06
$
945
,979
,861
R
estri
cted
5
,772
,722
1
2,59
0,64
2
16,
458,
462
3
1,90
0,00
0
21,
269,
101
4
,292
,533
1
9,84
3,81
7
54,
904,
539
6
1,48
3,11
6
124
,543
,867
U
nres
trict
ed
125
,741
,811
1
36,1
60,6
65
154
,747
,466
1
72,5
00,0
00
(1
20,3
90,3
58)
(1
29,2
02,0
28)
(88,
741,
462)
(44,
365,
850)
(104
,823
,877
) (3
0,78
5,73
2)
Tota
l Prim
ary
Gov
ernm
ent A
ctiv
ities
' Net
Po
sitio
n $
781
,998
,799
$
729
,192
,522
$
859
,792
,640
$
919
,429
,295
$
704
,390
,410
$
684
,298
,597
$
753
,837
,509
$
872
,050
,879
$
897
,851
,745
$
1
,039
,737
,996
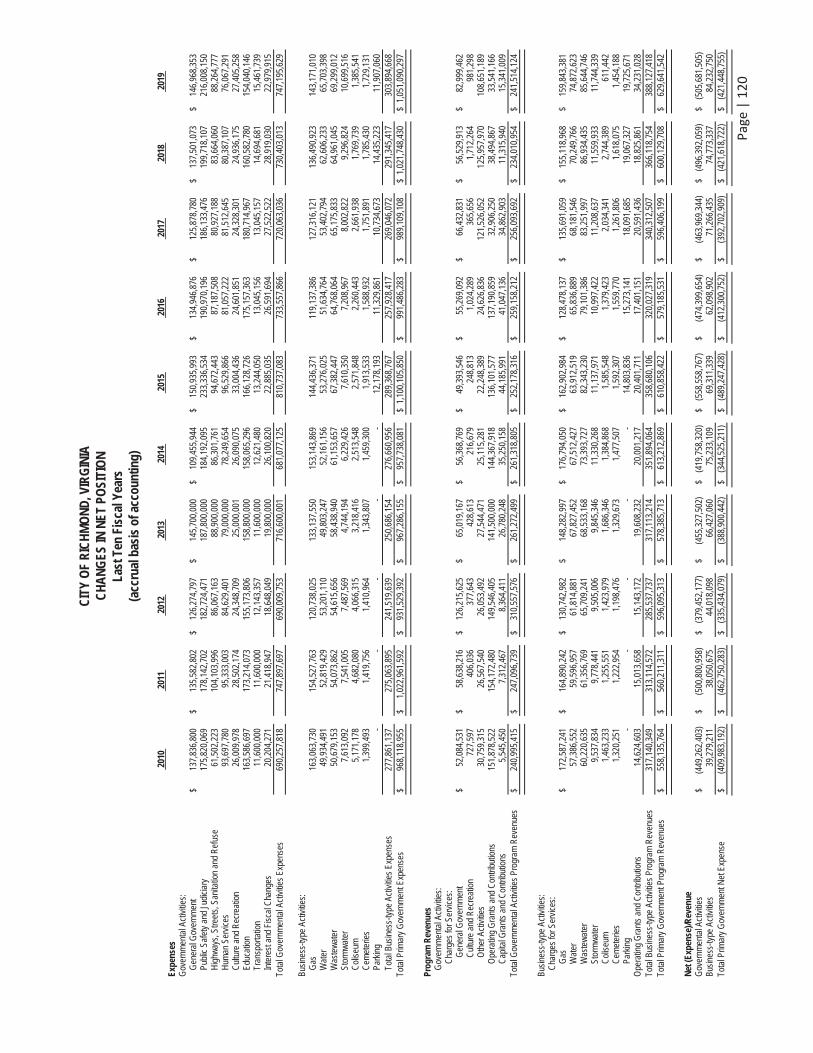
Page
|12
0
CIT
Y O
F R
ICH
MO
ND
, VIR
GIN
IA
CH
AN
GES
IN N
ET P
OSI
TIO
N
Last
Ten
Fis
cal Y
ears
(a
ccru
al b
asis
of a
ccou
ntin
g)
201
0 2
011
201
2 2
013
201
4 2
015
201
6 2
017
201
8 2
019
Expe
nses
G
over
nmen
tal A
ctiv
ities
:
Gen
eral
Gov
ernm
ent
$
137
,836
,800
$
1
35,5
82,8
02
$
126
,274
,797
$
1
45,7
00,0
00
$
109
,455
,944
$
1
50,9
35,9
93
$
134
,946
,876
$
1
25,8
78,7
80
$
137
,501
,073
$
1
46,9
68,3
53
Pu
blic
Saf
ety
and
Judi
ciar
y 1
75,8
20,0
69
178
,142
,702
1
82,7
24,4
71
187
,800
,000
1
84,1
92,0
95
233
,336
,534
1
90,9
70,1
96
186
,133
,476
1
99,7
18,1
07
216
,008
,150
Hig
hway
s, S
treet
s, S
anita
tion
and
Ref
use
61,
502,
223
1
04,1
03,9
96
86,
067,
163
8
8,90
0,00
0
86,
301,
761
9
4,67
2,44
3
87,
187,
508
8
0,92
7,18
8
83,
664,
060
8
8,26
4,77
7
H
uman
Ser
vice
s 9
3,69
7,78
0
95,
333,
003
8
4,62
9,40
1
79,
000,
000
7
8,24
9,65
4
96,
529,
866
8
1,05
7,22
2
81,
512,
645
8
0,38
7,10
7
76,
067,
291
Cul
ture
and
Rec
reat
ion
26,
009,
978
2
8,50
2,17
4
24,
348,
709
2
5,00
0,00
1
26,
090,
075
3
3,00
4,43
6
24,
601,
851
2
4,32
8,30
1
24,
936,
175
2
7,40
5,25
8
Ed
ucat
ion
163
,586
,697
1
73,2
14,0
73
155
,173
,806
1
58,8
00,0
00
158
,065
,296
1
66,1
28,7
26
175
,157
,363
1
80,7
14,9
67
160
,582
,780
1
54,0
40,1
46
Tr
ansp
orta
tion
11,
600,
000
1
1,60
0,00
0
12,
143,
357
1
1,60
0,00
0
12,
621,
480
1
3,24
4,05
0
13,
045,
156
1
3,04
5,15
7
14,
694,
681
1
5,46
1,73
9
In
tere
st a
nd F
isca
l Cha
nges
2
0,20
4,27
1
21,
418,
947
1
8,64
8,04
9
19,
800,
000
2
6,10
0,82
0
22,
885,
035
2
6,59
1,69
4
27,
522,
522
2
8,91
9,03
0
22,
979,
915
To
tal G
over
nmen
tal A
ctiv
ities
Exp
ense
s 6
90,2
57,8
18
747
,897
,697
6
90,0
09,7
53
716
,600
,001
6
81,0
77,1
25
810
,737
,083
7
33,5
57,8
66
720
,063
,036
7
30,4
03,0
13
747
,195
,629
Busi
ness
-type
Act
iviti
es:
G
as
163
,063
,730
1
54,5
27,7
63
120
,738
,025
1
33,1
37,5
50
153
,143
,869
1
44,4
36,3
71
119
,137
,386
1
27,3
16,1
21
136
,490
,923
1
43,1
71,0
10
W
ater
4
9,93
4,49
1
52,
819,
429
5
3,20
1,11
0
49,
803,
247
5
2,16
1,15
6
53,
276,
025
5
1,63
4,76
4
53,
402,
794
6
2,60
6,23
3
65,
703,
398
Was
tew
ater
5
0,67
9,15
3
54,
073,
862
5
4,61
5,65
6
58,
438,
940
6
1,15
3,65
7
67,
382,
447
6
4,76
8,06
4
65,
175,
833
6
4,96
1,04
5
69,
299,
012
Stor
mw
ater
7
,613
,092
7
,541
,005
7
,487
,569
4
,744
,194
6
,229
,426
7
,610
,350
7
,208
,967
8
,002
,822
9
,296
,824
1
0,69
9,51
6
C
olis
eum
5
,171
,178
4
,682
,080
4
,066
,315
3
,218
,416
2
,513
,548
2
,571
,848
2
,260
,443
2
,661
,938
1
,769
,739
1
,385
,541
Cem
eter
ies
1,3
99,4
93
1,4
19,7
56
1,4
10,9
64
1,3
43,8
07
1,4
59,3
00
1,9
13,5
33
1,5
88,9
32
1,7
51,8
91
1,7
85,4
30
1,7
29,1
31
Pa
rkin
g -
-
-
-
-
12,
178,
193
11,
329,
861
1
0,73
4,67
3
14,
435,
223
1
1,90
7,06
0
To
tal B
usin
ess-
type
Act
iviti
es E
xpen
ses
277
,861
,137
2
75,0
63,8
95
241
,519
,639
2
50,6
86,1
54
276
,660
,956
2
89,3
68,7
67
257
,928
,417
2
69,0
46,0
72
291
,345
,417
3
03,8
94,6
68
Tota
l Prim
ary
Gov
ernm
ent E
xpen
ses
$
968
,118
,955
$
1
,022
,961
,592
$
9
31,5
29,3
92
$
967
,286
,155
$
9
57,7
38,0
81
$ 1
,100
,105
,850
$
9
91,4
86,2
83
$
989
,109
,108
$
1,0
21,7
48,4
30
$ 1
,051
,090
,297
Prog
ram
Rev
enue
s
Gov
ernm
enta
l Act
iviti
es:
C
harg
es fo
r Ser
vice
s:
G
ener
al G
over
nmen
t $
5
2,08
4,53
1
$
58,
638,
216
$
1
26,2
15,6
25
$
65,
019,
167
$
5
6,36
8,76
9
$
49,
393,
546
$
5
5,26
9,09
2
$
66,
432,
831
$
5
6,52
9,91
3
$
82,
999,
462
Cul
ture
and
Rec
reat
ion
727
,597
4
06,0
36
377
,643
4
28,6
13
216
,679
2
48,8
13
1,0
24,2
89
365
,656
1
,712
,264
9
81,2
98
O
ther
Act
iviti
es
30,
759,
315
2
6,56
7,54
0
26,
053,
492
2
7,54
4,47
1
25,
115,
281
2
2,24
8,38
9
24,
626,
836
1
21,5
26,0
52
125
,957
,970
1
08,6
51,1
89
O
pera
ting
Gra
nts
and
Con
tribu
tions
1
51,8
78,5
22
154
,172
,480
1
49,5
46,4
05
141
,500
,000
1
44,3
67,9
18
136
,101
,577
1
37,1
90,8
59
32,
906,
250
3
8,49
4,86
7
33,
541,
166
Cap
ital G
rant
s an
d C
ontri
butio
ns
5,5
45,4
50
7,3
12,4
67
8,3
64,4
11
26,
780,
248
3
5,25
0,15
8
44,
185,
991
4
1,04
7,13
6
34,
862,
903
1
1,31
5,94
0
15,
341,
009
To
tal G
over
nmen
tal A
ctiv
ities
Pro
gram
Rev
enue
s $
2
40,9
95,4
15
$
247
,096
,739
$
3
10,5
57,5
76
$
261
,272
,499
$
2
61,3
18,8
05
$
252
,178
,316
$
2
59,1
58,2
12
$
256
,093
,692
$
2
34,0
10,9
54
$
241
,514
,124
Busi
ness
-type
Act
iviti
es:
C
harg
es fo
r Ser
vice
s:
G
as
$
172
,587
,241
$
1
64,8
90,2
42
$
130
,742
,982
$
1
48,2
82,9
97
$
176
,794
,050
$
1
62,9
02,9
84
$
128
,478
,137
$
1
35,6
91,0
59
$
155
,118
,968
$
1
59,8
43,3
81
W
ater
5
7,38
6,55
2
59,
596,
957
6
1,81
4,88
1
67,
827,
452
6
7,51
2,42
7
63,
912,
519
6
5,83
6,88
9
68,
181,
546
7
0,24
9,76
6
74,
872,
623
Was
tew
ater
6
0,22
0,63
5
61,
356,
769
6
5,70
9,24
1
68,
533,
168
7
3,39
3,72
7
82,
343,
230
7
9,10
1,38
6
83,
251,
997
8
6,93
4,43
5
85,
644,
746
Stor
mw
ater
9
,537
,834
9
,778
,441
9
,505
,006
9
,845
,346
1
1,33
0,26
8
11,
137,
971
1
0,99
7,42
2
11,
208,
637
1
1,55
9,93
3
11,
744,
339
Col
iseu
m
1,4
63,2
33
1,2
55,5
51
1,4
23,9
79
1,6
86,3
46
1,3
84,8
68
1,5
85,5
48
1,3
79,4
23
2,0
34,3
41
2,7
44,3
89
611
,442
Cem
eter
ies
1,3
20,2
51
1,2
22,9
54
1,1
98,4
76
1,3
29,6
73
1,4
77,5
07
1,5
92,3
07
1,5
59,7
70
1,2
61,8
06
1,6
18,0
75
1,4
54,1
88
Pa
rkin
g -
-
-
-
-
14,
803,
836
15,
273,
141
1
8,09
1,68
5
19,
067,
327
1
9,72
5,67
1
Ope
ratin
g G
rant
s an
d C
ontri
butio
ns
14,
624,
603
1
5,01
3,65
8
15,
143,
172
1
9,60
8,23
2
20,
001,
217
2
0,40
1,71
1 1
7,40
1,15
1
20,
591,
436
1
8,82
5,86
1
34,
231,
028
To
tal B
usin
ess-
type
Act
iviti
es P
rogr
am R
even
ues
317
,140
,349
3
13,1
14,5
72
285
,537
,737
3
17,1
13,2
14
351
,894
,064
3
58,6
80,1
06
320
,027
,319
3
40,3
12,5
07
366
,118
,754
3
88,1
27,4
18
Tota
l Prim
ary
Gov
ernm
ent P
rogr
am R
even
ues
$
558
,135
,764
$
5
60,2
11,3
11
$
596
,095
,313
$
5
78,3
85,7
13
$
613
,212
,869
$
6
10,8
58,4
22
$
579
,185
,531
$
5
96,4
06,1
99
$
600
,129
,708
$
6
29,6
41,5
42
Net
(Exp
ense
)/Rev
enue
G
over
nmen
tal A
ctiv
ities
$
(4
49,2
62,4
03)
$
(500
,800
,958
) $
(3
79,4
52,1
77)
$
(455
,327
,502
) $
(4
19,7
58,3
20)
$
(558
,558
,767
) $
(4
74,3
99,6
54)
$
(463
,969
,344
) $
(4
96,3
92,0
59)
$
(505
,681
,505
) Bu
sine
ss-ty
pe A
ctiv
ities
3
9,27
9,21
1
38,
050,
675
4
4,01
8,09
8
66,
427,
060
7
5,23
3,10
9
69,
311,
339
6
2,09
8,90
2
71,
266,
435
7
4,77
3,33
7
84,
232,
750
To
tal P
rimar
y G
over
nmen
t Net
Exp
ense
$
(4
09,9
83,1
92)
$
(462
,750
,283
) $
(3
35,4
34,0
79)
$
(388
,900
,442
) $
(3
44,5
25,2
11)
$
(489
,247
,428
) $
(4
12,3
00,7
52)
$
(392
,702
,909
) $
(4
21,6
18,7
22)
$
(421
,448
,755
)
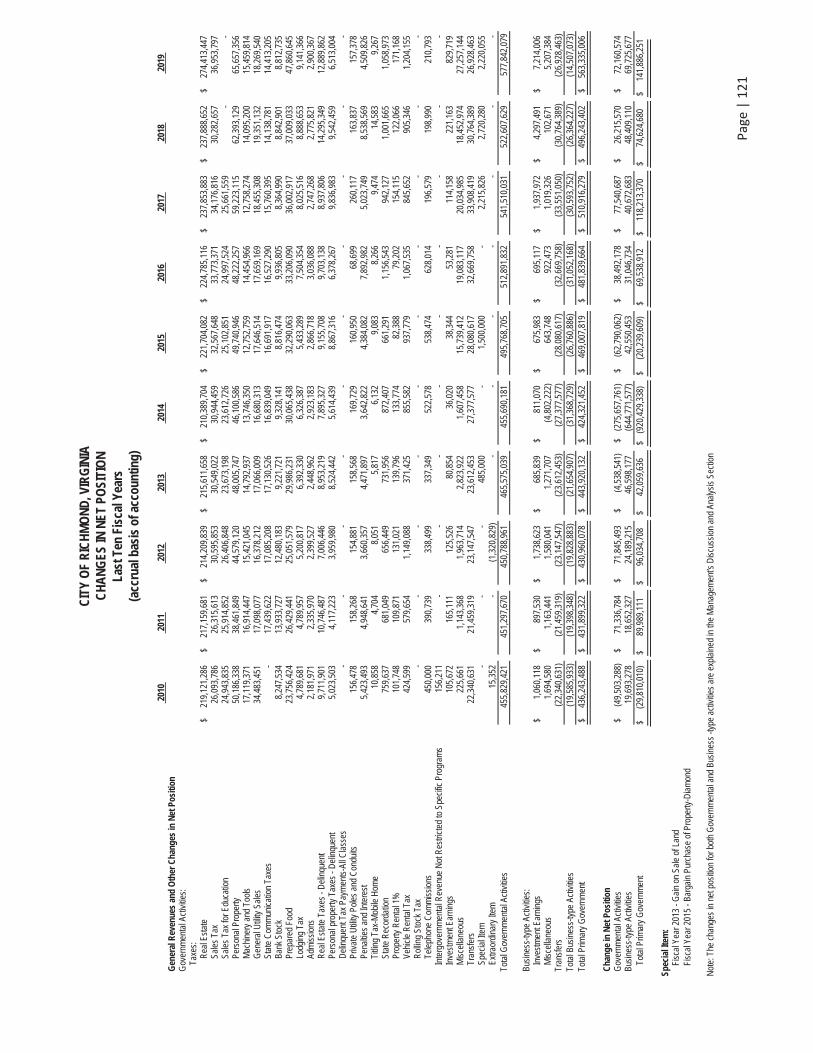
Page
|12
1
CIT
Y O
F R
ICH
MO
ND
, VIR
GIN
IA
CH
AN
GES
IN N
ET P
OSI
TIO
N
Last
Ten
Fis
cal Y
ears
(a
ccru
al b
asis
of a
ccou
ntin
g)
201
0 2
011
201
2 2
013
201
4 2
015
2
016
2
017
201
8 2
019
Gen
eral
Rev
enue
s an
d O
ther
Cha
nges
in N
et P
ositi
on
Gov
ernm
enta
l Act
iviti
es:
Ta
xes:
R
eal E
stat
e $
2
19,1
21,2
86
$
217
,159
,681
$
2
14,2
09,8
39
$
215
,611
,658
$
2
10,3
89,7
04
$
221
,704
,082
$
2
24,7
85,1
16
$
237
,853
,883
$
2
37,8
88,6
52
$
274
,413
,447
Sale
s Ta
x 2
6,09
3,78
6
26,
315,
613
3
0,59
5,85
3
30,
549,
022
3
0,94
4,45
9
32,
567,
648
3
3,77
3,37
1
34,
176,
816
3
0,28
2,65
7
36,
953,
797
Sale
s Ta
x fo
r Edu
catio
n 2
4,94
3,83
5
25,
914,
852
2
6,40
6,84
8
23,
673,
198
2
3,61
2,72
6
25,
102,
851
2
4,99
7,52
4
25,
661,
559
-
-
Pers
onal
Pro
perty
5
0,18
6,33
8
38,
461,
849
4
4,57
9,12
0
48,
005,
747
4
6,10
0,58
6
49,
740,
946
4
8,22
2,25
7
59,
223,
115
6
2,39
3,12
9
65,
657,
356
Mac
hine
ry a
nd T
ools
1
7,11
9,37
1
16,
914,
447
1
5,42
1,04
5
14,
792,
937
1
3,74
6,35
0
12,
752,
759
1
4,45
4,96
6
12,
758,
274
1
4,09
5,20
0
15,
459,
814
Gen
eral
Util
ity S
ales
3
4,48
3,45
1
17,
098,
077
1
6,37
8,21
2
17,
066,
009
1
6,68
0,31
3
17,
646,
514
1
7,65
9,16
9
18,
455,
308
1
9,35
1,13
2
18,
269,
540
Stat
e C
omm
unic
atio
n Ta
xes
- 1
7,43
9,62
2 1
7,08
5,20
8
17,
130,
526
1
6,83
9,04
9
16,
691,
917
1
6,52
7,29
0
15,
760,
395
1
4,13
8,78
1
14,
413,
205
Bank
Sto
ck
8,2
47,5
34
13,
933,
727
12,
480,
183
9
,221
,721
9
,328
,141
8
,816
,474
9
,936
,805
8
,364
,990
8
,842
,901
8
,812
,735
Prep
ared
Foo
d 2
3,75
6,42
4
26,
429,
441
25,
051,
579
2
9,98
6,23
1
30,
065,
438
3
2,29
0,06
3
33,
206,
090
3
6,00
2,91
7
37,
009,
033
4
7,86
0,64
5
Lo
dgin
g Ta
x 4
,789
,681
4
,789
,957
5,2
00,8
17
6,3
92,3
30
6,3
26,3
87
5,4
33,2
89
7,5
04,3
54
8,0
25,5
16
8,8
88,6
53
9,1
41,3
66
Ad
mis
sion
s 2
,181
,971
2
,335
,970
2,3
99,5
27
2,4
48,9
62
2,9
23,1
83
2,8
66,7
18
3,0
36,0
88
2,7
47,2
68
2,7
75,8
21
2,9
00,3
67
R
eal E
stat
e Ta
xes
- Del
inqu
ent
9,7
11,9
01
10,
746,
487
7,0
06,4
46
8,9
53,2
19
7,8
95,3
27
9,1
55,7
08
9,7
03,1
38
8,9
37,8
06
14,
295,
349
1
2,88
9,86
2
Pe
rson
al p
rope
rty T
axes
- D
elin
quen
t 5
,023
,503
4
,117
,223
3,9
59,9
80
8,5
24,4
42
5,6
14,4
39
8,8
67,3
16
6,3
78,2
67
9,8
36,9
83
9,5
42,4
59
6,5
13,0
04
D
elin
quen
t Tax
Pay
men
ts-A
ll C
lass
es
-
-
-
-
-
-
-
-
-
-
Pr
ivat
e U
tility
Pol
es a
nd C
ondu
its
156
,478
1
58,2
68
154
,881
1
58,5
68
169
,729
1
60,9
50
68,
699
2
60,1
17
163
,837
1
57,3
78
Pe
nalti
es a
nd In
tere
st
5,4
23,4
93
4,9
48,6
41
3,6
60,3
57
4,4
71,8
97
3,6
42,8
22
4,3
84,0
82
7,8
92,9
82
5,0
23,7
49
8,5
38,5
69
4,5
09,8
26
Ti
tling
Tax
-Mob
ile H
ome
10,
858
4
,704
8
,051
5
,817
6
,132
9
,083
8
,266
9
,474
1
4,58
3
9,2
67
St
ate
Rec
orda
tion
759
,637
6
81,0
49
656
,449
7
31,9
56
872
,407
6
61,2
91
1,1
56,5
43
942
,127
1
,001
,665
1
,058
,973
Prop
erty
Ren
tal 1
%
101
,748
1
09,8
71
131
,021
1
39,7
96
133
,774
8
2,38
8
79,
202
1
54,1
15
122
,066
1
71,1
68
Vehi
cle
Ren
tal T
ax
424
,599
5
79,6
54
1,1
49,0
88
371
,425
8
55,5
82
937
,779
1
,067
,535
8
45,6
52
905
,346
1
,204
,155
Rol
ling
Stoc
k Ta
x -
-
-
-
-
-
-
-
-
-
Tele
phon
e C
omm
issi
ons
450
,000
3
90,7
39
338
,499
3
37,3
49
522
,578
5
38,4
74
628
,014
1
96,5
79
198
,990
2
10,7
93
In
terg
over
nmen
tal R
even
ue N
ot R
estri
cted
to S
peci
fic P
rogr
ams
156
,211
-
-
-
-
-
-
-
-
-
Inve
stm
ent E
arni
ngs
105
,672
1
65,1
11
125
,526
8
0,85
4
36,
020
3
8,34
4
53,
281
1
14,1
58
221
,163
8
29,7
19
M
isce
llane
ous
225
,661
1
,143
,368
1
,963
,714
2
,823
,922
1
,607
,458
1
5,73
9,41
2
19,
083,
117
2
0,03
4,98
5
18,
452,
974
2
7,25
7,14
4
Tr
ansf
ers
22,
340,
631
2
1,45
9,31
9
23,
147,
547
2
3,61
2,45
3
27,
377,
577
2
8,08
0,61
7
32,
669,
758
3
3,90
8,41
9
30,
764,
389
2
6,92
8,46
3
Sp
ecia
l Ite
m
-
-
-
485
,000
-
1,5
00, 0
00 -
2,2
15,8
26 2
,720
,280
2
,220
,055
Extra
ordi
nary
Item
1
5,35
2
- (1
,320
,829
) -
-
-
-
-
-
-
To
tal G
over
nmen
tal A
ctiv
ities
4
55,8
29,4
21
451
,297
,670
4
50,7
88,9
61
465
,575
,039
4
55,6
90,1
81
495
,768
,705
5
12,8
91,8
32
541
,510
,031
5
22,6
07,6
29
577
,842
,079
Busi
ness
-type
Act
iviti
es:
In
vest
men
t Ear
ning
s $
1
,060
,118
$
8
97,5
30
$
1,7
38,6
23
$
685
,839
$
8
11,0
70
$
675
,983
$
6
95,1
17
$
1,9
37,9
72
$
4,2
97,4
91
$
7,2
14,0
06
M
isce
llane
ous
1,6
94,5
80
1,1
63,4
41
1,5
80,0
41
1,2
71,7
07
(4,8
02,2
22)
643
,748
9
22,4
73
1,0
19,3
26
102
,671
5
,207
,384
Tr
ansf
ers
(22,
340,
631)
(21,
459,
319)
(23,
147,
547)
(23,
612,
453)
(2
7,37
7,57
7)
(2
8,08
0,61
7)
(3
2,66
9,75
8)
(3
3,55
1,05
0)
(3
0,76
4,38
9)
(2
6,92
8,46
3)
Tota
l Bus
ines
s-ty
pe A
ctiv
ities
(1
9,58
5,93
3)
(19,
398,
348)
(1
9,82
8,88
3)
(2
1,65
4,90
7)
(3
1,36
8,72
9)
(2
6,76
0,88
6)
(3
1,05
2,16
8)
(3
0,59
3,75
2)
(2
6,36
4,22
7)
(1
4,50
7,07
3)
Tota
l Prim
ary
Gov
ernm
ent
$
436
,243
,488
$
4
31,8
99,3
22
$
430
,960
,078
$
4
43,9
20,1
32
$
424
,321
,452
$
4
69,0
07,8
19
$
481
,839
,664
$
5
10,9
16,2
79
$
496
,243
,402
$
5
63,3
35,0
06
Cha
nge
in N
et P
ositi
on
Gov
ernm
enta
l Act
iviti
es
$
(49,
503,
288)
$
7
1,33
6,78
4
$
71,
845,
493
$
(4
,538
,541
) $
(2
75,6
57,7
61)
$
(62,
790,
062)
$
3
8,49
2,17
8
$
77,
540,
687
$
2
6,21
5,57
0
$
72,
160,
574
Bu
sine
ss-ty
pe A
ctiv
ities
1
9,69
3,27
8
1
8,65
2,32
7
2
4,18
9,21
5
4
6,59
8,17
7
(6
44,7
71,5
77)
4
2,55
0,45
3
3
1,04
6,73
4
4
0,67
2,68
3
4
8,40
9,11
0
6
9,72
5,67
7
To
tal P
rimar
y G
over
nmen
t $
(2
9,81
0,01
0)
$
89,
989,
111
$
9
6,03
4,70
8
$
42,
059,
636
$
(9
20,4
29,3
38)
$
(20,
239,
609)
$
6
9,53
8,91
2
$
118
,213
,370
$
7
4,62
4,68
0
$
141
,886
,251
Spec
ial I
tem
:Fi
scal
Yea
r 201
3 - G
ain
on S
ale
of L
and
Fisc
al Y
ear 2
015
- Bar
gain
Pur
chas
e of
Pro
perty
-Dia
mon
d
Not
e: T
he c
hang
es in
net
pos
ition
for b
oth
Gov
ernm
enta
l and
Bus
ines
s -ty
pe a
ctiv
ities
are
exp
lain
ed in
the
Man
agem
ent's
Dis
cuss
ion
and
Anal
ysis
Sec
tion
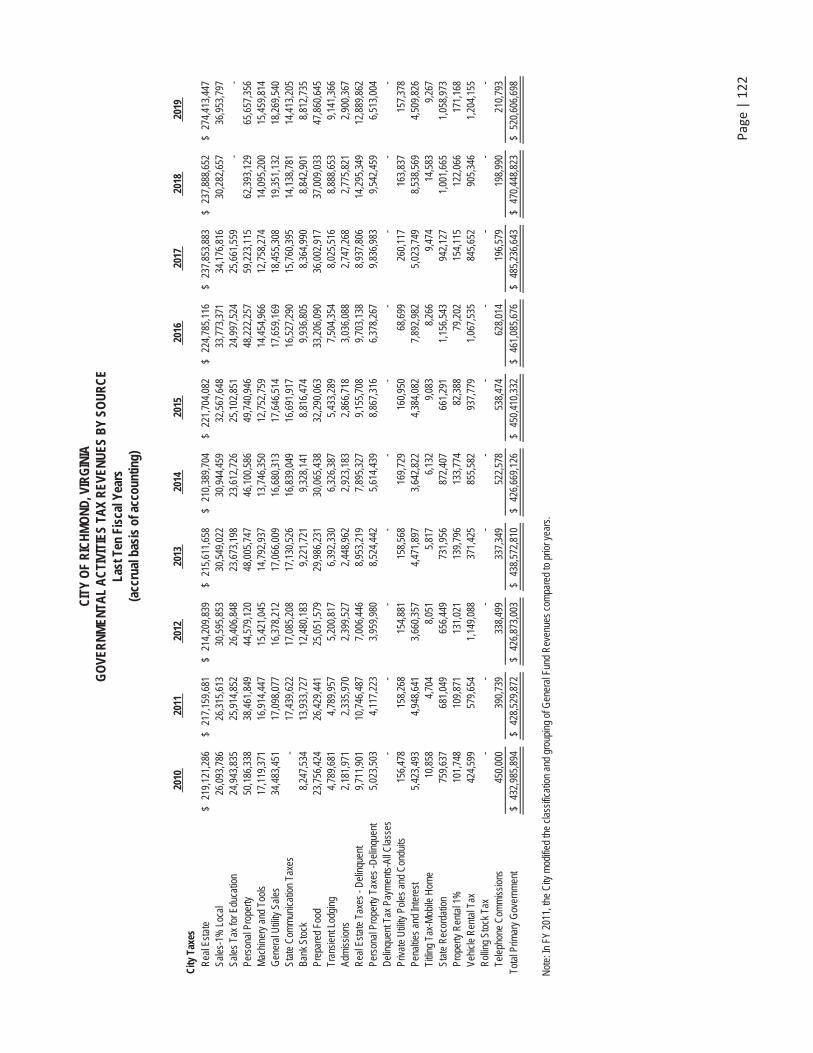
Page
|12
2
CIT
Y O
F R
ICH
MO
ND
, VIR
GIN
IA
GO
VER
NM
ENTA
L A
CTI
VITI
ES T
AX
REV
ENU
ES B
Y SO
UR
CE
Last
Ten
Fis
cal Y
ears
(a
ccru
al b
asis
of a
ccou
ntin
g)
201
0 2
011
201
2 2
013
201
4 2
015
201
6 2
017
201
8 2
019
City
Tax
es
R
eal E
stat
e $
21
9,12
1,28
6
$
217,
159,
681
$
21
4,20
9,83
9
$
215,
611,
658
$
21
0,38
9,70
4
$
221,
704,
082
$
22
4,78
5,11
6
$
237,
853,
883
$
23
7,88
8,65
2
$ 2
74,4
13,4
47
Sa
les-
1% L
ocal
2
6,09
3,78
6
26,
315,
613
3
0,59
5,85
3
30,
549,
022
3
0,94
4,45
9
32,
567,
648
3
3,77
3,37
1
34,
176,
816
3
0,28
2,65
7
36,
953,
797
Sale
s Ta
x fo
r Edu
catio
n 2
4,94
3,83
5
25,
914,
852
2
6,40
6,84
8
23,
673,
198
2
3,61
2,72
6
25,
102,
851
2
4,99
7,52
4
25,
661,
559
-
-
Pers
onal
Pro
perty
5
0,18
6,33
8
38,
461,
849
4
4,57
9,12
0
48,
005,
747
4
6,10
0,58
6
49,
740,
946
4
8,22
2,25
7
59,
223,
115
6
2,39
3,12
9
65,
657,
356
Mac
hine
ry a
nd T
ools
1
7,11
9,37
1
16,
914,
447
1
5,42
1,04
5
14,
792,
937
1
3,74
6,35
0
12,
752,
759
1
4,45
4,96
6
12,
758,
274
1
4,09
5,20
0
15,
459,
814
Gen
eral
Util
ity S
ales
3
4,48
3,45
1
17,
098,
077
1
6,37
8,21
2
17,
066,
009
1
6,68
0,31
3
17,
646,
514
1
7,65
9,16
9
18,
455,
308
1
9,35
1,13
2
18,
269,
540
Stat
e C
omm
unic
atio
n Ta
xes
- 1
7,43
9,62
2 1
7,08
5,20
8
17,
130,
526
1
6,83
9,04
9
16,
691,
917
1
6,52
7,29
0
15,
760,
395
1
4,13
8,78
1
14,
413,
205
Bank
Sto
ck
8,2
47,5
34
13,
933,
727
12,
480,
183
9
,221
,721
9
,328
,141
8
,816
,474
9
,936
,805
8
,364
,990
8
,842
,901
8
,812
,735
Prep
ared
Foo
d 2
3,75
6,42
4
26,
429,
441
25,
051,
579
2
9,98
6,23
1
30,
065,
438
3
2,29
0,06
3
33,
206,
090
3
6,00
2,91
7
37,
009,
033
4
7,86
0,64
5
Tr
ansi
ent L
odgi
ng
4,7
89,6
81
4,7
89,9
57 5
,200
,817
6
,392
,330
6
,326
,387
5
,433
,289
7
,504
,354
8
,025
,516
8
,888
,653
9
,141
,366
Adm
issi
ons
2,1
81,9
71
2,3
35,9
70 2
,399
,527
2
,448
,962
2
,923
,183
2
,866
,718
3
,036
,088
2
,747
,268
2
,775
,821
2
,900
,367
Rea
l Est
ate
Taxe
s - D
elin
quen
t 9
,711
,901
1
0,74
6,48
7 7
,006
,446
8
,953
,219
7
,895
,327
9
,155
,708
9
,703
,138
8
,937
,806
1
4,29
5,34
9
12,
889,
862
Pers
onal
Pro
perty
Tax
es -D
elin
quen
t 5
,023
,503
4
,117
,223
3,9
59,9
80
8,5
24,4
42
5,6
14,4
39
8,8
67,3
16
6,3
78,2
67
9,8
36,9
83
9,5
42,4
59
6,5
13,0
04
D
elin
quen
t Tax
Pay
men
ts-A
ll C
lass
es
-
-
-
-
-
-
-
-
-
-
Pr
ivat
e U
tility
Pol
es a
nd C
ondu
its
156
,478
1
58,2
68
154
,881
1
58,5
68
169
,729
1
60,9
50
68,
699
2
60,1
17
163
,837
1
57,3
78
Pe
nalti
es a
nd In
tere
st
5,4
23,4
93
4,9
48,6
41
3,6
60,3
57
4,4
71,8
97
3,6
42,8
22
4,3
84,0
82
7,8
92,9
82
5,0
23,7
49
8,5
38,5
69
4,5
09,8
26
Ti
tling
Tax
-Mob
ile H
ome
10,
858
4
,704
8
,051
5
,817
6
,132
9
,083
8
,266
9
,474
1
4,58
3
9,2
67
St
ate
Rec
orda
tion
759
,637
6
81,0
49
656
,449
7
31,9
56
872
,407
6
61,2
91
1,1
56,5
43
942
,127
1
,001
,665
1
,058
,973
Prop
erty
Ren
tal 1
%
101
,748
1
09,8
71
131
,021
1
39,7
96
133
,774
8
2,38
8
79,
202
1
54,1
15
122
,066
1
71,1
68
Vehi
cle
Ren
tal T
ax
424
,599
5
79,6
54
1,1
49,0
88
371
,425
8
55,5
82
937
,779
1
,067
,535
8
45,6
52
905
,346
1
,204
,155
Rol
ling
Stoc
k Ta
x -
-
-
-
-
-
-
-
-
-
Tele
phon
e C
omm
issi
ons
450
,000
3
90,7
39
338
,499
3
37,3
49
522
,578
5
38,4
74
628
,014
1
96,5
79
198
,990
2
10,7
93
Tota
l Prim
ary
Gov
ernm
ent
$
432,
985,
894
$
42
8,52
9,87
2
$
426,
873,
003
$
43
8,57
2,81
0
$
426,
669,
126
$
45
0,41
0,3 3
2
$
461,
085,
676
$
48
5,23
6,64
3
$
470,
448,
823
$
520
,606
,698
Not
e: In
FY
2011
, the
City
mod
ified
the
clas
sific
atio
n an
d gr
oupi
ng o
f Gen
eral
Fun
d R
even
ues
com
pare
d to
prio
r yea
rs.
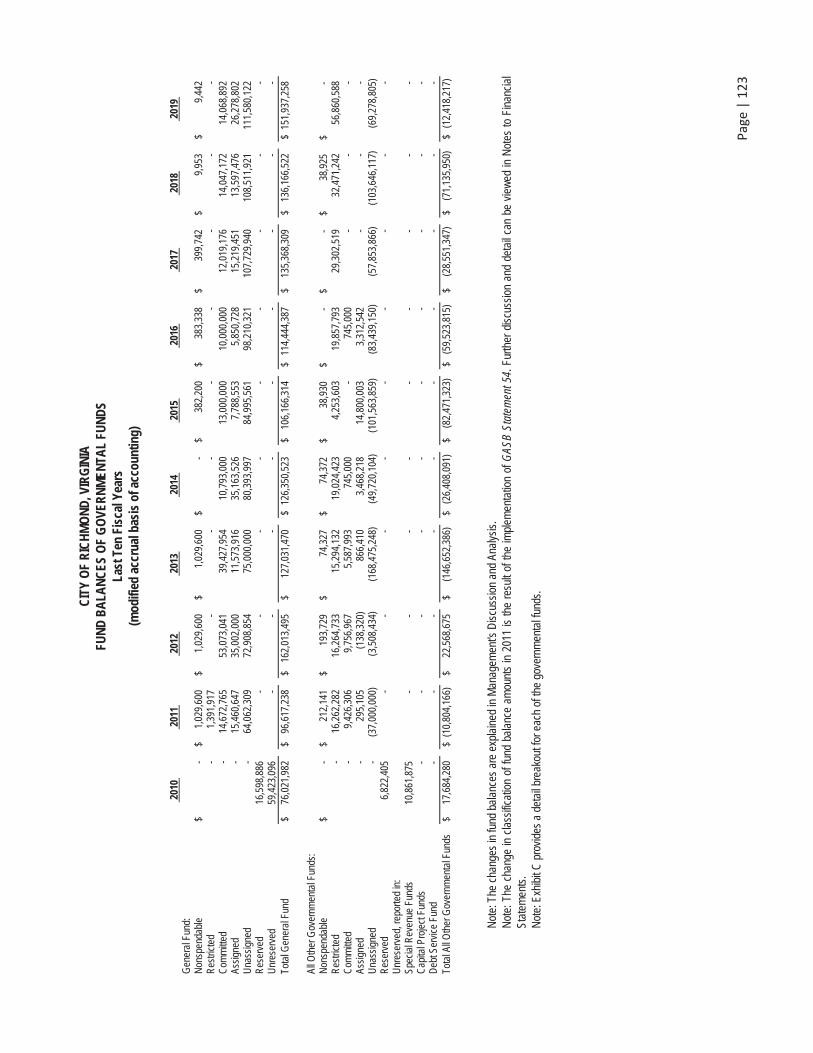
Page
|12
3
CIT
Y O
F R
ICH
MO
ND
, VIR
GIN
IA
FUN
D B
ALA
NC
ES O
F G
OVE
RN
MEN
TAL
FUN
DS
Last
Ten
Fis
cal Y
ears
(m
odifi
ed a
ccru
al b
asis
of a
ccou
ntin
g)
201
0 2
011
201
2 2
013
201
4 2
015
201
6 2
017
201
8 2
019
Gen
eral
Fun
d:
Non
spen
dabl
e $
-
$
1,0
29,6
00
$
1,0
29,6
00
$
1,0
29,6
00
$
- $
3
82,2
00
$
383
,338
$
3
99,7
42
$
9,9
53
$
9,4
42
Res
trict
ed
- 1
,391
, 917
-
-
- -
-
-
-
-
C
omm
itted
-
14,
672,
765
53,
073,
041
3
9,42
7,95
4
10,
793,
000
1
3,00
0,00
0
10,
000,
000
1
2,01
9,17
6
14,
047,
172
1
4,06
8,89
2
Assi
gned
-
15,
460,
647
35,
002,
000
1
1,57
3,91
6
35,
163,
526
7
,788
,553
5
,850
,728
1
5,21
9,45
1
13,
597,
476
2
6,27
8,80
2U
nass
igne
d -
64,
062,
309
72,
908,
854
7
5,00
0,00
0
80,
393,
997
8
4,99
5,56
1
98,
210,
321
1
07,7
29,9
40
108
,511
,921
1
11,5
80,1
22
Res
erve
d 1
6,59
8,88
6
-
-
-
-
-
-
-
-
-
Unr
eser
ved
59,
423,
096
-
-
-
-
-
-
-
-
-
To
tal G
ener
al F
und
$
76,
021,
982
$
96
,617
,238
$
16
2,01
3,49
5
$
127
,031
,470
$
126
,350
,523
$
10
6,16
6,31
4
$
114,
444,
387
$
1
35,3
68,3
09
$
136,
166,
522
$
151
,937
,258
All O
ther
Gov
ernm
enta
l Fun
ds:
Non
spen
dabl
e $
-
$
212
,141
$
1
93,7
29
$
74,
327
$
7
4,37
2
$
38,
930
$
-
$
- $
3
8,92
5
$
-
Res
trict
ed
- 1
6,26
2,28
2 1
6,26
4,73
3
15,
294,
132
1
9,02
4,42
3
4,2
53,6
03
19,
857,
793
2
9,30
2,51
9
32,
471,
242
5
6,86
0,58
8
Com
mitt
ed
- 9
,426
,306
9,7
56,9
67
5,5
87,9
93
745
,000
-
745
,000
-
-
-
Assi
gned
-
295
,105
(138
,320
) 8
66,4
10
3,4
68,2
18
14,
800,
003
3
,312
,542
-
-
-
Una
ssig
ned
-(3
7,00
0,00
0)(3
,508
,434
)
(168
,475
,248
) (4
9,72
0,10
4)
(1
01,5
63,8
59)
(8
3,43
9,15
0)
(5
7,85
3,86
6)
(1
03,6
46,1
17)
(6
9,27
8,80
5)
Res
erve
d 6
,822
,405
-
-
-
-
-
-
-
-
-
U
nres
erve
d, re
porte
d in
: Sp
ecia
l Rev
enue
Fun
ds
10,
861,
875
-
-
-
-
-
-
-
-
-
C
apita
l Pro
ject
Fun
ds
-
-
-
-
-
-
-
-
-
-
Deb
t Ser
vice
Fun
d -
-
-
-
-
-
-
-
-
-
To
tal A
ll O
ther
Gov
ernm
enta
l Fun
ds
$
17,
684,
280
$
(10
,804
,166
) $
2
2,56
8,67
5
$
(146
,652
,386
) $
(2
6,40
8,09
1)
$
(82,
471,
323)
$
(5
9,52
3,81
5)
$
(28,
551,
347)
$
(7
1,13
5,95
0)
$
(12,
418,
217)
Not
e: T
he c
hang
es in
fund
bal
ance
s ar
e ex
plai
ned
in M
anag
emen
t's D
iscu
ssio
n an
d An
alys
is.
Not
e: T
he c
hang
e in
cla
ssifi
catio
n of
fund
bal
ance
am
ount
s in
201
1 is
the
resu
lt of
the
impl
emen
tatio
n of
GAS
B St
atem
ent 5
4. F
urth
er d
iscu
ssio
n an
d de
tail
can
be v
iew
ed in
Not
es to
Fin
anci
al
Stat
emen
ts.
Not
e: E
xhib
it C
pro
vide
s a
deta
il br
eako
ut fo
r eac
h of
the
gove
rnm
enta
l fun
ds.
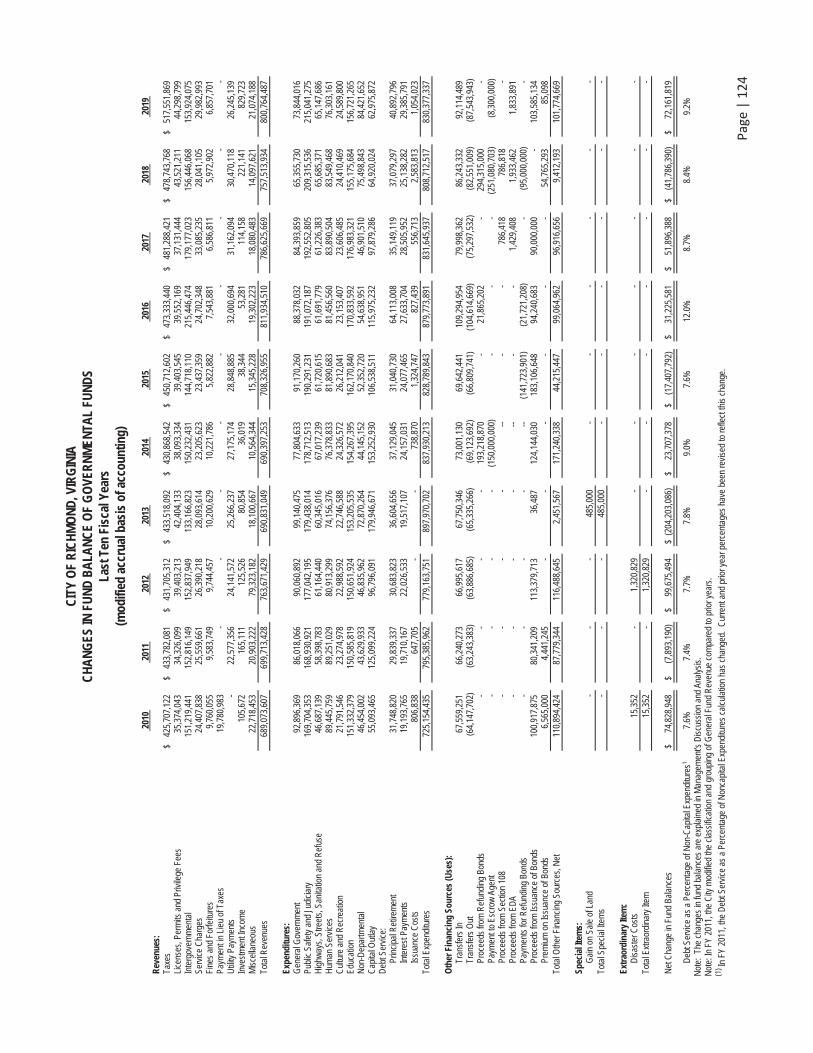
Page
|12
4
CIT
Y O
F R
ICH
MO
ND
, VIR
GIN
IA
CH
AN
GES
IN F
UN
D B
ALA
NC
E O
F G
OVE
RN
MEN
TAL
FUN
DS
Last
Ten
Fis
cal Y
ears
(m
odifi
ed a
ccru
al b
asis
of a
ccou
ntin
g)
201
0 2
011
201
2 2
013
201
4 2
015
201
6 2
017
201
8 2
019
Rev
enue
s:
Taxe
s $
42
5,70
7,12
2
$
433,
782,
081
$
43
1,70
5,31
2
$
433,
518,
092
$
43
0,86
8,54
2
$
450,
712,
602
$
47
3,33
3,44
0
$
481,
288,
421
$
47
8,74
3,76
8
$
517,
551,
869
Li
cens
es, P
erm
its a
nd P
rivile
ge F
ees
35,
374,
043
3
4,32
6,09
9
39,
403,
213
4
2,40
4,13
3
38,
093,
334
3
9,40
3,54
5
39,
552,
169
3
7,13
1,44
4
43,
521,
211
4
4,29
8,79
9
Inte
rgov
ernm
enta
l 1
51,2
19,4
41
152
,816
,149
1
52,8
37,9
49
133
,166
,823
1
50,2
32,4
31
144
,718
,110
2
15,4
46,4
74
179
,177
,023
1
56,4
46,0
68
153
,924
,075
Se
rvic
e C
harg
es
24,
407,
838
2
5,55
9,66
1
26,
390,
218
2
8,09
3,61
4
23,
205,
623
2
3,43
7,35
9
24,
702,
348
3
3,08
5,23
5
28,
041,
105
2
9,98
2,99
3
Fine
s an
d Fo
rfeitu
res
9,7
60,0
55
9,5
83,7
49
9,7
44,4
57
10,
200,
629
1
0,22
1,78
6
5,8
22,8
82
7,5
43,8
81
6,5
86,8
11
5,9
72,9
02
6,8
57,7
01
Paym
ent i
n Li
eu o
f Tax
es
19,
780,
983
-
-
-
-
-
-
-
-
-
U
tility
Pay
men
ts
- 2
2,57
7,35
6 2
4,14
1,57
2
25,
266,
237
2
7,17
5,17
4
28,
848,
885
3
2,00
0,69
4
31,
162,
094
3
0,47
0,11
8
26,
245,
139
In
vest
men
t Inc
ome
105
,672
1
65,1
11 1
25,5
26
80,
854
3
6,01
9
38,
344
5
3,28
1
114
,158
2
21,1
41
829
,723
M
isce
llane
ous
22,
718,
453
2
0,90
3,22
2 7
9,32
3,18
2
18,
100,
667
1
0,56
4,34
4
15,
345,
228
1
9,30
2,22
3
18,
080,
483
1
4,09
7,62
1
21,
074,
188
To
tal R
even
ues
689
,073
,607
6
99,7
13,4
28
763
,671
,429
6
90,8
31,0
49
690
,397
,253
7
08,3
26,9
55
811
,934
,510
7
86,6
25,6
69
757
,513
,934
8
00,7
64,4
87
Expe
nditu
res:
G
ener
al G
over
nmen
t 9
2,89
6,36
9
86,
018,
066
9
0,06
0,89
2
99,
140,
475
7
7,80
4,63
3
91,
170,
260
8
8,37
8,03
2
84,
393,
859
6
5,35
5,73
0
73,
844,
016
Pu
blic
Saf
ety
and
Judi
ciar
y 1
69,7
04,3
53
168
,930
,921
1
77,0
42,1
95
179
,438
,014
1
78,7
12,5
13
190
,291
,231
1
91,0
72,1
87
192
,552
,805
2
09,3
15,5
36
215
,041
,275
H
ighw
ays,
Stre
ets,
San
itatio
n an
d R
efus
e 4
6,68
7,13
9
58,
398,
783
6
1,16
4,44
0
60,
345,
016
6
7,01
7,23
9
61,
720,
615
6
1,69
1,77
9
61,
226,
383
6
5,68
5,37
1
65,
147,
686
H
uman
Ser
vice
s 8
9,44
5,75
9
89,
251,
029
8
0,91
3,29
9
74,
156,
376
7
6,37
8,83
3
81,
890,
683
8
1,45
6,56
0
83,
890,
504
8
3,54
9,46
8
76,
303,
161
C
ultu
re a
nd R
ecre
atio
n 2
1,79
1,54
6
23,
274,
978
2
2,98
8,59
2
22,
746,
588
2
4,32
6,57
2
26,
212,
041
2
3,15
3,40
7
23,
606,
485
2
4,41
0,46
9
24,
589,
800
Ed
ucat
ion
151
,332
,379
1
50,5
85,8
19
150
,651
,924
1
53,2
05,5
35
154
,267
,395
1
62,1
70,8
40
170
,833
,592
1
76,9
83,3
21
155
,175
,684
1
56,7
21,2
65
Non
-Dep
artm
enta
l 4
6,45
4,00
2
43,
629,
933
4
6,83
5,96
2
72,
870,
264
4
4,14
5,15
2
52,
352,
720
5
4,63
8,95
1
46,
901,
510
7
5,49
8,84
3
84,
421,
652
C
apita
l Out
lay
55,
093,
465
1
25,0
99,2
24
96,
796,
091
1
79,9
46,6
71
153
,252
,930
1
06,5
38,5
11
115
,975
,232
9
7,87
9,28
6
64,
920,
024
6
2,97
5,87
2
Deb
t Ser
vice
: P
rinci
pal R
etire
men
t 3
1,74
8,82
0
29,
839,
337
3
0,68
3,82
3
36,
604,
656
3
7,12
9,04
5
31,
040,
730
6
4,11
3,00
8
35,
149,
119
3
7,07
9,29
7
40,
892,
796
I
nter
est P
aym
ents
1
9,19
3,76
5
19,
710,
167
2
2,02
6,53
3
19,
517,
107
2
4,15
7,03
1
24,
077,
465
2
7,63
3,70
4
28,
505,
952
2
5,13
8,28
2
29,
385,
791
I
ssua
nce
Cos
ts
806
,838
6
47,7
05
-
-
738
,870
1
,324
,747
8
27,4
39
556
,713
2
,583
,813
1
,054
,023
To
tal E
xpen
ditu
res
725
,154
,435
7
95,3
85,9
62
779
,163
,751
8
97,9
70,7
02
837
,930
,213
8
28,7
89,8
43
879
,773
,891
8
31,6
45,9
37
808
,712
,517
8
30,3
77,3
37
Oth
er F
inan
cing
Sou
rces
(Use
s):
Tra
nsfe
rs In
6
7,55
9,25
1
66,
240,
273
6
6,99
5,61
7
67,
750,
346
7
3,00
1,13
0
69,
642,
441
1
09,2
94,9
54
79,
998,
362
8
6,24
3,33
2
92,
114,
489
T
rans
fers
Out
(6
4,14
7,70
2)
(63,
243,
383)
(6
3,88
6,68
5)
(65,
335,
266)
(69,
123,
692)
(66,
809,
741)
(104
,614
,669
)
(75,
297,
532)
(82,
551,
009)
(87,
543,
943)
P
roce
eds
from
Ref
undi
ng B
onds
-
-
-
-
1
93,2
18,8
70
- 2
1,86
5,20
2 -
294
,315
,000
-
Pay
men
t to
Escr
ow A
gent
-
-
-
-
(150
,000
,000
)
--
-
(2
51,0
80,7
03)
(8
,300
,000
) P
roce
eds
from
Sec
tion
108
-
-
-
-
--
- -
786
,418
7
86,8
18
-
Pro
ceed
s fro
m E
DA
-
-
-
-
--
- -
1,4
29,4
08
1,9
33,4
62
1,8
33,8
91
Pay
men
ts fo
r Ref
undi
ng B
onds
-
-
-
-
--
(1
41,7
23,9
01)
(21,
721,
208)
-
(95,
000,
000)
-
Pro
ceed
s fro
m Is
suan
ce o
f Bon
ds
100
,917
,875
8
0,34
1,20
9
113
,379
,713
3
6,48
7
124
,144
,030
1
83,1
06,6
48
94,
240,
683
9
0,00
0,00
0
- 1
03,5
85, 1
34 P
rem
ium
on
Issu
ance
of B
onds
6
,565
,000
4
,441
,245
-
-
-
-
-
-
5
4,76
5,29
3 8
5,09
8
Tota
l Oth
er F
inan
cing
Sou
rces
, Net
1
10,8
94,4
24
87,
779,
344
1
16,4
88,6
45
2,4
51,5
67
171
,240
,338
4
4,21
5,44
7
99,
064,
962
9
6,91
6,65
6
9,4
12,1
93
101
,774
,669
Spec
ial I
tem
s:
G
ain
on S
ale
of L
and
-
-
-
485
,000
-
-
-
-
-
-
To
tal S
peci
al It
ems
-
-
-
485
,000
-
-
-
-
-
-
Extr
aord
inar
y Ite
m:
D
isas
ter C
osts
1
5,35
2
- 1
,320
,829
-
-
-
-
-
-
-
Tota
l Ext
raor
dina
ry It
em
15,
352
-
1,3
20, 8
29 -
-
-
-
-
-
-
Net
Cha
nge
in F
und
Bala
nces
$
7
4,82
8,94
8
$
(7,8
93,1
90)
$
99,
675,
494
$
(20
4,20
3,08
6)
$
23,
707,
378
$
(1
7,40
7,79
2)
$
31,
225,
581
$
5
1,89
6,38
8
$
(41,
786,
390)
$
7
2,16
1,81
9
D
ebt S
ervi
ce a
s a
Perc
enta
ge o
f Non
-Cap
ital E
xpen
ditu
res1
7.6%
7.4%
7.7%
7.8%
9.0%
7.6%
12.0
%
8.
7%8.
4%9.
2%N
ote:
The
cha
nges
in fu
nd b
alan
ces
are
expl
aine
d in
Man
agem
ent's
Dis
cuss
ion
and
Anal
ysis
. N
ote:
In F
Y 20
11, t
he C
ity m
odifi
ed th
e cl
assi
ficat
ion
and
grou
ping
of G
ener
al F
und
Rev
enue
com
pare
d to
prio
r yea
rs.
(1) In
FY
2011
, the
Deb
t Ser
vice
as
a Pe
rcen
tage
of N
onca
pita
l Exp
endi
ture
s ca
lcul
atio
n ha
s ch
ange
d. C
urre
nt a
nd p
rior y
ear p
erce
ntag
es h
ave
been
revi
sed
to re
flect
this
cha
nge.
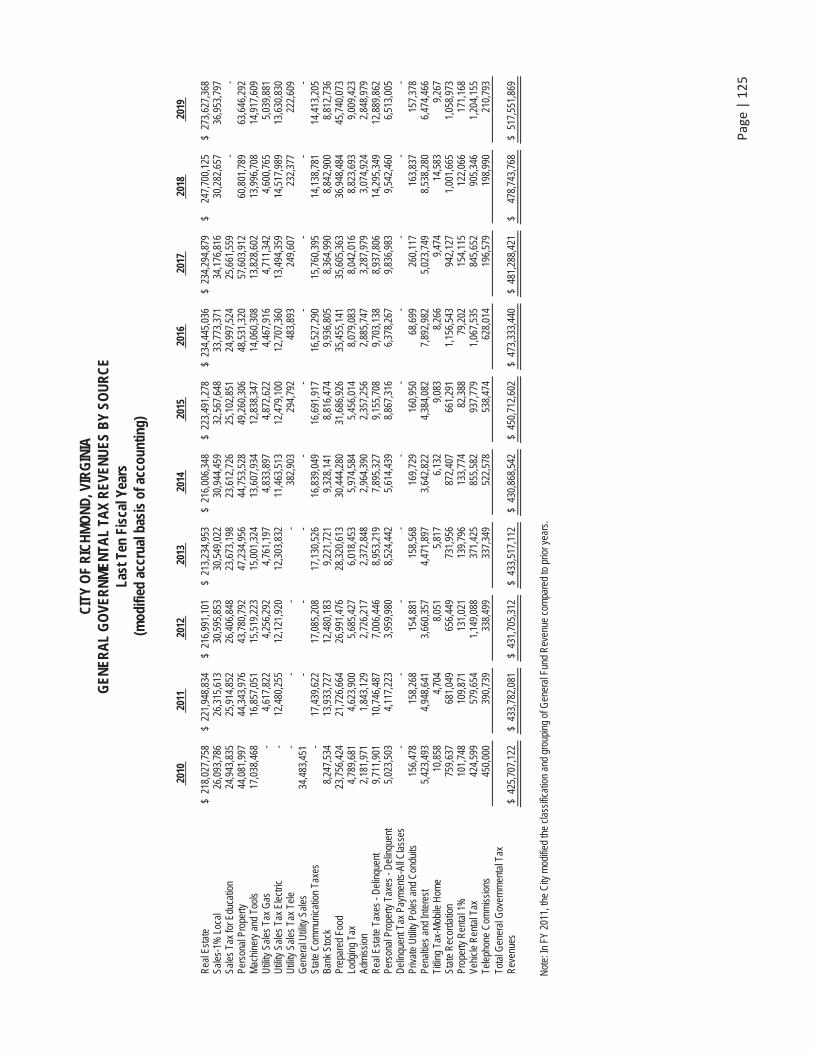
Page
|12
5
CIT
Y O
F R
ICH
MO
ND
, VIR
GIN
IA
GEN
ERA
L G
OVE
RN
MEN
TAL
TAX
REV
ENU
ES B
Y SO
UR
CE
Last
Ten
Fis
cal Y
ears
(m
odifi
ed a
ccru
al b
asis
of a
ccou
ntin
g)
201
0 2
011
201
2 2
013
201
4 2
015
201
6 2
017
201
8 2
019
Rea
l Est
ate
$ 2
18,0
27,7
58
$ 2
21,9
48,8
34
$ 2
16,9
91,1
01
$ 2
13,2
34,9
53
$ 2
16,0
06,3
48
$ 2
23,4
91,2
78
$ 2
34,4
45,0
36
$ 2
34,2
94,8
79
$
247
,700
,125
$
273
,627
,368
Sa
les-
1% L
ocal
2
6,09
3,78
6
26,
315,
613
3
0,59
5,85
3
30,
549,
022
3
0,94
4,45
9
32,
567,
648
3
3,77
3,37
1
34,
176,
816
3
0,28
2,65
7
36,
953,
797
Sa
les
Tax
for E
duca
tion
24,
943,
835
2
5,91
4,85
2
26,
406,
848
2
3,67
3,19
8
23,
612,
726
2
5,10
2,85
1
24,
997,
524
2
5,66
1,55
9
-
-
Pers
onal
Pro
perty
4
4,08
1,99
7
44,
343,
976
4
3,78
0,79
2
47,
234,
956
4
4,75
3,52
8
49,
260,
306
4
8,53
1,32
0
57,
603,
912
6
0,80
1,78
9
63,
646,
292
M
achi
nery
and
Too
ls
17,
038,
468
1
6,85
7,05
1
15,
519,
223
1
5,00
1,32
4
13,
607,
934
1
2,83
8,34
7
14,
060,
308
1
3,82
8,60
2
13,
996,
708
1
4,91
7,60
9
Util
ity S
ales
Tax
Gas
-
4,6
17, 8
22 4
,256
,292
4
,761
,197
4
,833
,897
4
,872
,622
4
,467
,916
4
,711
,342
4
,600
,765
5
,039
,881
U
tility
Sal
es T
ax E
lect
ric
- 1
2,48
0,25
5 1
2,12
1,92
0
12,
303,
832
1
1,46
3,51
3
12,
479,
100
1
2,70
7,36
0
13,
494,
359
1
4,51
7,98
9
13,
630,
830
U
tility
Sal
es T
ax T
ele
- -
-
-
382
,903
2
94,7
92
483
,893
2
49,6
07
232
,377
2
22,6
09
Gen
eral
Util
ity S
ales
3
4,48
3,45
1
-
-
-
-
-
-
-
-
-
Stat
e C
omm
unic
atio
n Ta
xes
- 1
7,43
9,62
2 1
7,08
5,20
8
17,
130,
526
1
6,83
9,04
9
16,
691,
917
1
6,52
7,29
0
15,
760,
395
1
4,13
8,78
1
14,
413,
205
Ba
nk S
tock
8,2
47,5
34
13,
933,
727
12,
480,
183
9
,221
,721
9
,328
,141
8
,816
,474
9
,936
,805
8
,364
,990
8
,842
,900
8
,812
,736
Pr
epar
ed F
ood
23,
756,
424
2
1,72
6,66
4 2
6,99
1,47
6
28,
320,
613
3
0,44
4,28
0
31,
686,
926
3
5,45
5,14
1
35,
605,
363
3
6,94
8,48
4
45,
740,
073
Lo
dgin
g Ta
x 4
,789
,681
4
,623
, 900
5,6
85,4
27
6,0
18,4
53
5,9
74,5
84
5,4
56,0
14
8,0
79,0
83
8,0
42,0
16
8,8
23,6
93
9,0
09,4
23
Adm
issi
on
2,1
81,9
71
1,8
43,1
29 2
,726
,217
2
,372
,848
2
,964
,390
2
,357
,256
2
,885
,747
3
,287
,979
3
,074
,924
2
,848
,979
R
eal E
stat
e Ta
xes
- Del
inqu
ent
9,7
11,9
01
10,
746,
487
7,0
06,4
46
8,9
53,2
19
7,8
95,3
27
9,1
55,7
08
9,7
03,1
38
8,9
37,8
06
14,
295,
349
1
2,88
9,86
2
Pers
onal
Pro
perty
Tax
es -
Del
inqu
ent
5,0
23,5
03
4,1
17, 2
23 3
,959
,980
8
,524
,442
5
,614
,439
8
,867
,316
6
,378
,267
9
,836
,983
9
,542
,460
6
,513
,005
D
elin
quen
t Tax
Pay
men
ts- A
ll C
lass
es
-
-
-
-
-
-
-
-
-
-
Priv
ate
Util
ity P
oles
and
Con
duits
1
56,4
78
158
,268
1
54,8
81
158
,568
1
69,7
29
160
,950
6
8,69
9
260
,117
1
63,8
37
157
,378
Pe
nalti
es a
nd In
tere
st
5,4
23,4
93
4,9
48,6
41
3,6
60,3
57
4,4
71,8
97
3,6
42,8
22
4,3
84,0
82
7,8
92,9
82
5,0
23,7
49
8,5
38,2
80
6,4
74,4
66
Titli
ng T
ax-M
obile
Hom
e 1
0,85
8
4,7
04
8,0
51
5,8
17
6,1
32
9,0
83
8,2
66
9,4
74
14,
583
9
,267
St
ate
Rec
orda
tion
759
,637
6
81,0
49
656
,449
7
31,9
56
872
,407
6
61,2
91
1,1
56,5
43
942
,127
1
,001
,665
1
,058
,973
Pr
oper
ty R
enta
l 1%
1
01,7
48
109
,871
1
31,0
21
139
,796
1
33,7
74
82,
388
7
9,20
2
154
,115
1
22,0
66
171
,168
Ve
hicl
e R
enta
l Tax
4
24,5
99
579
,654
1
,149
,088
3
71,4
25
855
,582
9
37,7
79
1,0
67,5
35
845
,652
9
05,3
46
1,2
04,1
55
Tele
phon
e C
omm
issi
ons
450
,000
3
90,7
39
338
,499
3
37,3
49
522
,578
5
38,4
74
628
,014
1
96,5
79
198
,990
2
10,7
93To
tal G
ener
al G
over
nmen
tal T
ax
Rev
enue
s $
425
,707
,122
$
433
,782
,081
$
431
,705
,312
$
433
,517
,112
$
430
,868
,542
$
450
,712
,602
$
473
,333
,440
$
481
,288
,421
$
4
78,7
43,7
68
$ 5
17,5
51,8
69
Not
e: In
FY
2011
, the
City
mod
ified
the
clas
sific
atio
n an
d gr
oupi
ng o
f Gen
eral
Fun
d R
even
ue c
ompa
red
to p
rior y
ears
.
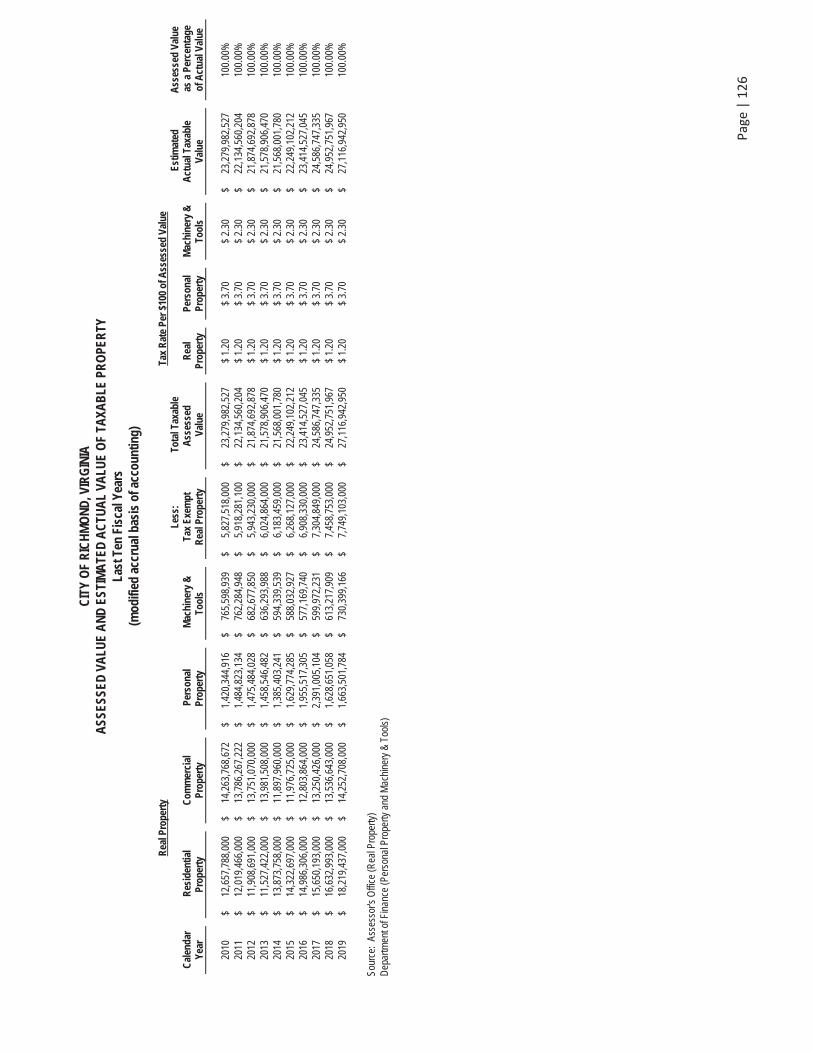
Page
|12
6
CIT
Y O
F R
ICH
MO
ND
, VIR
GIN
IA
ASS
ESSE
D V
ALU
E A
ND
EST
IMA
TED
AC
TUA
L VA
LUE
OF
TAXA
BLE
PR
OPE
RTY
La
st T
en F
isca
l Yea
rs
(mod
ified
acc
rual
bas
is o
f acc
ount
ing)
Rea
lPro
pert
yTa
x R
ate
Per $
100
of A
sses
sed
Valu
e
Cal
enda
r Ye
ar
R
esid
entia
l Pr
oper
ty
Com
mer
cial
Pr
oper
ty
Per
sona
l Pr
oper
ty
Mac
hine
ry &
To
ols
Les
s:
Tax
Exe
mpt
R
eal P
rope
rty
Tot
al T
axab
le
Ass
esse
d V
alue
R
eal
Prop
erty
Pers
onal
Pr
oper
ty
M
achi
nery
&
Tool
s
Est
imat
ed
Act
ual T
axab
le
Valu
e
Ass
esse
d Va
lue
as
a Pe
rcen
tage
of
Act
ual V
alue
201
0
$
12,
657,
788,
000
$
1
4,26
3,76
8,67
2
$
1,4
20,3
44,9
16
$
765
,598
,939
$
5
,827
,518
,000
$
2
3,27
9,98
2,52
7
$ 1
.20
$
3.7
0
$ 2
.30
$
2
3,27
9,98
2,52
7
100.
00%
2
011
$
1
2,01
9,46
6,00
0
$
13,
786,
267,
222
$
1
,484
,823
,134
$
7
62,2
84,9
48
$
5,9
18,2
81,1
00
$
22,
134,
560,
204
$
1.2
0
$ 3
.70
$
2.3
0
$
22,
134,
560,
204
10
0.00
%
201
2
$
11,
908,
691,
000
$
1
3,75
1,07
0,00
0
$
1,4
75,4
84,0
28
$
682
,677
,850
$
5
,943
,230
,000
$
2
1,87
4,69
2,87
8
$ 1
.20
$
3.7
0
$ 2
.30
$
2
1,87
4,69
2,87
8
100.
00%
2
013
$
1
1,52
7,42
2,00
0
$
13,
981,
508,
000
$
1
,458
,546
,482
$
6
36,2
93,9
88
$
6,0
24,8
64,0
00
$
21,
578,
906,
470
$
1.2
0
$ 3
.70
$
2.3
0
$
21,
578,
906,
470
10
0.00
%
201
4
$
13,
873,
758,
000
$
1
1,89
7,96
0,00
0
$
1,3
85,4
03,2
41
$
594
,339
,539
$
6
,183
,459
,000
$
2
1,56
8,00
1,78
0
$ 1
.20
$
3.7
0
$ 2
.30
$
2
1,56
8,00
1,78
0
100.
00%
2
015
$
1
4,32
2,69
7,00
0
$
11,
976,
725,
000
$
1
,629
,774
,285
$
5
88,0
32,9
27
$
6,2
68,1
27,0
00
$
22,
249,
102,
212
$
1.2
0
$ 3
.70
$
2.3
0
$
22,
249,
102,
212
10
0.00
%
201
6
$
14,
986,
306,
000
$
1
2,80
3,86
4,00
0
$
1,9
55,5
17,3
05
$
577
,169
,740
$
6
,908
,330
,000
$
2
3,41
4,52
7,04
5
$ 1
.20
$
3.7
0
$ 2
.30
$
2
3,41
4,52
7,04
5
100.
00%
2
017
$
1
5,65
0,19
3,00
0
$
13,
250,
426,
000
$
2
,391
,005
,104
$
5
99,9
72,2
31
$
7,3
04,8
49,0
00
$
24,
586,
747,
335
$
1.2
0
$ 3
.70
$
2.3
0
$
24,
586,
747,
335
10
0.00
%
201
8
$
16,
632,
993,
000
$
1
3,53
6,64
3,00
0
$
1,6
28,6
51,0
58
$
613
,217
,909
$
7
,458
,753
,000
$
2
4,95
2,75
1,96
7
$ 1
.20
$
3.7
0
$ 2
.30
$
2
4,95
2,75
1,96
7
100.
00%
2
019
$
1
8,21
9,43
7,00
0
$
14,
252,
708,
000
$
1
,663
,501
,784
$
7
30,3
99,1
66
$
7,7
49,1
03,0
00
$
27,
116,
942,
950
$
1.2
0
$ 3
.70
$
2.3
0
$
27,
116,
942,
950
10
0.00
%
Sour
ce:
Asse
ssor
's O
ffice
(Rea
l Pro
perty
) D
epar
tmen
t of F
inan
ce (P
erso
nal P
rope
rty a
nd M
achi
nery
& T
ools
)
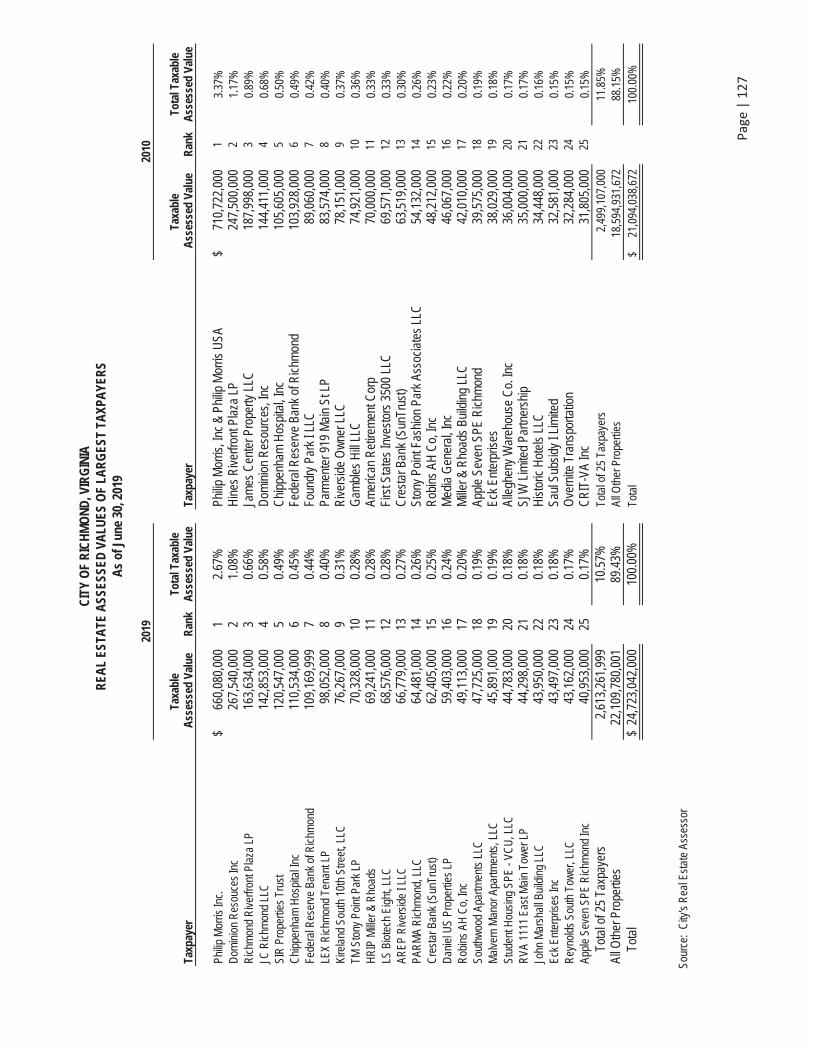
Page
|12
7
CIT
Y O
F R
ICH
MO
ND
, VIR
GIN
IA
REA
L ES
TATE
ASS
ESSE
D V
ALU
ES O
F LA
RG
EST
TAXP
AYE
RS
As
of J
une
30, 2
019
2019
2
010
Taxp
ayer
Ta
xabl
e A
sses
sed
Valu
e R
ank
Tota
l Tax
able
A
sses
sed
Valu
e Ta
xpay
er
Taxa
ble
Ass
esse
d Va
lue
Ran
k To
tal T
axab
le
Ass
esse
d Va
lue
Philip
Mor
ris In
c.
$
660
,080
,000
1
2.
67%
Ph
ilip M
orris
, Inc
& P
hilip
Mor
ris U
SA
$
710
,722
,000
1
3.
37%
D
omin
ion
Res
ouce
s In
c 2
67,5
40,0
00
2
1.08
%
Hin
es R
iver
front
Pla
za L
P 2
47,5
00,0
00 2
1.
17%
R
ichm
ond
Riv
erfro
nt P
laza
LP
163
,634
,000
3
0.
66%
Ja
mes
Cen
ter P
rope
rty L
LC
187
,998
,000
3
0.89
%
JC R
ichm
ond
LLC
1
42,8
53,0
00
4
0.58
%
Dom
inio
n R
esou
rces
, Inc
1
44,4
11,0
00 4
0.
68%
SI
R P
rope
rties
Tru
st
120
,547
,000
5
0.
49%
C
hipp
enha
m H
ospi
tal,
Inc
105
,605
,000
5
0.50
%
Chi
ppen
ham
Hos
pita
l Inc
1
10,5
34,0
00
6
0.45
%
Fede
ral R
eser
ve B
ank
of R
ichm
ond
103
,928
,000
6
0.49
%
Fede
ral R
eser
ve B
ank
of R
ichm
ond
109
,169
,999
7
0.
44%
Fo
undr
y Pa
rk I
LLC
8
9,06
0,00
0 7
0.
42%
LE
X R
ichm
ond
Tena
nt L
P 9
8,05
2,00
0
8
0.40
%
Parm
ente
r 919
Mai
n St
LP
83,
574,
000
8
0.40
%
Kire
land
Sou
th 1
0th
Stre
et, L
LC
76,
267,
000
9
0.
31%
R
iver
side
Ow
ner L
LC
78,
151,
000
9
0.37
%
TM S
tony
Poi
nt P
ark
LP
70,
328,
000
1
0
0.28
%
Gam
bles
Hill
LLC
7
4,92
1,00
0 1
0 0.
36%
H
RIP
Mille
r & R
hoad
s 6
9,24
1,00
0
11
0.
28%
Am
eric
an R
etire
men
t Cor
p 7
0,00
0,00
0 1
1 0.
33%
LS
Bio
tech
Eig
ht, L
LC
68,
576,
000
1
2
0.28
%
Firs
t Sta
tes
Inve
stor
s 35
00 L
LC
69,
571,
000
12
0.33
%
AREP
Riv
ersi
de I
LLC
6
6,77
9,00
0
13
0.
27%
C
rest
ar B
ank
(Sun
Trus
t) 6
3,51
9,00
0 1
3 0.
30%
PA
RM
A R
ichm
ond,
LLC
6
4,48
1,00
0
14
0.
26%
St
ony
Poin
t Fas
hion
Par
k As
soci
ates
LLC
5
4,13
2,00
0 1
4 0.
26%
C
rest
ar B
ank
(Sun
Trus
t) 6
2,40
5,00
0
15
0.
25%
R
obin
s AH
Co,
Inc
48,
212,
000
15
0.23
%
Dan
iel U
S Pr
oper
ties
LP
59,
403,
000
1
6
0.24
%
Med
ia G
ener
al, I
nc
46,
067,
000
16
0.22
%
Rob
ins
AH C
o, In
c 4
9,11
3,00
0
17
0.
20%
M
iller &
Rho
ads
Build
ing
LLC
4
2,01
0,00
0 1
7 0.
20%
So
uthw
ood
Apar
tmen
ts L
LC
47,
725,
000
1
8
0.19
%
Appl
e Se
ven
SPE
Ric
hmon
d 3
9,57
5,00
0 1
8 0.
19%
M
alve
rn M
anor
Apa
rtmen
ts, L
LC
45,
891,
000
1
9
0.19
%
Eck
Ente
rpris
es
38,
029,
000
19
0.18
%
Stud
ent H
ousi
ng S
PE -
VCU
, LLC
4
4,78
3,00
0
20
0.
18%
Al
legh
eny
War
ehou
se C
o. In
c 3
6,00
4,00
0 2
0 0.
17%
R
VA 1
111
East
Mai
n To
wer
LP
44,
298,
000
2
1
0.18
%
SJW
Lim
ited
Partn
ersh
ip
35,
000,
000
21
0.17
%
John
Mar
shal
l Bui
ldin
g LL
C
43,
950,
000
2
2
0.18
%
His
toric
Hot
els
LLC
3
4,44
8,00
0 2
2 0.
16%
Ec
k En
terp
rises
Inc
43,
497,
000
2
3
0.18
%
Saul
Sub
sidy
I Li
mite
d
32,
581,
000
23
0.15
%
Rey
nold
s So
uth
Tow
er, L
LC
43,
162,
000
2
4
0.17
%
Ove
rnite
Tra
nspo
rtatio
n 3
2,28
4,00
0 2
4 0.
15%
Ap
ple
Seve
n SP
E R
ichm
ond
Inc
40,
953,
000
2
5
0.17
%
CR
IT-V
A In
c 3
1,80
5,00
0 2
5 0.
15%
Tot
al o
f 25
Taxp
ayer
s 2
,613
,261
,999
10
.57%
To
tal o
f 25
Taxp
ayer
s 2
,499
,107
,000
11
.85%
Al
l Oth
er P
rope
rties
2
2,10
9,78
0,00
1
89.4
3%
All O
ther
Pro
perti
es
18,
594,
931,
672
88.1
5%
T
otal
$
24,
723,
042,
000
10
0.00
%
Tota
l $
2
1,09
4,03
8,67
2 10
0.00
%
Sour
ce:
City
's R
eal E
stat
e As
sess
or
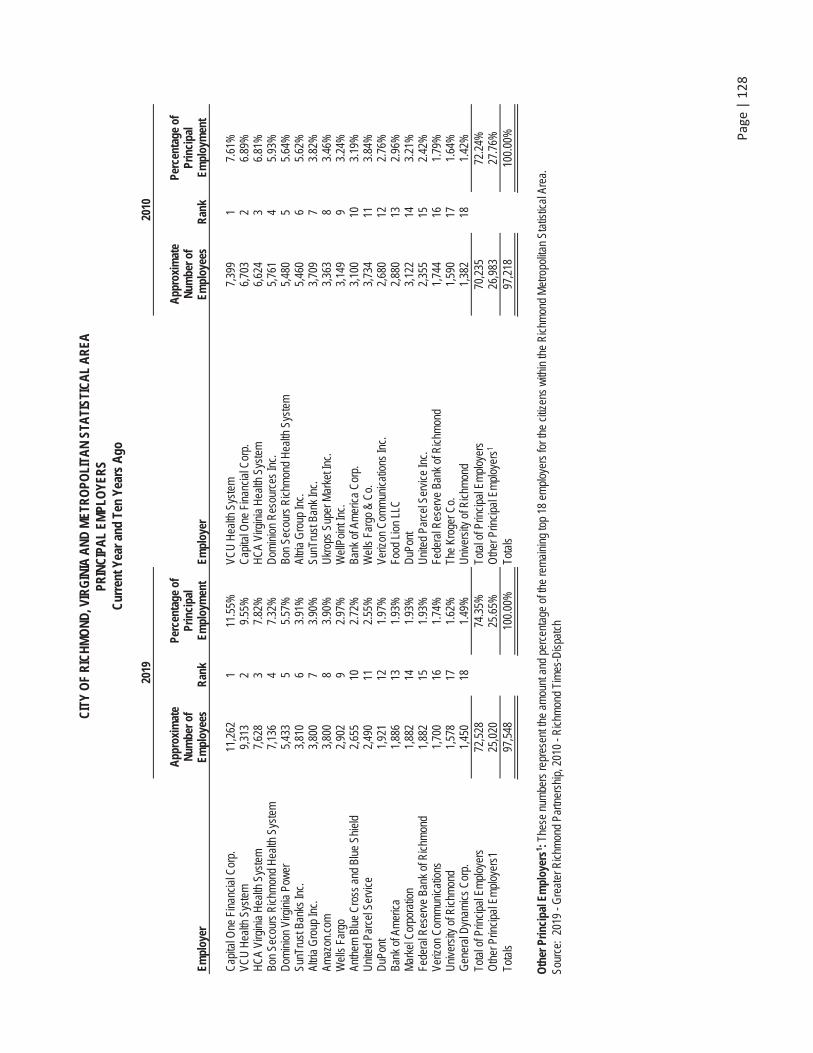
Page
|12
8
CIT
Y O
F R
ICH
MO
ND
, VIR
GIN
IA A
ND
MET
RO
POLI
TAN
STA
TIST
ICA
L A
REA
PR
INC
IPA
L EM
PLO
YER
S C
urre
nt Y
ear a
nd T
en Y
ears
Ago
2019
2
010
Empl
oyer
App
roxi
mat
e N
umbe
r of
Empl
oyee
s R
ank
Perc
enta
ge o
f Pr
inci
pal
Empl
oym
ent
Empl
oyer
App
roxi
mat
e N
umbe
r of
Empl
oyee
s R
ank
Perc
enta
ge o
f Pr
inci
pal
Empl
oym
ent
Cap
ital O
ne F
inan
cial
Cor
p.
11,
262
1
11.5
5%
VCU
Hea
lth S
yste
m
7,3
99
1
7.61
%
VCU
Hea
lth S
yste
m
9,3
13
2
9.55
%
Cap
ital O
ne F
inan
cial
Cor
p.
6,7
03
2
6.89
%
HC
A Vi
rgin
ia H
ealth
Sys
tem
7
,628
3
7.
82%
H
CA
Virg
inia
Hea
lth S
yste
m
6,6
24
3
6.81
%
Bon
Seco
urs
Ric
hmon
d H
ealth
Sys
tem
7
,136
4
7.
32%
D
omin
ion
Res
ourc
es In
c.
5,7
61
4
5.93
%
Dom
inio
n Vi
rgin
ia P
ower
5
,433
5
5.
57%
Bo
n Se
cour
s R
ichm
ond
Hea
lth S
yste
m
5,4
80
5
5.64
%
SunT
rust
Ban
ks In
c.
3,8
10
6
3.91
%
Altri
a G
roup
Inc.
5
,460
6
5.
62%
Al
tria
Gro
up In
c.
3,8
00
7
3.90
%
SunT
rust
Ban
k In
c.
3,7
09
7
3.82
%
Amaz
on.c
om
3,8
00
8
3.90
%
Ukr
ops
Supe
r Mar
ket I
nc.
3,3
63
8
3.46
%
Wel
ls F
argo
2
,902
9
2.
97%
W
ellP
oint
Inc.
3
,149
9
3.
24%
An
them
Blu
e C
ross
and
Blu
e Sh
ield
2
,655
1
0 2.
72%
Ba
nk o
f Am
eric
a C
orp.
3
,100
1
0 3.
19%
U
nite
d Pa
rcel
Ser
vice
2
,490
1
1 2.
55%
W
ells
Far
go &
Co.
3
,734
1
1 3.
84%
D
uPon
t 1
,921
1
2 1.
97%
Ve
rizon
Com
mun
icat
ions
Inc.
2
,680
1
2 2.
76%
Ba
nk o
f Am
eric
a 1
,886
1
3 1.
93%
Fo
od L
ion
LLC
2
,880
1
3 2.
96%
M
arke
l Cor
pora
tion
1,8
82
14
1.93
%
DuP
ont
3,1
22
14
3.21
%
Fede
ral R
eser
ve B
ank
of R
ichm
ond
1,8
82
15
1.93
%
Uni
ted
Parc
el S
ervi
ce In
c.
2,3
55
15
2.42
%
Veriz
on C
omm
unic
atio
ns
1,7
00
16
1.74
%
Fede
ral R
eser
ve B
ank
of R
ichm
ond
1,7
44
16
1.79
%
Uni
vers
ity o
f Ric
hmon
d 1
,578
1
7 1.
62%
Th
e Kr
oger
Co.
1
,590
1
7 1.
64%
G
ener
al D
ynam
ics
Cor
p.
1,4
50
18
1.49
%
Uni
vers
ity o
f Ric
hmon
d 1
,382
1
8 1.
42%
To
tal o
f Prin
cipa
l Em
ploy
ers
72,
528
74
.35%
To
tal o
f Prin
cipa
l Em
ploy
ers
70,
235
72
.24%
O
ther
Prin
cipa
l Em
ploy
ers1
2
5,02
0 25
.65%
O
ther
Prin
cipa
l Em
ploy
ers1
26,9
83
27.7
6%To
tals
9
7,54
8 10
0.00
%
Tota
ls
97,
218
100.
00%
Oth
er P
rinci
pal E
mpl
oyer
s1 : The
se n
umbe
rs re
pres
ent t
he a
mou
nt a
nd p
erce
ntag
e of
the
rem
aini
ng to
p 18
em
ploy
ers
for t
he c
itize
ns w
ithin
the
Ric
hmon
d M
etro
polit
an S
tatis
tical
Are
a.
Sour
ce:
2019
- G
reat
er R
ichm
ond
Partn
ersh
ip, 2
010
- Ric
hmon
d Ti
mes
-Dis
patc
h
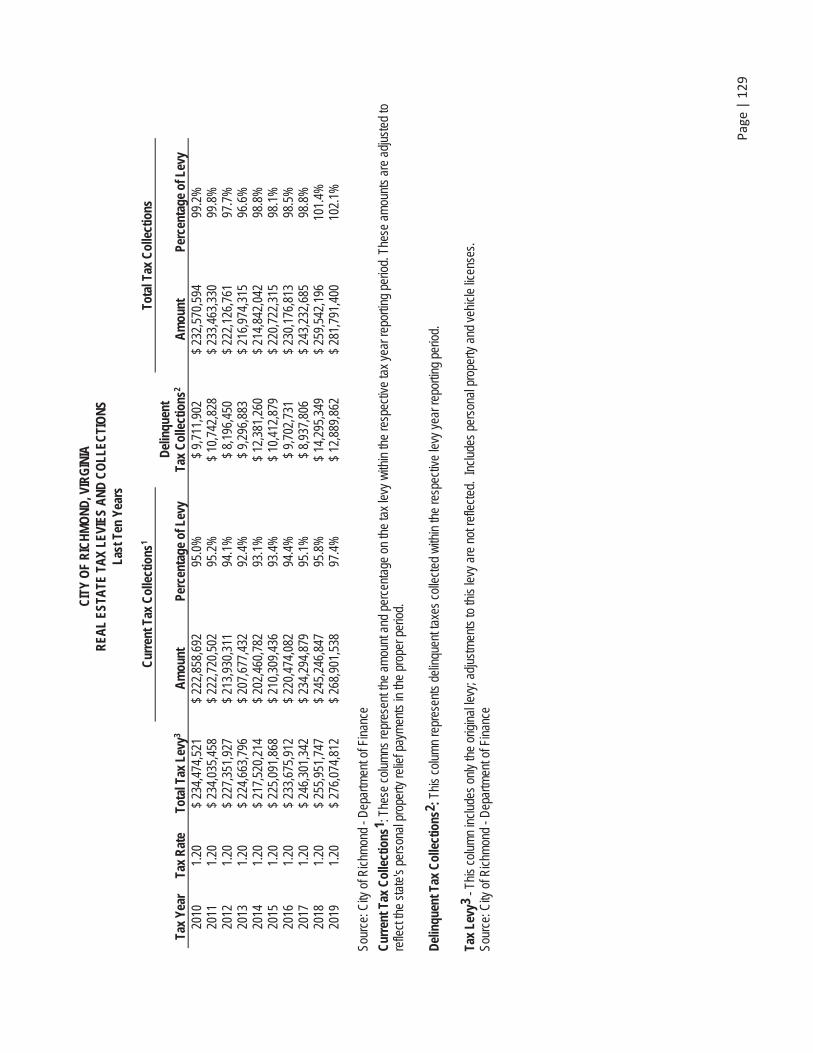
Page
|12
9
CIT
Y O
F R
ICH
MO
ND
, VIR
GIN
IA
REA
L ES
TATE
TA
X LE
VIES
AN
D C
OLL
ECTI
ON
S La
st T
en Y
ears
Cur
rent
Tax
Col
lect
ions
1To
tal T
ax C
olle
ctio
ns
Tax
Year
Ta
x R
ate
Tota
l Tax
Lev
y3 A
mou
nt
Perc
enta
ge o
f Lev
y D
elin
quen
tTa
x C
olle
ctio
ns2
Am
ount
Pe
rcen
tage
of L
evy
201
0
1.2
0
$ 2
34,4
74,5
21
$ 2
22,8
58,6
92
95.0
%
$ 9
,711
,902
$
232
,570
,594
99
.2%
2
011
1
.20
$
234
,035
,458
$
222
,720
,502
95
.2%
$
10,
742,
828
$
233
,463
,330
99
.8%
2
012
1
.20
$
227
,351
,927
$
213
,930
,311
94
.1%
$
8,1
96,4
50
$ 2
22,1
26,7
61
97.7
%
201
3
1.2
0
$ 2
24,6
63,7
96
$ 2
07,6
77,4
32
92.4
%
$ 9
,296
,883
$
216
,974
,315
96
.6%
2
014
1
.20
$
217
,520
,214
$
202
,460
,782
93
.1%
$
12,
381,
260
$
214
,842
,042
98
.8%
2
015
1
.20
$
225
,091
,868
$
210
,309
,436
93
.4%
$
10,
412,
879
$
220
,722
,315
98
.1%
2
016
1
.20
$
233
,675
,912
$
220
,474
,082
94
.4%
$
9,7
02,7
31
$ 2
30,1
76,8
13
98.5
%
201
7
1.2
0
$ 2
46,3
01,3
42
$ 2
34,2
94,8
79
95.1
%
$ 8
,937
,806
$
243
,232
,685
98
.8%
2
018
1
.20
$
255
,951
,747
$
245
,246
,847
95
.8%
$
14,
295,
349
$
259
,542
,196
10
1.4%
2
019
1
.20
$
276
,074
,812
$
268
,901
,538
97
.4%
$
12,
889,
862
$
281
,791
,400
10
2.1%
Sour
ce: C
ity o
f Ric
hmon
d - D
epar
tmen
t of F
inan
ce
Cur
rent
Tax
Col
lect
ions
1 : T
hese
col
umns
repr
esen
t the
am
ount
and
per
cent
age
on th
e ta
x le
vy w
ithin
the
resp
ectiv
e ta
x ye
ar re
porti
ng p
erio
d. T
hese
am
ount
s ar
e ad
just
ed to
re
flect
the
stat
e's
pers
onal
pro
perty
relie
f pay
men
ts in
the
prop
er p
erio
d.
Del
inqu
ent T
ax C
olle
ctio
ns2 :
Thi
s co
lum
n re
pres
ents
del
inqu
ent t
axes
col
lect
ed w
ithin
the
resp
ectiv
e le
vy y
ear r
epor
ting
perio
d.
Tax
Levy
3 - T
his
colu
mn
incl
udes
onl
y th
e or
igin
al le
vy; a
djus
tmen
ts to
this
levy
are
not
refle
cted
. In
clud
es p
erso
nal p
rope
rty a
nd v
ehic
le li
cens
es.
Sour
ce: C
ity o
f Ric
hmon
d - D
epar
tmen
t of F
inan
ce
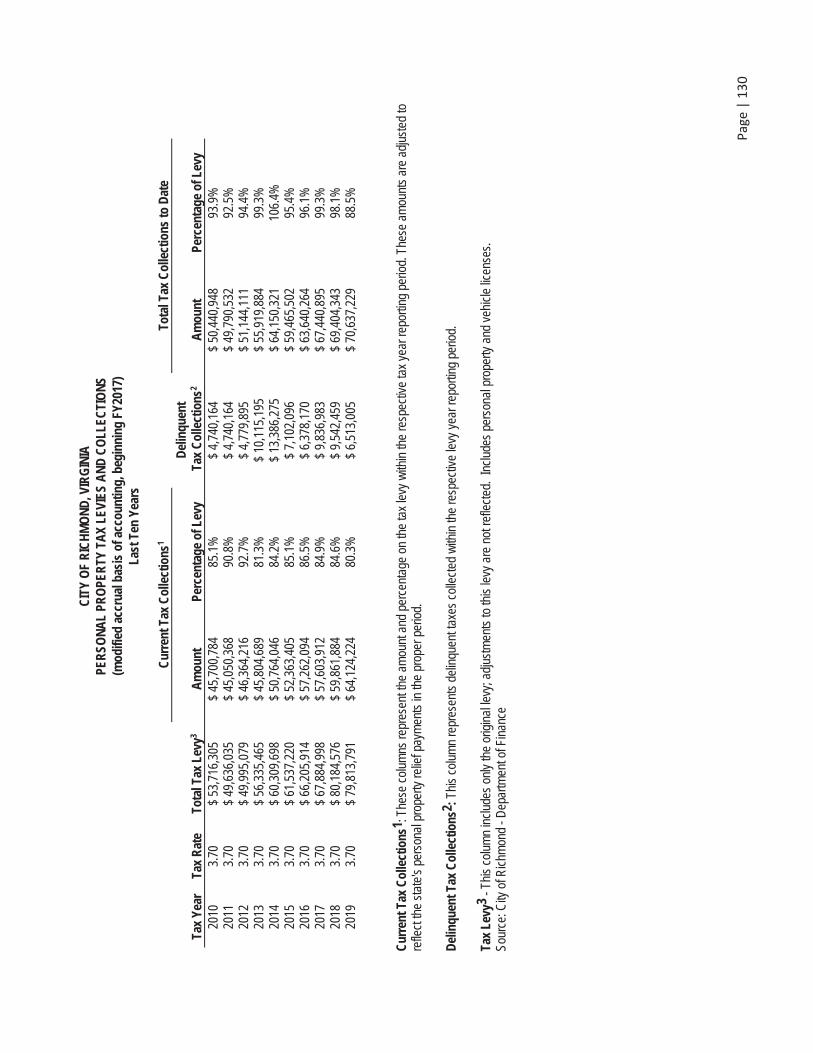
Page
|13
0
CIT
Y O
F R
ICH
MO
ND
, VIR
GIN
IA
PER
SON
AL
PRO
PER
TY T
AX
LEVI
ES A
ND
CO
LLEC
TIO
NS
(mod
ified
acc
rual
bas
is o
f acc
ount
ing,
beg
inni
ng F
Y201
7)
Last
Ten
Yea
rs
Cur
rent
Tax
Col
lect
ions
1To
tal T
ax C
olle
ctio
ns to
Dat
e
Tax
Year
Ta
x R
ate
Tota
l Tax
Lev
y3A
mou
nt
Perc
enta
ge o
f Lev
y D
elin
quen
t T
ax C
olle
ctio
ns2
Am
ount
Pe
rcen
tage
of L
evy
201
0
3.7
0
$ 5
3,71
6,30
5
$ 4
5,70
0,78
4
85.1
%
$ 4
,740
,164
$
50,
440,
948
93
.9%
2
011
3
.70
$
49,
636,
035
$
45,
050,
368
90
.8%
$
4,7
40,1
64
$ 4
9,79
0,53
2
92.5
%
201
2
3.7
0
$ 4
9,99
5,07
9
$ 4
6,36
4,21
6
92.7
%
$ 4
,779
,895
$
51,
144,
111
94
.4%
2
013
3
.70
$
56,
335,
465
$
45,
804,
689
81
.3%
$
10,
115,
195
$
55,
919,
884
99
.3%
2
014
3
.70
$
60,
309,
698
$
50,
764,
046
84
.2%
$
13,
386,
275
$
64,
150,
321
10
6.4%
2
015
3
.70
$
61,
537,
220
$
52,
363,
405
85
.1%
$
7,1
02,0
96
$ 5
9,46
5,50
2
95.4
%
201
6
3.7
0
$ 6
6,20
5,91
4
$ 5
7,26
2,09
4
86.5
%
$ 6
,378
,170
$
63,
640,
264
96
.1%
2
017
3
.70
$
67,
884,
998
$
57,
603,
912
84
.9%
$
9,8
36,9
83
$ 6
7,44
0,89
5
99.3
%
201
8
3.7
0
$ 8
0,18
4,57
6
$ 5
9,86
1,88
4
84.6
%
$ 9
,542
,459
$
69,
404,
343
98
.1%
2
019
3
.70
$
79,
813,
791
$
64,
124,
224
80
.3%
$
6,5
13,0
05
$ 7
0,63
7,22
9
88.5
%
Cur
rent
Tax
Col
lect
ions
1 : T
hese
col
umns
repr
esen
t the
am
ount
and
per
cent
age
on th
e ta
x le
vy w
ithin
the
resp
ectiv
e ta
x ye
ar re
porti
ng p
erio
d. T
hese
am
ount
s ar
e ad
just
ed to
re
flect
the
stat
e's
pers
onal
pro
perty
relie
f pay
men
ts in
the
prop
er p
erio
d.
Del
inqu
ent T
ax C
olle
ctio
ns2 :
Thi
s co
lum
n re
pres
ents
del
inqu
ent t
axes
col
lect
ed w
ithin
the
resp
ectiv
e le
vy y
ear r
epor
ting
perio
d.
Tax
Levy
3 - T
his
colu
mn
incl
udes
onl
y th
e or
igin
al le
vy; a
djus
tmen
ts to
this
levy
are
not
refle
cted
. In
clud
es p
erso
nal p
rope
rty a
nd v
ehic
le li
cens
es.
Sour
ce: C
ity o
f Ric
hmon
d - D
epar
tmen
t of F
inan
ce
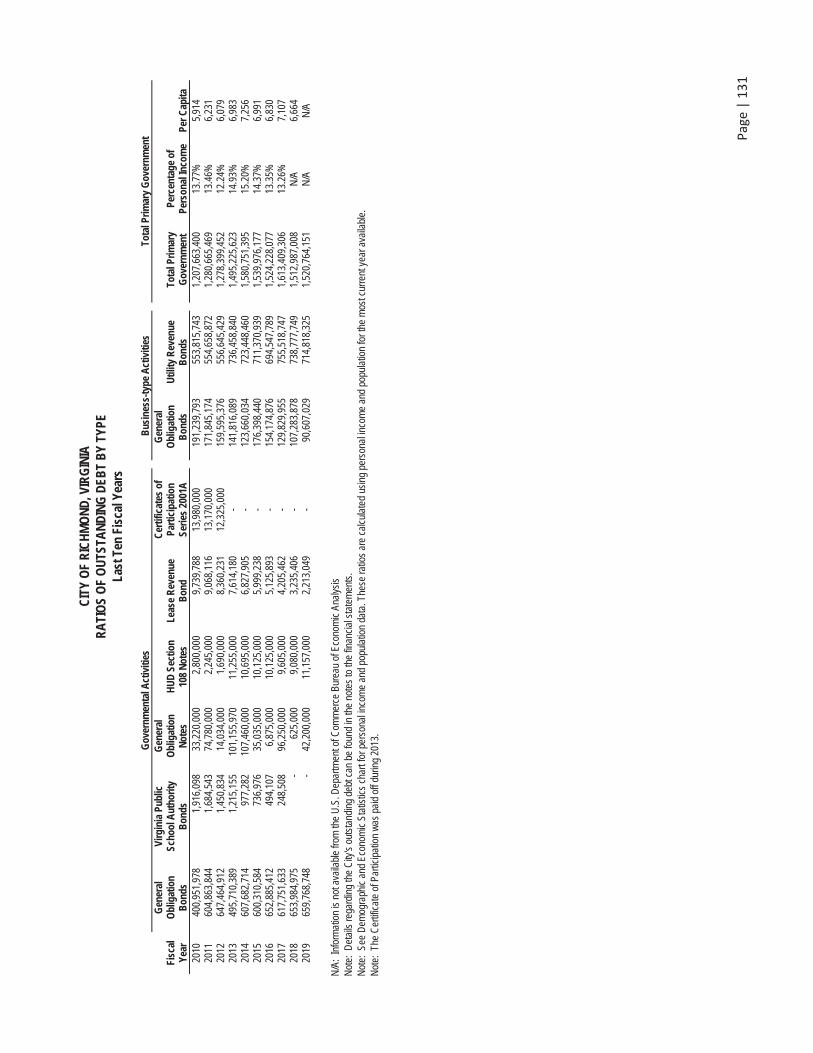
Page
|13
1
CIT
Y O
F R
ICH
MO
ND
, VIR
GIN
IA
RA
TIO
S O
F O
UTS
TAN
DIN
G D
EBT
BY
TYPE
La
st T
en F
isca
l Yea
rs
Gov
ernm
enta
l Act
iviti
es
Bus
ines
s-ty
pe A
ctiv
ities
To
tal P
rimar
y G
over
nmen
t
Fisc
al
Year
Gen
eral
Obl
igat
ion
Bon
ds
Virg
inia
Pub
lic
Scho
ol A
utho
rity
Bon
ds
Gen
eral
Obl
igat
ion
Not
esH
UD
Sec
tion
108
Not
es
Leas
e R
even
ue
Bon
d
Cer
tific
ates
of
Part
icip
atio
n Se
ries
2001
A
Gen
eral
Obl
igat
ion
Bon
ds
Util
ity R
even
ue
Bon
dsTo
tal P
rimar
y G
over
nmen
t Pe
rcen
tage
of
Pers
onal
Inco
me
Per C
apita
2
010
4
00,9
51,9
78
1,9
16,0
98
33,
220,
000
2
,800
,000
9
,739
,788
1
3,98
0,00
0
191
,239
,793
5
53,8
15,7
43
1,2
07,6
63,4
00
13.7
7%
5,9
14
201
1
604
,863
,844
1
,684
,543
7
4,78
0,00
0
2,2
45,0
00
9,0
68,1
16
13,
170,
000
1
71,8
45,1
74
554
,658
,872
1
,280
,665
,469
13
.46%
6
,231
2
012
6
47,4
64,9
12
1,4
50,8
34
14,
034,
000
1
,690
,000
8
,360
,231
1
2,32
5,00
0
159
,595
,376
5
56,6
45,4
29
1,2
78,3
99,4
52
12.2
4%
6,0
79
201
3
495
,710
,389
1
,215
,155
1
01,1
55,9
70
11,
255,
000
7
,614
,180
-
141
,816
, 089
736
,458
,840
1
,495
,225
,623
14
.93%
6
,983
2
014
6
07,6
82,7
14
977
,282
1
07,4
60,0
00
10,
695,
000
6
,827
,905
-
123
,660
,034
723
,448
,460
1
,580
,751
,395
15
.20%
7
,256
2
015
6
00,3
10,5
84
736
,976
3
5,03
5,00
0
10,
125,
000
5
,999
,238
-
176
,398
, 440
711
,370
,939
1
,539
,976
,177
14
.37%
6
,991
2
016
6
52,8
85,4
12
494
,107
6
,875
,000
1
0,12
5,00
0
5,1
25,8
93
- 1
54,1
74,8
76 6
94,5
47,7
89
1,5
24,2
28,0
77
13.3
5%
6,83
0 2
017
6
17,7
51,6
33
248
,508
9
6,25
0,00
0
9,6
05,0
00
4,2
05,4
62
- 1
29,8
29,9
55 7
55,5
18,7
47
1,6
13,4
09,3
06
13.2
6%
7,10
7 2
018
6
53,9
84,9
75
- 6
25, 0
00 9
,080
,000
3
,235
,406
-
107
,283
,878
738
,777
,749
1
,512
,987
,008
N
/A
6,66
4 2
019
6
59,7
68,7
48
- 4
2,20
0,00
0 1
1,15
7,00
0
2,2
13,0
49
- 9
0,60
7,02
9 7
14,8
18,3
25
1,5
20,7
64,1
51
N/A
N
/A
N/A
: In
form
atio
n is
not
ava
ilabl
e fro
m th
e U
.S. D
epar
tmen
t of C
omm
erce
Bur
eau
of E
cono
mic
Ana
lysi
s N
ote:
Det
ails
rega
rdin
g th
e C
ity's
outs
tand
ing
debt
can
be
foun
d in
the
note
s to
the
finan
cial
sta
tem
ents
. N
ote:
See
Dem
ogra
phic
and
Eco
nom
ic S
tatis
tics
char
t for
per
sona
l inc
ome
and
popu
latio
n da
ta. T
hese
ratio
s ar
e ca
lcul
ated
usi
ng p
erso
nal i
ncom
e an
d po
pula
tion
for t
he m
ost c
urre
nt y
ear a
vaila
ble.
N
ote:
The
Cer
tific
ate
of P
artic
ipat
ion
was
pai
d of
f dur
ing
2013
.
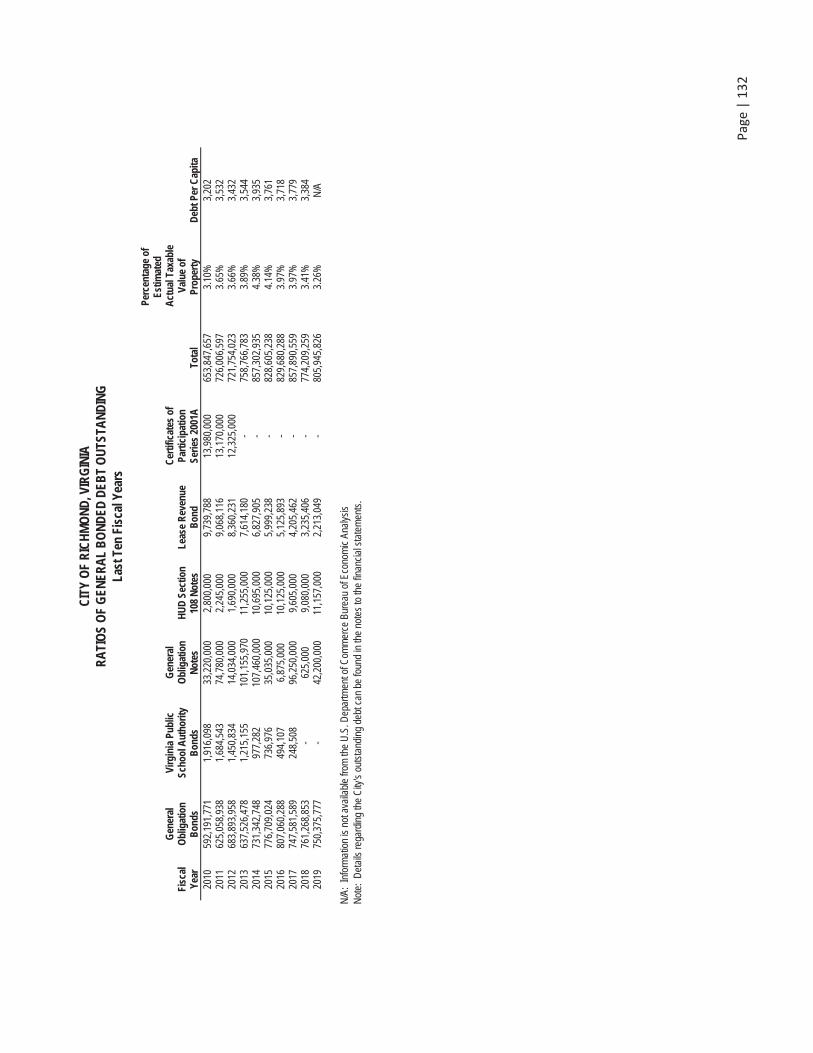
Page
|13
2
CIT
Y O
F R
ICH
MO
ND
, VIR
GIN
IA
RA
TIO
S O
F G
ENER
AL
BO
ND
ED D
EBT
OU
TSTA
ND
ING
La
st T
en F
isca
l Yea
rs
Fisc
al
Year
Gen
eral
Obl
igat
ion
Bon
ds
Virg
inia
Pub
lic
Scho
ol A
utho
rity
Bon
ds
Gen
eral
Obl
igat
ion
Not
esH
UD
Sec
tion
108
Not
es
Leas
e R
even
ue
Bon
d
Cer
tific
ates
of
Part
icip
atio
n Se
ries
2001
A
Tota
l
Perc
enta
ge o
f Es
timat
ed
Act
ual T
axab
le
Val
ue o
f Pr
oper
ty
Deb
t Per
Cap
ita
201
0
592
,191
,771
1
,916
,098
3
3,22
0,00
0
2,8
00,0
00
9,7
39,7
88
13,
980,
000
6
53,8
47,6
57
3.10
%
3,2
02
201
1
625
,058
,938
1
,684
,543
7
4,78
0,00
0
2,2
45,0
00
9,0
68,1
16
13,
170,
000
7
26,0
06,5
97
3.65
%
3,5
32
201
2
683
,893
,958
1
,450
,834
1
4,03
4,00
0
1,6
90,0
00
8,3
60,2
31
12,
325,
000
7
21,7
54,0
23
3.66
%
3,4
32
201
3
637
,526
,478
1
,215
,155
1
01,1
55,9
70
11,
255,
000
7
,614
,180
-
758
,766
, 783
3.89
%
3,5
44
201
4
731
,342
,748
9
77,2
82
107
,460
,000
1
0,69
5,00
0
6,8
27,9
05
- 8
57,3
02,9
354.
38%
3
,935
2
015
7
76,7
09,0
24
736
,976
3
5,03
5,00
0
10,
125,
000
5
,999
,238
-
828
,605
, 238
4.14
%
3,7
61
201
6
807
,060
,288
4
94,1
07
6,8
75,0
00
10,
125,
000
5
,125
,893
-
829
,680
,288
3.97
%
3,7
18
201
7
747
,581
,589
2
48,5
08
96,
250,
000
9
,605
,000
4
,205
,462
-
857
,890
,559
3.97
%
3,7
79
201
8
761
,268
,853
-
625
, 000
9,0
80,0
00
3,2
35,4
06
- 7
74,2
09,2
593.
41%
3
,384
2
019
7
50,3
75,7
77
- 4
2,20
0,00
0 1
1,15
7,00
0
2,2
13,0
49
- 8
05,9
45,8
263.
26%
N
/A
N/A
: In
form
atio
n is
not
ava
ilabl
e fro
m th
e U
.S. D
epar
tmen
t of C
omm
erce
Bur
eau
of E
cono
mic
Ana
lysi
s N
ote:
Det
ails
rega
rdin
g th
e C
ity's
outs
tand
ing
debt
can
be
foun
d in
the
note
s to
the
finan
cial
sta
tem
ents
.
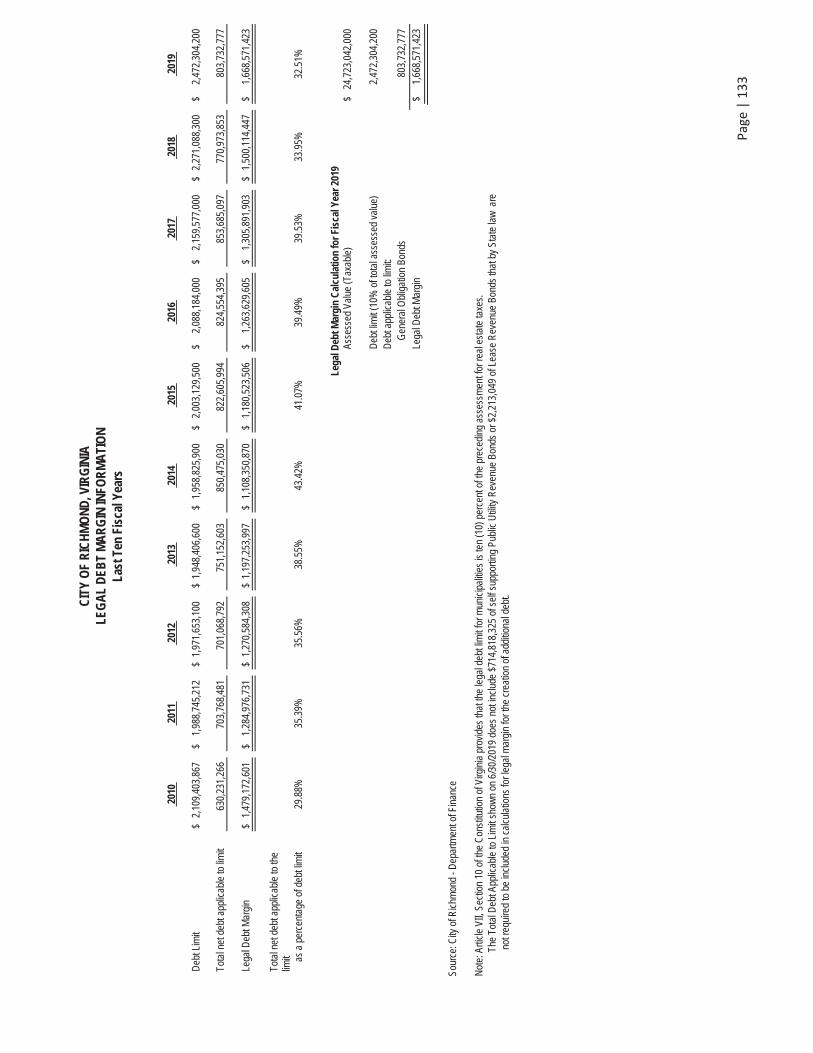
Page
|13
3
CIT
Y O
F R
ICH
MO
ND
, VIR
GIN
IA
LEG
AL
DEB
T M
AR
GIN
INFO
RM
ATI
ON
La
st T
en F
isca
l Yea
rs
201
0 2
011
201
2 2
013
201
4 2
015
201
6 2
017
201
8 2
019
Deb
t Lim
it $
2,1
09,4
03,8
67
$
1,98
8,74
5,21
2
$ 1
,971
,653
,100
$
1,9
48,4
06,6
00
$ 1
,958
,825
,900
$
2,
003,
129,
500
$
2
,088
,184
,000
$
2
,159
,577
,000
$
2,2
71,0
88,3
00
$
2,4
72,3
04,2
00
Tota
l net
deb
t app
licab
le to
lim
it 6
30,2
31,2
66
703
,768
,481
7
01,0
68,7
92
7
51,1
52,6
03
8
50,4
75,0
30
822
,605
,994
8
24,5
54,3
95
853
,685
,097
7
70,9
73,8
53
8
03,7
32,7
77
Lega
l Deb
t Mar
gin
$ 1
,479
,172
,601
$
1,
284,
976,
731
$
1,2
70,5
84,3
08
$ 1
,197
,253
,997
$
1,1
08,3
50,8
70
$
1,18
0,52
3,50
6
$
1,2
63,6
29,6
05
$
1,3
05,8
91,9
03
$ 1
,500
,114
,447
$
1
,668
,571
,423
Tota
l net
deb
t app
licab
le to
the
limit
a
s a
perc
enta
ge o
f deb
t lim
it 29
.88%
35
.39%
35
.56%
38.5
5%
43
. 42%
41.0
7%
39
.49%
39.5
3%
33
.95%
32.5
1%
Lega
l Deb
t Mar
gin
Cal
cula
tion
for F
isca
l Yea
r 201
9 As
sess
ed V
alue
(Tax
able
) $
24
,723
,042
,000
Deb
t lim
it (1
0% o
f tot
al a
sses
sed
valu
e)
2,4
72,3
04,2
00
Deb
t app
licab
le to
lim
it:
G
ener
al O
blig
atio
n Bo
nds
803
,732
,777
Le
gal D
ebt M
argi
n $
1
,668
,571
,423
Sour
ce: C
ity o
f Ric
hmon
d - D
epar
tmen
t of F
inan
ce
Not
e: A
rticl
e VI
I, Se
ctio
n 10
of t
he C
onst
itutio
n of
Virg
inia
pro
vide
s th
at th
e le
gal d
ebt l
imit
for m
unic
ipal
ities
is te
n (1
0) p
erce
nt o
f the
pre
cedi
ng a
sses
smen
t for
real
est
ate
taxe
s.
The
Tot
al D
ebt A
pplic
able
to L
imit
show
n on
6/3
0/20
19 d
oes
not i
nclu
de $
714,
818,
325
of s
elf s
uppo
rting
Pub
lic U
tility
Rev
enue
Bon
ds o
r $2,
213,
049
of L
ease
Rev
enue
Bon
ds th
at b
y St
ate
law
are
not r
equi
red
to b
e in
clud
ed in
cal
cula
tions
for l
egal
mar
gin
for t
he c
reat
ion
of a
dditi
onal
deb
t.
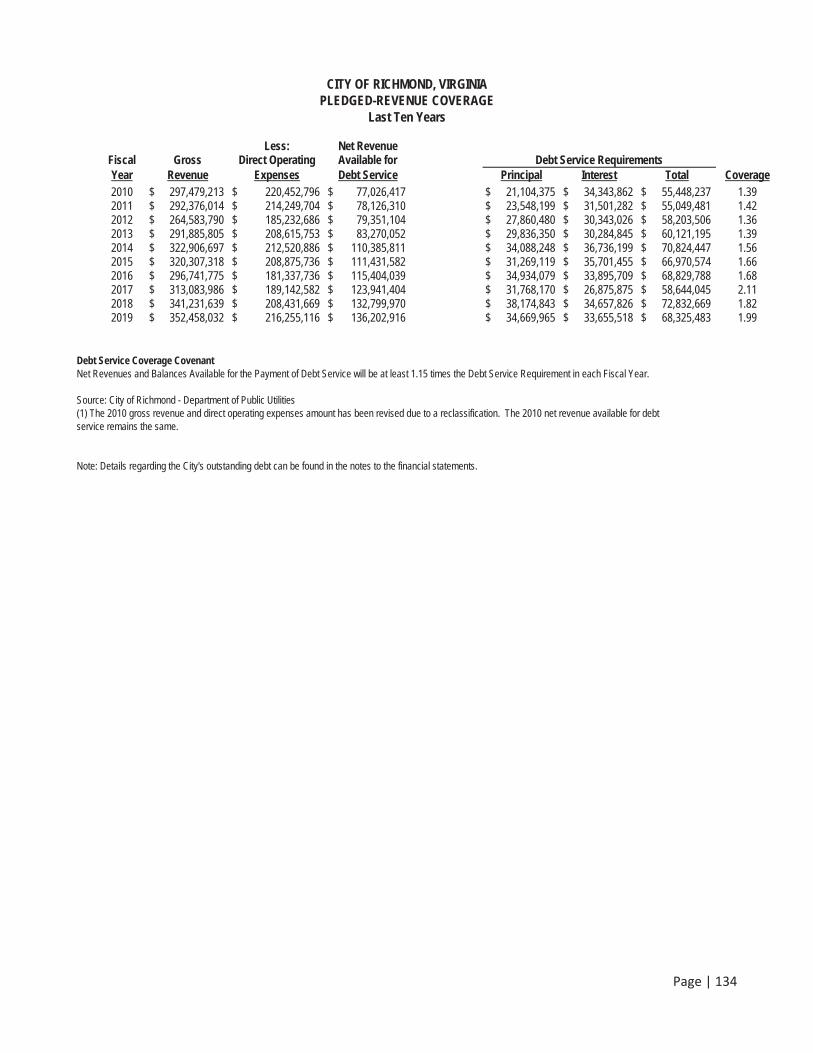
Page | 134
CITY OF RICHMOND, VIRGINIA PLEDGED-REVENUE COVERAGE
Last Ten Years
Less: Net RevenueFiscal Gross Direct Operating Available for Debt Service Requirements Year Revenue Expenses Debt Service Principal Interest Total Coverage
2010 $ 297,479,213 $ 220,452,796 $ 77,026,417 $ 21,104,375 $ 34,343,862 $ 55,448,237 1.39 2011 $ 292,376,014 $ 214,249,704 $ 78,126,310 $ 23,548,199 $ 31,501,282 $ 55,049,481 1.42 2012 $ 264,583,790 $ 185,232,686 $ 79,351,104 $ 27,860,480 $ 30,343,026 $ 58,203,506 1.36 2013 $ 291,885,805 $ 208,615,753 $ 83,270,052 $ 29,836,350 $ 30,284,845 $ 60,121,195 1.39 2014 $ 322,906,697 $ 212,520,886 $ 110,385,811 $ 34,088,248 $ 36,736,199 $ 70,824,447 1.56 2015 $ 320,307,318 $ 208,875,736 $ 111,431,582 $ 31,269,119 $ 35,701,455 $ 66,970,574 1.66 2016 $ 296,741,775 $ 181,337,736 $ 115,404,039 $ 34,934,079 $ 33,895,709 $ 68,829,788 1.68 2017 $ 313,083,986 $ 189,142,582 $ 123,941,404 $ 31,768,170 $ 26,875,875 $ 58,644,045 2.11 2018 $ 341,231,639 $ 208,431,669 $ 132,799,970 $ 38,174,843 $ 34,657,826 $ 72,832,669 1.82 2019 $ 352,458,032 $ 216,255,116 $ 136,202,916 $ 34,669,965 $ 33,655,518 $ 68,325,483 1.99
Debt Service Coverage CovenantNet Revenues and Balances Available for the Payment of Debt Service will be at least 1.15 times the Debt Service Requirement in each Fiscal Year.
Source: City of Richmond - Department of Public Utilities (1) The 2010 gross revenue and direct operating expenses amount has been revised due to a reclassification. The 2010 net revenue available for debt service remains the same.
Note: Details regarding the City's outstanding debt can be found in the notes to the financial statements.
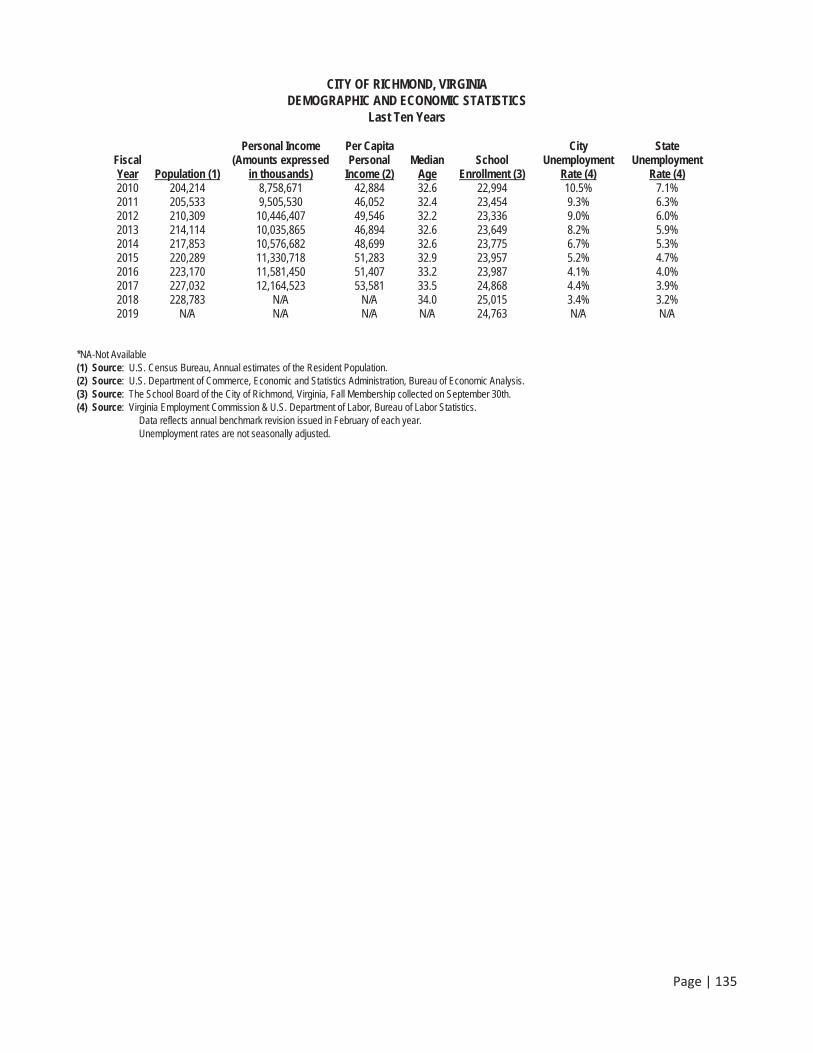
Page | 135
CITY OF RICHMOND, VIRGINIA DEMOGRAPHIC AND ECONOMIC STATISTICS
Last Ten Years
Personal Income Per Capita City StateFiscal (Amounts expressed Personal Median School Unemployment Unemployment Year Population (1) in thousands) Income (2) Age Enrollment (3) Rate (4) Rate (4)
2010 204,214 8,758,671 42,884 32.6 22,994 10.5% 7.1% 2011 205,533 9,505,530 46,052 32.4 23,454 9.3% 6.3% 2012 210,309 10,446,407 49,546 32.2 23,336 9.0% 6.0% 2013 214,114 10,035,865 46,894 32.6 23,649 8.2% 5.9% 2014 217,853 10,576,682 48,699 32.6 23,775 6.7% 5.3% 2015 220,289 11,330,718 51,283 32.9 23,957 5.2% 4.7% 2016 223,170 11,581,450 51,407 33.2 23,987 4.1% 4.0% 2017 227,032 12,164,523 53,581 33.5 24,868 4.4% 3.9% 2018 228,783 N/A N/A 34.0 25,015 3.4% 3.2% 2019 N/A N/A N/A N/A 24,763 N/A N/A
*NA-Not Available (1) Source: U.S. Census Bureau, Annual estimates of the Resident Population. (2) Source: U.S. Department of Commerce, Economic and Statistics Administration, Bureau of Economic Analysis.(3) Source: The School Board of the City of Richmond, Virginia, Fall Membership collected on September 30th. (4) Source: Virginia Employment Commission & U.S. Department of Labor, Bureau of Labor Statistics.
Data reflects annual benchmark revision issued in February of each year. Unemployment rates are not seasonally adjusted.
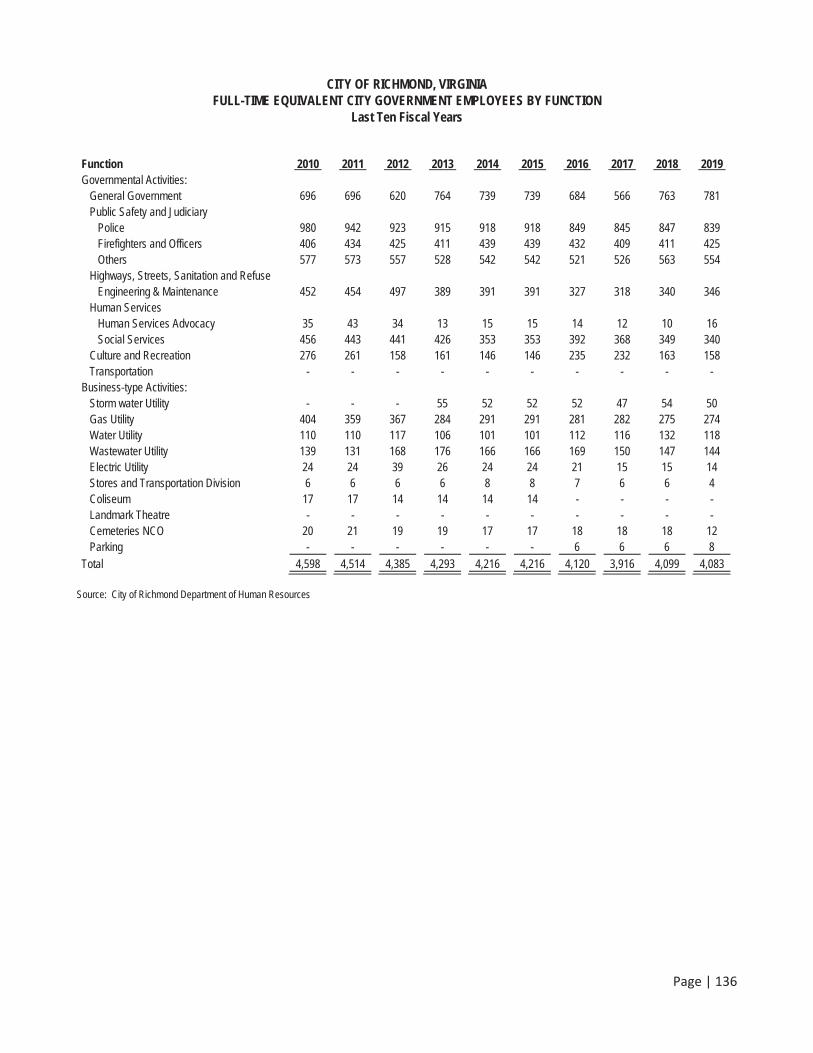
Page | 136
CITY OF RICHMOND, VIRGINIA FULL-TIME EQUIVALENT CITY GOVERNMENT EMPLOYEES BY FUNCTION
Last Ten Fiscal Years
Function 2010 2011 2012 2013 2014 2015 2016 2017 2018 2019 Governmental Activities: General Government 696 696 620 764 739 739 684 566 763 781
Public Safety and Judiciary Police 980 942 923 915 918 918 849 845 847 839 Firefighters and Officers 406 434 425 411 439 439 432 409 411 425 Others 577 573 557 528 542 542 521 526 563 554
Highways, Streets, Sanitation and Refuse Engineering & Maintenance 452 454 497 389 391 391 327 318 340 346
Human Services Human Services Advocacy 35 43 34 13 15 15 14 12 10 16 Social Services 456 443 441 426 353 353 392 368 349 340 Culture and Recreation 276 261 158 161 146 146 235 232 163 158 Transportation - - - - - - - - - - Business-type Activities: Storm water Utility - - - 55 52 52 52 47 54 50 Gas Utility 404 359 367 284 291 291 281 282 275 274 Water Utility 110 110 117 106 101 101 112 116 132 118 Wastewater Utility 139 131 168 176 166 166 169 150 147 144 Electric Utility 24 24 39 26 24 24 21 15 15 14 Stores and Transportation Division 6 6 6 6 8 8 7 6 6 4 Coliseum 17 17 14 14 14 14 - - - - Landmark Theatre - - - - - - - - - - Cemeteries NCO 20 21 19 19 17 17 18 18 18 12 Parking - - - - - - 6 6 6 8 Total 4,598 4,514 4,385 4,293 4,216 4,216 4,120 3,916 4,099 4,083
Source: City of Richmond Department of Human Resources
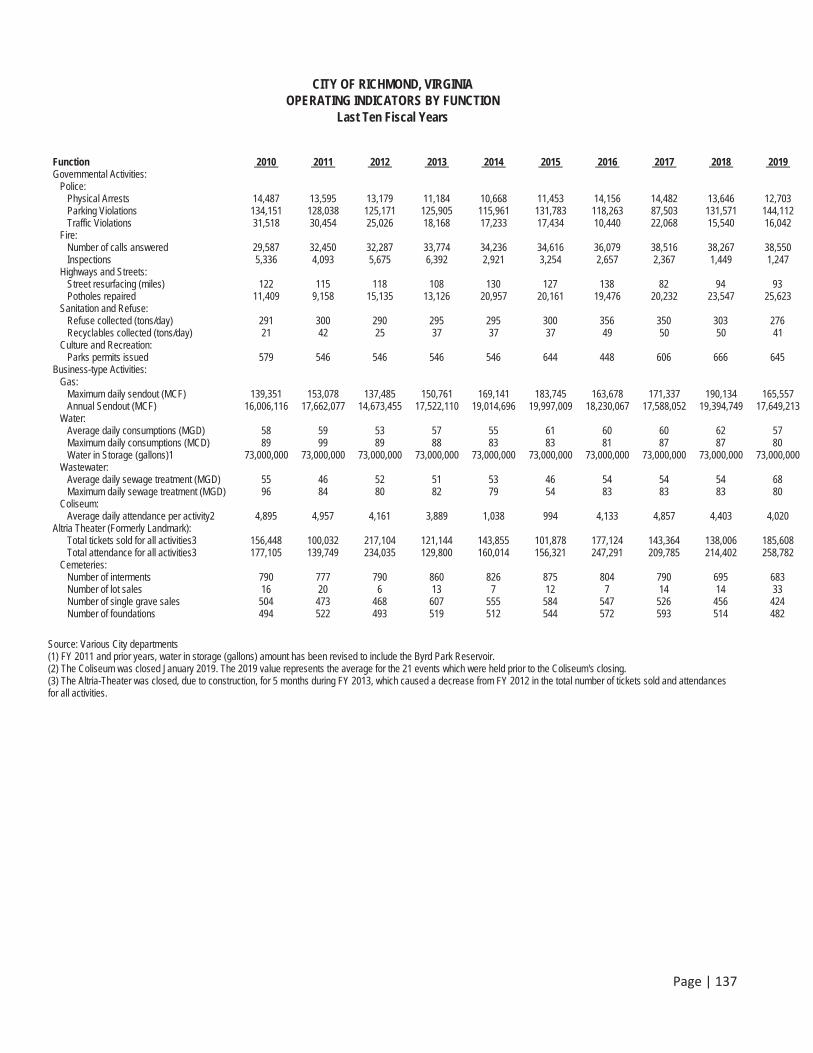
Page | 137
CITY OF RICHMOND, VIRGINIA OPERATING INDICATORS BY FUNCTION
Last Ten Fiscal Years
Function 2010 2011 2012 2013 2014 2015 2016 2017 2018 2019Governmental Activities:
Police: Physical Arrests 14,487 13,595 13,179 11,184 10,668 11,453 14,156 14,482 13,646 12,703 Parking Violations 134,151 128,038 125,171 125,905 115,961 131,783 118,263 87,503 131,571 144,112 Traffic Violations 31,518 30,454 25,026 18,168 17,233 17,434 10,440 22,068 15,540 16,042 Fire: Number of calls answered 29,587 32,450 32,287 33,774 34,236 34,616 36,079 38,516 38,267 38,550 Inspections 5,336 4,093 5,675 6,392 2,921 3,254 2,657 2,367 1,449 1,247
Highways and Streets: Street resurfacing (miles) 122 115 118 108 130 127 138 82 94 93 Potholes repaired 11,409 9,158 15,135 13,126 20,957 20,161 19,476 20,232 23,547 25,623
Sanitation and Refuse: Refuse collected (tons/day) 291 300 290 295 295 300 356 350 303 276 Recyclables collected (tons/day) 21 42 25 37 37 37 49 50 50 41
Culture and Recreation: Parks permits issued 579 546 546 546 546 644 448 606 666 645 Business-type Activities:
Gas: Maximum daily sendout (MCF) 139,351 153,078 137,485 150,761 169,141 183,745 163,678 171,337 190,134 165,557
Annual Sendout (MCF) 16,006,116 17,662,077 14,673,455 17,522,110 19,014,696 19,997,009 18,230,067 17,588,052 19,394,749 17,649,213 Water:
Average daily consumptions (MGD) 58 59 53 57 55 61 60 60 62 57 Maximum daily consumptions (MCD) 89 99 89 88 83 83 81 87 87 80 Water in Storage (gallons)1 73,000,000 73,000,000 73,000,000 73,000,000 73,000,000 73,000,000 73,000,000 73,000,000 73,000,000 73,000,000 Wastewater:
Average daily sewage treatment (MGD) 55 46 52 51 53 46 54 54 54 68 Maximum daily sewage treatment (MGD) 96 84 80 82 79 54 83 83 83 80
Coliseum: Average daily attendance per activity2 4,895 4,957 4,161 3,889 1,038 994 4,133 4,857 4,403 4,020 Altria Theater (Formerly Landmark):
Total tickets sold for all activities3 156,448 100,032 217,104 121,144 143,855 101,878 177,124 143,364 138,006 185,608 Total attendance for all activities3 177,105 139,749 234,035 129,800 160,014 156,321 247,291 209,785 214,402 258,782 Cemeteries: Number of interments 790 777 790 860 826 875 804 790 695 683 Number of lot sales 16 20 6 13 7 12 7 14 14 33 Number of single grave sales 504 473 468 607 555 584 547 526 456 424 Number of foundations 494 522 493 519 512 544 572 593 514 482
Source: Various City departments (1) FY 2011 and prior years, water in storage (gallons) amount has been revised to include the Byrd Park Reservoir. (2) The Coliseum was closed January 2019. The 2019 value represents the average for the 21 events which were held prior to the Coliseum's closing. (3) The Altria-Theater was closed, due to construction, for 5 months during FY 2013, which caused a decrease from FY 2012 in the total number of tickets sold and attendances for all activities.
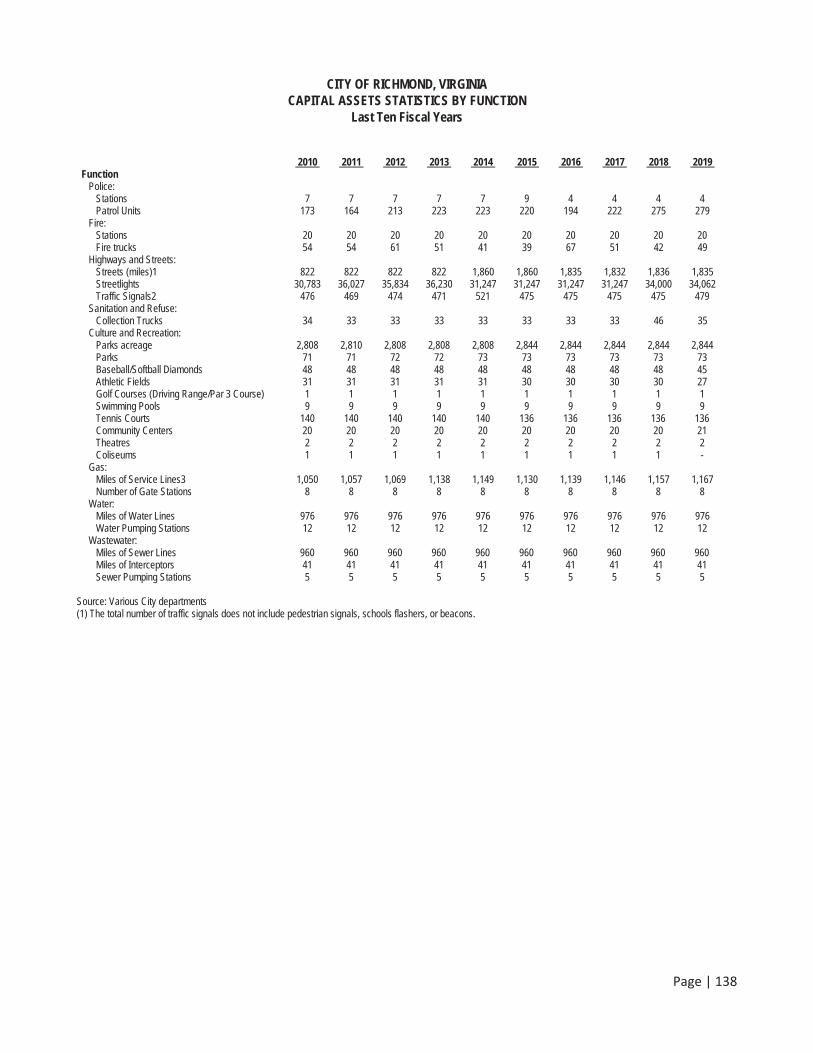
Page | 138
CITY OF RICHMOND, VIRGINIA CAPITAL ASSETS STATISTICS BY FUNCTION
Last Ten Fiscal Years
2010 2011 2012 2013 2014 2015 2016 2017 2018 2019Function
Police: Stations 7 7 7 7 7 9 4 4 4 4
Patrol Units 173 164 213 223 223 220 194 222 275 279 Fire: Stations 20 20 20 20 20 20 20 20 20 20 Fire trucks 54 54 61 51 41 39 67 51 42 49
Highways and Streets: Streets (miles)1 822 822 822 822 1,860 1,860 1,835 1,832 1,836 1,835 Streetlights 30,783 36,027 35,834 36,230 31,247 31,247 31,247 31,247 34,000 34,062 Traffic Signals2 476 469 474 471 521 475 475 475 475 479
Sanitation and Refuse: Collection Trucks 34 33 33 33 33 33 33 33 46 35 Culture and Recreation:
Parks acreage 2,808 2,810 2,808 2,808 2,808 2,844 2,844 2,844 2,844 2,844 Parks 71 71 72 72 73 73 73 73 73 73 Baseball/Softball Diamonds 48 48 48 48 48 48 48 48 48 45
Athletic Fields 31 31 31 31 31 30 30 30 30 27 Golf Courses (Driving Range/Par 3 Course) 1 1 1 1 1 1 1 1 1 1 Swimming Pools 9 9 9 9 9 9 9 9 9 9 Tennis Courts 140 140 140 140 140 136 136 136 136 136 Community Centers 20 20 20 20 20 20 20 20 20 21 Theatres 2 2 2 2 2 2 2 2 2 2 Coliseums 1 1 1 1 1 1 1 1 1 -
Gas: Miles of Service Lines3 1,050 1,057 1,069 1,138 1,149 1,130 1,139 1,146 1,157 1,167
Number of Gate Stations 8 8 8 8 8 8 8 8 8 8 Water: Miles of Water Lines 976 976 976 976 976 976 976 976 976 976 Water Pumping Stations 12 12 12 12 12 12 12 12 12 12
Wastewater: Miles of Sewer Lines 960 960 960 960 960 960 960 960 960 960 Miles of Interceptors 41 41 41 41 41 41 41 41 41 41 Sewer Pumping Stations 5 5 5 5 5 5 5 5 5 5
Source: Various City departments (1) The total number of traffic signals does not include pedestrian signals, schools flashers, or beacons.

DEPARTMENT OF FINANCE
900 East Broad Street, 10th Floor
Richmond, Virginia 23219
PRINTED BY CITY PRINTING SERVICES
Department of Information Technology
(804) 646-5801
RVA.GOV