Embed Size (px)
Citation preview

CITY OF SAN DIEGO
Fiscal Year 2017 - 2021 Five-Year Capital Infrastructure Planning Outlook
December 7, 2015
Kevin L. Faulconer Scott Chadwick Mayor Chief Operating Officer Stacey LoMedico Paz Gomez
Assistant Chief Operating Officer Deputy Chief Operating Officer Infrastructure/Public Works
Disclaimer: The City files its disclosure documents, including official statements, audited financial statements, comprehensive annual financial reports, annual financial information, material event notices, and voluntary disclosures with the Municipal Securities Rule Making Board’s Electronic Municipal Market Access (“EMMA”) system. The Five-Year Capital Infrastructure Planning Outlook is not filed on EMMA and investors should not rely upon the Five-Year Capital Infrastructure Planning Outlook to make any investment decisions. The City will provide the Five-Year Capital Infrastructure Planning Outlook to the rating agencies, its bond insurers and other interested parties, and welcomes and encourages their careful review of this document. Readers are cautioned that the numbers presented in this document are the City’s best estimate for the next five years based on facts and factors currently known to the City and do not represent actual performance. No representation is made by the City that, as of the date this document is read, there is not a material difference between the City’s actual performance as of such date and the financial data presented in the Five-Year Capital Infrastructure Planning Outlook. Certain statements in this document constitute forward-looking statements or statements which may be deemed or construed to be forward-looking statements. Forward-looking statements involve, and are subject to known and unknown risks, uncertainties and other factors which could cause the City's actual results, performance (financial or operating) or achievements to differ materially from the future results, performance (financial or operating) or achievements expressed or implied by such forward-looking statements. All forward-looking statements herein are expressly qualified in their entirety by the abovementioned cautionary statement. The City disclaims any obligation to update forward-looking statements contained in this document.

City of San Diego FY 2017-2021 Five-Year Capital Infrastructure Planning Outlook
This Page Intentionally Left Blank
City of San Diego FY 2017-2021 Five-Year Capital Infrastructure Planning Outlook
Table of Contents Executive Summary .................................................................................................................................. 1
Table 1 General Fund Infrastructure Investments: FY 2017 – FY 2021 ............................................ 2
Figure 1 FY 2016 Adopted CIP Budget Funding Sources ................................................................. 2
Table 2 CIP Status of Streamlining Measures and Process Improvements ...................................... 3
Report Overview and Methodology ........................................................................................................... 4
Table 3 City of San Diego Multi-Year CIP ......................................................................................... 4
Table 4 Top Ten Infrastructure Capital Assets and Additional Assets Included ................................ 5
Table 5 CIP Outlook Assumptions ..................................................................................................... 6
Capital Improvement Program (CIP) Overview ......................................................................................... 7
CIP Review Advisory Committee (CIPRAC) ......................................................................................... 7
Infrastructure Asset Management (IAM) Program .................................................................................... 8
Condition Assessments ......................................................................................................................... 8
Table 6 Current Status of Condition Assessments ............................................................................ 9
Identifying Capital Needs ........................................................................................................................ 10
Federal and State Mandated Requirements ....................................................................................... 10
Preservation of Public Safety .............................................................................................................. 11
Community Input ................................................................................................................................. 11
Establishing and Evaluating Service Level Standards ........................................................................ 12
Table 7 Service Level Standard Sources ........................................................................................ 12
Identifying Sources to Fund Capital Needs............................................................................................. 13
Table 8 Capital Project Funding Sources, Restrictions, and CIP Constraints/Risks ....................... 13
Figure 2 Capital Improvement Planning Model ................................................................................ 15
Major General Fund Revenue Growth ................................................................................................ 16
Table 9 New Major General Fund Revenues to Fund Infrastructure ............................................... 16
Table 10 General Fund Infrastructure Investment Priorities ............................................................ 16
Projected Capital Asset Needs and Funding: FY 2017 - 2021 ............................................................... 17
Table 11 Summary of Infrastructure Needs, Funding, and Funding Gap FY 2017 – FY 2021 ........ 17
Table 12 Summary of Projected Capital Asset Needs FY 2017 - FY 2021 ..................................... 17
Table 13 Summary of Capital Funding Projections FY 2017 - FY 2021 .......................................... 18
Table 14 Accessibility - ADA Asset Type ......................................................................................... 18
Table 15 Airports ............................................................................................................................. 18
Table 16 Bike Paths ........................................................................................................................ 19
Table 17 Bridges ............................................................................................................................. 19

City of San Diego FY 2017-2021 Five-Year Capital Infrastructure Planning Outlook
Table 18 Facilities- General Fund .................................................................................................... 19
Table 19 Fire Stations and Lifeguard Stations ................................................................................. 20
Table 20 Landfills ............................................................................................................................ 20
Table 21 Libraries ............................................................................................................................ 21
Table 22 Parks, Golf Courses, and Mission Bay Improvements ..................................................... 21
Table 23 Police Stations .................................................................................................................. 22
Table 24 Qualcomm Stadium .......................................................................................................... 22
Table 25 Sidewalks.......................................................................................................................... 22
Table 26 Storm Water Infrastructure (Drainage) ............................................................................. 23
Table 27 Streetlights ........................................................................................................................ 23
Table 28 Streets- Modifications and Pavement ............................................................................... 24
Table 29 Traffic Signals/Signal Communication .............................................................................. 24
Table 30 Wastewater and Water Infrastructure ............................................................................... 25
Pure Water San Diego ..................................................................................................................... 25
Conclusion .............................................................................................................................................. 26
Appendix A: CIP Funding Source Projections ........................................................................................ 27
Appendix B: Summary of Capital Needs, Funding, and Fiscal Gap ....................................................... 29
Hyperlinked References.......................................................................................................................... 32
List of Abbreviations
1. ADA: Americans with Disabilities Act
2. AMD: Asset-Managing Department
3. CIP Outlook: Five Year Fiscal Year 2017 – 2021
Capital Infrastructure Planning Outlook
4. CIP: Capital Improvement Program
5. CIPRAC: Capital Improvements Program Review
and Advisory Committee
6. City: City of San Diego
7. CNG: Compressed Natural Gas
8. CPC: Community Planners Committee
9. CPG: Community Planning Groups
10. DIF: Developer Impact Fees
11. FBA: Facilities Benefits Assessments
12. FCA: Facility Condition Assessment
13. FCI: Facility Condition Index
14. FY: Fiscal Year
15. IAM: Infrastructure Asset Management
16. IBA: Office of the Independent Budget Analyst
17. JOC: Job Order Contract
18. MACC: Multiple Award Construction Contract
19. MADs: Maintenance Assessment Districts
20. Metro: Metropolitan System (for wastewater)
21. Muni: Municipal System (for wastewater)
22. OCI: Overall Condition Index (of pavement)
23. PLWTP: Point Loma Wastewater Treatment Plant
24. SLBE/ELBE: Small Local Business Enterprise/
Emerging Local Business Enterprise Program
25. SLS: Service Level Standard

Executive Summary
The City of San Diego (City) Fiscal Year (FY) 2017-2021 Five-Year Capital Infrastructure Planning Outlook (CIP
Outlook) models long-range fiscal and capital asset planning. This is the second CIP Outlook the City has published
since January 2015 which aims to provide information on the basis for revenue projections, criteria to determine
capital infrastructure needs, and present a broad overview of capital infrastructure needs and funding over the next
five fiscal years. The CIP Outlook is developed to closely follow the annual release of the Five-Year Financial
Outlook in an effort to accurately forecast future available funding for capital projects and drive long-term
infrastructure planning.
This CIP Outlook provides the City Council and the public an informative capital needs setting to support an informed
discussion formally held during development of the FY 2017 Annual Budget. This document is not a budget, and
therefore does not include all departmental or public requests that may be considered in the preparation of future
annual budgets1.
Improved Long-Term Planning to Better Manage City Infrastructure This report represents a positive shift in practice by providing a comprehensive evaluation and analysis of the
planning that occurs across a wide array of City departments. San Diego’s infrastructure backlog was created over
several decades and further impacted by the lack of coordinated long-range planning. The compilation of
infrastructure data citywide will allow for improved management of the City’s capital assets. As part of the Mayor’s
initiative to improve the management of the City’s Capital Improvement Program (CIP), this document will continue
to be refined to better reflect the City’s strategic initiatives, updated condition assessments and established service
level standards.
A Focus on Infrastructure Investment As the economy has improved, the Mayor and City Council have continued to prioritize infrastructure investment.
Over the next five years, the City’s CIP is expected to grow by an additional $468.3 million from the FY 2016 Annual
CIP Budget of $367.6 million, and includes major infrastructure investments in streets, sidewalks, water quality,
libraries, parks, public safety and other high priority neighborhood projects. Projected revenues have grown from
the previous CIP Outlook from $2.16 billion to $2.85 billion over the next five years, an increase of approximately
$690 million to support the City’s CIP.
Through the CIP Outlook period, an estimated $2.85 billion in revenue will be available for capital projects and
includes the commitment of at least 50 percent of new major General Fund revenue growth to be dedicated to fund
infrastructure2, totaling approximately $203.6 million. The Mayor continues to pledge at least 50 percent of new
major revenue growth from the General Fund to investments in infrastructure. The FY 2016 Adopted Budget
1 Financial Management Department publishes the CIP Adopted Budget annually. The Citizens Guide to the Capital Improvement Program produced by the Office of the Independent Budget Analyst, provides additional useful information about the City’s CIP. 2 The amounts do not only improve current infrastructure assets, but can also support bond payments, and new and existing infrastructure.

City of San Diego FY 2017-2021 Five-Year Capital Infrastructure Planning Outlook
Page 2
included a net $43.9 million in new infrastructure expenditures of which $34.2 million was allocated directly to the
CIP and the remaining towards operational infrastructure expenditures.
The FY 2016 total amount of $34.2 million represents a significant shift in practice of funding the City’s CIP from
the General Fund, demonstrating a strong commitment to infrastructure investment. Table 1 below highlights the
total General Fund projected investments referenced in the recently released FY 2017 – 2021 Five-Year Financial
Outlook identified to address priority infrastructure needs.
Table 1 General Fund Infrastructure Investments: FY 2017 – FY 2021
The increased contribution of general funds are in addition to other major revenue sources for the CIP. Figure 2
illustrates major CIP funding sources.
Figure 1 FY 2016 Adopted CIP Budget Funding Sources
An estimated $4.24 billion capital infrastructure needs exist over the next five fiscal years, which includes continuing
expenditure needs of existing CIP projects from the FY 2016 Annual CIP Budget, as well as newly identified capital
asset needs based on regulatory requirements or other specific criteria further explained in this report. An estimated
additional $1.4 billion would be required to meet all of the needs outlined. This projected funding gap has been
reduced by approximately $300 million due primarily to increases in projected funding and modifications to storm
water regulations.
Infrastructure Needs (in millions)
FY 2017 FY 2018 FY 2019 FY 2020 FY 2021 TOTAL
Expenses $ 21.7 $ 32.6 $ 43.2 $ 49.6 $ 56.6 $ 203.6

City of San Diego FY 2017-2021 Five-Year Capital Infrastructure Planning Outlook
Page 3
Building an Efficient Capital Improvement Program As the CIP program grows it is critical to efficiently manage and deliver capital projects. To accommodate growth
and build organizational capacity in the CIP, multiple process improvements have been recently implemented while
many others are in progress. Table 2 exhibits current status of these efforts.3 These reforms build on previous
measures to streamline processes to reduce contracting time by eliminating duplicative and redundant processes.
Table 2 CIP Status of Streamlining Measures and Process Improvements CIP Streamlining Measure and Process Improvement Description Implemented In Progress
Expansion of the Multiple Award Construction Contract (MACC) Program Increased task order limit to $30.0 million and conversion to a permanent program, allowing construction to begin sooner than traditional delivery methods.
X
Online Bidding and Award of Construction Contracts Replaced hard copy bids for electronic submittals, allowing for reduced contract award periods. X Streamlined Environmental Review Delegated limited CEQA determinations authority to the Public Works Department and dedicated staff within Development Services to accelerate environmental review processes.
X
Expanded Use of Job Order Contracts (JOC) Use multiple JOCs for each type of work for improved reliability and increased capacity. X Expanded Use of City Construction Crews for Small Projects Use of City Forces to perform work on projects that do not require engineering plans for improved responsiveness to smaller CIP needs.
X
Better Coordinate Paving Roads with Current Projects Combines street resurfacing improvements with current underground infrastructure projects to accelerate implementation permanent paving and reduce community impacts.
X
Community-Based Competitive Design A fixed-price/fixed-schedule design-build approach for new building projects that involves the community at the early project stages for the input and ranking of the competing architects' proposed conceptual designs, reducing overall project duration and related costs.
X
Agreed Contracting Out Protocols for Engineering Services Agreed understanding with impacted labor organization for contracting specialty types of work to accelerate CIP project designs.
X
Park General Development Plan Reform An amendment of Council Policy 600-33 - Public Notification and Input for City-Wide Park Development Projects, to improve process of final approval for parks project scopes.
X
Standardized Designs for Fire Stations, Comfort Stations, and Shade Structures Establishment of standard design scoping templates and performance specifications for new fire stations, comfort stations, and shade structures, reducing overall duration and related costs.
X
Options (Batch) Contracting Multiple similar facilities projects are grouped and issued as a single design-build contract with a fixed per project price over a set period. Individual projects within the contract can start construction as funding becomes available, reducing time associated with procurement.
X
Electronic Review Process for Mayoral Action Documents (PA 2625) On-line system modeled after the existing e1472 system, which will accelerate the action approvals and the overall delivery of CIP projects.
X
Increased Size of Average Construction Contracts Combines similar CIP needs or those in the same geographical area into larger projects. X Improved Cash Monitoring4 This effort involves monitoring of cash spending on CIP projects and moving funds if needed to support project execution.
X
Establish A Commercial Paper Program This program, once finalized, is intended to serve as a short-term financing tool for CIP projects to improve the process for timely execution of large contracts and reduce negative arbitrage.
X
3 Report No 15-020 CIP Process Improvement and Streamlining was presented to the City Council Infrastructure Committee on March 11, 2015. 4 Additional information is contained in Report No. 15-107 Semi-Annual CIP Budget Monitoring Report will be presented to the City Council Infrastructure Committee on December 9, 2015.

City of San Diego FY 2017-2021 Five-Year Capital Infrastructure Planning Outlook
Page 4
Report Overview and Methodology
The CIP Outlook is developed to closely follow the annual release of the Mayor’s Five-Year Financial Outlook to
replace prior revenue growth projections eligible to fund possible future capital infrastructure asset needs. The
preliminary funding analysis included in the CIP Outlook is also intended to support development of the Annual CIP
Budget. This CIP Outlook report provides the City Council and the public an informative capital asset needs setting
to support an informed discussion formally held during development of the FY 2017 Adopted CIP Budget.
The funding analysis portion of this report is separated into two primary segments: projected expenditures of
identified infrastructure capital needs and forecasted eligible revenues to support those capital needs. The projected
expenditure segment is further categorized by capital asset type. These segments consist of the City’s projections
for the next five fiscal years of ongoing and one-time revenues and expenditures, including adjustments necessary
to support current or anticipated service levels or conditions of specific capital assets. The forecasted revenue
sources that are eligible to fund CIP projects include a significant portion of new major General Fund growth
projections to support infrastructure priorities.
The City’s FY 2016 Adopted CIP Budget provided the baseline expenditure values as the starting point to formulate
projections over the next five fiscal years. The adopted budget allocates existing and anticipated funds to both new
and continuing projects in the City’s multi-year CIP. Table 3 below displays the baseline expenditures referenced
from the FY 2016 Adopted CIP Budget, currently totaling a $7.57 billion multi-year CIP.
Table 3 City of San Diego Multi-Year CIP5
Multi-Year CIPPior Year for
Existing CIP ProjectsFiscal Year 2016 Adopted Budget
Future Years for Existiing CIP Projects
TOTAL
CIP Project Expense $ 2,302,429,835 $ 367,636,374 $ 4,897,001,289 $ 7,567,067,498
The ‘Future Years for Existing CIP Projects’ expenditure referenced in the table above displays approximately $4.9
billion of funding needed in future years to complete existing CIP projects and does not include all of the unfunded
needs or include newly identified needs that could become CIP projects in the future.
In preparation for this report and to identify new capital asset needs to support infrastructure, Asset-Managing
Departments (AMD) submitted a total of approximately $4.13 billion in capital infrastructure requests over the next
five fiscal years, which includes continuing expenditure needs of existing CIP projects from the FY 2016 Annual
CIP Budget, as well as newly identified capital asset needs based on regulatory requirements or other specific
criteria further explained in this report. In addition, City departments that serve as revenue source administrators
for certain fund sources eligible to fund capital needs also submitted growth projections over the next five fiscal
years.
5 The data in this table is based on existing CIP projects in the Adopted FY16 CIP Budget. “Future Years” includes expenses through the life of existing CIP projects, which could extend beyond five fiscal years.

City of San Diego FY 2017-2021 Five-Year Capital Infrastructure Planning Outlook
Page 5
Report Assumptions
For the purpose of this report, information was collected from AMDs that primarily focused on the top ten
infrastructure capital assets based on 2013 survey data, and informed by the City Council’s Infrastructure
Committee’s indication that these assets are the highest areas of public interest for investment. These assets are
identified in Table 4 below and also include additional assets AMDs submitted for this CIP Outlook.
Table 4 Top Ten Infrastructure Capital Assets and Additional Assets Included Top Ten Infrastructure Capital Assets (in alphabetical order) Asset-Managing Department (AMD)
Bridges Transportation & Storm Water
Fire Stations Fire-Rescue
Park and Recreation Sites Park and Recreation
Police Stations Police
Sidewalks Transportation & Storm Water
Storm Water Infrastructure Transportation & Storm Water
Streetlights Transportation & Storm Water
Streets and Roads Transportation & Storm Water
Wastewater Infrastructure Public Utilities
Water Infrastructure Public Utilities
Additional Infrastructure Capital Assets (in alphabetical order) Asset-Managing Department (AMD)
Airports Real Estate Assets
Americans with Disabilities Impacted Capital Assets Office of ADA Accessibility and Compliance
Bike Paths Transportation & Storm Water
General Public Facilities6 Public Works, Facilities Division
Landfills Environmental Services
Libraries Library
Lifeguard Stations Fire-Rescue
Traffic Signals Transportation & Storm Water
While the CIP Outlook attempts to present a comprehensive inventory of citywide capital asset needs and identify
potential future funding sources for those needs, some capital assets and revenue sources are either not included
or are partially projected in report. This is due to a variety of reasons outlined in Table 5. These assumptions
collectively contribute to the complexity of developing a multi-billion capital plan and executing improvements of a
heavily urbanized infrastructure system and are influenced by limited resources, competing priorities, changing
demographics, performance capacity, and numerous other challenges.
6 These facilities are in reference to structures maintained by the General Fund for operational use such as City Administration Building, Operations Yards, and other locations where City employees work or are available for public use.
City of San Diego FY 2017-2021 Five-Year Capital Infrastructure Planning Outlook
Page 6
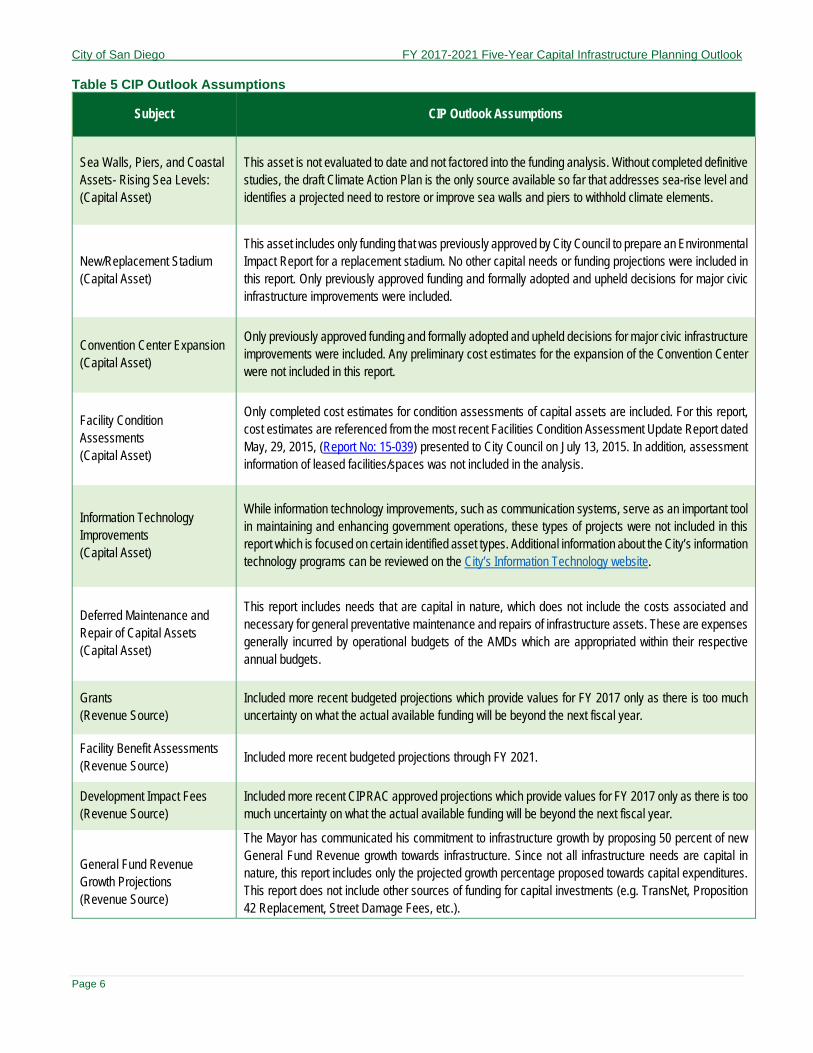
Table 5 CIP Outlook Assumptions
Subject CIP Outlook Assumptions
Sea Walls, Piers, and Coastal Assets- Rising Sea Levels: (Capital Asset)
This asset is not evaluated to date and not factored into the funding analysis. Without completed definitive studies, the draft Climate Action Plan is the only source available so far that addresses sea-rise level and identifies a projected need to restore or improve sea walls and piers to withhold climate elements.
New/Replacement Stadium (Capital Asset)
This asset includes only funding that was previously approved by City Council to prepare an Environmental Impact Report for a replacement stadium. No other capital needs or funding projections were included in this report. Only previously approved funding and formally adopted and upheld decisions for major civic infrastructure improvements were included.
Convention Center Expansion (Capital Asset)
Only previously approved funding and formally adopted and upheld decisions for major civic infrastructure improvements were included. Any preliminary cost estimates for the expansion of the Convention Center were not included in this report.
Facility Condition Assessments (Capital Asset)
Only completed cost estimates for condition assessments of capital assets are included. For this report, cost estimates are referenced from the most recent Facilities Condition Assessment Update Report dated May, 29, 2015, (Report No: 15-039) presented to City Council on July 13, 2015. In addition, assessment information of leased facilities/spaces was not included in the analysis.
Information Technology Improvements (Capital Asset)
While information technology improvements, such as communication systems, serve as an important tool in maintaining and enhancing government operations, these types of projects were not included in this report which is focused on certain identified asset types. Additional information about the City’s information technology programs can be reviewed on the City’s Information Technology website.
Deferred Maintenance and Repair of Capital Assets (Capital Asset)
This report includes needs that are capital in nature, which does not include the costs associated and necessary for general preventative maintenance and repairs of infrastructure assets. These are expenses generally incurred by operational budgets of the AMDs which are appropriated within their respective annual budgets.
Grants (Revenue Source)
Included more recent budgeted projections which provide values for FY 2017 only as there is too much uncertainty on what the actual available funding will be beyond the next fiscal year.
Facility Benefit Assessments (Revenue Source)
Included more recent budgeted projections through FY 2021.
Development Impact Fees (Revenue Source)
Included more recent CIPRAC approved projections which provide values for FY 2017 only as there is too much uncertainty on what the actual available funding will be beyond the next fiscal year.
General Fund Revenue Growth Projections (Revenue Source)
The Mayor has communicated his commitment to infrastructure growth by proposing 50 percent of new General Fund Revenue growth towards infrastructure. Since not all infrastructure needs are capital in nature, this report includes only the projected growth percentage proposed towards capital expenditures. This report does not include other sources of funding for capital investments (e.g. TransNet, Proposition 42 Replacement, Street Damage Fees, etc.).

City of San Diego FY 2017-2021 Five-Year Capital Infrastructure Planning Outlook
Page 7
Capital Improvement Program (CIP) Overview
The City’s CIP is a compilation of capital improvement projects and annually adopted funding sources. CIP projects
provide improvements or additions to the City’s vast infrastructure systems designed to enhance overall quality of
life. Executing the CIP portfolio is complex in nature due to the size and variety of funding sources, asset types,
and project delivery methods. Implementation of the CIP is consistent with the City's adopted General Plan,
community plans, and other applicable plans.
The City engages in many processes to establish an infrastructure project which includes identifying a proposed
need, vetting that proposed need to established criteria, defining scope definition, estimating project costs,
assigning prioritization, securing funding, and executing a quality project to completion safely and within budget and
schedule.
A capital project is defined and based on construction, purchase, or major renovation of facilities, utility systems,
roadway projects as well as land acquisition that adds significant life and value to the City’s assets. The City’s State
of the CIP Report issued semi-annually covers activity status and performance data of current CIP projects and
current trends impacting the CIP. Each AMD is responsible for operations and maintenance needs to maintain and
repair its own infrastructure through condition assessments and maintenance schedules. A repair that extends the
life of an asset is considered capital since it adds value to the asset. Infrastructure needs also include rehabilitation
or major upgrades of existing infrastructure as well as which require capital investment. These latter types are
referred to as CIP projects.
CIP Review Advisory Committee (CIPRAC) The City manages participation of several City departments organized through a process to move capital projects
and proposed allocations of available capital funds forward. This process is currently coordinated by the Capital
Improvements Program Review and Advisory Committee (CIPRAC) which includes membership of the following
City Departments:
Asset-Managing City Departments (AMD) CIP Service-Providing City Departments
Environmental Services Office of ADA Compliance and Accessibility Fire-Rescue Office of the City Comptroller Library Planning Park and Recreation Debt Management Police Financial Management Public Utilities Public Works, Engineering and Capital Projects Branch
Real Estate Assets (including airports and stadiums) Public Works, Facilities Division
Transportation and Storm Water Public Works, Contracts Branch Civic San Diego (agency) Purchasing and Contracting
CIPRAC functions as a City-staffed advisory committee that reviews all proposed CIP projects with a preliminary
scope of work and cost estimates from a citywide perspective, providing the Mayor with proposed CIP budget and
project prioritization recommendations. Consistent with Council Policy 800-14, CIPRAC evaluates all requested
projects to assist decision-makers to compare costs and benefits to make best use of available funding resources.

City of San Diego FY 2017-2021 Five-Year Capital Infrastructure Planning Outlook
Page 8
Infrastructure Asset Management (IAM) Program
The City is responsible for maintaining a large and complex network of infrastructure assets. Effective maintenance
and capital renewal strategies are necessary to ensure public health, safety, and quality of life for the public. Asset
Management is an industry best business practice for managing infrastructure assets at a certain standard for the
lowest life cycle cost. The Asset Management approach is based on having key data on infrastructure assets, such
as current conditions, so that the City can make optimal maintenance and repair and capital investment decisions.
In FY 2014, City Council approved Council Policy 800-16 to implement Asset Management and in FY 2015, the City
established the IAM Program (formerly Enterprise Asset Management). The IAM Program core goals are to
implement the Council Policy, coordinate standards for asset management programs, and lead implementation of
a software solution for improving management of infrastructure assets— the I AM San Diego Project.
The I AM San Diego Project The I AM San Diego Project is a citywide strategic initiative to develop and implement an integrated software solution
to improve the City’s management of infrastructure assets by managing maintenance along with capital asset
management, condition assessments, renewal and replacement prioritization and planning, and needs forecasting.
The project is a critical step toward full replacement of existing disparate, obsolete, and ineffective maintenance
management systems now in use within several City Departments.
Included in the scope of the project is asset-based capital planning, projects, and portfolio management which will
allow for staff to assess and measure lifecycle costs; forecast for condition, risk, cost, and failure. The system will
enable the City to better prioritize, plan, and deliver needed maintenance and capital projects for infrastructure; and
develop optimal maintenance and capital investment strategies.
Key milestones include the initiation of business process consulting services in early December 2015 and the on-
boarding of the Systems Integrator, which will initiate the Project Preparation Phase in February 2016. In future
years, the IAM system will support establishing stronger analysis of capital needs for the CIP Outlook.
Condition Assessments The City owns and maintains depreciable capital assets such as streets, bridges, parks, public facilities, and
airports. Due to tight financial constraints, the City has previously deferred maintenance and capital expenditures
related to these assets, which resulted in deteriorated infrastructure. The Facility Conditions Assessments (FCA)
are required for health and safety conditions of building occupants, code violations, energy saving opportunities,
and project planning. Contents of the FCA Update Report that was presented to the City Council earlier this year
has been included in the funding analysis basis for facilities’ capital needs.
In FY 2015, the City made a substantial investment in funding condition assessments, some of which have been
completed. One of these is the latest street condition assessment survey which is expected to conclude the data
collection evaluation in December 2015 and final results are anticipated to be released in a report in early calendar
year 2016. This will provide the City with updated information on the required repairs to meet the City’s street
condition goals. Table 6 provides the most current status of condition assessments.

City of San Diego FY 2017-2021 Five-Year Capital Infrastructure Planning Outlook
Page 9
Table 6 Current Status of Condition Assessments
Capital Asset Type Current Status of Condition Assessments
Facilities - General Fund
Planned to be completed in early December 2015 and results presented in early
calendar year 2016.
A partial report was provided in the FCA Update Report presented earlier this year.
Facilities - Public Utilities 85% near completion. Final results expected to be completed in FY 2016.
Facilities - Park and Recreation Anticipated to be completed in FY 2016.
Developed Parks Anticipated to be completed in FY 2020.
Sidewalks Completed. Results report released in September 2015.
Streets Completed. Results report planned to be released in early calendar year 2016.
Water and Wastewater Part of Five-Year Condition Assessment Program (FY 2013-2017), although some
survey portions might extend beyond FY 2017.
Conducting condition assessments to collect detailed and up-to-date information on infrastructure assets is a critical
component of Asset Management so that the City can plan effective maintenance and repair and capital investment
strategies to ensure the reliability and sustainability of capital assets. The City will have a better understanding of
funding needs related to capital expenditures of its depreciable assets as data becomes available from the on-going
condition assessments. At that time, the prioritization of scheduling and funding capital needs will be re-evaluated.
Operations and Maintenance Impacts to Capital Renewal Conducting preventative maintenance and corrective repairs annually is vital for optimizing the life of capital assets
at the lowest lifecycle cost. When on-going maintenance is not fully funded, it contributes to deferred maintenance
and capital, raises risks to the public, and increases repair and replacement costs. While capital repair,
rehabilitation, or replacement are eligible to be in the CIP, maintenance is considered to be an operational cost
typically funded by the AMD’s operating budget, Facilities Division’s operating budget, or other non-capital funding
sources. Further, many available funding sources have restrictions on how much of the funds can be used for
maintenance such as TransNet, which limits operational maintenance to 30 percent of the total funds the City
receives.

City of San Diego FY 2017-2021 Five-Year Capital Infrastructure Planning Outlook
Page 10
Identifying Capital Needs
Numerous factors affect what triggers and defines a capital asset need. Significant factors include consideration of
public health and safety, adhering to federal, State and local laws, adopting and adhering to service level standards
(SLS), and evaluating asset condition assessments. The coordination efforts applied relies on these critical factors
to determine and later prioritize a capital need exists, either as a comparison to the known condition of an existing
asset or determining a missing asset.
Federal and State Mandated Requirements The City faces a wide range of mandates and from various regulatory agencies regarding specific designs and
attributes of an asset which have consequences if the mandate is unmet. Many of these legal mandates regulate
a specific standard to preserve and maintain a public health standard to protect the environment, such as water
and air quality rules, and also to provide a level of access to the public for services. Some CIP projects must be
done to comply with these laws and regulations or may be mandated in legal agreements. Failure to meet these
requirements could result in the City facing substantial fines or exposure to litigation. In addition to existing
mandates that regulate capital assets related to water clarity for storm drains and laws that govern standards for
sewer and water pipelines, the City also has requirements regarding the standards for the public’s accessibility for
persons with disabilities.
Americans with Disabilities Act (ADA) Requirements The 1990 ADA Federal law mandates local governments create a complaint process for persons with a disability
who have a grievance against the municipality. The City’s formal ADA complaint process is through its Office of
ADA Compliance and Accessibility. The majority of complaints involve the public right-of-way, such as missing or
inadequate curb ramps, missing sidewalks, and requests for accessible pedestrian signals at signalized roadway
intersections. The City resolves all complaints in the most expeditious way feasible, though many public right-of-
way complaints include complex design elements that may delay an immediate resolution. The City has more than
285 open and unfunded complaints with an approximate remediation cost of $21 million.
ADA law also requires that public entities with 50 or more employees complete a transition plan that identifies and
schedules structural changes to facilities and public rights-of-way needed to achieve accessibility. The City’s
Transition Plan, adopted in 1996, identified 212 high-use City-owned facilities needing architectural barrier removal
to achieve full accessibility. The City has completed all but a small number of the projects on its Transition Plan;
those few remaining are funded but not yet complete.
In 2009 the City hired a consultant to update the Transition Plan that identified 183 high-use public facilities requiring
architectural barrier removal. Since 2009, several of those facilities have been funded and brought into compliance,
though work remains, at an estimated cost of $37 million. Transition Plans are working documents; as such, the
City continues to evaluate its public facilities for compliance with current ADA regulations and update its list of
projects needing barrier removal. In addition to Transition Plan-specific and complaint-related projects, all City
capital projects incorporate ADA components as required by Federal, State, and local laws, building codes and
regulations.

City of San Diego FY 2017-2021 Five-Year Capital Infrastructure Planning Outlook
Page 11
Preservation of Public Safety Public safety assets are assets used by City staff whose mission is to protect, preserve, and maintain safety of the
community, its environment and property. Typical facilities include lifeguard, fire and police stations. Other types of
projects may result in avoiding or reducing risk to public health, safety, and the environment, through improvements
such as reducing traffic collisions, sewer spills, and emergency response times. The City has recognized the value
of fire prevention and the need to prevent or limit the severity of fire, given the type of housing stock, commercial
buildings, and the threat of wildland fires on the City’s edges. To meet these challenges, the City has adopted safety
codes more strenuous than those mandated by state minimums.
In 2010, the City commissioned an expert consultant, Citygate, to examine the City’s ability to meet response time
benchmarks for the Fire-Rescue Department. The consultant’s report, Fire Services Standards of Response
Coverage Deployment Study included findings and recommendations. A working group produced a Five-Year Plan
adopted by City Council in 2011 to implement significant recommendations. Portions of the study results and plan
included recommending new safety infrastructure to improve or maintain response times to emergencies and to
maintain appropriate fire station ratios to support population densities.
Community Input The City is committed to involving the public in developing the CIP. Throughout the project life cycle, the City gains
public input and also provides information on the activities that have the greatest potential impact on the community.
CIPRAC has adopted goals to collect community input consistent with Council Policy 000-32 by providing a public
process to gain input on infrastructure suggestions through the City’s Community Planners Committee7 (CPC).
The Public Works Department, the Office of the IBA, and the Financial Management Department, and the CPC
have provided training sessions in the past for all the Community Planning Groups (CPG) to encourage more
community involvement in the development of the City’s CIP. As a result, a list of community driven proposed CIP
projects were received in late 2013. These proposals have since been reviewed and categorized as a proposed
future CIP projects, current projects or not a CIP project. Of the 374 requests received, 93 have become a CIP
project or are scheduled to become a CIP project within the next 5 years, and, 193 requests have become new
needs searching for additional funding. Details of these efforts are further outlined in the City’s review to these
requests.
The City is characterized by diverse topography and distinctive neighborhoods within 52 community planning areas.
The Planning Department works extensively with CPGs to update community plans to implement citywide goals
and address community-specific issues. Community plans also identify public facilities that are needed to serve the
community and implement the General Plan. These facilities are prioritized by the community, included in an Impact
Fee Study, and serve as the basis for establishing a developer impact fee (DIF). DIF is one of several funding
sources used in the CIP. With many plan updates currently underway, it is anticipated that new and revised projects
will continue to be added to the CIP.
7 The Community Planners Committee was instituted to ensure communication and to solicit resident input on citywide issues among the various planning groups in the City under the direction of Council Policy 600-09.

City of San Diego FY 2017-2021 Five-Year Capital Infrastructure Planning Outlook
Page 12
Establishing and Evaluating Service Level Standards Level of Service is the defined service quality for a particular activity against which service performance may be
measured. Service Level Standards (SLS) set a threshold for public infrastructure needs and usually relate to
quality, quantity, reliability, responsiveness, environmental, acceptability, and cost. Many of the City’s existing SLS
were established as part of the General and community plans; federal, state, and regional regulations and laws;
and industry standards. These SLS reflect accepted infrastructure requirements such as increased park space,
access to public safety, improved traffic patterns, and adding public safety facilities. Table 7 below displays various
plans that directly or indirectly address SLS and serve to guide the AMDs in determining a capital need.
Table 7 Service Level Standard Sources
Capital Asset Type Current Service Level Standard Source
Airports Federal Aviation Administration and Industry Standards
Bicycle Mobility/Bike Paths San Diego Bicycle Master Plan
Bridges CALTRANS rating criteria
Civic, Cultural and Community Centers Facility Condition Index (FCI)
Disabled Access Federal Regulations and Laws
Fire Stations Fire Department Standard of Response Coverage - Citygate Study
Golf Courses Five-Year Golf Plan, 2012
Libraries General Plan and American Library Association Guidelines
Lifeguard Stations General Plan and Department Standards
Recreation Centers General Plan and Department Standards
Police Stations General Plan, Industry Standards, and Department Standards
Sidewalks Community Plans, Mobility Plans, and Transportation Needs List
Sporting Event Venues, Stadiums, Convention Center Industry Standards and Contractual Obligations
Storm Water Included in the Watershed Asset Management Plan - 2013
Streetlights Community Plans, Mobility Plans, and Transportation Needs List
Streets and Roads Overall Condition Index (OCI), Pavement Condition
Water and Wastewater State and Federal Regulations
The City continues to build upon current SLS to include all assets, and to evaluate outdated SLS. Newer initiatives
that have capital improvement components may develop new standards that need to be met along with other
existing standards. Newer standards will impact the future capital planning efforts and it is also possible they may
result in revising scopes of work and cost projections of current CIP projects.

City of San Diego FY 2017-2021 Five-Year Capital Infrastructure Planning Outlook
Page 13
Identifying Sources to Fund Capital Needs
The following section provides details of the City’s funding sources that are most often used to support infrastructure
capital needs. The City’s CIP uses a variety of on-going and one-time funding sources to fund CIP projects.
Appropriating funds to meet capital needs is contingent upon forecasting revenues to be received for a specific
year. Definitions, restrictions, and constraints of funding sources to support capital needs are described in Table
8. Some of the below identified funding sources in this table do not always realize revenue as planned due to various
reasons such as economic down-turns, lack of land sales (Capital Outlay Fund), rate of development delays
(Developer Impact Fees and Facilities Benefit Assessment funds).
Table 8 Capital Project Funding Sources, Restrictions, and CIP Constraints/Risks Funding Source Restrictions Constraints/Risks
Bond Financing Limited to infrastructure for which the bonds were intended Contingent on the ability and option of the City to bond
Capital Outlay Used exclusively for acquisition, construction, and completion of permanent public improvements or real property
Contingent upon land sales
Development Impact Fees (DIF)
Limited to communities in which each fee was collected Contingent upon development and developers submitting their fees
Donations and Developer Funding
Donations may be restricted by the donor to a particular purpose
Developer Funding is restricted to certain projects (or types), in certain areas
Donations must be received by the donor
Developer Funding must be received by the developer
Enterprise Funds (e.g. water, sewer, golf, airports)
Must be used to support the services that provide the revenue
Based on user revenues and established user fee rates
Facilities Benefit Assessments
Limited to the designated area of benefit in the community planning area
Contingent upon development and developers submitting their fees
General Fund Limited to General Fund-managed assets Use of monies for CIP projects impacts the operational budgets of the departments requesting these funds
Grants Used for purposes approved by granting agency Contingent upon grant being awarded
Maintenance Assessment Districts (MADs)
Limited to projects within MAD boundaries Based upon the amount of assessments charged to each property owner in the district
Mission Bay and Regional Park Improvement Funds
Mission Bay Improvements Funds must be used on specific projects listed in the City Charter.
Regional Park Improvement Funds must be used in the City’s regional parks and recommended by the Regional Park Improvements Fund Oversight Committee.
Based on annual lease revenue generated in Mission Bay Park.
Park Service District Funds
Limited to park and recreational facilities within the district areas from which the funds were collected
These funds no longer collect revenue and have been replaced by a park component of FBAs and DIFs
Special Revenue Funds
Must be used for the specifically identified purpose of the fund
Revenue must be received
TransNet Funds Limited to projects that provide congestion relief and transportation improvements
Contingent on revenue from a one-half cent local sales tax

City of San Diego FY 2017-2021 Five-Year Capital Infrastructure Planning Outlook
Page 14
Grant funding is difficult to predict for the outlying years of this report’s projections due to complex contingency
requirements in order to continue eligibility to receive additional grants. This is common for very large scale
projects, such as improvements to bridges, as well for Community Development Block Grants. Additionally, DIF
revenue is also not projected beyond FY 2017 since this revenue is contingent upon private development activity
which is also difficult to predict for outlying years.
Review of Infrastructure Financing Generally, most funding sources must be applied strictly for purposes intended for a specific program. For example,
the goal of TransNet funding is to reduce traffic congestion, and therefore can only be used for street improvements
and assets within the right-of-way. DIFs are assessed to mitigate the impacts of development assessed within a
specific community and must be used for expanded or new facilities for that same community. The City’s reliance
on bond financing programs is an equitable and affordable means of financing capital projects and represents an
important component of capital planning to address infrastructure needs. It is the City’s goal to structure and
implement bond financings to provide funding in a timely and cost effective manner for priority capital projects
consistent with the current City’s Debt Policy.
Most General Fund assets do not have the revenue capacity to finance many CIP projects through a pay-go
model. Therefore, the City leverages the General Fund’s assets through the issue of long-term bonds. An
alternative to pay go funding for General Fund capital assets are bond offerings. The City primarily utilizes Lease
Revenue Bonds to finance General Fund capital improvements. The City’s existing general operating revenues are
pledged to pay annual debt service on these bonds. The bond obligations do not authorize the City to levy a new
tax or a charge to repay the bonds. The water and wastewater infrastructure projects are financed with the proceeds
from Water and Sewer Revenue Bonds, with repayment solely derived from revenue generated by water or sewer
rate charges from respective customers.
Capital funding for General Fund asset classes such as streets, facilities, and storm drains have been deferred
resulting in a major capital backlog. To begin to address capital needs within the existing infrastructure, the City
issued bonds for approximately $333 million between 2009 and 2014. These funds were allocated to address
important capital improvements to existing assets and new facilities across the City:
Streets and Sidewalks $157 million
Facilities $107 million
Storm Drains $45 million
Other (e.g. ADA, parks, street lights) $24 million
TOTAL $333 million
Among the Enterprise Funds, the water and wastewater utilities each have large CIP projects traditionally funded
through a combination of cash, bond proceeds, grants, and State Revolving Fund loans, and supported by the
respective system revenues. These capital projects are driven by a need to maintain or replace existing
infrastructure, increase capacity, expand the systems to accommodate growth, and also to comply with federal and
State regulations. These utilities are primarily supported by revenues generated by charges to customers.

City of San Diego FY 2017-2021 Five-Year Capital Infrastructure Planning Outlook
Page 15
Funding Capacity When developing the annual budget, City staff evaluates trends in revenue activity and other general economic
factors that impact changes to CIP project costs and supporting revenue sources. All project costs that are projected
to be incurred upon completion of a project, ramifications of not implementing a project, and potential lost
opportunity costs to the City if a project is delayed are reviewed annually.
The CIP budget is the mechanism that implements the CIP and fulfills a requirement of the City Charter-Section 69.
The City Council annually approves the CIP budget and the allocation of funds for the included projects via the
Appropriations Ordinance, which establishes the legal spending authority for each budgeted fund, department, or
both based upon the adopted budget, City Charter-Section 71. These limits include appropriations carried forward
from prior years as authorized in the City Charter-Section 84.
Spending limits, based on updated information, can be amended during the year through City Council approval. Once all capital needs are identified with project cost estimates, known revenue sources are applied which will
produce a funding needs gap. This is further illustrated in Figure 1 below.
Figure 2 Capital Improvement Planning Model
Capital Improvement Planning
Validate Capital Needs
Review
Council Policy
Eligible Funding Identified
Funding Gap Identified
Scope of Work
Cost Estimate
Funding Eligibility
Prioritization Capital Planning
Planning Capital Projects to Available Funding
Planning Aligned with Known Funding Gap

City of San Diego FY 2017-2021 Five-Year Capital Infrastructure Planning Outlook
Page 16
Major General Fund Revenue Growth The General Fund is the City’s principal operating fund and pays for core City services such as public safety, parks,
transportation and storm water, and library services. These critical services require the use of the majority of City
tax revenue on an annual basis. However, in addition to supporting operational activities, General Fund revenues
also serve as one of the many funding sources for the CIP.
As reflected in the Mayor’s FY 2017 - 2021 Five-Year Financial Outlook, a commitment of at least 50 percent of
new major General Fund revenue growth is dedicated to funding infrastructure. Table 9 provides the most recent
growth projections identified to fund infrastructure through FY 2021.
Table 9 New Major General Fund Revenues to Fund Infrastructure
Based on the Mayor’s recently updated Priority Initiatives, expenditures for infrastructure are projected to more than
double the 50 percent pledge of Major Revenue growth over the next five years. The table below displays a more
detailed overview of those identified goals of pledged funding for infrastructure as referenced in Table 1 earlier in
this report.
Table 10 General Fund Infrastructure Investment Priorities
New Major General Fund Revenues to Fund Infrastrucutre
FY 2017 FY 2018 FY 2019 FY 2020 FY 2021 TOTAL
50% Projected Major General Fund Revenues $15,577,268 $21,844,754 $19,967,771 $19,754,951 $16,991,450 $94,136,193
Infrastructure Needs (in millions)
FY 2017 FY 2018 FY 2019 FY 2020 FY 2021 TOTAL
Deferred Capital Debt Service $ 2.0 $ 7.7 $ 13.4 $ 17.1 $ 16.6 $ 56.8 Industry Standard/CIP Infrastructure Maintenance 2.2$ 4.0$ 5.7$ 7.5$ 9.3$ 28.7$
Infrastructure Asset Management (IAM) $ 7.0 $ 3.5 $ - $ - $ - $ 10.5
Compressed Natural Gas Fueling Station 0.6$ 0.4$ 0.2$ (0.2)$ (0.3)$ 0.7$
Playground Outlay and Rubberized Surfacing $ 0.2 $ 0.2 $ 0.2 $ 0.2 $ 0.2 $ 1.0
Pershing Joint Use Synthetic Turf Replacement 0.5$ 0.7$ -$ -$ -$ 1.2$
Storm Water-Flood Risk Management $ 2.3 $ 2.8 $ 2.5 $ 2.3 $ 2.3 $ 12.3
Storm Water-Water Quality Projects 0.4$ 0.6$ 0.7$ 0.7$ 0.7$ 2.9$ Streets, Sidewalks, and Active & Other Transportation
$ 6.2 $ 10.3 $ 20.5 $ 22.0 $ 27.9 $ 86.9
Police Headquarters Facility Improvements & Feasibility Study 0.3$ 2.5$ -$ -$ -$ 2.8$
Total $ 21.7 $ 32.6 $ 43.2 $ 49.6 $ 56.6 $ 203.6

City of San Diego FY 2017-2021 Five-Year Capital Infrastructure Planning Outlook
Page 17
Projected Capital Asset Needs and Funding: FY 2017 - 2021
This report further presents projected revenues for new and deferred capital needs over the next five fiscal years.8
The projected capital needs through FY 2021 are approximately $4.24 billion, with approximately $2.85 billion of
projected funding with an estimated funding gap of $1.4 billion reflected in Table 11. Table 12 provides projected
expenditures of capital needs by asset type. This does not represent the entire value of all City infrastructure needs
since not all capital needs could be reasonably addressed within the next five years. There are several asset types
with needs fully funded by enterprise funds not related to the funding gap. Enterprise Funds account for specific
services funded directly by fees and charges to users such as water and sewer services intended to be self-
supporting.
Table 11 Summary of Infrastructure Needs, Funding, and Funding Gap FY 2017 – FY 2021
Table 12 Summary of Projected Capital Asset Needs FY 2017 - FY 2021
In order to effectively plan the execution of capital needs, the City needs to provide reasonable projections of cash
flows displayed in Table 13 for the projected funding per asset type. As noted in the assumptions identified in Table
5 earlier in this report, some funding sources are projected only on an annual basis such as DIFs and grants. While
the needs may be eligible for these funding sources are included, projections beyond FY 2017 for these fund
sources is not included in this report. The following section beginning with Table 14 provides additional detail of
projected capital needs, funding sources, and additional information regarding unique needs for each asset type.
8 Projections displayed in this report are not a part of the annual Appropriations Ordinance adopted by City Council.
FY 2017 FY 2018 FY 2019 FY 2020 FY 2021 TotalCapital Needs 780,099,919$ 685,406,145$ 638,867,996$ 912,170,099$ 1,225,416,497$ 4,241,960,655$ Funding 633,954,622 457,575,325 398,821,948 522,044,264 835,932,515 2,848,328,673 Gap 146,145,297$ 227,830,820$ 240,046,048$ 390,125,835$ 389,483,982$ 1,393,631,982$
FY 2017 FY 2018 FY 2019 FY 2020 FY 2021 TotalAsset TypeADA 6,400,000$ 8,500,000$ 8,500,000$ 8,500,000$ 8,500,000$ 40,400,000$ Airports 7,000,000 6,566,667 7,750,000 4,500,000 4,000,000 29,816,667 Bike Paths 5,250,000 17,610,000 19,391,468 18,310,000 18,680,000 79,241,468 Bridges 140,099,330 5,956,000 3,542,000 29,357,000 8,454,000 187,408,330 Facilities 14,735,914 38,000,000 52,590,554 60,000,000 60,000,000 225,326,468 Fire Stations 850,000 10,913,688 12,774,864 18,226,099 42,726,919 85,491,570 Landfills 6,000,000 9,900,000 19,000,000 - - 34,900,000 Libraries 11,774,505 - 18,304,201 37,395,842 15,150,860 82,625,408 Lifeguard Stations - - - - 10,735,444 10,735,444 Parks 27,096,778 89,113,571 31,401,196 32,935,282 32,724,804 213,271,630 Police Stations 10,353,460 3,788,076 - - - 14,141,536 QUALCOMM Stadium 750,000 750,000 750,000 750,000 750,000 3,750,000 Sidewalks 9,010,000 20,770,000 21,100,000 21,450,000 21,800,000 94,130,000 Storm Water 70,191,534 77,512,844 83,800,697 89,272,166 95,411,929 416,189,170 Streetlights 31,210,000 39,470,000 39,700,000 39,940,000 40,190,000 190,510,000 Streets and Roads - Modifications 59,716,000 10,565,000 14,845,676 26,310,100 3,280,000 114,716,776 Streets and Roads - Pavement 83,100,000 83,100,000 83,100,000 83,100,000 83,100,000 415,500,000 Traffic Signals 11,750,000 11,160,000 27,510,000 28,080,000 28,490,000 106,990,000 Wastewater 112,558,588 113,604,077 73,939,334 78,587,181 239,335,334 618,024,513 Water 172,253,811 138,126,221 120,868,006 335,456,429 512,087,208 1,278,791,675 Total Capital Needs 780,099,919$ 685,406,145$ 638,867,996$ 912,170,099$ 1,225,416,497$ 4,241,960,655$

City of San Diego FY 2017-2021 Five-Year Capital Infrastructure Planning Outlook
Page 18
Table 13 Summary of Capital Funding Projections FY 2017 - FY 2021
Accessibility- ADA Transition Plan, AMD: Various depending on asset type Table 14 Accessibility - ADA Asset Type
Disability access improvements are an integral part of several various asset types. DIF funding identified are for
complaint-based curb ramp installations. Many other complaints require additional funding, such as requests for
missing sidewalks, accessible pedestrian signals, and missing or non-compliant curb ramps. The City has over 285
open and unfunded complaints with an approximate remediation cost of $21 million. Costs for Transition Plan and
complaint remediation projects is currently estimated at $52 million. Since FY 2008, the City has invested an
average of $6.6 million annually in barrier removal projects. In addition, all facility improvements include ADA
requirements and other projects such as street resurfacing or pipeline replacement install ADA curb ramps annually.
Airports, AMD: Real Estate Assets Department Table 15 Airports
The Airports Division manages Brown and Montgomery Air Fields with a combined 1,330 acres. These two general
aviation airports contain nearly eight miles of runways and taxiways which safely accommodate over 275,000
annual aircraft operations. Rehabilitation of roadways and taxiways are necessary to maintain safety and to adhere
to federal grant requirements.
FY 2017 FY 2018 FY 2019 FY 2020 FY 2021 TotalAsset TypeADA 759,600$ -$ -$ -$ -$ 759,600$ Airports 7,000,000 6,566,667 7,750,000 4,500,000 4,000,000 29,816,667 Bike Paths 750,000 750,000 2,181,468 750,000 750,000 5,181,468 Bridges 117,588,260 500,000 500,000 500,000 500,000 119,588,260 Facilities 12,000,000 12,000,000 12,000,000 - - 36,000,000 Fire Stations 850,000 - 1,861,176 6,462,410 - 9,173,586 Landfills 6,000,000 9,000,000 19,000,000 - - 34,000,000 Libraries 11,655,605 - - 8,372,000 7,286,000 27,313,605 Lifeguard Stations - - - - - - Parks 20,120,680 45,080,283 22,416,288 14,254,282 15,720,269 117,591,801 Police Stations 1,453,460 3,788,076 - - - 5,241,536 QUALCOMM Stadium 750,000 750,000 750,000 750,000 750,000 3,750,000 Sidewalks 4,128,619 6,650,000 9,100,000 6,600,000 6,600,000 33,078,619 Storm Water 24,575,000 24,675,000 24,475,000 6,275,000 6,275,000 86,275,000 Streetlights 1,350,000 2,450,000 6,300,000 3,800,000 3,800,000 17,700,000 Streets and Roads - Modifications 57,061,000 8,635,000 12,680,676 24,250,100 1,160,000 103,786,776 Streets and Roads - Pavement 83,100,000 83,100,000 83,100,000 29,586,862 35,768,705 314,655,567 Traffic Signals - 1,900,000 1,900,000 1,900,000 1,900,000 7,600,000 Wastewater 112,558,588 113,604,077 73,939,334 78,587,181 239,335,334 618,024,513 Water 172,253,811 138,126,221 120,868,006 335,456,429 512,087,208 1,278,791,675 Total Funding 633,954,622$ 457,575,325$ 398,821,948$ 522,044,264$ 835,932,515$ 2,848,328,673$
FY 2017 FY 2018 FY 2019 FY 2020 FY 2021 TotalNeed 6,400,000$ 8,500,000$ 8,500,000$ 8,500,000$ 8,500,000$ 40,400,000$ Funding Source -
Development Impact Fees 759,600 - - - - 759,600 Funding Source Total 759,600$ -$ -$ -$ -$ 759,600$ Gap 5,640,400$ 8,500,000$ 8,500,000$ 8,500,000$ 8,500,000$ 39,640,400$
FY 2017 FY 2018 FY 2019 FY 2020 FY 2021 TotalNeed 7,000,000$ 6,566,667$ 7,750,000$ 4,500,000$ 4,000,000$ 29,816,667$ Funding Source -
Airport Funds 7,000,000 6,566,667 7,750,000 4,500,000 4,000,000 29,816,667 Funding Source Total 7,000,000$ 6,566,667$ 7,750,000$ 4,500,000$ 4,000,000$ 29,816,667$ Gap -$ -$ -$ -$ -$ -$

City of San Diego FY 2017-2021 Five-Year Capital Infrastructure Planning Outlook
Page 19
Bike Paths, AMD: Transportation and Storm Water Department Table 16 Bike Paths
The City’s bike improvement priorities continue to take advantage of opportunities for “repurposing operational
conditions” on roadways that are resurfaced, which coincides with the Street Preservation Program, the
Undergrounding Utility Program, and the Group Projects that replace the City’s water and wastewater systems. This
strategy has been an efficient and cost effective delivery method for creating new and improved existing bikeways
throughout the City. By addressing the delivery of projects in this manner, the Bike Program has achieved
approximately 21 percent of the high priority projects identified in the Bike Master Plan in a relatively short amount
of time. The $750,000 in TransNet funding will be used for additional repurposing and other projects to improve
existing, and to create new, bikeways. The assumption is to complete all projects in the Bicycle Master Plan in 20
years. As the Bicycle Advisory Committee finishes the Bicycle Master Plan Strategic Implementation Plan further
cost analysis will be performed and projected funding will be added to meet the Climate Action Plan priorities.
Bridges, AMD: Transportation and Storm Water Department Table 17 Bridges
Within the next 10 years approximately 150 bridges will be inspected jointly with Caltrans to evaluate, plan and
make any necessary repairs to the City’s bridges with the goal to plan and design one large and 15 small bridge
rehabilitation project per year. Large and complex bridges, include Morena Boulevard over the San Diego River
and two Fairmont Avenue bridges over Aldine Drive.
City Facilities- General Fund, AMD: Public Works Department, Facilities Division Table 18 Facilities- General Fund
The Facilities Division provides repair, modernization, and improvement services to over 1,650 municipal facilities
incorporating 6.5 million square feet of floor space, however, the table above reflects City facilities maintained in
the General Fund. Projects are construction of new City structures and major improvements to existing buildings,
including the backlog of General Fund deferred capital requirements. Capital needs include the City’s deferred
capital needs, which were recently estimated at $177 million, as well as capital renewal investment of $55 million
to meet an adequate level of occupancy per the FCI. In FY 2016, $5.3 million was allocated towards this effort.
FY 2017 FY 2018 FY 2019 FY 2020 FY 2021 TotalNeed 5,250,000$ 17,610,000$ 19,391,468$ 18,310,000$ 18,680,000$ 79,241,468$ Funding Source - Facilities Benefit Assessments - - 1,431,468 - - 1,431,468 TransNet Funds 750,000 750,000 750,000 750,000 750,000 3,750,000 Funding Source Total 750,000$ 750,000$ 2,181,468$ 750,000$ 750,000$ 5,181,468$ Gap 4,500,000$ 16,860,000$ 17,210,000$ 17,560,000$ 17,930,000$ 74,060,000$
FY 2017 FY 2018 FY 2019 FY 2020 FY 2021 TotalNeed 140,099,330$ 5,956,000$ 3,542,000$ 29,357,000$ 8,454,000$ 187,408,330$ Funding Source -
Grants 117,588,260 - - - - 117,588,260
TransNet Funds - 500,000 500,000 500,000 500,000 2,000,000 Funding Source Total 117,588,260$ 500,000$ 500,000$ 500,000$ 500,000$ 119,588,260$ Gap 22,511,070$ 5,456,000$ 3,042,000$ 28,857,000$ 7,954,000$ 67,820,070$
FY 2017 FY 2018 FY 2019 FY 2020 FY 2021 TotalNeed 14,735,914$ 38,000,000$ 52,590,554$ 60,000,000$ 60,000,000$ 225,326,468$ Funding Source -
Bond Funds 12,000,000 12,000,000 12,000,000 - - 36,000,000 Funding Source Total 12,000,000$ 12,000,000$ 12,000,000$ -$ -$ 36,000,000$ Gap 2,735,914$ 26,000,000$ 40,590,554$ 60,000,000$ 60,000,000$ 189,326,468$

City of San Diego FY 2017-2021 Five-Year Capital Infrastructure Planning Outlook
Page 20
Fire Stations and Lifeguard Stations, AMD: Fire-Rescue Department Table 19 Fire Stations and Lifeguard Stations
The Department operates 48 fire stations, two 911 communications centers, an air operations facility, a training
facility, nine lifeguard stations, a boat dock, and 48 seasonal lifeguard towers to serve a population of 1.3 million
within a 343 square mile area. The table above summarizes capital needs through FY 2021 only intended to improve
time response standards to emergencies outlined in the Implementation Plan for the Citygate’s Standards of
Coverage report adopted by City Council in 2011.
Additional recommendations to improve infrastructure outlined in the Citygate report that will continue to be
addressed for future planning as additional funding becomes available. FY 2017 includes replacement of the
existing fire station in Tierrasanta. Additional projects include improvements to existing fire stations or the
development of new fire stations such as Otay Mesa, Paradise Hills, Barrio Logan, College Area, Black Mountain
Ranch, Skyline Hills, and Home Avenue, as well as the Air Operations Facility. The lifeguard stations anticipated to
need funding beginning in FY 2021 are in North Pacific Beach and Ocean Beach.
Landfills, AMD: Environmental Services Department Table 20 Landfills
The Environmental Services Department operates a full-service landfill and maintains eight closed landfills and
eight inactive burn sites, all of which require sustained improvements. The funding needed is to support the Aerated
Stat Pile which better processes clean separated food scraps that would come to the Greenery in addition to the
need for vertical expansion with mitigation in order to increase capacity and landfill life of the Miramar Landfill.
Another significant capital need is to build a resource recovery facility at the Miramar Landfill to source separate
and divert materials.
The Department is constructing a Compressed Natural Gas (CNG) Fueling Station at the Miramar Operations
Center. The CNG Fueling Station will allow for the conversion of the City’s fleet of refuse and recycling vehicles
from diesel to natural gas, consistent with the strategies of the City’s Climate Action Plan. The amount requested
includes the estimated General Fund share to construct and operate the CNG fueling station. Once operational, the
General Fund will directly benefit from this facility in the form of fuel cost savings.
Fire Stations FY 2017 FY 2018 FY 2019 FY 2020 FY 2021 TotalNeed 850,000$ 10,913,688$ 12,774,864$ 18,226,099$ 42,726,919$ 85,491,570$ Funding Source -
Development Impact Fees 850,000 - - - - 850,000
Facilities Benefit Assessments - - 1,861,176 6,462,410 - 8,323,586 Funding Source Total 850,000$ -$ 1,861,176$ 6,462,410$ -$ 9,173,586$ Gap -$ 10,913,688$ 10,913,688$ 11,763,689$ 42,726,919$ 76,317,984$
Lifeguard Stations FY 2017 FY 2018 FY 2019 FY 2020 FY 2021 TotalNeed -$ -$ -$ -$ 10,735,444$ 10,735,444$ Funding Source - Funding Source Total -$ -$ -$ -$ -$ -$ Gap -$ -$ -$ -$ 10,735,444$ 10,735,444$
FY 2017 FY 2018 FY 2019 FY 2020 FY 2021 TotalNeed 6,000,000$ 9,900,000$ 19,000,000$ -$ -$ 34,900,000$ Funding Source -
Refuse Disposal Fund 6,000,000 9,000,000 19,000,000 - - 34,000,000 Funding Source Total 6,000,000$ 9,000,000$ 19,000,000$ -$ -$ 34,000,000$ Gap -$ 900,000$ -$ -$ -$ 900,000$
City of San Diego FY 2017-2021 Five-Year Capital Infrastructure Planning Outlook
Page 21
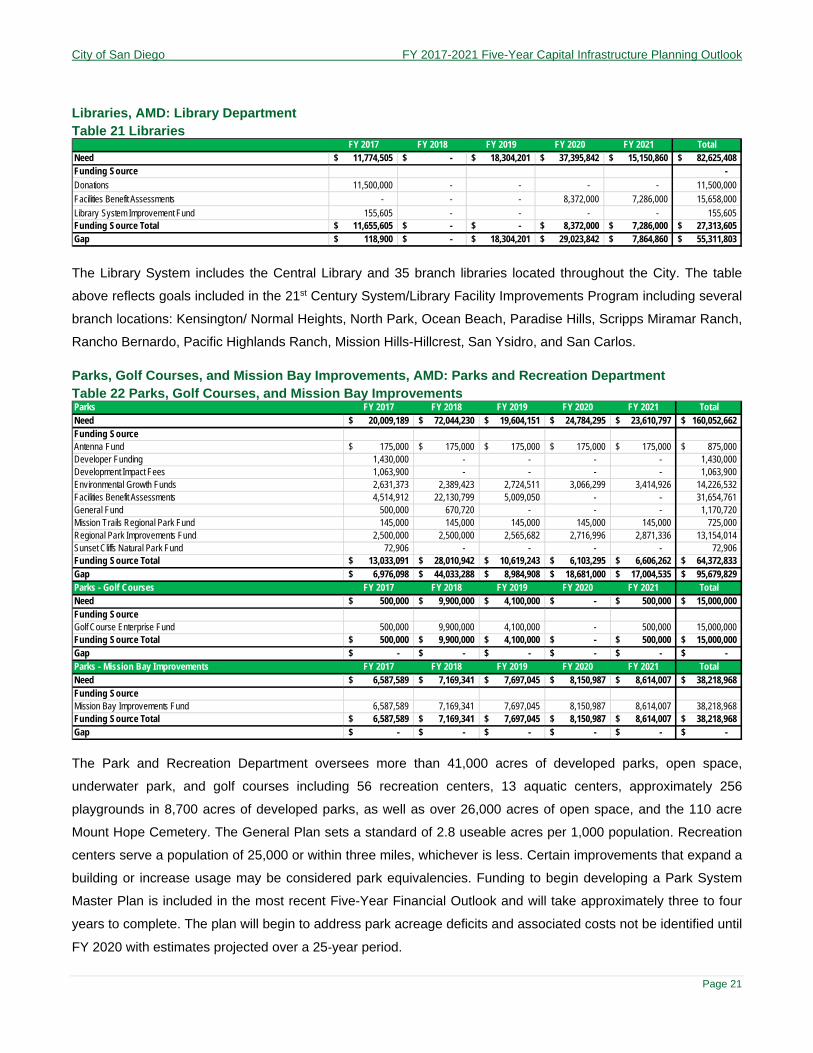
Libraries, AMD: Library Department Table 21 Libraries
The Library System includes the Central Library and 35 branch libraries located throughout the City. The table
above reflects goals included in the 21st Century System/Library Facility Improvements Program including several
branch locations: Kensington/ Normal Heights, North Park, Ocean Beach, Paradise Hills, Scripps Miramar Ranch,
Rancho Bernardo, Pacific Highlands Ranch, Mission Hills-Hillcrest, San Ysidro, and San Carlos.
Parks, Golf Courses, and Mission Bay Improvements, AMD: Parks and Recreation Department Table 22 Parks, Golf Courses, and Mission Bay Improvements
The Park and Recreation Department oversees more than 41,000 acres of developed parks, open space,
underwater park, and golf courses including 56 recreation centers, 13 aquatic centers, approximately 256
playgrounds in 8,700 acres of developed parks, as well as over 26,000 acres of open space, and the 110 acre
Mount Hope Cemetery. The General Plan sets a standard of 2.8 useable acres per 1,000 population. Recreation
centers serve a population of 25,000 or within three miles, whichever is less. Certain improvements that expand a
building or increase usage may be considered park equivalencies. Funding to begin developing a Park System
Master Plan is included in the most recent Five-Year Financial Outlook and will take approximately three to four
years to complete. The plan will begin to address park acreage deficits and associated costs not be identified until
FY 2020 with estimates projected over a 25‐year period.
FY 2017 FY 2018 FY 2019 FY 2020 FY 2021 TotalNeed 11,774,505$ -$ 18,304,201$ 37,395,842$ 15,150,860$ 82,625,408$ Funding Source -
Donations 11,500,000 - - - - 11,500,000
Facilities Benefit Assessments - - - 8,372,000 7,286,000 15,658,000
Library System Improvement Fund 155,605 - - - - 155,605 Funding Source Total 11,655,605$ -$ -$ 8,372,000$ 7,286,000$ 27,313,605$ Gap 118,900$ -$ 18,304,201$ 29,023,842$ 7,864,860$ 55,311,803$
Parks FY 2017 FY 2018 FY 2019 FY 2020 FY 2021 TotalNeed 20,009,189$ 72,044,230$ 19,604,151$ 24,784,295$ 23,610,797$ 160,052,662$ Funding SourceAntenna Fund 175,000$ 175,000$ 175,000$ 175,000$ 175,000$ 875,000$ Developer Funding 1,430,000 - - - - 1,430,000 Development Impact Fees 1,063,900 - - - - 1,063,900 Environmental Growth Funds 2,631,373 2,389,423 2,724,511 3,066,299 3,414,926 14,226,532 Facilities Benefit Assessments 4,514,912 22,130,799 5,009,050 - - 31,654,761 General Fund 500,000 670,720 - - - 1,170,720 Mission Trails Regional Park Fund 145,000 145,000 145,000 145,000 145,000 725,000 Regional Park Improvements Fund 2,500,000 2,500,000 2,565,682 2,716,996 2,871,336 13,154,014 Sunset Cliffs Natural Park Fund 72,906 - - - - 72,906 Funding Source Total 13,033,091$ 28,010,942$ 10,619,243$ 6,103,295$ 6,606,262$ 64,372,833$ Gap 6,976,098$ 44,033,288$ 8,984,908$ 18,681,000$ 17,004,535$ 95,679,829$ Parks - Golf Courses FY 2017 FY 2018 FY 2019 FY 2020 FY 2021 TotalNeed 500,000$ 9,900,000$ 4,100,000$ -$ 500,000$ 15,000,000$ Funding SourceGolf Course Enterprise Fund 500,000 9,900,000 4,100,000 - 500,000 15,000,000 Funding Source Total 500,000$ 9,900,000$ 4,100,000$ -$ 500,000$ 15,000,000$ Gap -$ -$ -$ -$ -$ -$ Parks - Mission Bay Improvements FY 2017 FY 2018 FY 2019 FY 2020 FY 2021 TotalNeed 6,587,589$ 7,169,341$ 7,697,045$ 8,150,987$ 8,614,007$ 38,218,968$ Funding SourceMission Bay Improvements Fund 6,587,589 7,169,341 7,697,045 8,150,987 8,614,007 38,218,968 Funding Source Total 6,587,589$ 7,169,341$ 7,697,045$ 8,150,987$ 8,614,007$ 38,218,968$ Gap -$ -$ -$ -$ -$ -$

City of San Diego FY 2017-2021 Five-Year Capital Infrastructure Planning Outlook
Page 22
Unfulfilled General Development Plans, Facilities Financing Plans, and incomplete condition assessments are
sources not included to determine potential capital needs. Additionally, community requests could include items not
required or are deferred capital needs in support of a specific upgrade within an existing park.
Police Stations, AMD: Police Department Table 23 Police Stations
The Police Department serves the community from ten area commands located throughout the City. In addition to
the existing CIP projects are improvements for the Police Headquarters facility and a feasibility study.
Qualcomm Stadium, AMD: Real Estate Assets Table 24 Qualcomm Stadium
Qualcomm Stadium is a 70,500 seat multipurpose stadium that hosts the San Diego Chargers, San Diego State
University Aztecs, annual Holiday and Poinsettia Bowls, plus concerts, international soccer games, major cultural
events, and hosts over one million visitors every year. The 166-acre stadium site opened in 1967 now in its 49th
year of operation. The annual allocation provides for improvements, repairs or replacement, including the
emergency back-up lighting system, training center HVAC and roof, parking lot, and stadium seating areas. The
$750,000 reflects the needed minimum annual investment to maintain the facility at its current condition. A 2011
facility condition assessment prepared by AECOM estimates the facility has $79.5 million in deferred capital costs,
which in present dollars is approximately $85 million. These numbers are not captured in the City’s total
infrastructure need due to ongoing discussions with the National Football League on a proposal for replacing the
existing stadium with ongoing maintenance and capital improvements for the new stadium funded by non-City
resources.
Sidewalks, AMD: Transportation and Storm Water Department Table 25 Sidewalks
The Transportation and Storm Water Department has identified long-term goals of repair and replacement of all
damaged City sidewalks in the next 10 years. Additionally, the department will install 330,000 linear feet of new
walkways by the end of FY 2026, which is approximately 3,300 linear feet of sidewalk per year, pending available
funding. This assumption will address the top 10 percent of projects on the City’s new sidewalks needs list.
FY 2017 FY 2018 FY 2019 FY 2020 FY 2021 TotalNeed 10,353,460$ 3,788,076$ -$ -$ -$ 14,141,536$ Funding Source -
General Fund 1,453,460 3,788,076 - - - 5,241,536 Funding Source Total 1,453,460$ 3,788,076$ -$ -$ -$ 5,241,536$ Gap 8,900,000$ -$ -$ -$ -$ 8,900,000$
FY 2017 FY 2018 FY 2019 FY 2020 FY 2021 TotalNeed 750,000$ 750,000$ 750,000$ 750,000$ 750,000$ 3,750,000$ Funding Source - QUALCOMM Stadium Fund 750,000$ 750,000$ 750,000$ 750,000$ 750,000$ 3,750,000$ Funding Source Total 750,000$ 750,000$ 750,000$ 750,000$ 750,000$ 3,750,000$ Gap -$ -$ -$ -$ -$ -$
FY 2017 FY 2018 FY 2019 FY 2020 FY 2021 TotalNeed 9,010,000$ 20,770,000$ 21,100,000$ 21,450,000$ 21,800,000$ 94,130,000$ Funding Source - General Fund 3,400,000 5,450,000 7,900,000 5,400,000 5,400,000 27,550,000
TransNet Funds 728,619 1,200,000 1,200,000 1,200,000 1,200,000 5,528,619 Funding Source Total 4,128,619$ 6,650,000$ 9,100,000$ 6,600,000$ 6,600,000$ 33,078,619$ Gap 4,881,381$ 14,120,000$ 12,000,000$ 14,850,000$ 15,200,000$ 61,051,381$
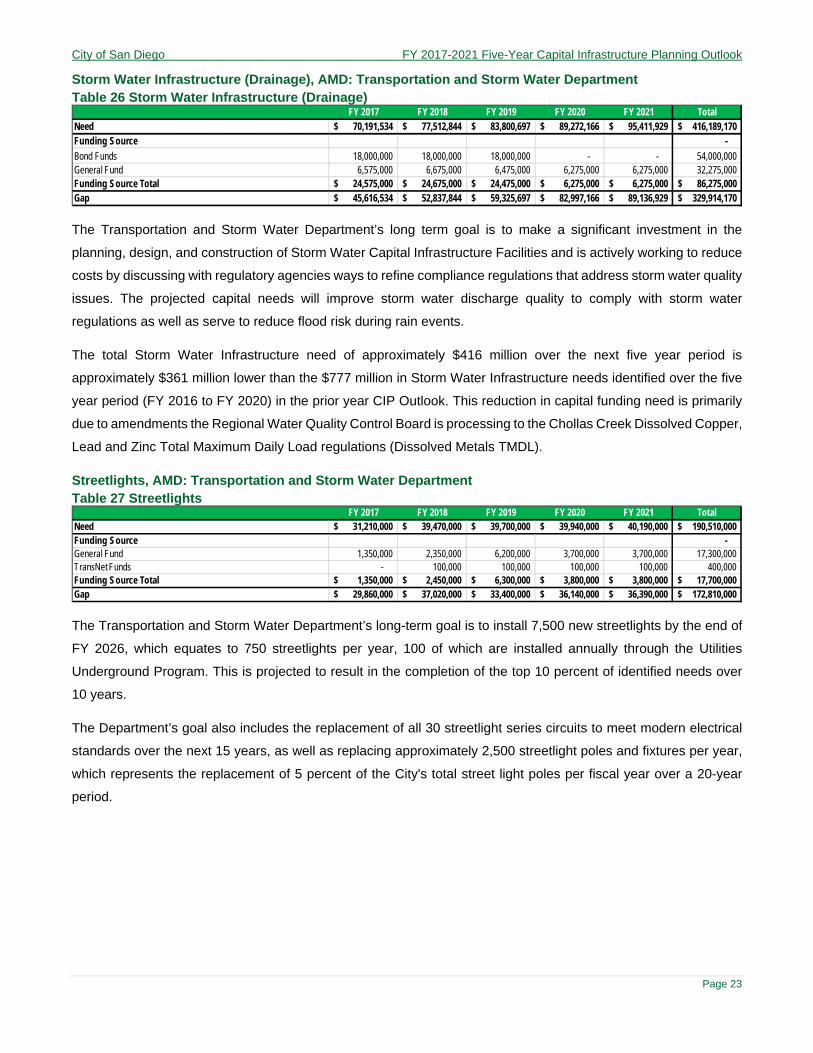
City of San Diego FY 2017-2021 Five-Year Capital Infrastructure Planning Outlook
Page 23
Storm Water Infrastructure (Drainage), AMD: Transportation and Storm Water Department Table 26 Storm Water Infrastructure (Drainage)
The Transportation and Storm Water Department’s long term goal is to make a significant investment in the
planning, design, and construction of Storm Water Capital Infrastructure Facilities and is actively working to reduce
costs by discussing with regulatory agencies ways to refine compliance regulations that address storm water quality
issues. The projected capital needs will improve storm water discharge quality to comply with storm water
regulations as well as serve to reduce flood risk during rain events.
The total Storm Water Infrastructure need of approximately $416 million over the next five year period is
approximately $361 million lower than the $777 million in Storm Water Infrastructure needs identified over the five
year period (FY 2016 to FY 2020) in the prior year CIP Outlook. This reduction in capital funding need is primarily
due to amendments the Regional Water Quality Control Board is processing to the Chollas Creek Dissolved Copper,
Lead and Zinc Total Maximum Daily Load regulations (Dissolved Metals TMDL).
Streetlights, AMD: Transportation and Storm Water Department Table 27 Streetlights
The Transportation and Storm Water Department’s long-term goal is to install 7,500 new streetlights by the end of
FY 2026, which equates to 750 streetlights per year, 100 of which are installed annually through the Utilities
Underground Program. This is projected to result in the completion of the top 10 percent of identified needs over
10 years.
The Department’s goal also includes the replacement of all 30 streetlight series circuits to meet modern electrical
standards over the next 15 years, as well as replacing approximately 2,500 streetlight poles and fixtures per year,
which represents the replacement of 5 percent of the City's total street light poles per fiscal year over a 20-year
period.
FY 2017 FY 2018 FY 2019 FY 2020 FY 2021 TotalNeed 70,191,534$ 77,512,844$ 83,800,697$ 89,272,166$ 95,411,929$ 416,189,170$ Funding Source -
Bond Funds 18,000,000 18,000,000 18,000,000 - - 54,000,000 General Fund 6,575,000 6,675,000 6,475,000 6,275,000 6,275,000 32,275,000 Funding Source Total 24,575,000$ 24,675,000$ 24,475,000$ 6,275,000$ 6,275,000$ 86,275,000$ Gap 45,616,534$ 52,837,844$ 59,325,697$ 82,997,166$ 89,136,929$ 329,914,170$
FY 2017 FY 2018 FY 2019 FY 2020 FY 2021 TotalNeed 31,210,000$ 39,470,000$ 39,700,000$ 39,940,000$ 40,190,000$ 190,510,000$ Funding Source - General Fund 1,350,000 2,350,000 6,200,000 3,700,000 3,700,000 17,300,000 TransNet Funds - 100,000 100,000 100,000 100,000 400,000 Funding Source Total 1,350,000$ 2,450,000$ 6,300,000$ 3,800,000$ 3,800,000$ 17,700,000$ Gap 29,860,000$ 37,020,000$ 33,400,000$ 36,140,000$ 36,390,000$ 172,810,000$

City of San Diego FY 2017-2021 Five-Year Capital Infrastructure Planning Outlook
Page 24
Streets- Modifications and Pavement AMD: Transportation and Storm Water Department Table 28 Streets- Modifications and Pavement
The Transportation and Storm Water Department manages the City's roadway infrastructure of approximately 2,659
centerline miles of asphalt streets and 115 centerline miles of concrete streets. The City is nearly complete with a
condition assessment survey and expects to release a report in early calendar year 2016.
The Department’s long-term goal is to reach an average pavement OCI of 70 (“Good”) for asphalt and concrete
streets in 10 years. This will be a significant increase from the 2011 condition assessment average OCI of 54.6
(“Fair”). The funding need includes the replacement of concrete streets and other street right-of-way infrastructure
needs. Capital needs for street infrastructure do not include slurry sealing, which is funded by the Department’s
operational budget. Last year, the Department estimated it would take approximately 140 miles of overlay and 250
miles of slurry seal per year to achieve an OCI rating of 70 by FY 2025. The Department is currently completing the
2015 condition assessment, which will allow for an update on annual repair estimates and also tracking road repair
performed by other CIP projects (i.e. water, wastewater, utility undergrounding), which also result in street repair
when completed.
Traffic Signals/Signal Communication, AMD: Transportation and Storm Water Department Table 29 Traffic Signals/Signal Communication
The Transportation and Storm Water Department completed a Traffic Signal Communication Master Plan which
provides the framework of needs. The department’s long-term goal is to replace all existing signals that have
reached the end of their useful life by FY 2021 and the installation of all new signals that have been identified by
FY 2026. The department plans to complete all identified projects in the Traffic Signal Communications Master Plan
by FY 2025.
Streets and Roads - Modifications FY 2017 FY 2018 FY 2019 FY 2020 FY 2021 TotalNeed 59,716,000$ 10,565,000$ 14,845,676$ 26,310,100$ 3,280,000$ 114,716,776$ Funding Source -
Bus Stop Capital Improvement Fund 60,000 60,000 60,000 60,000 60,000 300,000
Developer Funding 15,629,000 - - - - 15,629,000
Facilities Benefit Assessments 24,975,000 7,475,000 11,520,676 23,090,100 - 67,060,776
Grants 1,172,000 - - - - 1,172,000
Maintenance Assessment Districts 25,000 - - - - 25,000
TransNet Funds 15,200,000 1,100,000 1,100,000 1,100,000 1,100,000 19,600,000 Funding Source Total 57,061,000$ 8,635,000$ 12,680,676$ 24,250,100$ 1,160,000$ 103,786,776$ Gap 2,655,000$ 1,930,000$ 2,165,000$ 2,060,000$ 2,120,000$ 10,930,000$ Streets and Roads - Pavement FY 2017 FY 2018 FY 2019 FY 2020 FY 2021 TotalNeed 83,100,000$ 83,100,000$ 83,100,000$ 83,100,000$ 83,100,000$ 415,500,000$ Funding Source -
Bond Funds 60,000,000 60,000,000 60,000,000 - - 180,000,000
General Fund - - 4,000,000 10,000,000 15,000,000 29,000,000
Prior Year Continuing Appropriations 18,350,000 6,021,798 785,486 - - 25,157,284
TransNet Funds 3,250,000 15,578,202 16,814,514 18,086,862 19,268,705 72,998,283
Trench Cut/Excavation Fee Fund 1,500,000 1,500,000 1,500,000 1,500,000 1,500,000 7,500,000 Funding Source Total 83,100,000$ 83,100,000$ 83,100,000$ 29,586,862$ 35,768,705$ 314,655,567$ Gap -$ -$ -$ 53,513,138$ 47,331,295$ 100,844,433$
FY 2017 FY 2018 FY 2019 FY 2020 FY 2021 TotalNeed 11,750,000$ 11,160,000$ 27,510,000$ 28,080,000$ 28,490,000$ 106,990,000$ Funding Source - TransNet Funds - 1,900,000 1,900,000 1,900,000 1,900,000 7,600,000 Funding Source Total -$ 1,900,000$ 1,900,000$ 1,900,000$ 1,900,000$ 7,600,000$ Gap 11,750,000$ 9,260,000$ 25,610,000$ 26,180,000$ 26,590,000$ 99,390,000$
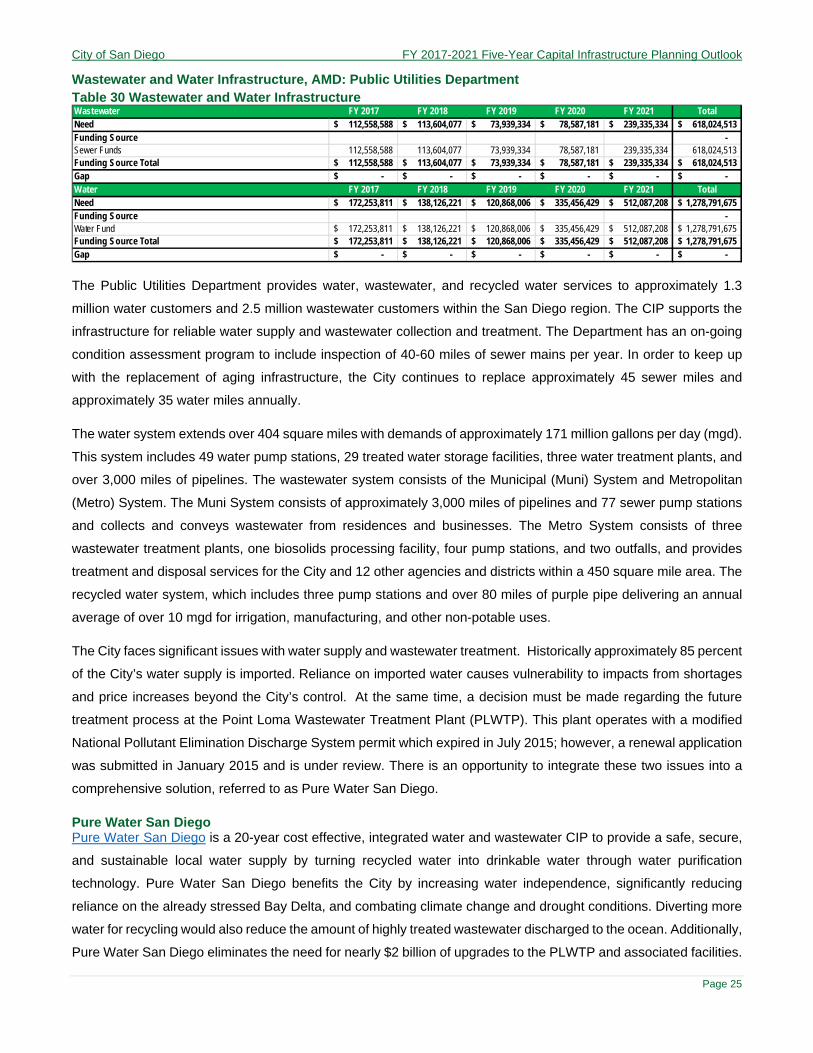
City of San Diego FY 2017-2021 Five-Year Capital Infrastructure Planning Outlook
Page 25
Wastewater and Water Infrastructure, AMD: Public Utilities Department Table 30 Wastewater and Water Infrastructure
The Public Utilities Department provides water, wastewater, and recycled water services to approximately 1.3
million water customers and 2.5 million wastewater customers within the San Diego region. The CIP supports the
infrastructure for reliable water supply and wastewater collection and treatment. The Department has an on-going
condition assessment program to include inspection of 40-60 miles of sewer mains per year. In order to keep up
with the replacement of aging infrastructure, the City continues to replace approximately 45 sewer miles and
approximately 35 water miles annually.
The water system extends over 404 square miles with demands of approximately 171 million gallons per day (mgd).
This system includes 49 water pump stations, 29 treated water storage facilities, three water treatment plants, and
over 3,000 miles of pipelines. The wastewater system consists of the Municipal (Muni) System and Metropolitan
(Metro) System. The Muni System consists of approximately 3,000 miles of pipelines and 77 sewer pump stations
and collects and conveys wastewater from residences and businesses. The Metro System consists of three
wastewater treatment plants, one biosolids processing facility, four pump stations, and two outfalls, and provides
treatment and disposal services for the City and 12 other agencies and districts within a 450 square mile area. The
recycled water system, which includes three pump stations and over 80 miles of purple pipe delivering an annual
average of over 10 mgd for irrigation, manufacturing, and other non-potable uses.
The City faces significant issues with water supply and wastewater treatment. Historically approximately 85 percent
of the City’s water supply is imported. Reliance on imported water causes vulnerability to impacts from shortages
and price increases beyond the City’s control. At the same time, a decision must be made regarding the future
treatment process at the Point Loma Wastewater Treatment Plant (PLWTP). This plant operates with a modified
National Pollutant Elimination Discharge System permit which expired in July 2015; however, a renewal application
was submitted in January 2015 and is under review. There is an opportunity to integrate these two issues into a
comprehensive solution, referred to as Pure Water San Diego.
Pure Water San Diego Pure Water San Diego is a 20-year cost effective, integrated water and wastewater CIP to provide a safe, secure,
and sustainable local water supply by turning recycled water into drinkable water through water purification
technology. Pure Water San Diego benefits the City by increasing water independence, significantly reducing
reliance on the already stressed Bay Delta, and combating climate change and drought conditions. Diverting more
water for recycling would also reduce the amount of highly treated wastewater discharged to the ocean. Additionally,
Pure Water San Diego eliminates the need for nearly $2 billion of upgrades to the PLWTP and associated facilities.
Wastewater FY 2017 FY 2018 FY 2019 FY 2020 FY 2021 TotalNeed 112,558,588$ 113,604,077$ 73,939,334$ 78,587,181$ 239,335,334$ 618,024,513$ Funding Source - Sewer Funds 112,558,588 113,604,077 73,939,334 78,587,181 239,335,334 618,024,513 Funding Source Total 112,558,588$ 113,604,077$ 73,939,334$ 78,587,181$ 239,335,334$ 618,024,513$ Gap -$ -$ -$ -$ -$ -$ Water FY 2017 FY 2018 FY 2019 FY 2020 FY 2021 TotalNeed 172,253,811$ 138,126,221$ 120,868,006$ 335,456,429$ 512,087,208$ 1,278,791,675$ Funding Source - Water Fund 172,253,811$ 138,126,221$ 120,868,006$ 335,456,429$ 512,087,208$ 1,278,791,675$ Funding Source Total 172,253,811$ 138,126,221$ 120,868,006$ 335,456,429$ 512,087,208$ 1,278,791,675$ Gap -$ -$ -$ -$ -$ -$

City of San Diego FY 2017-2021 Five-Year Capital Infrastructure Planning Outlook
Page 26
Conclusion
The CIP Outlook focuses on collecting, analyzing, and summarizing the currently known inventory of capital needs
and forecast possible funding sources for these capital expenditures over the next five fiscal years. This effort
continues the increased commitment to invest and allocate resources to address the City’s current and future capital
needs to maintain and develop the City’s complex infrastructure systems. Providing adequate public infrastructure
involves a continuous review of the City's capital needs.
In order to progressively support neighborhoods with reliable infrastructure, this report addresses the City’s capital
asset needs to provide a more comprehensive understanding of capital assets, their purpose, the need to preserve
an asset’s life cycle, and guide in preparing to renew or replace an asset and also planning to provide a determined
missing asset. The continuation of creating or revising service level standards will shape future needs to meet the
City’s commitment to communities, user groups, visitors, local business, and other stakeholders.
Capital planning initiatives including CIP streamlining initiatives, updated prioritization policy, asset management,
and organized outreach through City-recognized community organizations are important examples of the City
proactively building a transparent and reasonable planning effort. Furthermore, the City’s recently renewed efforts
to assess the condition of its assets will provide thorough and cost-effective analyses of infrastructure conditions,
assist in prioritizing projects, and help in developing funding plans for all infrastructure needs.

City of San Diego FY 2017-2021 Five-Year Capital Infrastructure Planning Outlook
Page 27
Appendix A: CIP Funding Source Projections
Airport Funds FY 2017 FY 2018 FY 2019 FY 2020 FY 2021 TotalProjected 7,000,000$ 6,566,667$ 7,750,000$ 4,500,000$ 4,000,000$ 29,816,667$ Airports 7,000,000 6,566,667 7,750,000 4,500,000 4,000,000 29,816,667
Antenna Fund FY 2017 FY 2018 FY 2019 FY 2020 FY 2021 TotalProjected 175,000$ 175,000$ 175,000$ 175,000$ 175,000$ 875,000$ Parks 175,000 175,000 175,000 175,000 175,000 875,000
Bond Funds FY 2017 FY 2018 FY 2019 FY 2020 FY 2021 TotalProjected 90,000,000$ 90,000,000$ 90,000,000$ -$ -$ 270,000,000$ Facilities 12,000,000 12,000,000 12,000,000 - - 36,000,000 Storm Water 18,000,000 18,000,000 18,000,000 - - 54,000,000 Streets and Roads - Pavement 60,000,000 60,000,000 60,000,000 - - 180,000,000
Bus Stop Capital Improvement Fund FY 2017 FY 2018 FY 2019 FY 2020 FY 2021 TotalProjected 60,000$ 60,000$ 60,000$ 60,000$ 60,000$ 300,000$ Streets and Roads - Modifications 60,000 60,000 60,000 60,000 60,000 300,000
Developer Funding FY 2017 FY 2018 FY 2019 FY 2020 FY 2021 TotalProjected 17,059,000$ -$ -$ -$ -$ 17,059,000$ Parks 1,430,000 - - - - 1,430,000 Streets and Roads - Modifications 15,629,000 - - - - 15,629,000
Development Impact Fees FY 2017 FY 2018 FY 2019 FY 2020 FY 2021 TotalProjected 2,673,500$ -$ -$ -$ -$ 2,673,500$ ADA 759,600 - - - - 759,600 Fire Stations 850,000 - - - - 850,000 Parks 1,063,900 - - - - 1,063,900
Donations FY 2017 FY 2018 FY 2019 FY 2020 FY 2021 TotalProjected 11,500,000$ -$ -$ -$ -$ 11,500,000$ Libraries 11,500,000 - - - - 11,500,000
Environmental Growth Funds FY 2017 FY 2018 FY 2019 FY 2020 FY 2021 TotalProjected 2,631,373$ 2,389,423$ 2,724,511$ 3,066,299$ 3,414,926$ 14,226,532$ Parks 2,631,373 2,389,423 2,724,511 3,066,299 3,414,926 14,226,532
Facilities Benefit Assessments FY 2017 FY 2018 FY 2019 FY 2020 FY 2021 TotalProjected 29,489,912$ 29,605,799$ 19,822,370$ 37,924,510$ 7,286,000$ 124,128,591$ Bike Paths - - 1,431,468 - - 1,431,468 Fire Stations - - 1,861,176 6,462,410 - 8,323,586 Libraries - - - 8,372,000 7,286,000 15,658,000 Parks 4,514,912 22,130,799 5,009,050 - - 31,654,761 Streets and Roads - Modifications 24,975,000 7,475,000 11,520,676 23,090,100 - 67,060,776
General Fund FY 2017 FY 2018 FY 2019 FY 2020 FY 2021 TotalProjected 13,278,460$ 18,933,796$ 24,575,000$ 25,375,000$ 30,375,000$ 112,537,256$ Parks 500,000 670,720 - - - 1,170,720 Police Stations 1,453,460 3,788,076 - - - 5,241,536 Sidewalks 3,400,000 5,450,000 7,900,000 5,400,000 5,400,000 27,550,000 Storm Water 6,575,000 6,675,000 6,475,000 6,275,000 6,275,000 32,275,000 Streetlights 1,350,000 2,350,000 6,200,000 3,700,000 3,700,000 17,300,000 Streets and Roads - Pavement - - 4,000,000 10,000,000 15,000,000 29,000,000
Golf Course Enterprise Fund FY 2017 FY 2018 FY 2019 FY 2020 FY 2021 TotalProjected 500,000$ 9,900,000$ 4,100,000$ -$ 500,000$ 15,000,000$ Parks 500,000 9,900,000 4,100,000 - 500,000 15,000,000
Grants FY 2017 FY 2018 FY 2019 FY 2020 FY 2021 TotalProjected 118,760,260$ -$ -$ -$ -$ 118,760,260$ Bridges 117,588,260 - - - - 117,588,260 Streets and Roads - Modifications 1,172,000 - - - - 1,172,000
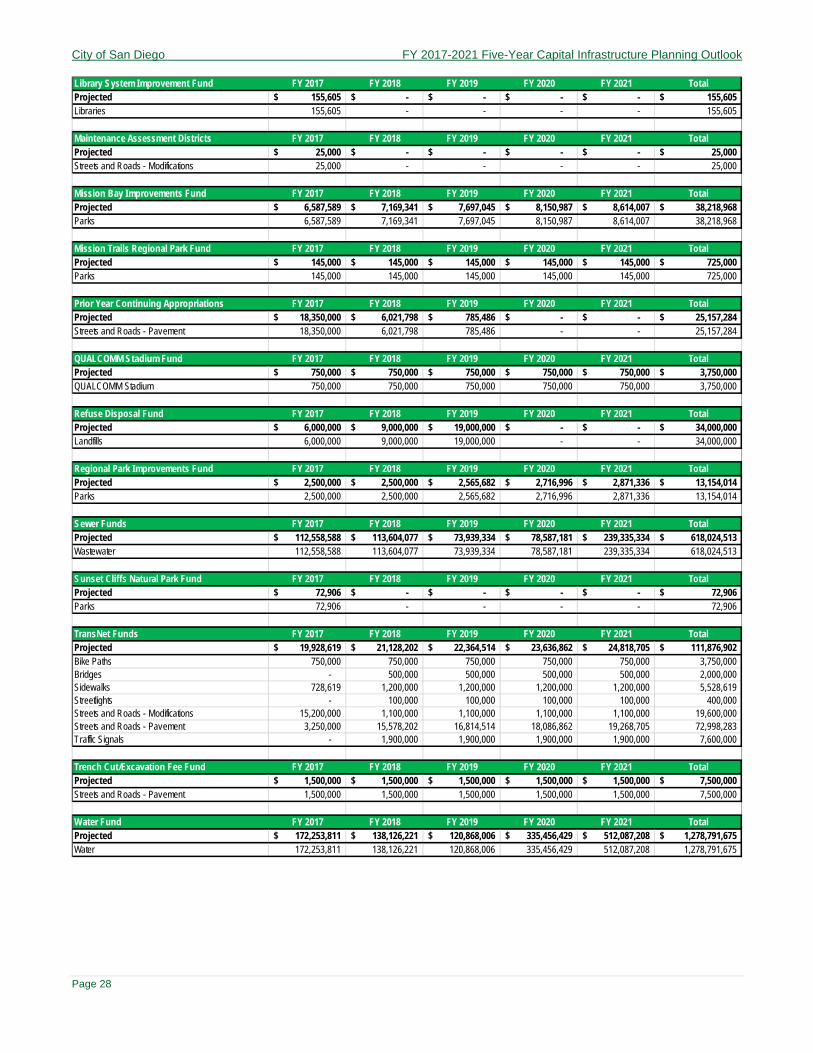
City of San Diego FY 2017-2021 Five-Year Capital Infrastructure Planning Outlook
Page 28
Library System Improvement Fund FY 2017 FY 2018 FY 2019 FY 2020 FY 2021 TotalProjected 155,605$ -$ -$ -$ -$ 155,605$ Libraries 155,605 - - - - 155,605
Maintenance Assessment Districts FY 2017 FY 2018 FY 2019 FY 2020 FY 2021 TotalProjected 25,000$ -$ -$ -$ -$ 25,000$ Streets and Roads - Modifications 25,000 - - - - 25,000
Mission Bay Improvements Fund FY 2017 FY 2018 FY 2019 FY 2020 FY 2021 TotalProjected 6,587,589$ 7,169,341$ 7,697,045$ 8,150,987$ 8,614,007$ 38,218,968$ Parks 6,587,589 7,169,341 7,697,045 8,150,987 8,614,007 38,218,968
Mission Trails Regional Park Fund FY 2017 FY 2018 FY 2019 FY 2020 FY 2021 TotalProjected 145,000$ 145,000$ 145,000$ 145,000$ 145,000$ 725,000$ Parks 145,000 145,000 145,000 145,000 145,000 725,000
Prior Year Continuing Appropriations FY 2017 FY 2018 FY 2019 FY 2020 FY 2021 TotalProjected 18,350,000$ 6,021,798$ 785,486$ -$ -$ 25,157,284$ Streets and Roads - Pavement 18,350,000 6,021,798 785,486 - - 25,157,284
QUALCOMM Stadium Fund FY 2017 FY 2018 FY 2019 FY 2020 FY 2021 TotalProjected 750,000$ 750,000$ 750,000$ 750,000$ 750,000$ 3,750,000$ QUALCOMM Stadium 750,000 750,000 750,000 750,000 750,000 3,750,000
Refuse Disposal Fund FY 2017 FY 2018 FY 2019 FY 2020 FY 2021 TotalProjected 6,000,000$ 9,000,000$ 19,000,000$ -$ -$ 34,000,000$ Landfills 6,000,000 9,000,000 19,000,000 - - 34,000,000
Regional Park Improvements Fund FY 2017 FY 2018 FY 2019 FY 2020 FY 2021 TotalProjected 2,500,000$ 2,500,000$ 2,565,682$ 2,716,996$ 2,871,336$ 13,154,014$ Parks 2,500,000 2,500,000 2,565,682 2,716,996 2,871,336 13,154,014
Sewer Funds FY 2017 FY 2018 FY 2019 FY 2020 FY 2021 TotalProjected 112,558,588$ 113,604,077$ 73,939,334$ 78,587,181$ 239,335,334$ 618,024,513$ Wastewater 112,558,588 113,604,077 73,939,334 78,587,181 239,335,334 618,024,513
Sunset Cliffs Natural Park Fund FY 2017 FY 2018 FY 2019 FY 2020 FY 2021 TotalProjected 72,906$ -$ -$ -$ -$ 72,906$ Parks 72,906 - - - - 72,906
TransNet Funds FY 2017 FY 2018 FY 2019 FY 2020 FY 2021 TotalProjected 19,928,619$ 21,128,202$ 22,364,514$ 23,636,862$ 24,818,705$ 111,876,902$ Bike Paths 750,000 750,000 750,000 750,000 750,000 3,750,000 Bridges - 500,000 500,000 500,000 500,000 2,000,000 Sidewalks 728,619 1,200,000 1,200,000 1,200,000 1,200,000 5,528,619 Streetlights - 100,000 100,000 100,000 100,000 400,000 Streets and Roads - Modifications 15,200,000 1,100,000 1,100,000 1,100,000 1,100,000 19,600,000 Streets and Roads - Pavement 3,250,000 15,578,202 16,814,514 18,086,862 19,268,705 72,998,283 Traffic Signals - 1,900,000 1,900,000 1,900,000 1,900,000 7,600,000
Trench Cut/Excavation Fee Fund FY 2017 FY 2018 FY 2019 FY 2020 FY 2021 TotalProjected 1,500,000$ 1,500,000$ 1,500,000$ 1,500,000$ 1,500,000$ 7,500,000$ Streets and Roads - Pavement 1,500,000 1,500,000 1,500,000 1,500,000 1,500,000 7,500,000
Water Fund FY 2017 FY 2018 FY 2019 FY 2020 FY 2021 TotalProjected 172,253,811$ 138,126,221$ 120,868,006$ 335,456,429$ 512,087,208$ 1,278,791,675$ Water 172,253,811 138,126,221 120,868,006 335,456,429 512,087,208 1,278,791,675

City of San Diego FY 2017-2021 Five-Year Capital Infrastructure Planning Outlook
Page 29
Appendix B: Summary of Capital Needs, Funding, and Fiscal Gap
ADA FY 2017 FY 2018 FY 2019 FY 2020 FY 2021 TotalNeed 6,400,000$ 8,500,000$ 8,500,000$ 8,500,000$ 8,500,000$ 40,400,000$ Funding Source -
Development Impact Fees 759,600 - - - - 759,600 Funding Source Total 759,600$ -$ -$ -$ -$ 759,600$ Gap 5,640,400$ 8,500,000$ 8,500,000$ 8,500,000$ 8,500,000$ 39,640,400$
Airports FY 2017 FY 2018 FY 2019 FY 2020 FY 2021 TotalNeed 7,000,000$ 6,566,667$ 7,750,000$ 4,500,000$ 4,000,000$ 29,816,667$ Funding Source -
Airport Funds 7,000,000 6,566,667 7,750,000 4,500,000 4,000,000 29,816,667 Funding Source Total 7,000,000$ 6,566,667$ 7,750,000$ 4,500,000$ 4,000,000$ 29,816,667$ Gap -$ -$ -$ -$ -$ -$
Bike PathsBike Paths FY 2017 FY 2018 FY 2019 FY 2020 FY 2021 TotalNeed 5,250,000$ 17,610,000$ 19,391,468$ 18,310,000$ 18,680,000$ 79,241,468$ Funding Source - Facilities Benefit Assessments - - 1,431,468 - - 1,431,468 TransNet Funds 750,000 750,000 750,000 750,000 750,000 3,750,000 Funding Source Total 750,000$ 750,000$ 2,181,468$ 750,000$ 750,000$ 5,181,468$ Gap 4,500,000$ 16,860,000$ 17,210,000$ 17,560,000$ 17,930,000$ 74,060,000$
Birdges FY 2017 FY 2018 FY 2019 FY 2020 FY 2021 TotalNeed 140,099,330$ 5,956,000$ 3,542,000$ 29,357,000$ 8,454,000$ 187,408,330$ Funding Source -
Grants 117,588,260 - - - - 117,588,260
TransNet Funds - 500,000 500,000 500,000 500,000 2,000,000 Funding Source Total 117,588,260$ 500,000$ 500,000$ 500,000$ 500,000$ 119,588,260$ Gap 22,511,070$ 5,456,000$ 3,042,000$ 28,857,000$ 7,954,000$ 67,820,070$
Facilities- General Fund FY 2017 FY 2018 FY 2019 FY 2020 FY 2021 TotalNeed 14,735,914$ 38,000,000$ 52,590,554$ 60,000,000$ 60,000,000$ 225,326,468$ Funding Source -
Bond Funds 12,000,000 12,000,000 12,000,000 - - 36,000,000 Funding Source Total 12,000,000$ 12,000,000$ 12,000,000$ -$ -$ 36,000,000$ Gap 2,735,914$ 26,000,000$ 40,590,554$ 60,000,000$ 60,000,000$ 189,326,468$
Fire Stations FY 2017 FY 2018 FY 2019 FY 2020 FY 2021 TotalNeed 850,000$ 10,913,688$ 12,774,864$ 18,226,099$ 42,726,919$ 85,491,570$ Funding Source -
Development Impact Fees 850,000 - - - - 850,000
Facilities Benefit Assessments - - 1,861,176 6,462,410 - 8,323,586 Funding Source Total 850,000$ -$ 1,861,176$ 6,462,410$ -$ 9,173,586$ Gap -$ 10,913,688$ 10,913,688$ 11,763,689$ 42,726,919$ 76,317,984$ Lifeguard Stations FY 2017 FY 2018 FY 2019 FY 2020 FY 2021 TotalNeed -$ -$ -$ -$ 10,735,444$ 10,735,444$ Funding Source - Funding Source Total -$ -$ -$ -$ -$ -$ Gap -$ -$ -$ -$ 10,735,444$ 10,735,444$
Landfills FY 2017 FY 2018 FY 2019 FY 2020 FY 2021 TotalNeed 6,000,000$ 9,900,000$ 19,000,000$ -$ -$ 34,900,000$ Funding Source -
Refuse Disposal Fund 6,000,000 9,000,000 19,000,000 - - 34,000,000 Funding Source Total 6,000,000$ 9,000,000$ 19,000,000$ -$ -$ 34,000,000$ Gap -$ 900,000$ -$ -$ -$ 900,000$

City of San Diego FY 2017-2021 Five-Year Capital Infrastructure Planning Outlook
Page 30
Libraries FY 2017 FY 2018 FY 2019 FY 2020 FY 2021 TotalNeed 11,774,505$ -$ 18,304,201$ 37,395,842$ 15,150,860$ 82,625,408$ Funding Source -
Donations 11,500,000 - - - - 11,500,000
Facilities Benefit Assessments - - - 8,372,000 7,286,000 15,658,000
Library System Improvement Fund 155,605 - - - - 155,605 Funding Source Total 11,655,605$ -$ -$ 8,372,000$ 7,286,000$ 27,313,605$ Gap 118,900$ -$ 18,304,201$ 29,023,842$ 7,864,860$ 55,311,803$
ParksParks FY 2017 FY 2018 FY 2019 FY 2020 FY 2021 TotalNeed 20,009,189$ 72,044,230$ 19,604,151$ 24,784,295$ 23,610,797$ 160,052,662$ Funding SourceAntenna Fund 175,000$ 175,000$ 175,000$ 175,000$ 175,000$ 875,000$ Developer Funding 1,430,000 - - - - 1,430,000 Development Impact Fees 1,063,900 - - - - 1,063,900 Environmental Growth Funds 2,631,373 2,389,423 2,724,511 3,066,299 3,414,926 14,226,532 Facilities Benefit Assessments 4,514,912 22,130,799 5,009,050 - - 31,654,761 General Fund 500,000 670,720 - - - 1,170,720 Mission Trails Regional Park Fund 145,000 145,000 145,000 145,000 145,000 725,000 Regional Park Improvements Fund 2,500,000 2,500,000 2,565,682 2,716,996 2,871,336 13,154,014 Sunset Cliffs Natural Park Fund 72,906 - - - - 72,906 Funding Source Total 13,033,091$ 28,010,942$ 10,619,243$ 6,103,295$ 6,606,262$ 64,372,833$ Gap 6,976,098$ 44,033,288$ 8,984,908$ 18,681,000$ 17,004,535$ 95,679,829$ Parks - Golf Courses FY 2017 FY 2018 FY 2019 FY 2020 FY 2021 TotalNeed 500,000$ 9,900,000$ 4,100,000$ -$ 500,000$ 15,000,000$ Funding SourceGolf Course Enterprise Fund 500,000 9,900,000 4,100,000 - 500,000 15,000,000 Funding Source Total 500,000$ 9,900,000$ 4,100,000$ -$ 500,000$ 15,000,000$ Gap -$ -$ -$ -$ -$ -$ Parks - Mission Bay Improvements FY 2017 FY 2018 FY 2019 FY 2020 FY 2021 TotalNeed 6,587,589$ 7,169,341$ 7,697,045$ 8,150,987$ 8,614,007$ 38,218,968$ Funding SourceMission Bay Improvements Fund 6,587,589 7,169,341 7,697,045 8,150,987 8,614,007 38,218,968 Funding Source Total 6,587,589$ 7,169,341$ 7,697,045$ 8,150,987$ 8,614,007$ 38,218,968$ Gap -$ -$ -$ -$ -$ -$
Police Stations FY 2017 FY 2018 FY 2019 FY 2020 FY 2021 TotalNeed 10,353,460$ 3,788,076$ -$ -$ -$ 14,141,536$ Funding Source -
General Fund 1,453,460 3,788,076 - - - 5,241,536 Funding Source Total 1,453,460$ 3,788,076$ -$ -$ -$ 5,241,536$ Gap 8,900,000$ -$ -$ -$ -$ 8,900,000$
QUALCOMM Stadium FY 2017 FY 2018 FY 2019 FY 2020 FY 2021 TotalNeed 750,000$ 750,000$ 750,000$ 750,000$ 750,000$ 3,750,000$ Funding Source - QUALCOMM Stadium Fund 750,000$ 750,000$ 750,000$ 750,000$ 750,000$ 3,750,000$ Funding Source Total 750,000$ 750,000$ 750,000$ 750,000$ 750,000$ 3,750,000$ Gap -$ -$ -$ -$ -$ -$
Sidewalks FY 2017 FY 2018 FY 2019 FY 2020 FY 2021 TotalNeed 9,010,000$ 20,770,000$ 21,100,000$ 21,450,000$ 21,800,000$ 94,130,000$ Funding Source - General Fund 3,400,000 5,450,000 7,900,000 5,400,000 5,400,000 27,550,000
TransNet Funds 728,619 1,200,000 1,200,000 1,200,000 1,200,000 5,528,619 Funding Source Total 4,128,619$ 6,650,000$ 9,100,000$ 6,600,000$ 6,600,000$ 33,078,619$ Gap 4,881,381$ 14,120,000$ 12,000,000$ 14,850,000$ 15,200,000$ 61,051,381$
Storm Water FY 2017 FY 2018 FY 2019 FY 2020 FY 2021 TotalNeed 70,191,534$ 77,512,844$ 83,800,697$ 89,272,166$ 95,411,929$ 416,189,170$ Funding Source -
Bond Funds 18,000,000 18,000,000 18,000,000 - - 54,000,000 General Fund 6,575,000 6,675,000 6,475,000 6,275,000 6,275,000 32,275,000 Funding Source Total 24,575,000$ 24,675,000$ 24,475,000$ 6,275,000$ 6,275,000$ 86,275,000$ Gap 45,616,534$ 52,837,844$ 59,325,697$ 82,997,166$ 89,136,929$ 329,914,170$

City of San Diego FY 2017-2021 Five-Year Capital Infrastructure Planning Outlook
Page 31
Streetlights FY 2017 FY 2018 FY 2019 FY 2020 FY 2021 TotalNeed 31,210,000$ 39,470,000$ 39,700,000$ 39,940,000$ 40,190,000$ 190,510,000$ Funding Source - General Fund 1,350,000 2,350,000 6,200,000 3,700,000 3,700,000 17,300,000 TransNet Funds - 100,000 100,000 100,000 100,000 400,000 Funding Source Total 1,350,000$ 2,450,000$ 6,300,000$ 3,800,000$ 3,800,000$ 17,700,000$ Gap 29,860,000$ 37,020,000$ 33,400,000$ 36,140,000$ 36,390,000$ 172,810,000$
Streets and Roads - Modifications FY 2017 FY 2018 FY 2019 FY 2020 FY 2021 TotalNeed 59,716,000$ 10,565,000$ 14,845,676$ 26,310,100$ 3,280,000$ 114,716,776$ Funding Source -
Bus Stop Capital Improvement Fund 60,000 60,000 60,000 60,000 60,000 300,000
Developer Funding 15,629,000 - - - - 15,629,000
Facilities Benefit Assessments 24,975,000 7,475,000 11,520,676 23,090,100 - 67,060,776
Grants 1,172,000 - - - - 1,172,000
Maintenance Assessment Districts 25,000 - - - - 25,000
TransNet Funds 15,200,000 1,100,000 1,100,000 1,100,000 1,100,000 19,600,000 Funding Source Total 57,061,000$ 8,635,000$ 12,680,676$ 24,250,100$ 1,160,000$ 103,786,776$ Gap 2,655,000$ 1,930,000$ 2,165,000$ 2,060,000$ 2,120,000$ 10,930,000$ Streets and Roads - Pavement FY 2017 FY 2018 FY 2019 FY 2020 FY 2021 TotalNeed 83,100,000$ 83,100,000$ 83,100,000$ 83,100,000$ 83,100,000$ 415,500,000$ Funding Source -
Bond Funds 60,000,000 60,000,000 60,000,000 - - 180,000,000
General Fund - - 4,000,000 10,000,000 15,000,000 29,000,000
Prior Year Continuing Appropriations 18,350,000 6,021,798 785,486 - - 25,157,284
TransNet Funds 3,250,000 15,578,202 16,814,514 18,086,862 19,268,705 72,998,283
Trench Cut/Excavation Fee Fund 1,500,000 1,500,000 1,500,000 1,500,000 1,500,000 7,500,000 Funding Source Total 83,100,000$ 83,100,000$ 83,100,000$ 29,586,862$ 35,768,705$ 314,655,567$ Gap -$ -$ -$ 53,513,138$ 47,331,295$ 100,844,433$
Traffic Signals FY 2017 FY 2018 FY 2019 FY 2020 FY 2021 TotalNeed 11,750,000$ 11,160,000$ 27,510,000$ 28,080,000$ 28,490,000$ 106,990,000$ Funding Source - TransNet Funds - 1,900,000 1,900,000 1,900,000 1,900,000 7,600,000 Funding Source Total -$ 1,900,000$ 1,900,000$ 1,900,000$ 1,900,000$ 7,600,000$ Gap 11,750,000$ 9,260,000$ 25,610,000$ 26,180,000$ 26,590,000$ 99,390,000$
Wastewater FY 2017 FY 2018 FY 2019 FY 2020 FY 2021 TotalNeed 112,558,588$ 113,604,077$ 73,939,334$ 78,587,181$ 239,335,334$ 618,024,513$ Funding Source - Sewer Funds 112,558,588 113,604,077 73,939,334 78,587,181 239,335,334 618,024,513 Funding Source Total 112,558,588$ 113,604,077$ 73,939,334$ 78,587,181$ 239,335,334$ 618,024,513$ Gap -$ -$ -$ -$ -$ -$ Water FY 2017 FY 2018 FY 2019 FY 2020 FY 2021 TotalNeed 172,253,811$ 138,126,221$ 120,868,006$ 335,456,429$ 512,087,208$ 1,278,791,675$ Funding Source - Water Fund 172,253,811$ 138,126,221$ 120,868,006$ 335,456,429$ 512,087,208$ 1,278,791,675$ Funding Source Total 172,253,811$ 138,126,221$ 120,868,006$ 335,456,429$ 512,087,208$ 1,278,791,675$ Gap -$ -$ -$ -$ -$ -$

City of San Diego FY 2017-2021 Five-Year Capital Infrastructure Planning Outlook
Page 32
Hyperlinked References 1. Capital Improvement Program (CIP): http://www.sandiego.gov/cip/about/index.shtml
2. CIP Adopted Budget: http://www.sandiego.gov/fm/annual/index.shtml
3. The Citizens Guide to the Capital Improvement Program: http://www.sandiego.gov/iba/pdf/guidefullversion.pdf
4. FY 2017 – 2021 Five-Year Financial Outlook: http://www.sandiego.gov/fm/pdf/fy17_5year.pdf
5. FY 2016 Annual CIP Budget: http://www.sandiego.gov/fm/annual/fy16/fy16vol3.shtml
6. Report No 15-020 CIP Process Improvement and Streamlining:
http://docs.sandiego.gov/councilcomm_agendas_attach/2015/Infra_150311_6a.pdf
7. Asset-Managing Departments (AMD): http://www.sandiego.gov/cip/about/assettypes.shtml
8. Facilities Condition Assessment Update Report dated May, 29, 2015, (Report No: 15-039):
http://docs.sandiego.gov/councilcomm_agendas_attach/2015/Infra_150603_9.pdf
9. City’s Information Technology website: http://www.sandiego.gov/it/services/index.shtml
10. City’s State of the CIP Report: http://www.sandiego.gov/cip/reports/index.shtml
11. CIP projects: http://www.sandiego.gov/cip/about/index.shtml
12. Capital Improvements Program Review and Advisory Committee (CIPRAC):
http://www.sandiego.gov/cip/about/ciprac.shtml
13. Council Policy 800-14: http://docs.sandiego.gov/councilpolicies/cpd_800-14.pdf
14. Council Policy 800-16: http://docs.sandiego.gov/councilpolicies/cpd_800-16.pdf
15. FCA Update Report: http://docs.sandiego.gov/councilcomm_agendas_attach/2015/Infra_150603_9.pdf
16. Office of ADA Compliance and Accessibility: http://www.sandiego.gov/adacompliance/
17. Fire Services Standards of Response Coverage Deployment Study:
http://docs.sandiego.gov/councilcomm_agendas_attach/2011/PSNS_110216_5a.pdf
18. Council Policy 000-32: http://docs.sandiego.gov/councilpolicies/cpd_000-32.pdf
19. Community Planners Committee: http://www.sandiego.gov/planning/community/cpc/
20. City’s review (to community requests):
http://www.sandiego.gov/planning/community/pdf/cpc/agendas/attachments/master.pdf
21. City’s Debt Policy: http://www.sandiego.gov/fm/pdf/debtpolicy2015.pdf
22. City Charter -Section 69, 71, and 84: http://docs.sandiego.gov/citycharter/Article%20VII.pdf
23. Appropriations Ordinance: http://www.sandiego.gov/fm/policies/
24. Pure Water San Diego: http://www.sandiego.gov/water/purewater/