Embed Size (px)
Citation preview

City of San Marcos, California
ADOPTED ANNUALOPERATIONS & CAPITAL
BUDGET2018-19
Discover Life’s Possibilities
Fiscal Year 2018-19 Budget
1 Civic Center Drive | San Marcos, CA 92069 | (760) 744-1050
ACKNOWLEDGEMENTS
CITY OF SAN MARCOS CITY COUNCIL
Jim Desmond, Mayor
Rebecca Jones, Vice Mayor
Chris Orlando, Council Member
Kristal Jabara, Council Member
Sharon Jenkins, Council Member
BUDGET REVIEW COMMITTEE
Charles Zahl, Chair
Xavier Martinez, Vice Chair
James Knowlton
Neil Kramer
Charlotte Rice
Glen Winn
Fiscal Year 2018-19 Budget
1 Civic Center Drive | San Marcos, CA 92069 | (760) 744-1050
TABLE OF CONTENTS
Transmittal Letter .................................................................................................................. i
Projected Expenditures - Overview by Fund and Function ......................................................... 1
Projected Revenues - Overview by Fund and Type .................................................................... 3
General Fund
General Fund Overview .......................................................................................................... 7
General Government Function ........................................................................................ 11
City Council ........................................................................................................... 13
Administration ...................................................................................................... 17
Communications & Marketing ........................................................................... 21
Economic Development .................................................................................... 22
City Attorney ......................................................................................................... 23
City Clerk .............................................................................................................. 27
Human Resources/Risk Management ....................................................................... 31
Finance & Information Systems .............................................................................. 37
Finance ........................................................................................................... 40
Information Systems ........................................................................................ 41
Real Property Services ........................................................................................... 43
Public Works Function .................................................................................................... 49
Administration ...................................................................................................... 54
Storm Water Program Management ........................................................................ 55
Right-of-Way Maintenance ..................................................................................... 56
Fleet Maintenance ................................................................................................. 58
Parks and Landscape ............................................................................................. 60
Facilities Maintenance ........................................................................................... 62
Engineering (Traffic/Capital Improvement) ............................................................. 64
Development Services Function ...................................................................................... 65
Administration ...................................................................................................... 68
Planning ............................................................................................................... 69
Building ................................................................................................................ 70
Fiscal Year 2018-19 Budget
1 Civic Center Drive | San Marcos, CA 92069 | (760) 744-1050
Engineering (Land Development) ............................................................................ 71
Public Safety Function ................................................................................................... 73
Fire ....................................................................................................................... 75
Administration ................................................................................................. 78
Emergency Preparedness.................................................................................. 79
Emergency Medical Services ............................................................................. 80
Operations ...................................................................................................... 81
Prevention....................................................................................................... 83
Law Enforcement .................................................................................................. 85
Parks and Recreation Function ....................................................................................... 89
Parks and Recreation ............................................................................................. 91
Other Restricted Funds
Gas Tax Fund ................................................................................................................. 95
Traffic Safety Fund ......................................................................................................... 97
Lighting & Landscaping Maintenance District Fund ........................................................... 99
City Affordable Housing Fund ......................................................................................... 101
CFD 98-02 Lighting and Landscaping Fund ....................................................................... 103
Senior Nutrition Grant Fund ........................................................................................... 109
CDBG Fund .................................................................................................................... 111
Center Drive Maintenance District Fund ........................................................................... 113
CalHOME Grant Fund ...................................................................................................... 115
CFD 2011-01 Congestion Management Fund ..................................................................... 117
PEG Fund ...................................................................................................................... 119
Art in Public Places Fund ................................................................................................ 121
RMRA Fund .................................................................................................................... 123
San Marcos Successor Housing Agency Fund .................................................................... 125
Lease Revenue Debt Service Fund ................................................................................... 127
Public Facilities Fees Fund .............................................................................................. 129
Transnet - Streets Fund .................................................................................................. 131
Creekside Marketplace Enterprise Fund ........................................................................... 133
Vehicle & Equipment Acquisition/Replacement Fund ........................................................ 135

Fiscal Year 2018-19 Budget
1 Civic Center Drive | San Marcos, CA 92069 | (760) 744-1050
City Facilities Replacement/Rehabilitation Fund .............................................................. 137
City Infrastructure Replacement/Rehabilitation Fund ....................................................... 139
Projected Fund Balance Summaries ......................................................................................... 141
FY 2017-18 Balanced Scorecard Report .................................................................................... 143
Capital Improvement Projects Program ................................................................................... 157
CIP Program Summary by Project Type ............................................................................ 159
CIP Program Summary by Funding Source ....................................................................... 161
CIP Program Project Detail Sheets ................................................................................... 167

This page intentionally left blank.
June 12, 2018
Honorable Mayor and Members of the City Council:
It is my pleasure to submit the Fiscal Year (FY) 2018-19 Operations and Maintenance Budget (O&M)
as well as the five-year Capital Improvement Program Budget (CIP) for the City of San Marcos.
We have continued to include in this year’s budget a column showing the departmental budget
requests and the City Manager’s recommendation. Budgets prior to FY 2015-16 did not provide
departmental request information. Over the past several years, we have had each department
make a presentation to the Budget Review Committee providing an overview of their budget and
operations and highlighting specific requests that they made. This year the presentations focused
on the major new requests or significant adjustments a department may have been seeking.
Including those amounts in the budget reports provides the City Council with some insight as to
what areas of departmental operations directors viewed as requiring additional funding. This year’s
departmental requests were more moderate than in past years, and we have attempted to fund
most of those, particularly those that do not have on-going personnel costs. In some instances, we
asked departments to accelerate items that could be undertaken prior to the end of FY 2017-18,
particularly one-time items, as we had some available savings in the current year.
From a big picture/national economic perspective, economic activity remains good. The United
States Commerce Department reported that the U.S. economy grew by 2.2% in the first quarter of
2018. That followed three successive quarters with growth of 2.9% or higher, the first time in more
than three years such a string of growth occurred. The May 2018 jobs report was better than
projected as the economy added 223,000 new jobs. The monthly average over the past 12 months
has been over 190,000 per month which is marked improvement compared to the past few years.
Economists consider that a minimum of 150,000 jobs need to be created a month to keep the
economy expanding. The unemployment rate in April dropped to almost new lows at 3.8%. It had
not been at such a low rate since the end of the dot.com bubble period of 1998 – 2000 and prior to
that 1973. The “real” unemployment rate that includes workers who had exited the job market fell
to 7.6%, the lowest it has been since 2001.
In our particular case, we continue to see growth at this point. We saw an accelerated growth rate
in FY 2017-18 notably in sales tax and building permit/development fee revenues. With respect to
ii
sales tax, the bulk of the increase was in the construction, building supply and business to business
sectors which tend to be very cyclical. We continue to maintain a conservative outlook as it seems
unlikely that the economy will be able to maintain this higher growth rate for a protracted period of
time. The concern of a not too distant slowdown seems to be affecting the rate of wage inflation.
Based on our employee group memorandums of understanding, our staff will see a 2.05% cost of
labor increase in FY 2018-19. As you will recall, our prescribed wage indexes for establishing cost of
labor increases include both public and private sector industries and should be a reliable snapshot
of the growth of the economy from a wages perspective.
Besides sales tax, we are seeing small to strong growth in a number of our major revenue categories
including rental income and property tax. Rental income is strong and steady with a projected
increase of 2.4%. Creekside Marketplace continues to perform well. It remains 100% leased, and the
only significant expiring lease is Staples. That term ends on June 30, 2019, and Staples has three
remaining 5 year options, so the center will essentially continue through the fiscal year fully leased.
A number of leases do expire in FY 2019-20, and we are actively working on those, most notably Best
Buy, Applebee’s and Panera Bread. All three have remaining options should they choose to execute
them. At City Hall, we are seeing some modest improvement in the office rental market. Most
importantly, in FY 2017-18 we successfully re-signed the IRS and the Veterans Administration to new
leases and also will be welcoming the University of California, San Diego as a tenant in FY 2018-19.
Property tax continues to be a strong source of growth, and we are projecting a healthy 7.3%
increase. This is due to the very strong housing market as well as the addition of newly taxable
residential and non-residential properties. We are projecting a flat level for Transient Occupancy
Tax. Overall, we are projecting that FY 2018-19 General Fund Revenues will grow by only 0.2% over
our FY 2017-18 projections. Despite strong tax revenues, we are assuming a reduction in building
permits and development related fees by over $1 million which offsets all of the sales tax, rental and
a portion of the property tax gains. We see FY 2018-19 as a slower year in terms of issuance of
building permits, particularly new construction permits as the plans that are in the pipeline are
likely at least a year away from building permit activity. Lastly, we reduced the contribution to the
General Fund from the Creekside Marketplace from $5 million in FY 2017-18 to $4.35 million in FY
2018-19.
National, statewide and regional economic indicators are generally positive. The unemployment
rate in California fell from 4.5% in April of 2017 to 3.8% in April of 2018. San Diego continues to
outperform the state overall with an unemployment rate of 2.9% in April of 2018. The labor force
participation rate in California remains unchanged at about 62%, however, this steadiness is not a
iii
positive note as the participation rate of 61.8% in April of 2014 marked the lowest rate since April of
1976. Nationally, consumer confidence rose to an 18 year high in May of 2018.
Lastly on the economic front, the San Diego Union Tribune reported in March of this year that the
median San Diego County single family home price was $608,750, a 7.7% increase in a year.
In developing the budget for FY 2018-19, the first thing we did was to build on the City Council’s
adopted policy of directing general funds toward infrastructure, City facilities and vehicles and
equipment replacement and rehabilitation. As the Council knows, the Fiscal Management Policy it
adopted in 2015 provided that 2.6% of the adopted FY 2014-15 General Fund budget or $1,648,506
in FY 2015-16 be budgeted for this purpose. The policy escalates that set aside each year. The
recommended FY 2018-19 budget sets aside 4.1% of the adopted FY 2017-18 budget or $2,912,605
toward that purpose. This is consistent with the adopted City Council policy, and you will see that
set aside on the General Fund Expenditure Page (page 1), General Fund Summary Page (page 7),
and you will note the allocations of those funds in Fund Numbers 602, 603 and 604 (pages 135 –
140).
The City’s financial outlook remains quite strong. The General Fund summary page shows a
projected surplus for the end of FY 2017-18 of approximately $2.1 million. Unlike prior years, this
surplus is mostly due to factors on the revenue side, predominantly higher than expected sales tax
and development/building permit fees and some one-time revenues. The Council’s adopted Fiscal
Management Policy provides that any year end operating surpluses (assuming the minimum 40%
reserve level is met) be distributed to our rehabilitation and replacement funds. On the same
Council agenda as this budget are separate action items with staff’s recommendations for the
use/distribution of those surplus funds.
We are projecting that we will end FY 2017-18 with a General Fund liquid reserve level of $30,054,586
or 43.6% of the actual FY 2016-17 General Fund expenditures. The proposed FY 2018-19 General
Fund Budget provides a reserve level of $30,190,583 or 40.4% of projected FY 2017-18 expenditures.
Staff will return to Council at the conclusion of the audit period in the fall of 2018 with
recommendations for the use of any additional surplus and confirmation of compliance with the
Council adopted reserve levels.
iv
GENERAL FUND
The recommended FY 2018-19 budget is balanced and in compliance with the Council’s amended
General Fund Reserve Policy.
Revenues
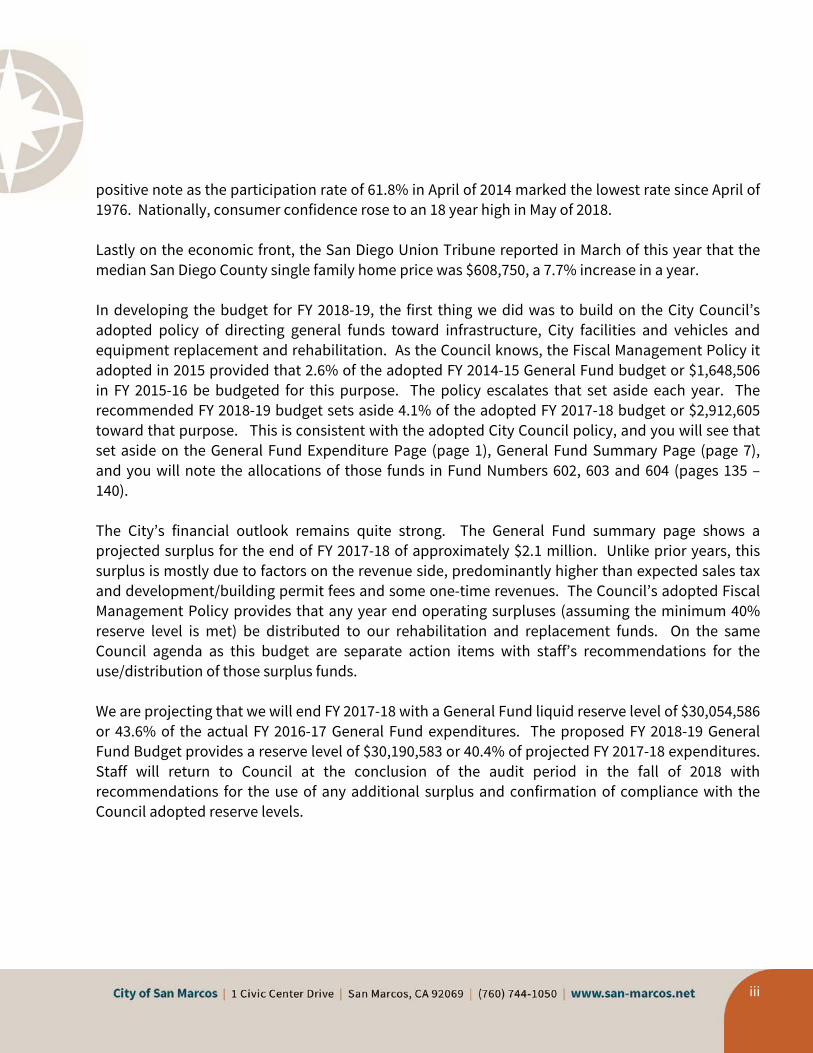
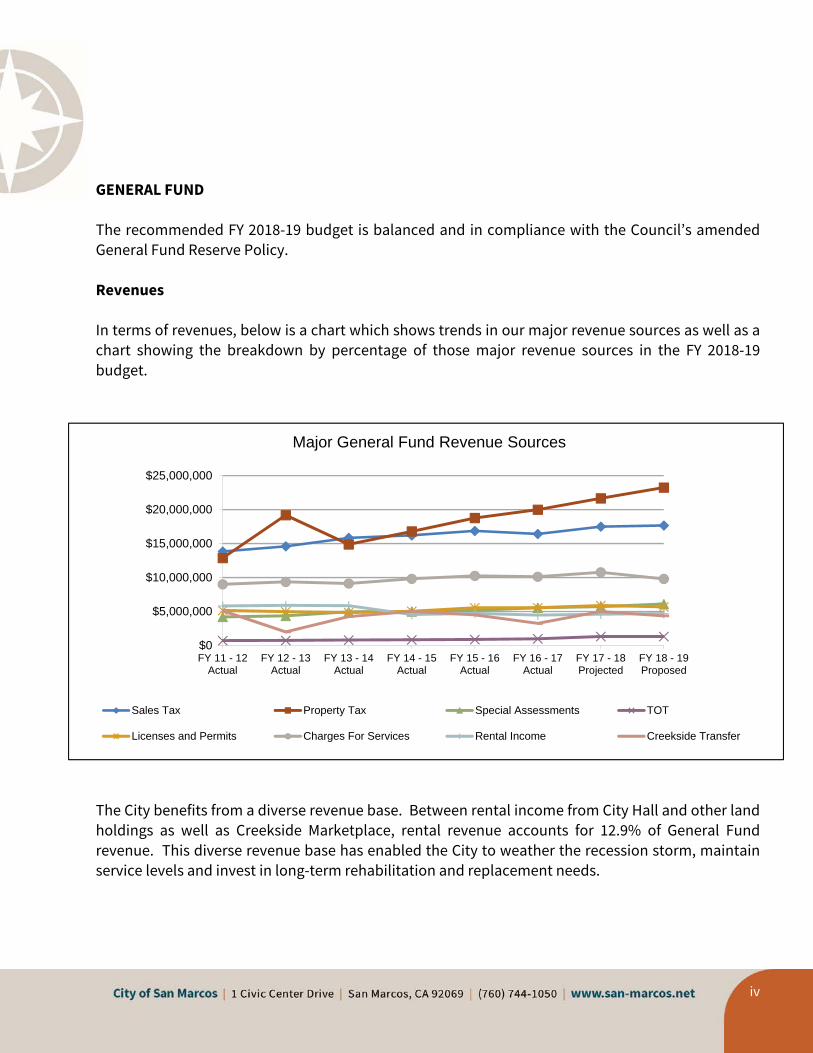
In terms of revenues, below is a chart which shows trends in our major revenue sources as well as a
chart showing the breakdown by percentage of those major revenue sources in the FY 2018-19
budget.
The City benefits from a diverse revenue base. Between rental income from City Hall and other land
holdings as well as Creekside Marketplace, rental revenue accounts for 12.9% of General Fund
revenue. This diverse revenue base has enabled the City to weather the recession storm, maintain
service levels and invest in long-term rehabilitation and replacement needs.
$0
$5,000,000
$10,000,000
$15,000,000
$20,000,000
$25,000,000
FY 11 - 12Actual
FY 12 - 13Actual
FY 13 - 14Actual
FY 14 - 15Actual
FY 15 - 16Actual
FY 16 - 17Actual
FY 17 - 18Projected
FY 18 - 19Proposed
Major General Fund Revenue Sources
Sales Tax Property Tax Special Assessments TOT
Licenses and Permits Charges For Services Rental Income Creekside Transfer
v
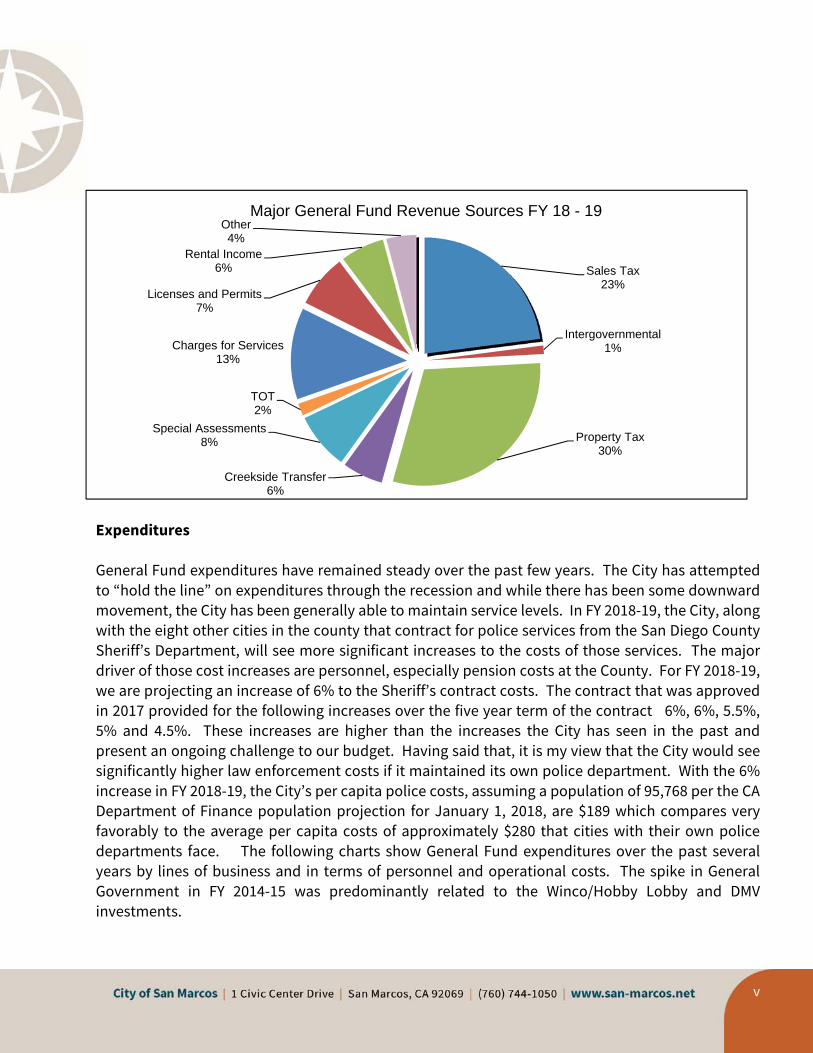
Expenditures
General Fund expenditures have remained steady over the past few years. The City has attempted
to “hold the line” on expenditures through the recession and while there has been some downward
movement, the City has been generally able to maintain service levels. In FY 2018-19, the City, along
with the eight other cities in the county that contract for police services from the San Diego County
Sheriff’s Department, will see more significant increases to the costs of those services. The major
driver of those cost increases are personnel, especially pension costs at the County. For FY 2018-19,
we are projecting an increase of 6% to the Sheriff’s contract costs. The contract that was approved
in 2017 provided for the following increases over the five year term of the contract 6%, 6%, 5.5%,
5% and 4.5%. These increases are higher than the increases the City has seen in the past and
present an ongoing challenge to our budget. Having said that, it is my view that the City would see
significantly higher law enforcement costs if it maintained its own police department. With the 6%
increase in FY 2018-19, the City’s per capita police costs, assuming a population of 95,768 per the CA
Department of Finance population projection for January 1, 2018, are $189 which compares very
favorably to the average per capita costs of approximately $280 that cities with their own police
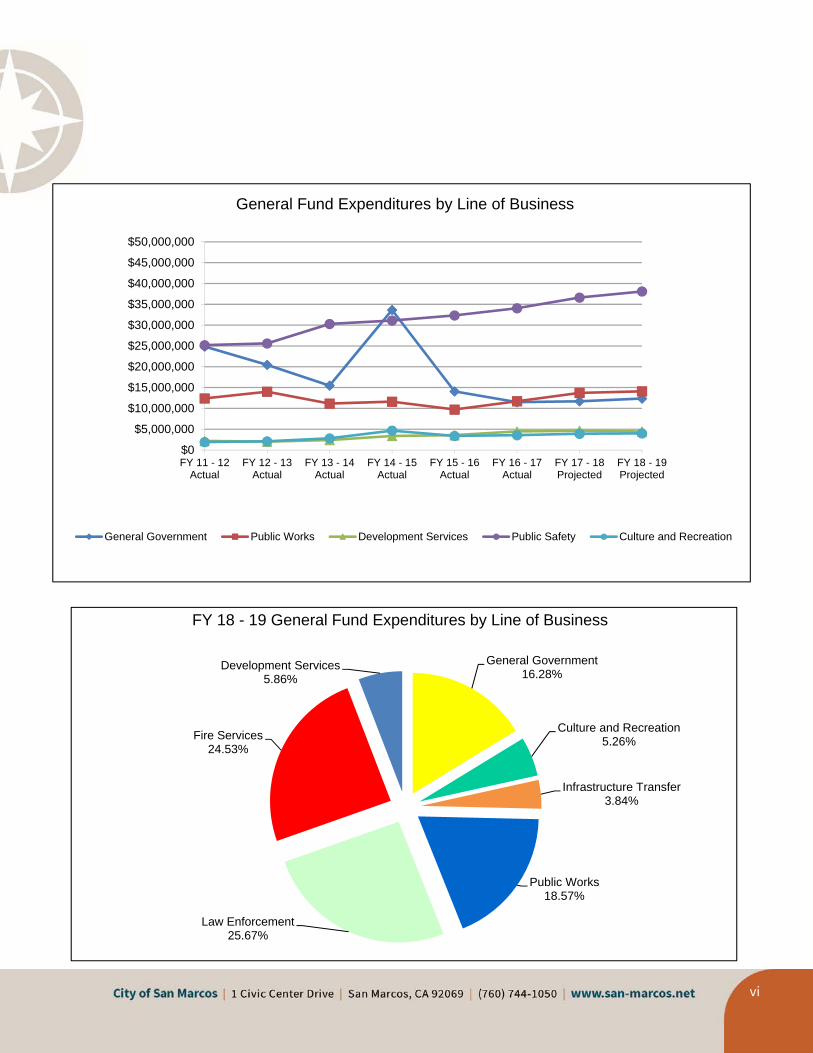
departments face. The following charts show General Fund expenditures over the past several
years by lines of business and in terms of personnel and operational costs. The spike in General
Government in FY 2014-15 was predominantly related to the Winco/Hobby Lobby and DMV
investments.
Sales Tax23%
Intergovernmental1%
Property Tax30%
Creekside Transfer6%
Special Assessments8%
TOT2%
Charges for Services13%
Licenses and Permits7%
Rental Income6%
Other4%
Major General Fund Revenue Sources FY 18 - 19
vi
General Government16.28%
Culture and Recreation5.26%
Infrastructure Transfer3.84%
Public Works18.57%
Law Enforcement25.67%
Fire Services24.53%
Development Services5.86%
FY 18 - 19 General Fund Expenditures by Line of Business
$0
$5,000,000
$10,000,000
$15,000,000
$20,000,000
$25,000,000
$30,000,000
$35,000,000
$40,000,000
$45,000,000
$50,000,000
FY 11 - 12Actual
FY 12 - 13Actual
FY 13 - 14Actual
FY 14 - 15Actual
FY 15 - 16Actual
FY 16 - 17Actual
FY 17 - 18Projected
FY 18 - 19Projected
General Fund Expenditures by Line of Business
General Government Public Works Development Services Public Safety Culture and Recreation
vii
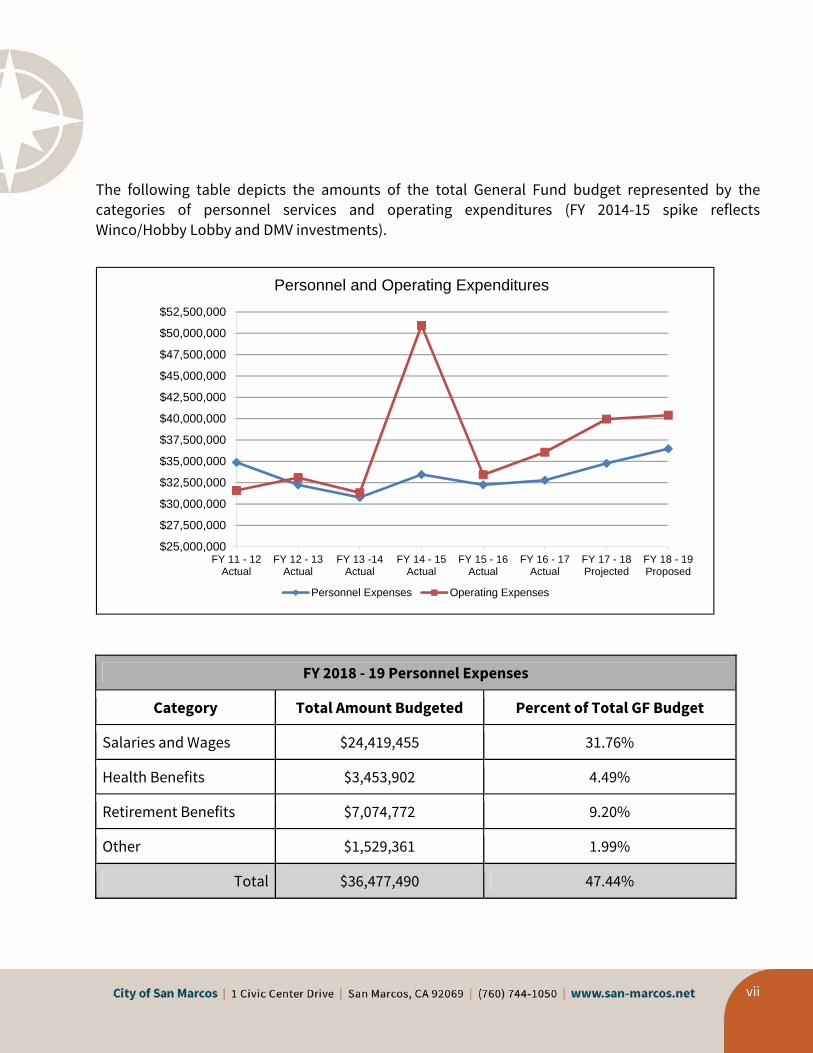
The following table depicts the amounts of the total General Fund budget represented by the
categories of personnel services and operating expenditures (FY 2014-15 spike reflects
Winco/Hobby Lobby and DMV investments).
FY 2018 - 19 Personnel Expenses
Category Total Amount Budgeted Percent of Total GF Budget
Salaries and Wages $24,419,455 31.76%
Health Benefits $3,453,902 4.49%
Retirement Benefits $7,074,772 9.20%
Other $1,529,361 1.99%
Total $36,477,490 47.44%
$25,000,000
$27,500,000
$30,000,000
$32,500,000
$35,000,000
$37,500,000
$40,000,000
$42,500,000
$45,000,000
$47,500,000
$50,000,000
$52,500,000
FY 11 - 12Actual
FY 12 - 13Actual
FY 13 -14Actual
FY 14 - 15Actual
FY 15 - 16Actual
FY 16 - 17Actual
FY 17 - 18Projected
FY 18 - 19Proposed
Personnel and Operating Expenditures
Personnel Expenses Operating Expenses
viii
The total share of the City’s General Fund budget made up by personnel expenses has been on a
slight downward trend from 49.11% in FY 2015-16 to 47.32% in the original FY 2017-18 budget and
has now stabilized at 47.44%. While seemingly small from a percentage perspective, if the FY 2018-
19 share was the same as FY 2015-16, personnel costs would be $1.27 million higher.
The budget reflects the 2.05% cost of labor increases that are part of the City’s memorandums of
understanding with its employee groups. It also reflects projected increases in health care and
pension costs. With respect to pension costs, changes made by CalPERS to their investment
assumption rate of return impact our budget starting in FY 2018-19. The Council’s decision to utilize
the operational surplus from FY 2015-16 as a one-time payment to CalPERS will significantly assist
in offsetting those increases. Pensions continue to present a significant challenge to the budget
and managing those challenges in the long term will be a matter of high importance in the coming
years.
Other Expenditure Highlights:
While the budget from an operational standpoint does not contain a large number of major
enhancements, there are some noteworthy items. The Sheriff’s contract increase of 6% results in
$1,046,119 of higher law enforcement costs compared to the FY 2017-18 adopted budget. Also in
the Public Safety area, while the rate of increase continues to moderate, the City continues to see a
steady increase in calls for service for fire and emergency medical services. This has caused an
increase in the cost of dispatch service calls and medical supplies. Also, with respect to dispatch
services, the fee per call was increased by the North Comm JPA. The combined increased call
volume and charge per call is resulting in a 10% increase in dispatch services or an increase of
approximately $88,000. There are some offsetting revenues and the City continues to look at the
concept of a “first responder fee” to assist in defraying the additional costs of medical aid services.
With respect to personnel costs as discussed above, the flat nature of personnel costs related to
total general fund budget reflect management’s continued efforts to actively control those costs.
The recommended budget does include funding for two new full time positions, a
Management/Leasing Analyst for our Real Property Services Division and a Fire Mechanic for our
Public Works Department. The latter position is planned to come on board mid-year, so only half of
the costs of that position are included in the proposed budget.
The proposed budget also continues to reflect management’s commitment to upgrading our IT
services. The proposed budget contains a number of IT improvements including over $100,000 in
ix
equipment replacements/upgrades, a 75% increase in that area, as well as a significant increase in
our contract maintenance services. The budget does include funding to move to an online business
license application process as well as develop a citizens concern reporting application that will add
mobile capacity to that service that currently exists via our website. Overall, the IT budget will
increase by $248,443 or 15%.
The recommended budget continues to adhere to the Council’s adopted fiscal management policy
both in terms of the City’s reserve levels and the annual transfer from the General Fund to the
Infrastructure, Facilities and Vehicle and Equipment Fund. That transfer is based on 4.1% of the FY
2017-18 budget.
CAPITAL IMPROVEMENT PROJECTS BUDGET
Over the past several years, we have refined the Capital Improvement Projects (CIP) Budget to
provide a more accurate representation of the City’s actual five year capital program. That program
will see very significant projects moving forward starting in FY 2018-19 and for several years
thereafter. Since most of those projects have had very long lead times (Creek District
Infrastructure), there are relatively few new projects recommended in the FY 2018-19 CIP.
The total new appropriations recommended for FY 2018-19 for CIP projects is $32.6 million. The
various Creek District projects, which should be under contract and moving forward to construction
in the first quarter of 2019, account for $19.9 million of that total. The proposed CIP also includes
significant funding in the amount of $5.1 million for the Woodland Parkway Interchange. This
represents the City’s commitment to its recently approved agreement with Caltrans to reimburse
them for their costs in completing all of the pre-construction phases of that project. The other
significant addition to the CIP is the inclusion of $8 million of future funding for the City’s share of
the completion of Discovery Street from Craven Road to Twin Oaks Valley Road.
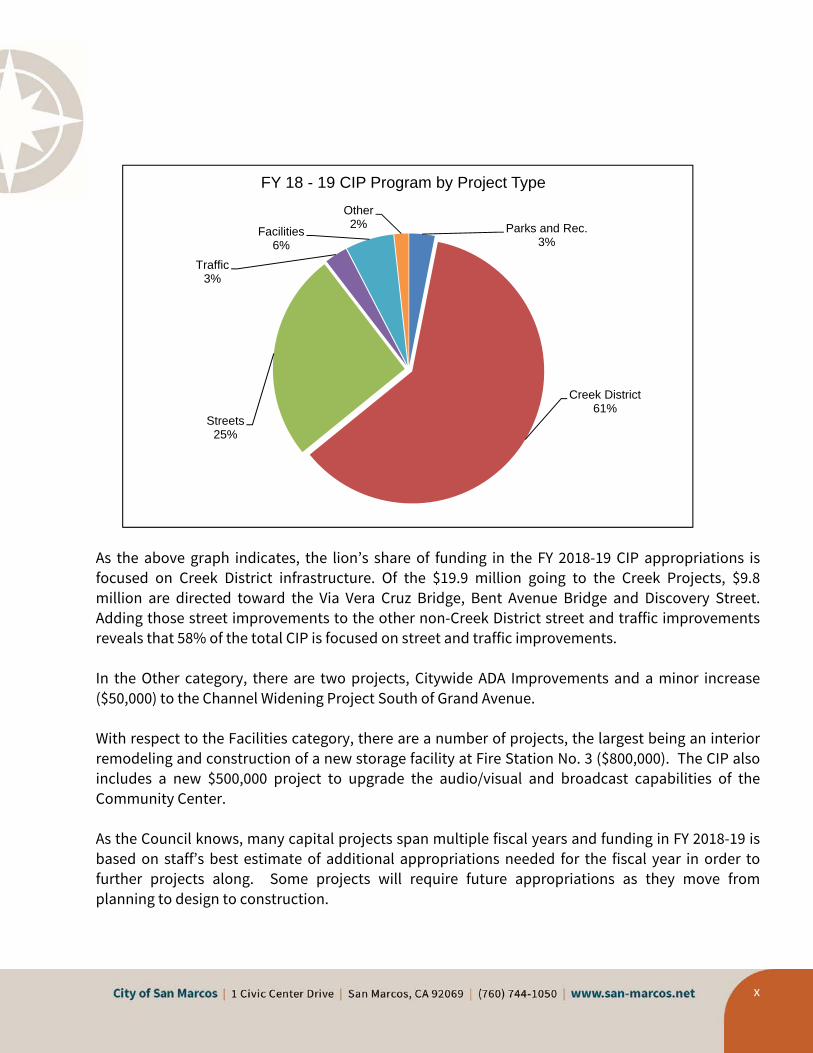
The following chart depicts each of the project types and their percentage of the total CIP budget.
x
As the above graph indicates, the lion’s share of funding in the FY 2018-19 CIP appropriations is
focused on Creek District infrastructure. Of the $19.9 million going to the Creek Projects, $9.8
million are directed toward the Via Vera Cruz Bridge, Bent Avenue Bridge and Discovery Street.
Adding those street improvements to the other non-Creek District street and traffic improvements
reveals that 58% of the total CIP is focused on street and traffic improvements.
In the Other category, there are two projects, Citywide ADA Improvements and a minor increase
($50,000) to the Channel Widening Project South of Grand Avenue.
With respect to the Facilities category, there are a number of projects, the largest being an interior
remodeling and construction of a new storage facility at Fire Station No. 3 ($800,000). The CIP also
includes a new $500,000 project to upgrade the audio/visual and broadcast capabilities of the
Community Center.
As the Council knows, many capital projects span multiple fiscal years and funding in FY 2018-19 is
based on staff’s best estimate of additional appropriations needed for the fiscal year in order to
further projects along. Some projects will require future appropriations as they move from
planning to design to construction.
Parks and Rec.3%
Creek District61%
Streets25%
Traffic3%
Facilities6%
Other2%
FY 18 - 19 CIP Program by Project Type
xi
Some of the major non-Creek District projects that are still in progress are:
Palomar Station Pedestrian Bridge ($5.55 million)
Rancho Coronado Park ($5.68 million)
South Lake Community Park ($4.75 million)
Channel Widening South of Grand Avenue ($4.29 million)
South Santa Fe – Smilax to Bosstick ($7.1 million)
Woodland Parkway SR 78 Interchange and Barham Road Widening ($17.4 million)
San Marcos Boulevard at Discovery Street Intersection Improvements ($2.61 million)
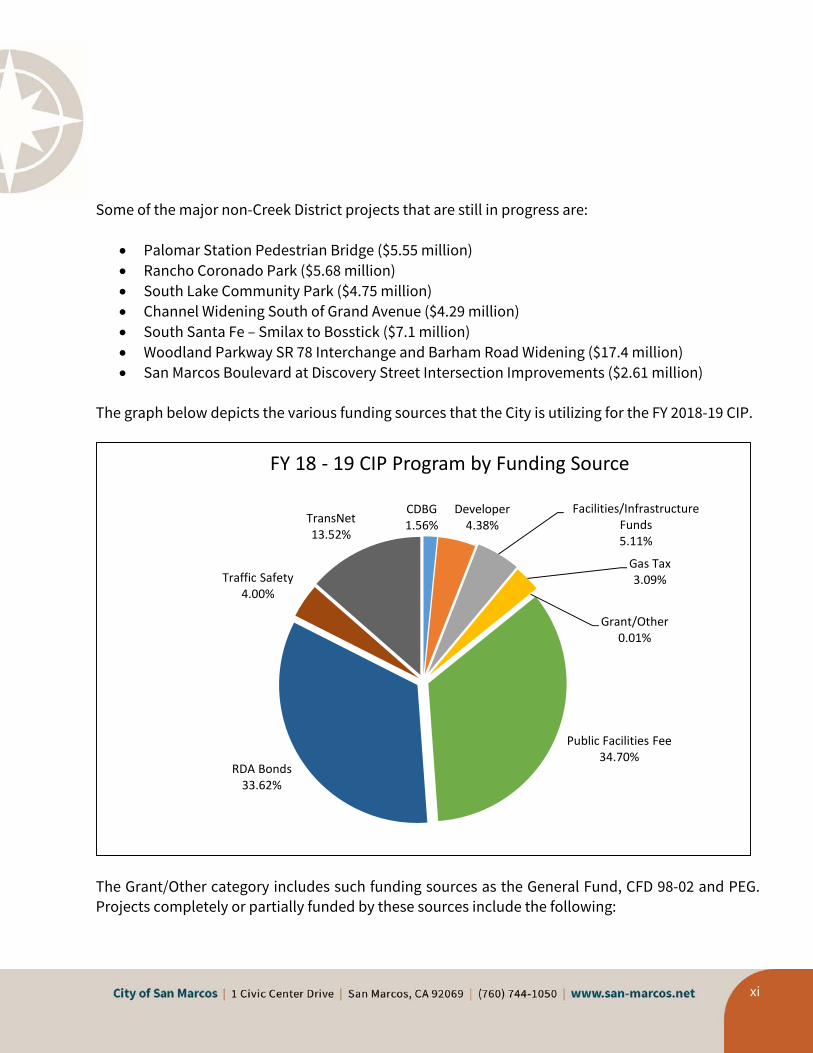
The graph below depicts the various funding sources that the City is utilizing for the FY 2018-19 CIP.
The Grant/Other category includes such funding sources as the General Fund, CFD 98-02 and PEG.
Projects completely or partially funded by these sources include the following:
CDBG1.56%
Developer4.38%
Facilities/Infrastructure Funds5.11%
Gas Tax3.09%
Grant/Other0.01%
Public Facilities Fee34.70%
RDA Bonds33.62%
Traffic Safety4.00%
TransNet13.52%
FY 18 ‐ 19 CIP Program by Funding Source
xii
San Marcos Boulevard Intersection Improvements
Park Infrastructure and Field Rehabilitation
Annual Playground Replacement
Community Center Audio/Visual Improvements
As the Council is aware, the Creek District makes up a significant portion of the five year CIP. The
total five year program starting in FY 2018-19 and extending through FY 2022-23 is $203,178,376.
The Creek District projects make up $101,848,523 or 50% of the total CIP. The main projects in the
Creek District are:
Via Vera Cruz Bridge ($30,524,498)
Bent Avenue Bridge ($24,278,256)
Discovery Street Widening and Flood Control ($13,227,028)
Creekside Drive and Grading ($15,341,449)
Promenade Construction ($3,784,675)
Environmental Habitat and Mitigation Establishment ($14,692,617)
CONCLUSION
The City’s finances remain in strong condition. The Council’s General Fund Reserve and Fiscal
Management Policies have been adhered to and while there are challenges facing the City in FY
2018-19, the continued growth of the economy has resulted in an uptick in revenues that are able to
keep pace with cost increases, fund both the rehabilitation and replacement efforts per Council
policy and make some operational enhancements. A solid foundation exists for providing quality
services while still preparing for the future. Through streamlined processes, new work procedures,
and better use of technology, we have been able to maintain critical programs and carry out
important infrastructure projects.
I would like to express my appreciation to all of our Department and Division Directors and
especially their budget staff. We continue to try to improve not only the budget document, but our
budgeting processes as well and the efforts of all of our departmental staff have resulted in a much
better budget development process and improved budget document.

xiii
I would especially like to express my appreciation to Laura Rocha, Director of Finance and IT and
Alan Stutler, Budget and Revenue Officer as well as the Budget Review Committee for their efforts
on improving our budget program.
I would also like to express my appreciation to the City Council for providing the leadership and
support necessary to pursue and achieve our goals and to City staff for their commitment in
providing top-quality services to the community. Our combined efforts are critical to the City’s
success.
Sincerely,
Jack Griffin
City Manager

This page intentionally left blank.
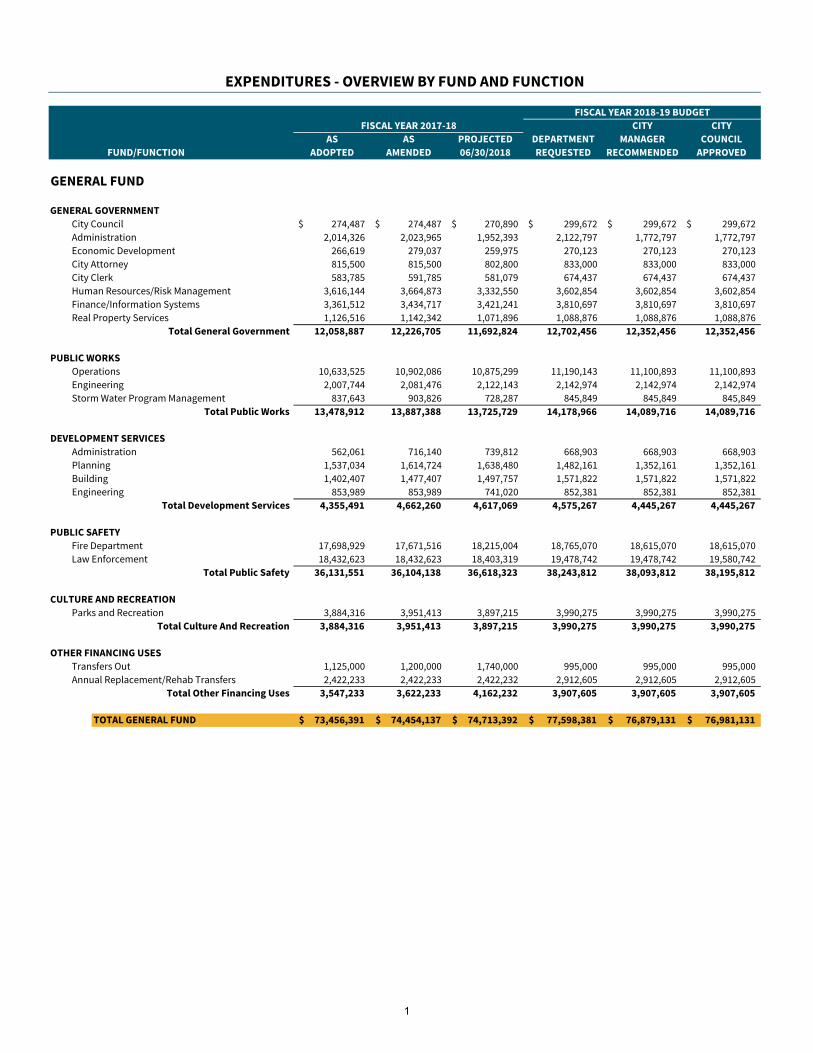
EXPENDITURES - OVERVIEW BY FUND AND FUNCTION
FISCAL YEAR 2018-19 BUDGET
FISCAL YEAR 2017-18 CITY CITY
AS AS PROJECTED DEPARTMENT MANAGER COUNCIL
FUND/FUNCTION ADOPTED AMENDED 06/30/2018 REQUESTED RECOMMENDED APPROVED
GENERAL FUND
GENERAL GOVERNMENT
City Council 274,487$ 274,487$ 270,890$ 299,672$ 299,672$ 299,672$
Administration 2,014,326 2,023,965 1,952,393 2,122,797 1,772,797 1,772,797
Economic Development 266,619 279,037 259,975 270,123 270,123 270,123
City Attorney 815,500 815,500 802,800 833,000 833,000 833,000
City Clerk 583,785 591,785 581,079 674,437 674,437 674,437
Human Resources/Risk Management 3,616,144 3,664,873 3,332,550 3,602,854 3,602,854 3,602,854
Finance/Information Systems 3,361,512 3,434,717 3,421,241 3,810,697 3,810,697 3,810,697
Real Property Services 1,126,516 1,142,342 1,071,896 1,088,876 1,088,876 1,088,876
Total General Government 12,058,887 12,226,705 11,692,824 12,702,456 12,352,456 12,352,456
-4.37% 8.63% -2.76% 0.00%
PUBLIC WORKS
Operations 10,633,525 10,902,086 10,875,299 11,190,143 11,100,893 11,100,893
Engineering 2,007,744 2,081,476 2,122,143 2,142,974 2,142,974 2,142,974
Storm Water Program Management 837,643 903,826 728,287 845,849 845,849 845,849
Total Public Works 13,478,912 13,887,388 13,725,729 14,178,966 14,089,716 14,089,716
-1.16% 3.30% -0.63% 0.00%
DEVELOPMENT SERVICES
Administration 562,061 716,140 739,812 668,903 668,903 668,903
Planning 1,537,034 1,614,724 1,638,480 1,482,161 1,352,161 1,352,161
Building 1,402,407 1,477,407 1,497,757 1,571,822 1,571,822 1,571,822
Engineering 853,989 853,989 741,020 852,381 852,381 852,381
Total Development Services 4,355,491 4,662,260 4,617,069 4,575,267 4,445,267 4,445,267
-0.97% -0.91% -2.84% 0.00%
PUBLIC SAFETY
Fire Department 17,698,929 17,671,516 18,215,004 18,765,070 18,615,070 18,615,070
Law Enforcement 18,432,623 18,432,623 18,403,319 19,478,742 19,478,742 19,580,742
Total Public Safety 36,131,551 36,104,138 36,618,323 38,243,812 38,093,812 38,195,812
1.42% 4.44% -0.39% 0.27%
CULTURE AND RECREATION
Parks and Recreation 3,884,316 3,951,413 3,897,215 3,990,275 3,990,275 3,990,275
Total Culture And Recreation 3,884,316 3,951,413 3,897,215 3,990,275 3,990,275 3,990,275
-1.37% 2.39% 0.00% 0.00%
OTHER FINANCING USES
Transfers Out 1,125,000 1,200,000 1,740,000 995,000 995,000 995,000
Annual Replacement/Rehab Transfers 2,422,233 2,422,233 2,422,232 2,912,605 2,912,605 2,912,605
Total Other Financing Uses 3,547,233 3,622,233 4,162,232 3,907,605 3,907,605 3,907,605
14.91% -6.12% 0.00% 0.00%
TOTAL GENERAL FUND 73,456,391$ 74,454,137$ 74,713,392$ 77,598,381$ 76,879,131$ 76,981,131$
997,746 259,256 2,884,988 (719,250) 102,000
1.36% 0.35% 3.86% -0.93% 0.13%
1
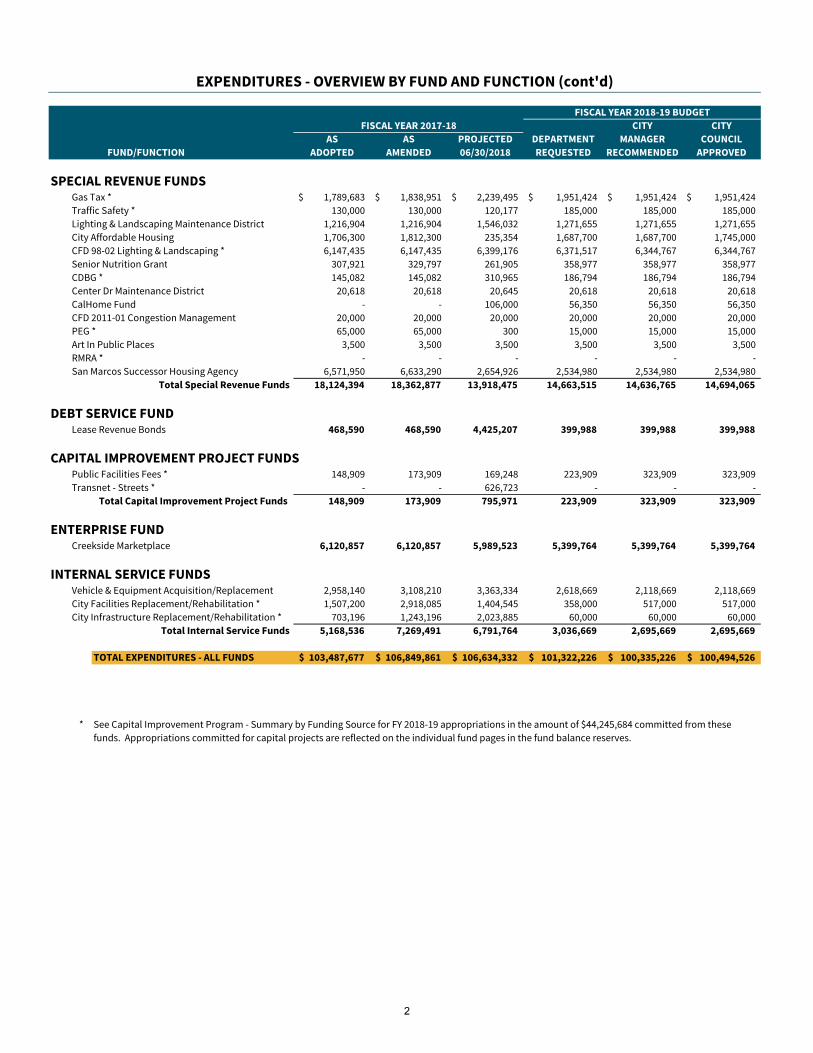
EXPENDITURES - OVERVIEW BY FUND AND FUNCTION (cont'd)
FISCAL YEAR 2018-19 BUDGET
FISCAL YEAR 2017-18 CITY CITY
AS AS PROJECTED DEPARTMENT MANAGER COUNCIL
FUND/FUNCTION ADOPTED AMENDED 06/30/2018 REQUESTED RECOMMENDED APPROVED
SPECIAL REVENUE FUNDSGas Tax * 1,789,683$ 1,838,951$ 2,239,495$ 1,951,424$ 1,951,424$ 1,951,424$
Traffic Safety * 130,000 130,000 120,177 185,000 185,000 185,000
Lighting & Landscaping Maintenance District 1,216,904 1,216,904 1,546,032 1,271,655 1,271,655 1,271,655
City Affordable Housing 1,706,300 1,812,300 235,354 1,687,700 1,687,700 1,745,000
CFD 98-02 Lighting & Landscaping * 6,147,435 6,147,435 6,399,176 6,371,517 6,344,767 6,344,767
Senior Nutrition Grant 307,921 329,797 261,905 358,977 358,977 358,977
CDBG * 145,082 145,082 310,965 186,794 186,794 186,794
Center Dr Maintenance District 20,618 20,618 20,645 20,618 20,618 20,618
CalHome Fund - - 106,000 56,350 56,350 56,350
CFD 2011-01 Congestion Management 20,000 20,000 20,000 20,000 20,000 20,000
PEG * 65,000 65,000 300 15,000 15,000 15,000
Art In Public Places 3,500 3,500 3,500 3,500 3,500 3,500
RMRA * - - - - - -
San Marcos Successor Housing Agency 6,571,950 6,633,290 2,654,926 2,534,980 2,534,980 2,534,980
Total Special Revenue Funds 18,124,394 18,362,877 13,918,475 14,663,515 14,636,765 14,694,065
DEBT SERVICE FUNDLease Revenue Bonds 468,590 468,590 4,425,207 399,988 399,988 399,988
CAPITAL IMPROVEMENT PROJECT FUNDS Public Facilities Fees * 148,909 173,909 169,248 223,909 323,909 323,909
Transnet - Streets * - - 626,723 - - -
Total Capital Improvement Project Funds 148,909 173,909 795,971 223,909 323,909 323,909
ENTERPRISE FUNDCreekside Marketplace 6,120,857 6,120,857 5,989,523 5,399,764 5,399,764 5,399,764
INTERNAL SERVICE FUNDSVehicle & Equipment Acquisition/Replacement 2,958,140 3,108,210 3,363,334 2,618,669 2,118,669 2,118,669
City Facilities Replacement/Rehabilitation * 1,507,200 2,918,085 1,404,545 358,000 517,000 517,000
City Infrastructure Replacement/Rehabilitation * 703,196 1,243,196 2,023,885 60,000 60,000 60,000
Total Internal Service Funds 5,168,536 7,269,491 6,791,764 3,036,669 2,695,669 2,695,669
TOTAL EXPENDITURES - ALL FUNDS 103,487,677$ 106,849,861$ 106,634,332$ 101,322,226$ 100,335,226$ 100,494,526$
$0 $0
will be off will be off
$30K due to $30K due to
* See Capital Improvement Program - Summary by Funding Source for FY 2018-19 appropriations in the amount of $44,245,684 committed from these
funds. Appropriations committed for capital projects are reflected on the individual fund pages in the fund balance reserves.
259.000
259.000
2
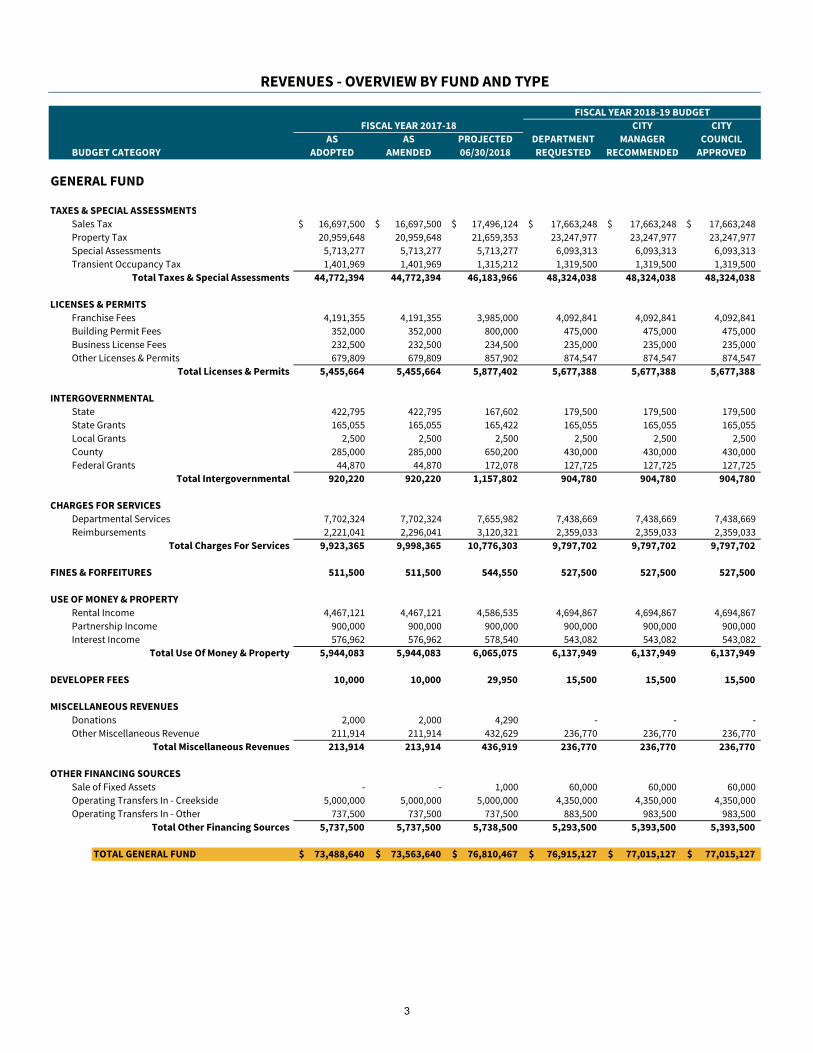
REVENUES - OVERVIEW BY FUND AND TYPE
FISCAL YEAR 2018-19 BUDGET
FISCAL YEAR 2017-18 CITY CITY
AS AS PROJECTED DEPARTMENT MANAGER COUNCIL
BUDGET CATEGORY ADOPTED AMENDED 06/30/2018 REQUESTED RECOMMENDED APPROVED
GENERAL FUND
TAXES & SPECIAL ASSESSMENTS
Sales Tax 16,697,500$ 16,697,500$ 17,496,124$ 17,663,248$ 17,663,248$ 17,663,248$
Property Tax 20,959,648 20,959,648 21,659,353 23,247,977 23,247,977 23,247,977
Special Assessments 5,713,277 5,713,277 5,713,277 6,093,313 6,093,313 6,093,313
Transient Occupancy Tax 1,401,969 1,401,969 1,315,212 1,319,500 1,319,500 1,319,500
Total Taxes & Special Assessments 44,772,394 44,772,394 46,183,966 48,324,038 48,324,038 48,324,038
3.15% 4.63% 0.00% 0.00%
LICENSES & PERMITS
Franchise Fees 4,191,355 4,191,355 3,985,000 4,092,841 4,092,841 4,092,841
Building Permit Fees 352,000 352,000 800,000 475,000 475,000 475,000
Business License Fees 232,500 232,500 234,500 235,000 235,000 235,000
Other Licenses & Permits 679,809 679,809 857,902 874,547 874,547 874,547
Total Licenses & Permits 5,455,664 5,455,664 5,877,402 5,677,388 5,677,388 5,677,388
7.73% -3.40% 0.00% 0.00%
INTERGOVERNMENTAL
State 422,795 422,795 167,602 179,500 179,500 179,500
State Grants 165,055 165,055 165,422 165,055 165,055 165,055
Local Grants 2,500 2,500 2,500 2,500 2,500 2,500
County 285,000 285,000 650,200 430,000 430,000 430,000
Federal Grants 44,870 44,870 172,078 127,725 127,725 127,725
Total Intergovernmental 920,220 920,220 1,157,802 904,780 904,780 904,780
25.82% -21.85% 0.00% 0.00%
CHARGES FOR SERVICES
Departmental Services 7,702,324 7,702,324 7,655,982 7,438,669 7,438,669 7,438,669
Reimbursements 2,221,041 2,296,041 3,120,321 2,359,033 2,359,033 2,359,033
Total Charges For Services 9,923,365 9,998,365 10,776,303 9,797,702 9,797,702 9,797,702
7.78% -9.08% 0.00% 0.00%
FINES & FORFEITURES 511,500 511,500 544,550 527,500 527,500 527,500
6.46% -3.13% 0.00% 0.00%
USE OF MONEY & PROPERTY
Rental Income 4,467,121 4,467,121 4,586,535 4,694,867 4,694,867 4,694,867
Partnership Income 900,000 900,000 900,000 900,000 900,000 900,000
Interest Income 576,962 576,962 578,540 543,082 543,082 543,082
Total Use Of Money & Property 5,944,083 5,944,083 6,065,075 6,137,949 6,137,949 6,137,949
2.04% 1.20% 0.00% 0.00%
DEVELOPER FEES 10,000 10,000 29,950 15,500 15,500 15,500
-48.25% 0.00% 0.00%
MISCELLANEOUS REVENUES
Donations 2,000 2,000 4,290 - - -
Other Miscellaneous Revenue 211,914 211,914 432,629 236,770 236,770 236,770
Total Miscellaneous Revenues 213,914 213,914 436,919 236,770 236,770 236,770
104.25% -45.81% 0.00% 0.00%
OTHER FINANCING SOURCES
Sale of Fixed Assets - - 1,000 60,000 60,000 60,000
Operating Transfers In - Creekside 5,000,000 5,000,000 5,000,000 4,350,000 4,350,000 4,350,000
Operating Transfers In - Other 737,500 737,500 737,500 883,500 983,500 983,500
Total Other Financing Sources 5,737,500 5,737,500 5,738,500 5,293,500 5,393,500 5,393,500
0.02% -7.75% 1.89% 0.00%
TOTAL GENERAL FUND 73,488,640$ 73,563,640$ 76,810,467$ 76,915,127$ 77,015,127$ 77,015,127$
3,246,827 104,660 100,000 0
4.41% 0.14% 0.13% 0.00%
3
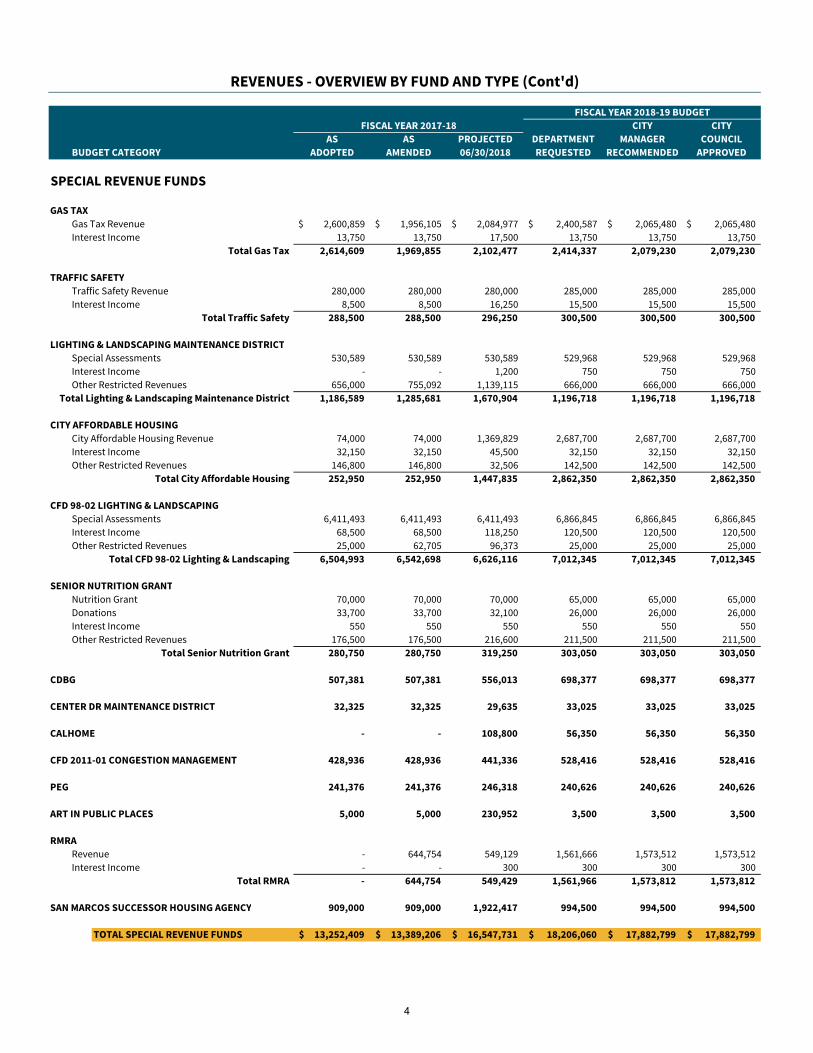
REVENUES - OVERVIEW BY FUND AND TYPE (Cont'd)
FISCAL YEAR 2018-19 BUDGET
FISCAL YEAR 2017-18 CITY CITY
AS AS PROJECTED DEPARTMENT MANAGER COUNCIL
BUDGET CATEGORY ADOPTED AMENDED 06/30/2018 REQUESTED RECOMMENDED APPROVED
SPECIAL REVENUE FUNDS
GAS TAX
Gas Tax Revenue 2,600,859$ 1,956,105$ 2,084,977$ 2,400,587$ 2,065,480$ 2,065,480$
Interest Income 13,750 13,750 17,500 13,750 13,750 13,750
Total Gas Tax 2,614,609 1,969,855 2,102,477 2,414,337 2,079,230 2,079,230
TRAFFIC SAFETY
Traffic Safety Revenue 280,000 280,000 280,000 285,000 285,000 285,000
Interest Income 8,500 8,500 16,250 15,500 15,500 15,500
Total Traffic Safety 288,500 288,500 296,250 300,500 300,500 300,500
LIGHTING & LANDSCAPING MAINTENANCE DISTRICT
Special Assessments 530,589 530,589 530,589 529,968 529,968 529,968
Interest Income - - 1,200 750 750 750
Other Restricted Revenues 656,000 755,092 1,139,115 666,000 666,000 666,000
Total Lighting & Landscaping Maintenance District 1,186,589 1,285,681 1,670,904 1,196,718 1,196,718 1,196,718
CITY AFFORDABLE HOUSING
City Affordable Housing Revenue 74,000 74,000 1,369,829 2,687,700 2,687,700 2,687,700
Interest Income 32,150 32,150 45,500 32,150 32,150 32,150
Other Restricted Revenues 146,800 146,800 32,506 142,500 142,500 142,500
Total City Affordable Housing 252,950 252,950 1,447,835 2,862,350 2,862,350 2,862,350
CFD 98-02 LIGHTING & LANDSCAPING
Special Assessments 6,411,493 6,411,493 6,411,493 6,866,845 6,866,845 6,866,845
Interest Income 68,500 68,500 118,250 120,500 120,500 120,500
Other Restricted Revenues 25,000 62,705 96,373 25,000 25,000 25,000
Total CFD 98-02 Lighting & Landscaping 6,504,993 6,542,698 6,626,116 7,012,345 7,012,345 7,012,345
SENIOR NUTRITION GRANT
Nutrition Grant 70,000 70,000 70,000 65,000 65,000 65,000
Donations 33,700 33,700 32,100 26,000 26,000 26,000
Interest Income 550 550 550 550 550 550
Other Restricted Revenues 176,500 176,500 216,600 211,500 211,500 211,500
Total Senior Nutrition Grant 280,750 280,750 319,250 303,050 303,050 303,050
CDBG 507,381 507,381 556,013 698,377 698,377 698,377
CENTER DR MAINTENANCE DISTRICT 32,325 32,325 29,635 33,025 33,025 33,025
CALHOME - - 108,800 56,350 56,350 56,350
CFD 2011-01 CONGESTION MANAGEMENT 428,936 428,936 441,336 528,416 528,416 528,416
PEG 241,376 241,376 246,318 240,626 240,626 240,626
ART IN PUBLIC PLACES 5,000 5,000 230,952 3,500 3,500 3,500
RMRA
Revenue - 644,754 549,129 1,561,666 1,573,512 1,573,512
Interest Income - - 300 300 300 300
Total RMRA - 644,754 549,429 1,561,966 1,573,812 1,573,812
SAN MARCOS SUCCESSOR HOUSING AGENCY 909,000 909,000 1,922,417 994,500 994,500 994,500
TOTAL SPECIAL REVENUE FUNDS 13,252,409$ 13,389,206$ 16,547,731$ 18,206,060$ 17,882,799$ 17,882,799$
4
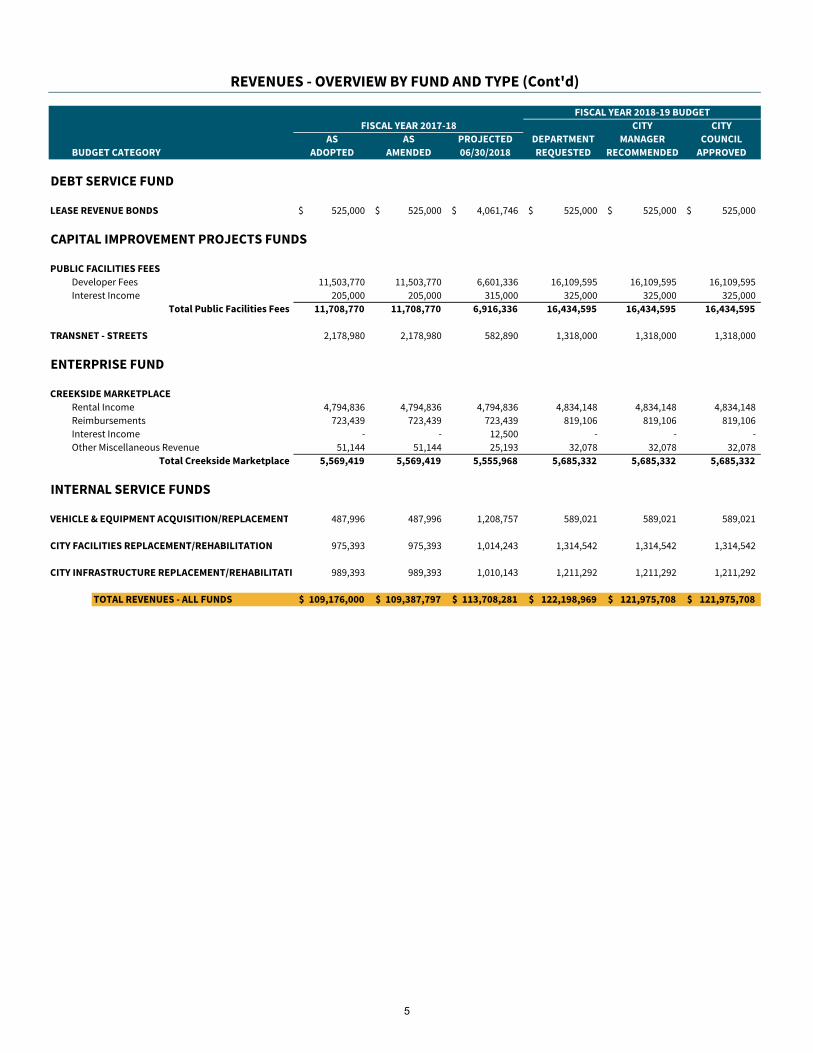
REVENUES - OVERVIEW BY FUND AND TYPE (Cont'd)
FISCAL YEAR 2018-19 BUDGET
FISCAL YEAR 2017-18 CITY CITY
AS AS PROJECTED DEPARTMENT MANAGER COUNCIL
BUDGET CATEGORY ADOPTED AMENDED 06/30/2018 REQUESTED RECOMMENDED APPROVED
DEBT SERVICE FUND
LEASE REVENUE BONDS 525,000$ 525,000$ 4,061,746$ 525,000$ 525,000$ 525,000$
CAPITAL IMPROVEMENT PROJECTS FUNDS
PUBLIC FACILITIES FEES
Developer Fees 11,503,770 11,503,770 6,601,336 16,109,595 16,109,595 16,109,595
Interest Income 205,000 205,000 315,000 325,000 325,000 325,000
Total Public Facilities Fees 11,708,770 11,708,770 6,916,336 16,434,595 16,434,595 16,434,595
TRANSNET - STREETS 2,178,980 2,178,980 582,890 1,318,000 1,318,000 1,318,000
ENTERPRISE FUND
CREEKSIDE MARKETPLACE
Rental Income 4,794,836 4,794,836 4,794,836 4,834,148 4,834,148 4,834,148
Reimbursements 723,439 723,439 723,439 819,106 819,106 819,106
Interest Income - - 12,500 - - -
Other Miscellaneous Revenue 51,144 51,144 25,193 32,078 32,078 32,078
Total Creekside Marketplace 5,569,419 5,569,419 5,555,968 5,685,332 5,685,332 5,685,332
INTERNAL SERVICE FUNDS
VEHICLE & EQUIPMENT ACQUISITION/REPLACEMENT 487,996 487,996 1,208,757 589,021 589,021 589,021
CITY FACILITIES REPLACEMENT/REHABILITATION 975,393 975,393 1,014,243 1,314,542 1,314,542 1,314,542
CITY INFRASTRUCTURE REPLACEMENT/REHABILITATIO 989,393 989,393 1,010,143 1,211,292 1,211,292 1,211,292
TOTAL REVENUES - ALL FUNDS 109,176,000$ 109,387,797$ 113,708,281$ 122,198,969$ 121,975,708$ 121,975,708$
113,708,281$ 122,198,969$ 121,975,708$
-$ -$ -$
5

|
This page intentionally left blank.
6
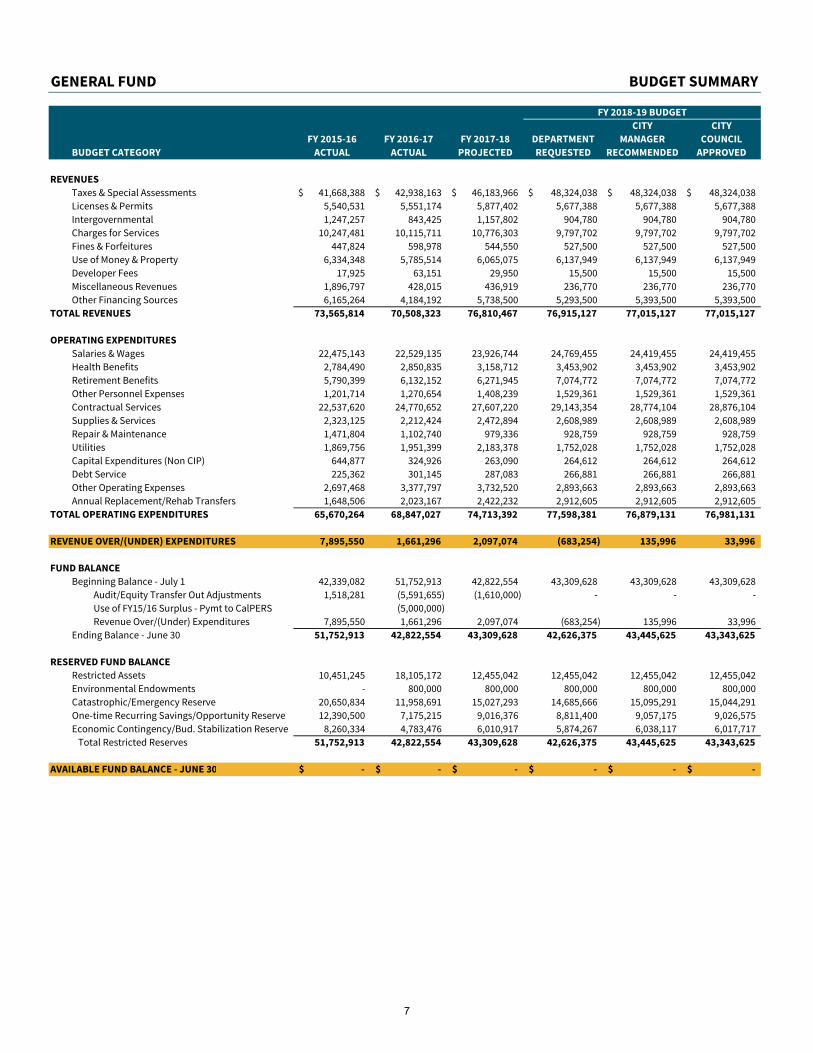
GENERAL FUND BUDGET SUMMARY
FY 2018-19 BUDGET
CITY CITY
FY 2015-16 FY 2016-17 FY 2017-18 DEPARTMENT MANAGER COUNCIL
BUDGET CATEGORY ACTUAL ACTUAL PROJECTED REQUESTED RECOMMENDED APPROVED
REVENUES
Taxes & Special Assessments 41,668,388$ 42,938,163$ 46,183,966$ 48,324,038$ 48,324,038$ 48,324,038$
Licenses & Permits 5,540,531 5,551,174 5,877,402 5,677,388 5,677,388 5,677,388
Intergovernmental 1,247,257 843,425 1,157,802 904,780 904,780 904,780
Charges for Services 10,247,481 10,115,711 10,776,303 9,797,702 9,797,702 9,797,702
Fines & Forfeitures 447,824 598,978 544,550 527,500 527,500 527,500
Use of Money & Property 6,334,348 5,785,514 6,065,075 6,137,949 6,137,949 6,137,949
Developer Fees 17,925 63,151 29,950 15,500 15,500 15,500
Miscellaneous Revenues 1,896,797 428,015 436,919 236,770 236,770 236,770
Other Financing Sources 6,165,264 4,184,192 5,738,500 5,293,500 5,393,500 5,393,500
TOTAL REVENUES 73,565,814 70,508,323 76,810,467 76,915,127 77,015,127 77,015,127
OPERATING EXPENDITURES
Salaries & Wages 22,475,143 22,529,135 23,926,744 24,769,455 24,419,455 24,419,455
Health Benefits 2,784,490 2,850,835 3,158,712 3,453,902 3,453,902 3,453,902
Retirement Benefits 5,790,399 6,132,152 6,271,945 7,074,772 7,074,772 7,074,772
Other Personnel Expenses 1,201,714 1,270,654 1,408,239 1,529,361 1,529,361 1,529,361
Contractual Services 22,537,620 24,770,652 27,607,220 29,143,354 28,774,104 28,876,104
Supplies & Services 2,323,125 2,212,424 2,472,894 2,608,989 2,608,989 2,608,989
Repair & Maintenance 1,471,804 1,102,740 979,336 928,759 928,759 928,759
Utilities 1,869,756 1,951,399 2,183,378 1,752,028 1,752,028 1,752,028
Capital Expenditures (Non CIP) 644,877 324,926 263,090 264,612 264,612 264,612
Debt Service 225,362 301,145 287,083 266,881 266,881 266,881
Other Operating Expenses 2,697,468 3,377,797 3,732,520 2,893,663 2,893,663 2,893,663
Annual Replacement/Rehab Transfers 1,648,506 2,023,167 2,422,232 2,912,605 2,912,605 2,912,605
TOTAL OPERATING EXPENDITURES 65,670,264 68,847,027 74,713,392 77,598,381 76,879,131 76,981,131
REVENUE OVER/(UNDER) EXPENDITURES 7,895,550 1,661,296 2,097,074 (683,254) 135,996 33,996
FUND BALANCE
Beginning Balance - July 1 42,339,082 51,752,913 42,822,554 43,309,628 43,309,628 43,309,628
Audit/Equity Transfer Out Adjustments 1,518,281 (5,591,655) (1,610,000) - - -
Use of FY15/16 Surplus - Pymt to CalPERS (5,000,000)
Revenue Over/(Under) Expenditures 7,895,550 1,661,296 2,097,074 (683,254) 135,996 33,996
Ending Balance - June 30 51,752,913 42,822,554 43,309,628 42,626,375 43,445,625 43,343,625
RESERVED FUND BALANCE
Restricted Assets 10,451,245 18,105,172 12,455,042 12,455,042 12,455,042 12,455,042
Environmental Endowments - 800,000 800,000 800,000 800,000 800,000
Catastrophic/Emergency Reserve 20,650,834 11,958,691 15,027,293 14,685,666 15,095,291 15,044,291
One-time Recurring Savings/Opportunity Reserve 12,390,500 7,175,215 9,016,376 8,811,400 9,057,175 9,026,575
Economic Contingency/Bud. Stabilization Reserve 8,260,334 4,783,476 6,010,917 5,874,267 6,038,117 6,017,717
Total Restricted Reserves 51,752,913 42,822,554 43,309,628 42,626,375 43,445,625 43,343,625
AVAILABLE FUND BALANCE - JUNE 30 -$ -$ -$ -$ -$ -$
7
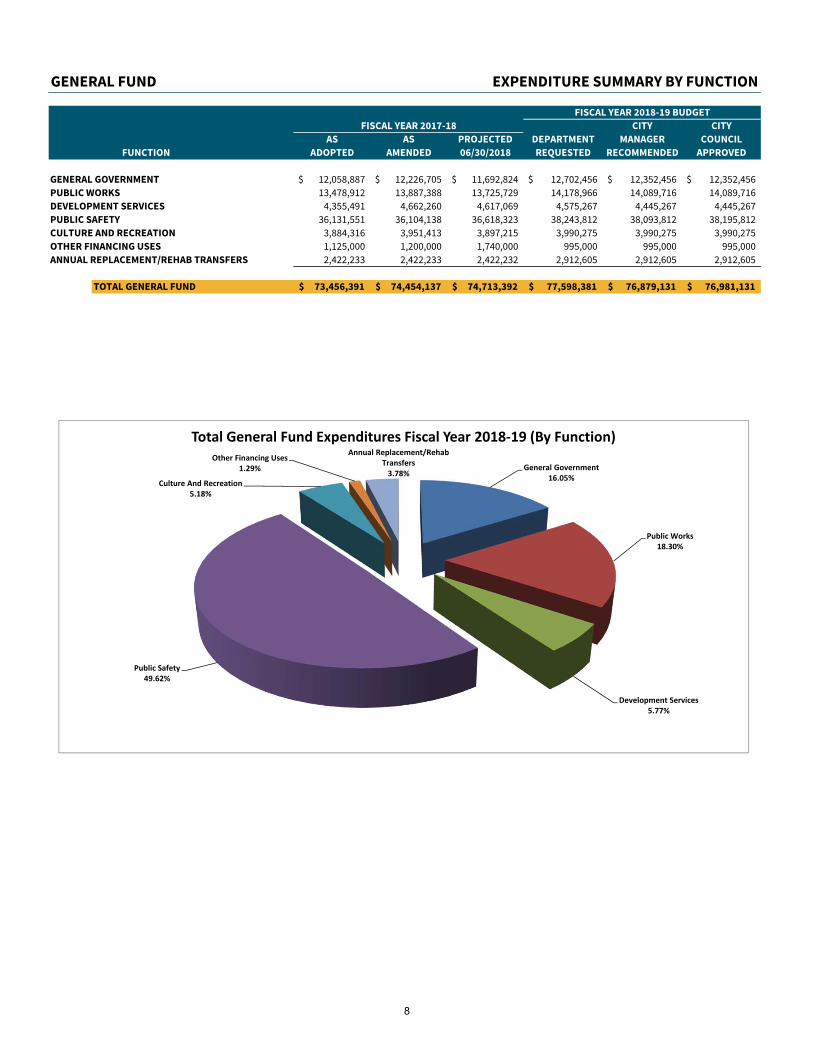
GENERAL FUND EXPENDITURE SUMMARY BY FUNCTION
FISCAL YEAR 2018-19 BUDGET
FISCAL YEAR 2017-18 CITY CITY
AS AS PROJECTED DEPARTMENT MANAGER COUNCIL
FUNCTION ADOPTED AMENDED 06/30/2018 REQUESTED RECOMMENDED APPROVED
GENERAL GOVERNMENT 12,058,887$ 12,226,705$ 11,692,824$ 12,702,456$ 12,352,456$ 12,352,456$
PUBLIC WORKS 13,478,912 13,887,388 13,725,729 14,178,966 14,089,716 14,089,716
DEVELOPMENT SERVICES 4,355,491 4,662,260 4,617,069 4,575,267 4,445,267 4,445,267
PUBLIC SAFETY 36,131,551 36,104,138 36,618,323 38,243,812 38,093,812 38,195,812
CULTURE AND RECREATION 3,884,316 3,951,413 3,897,215 3,990,275 3,990,275 3,990,275
OTHER FINANCING USES 1,125,000 1,200,000 1,740,000 995,000 995,000 995,000
ANNUAL REPLACEMENT/REHAB TRANSFERS 2,422,233 2,422,233 2,422,232 2,912,605 2,912,605 2,912,605
TOTAL GENERAL FUND 73,456,391$ 74,454,137$ 74,713,392$ 77,598,381$ 76,879,131$ 76,981,131$
73,456,391$ 74,454,137$ 74,713,392$ 77,598,381$ 76,879,131$ 76,981,131$
-$ -$ -$ -$ -$ -$
General Government16.05%
Public Works18.30%
Development Services5.77%
Public Safety49.62%
Culture And Recreation5.18%
Other Financing Uses1.29%
Annual Replacement/Rehab Transfers3.78%
Total General Fund Expenditures Fiscal Year 2018‐19 (By Function)
8
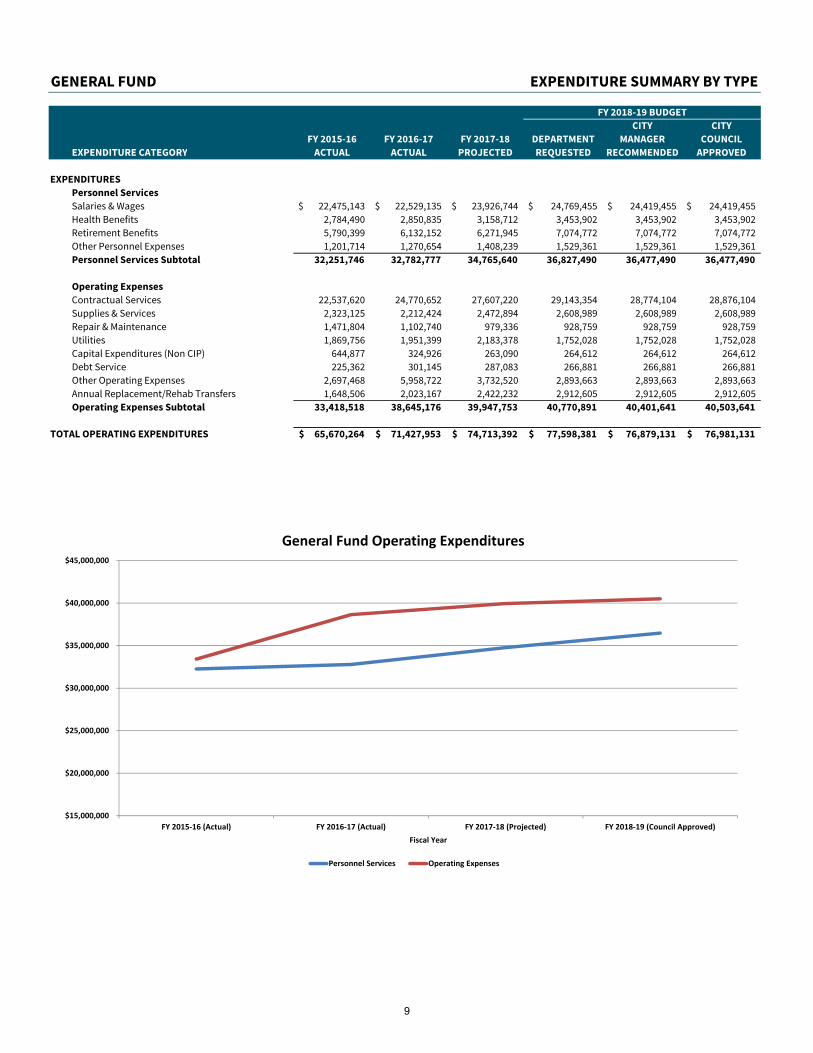
GENERAL FUND EXPENDITURE SUMMARY BY TYPE
FY 2018-19 BUDGET
CITY CITY
FY 2015-16 FY 2016-17 FY 2017-18 DEPARTMENT MANAGER COUNCIL
EXPENDITURE CATEGORY ACTUAL ACTUAL PROJECTED REQUESTED RECOMMENDED APPROVED
EXPENDITURES
Personnel Services
Salaries & Wages 22,475,143$ 22,529,135$ 23,926,744$ 24,769,455$ 24,419,455$ 24,419,455$
Health Benefits 2,784,490 2,850,835 3,158,712 3,453,902 3,453,902 3,453,902
Retirement Benefits 5,790,399 6,132,152 6,271,945 7,074,772 7,074,772 7,074,772
Other Personnel Expenses 1,201,714 1,270,654 1,408,239 1,529,361 1,529,361 1,529,361
Personnel Services Subtotal 32,251,746 32,782,777 34,765,640 36,827,490 36,477,490 36,477,490
Operating Expenses
Contractual Services 22,537,620 24,770,652 27,607,220 29,143,354 28,774,104 28,876,104
Supplies & Services 2,323,125 2,212,424 2,472,894 2,608,989 2,608,989 2,608,989
Repair & Maintenance 1,471,804 1,102,740 979,336 928,759 928,759 928,759
Utilities 1,869,756 1,951,399 2,183,378 1,752,028 1,752,028 1,752,028
Capital Expenditures (Non CIP) 644,877 324,926 263,090 264,612 264,612 264,612
Debt Service 225,362 301,145 287,083 266,881 266,881 266,881
Other Operating Expenses 2,697,468 5,958,722 3,732,520 2,893,663 2,893,663 2,893,663
Annual Replacement/Rehab Transfers 1,648,506 2,023,167 2,422,232 2,912,605 2,912,605 2,912,605
Operating Expenses Subtotal 33,418,518 38,645,176 39,947,753 40,770,891 40,401,641 40,503,641
TOTAL OPERATING EXPENDITURES 65,670,264$ 71,427,953$ 74,713,392$ 77,598,381$ 76,879,131$ 76,981,131$
$15,000,000
$20,000,000
$25,000,000
$30,000,000
$35,000,000
$40,000,000
$45,000,000
FY 2015‐16 (Actual) FY 2016‐17 (Actual) FY 2017‐18 (Projected) FY 2018‐19 (Council Approved)
Fiscal Year
General Fund Operating Expenditures
Personnel Services Operating Expenses
9
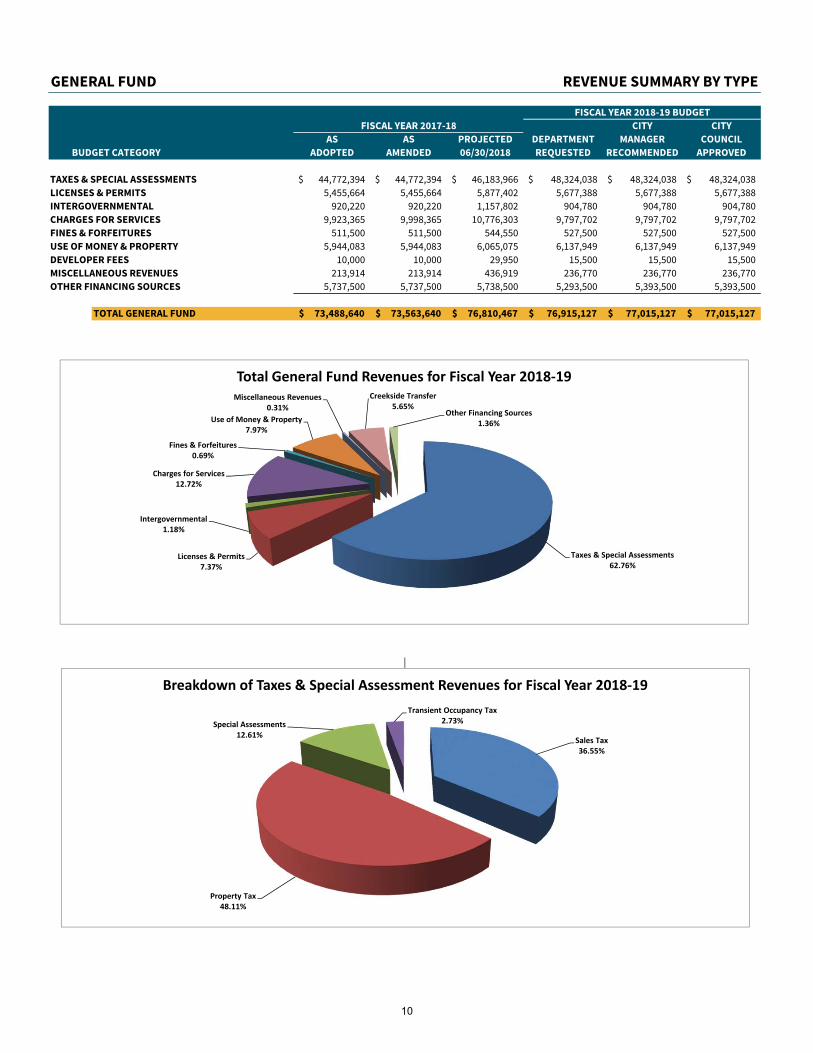
GENERAL FUND REVENUE SUMMARY BY TYPE
FISCAL YEAR 2018-19 BUDGET
FISCAL YEAR 2017-18 CITY CITY
AS AS PROJECTED DEPARTMENT MANAGER COUNCIL
BUDGET CATEGORY ADOPTED AMENDED 06/30/2018 REQUESTED RECOMMENDED APPROVED
TAXES & SPECIAL ASSESSMENTS 44,772,394$ 44,772,394$ 46,183,966$ 48,324,038$ 48,324,038$ 48,324,038$
LICENSES & PERMITS 5,455,664 5,455,664 5,877,402 5,677,388 5,677,388 5,677,388
INTERGOVERNMENTAL 920,220 920,220 1,157,802 904,780 904,780 904,780
CHARGES FOR SERVICES 9,923,365 9,998,365 10,776,303 9,797,702 9,797,702 9,797,702
FINES & FORFEITURES 511,500 511,500 544,550 527,500 527,500 527,500
USE OF MONEY & PROPERTY 5,944,083 5,944,083 6,065,075 6,137,949 6,137,949 6,137,949
DEVELOPER FEES 10,000 10,000 29,950 15,500 15,500 15,500
MISCELLANEOUS REVENUES 213,914 213,914 436,919 236,770 236,770 236,770
OTHER FINANCING SOURCES 5,737,500 5,737,500 5,738,500 5,293,500 5,393,500 5,393,500
TOTAL GENERAL FUND 73,488,640$ 73,563,640$ 76,810,467$ 76,915,127$ 77,015,127$ 77,015,127$
|
Taxes & Special Assessments62.76%
Licenses & Permits7.37%
Intergovernmental1.18%
Charges for Services12.72%
Fines & Forfeitures0.69%
Use of Money & Property7.97%
Miscellaneous Revenues0.31%
Creekside Transfer5.65%
Other Financing Sources1.36%
Total General Fund Revenues for Fiscal Year 2018‐19
Sales Tax36.55%
Property Tax48.11%
Special Assessments12.61%
Transient Occupancy Tax2.73%
Breakdown of Taxes & Special Assessment Revenues for Fiscal Year 2018‐19
10
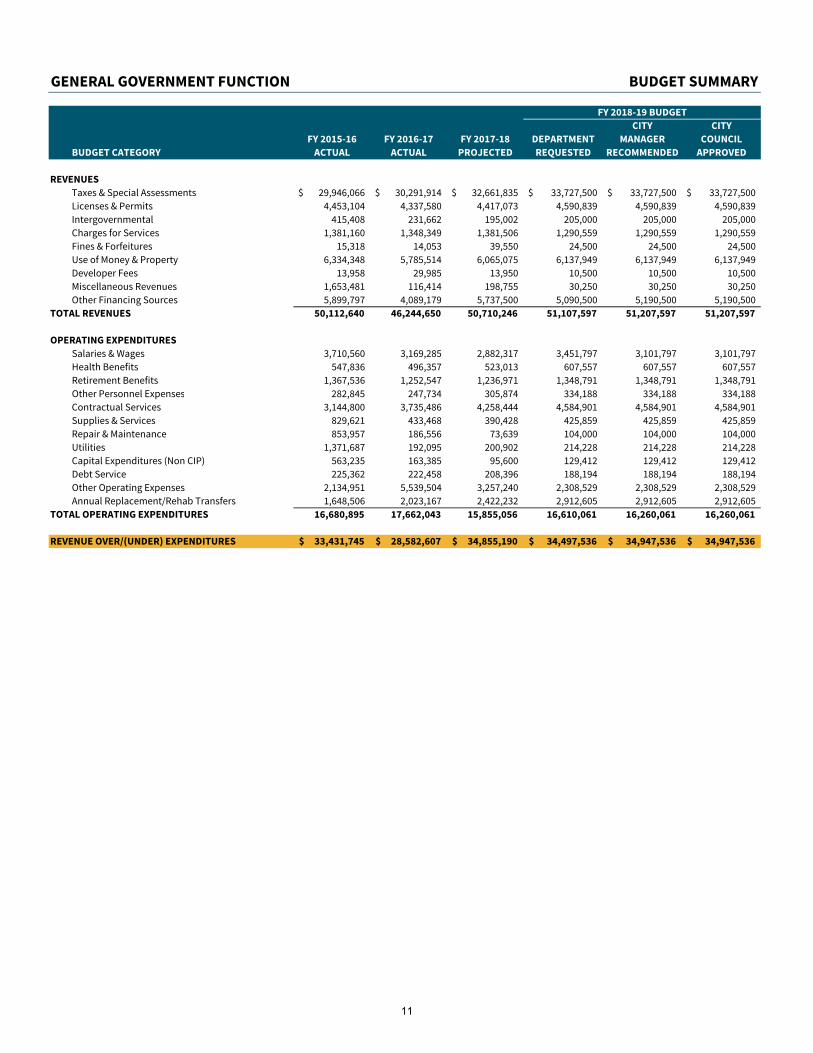
GENERAL GOVERNMENT FUNCTION BUDGET SUMMARY
FY 2018-19 BUDGET
CITY CITY
FY 2015-16 FY 2016-17 FY 2017-18 DEPARTMENT MANAGER COUNCIL
BUDGET CATEGORY ACTUAL ACTUAL PROJECTED REQUESTED RECOMMENDED APPROVED
REVENUES
Taxes & Special Assessments 29,946,066$ 30,291,914$ 32,661,835$ 33,727,500$ 33,727,500$ 33,727,500$
Licenses & Permits 4,453,104 4,337,580 4,417,073 4,590,839 4,590,839 4,590,839
Intergovernmental 415,408 231,662 195,002 205,000 205,000 205,000
Charges for Services 1,381,160 1,348,349 1,381,506 1,290,559 1,290,559 1,290,559
Fines & Forfeitures 15,318 14,053 39,550 24,500 24,500 24,500
Use of Money & Property 6,334,348 5,785,514 6,065,075 6,137,949 6,137,949 6,137,949
Developer Fees 13,958 29,985 13,950 10,500 10,500 10,500
Miscellaneous Revenues 1,653,481 116,414 198,755 30,250 30,250 30,250
Other Financing Sources 5,899,797 4,089,179 5,737,500 5,090,500 5,190,500 5,190,500
TOTAL REVENUES 50,112,640 46,244,650 50,710,246 51,107,597 51,207,597 51,207,597
OPERATING EXPENDITURES
Salaries & Wages 3,710,560 3,169,285 2,882,317 3,451,797 3,101,797 3,101,797
Health Benefits 547,836 496,357 523,013 607,557 607,557 607,557
Retirement Benefits 1,367,536 1,252,547 1,236,971 1,348,791 1,348,791 1,348,791
Other Personnel Expenses 282,845 247,734 305,874 334,188 334,188 334,188
Contractual Services 3,144,800 3,735,486 4,258,444 4,584,901 4,584,901 4,584,901
Supplies & Services 829,621 433,468 390,428 425,859 425,859 425,859
Repair & Maintenance 853,957 186,556 73,639 104,000 104,000 104,000
Utilities 1,371,687 192,095 200,902 214,228 214,228 214,228
Capital Expenditures (Non CIP) 563,235 163,385 95,600 129,412 129,412 129,412
Debt Service 225,362 222,458 208,396 188,194 188,194 188,194
Other Operating Expenses 2,134,951 5,539,504 3,257,240 2,308,529 2,308,529 2,308,529
Annual Replacement/Rehab Transfers 1,648,506 2,023,167 2,422,232 2,912,605 2,912,605 2,912,605
TOTAL OPERATING EXPENDITURES 16,680,895 17,662,043 15,855,056 16,610,061 16,260,061 16,260,061
REVENUE OVER/(UNDER) EXPENDITURES 33,431,745$ 28,582,607$ 34,855,190$ 34,497,536$ 34,947,536$ 34,947,536$
11

|
This page intentionally left blank.
12
CITY COUNCIL
PURPOSE:
To develop strategic goals and priorities for the City through policy development and the legislative process while being mindful of the needs, interests and
concerns of San Marcos residents in an open and responsive manner.
SUMMARY OF SERVICES:
This budget provides funding to support the activities of the City Council, including expenses for conferences and travel, association dues and subscriptions
and intergovernmental support activities.
STRATEGIC THEMES:
• Quality of Life• Economic Development• Good Governance• Planning for the Future• Dynamic and Responsive Service Delivery
13
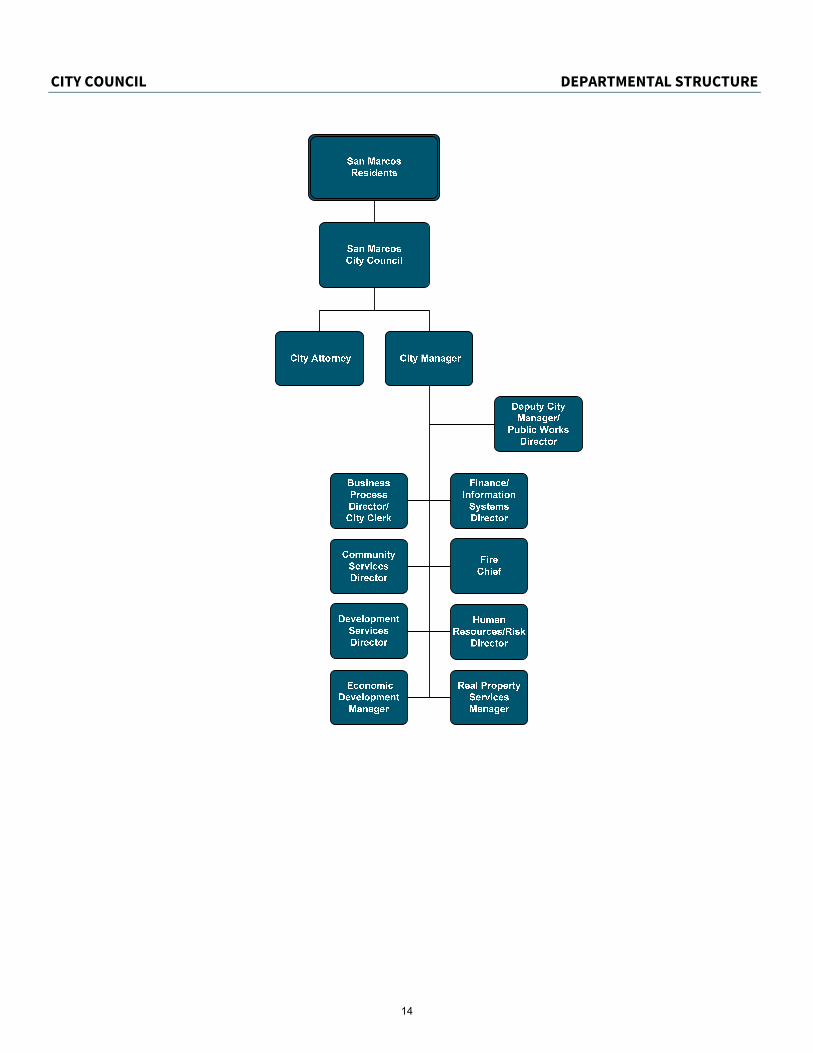
CITY COUNCIL DEPARTMENTAL STRUCTURE
NEED
|
14
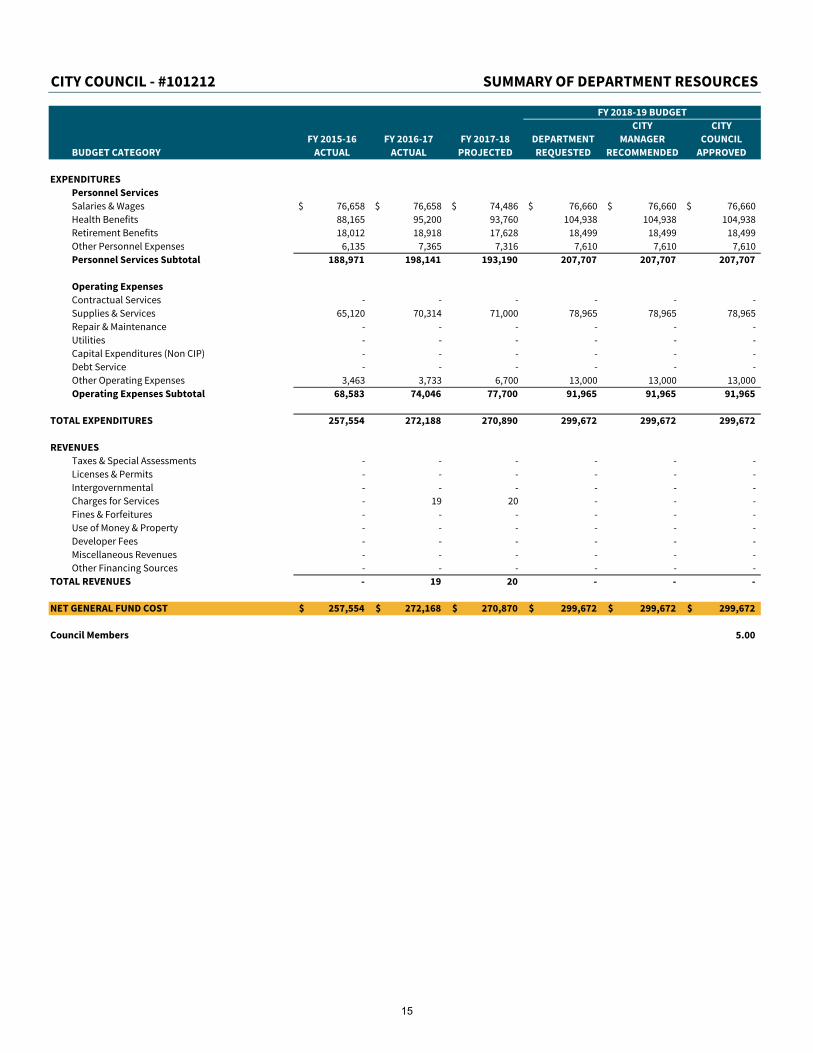
CITY COUNCIL - #101212 SUMMARY OF DEPARTMENT RESOURCES
FY 2018-19 BUDGET
CITY CITY
FY 2015-16 FY 2016-17 FY 2017-18 DEPARTMENT MANAGER COUNCIL
BUDGET CATEGORY ACTUAL ACTUAL PROJECTED REQUESTED RECOMMENDED APPROVED
EXPENDITURES
Personnel Services
Salaries & Wages 76,658$ 76,658$ 74,486$ 76,660$ 76,660$ 76,660$
Health Benefits 88,165 95,200 93,760 104,938 104,938 104,938
Retirement Benefits 18,012 18,918 17,628 18,499 18,499 18,499
Other Personnel Expenses 6,135 7,365 7,316 7,610 7,610 7,610
Personnel Services Subtotal 188,971 198,141 193,190 207,707 207,707 207,707
Operating Expenses
Contractual Services - - - - - -
Supplies & Services 65,120 70,314 71,000 78,965 78,965 78,965
Repair & Maintenance - - - - - -
Utilities - - - - - -
Capital Expenditures (Non CIP) - - - - - -
Debt Service - - - - - -
Other Operating Expenses 3,463 3,733 6,700 13,000 13,000 13,000
Operating Expenses Subtotal 68,583 74,046 77,700 91,965 91,965 91,965
TOTAL EXPENDITURES 257,554 272,188 270,890 299,672 299,672 299,672
REVENUES
Taxes & Special Assessments - - - - - -
Licenses & Permits - - - - - -
Intergovernmental - - - - - -
Charges for Services - 19 20 - - -
Fines & Forfeitures - - - - - -
Use of Money & Property - - - - - -
Developer Fees - - - - - -
Miscellaneous Revenues - - - - - -
Other Financing Sources - - - - - -
TOTAL REVENUES - 19 20 - - -
NET GENERAL FUND COST 257,554$ 272,168$ 270,870$ 299,672$ 299,672$ 299,672$
Council Members 5.00
15
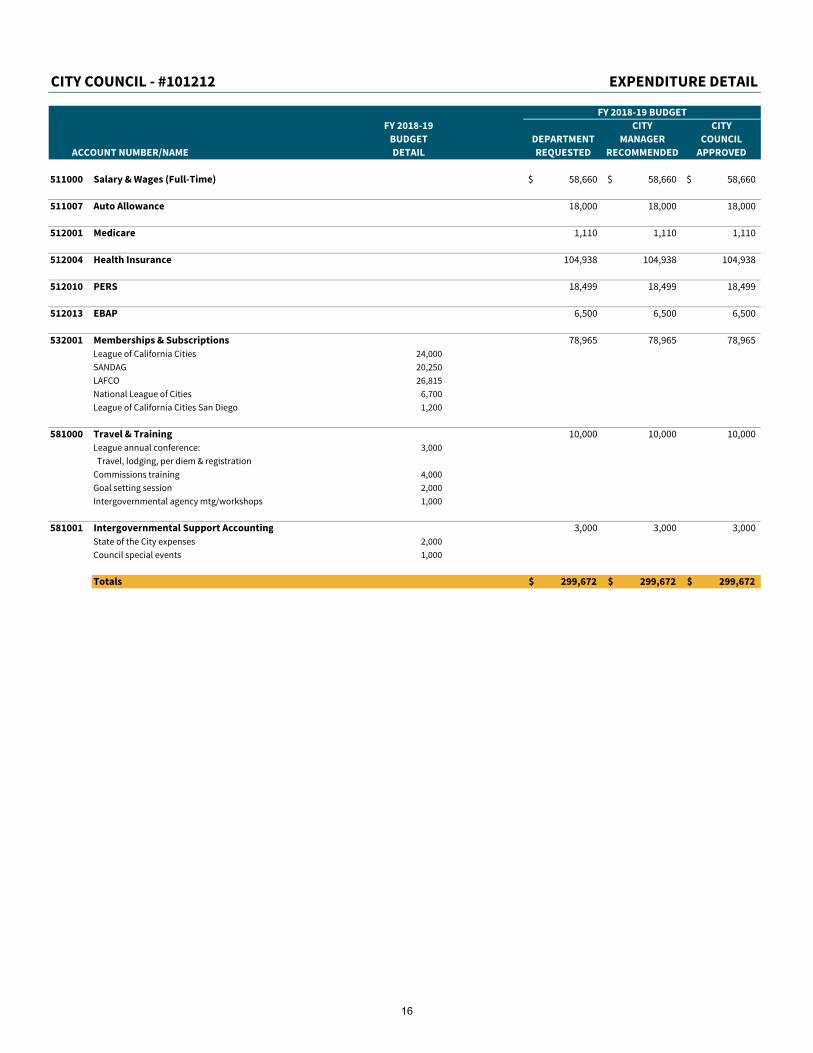
CITY COUNCIL - #101212 EXPENDITURE DETAIL
FY 2018-19 BUDGET
FY 2018-19 CITY CITY
BUDGET DEPARTMENT MANAGER COUNCIL
ACCOUNT NUMBER/NAME DETAIL REQUESTED RECOMMENDED APPROVED
511000 Salary & Wages (Full-Time) 58,660$ 58,660$ 58,660$
511007 Auto Allowance 18,000 18,000 18,000
512001 Medicare 1,110 1,110 1,110
512004 Health Insurance 104,938 104,938 104,938
512010 PERS 18,499 18,499 18,499
512013 EBAP 6,500 6,500 6,500
532001 Memberships & Subscriptions 78,965 78,965 78,965
League of California Cities 24,000
SANDAG 20,250
LAFCO 26,815
National League of Cities 6,700
League of California Cities San Diego 1,200
581000 Travel & Training 10,000 10,000 10,000
League annual conference: 3,000
Travel, lodging, per diem & registration
Commissions training 4,000
Goal setting session 2,000
Intergovernmental agency mtg/workshops 1,000
581001 Intergovernmental Support Accounting 3,000 3,000 3,000
State of the City expenses 2,000
Council special events 1,000
Totals 299,672$ 299,672$ 299,672$
16
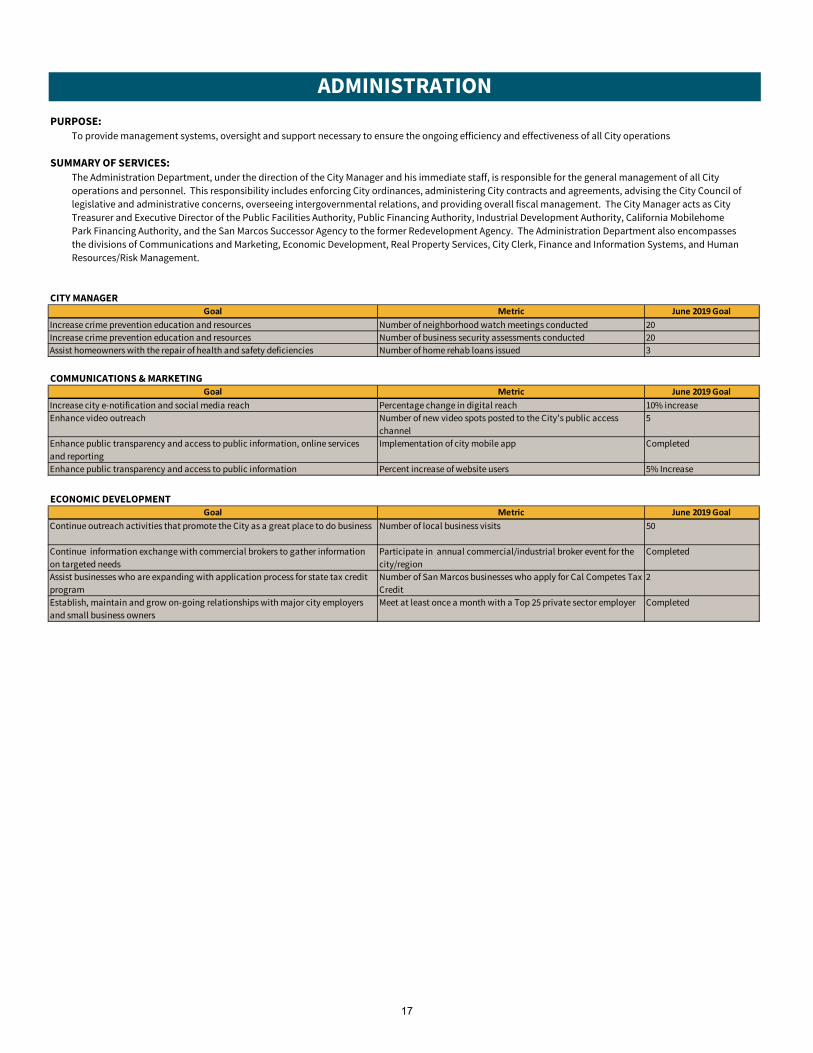
ADMINISTRATION
PURPOSE:
To provide management systems, oversight and support necessary to ensure the ongoing efficiency and effectiveness of all City operations.
SUMMARY OF SERVICES:
The Administration Department, under the direction of the City Manager and his immediate staff, is responsible for the general management of all City
operations and personnel. This responsibility includes enforcing City ordinances, administering City contracts and agreements, advising the City Council of
legislative and administrative concerns, overseeing intergovernmental relations, and providing overall fiscal management. The City Manager acts as City
Treasurer and Executive Director of the Public Facilities Authority, Public Financing Authority, Industrial Development Authority, California Mobilehome
Park Financing Authority, and the San Marcos Successor Agency to the former Redevelopment Agency. The Administration Department also encompasses
the divisions of Communications and Marketing, Economic Development, Real Property Services, City Clerk, Finance and Information Systems, and Human
Resources/Risk Management.
CITY MANAGER
COMMUNICATIONS & MARKETING
ECONOMIC DEVELOPMENT
Goal Metric June 2019 Goal
Increase crime prevention education and resources Number of neighborhood watch meetings conducted 20
Increase crime prevention education and resources Number of business security assessments conducted 20
Assist homeowners with the repair of health and safety deficiencies Number of home rehab loans issued 3
Goal Metric June 2019 Goal
Continue outreach activities that promote the City as a great place to do business Number of local business visits 50
Continue information exchange with commercial brokers to gather information
on targeted needs
Participate in annual commercial/industrial broker event for the
city/region
Completed
Assist businesses who are expanding with application process for state tax credit
program
Number of San Marcos businesses who apply for Cal Competes Tax
Credit
2
Establish, maintain and grow on-going relationships with major city employers
and small business owners
Meet at least once a month with a Top 25 private sector employer Completed
Goal Metric June 2019 Goal
Increase city e-notification and social media reach Percentage change in digital reach 10% increase
Enhance video outreach Number of new video spots posted to the City's public access
channel
5
Enhance public transparency and access to public information, online services
and reporting
Implementation of city mobile app Completed
Enhance public transparency and access to public information Percent increase of website users 5% Increase
17
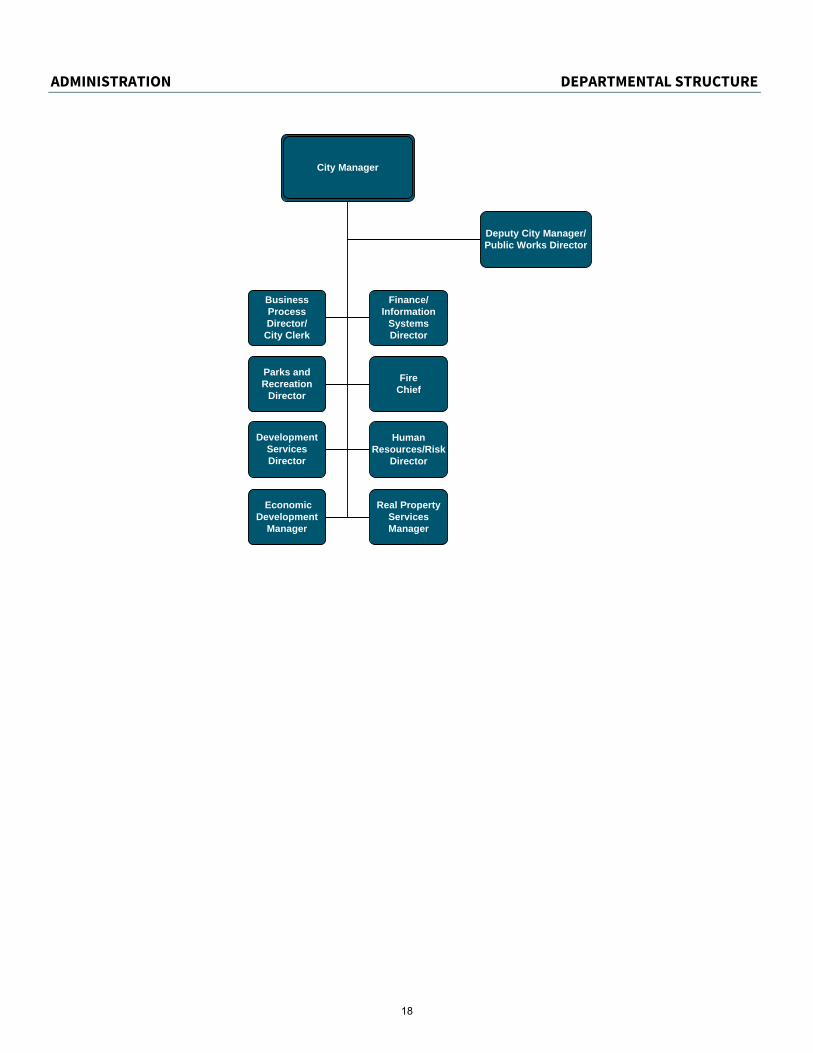
ADMINISTRATION DEPARTMENTAL STRUCTURE
NEED
|
Economic Development
Manager
Parks and Recreation
Director
Business Process Director/
City Clerk
Human Resources/Risk
Director
Finance/Information
SystemsDirector
Fire Chief
Real Property Services Manager
Deputy City Manager/Public Works Director
City Manager
Development Services Director
18
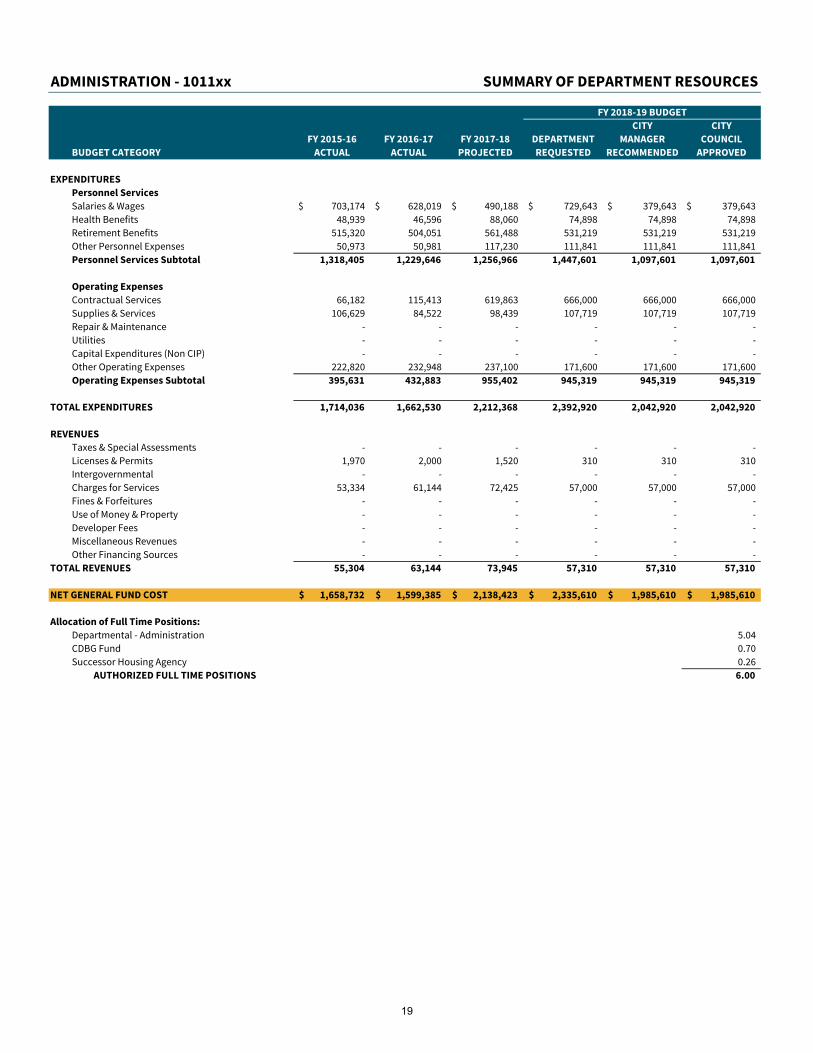
ADMINISTRATION - 1011xx SUMMARY OF DEPARTMENT RESOURCES
FY 2018-19 BUDGET
CITY CITY
FY 2015-16 FY 2016-17 FY 2017-18 DEPARTMENT MANAGER COUNCIL
BUDGET CATEGORY ACTUAL ACTUAL PROJECTED REQUESTED RECOMMENDED APPROVED
EXPENDITURES
Personnel Services
Salaries & Wages 703,174$ 628,019$ 490,188$ 729,643$ 379,643$ 379,643$
Health Benefits 48,939 46,596 88,060 74,898 74,898 74,898
Retirement Benefits 515,320 504,051 561,488 531,219 531,219 531,219
Other Personnel Expenses 50,973 50,981 117,230 111,841 111,841 111,841
Personnel Services Subtotal 1,318,405 1,229,646 1,256,966 1,447,601 1,097,601 1,097,601
Operating Expenses
Contractual Services 66,182 115,413 619,863 666,000 666,000 666,000
Supplies & Services 106,629 84,522 98,439 107,719 107,719 107,719
Repair & Maintenance - - - - - -
Utilities - - - - - -
Capital Expenditures (Non CIP) - - - - - -
Other Operating Expenses 222,820 232,948 237,100 171,600 171,600 171,600
Operating Expenses Subtotal 395,631 432,883 955,402 945,319 945,319 945,319
TOTAL EXPENDITURES 1,714,036 1,662,530 2,212,368 2,392,920 2,042,920 2,042,920
REVENUES
Taxes & Special Assessments - - - - - -
Licenses & Permits 1,970 2,000 1,520 310 310 310
Intergovernmental - - - - - -
Charges for Services 53,334 61,144 72,425 57,000 57,000 57,000
Fines & Forfeitures - - - - - -
Use of Money & Property - - - - - -
Developer Fees - - - - - -
Miscellaneous Revenues - - - - - -
Other Financing Sources - - - - - -
TOTAL REVENUES 55,304 63,144 73,945 57,310 57,310 57,310
NET GENERAL FUND COST 1,658,732$ 1,599,385$ 2,138,423$ 2,335,610$ 1,985,610$ 1,985,610$
Allocation of Full Time Positions:
Departmental - Administration 5.04
CDBG Fund 0.70
Successor Housing Agency 0.26
AUTHORIZED FULL TIME POSITIONS 6.00
19
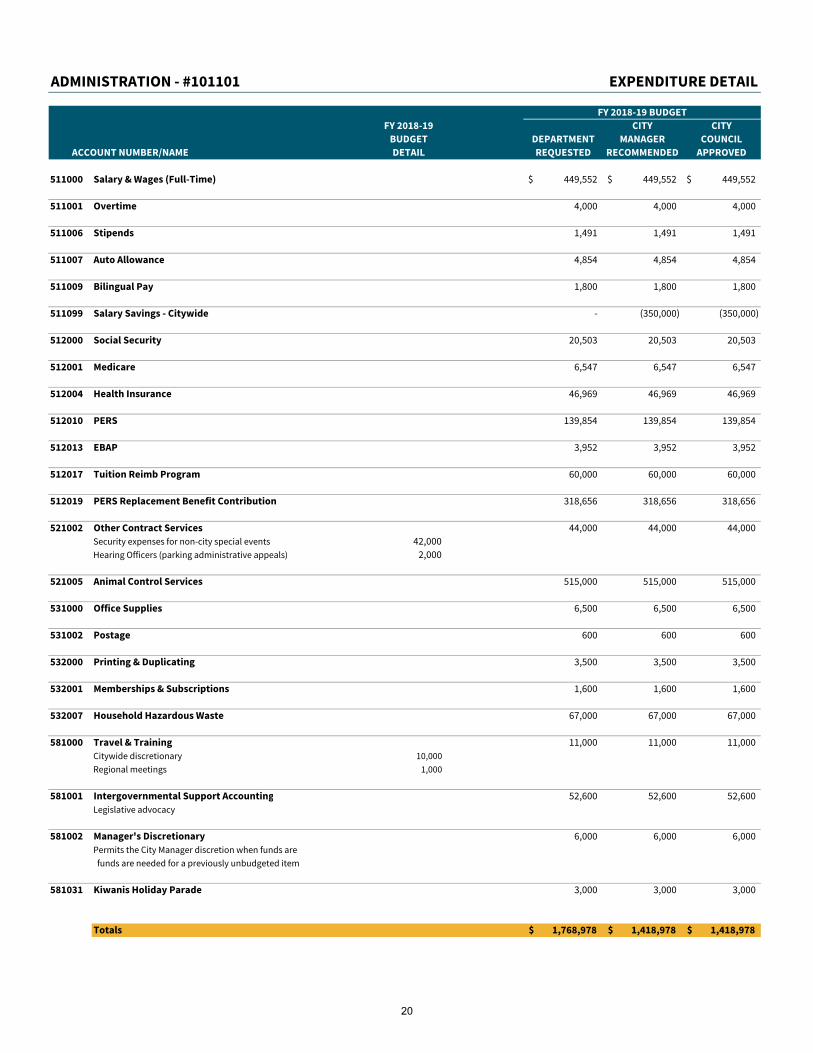
ADMINISTRATION - #101101 EXPENDITURE DETAIL
FY 2018-19 BUDGET
FY 2018-19 CITY CITY
BUDGET DEPARTMENT MANAGER COUNCIL
ACCOUNT NUMBER/NAME DETAIL REQUESTED RECOMMENDED APPROVED
511000 Salary & Wages (Full-Time) 449,552$ 449,552$ 449,552$
511001 Overtime 4,000 4,000 4,000
511006 Stipends 1,491 1,491 1,491
511007 Auto Allowance 4,854 4,854 4,854
511009 Bilingual Pay 1,800 1,800 1,800
511099 Salary Savings - Citywide - (350,000) (350,000)
512000 Social Security 20,503 20,503 20,503
512001 Medicare 6,547 6,547 6,547
512004 Health Insurance 46,969 46,969 46,969
512010 PERS 139,854 139,854 139,854
512013 EBAP 3,952 3,952 3,952
512017 Tuition Reimb Program 60,000 60,000 60,000
512019 PERS Replacement Benefit Contribution 318,656 318,656 318,656
521002 Other Contract Services 44,000 44,000 44,000
Security expenses for non-city special events 42,000
Hearing Officers (parking administrative appeals) 2,000
521005 Animal Control Services 515,000 515,000 515,000
531000 Office Supplies 6,500 6,500 6,500
531002 Postage 600 600 600
532000 Printing & Duplicating 3,500 3,500 3,500
532001 Memberships & Subscriptions 1,600 1,600 1,600
532007 Household Hazardous Waste 67,000 67,000 67,000
581000 Travel & Training 11,000 11,000 11,000
Citywide discretionary 10,000
Regional meetings 1,000
581001 Intergovernmental Support Accounting 52,600 52,600 52,600
Legislative advocacy
581002 Manager's Discretionary 6,000 6,000 6,000
Permits the City Manager discretion when funds are
funds are needed for a previously unbudgeted item
581031 Kiwanis Holiday Parade 3,000 3,000 3,000
Totals 1,768,978$ 1,418,978$ 1,418,978$
20
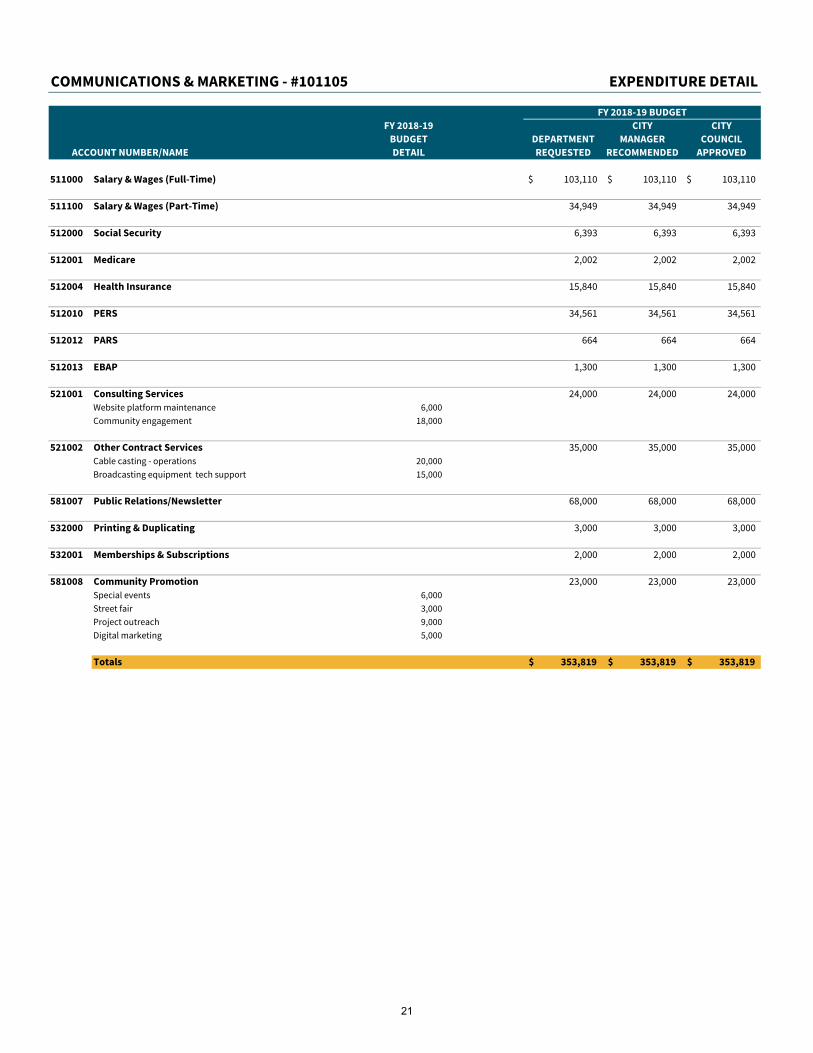
COMMUNICATIONS & MARKETING - #101105 EXPENDITURE DETAIL
FY 2018-19 BUDGET
FY 2018-19 CITY CITY
BUDGET DEPARTMENT MANAGER COUNCIL
ACCOUNT NUMBER/NAME DETAIL REQUESTED RECOMMENDED APPROVED
511000 Salary & Wages (Full-Time) 103,110$ 103,110$ 103,110$
511100 Salary & Wages (Part-Time) 34,949 34,949 34,949
512000 Social Security 6,393 6,393 6,393
512001 Medicare 2,002 2,002 2,002
512004 Health Insurance 15,840 15,840 15,840
512010 PERS 34,561 34,561 34,561
512012 PARS 664 664 664
512013 EBAP 1,300 1,300 1,300
521001 Consulting Services 24,000 24,000 24,000
Website platform maintenance 6,000
Community engagement 18,000
521002 Other Contract Services 35,000 35,000 35,000
Cable casting - operations 20,000
Broadcasting equipment tech support 15,000
581007 Public Relations/Newsletter 68,000 68,000 68,000
532000 Printing & Duplicating 3,000 3,000 3,000
532001 Memberships & Subscriptions 2,000 2,000 2,000
581008 Community Promotion 23,000 23,000 23,000
Special events 6,000
Street fair 3,000
Project outreach 9,000
Digital marketing 5,000
Totals 353,819$ 353,819$ 353,819$
21
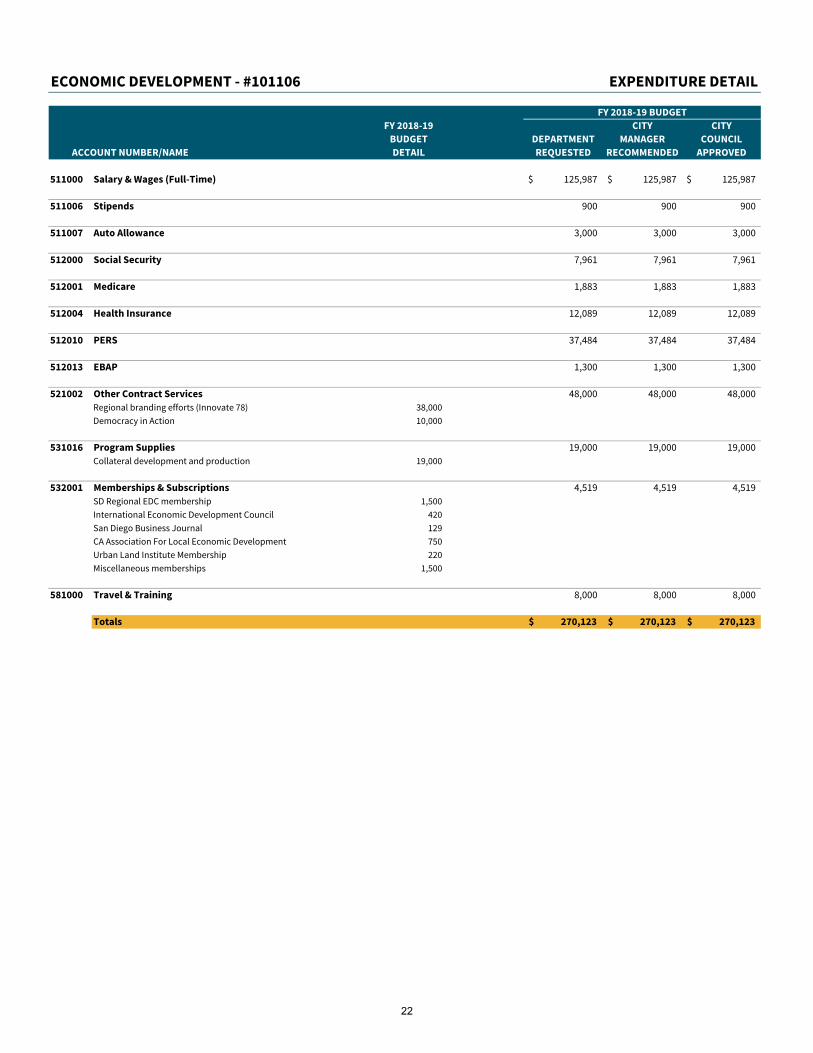
ECONOMIC DEVELOPMENT - #101106 EXPENDITURE DETAIL
FY 2018-19 BUDGET
FY 2018-19 CITY CITY
BUDGET DEPARTMENT MANAGER COUNCIL
ACCOUNT NUMBER/NAME DETAIL REQUESTED RECOMMENDED APPROVED
511000 Salary & Wages (Full-Time) 125,987$ 125,987$ 125,987$
511006 Stipends 900 900 900
511007 Auto Allowance 3,000 3,000 3,000
512000 Social Security 7,961 7,961 7,961
512001 Medicare 1,883 1,883 1,883
512004 Health Insurance 12,089 12,089 12,089
512010 PERS 37,484 37,484 37,484
512013 EBAP 1,300 1,300 1,300
521002 Other Contract Services 48,000 48,000 48,000
Regional branding efforts (Innovate 78) 38,000
Democracy in Action 10,000
531016 Program Supplies 19,000 19,000 19,000
Collateral development and production 19,000
532001 Memberships & Subscriptions 4,519 4,519 4,519
SD Regional EDC membership 1,500
International Economic Development Council 420
San Diego Business Journal 129
CA Association For Local Economic Development 750
Urban Land Institute Membership 220
Miscellaneous memberships 1,500
581000 Travel & Training 8,000 8,000 8,000
Totals 270,123$ 270,123$ 270,123$
22

CITY ATTORNEY
PURPOSE:
To provide legal counsel to the San Marcos City Council and all City boards, commissions and departments to ensure City policy and service delivery is
executed in a lawful manner.
SUMMARY OF SERVICES:
The City Attorney is appointed by the San Marcos City Council and provides legal counsel for the preparation of resolutions and ordinances; handles all
litigation involving the City; provides legal opinions to guide policy-making decisions; approves all contracts; and enforces City laws and regulations.
23
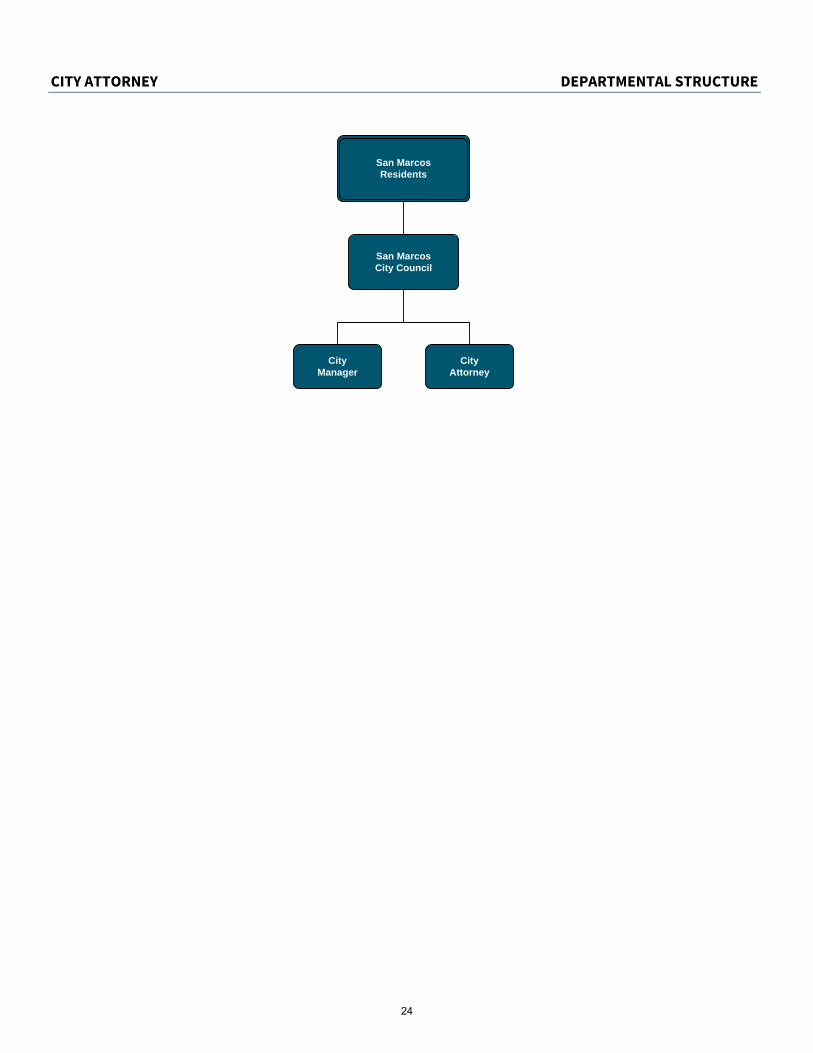
CITY ATTORNEY DEPARTMENTAL STRUCTURE
NEED
|
San Marcos Residents
San Marcos City Council
City Manager
City Attorney
24
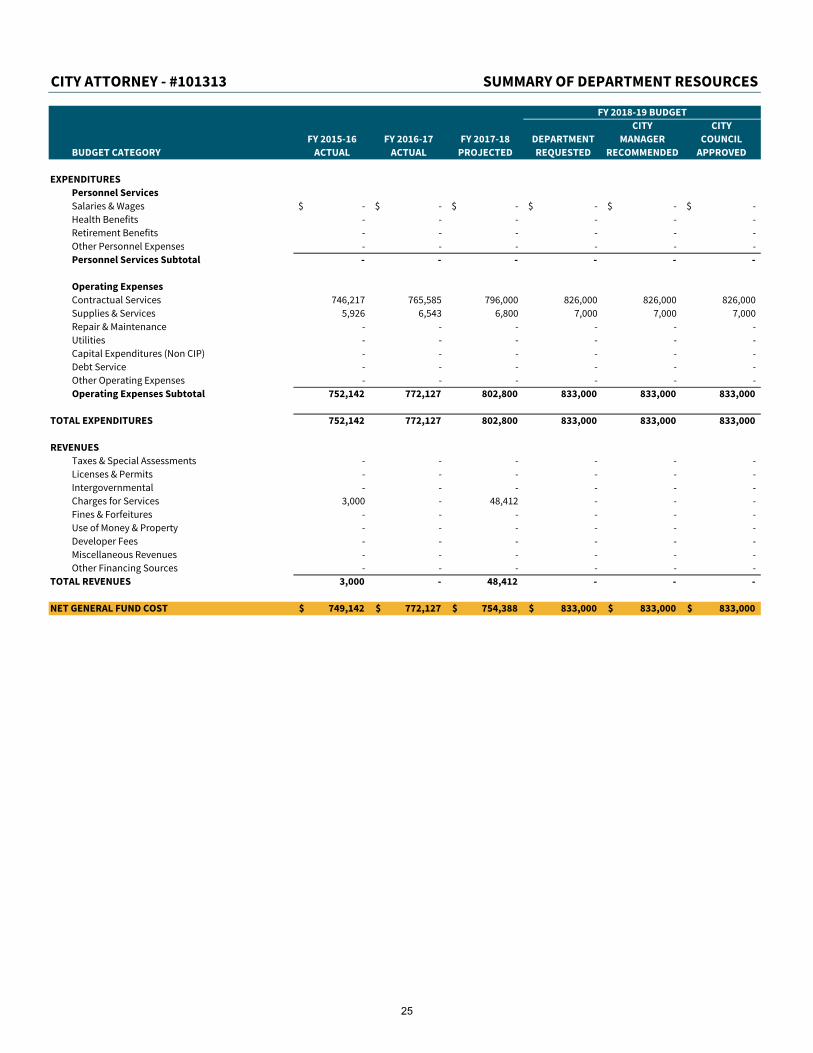
CITY ATTORNEY - #101313 SUMMARY OF DEPARTMENT RESOURCES
FY 2018-19 BUDGET
CITY CITY
FY 2015-16 FY 2016-17 FY 2017-18 DEPARTMENT MANAGER COUNCIL
BUDGET CATEGORY ACTUAL ACTUAL PROJECTED REQUESTED RECOMMENDED APPROVED
EXPENDITURES
Personnel Services
Salaries & Wages -$ -$ -$ -$ -$ -$
Health Benefits - - - - - -
Retirement Benefits - - - - - -
Other Personnel Expenses - - - - - -
Personnel Services Subtotal - - - - - -
Operating Expenses
Contractual Services 746,217 765,585 796,000 826,000 826,000 826,000
Supplies & Services 5,926 6,543 6,800 7,000 7,000 7,000
Repair & Maintenance - - - - - -
Utilities - - - - - -
Capital Expenditures (Non CIP) - - - - - -
Debt Service - - - - - -
Other Operating Expenses - - - - - -
Operating Expenses Subtotal 752,142 772,127 802,800 833,000 833,000 833,000
TOTAL EXPENDITURES 752,142 772,127 802,800 833,000 833,000 833,000
REVENUES
Taxes & Special Assessments - - - - - -
Licenses & Permits - - - - - -
Intergovernmental - - - - - -
Charges for Services 3,000 - 48,412 - - -
Fines & Forfeitures - - - - - -
Use of Money & Property - - - - - -
Developer Fees - - - - - -
Miscellaneous Revenues - - - - - -
Other Financing Sources - - - - - -
TOTAL REVENUES 3,000 - 48,412 - - -
NET GENERAL FUND COST 749,142$ 772,127$ 754,388$ 833,000$ 833,000$ 833,000$
25

CITY ATTORNEY - #101313 EXPENDITURE DETAIL
FY 2018-19 BUDGET
FY 2018-19 CITY CITY
BUDGET DEPARTMENT MANAGER COUNCIL
ACCOUNT NUMBER/NAME DETAIL REQUESTED RECOMMENDED APPROVED
521000 City Attorney Services 810,000$ 810,000$ 810,000$
521002 Other Contract Services 15,000 15,000 15,000
521015 MH Rent Review/Litigation 1,000 1,000 1,000
531003 State & Municipal Code Books 7,000 7,000 7,000
Totals 833,000$ 833,000$ 833,000$
26
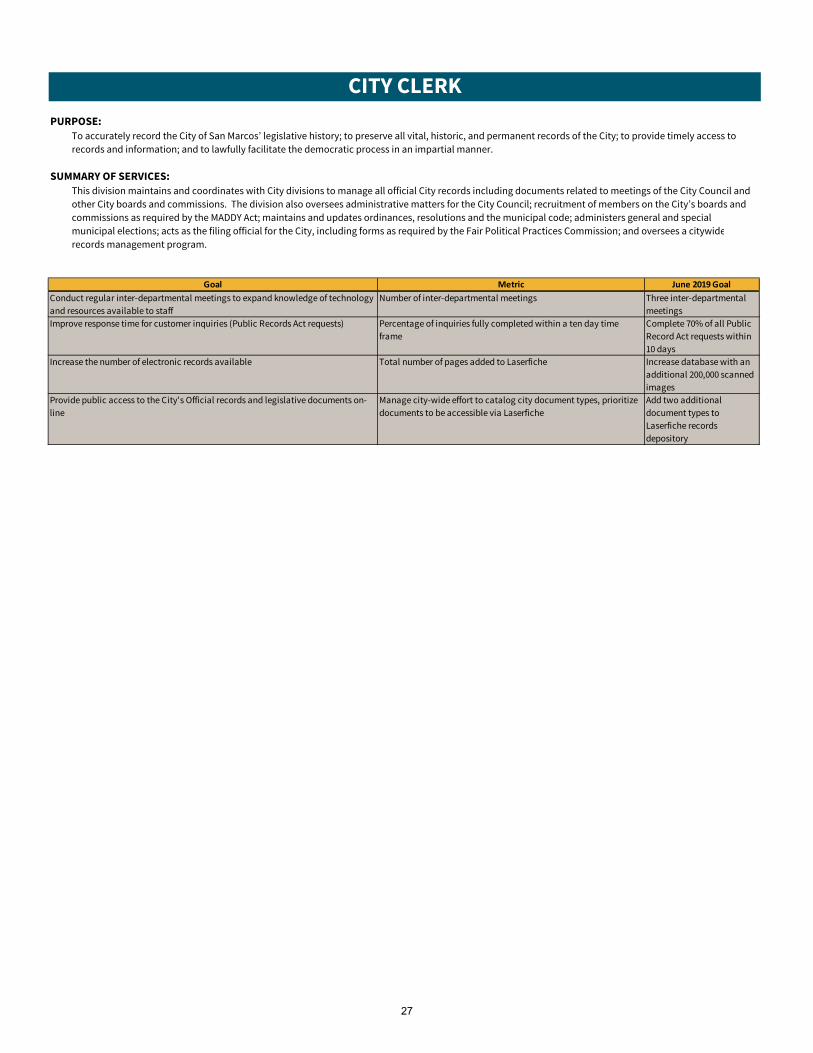
CITY CLERK
PURPOSE:
To accurately record the City of San Marcos’ legislative history; to preserve all vital, historic, and permanent records of the City; to provide timely access to
records and information; and to lawfully facilitate the democratic process in an impartial manner.
SUMMARY OF SERVICES:
This division maintains and coordinates with City divisions to manage all official City records including documents related to meetings of the City Council and
other City boards and commissions. The division also oversees administrative matters for the City Council; recruitment of members on the City’s boards and
commissions as required by the MADDY Act; maintains and updates ordinances, resolutions and the municipal code; administers general and special
municipal elections; acts as the filing official for the City, including forms as required by the Fair Political Practices Commission; and oversees a citywide
records management program.
Goal Metric June 2019 Goal
Conduct regular inter-departmental meetings to expand knowledge of technology
and resources available to staff
Number of inter-departmental meetings Three inter-departmental
meetings
Improve response time for customer inquiries (Public Records Act requests) Percentage of inquiries fully completed within a ten day time
frame
Complete 70% of all Public
Record Act requests within
10 days
Increase the number of electronic records available Total number of pages added to Laserfiche Increase database with an
additional 200,000 scanned
images
Provide public access to the City's Official records and legislative documents on-
line
Manage city-wide effort to catalog city document types, prioritize
documents to be accessible via Laserfiche
Add two additional
document types to
Laserfiche records
depository
27
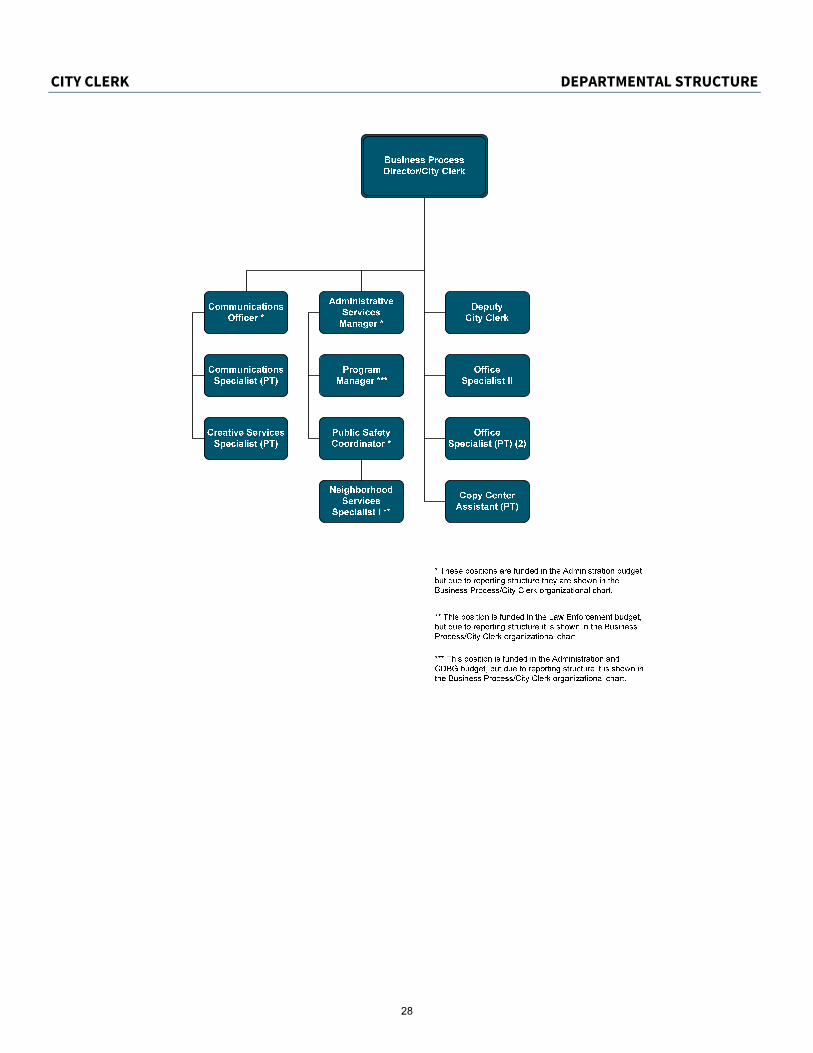
CITY CLERK DEPARTMENTAL STRUCTURE
NEED
|
28
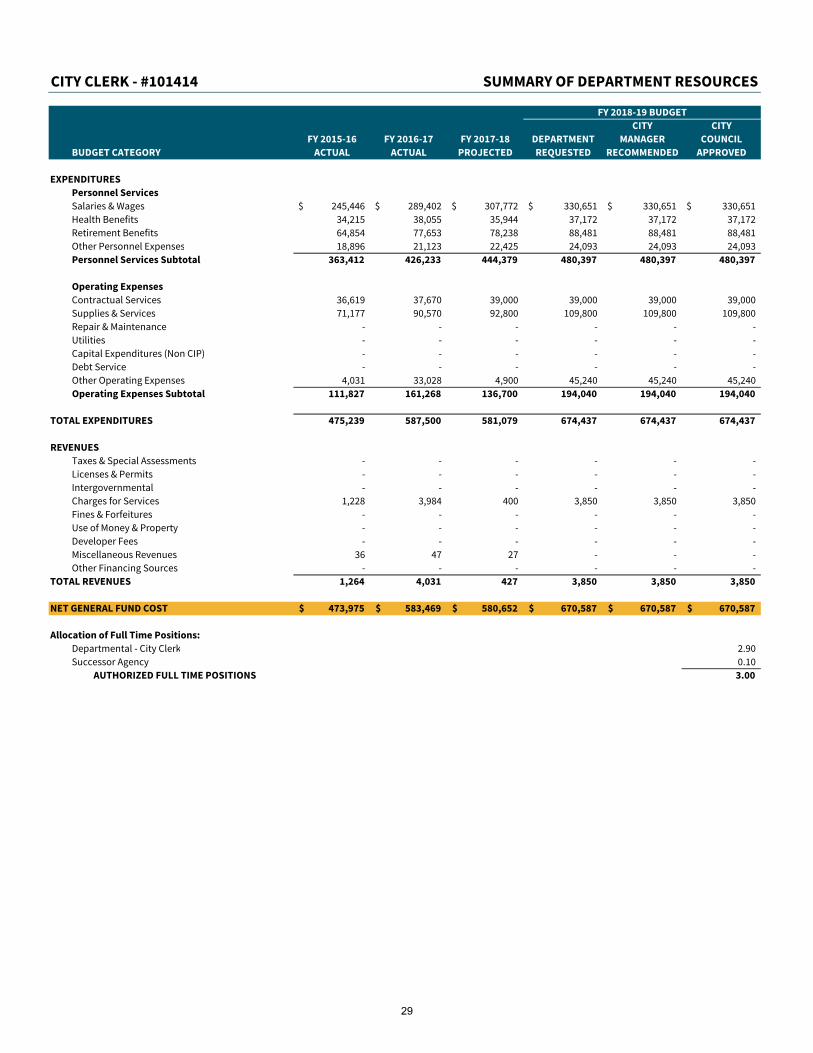
CITY CLERK - #101414 SUMMARY OF DEPARTMENT RESOURCES
FY 2018-19 BUDGET
CITY CITY
FY 2015-16 FY 2016-17 FY 2017-18 DEPARTMENT MANAGER COUNCIL
BUDGET CATEGORY ACTUAL ACTUAL PROJECTED REQUESTED RECOMMENDED APPROVED
EXPENDITURES
Personnel Services
Salaries & Wages 245,446$ 289,402$ 307,772$ 330,651$ 330,651$ 330,651$
Health Benefits 34,215 38,055 35,944 37,172 37,172 37,172
Retirement Benefits 64,854 77,653 78,238 88,481 88,481 88,481
Other Personnel Expenses 18,896 21,123 22,425 24,093 24,093 24,093
Personnel Services Subtotal 363,412 426,233 444,379 480,397 480,397 480,397
Operating Expenses
Contractual Services 36,619 37,670 39,000 39,000 39,000 39,000
Supplies & Services 71,177 90,570 92,800 109,800 109,800 109,800
Repair & Maintenance - - - - - -
Utilities - - - - - -
Capital Expenditures (Non CIP) - - - - - -
Debt Service - - - - - -
Other Operating Expenses 4,031 33,028 4,900 45,240 45,240 45,240
Operating Expenses Subtotal 111,827 161,268 136,700 194,040 194,040 194,040
TOTAL EXPENDITURES 475,239 587,500 581,079 674,437 674,437 674,437
REVENUES
Taxes & Special Assessments - - - - - -
Licenses & Permits - - - - - -
Intergovernmental - - - - - -
Charges for Services 1,228 3,984 400 3,850 3,850 3,850
Fines & Forfeitures - - - - - -
Use of Money & Property - - - - - -
Developer Fees - - - - - -
Miscellaneous Revenues 36 47 27 - - -
Other Financing Sources - - - - - -
TOTAL REVENUES 1,264 4,031 427 3,850 3,850 3,850
NET GENERAL FUND COST 473,975$ 583,469$ 580,652$ 670,587$ 670,587$ 670,587$
Allocation of Full Time Positions:
Departmental - City Clerk 2.90
Successor Agency 0.10
AUTHORIZED FULL TIME POSITIONS 3.00
29

CITY CLERK - #101414 EXPENDITURE DETAIL
FY 2018-19 BUDGET
FY 2018-19 CITY CITY
BUDGET DEPARTMENT MANAGER COUNCIL
ACCOUNT NUMBER/NAME DETAIL REQUESTED RECOMMENDED APPROVED
511000 Salary & Wages (Full-Time) 278,346$ 278,346$ 278,346$
511001 Overtime 2,500 2,500 2,500
511006 Stipends 1,410 1,410 1,410
511007 Auto Allowance 4,277 4,277 4,277
511009 Bilingual Pay 1,800 1,800 1,800
511100 Salary & Wages (Part-Time) 42,318 42,318 42,318
512000 Social Security 15,629 15,629 15,629
512001 Medicare 4,794 4,794 4,794
512004 Health Insurance 37,172 37,172 37,172
512010 PERS 87,677 87,677 87,677
512012 PARS 804 804 804
512013 EBAP 3,670 3,670 3,670
521002 Other Contract Services 33,000 33,000 33,000
Granicus/Legistar agenda management maint. 11,000
Granicus video web streaming operation & maint. 20,000
Convert municipal and zoning code to online publisher 2,000
521012 Contract Maintenance Services 6,000 6,000 6,000
531000 Office Supplies 4,000 4,000 4,000
531002 Postage 72,000 72,000 72,000
532000 Printing & Duplicating 15,000 15,000 15,000
532001 Memberships & Subscriptions 800 800 800
International Institute of Municipal Clerks 400
California City Clerks Association 320
San Diego County & City Clerk Association 40
San Diego Deputy City Clerk Association 40
532002 Legal & Other Advertising 18,000 18,000 18,000
581000 Travel & Training 5,240 5,240 5,240
Technical Track for Clerks 3,340
Travel & lodging for TTC training 1,400
Annual Conference - new law and election training 500
581005 General Election Expenses 40,000 40,000 40,000
Totals 674,437$ 674,437$ 674,437$
30
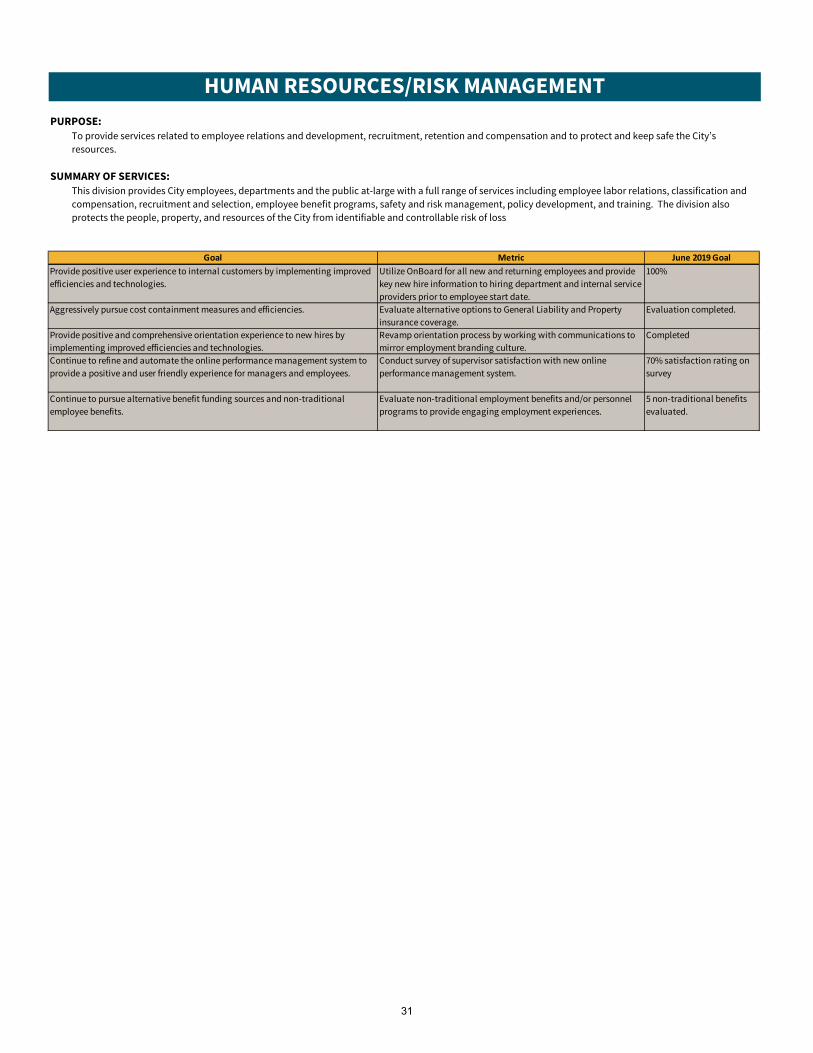
HUMAN RESOURCES/RISK MANAGEMENT
PURPOSE:
To provide services related to employee relations and development, recruitment, retention and compensation and to protect and keep safe the City’s
resources.
SUMMARY OF SERVICES:
This division provides City employees, departments and the public at-large with a full range of services including employee labor relations, classification and
compensation, recruitment and selection, employee benefit programs, safety and risk management, policy development, and training. The division also
protects the people, property, and resources of the City from identifiable and controllable risk of loss.
Goal Metric June 2019 Goal
Provide positive user experience to internal customers by implementing improved
efficiencies and technologies.
Utilize OnBoard for all new and returning employees and provide
key new hire information to hiring department and internal service
providers prior to employee start date.
100%
Aggressively pursue cost containment measures and efficiencies. Evaluate alternative options to General Liability and Property
insurance coverage.
Evaluation completed.
Provide positive and comprehensive orientation experience to new hires by
implementing improved efficiencies and technologies.
Revamp orientation process by working with communications to
mirror employment branding culture.
Completed
Continue to refine and automate the online performance management system to
provide a positive and user friendly experience for managers and employees.
Conduct survey of supervisor satisfaction with new online
performance management system.
70% satisfaction rating on
survey
Continue to pursue alternative benefit funding sources and non-traditional
employee benefits.
Evaluate non-traditional employment benefits and/or personnel
programs to provide engaging employment experiences.
5 non-traditional benefits
evaluated.
31
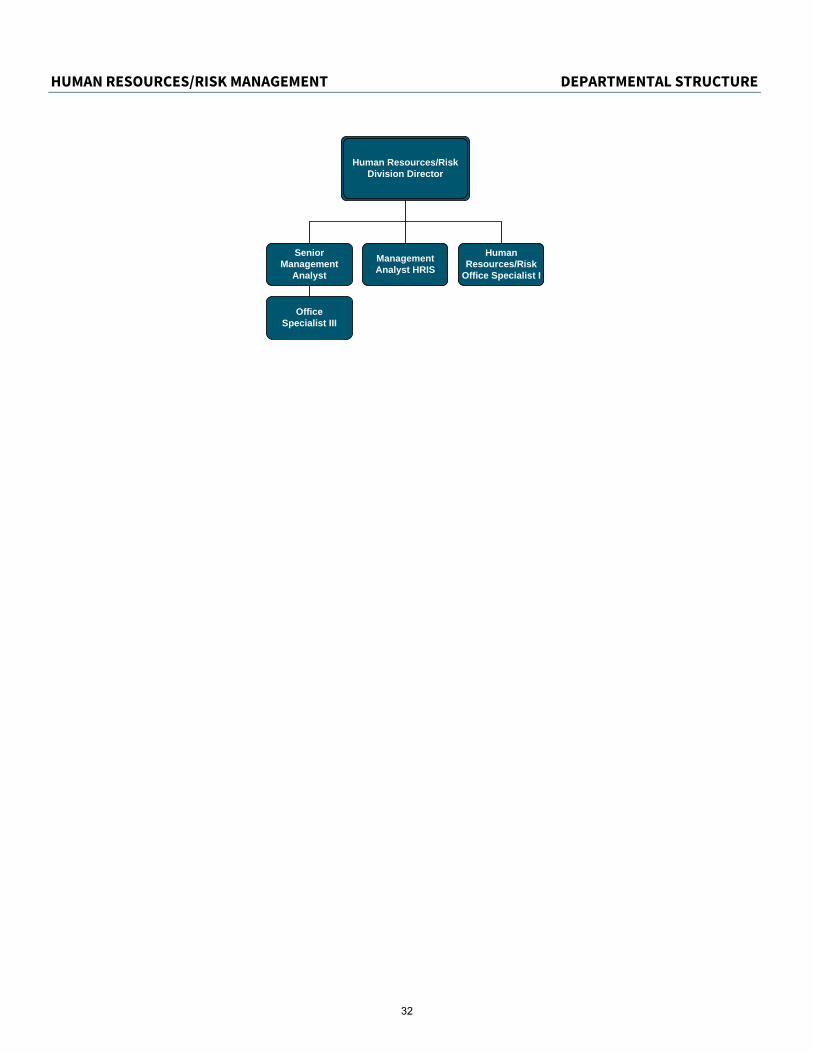
HUMAN RESOURCES/RISK MANAGEMENT DEPARTMENTAL STRUCTURE
NEED
|
Human Resources/Risk Division Director
Senior Management
Analyst
Management Analyst HRIS
Human Resources/Risk
Office Specialist I
Office Specialist III
32
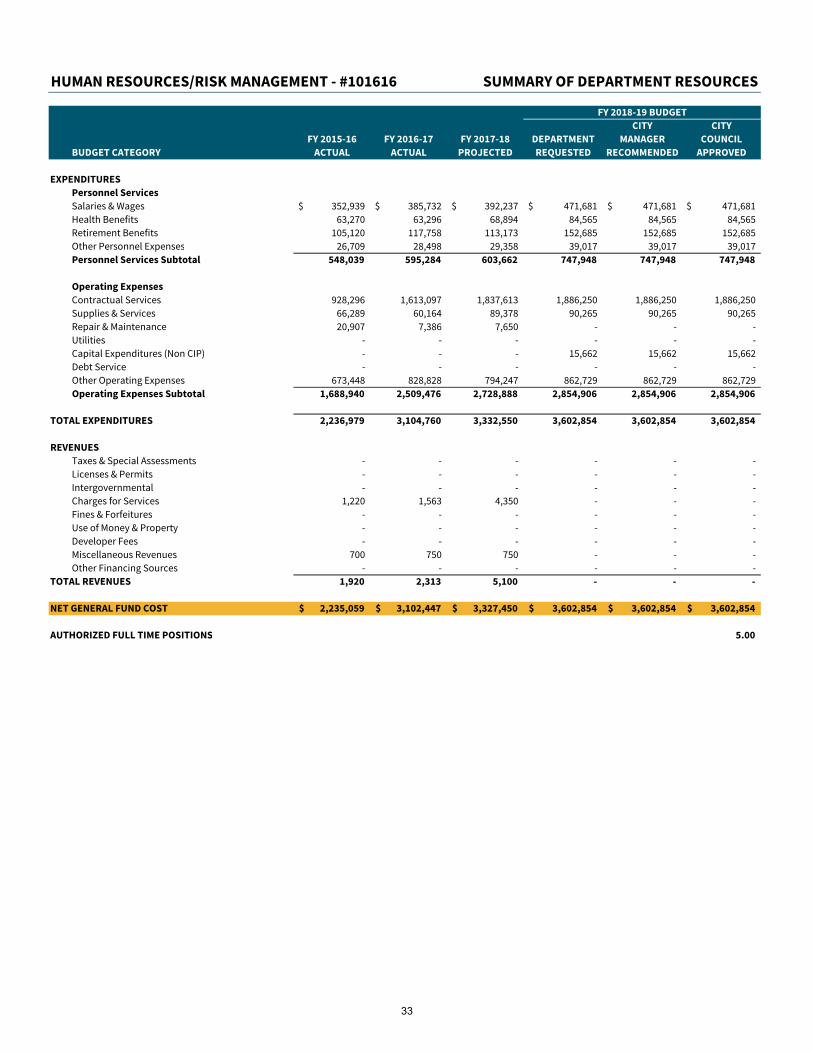
HUMAN RESOURCES/RISK MANAGEMENT - #101616 SUMMARY OF DEPARTMENT RESOURCES
FY 2018-19 BUDGET
CITY CITY
FY 2015-16 FY 2016-17 FY 2017-18 DEPARTMENT MANAGER COUNCIL
BUDGET CATEGORY ACTUAL ACTUAL PROJECTED REQUESTED RECOMMENDED APPROVED
EXPENDITURES
Personnel Services
Salaries & Wages 352,939$ 385,732$ 392,237$ 471,681$ 471,681$ 471,681$
Health Benefits 63,270 63,296 68,894 84,565 84,565 84,565
Retirement Benefits 105,120 117,758 113,173 152,685 152,685 152,685
Other Personnel Expenses 26,709 28,498 29,358 39,017 39,017 39,017
Personnel Services Subtotal 548,039 595,284 603,662 747,948 747,948 747,948
Operating Expenses
Contractual Services 928,296 1,613,097 1,837,613 1,886,250 1,886,250 1,886,250
Supplies & Services 66,289 60,164 89,378 90,265 90,265 90,265
Repair & Maintenance 20,907 7,386 7,650 - - -
Utilities - - - - - -
Capital Expenditures (Non CIP) - - - 15,662 15,662 15,662
Debt Service - - - - - -
Other Operating Expenses 673,448 828,828 794,247 862,729 862,729 862,729
Operating Expenses Subtotal 1,688,940 2,509,476 2,728,888 2,854,906 2,854,906 2,854,906
TOTAL EXPENDITURES 2,236,979 3,104,760 3,332,550 3,602,854 3,602,854 3,602,854
REVENUES
Taxes & Special Assessments - - - - - -
Licenses & Permits - - - - - -
Intergovernmental - - - - - -
Charges for Services 1,220 1,563 4,350 - - -
Fines & Forfeitures - - - - - -
Use of Money & Property - - - - - -
Developer Fees - - - - - -
Miscellaneous Revenues 700 750 750 - - -
Other Financing Sources - - - - - -
TOTAL REVENUES 1,920 2,313 5,100 - - -
NET GENERAL FUND COST 2,235,059$ 3,102,447$ 3,327,450$ 3,602,854$ 3,602,854$ 3,602,854$
AUTHORIZED FULL TIME POSITIONS 5.00
33
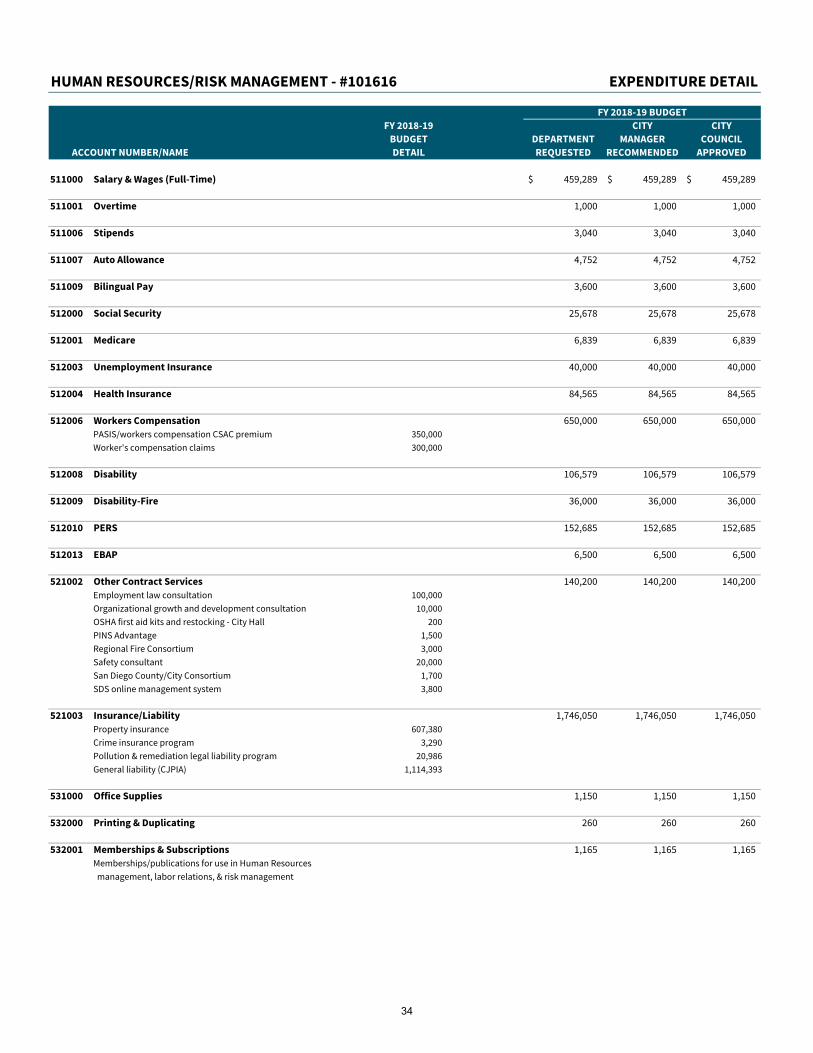
HUMAN RESOURCES/RISK MANAGEMENT - #101616 EXPENDITURE DETAIL
FY 2018-19 BUDGET
FY 2018-19 CITY CITY
BUDGET DEPARTMENT MANAGER COUNCIL
ACCOUNT NUMBER/NAME DETAIL REQUESTED RECOMMENDED APPROVED
511000 Salary & Wages (Full-Time) 459,289$ 459,289$ 459,289$
511001 Overtime 1,000 1,000 1,000
511006 Stipends 3,040 3,040 3,040
511007 Auto Allowance 4,752 4,752 4,752
511009 Bilingual Pay 3,600 3,600 3,600
512000 Social Security 25,678 25,678 25,678
512001 Medicare 6,839 6,839 6,839
512003 Unemployment Insurance 40,000 40,000 40,000
512004 Health Insurance 84,565 84,565 84,565
512006 Workers Compensation 650,000 650,000 650,000
PASIS/workers compensation CSAC premium 350,000
Worker's compensation claims 300,000
512008 Disability 106,579 106,579 106,579
512009 Disability-Fire 36,000 36,000 36,000
512010 PERS 152,685 152,685 152,685
512013 EBAP 6,500 6,500 6,500
521002 Other Contract Services 140,200 140,200 140,200
Employment law consultation 100,000
Organizational growth and development consultation 10,000
OSHA first aid kits and restocking - City Hall 200
PINS Advantage 1,500
Regional Fire Consortium 3,000
Safety consultant 20,000
San Diego County/City Consortium 1,700
SDS online management system 3,800
521003 Insurance/Liability 1,746,050 1,746,050 1,746,050
Property insurance 607,380
Crime insurance program 3,290
Pollution & remediation legal liability program 20,986
General liability (CJPIA) 1,114,393
531000 Office Supplies 1,150 1,150 1,150
532000 Printing & Duplicating 260 260 260
532001 Memberships & Subscriptions 1,165 1,165 1,165
Memberships/publications for use in Human Resources
management, labor relations, & risk management
34
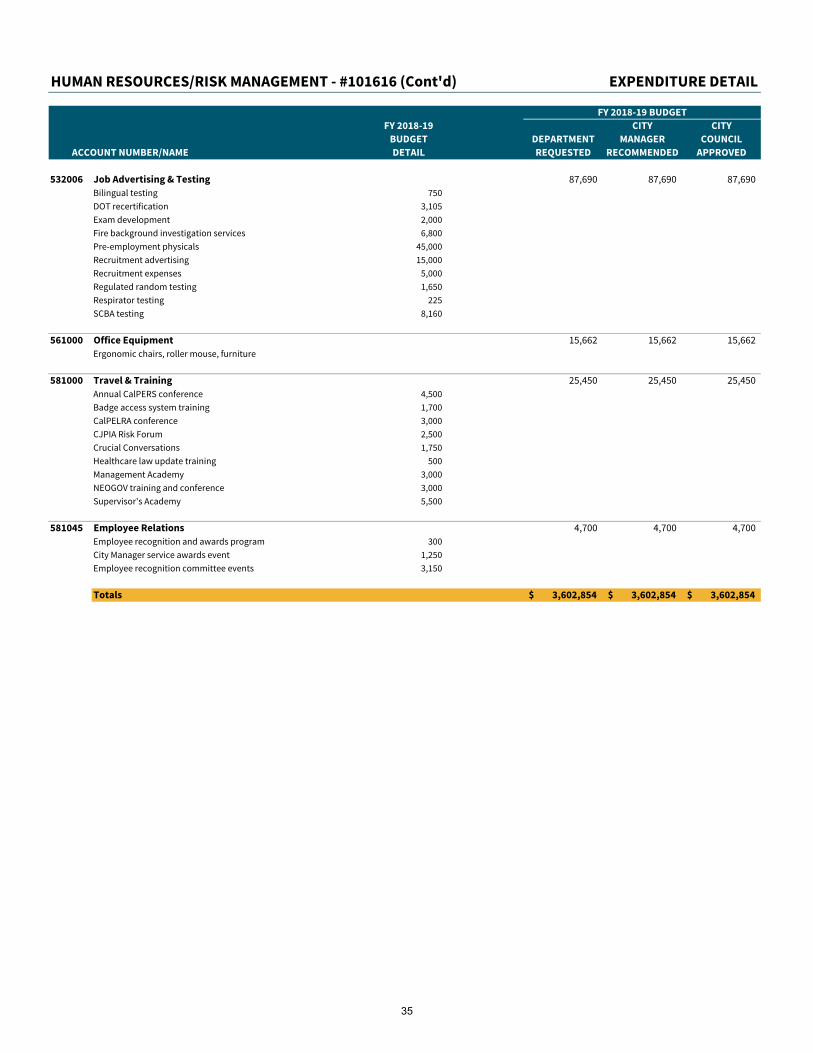
HUMAN RESOURCES/RISK MANAGEMENT - #101616 (Cont'd) EXPENDITURE DETAIL
FY 2018-19 BUDGET
FY 2018-19 CITY CITY
BUDGET DEPARTMENT MANAGER COUNCIL
ACCOUNT NUMBER/NAME DETAIL REQUESTED RECOMMENDED APPROVED
532006 Job Advertising & Testing 87,690 87,690 87,690
Bilingual testing 750
DOT recertification 3,105
Exam development 2,000
Fire background investigation services 6,800
Pre-employment physicals 45,000
Recruitment advertising 15,000
Recruitment expenses 5,000
Regulated random testing 1,650
Respirator testing 225
SCBA testing 8,160
561000 Office Equipment 15,662 15,662 15,662
Ergonomic chairs, roller mouse, furniture
581000 Travel & Training 25,450 25,450 25,450
Annual CalPERS conference 4,500
Badge access system training 1,700
CalPELRA conference 3,000
CJPIA Risk Forum 2,500
Crucial Conversations 1,750
Healthcare law update training 500
Management Academy 3,000
NEOGOV training and conference 3,000
Supervisor's Academy 5,500
581045 Employee Relations 4,700 4,700 4,700
Employee recognition and awards program 300
City Manager service awards event 1,250
Employee recognition committee events 3,150
Totals 3,602,854$ 3,602,854$ 3,602,854$
35

|
This page intentionally left blank.
36
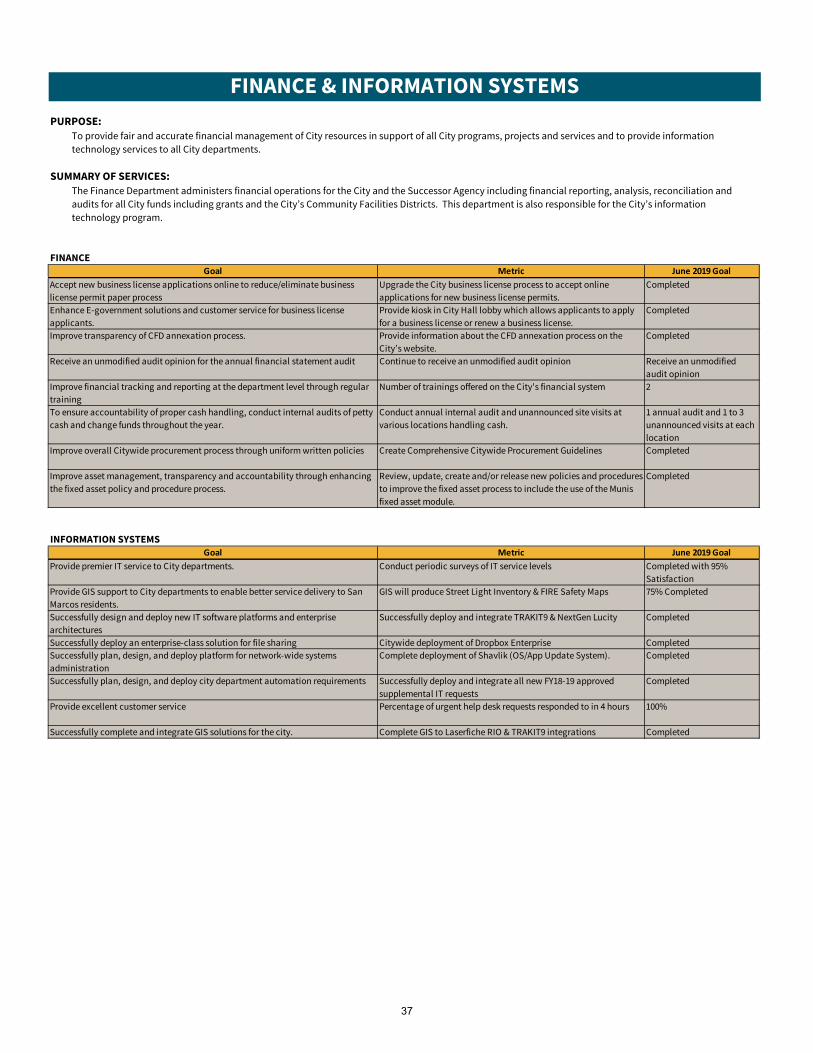
FINANCE & INFORMATION SYSTEMS
PURPOSE:
To provide fair and accurate financial management of City resources in support of all City programs, projects and services and to provide information
technology services to all City departments.
SUMMARY OF SERVICES:
The Finance Department administers financial operations for the City and the Successor Agency including financial reporting, analysis, reconciliation and
audits for all City funds including grants and the City’s Community Facilities Districts. This department is also responsible for the City’s information
technology program.
FINANCE
INFORMATION SYSTEMS
Goal Metric June 2019 Goal
Accept new business license applications online to reduce/eliminate business
license permit paper process
Upgrade the City business license process to accept online
applications for new business license permits.
Completed
Enhance E-government solutions and customer service for business license
applicants.
Provide kiosk in City Hall lobby which allows applicants to apply
for a business license or renew a business license.
Completed
Improve transparency of CFD annexation process. Provide information about the CFD annexation process on the
City’s website.
Completed
Receive an unmodified audit opinion for the annual financial statement audit Continue to receive an unmodified audit opinion Receive an unmodified
audit opinion
Improve financial tracking and reporting at the department level through regular
training
Number of trainings offered on the City's financial system 2
To ensure accountability of proper cash handling, conduct internal audits of petty
cash and change funds throughout the year.
Conduct annual internal audit and unannounced site visits at
various locations handling cash.
1 annual audit and 1 to 3
unannounced visits at each
location
Improve overall Citywide procurement process through uniform written policies Create Comprehensive Citywide Procurement Guidelines Completed
Improve asset management, transparency and accountability through enhancing
the fixed asset policy and procedure process.
Review, update, create and/or release new policies and procedures
to improve the fixed asset process to include the use of the Munis
fixed asset module.
Completed
Goal Metric June 2019 Goal
Provide premier IT service to City departments. Conduct periodic surveys of IT service levels Completed with 95%
Satisfaction
Provide GIS support to City departments to enable better service delivery to San
Marcos residents.
GIS will produce Street Light Inventory & FIRE Safety Maps 75% Completed
Successfully design and deploy new IT software platforms and enterprise
architectures
Successfully deploy and integrate TRAKIT9 & NextGen Lucity Completed
Successfully deploy an enterprise-class solution for file sharing Citywide deployment of Dropbox Enterprise Completed
Successfully plan, design, and deploy platform for network-wide systems
administration
Complete deployment of Shavlik (OS/App Update System). Completed
Successfully plan, design, and deploy city department automation requirements Successfully deploy and integrate all new FY18-19 approved
supplemental IT requests
Completed
Provide excellent customer service Percentage of urgent help desk requests responded to in 4 hours 100%
Successfully complete and integrate GIS solutions for the city. Complete GIS to Laserfiche RIO & TRAKIT9 integrations Completed
37
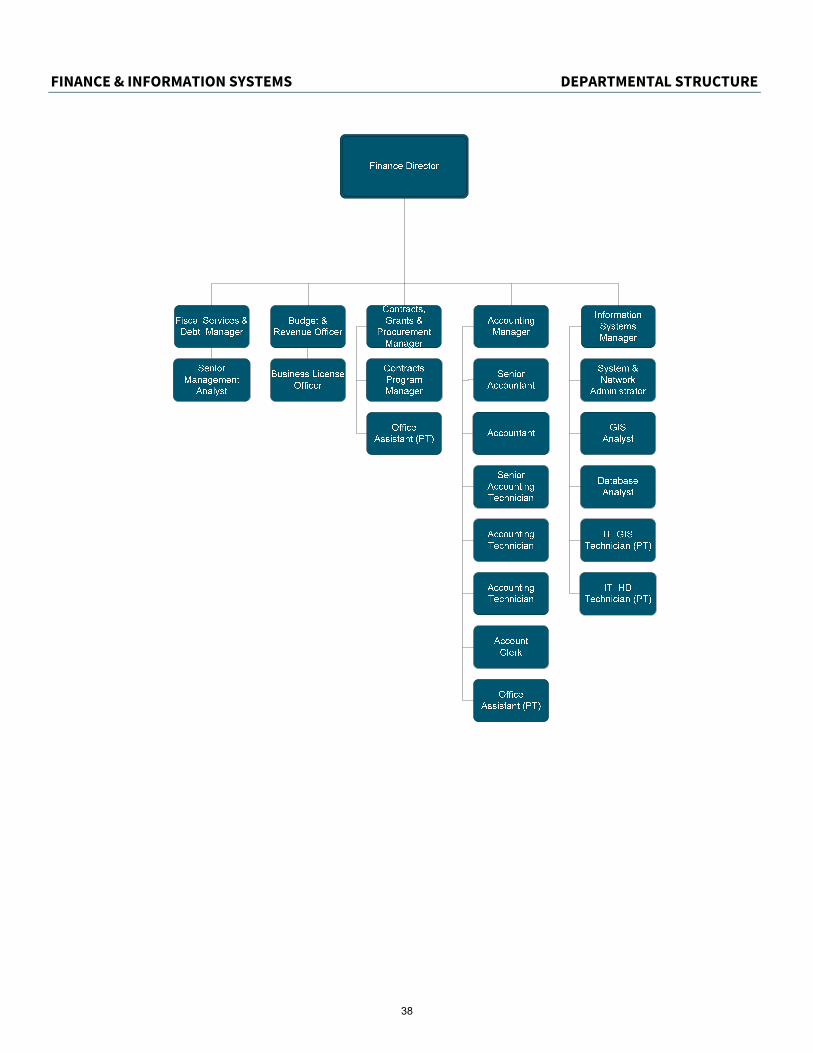
FINANCE & INFORMATION SYSTEMS DEPARTMENTAL STRUCTURE
NEED
|
38

FINANCE & INFORMATION SYSTEMS - 1017XX SUMMARY OF DEPARTMENT RESOURCES
FY 2018-19 BUDGET
CITY CITY
FY 2015-16 FY 2016-17 FY 2017-18 DEPARTMENT MANAGER COUNCIL
BUDGET CATEGORY ACTUAL ACTUAL PROJECTED REQUESTED RECOMMENDED APPROVED
EXPENDITURES
Personnel Services
Salaries & Wages 1,229,534$ 1,306,338$ 1,445,638$ 1,579,876$ 1,579,876$ 1,579,876$
Health Benefits 179,965 187,648 204,617 239,008 239,008 239,008
Retirement Benefits 377,178 411,058 412,574 474,300 474,300 474,300
Other Personnel Expenses 99,539 107,736 116,437 128,657 128,657 128,657
Personnel Services Subtotal 1,886,215 2,012,781 2,179,266 2,421,841 2,421,841 2,421,841
Operating Expenses
Contractual Services 505,038 503,948 632,801 787,664 787,664 787,664
Supplies & Services 22,744 21,394 20,371 21,910 21,910 21,910
Repair & Maintenance - - - 4,000 4,000 4,000
Utilities 187,136 184,647 189,277 214,228 214,228 214,228
Capital Expenditures (Non CIP) 544,197 163,385 89,600 106,250 106,250 106,250
Debt Service 146,632 206,571 208,396 188,194 188,194 188,194
Other Operating Expenses 112,542 190,303 101,530 66,610 66,610 66,610
Operating Expenses Subtotal 1,518,289 1,270,248 1,241,975 1,388,856 1,388,856 1,388,856
TOTAL EXPENDITURES 3,404,504 3,283,029 3,421,241 3,810,697 3,810,697 3,810,697
REVENUES
Taxes & Special Assessments - - - - - -
Licenses & Permits 241,103 245,147 248,665 315,800 315,800 315,800
Intergovernmental - - - - - -
Charges for Services 874,139 784,325 817,849 788,709 788,709 788,709
Fines & Forfeitures - - - - - -
Use of Money & Property - - - - - -
Developer Fees - - - - - -
Miscellaneous Revenues - - 100 - - -
Other Financing Sources 432,248 113,899 - - - -
TOTAL REVENUES 1,547,489 1,143,371 1,066,614 1,104,509 1,104,509 1,104,509
NET GENERAL FUND COST 1,857,015$ 2,139,658$ 2,354,627$ 2,706,188$ 2,706,188$ 2,706,188$
Allocation of Full Time Positions:
Departmental - Finance/Information Systems 14.58
CFD 98-02 0.90
Lighting & Landscaping 0.14
Successor Housing Agency 0.08
Capital Improvement Program 0.90
Successor Agency 1.40
AUTHORIZED FULL TIME POSITIONS 18.00
39
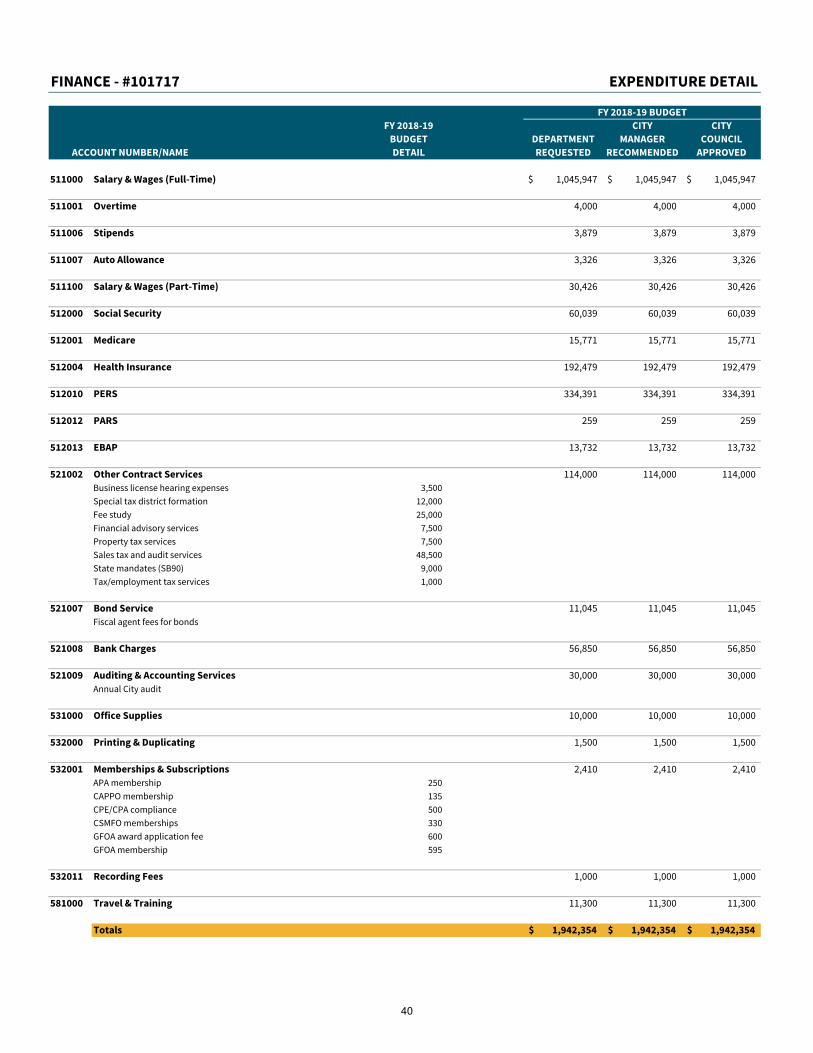
FINANCE - #101717 EXPENDITURE DETAIL
FY 2018-19 BUDGET
FY 2018-19 CITY CITY
BUDGET DEPARTMENT MANAGER COUNCIL
ACCOUNT NUMBER/NAME DETAIL REQUESTED RECOMMENDED APPROVED
511000 Salary & Wages (Full-Time) 1,045,947$ 1,045,947$ 1,045,947$
511001 Overtime 4,000 4,000 4,000
511006 Stipends 3,879 3,879 3,879
511007 Auto Allowance 3,326 3,326 3,326
511100 Salary & Wages (Part-Time) 30,426 30,426 30,426
512000 Social Security 60,039 60,039 60,039
512001 Medicare 15,771 15,771 15,771
512004 Health Insurance 192,479 192,479 192,479
512010 PERS 334,391 334,391 334,391
512012 PARS 259 259 259
512013 EBAP 13,732 13,732 13,732
521002 Other Contract Services 114,000 114,000 114,000
Business license hearing expenses 3,500
Special tax district formation 12,000
Fee study 25,000
Financial advisory services 7,500
Property tax services 7,500
Sales tax and audit services 48,500
State mandates (SB90) 9,000
Tax/employment tax services 1,000
521007 Bond Service 11,045 11,045 11,045
Fiscal agent fees for bonds
521008 Bank Charges 56,850 56,850 56,850
521009 Auditing & Accounting Services 30,000 30,000 30,000
Annual City audit
531000 Office Supplies 10,000 10,000 10,000
532000 Printing & Duplicating 1,500 1,500 1,500
532001 Memberships & Subscriptions 2,410 2,410 2,410
APA membership 250
CAPPO membership 135
CPE/CPA compliance 500
CSMFO memberships 330
GFOA award application fee 600
GFOA membership 595
532011 Recording Fees 1,000 1,000 1,000
581000 Travel & Training 11,300 11,300 11,300
Totals 1,942,354$ 1,942,354$ 1,942,354$
40
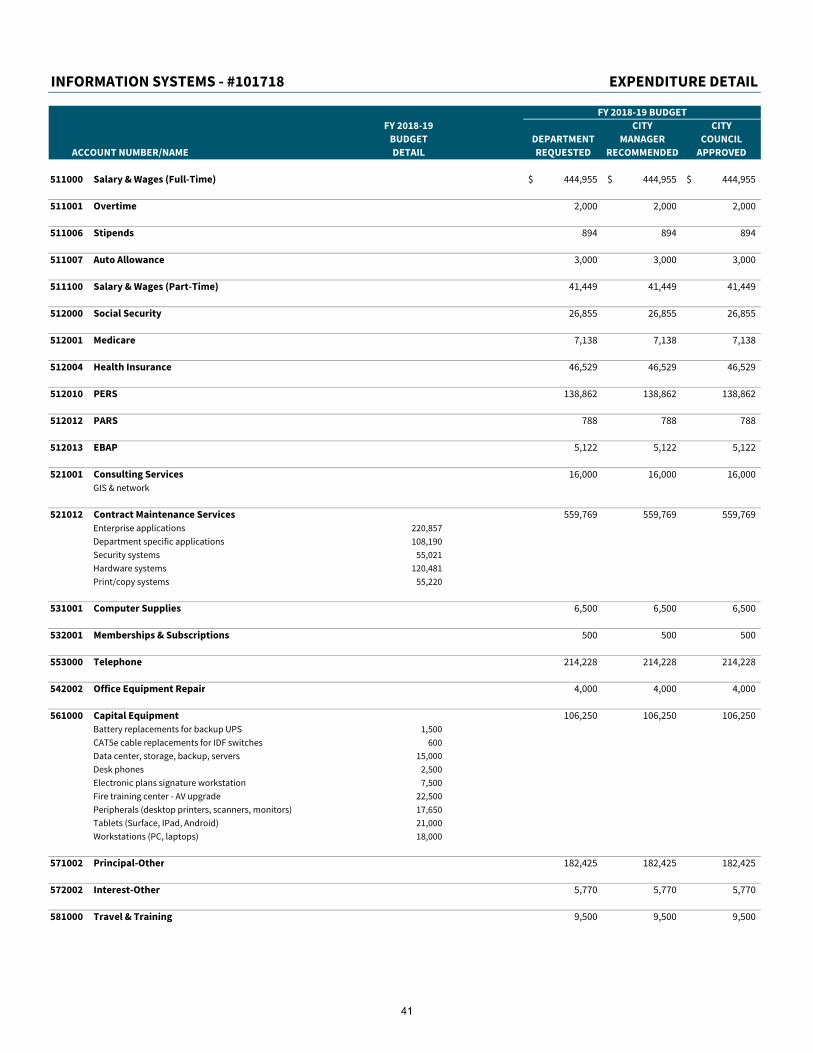
INFORMATION SYSTEMS - #101718 EXPENDITURE DETAIL
FY 2018-19 BUDGET
FY 2018-19 CITY CITY
BUDGET DEPARTMENT MANAGER COUNCIL
ACCOUNT NUMBER/NAME DETAIL REQUESTED RECOMMENDED APPROVED
511000 Salary & Wages (Full-Time) 444,955$ 444,955$ 444,955$
511001 Overtime 2,000 2,000 2,000
511006 Stipends 894 894 894
511007 Auto Allowance 3,000 3,000 3,000
511100 Salary & Wages (Part-Time) 41,449 41,449 41,449
512000 Social Security 26,855 26,855 26,855
512001 Medicare 7,138 7,138 7,138
512004 Health Insurance 46,529 46,529 46,529
512010 PERS 138,862 138,862 138,862
512012 PARS 788 788 788
512013 EBAP 5,122 5,122 5,122
521001 Consulting Services 16,000 16,000 16,000
GIS & network
521012 Contract Maintenance Services 559,769 559,769 559,769
Enterprise applications 220,857
Department specific applications 108,190
Security systems 55,021
Hardware systems 120,481
Print/copy systems 55,220
531001 Computer Supplies 6,500 6,500 6,500
532001 Memberships & Subscriptions 500 500 500
553000 Telephone 214,228 214,228 214,228
542002 Office Equipment Repair 4,000 4,000 4,000
561000 Capital Equipment 106,250 106,250 106,250
Battery replacements for backup UPS 1,500
CAT5e cable replacements for IDF switches 600
Data center, storage, backup, servers 15,000
Desk phones 2,500
Electronic plans signature workstation 7,500
Fire training center - AV upgrade 22,500
Peripherals (desktop printers, scanners, monitors) 17,650
Tablets (Surface, IPad, Android) 21,000
Workstations (PC, laptops) 18,000
571002 Principal-Other 182,425 182,425 182,425
572002 Interest-Other 5,770 5,770 5,770
581000 Travel & Training 9,500 9,500 9,500
41
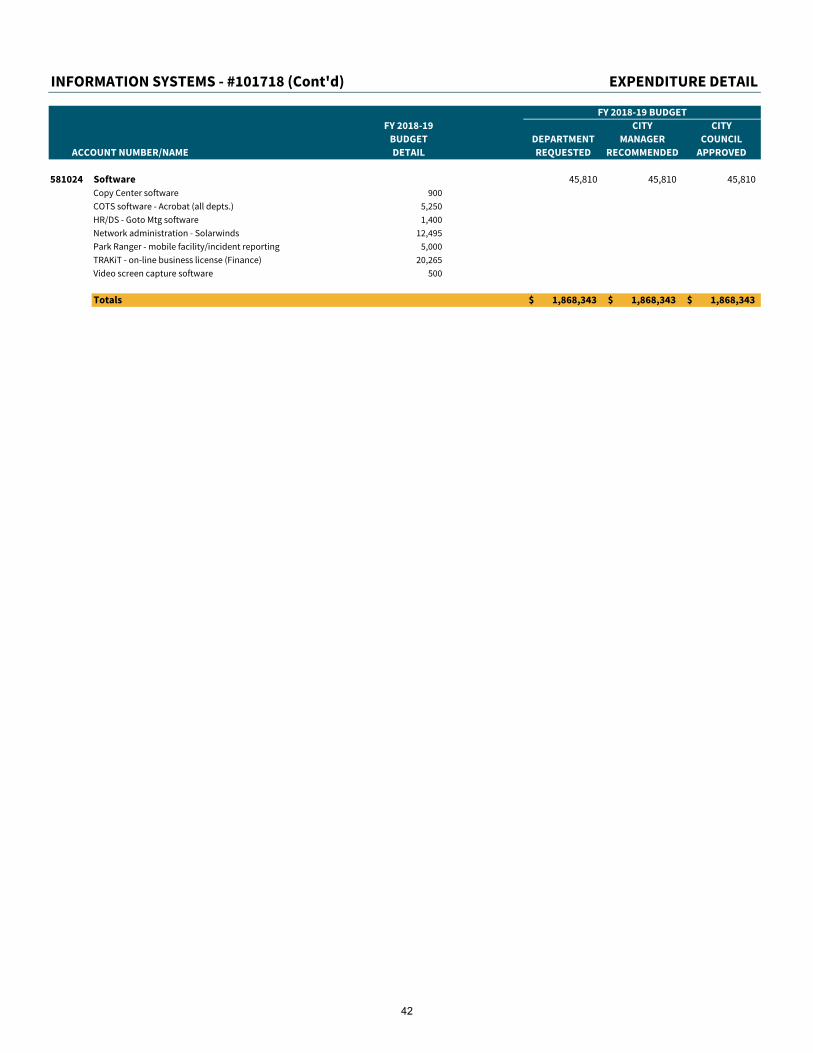
INFORMATION SYSTEMS - #101718 (Cont'd) EXPENDITURE DETAIL
FY 2018-19 BUDGET
FY 2018-19 CITY CITY
BUDGET DEPARTMENT MANAGER COUNCIL
ACCOUNT NUMBER/NAME DETAIL REQUESTED RECOMMENDED APPROVED
581024 Software 45,810 45,810 45,810
Copy Center software 900
COTS software - Acrobat (all depts.) 5,250
HR/DS - Goto Mtg software 1,400
Network administration - Solarwinds 12,495
Park Ranger - mobile facility/incident reporting 5,000
TRAKiT - on-line business license (Finance) 20,265
Video screen capture software 500
Totals 1,868,343$ 1,868,343$ 1,868,343$
42
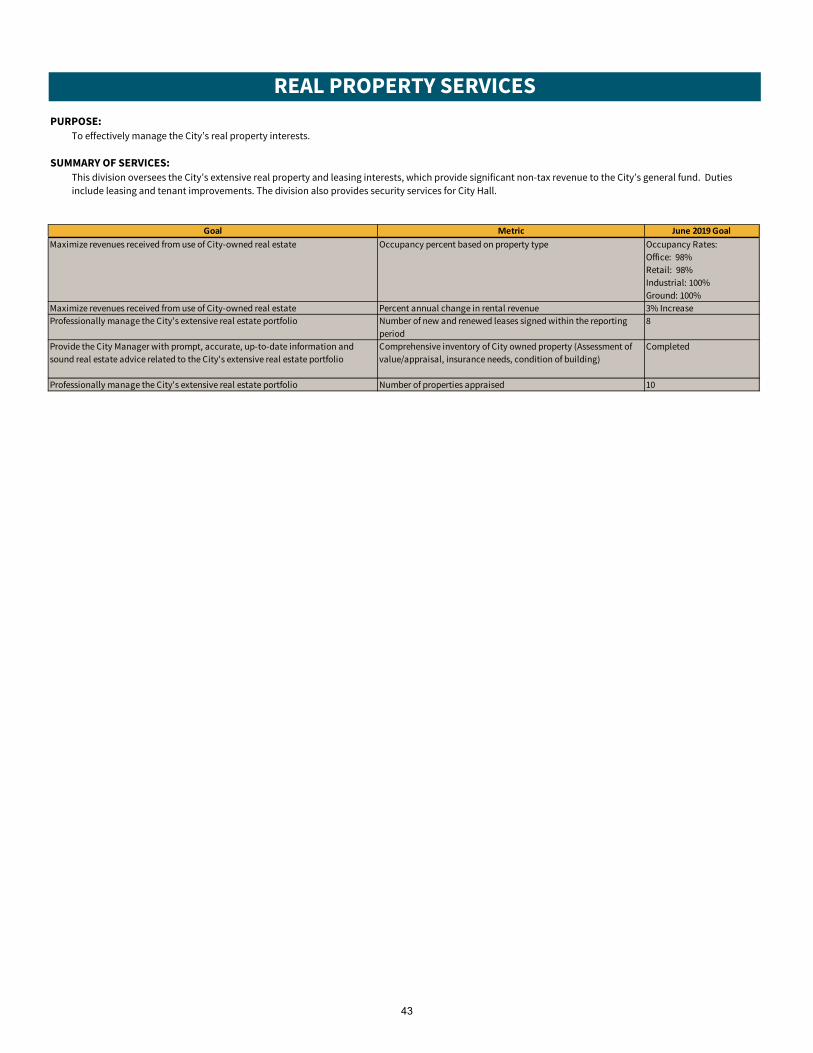
REAL PROPERTY SERVICES
PURPOSE:
To effectively manage the City’s real property interests.
SUMMARY OF SERVICES:
This division oversees the City’s extensive real property and leasing interests, which provide significant non-tax revenue to the City’s general fund. Duties
include leasing and tenant improvements. The division also provides security services for City Hall.
Goal Metric June 2019 Goal
Maximize revenues received from use of City-owned real estate Occupancy percent based on property type Occupancy Rates:
Office: 98%
Retail: 98%
Industrial: 100%
Ground: 100%
Maximize revenues received from use of City-owned real estate Percent annual change in rental revenue 3% Increase
Professionally manage the City's extensive real estate portfolio Number of new and renewed leases signed within the reporting
period
8
Provide the City Manager with prompt, accurate, up-to-date information and
sound real estate advice related to the City's extensive real estate portfolio
Comprehensive inventory of City owned property (Assessment of
value/appraisal, insurance needs, condition of building)
Completed
Professionally manage the City's extensive real estate portfolio Number of properties appraised 10
43
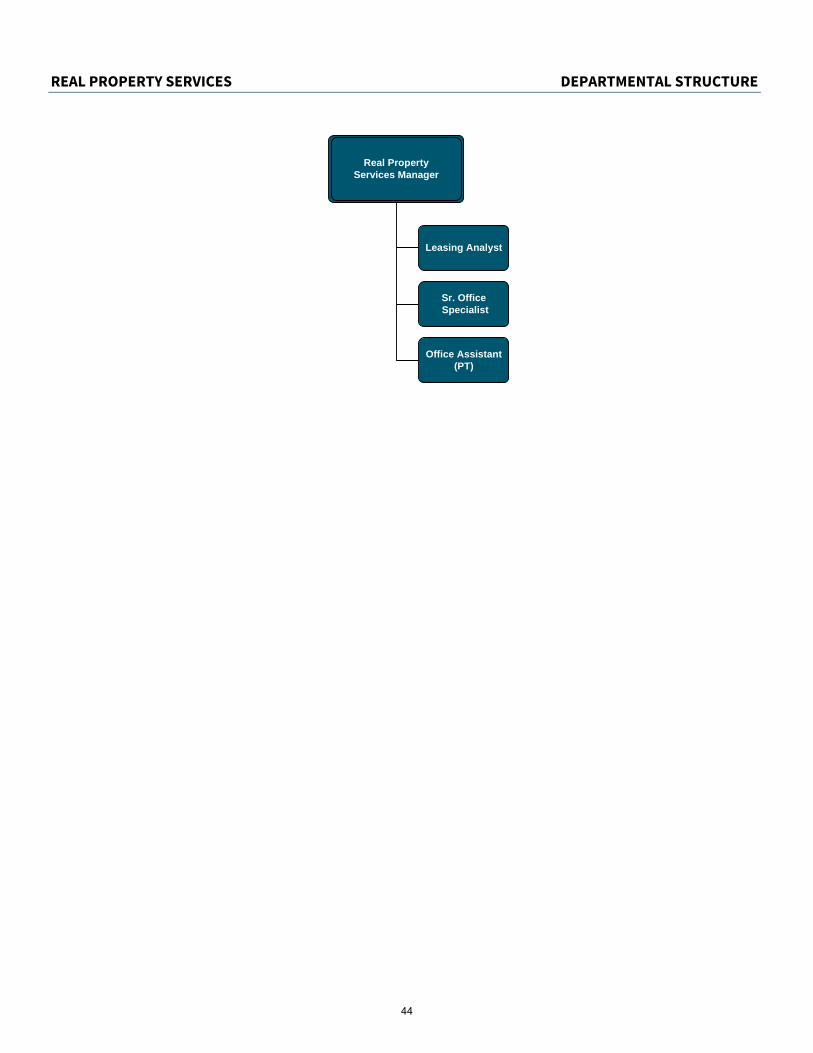
REAL PROPERTY SERVICES DEPARTMENTAL STRUCTURE
NEED
|
Real Property Services Manager
Sr. Office Specialist
Office Assistant (PT)
Leasing Analyst
44
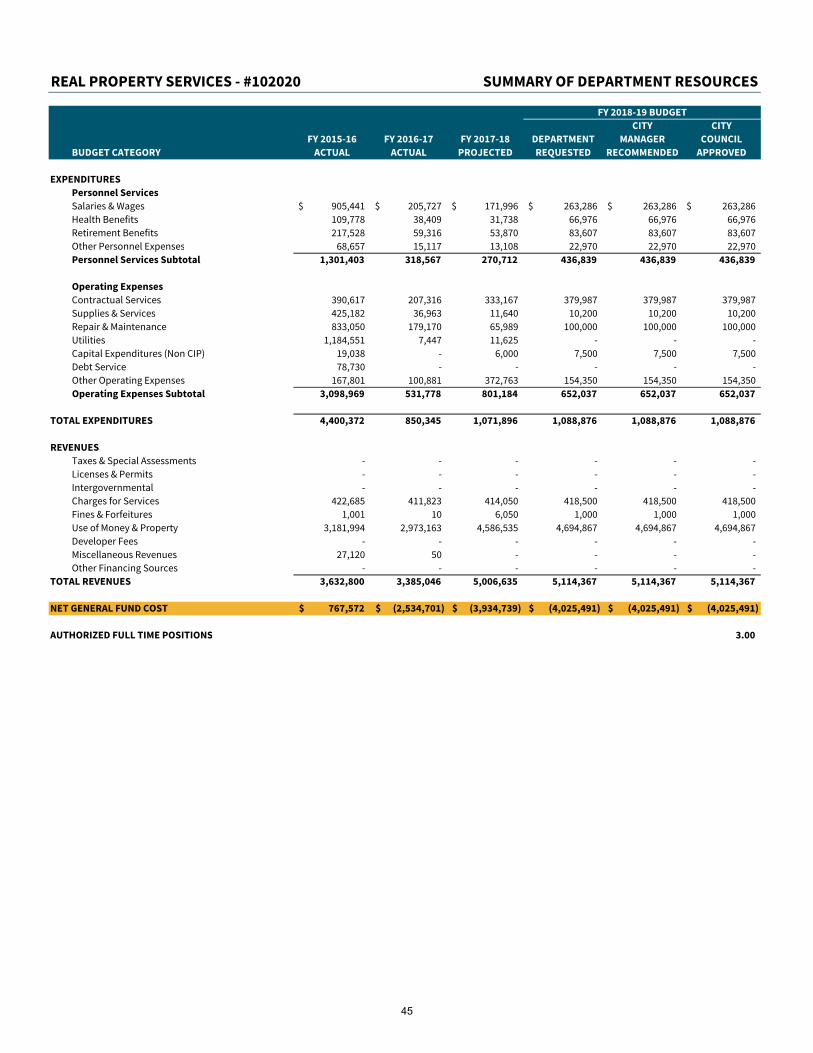
REAL PROPERTY SERVICES - #102020 SUMMARY OF DEPARTMENT RESOURCES
FY 2018-19 BUDGET
CITY CITY
FY 2015-16 FY 2016-17 FY 2017-18 DEPARTMENT MANAGER COUNCIL
BUDGET CATEGORY ACTUAL ACTUAL PROJECTED REQUESTED RECOMMENDED APPROVED
EXPENDITURES
Personnel Services
Salaries & Wages 905,441$ 205,727$ 171,996$ 263,286$ 263,286$ 263,286$
Health Benefits 109,778 38,409 31,738 66,976 66,976 66,976
Retirement Benefits 217,528 59,316 53,870 83,607 83,607 83,607
Other Personnel Expenses 68,657 15,117 13,108 22,970 22,970 22,970
Personnel Services Subtotal 1,301,403 318,567 270,712 436,839 436,839 436,839
Operating Expenses
Contractual Services 390,617 207,316 333,167 379,987 379,987 379,987
Supplies & Services 425,182 36,963 11,640 10,200 10,200 10,200
Repair & Maintenance 833,050 179,170 65,989 100,000 100,000 100,000
Utilities 1,184,551 7,447 11,625 - - -
Capital Expenditures (Non CIP) 19,038 - 6,000 7,500 7,500 7,500
Debt Service 78,730 - - - - -
Other Operating Expenses 167,801 100,881 372,763 154,350 154,350 154,350
Operating Expenses Subtotal 3,098,969 531,778 801,184 652,037 652,037 652,037
TOTAL EXPENDITURES 4,400,372 850,345 1,071,896 1,088,876 1,088,876 1,088,876
REVENUES
Taxes & Special Assessments - - - - - -
Licenses & Permits - - - - - -
Intergovernmental - - - - - -
Charges for Services 422,685 411,823 414,050 418,500 418,500 418,500
Fines & Forfeitures 1,001 10 6,050 1,000 1,000 1,000
Use of Money & Property 3,181,994 2,973,163 4,586,535 4,694,867 4,694,867 4,694,867
Developer Fees - - - - - -
Miscellaneous Revenues 27,120 50 - - - -
Other Financing Sources - - - - - -
TOTAL REVENUES 3,632,800 3,385,046 5,006,635 5,114,367 5,114,367 5,114,367
NET GENERAL FUND COST 767,572$ (2,534,701)$ (3,934,739)$ (4,025,491)$ (4,025,491)$ (4,025,491)$
AUTHORIZED FULL TIME POSITIONS 3.00
45
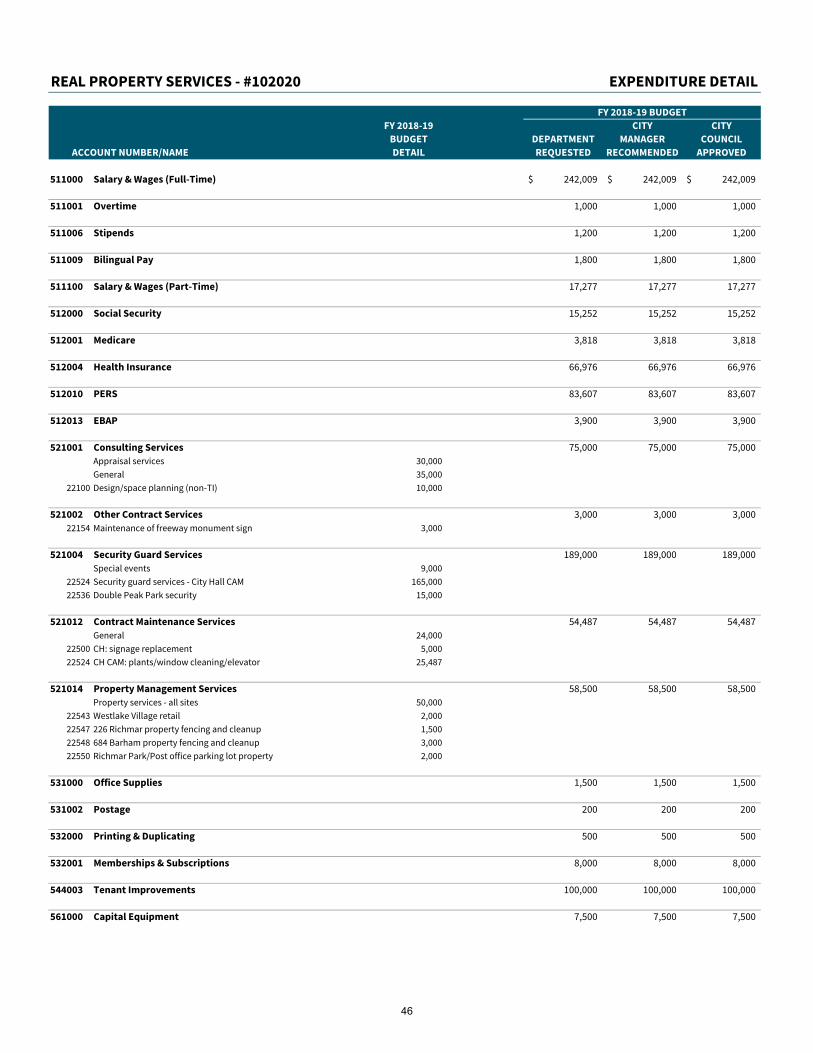
REAL PROPERTY SERVICES - #102020 EXPENDITURE DETAIL
FY 2018-19 BUDGET
FY 2018-19 CITY CITY
BUDGET DEPARTMENT MANAGER COUNCIL
ACCOUNT NUMBER/NAME DETAIL REQUESTED RECOMMENDED APPROVED
511000 Salary & Wages (Full-Time) 242,009$ 242,009$ 242,009$
511001 Overtime 1,000 1,000 1,000
511006 Stipends 1,200 1,200 1,200
511009 Bilingual Pay 1,800 1,800 1,800
511100 Salary & Wages (Part-Time) 17,277 17,277 17,277
512000 Social Security 15,252 15,252 15,252
512001 Medicare 3,818 3,818 3,818
512004 Health Insurance 66,976 66,976 66,976
512010 PERS 83,607 83,607 83,607
512013 EBAP 3,900 3,900 3,900
521001 Consulting Services 75,000 75,000 75,000
Appraisal services 30,000
General 35,000
22100 Design/space planning (non-TI) 10,000
521002 Other Contract Services 3,000 3,000 3,000
22154 Maintenance of freeway monument sign 3,000
521004 Security Guard Services 189,000 189,000 189,000
Special events 9,000
22524 Security guard services - City Hall CAM 165,000
22536 Double Peak Park security 15,000
521012 Contract Maintenance Services 54,487 54,487 54,487
General 24,000
22500 CH: signage replacement 5,000
22524 CH CAM: plants/window cleaning/elevator 25,487
521014 Property Management Services 58,500 58,500 58,500
Property services - all sites 50,000
22543 Westlake Village retail 2,000
22547 226 Richmar property fencing and cleanup 1,500
22548 684 Barham property fencing and cleanup 3,000
22550 Richmar Park/Post office parking lot property 2,000
531000 Office Supplies 1,500 1,500 1,500
531002 Postage 200 200 200
532000 Printing & Duplicating 500 500 500
532001 Memberships & Subscriptions 8,000 8,000 8,000
544003 Tenant Improvements 100,000 100,000 100,000
561000 Capital Equipment 7,500 7,500 7,500
46
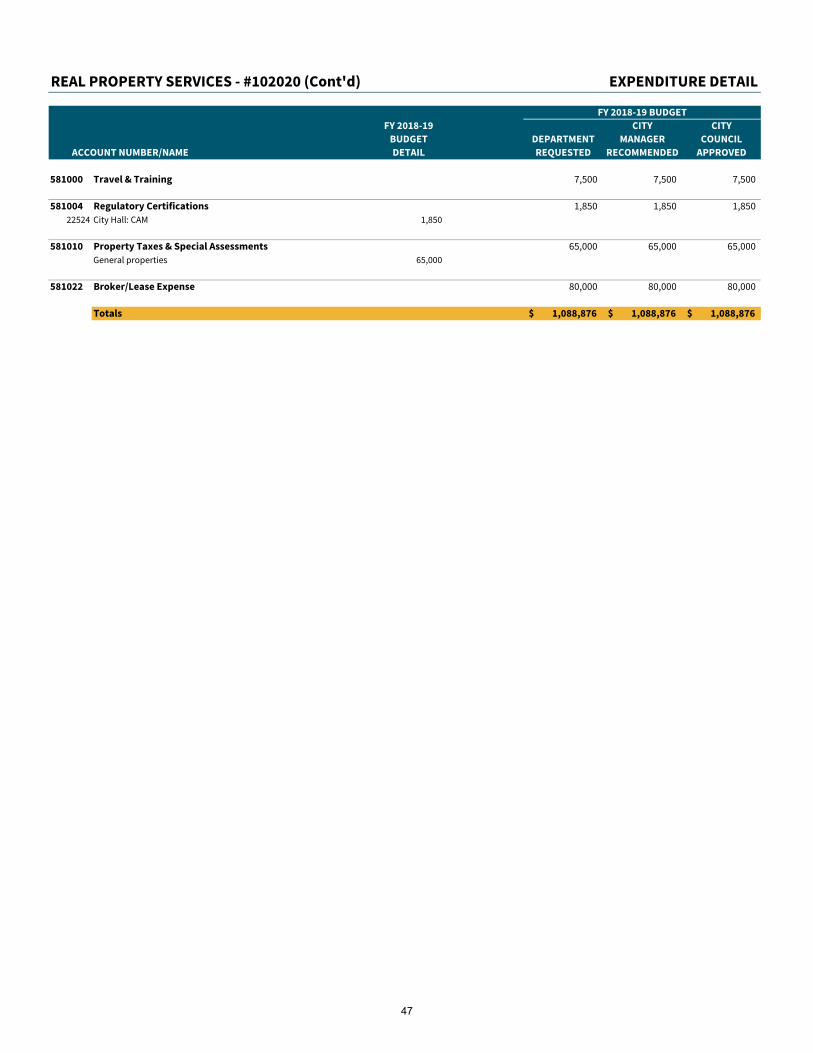
REAL PROPERTY SERVICES - #102020 (Cont'd) EXPENDITURE DETAIL
FY 2018-19 BUDGET
FY 2018-19 CITY CITY
BUDGET DEPARTMENT MANAGER COUNCIL
ACCOUNT NUMBER/NAME DETAIL REQUESTED RECOMMENDED APPROVED
581000 Travel & Training 7,500 7,500 7,500
581004 Regulatory Certifications 1,850 1,850 1,850
22524 City Hall: CAM 1,850
581010 Property Taxes & Special Assessments 65,000 65,000 65,000
General properties 65,000
581022 Broker/Lease Expense 80,000 80,000 80,000
Totals 1,088,876$ 1,088,876$ 1,088,876$
47

|
This page intentionally left blank.
48
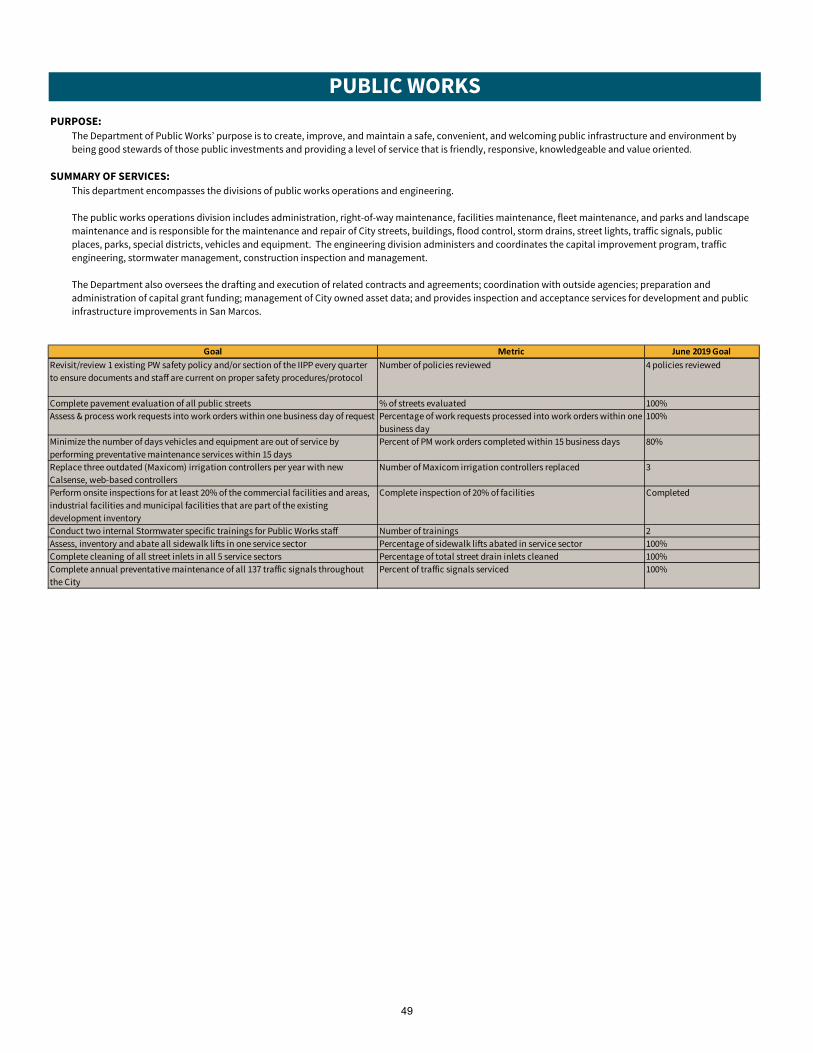
PUBLIC WORKS
PURPOSE:
The Department of Public Works’ purpose is to create, improve, and maintain a safe, convenient, and welcoming public infrastructure and environment by
being good stewards of those public investments and providing a level of service that is friendly, responsive, knowledgeable and value oriented.
SUMMARY OF SERVICES:
This department encompasses the divisions of public works operations and engineering.
The public works operations division includes administration, right-of-way maintenance, facilities maintenance, fleet maintenance, and parks and landscape
maintenance and is responsible for the maintenance and repair of City streets, buildings, flood control, storm drains, street lights, traffic signals, public
places, parks, special districts, vehicles and equipment. The engineering division administers and coordinates the capital improvement program, traffic
engineering, stormwater management, construction inspection and management.
The Department also oversees the drafting and execution of related contracts and agreements; coordination with outside agencies; preparation and
administration of capital grant funding; management of City owned asset data; and provides inspection and acceptance services for development and public
infrastructure improvements in San Marcos.
Goal Metric June 2019 Goal
Revisit/review 1 existing PW safety policy and/or section of the IIPP every quarter
to ensure documents and staff are current on proper safety procedures/protocol
Number of policies reviewed 4 policies reviewed
Complete pavement evaluation of all public streets % of streets evaluated 100%
Assess & process work requests into work orders within one business day of request Percentage of work requests processed into work orders within one
business day
100%
Minimize the number of days vehicles and equipment are out of service by
performing preventative maintenance services within 15 days
Percent of PM work orders completed within 15 business days 80%
Replace three outdated (Maxicom) irrigation controllers per year with new
Calsense, web-based controllers
Number of Maxicom irrigation controllers replaced 3
Perform onsite inspections for at least 20% of the commercial facilities and areas,
industrial facilities and municipal facilities that are part of the existing
development inventory
Complete inspection of 20% of facilities Completed
Conduct two internal Stormwater specific trainings for Public Works staff Number of trainings 2
Assess, inventory and abate all sidewalk lifts in one service sector Percentage of sidewalk lifts abated in service sector 100%
Complete cleaning of all street inlets in all 5 service sectors Percentage of total street drain inlets cleaned 100%
Complete annual preventative maintenance of all 137 traffic signals throughout
the City
Percent of traffic signals serviced 100%
49
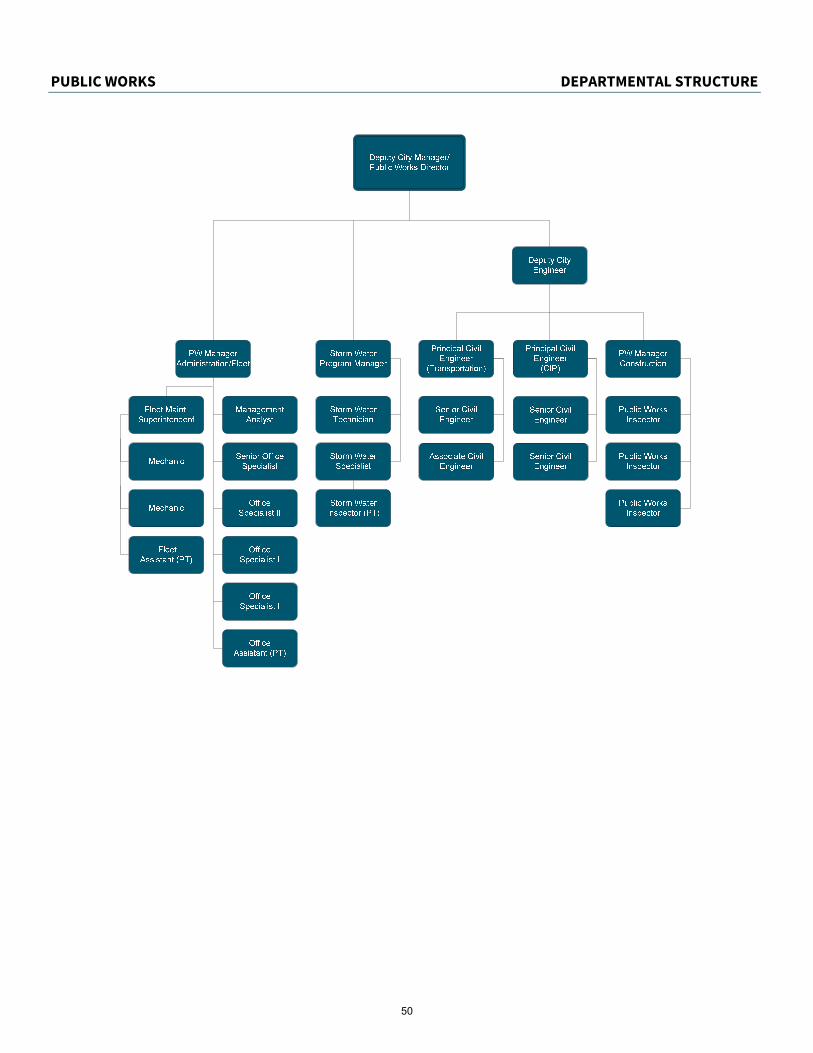
PUBLIC WORKS DEPARTMENTAL STRUCTURE
NEED
|
50
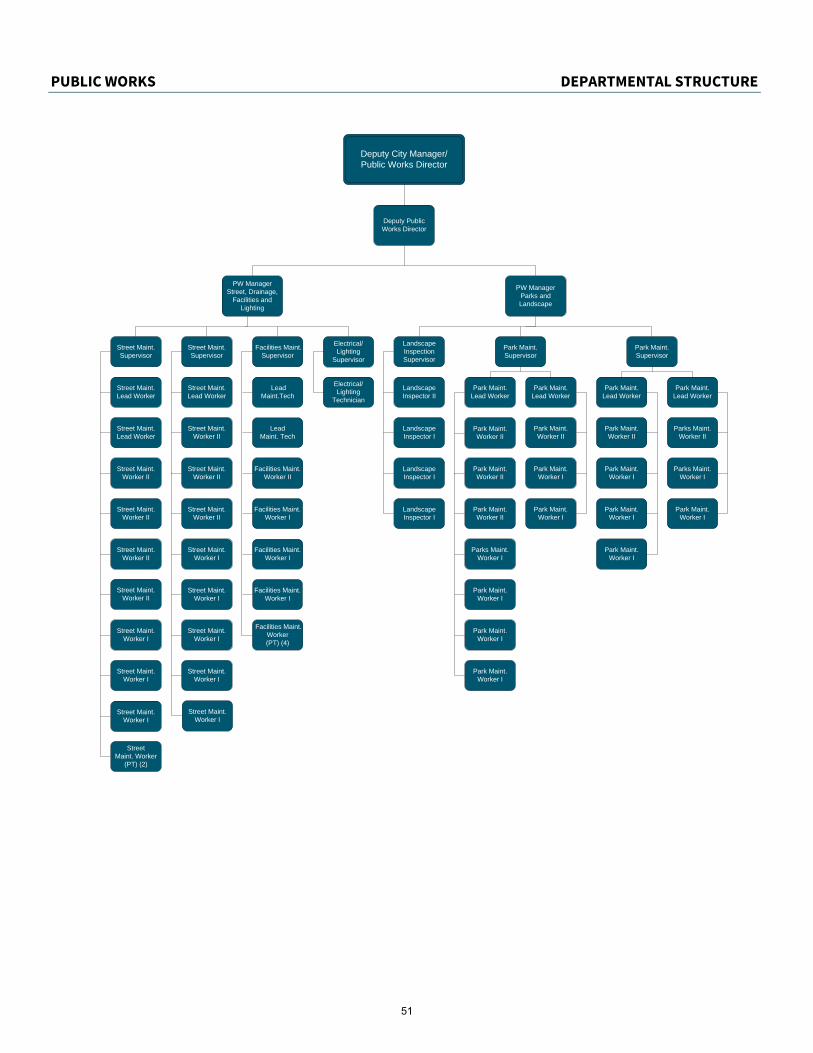
PUBLIC WORKS DEPARTMENTAL STRUCTURE
NEED
|
Deputy City Manager/Public Works Director
Deputy Public Works Director
Street Maint. Supervisor
Electrical/Lighting
Supervisor
Street Maint. Supervisor
Street Maint. Lead Worker
Street Maint. Worker II
Street Maint. Worker II
Electrical/Lighting
Technician
PW ManagerParks and Landscape
Park Maint. Supervisor
Landscape Inspection Supervisor
Park Maint. Supervisor
Park Maint. Lead Worker
Park Maint. Lead Worker
Park Maint. Lead Worker
Park Maint. Lead Worker
Parks Maint. Worker I
Landscape Inspector II
Landscape Inspector I
Street Maint. Lead Worker
Street Maint. Worker II
Street Maint. Worker II
Street Maint. Worker II
Street Maint. Worker II
Street Maint. Worker I
Street Maint. Worker I
Street Maint. Worker I
Street Maint. Worker I
Street Maint. Worker II
Street Maint. Worker I
Street Maint. Lead Worker
Landscape Inspector I
Parks Maint. Worker II
Parks Maint. Worker I
Park Maint. Worker I
Landscape Inspector I
Park Maint. Worker II
Park Maint. Worker II
Park Maint. Worker II
Park Maint. Worker II
Street Maint. Worker I
Street Maint. Worker I
Park Maint. Worker I
Park Maint. Worker I
Park Maint. Worker I
Park Maint. Worker I
Park Maint. Worker I
Park Maint. Worker I
Street Maint. Worker
(PT) (2)
PW Manager Street, Drainage,
Facilities and Lighting
Park Maint. Worker I
Street Maint. Worker I
Park Maint. Worker II
Park Maint. Worker I
Facilities Maint.Supervisor
Facilities Maint. Worker I
Lead Maint.Tech
Lead Maint. Tech
Facilities Maint. Worker I
Facilities Maint.Worker II
Facilities Maint. Worker I
Facilities Maint. Worker (PT) (4)
51

|
This page intentionally left blank.
52
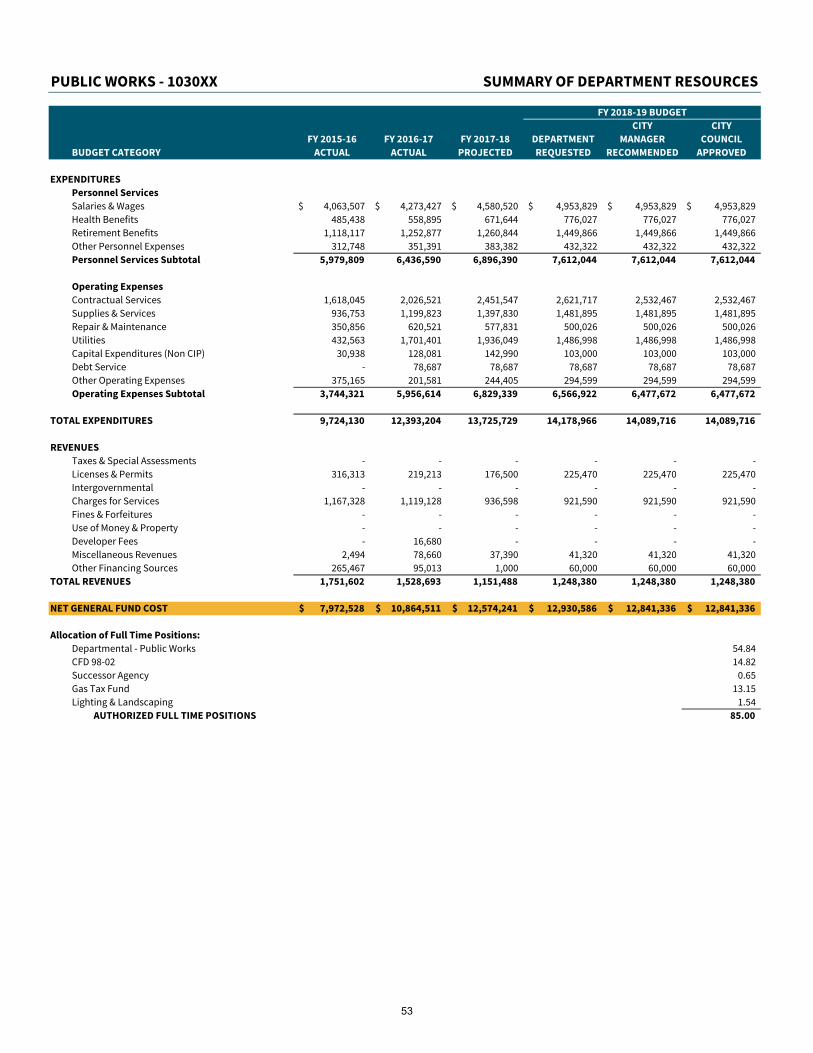
PUBLIC WORKS - 1030XX SUMMARY OF DEPARTMENT RESOURCES
FY 2018-19 BUDGET
CITY CITY
FY 2015-16 FY 2016-17 FY 2017-18 DEPARTMENT MANAGER COUNCIL
BUDGET CATEGORY ACTUAL ACTUAL PROJECTED REQUESTED RECOMMENDED APPROVED
EXPENDITURES
Personnel Services
Salaries & Wages 4,063,507$ 4,273,427$ 4,580,520$ 4,953,829$ 4,953,829$ 4,953,829$
Health Benefits 485,438 558,895 671,644 776,027 776,027 776,027
Retirement Benefits 1,118,117 1,252,877 1,260,844 1,449,866 1,449,866 1,449,866
Other Personnel Expenses 312,748 351,391 383,382 432,322 432,322 432,322
Personnel Services Subtotal 5,979,809 6,436,590 6,896,390 7,612,044 7,612,044 7,612,044
Operating Expenses
Contractual Services 1,618,045 2,026,521 2,451,547 2,621,717 2,532,467 2,532,467
Supplies & Services 936,753 1,199,823 1,397,830 1,481,895 1,481,895 1,481,895
Repair & Maintenance 350,856 620,521 577,831 500,026 500,026 500,026
Utilities 432,563 1,701,401 1,936,049 1,486,998 1,486,998 1,486,998
Capital Expenditures (Non CIP) 30,938 128,081 142,990 103,000 103,000 103,000
Debt Service - 78,687 78,687 78,687 78,687 78,687
Other Operating Expenses 375,165 201,581 244,405 294,599 294,599 294,599
Operating Expenses Subtotal 3,744,321 5,956,614 6,829,339 6,566,922 6,477,672 6,477,672
TOTAL EXPENDITURES 9,724,130 12,393,204 13,725,729 14,178,966 14,089,716 14,089,716
REVENUES
Taxes & Special Assessments - - - - - -
Licenses & Permits 316,313 219,213 176,500 225,470 225,470 225,470
Intergovernmental - - - - - -
Charges for Services 1,167,328 1,119,128 936,598 921,590 921,590 921,590
Fines & Forfeitures - - - - - -
Use of Money & Property - - - - - -
Developer Fees - 16,680 - - - -
Miscellaneous Revenues 2,494 78,660 37,390 41,320 41,320 41,320
Other Financing Sources 265,467 95,013 1,000 60,000 60,000 60,000
TOTAL REVENUES 1,751,602 1,528,693 1,151,488 1,248,380 1,248,380 1,248,380
NET GENERAL FUND COST 7,972,528$ 10,864,511$ 12,574,241$ 12,930,586$ 12,841,336$ 12,841,336$
Allocation of Full Time Positions:
Departmental - Public Works 54.84
CFD 98-02 14.82
Successor Agency 0.65
Gas Tax Fund 13.15
Lighting & Landscaping 1.54
AUTHORIZED FULL TIME POSITIONS 85.00
53
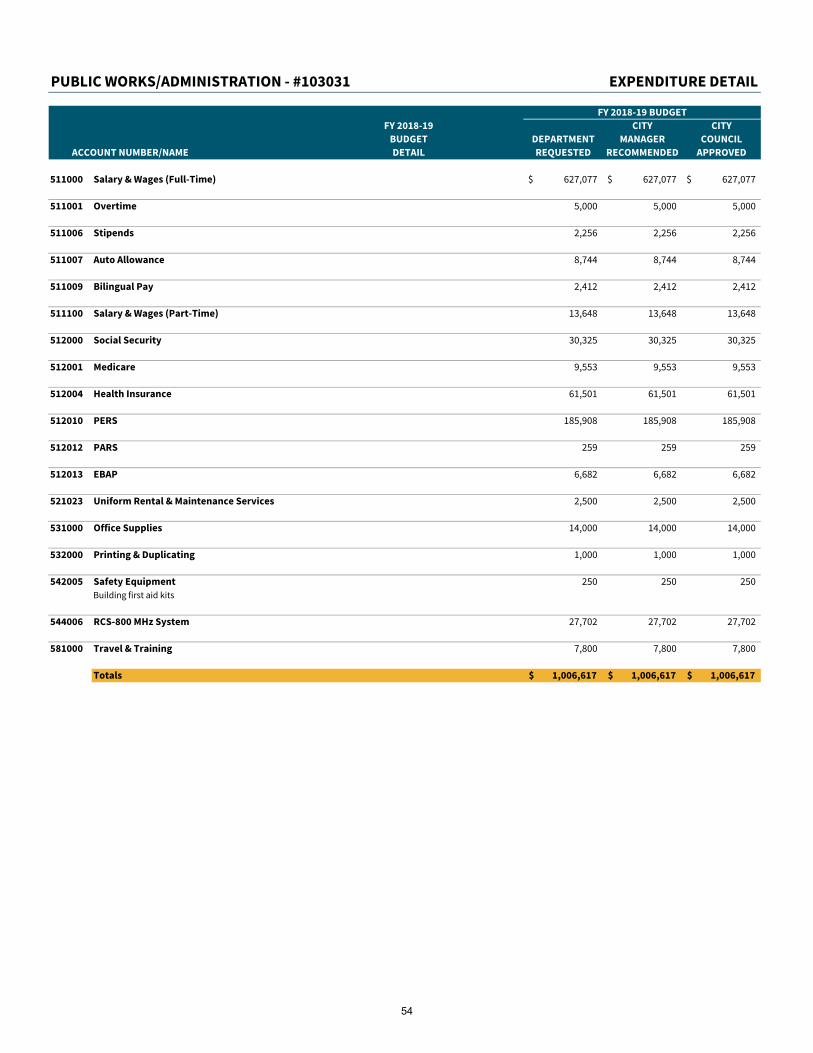
PUBLIC WORKS/ADMINISTRATION - #103031 EXPENDITURE DETAIL
FY 2018-19 BUDGET
FY 2018-19 CITY CITY
BUDGET DEPARTMENT MANAGER COUNCIL
ACCOUNT NUMBER/NAME DETAIL REQUESTED RECOMMENDED APPROVED
511000 Salary & Wages (Full-Time) 627,077$ 627,077$ 627,077$
511001 Overtime 5,000 5,000 5,000
511006 Stipends 2,256 2,256 2,256
511007 Auto Allowance 8,744 8,744 8,744
511009 Bilingual Pay 2,412 2,412 2,412
511100 Salary & Wages (Part-Time) 13,648 13,648 13,648
512000 Social Security 30,325 30,325 30,325
512001 Medicare 9,553 9,553 9,553
512004 Health Insurance 61,501 61,501 61,501
512010 PERS 185,908 185,908 185,908
512012 PARS 259 259 259
512013 EBAP 6,682 6,682 6,682
521023 Uniform Rental & Maintenance Services 2,500 2,500 2,500
531000 Office Supplies 14,000 14,000 14,000
532000 Printing & Duplicating 1,000 1,000 1,000
542005 Safety Equipment 250 250 250
Building first aid kits
544006 RCS-800 MHz System 27,702 27,702 27,702
581000 Travel & Training 7,800 7,800 7,800
Totals 1,006,617$ 1,006,617$ 1,006,617$
54

PUBLIC WORKS/STORM WATER PROGRAM MANAGEMENT - #103003 EXPENDITURE DETAIL
FY 2018-19 BUDGET
FY 2018-19 CITY CITY
BUDGET DEPARTMENT MANAGER COUNCIL
ACCOUNT NUMBER/NAME DETAIL REQUESTED RECOMMENDED APPROVED
511000 Salary & Wages (Full-Time) 252,715$ 252,715$ 252,715$
511001 Overtime 1,500 1,500 1,500
511006 Stipends 1,400 1,400 1,400
511100 Salary & Wages (Part-Time) 40,585 40,585 40,585
512000 Social Security 15,849 15,849 15,849
512001 Medicare 4,295 4,295 4,295
512004 Health Insurance 38,711 38,711 38,711
512010 PERS 82,409 82,409 82,409
512012 PARS 771 771 771
512013 EBAP 3,900 3,900 3,900
521001 Consulting Services 155,964 155,964 155,964
Water Monitoring Consulting Services 140,000
Discovery Lake treatment and permits 15,964
531010 Small Tools 1,550 1,550 1,550
531020 Uniform Expense 625 625 625
542005 Safety Equipment 300 300 300
581000 Travel & Training 9,420 9,420 9,420
CASQA Conference 2,000
Certified Erosion & Sediment Storm Water Inspector (CESSWI) 900
Certified Professional Erosion & Sediment Control (CPESC) 125
Certified Professional in Storm Water Quality (CPSWQ) 125
Continuing education requirements for certifications 5,700
Municipal Separate Storm Sewer System Specialist (CMS4S) 70
Qualified SWPPP Developer (QSD) 200
Qualified SWPPP Practitioner (QSP) 300
581011 Recycling Expenditures 25,055 25,055 25,055
581028 NPDES Programs 210,800 210,800 210,800
BIGHT Cost Share 15,000
Carlsbad Watershed Management Area (CWMA) cost share/MOU 12,000
Carlsbad Watershed Management Area Contract 50,000
Education programs 15,000
Regional MOU cost share 30,000
SWRCB annual discharge fee - Bradley Park 57,000
SWRCB general industrial permit fee - Bradley Park 1,800
SWRCD annual discharge fee 30,000
Totals 845,849$ 845,849$ 845,849$
55

PUBLIC WORKS/RIGHT-OF-WAY MAINTENANCE - #103032 EXPENDITURE DETAIL
FY 2018-19 BUDGET
FY 2018-19 CITY CITY
BUDGET DEPARTMENT MANAGER COUNCIL
ACCOUNT NUMBER/NAME DETAIL REQUESTED RECOMMENDED APPROVED
511000 Salary & Wages (Full-Time) 545,351$ 545,351$ 545,351$
511001 Overtime 29,861 29,861 29,861
511006 Stipends 6,590 6,590 6,590
511009 Bilingual Pay 3,927 3,927 3,927
511100 Salary & Wages (Part-Time) 14,069 14,069 14,069
512000 Social Security 36,175 36,175 36,175
512001 Medicare 8,697 8,697 8,697
512004 Health Insurance 95,129 95,129 95,129
512010 PERS 175,821 175,821 175,821
512012 PARS 122 122 122
512013 EBAP 9,720 9,720 9,720
512015 RHS 1,269 1,269 1,269
521002 Other Contract Services 46,050 46,050 46,050
NCTD permit fee 650
NCTD flagging fee 2,000
League Of California Cities contribution 400
Storm channel maintenance permits 43,000
521012 Contract Maintenance Services 594,618 594,618 594,618
Biological survey services (Storm) 15,000
Concrete sidewalk inspection 19,200
Dead animal pick up and disposal 8,640
Electrical maintenance 15,000
Homeless encampment cleanup 18,000
Guardrail study 50,000
Parks concrete repairs 10,734
Pest control 1,000
Sand grease separators (Storm) 8,000
Slurry asphalt trails 10,125
Slurry park parking lots 5,582
Storm drain and inlet cleaning (Storm) 100,000
Street sweeping (Storm) 300,737
Tree trimming/removal 30,000
Underground service alert 2,600
521023 Uniform Rental & Maintenance Services 7,578 7,578 7,578
531009 Construction Materials 54,600 54,600 54,600
Graffiti abatement (project #55021) 20,000
Herbicides (Storm) 4,600
Light pole signage 1,000
Materials for drainage system facilities (Storm) 7,000
Pedestrian lights, poles, and meter pedestals 20,000
Various construction materials 2,000
56
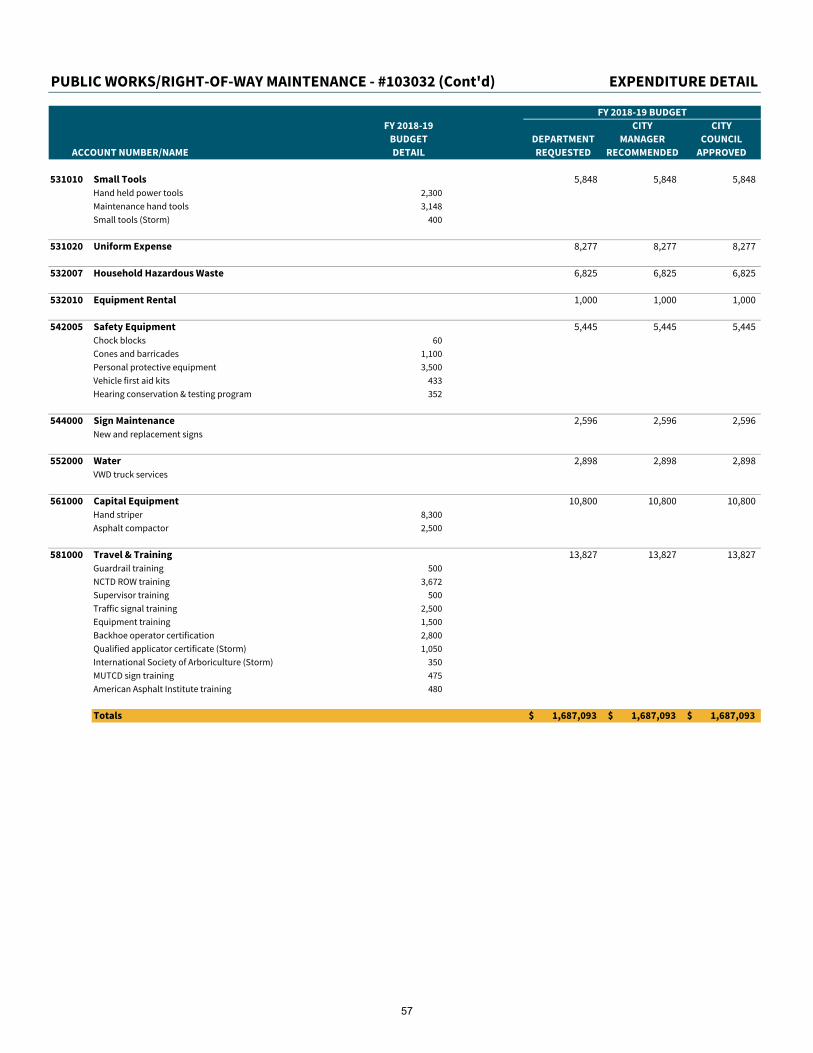
PUBLIC WORKS/RIGHT-OF-WAY MAINTENANCE - #103032 (Cont'd) EXPENDITURE DETAIL
FY 2018-19 BUDGET
FY 2018-19 CITY CITY
BUDGET DEPARTMENT MANAGER COUNCIL
ACCOUNT NUMBER/NAME DETAIL REQUESTED RECOMMENDED APPROVED
531010 Small Tools 5,848 5,848 5,848
Hand held power tools 2,300
Maintenance hand tools 3,148
Small tools (Storm) 400
531020 Uniform Expense 8,277 8,277 8,277
532007 Household Hazardous Waste 6,825 6,825 6,825
532010 Equipment Rental 1,000 1,000 1,000
542005 Safety Equipment 5,445 5,445 5,445
Chock blocks 60
Cones and barricades 1,100
Personal protective equipment 3,500
Vehicle first aid kits 433
Hearing conservation & testing program 352
544000 Sign Maintenance 2,596 2,596 2,596
New and replacement signs
552000 Water 2,898 2,898 2,898
VWD truck services
561000 Capital Equipment 10,800 10,800 10,800
Hand striper 8,300
Asphalt compactor 2,500
581000 Travel & Training 13,827 13,827 13,827
Guardrail training 500
NCTD ROW training 3,672
Supervisor training 500
Traffic signal training 2,500
Equipment training 1,500
Backhoe operator certification 2,800
Qualified applicator certificate (Storm) 1,050
International Society of Arboriculture (Storm) 350
MUTCD sign training 475
American Asphalt Institute training 480
Totals 1,687,093$ 1,687,093$ 1,687,093$
57
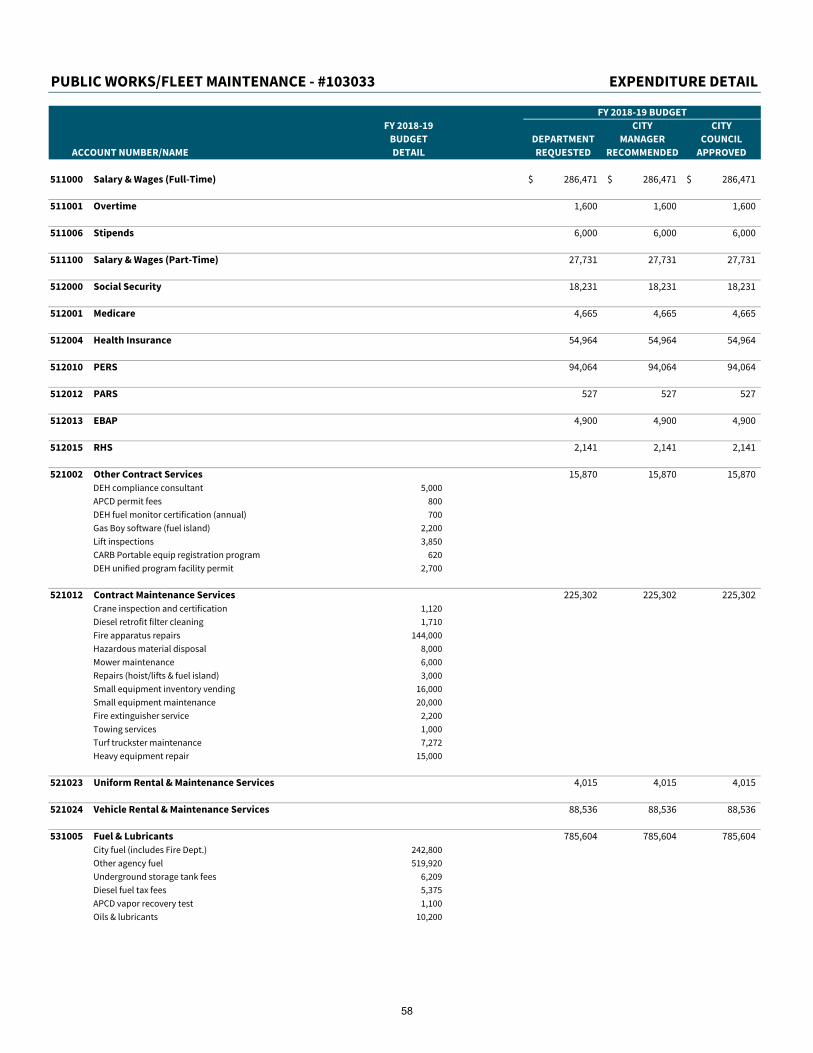
PUBLIC WORKS/FLEET MAINTENANCE - #103033 EXPENDITURE DETAIL
FY 2018-19 BUDGET
FY 2018-19 CITY CITY
BUDGET DEPARTMENT MANAGER COUNCIL
ACCOUNT NUMBER/NAME DETAIL REQUESTED RECOMMENDED APPROVED
511000 Salary & Wages (Full-Time) 286,471$ 286,471$ 286,471$
511001 Overtime 1,600 1,600 1,600
511006 Stipends 6,000 6,000 6,000
511100 Salary & Wages (Part-Time) 27,731 27,731 27,731
512000 Social Security 18,231 18,231 18,231
512001 Medicare 4,665 4,665 4,665
512004 Health Insurance 54,964 54,964 54,964
512010 PERS 94,064 94,064 94,064
512012 PARS 527 527 527
512013 EBAP 4,900 4,900 4,900
512015 RHS 2,141 2,141 2,141
521002 Other Contract Services 15,870 15,870 15,870
DEH compliance consultant 5,000
APCD permit fees 800
DEH fuel monitor certification (annual) 700
Gas Boy software (fuel island) 2,200
Lift inspections 3,850
CARB Portable equip registration program 620
DEH unified program facility permit 2,700
521012 Contract Maintenance Services 225,302 225,302 225,302
Crane inspection and certification 1,120
Diesel retrofit filter cleaning 1,710
Fire apparatus repairs 144,000
Hazardous material disposal 8,000
Mower maintenance 6,000
Repairs (hoist/lifts & fuel island) 3,000
Small equipment inventory vending 16,000
Small equipment maintenance 20,000
Fire extinguisher service 2,200
Towing services 1,000
Turf truckster maintenance 7,272
Heavy equipment repair 15,000
521023 Uniform Rental & Maintenance Services 4,015 4,015 4,015
521024 Vehicle Rental & Maintenance Services 88,536 88,536 88,536
531005 Fuel & Lubricants 785,604 785,604 785,604
City fuel (includes Fire Dept.) 242,800
Other agency fuel 519,920
Underground storage tank fees 6,209
Diesel fuel tax fees 5,375
APCD vapor recovery test 1,100
Oils & lubricants 10,200
58
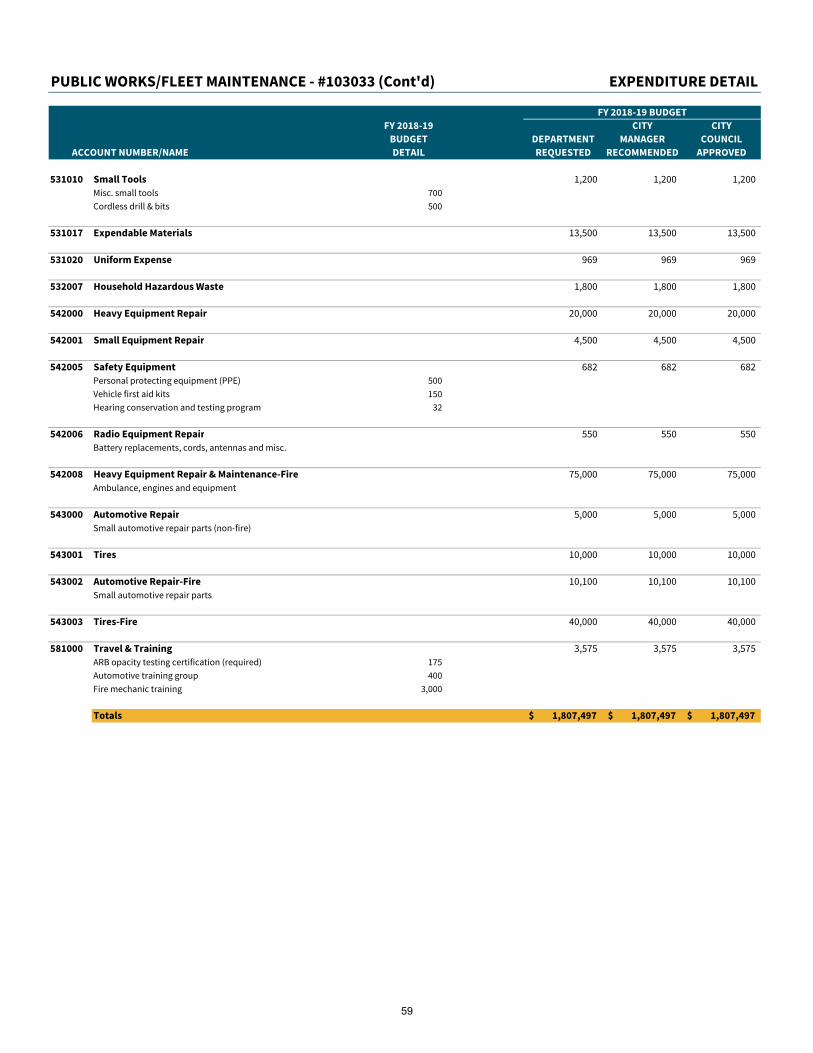
PUBLIC WORKS/FLEET MAINTENANCE - #103033 (Cont'd) EXPENDITURE DETAIL
FY 2018-19 BUDGET
FY 2018-19 CITY CITY
BUDGET DEPARTMENT MANAGER COUNCIL
ACCOUNT NUMBER/NAME DETAIL REQUESTED RECOMMENDED APPROVED
531010 Small Tools 1,200 1,200 1,200
Misc. small tools 700
Cordless drill & bits 500
531017 Expendable Materials 13,500 13,500 13,500
531020 Uniform Expense 969 969 969
532007 Household Hazardous Waste 1,800 1,800 1,800
542000 Heavy Equipment Repair 20,000 20,000 20,000
542001 Small Equipment Repair 4,500 4,500 4,500
542005 Safety Equipment 682 682 682
Personal protecting equipment (PPE) 500
Vehicle first aid kits 150
Hearing conservation and testing program 32
542006 Radio Equipment Repair 550 550 550
Battery replacements, cords, antennas and misc.
542008 Heavy Equipment Repair & Maintenance-Fire 75,000 75,000 75,000
Ambulance, engines and equipment
543000 Automotive Repair 5,000 5,000 5,000
Small automotive repair parts (non-fire)
543001 Tires 10,000 10,000 10,000
543002 Automotive Repair-Fire 10,100 10,100 10,100
Small automotive repair parts
543003 Tires-Fire 40,000 40,000 40,000
581000 Travel & Training 3,575 3,575 3,575
ARB opacity testing certification (required) 175
Automotive training group 400
Fire mechanic training 3,000
Totals 1,807,497$ 1,807,497$ 1,807,497$
59
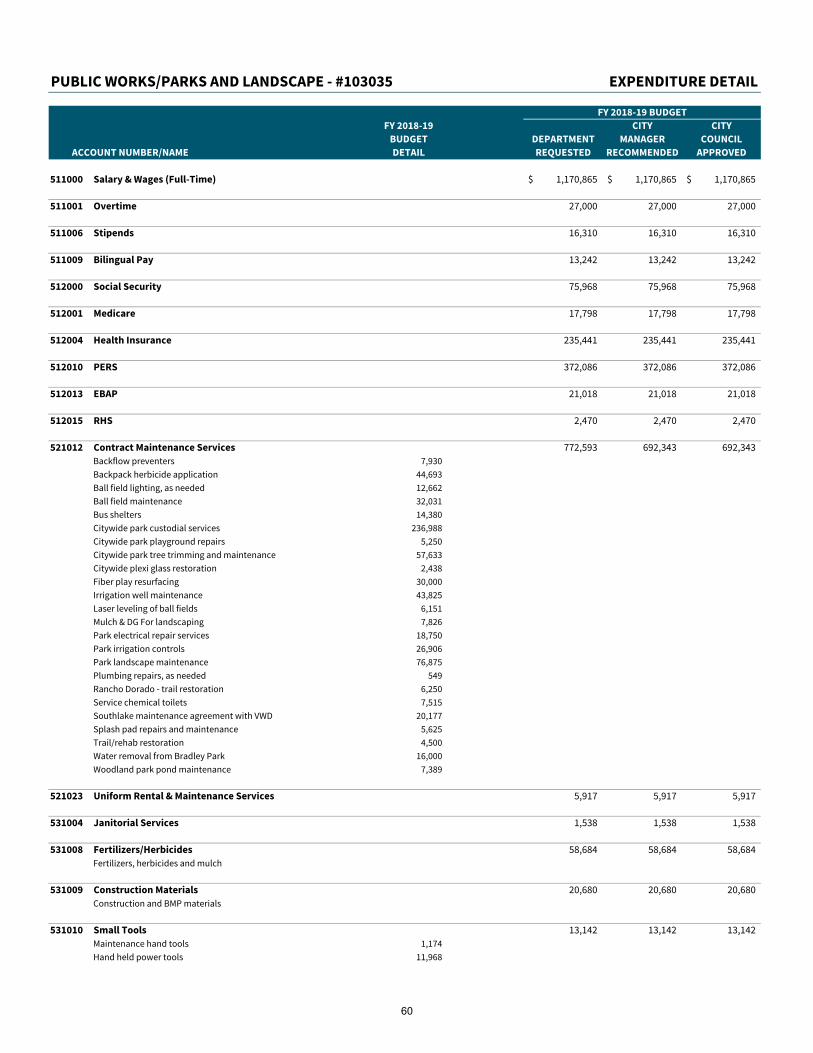
PUBLIC WORKS/PARKS AND LANDSCAPE - #103035 EXPENDITURE DETAIL
FY 2018-19 BUDGET
FY 2018-19 CITY CITY
BUDGET DEPARTMENT MANAGER COUNCIL
ACCOUNT NUMBER/NAME DETAIL REQUESTED RECOMMENDED APPROVED
511000 Salary & Wages (Full-Time) 1,170,865$ 1,170,865$ 1,170,865$
511001 Overtime 27,000 27,000 27,000
511006 Stipends 16,310 16,310 16,310
511009 Bilingual Pay 13,242 13,242 13,242
512000 Social Security 75,968 75,968 75,968
512001 Medicare 17,798 17,798 17,798
512004 Health Insurance 235,441 235,441 235,441
512010 PERS 372,086 372,086 372,086
512013 EBAP 21,018 21,018 21,018
512015 RHS 2,470 2,470 2,470
521012 Contract Maintenance Services 772,593 692,343 692,343
Backflow preventers 7,930
Backpack herbicide application 44,693
Ball field lighting, as needed 12,662
Ball field maintenance 32,031
Bus shelters 14,380
Citywide park custodial services 236,988
Citywide park playground repairs 5,250
Citywide park tree trimming and maintenance 57,633
Citywide plexi glass restoration 2,438
Fiber play resurfacing 30,000
Irrigation well maintenance 43,825
Laser leveling of ball fields 6,151
Mulch & DG For landscaping 7,826
Park electrical repair services 18,750
Park irrigation controls 26,906
Park landscape maintenance 76,875
Plumbing repairs, as needed 549
Rancho Dorado - trail restoration 6,250
Service chemical toilets 7,515
Southlake maintenance agreement with VWD 20,177
Splash pad repairs and maintenance 5,625
Trail/rehab restoration 4,500
Water removal from Bradley Park 16,000
Woodland park pond maintenance 7,389
521023 Uniform Rental & Maintenance Services 5,917 5,917 5,917
531004 Janitorial Services 1,538 1,538 1,538
531008 Fertilizers/Herbicides 58,684 58,684 58,684
Fertilizers, herbicides and mulch
531009 Construction Materials 20,680 20,680 20,680
Construction and BMP materials
531010 Small Tools 13,142 13,142 13,142
Maintenance hand tools 1,174
Hand held power tools 11,968
60
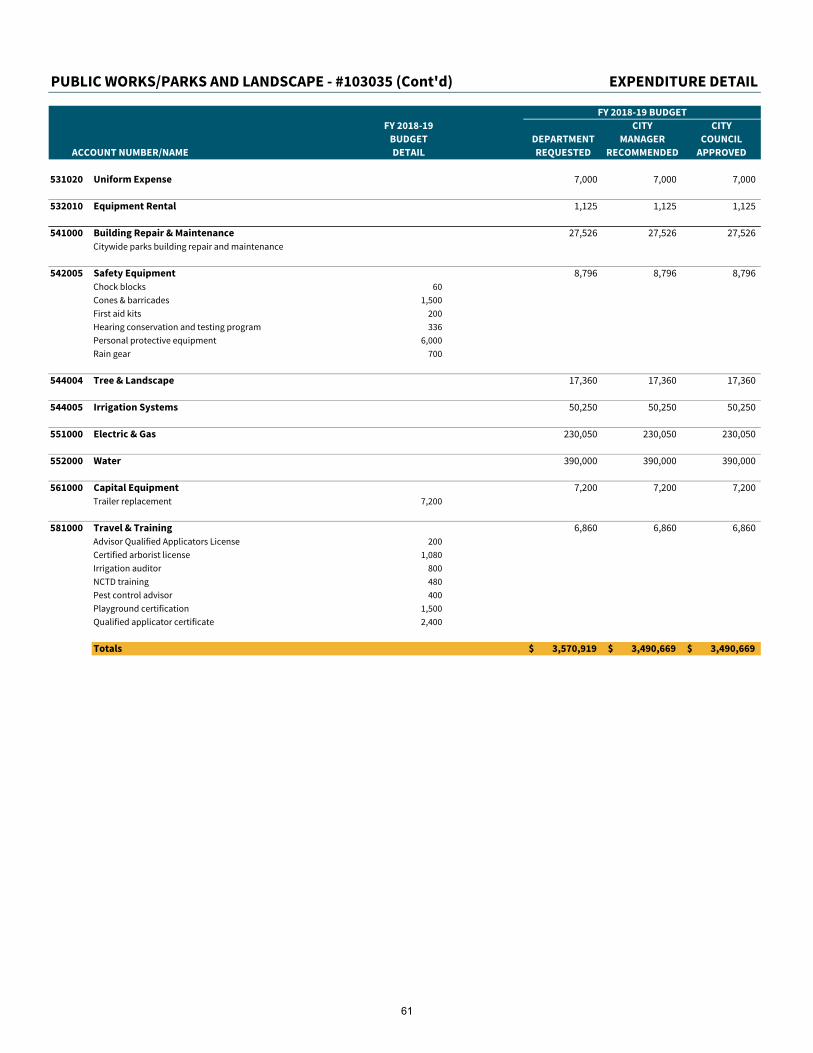
PUBLIC WORKS/PARKS AND LANDSCAPE - #103035 (Cont'd) EXPENDITURE DETAIL
FY 2018-19 BUDGET
FY 2018-19 CITY CITY
BUDGET DEPARTMENT MANAGER COUNCIL
ACCOUNT NUMBER/NAME DETAIL REQUESTED RECOMMENDED APPROVED
531020 Uniform Expense 7,000 7,000 7,000
532010 Equipment Rental 1,125 1,125 1,125
541000 Building Repair & Maintenance 27,526 27,526 27,526
Citywide parks building repair and maintenance
542005 Safety Equipment 8,796 8,796 8,796
Chock blocks 60
Cones & barricades 1,500
First aid kits 200
Hearing conservation and testing program 336
Personal protective equipment 6,000
Rain gear 700
544004 Tree & Landscape 17,360 17,360 17,360
544005 Irrigation Systems 50,250 50,250 50,250
551000 Electric & Gas 230,050 230,050 230,050
552000 Water 390,000 390,000 390,000
561000 Capital Equipment 7,200 7,200 7,200
Trailer replacement 7,200
581000 Travel & Training 6,860 6,860 6,860
Advisor Qualified Applicators License 200
Certified arborist license 1,080
Irrigation auditor 800
NCTD training 480
Pest control advisor 400
Playground certification 1,500
Qualified applicator certificate 2,400
Totals 3,570,919$ 3,490,669$ 3,490,669$
61
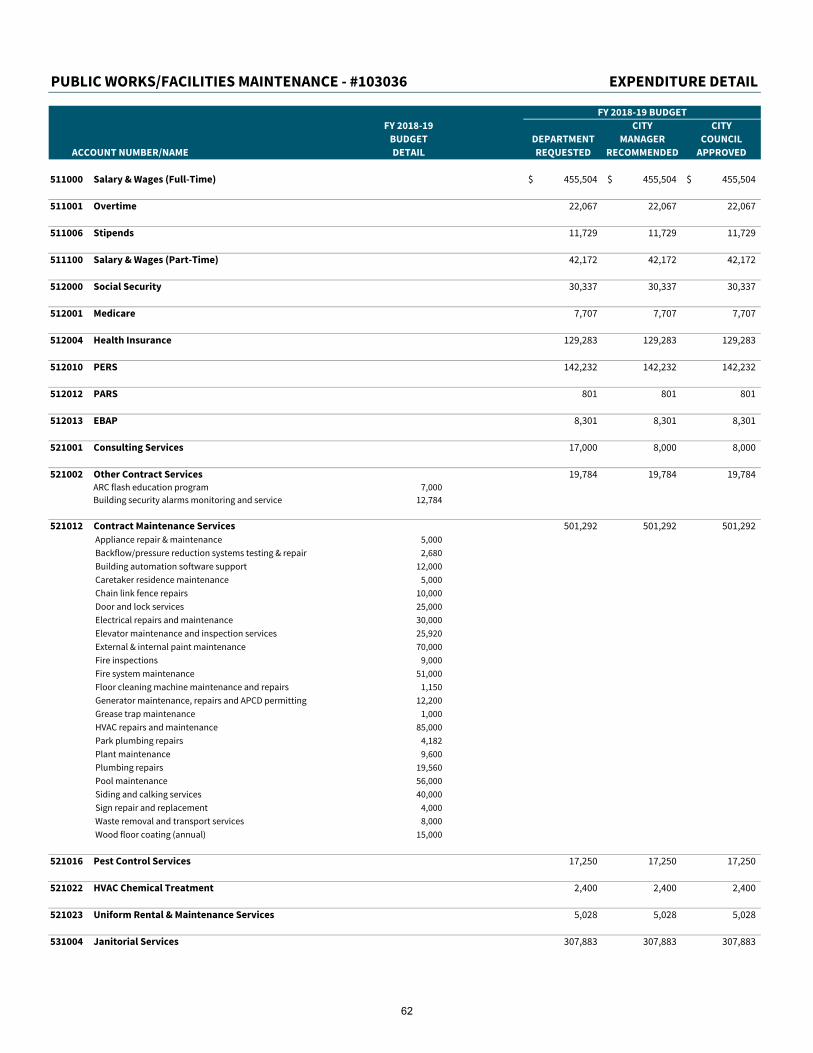
PUBLIC WORKS/FACILITIES MAINTENANCE - #103036 EXPENDITURE DETAIL
FY 2018-19 BUDGET
FY 2018-19 CITY CITY
BUDGET DEPARTMENT MANAGER COUNCIL
ACCOUNT NUMBER/NAME DETAIL REQUESTED RECOMMENDED APPROVED
511000 Salary & Wages (Full-Time) 455,504$ 455,504$ 455,504$
511001 Overtime 22,067 22,067 22,067
511006 Stipends 11,729 11,729 11,729
511100 Salary & Wages (Part-Time) 42,172 42,172 42,172
512000 Social Security 30,337 30,337 30,337
512001 Medicare 7,707 7,707 7,707
512004 Health Insurance 129,283 129,283 129,283
512010 PERS 142,232 142,232 142,232
512012 PARS 801 801 801
512013 EBAP 8,301 8,301 8,301
521001 Consulting Services 17,000 8,000 8,000
521002 Other Contract Services 19,784 19,784 19,784 ARC flash education program 7,000
Building security alarms monitoring and service 12,784
521012 Contract Maintenance Services 501,292 501,292 501,292
Appliance repair & maintenance 5,000
Backflow/pressure reduction systems testing & repair 2,680
Building automation software support 12,000
Caretaker residence maintenance 5,000
Chain link fence repairs 10,000
Door and lock services 25,000
Electrical repairs and maintenance 30,000
Elevator maintenance and inspection services 25,920
External & internal paint maintenance 70,000
Fire inspections 9,000
Fire system maintenance 51,000
Floor cleaning machine maintenance and repairs 1,150
Generator maintenance, repairs and APCD permitting 12,200
Grease trap maintenance 1,000
HVAC repairs and maintenance 85,000
Park plumbing repairs 4,182
Plant maintenance 9,600
Plumbing repairs 19,560
Pool maintenance 56,000
Siding and calking services 40,000
Sign repair and replacement 4,000
Waste removal and transport services 8,000
Wood floor coating (annual) 15,000
521016 Pest Control Services 17,250 17,250 17,250
521022 HVAC Chemical Treatment 2,400 2,400 2,400
521023 Uniform Rental & Maintenance Services 5,028 5,028 5,028
531004 Janitorial Services 307,883 307,883 307,883
62
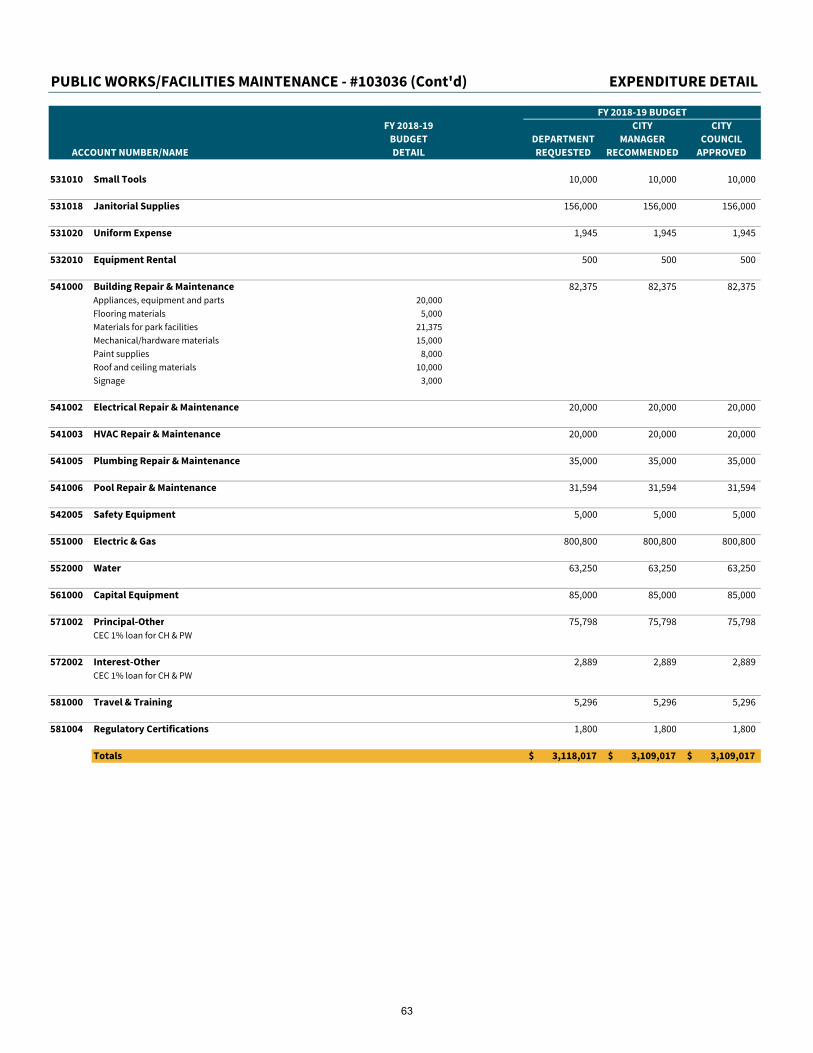
PUBLIC WORKS/FACILITIES MAINTENANCE - #103036 (Cont'd) EXPENDITURE DETAIL
FY 2018-19 BUDGET
FY 2018-19 CITY CITY
BUDGET DEPARTMENT MANAGER COUNCIL
ACCOUNT NUMBER/NAME DETAIL REQUESTED RECOMMENDED APPROVED
531010 Small Tools 10,000 10,000 10,000
531018 Janitorial Supplies 156,000 156,000 156,000
531020 Uniform Expense 1,945 1,945 1,945
532010 Equipment Rental 500 500 500
541000 Building Repair & Maintenance 82,375 82,375 82,375
Appliances, equipment and parts 20,000
Flooring materials 5,000
Materials for park facilities 21,375
Mechanical/hardware materials 15,000
Paint supplies 8,000
Roof and ceiling materials 10,000
Signage 3,000
541002 Electrical Repair & Maintenance 20,000 20,000 20,000
541003 HVAC Repair & Maintenance 20,000 20,000 20,000
541005 Plumbing Repair & Maintenance 35,000 35,000 35,000
541006 Pool Repair & Maintenance 31,594 31,594 31,594
542005 Safety Equipment 5,000 5,000 5,000
551000 Electric & Gas 800,800 800,800 800,800
552000 Water 63,250 63,250 63,250
561000 Capital Equipment 85,000 85,000 85,000
571002 Principal-Other 75,798 75,798 75,798
CEC 1% loan for CH & PW
572002 Interest-Other 2,889 2,889 2,889
CEC 1% loan for CH & PW
581000 Travel & Training 5,296 5,296 5,296
581004 Regulatory Certifications 1,800 1,800 1,800
Totals 3,118,017$ 3,109,017$ 3,109,017$
63
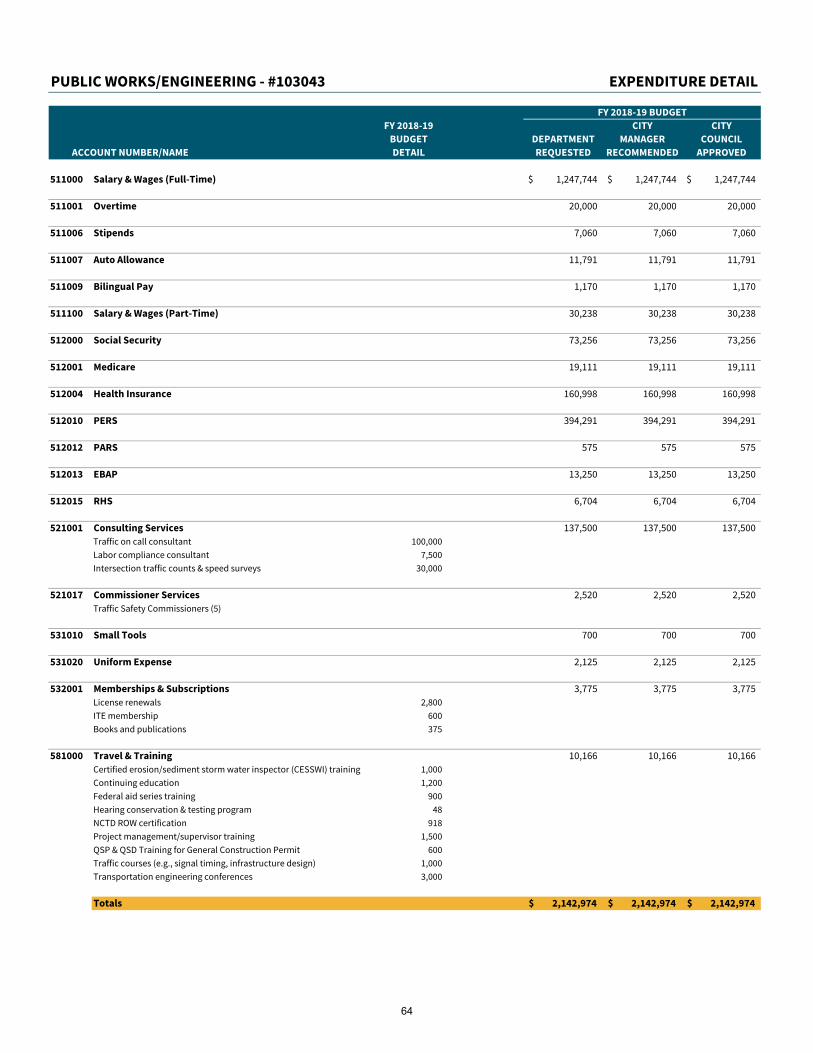
PUBLIC WORKS/ENGINEERING - #103043 EXPENDITURE DETAIL
FY 2018-19 BUDGET
FY 2018-19 CITY CITY
BUDGET DEPARTMENT MANAGER COUNCIL
ACCOUNT NUMBER/NAME DETAIL REQUESTED RECOMMENDED APPROVED
511000 Salary & Wages (Full-Time) 1,247,744$ 1,247,744$ 1,247,744$
511001 Overtime 20,000 20,000 20,000
511006 Stipends 7,060 7,060 7,060
511007 Auto Allowance 11,791 11,791 11,791
511009 Bilingual Pay 1,170 1,170 1,170
511100 Salary & Wages (Part-Time) 30,238 30,238 30,238
512000 Social Security 73,256 73,256 73,256
512001 Medicare 19,111 19,111 19,111
512004 Health Insurance 160,998 160,998 160,998
512010 PERS 394,291 394,291 394,291
512012 PARS 575 575 575
512013 EBAP 13,250 13,250 13,250
512015 RHS 6,704 6,704 6,704
521001 Consulting Services 137,500 137,500 137,500
Traffic on call consultant 100,000
Labor compliance consultant 7,500
Intersection traffic counts & speed surveys 30,000
521017 Commissioner Services 2,520 2,520 2,520
Traffic Safety Commissioners (5)
531010 Small Tools 700 700 700
531020 Uniform Expense 2,125 2,125 2,125
532001 Memberships & Subscriptions 3,775 3,775 3,775
License renewals 2,800
ITE membership 600
Books and publications 375
581000 Travel & Training 10,166 10,166 10,166
Certified erosion/sediment storm water inspector (CESSWI) training 1,000
Continuing education 1,200
Federal aid series training 900
Hearing conservation & testing program 48
NCTD ROW certification 918
Project management/supervisor training 1,500
QSP & QSD Training for General Construction Permit 600
Traffic courses (e.g., signal timing, infrastructure design) 1,000
Transportation engineering conferences 3,000
Totals 2,142,974$ 2,142,974$ 2,142,974$
64
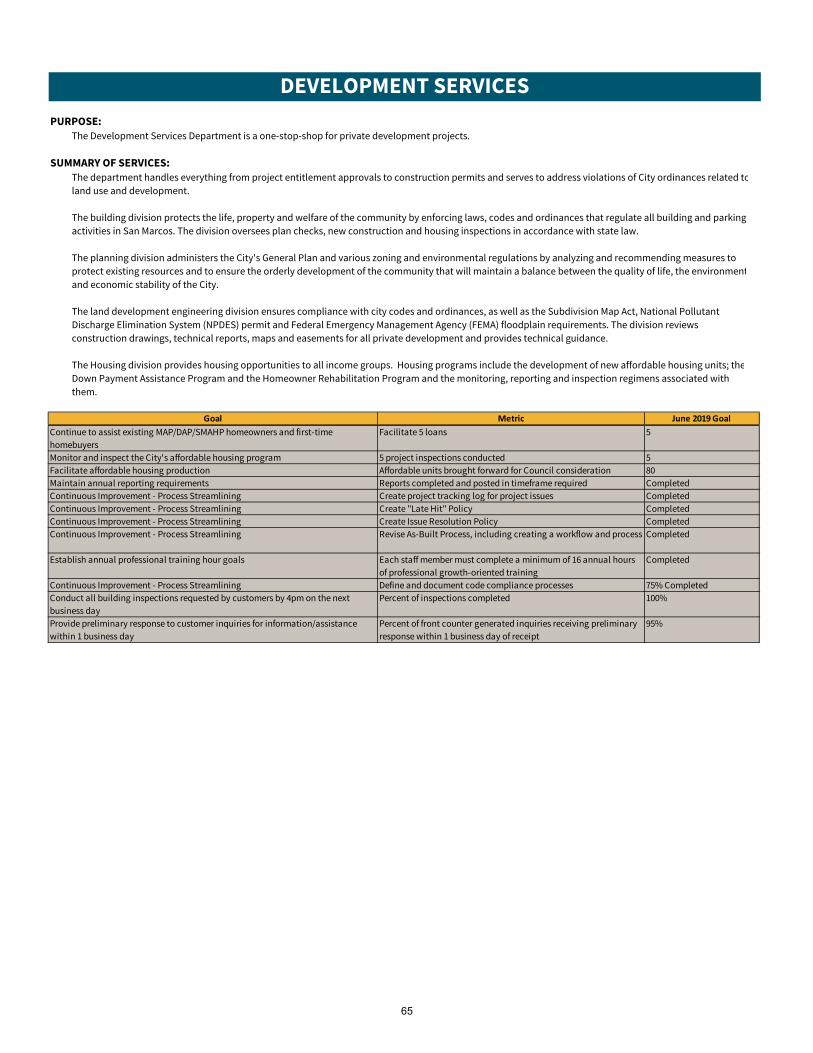
DEVELOPMENT SERVICES
PURPOSE:
The Development Services Department is a one-stop-shop for private development projects.
SUMMARY OF SERVICES:
The department handles everything from project entitlement approvals to construction permits and serves to address violations of City ordinances related to
land use and development.
The building division protects the life, property and welfare of the community by enforcing laws, codes and ordinances that regulate all building and parking
activities in San Marcos. The division oversees plan checks, new construction and housing inspections in accordance with state law.
The planning division administers the City's General Plan and various zoning and environmental regulations by analyzing and recommending measures to
protect existing resources and to ensure the orderly development of the community that will maintain a balance between the quality of life, the environment
and economic stability of the City.
The land development engineering division ensures compliance with city codes and ordinances, as well as the Subdivision Map Act, National Pollutant
Discharge Elimination System (NPDES) permit and Federal Emergency Management Agency (FEMA) floodplain requirements. The division reviews
construction drawings, technical reports, maps and easements for all private development and provides technical guidance.
The Housing division provides housing opportunities to all income groups. Housing programs include the development of new affordable housing units; the
Down Payment Assistance Program and the Homeowner Rehabilitation Program and the monitoring, reporting and inspection regimens associated with
them.
Goal Metric June 2019 Goal
Continue to assist existing MAP/DAP/SMAHP homeowners and first-time
homebuyers
Facilitate 5 loans 5
Monitor and inspect the City's affordable housing program 5 project inspections conducted 5
Facilitate affordable housing production Affordable units brought forward for Council consideration 80
Maintain annual reporting requirements Reports completed and posted in timeframe required Completed
Continuous Improvement - Process Streamlining Create project tracking log for project issues Completed
Continuous Improvement - Process Streamlining Create "Late Hit" Policy Completed
Continuous Improvement - Process Streamlining Create Issue Resolution Policy Completed
Continuous Improvement - Process Streamlining Revise As-Built Process, including creating a workflow and process Completed
Establish annual professional training hour goals Each staff member must complete a minimum of 16 annual hours
of professional growth-oriented training
Completed
Continuous Improvement - Process Streamlining Define and document code compliance processes 75% Completed
Conduct all building inspections requested by customers by 4pm on the next
business day
Percent of inspections completed 100%
Provide preliminary response to customer inquiries for information/assistance
within 1 business day
Percent of front counter generated inquiries receiving preliminary
response within 1 business day of receipt
95%
65
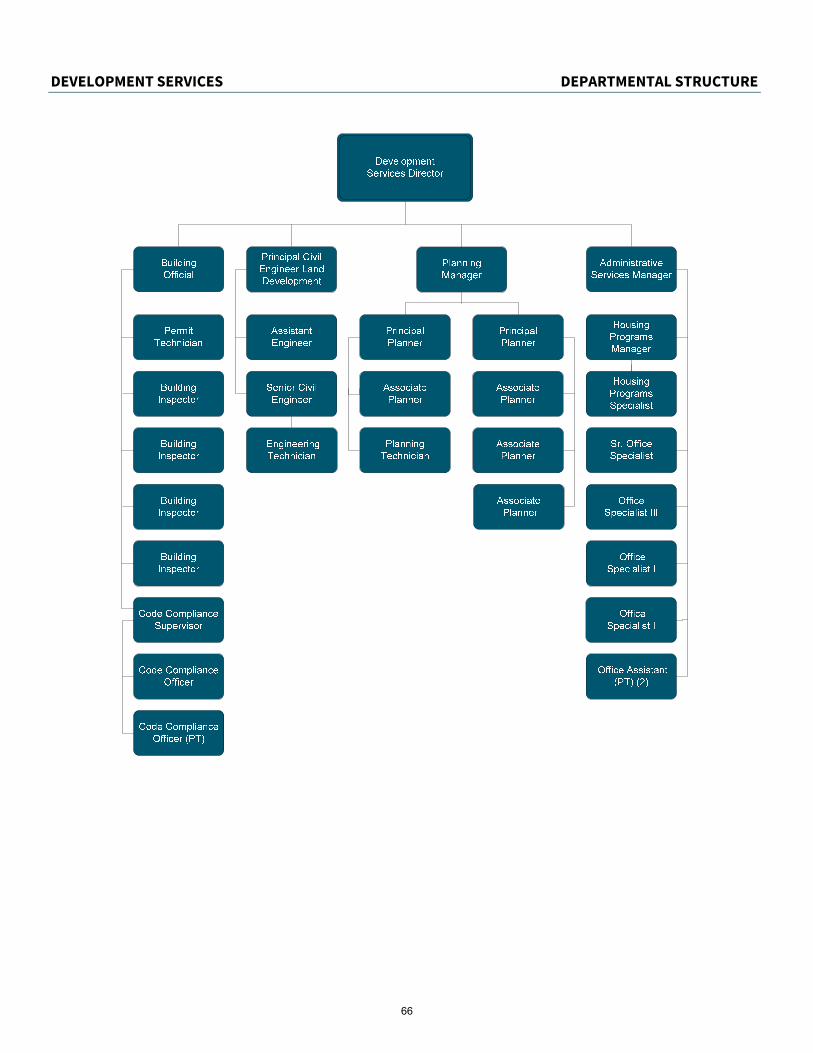
DEVELOPMENT SERVICES DEPARTMENTAL STRUCTURE
NEED
|
66
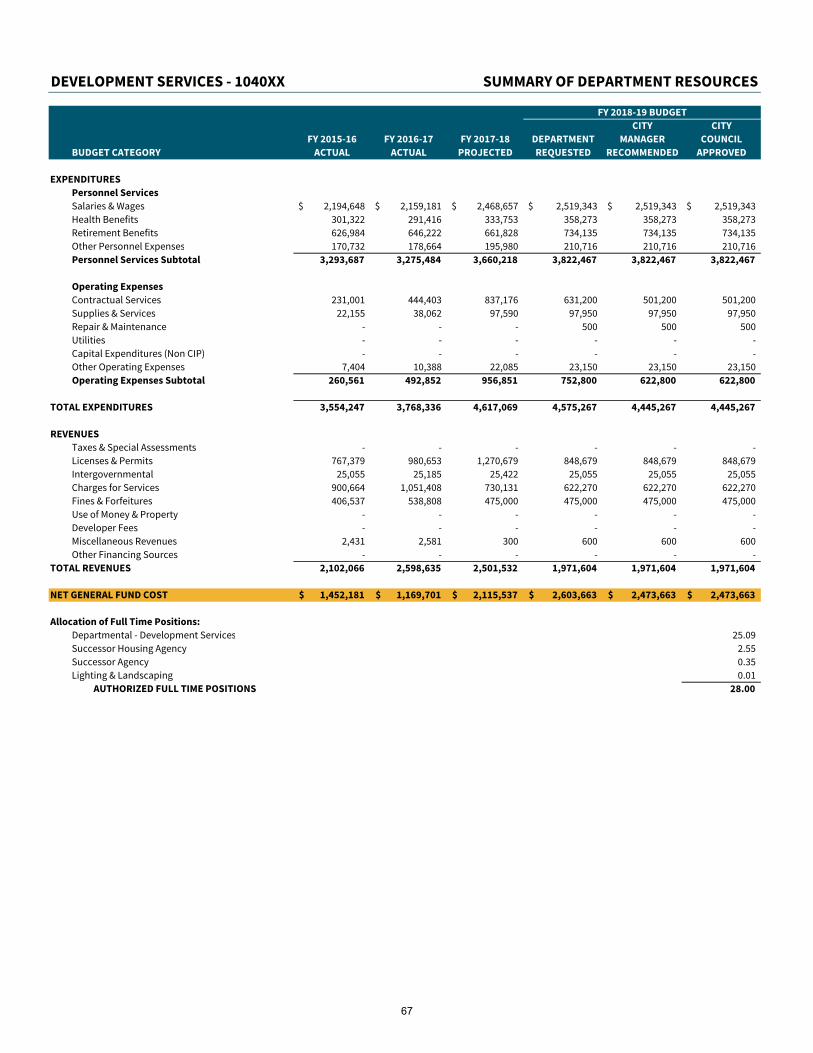
DEVELOPMENT SERVICES - 1040XX SUMMARY OF DEPARTMENT RESOURCES
FY 2018-19 BUDGET
CITY CITY
FY 2015-16 FY 2016-17 FY 2017-18 DEPARTMENT MANAGER COUNCIL
BUDGET CATEGORY ACTUAL ACTUAL PROJECTED REQUESTED RECOMMENDED APPROVED
EXPENDITURES
Personnel Services
Salaries & Wages 2,194,648$ 2,159,181$ 2,468,657$ 2,519,343$ 2,519,343$ 2,519,343$
Health Benefits 301,322 291,416 333,753 358,273 358,273 358,273
Retirement Benefits 626,984 646,222 661,828 734,135 734,135 734,135
Other Personnel Expenses 170,732 178,664 195,980 210,716 210,716 210,716
Personnel Services Subtotal 3,293,687 3,275,484 3,660,218 3,822,467 3,822,467 3,822,467
Operating Expenses
Contractual Services 231,001 444,403 837,176 631,200 501,200 501,200
Supplies & Services 22,155 38,062 97,590 97,950 97,950 97,950
Repair & Maintenance - - - 500 500 500
Utilities - - - - - -
Capital Expenditures (Non CIP) - - - - - -
Other Operating Expenses 7,404 10,388 22,085 23,150 23,150 23,150
Operating Expenses Subtotal 260,561 492,852 956,851 752,800 622,800 622,800
TOTAL EXPENDITURES 3,554,247 3,768,336 4,617,069 4,575,267 4,445,267 4,445,267
REVENUES
Taxes & Special Assessments - - - - - -
Licenses & Permits 767,379 980,653 1,270,679 848,679 848,679 848,679
Intergovernmental 25,055 25,185 25,422 25,055 25,055 25,055
Charges for Services 900,664 1,051,408 730,131 622,270 622,270 622,270
Fines & Forfeitures 406,537 538,808 475,000 475,000 475,000 475,000
Use of Money & Property - - - - - -
Developer Fees - - - - - -
Miscellaneous Revenues 2,431 2,581 300 600 600 600
Other Financing Sources - - - - - -
TOTAL REVENUES 2,102,066 2,598,635 2,501,532 1,971,604 1,971,604 1,971,604
NET GENERAL FUND COST 1,452,181$ 1,169,701$ 2,115,537$ 2,603,663$ 2,473,663$ 2,473,663$
Allocation of Full Time Positions:
Departmental - Development Services 25.09
Successor Housing Agency 2.55
Successor Agency 0.35
Lighting & Landscaping 0.01
AUTHORIZED FULL TIME POSITIONS 28.00
67
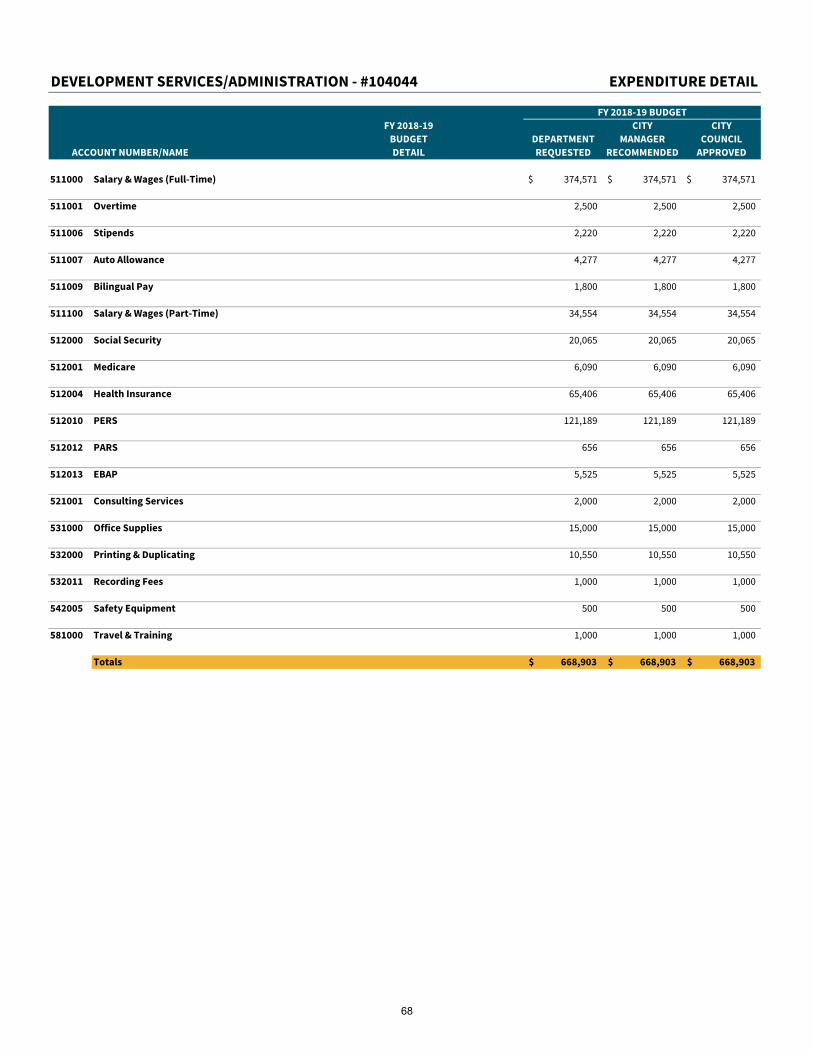
DEVELOPMENT SERVICES/ADMINISTRATION - #104044 EXPENDITURE DETAIL
FY 2018-19 BUDGET
FY 2018-19 CITY CITY
BUDGET DEPARTMENT MANAGER COUNCIL
ACCOUNT NUMBER/NAME DETAIL REQUESTED RECOMMENDED APPROVED
511000 Salary & Wages (Full-Time) 374,571$ 374,571$ 374,571$
511001 Overtime 2,500 2,500 2,500
511006 Stipends 2,220 2,220 2,220
511007 Auto Allowance 4,277 4,277 4,277
511009 Bilingual Pay 1,800 1,800 1,800
511100 Salary & Wages (Part-Time) 34,554 34,554 34,554
512000 Social Security 20,065 20,065 20,065
512001 Medicare 6,090 6,090 6,090
512004 Health Insurance 65,406 65,406 65,406
512010 PERS 121,189 121,189 121,189
512012 PARS 656 656 656
512013 EBAP 5,525 5,525 5,525
521001 Consulting Services 2,000 2,000 2,000
531000 Office Supplies 15,000 15,000 15,000
532000 Printing & Duplicating 10,550 10,550 10,550
532011 Recording Fees 1,000 1,000 1,000
542005 Safety Equipment 500 500 500
581000 Travel & Training 1,000 1,000 1,000
Totals 668,903$ 668,903$ 668,903$
68
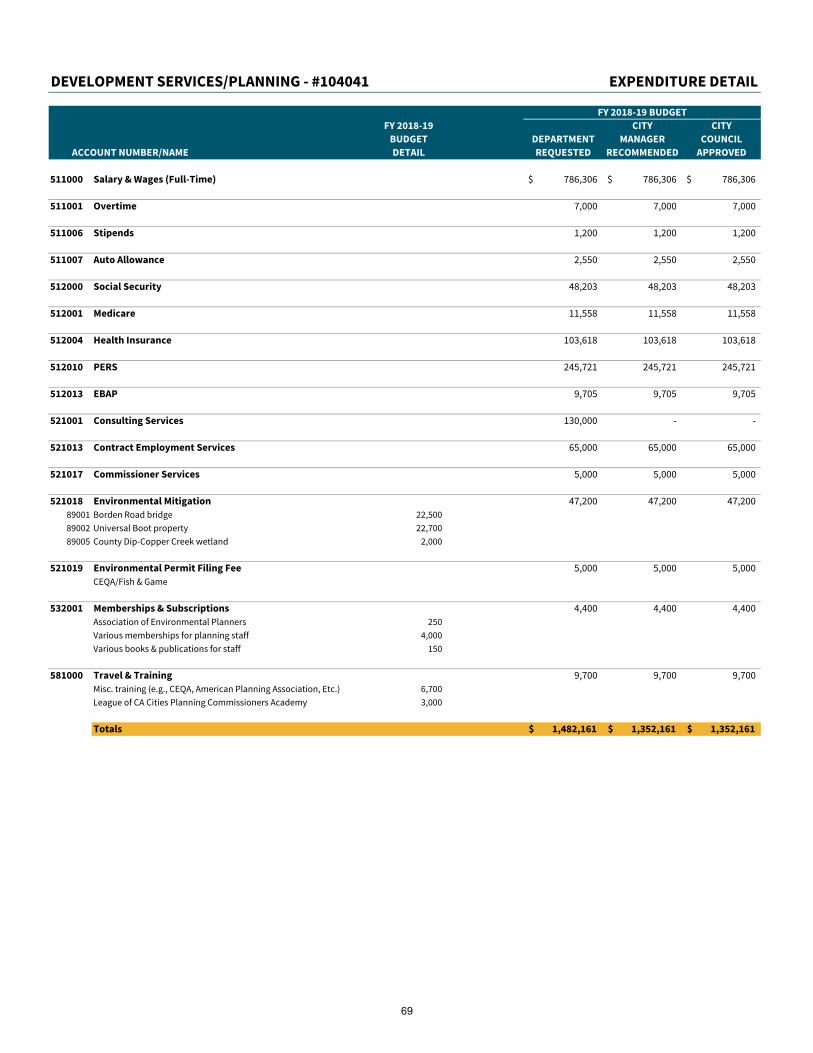
DEVELOPMENT SERVICES/PLANNING - #104041 EXPENDITURE DETAIL
FY 2018-19 BUDGET
FY 2018-19 CITY CITY
BUDGET DEPARTMENT MANAGER COUNCIL
ACCOUNT NUMBER/NAME DETAIL REQUESTED RECOMMENDED APPROVED
511000 Salary & Wages (Full-Time) 786,306$ 786,306$ 786,306$
511001 Overtime 7,000 7,000 7,000
511006 Stipends 1,200 1,200 1,200
511007 Auto Allowance 2,550 2,550 2,550
512000 Social Security 48,203 48,203 48,203
512001 Medicare 11,558 11,558 11,558
512004 Health Insurance 103,618 103,618 103,618
512010 PERS 245,721 245,721 245,721
512013 EBAP 9,705 9,705 9,705
521001 Consulting Services 130,000 - -
521013 Contract Employment Services 65,000 65,000 65,000
521017 Commissioner Services 5,000 5,000 5,000
521018 Environmental Mitigation 47,200 47,200 47,200
89001 Borden Road bridge 22,500
89002 Universal Boot property 22,700
89005 County Dip-Copper Creek wetland 2,000
521019 Environmental Permit Filing Fee 5,000 5,000 5,000
CEQA/Fish & Game
532001 Memberships & Subscriptions 4,400 4,400 4,400
Association of Environmental Planners 250
Various memberships for planning staff 4,000
Various books & publications for staff 150
581000 Travel & Training 9,700 9,700 9,700
Misc. training (e.g., CEQA, American Planning Association, Etc.) 6,700
League of CA Cities Planning Commissioners Academy 3,000
Totals 1,482,161$ 1,352,161$ 1,352,161$
69
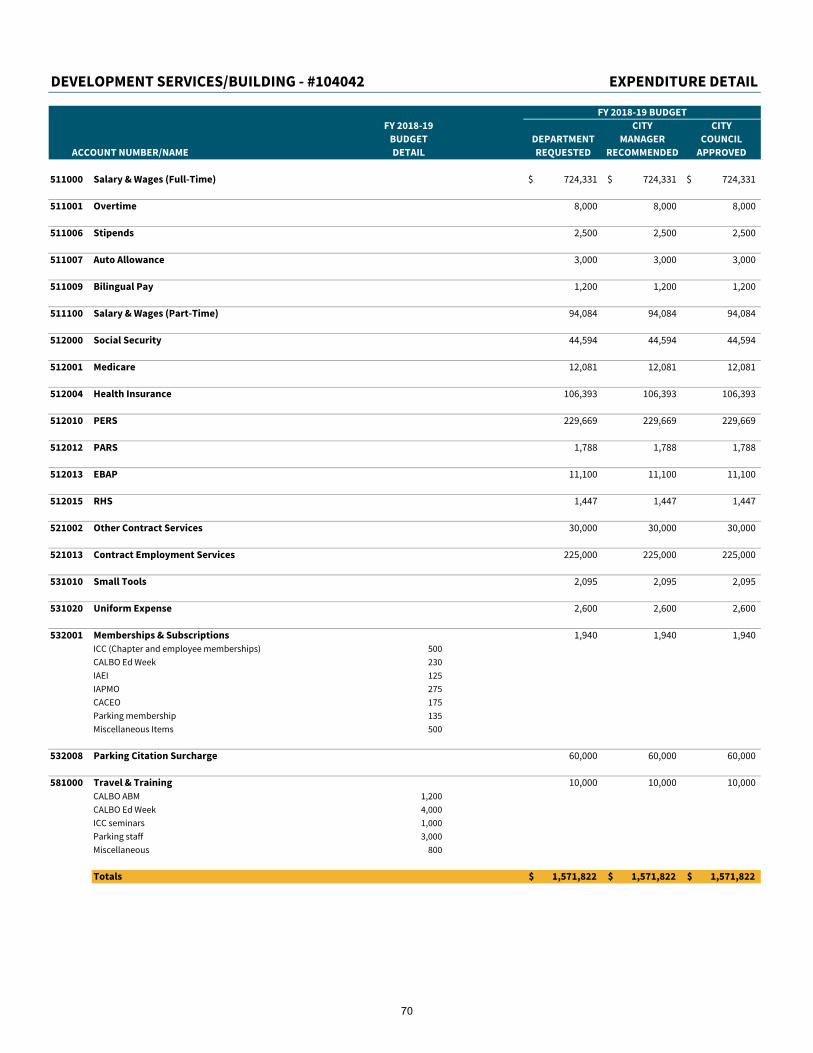
DEVELOPMENT SERVICES/BUILDING - #104042 EXPENDITURE DETAIL
FY 2018-19 BUDGET
FY 2018-19 CITY CITY
BUDGET DEPARTMENT MANAGER COUNCIL
ACCOUNT NUMBER/NAME DETAIL REQUESTED RECOMMENDED APPROVED
511000 Salary & Wages (Full-Time) 724,331$ 724,331$ 724,331$
511001 Overtime 8,000 8,000 8,000
511006 Stipends 2,500 2,500 2,500
511007 Auto Allowance 3,000 3,000 3,000
511009 Bilingual Pay 1,200 1,200 1,200
511100 Salary & Wages (Part-Time) 94,084 94,084 94,084
512000 Social Security 44,594 44,594 44,594
512001 Medicare 12,081 12,081 12,081
512004 Health Insurance 106,393 106,393 106,393
512010 PERS 229,669 229,669 229,669
512012 PARS 1,788 1,788 1,788
512013 EBAP 11,100 11,100 11,100
512015 RHS 1,447 1,447 1,447
521002 Other Contract Services 30,000 30,000 30,000
521013 Contract Employment Services 225,000 225,000 225,000
531010 Small Tools 2,095 2,095 2,095
531020 Uniform Expense 2,600 2,600 2,600
532001 Memberships & Subscriptions 1,940 1,940 1,940
ICC (Chapter and employee memberships) 500
CALBO Ed Week 230
IAEI 125
IAPMO 275
CACEO 175
Parking membership 135
Miscellaneous Items 500
532008 Parking Citation Surcharge 60,000 60,000 60,000
581000 Travel & Training 10,000 10,000 10,000
CALBO ABM 1,200
CALBO Ed Week 4,000
ICC seminars 1,000
Parking staff 3,000
Miscellaneous 800
Totals 1,571,822$ 1,571,822$ 1,571,822$
70
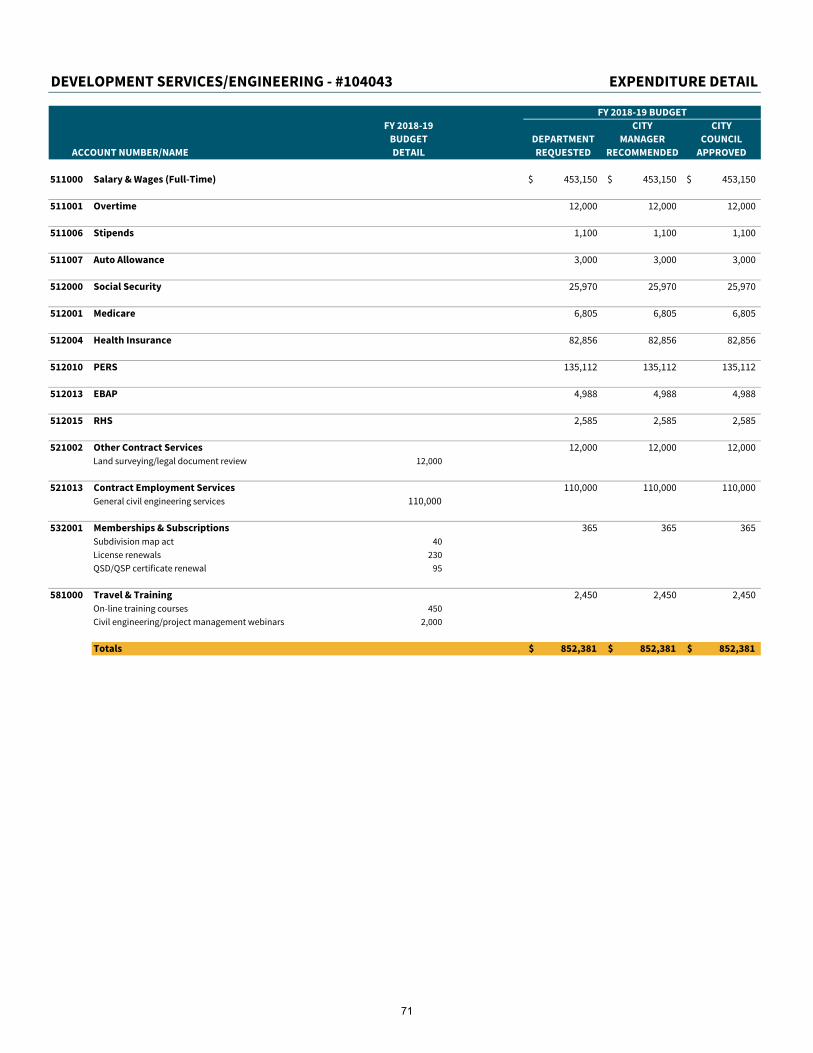
DEVELOPMENT SERVICES/ENGINEERING - #104043 EXPENDITURE DETAIL
FY 2018-19 BUDGET
FY 2018-19 CITY CITY
BUDGET DEPARTMENT MANAGER COUNCIL
ACCOUNT NUMBER/NAME DETAIL REQUESTED RECOMMENDED APPROVED
511000 Salary & Wages (Full-Time) 453,150$ 453,150$ 453,150$
511001 Overtime 12,000 12,000 12,000
511006 Stipends 1,100 1,100 1,100
511007 Auto Allowance 3,000 3,000 3,000
512000 Social Security 25,970 25,970 25,970
512001 Medicare 6,805 6,805 6,805
512004 Health Insurance 82,856 82,856 82,856
512010 PERS 135,112 135,112 135,112
512013 EBAP 4,988 4,988 4,988
512015 RHS 2,585 2,585 2,585
521002 Other Contract Services 12,000 12,000 12,000
Land surveying/legal document review 12,000
521013 Contract Employment Services 110,000 110,000 110,000
General civil engineering services 110,000
532001 Memberships & Subscriptions 365 365 365
Subdivision map act 40
License renewals 230
QSD/QSP certificate renewal 95
581000 Travel & Training 2,450 2,450 2,450
On-line training courses 450
Civil engineering/project management webinars 2,000
Totals 852,381$ 852,381$ 852,381$
71

|
This page intentionally left blank.
72
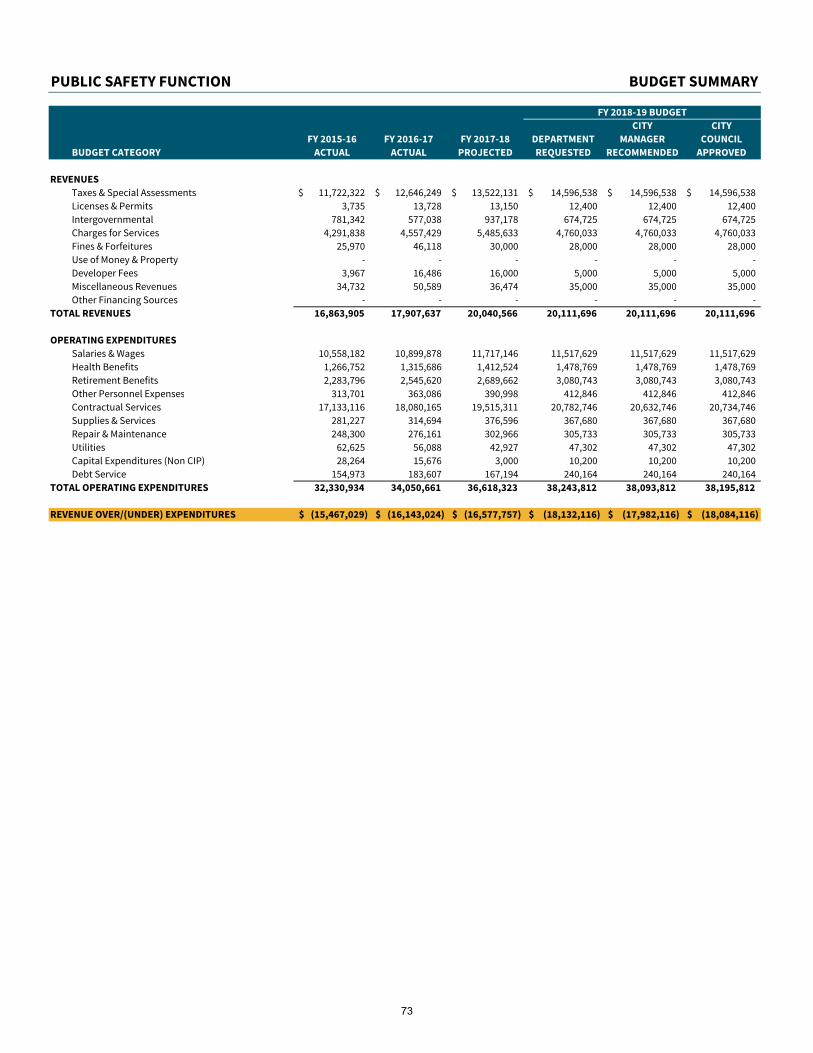
PUBLIC SAFETY FUNCTION BUDGET SUMMARY
FY 2018-19 BUDGET
CITY CITY
FY 2015-16 FY 2016-17 FY 2017-18 DEPARTMENT MANAGER COUNCIL
BUDGET CATEGORY ACTUAL ACTUAL PROJECTED REQUESTED RECOMMENDED APPROVED
REVENUES
Taxes & Special Assessments 11,722,322$ 12,646,249$ 13,522,131$ 14,596,538$ 14,596,538$ 14,596,538$
Licenses & Permits 3,735 13,728 13,150 12,400 12,400 12,400
Intergovernmental 781,342 577,038 937,178 674,725 674,725 674,725
Charges for Services 4,291,838 4,557,429 5,485,633 4,760,033 4,760,033 4,760,033
Fines & Forfeitures 25,970 46,118 30,000 28,000 28,000 28,000
Use of Money & Property - - - - - -
Developer Fees 3,967 16,486 16,000 5,000 5,000 5,000
Miscellaneous Revenues 34,732 50,589 36,474 35,000 35,000 35,000
Other Financing Sources - - - - - -
TOTAL REVENUES 16,863,905 17,907,637 20,040,566 20,111,696 20,111,696 20,111,696
OPERATING EXPENDITURES
Salaries & Wages 10,558,182 10,899,878 11,717,146 11,517,629 11,517,629 11,517,629
Health Benefits 1,266,752 1,315,686 1,412,524 1,478,769 1,478,769 1,478,769
Retirement Benefits 2,283,796 2,545,620 2,689,662 3,080,743 3,080,743 3,080,743
Other Personnel Expenses 313,701 363,086 390,998 412,846 412,846 412,846
Contractual Services 17,133,116 18,080,165 19,515,311 20,782,746 20,632,746 20,734,746
Supplies & Services 281,227 314,694 376,596 367,680 367,680 367,680
Repair & Maintenance 248,300 276,161 302,966 305,733 305,733 305,733
Utilities 62,625 56,088 42,927 47,302 47,302 47,302
Capital Expenditures (Non CIP) 28,264 15,676 3,000 10,200 10,200 10,200
Debt Service 154,973 183,607 167,194 240,164 240,164 240,164
TOTAL OPERATING EXPENDITURES 32,330,934 34,050,661 36,618,323 38,243,812 38,093,812 38,195,812
REVENUE OVER/(UNDER) EXPENDITURES (15,467,029)$ (16,143,024)$ (16,577,757)$ (18,132,116)$ (17,982,116)$ (18,084,116)$
73

|
This page intentionally left blank.
74
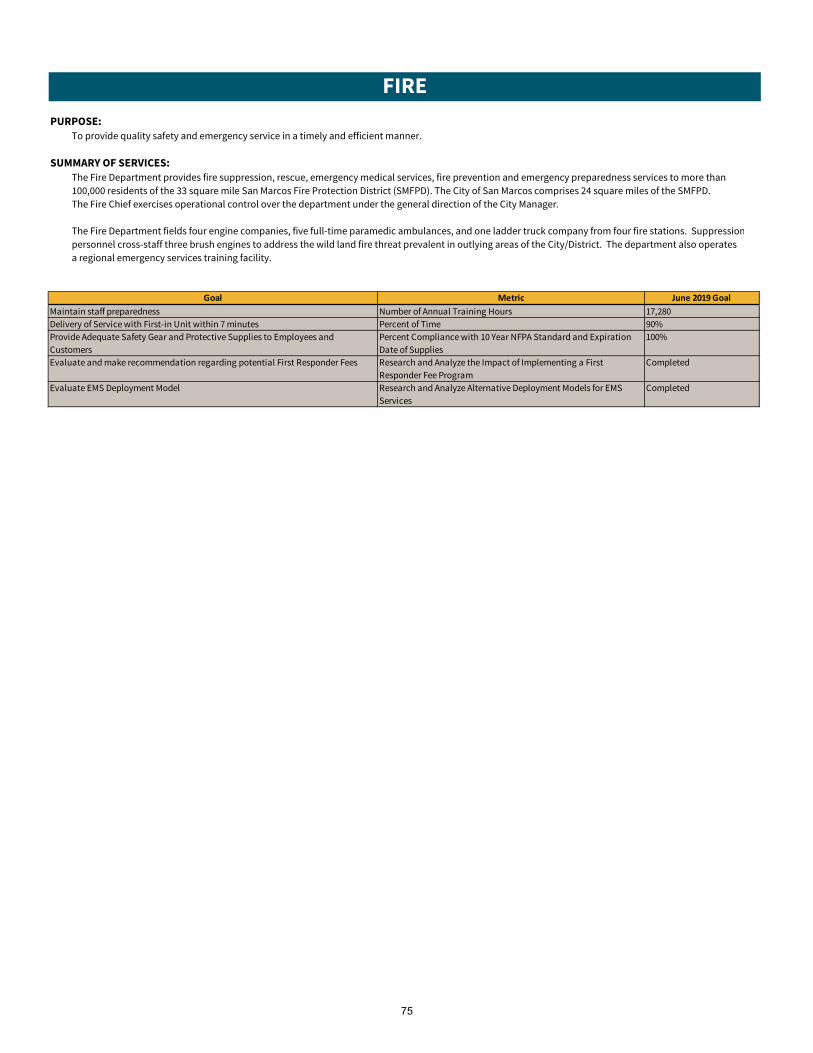
FIRE
PURPOSE:
To provide quality safety and emergency service in a timely and efficient manner.
SUMMARY OF SERVICES:
The Fire Department provides fire suppression, rescue, emergency medical services, fire prevention and emergency preparedness services to more than
100,000 residents of the 33 square mile San Marcos Fire Protection District (SMFPD). The City of San Marcos comprises 24 square miles of the SMFPD.
The Fire Chief exercises operational control over the department under the general direction of the City Manager.
The Fire Department fields four engine companies, five full-time paramedic ambulances, and one ladder truck company from four fire stations. Suppression
personnel cross-staff three brush engines to address the wild land fire threat prevalent in outlying areas of the City/District. The department also operates
a regional emergency services training facility.
Goal Metric June 2019 Goal
Maintain staff preparedness Number of Annual Training Hours 17,280
Delivery of Service with First-in Unit within 7 minutes Percent of Time 90%
Provide Adequate Safety Gear and Protective Supplies to Employees and
Customers
Percent Compliance with 10 Year NFPA Standard and Expiration
Date of Supplies
100%
Evaluate and make recommendation regarding potential First Responder Fees Research and Analyze the Impact of Implementing a First
Responder Fee Program
Completed
Evaluate EMS Deployment Model Research and Analyze Alternative Deployment Models for EMS
Services
Completed
75
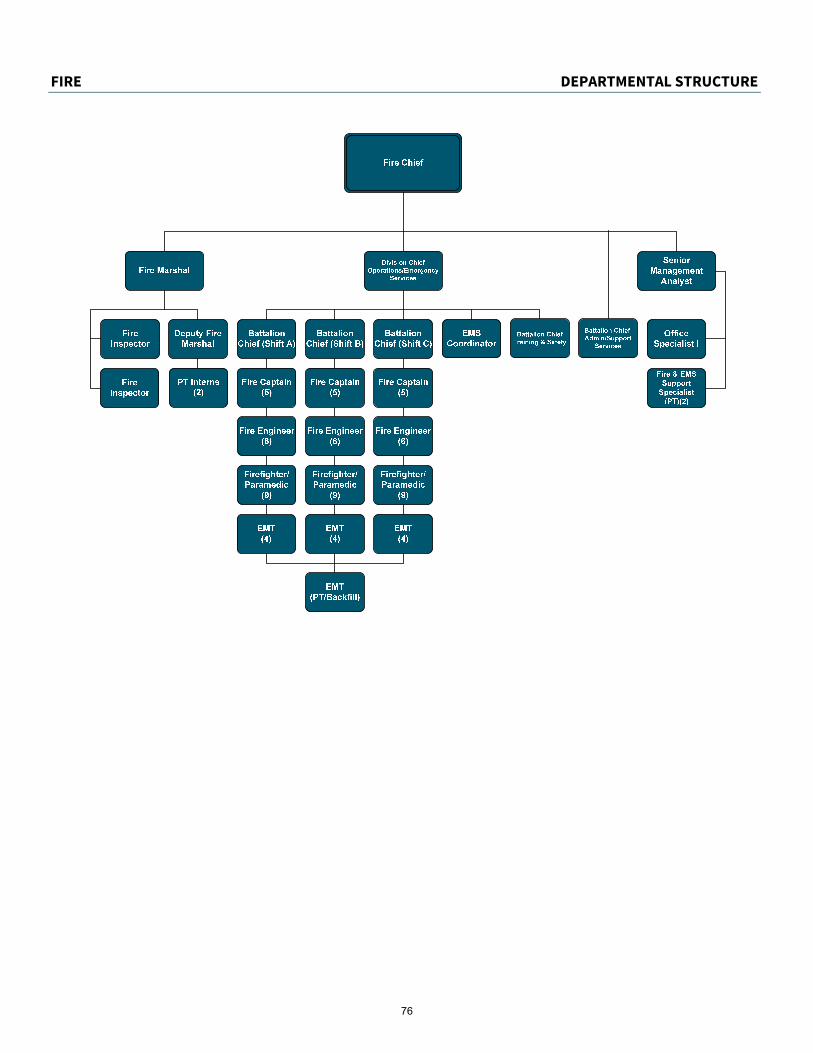
FIRE DEPARTMENTAL STRUCTURE
NEED
|
76
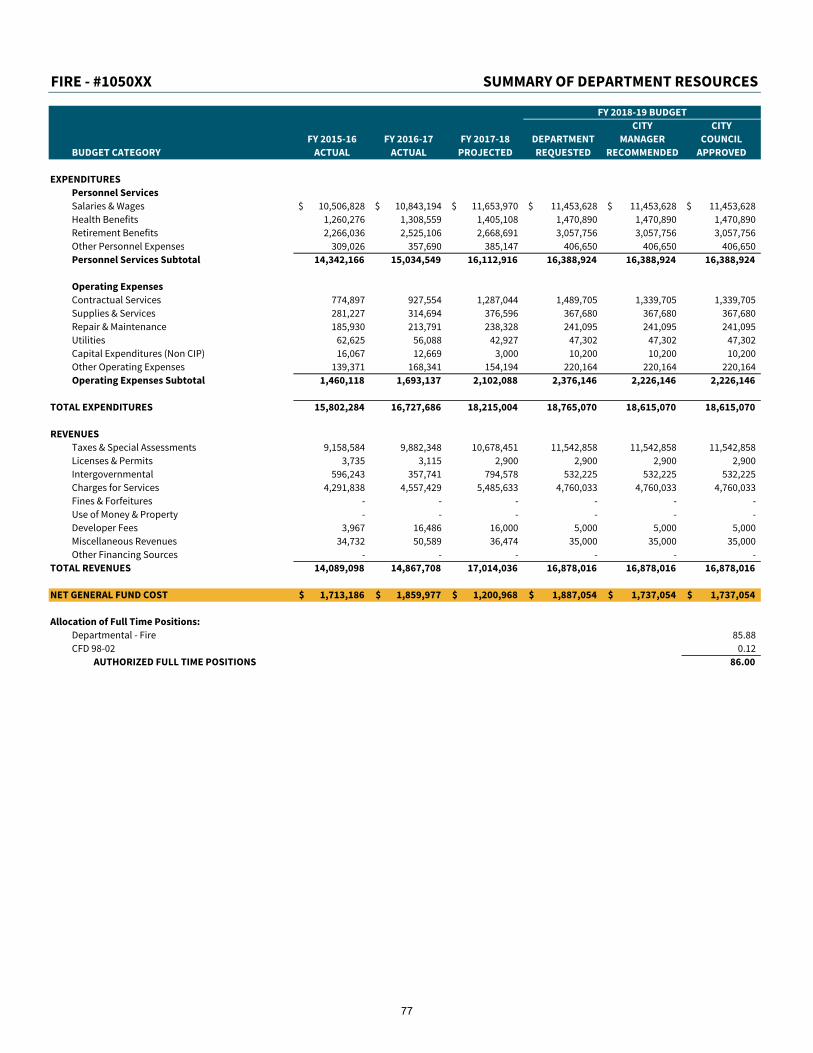
FIRE - #1050XX SUMMARY OF DEPARTMENT RESOURCES
FY 2018-19 BUDGET
CITY CITY
FY 2015-16 FY 2016-17 FY 2017-18 DEPARTMENT MANAGER COUNCIL
BUDGET CATEGORY ACTUAL ACTUAL PROJECTED REQUESTED RECOMMENDED APPROVED
EXPENDITURES
Personnel Services
Salaries & Wages 10,506,828$ 10,843,194$ 11,653,970$ 11,453,628$ 11,453,628$ 11,453,628$
Health Benefits 1,260,276 1,308,559 1,405,108 1,470,890 1,470,890 1,470,890
Retirement Benefits 2,266,036 2,525,106 2,668,691 3,057,756 3,057,756 3,057,756
Other Personnel Expenses 309,026 357,690 385,147 406,650 406,650 406,650
Personnel Services Subtotal 14,342,166 15,034,549 16,112,916 16,388,924 16,388,924 16,388,924
Operating Expenses
Contractual Services 774,897 927,554 1,287,044 1,489,705 1,339,705 1,339,705
Supplies & Services 281,227 314,694 376,596 367,680 367,680 367,680
Repair & Maintenance 185,930 213,791 238,328 241,095 241,095 241,095
Utilities 62,625 56,088 42,927 47,302 47,302 47,302
Capital Expenditures (Non CIP) 16,067 12,669 3,000 10,200 10,200 10,200
Other Operating Expenses 139,371 168,341 154,194 220,164 220,164 220,164
Operating Expenses Subtotal 1,460,118 1,693,137 2,102,088 2,376,146 2,226,146 2,226,146
TOTAL EXPENDITURES 15,802,284 16,727,686 18,215,004 18,765,070 18,615,070 18,615,070
REVENUES
Taxes & Special Assessments 9,158,584 9,882,348 10,678,451 11,542,858 11,542,858 11,542,858
Licenses & Permits 3,735 3,115 2,900 2,900 2,900 2,900
Intergovernmental 596,243 357,741 794,578 532,225 532,225 532,225
Charges for Services 4,291,838 4,557,429 5,485,633 4,760,033 4,760,033 4,760,033
Fines & Forfeitures - - - - - -
Use of Money & Property - - - - - -
Developer Fees 3,967 16,486 16,000 5,000 5,000 5,000
Miscellaneous Revenues 34,732 50,589 36,474 35,000 35,000 35,000
Other Financing Sources - - - - - -
TOTAL REVENUES 14,089,098 14,867,708 17,014,036 16,878,016 16,878,016 16,878,016
NET GENERAL FUND COST 1,713,186$ 1,859,977$ 1,200,968$ 1,887,054$ 1,737,054$ 1,737,054$
Allocation of Full Time Positions:
Departmental - Fire 85.88
CFD 98-02 0.12
AUTHORIZED FULL TIME POSITIONS 86.00
77
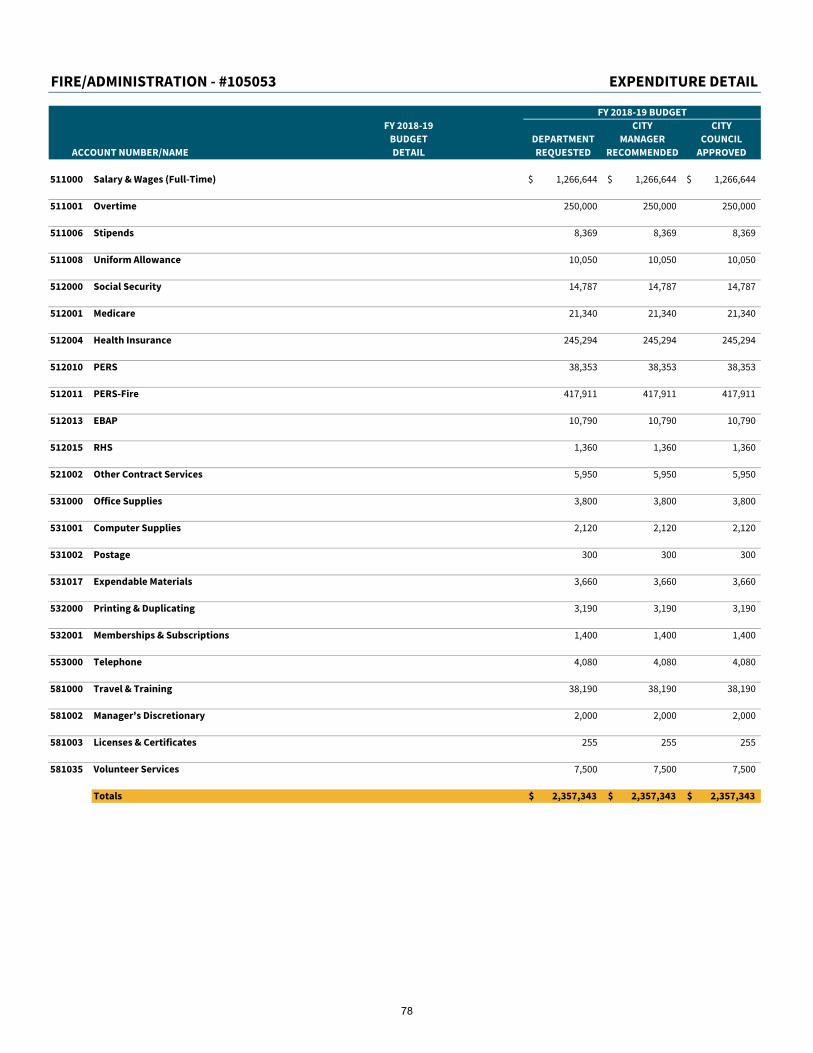
FIRE/ADMINISTRATION - #105053 EXPENDITURE DETAIL
FY 2018-19 BUDGET
FY 2018-19 CITY CITY
BUDGET DEPARTMENT MANAGER COUNCIL
ACCOUNT NUMBER/NAME DETAIL REQUESTED RECOMMENDED APPROVED
511000 Salary & Wages (Full-Time) 1,266,644$ 1,266,644$ 1,266,644$
511001 Overtime 250,000 250,000 250,000
511006 Stipends 8,369 8,369 8,369
511008 Uniform Allowance 10,050 10,050 10,050
512000 Social Security 14,787 14,787 14,787
512001 Medicare 21,340 21,340 21,340
512004 Health Insurance 245,294 245,294 245,294
512010 PERS 38,353 38,353 38,353
512011 PERS-Fire 417,911 417,911 417,911
512013 EBAP 10,790 10,790 10,790
512015 RHS 1,360 1,360 1,360
521002 Other Contract Services 5,950 5,950 5,950
531000 Office Supplies 3,800 3,800 3,800
531001 Computer Supplies 2,120 2,120 2,120
531002 Postage 300 300 300
531017 Expendable Materials 3,660 3,660 3,660
532000 Printing & Duplicating 3,190 3,190 3,190
532001 Memberships & Subscriptions 1,400 1,400 1,400
553000 Telephone 4,080 4,080 4,080
581000 Travel & Training 38,190 38,190 38,190
581002 Manager's Discretionary 2,000 2,000 2,000
581003 Licenses & Certificates 255 255 255
581035 Volunteer Services 7,500 7,500 7,500
Totals 2,357,343$ 2,357,343$ 2,357,343$
78
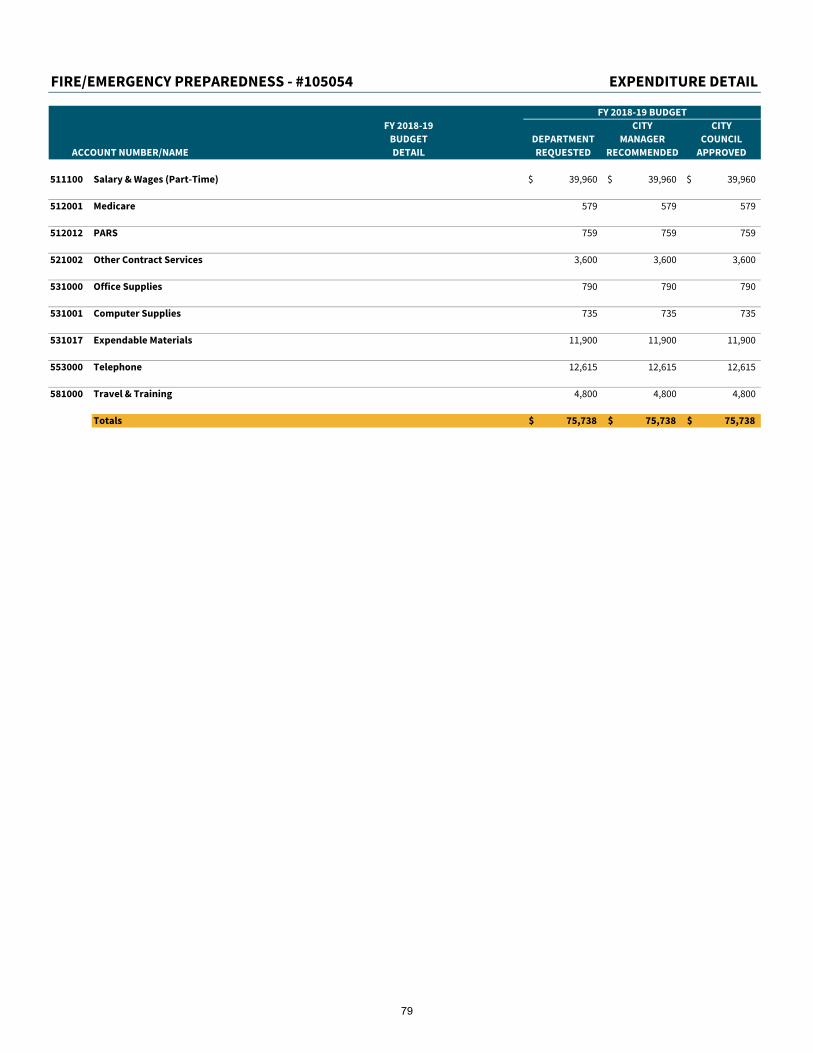
FIRE/EMERGENCY PREPAREDNESS - #105054 EXPENDITURE DETAIL
FY 2018-19 BUDGET
FY 2018-19 CITY CITY
BUDGET DEPARTMENT MANAGER COUNCIL
ACCOUNT NUMBER/NAME DETAIL REQUESTED RECOMMENDED APPROVED
511100 Salary & Wages (Part-Time) 39,960$ 39,960$ 39,960$
512001 Medicare 579 579 579
512012 PARS 759 759 759
521002 Other Contract Services 3,600 3,600 3,600
531000 Office Supplies 790 790 790
531001 Computer Supplies 735 735 735
531017 Expendable Materials 11,900 11,900 11,900
553000 Telephone 12,615 12,615 12,615
581000 Travel & Training 4,800 4,800 4,800
Totals 75,738$ 75,738$ 75,738$
79
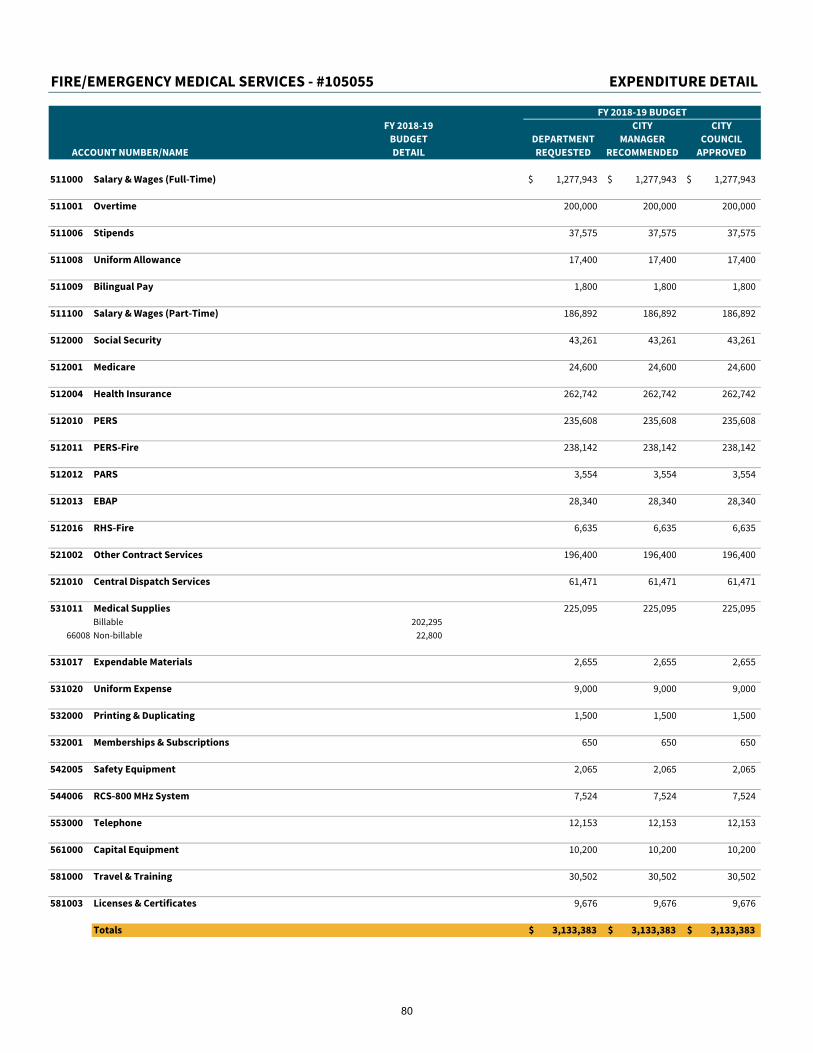
FIRE/EMERGENCY MEDICAL SERVICES - #105055 EXPENDITURE DETAIL
FY 2018-19 BUDGET
FY 2018-19 CITY CITY
BUDGET DEPARTMENT MANAGER COUNCIL
ACCOUNT NUMBER/NAME DETAIL REQUESTED RECOMMENDED APPROVED
511000 Salary & Wages (Full-Time) 1,277,943$ 1,277,943$ 1,277,943$
511001 Overtime 200,000 200,000 200,000
511006 Stipends 37,575 37,575 37,575
511008 Uniform Allowance 17,400 17,400 17,400
511009 Bilingual Pay 1,800 1,800 1,800
511100 Salary & Wages (Part-Time) 186,892 186,892 186,892
512000 Social Security 43,261 43,261 43,261
512001 Medicare 24,600 24,600 24,600
512004 Health Insurance 262,742 262,742 262,742
512010 PERS 235,608 235,608 235,608
512011 PERS-Fire 238,142 238,142 238,142
512012 PARS 3,554 3,554 3,554
512013 EBAP 28,340 28,340 28,340
512016 RHS-Fire 6,635 6,635 6,635
521002 Other Contract Services 196,400 196,400 196,400
521010 Central Dispatch Services 61,471 61,471 61,471
531011 Medical Supplies 225,095 225,095 225,095
Billable 202,295
66008 Non-billable 22,800
531017 Expendable Materials 2,655 2,655 2,655
531020 Uniform Expense 9,000 9,000 9,000
532000 Printing & Duplicating 1,500 1,500 1,500
532001 Memberships & Subscriptions 650 650 650
542005 Safety Equipment 2,065 2,065 2,065
544006 RCS-800 MHz System 7,524 7,524 7,524
553000 Telephone 12,153 12,153 12,153
561000 Capital Equipment 10,200 10,200 10,200
581000 Travel & Training 30,502 30,502 30,502
581003 Licenses & Certificates 9,676 9,676 9,676
Totals 3,133,383$ 3,133,383$ 3,133,383$
80
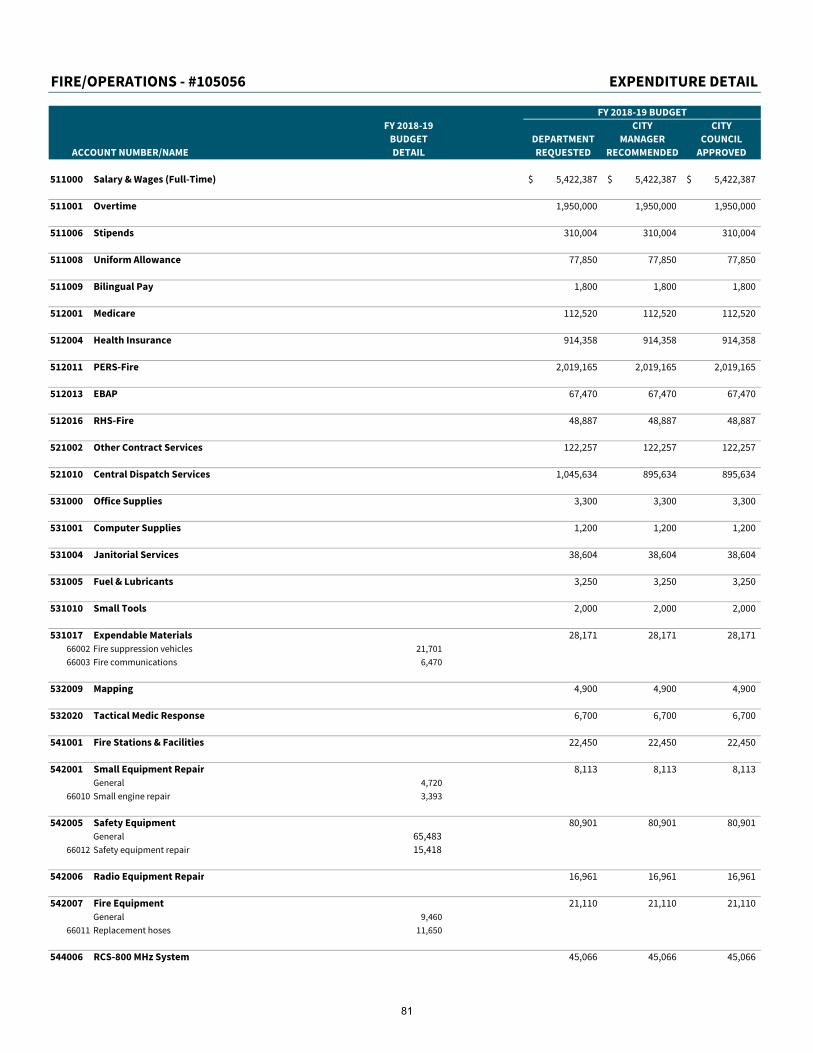
FIRE/OPERATIONS - #105056 EXPENDITURE DETAIL
FY 2018-19 BUDGET
FY 2018-19 CITY CITY
BUDGET DEPARTMENT MANAGER COUNCIL
ACCOUNT NUMBER/NAME DETAIL REQUESTED RECOMMENDED APPROVED
511000 Salary & Wages (Full-Time) 5,422,387$ 5,422,387$ 5,422,387$
511001 Overtime 1,950,000 1,950,000 1,950,000
511006 Stipends 310,004 310,004 310,004
511008 Uniform Allowance 77,850 77,850 77,850
511009 Bilingual Pay 1,800 1,800 1,800
512001 Medicare 112,520 112,520 112,520
512004 Health Insurance 914,358 914,358 914,358
512011 PERS-Fire 2,019,165 2,019,165 2,019,165
512013 EBAP 67,470 67,470 67,470
512016 RHS-Fire 48,887 48,887 48,887
521002 Other Contract Services 122,257 122,257 122,257
521010 Central Dispatch Services 1,045,634 895,634 895,634
531000 Office Supplies 3,300 3,300 3,300
531001 Computer Supplies 1,200 1,200 1,200
531004 Janitorial Services 38,604 38,604 38,604
531005 Fuel & Lubricants 3,250 3,250 3,250
531010 Small Tools 2,000 2,000 2,000
531017 Expendable Materials 28,171 28,171 28,171
66002 Fire suppression vehicles 21,701
66003 Fire communications 6,470
532009 Mapping 4,900 4,900 4,900
532020 Tactical Medic Response 6,700 6,700 6,700
541001 Fire Stations & Facilities 22,450 22,450 22,450
542001 Small Equipment Repair 8,113 8,113 8,113
General 4,720
66010 Small engine repair 3,393
542005 Safety Equipment 80,901 80,901 80,901
General 65,483
66012 Safety equipment repair 15,418
542006 Radio Equipment Repair 16,961 16,961 16,961
542007 Fire Equipment 21,110 21,110 21,110
General 9,460
66011 Replacement hoses 11,650
544006 RCS-800 MHz System 45,066 45,066 45,066
81
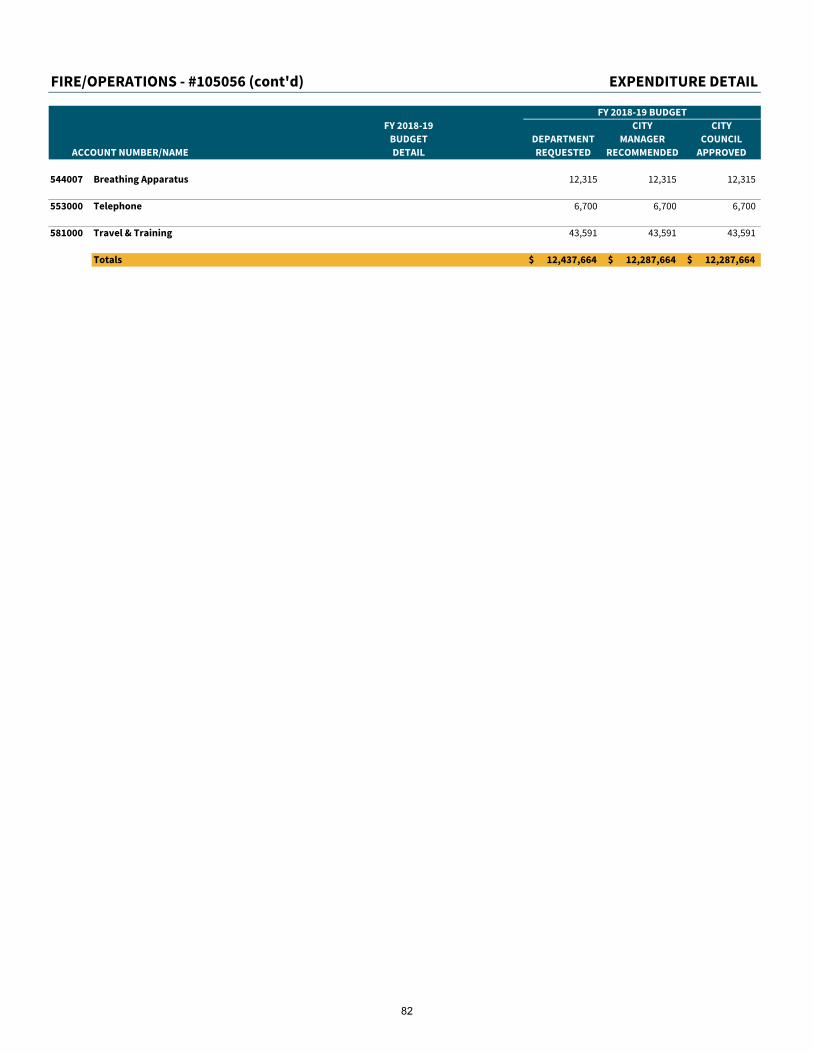
FIRE/OPERATIONS - #105056 (cont'd) EXPENDITURE DETAIL
FY 2018-19 BUDGET
FY 2018-19 CITY CITY
BUDGET DEPARTMENT MANAGER COUNCIL
ACCOUNT NUMBER/NAME DETAIL REQUESTED RECOMMENDED APPROVED
544007 Breathing Apparatus 12,315 12,315 12,315
553000 Telephone 6,700 6,700 6,700
581000 Travel & Training 43,591 43,591 43,591
Totals 12,437,664$ 12,287,664$ 12,287,664$
82
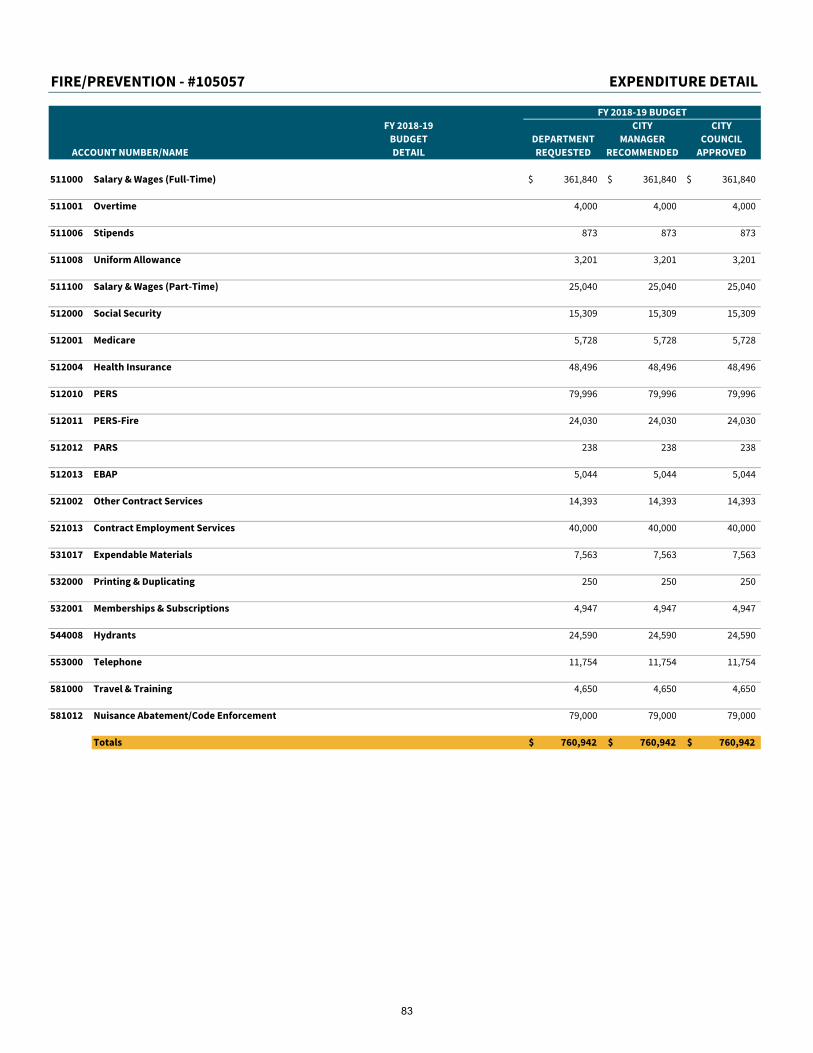
FIRE/PREVENTION - #105057 EXPENDITURE DETAIL
FY 2018-19 BUDGET
FY 2018-19 CITY CITY
BUDGET DEPARTMENT MANAGER COUNCIL
ACCOUNT NUMBER/NAME DETAIL REQUESTED RECOMMENDED APPROVED
511000 Salary & Wages (Full-Time) 361,840$ 361,840$ 361,840$
511001 Overtime 4,000 4,000 4,000
511006 Stipends 873 873 873
511008 Uniform Allowance 3,201 3,201 3,201
511100 Salary & Wages (Part-Time) 25,040 25,040 25,040
512000 Social Security 15,309 15,309 15,309
512001 Medicare 5,728 5,728 5,728
512004 Health Insurance 48,496 48,496 48,496
512010 PERS 79,996 79,996 79,996
512011 PERS-Fire 24,030 24,030 24,030
512012 PARS 238 238 238
512013 EBAP 5,044 5,044 5,044
521002 Other Contract Services 14,393 14,393 14,393
521013 Contract Employment Services 40,000 40,000 40,000
531017 Expendable Materials 7,563 7,563 7,563
532000 Printing & Duplicating 250 250 250
532001 Memberships & Subscriptions 4,947 4,947 4,947
544008 Hydrants 24,590 24,590 24,590
553000 Telephone 11,754 11,754 11,754
581000 Travel & Training 4,650 4,650 4,650
581012 Nuisance Abatement/Code Enforcement 79,000 79,000 79,000
Totals 760,942$ 760,942$ 760,942$
83

|
This page intentionally left blank.
84
LAW ENFORCEMENT
PURPOSE:
To provide responsive, professional law enforcement services to all people in San Marcos. These services are contracted through the San Diego County
Sheriff's Department.
SUMMARY OF SERVICES:
The City contracts for law enforcement services with the San Diego County Sheriff's Department. Law enforcement services include patrol, traffic, community
oriented policing, gang and narcotics details, detectives, clerical and supervisory personnel. In addition to operational costs associated with personnel and
equipment, the law enforcement budget also supports facility costs associated with the Sheriff's San Marcos Station location.
85
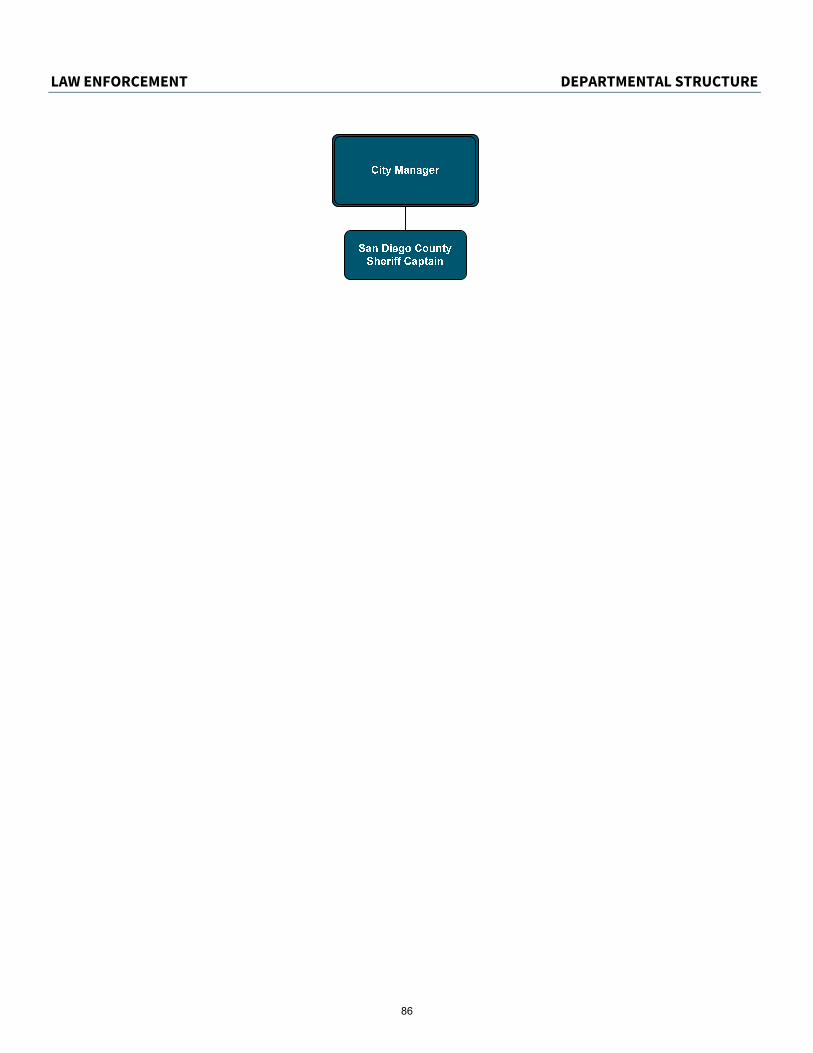
LAW ENFORCEMENT DEPARTMENTAL STRUCTURE
NEED
|
86
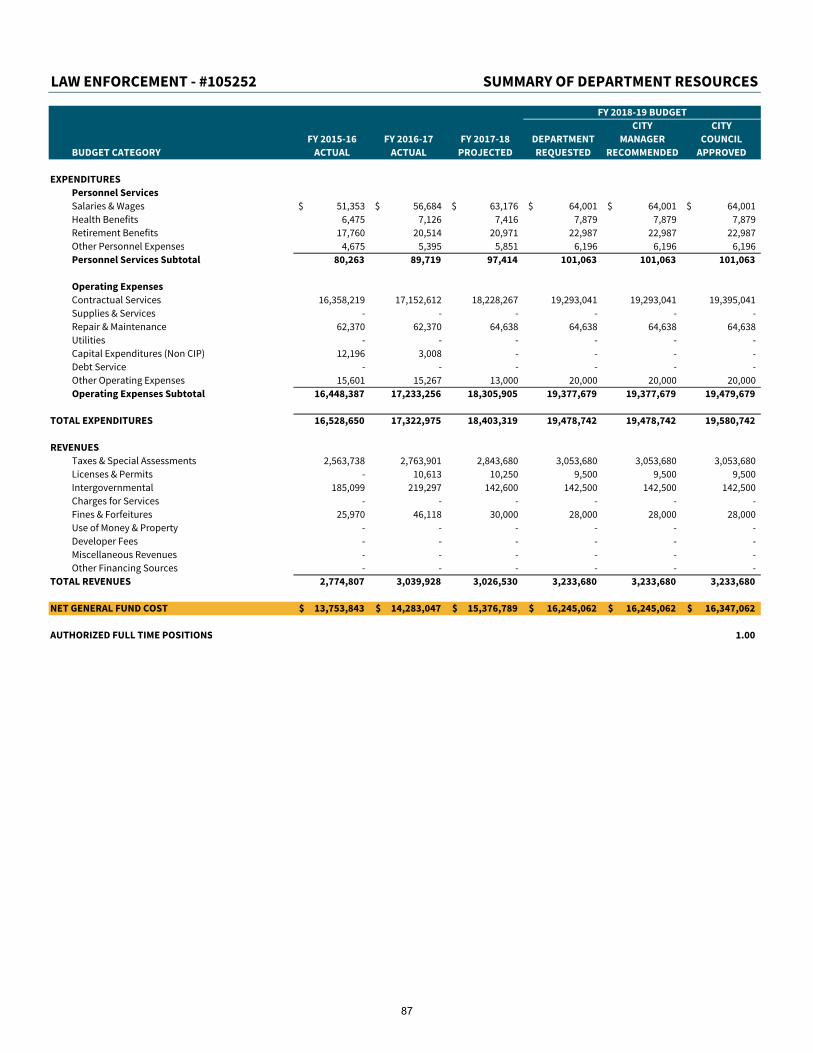
LAW ENFORCEMENT - #105252 SUMMARY OF DEPARTMENT RESOURCES
FY 2018-19 BUDGET
CITY CITY
FY 2015-16 FY 2016-17 FY 2017-18 DEPARTMENT MANAGER COUNCIL
BUDGET CATEGORY ACTUAL ACTUAL PROJECTED REQUESTED RECOMMENDED APPROVED
EXPENDITURES
Personnel Services
Salaries & Wages 51,353$ 56,684$ 63,176$ 64,001$ 64,001$ 64,001$
Health Benefits 6,475 7,126 7,416 7,879 7,879 7,879
Retirement Benefits 17,760 20,514 20,971 22,987 22,987 22,987
Other Personnel Expenses 4,675 5,395 5,851 6,196 6,196 6,196
Personnel Services Subtotal 80,263 89,719 97,414 101,063 101,063 101,063
Operating Expenses
Contractual Services 16,358,219 17,152,612 18,228,267 19,293,041 19,293,041 19,395,041
Supplies & Services - - - - - -
Repair & Maintenance 62,370 62,370 64,638 64,638 64,638 64,638
Utilities - - - - - -
Capital Expenditures (Non CIP) 12,196 3,008 - - - -
Debt Service - - - - - -
Other Operating Expenses 15,601 15,267 13,000 20,000 20,000 20,000
Operating Expenses Subtotal 16,448,387 17,233,256 18,305,905 19,377,679 19,377,679 19,479,679
TOTAL EXPENDITURES 16,528,650 17,322,975 18,403,319 19,478,742 19,478,742 19,580,742
REVENUES
Taxes & Special Assessments 2,563,738 2,763,901 2,843,680 3,053,680 3,053,680 3,053,680
Licenses & Permits - 10,613 10,250 9,500 9,500 9,500
Intergovernmental 185,099 219,297 142,600 142,500 142,500 142,500
Charges for Services - - - - - -
Fines & Forfeitures 25,970 46,118 30,000 28,000 28,000 28,000
Use of Money & Property - - - - - -
Developer Fees - - - - - -
Miscellaneous Revenues - - - - - -
Other Financing Sources - - - - - -
TOTAL REVENUES 2,774,807 3,039,928 3,026,530 3,233,680 3,233,680 3,233,680
NET GENERAL FUND COST 13,753,843$ 14,283,047$ 15,376,789$ 16,245,062$ 16,245,062$ 16,347,062$
AUTHORIZED FULL TIME POSITIONS 1.00
87
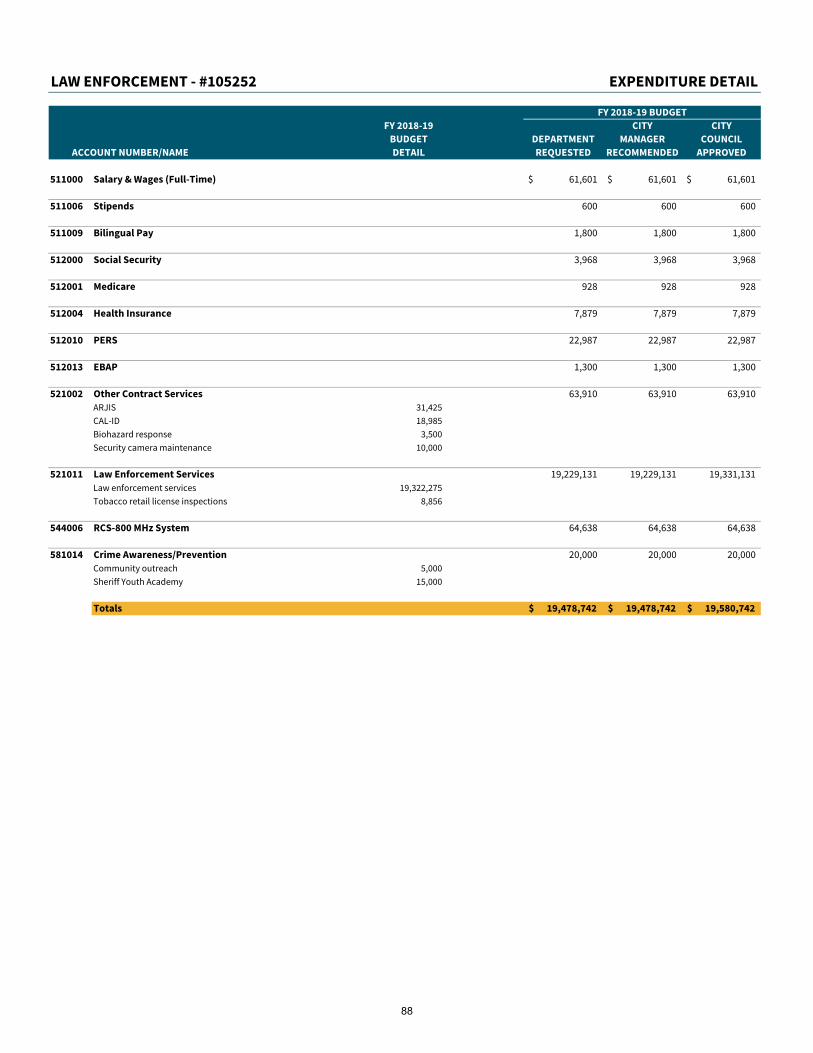
LAW ENFORCEMENT - #105252 EXPENDITURE DETAIL
FY 2018-19 BUDGET
FY 2018-19 CITY CITY
BUDGET DEPARTMENT MANAGER COUNCIL
ACCOUNT NUMBER/NAME DETAIL REQUESTED RECOMMENDED APPROVED
511000 Salary & Wages (Full-Time) 61,601$ 61,601$ 61,601$
511006 Stipends 600 600 600
511009 Bilingual Pay 1,800 1,800 1,800
512000 Social Security 3,968 3,968 3,968
512001 Medicare 928 928 928
512004 Health Insurance 7,879 7,879 7,879
512010 PERS 22,987 22,987 22,987
512013 EBAP 1,300 1,300 1,300
521002 Other Contract Services 63,910 63,910 63,910
ARJIS 31,425
CAL-ID 18,985
Biohazard response 3,500
Security camera maintenance 10,000
521011 Law Enforcement Services 19,229,131 19,229,131 19,331,131
Law enforcement services 19,322,275
Tobacco retail license inspections 8,856
544006 RCS-800 MHz System 64,638 64,638 64,638
581014 Crime Awareness/Prevention 20,000 20,000 20,000
Community outreach 5,000
Sheriff Youth Academy 15,000
Totals 19,478,742$ 19,478,742$ 19,580,742$
88
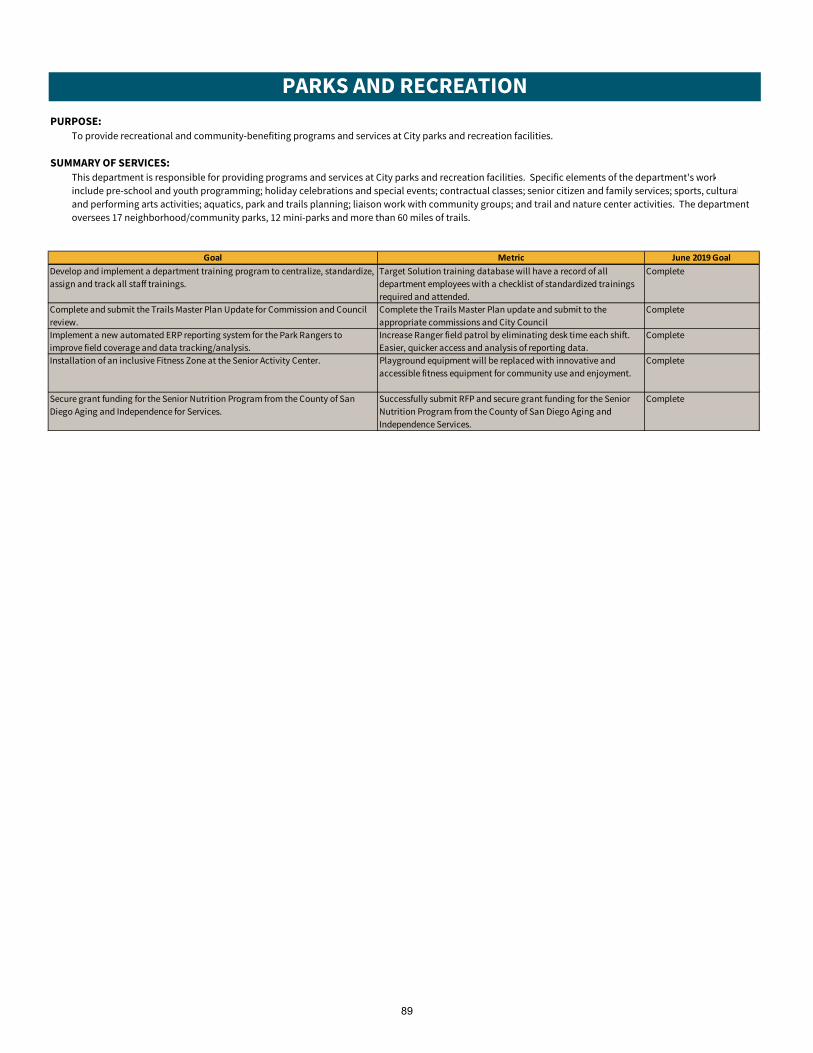
PARKS AND RECREATION
PURPOSE:
To provide recreational and community-benefiting programs and services at City parks and recreation facilities.
SUMMARY OF SERVICES:
This department is responsible for providing programs and services at City parks and recreation facilities. Specific elements of the department's work
include pre-school and youth programming; holiday celebrations and special events; contractual classes; senior citizen and family services; sports, cultural
and performing arts activities; aquatics, park and trails planning; liaison work with community groups; and trail and nature center activities. The department
oversees 17 neighborhood/community parks, 12 mini-parks and more than 60 miles of trails.
Goal Metric June 2019 Goal
Develop and implement a department training program to centralize, standardize,
assign and track all staff trainings.
Target Solution training database will have a record of all
department employees with a checklist of standardized trainings
required and attended.
Complete
Complete and submit the Trails Master Plan Update for Commission and Council
review.
Complete the Trails Master Plan update and submit to the
appropriate commissions and City Council
Complete
Implement a new automated ERP reporting system for the Park Rangers to
improve field coverage and data tracking/analysis.
Increase Ranger field patrol by eliminating desk time each shift.
Easier, quicker access and analysis of reporting data.
Complete
Installation of an inclusive Fitness Zone at the Senior Activity Center. Playground equipment will be replaced with innovative and
accessible fitness equipment for community use and enjoyment.
Complete
Secure grant funding for the Senior Nutrition Program from the County of San
Diego Aging and Independence for Services.
Successfully submit RFP and secure grant funding for the Senior
Nutrition Program from the County of San Diego Aging and
Independence Services.
Complete
89
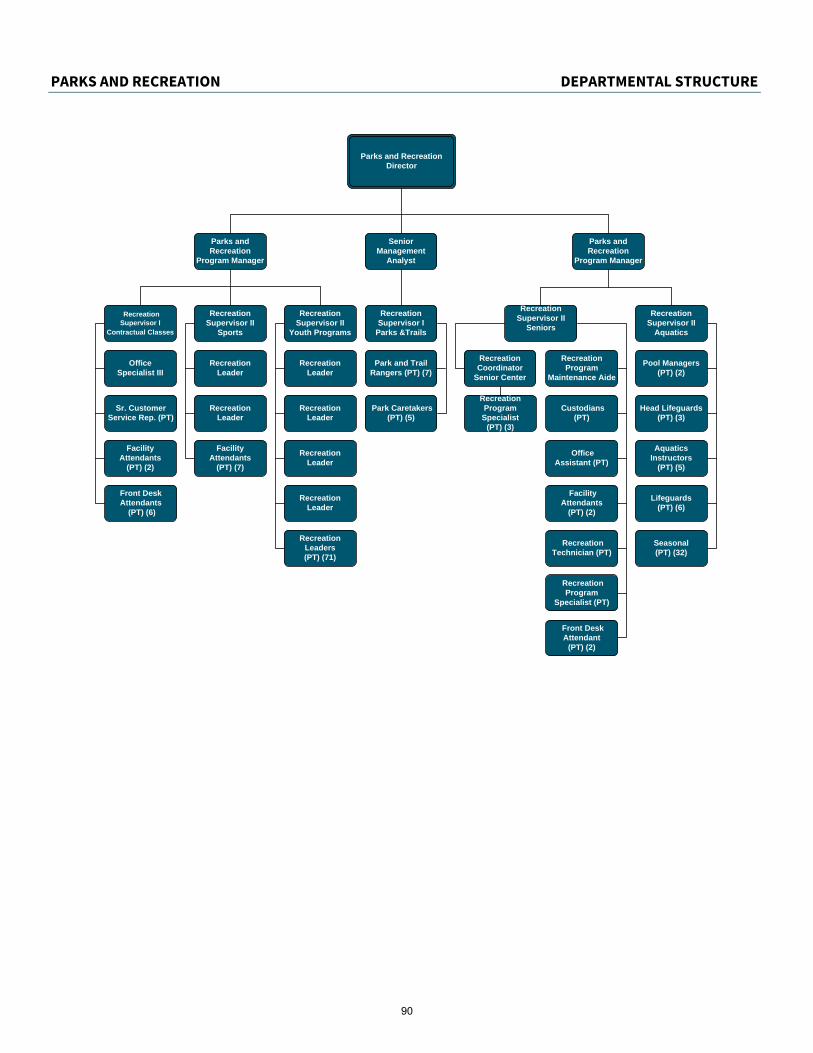
PARKS AND RECREATION DEPARTMENTAL STRUCTURE
NEED
|
Parks and Recreation Director
Parks and Recreation
Program Manager
Recreation Supervisor I
Parks &Trails
Recreation Supervisor II
Sports
Recreation Supervisor II
Youth Programs
Recreation Supervisor II
Aquatics
Parks and Recreation
Program Manager
Pool Managers(PT) (2)
Office Specialist III
Recreation Leader
Park and Trail Rangers (PT) (7)
Facility Attendants
(PT) (7)
Recreation Program
Maintenance Aide
Recreation Coordinator
Senior Center
Recreation Leader
Recreation Leader
Recreation Leaders (PT) (71)
Recreation Leader
Recreation Leader
Recreation Leader
Park Caretakers (PT) (5)
Recreation Program Specialist
(PT) (3)
Recreation Supervisor I
Contractual Classes
Facility Attendants
(PT) (2)
Recreation Supervisor II
Seniors
Custodians (PT)
Office Assistant (PT)
Facility Attendants
(PT) (2)
Recreation Technician (PT)
Senior Management
Analyst
Sr. Customer Service Rep. (PT)
Front Desk Attendants
(PT) (6)
Recreation Program
Specialist (PT)
Front Desk Attendant
(PT) (2)
Head Lifeguards(PT) (3)
Aquatics Instructors
(PT) (5)
Lifeguards(PT) (6)
Seasonal (PT) (32)
90

PARKS AND RECREATION - #106161 SUMMARY OF DEPARTMENT RESOURCES
FY 2018-19 BUDGET
CITY CITY
FY 2015-16 FY 2016-17 FY 2017-18 DEPARTMENT MANAGER COUNCIL
BUDGET CATEGORY ACTUAL ACTUAL PROJECTED REQUESTED RECOMMENDED APPROVED
EXPENDITURES
Personnel Services
Salaries & Wages 1,948,247$ 2,027,365$ 2,278,104$ 2,326,857$ 2,326,857$ 2,326,857$
Health Benefits 183,142 188,482 217,778 233,276 233,276 233,276
Retirement Benefits 393,967 434,886 422,640 461,237 461,237 461,237
Other Personnel Expenses 121,689 129,779 132,005 139,289 139,289 139,289
Personnel Services Subtotal 2,647,044 2,780,512 3,050,527 3,160,659 3,160,659 3,160,659
Operating Expenses
Contractual Services 410,658 484,077 544,742 522,790 522,790 522,790
Supplies & Services 253,369 226,377 210,450 235,605 235,605 235,605
Repair & Maintenance 18,691 19,503 24,900 18,500 18,500 18,500
Utilities 2,881 1,815 3,500 3,500 3,500 3,500
Capital Expenditures (Non CIP) 22,441 17,784 21,500 22,000 22,000 22,000
Other Operating Expenses 24,975 23,642 41,596 27,221 27,221 27,221
Operating Expenses Subtotal 733,014 773,198 846,688 829,616 829,616 829,616
TOTAL EXPENDITURES 3,380,058 3,553,710 3,897,215 3,990,275 3,990,275 3,990,275
REVENUES
Taxes & Special Assessments - - - - - -
Licenses & Permits - - - - - -
Intergovernmental 25,452 9,540 200 - - -
Charges for Services 2,506,491 2,039,397 2,242,435 2,203,250 2,203,250 2,203,250
Fines & Forfeitures - - - - - -
Use of Money & Property - - - - - -
Developer Fees - - - - - -
Miscellaneous Revenues 203,659 179,772 164,000 129,600 129,600 129,600
Other Financing Sources - - - 143,000 143,000 143,000
TOTAL REVENUES 2,735,602 2,228,709 2,406,635 2,475,850 2,475,850 2,475,850
NET GENERAL FUND COST 644,456$ 1,325,000$ 1,490,580$ 1,514,425$ 1,514,425$ 1,514,425$
Allocation of Full Time Positions:
Departmental - Parks and Recreation 17.09
Senior Nutrition 1.55
CFD 98-02 0.36
AUTHORIZED FULL TIME POSITIONS 19.00
91
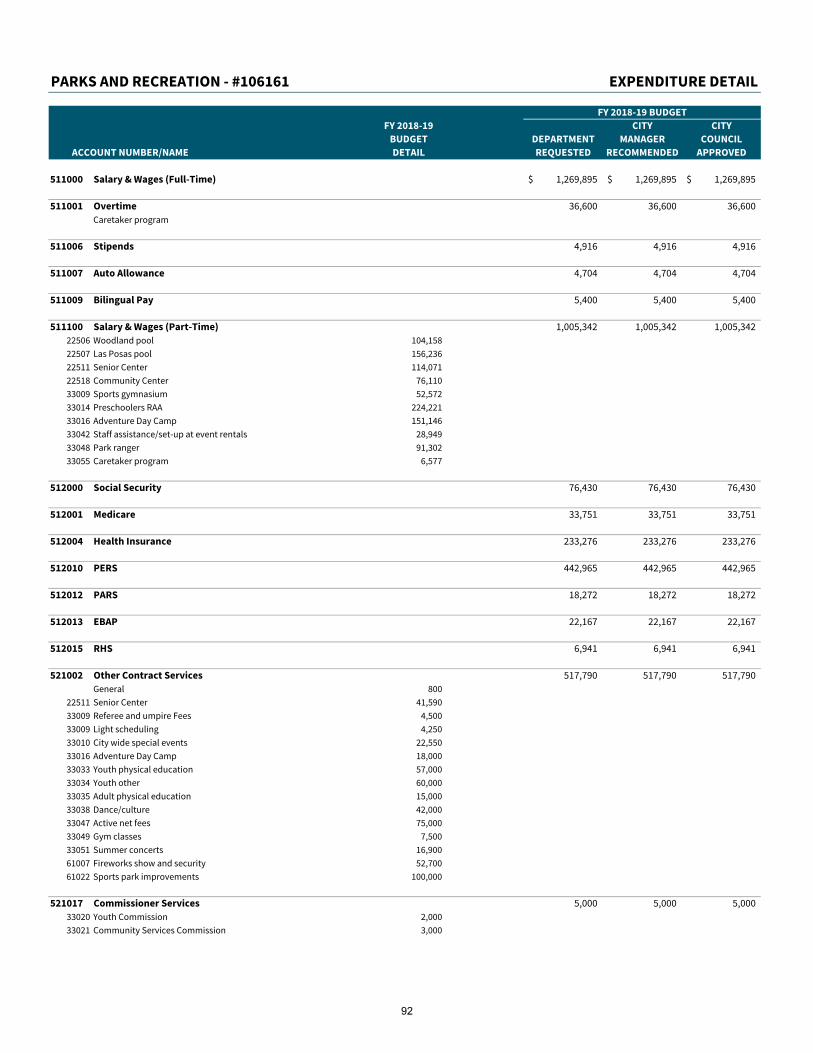
PARKS AND RECREATION - #106161 EXPENDITURE DETAIL
FY 2018-19 BUDGET
FY 2018-19 CITY CITY
BUDGET DEPARTMENT MANAGER COUNCIL
ACCOUNT NUMBER/NAME DETAIL REQUESTED RECOMMENDED APPROVED
511000 Salary & Wages (Full-Time) 1,269,895$ 1,269,895$ 1,269,895$
511001 Overtime 36,600 36,600 36,600
Caretaker program
511006 Stipends 4,916 4,916 4,916
511007 Auto Allowance 4,704 4,704 4,704
511009 Bilingual Pay 5,400 5,400 5,400
511100 Salary & Wages (Part-Time) 1,005,342 1,005,342 1,005,342
22506 Woodland pool 104,158
22507 Las Posas pool 156,236
22511 Senior Center 114,071
22518 Community Center 76,110
33009 Sports gymnasium 52,572
33014 Preschoolers RAA 224,221
33016 Adventure Day Camp 151,146
33042 Staff assistance/set-up at event rentals 28,949
33048 Park ranger 91,302
33055 Caretaker program 6,577
512000 Social Security 76,430 76,430 76,430
512001 Medicare 33,751 33,751 33,751
512004 Health Insurance 233,276 233,276 233,276
512010 PERS 442,965 442,965 442,965
512012 PARS 18,272 18,272 18,272
512013 EBAP 22,167 22,167 22,167
512015 RHS 6,941 6,941 6,941
521002 Other Contract Services 517,790 517,790 517,790
General 800
22511 Senior Center 41,590
33009 Referee and umpire Fees 4,500
33009 Light scheduling 4,250
33010 City wide special events 22,550
33016 Adventure Day Camp 18,000
33033 Youth physical education 57,000
33034 Youth other 60,000
33035 Adult physical education 15,000
33038 Dance/culture 42,000
33047 Active net fees 75,000
33049 Gym classes 7,500
33051 Summer concerts 16,900
61007 Fireworks show and security 52,700
61022 Sports park improvements 100,000
521017 Commissioner Services 5,000 5,000 5,000
33020 Youth Commission 2,000
33021 Community Services Commission 3,000
92
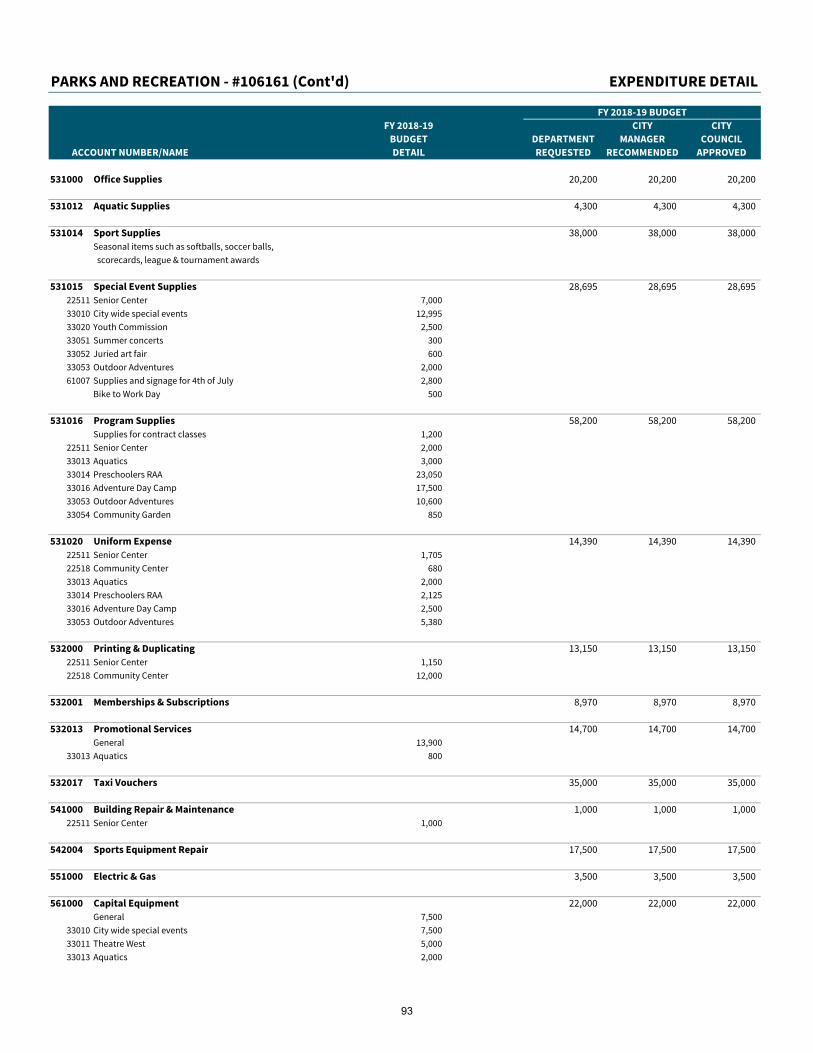
PARKS AND RECREATION - #106161 (Cont'd) EXPENDITURE DETAIL
FY 2018-19 BUDGET
FY 2018-19 CITY CITY
BUDGET DEPARTMENT MANAGER COUNCIL
ACCOUNT NUMBER/NAME DETAIL REQUESTED RECOMMENDED APPROVED
531000 Office Supplies 20,200 20,200 20,200
531012 Aquatic Supplies 4,300 4,300 4,300
531014 Sport Supplies 38,000 38,000 38,000
Seasonal items such as softballs, soccer balls,
scorecards, league & tournament awards
531015 Special Event Supplies 28,695 28,695 28,695
22511 Senior Center 7,000
33010 City wide special events 12,995
33020 Youth Commission 2,500
33051 Summer concerts 300
33052 Juried art fair 600
33053 Outdoor Adventures 2,000
61007 Supplies and signage for 4th of July 2,800
Bike to Work Day 500
531016 Program Supplies 58,200 58,200 58,200
Supplies for contract classes 1,200
22511 Senior Center 2,000
33013 Aquatics 3,000
33014 Preschoolers RAA 23,050
33016 Adventure Day Camp 17,500
33053 Outdoor Adventures 10,600
33054 Community Garden 850
531020 Uniform Expense 14,390 14,390 14,390
22511 Senior Center 1,705
22518 Community Center 680
33013 Aquatics 2,000
33014 Preschoolers RAA 2,125
33016 Adventure Day Camp 2,500
33053 Outdoor Adventures 5,380
532000 Printing & Duplicating 13,150 13,150 13,150
22511 Senior Center 1,150
22518 Community Center 12,000
532001 Memberships & Subscriptions 8,970 8,970 8,970
532013 Promotional Services 14,700 14,700 14,700
General 13,900
33013 Aquatics 800
532017 Taxi Vouchers 35,000 35,000 35,000
541000 Building Repair & Maintenance 1,000 1,000 1,000
22511 Senior Center 1,000
542004 Sports Equipment Repair 17,500 17,500 17,500
551000 Electric & Gas 3,500 3,500 3,500
561000 Capital Equipment 22,000 22,000 22,000
General 7,500
33010 City wide special events 7,500
33011 Theatre West 5,000
33013 Aquatics 2,000
93
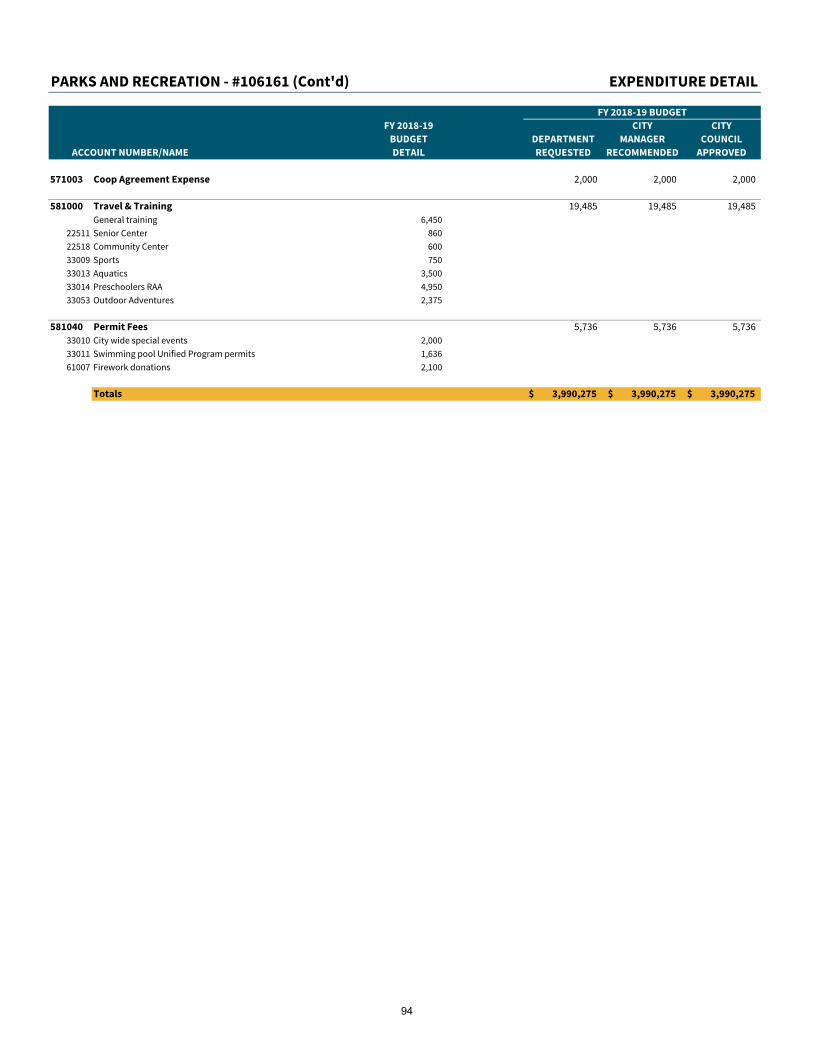
PARKS AND RECREATION - #106161 (Cont'd) EXPENDITURE DETAIL
FY 2018-19 BUDGET
FY 2018-19 CITY CITY
BUDGET DEPARTMENT MANAGER COUNCIL
ACCOUNT NUMBER/NAME DETAIL REQUESTED RECOMMENDED APPROVED
571003 Coop Agreement Expense 2,000 2,000 2,000
581000 Travel & Training 19,485 19,485 19,485
General training 6,450
22511 Senior Center 860
22518 Community Center 600
33009 Sports 750
33013 Aquatics 3,500
33014 Preschoolers RAA 4,950
33053 Outdoor Adventures 2,375
581040 Permit Fees 5,736 5,736 5,736
33010 City wide special events 2,000
33011 Swimming pool Unified Program permits 1,636
61007 Firework donations 2,100
Totals 3,990,275$ 3,990,275$ 3,990,275$
94
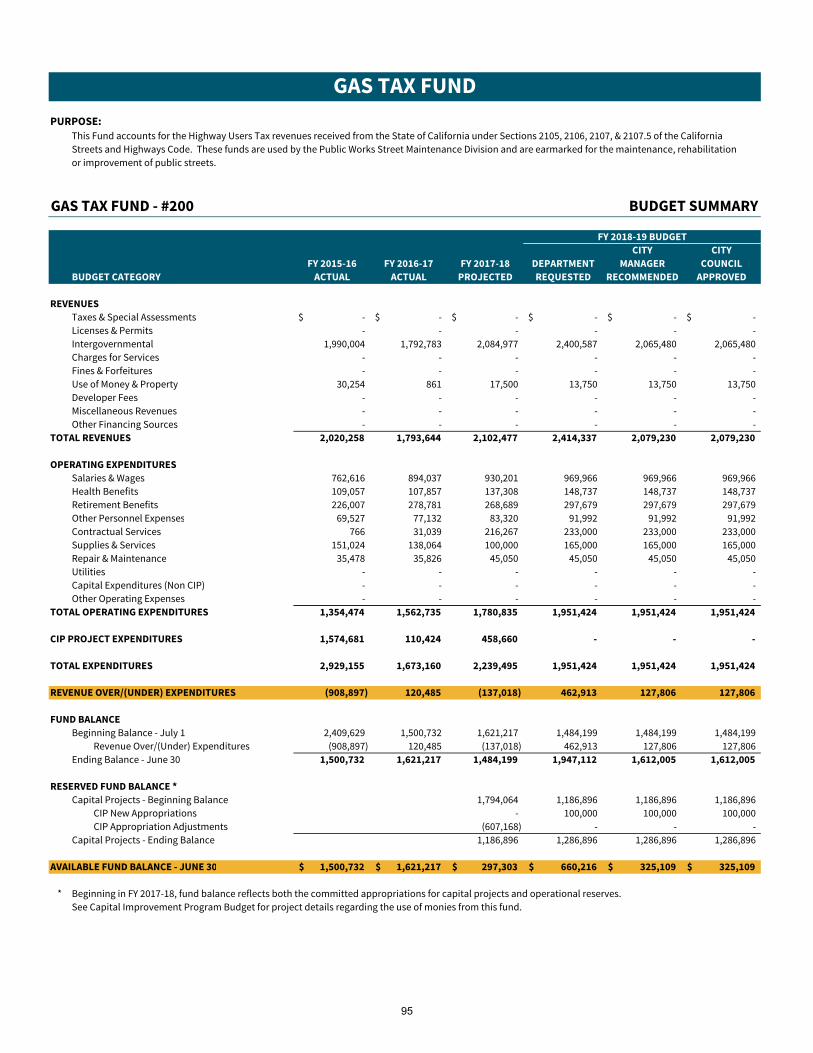
GAS TAX FUND
PURPOSE:
This Fund accounts for the Highway Users Tax revenues received from the State of California under Sections 2105, 2106, 2107, & 2107.5 of the California
Streets and Highways Code. These funds are used by the Public Works Street Maintenance Division and are earmarked for the maintenance, rehabilitation
or improvement of public streets.
GAS TAX FUND - #200 BUDGET SUMMARY
FY 2018-19 BUDGET
CITY CITY
FY 2015-16 FY 2016-17 FY 2017-18 DEPARTMENT MANAGER COUNCIL
BUDGET CATEGORY ACTUAL ACTUAL PROJECTED REQUESTED RECOMMENDED APPROVED
REVENUES
Taxes & Special Assessments -$ -$ -$ -$ -$ -$
Licenses & Permits - - - - - -
Intergovernmental 1,990,004 1,792,783 2,084,977 2,400,587 2,065,480 2,065,480
Charges for Services - - - - - -
Fines & Forfeitures - - - - - -
Use of Money & Property 30,254 861 17,500 13,750 13,750 13,750
Developer Fees - - - - - -
Miscellaneous Revenues - - - - - -
Other Financing Sources - - - - - -
TOTAL REVENUES 2,020,258 1,793,644 2,102,477 2,414,337 2,079,230 2,079,230
OPERATING EXPENDITURES
Salaries & Wages 762,616 894,037 930,201 969,966 969,966 969,966
Health Benefits 109,057 107,857 137,308 148,737 148,737 148,737
Retirement Benefits 226,007 278,781 268,689 297,679 297,679 297,679
Other Personnel Expenses 69,527 77,132 83,320 91,992 91,992 91,992
Contractual Services 766 31,039 216,267 233,000 233,000 233,000
Supplies & Services 151,024 138,064 100,000 165,000 165,000 165,000
Repair & Maintenance 35,478 35,826 45,050 45,050 45,050 45,050
Utilities - - - - - -
Capital Expenditures (Non CIP) - - - - - -
Other Operating Expenses - - - - - -
TOTAL OPERATING EXPENDITURES 1,354,474 1,562,735 1,780,835 1,951,424 1,951,424 1,951,424
CIP PROJECT EXPENDITURES 1,574,681 110,424 458,660 - - -
TOTAL EXPENDITURES 2,929,155 1,673,160 2,239,495 1,951,424 1,951,424 1,951,424
REVENUE OVER/(UNDER) EXPENDITURES (908,897) 120,485 (137,018) 462,913 127,806 127,806
FUND BALANCE
Beginning Balance - July 1 2,409,629 1,500,732 1,621,217 1,484,199 1,484,199 1,484,199
Revenue Over/(Under) Expenditures (908,897) 120,485 (137,018) 462,913 127,806 127,806
Ending Balance - June 30 1,500,732 1,621,217 1,484,199 1,947,112 1,612,005 1,612,005
RESERVED FUND BALANCE *
Capital Projects - Beginning Balance 1,794,064 1,186,896 1,186,896 1,186,896
CIP New Appropriations - 100,000 100,000 100,000
CIP Appropriation Adjustments (607,168) - - -
Capital Projects - Ending Balance 1,186,896 1,286,896 1,286,896 1,286,896
AVAILABLE FUND BALANCE - JUNE 30 1,500,732$ 1,621,217$ 297,303$ 660,216$ 325,109$ 325,109$
* Beginning in FY 2017-18, fund balance reflects both the committed appropriations for capital projects and operational reserves.
See Capital Improvement Program Budget for project details regarding the use of monies from this fund.
95
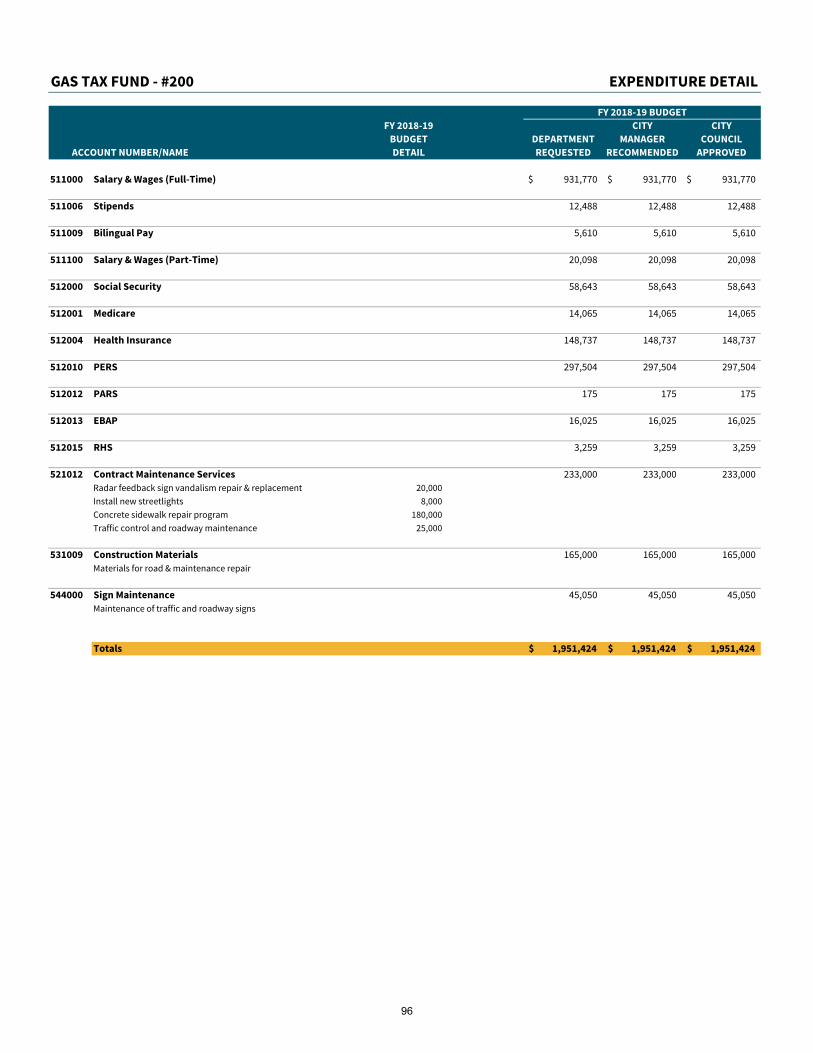
GAS TAX FUND - #200 EXPENDITURE DETAIL
FY 2018-19 BUDGET
FY 2018-19 CITY CITY
BUDGET DEPARTMENT MANAGER COUNCIL
ACCOUNT NUMBER/NAME DETAIL REQUESTED RECOMMENDED APPROVED
511000 Salary & Wages (Full-Time) 931,770$ 931,770$ 931,770$
511006 Stipends 12,488 12,488 12,488
511009 Bilingual Pay 5,610 5,610 5,610
511100 Salary & Wages (Part-Time) 20,098 20,098 20,098
512000 Social Security 58,643 58,643 58,643
512001 Medicare 14,065 14,065 14,065
512004 Health Insurance 148,737 148,737 148,737
512010 PERS 297,504 297,504 297,504
512012 PARS 175 175 175
512013 EBAP 16,025 16,025 16,025
512015 RHS 3,259 3,259 3,259
521012 Contract Maintenance Services 233,000 233,000 233,000
Radar feedback sign vandalism repair & replacement 20,000
Install new streetlights 8,000
Concrete sidewalk repair program 180,000
Traffic control and roadway maintenance 25,000
531009 Construction Materials 165,000 165,000 165,000
Materials for road & maintenance repair
544000 Sign Maintenance 45,050 45,050 45,050
Maintenance of traffic and roadway signs
Totals 1,951,424$ 1,951,424$ 1,951,424$
96
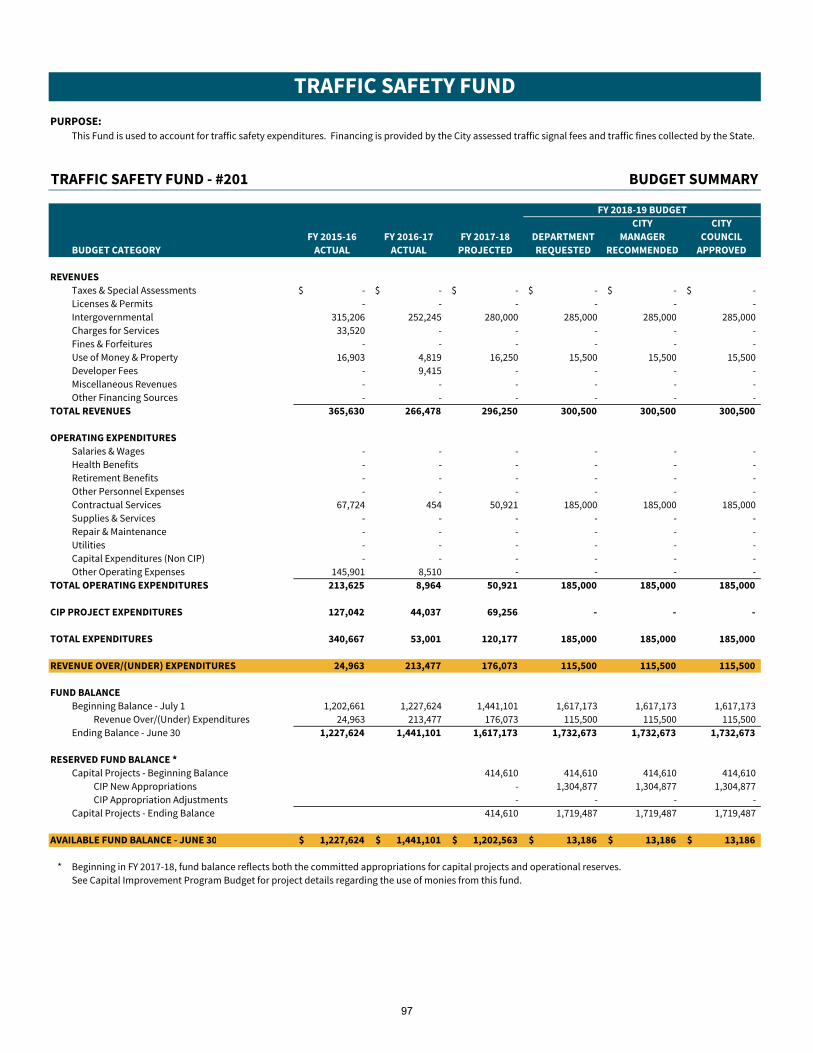
TRAFFIC SAFETY FUND
PURPOSE:
This Fund is used to account for traffic safety expenditures. Financing is provided by the City assessed traffic signal fees and traffic fines collected by the State.
TRAFFIC SAFETY FUND - #201 BUDGET SUMMARY
FY 2018-19 BUDGET
CITY CITY
FY 2015-16 FY 2016-17 FY 2017-18 DEPARTMENT MANAGER COUNCIL
BUDGET CATEGORY ACTUAL ACTUAL PROJECTED REQUESTED RECOMMENDED APPROVED
REVENUES
Taxes & Special Assessments -$ -$ -$ -$ -$ -$
Licenses & Permits - - - - - -
Intergovernmental 315,206 252,245 280,000 285,000 285,000 285,000
Charges for Services 33,520 - - - - -
Fines & Forfeitures - - - - - -
Use of Money & Property 16,903 4,819 16,250 15,500 15,500 15,500
Developer Fees - 9,415 - - - -
Miscellaneous Revenues - - - - - -
Other Financing Sources - - - - - -
TOTAL REVENUES 365,630 266,478 296,250 300,500 300,500 300,500
OPERATING EXPENDITURES
Salaries & Wages - - - - - -
Health Benefits - - - - - -
Retirement Benefits - - - - - -
Other Personnel Expenses - - - - - -
Contractual Services 67,724 454 50,921 185,000 185,000 185,000
Supplies & Services - - - - - -
Repair & Maintenance - - - - - -
Utilities - - - - - -
Capital Expenditures (Non CIP) - - - - - -
Other Operating Expenses 145,901 8,510 - - - -
TOTAL OPERATING EXPENDITURES 213,625 8,964 50,921 185,000 185,000 185,000
CIP PROJECT EXPENDITURES 127,042 44,037 69,256 - - -
TOTAL EXPENDITURES 340,667 53,001 120,177 185,000 185,000 185,000
REVENUE OVER/(UNDER) EXPENDITURES 24,963 213,477 176,073 115,500 115,500 115,500
FUND BALANCE
Beginning Balance - July 1 1,202,661 1,227,624 1,441,101 1,617,173 1,617,173 1,617,173
Revenue Over/(Under) Expenditures 24,963 213,477 176,073 115,500 115,500 115,500
Ending Balance - June 30 1,227,624 1,441,101 1,617,173 1,732,673 1,732,673 1,732,673
RESERVED FUND BALANCE *
Capital Projects - Beginning Balance 414,610 414,610 414,610 414,610
CIP New Appropriations - 1,304,877 1,304,877 1,304,877
CIP Appropriation Adjustments - - - -
Capital Projects - Ending Balance 414,610 1,719,487 1,719,487 1,719,487
AVAILABLE FUND BALANCE - JUNE 30 1,227,624$ 1,441,101$ 1,202,563$ 13,186$ 13,186$ 13,186$
* Beginning in FY 2017-18, fund balance reflects both the committed appropriations for capital projects and operational reserves.
See Capital Improvement Program Budget for project details regarding the use of monies from this fund.
97
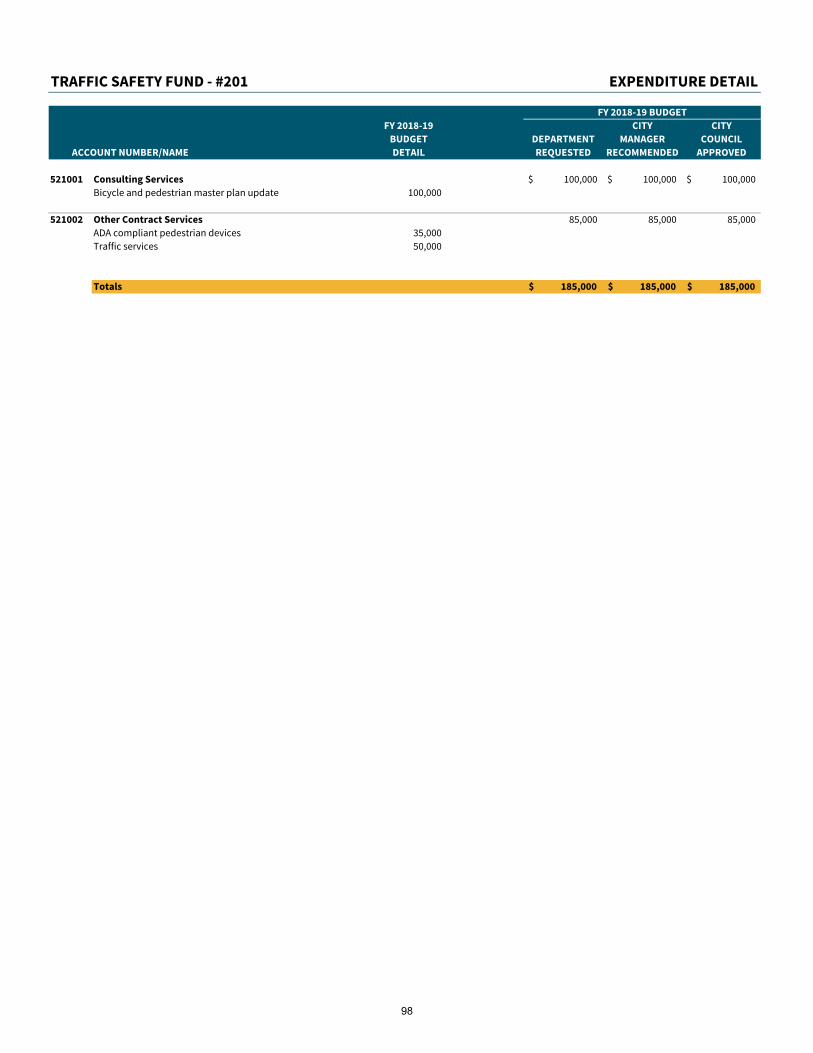
TRAFFIC SAFETY FUND - #201 EXPENDITURE DETAIL
FY 2018-19 BUDGET
FY 2018-19 CITY CITY
BUDGET DEPARTMENT MANAGER COUNCIL
ACCOUNT NUMBER/NAME DETAIL REQUESTED RECOMMENDED APPROVED
521001 Consulting Services 100,000$ 100,000$ 100,000$
Bicycle and pedestrian master plan update 100,000
521002 Other Contract Services 85,000 85,000 85,000
ADA compliant pedestrian devices 35,000
Traffic services 50,000
Totals 185,000$ 185,000$ 185,000$
98

LIGHTING & LANDSCAPING MAINTENANCE DISTRICT FUND
PURPOSE:
This Fund is used to account for the costs of providing street lighting and landscaping services to certain properties. The benefiting properties are assessed
for a portion of the costs.
LIGHTING & LANDSCAPING MAINTENANCE DISTRICT FUND - #202 BUDGET SUMMARY
FY 2018-19 BUDGET
CITY CITY
FY 2015-16 FY 2016-17 FY 2017-18 DEPARTMENT MANAGER COUNCIL
BUDGET CATEGORY ACTUAL ACTUAL PROJECTED REQUESTED RECOMMENDED APPROVED
REVENUES
Taxes & Special Assessments 532,613$ 532,220$ 530,589$ 529,968$ 529,968$ 529,968$
Licenses & Permits - - - - - -
Intergovernmental - - - - - -
Charges for Services 7,172 7,202 6,600 6,000 6,000 6,000
Fines & Forfeitures - - - - - -
Use of Money & Property (6,011) 769 1,200 750 750 750
Developer Fees - - - - - -
Miscellaneous Revenues 13,333 23,972 - - - -
Other Financing Sources 756,339 928,572 1,132,515 660,000 660,000 660,000
TOTAL REVENUES 1,303,445 1,492,736 1,670,904 1,196,718 1,196,718 1,196,718
OPERATING EXPENDITURES
Salaries & Wages 49,564 152,465 123,004 137,031 137,031 137,031
Health Benefits 6,032 16,043 15,028 17,259 17,259 17,259
Retirement Benefits 14,888 48,486 37,254 42,926 42,926 42,926
Other Personnel Expenses 4,504 13,750 11,553 37,861 37,861 37,861
Contractual Services 752,329 675,855 686,702 663,707 663,707 663,707
Supplies & Services 579 - 5,100 250 250 250
Repair & Maintenance 4,666 - 5,700 5,700 5,700 5,700
Utilities 200,501 285,214 296,569 341,418 341,418 341,418
Capital Expenditures (Non CIP) - - - - - -
Debt Service - 25,502 25,503 25,503 25,503 25,503
Other Operating Expenses - - - - - -
TOTAL OPERATING EXPENDITURES 1,033,063 1,217,316 1,206,413 1,271,655 1,271,655 1,271,655
CIP PROJECT EXPENDITURES 270,361 275,421 339,619 - - -
TOTAL EXPENDITURES 1,303,425 1,492,736 1,546,032 1,271,655 1,271,655 1,271,655
REVENUE OVER/(UNDER) EXPENDITURES 21 - 124,872 (74,937) (74,937) (74,937)
FUND BALANCE
Beginning Balance - July 1 (21) - - 124,872 124,872 124,872
Revenue Over/(Under) Expenditures 21 - 124,872 (74,937) (74,937) (74,937)
Ending Balance - June 30 - - 124,872 49,935 49,935 49,935
RESERVED FUND BALANCE
Lighting and Landscaping - - - - - -
AVAILABLE FUND BALANCE - JUNE 30 -$ -$ 124,872$ 49,935$ 49,935$ 49,935$
99
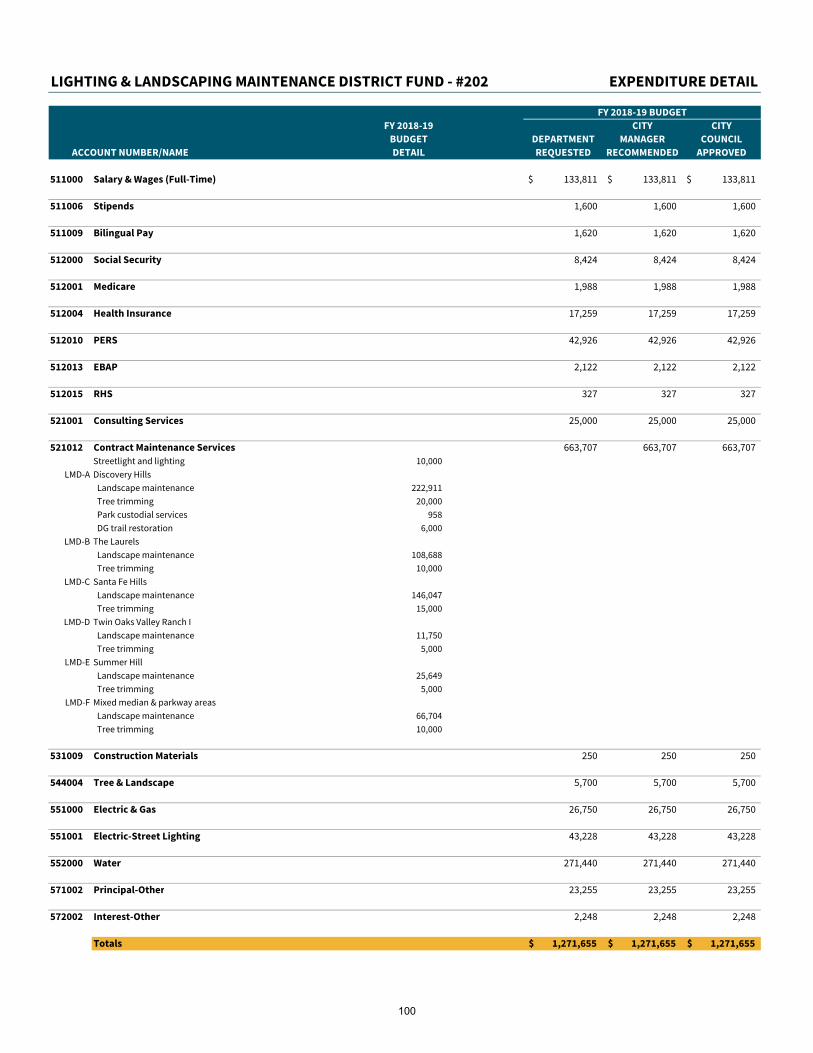
LIGHTING & LANDSCAPING MAINTENANCE DISTRICT FUND - #202 EXPENDITURE DETAIL
FY 2018-19 BUDGET
FY 2018-19 CITY CITY
BUDGET DEPARTMENT MANAGER COUNCIL
ACCOUNT NUMBER/NAME DETAIL REQUESTED RECOMMENDED APPROVED
511000 Salary & Wages (Full-Time) 133,811$ 133,811$ 133,811$
511006 Stipends 1,600 1,600 1,600
511009 Bilingual Pay 1,620 1,620 1,620
512000 Social Security 8,424 8,424 8,424
512001 Medicare 1,988 1,988 1,988
512004 Health Insurance 17,259 17,259 17,259
512010 PERS 42,926 42,926 42,926
512013 EBAP 2,122 2,122 2,122
512015 RHS 327 327 327
521001 Consulting Services 25,000 25,000 25,000
521012 Contract Maintenance Services 663,707 663,707 663,707
Streetlight and lighting 10,000
LMD-A Discovery Hills
Landscape maintenance 222,911
Tree trimming 20,000
Park custodial services 958
DG trail restoration 6,000
LMD-B The Laurels
Landscape maintenance 108,688
Tree trimming 10,000
LMD-C Santa Fe Hills
Landscape maintenance 146,047
Tree trimming 15,000
LMD-D Twin Oaks Valley Ranch I
Landscape maintenance 11,750
Tree trimming 5,000
LMD-E Summer Hill
Landscape maintenance 25,649
Tree trimming 5,000
LMD-F Mixed median & parkway areas
Landscape maintenance 66,704
Tree trimming 10,000
531009 Construction Materials 250 250 250
544004 Tree & Landscape 5,700 5,700 5,700
551000 Electric & Gas 26,750 26,750 26,750
551001 Electric-Street Lighting 43,228 43,228 43,228
552000 Water 271,440 271,440 271,440
571002 Principal-Other 23,255 23,255 23,255
572002 Interest-Other 2,248 2,248 2,248
Totals 1,271,655$ 1,271,655$ 1,271,655$
100
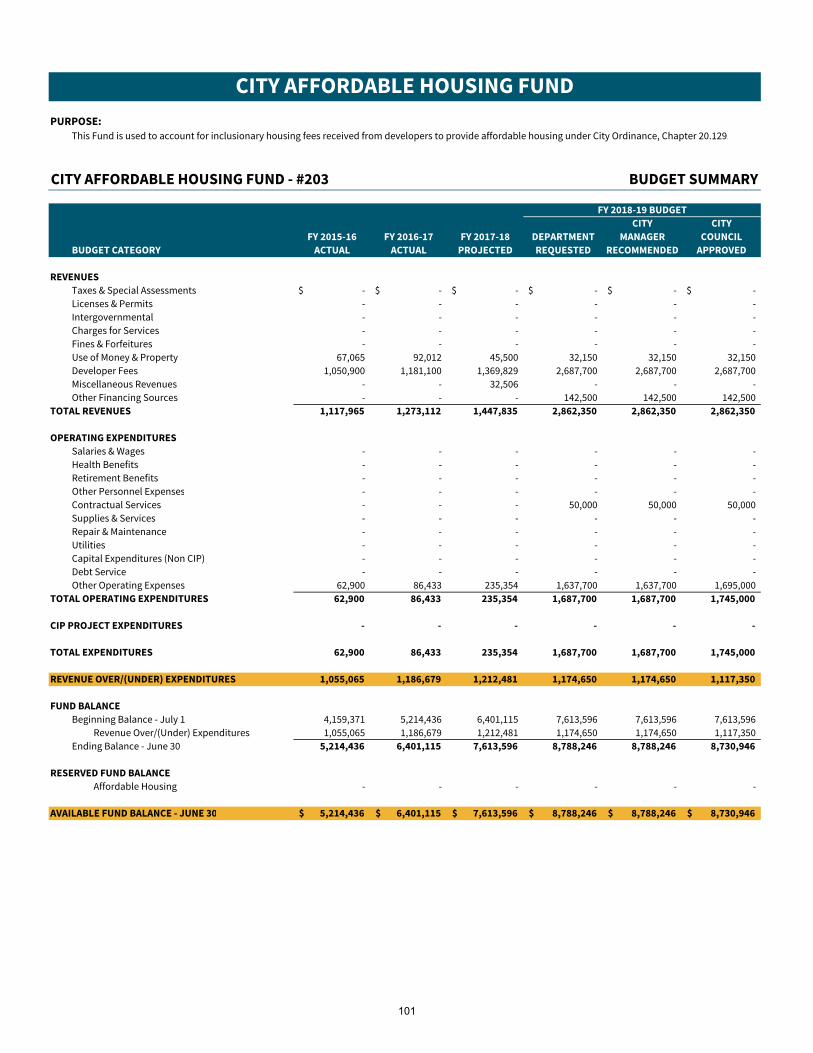
CITY AFFORDABLE HOUSING FUND
PURPOSE:
This Fund is used to account for inclusionary housing fees received from developers to provide affordable housing under City Ordinance, Chapter 20.129.
CITY AFFORDABLE HOUSING FUND - #203 BUDGET SUMMARY
FY 2018-19 BUDGET
CITY CITY
FY 2015-16 FY 2016-17 FY 2017-18 DEPARTMENT MANAGER COUNCIL
BUDGET CATEGORY ACTUAL ACTUAL PROJECTED REQUESTED RECOMMENDED APPROVED
REVENUES
Taxes & Special Assessments -$ -$ -$ -$ -$ -$
Licenses & Permits - - - - - -
Intergovernmental - - - - - -
Charges for Services - - - - - -
Fines & Forfeitures - - - - - -
Use of Money & Property 67,065 92,012 45,500 32,150 32,150 32,150
Developer Fees 1,050,900 1,181,100 1,369,829 2,687,700 2,687,700 2,687,700
Miscellaneous Revenues - - 32,506 - - -
Other Financing Sources - - - 142,500 142,500 142,500
TOTAL REVENUES 1,117,965 1,273,112 1,447,835 2,862,350 2,862,350 2,862,350
OPERATING EXPENDITURES
Salaries & Wages - - - - - -
Health Benefits - - - - - -
Retirement Benefits - - - - - -
Other Personnel Expenses - - - - - -
Contractual Services - - - 50,000 50,000 50,000
Supplies & Services - - - - - -
Repair & Maintenance - - - - - -
Utilities - - - - - -
Capital Expenditures (Non CIP) - - - - - -
Debt Service - - - - - -
Other Operating Expenses 62,900 86,433 235,354 1,637,700 1,637,700 1,695,000
TOTAL OPERATING EXPENDITURES 62,900 86,433 235,354 1,687,700 1,687,700 1,745,000
CIP PROJECT EXPENDITURES - - - - - -
TOTAL EXPENDITURES 62,900 86,433 235,354 1,687,700 1,687,700 1,745,000
REVENUE OVER/(UNDER) EXPENDITURES 1,055,065 1,186,679 1,212,481 1,174,650 1,174,650 1,117,350
FUND BALANCE
Beginning Balance - July 1 4,159,371 5,214,436 6,401,115 7,613,596 7,613,596 7,613,596
Revenue Over/(Under) Expenditures 1,055,065 1,186,679 1,212,481 1,174,650 1,174,650 1,117,350
Ending Balance - June 30 5,214,436 6,401,115 7,613,596 8,788,246 8,788,246 8,730,946
RESERVED FUND BALANCE
Affordable Housing - - - - - -
AVAILABLE FUND BALANCE - JUNE 30 5,214,436$ 6,401,115$ 7,613,596$ 8,788,246$ 8,788,246$ 8,730,946$
101

CITY AFFORDABLE HOUSING FUND - #203 EXPENDITURE DETAIL
FY 2018-19 BUDGET
FY 2018-19 CITY CITY
BUDGET DEPARTMENT MANAGER COUNCIL
ACCOUNT NUMBER/NAME DETAIL REQUESTED RECOMMENDED APPROVED
521001 Consulting Services 50,000$ 50,000$ 50,000$
581017 Developer Loan 1,450,000 1,450,000 1,450,000
Affordable Housing developer loans
581019 Housing Rehab Loans 120,000 120,000 120,000
581037 Housing Support 67,700 67,700 125,000
Totals 1,687,700$ 1,687,700$ 1,745,000$
102
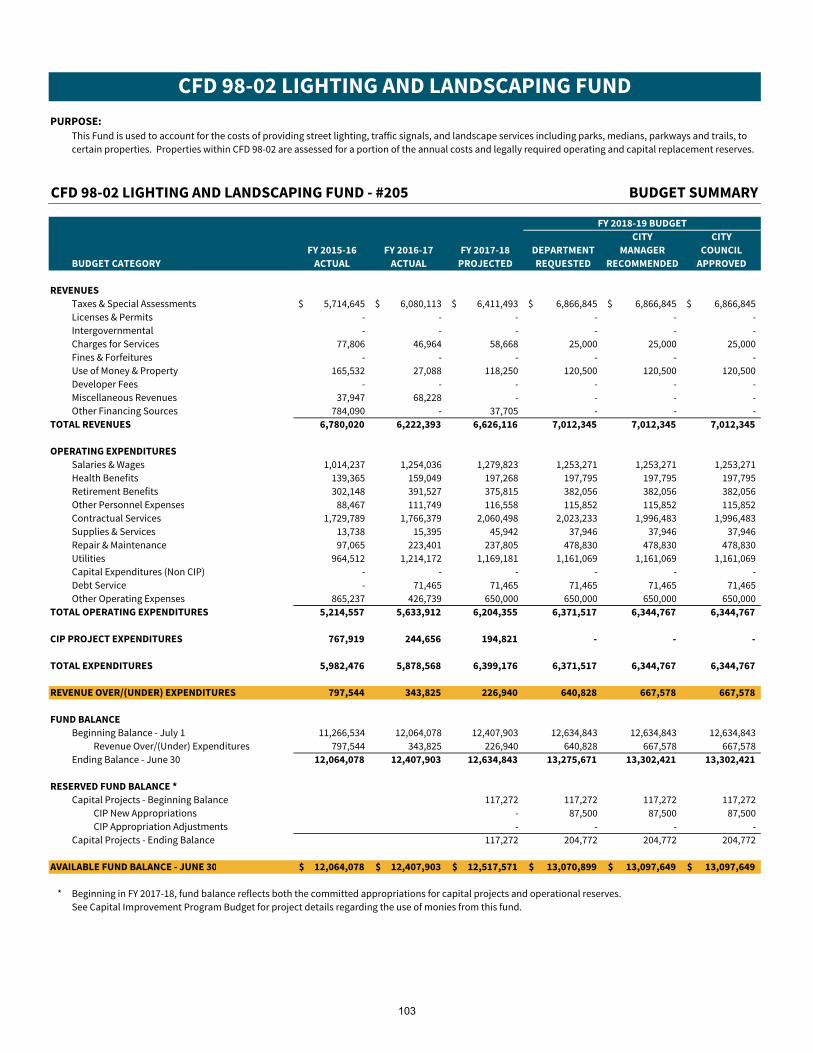
CFD 98-02 LIGHTING AND LANDSCAPING FUND
PURPOSE:
This Fund is used to account for the costs of providing street lighting, traffic signals, and landscape services including parks, medians, parkways and trails, to
certain properties. Properties within CFD 98-02 are assessed for a portion of the annual costs and legally required operating and capital replacement reserves.
CFD 98-02 LIGHTING AND LANDSCAPING FUND - #205 BUDGET SUMMARY
FY 2018-19 BUDGET
CITY CITY
FY 2015-16 FY 2016-17 FY 2017-18 DEPARTMENT MANAGER COUNCIL
BUDGET CATEGORY ACTUAL ACTUAL PROJECTED REQUESTED RECOMMENDED APPROVED
REVENUES
Taxes & Special Assessments 5,714,645$ 6,080,113$ 6,411,493$ 6,866,845$ 6,866,845$ 6,866,845$
Licenses & Permits - - - - - -
Intergovernmental - - - - - -
Charges for Services 77,806 46,964 58,668 25,000 25,000 25,000
Fines & Forfeitures - - - - - -
Use of Money & Property 165,532 27,088 118,250 120,500 120,500 120,500
Developer Fees - - - - - -
Miscellaneous Revenues 37,947 68,228 - - - -
Other Financing Sources 784,090 - 37,705 - - -
TOTAL REVENUES 6,780,020 6,222,393 6,626,116 7,012,345 7,012,345 7,012,345
OPERATING EXPENDITURES
Salaries & Wages 1,014,237 1,254,036 1,279,823 1,253,271 1,253,271 1,253,271
Health Benefits 139,365 159,049 197,268 197,795 197,795 197,795
Retirement Benefits 302,148 391,527 375,815 382,056 382,056 382,056
Other Personnel Expenses 88,467 111,749 116,558 115,852 115,852 115,852
Contractual Services 1,729,789 1,766,379 2,060,498 2,023,233 1,996,483 1,996,483
Supplies & Services 13,738 15,395 45,942 37,946 37,946 37,946
Repair & Maintenance 97,065 223,401 237,805 478,830 478,830 478,830
Utilities 964,512 1,214,172 1,169,181 1,161,069 1,161,069 1,161,069
Capital Expenditures (Non CIP) - - - - - -
Debt Service - 71,465 71,465 71,465 71,465 71,465
Other Operating Expenses 865,237 426,739 650,000 650,000 650,000 650,000
TOTAL OPERATING EXPENDITURES 5,214,557 5,633,912 6,204,355 6,371,517 6,344,767 6,344,767
CIP PROJECT EXPENDITURES 767,919 244,656 194,821 - - -
TOTAL EXPENDITURES 5,982,476 5,878,568 6,399,176 6,371,517 6,344,767 6,344,767
REVENUE OVER/(UNDER) EXPENDITURES 797,544 343,825 226,940 640,828 667,578 667,578
FUND BALANCE
Beginning Balance - July 1 11,266,534 12,064,078 12,407,903 12,634,843 12,634,843 12,634,843
Revenue Over/(Under) Expenditures 797,544 343,825 226,940 640,828 667,578 667,578
Ending Balance - June 30 12,064,078 12,407,903 12,634,843 13,275,671 13,302,421 13,302,421
RESERVED FUND BALANCE *
Capital Projects - Beginning Balance 117,272 117,272 117,272 117,272
CIP New Appropriations - 87,500 87,500 87,500
CIP Appropriation Adjustments - - - -
Capital Projects - Ending Balance 117,272 204,772 204,772 204,772
AVAILABLE FUND BALANCE - JUNE 30 12,064,078$ 12,407,903$ 12,517,571$ 13,070,899$ 13,097,649$ 13,097,649$
* Beginning in FY 2017-18, fund balance reflects both the committed appropriations for capital projects and operational reserves.
See Capital Improvement Program Budget for project details regarding the use of monies from this fund.
103
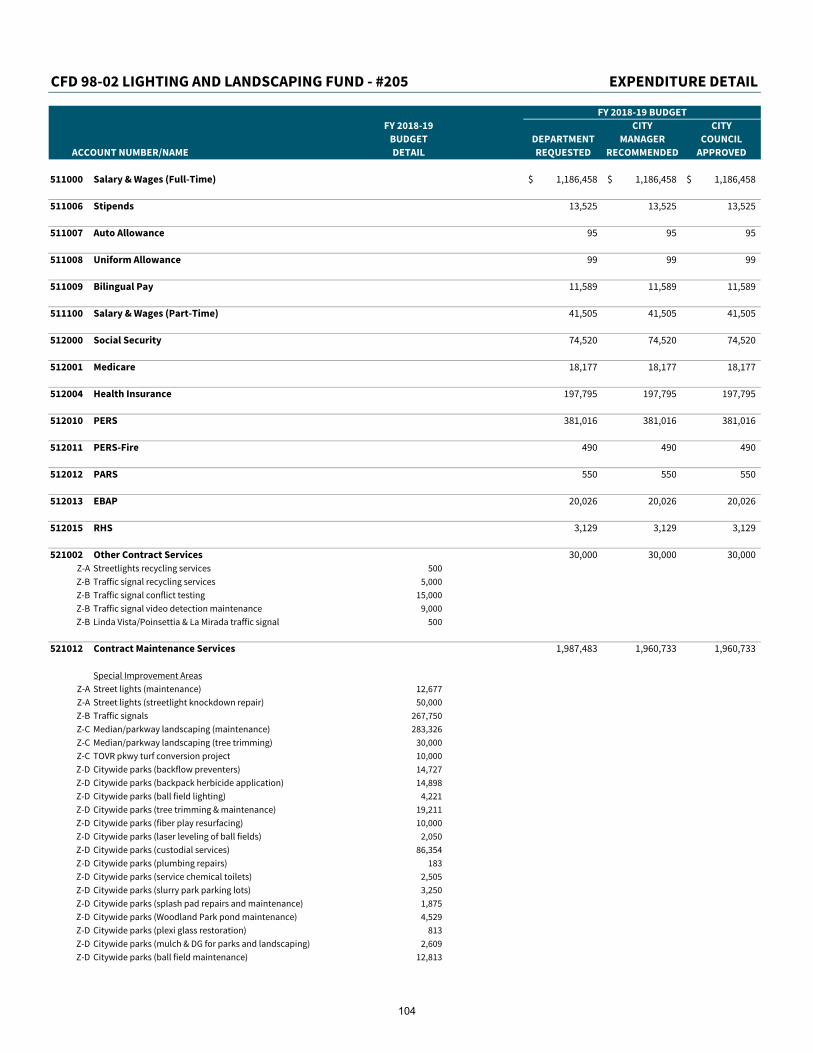
CFD 98-02 LIGHTING AND LANDSCAPING FUND - #205 EXPENDITURE DETAIL
FY 2018-19 BUDGET
FY 2018-19 CITY CITY
BUDGET DEPARTMENT MANAGER COUNCIL
ACCOUNT NUMBER/NAME DETAIL REQUESTED RECOMMENDED APPROVED
511000 Salary & Wages (Full-Time) 1,186,458$ 1,186,458$ 1,186,458$
511006 Stipends 13,525 13,525 13,525
511007 Auto Allowance 95 95 95
511008 Uniform Allowance 99 99 99
511009 Bilingual Pay 11,589 11,589 11,589
511100 Salary & Wages (Part-Time) 41,505 41,505 41,505
512000 Social Security 74,520 74,520 74,520
512001 Medicare 18,177 18,177 18,177
512004 Health Insurance 197,795 197,795 197,795
512010 PERS 381,016 381,016 381,016
512011 PERS-Fire 490 490 490
512012 PARS 550 550 550
512013 EBAP 20,026 20,026 20,026
512015 RHS 3,129 3,129 3,129
521002 Other Contract Services 30,000 30,000 30,000
Z-A Streetlights recycling services 500
Z-B Traffic signal recycling services 5,000
Z-B Traffic signal conflict testing 15,000
Z-B Traffic signal video detection maintenance 9,000
Z-B Linda Vista/Poinsettia & La Mirada traffic signal 500
521012 Contract Maintenance Services 1,987,483 1,960,733 1,960,733
Special Improvement Areas
Z-A Street lights (maintenance) 12,677
Z-A Street lights (streetlight knockdown repair) 50,000
Z-B Traffic signals 267,750
Z-C Median/parkway landscaping (maintenance) 283,326
Z-C Median/parkway landscaping (tree trimming) 30,000
Z-C TOVR pkwy turf conversion project 10,000
Z-D Citywide parks (backflow preventers) 14,727
Z-D Citywide parks (backpack herbicide application) 14,898
Z-D Citywide parks (ball field lighting) 4,221
Z-D Citywide parks (tree trimming & maintenance) 19,211
Z-D Citywide parks (fiber play resurfacing) 10,000
Z-D Citywide parks (laser leveling of ball fields) 2,050
Z-D Citywide parks (custodial services) 86,354
Z-D Citywide parks (plumbing repairs) 183
Z-D Citywide parks (service chemical toilets) 2,505
Z-D Citywide parks (slurry park parking lots) 3,250
Z-D Citywide parks (splash pad repairs and maintenance) 1,875
Z-D Citywide parks (Woodland Park pond maintenance) 4,529
Z-D Citywide parks (plexi glass restoration) 813
Z-D Citywide parks (mulch & DG for parks and landscaping) 2,609
Z-D Citywide parks (ball field maintenance) 12,813
104
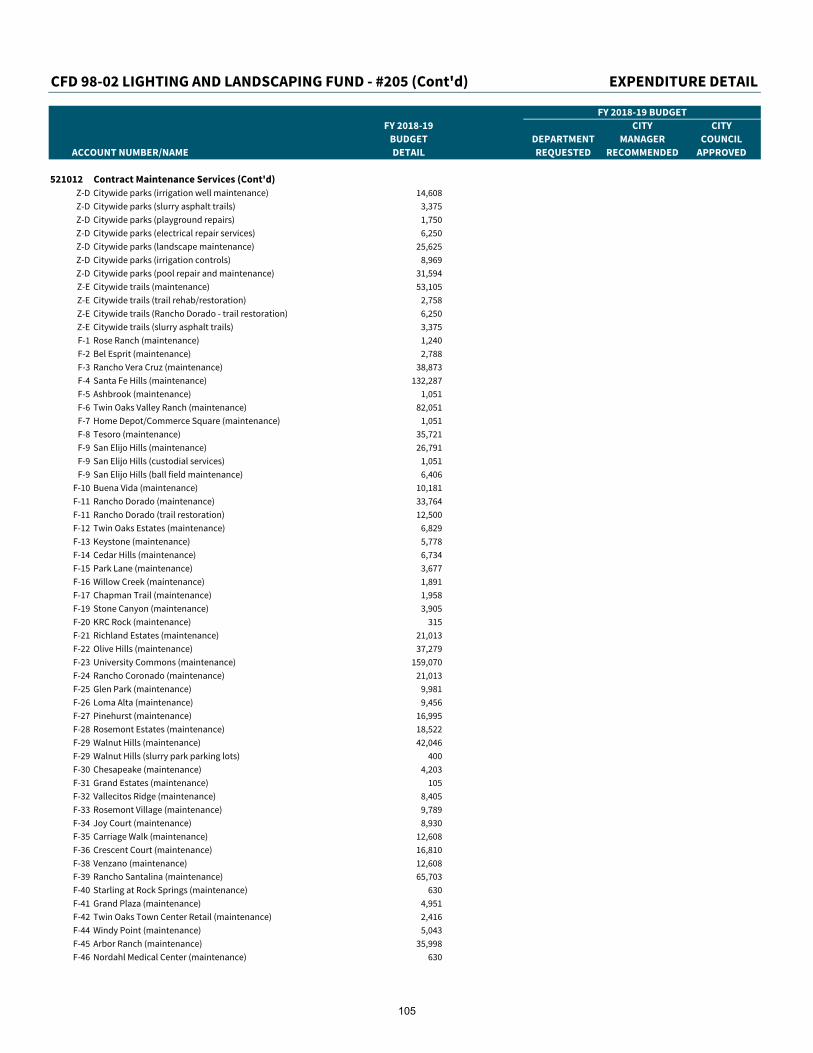
CFD 98-02 LIGHTING AND LANDSCAPING FUND - #205 (Cont'd) EXPENDITURE DETAIL
FY 2018-19 BUDGET
FY 2018-19 CITY CITY
BUDGET DEPARTMENT MANAGER COUNCIL
ACCOUNT NUMBER/NAME DETAIL REQUESTED RECOMMENDED APPROVED
521012 Contract Maintenance Services (Cont'd)
Z-D Citywide parks (irrigation well maintenance) 14,608
Z-D Citywide parks (slurry asphalt trails) 3,375
Z-D Citywide parks (playground repairs) 1,750
Z-D Citywide parks (electrical repair services) 6,250
Z-D Citywide parks (landscape maintenance) 25,625
Z-D Citywide parks (irrigation controls) 8,969
Z-D Citywide parks (pool repair and maintenance) 31,594
Z-E Citywide trails (maintenance) 53,105
Z-E Citywide trails (trail rehab/restoration) 2,758
Z-E Citywide trails (Rancho Dorado - trail restoration) 6,250
Z-E Citywide trails (slurry asphalt trails) 3,375
F-1 Rose Ranch (maintenance) 1,240
F-2 Bel Esprit (maintenance) 2,788
F-3 Rancho Vera Cruz (maintenance) 38,873
F-4 Santa Fe Hills (maintenance) 132,287
F-5 Ashbrook (maintenance) 1,051
F-6 Twin Oaks Valley Ranch (maintenance) 82,051
F-7 Home Depot/Commerce Square (maintenance) 1,051
F-8 Tesoro (maintenance) 35,721
F-9 San Elijo Hills (maintenance) 26,791
F-9 San Elijo Hills (custodial services) 1,051
F-9 San Elijo Hills (ball field maintenance) 6,406
F-10 Buena Vida (maintenance) 10,181
F-11 Rancho Dorado (maintenance) 33,764
F-11 Rancho Dorado (trail restoration) 12,500
F-12 Twin Oaks Estates (maintenance) 6,829
F-13 Keystone (maintenance) 5,778
F-14 Cedar Hills (maintenance) 6,734
F-15 Park Lane (maintenance) 3,677
F-16 Willow Creek (maintenance) 1,891
F-17 Chapman Trail (maintenance) 1,958
F-19 Stone Canyon (maintenance) 3,905
F-20 KRC Rock (maintenance) 315
F-21 Richland Estates (maintenance) 21,013
F-22 Olive Hills (maintenance) 37,279
F-23 University Commons (maintenance) 159,070
F-24 Rancho Coronado (maintenance) 21,013
F-25 Glen Park (maintenance) 9,981
F-26 Loma Alta (maintenance) 9,456
F-27 Pinehurst (maintenance) 16,995
F-28 Rosemont Estates (maintenance) 18,522
F-29 Walnut Hills (maintenance) 42,046
F-29 Walnut Hills (slurry park parking lots) 400
F-30 Chesapeake (maintenance) 4,203
F-31 Grand Estates (maintenance) 105
F-32 Vallecitos Ridge (maintenance) 8,405
F-33 Rosemont Village (maintenance) 9,789
F-34 Joy Court (maintenance) 8,930
F-35 Carriage Walk (maintenance) 12,608
F-36 Crescent Court (maintenance) 16,810
F-38 Venzano (maintenance) 12,608
F-39 Rancho Santalina (maintenance) 65,703
F-40 Starling at Rock Springs (maintenance) 630
F-41 Grand Plaza (maintenance) 4,951
F-42 Twin Oaks Town Center Retail (maintenance) 2,416
F-44 Windy Point (maintenance) 5,043
F-45 Arbor Ranch (maintenance) 35,998
F-46 Nordahl Medical Center (maintenance) 630
105

CFD 98-02 LIGHTING AND LANDSCAPING FUND - #205 (Cont'd) EXPENDITURE DETAIL
FY 2018-19 BUDGET
FY 2018-19 CITY CITY
BUDGET DEPARTMENT MANAGER COUNCIL
ACCOUNT NUMBER/NAME DETAIL REQUESTED RECOMMENDED APPROVED
521012 Contract Maintenance Services (Cont'd)
F-47 Autumn Terrace (maintenance) 2,962
F-48 Sierra Madre Academy (maintenance) 2,416
F-49 CVS Las Posas (maintenance) 2,311
F-51 Campus Pointe (maintenance) 1,051
F-52 Westlake Village (maintenance) 4,582
F-53 Armorlite (maintenance) 14,515
521016 Pest Control Services 5,750 5,750 5,750
Z-D Citywide parks
531004 Janitorial Services 7,688 7,688 7,688
Z-D Citywide parks
531008 Fertilizers/Herbicides 19,561 19,561 19,561
Z-D Citywide parks
531009 Construction Materials 8,431 8,431 8,431
Construction and BMP materials 8,431
531010 Small Tools 1,891 1,891 1,891
Z-B Traffic signals (traffic signal tools) 1,000
Z-D Citywide parks (maintenance & hand tools) 391
Z-D Citywide parks (inspection tools) 500
532010 Equipment Rental 375 375 375
Z-D Citywide parks (general equipment)
541000 Building Repair & Maintenance 16,300 16,300 16,300
541002 Electrical Repair & Maintenance 600 600 600
541005 Plumbing Repair & Maintenance 600 600 600
541006 Pool Repair & Maintenance 10,531 10,531 10,531
544000 Sign Maintenance 865 865 865
Z-D Citywide parks (new and replacement signs)
544001 Traffic Signal Maintenance 397,125 397,125 397,125
Z-B Traffic signals (materials and supplies) 31,525
Z-B Traffic signals (battery backup replacement for signals) 270,000
Z-B Traffic signals (knockdown cabinet replacements) 50,000
Z-B Traffic signals (conflict materials) 45,600
544002 Street Lighting 25,000 25,000 25,000
Z-A Street lighting (maintenance materials)
544004 Tree & Landscape 10,640 10,640 10,640
Z-D Citywide parks (tree and shrub materials)
544005 Irrigation Systems 17,169 17,169 17,169
Z-D Citywide parks
551000 Electric & Gas 125,000 125,000 125,000
551001 Electric-Street Lighting 122,869 122,869 122,869
Z-A Street lighting
106

CFD 98-02 LIGHTING AND LANDSCAPING FUND - #205 (Cont'd) EXPENDITURE DETAIL
FY 2018-19 BUDGET
FY 2018-19 CITY CITY
BUDGET DEPARTMENT MANAGER COUNCIL
ACCOUNT NUMBER/NAME DETAIL REQUESTED RECOMMENDED APPROVED
551002 Electric-Traffic Signals 90,950 90,950 90,950
Z-B Traffic signals
552000 Water 822,250 822,250 822,250
Includes CFD parks, trails, medians, street lights, traffic signals and F zones
571002 Principal-Other 65,166 65,166 65,166
572002 Interest-Other 6,299 6,299 6,299
582000 Operating Transfers Out 650,000 650,000 650,000
Totals 6,371,517$ 6,344,767$ 6,344,767$
107

|
This page intentionally left blank.
108
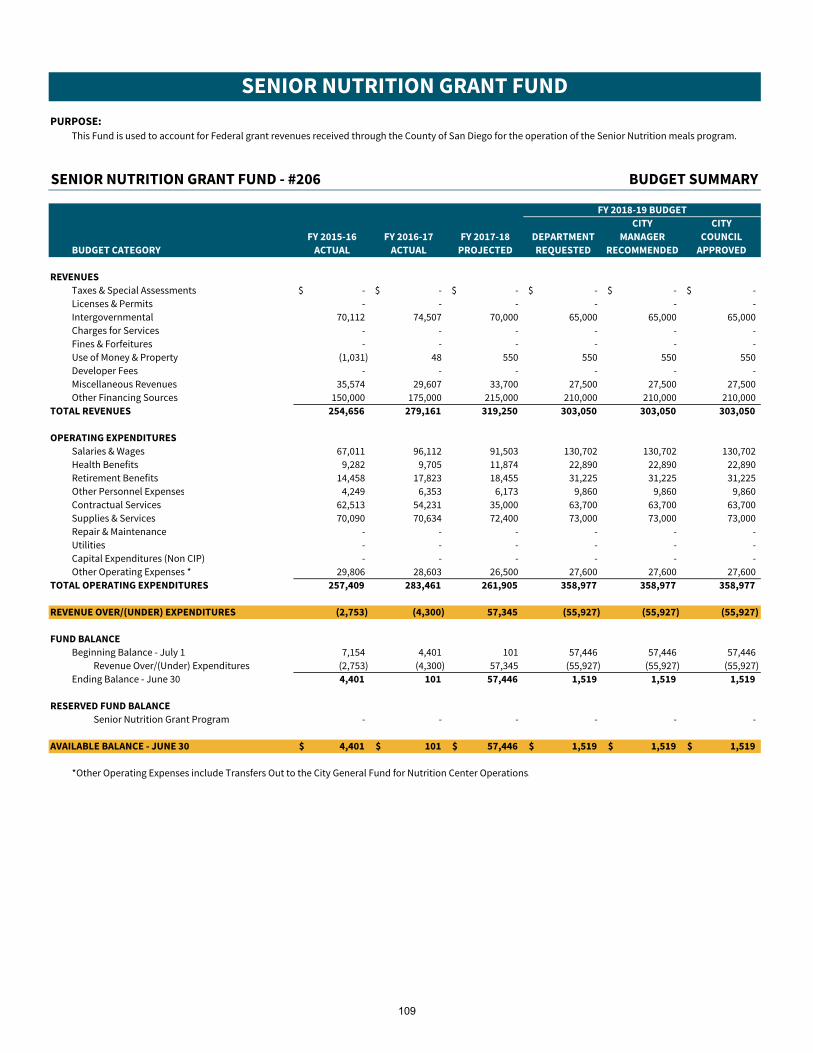
SENIOR NUTRITION GRANT FUND
PURPOSE:
This Fund is used to account for Federal grant revenues received through the County of San Diego for the operation of the Senior Nutrition meals program.
SENIOR NUTRITION GRANT FUND - #206 BUDGET SUMMARY
FY 2018-19 BUDGET
CITY CITY
FY 2015-16 FY 2016-17 FY 2017-18 DEPARTMENT MANAGER COUNCIL
BUDGET CATEGORY ACTUAL ACTUAL PROJECTED REQUESTED RECOMMENDED APPROVED
REVENUES
Taxes & Special Assessments -$ -$ -$ -$ -$ -$
Licenses & Permits - - - - - -
Intergovernmental 70,112 74,507 70,000 65,000 65,000 65,000
Charges for Services - - - - - -
Fines & Forfeitures - - - - - -
Use of Money & Property (1,031) 48 550 550 550 550
Developer Fees - - - - - -
Miscellaneous Revenues 35,574 29,607 33,700 27,500 27,500 27,500
Other Financing Sources 150,000 175,000 215,000 210,000 210,000 210,000
TOTAL REVENUES 254,656 279,161 319,250 303,050 303,050 303,050
OPERATING EXPENDITURES
Salaries & Wages 67,011 96,112 91,503 130,702 130,702 130,702
Health Benefits 9,282 9,705 11,874 22,890 22,890 22,890
Retirement Benefits 14,458 17,823 18,455 31,225 31,225 31,225
Other Personnel Expenses 4,249 6,353 6,173 9,860 9,860 9,860
Contractual Services 62,513 54,231 35,000 63,700 63,700 63,700
Supplies & Services 70,090 70,634 72,400 73,000 73,000 73,000
Repair & Maintenance - - - - - -
Utilities - - - - - -
Capital Expenditures (Non CIP) - - - - - -
Other Operating Expenses * 29,806 28,603 26,500 27,600 27,600 27,600
TOTAL OPERATING EXPENDITURES 257,409 283,461 261,905 358,977 358,977 358,977
REVENUE OVER/(UNDER) EXPENDITURES (2,753) (4,300) 57,345 (55,927) (55,927) (55,927)
FUND BALANCE
Beginning Balance - July 1 7,154 4,401 101 57,446 57,446 57,446
Revenue Over/(Under) Expenditures (2,753) (4,300) 57,345 (55,927) (55,927) (55,927)
Ending Balance - June 30 4,401 101 57,446 1,519 1,519 1,519
RESERVED FUND BALANCE
Senior Nutrition Grant Program - - - - - -
AVAILABLE BALANCE - JUNE 30 4,401$ 101$ 57,446$ 1,519$ 1,519$ 1,519$
*Other Operating Expenses include Transfers Out to the City General Fund for Nutrition Center Operations.
109
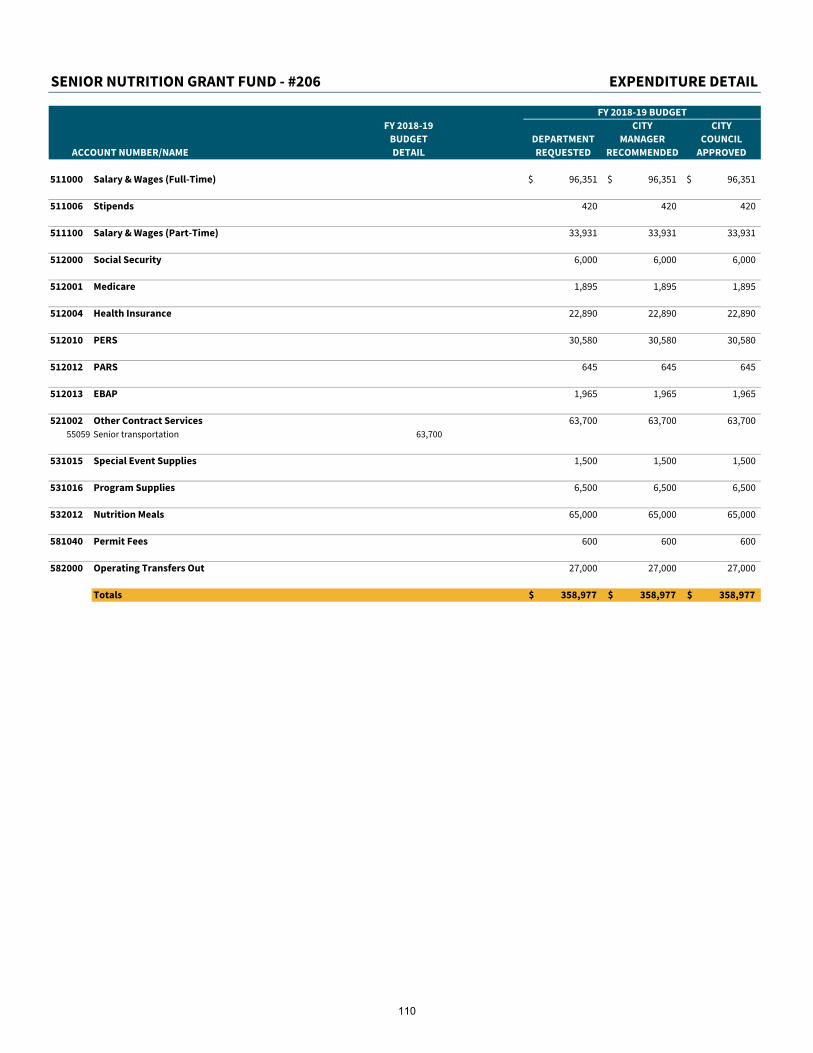
SENIOR NUTRITION GRANT FUND - #206 EXPENDITURE DETAIL
FY 2018-19 BUDGET
FY 2018-19 CITY CITY
BUDGET DEPARTMENT MANAGER COUNCIL
ACCOUNT NUMBER/NAME DETAIL REQUESTED RECOMMENDED APPROVED
511000 Salary & Wages (Full-Time) 96,351$ 96,351$ 96,351$
511006 Stipends 420 420 420
511100 Salary & Wages (Part-Time) 33,931 33,931 33,931
512000 Social Security 6,000 6,000 6,000
512001 Medicare 1,895 1,895 1,895
512004 Health Insurance 22,890 22,890 22,890
512010 PERS 30,580 30,580 30,580
512012 PARS 645 645 645
512013 EBAP 1,965 1,965 1,965
521002 Other Contract Services 63,700 63,700 63,700
55059 Senior transportation 63,700
531015 Special Event Supplies 1,500 1,500 1,500
531016 Program Supplies 6,500 6,500 6,500
532012 Nutrition Meals 65,000 65,000 65,000
581040 Permit Fees 600 600 600
582000 Operating Transfers Out 27,000 27,000 27,000
Totals 358,977$ 358,977$ 358,977$
110

CDBG FUND
PURPOSE:
This Fund is used to account for transactions relating to the Community Development Block Grant Program provided by the Federal Government. Funds are
mostly utilized for capital improvement projects, fair housing services, and non-profit coordination benefiting low and moderate income areas within the City.
CDBG FUND - #207 BUDGET SUMMARY
FY 2018-19 BUDGET
CITY CITY
FY 2015-16 FY 2016-17 FY 2017-18 DEPARTMENT MANAGER COUNCIL
BUDGET CATEGORY ACTUAL ACTUAL PROJECTED REQUESTED RECOMMENDED APPROVED
REVENUES
Taxes & Special Assessments -$ -$ -$ -$ -$ -$
Licenses & Permits - - - - - -
Intergovernmental 296,637 569,276 556,013 698,377 698,377 698,377
Charges for Services - - - - - -
Fines & Forfeitures - - - - - -
Use of Money & Property - - - - - -
Developer Fees - - - - - -
Miscellaneous Revenues - - - - - -
Other Financing Sources - - - - - -
TOTAL REVENUES 296,637 569,276 556,013 698,377 698,377 698,377
OPERATING EXPENDITURES
Salaries & Wages 82,930 76,905 59,204 84,540 84,540 84,540
Health Benefits 3,066 5,292 8,879 12,813 12,813 12,813
Retirement Benefits 24,897 22,118 17,345 26,690 26,690 26,690
Other Personnel Expenses 6,588 5,791 4,852 7,378 7,378 7,378
Contractual Services 45,008 41,905 42,408 50,473 50,473 50,473
Supplies & Services 2,858 1,814 3,500 3,500 3,500 3,500
Repair & Maintenance - - - - - -
Utilities - - - - - -
Capital Expenditures (Non CIP) - - - - - -
Other Operating Expenses 825 35 1,400 1,400 1,400 1,400
TOTAL OPERATING EXPENDITURES 166,173 153,859 137,588 186,794 186,794 186,794
CIP PROJECT EXPENDITURES 123,607 408,233 173,377 - - -
TOTAL EXPENDITURES 289,780 562,092 310,965 186,794 186,794 186,794
REVENUE OVER/(UNDER) EXPENDITURES 6,857 7,184 245,048 511,583 511,583 511,583
FUND BALANCE
Beginning Balance - July 1 84,620 91,477 98,661 343,709 343,709 343,709
Revenue Over/(Under) Expenditures 6,857 7,184 245,048 511,583 511,583 511,583
Ending Balance - June 30 91,477 98,661 343,709 855,292 855,292 855,292
RESERVED FUND BALANCE *
Capital Projects - Beginning Balance 193,443 193,443 193,443 193,443
CIP New Appropriations - 508,729 508,729 508,729
CIP Appropriation Adjustments - - - -
Capital Projects - Ending Balance 193,443 702,172 702,172 702,172
AVAILABLE FUND BALANCE - JUNE 30 91,477$ 98,661$ 150,266$ 153,120$ 153,120$ 153,120$
* Beginning in FY 2017-18, fund balance reflects both the committed appropriations for capital projects and operational reserves.
See Capital Improvement Program Budget for project details regarding the use of monies from this fund.
111
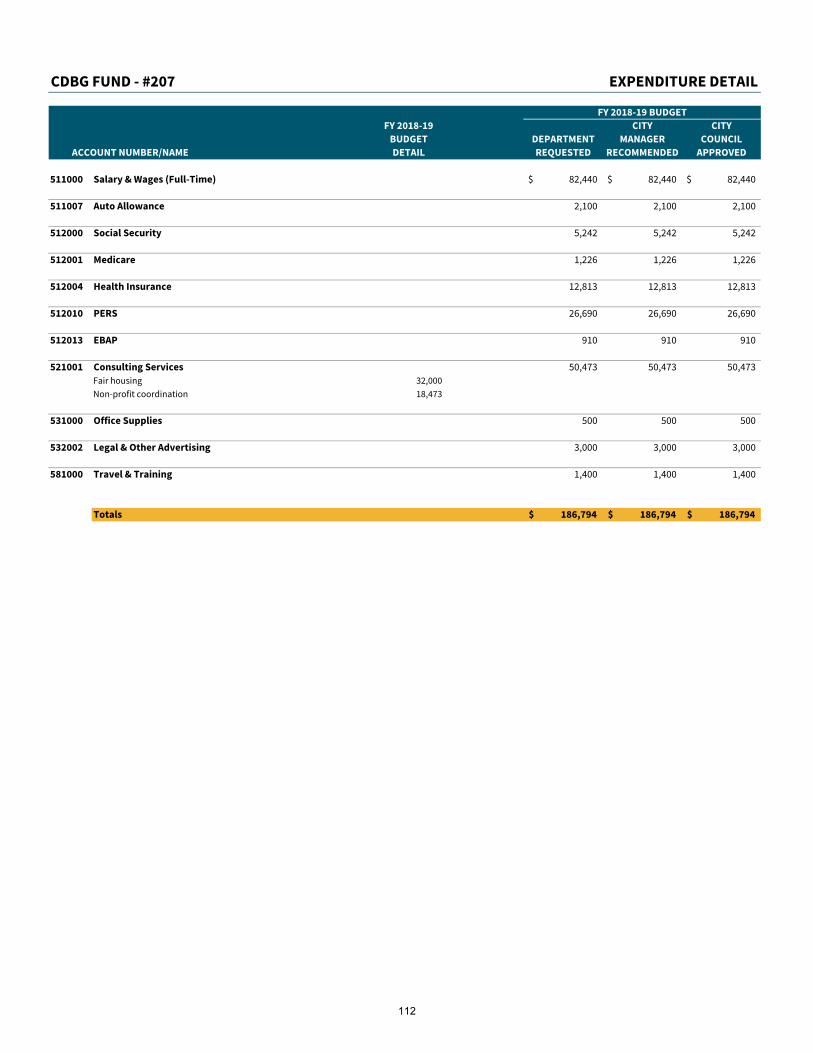
CDBG FUND - #207 EXPENDITURE DETAIL
FY 2018-19 BUDGET
FY 2018-19 CITY CITY
BUDGET DEPARTMENT MANAGER COUNCIL
ACCOUNT NUMBER/NAME DETAIL REQUESTED RECOMMENDED APPROVED
511000 Salary & Wages (Full-Time) 82,440$ 82,440$ 82,440$
511007 Auto Allowance 2,100 2,100 2,100
512000 Social Security 5,242 5,242 5,242
512001 Medicare 1,226 1,226 1,226
512004 Health Insurance 12,813 12,813 12,813
512010 PERS 26,690 26,690 26,690
512013 EBAP 910 910 910
521001 Consulting Services 50,473 50,473 50,473
Fair housing 32,000
Non-profit coordination 18,473
531000 Office Supplies 500 500 500
532002 Legal & Other Advertising 3,000 3,000 3,000
581000 Travel & Training 1,400 1,400 1,400
Totals 186,794$ 186,794$ 186,794$
112

CENTER DR MAINTENANCE DISTRICT FUND
PURPOSE:
This Fund is used to account for the costs of providing street maintenance services to certain properties. The benefiting properties are assessed for a portion
of the costs.
CENTER DR MAINTENANCE DISTRICT FUND - #211 BUDGET SUMMARY
FY 2018-19 BUDGET
CITY CITY
FY 2015-16 FY 2016-17 FY 2017-18 DEPARTMENT MANAGER COUNCIL
BUDGET CATEGORY ACTUAL ACTUAL PROJECTED REQUESTED RECOMMENDED APPROVED
REVENUES
Taxes & Special Assessments 28,517$ 21,284$ 28,510$ 31,775$ 31,775$ 31,775$
Licenses & Permits - - - - - -
Intergovernmental - - - - - -
Charges for Services - - - - - -
Fines & Forfeitures - - - - - -
Use of Money & Property 1,372 322 1,125 1,250 1,250 1,250
Developer Fees - - - - - -
Miscellaneous Revenues - - - - - -
Other Financing Sources - - - - - -
TOTAL REVENUES 29,889 21,606 29,635 33,025 33,025 33,025
OPERATING EXPENDITURES
Salaries & Wages - - - - - -
Health Benefits - - - - - -
Retirement Benefits - - - - - -
Other Personnel Expenses - - - - - -
Contractual Services 3,708 3,000 8,667 5,647 5,647 5,647
Supplies & Services - - 500 500 500 500
Repair & Maintenance - - - - - -
Utilities 899 906 978 971 971 971
Capital Expenditures (Non CIP) - - - - - -
Other Operating Expenses 7,671 10,649 10,500 13,500 13,500 13,500
TOTAL OPERATING EXPENDITURES 12,277 14,554 20,645 20,618 20,618 20,618
CIP PROJECT EXPENDITURES - - - - - -
TOTAL EXPENDITURES 12,277 14,554 20,645 20,618 20,618 20,618
REVENUE OVER/(UNDER) EXPENDITURES 17,612 7,051 8,990 12,407 12,407 12,407
FUND BALANCE
Beginning Balance - July 1 85,228 102,840 109,891 118,881 118,881 118,881
Revenue Over/(Under) Expenditures 17,612 7,051 8,990 12,407 12,407 12,407
Ending Balance - June 30 102,840 109,891 118,881 131,288 131,288 131,288
RESERVED FUND BALANCE
Street Maintenance - - - - - -
AVAILABLE FUND BALANCE - JUNE 30 102,840$ 109,891$ 118,881$ 131,288$ 131,288$ 131,288$
113
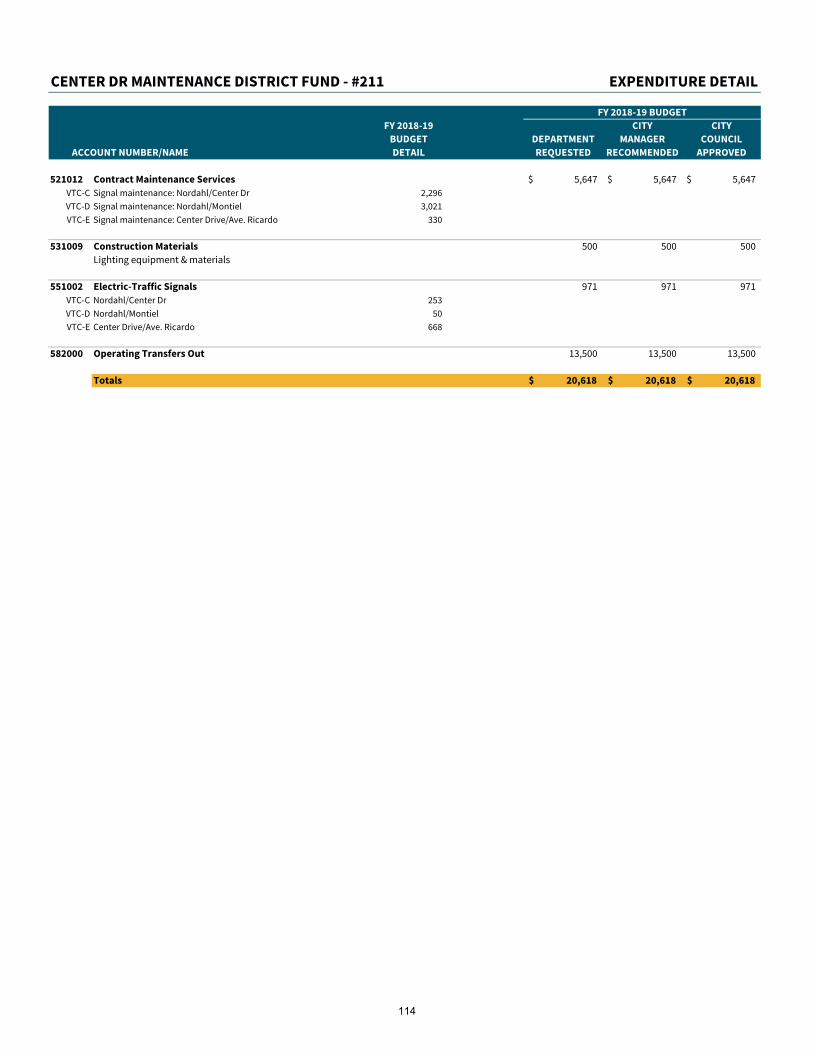
CENTER DR MAINTENANCE DISTRICT FUND - #211 EXPENDITURE DETAIL
FY 2018-19 BUDGET
FY 2018-19 CITY CITY
BUDGET DEPARTMENT MANAGER COUNCIL
ACCOUNT NUMBER/NAME DETAIL REQUESTED RECOMMENDED APPROVED
521012 Contract Maintenance Services 5,647$ 5,647$ 5,647$
VTC-C Signal maintenance: Nordahl/Center Dr 2,296
VTC-D Signal maintenance: Nordahl/Montiel 3,021
VTC-E Signal maintenance: Center Drive/Ave. Ricardo 330
531009 Construction Materials 500 500 500
Lighting equipment & materials
551002 Electric-Traffic Signals 971 971 971
VTC-C Nordahl/Center Dr 253
VTC-D Nordahl/Montiel 50
VTC-E Center Drive/Ave. Ricardo 668
582000 Operating Transfers Out 13,500 13,500 13,500
Totals 20,618$ 20,618$ 20,618$
114
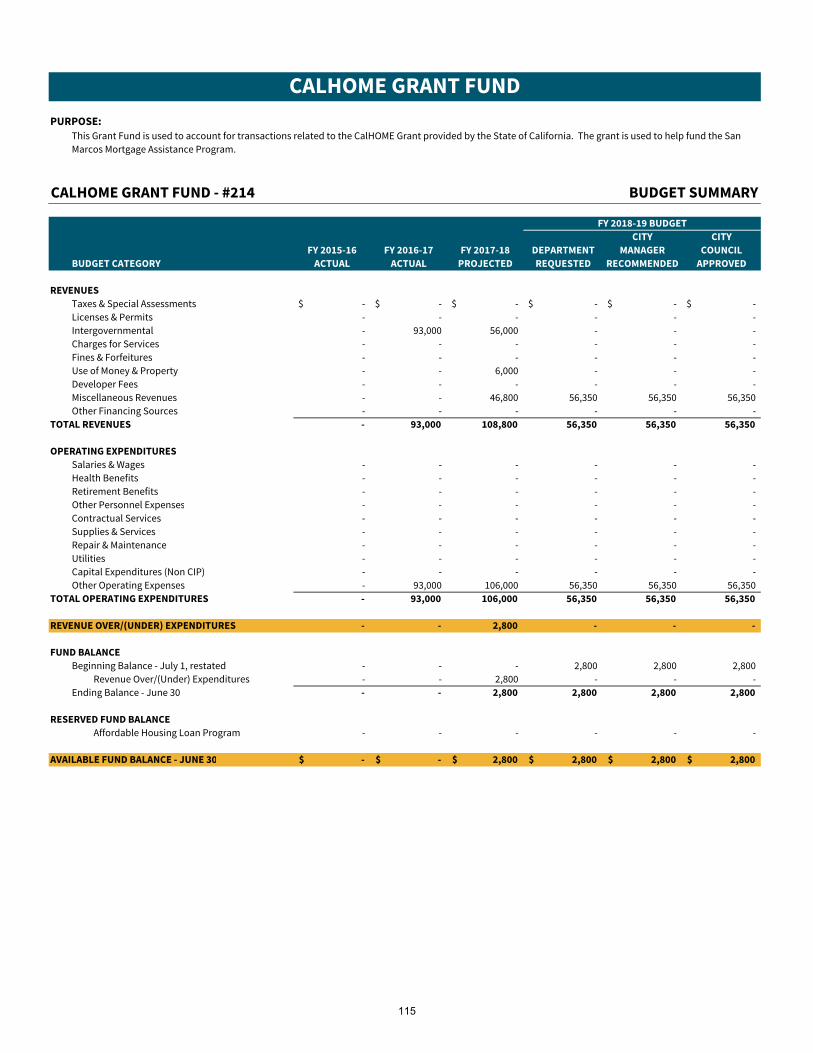
CALHOME GRANT FUND
PURPOSE:
This Grant Fund is used to account for transactions related to the CalHOME Grant provided by the State of California. The grant is used to help fund the San
Marcos Mortgage Assistance Program.
CALHOME GRANT FUND - #214 BUDGET SUMMARY
FY 2018-19 BUDGET
CITY CITY
FY 2015-16 FY 2016-17 FY 2017-18 DEPARTMENT MANAGER COUNCIL
BUDGET CATEGORY ACTUAL ACTUAL PROJECTED REQUESTED RECOMMENDED APPROVED
REVENUES
Taxes & Special Assessments -$ -$ -$ -$ -$ -$
Licenses & Permits - - - - - -
Intergovernmental - 93,000 56,000 - - -
Charges for Services - - - - - -
Fines & Forfeitures - - - - - -
Use of Money & Property - - 6,000 - - -
Developer Fees - - - - - -
Miscellaneous Revenues - - 46,800 56,350 56,350 56,350
Other Financing Sources - - - - - -
TOTAL REVENUES - 93,000 108,800 56,350 56,350 56,350
OPERATING EXPENDITURES
Salaries & Wages - - - - - -
Health Benefits - - - - - -
Retirement Benefits - - - - - -
Other Personnel Expenses - - - - - -
Contractual Services - - - - - -
Supplies & Services - - - - - -
Repair & Maintenance - - - - - -
Utilities - - - - - -
Capital Expenditures (Non CIP) - - - - - -
Other Operating Expenses - 93,000 106,000 56,350 56,350 56,350
TOTAL OPERATING EXPENDITURES - 93,000 106,000 56,350 56,350 56,350
REVENUE OVER/(UNDER) EXPENDITURES - - 2,800 - - -
FUND BALANCE
Beginning Balance - July 1, restated - - - 2,800 2,800 2,800
Revenue Over/(Under) Expenditures - - 2,800 - - -
Ending Balance - June 30 - - 2,800 2,800 2,800 2,800
RESERVED FUND BALANCE
Affordable Housing Loan Program - - - - - -
AVAILABLE FUND BALANCE - JUNE 30 -$ -$ 2,800$ 2,800$ 2,800$ 2,800$
115

|
This page intentionally left blank.
116
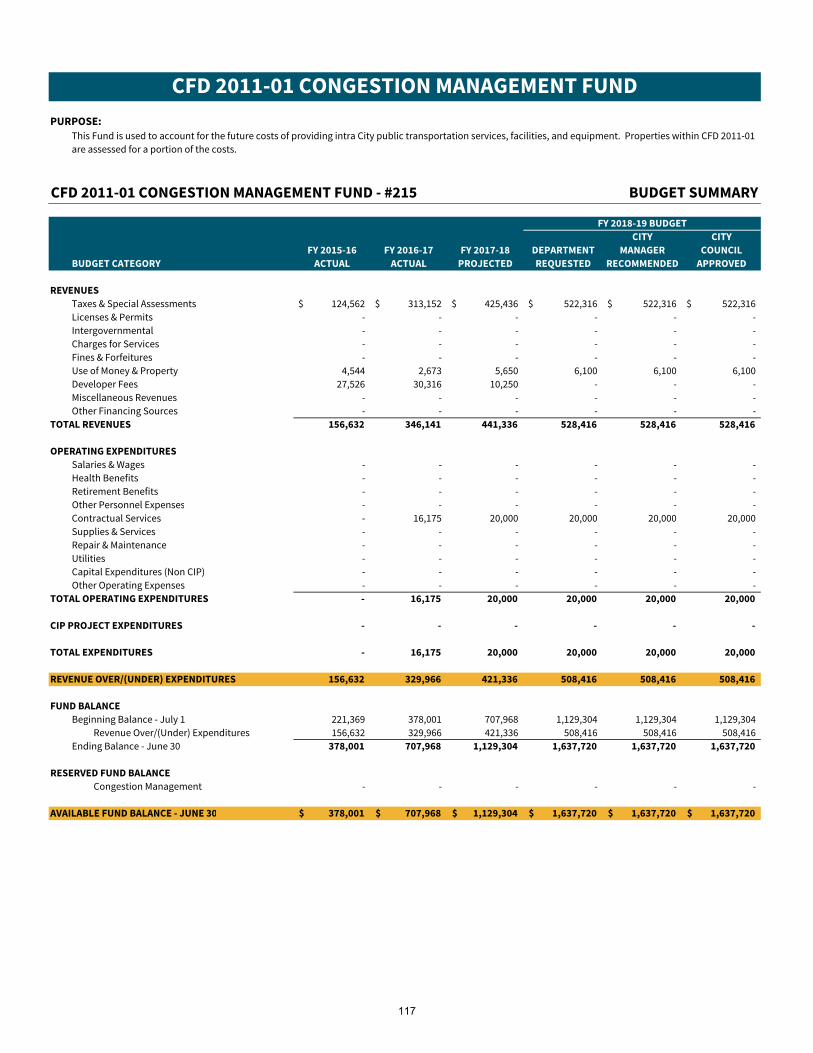
CFD 2011-01 CONGESTION MANAGEMENT FUND
PURPOSE:
This Fund is used to account for the future costs of providing intra City public transportation services, facilities, and equipment. Properties within CFD 2011-01
are assessed for a portion of the costs.
CFD 2011-01 CONGESTION MANAGEMENT FUND - #215 BUDGET SUMMARY
FY 2018-19 BUDGET
CITY CITY
FY 2015-16 FY 2016-17 FY 2017-18 DEPARTMENT MANAGER COUNCIL
BUDGET CATEGORY ACTUAL ACTUAL PROJECTED REQUESTED RECOMMENDED APPROVED
REVENUES
Taxes & Special Assessments 124,562$ 313,152$ 425,436$ 522,316$ 522,316$ 522,316$
Licenses & Permits - - - - - -
Intergovernmental - - - - - -
Charges for Services - - - - - -
Fines & Forfeitures - - - - - -
Use of Money & Property 4,544 2,673 5,650 6,100 6,100 6,100
Developer Fees 27,526 30,316 10,250 - - -
Miscellaneous Revenues - - - - - -
Other Financing Sources - - - - - -
TOTAL REVENUES 156,632 346,141 441,336 528,416 528,416 528,416
OPERATING EXPENDITURES
Salaries & Wages - - - - - -
Health Benefits - - - - - -
Retirement Benefits - - - - - -
Other Personnel Expenses - - - - - -
Contractual Services - 16,175 20,000 20,000 20,000 20,000
Supplies & Services - - - - - -
Repair & Maintenance - - - - - -
Utilities - - - - - -
Capital Expenditures (Non CIP) - - - - - -
Other Operating Expenses - - - - - -
TOTAL OPERATING EXPENDITURES - 16,175 20,000 20,000 20,000 20,000
CIP PROJECT EXPENDITURES - - - - - -
TOTAL EXPENDITURES - 16,175 20,000 20,000 20,000 20,000
REVENUE OVER/(UNDER) EXPENDITURES 156,632 329,966 421,336 508,416 508,416 508,416
FUND BALANCE
Beginning Balance - July 1 221,369 378,001 707,968 1,129,304 1,129,304 1,129,304
Revenue Over/(Under) Expenditures 156,632 329,966 421,336 508,416 508,416 508,416
Ending Balance - June 30 378,001 707,968 1,129,304 1,637,720 1,637,720 1,637,720
RESERVED FUND BALANCE
Congestion Management - - - - - -
AVAILABLE FUND BALANCE - JUNE 30 378,001$ 707,968$ 1,129,304$ 1,637,720$ 1,637,720$ 1,637,720$
117

|
This page intentionally left blank.
118
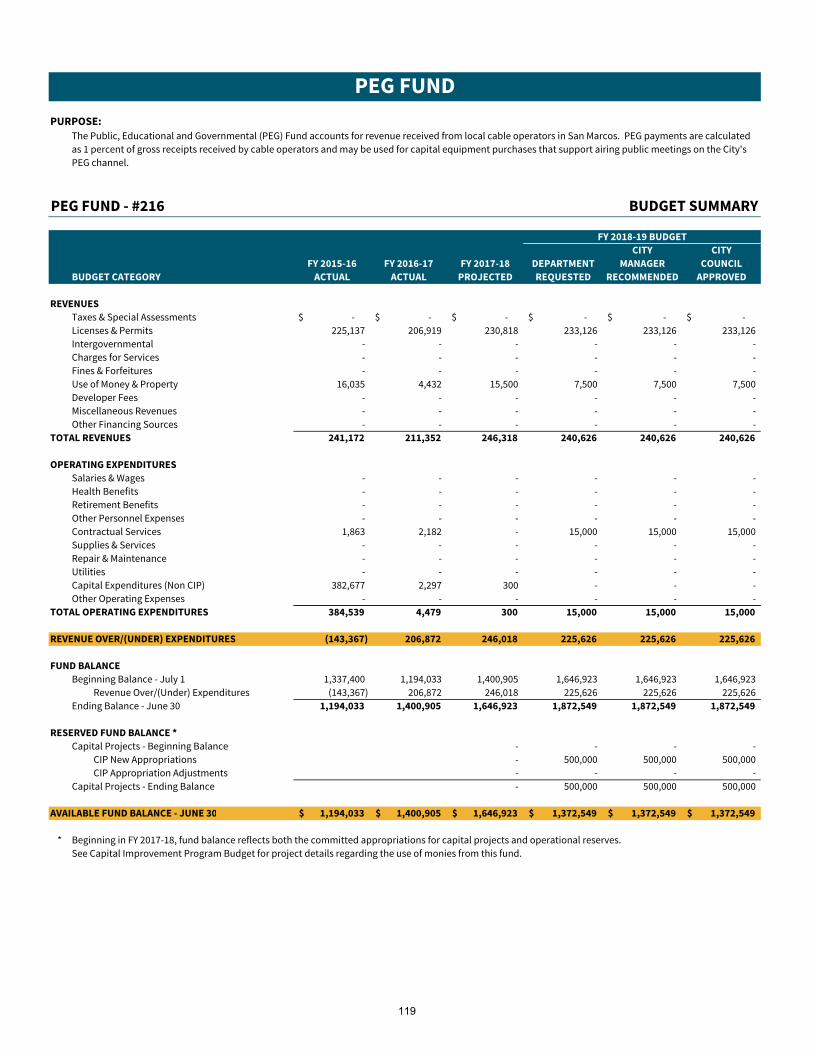
PEG FUND
PURPOSE:
The Public, Educational and Governmental (PEG) Fund accounts for revenue received from local cable operators in San Marcos. PEG payments are calculated
as 1 percent of gross receipts received by cable operators and may be used for capital equipment purchases that support airing public meetings on the City's
PEG channel.
PEG FUND - #216 BUDGET SUMMARY
FY 2018-19 BUDGET
CITY CITY
FY 2015-16 FY 2016-17 FY 2017-18 DEPARTMENT MANAGER COUNCIL
BUDGET CATEGORY ACTUAL ACTUAL PROJECTED REQUESTED RECOMMENDED APPROVED
REVENUES
Taxes & Special Assessments -$ -$ -$ -$ -$ -$
Licenses & Permits 225,137 206,919 230,818 233,126 233,126 233,126
Intergovernmental - - - - - -
Charges for Services - - - - - -
Fines & Forfeitures - - - - - -
Use of Money & Property 16,035 4,432 15,500 7,500 7,500 7,500
Developer Fees - - - - - -
Miscellaneous Revenues - - - - - -
Other Financing Sources - - - - - -
TOTAL REVENUES 241,172 211,352 246,318 240,626 240,626 240,626
OPERATING EXPENDITURES
Salaries & Wages - - - - - -
Health Benefits - - - - - -
Retirement Benefits - - - - - -
Other Personnel Expenses - - - - - -
Contractual Services 1,863 2,182 - 15,000 15,000 15,000
Supplies & Services - - - - - -
Repair & Maintenance - - - - - -
Utilities - - - - - -
Capital Expenditures (Non CIP) 382,677 2,297 300 - - -
Other Operating Expenses - - - - - -
TOTAL OPERATING EXPENDITURES 384,539 4,479 300 15,000 15,000 15,000
REVENUE OVER/(UNDER) EXPENDITURES (143,367) 206,872 246,018 225,626 225,626 225,626
FUND BALANCE
Beginning Balance - July 1 1,337,400 1,194,033 1,400,905 1,646,923 1,646,923 1,646,923
Revenue Over/(Under) Expenditures (143,367) 206,872 246,018 225,626 225,626 225,626
Ending Balance - June 30 1,194,033 1,400,905 1,646,923 1,872,549 1,872,549 1,872,549
RESERVED FUND BALANCE *
Capital Projects - Beginning Balance - - - -
CIP New Appropriations - 500,000 500,000 500,000
CIP Appropriation Adjustments - - - -
Capital Projects - Ending Balance - 500,000 500,000 500,000
AVAILABLE FUND BALANCE - JUNE 30 1,194,033$ 1,400,905$ 1,646,923$ 1,372,549$ 1,372,549$ 1,372,549$
* Beginning in FY 2017-18, fund balance reflects both the committed appropriations for capital projects and operational reserves.
See Capital Improvement Program Budget for project details regarding the use of monies from this fund.
119
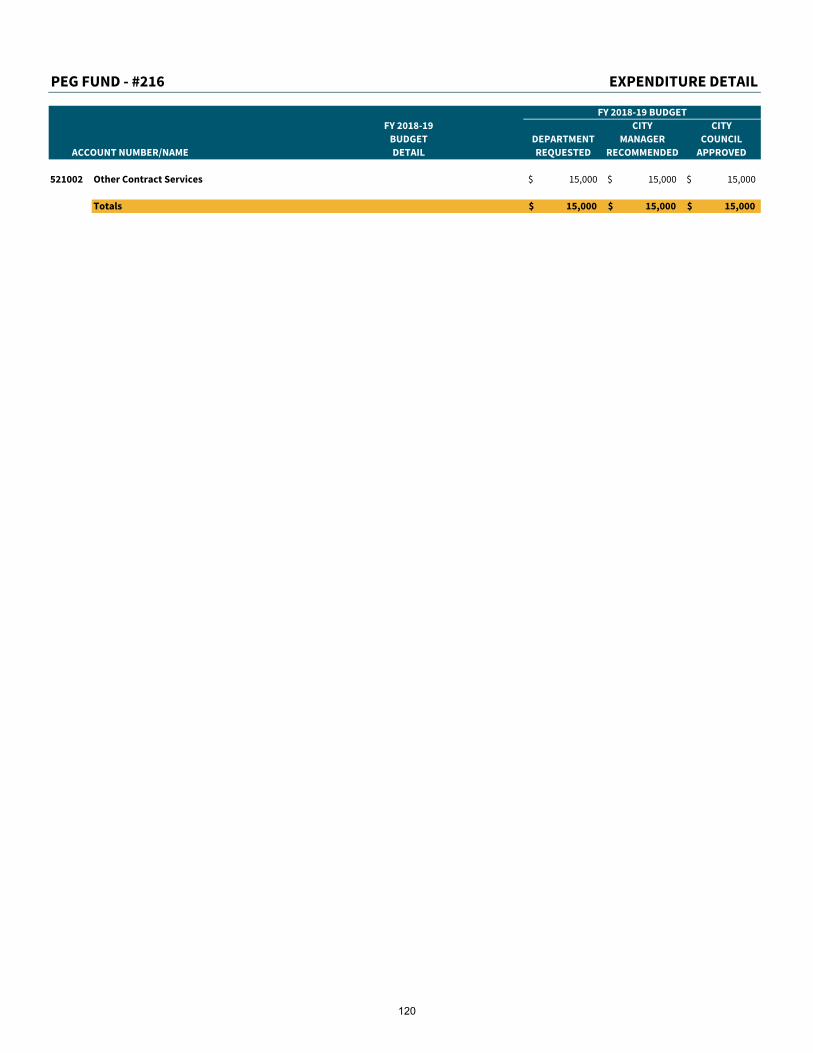
PEG FUND - #216 EXPENDITURE DETAIL
FY 2018-19 BUDGET
FY 2018-19 CITY CITY
BUDGET DEPARTMENT MANAGER COUNCIL
ACCOUNT NUMBER/NAME DETAIL REQUESTED RECOMMENDED APPROVED
521002 Other Contract Services 15,000$ 15,000$ 15,000$
Totals 15,000$ 15,000$ 15,000$
120
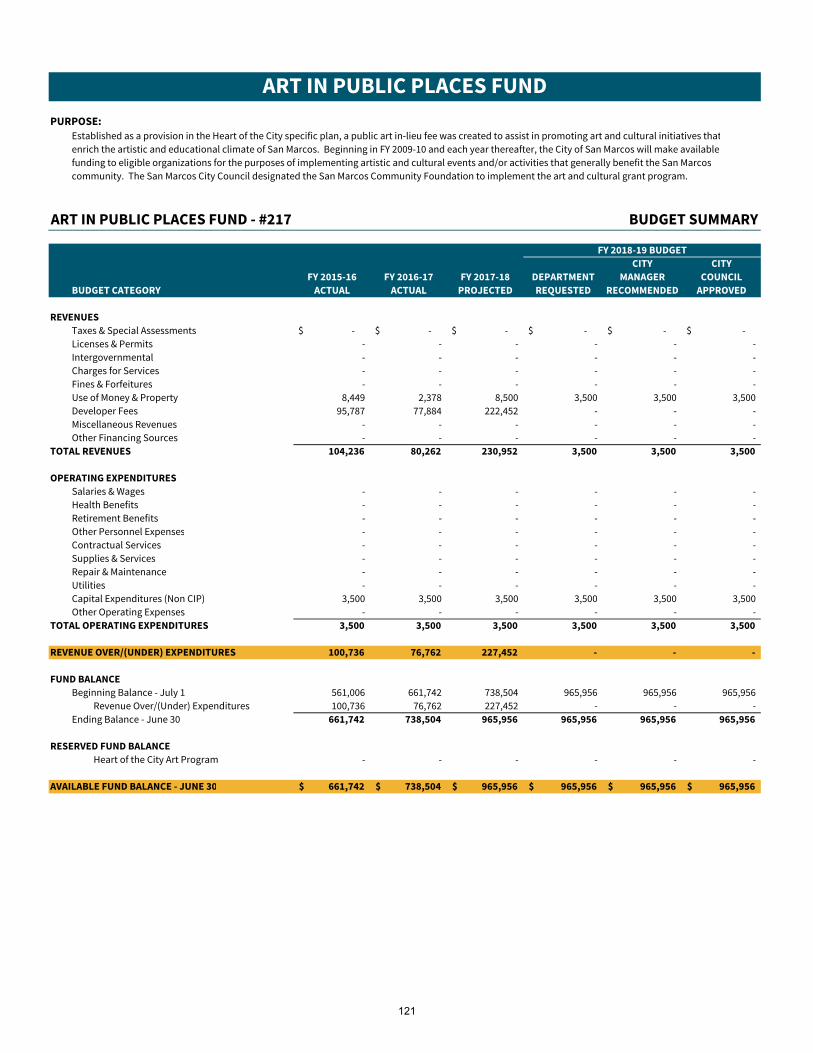
ART IN PUBLIC PLACES FUND
PURPOSE:
Established as a provision in the Heart of the City specific plan, a public art in-lieu fee was created to assist in promoting art and cultural initiatives that
enrich the artistic and educational climate of San Marcos. Beginning in FY 2009-10 and each year thereafter, the City of San Marcos will make available
funding to eligible organizations for the purposes of implementing artistic and cultural events and/or activities that generally benefit the San Marcos
community. The San Marcos City Council designated the San Marcos Community Foundation to implement the art and cultural grant program.
ART IN PUBLIC PLACES FUND - #217 BUDGET SUMMARY
FY 2018-19 BUDGET
CITY CITY
FY 2015-16 FY 2016-17 FY 2017-18 DEPARTMENT MANAGER COUNCIL
BUDGET CATEGORY ACTUAL ACTUAL PROJECTED REQUESTED RECOMMENDED APPROVED
REVENUES
Taxes & Special Assessments -$ -$ -$ -$ -$ -$
Licenses & Permits - - - - - -
Intergovernmental - - - - - -
Charges for Services - - - - - -
Fines & Forfeitures - - - - - -
Use of Money & Property 8,449 2,378 8,500 3,500 3,500 3,500
Developer Fees 95,787 77,884 222,452 - - -
Miscellaneous Revenues - - - - - -
Other Financing Sources - - - - - -
TOTAL REVENUES 104,236 80,262 230,952 3,500 3,500 3,500
OPERATING EXPENDITURES
Salaries & Wages - - - - - -
Health Benefits - - - - - -
Retirement Benefits - - - - - -
Other Personnel Expenses - - - - - -
Contractual Services - - - - - -
Supplies & Services - - - - - -
Repair & Maintenance - - - - - -
Utilities - - - - - -
Capital Expenditures (Non CIP) 3,500 3,500 3,500 3,500 3,500 3,500
Other Operating Expenses - - - - - -
TOTAL OPERATING EXPENDITURES 3,500 3,500 3,500 3,500 3,500 3,500
REVENUE OVER/(UNDER) EXPENDITURES 100,736 76,762 227,452 - - -
FUND BALANCE
Beginning Balance - July 1 561,006 661,742 738,504 965,956 965,956 965,956
Revenue Over/(Under) Expenditures 100,736 76,762 227,452 - - -
Ending Balance - June 30 661,742 738,504 965,956 965,956 965,956 965,956
RESERVED FUND BALANCE
Heart of the City Art Program - - - - - -
AVAILABLE FUND BALANCE - JUNE 30 661,742$ 738,504$ 965,956$ 965,956$ 965,956$ 965,956$
121

ART IN PUBLIC PLACES FUND - #217 EXPENDITURE DETAIL
FY 2018-19 BUDGET
FY 2018-19 CITY CITY
BUDGET DEPARTMENT MANAGER COUNCIL
ACCOUNT NUMBER/NAME DETAIL REQUESTED RECOMMENDED APPROVED
581009 Art in Public Places 3,500$ 3,500$ 3,500$
Totals 3,500$ 3,500$ 3,500$
122
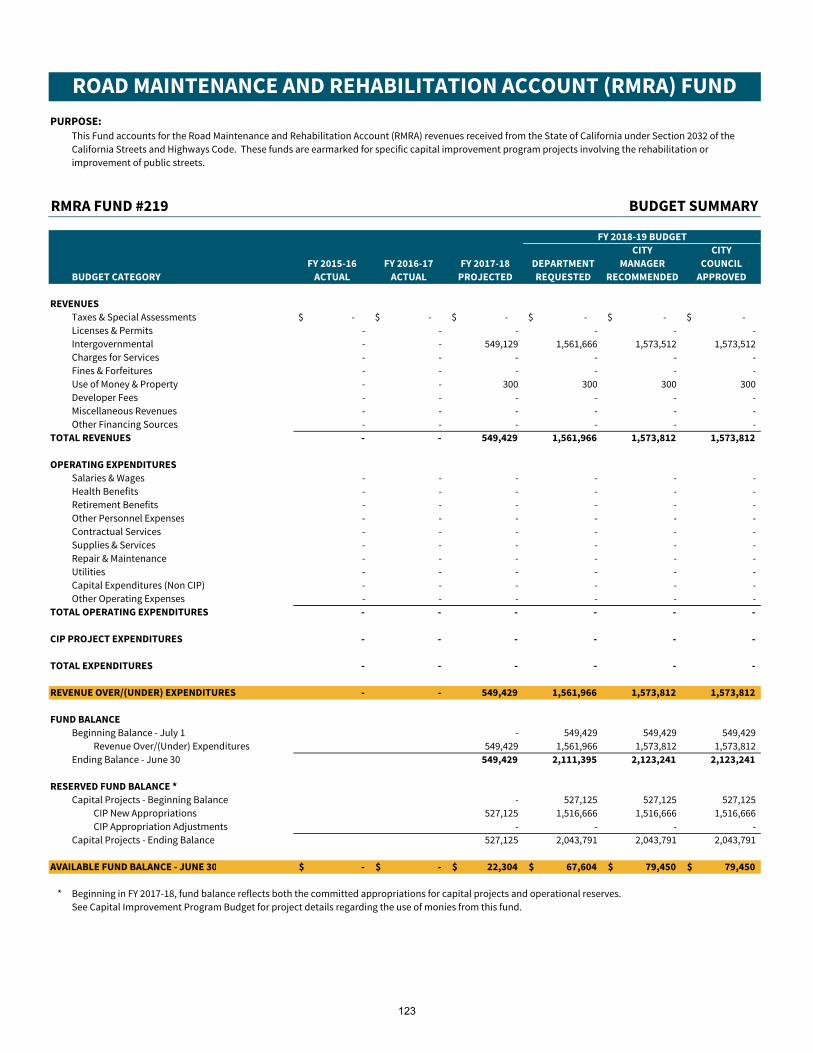
ROAD MAINTENANCE AND REHABILITATION ACCOUNT (RMRA) FUND
PURPOSE:
This Fund accounts for the Road Maintenance and Rehabilitation Account (RMRA) revenues received from the State of California under Section 2032 of the
California Streets and Highways Code. These funds are earmarked for specific capital improvement program projects involving the rehabilitation or
improvement of public streets.
RMRA FUND #219 BUDGET SUMMARY
FY 2018-19 BUDGET
CITY CITY
FY 2015-16 FY 2016-17 FY 2017-18 DEPARTMENT MANAGER COUNCIL
BUDGET CATEGORY ACTUAL ACTUAL PROJECTED REQUESTED RECOMMENDED APPROVED
REVENUES
Taxes & Special Assessments -$ -$ -$ -$ -$ -$
Licenses & Permits - - - - - -
Intergovernmental - - 549,129 1,561,666 1,573,512 1,573,512
Charges for Services - - - - - -
Fines & Forfeitures - - - - - -
Use of Money & Property - - 300 300 300 300
Developer Fees - - - - - -
Miscellaneous Revenues - - - - - -
Other Financing Sources - - - - - -
TOTAL REVENUES - - 549,429 1,561,966 1,573,812 1,573,812
OPERATING EXPENDITURES
Salaries & Wages - - - - - -
Health Benefits - - - - - -
Retirement Benefits - - - - - -
Other Personnel Expenses - - - - - -
Contractual Services - - - - - -
Supplies & Services - - - - - -
Repair & Maintenance - - - - - -
Utilities - - - - - -
Capital Expenditures (Non CIP) - - - - - -
Other Operating Expenses - - - - - -
TOTAL OPERATING EXPENDITURES - - - - - -
CIP PROJECT EXPENDITURES - - - - - -
TOTAL EXPENDITURES - - - - - -
REVENUE OVER/(UNDER) EXPENDITURES - - 549,429 1,561,966 1,573,812 1,573,812
FUND BALANCE
Beginning Balance - July 1 - 549,429 549,429 549,429
Revenue Over/(Under) Expenditures 549,429 1,561,966 1,573,812 1,573,812
Ending Balance - June 30 549,429 2,111,395 2,123,241 2,123,241
RESERVED FUND BALANCE *
Capital Projects - Beginning Balance - 527,125 527,125 527,125
CIP New Appropriations 527,125 1,516,666 1,516,666 1,516,666
CIP Appropriation Adjustments - - - -
Capital Projects - Ending Balance 527,125 2,043,791 2,043,791 2,043,791
AVAILABLE FUND BALANCE - JUNE 30 -$ -$ 22,304$ 67,604$ 79,450$ 79,450$
* Beginning in FY 2017-18, fund balance reflects both the committed appropriations for capital projects and operational reserves.
See Capital Improvement Program Budget for project details regarding the use of monies from this fund.
123

|
This page intentionally left blank.
124
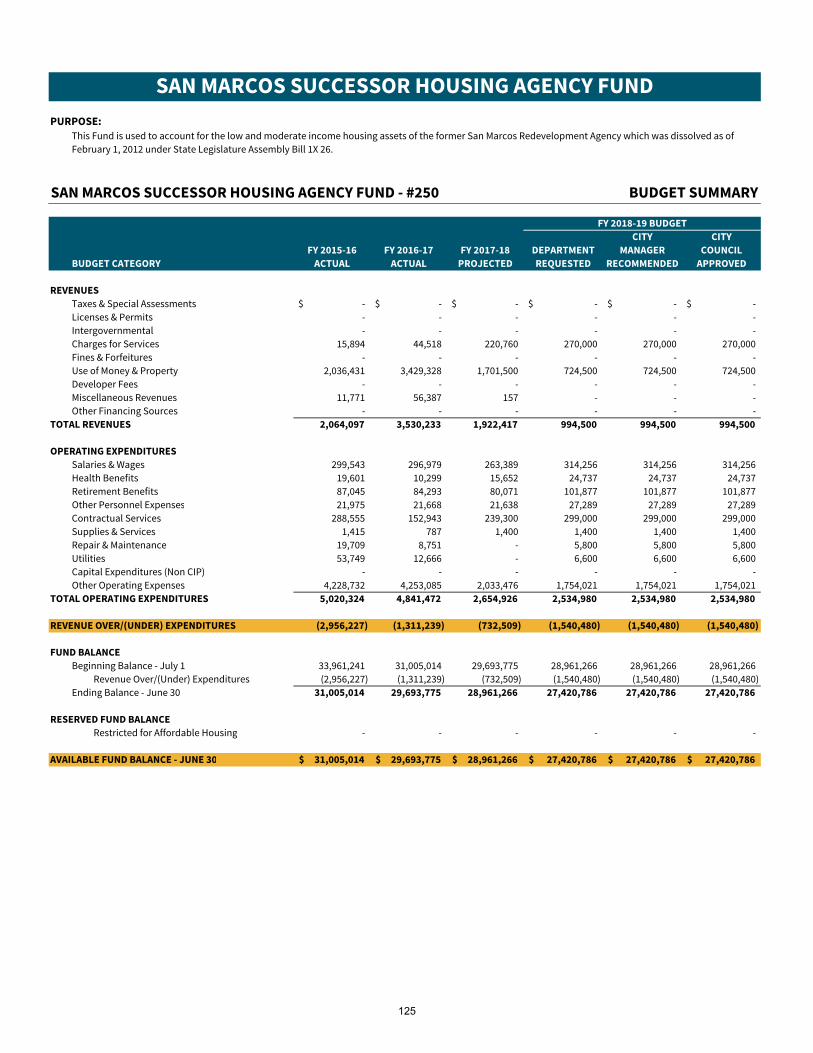
SAN MARCOS SUCCESSOR HOUSING AGENCY FUND
PURPOSE:
This Fund is used to account for the low and moderate income housing assets of the former San Marcos Redevelopment Agency which was dissolved as of
February 1, 2012 under State Legislature Assembly Bill 1X 26.
SAN MARCOS SUCCESSOR HOUSING AGENCY FUND - #250 BUDGET SUMMARY
FY 2018-19 BUDGET
CITY CITY
FY 2015-16 FY 2016-17 FY 2017-18 DEPARTMENT MANAGER COUNCIL
BUDGET CATEGORY ACTUAL ACTUAL PROJECTED REQUESTED RECOMMENDED APPROVED
REVENUES
Taxes & Special Assessments -$ -$ -$ -$ -$ -$
Licenses & Permits - - - - - -
Intergovernmental - - - - - -
Charges for Services 15,894 44,518 220,760 270,000 270,000 270,000
Fines & Forfeitures - - - - - -
Use of Money & Property 2,036,431 3,429,328 1,701,500 724,500 724,500 724,500
Developer Fees - - - - - -
Miscellaneous Revenues 11,771 56,387 157 - - -
Other Financing Sources - - - - - -
TOTAL REVENUES 2,064,097 3,530,233 1,922,417 994,500 994,500 994,500
OPERATING EXPENDITURES
Salaries & Wages 299,543 296,979 263,389 314,256 314,256 314,256
Health Benefits 19,601 10,299 15,652 24,737 24,737 24,737
Retirement Benefits 87,045 84,293 80,071 101,877 101,877 101,877
Other Personnel Expenses 21,975 21,668 21,638 27,289 27,289 27,289
Contractual Services 288,555 152,943 239,300 299,000 299,000 299,000
Supplies & Services 1,415 787 1,400 1,400 1,400 1,400
Repair & Maintenance 19,709 8,751 - 5,800 5,800 5,800
Utilities 53,749 12,666 - 6,600 6,600 6,600
Capital Expenditures (Non CIP) - - - - - -
Other Operating Expenses 4,228,732 4,253,085 2,033,476 1,754,021 1,754,021 1,754,021
TOTAL OPERATING EXPENDITURES 5,020,324 4,841,472 2,654,926 2,534,980 2,534,980 2,534,980
REVENUE OVER/(UNDER) EXPENDITURES (2,956,227) (1,311,239) (732,509) (1,540,480) (1,540,480) (1,540,480)
FUND BALANCE
Beginning Balance - July 1 33,961,241 31,005,014 29,693,775 28,961,266 28,961,266 28,961,266
Revenue Over/(Under) Expenditures (2,956,227) (1,311,239) (732,509) (1,540,480) (1,540,480) (1,540,480)
Ending Balance - June 30 31,005,014 29,693,775 28,961,266 27,420,786 27,420,786 27,420,786
RESERVED FUND BALANCE
Restricted for Affordable Housing - - - - - -
AVAILABLE FUND BALANCE - JUNE 30 31,005,014$ 29,693,775$ 28,961,266$ 27,420,786$ 27,420,786$ 27,420,786$
125
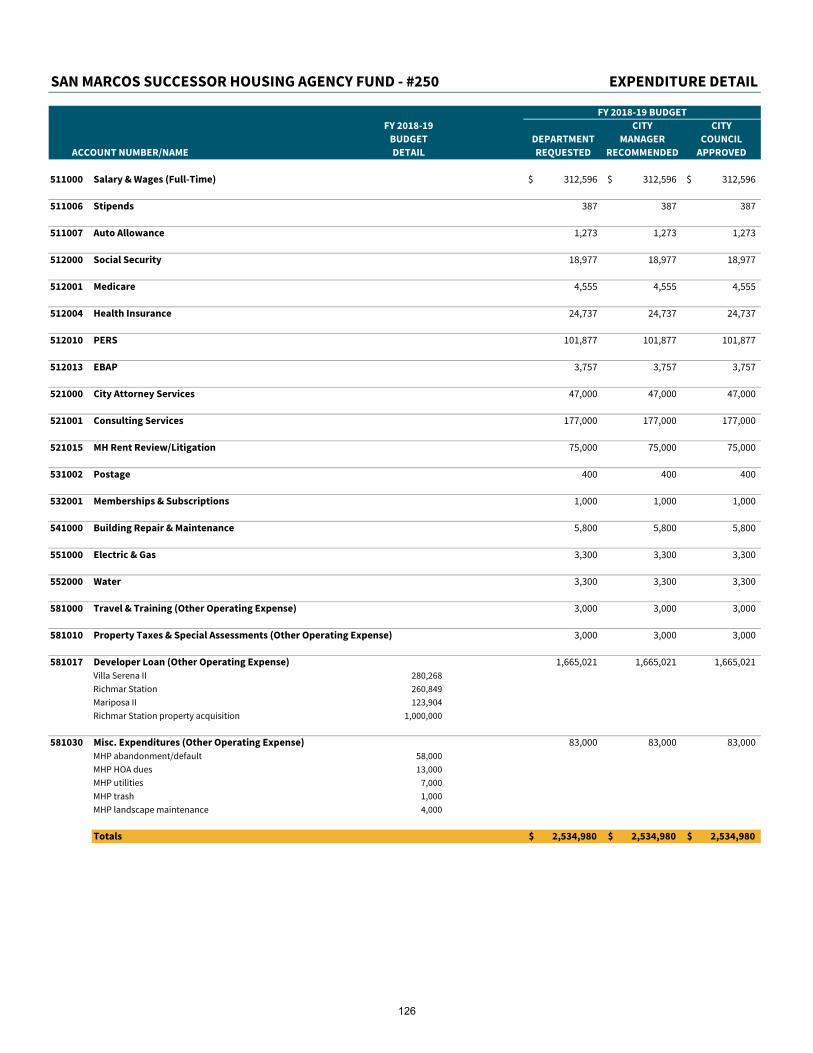
SAN MARCOS SUCCESSOR HOUSING AGENCY FUND - #250 EXPENDITURE DETAIL
FY 2018-19 BUDGET
FY 2018-19 CITY CITY
BUDGET DEPARTMENT MANAGER COUNCIL
ACCOUNT NUMBER/NAME DETAIL REQUESTED RECOMMENDED APPROVED
511000 Salary & Wages (Full-Time) 312,596$ 312,596$ 312,596$
511006 Stipends 387 387 387
511007 Auto Allowance 1,273 1,273 1,273
512000 Social Security 18,977 18,977 18,977
512001 Medicare 4,555 4,555 4,555
512004 Health Insurance 24,737 24,737 24,737
512010 PERS 101,877 101,877 101,877
512013 EBAP 3,757 3,757 3,757
521000 City Attorney Services 47,000 47,000 47,000
521001 Consulting Services 177,000 177,000 177,000
521015 MH Rent Review/Litigation 75,000 75,000 75,000
531002 Postage 400 400 400
532001 Memberships & Subscriptions 1,000 1,000 1,000
541000 Building Repair & Maintenance 5,800 5,800 5,800
551000 Electric & Gas 3,300 3,300 3,300
552000 Water 3,300 3,300 3,300
581000 Travel & Training (Other Operating Expense) 3,000 3,000 3,000
581010 Property Taxes & Special Assessments (Other Operating Expense) 3,000 3,000 3,000
581017 Developer Loan (Other Operating Expense) 1,665,021 1,665,021 1,665,021
Villa Serena II 280,268
Richmar Station 260,849
Mariposa II 123,904
Richmar Station property acquisition 1,000,000
581030 Misc. Expenditures (Other Operating Expense) 83,000 83,000 83,000
MHP abandonment/default 58,000
MHP HOA dues 13,000
MHP utilities 7,000
MHP trash 1,000
MHP landscape maintenance 4,000
Totals 2,534,980$ 2,534,980$ 2,534,980$
126
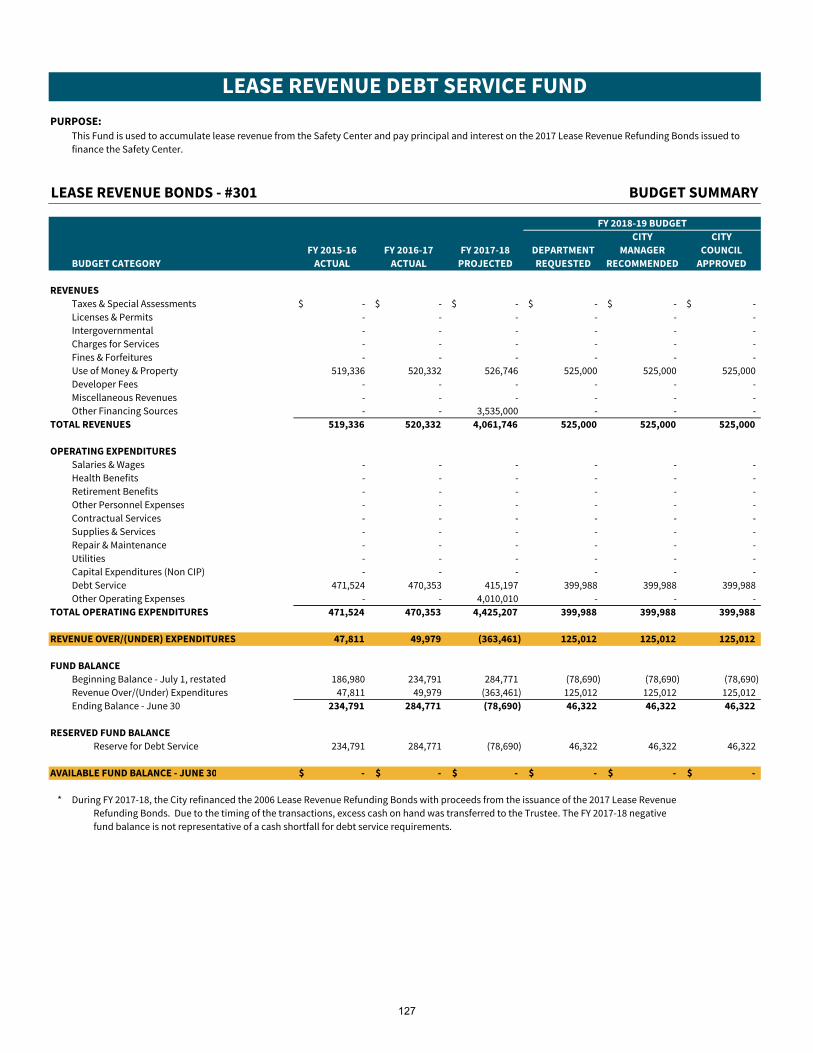
LEASE REVENUE DEBT SERVICE FUND
PURPOSE:
This Fund is used to accumulate lease revenue from the Safety Center and pay principal and interest on the 2017 Lease Revenue Refunding Bonds issued to
finance the Safety Center.
LEASE REVENUE BONDS - #301 BUDGET SUMMARY
FY 2018-19 BUDGET
CITY CITY
FY 2015-16 FY 2016-17 FY 2017-18 DEPARTMENT MANAGER COUNCIL
BUDGET CATEGORY ACTUAL ACTUAL PROJECTED REQUESTED RECOMMENDED APPROVED
REVENUES
Taxes & Special Assessments -$ -$ -$ -$ -$ -$
Licenses & Permits - - - - - -
Intergovernmental - - - - - -
Charges for Services - - - - - -
Fines & Forfeitures - - - - - -
Use of Money & Property 519,336 520,332 526,746 525,000 525,000 525,000
Developer Fees - - - - - -
Miscellaneous Revenues - - - - - -
Other Financing Sources - - 3,535,000 - - -
TOTAL REVENUES 519,336 520,332 4,061,746 525,000 525,000 525,000
OPERATING EXPENDITURES
Salaries & Wages - - - - - -
Health Benefits - - - - - -
Retirement Benefits - - - - - -
Other Personnel Expenses - - - - - -
Contractual Services - - - - - -
Supplies & Services - - - - - -
Repair & Maintenance - - - - - -
Utilities - - - - - -
Capital Expenditures (Non CIP) - - - - - -
Debt Service 471,524 470,353 415,197 399,988 399,988 399,988
Other Operating Expenses - - 4,010,010 - - -
TOTAL OPERATING EXPENDITURES 471,524 470,353 4,425,207 399,988 399,988 399,988
REVENUE OVER/(UNDER) EXPENDITURES 47,811 49,979 (363,461) 125,012 125,012 125,012
FUND BALANCE
Beginning Balance - July 1, restated 186,980 234,791 284,771 (78,690) (78,690) (78,690)
Revenue Over/(Under) Expenditures 47,811 49,979 (363,461) 125,012 125,012 125,012
Ending Balance - June 30 234,791 284,771 (78,690) 46,322 46,322 46,322
RESERVED FUND BALANCE
Reserve for Debt Service 234,791 284,771 (78,690) 46,322 46,322 46,322
AVAILABLE FUND BALANCE - JUNE 30 -$ -$ -$ -$ -$ -$
* During FY 2017-18, the City refinanced the 2006 Lease Revenue Refunding Bonds with proceeds from the issuance of the 2017 Lease Revenue
Refunding Bonds. Due to the timing of the transactions, excess cash on hand was transferred to the Trustee. The FY 2017-18 negative
fund balance is not representative of a cash shortfall for debt service requirements.
127

LEASE REVENUE BONDS - #301 EXPENDITURE DETAIL
FY 2018-19 BUDGET
FY 2018-19 CITY CITY
BUDGET DEPARTMENT MANAGER COUNCIL
ACCOUNT NUMBER/NAME DETAIL REQUESTED RECOMMENDED APPROVED
571000 Principal-Bonds 320,000$ 320,000$ 320,000$
2017 Lease Revenue Refunding Bonds
572000 Interest-Bonds 79,988 79,988 79,988
2017 Lease Revenue Refunding Bonds
Totals 399,988$ 399,988$ 399,988$
128
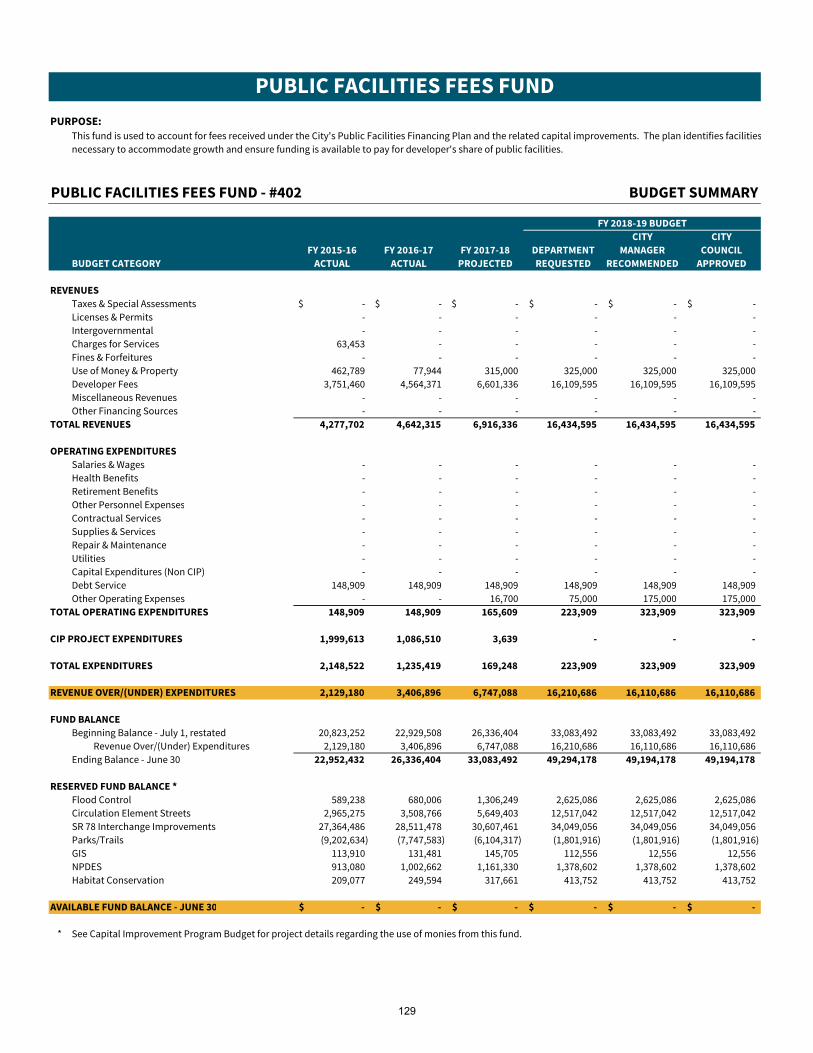
PUBLIC FACILITIES FEES FUND
PURPOSE:
This fund is used to account for fees received under the City's Public Facilities Financing Plan and the related capital improvements. The plan identifies facilities
necessary to accommodate growth and ensure funding is available to pay for developer's share of public facilities.
PUBLIC FACILITIES FEES FUND - #402 BUDGET SUMMARY
FY 2018-19 BUDGET
CITY CITY
FY 2015-16 FY 2016-17 FY 2017-18 DEPARTMENT MANAGER COUNCIL
BUDGET CATEGORY ACTUAL ACTUAL PROJECTED REQUESTED RECOMMENDED APPROVED
REVENUES
Taxes & Special Assessments -$ -$ -$ -$ -$ -$
Licenses & Permits - - - - - -
Intergovernmental - - - - - -
Charges for Services 63,453 - - - - -
Fines & Forfeitures - - - - - -
Use of Money & Property 462,789 77,944 315,000 325,000 325,000 325,000
Developer Fees 3,751,460 4,564,371 6,601,336 16,109,595 16,109,595 16,109,595
Miscellaneous Revenues - - - - - -
Other Financing Sources - - - - - -
TOTAL REVENUES 4,277,702 4,642,315 6,916,336 16,434,595 16,434,595 16,434,595
OPERATING EXPENDITURES
Salaries & Wages - - - - - -
Health Benefits - - - - - -
Retirement Benefits - - - - - -
Other Personnel Expenses - - - - - -
Contractual Services - - - - - -
Supplies & Services - - - - - -
Repair & Maintenance - - - - - -
Utilities - - - - - -
Capital Expenditures (Non CIP) - - - - - -
Debt Service 148,909 148,909 148,909 148,909 148,909 148,909
Other Operating Expenses - - 16,700 75,000 175,000 175,000
TOTAL OPERATING EXPENDITURES 148,909 148,909 165,609 223,909 323,909 323,909
CIP PROJECT EXPENDITURES 1,999,613 1,086,510 3,639 - - -
TOTAL EXPENDITURES 2,148,522 1,235,419 169,248 223,909 323,909 323,909
REVENUE OVER/(UNDER) EXPENDITURES 2,129,180 3,406,896 6,747,088 16,210,686 16,110,686 16,110,686
FUND BALANCE
Beginning Balance - July 1, restated 20,823,252 22,929,508 26,336,404 33,083,492 33,083,492 33,083,492
Revenue Over/(Under) Expenditures 2,129,180 3,406,896 6,747,088 16,210,686 16,110,686 16,110,686
Ending Balance - June 30 22,952,432 26,336,404 33,083,492 49,294,178 49,194,178 49,194,178
RESERVED FUND BALANCE *
Flood Control 589,238 680,006 1,306,249 2,625,086 2,625,086 2,625,086
Circulation Element Streets 2,965,275 3,508,766 5,649,403 12,517,042 12,517,042 12,517,042
SR 78 Interchange Improvements 27,364,486 28,511,478 30,607,461 34,049,056 34,049,056 34,049,056
Parks/Trails (9,202,634) (7,747,583) (6,104,317) (1,801,916) (1,801,916) (1,801,916)
GIS 113,910 131,481 145,705 112,556 12,556 12,556
NPDES 913,080 1,002,662 1,161,330 1,378,602 1,378,602 1,378,602
Habitat Conservation 209,077 249,594 317,661 413,752 413,752 413,752
AVAILABLE FUND BALANCE - JUNE 30 -$ -$ -$ -$ -$ -$
* See Capital Improvement Program Budget for project details regarding the use of monies from this fund.
129
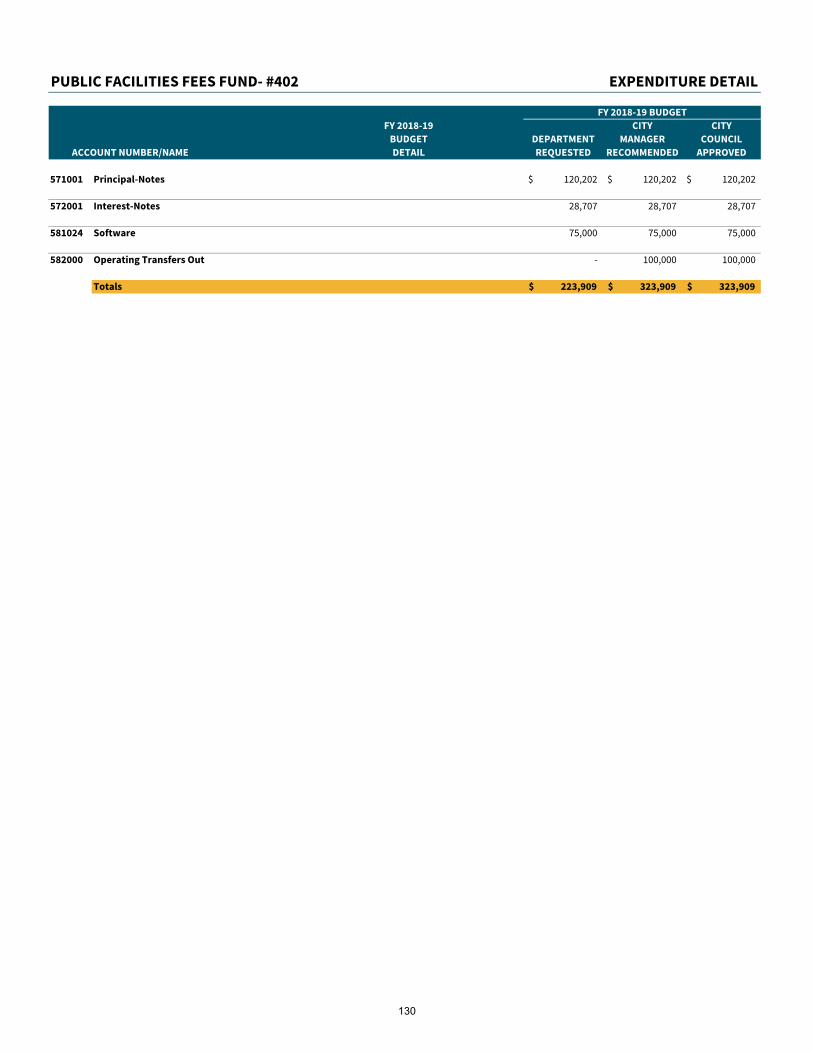
PUBLIC FACILITIES FEES FUND- #402 EXPENDITURE DETAIL
FY 2018-19 BUDGET
FY 2018-19 CITY CITY
BUDGET DEPARTMENT MANAGER COUNCIL
ACCOUNT NUMBER/NAME DETAIL REQUESTED RECOMMENDED APPROVED
571001 Principal-Notes 120,202$ 120,202$ 120,202$
572001 Interest-Notes 28,707 28,707 28,707
581024 Software 75,000 75,000 75,000
582000 Operating Transfers Out - 100,000 100,000
Totals 223,909$ 323,909$ 323,909$
130
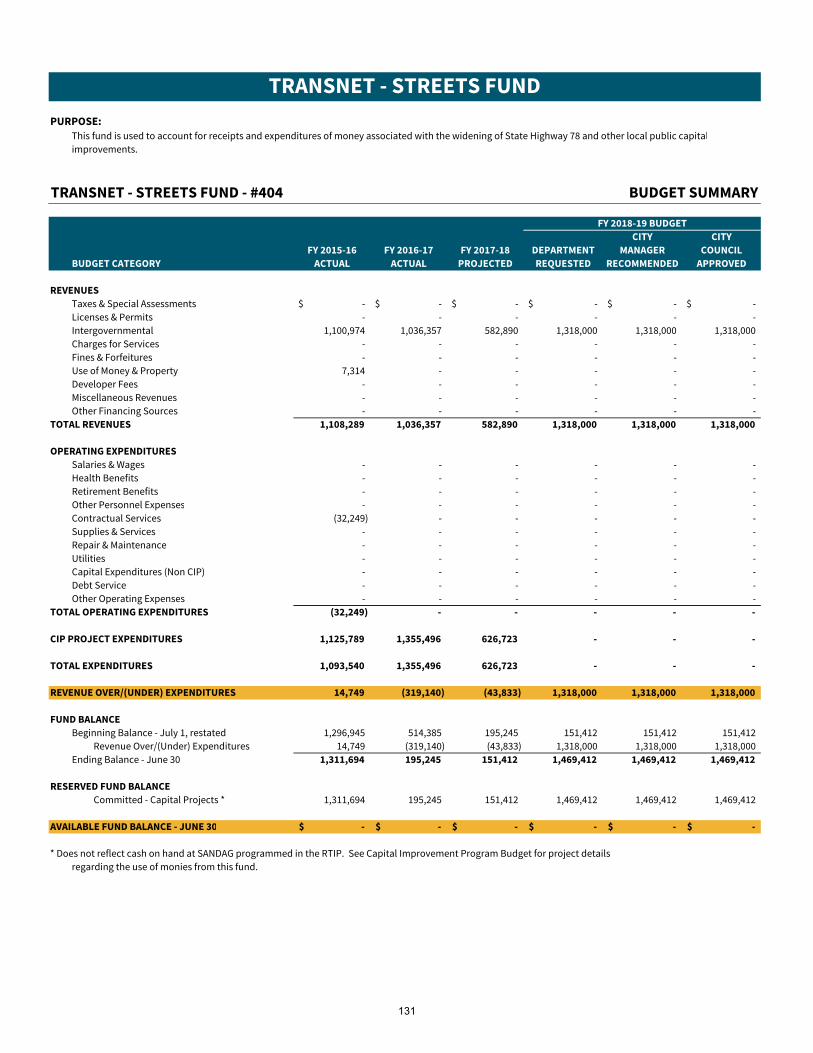
TRANSNET - STREETS FUND
PURPOSE:
This fund is used to account for receipts and expenditures of money associated with the widening of State Highway 78 and other local public capital
improvements.
TRANSNET - STREETS FUND - #404 BUDGET SUMMARY
FY 2018-19 BUDGET
CITY CITY
FY 2015-16 FY 2016-17 FY 2017-18 DEPARTMENT MANAGER COUNCIL
BUDGET CATEGORY ACTUAL ACTUAL PROJECTED REQUESTED RECOMMENDED APPROVED
REVENUES
Taxes & Special Assessments -$ -$ -$ -$ -$ -$
Licenses & Permits - - - - - -
Intergovernmental 1,100,974 1,036,357 582,890 1,318,000 1,318,000 1,318,000
Charges for Services - - - - - -
Fines & Forfeitures - - - - - -
Use of Money & Property 7,314 - - - - -
Developer Fees - - - - - -
Miscellaneous Revenues - - - - - -
Other Financing Sources - - - - - -
TOTAL REVENUES 1,108,289 1,036,357 582,890 1,318,000 1,318,000 1,318,000
OPERATING EXPENDITURES
Salaries & Wages - - - - - -
Health Benefits - - - - - -
Retirement Benefits - - - - - -
Other Personnel Expenses - - - - - -
Contractual Services (32,249) - - - - -
Supplies & Services - - - - - -
Repair & Maintenance - - - - - -
Utilities - - - - - -
Capital Expenditures (Non CIP) - - - - - -
Debt Service - - - - - -
Other Operating Expenses - - - - - -
TOTAL OPERATING EXPENDITURES (32,249) - - - - -
CIP PROJECT EXPENDITURES 1,125,789 1,355,496 626,723 - - -
TOTAL EXPENDITURES 1,093,540 1,355,496 626,723 - - -
REVENUE OVER/(UNDER) EXPENDITURES 14,749 (319,140) (43,833) 1,318,000 1,318,000 1,318,000
FUND BALANCE
Beginning Balance - July 1, restated 1,296,945 514,385 195,245 151,412 151,412 151,412
Revenue Over/(Under) Expenditures 14,749 (319,140) (43,833) 1,318,000 1,318,000 1,318,000
Ending Balance - June 30 1,311,694 195,245 151,412 1,469,412 1,469,412 1,469,412
RESERVED FUND BALANCE
Committed - Capital Projects * 1,311,694 195,245 151,412 1,469,412 1,469,412 1,469,412
AVAILABLE FUND BALANCE - JUNE 30 -$ -$ -$ -$ -$ -$
* Does not reflect cash on hand at SANDAG programmed in the RTIP. See Capital Improvement Program Budget for project details
regarding the use of monies from this fund.
131

|
This page intentionally left blank.
132
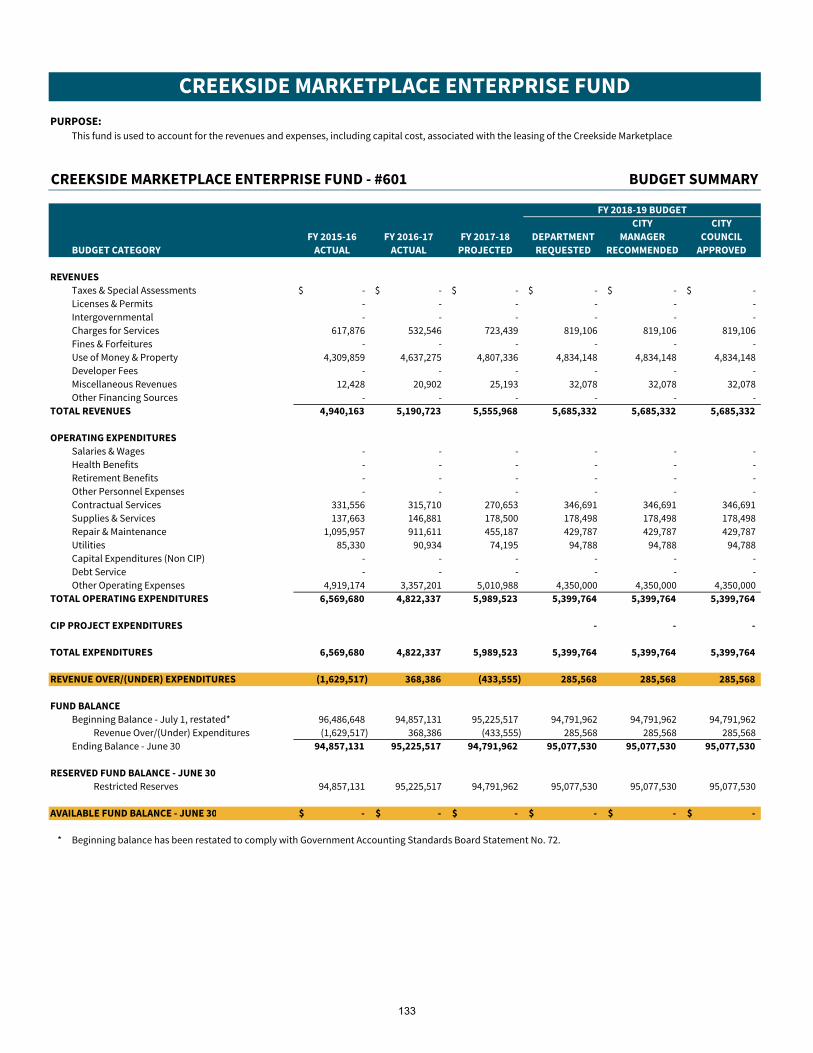
CREEKSIDE MARKETPLACE ENTERPRISE FUND
PURPOSE:
This fund is used to account for the revenues and expenses, including capital cost, associated with the leasing of the Creekside Marketplace.
CREEKSIDE MARKETPLACE ENTERPRISE FUND - #601 BUDGET SUMMARY
FY 2018-19 BUDGET
CITY CITY
FY 2015-16 FY 2016-17 FY 2017-18 DEPARTMENT MANAGER COUNCIL
BUDGET CATEGORY ACTUAL ACTUAL PROJECTED REQUESTED RECOMMENDED APPROVED
REVENUES
Taxes & Special Assessments -$ -$ -$ -$ -$ -$
Licenses & Permits - - - - - -
Intergovernmental - - - - - -
Charges for Services 617,876 532,546 723,439 819,106 819,106 819,106
Fines & Forfeitures - - - - - -
Use of Money & Property 4,309,859 4,637,275 4,807,336 4,834,148 4,834,148 4,834,148
Developer Fees - - - - - -
Miscellaneous Revenues 12,428 20,902 25,193 32,078 32,078 32,078
Other Financing Sources - - - - - -
TOTAL REVENUES 4,940,163 5,190,723 5,555,968 5,685,332 5,685,332 5,685,332
OPERATING EXPENDITURES
Salaries & Wages - - - - - -
Health Benefits - - - - - -
Retirement Benefits - - - - - -
Other Personnel Expenses - - - - - -
Contractual Services 331,556 315,710 270,653 346,691 346,691 346,691
Supplies & Services 137,663 146,881 178,500 178,498 178,498 178,498
Repair & Maintenance 1,095,957 911,611 455,187 429,787 429,787 429,787
Utilities 85,330 90,934 74,195 94,788 94,788 94,788
Capital Expenditures (Non CIP) - - - - - -
Debt Service - - - - - -
Other Operating Expenses 4,919,174 3,357,201 5,010,988 4,350,000 4,350,000 4,350,000
TOTAL OPERATING EXPENDITURES 6,569,680 4,822,337 5,989,523 5,399,764 5,399,764 5,399,764
CIP PROJECT EXPENDITURES - - -
TOTAL EXPENDITURES 6,569,680 4,822,337 5,989,523 5,399,764 5,399,764 5,399,764
REVENUE OVER/(UNDER) EXPENDITURES (1,629,517) 368,386 (433,555) 285,568 285,568 285,568
FUND BALANCE
Beginning Balance - July 1, restated* 96,486,648 94,857,131 95,225,517 94,791,962 94,791,962 94,791,962
Revenue Over/(Under) Expenditures (1,629,517) 368,386 (433,555) 285,568 285,568 285,568
Ending Balance - June 30 94,857,131 95,225,517 94,791,962 95,077,530 95,077,530 95,077,530
RESERVED FUND BALANCE - JUNE 30
Restricted Reserves 94,857,131 95,225,517 94,791,962 95,077,530 95,077,530 95,077,530
AVAILABLE FUND BALANCE - JUNE 30 -$ -$ -$ -$ -$ -$
* Beginning balance has been restated to comply with Government Accounting Standards Board Statement No. 72.
133
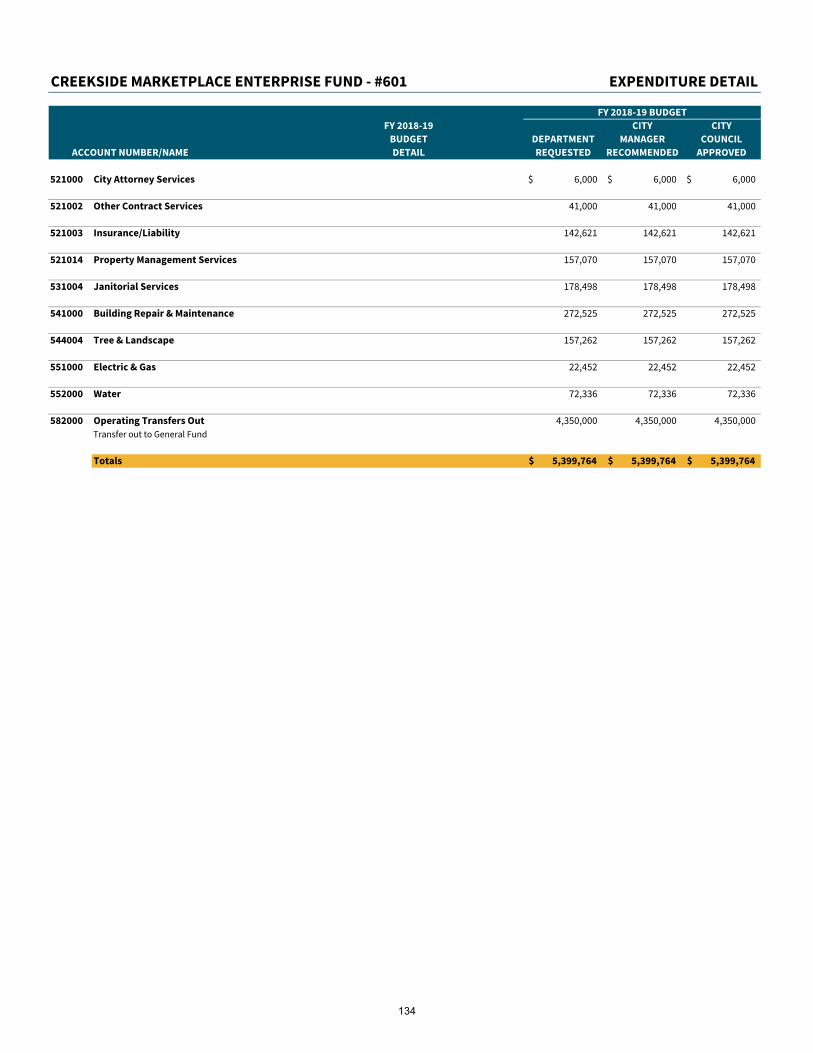
CREEKSIDE MARKETPLACE ENTERPRISE FUND - #601 EXPENDITURE DETAIL
FY 2018-19 BUDGET
FY 2018-19 CITY CITY
BUDGET DEPARTMENT MANAGER COUNCIL
ACCOUNT NUMBER/NAME DETAIL REQUESTED RECOMMENDED APPROVED
521000 City Attorney Services 6,000$ 6,000$ 6,000$
521002 Other Contract Services 41,000 41,000 41,000
521003 Insurance/Liability 142,621 142,621 142,621
521014 Property Management Services 157,070 157,070 157,070
531004 Janitorial Services 178,498 178,498 178,498
541000 Building Repair & Maintenance 272,525 272,525 272,525
544004 Tree & Landscape 157,262 157,262 157,262
551000 Electric & Gas 22,452 22,452 22,452
552000 Water 72,336 72,336 72,336
582000 Operating Transfers Out 4,350,000 4,350,000 4,350,000
Transfer out to General Fund
Totals 5,399,764$ 5,399,764$ 5,399,764$
134
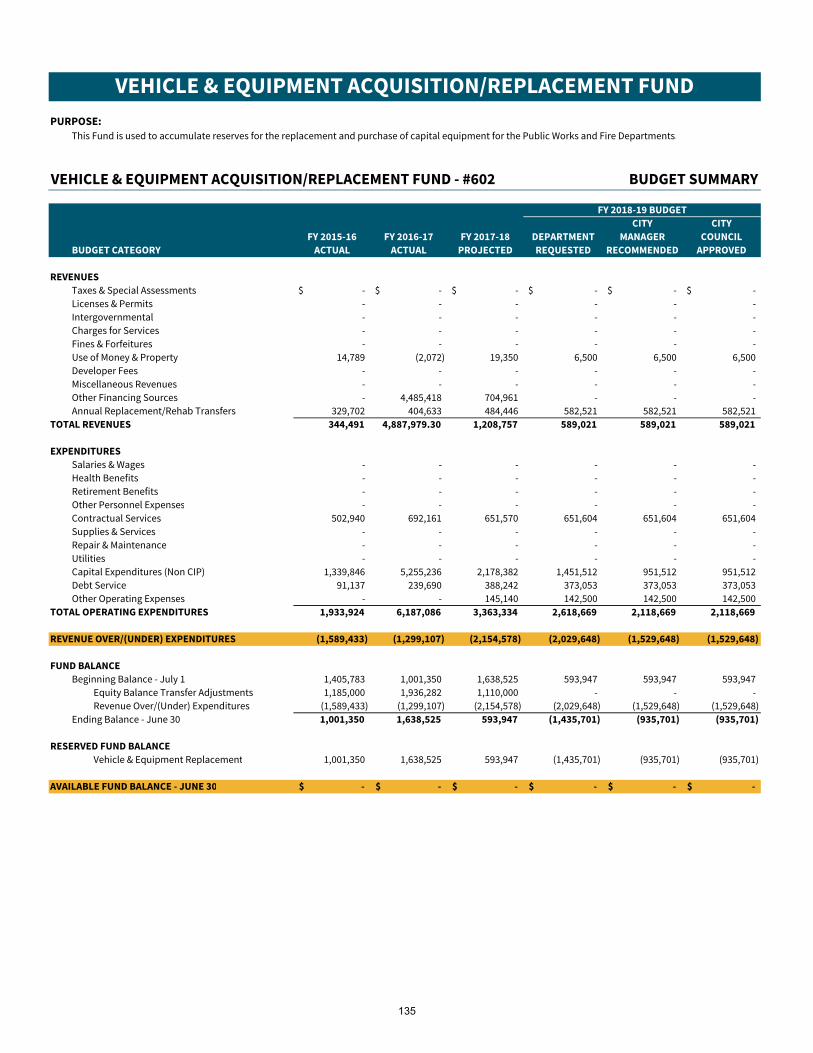
VEHICLE & EQUIPMENT ACQUISITION/REPLACEMENT FUND
PURPOSE:
This Fund is used to accumulate reserves for the replacement and purchase of capital equipment for the Public Works and Fire Departments.
VEHICLE & EQUIPMENT ACQUISITION/REPLACEMENT FUND - #602 BUDGET SUMMARY
FY 2018-19 BUDGET
CITY CITY
FY 2015-16 FY 2016-17 FY 2017-18 DEPARTMENT MANAGER COUNCIL
BUDGET CATEGORY ACTUAL ACTUAL PROJECTED REQUESTED RECOMMENDED APPROVED
REVENUES
Taxes & Special Assessments -$ -$ -$ -$ -$ -$
Licenses & Permits - - - - - -
Intergovernmental - - - - - -
Charges for Services - - - - - -
Fines & Forfeitures - - - - - -
Use of Money & Property 14,789 (2,072) 19,350 6,500 6,500 6,500
Developer Fees - - - - - -
Miscellaneous Revenues - - - - - -
Other Financing Sources - 4,485,418 704,961 - - -
Annual Replacement/Rehab Transfers 329,702 404,633 484,446 582,521 582,521 582,521
TOTAL REVENUES 344,491 4,887,979.30 1,208,757 589,021 589,021 589,021
EXPENDITURES
Salaries & Wages - - - - - -
Health Benefits - - - - - -
Retirement Benefits - - - - - -
Other Personnel Expenses - - - - - -
Contractual Services 502,940 692,161 651,570 651,604 651,604 651,604
Supplies & Services - - - - - -
Repair & Maintenance - - - - - -
Utilities - - - - - -
Capital Expenditures (Non CIP) 1,339,846 5,255,236 2,178,382 1,451,512 951,512 951,512
Debt Service 91,137 239,690 388,242 373,053 373,053 373,053
Other Operating Expenses - - 145,140 142,500 142,500 142,500
TOTAL OPERATING EXPENDITURES 1,933,924 6,187,086 3,363,334 2,618,669 2,118,669 2,118,669
REVENUE OVER/(UNDER) EXPENDITURES (1,589,433) (1,299,107) (2,154,578) (2,029,648) (1,529,648) (1,529,648)
FUND BALANCE
Beginning Balance - July 1 1,405,783 1,001,350 1,638,525 593,947 593,947 593,947
Equity Balance Transfer Adjustments 1,185,000 1,936,282 1,110,000 - - -
Revenue Over/(Under) Expenditures (1,589,433) (1,299,107) (2,154,578) (2,029,648) (1,529,648) (1,529,648)
Ending Balance - June 30 1,001,350 1,638,525 593,947 (1,435,701) (935,701) (935,701)
RESERVED FUND BALANCE
Vehicle & Equipment Replacement 1,001,350 1,638,525 593,947 (1,435,701) (935,701) (935,701)
AVAILABLE FUND BALANCE - JUNE 30 -$ -$ -$ -$ -$ -$
135
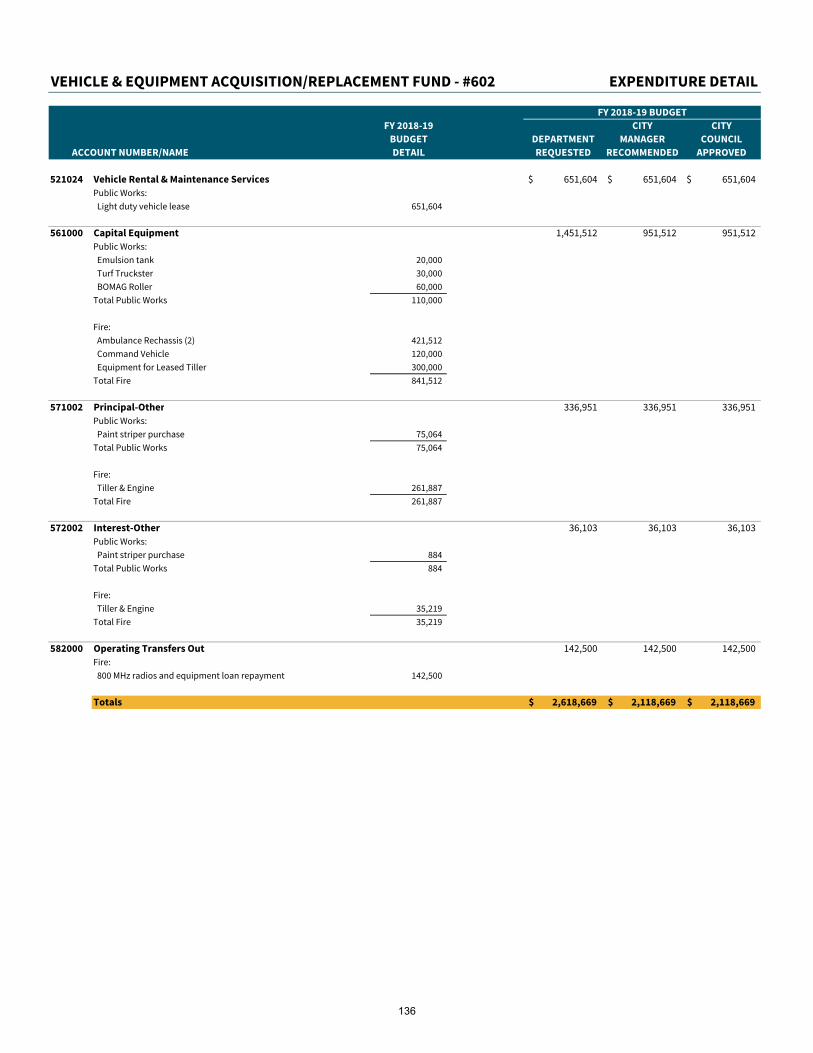
VEHICLE & EQUIPMENT ACQUISITION/REPLACEMENT FUND - #602 EXPENDITURE DETAIL
FY 2018-19 BUDGET
FY 2018-19 CITY CITY
BUDGET DEPARTMENT MANAGER COUNCIL
ACCOUNT NUMBER/NAME DETAIL REQUESTED RECOMMENDED APPROVED
521024 Vehicle Rental & Maintenance Services 651,604$ 651,604$ 651,604$
Public Works:
Light duty vehicle lease 651,604
561000 Capital Equipment 1,451,512 951,512 951,512
Public Works:
Emulsion tank 20,000
Turf Truckster 30,000
BOMAG Roller 60,000
Total Public Works 110,000
Fire:
Ambulance Rechassis (2) 421,512
Command Vehicle 120,000
Equipment for Leased Tiller 300,000
Total Fire 841,512
571002 Principal-Other 336,951 336,951 336,951
Public Works:
Paint striper purchase 75,064
Total Public Works 75,064
Fire:
Tiller & Engine 261,887
Total Fire 261,887
572002 Interest-Other 36,103 36,103 36,103
Public Works:
Paint striper purchase 884
Total Public Works 884
Fire:
Tiller & Engine 35,219
Total Fire 35,219
582000 Operating Transfers Out 142,500 142,500 142,500
Fire:
800 MHz radios and equipment loan repayment 142,500
Totals 2,618,669$ 2,118,669$ 2,118,669$
136

CITY FACILITIES REPLACEMENT/REHABILITATION FUND
PURPOSE:
This Fund is used to accumulate reserves for the replacement and/or rehabilitation of City facilities.
CITY FACILITIES REPLACEMENT/REHABILITATION FUND - #603 BUDGET SUMMARY
FY 2018-19 BUDGET
CITY CITY
FY 2015-16 FY 2016-17 FY 2017-18 DEPARTMENT MANAGER COUNCIL
BUDGET CATEGORY ACTUAL ACTUAL PROJECTED REQUESTED RECOMMENDED APPROVED
REVENUES
Taxes & Special Assessments -$ -$ -$ -$ -$ -$
Licenses & Permits - - - - - -
Intergovernmental - - - - - -
Charges for Services - - - 143,000 143,000 143,000
Fines & Forfeitures - - - - - -
Use of Money & Property 26,506 7,941 45,350 6,500 6,500 6,500
Developer Fees - - - - - -
Miscellaneous Revenues - - - - - -
Other Financing Sources - - - - - -
Annual Replacement/Rehab Transfers 659,402 809,267 968,893 1,165,042 1,165,042 1,165,042
TOTAL REVENUES 685,908 817,208 1,014,243 1,314,542 1,314,542 1,314,542
EXPENDITURES
Salaries & Wages - - - - - -
Health Benefits - - - - - -
Retirement Benefits - - - - - -
Other Personnel Expenses - - - - - -
Contractual Services 903,631 285,253 1,397,475 358,000 517,000 517,000
Supplies & Services - - - - - -
Repair & Maintenance 40,615 (7,939) - - - -
Utilities - - - - - -
Capital Expenditures (Non CIP) - - - - - -
Other Operating Expenses - - - - - -
TOTAL OPERATING EXPENDITURES 944,247 277,314 1,397,475 358,000 517,000 517,000
CIP PROJECT EXPENDITURES 98,971 218,882 7,070 - - -
TOTAL EXPENDITURES 1,043,218 496,196 1,404,545 358,000 517,000 517,000
REVENUE OVER/(UNDER) EXPENDITURES (357,310) 321,011 (390,302) 956,542 797,542 797,542
FUND BALANCE
Beginning Balance - July 1 483,243 2,495,933 4,599,214 4,458,912 4,458,912 4,458,912
Equity Balance Transfer Adjustments 2,370,000 1,782,269 250,000 - - -
Revenue Over/(Under) Expenditures (357,310) 321,011 (390,302) 956,542 797,542 797,542
Ending Balance - June 30 2,495,933 4,599,214 4,458,912 5,415,454 5,256,454 5,256,454
RESERVED FUND BALANCE *
Capital Projects - Beginning Balance 2,867,450 2,867,450 2,867,450 2,867,450
CIP New Appropriations - 365,000 365,000 365,000
CIP Appropriation Adjustments - (300,000) (300,000) (300,000)
Capital Projects - Ending Balance 2,867,450 2,932,450 2,932,450 2,932,450
AVAILABLE FUND BALANCE - JUNE 30 2,495,933$ 4,599,214$ 1,591,462$ 2,483,004$ 2,324,004$ 2,324,004$
* Beginning in FY 2017-18, fund balance reflects both the committed appropriations for capital projects and operational reserves.
See Capital Improvement Program Budget for project details regarding the use of monies from this fund.
137
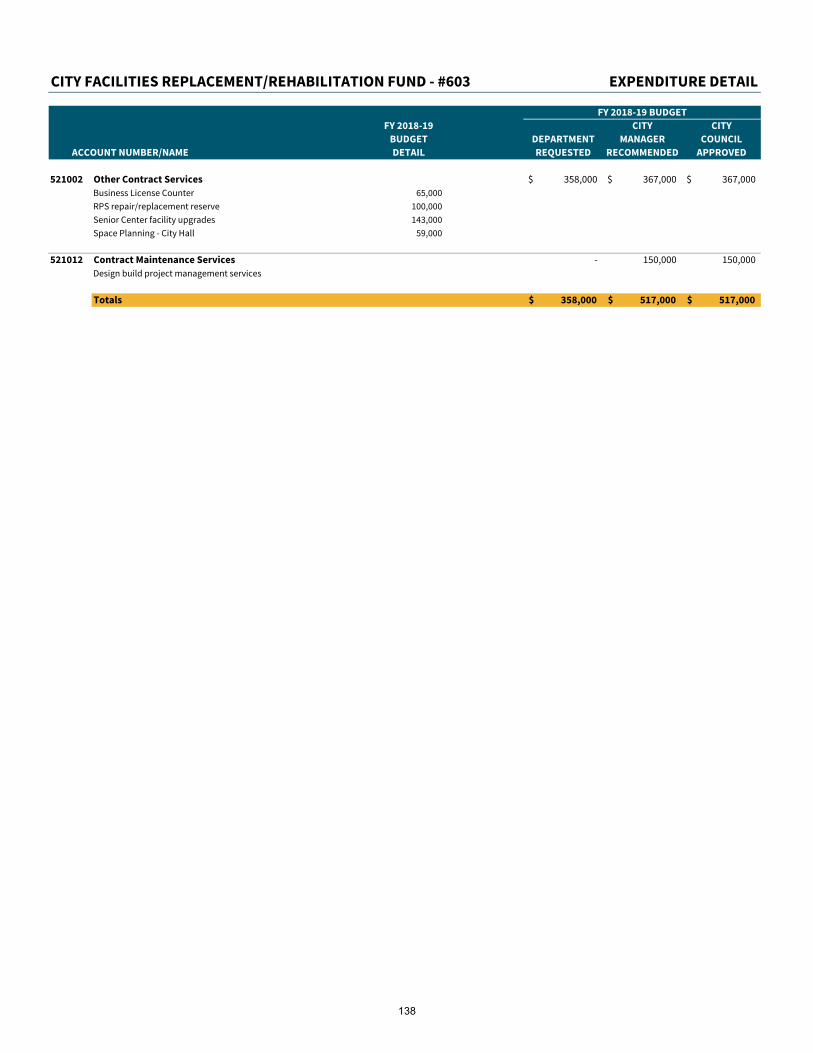
CITY FACILITIES REPLACEMENT/REHABILITATION FUND - #603 EXPENDITURE DETAIL
FY 2018-19 BUDGET
FY 2018-19 CITY CITY
BUDGET DEPARTMENT MANAGER COUNCIL
ACCOUNT NUMBER/NAME DETAIL REQUESTED RECOMMENDED APPROVED
521002 Other Contract Services 358,000$ 367,000$ 367,000$
Business License Counter 65,000
RPS repair/replacement reserve 100,000
Senior Center facility upgrades 143,000
Space Planning - City Hall 59,000
521012 Contract Maintenance Services - 150,000 150,000
Design build project management services
Totals 358,000$ 517,000$ 517,000$
138
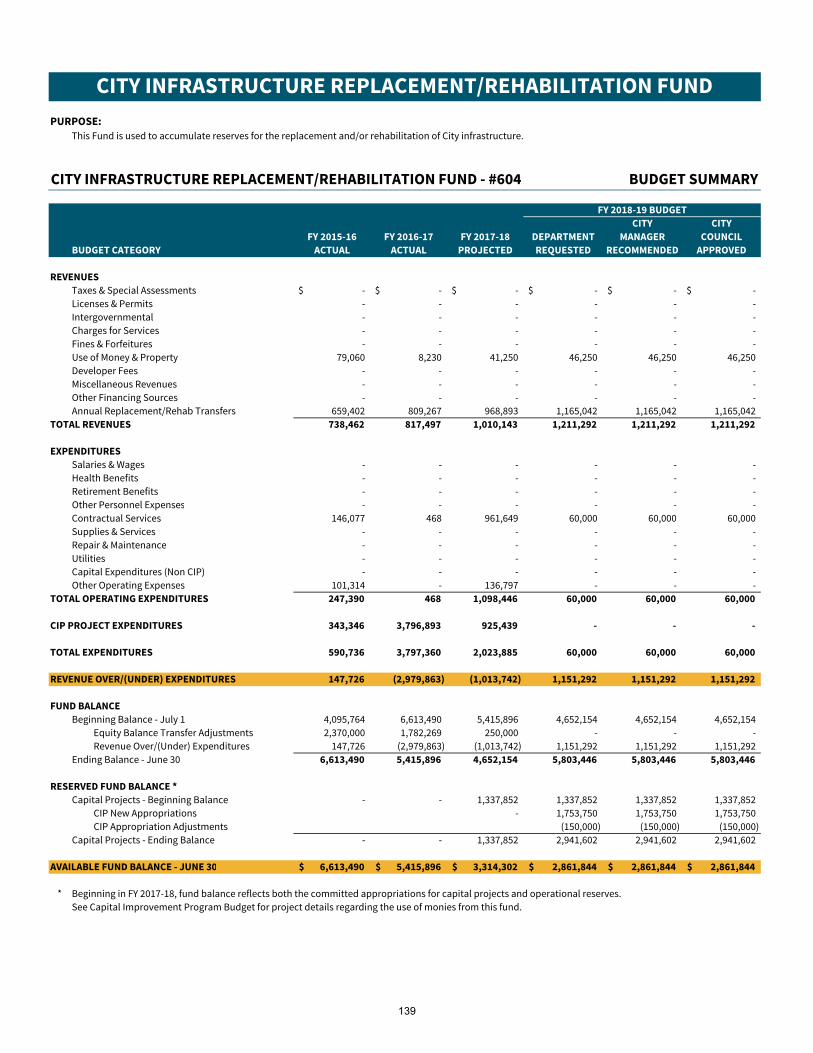
CITY INFRASTRUCTURE REPLACEMENT/REHABILITATION FUND
PURPOSE:
This Fund is used to accumulate reserves for the replacement and/or rehabilitation of City infrastructure.
CITY INFRASTRUCTURE REPLACEMENT/REHABILITATION FUND - #604 BUDGET SUMMARY
FY 2018-19 BUDGET
CITY CITY
FY 2015-16 FY 2016-17 FY 2017-18 DEPARTMENT MANAGER COUNCIL
BUDGET CATEGORY ACTUAL ACTUAL PROJECTED REQUESTED RECOMMENDED APPROVED
REVENUES
Taxes & Special Assessments -$ -$ -$ -$ -$ -$
Licenses & Permits - - - - - -
Intergovernmental - - - - - -
Charges for Services - - - - - -
Fines & Forfeitures - - - - - -
Use of Money & Property 79,060 8,230 41,250 46,250 46,250 46,250
Developer Fees - - - - - -
Miscellaneous Revenues - - - - - -
Other Financing Sources - - - - - -
Annual Replacement/Rehab Transfers 659,402 809,267 968,893 1,165,042 1,165,042 1,165,042
TOTAL REVENUES 738,462 817,497 1,010,143 1,211,292 1,211,292 1,211,292
EXPENDITURES
Salaries & Wages - - - - - -
Health Benefits - - - - - -
Retirement Benefits - - - - - -
Other Personnel Expenses - - - - - -
Contractual Services 146,077 468 961,649 60,000 60,000 60,000
Supplies & Services - - - - - -
Repair & Maintenance - - - - - -
Utilities - - - - - -
Capital Expenditures (Non CIP) - - - - - -
Other Operating Expenses 101,314 - 136,797 - - -
TOTAL OPERATING EXPENDITURES 247,390 468 1,098,446 60,000 60,000 60,000
CIP PROJECT EXPENDITURES 343,346 3,796,893 925,439 - - -
TOTAL EXPENDITURES 590,736 3,797,360 2,023,885 60,000 60,000 60,000
REVENUE OVER/(UNDER) EXPENDITURES 147,726 (2,979,863) (1,013,742) 1,151,292 1,151,292 1,151,292
FUND BALANCE
Beginning Balance - July 1 4,095,764 6,613,490 5,415,896 4,652,154 4,652,154 4,652,154
Equity Balance Transfer Adjustments 2,370,000 1,782,269 250,000 - - -
Revenue Over/(Under) Expenditures 147,726 (2,979,863) (1,013,742) 1,151,292 1,151,292 1,151,292
Ending Balance - June 30 6,613,490 5,415,896 4,652,154 5,803,446 5,803,446 5,803,446
RESERVED FUND BALANCE *
Capital Projects - Beginning Balance - - 1,337,852 1,337,852 1,337,852 1,337,852
CIP New Appropriations - 1,753,750 1,753,750 1,753,750
CIP Appropriation Adjustments (150,000) (150,000) (150,000)
Capital Projects - Ending Balance - - 1,337,852 2,941,602 2,941,602 2,941,602
AVAILABLE FUND BALANCE - JUNE 30 6,613,490$ 5,415,896$ 3,314,302$ 2,861,844$ 2,861,844$ 2,861,844$
* Beginning in FY 2017-18, fund balance reflects both the committed appropriations for capital projects and operational reserves.
See Capital Improvement Program Budget for project details regarding the use of monies from this fund.
139
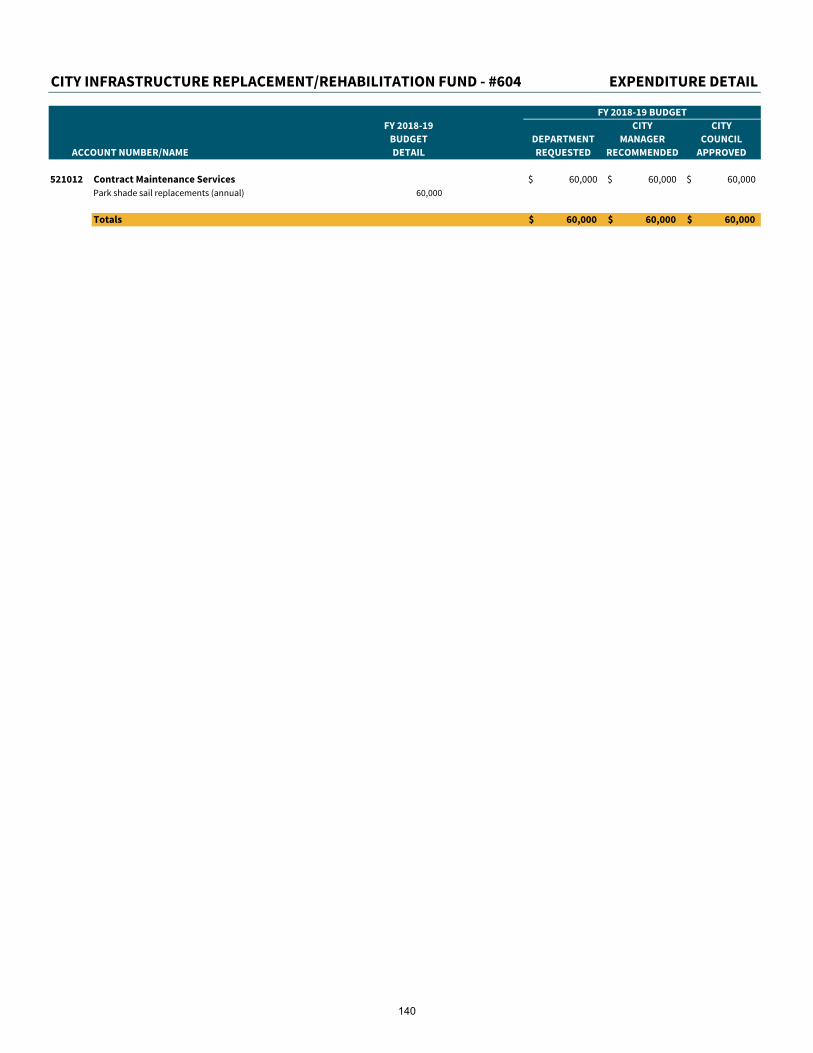
CITY INFRASTRUCTURE REPLACEMENT/REHABILITATION FUND - #604 EXPENDITURE DETAIL
FY 2018-19 BUDGET
FY 2018-19 CITY CITY
BUDGET DEPARTMENT MANAGER COUNCIL
ACCOUNT NUMBER/NAME DETAIL REQUESTED RECOMMENDED APPROVED
521012 Contract Maintenance Services 60,000$ 60,000$ 60,000$
Park shade sail replacements (annual) 60,000
Totals 60,000$ 60,000$ 60,000$
140
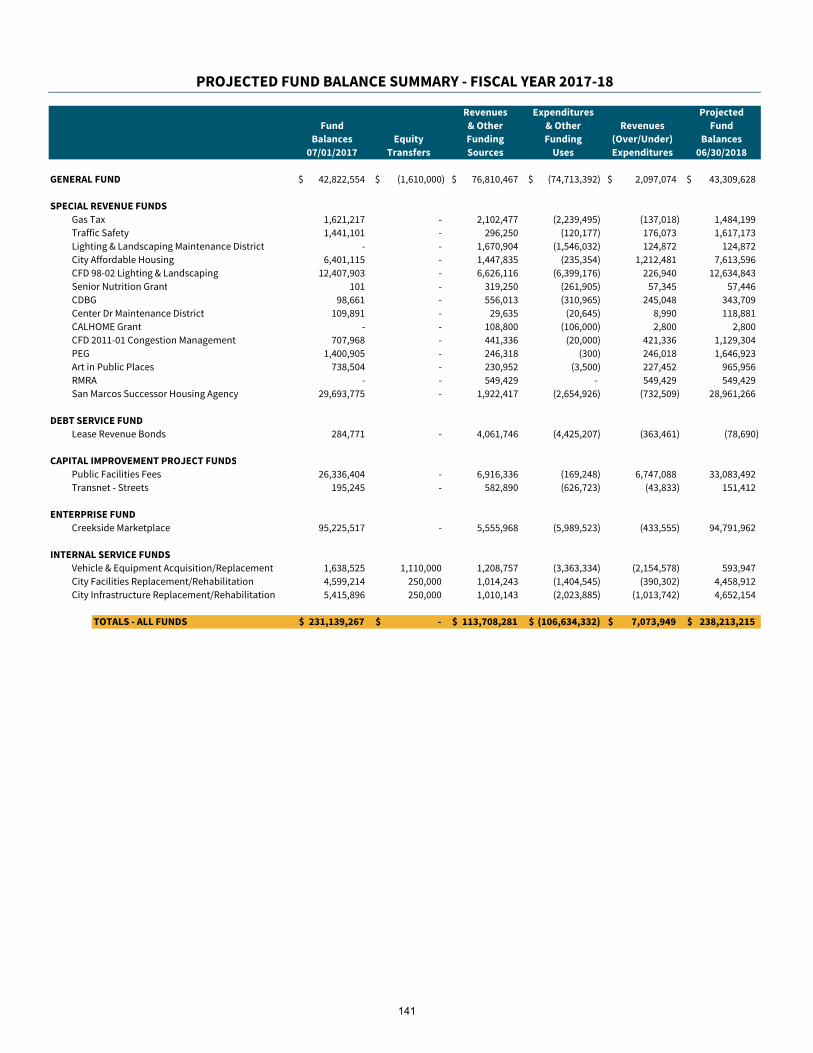
PROJECTED FUND BALANCE SUMMARY - FISCAL YEAR 2017-18
Revenues Expenditures Projected
Fund & Other & Other Revenues Fund
Balances Equity Funding Funding (Over/Under) Balances
07/01/2017 Transfers Sources Uses Expenditures 06/30/2018
GENERAL FUND 42,822,554$ (1,610,000)$ 76,810,467$ (74,713,392)$ 2,097,074$ 43,309,628$
SPECIAL REVENUE FUNDS
Gas Tax 1,621,217 - 2,102,477 (2,239,495) (137,018) 1,484,199
Traffic Safety 1,441,101 - 296,250 (120,177) 176,073 1,617,173
Lighting & Landscaping Maintenance District - - 1,670,904 (1,546,032) 124,872 124,872
City Affordable Housing 6,401,115 - 1,447,835 (235,354) 1,212,481 7,613,596
CFD 98-02 Lighting & Landscaping 12,407,903 - 6,626,116 (6,399,176) 226,940 12,634,843
Senior Nutrition Grant 101 - 319,250 (261,905) 57,345 57,446
CDBG 98,661 - 556,013 (310,965) 245,048 343,709
Center Dr Maintenance District 109,891 - 29,635 (20,645) 8,990 118,881
CALHOME Grant - - 108,800 (106,000) 2,800 2,800
CFD 2011-01 Congestion Management 707,968 - 441,336 (20,000) 421,336 1,129,304
PEG 1,400,905 - 246,318 (300) 246,018 1,646,923
Art in Public Places 738,504 - 230,952 (3,500) 227,452 965,956
RMRA - - 549,429 - 549,429 549,429
San Marcos Successor Housing Agency 29,693,775 - 1,922,417 (2,654,926) (732,509) 28,961,266
DEBT SERVICE FUND
Lease Revenue Bonds 284,771 - 4,061,746 (4,425,207) (363,461) (78,690)
CAPITAL IMPROVEMENT PROJECT FUNDS
Public Facilities Fees 26,336,404 - 6,916,336 (169,248) 6,747,088 33,083,492
Transnet - Streets 195,245 - 582,890 (626,723) (43,833) 151,412
ENTERPRISE FUND
Creekside Marketplace 95,225,517 - 5,555,968 (5,989,523) (433,555) 94,791,962
INTERNAL SERVICE FUNDS
Vehicle & Equipment Acquisition/Replacement 1,638,525 1,110,000 1,208,757 (3,363,334) (2,154,578) 593,947
City Facilities Replacement/Rehabilitation 4,599,214 250,000 1,014,243 (1,404,545) (390,302) 4,458,912
City Infrastructure Replacement/Rehabilitation 5,415,896 250,000 1,010,143 (2,023,885) (1,013,742) 4,652,154
TOTALS - ALL FUNDS 231,139,267$ -$ 113,708,281$ (106,634,332)$ 7,073,949$ 238,213,215$
141

PROJECTED FUND BALANCE SUMMARY - FISCAL YEAR 2018-19
Projected Revenues Expenditures Projected
Fund & Other & Other Revenues Fund
Balances Equity Funding Funding (Over/Under) Balances
07/01/2018 Transfers Sources Uses Expenditures 06/30/2019
GENERAL FUND 43,309,628$ -$ 77,015,127$ (76,879,131)$ 135,996$ 43,445,625$
SPECIAL REVENUE FUNDS
Gas Tax 1,484,199 - 2,079,230 (1,951,424) 127,806 1,612,005
Traffic Safety 1,617,173 - 300,500 (185,000) 115,500 1,732,673
Lighting & Landscaping Maintenance District 124,872 - 1,196,718 (1,271,655) (74,937) 49,935
City Affordable Housing 7,613,596 - 2,862,350 (1,687,700) 1,174,650 8,788,246
CFD 98-02 Lighting & Landscaping 12,634,843 - 7,012,345 (6,344,767) 667,578 13,302,421
Senior Nutrition Grant 57,446 - 303,050 (358,977) (55,927) 1,519
CDBG 343,709 - 698,377 (186,794) 511,583 855,292
Center Dr Maintenance District 118,881 - 33,025 (20,618) 12,407 131,288
CALHOME Grant 2,800 - 56,350 (56,350) - 2,800
CFD 2011-01 Congestion Management 1,129,304 - 528,416 (20,000) 508,416 1,637,720
PEG 1,646,923 - 240,626 (15,000) 225,626 1,872,549
Art in Public Places 965,956 - 3,500 (3,500) - 965,956
RMRA 549,429 - 1,573,812 - 1,573,812 2,123,241
San Marcos Successor Housing Agency 28,961,266 - 994,500 (2,534,980) (1,540,480) 27,420,786
DEBT SERVICE FUND
Lease Revenue Bonds (78,690) - 525,000 (399,988) 125,012 46,322
CAPITAL IMPROVEMENT PROJECT FUNDS
Public Facilities Fees 33,083,492 - 16,434,595 (323,909) 16,110,686 49,194,178
Transnet - Streets 151,412 - 1,318,000 - 1,318,000 1,469,412
ENTERPRISE FUND
Creekside Marketplace 94,791,962 - 5,685,332 (5,399,764) 285,568 95,077,530
INTERNAL SERVICE FUNDS
Vehicle & Equipment Acquisition/Replacement 593,947 - 589,021 (2,118,669) (1,529,648) (935,701)
City Facilities Replacement/Rehabilitation 4,458,912 - 1,314,542 (517,000) 797,542 5,256,454
City Infrastructure Replacement/Rehabilitation 4,652,154 - 1,211,292 (60,000) 1,151,292 5,803,446
TOTALS - ALL FUNDS 238,213,215$ -$ 121,975,708$ (100,335,226)$ 21,640,482$ 259,853,697$
142
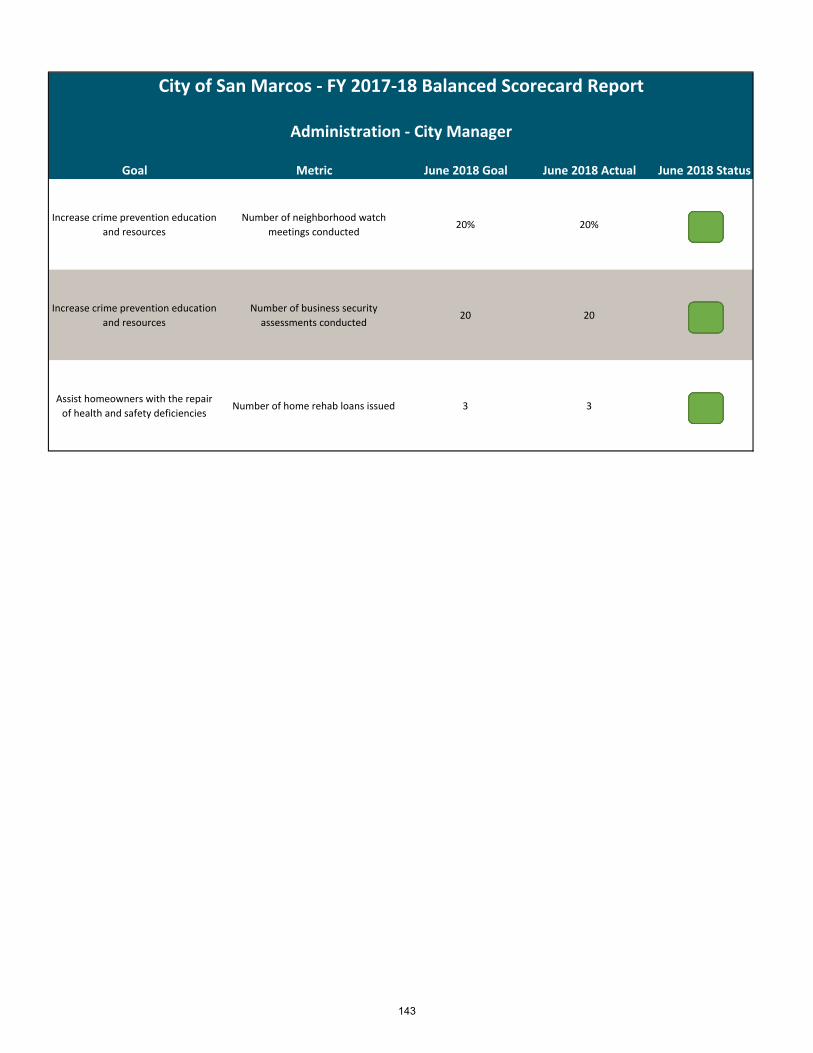
City of San Marcos ‐ FY 2017‐18 Balanced Scorecard Report
Administration ‐ City Manager
Goal Metric June 2018 Goal June 2018 Actual June 2018 Status
Increase crime prevention education
and resources
Number of neighborhood watch
meetings conducted20% 20%
Increase crime prevention education
and resources
Number of business security
assessments conducted20 20
Assist homeowners with the repair
of health and safety deficiencies Number of home rehab loans issued 3 3
143
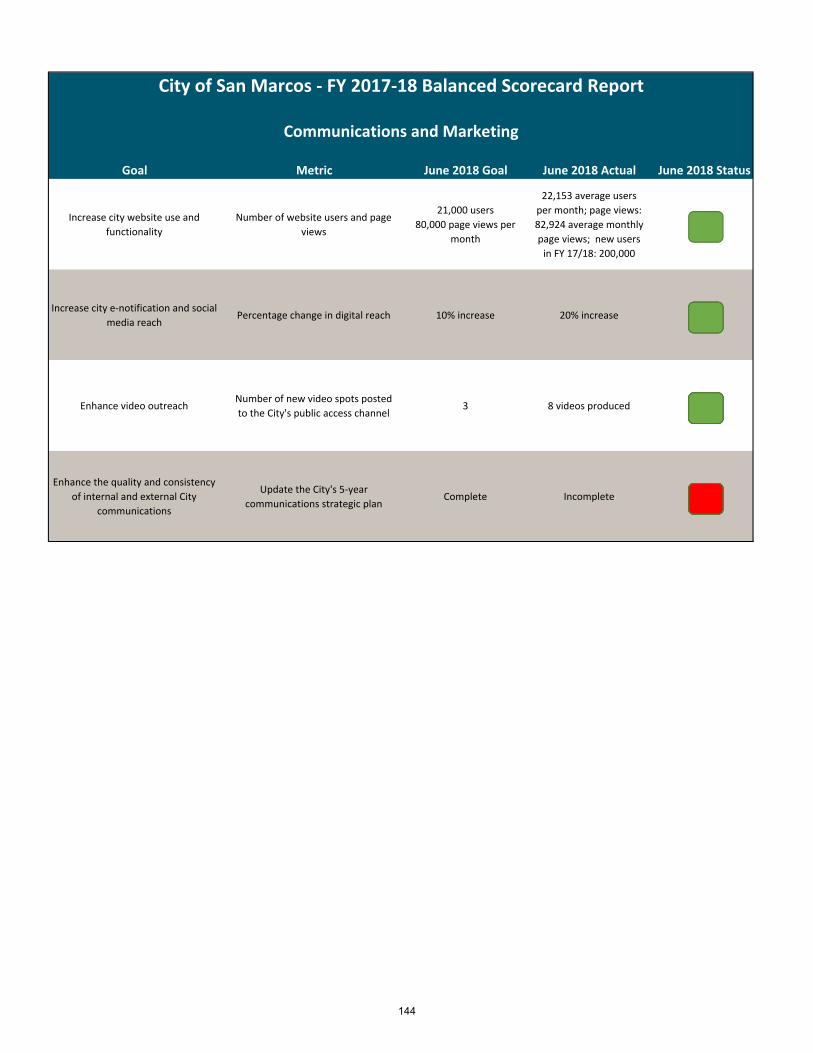
City of San Marcos ‐ FY 2017‐18 Balanced Scorecard Report
Communications and Marketing
Goal Metric June 2018 Goal June 2018 Actual June 2018 Status
Increase city website use and
functionality
Number of website users and page
views
21,000 users
80,000 page views per
month
22,153 average users
per month; page views:
82,924 average monthly
page views; new users
in FY 17/18: 200,000
Increase city e‐notification and social
media reachPercentage change in digital reach 10% increase 20% increase
Enhance video outreachNumber of new video spots posted
to the City's public access channel3 8 videos produced
Enhance the quality and consistency
of internal and external City
communications
Update the City's 5‐year
communications strategic planComplete Incomplete
144

City of San Marcos ‐ FY 2017‐18 Balanced Scorecard Report
Economic Development
Goal Metric June 2018 Goal June 2018 Actual June 2018 Status
Continue outreach activities that
promote the City as a great place to
do business
Number of local business visits 25 65
Continue information exchange with
commercial brokers to gather
information on targeted needs
Participate in annual
commercial/industrial broker event
for the city/region
Completed Completed
Develop a marketing identity for the
City as an entity
Install new entry and way finding
signage program for the key access
points, intersections, and important
traffic corridors
Completed Completed
Establish, maintain and grow on‐
going relationships with major city
employers and small business
owners
Meet at least once a month with a
Top 25 private sector employerCompleted Completed
Assist existing and prospective
businesses navigate the City
development and permitting process
Develop a post application survey to
assess applicant's experience with
the City's development process and
identify opportunities for
improvement
Completed Not completed.
145
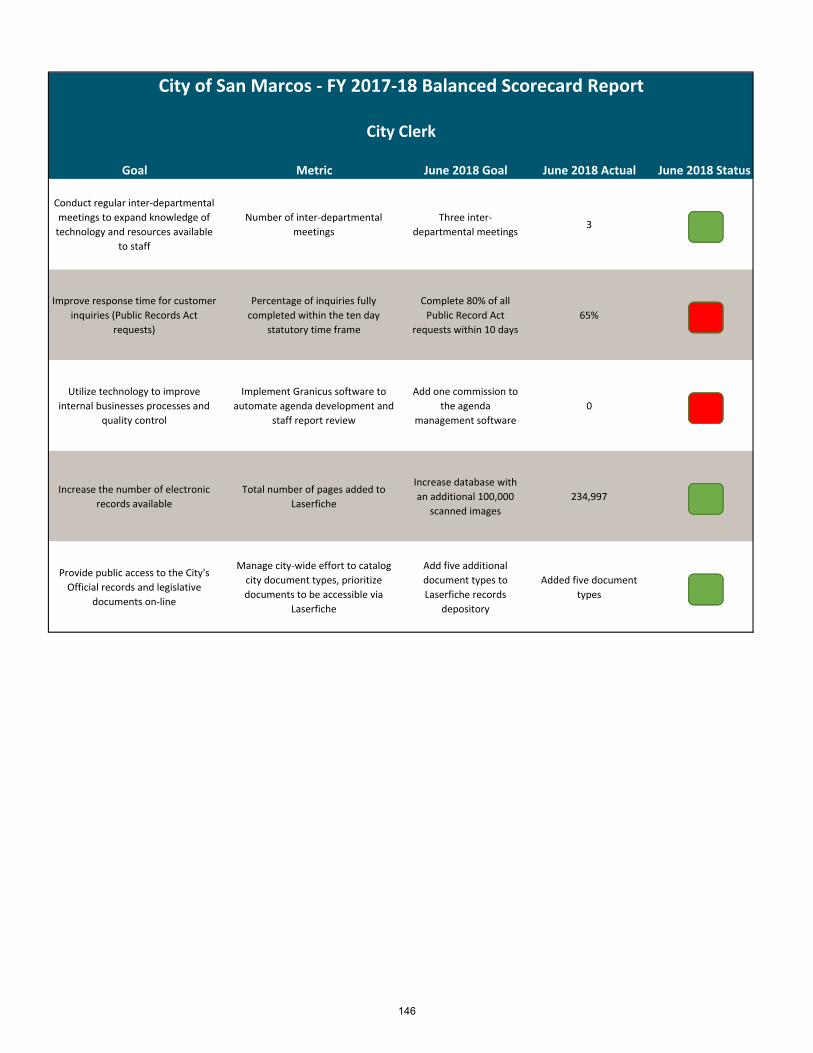
City of San Marcos ‐ FY 2017‐18 Balanced Scorecard Report
City Clerk
Goal Metric June 2018 Goal June 2018 Actual June 2018 Status
Conduct regular inter‐departmental
meetings to expand knowledge of
technology and resources available
to staff
Number of inter‐departmental
meetings
Three inter‐
departmental meetings3
Improve response time for customer
inquiries (Public Records Act
requests)
Percentage of inquiries fully
completed within the ten day
statutory time frame
Complete 80% of all
Public Record Act
requests within 10 days
65%
Utilize technology to improve
internal businesses processes and
quality control
Implement Granicus software to
automate agenda development and
staff report review
Add one commission to
the agenda
management software
0
Increase the number of electronic
records available
Total number of pages added to
Laserfiche
Increase database with
an additional 100,000
scanned images
234,997
Provide public access to the City's
Official records and legislative
documents on‐line
Manage city‐wide effort to catalog
city document types, prioritize
documents to be accessible via
Laserfiche
Add five additional
document types to
Laserfiche records
depository
Added five document
types
146
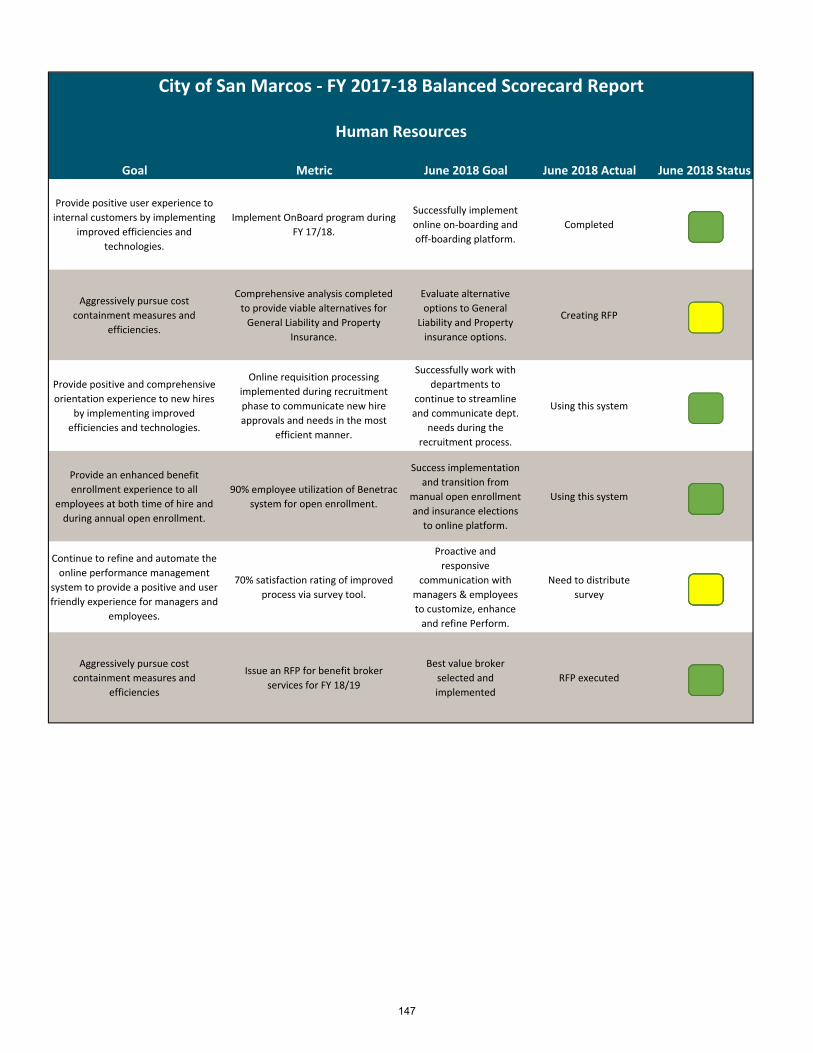
City of San Marcos ‐ FY 2017‐18 Balanced Scorecard Report
Human Resources
Goal Metric June 2018 Goal June 2018 Actual June 2018 Status
Provide positive user experience to
internal customers by implementing
improved efficiencies and
technologies.
Implement OnBoard program during
FY 17/18.
Successfully implement
online on‐boarding and
off‐boarding platform.
Completed
Aggressively pursue cost
containment measures and
efficiencies.
Comprehensive analysis completed
to provide viable alternatives for
General Liability and Property
Insurance.
Evaluate alternative
options to General
Liability and Property
insurance options.
Creating RFP
Provide positive and comprehensive
orientation experience to new hires
by implementing improved
efficiencies and technologies.
Online requisition processing
implemented during recruitment
phase to communicate new hire
approvals and needs in the most
efficient manner.
Successfully work with
departments to
continue to streamline
and communicate dept.
needs during the
recruitment process.
Using this system
Provide an enhanced benefit
enrollment experience to all
employees at both time of hire and
during annual open enrollment.
90% employee utilization of Benetrac
system for open enrollment.
Success implementation
and transition from
manual open enrollment
and insurance elections
to online platform.
Using this system
Continue to refine and automate the
online performance management
system to provide a positive and user
friendly experience for managers and
employees.
70% satisfaction rating of improved
process via survey tool.
Proactive and
responsive
communication with
managers & employees
to customize, enhance
and refine Perform.
Need to distribute
survey
Aggressively pursue cost
containment measures and
efficiencies
Issue an RFP for benefit broker
services for FY 18/19
Best value broker
selected and
implemented
RFP executed
147
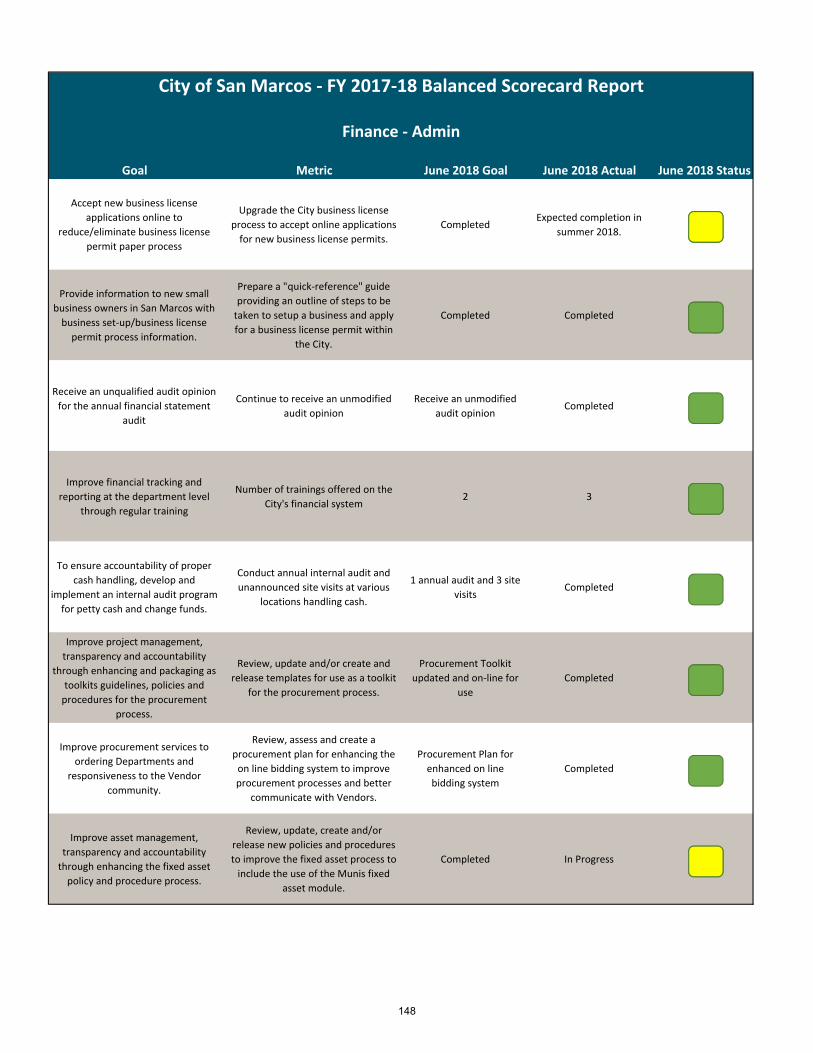
City of San Marcos ‐ FY 2017‐18 Balanced Scorecard Report
Finance ‐ Admin
Goal Metric June 2018 Goal June 2018 Actual June 2018 Status
Accept new business license
applications online to
reduce/eliminate business license
permit paper process
Upgrade the City business license
process to accept online applications
for new business license permits.
CompletedExpected completion in
summer 2018.
Provide information to new small
business owners in San Marcos with
business set‐up/business license
permit process information.
Prepare a "quick‐reference" guide
providing an outline of steps to be
taken to setup a business and apply
for a business license permit within
the City.
Completed Completed
Receive an unqualified audit opinion
for the annual financial statement
audit
Continue to receive an unmodified
audit opinion
Receive an unmodified
audit opinionCompleted
Improve financial tracking and
reporting at the department level
through regular training
Number of trainings offered on the
City's financial system2 3
To ensure accountability of proper
cash handling, develop and
implement an internal audit program
for petty cash and change funds.
Conduct annual internal audit and
unannounced site visits at various
locations handling cash.
1 annual audit and 3 site
visitsCompleted
Improve project management,
transparency and accountability
through enhancing and packaging as
toolkits guidelines, policies and
procedures for the procurement
process.
Review, update and/or create and
release templates for use as a toolkit
for the procurement process.
Procurement Toolkit
updated and on‐line for
use
Completed
Improve procurement services to
ordering Departments and
responsiveness to the Vendor
community.
Review, assess and create a
procurement plan for enhancing the
on line bidding system to improve
procurement processes and better
communicate with Vendors.
Procurement Plan for
enhanced on line
bidding system
Completed
Improve asset management,
transparency and accountability
through enhancing the fixed asset
policy and procedure process.
Review, update, create and/or
release new policies and procedures
to improve the fixed asset process to
include the use of the Munis fixed
asset module.
Completed In Progress
148
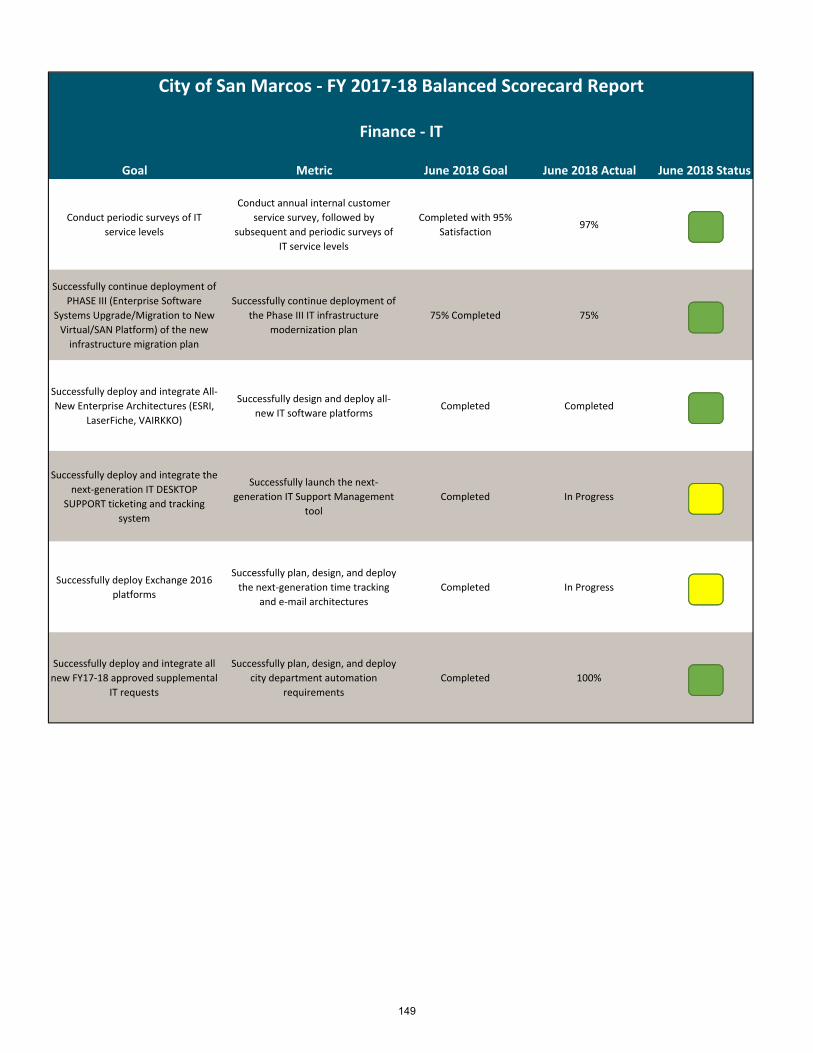
City of San Marcos ‐ FY 2017‐18 Balanced Scorecard Report
Finance ‐ IT
Goal Metric June 2018 Goal June 2018 Actual June 2018 Status
Conduct periodic surveys of IT
service levels
Conduct annual internal customer
service survey, followed by
subsequent and periodic surveys of
IT service levels
Completed with 95%
Satisfaction 97%
Successfully continue deployment of
PHASE III (Enterprise Software
Systems Upgrade/Migration to New
Virtual/SAN Platform) of the new
infrastructure migration plan
Successfully continue deployment of
the Phase III IT infrastructure
modernization plan
75% Completed 75%
Successfully deploy and integrate All‐
New Enterprise Architectures (ESRI,
LaserFiche, VAIRKKO)
Successfully design and deploy all‐
new IT software platformsCompleted Completed
Successfully deploy and integrate the
next‐generation IT DESKTOP
SUPPORT ticketing and tracking
system
Successfully launch the next‐
generation IT Support Management
tool
Completed In Progress
Successfully deploy Exchange 2016
platforms
Successfully plan, design, and deploy
the next‐generation time tracking
and e‐mail architectures
Completed In Progress
Successfully deploy and integrate all
new FY17‐18 approved supplemental
IT requests
Successfully plan, design, and deploy
city department automation
requirements
Completed 100%
149
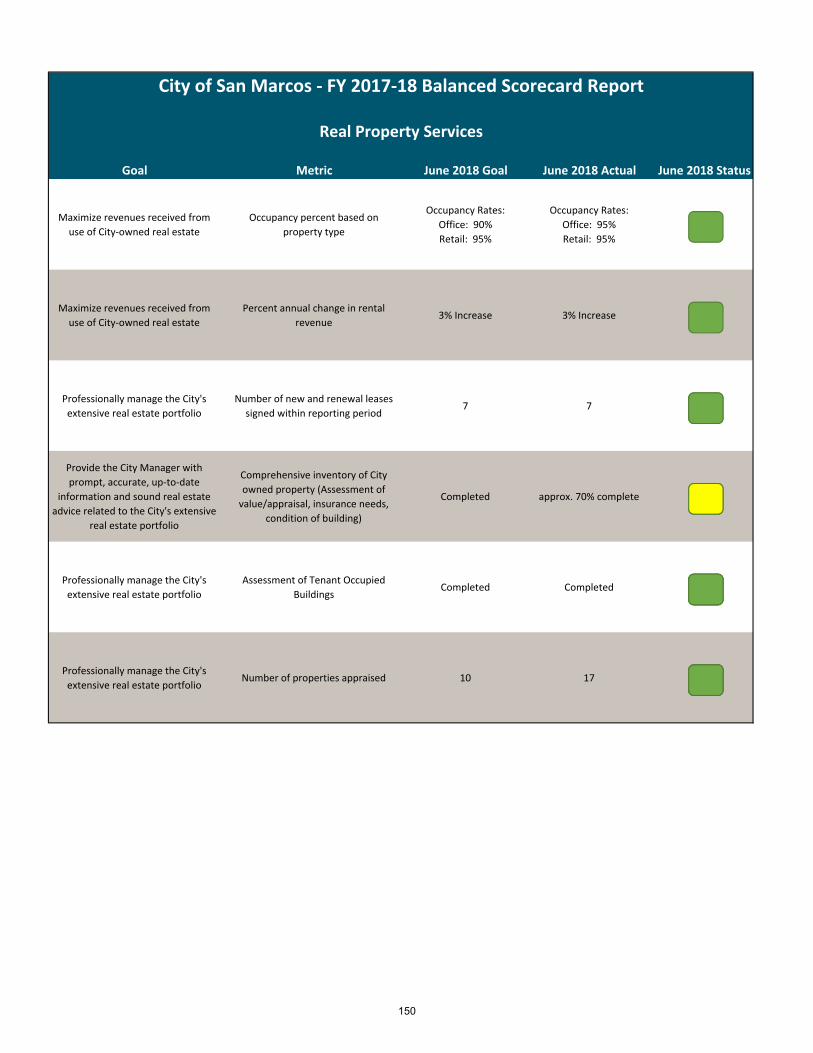
City of San Marcos ‐ FY 2017‐18 Balanced Scorecard Report
Real Property Services
Goal Metric June 2018 Goal June 2018 Actual June 2018 Status
Maximize revenues received from
use of City‐owned real estate
Occupancy percent based on
property type
Occupancy Rates:
Office: 90%
Retail: 95%
Occupancy Rates:
Office: 95%
Retail: 95%
Maximize revenues received from
use of City‐owned real estate
Percent annual change in rental
revenue3% Increase 3% Increase
Professionally manage the City's
extensive real estate portfolio
Number of new and renewal leases
signed within reporting period7 7
Provide the City Manager with
prompt, accurate, up‐to‐date
information and sound real estate
advice related to the City's extensive
real estate portfolio
Comprehensive inventory of City
owned property (Assessment of
value/appraisal, insurance needs,
condition of building)
Completed approx. 70% complete
Professionally manage the City's
extensive real estate portfolio
Assessment of Tenant Occupied
BuildingsCompleted Completed
Professionally manage the City's
extensive real estate portfolioNumber of properties appraised 10 17
150
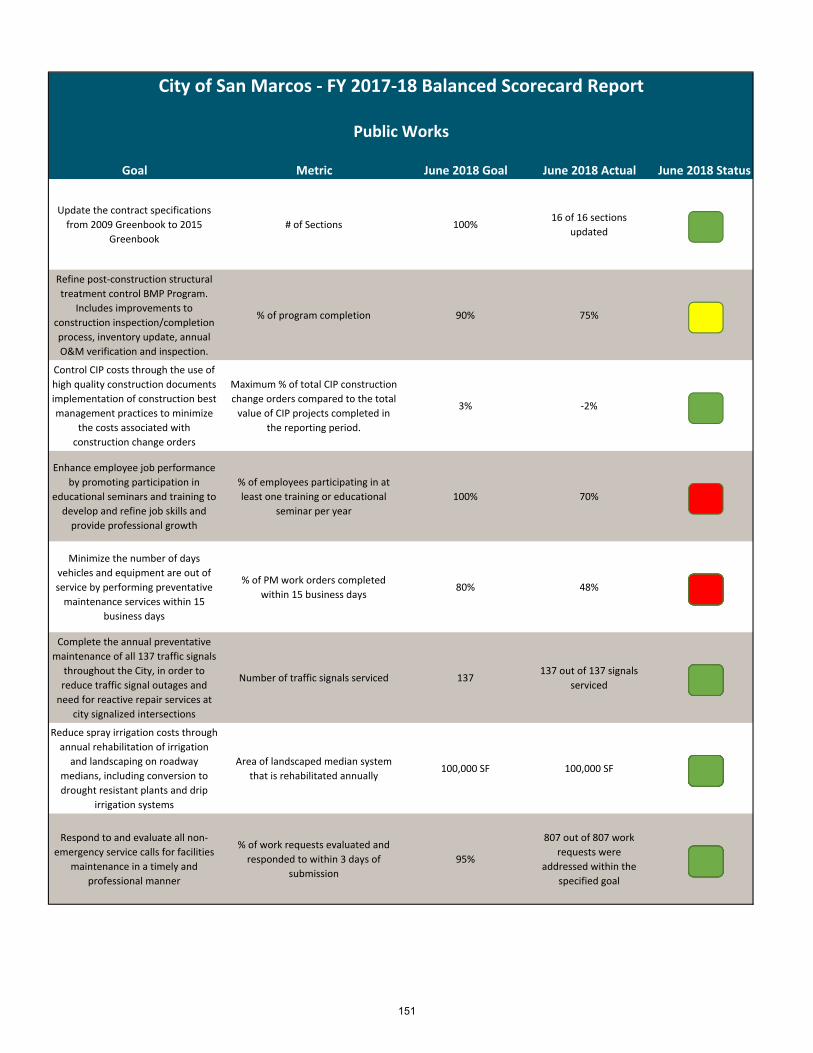
City of San Marcos ‐ FY 2017‐18 Balanced Scorecard Report
Public Works
Goal Metric June 2018 Goal June 2018 Actual June 2018 Status
Update the contract specifications
from 2009 Greenbook to 2015
Greenbook
# of Sections 100%16 of 16 sections
updated
Refine post‐construction structural
treatment control BMP Program.
Includes improvements to
construction inspection/completion
process, inventory update, annual
O&M verification and inspection.
% of program completion 90% 75%
Control CIP costs through the use of
high quality construction documents
implementation of construction best
management practices to minimize
the costs associated with
construction change orders
Maximum % of total CIP construction
change orders compared to the total
value of CIP projects completed in
the reporting period.
3% ‐2%
Enhance employee job performance
by promoting participation in
educational seminars and training to
develop and refine job skills and
provide professional growth
% of employees participating in at
least one training or educational
seminar per year
100% 70%
Minimize the number of days
vehicles and equipment are out of
service by performing preventative
maintenance services within 15
business days
% of PM work orders completed
within 15 business days80% 48%
Complete the annual preventative
maintenance of all 137 traffic signals
throughout the City, in order to
reduce traffic signal outages and
need for reactive repair services at
city signalized intersections
Number of traffic signals serviced 137137 out of 137 signals
serviced
Reduce spray irrigation costs through
annual rehabilitation of irrigation
and landscaping on roadway
medians, including conversion to
drought resistant plants and drip
irrigation systems
Area of landscaped median system
that is rehabilitated annually100,000 SF 100,000 SF
Respond to and evaluate all non‐
emergency service calls for facilities
maintenance in a timely and
professional manner
% of work requests evaluated and
responded to within 3 days of
submission
95%
807 out of 807 work
requests were
addressed within the
specified goal
151
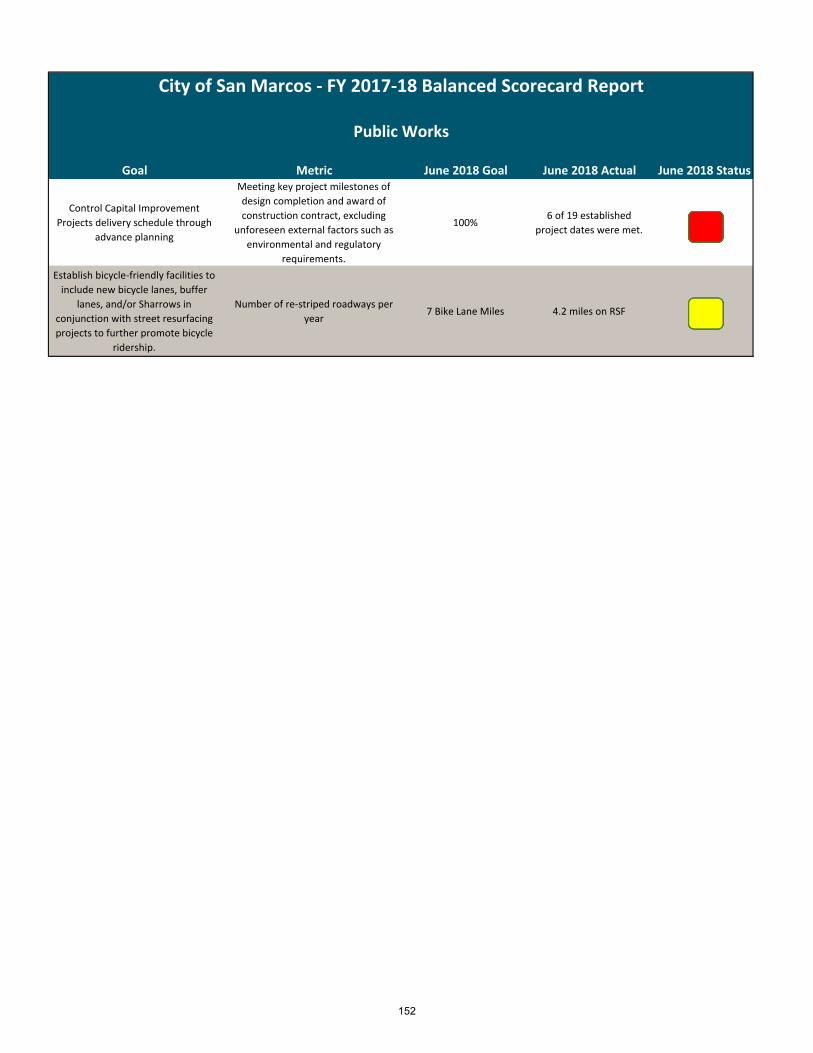
City of San Marcos ‐ FY 2017‐18 Balanced Scorecard Report
Public Works
Goal Metric June 2018 Goal June 2018 Actual June 2018 Status
Control Capital Improvement
Projects delivery schedule through
advance planning
Meeting key project milestones of
design completion and award of
construction contract, excluding
unforeseen external factors such as
environmental and regulatory
requirements.
100%6 of 19 established
project dates were met.
Establish bicycle‐friendly facilities to
include new bicycle lanes, buffer
lanes, and/or Sharrows in
conjunction with street resurfacing
projects to further promote bicycle
ridership.
Number of re‐striped roadways per
year7 Bike Lane Miles 4.2 miles on RSF
152
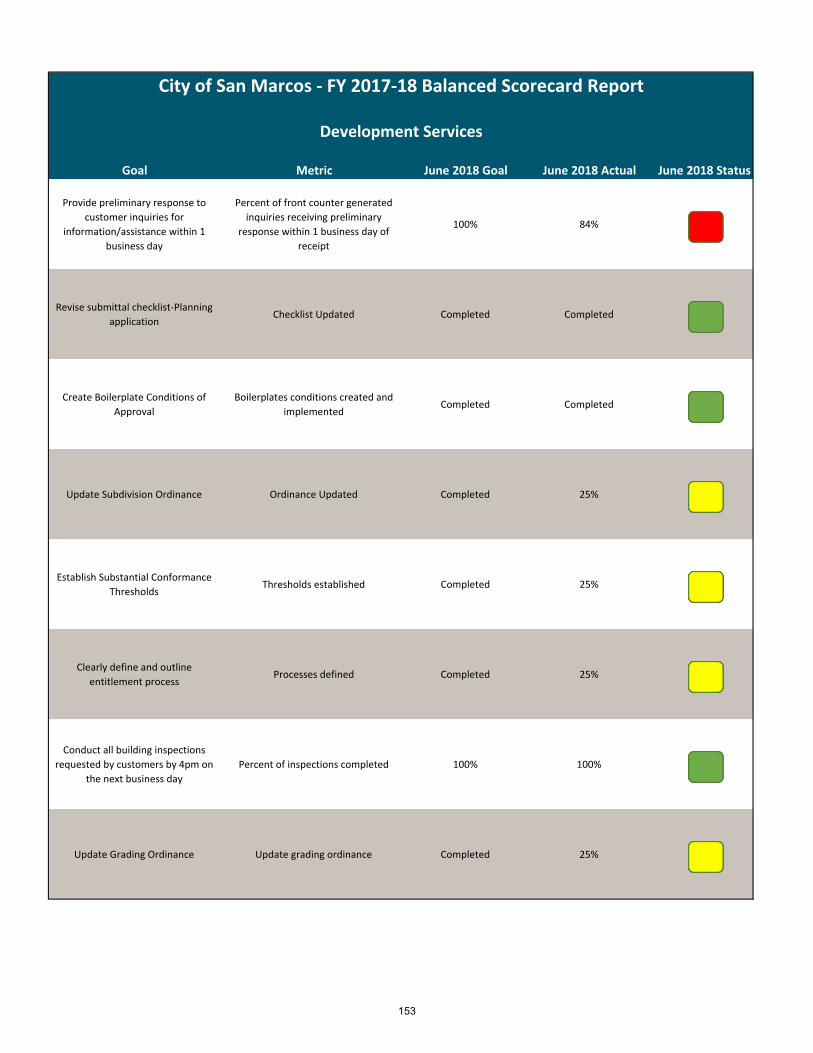
City of San Marcos ‐ FY 2017‐18 Balanced Scorecard Report
Development Services
Goal Metric June 2018 Goal June 2018 Actual June 2018 Status
Provide preliminary response to
customer inquiries for
information/assistance within 1
business day
Percent of front counter generated
inquiries receiving preliminary
response within 1 business day of
receipt
100% 84%
Revise submittal checklist‐Planning
applicationChecklist Updated Completed Completed
Create Boilerplate Conditions of
Approval
Boilerplates conditions created and
implementedCompleted Completed
Update Subdivision Ordinance Ordinance Updated Completed 25%
Establish Substantial Conformance
ThresholdsThresholds established Completed 25%
Clearly define and outline
entitlement processProcesses defined Completed 25%
Conduct all building inspections
requested by customers by 4pm on
the next business day
Percent of inspections completed 100% 100%
Update Grading Ordinance Update grading ordinance Completed 25%
153
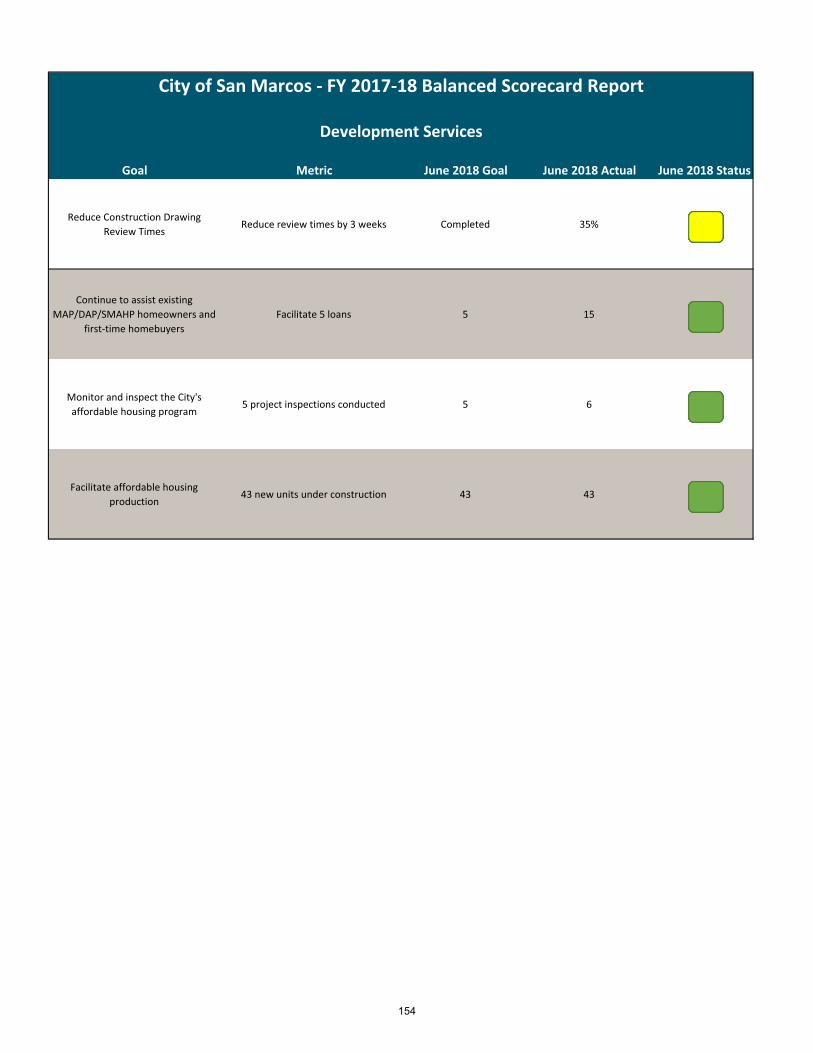
City of San Marcos ‐ FY 2017‐18 Balanced Scorecard Report
Development Services
Goal Metric June 2018 Goal June 2018 Actual June 2018 Status
Reduce Construction Drawing
Review TimesReduce review times by 3 weeks Completed 35%
Continue to assist existing
MAP/DAP/SMAHP homeowners and
first‐time homebuyers
Facilitate 5 loans 5 15
Monitor and inspect the City's
affordable housing program5 project inspections conducted 5 6
Facilitate affordable housing
production43 new units under construction 43 43
154
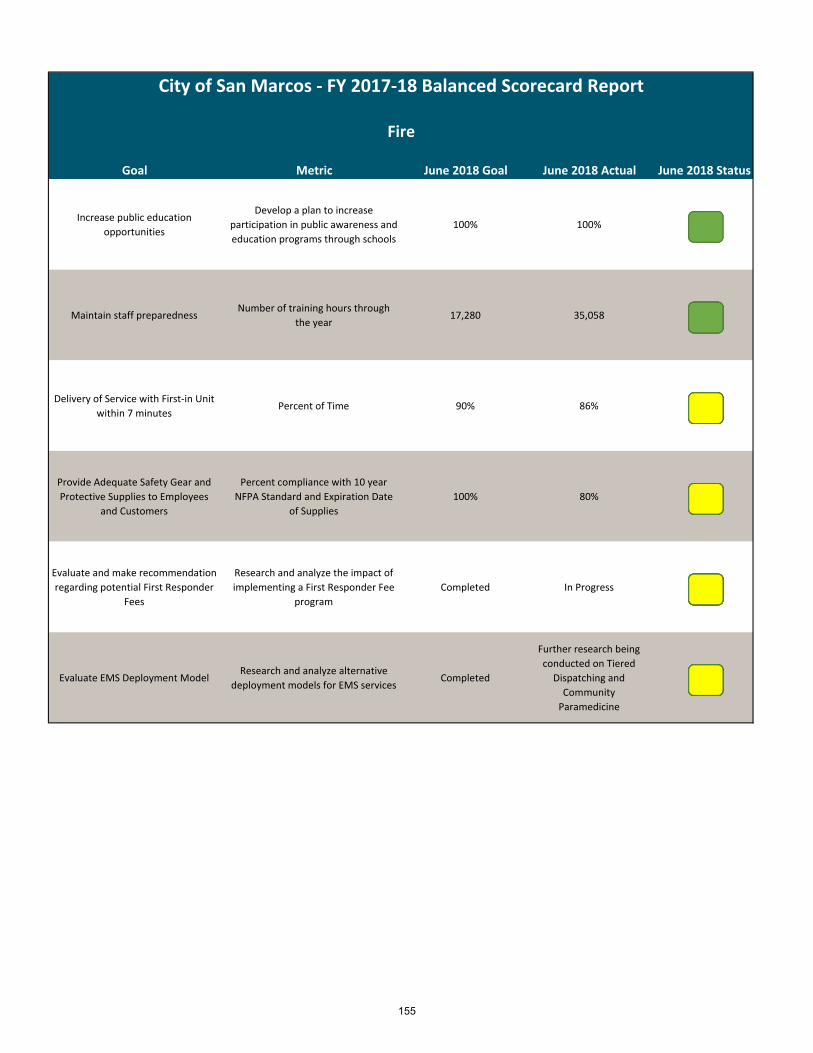
City of San Marcos ‐ FY 2017‐18 Balanced Scorecard Report
Fire
Goal Metric June 2018 Goal June 2018 Actual June 2018 Status
Increase public education
opportunities
Develop a plan to increase
participation in public awareness and
education programs through schools
100% 100%
Maintain staff preparednessNumber of training hours through
the year17,280 35,058
Delivery of Service with First‐in Unit
within 7 minutes Percent of Time 90% 86%
Provide Adequate Safety Gear and
Protective Supplies to Employees
and Customers
Percent compliance with 10 year
NFPA Standard and Expiration Date
of Supplies
100% 80%
Evaluate and make recommendation
regarding potential First Responder
Fees
Research and analyze the impact of
implementing a First Responder Fee
program
Completed In Progress
Evaluate EMS Deployment ModelResearch and analyze alternative
deployment models for EMS servicesCompleted
Further research being
conducted on Tiered
Dispatching and
Community
Paramedicine
155

City of San Marcos ‐ FY 2017‐18 Balanced Scorecard Report
Parks and Recreation
Goal Metric June 2018 Goal June 2018 Actual June 2018 Status
To achieve a 95% or higher
satisfaction rating on Community
Services program surveys distributed
to customers
Percentage of customers rating
programs/events satisfactory or
higher
95% 95%
Increase the presence of park
rangers in our high profile parks
during the times of 1pm to 6pm
Percentage increase over baseline
park patrols10% increase 10% increase
Provide appropriate trainings for
Community Services staff
Percentage of CS staff attending a
training100% 100%
Complete and submit the Trails
Master Plan Update for Commission
and Council review
Complete the master plan and
submit to the appropriate
commissions and City Council
Complete In Progress
Complete and submit the Parks
Master Plan Update for Commission
and Council review
Complete the master plan and
submit to the appropriate
commissions and City Council
Complete Complete
Provide high quality meals at Senior
Activities CenterPercentage increase in meals served 5% 5%
156
CAPITAL IMPROVEMENT PROJECTS PROGRAM
INTRODUCTION AND OVERVIEW:The 2019‐2023 Capital Improvement Projects (CIP) Program is a five‐year appropriation plan that provides the City with a financial strategy for infrastructure
improvements. Major capital improvements can require multiple years to strategically plan, design, fund, and eventually construct or execute. The CIP is
updated annually to add new appropriations and/or projects, while evaluating priorities, new requirements and new sources of funding. The program as a
whole coordinates the identification of dependable funding sources with the implementation of projects for currently evaluated needs and priorities.
PROCESS:The CIP process is a cooperative effort involving several departments within the City. The budget staff begins the process annually in December. A form is
completed for projects and includes a project description, schedule, and requested funding. Projects are then grouped into nine major categories including
Bridges, Creek District, Environmental, Landscape, Parks, Planning, Storm Drain, Streets and Traffic.
Concurrently, staff works to estimate the revenues for each funding source over the five‐year span of the program. Based on available funding by category,
and priority ranking, projects are then programmed as funding allows. Final adoption of the CIP occurs during a public meeting in June. All changes made
during the public process are incorporated into the adopted budget document which is published on the City website and distributed to City Staff.
CIP FUNDING SOURCES:Funding for the CIP comes from a variety of funding sources including Federal, State, developer and local funding. Most of these funds are earmarked for a
specific purpose and cannot be used to offset operating costs.
FY 2018‐19 PROPOSED CIP BUDGETThe proposed Fiscal Year 2018‐19 CIP appropriations are approximately $32.6 million. The forecasted five‐year appropriations are $44.2 million. The
CIP program reflects the actions taken by Council and developed in accordance with Council adopted policies and guiding documents (such as, but
not limited to the City’s General Plan, Master Plans, Specific Plans, Regional Transportation Plan) as well as generally accepted accounting principles.
The CIP includes funding for projects and programs in various geographic areas of the City.
157
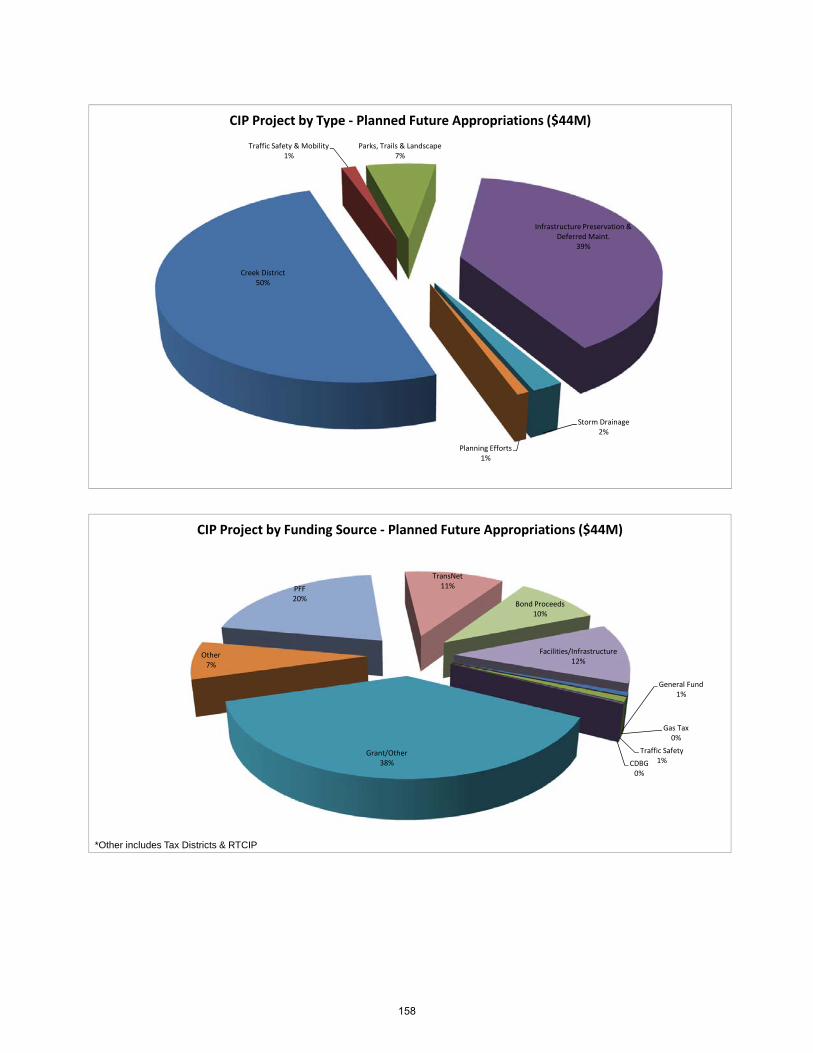
Creek District50%
Traffic Safety & Mobility1%
Parks, Trails & Landscape7%
Infrastructure Preservation & Deferred Maint.
39%
Storm Drainage2%
Planning Efforts1%
CIP Project by Type ‐ Planned Future Appropriations ($44M)
General Fund1%
Gas Tax0%
Traffic Safety1%CDBG
0%
Grant/Other38%
Other7%
PFF20%
TransNet11%
Bond Proceeds10%
Facilities/Infrastructure12%
CIP Project by Funding Source ‐ Planned Future Appropriations ($44M)
*Other includes Tax Districts & RTCIP
158
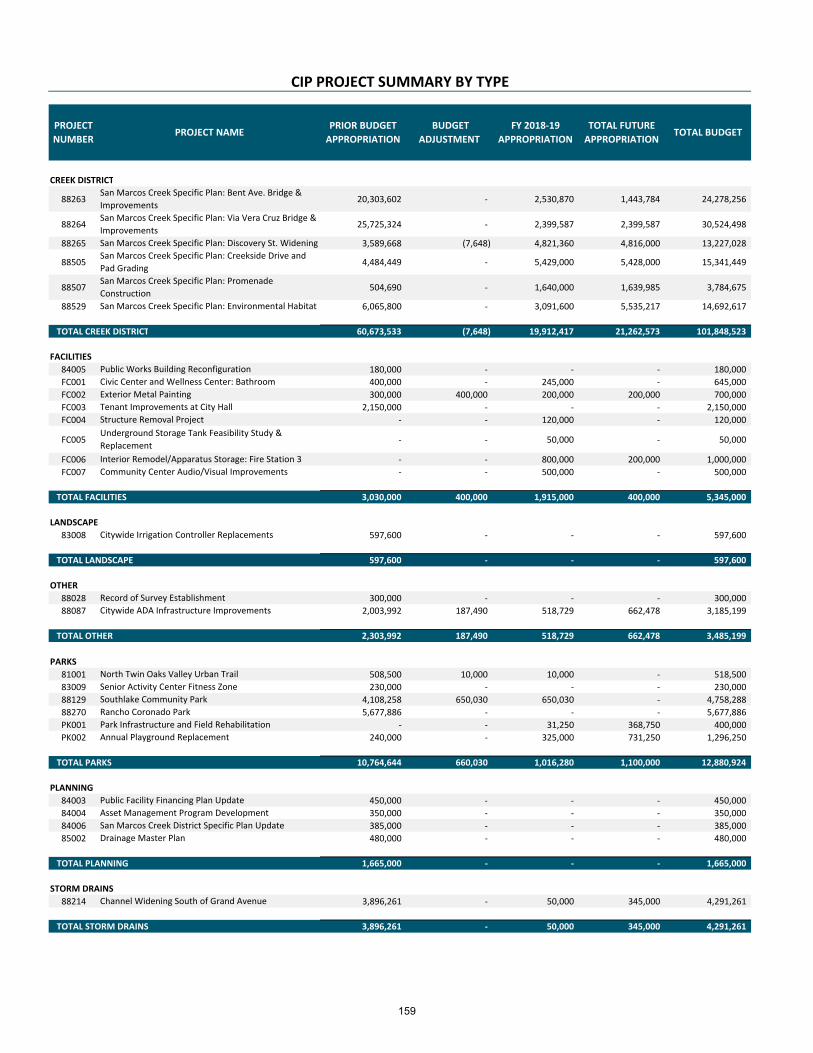
CIP PROJECT SUMMARY BY TYPE
4 5 6 11 12CREEK DISTRICT
88263 20,303,602 ‐ 2,530,870 1,443,784 24,278,256
88264 25,725,324 ‐ 2,399,587 2,399,587 30,524,498
88265 3,589,668 (7,648) 4,821,360 4,816,000 13,227,028
88505 4,484,449 ‐ 5,429,000 5,428,000 15,341,449
88507 504,690 ‐ 1,640,000 1,639,985 3,784,675
88529 6,065,800 ‐ 3,091,600 5,535,217 14,692,617
TOTAL CREEK DISTRICT 60,673,533 (7,648) 19,912,417 21,262,573 101,848,523
FACILITIES
84005 180,000 ‐ ‐ ‐ 180,000
FC001 400,000 ‐ 245,000 ‐ 645,000
FC002 300,000 400,000 200,000 200,000 700,000
FC003 2,150,000 ‐ ‐ ‐ 2,150,000
FC004 ‐ ‐ 120,000 ‐ 120,000
FC005 ‐ ‐ 50,000 ‐ 50,000
FC006 ‐ ‐ 800,000 200,000 1,000,000
FC007 ‐ ‐ 500,000 ‐ 500,000
TOTAL FACILITIES 3,030,000 400,000 1,915,000 400,000 5,345,000
LANDSCAPE
83008 597,600 ‐ ‐ ‐ 597,600
TOTAL LANDSCAPE 597,600 ‐ ‐ ‐ 597,600
OTHER
88028 300,000 ‐ ‐ ‐ 300,000
88087 2,003,992 187,490 518,729 662,478 3,185,199
TOTAL OTHER 2,303,992 187,490 518,729 662,478 3,485,199
PARKS
81001 508,500 10,000 10,000 ‐ 518,500
83009 230,000 ‐ ‐ ‐ 230,000
88129 4,108,258 650,030 650,030 ‐ 4,758,288
88270 5,677,886 ‐ ‐ ‐ 5,677,886
PK001 ‐ ‐ 31,250 368,750 400,000
PK002 240,000 ‐ 325,000 731,250 1,296,250
TOTAL PARKS 10,764,644 660,030 1,016,280 1,100,000 12,880,924
PLANNING
84003 450,000 ‐ ‐ ‐ 450,000
84004 350,000 ‐ ‐ ‐ 350,000
84006 385,000 ‐ ‐ ‐ 385,000
85002 480,000 ‐ ‐ ‐ 480,000
TOTAL PLANNING 1,665,000 ‐ ‐ ‐ 1,665,000
STORM DRAINS
88214 3,896,261 ‐ 50,000 345,000 4,291,261
TOTAL STORM DRAINS 3,896,261 ‐ 50,000 345,000 4,291,261
PROJECT
NUMBERPROJECT NAME
San Marcos Creek Specific Plan: Via Vera Cruz Bridge &
Improvements
San Marcos Creek Specific Plan: Bent Ave. Bridge &
Improvements
Structure Removal Project
Underground Storage Tank Feasibility Study &
Replacement
Interior Remodel/Apparatus Storage: Fire Station 3
Annual Playground Replacement
Record of Survey Establishment
Citywide ADA Infrastructure Improvements
Civic Center and Wellness Center: Bathroom
TOTAL FUTURE
APPROPRIATIONTOTAL BUDGET
FY 2018‐19
APPROPRIATION
San Marcos Creek Specific Plan: Environmental Habitat
Public Works Building Reconfiguration
San Marcos Creek Specific Plan: Discovery St. Widening
San Marcos Creek Specific Plan: Creekside Drive and
Pad Grading
San Marcos Creek Specific Plan: Promenade
Construction
Park Infrastructure and Field Rehabilitation
Southlake Community Park
Rancho Coronado Park
PRIOR BUDGET
APPROPRIATION
BUDGET
ADJUSTMENT
Community Center Audio/Visual Improvements
Exterior Metal Painting
Tenant Improvements at City Hall
Public Facility Financing Plan Update
Asset Management Program Development
San Marcos Creek District Specific Plan Update
Channel Widening South of Grand Avenue
Drainage Master Plan
North Twin Oaks Valley Urban Trail
Citywide Irrigation Controller Replacements
Senior Activity Center Fitness Zone
159
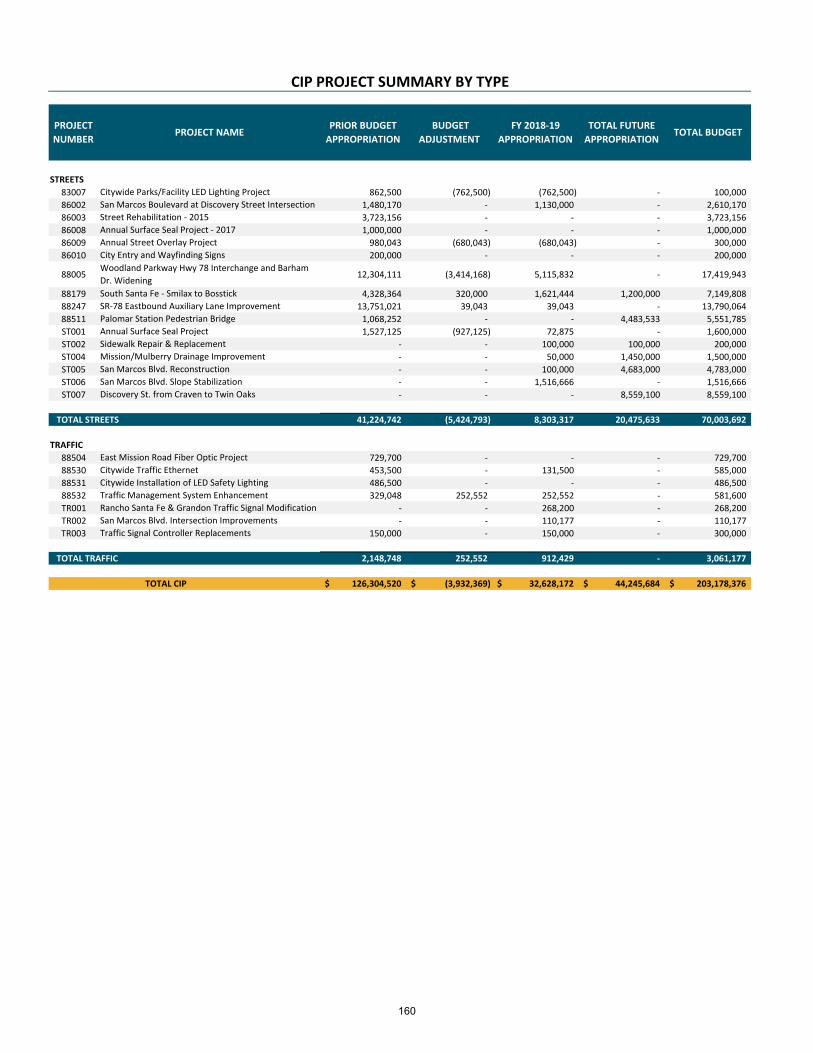
CIP PROJECT SUMMARY BY TYPE
PROJECT
NUMBERPROJECT NAME
TOTAL FUTURE
APPROPRIATIONTOTAL BUDGET
FY 2018‐19
APPROPRIATION
PRIOR BUDGET
APPROPRIATION
BUDGET
ADJUSTMENT
STREETS
83007 862,500 (762,500) (762,500) ‐ 100,000
86002 1,480,170 ‐ 1,130,000 ‐ 2,610,170
86003 3,723,156 ‐ ‐ ‐ 3,723,156
86008 1,000,000 ‐ ‐ ‐ 1,000,000
86009 980,043 (680,043) (680,043) ‐ 300,000
86010 200,000 ‐ ‐ ‐ 200,000
88005 12,304,111 (3,414,168) 5,115,832 ‐ 17,419,943
88179 4,328,364 320,000 1,621,444 1,200,000 7,149,808
88247 13,751,021 39,043 39,043 ‐ 13,790,064
88511 1,068,252 ‐ ‐ 4,483,533 5,551,785
ST001 1,527,125 (927,125) 72,875 ‐ 1,600,000
ST002 ‐ ‐ 100,000 100,000 200,000
ST004 ‐ ‐ 50,000 1,450,000 1,500,000
ST005 ‐ ‐ 100,000 4,683,000 4,783,000
ST006 ‐ ‐ 1,516,666 ‐ 1,516,666
ST007 ‐ ‐ ‐ 8,559,100 8,559,100
TOTAL STREETS 41,224,742 (5,424,793) 8,303,317 20,475,633 70,003,692
TRAFFIC
88504 729,700 ‐ ‐ ‐ 729,700
88530 453,500 ‐ 131,500 ‐ 585,000
88531 486,500 ‐ ‐ ‐ 486,500
88532 329,048 252,552 252,552 ‐ 581,600
TR001 ‐ ‐ 268,200 ‐ 268,200
TR002 ‐ ‐ 110,177 ‐ 110,177
TR003 150,000 ‐ 150,000 ‐ 300,000
TOTAL TRAFFIC 2,148,748 252,552 912,429 ‐ 3,061,177
TOTAL CIP 126,304,520$ (3,932,369)$ 32,628,172$ 44,245,684$ 203,178,376$
Rancho Santa Fe & Grandon Traffic Signal Modification
Citywide Installation of LED Safety Lighting
Traffic Management System Enhancement
Citywide Traffic Ethernet
SR‐78 Eastbound Auxiliary Lane Improvement
Annual Surface Seal Project
Sidewalk Repair & Replacement
San Marcos Boulevard at Discovery Street Intersection
Street Rehabilitation ‐ 2015
Citywide Parks/Facility LED Lighting Project
Annual Surface Seal Project ‐ 2017
City Entry and Wayfinding Signs
Woodland Parkway Hwy 78 Interchange and Barham
Dr. Widening
South Santa Fe ‐ Smilax to Bosstick
Palomar Station Pedestrian Bridge
Annual Street Overlay Project
Traffic Signal Controller Replacements
Mission/Mulberry Drainage Improvement
San Marcos Blvd. Reconstruction
San Marcos Blvd. Slope Stabilization
Discovery St. from Craven to Twin Oaks
San Marcos Blvd. Intersection Improvements
East Mission Road Fiber Optic Project
160
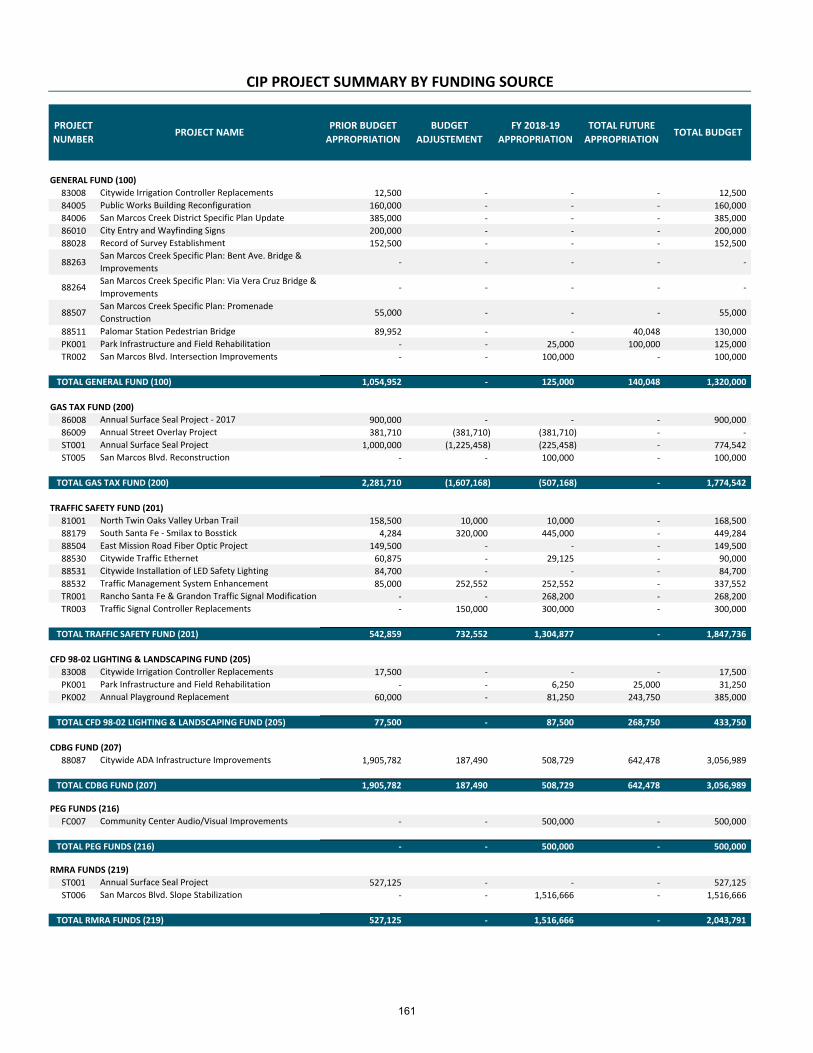
CIP PROJECT SUMMARY BY FUNDING SOURCE
4 5 6 11 12GENERAL FUND (100)
83008 12,500 ‐ ‐ ‐ 12,500
84005 160,000 ‐ ‐ ‐ 160,000
84006 385,000 ‐ ‐ ‐ 385,000
86010 200,000 ‐ ‐ ‐ 200,000
88028 152,500 ‐ ‐ ‐ 152,500
88263 ‐ ‐ ‐ ‐ ‐
88264 ‐ ‐ ‐ ‐ ‐
88507 55,000 ‐ ‐ ‐ 55,000
88511 89,952 ‐ ‐ 40,048 130,000
PK001 ‐ ‐ 25,000 100,000 125,000
TR002 ‐ ‐ 100,000 ‐ 100,000
TOTAL GENERAL FUND (100) 1,054,952 ‐ 125,000 140,048 1,320,000
GAS TAX FUND (200)
86008 900,000 ‐ ‐ ‐ 900,000
86009 381,710 (381,710) (381,710) ‐ ‐
ST001 1,000,000 (1,225,458) (225,458) ‐ 774,542
ST005 ‐ ‐ 100,000 ‐ 100,000
TOTAL GAS TAX FUND (200) 2,281,710 (1,607,168) (507,168) ‐ 1,774,542
TRAFFIC SAFETY FUND (201)
81001 158,500 10,000 10,000 ‐ 168,500
88179 4,284 320,000 445,000 ‐ 449,284
88504 149,500 ‐ ‐ ‐ 149,500
88530 60,875 ‐ 29,125 ‐ 90,000
88531 84,700 ‐ ‐ ‐ 84,700
88532 85,000 252,552 252,552 ‐ 337,552
TR001 ‐ ‐ 268,200 ‐ 268,200
TR003 ‐ 150,000 300,000 ‐ 300,000
TOTAL TRAFFIC SAFETY FUND (201) 542,859 732,552 1,304,877 ‐ 1,847,736
CFD 98‐02 LIGHTING & LANDSCAPING FUND (205)
83008 17,500 ‐ ‐ ‐ 17,500
PK001 ‐ ‐ 6,250 25,000 31,250
PK002 60,000 ‐ 81,250 243,750 385,000
TOTAL CFD 98‐02 LIGHTING & LANDSCAPING FUND (205) 77,500 ‐ 87,500 268,750 433,750
CDBG FUND (207)
88087 1,905,782 187,490 508,729 642,478 3,056,989
TOTAL CDBG FUND (207) 1,905,782 187,490 508,729 642,478 3,056,989
PEG FUNDS (216)
FC007 ‐ ‐ 500,000 ‐ 500,000
TOTAL PEG FUNDS (216) ‐ ‐ 500,000 ‐ 500,000
RMRA FUNDS (219)
ST001 527,125 ‐ ‐ ‐ 527,125
ST006 ‐ ‐ 1,516,666 ‐ 1,516,666
TOTAL RMRA FUNDS (219) 527,125 ‐ 1,516,666 ‐ 2,043,791
TOTAL FUTURE
APPROPRIATIONTOTAL BUDGET
San Marcos Creek District Specific Plan Update
Park Infrastructure and Field Rehabilitation
Palomar Station Pedestrian Bridge
Community Center Audio/Visual Improvements
San Marcos Blvd. Slope Stabilization
South Santa Fe ‐ Smilax to Bosstick
East Mission Road Fiber Optic Project
Citywide Traffic Ethernet
Citywide Installation of LED Safety Lighting
Traffic Signal Controller Replacements
North Twin Oaks Valley Urban Trail
City Entry and Wayfinding Signs
Record of Survey Establishment
Citywide Irrigation Controller Replacements
Public Works Building Reconfiguration
San Marcos Blvd. Reconstruction
San Marcos Creek Specific Plan: Promenade
Construction
PROJECT
NUMBERPROJECT NAME
PRIOR BUDGET
APPROPRIATION
BUDGET
ADJUSTEMENT
FY 2018‐19
APPROPRIATION
Citywide ADA Infrastructure Improvements
Annual Playground Replacement
Citywide Irrigation Controller Replacements
Park Infrastructure and Field Rehabilitation
Traffic Management System Enhancement
Rancho Santa Fe & Grandon Traffic Signal Modification
Annual Street Overlay Project
Annual Surface Seal Project ‐ 2017
Annual Surface Seal Project
San Marcos Blvd. Intersection Improvements
Annual Surface Seal Project
San Marcos Creek Specific Plan: Bent Ave. Bridge &
Improvements
San Marcos Creek Specific Plan: Via Vera Cruz Bridge &
Improvements
161
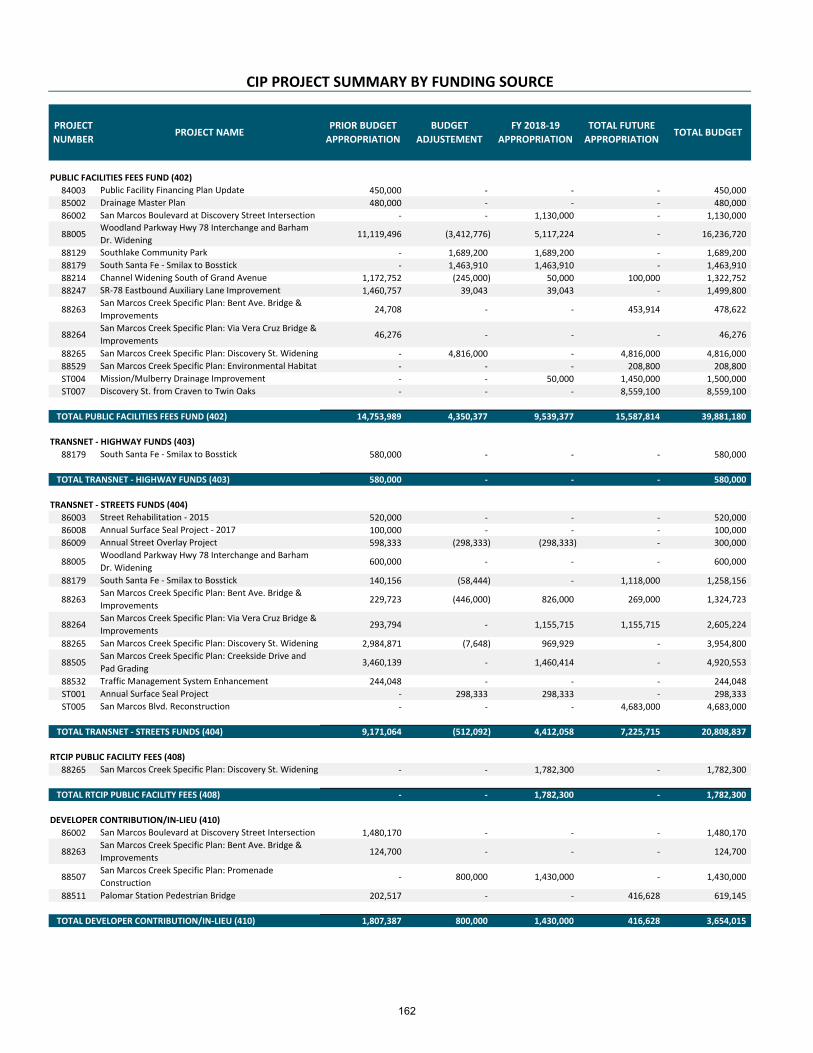
CIP PROJECT SUMMARY BY FUNDING SOURCE
TOTAL FUTURE
APPROPRIATIONTOTAL BUDGET
PROJECT
NUMBERPROJECT NAME
PRIOR BUDGET
APPROPRIATION
BUDGET
ADJUSTEMENT
FY 2018‐19
APPROPRIATION
PUBLIC FACILITIES FEES FUND (402)
84003 450,000 ‐ ‐ ‐ 450,000
85002 480,000 ‐ ‐ ‐ 480,000
86002 ‐ ‐ 1,130,000 ‐ 1,130,000
88005 11,119,496 (3,412,776) 5,117,224 ‐ 16,236,720
88129 ‐ 1,689,200 1,689,200 ‐ 1,689,200
88179 ‐ 1,463,910 1,463,910 ‐ 1,463,910
88214 1,172,752 (245,000) 50,000 100,000 1,322,752
88247 1,460,757 39,043 39,043 ‐ 1,499,800
88263 24,708 ‐ ‐ 453,914 478,622
88264 46,276 ‐ ‐ ‐ 46,276
88265 ‐ 4,816,000 ‐ 4,816,000 4,816,000
88529 ‐ ‐ ‐ 208,800 208,800
ST004 ‐ ‐ 50,000 1,450,000 1,500,000
ST007 ‐ ‐ ‐ 8,559,100 8,559,100
TOTAL PUBLIC FACILITIES FEES FUND (402) 14,753,989 4,350,377 9,539,377 15,587,814 39,881,180
TRANSNET ‐ HIGHWAY FUNDS (403)
88179 580,000 ‐ ‐ ‐ 580,000
TOTAL TRANSNET ‐ HIGHWAY FUNDS (403) 580,000 ‐ ‐ ‐ 580,000
TRANSNET ‐ STREETS FUNDS (404)
86003 520,000 ‐ ‐ ‐ 520,000
86008 100,000 ‐ ‐ ‐ 100,000
86009 598,333 (298,333) (298,333) ‐ 300,000
88005 600,000 ‐ ‐ ‐ 600,000
88179 140,156 (58,444) ‐ 1,118,000 1,258,156
88263 229,723 (446,000) 826,000 269,000 1,324,723
88264 293,794 ‐ 1,155,715 1,155,715 2,605,224
88265 2,984,871 (7,648) 969,929 ‐ 3,954,800
88505 3,460,139 ‐ 1,460,414 ‐ 4,920,553
88532 244,048 ‐ ‐ ‐ 244,048
ST001 ‐ 298,333 298,333 ‐ 298,333
ST005 ‐ ‐ ‐ 4,683,000 4,683,000
TOTAL TRANSNET ‐ STREETS FUNDS (404) 9,171,064 (512,092) 4,412,058 7,225,715 20,808,837
RTCIP PUBLIC FACILITY FEES (408)
88265 ‐ ‐ 1,782,300 ‐ 1,782,300
TOTAL RTCIP PUBLIC FACILITY FEES (408) ‐ ‐ 1,782,300 ‐ 1,782,300
DEVELOPER CONTRIBUTION/IN‐LIEU (410)
86002 1,480,170 ‐ ‐ ‐ 1,480,170
88263 124,700 ‐ ‐ ‐ 124,700
88507 ‐ 800,000 1,430,000 ‐ 1,430,000
88511 202,517 ‐ ‐ 416,628 619,145
TOTAL DEVELOPER CONTRIBUTION/IN‐LIEU (410) 1,807,387 800,000 1,430,000 416,628 3,654,015
Annual Street Overlay Project
Woodland Parkway Hwy 78 Interchange and Barham
Dr. Widening
Woodland Parkway Hwy 78 Interchange and Barham
Dr. Widening
South Santa Fe ‐ Smilax to Bosstick
San Marcos Creek Specific Plan: Bent Ave. Bridge &
Improvements
San Marcos Creek Specific Plan: Via Vera Cruz Bridge &
Improvements
Channel Widening South of Grand Avenue
Southlake Community Park
SR‐78 Eastbound Auxiliary Lane Improvement
San Marcos Creek Specific Plan: Discovery St. Widening
Drainage Master Plan
San Marcos Boulevard at Discovery Street Intersection
Annual Surface Seal Project ‐ 2017
Discovery St. from Craven to Twin Oaks
San Marcos Creek Specific Plan: Bent Ave. Bridge &
Improvements
San Marcos Blvd. Reconstruction
Mission/Mulberry Drainage Improvement
Street Rehabilitation ‐ 2015
Public Facility Financing Plan Update
South Santa Fe ‐ Smilax to Bosstick
San Marcos Creek Specific Plan: Via Vera Cruz Bridge &
Improvements
San Marcos Creek Specific Plan: Discovery St. Widening
San Marcos Creek Specific Plan: Creekside Drive and
Pad Grading
San Marcos Creek Specific Plan: Bent Ave. Bridge &
Improvements
Annual Surface Seal Project
San Marcos Creek Specific Plan: Environmental Habitat
South Santa Fe ‐ Smilax to Bosstick
Traffic Management System Enhancement
San Marcos Creek Specific Plan: Discovery St. Widening
San Marcos Boulevard at Discovery Street Intersection
San Marcos Creek Specific Plan: Promenade
Construction
Palomar Station Pedestrian Bridge
162

CIP PROJECT SUMMARY BY FUNDING SOURCE
TOTAL FUTURE
APPROPRIATIONTOTAL BUDGET
PROJECT
NUMBERPROJECT NAME
PRIOR BUDGET
APPROPRIATION
BUDGET
ADJUSTEMENT
FY 2018‐19
APPROPRIATION
GRANT/OTHER FUNDING (411)
81001 350,000 ‐ ‐ ‐ 350,000
83007 862,500 (862,500) (862,500) ‐ ‐
83008 567,600 ‐ ‐ ‐ 567,600
88247 10,529,476 ‐ ‐ ‐ 10,529,476
88263 19,827,534 ‐ ‐ ‐ 19,827,534
88264 24,964,752 ‐ ‐ ‐ 24,964,752
88504 580,200 ‐ ‐ ‐ 580,200
88507 ‐ ‐ ‐ 1,000,000 1,000,000
88511 775,783 ‐ ‐ 4,026,857 4,802,640
88529 1,860,317 (626,400) ‐ ‐ 1,860,317
88530 392,625 ‐ 102,375 ‐ 495,000
88531 401,800 ‐ ‐ ‐ 401,800
TR002 ‐ ‐ 10,177 ‐ 10,177
TOTAL GRANT/OTHER FUNDING (411) 61,112,587 (1,488,900) (749,948) 5,026,857 65,389,496
TIF FUNDS (412)
88179 ‐ ‐ ‐ 82,000 82,000
TOTAL TIF FUNDS (412) ‐ ‐ ‐ 82,000 82,000
HOA REVENUE (443)
ST002 ‐ ‐ 40,000 40,000 80,000
TOTAL HOA REVENUE (443) ‐ ‐ 40,000 40,000 80,000
LEGACY FUNDS (501)
83009 230,000 ‐ ‐ ‐ 230,000
TOTAL LEGACY FUNDS (501) 230,000 ‐ ‐ ‐ 230,000
SUCCESSOR AGENCY NO. 2 BOND (560552)
88263 96,614 446,000 1,704,870 720,870 2,522,354
88264 57 ‐ ‐ 1,243,872 1,243,929
88505 1,380 ‐ 3,968,586 5,428,000 9,397,966
88507 330,015 (800,000) 210,000 639,985 1,180,000
88529 ‐ 326,400 3,091,600 826,400 3,918,000
TOTAL SUCCESSOR AGENCY NO. 2 BOND (560552) 428,066 (27,600) 8,975,056 8,859,127 18,262,249
San Marcos Blvd. Intersection Improvements
Citywide Installation of LED Safety Lighting
SR‐78 Eastbound Auxiliary Lane Improvement
San Marcos Creek Specific Plan: Bent Ave. Bridge &
Improvements
San Marcos Creek Specific Plan: Via Vera Cruz Bridge &
Improvements
East Mission Road Fiber Optic Project
San Marcos Creek Specific Plan: Promenade
Construction
Palomar Station Pedestrian Bridge
San Marcos Creek Specific Plan: Environmental Habitat
Citywide Traffic Ethernet
San Marcos Creek Specific Plan: Creekside Drive and
Pad Grading
San Marcos Creek Specific Plan: Promenade
Construction
San Marcos Creek Specific Plan: Environmental Habitat
North Twin Oaks Valley Urban Trail
Citywide Parks/Facility LED Lighting Project
Citywide Irrigation Controller Replacements
Senior Activity Center Fitness Zone
San Marcos Creek Specific Plan: Bent Ave. Bridge &
Improvements
San Marcos Creek Specific Plan: Via Vera Cruz Bridge &
Improvements
South Santa Fe ‐ Smilax to Bosstick
Sidewalk Repair & Replacement
163
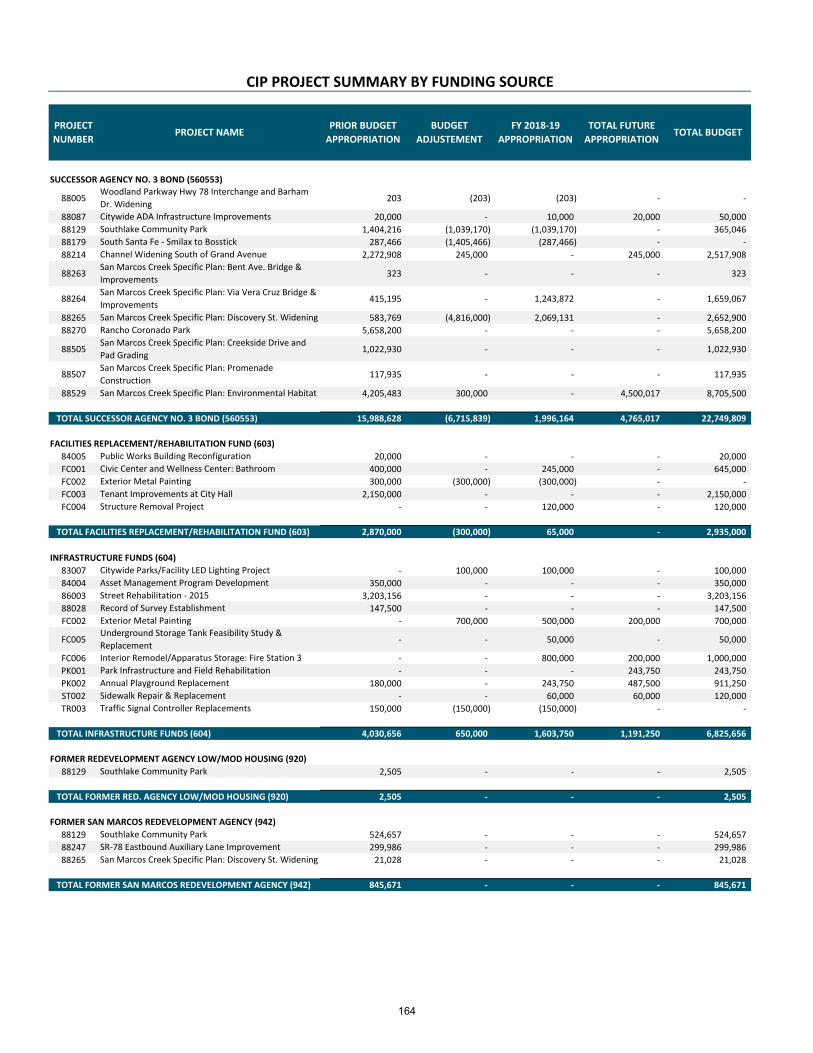
CIP PROJECT SUMMARY BY FUNDING SOURCE
TOTAL FUTURE
APPROPRIATIONTOTAL BUDGET
PROJECT
NUMBERPROJECT NAME
PRIOR BUDGET
APPROPRIATION
BUDGET
ADJUSTEMENT
FY 2018‐19
APPROPRIATION
SUCCESSOR AGENCY NO. 3 BOND (560553)
88005 203 (203) (203) ‐ ‐
88087 20,000 ‐ 10,000 20,000 50,000
88129 1,404,216 (1,039,170) (1,039,170) ‐ 365,046
88179 287,466 (1,405,466) (287,466) ‐ ‐
88214 2,272,908 245,000 ‐ 245,000 2,517,908
88263 323 ‐ ‐ ‐ 323
88264 415,195 ‐ 1,243,872 ‐ 1,659,067
88265 583,769 (4,816,000) 2,069,131 ‐ 2,652,900
88270 5,658,200 ‐ ‐ ‐ 5,658,200
88505 1,022,930 ‐ ‐ ‐ 1,022,930
88507 117,935 ‐ ‐ ‐ 117,935
88529 4,205,483 300,000 ‐ 4,500,017 8,705,500
TOTAL SUCCESSOR AGENCY NO. 3 BOND (560553) 15,988,628 (6,715,839) 1,996,164 4,765,017 22,749,809
FACILITIES REPLACEMENT/REHABILITATION FUND (603)
84005 20,000 ‐ ‐ ‐ 20,000
FC001 400,000 ‐ 245,000 ‐ 645,000
FC002 300,000 (300,000) (300,000) ‐ ‐
FC003 2,150,000 ‐ ‐ ‐ 2,150,000
FC004 ‐ ‐ 120,000 ‐ 120,000
TOTAL FACILITIES REPLACEMENT/REHABILITATION FUND (603) 2,870,000 (300,000) 65,000 ‐ 2,935,000
INFRASTRUCTURE FUNDS (604)
83007 ‐ 100,000 100,000 ‐ 100,000
84004 350,000 ‐ ‐ ‐ 350,000
86003 3,203,156 ‐ ‐ ‐ 3,203,156
88028 147,500 ‐ ‐ ‐ 147,500
FC002 ‐ 700,000 500,000 200,000 700,000
FC005 ‐ ‐ 50,000 ‐ 50,000
FC006 ‐ ‐ 800,000 200,000 1,000,000
PK001 ‐ ‐ ‐ 243,750 243,750
PK002 180,000 ‐ 243,750 487,500 911,250
ST002 ‐ ‐ 60,000 60,000 120,000
TR003 150,000 (150,000) (150,000) ‐ ‐
TOTAL INFRASTRUCTURE FUNDS (604) 4,030,656 650,000 1,603,750 1,191,250 6,825,656
FORMER REDEVELOPMENT AGENCY LOW/MOD HOUSING (920)
88129 2,505 ‐ ‐ ‐ 2,505
TOTAL FORMER RED. AGENCY LOW/MOD HOUSING (920) 2,505 ‐ ‐ ‐ 2,505
FORMER SAN MARCOS REDEVELOPMENT AGENCY (942)
88129 524,657 ‐ ‐ ‐ 524,657
88247 299,986 ‐ ‐ ‐ 299,986
88265 21,028 ‐ ‐ ‐ 21,028
TOTAL FORMER SAN MARCOS REDEVELOPMENT AGENCY (942) 845,671 ‐ ‐ ‐ 845,671
San Marcos Creek Specific Plan: Promenade
Construction
San Marcos Creek Specific Plan: Environmental Habitat
Southlake Community Park
South Santa Fe ‐ Smilax to Bosstick
San Marcos Creek Specific Plan: Creekside Drive and
Pad Grading
Channel Widening South of Grand Avenue
San Marcos Creek Specific Plan: Bent Ave. Bridge &
Improvements
San Marcos Creek Specific Plan: Via Vera Cruz Bridge &
Improvements
San Marcos Creek Specific Plan: Discovery St. Widening
Rancho Coronado Park
Citywide ADA Infrastructure Improvements
San Marcos Creek Specific Plan: Discovery St. Widening
Southlake Community Park
Exterior Metal Painting
Southlake Community Park
SR‐78 Eastbound Auxiliary Lane Improvement
Public Works Building Reconfiguration
Civic Center and Wellness Center: Bathroom
Street Rehabilitation ‐ 2015
Record of Survey Establishment
Park Infrastructure and Field Rehabilitation
Structure Removal Project
Sidewalk Repair & Replacement
Traffic Signal Controller Replacements
Annual Playground Replacement
Interior Remodel/Apparatus Storage: Fire Station 3
Underground Storage Tank Feasibility Study &
Replacement
Asset Management Program Development
Citywide Parks/Facility LED Lighting Project
Tenant Improvements at City Hall
Exterior Metal Painting
Woodland Parkway Hwy 78 Interchange and Barham
Dr. Widening
164
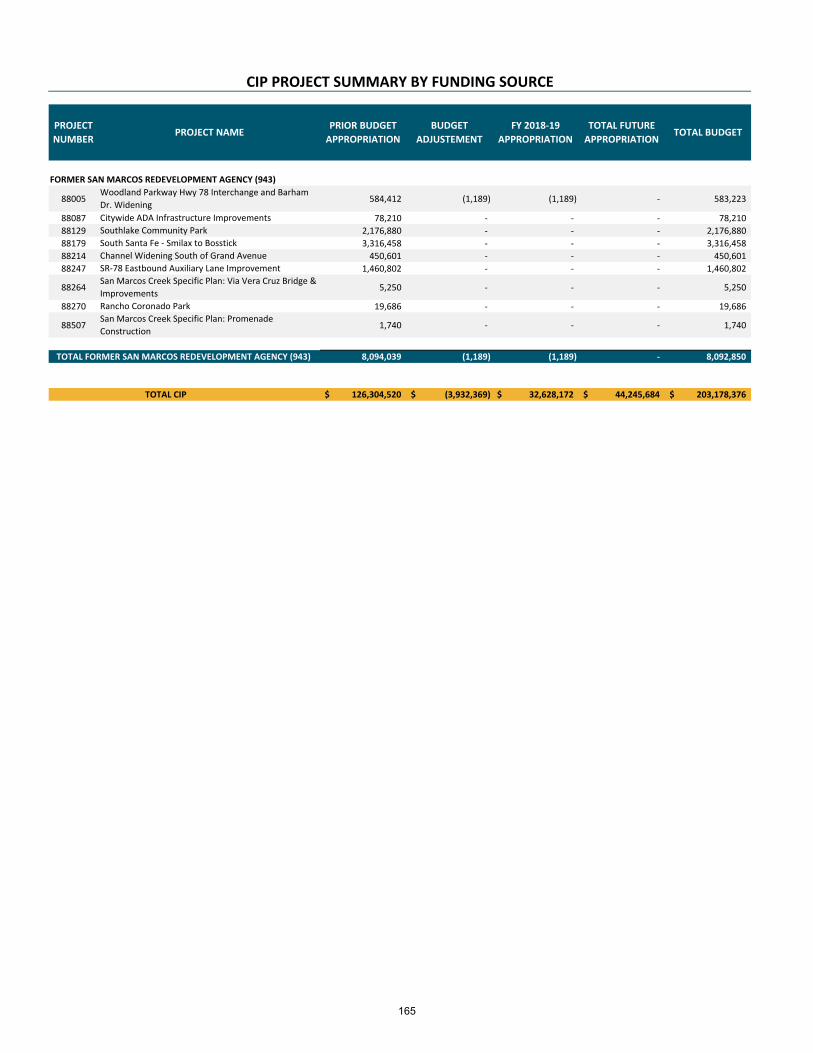
CIP PROJECT SUMMARY BY FUNDING SOURCE
TOTAL FUTURE
APPROPRIATIONTOTAL BUDGET
PROJECT
NUMBERPROJECT NAME
PRIOR BUDGET
APPROPRIATION
BUDGET
ADJUSTEMENT
FY 2018‐19
APPROPRIATION
FORMER SAN MARCOS REDEVELOPMENT AGENCY (943)
88005 584,412 (1,189) (1,189) ‐ 583,223
88087 78,210 ‐ ‐ ‐ 78,210
88129 2,176,880 ‐ ‐ ‐ 2,176,880
88179 3,316,458 ‐ ‐ ‐ 3,316,458
88214 450,601 ‐ ‐ ‐ 450,601
88247 1,460,802 ‐ ‐ ‐ 1,460,802
88264 5,250 ‐ ‐ ‐ 5,250
88270 19,686 ‐ ‐ ‐ 19,686
88507 1,740 ‐ ‐ ‐ 1,740
TOTAL FORMER SAN MARCOS REDEVELOPMENT AGENCY (943) 8,094,039 (1,189) (1,189) ‐ 8,092,850
TOTAL CIP 126,304,520$ (3,932,369)$ 32,628,172$ 44,245,684$ 203,178,376$
Channel Widening South of Grand Avenue
SR‐78 Eastbound Auxiliary Lane Improvement
San Marcos Creek Specific Plan: Via Vera Cruz Bridge &
Improvements
Rancho Coronado Park
San Marcos Creek Specific Plan: Promenade
Construction
Woodland Parkway Hwy 78 Interchange and Barham
Dr. Widening
Citywide ADA Infrastructure Improvements
Southlake Community Park
South Santa Fe ‐ Smilax to Bosstick
165

|
This page intentionally left blank.
166
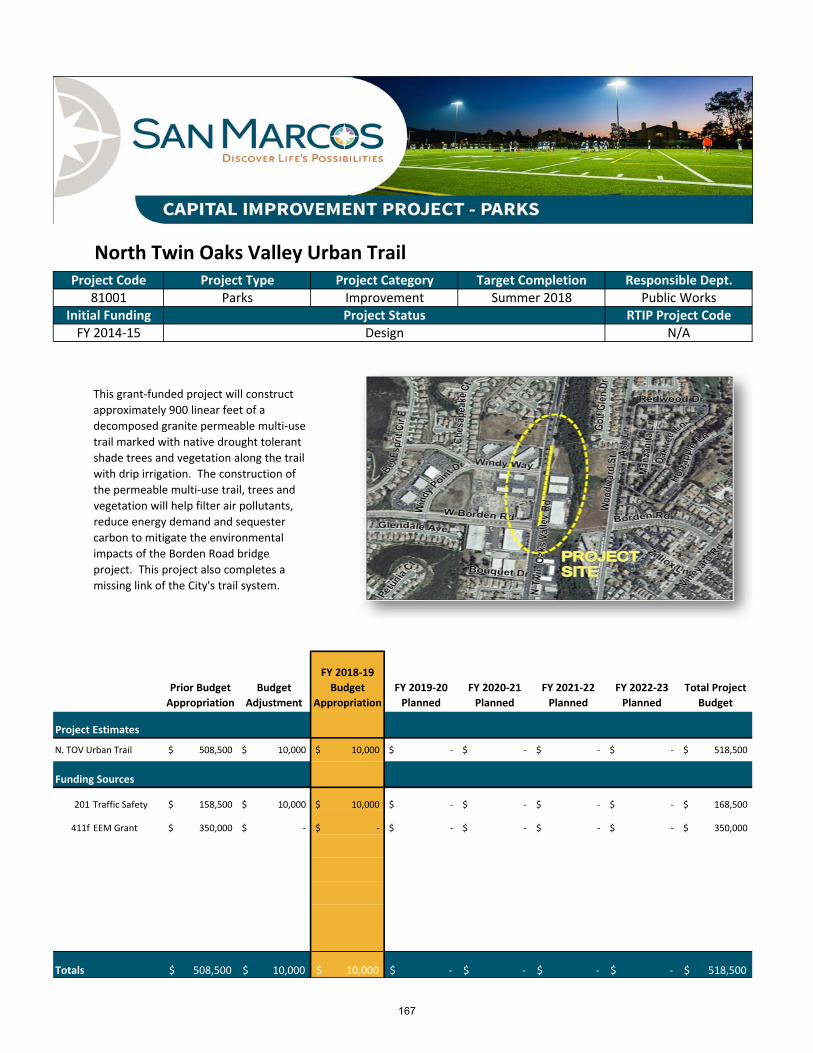
Title: North Twin Oaks Valley Urban Trail
Prior Budget
Appropriation
Budget
Adjustment
FY 2018‐19
Budget
Appropriation
FY 2019‐20
Planned
FY 2020‐21
Planned
FY 2021‐22
Planned
FY 2022‐23
Planned
Total Project
Budget
Project Estimates
N. TOV Urban Trail 508,500$ 10,000$ 10,000$ ‐$ ‐$ ‐$ ‐$ 518,500$
Funding Sources
201 Traffic Safety 158,500$ 10,000$ 10,000$ ‐$ ‐$ ‐$ ‐$ 168,500$
411f EEM Grant 350,000$ ‐$ ‐$ ‐$ ‐$ ‐$ ‐$ 350,000$
‐$ ‐$ ‐$ ‐$ ‐$ ‐$ ‐$ ‐$
‐$ ‐$ ‐$ ‐$ ‐$ ‐$ ‐$ ‐$
‐$ ‐$ ‐$ ‐$ ‐$ ‐$ ‐$ ‐$
‐$ ‐$ ‐$ ‐$ ‐$ ‐$ ‐$ ‐$
‐$ ‐$ ‐$ ‐$ ‐$ ‐$ ‐$ ‐$
508,500$ 10,000$ 10,000$ ‐$ ‐$ ‐$ ‐$ 518,500$
Project Code Project Type Project Category Target Completion Responsible Dept.
Totals
FY 2014‐15 N/A
This grant‐funded project will construct
approximately 900 linear feet of a
decomposed granite permeable multi‐use
trail marked with native drought tolerant
shade trees and vegetation along the trail
with drip irrigation. The construction of
the permeable multi‐use trail, trees and
vegetation will help filter air pollutants,
reduce energy demand and sequester
carbon to mitigate the environmental
impacts of the Borden Road bridge
project. This project also completes a
missing link of the City's trail system.
81001 Parks Improvement Summer 2018 Public WorksInitial Funding RTIP Project CodeProject Status
Design
167

Title: Citywide Parks/Facility LED Lighting Project
Prior Budget
Appropriation
Budget
Adjustment
FY 2018‐19
Budget
Appropriation
FY 2019‐20
Planned
FY 2020‐21
Planned
FY 2021‐22
Planned
FY 2022‐23
Planned
Total Project
Budget
Project Estimates
Citywide LED 862,500$ (762,500)$ (762,500)$ ‐$ ‐$ ‐$ ‐$ 100,000$
Funding Sources
411t Grant / Other 862,500$ (862,500)$ (862,500)$ ‐$ ‐$ ‐$ ‐$ ‐$
604 Infrastructure R& ‐$ 100,000$ 100,000$ ‐$ ‐$ ‐$ ‐$ 100,000$
‐$ ‐$ ‐$ ‐$ ‐$ ‐$ ‐$ ‐$
‐$ ‐$ ‐$ ‐$ ‐$ ‐$ ‐$ ‐$
‐$ ‐$ ‐$ ‐$ ‐$ ‐$ ‐$ ‐$
‐$ ‐$ ‐$ ‐$ ‐$ ‐$ ‐$ ‐$
‐$ ‐$ ‐$ ‐$ ‐$ ‐$ ‐$ ‐$
862,500$ (762,500)$ (762,500)$ ‐$ ‐$ ‐$ ‐$ 100,000$
Public WorksRTIP Project Code
N/A
Project Type Project Category Target Completion Responsible Dept.Project Code
FY 2016‐17Project StatusNot Started
Totals
Streets Improvement Spring 2020
This project will replace citywide outdoor
lighting with LED lights at various
locations. This this project will reduce
long‐term energy use and costs and
increase efficiency of the City's electrical
infrastructure.
Initial Funding83007
168
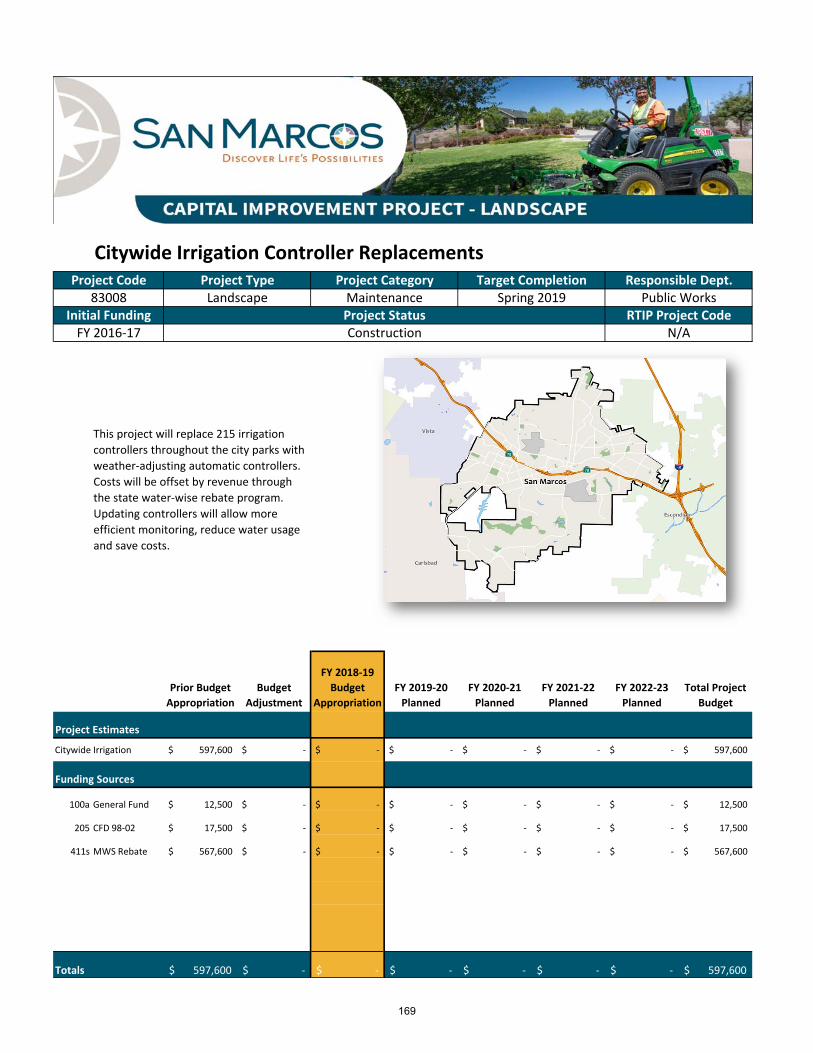
Title: Citywide Irrigation Controller Replacements
Prior Budget
Appropriation
Budget
Adjustment
FY 2018‐19
Budget
Appropriation
FY 2019‐20
Planned
FY 2020‐21
Planned
FY 2021‐22
Planned
FY 2022‐23
Planned
Total Project
Budget
Project Estimates
Citywide Irrigation 597,600$ ‐$ ‐$ ‐$ ‐$ ‐$ ‐$ 597,600$
Funding Sources
100a General Fund 12,500$ ‐$ ‐$ ‐$ ‐$ ‐$ ‐$ 12,500$
205 CFD 98‐02 17,500$ ‐$ ‐$ ‐$ ‐$ ‐$ ‐$ 17,500$
411s MWS Rebate 567,600$ ‐$ ‐$ ‐$ ‐$ ‐$ ‐$ 567,600$
‐$ ‐$ ‐$ ‐$ ‐$ ‐$ ‐$ ‐$
‐$ ‐$ ‐$ ‐$ ‐$ ‐$ ‐$ ‐$
‐$ ‐$ ‐$ ‐$ ‐$ ‐$ ‐$ ‐$
‐$ ‐$ ‐$ ‐$ ‐$ ‐$ ‐$ ‐$
597,600$ ‐$ ‐$ ‐$ ‐$ ‐$ ‐$ 597,600$ Totals
Landscape Maintenance Spring 2019
This project will replace 215 irrigation
controllers throughout the city parks with
weather‐adjusting automatic controllers.
Costs will be offset by revenue through
the state water‐wise rebate program.
Updating controllers will allow more
efficient monitoring, reduce water usage
and save costs.
Initial Funding83008
FY 2016‐17Project StatusConstruction
Public WorksRTIP Project Code
N/A
Project Type Project Category Target Completion Responsible Dept.Project Code
169
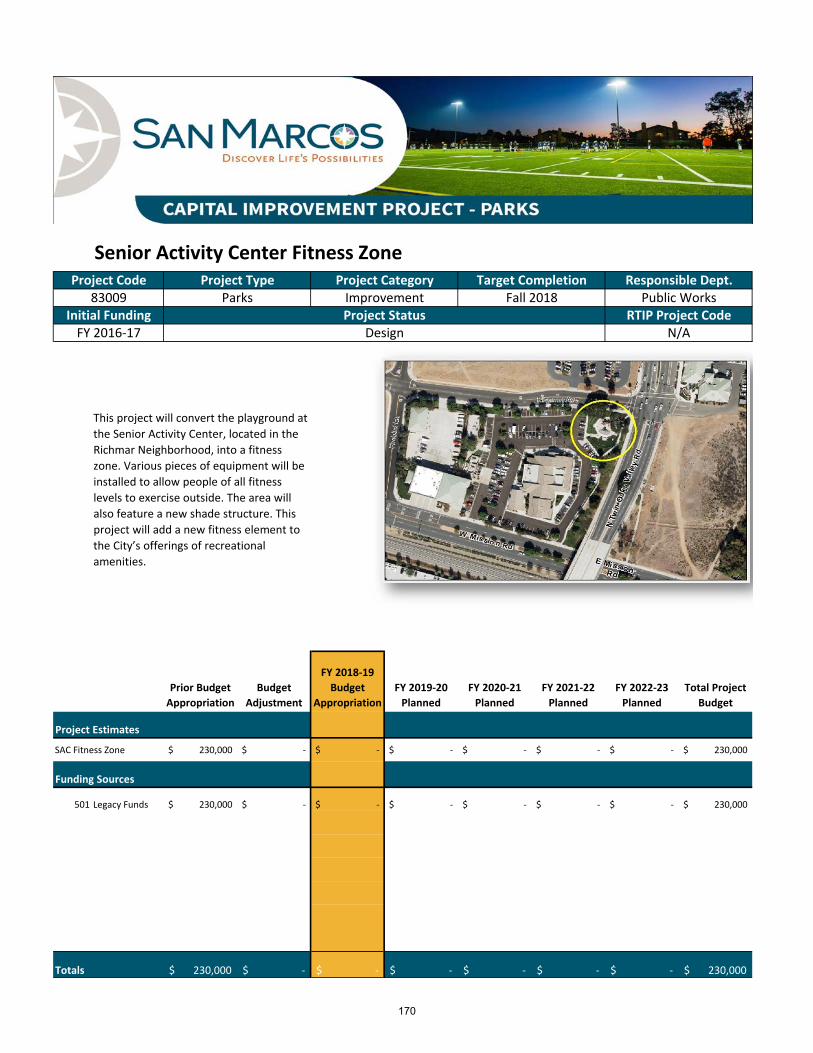
Title: Senior Activity Center Fitness Zone
Prior Budget
Appropriation
Budget
Adjustment
FY 2018‐19
Budget
Appropriation
FY 2019‐20
Planned
FY 2020‐21
Planned
FY 2021‐22
Planned
FY 2022‐23
Planned
Total Project
Budget
Project Estimates
SAC Fitness Zone 230,000$ ‐$ ‐$ ‐$ ‐$ ‐$ ‐$ 230,000$
Funding Sources
501 Legacy Funds 230,000$ ‐$ ‐$ ‐$ ‐$ ‐$ ‐$ 230,000$
‐$ ‐$ ‐$ ‐$ ‐$ ‐$ ‐$ ‐$
‐$ ‐$ ‐$ ‐$ ‐$ ‐$ ‐$ ‐$
‐$ ‐$ ‐$ ‐$ ‐$ ‐$ ‐$ ‐$
‐$ ‐$ ‐$ ‐$ ‐$ ‐$ ‐$ ‐$
‐$ ‐$ ‐$ ‐$ ‐$ ‐$ ‐$ ‐$
‐$ ‐$ ‐$ ‐$ ‐$ ‐$ ‐$ ‐$
230,000$ ‐$ ‐$ ‐$ ‐$ ‐$ ‐$ 230,000$ Totals
Parks Improvement Fall 2018
This project will convert the playground at
the Senior Activity Center, located in the
Richmar Neighborhood, into a fitness
zone. Various pieces of equipment will be
installed to allow people of all fitness
levels to exercise outside. The area will
also feature a new shade structure. This
project will add a new fitness element to
the City’s offerings of recreational
amenities.
Initial Funding83009
FY 2016‐17Project Status
Design
Public WorksRTIP Project Code
N/A
Project Type Project Category Target Completion Responsible Dept.Project Code
170
Title: Public Facility Financing Plan Update
Prior Budget
Appropriation
Budget
Adjustment
FY 2018‐19
Budget
Appropriation
FY 2019‐20
Planned
FY 2020‐21
Planned
FY 2021‐22
Planned
FY 2022‐23
Planned
Total Project
Budget
Project Estimates
PFF Update 450,000$ ‐$ ‐$ ‐$ ‐$ ‐$ ‐$ 450,000$
Funding Sources
402a PFF (FC PFF) 90,000$ ‐$ ‐$ ‐$ ‐$ ‐$ ‐$ 90,000$
402b PFF (HC PFF) 22,500$ ‐$ ‐$ ‐$ ‐$ ‐$ ‐$ 22,500$
402c PFF (NPDES PFF) 67,500$ ‐$ ‐$ ‐$ ‐$ ‐$ ‐$ 67,500$
402d PFF (Streets PFF) 90,000$ ‐$ ‐$ ‐$ ‐$ ‐$ ‐$ 90,000$
402e PFF (SR78 PFF) 90,000$ ‐$ ‐$ ‐$ ‐$ ‐$ ‐$ 90,000$
402f PFF (Parks PFF) 67,500$ ‐$ ‐$ ‐$ ‐$ ‐$ ‐$ 67,500$
402g PFF (GIS PFF) 22,500$ ‐$ ‐$ ‐$ ‐$ ‐$ ‐$ 22,500$
450,000$ ‐$ ‐$ ‐$ ‐$ ‐$ ‐$ 450,000$
Project Code Project Type Project Category Target Completion Responsible Dept.
Totals
FY 2015‐16 N/A
This project plans to update the City
Public Facility Financing Plan to establish a
revised impact fee structure for future
development.
84003 Planning Improvement Summer 2019 Public WorksInitial Funding RTIP Project CodeProject Status
Not Started
171
Title: Asset Management Program Development
Prior Budget
Appropriation
Budget
Adjustment
FY 2018‐19
Budget
Appropriation
FY 2019‐20
Planned
FY 2020‐21
Planned
FY 2021‐22
Planned
FY 2022‐23
Planned
Total Project
Budget
Project Estimates
Asset Management 350,000$ ‐$ ‐$ ‐$ ‐$ ‐$ ‐$ 350,000$
Funding Sources
604 Infrastructure R& 350,000$ ‐$ ‐$ ‐$ ‐$ ‐$ ‐$ 350,000$
‐$ ‐$ ‐$ ‐$ ‐$ ‐$ ‐$ ‐$
‐$ ‐$ ‐$ ‐$ ‐$ ‐$ ‐$ ‐$
‐$ ‐$ ‐$ ‐$ ‐$ ‐$ ‐$ ‐$
‐$ ‐$ ‐$ ‐$ ‐$ ‐$ ‐$ ‐$
‐$ ‐$ ‐$ ‐$ ‐$ ‐$ ‐$ ‐$
‐$ ‐$ ‐$ ‐$ ‐$ ‐$ ‐$ ‐$
350,000$ ‐$ ‐$ ‐$ ‐$ ‐$ ‐$ 350,000$
Project Code Project Type Project Category Target Completion Responsible Dept.
Totals
FY 2016‐17 N/A
This project will develop a comprehensive
program to understand the City's long‐
term infrastructure maintenance and
replacement needs. This will ensure
proper prioritization and efficiency when
it comes to maintaining and replacing city
assets in the long term.
84004 Planning Improvement Winter 2018 Public WorksInitial Funding RTIP Project CodeProject Status
Design
172
Title: Public Works Building Reconfiguration
Prior Budget
Appropriation
Budget
Adjustment
FY 2018‐19
Budget
Appropriation
FY 2019‐20
Planned
FY 2020‐21
Planned
FY 2021‐22
Planned
FY 2022‐23
Planned
Total Project
Budget
Project Estimates
PW Building Reconfig 180,000$ ‐$ ‐$ ‐$ ‐$ ‐$ ‐$ 180,000$
Funding Sources
100a General Fund 160,000$ ‐$ ‐$ ‐$ ‐$ ‐$ ‐$ 160,000$
603 Facilities R&R 20,000$ ‐$ ‐$ ‐$ ‐$ ‐$ ‐$ 20,000$
‐$ ‐$ ‐$ ‐$ ‐$ ‐$ ‐$ ‐$
‐$ ‐$ ‐$ ‐$ ‐$ ‐$ ‐$ ‐$
‐$ ‐$ ‐$ ‐$ ‐$ ‐$ ‐$ ‐$
‐$ ‐$ ‐$ ‐$ ‐$ ‐$ ‐$ ‐$
‐$ ‐$ ‐$ ‐$ ‐$ ‐$ ‐$ ‐$
180,000$ ‐$ ‐$ ‐$ ‐$ ‐$ ‐$ 180,000$ Totals
Facilities Improvement Winter 2019
This project will reconfigure the Public
Works building to accommodate the
facilities maintenance staff that will be
moving over from City Hall. Recent
organizational changes have moved
facilities maintenance functions from the
Real Property Services Division to the
Public Works Department.
Initial Funding84005
FY 2016‐17Project Status
Design
Public WorksRTIP Project Code
N/A
Project Type Project Category Target Completion Responsible Dept.Project Code
173
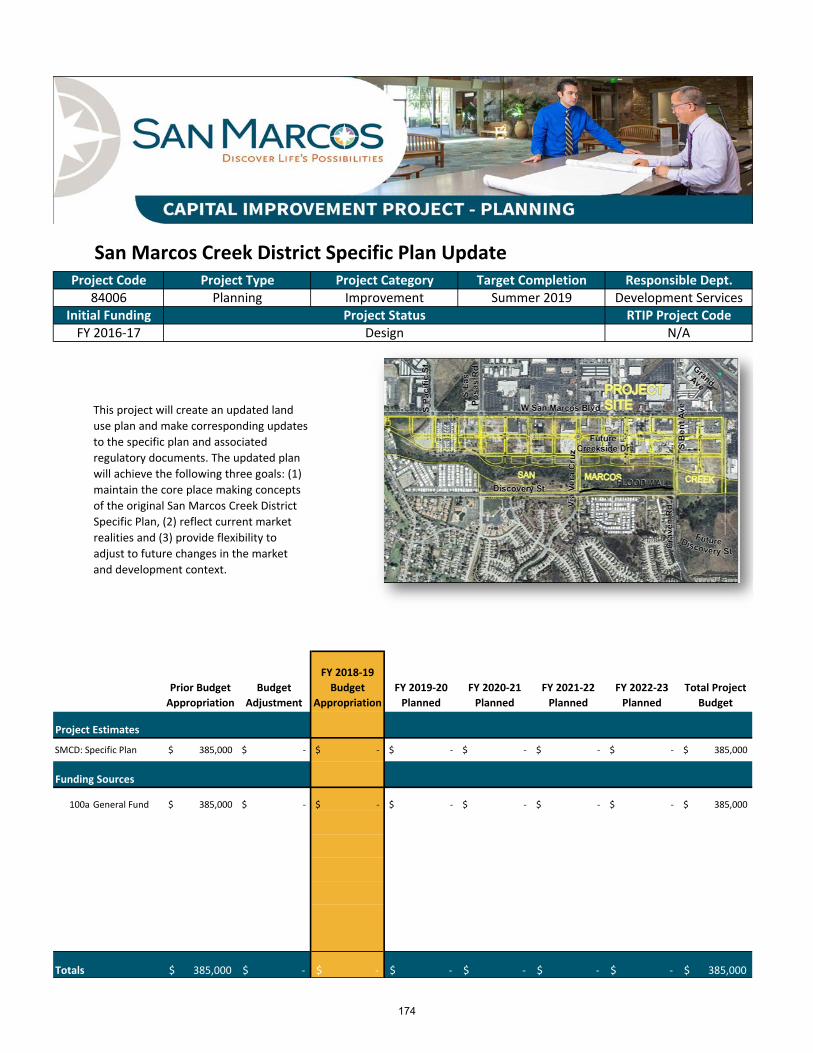
Title: San Marcos Creek District Specific Plan Update
Prior Budget
Appropriation
Budget
Adjustment
FY 2018‐19
Budget
Appropriation
FY 2019‐20
Planned
FY 2020‐21
Planned
FY 2021‐22
Planned
FY 2022‐23
Planned
Total Project
Budget
Project Estimates
SMCD: Specific Plan 385,000$ ‐$ ‐$ ‐$ ‐$ ‐$ ‐$ 385,000$
Funding Sources
100a General Fund 385,000$ ‐$ ‐$ ‐$ ‐$ ‐$ ‐$ 385,000$
‐$ ‐$ ‐$ ‐$ ‐$ ‐$ ‐$ ‐$
‐$ ‐$ ‐$ ‐$ ‐$ ‐$ ‐$ ‐$
‐$ ‐$ ‐$ ‐$ ‐$ ‐$ ‐$ ‐$
‐$ ‐$ ‐$ ‐$ ‐$ ‐$ ‐$ ‐$
‐$ ‐$ ‐$ ‐$ ‐$ ‐$ ‐$ ‐$
‐$ ‐$ ‐$ ‐$ ‐$ ‐$ ‐$ ‐$
385,000$ ‐$ ‐$ ‐$ ‐$ ‐$ ‐$ 385,000$
Design N/A
Totals
This project will create an updated land
use plan and make corresponding updates
to the specific plan and associated
regulatory documents. The updated plan
will achieve the following three goals: (1)
maintain the core place making concepts
of the original San Marcos Creek District
Specific Plan, (2) reflect current market
realities and (3) provide flexibility to
adjust to future changes in the market
and development context.
Planning Improvement Summer 2019Initial Funding
84006
FY 2016‐17
Development ServicesRTIP Project CodeProject Status
Project Type Project Category Target Completion Responsible Dept.Project Code
174

Title: Drainage Master Plan
Prior Budget
Appropriation
Budget
Adjustment
FY 2018‐19
Budget
Appropriation
FY 2019‐20
Planned
FY 2020‐21
Planned
FY 2021‐22
Planned
FY 2022‐23
Planned
Total Project
Budget
Project Estimates
Drainage Master Plan 480,000$ ‐$ ‐$ ‐$ ‐$ ‐$ ‐$ 480,000$
Funding Sources
402a PFF (FC PFF) 480,000$ ‐$ ‐$ ‐$ ‐$ ‐$ ‐$ 480,000$
‐$ ‐$ ‐$ ‐$ ‐$ ‐$ ‐$ ‐$
‐$ ‐$ ‐$ ‐$ ‐$ ‐$ ‐$ ‐$
‐$ ‐$ ‐$ ‐$ ‐$ ‐$ ‐$ ‐$
‐$ ‐$ ‐$ ‐$ ‐$ ‐$ ‐$ ‐$
‐$ ‐$ ‐$ ‐$ ‐$ ‐$ ‐$ ‐$
‐$ ‐$ ‐$ ‐$ ‐$ ‐$ ‐$ ‐$
480,000$ ‐$ ‐$ ‐$ ‐$ ‐$ ‐$ 480,000$ Totals
FY 2014‐15 N/A
This project will update the citywide
drainage master plan. This is required for
the Public Facilities Fund update and
planning future storm drain improvement
projects.
85002 Planning Maintenance Winter 2018 Development ServicesInitial Funding RTIP Project CodeProject Status
Finalizing
Project Code Project Type Project Category Target Completion Responsible Dept.
175
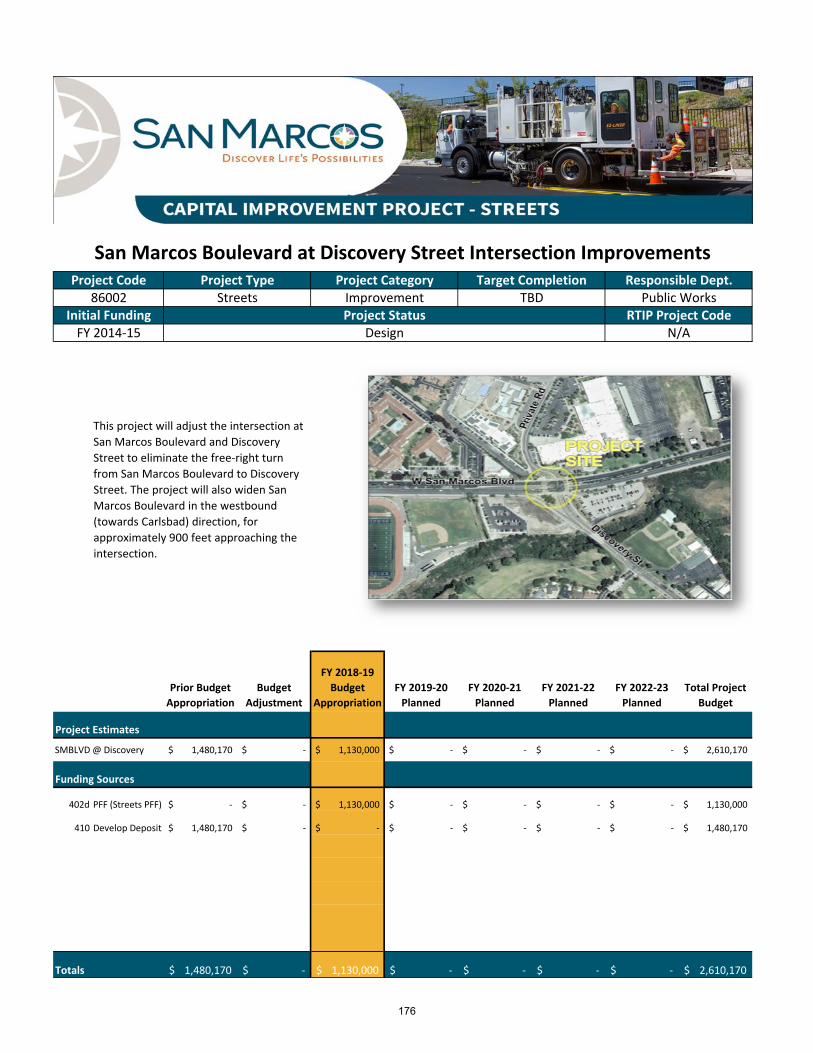
Title: San Marcos Boulevard at Discovery Street Intersection Improvements
Prior Budget
Appropriation
Budget
Adjustment
FY 2018‐19
Budget
Appropriation
FY 2019‐20
Planned
FY 2020‐21
Planned
FY 2021‐22
Planned
FY 2022‐23
Planned
Total Project
Budget
Project Estimates
SMBLVD @ Discovery 1,480,170$ ‐$ 1,130,000$ ‐$ ‐$ ‐$ ‐$ 2,610,170$
Funding Sources
402d PFF (Streets PFF) ‐$ ‐$ 1,130,000$ ‐$ ‐$ ‐$ ‐$ 1,130,000$
410 Develop Deposit 1,480,170$ ‐$ ‐$ ‐$ ‐$ ‐$ ‐$ 1,480,170$
‐$ ‐$ ‐$ ‐$ ‐$ ‐$ ‐$ ‐$
‐$ ‐$ ‐$ ‐$ ‐$ ‐$ ‐$ ‐$
‐$ ‐$ ‐$ ‐$ ‐$ ‐$ ‐$ ‐$
‐$ ‐$ ‐$ ‐$ ‐$ ‐$ ‐$ ‐$
‐$ ‐$ ‐$ ‐$ ‐$ ‐$ ‐$ ‐$
1,480,170$ ‐$ 1,130,000$ ‐$ ‐$ ‐$ ‐$ 2,610,170$
Project Code Project Type Project Category Target Completion Responsible Dept.
Initial Funding RTIP Project CodeProject Status86002 Streets Improvement TBD Public Works
Totals
FY 2014‐15 N/A
This project will adjust the intersection at
San Marcos Boulevard and Discovery
Street to eliminate the free‐right turn
from San Marcos Boulevard to Discovery
Street. The project will also widen San
Marcos Boulevard in the westbound
(towards Carlsbad) direction, for
approximately 900 feet approaching the
intersection.
Design
176
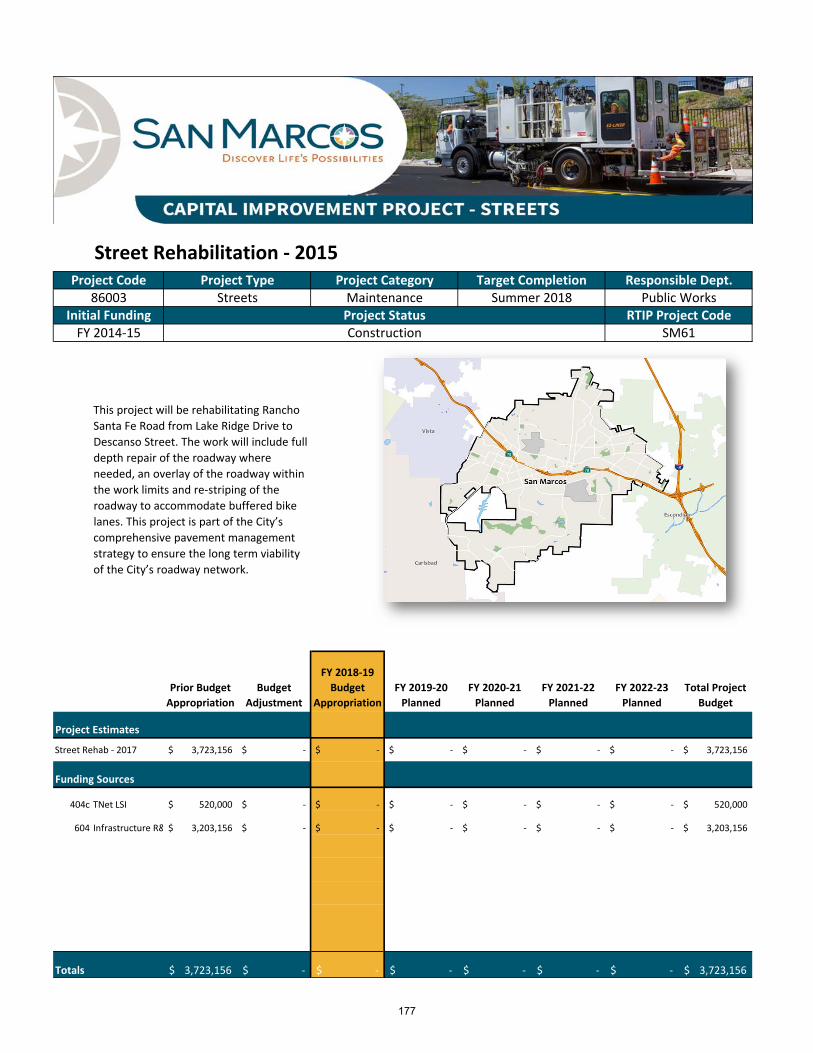
Title: Street Rehabilitation ‐ 2015
Prior Budget
Appropriation
Budget
Adjustment
FY 2018‐19
Budget
Appropriation
FY 2019‐20
Planned
FY 2020‐21
Planned
FY 2021‐22
Planned
FY 2022‐23
Planned
Total Project
Budget
Project Estimates
Street Rehab ‐ 2017 3,723,156$ ‐$ ‐$ ‐$ ‐$ ‐$ ‐$ 3,723,156$
Funding Sources
404c TNet LSI 520,000$ ‐$ ‐$ ‐$ ‐$ ‐$ ‐$ 520,000$
604 Infrastructure R& 3,203,156$ ‐$ ‐$ ‐$ ‐$ ‐$ ‐$ 3,203,156$
‐$ ‐$ ‐$ ‐$ ‐$ ‐$ ‐$ ‐$
‐$ ‐$ ‐$ ‐$ ‐$ ‐$ ‐$ ‐$
‐$ ‐$ ‐$ ‐$ ‐$ ‐$ ‐$ ‐$
‐$ ‐$ ‐$ ‐$ ‐$ ‐$ ‐$ ‐$
‐$ ‐$ ‐$ ‐$ ‐$ ‐$ ‐$ ‐$
3,723,156$ ‐$ ‐$ ‐$ ‐$ ‐$ ‐$ 3,723,156$
Project Code Project Type Project Category Target Completion Responsible Dept.
Initial Funding RTIP Project CodeProject Status86003 Streets Maintenance Summer 2018 Public Works
Totals
FY 2014‐15 SM61
This project will be rehabilitating Rancho
Santa Fe Road from Lake Ridge Drive to
Descanso Street. The work will include full
depth repair of the roadway where
needed, an overlay of the roadway within
the work limits and re‐striping of the
roadway to accommodate buffered bike
lanes. This project is part of the City’s
comprehensive pavement management
strategy to ensure the long term viability
of the City’s roadway network.
Construction
177

Title: Annual Street Overlay Project
Prior Budget
Appropriation
Budget
Adjustment
FY 2018‐19
Budget
Appropriation
FY 2018‐19
Planned
FY 2019‐20
Planned
FY 2020‐21
Planned
FY 2021‐22
Planned
Total Project
Budget
Project Estimates
Annual Street Overlay 980,043$ (680,043)$ (680,043)$ ‐$ ‐$ ‐$ ‐$ 300,000$
Funding Sources
200 Gas Tax 381,710$ (381,710)$ (381,710)$ ‐$ ‐$ ‐$ ‐$ ‐$
404c TNet LSI 598,333$ (298,333)$ (298,333)$ ‐$ ‐$ ‐$ ‐$ 300,000$
‐$ ‐$ ‐$ ‐$ ‐$ ‐$ ‐$ ‐$
‐$ ‐$ ‐$ ‐$ ‐$ ‐$ ‐$ ‐$
‐$ ‐$ ‐$ ‐$ ‐$ ‐$ ‐$ ‐$
‐$ ‐$ ‐$ ‐$ ‐$ ‐$ ‐$ ‐$
‐$ ‐$ ‐$ ‐$ ‐$ ‐$ ‐$ ‐$
980,043$ (680,043)$ (680,043)$ ‐$ ‐$ ‐$ ‐$ 300,000$ Totals
Initial Funding Project Status RTIP Project Code
Project Code Project Type Project Category Target Completion Responsible Dept.86009 Streets Maintenance Winter 2018 Public Works
FY 2016‐17 Finalizing SM59
This project is part of the City’s regular
maintenance of roadways. Various
roadways will receive an overlay as part of
this project to protect them from ongoing
wear and tear.
178

Title: City Entry and Wayfinding Signs
Prior Budget
Appropriation
Budget
Adjustment
FY 2018‐19
Budget
Appropriation
FY 2019‐20
Planned
FY 2020‐21
Planned
FY 2021‐22
Planned
FY 2022‐23
Planned
Total Project
Budget
Project Estimates
City Entry Signs 200,000$ ‐$ ‐$ ‐$ ‐$ ‐$ ‐$ 200,000$
Funding Sources
100a General Fund 200,000$ ‐$ ‐$ ‐$ ‐$ ‐$ ‐$ 200,000$
‐$ ‐$ ‐$ ‐$ ‐$ ‐$ ‐$ ‐$
‐$ ‐$ ‐$ ‐$ ‐$ ‐$ ‐$ ‐$
‐$ ‐$ ‐$ ‐$ ‐$ ‐$ ‐$ ‐$
‐$ ‐$ ‐$ ‐$ ‐$ ‐$ ‐$ ‐$
‐$ ‐$ ‐$ ‐$ ‐$ ‐$ ‐$ ‐$
‐$ ‐$ ‐$ ‐$ ‐$ ‐$ ‐$ ‐$
200,000$ ‐$ ‐$ ‐$ ‐$ ‐$ ‐$ 200,000$ Totals
Streets Improvement Summer 2018
This project will construct new entry
monument signs providing a sense of
place for San Marcos. As part of this
project the City will also develop a
comprehensive master plan for
fundamental signage in the City.
Initial Funding86010
FY 2016‐17Project Status
Design
Public WorksRTIP Project Code
N/A
Project Type Project Category Target Completion Responsible Dept.Project Code
179
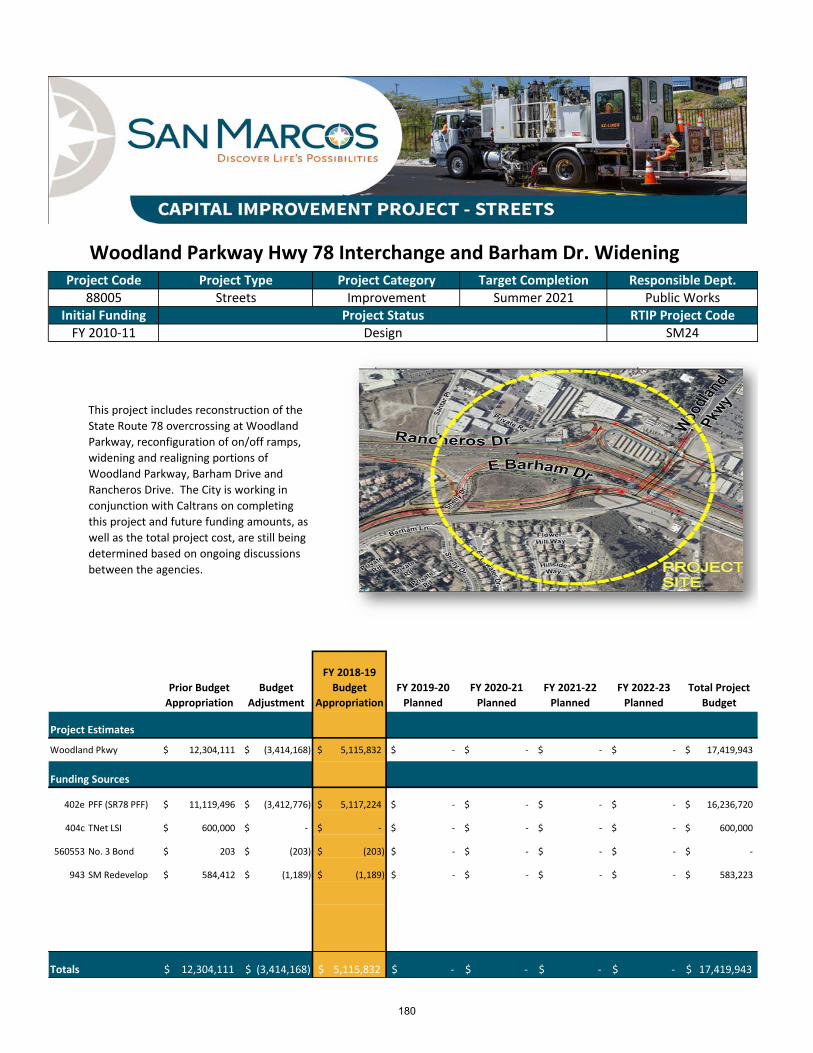
Title: Woodland Parkway Hwy 78 Interchange and Barham Dr. Widening
Prior Budget
Appropriation
Budget
Adjustment
FY 2018‐19
Budget
Appropriation
FY 2019‐20
Planned
FY 2020‐21
Planned
FY 2021‐22
Planned
FY 2022‐23
Planned
Total Project
Budget
Project Estimates
Woodland Pkwy 12,304,111$ (3,414,168)$ 5,115,832$ ‐$ ‐$ ‐$ ‐$ 17,419,943$
Funding Sources
402e PFF (SR78 PFF) 11,119,496$ (3,412,776)$ 5,117,224$ ‐$ ‐$ ‐$ ‐$ 16,236,720$
404c TNet LSI 600,000$ ‐$ ‐$ ‐$ ‐$ ‐$ ‐$ 600,000$
560553 No. 3 Bond 203$ (203)$ (203)$ ‐$ ‐$ ‐$ ‐$ ‐$
943 SM Redevelop 584,412$ (1,189)$ (1,189)$ ‐$ ‐$ ‐$ ‐$ 583,223$
12,304,111$ (3,414,168)$ 5,115,832$ ‐$ ‐$ ‐$ ‐$ 17,419,943$ Totals
FY 2010‐11 SM24
This project includes reconstruction of the
State Route 78 overcrossing at Woodland
Parkway, reconfiguration of on/off ramps,
widening and realigning portions of
Woodland Parkway, Barham Drive and
Rancheros Drive. The City is working in
conjunction with Caltrans on completing
this project and future funding amounts, as
well as the total project cost, are still being
determined based on ongoing discussions
between the agencies.
DesignInitial Funding RTIP Project CodeProject Status
Project Code Project Type Project Category Target Completion Responsible Dept.88005 Streets Improvement Summer 2021 Public Works
180

Title: Record of Survey Establishment
Prior Budget
Appropriation
Budget
Adjustment
FY 2018‐19
Budget
Appropriation
FY 2019‐20
Planned
FY 2020‐21
Planned
FY 2021‐22
Planned
FY 2022‐23
Planned
Total Project
Budget
Project Estimates
Record of Survey 300,000$ ‐$ ‐$ ‐$ ‐$ ‐$ ‐$ 300,000$
Funding Sources
100a General Fund 152,500$ ‐$ ‐$ ‐$ ‐$ ‐$ ‐$ 152,500$
604 Infrastructure R& 147,500$ ‐$ ‐$ ‐$ ‐$ ‐$ ‐$ 147,500$
‐$ ‐$ ‐$ ‐$ ‐$ ‐$ ‐$ ‐$
‐$ ‐$ ‐$ ‐$ ‐$ ‐$ ‐$ ‐$
‐$ ‐$ ‐$ ‐$ ‐$ ‐$ ‐$ ‐$
‐$ ‐$ ‐$ ‐$ ‐$ ‐$ ‐$ ‐$
‐$ ‐$ ‐$ ‐$ ‐$ ‐$ ‐$ ‐$
300,000$ ‐$ ‐$ ‐$ ‐$ ‐$ ‐$ 300,000$ Totals
Other Maintenance Summer 2019
The City is responsible for maintaining a
system of monuments for horizontal and
vertical control. Surveyors use this
control to determine lot line locations,
building locations, street alignments and
etc. Many of the monuments established
by prior ROS are missing. The new ROS
will provide locations of the City's first
order monuments and adjust the vertical
datum to the North American Vertical
Datum.
Initial Funding88028
FY 2016‐17Project Status
Design
Development ServicesRTIP Project Code
N/A
Project Type Project Category Target Completion Responsible Dept.Project Code
181
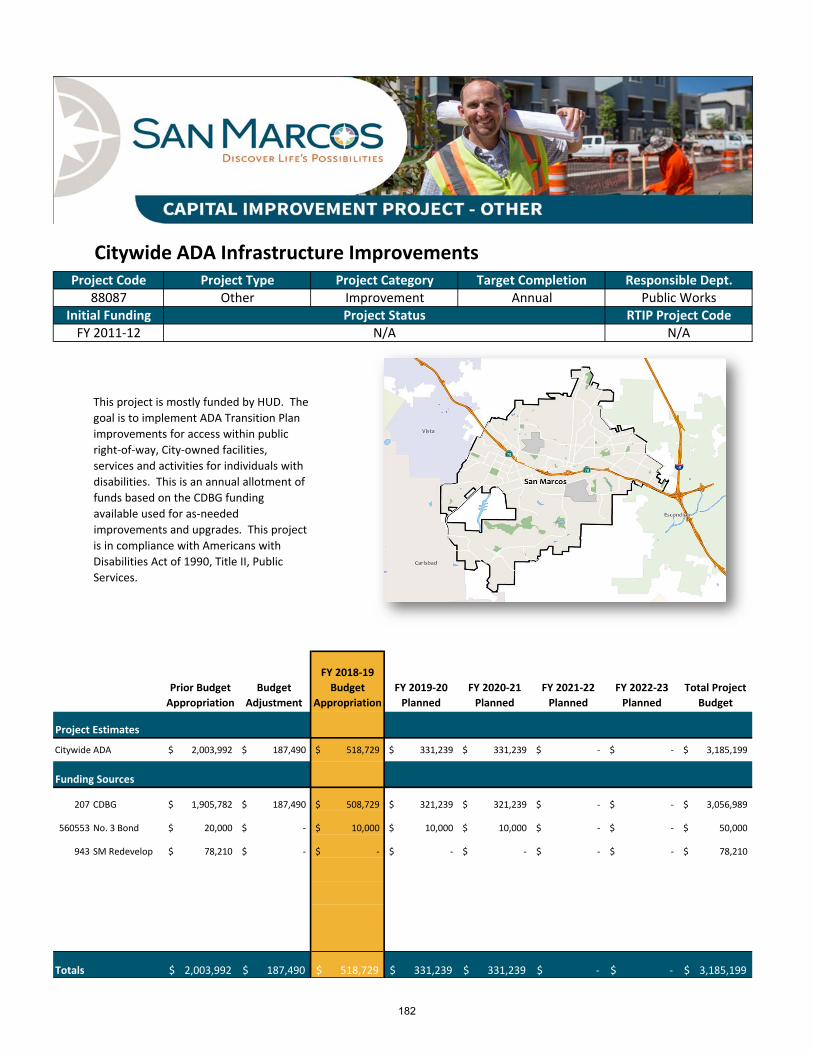
Title: Citywide ADA Infrastructure Improvements
Prior Budget
Appropriation
Budget
Adjustment
FY 2018‐19
Budget
Appropriation
FY 2019‐20
Planned
FY 2020‐21
Planned
FY 2021‐22
Planned
FY 2022‐23
Planned
Total Project
Budget
Project Estimates
Citywide ADA 2,003,992$ 187,490$ 518,729$ 331,239$ 331,239$ ‐$ ‐$ 3,185,199$
Funding Sources
207 CDBG 1,905,782$ 187,490$ 508,729$ 321,239$ 321,239$ ‐$ ‐$ 3,056,989$
560553 No. 3 Bond 20,000$ ‐$ 10,000$ 10,000$ 10,000$ ‐$ ‐$ 50,000$
943 SM Redevelop 78,210$ ‐$ ‐$ ‐$ ‐$ ‐$ ‐$ 78,210$
‐$ ‐$ ‐$ ‐$ ‐$ ‐$ ‐$ ‐$
‐$ ‐$ ‐$ ‐$ ‐$ ‐$ ‐$ ‐$
‐$ ‐$ ‐$ ‐$ ‐$ ‐$ ‐$ ‐$
‐$ ‐$ ‐$ ‐$ ‐$ ‐$ ‐$ ‐$
2,003,992$ 187,490$ 518,729$ 331,239$ 331,239$ ‐$ ‐$ 3,185,199$ Totals
FY 2011‐12 N/A
This project is mostly funded by HUD. The
goal is to implement ADA Transition Plan
improvements for access within public
right‐of‐way, City‐owned facilities,
services and activities for individuals with
disabilities. This is an annual allotment of
funds based on the CDBG funding
available used for as‐needed
improvements and upgrades. This project
is in compliance with Americans with
Disabilities Act of 1990, Title II, Public
Services.
88087 Other Improvement Annual Public WorksInitial Funding RTIP Project CodeProject Status
N/A
Project Code Project Type Project Category Target Completion Responsible Dept.
182

Title: Southlake Community Park
Prior Budget
Appropriation
Budget
Adjustment
FY 2018‐19
Budget
Appropriation
FY 2019‐20
Planned
FY 2020‐21
Planned
FY 2021‐22
Planned
FY 2022‐23
Planned
Total Project
Budget
Project Estimates
Southlake Park 4,108,258$ 650,030$ 650,030$ ‐$ ‐$ ‐$ ‐$ 4,758,288$
Funding Sources
402f PFF (Parks PFF) ‐$ 1,689,200$ 1,689,200$ ‐$ ‐$ ‐$ ‐$ 1,689,200$
560553 No. 3 Bond 1,404,216$ (1,039,170)$ (1,039,170)$ ‐$ ‐$ ‐$ ‐$ 365,046$
920 SM Redevelop 2,505$ ‐$ ‐$ ‐$ ‐$ ‐$ ‐$ 2,505$
942 SM Redevelop 524,657$ ‐$ ‐$ ‐$ ‐$ ‐$ ‐$ 524,657$
943 SM Redevelop 2,176,880$ ‐$ ‐$ ‐$ ‐$ ‐$ 2,176,880$
‐$ ‐$ ‐$ ‐$ ‐$ ‐$ ‐$ ‐$
‐$ ‐$ ‐$ ‐$ ‐$ ‐$ ‐$ ‐$
4,108,258$ 650,030$ 650,030$ ‐$ ‐$ ‐$ ‐$ 4,758,288$ Totals
FY 2007‐08 N/A
This project will construct portions of the
South Lake Community Park master plan.
Amenities will include, a parking lot,
restroom, overlook and dock. The first
phase of construction of portions of the
park take advantage of a joint agreement
with Vallecitos Water District for the use
of South Lake reservoir as a park site.
DesignInitial Funding RTIP Project CodeProject Status
Project Code Project Type Project Category Target Completion Responsible Dept.88129 Parks Improvement Summer 2019 Public Works
183
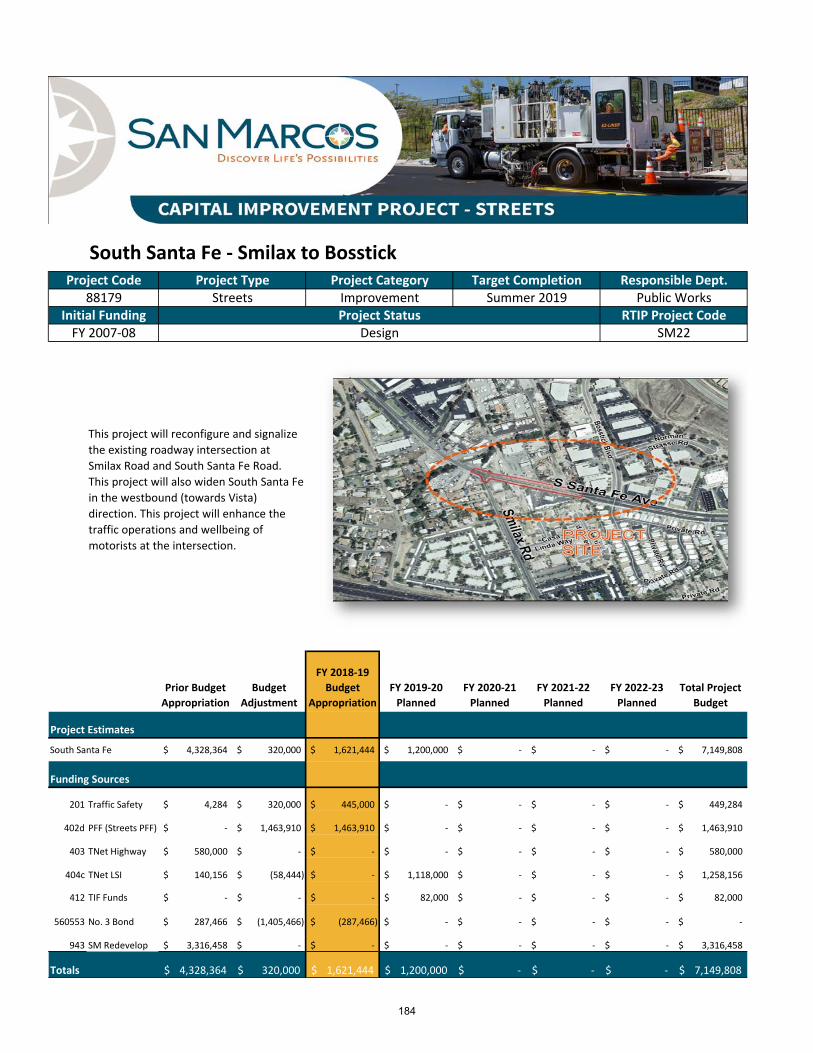
Title: South Santa Fe ‐ Smilax to Bosstick
Prior Budget
Appropriation
Budget
Adjustment
FY 2018‐19
Budget
Appropriation
FY 2019‐20
Planned
FY 2020‐21
Planned
FY 2021‐22
Planned
FY 2022‐23
Planned
Total Project
Budget
Project Estimates
South Santa Fe 4,328,364$ 320,000$ 1,621,444$ 1,200,000$ ‐$ ‐$ ‐$ 7,149,808$
Funding Sources
201 Traffic Safety 4,284$ 320,000$ 445,000$ ‐$ ‐$ ‐$ ‐$ 449,284$
402d PFF (Streets PFF) ‐$ 1,463,910$ 1,463,910$ ‐$ ‐$ ‐$ ‐$ 1,463,910$
403 TNet Highway 580,000$ ‐$ ‐$ ‐$ ‐$ ‐$ ‐$ 580,000$
404c TNet LSI 140,156$ (58,444)$ ‐$ 1,118,000$ ‐$ ‐$ ‐$ 1,258,156$
412 TIF Funds ‐$ ‐$ ‐$ 82,000$ ‐$ ‐$ ‐$ 82,000$
560553 No. 3 Bond 287,466$ (1,405,466)$ (287,466)$ ‐$ ‐$ ‐$ ‐$ ‐$
943 SM Redevelop 3,316,458$ ‐$ ‐$ ‐$ ‐$ ‐$ ‐$ 3,316,458$
4,328,364$ 320,000$ 1,621,444$ 1,200,000$ ‐$ ‐$ ‐$ 7,149,808$
Initial Funding RTIP Project CodeProject StatusDesign
Project Code Project Type Project Category Target Completion Responsible Dept.88179 Streets Improvement Summer 2019 Public Works
Totals
FY 2007‐08 SM22
This project will reconfigure and signalize
the existing roadway intersection at
Smilax Road and South Santa Fe Road.
This project will also widen South Santa Fe
in the westbound (towards Vista)
direction. This project will enhance the
traffic operations and wellbeing of
motorists at the intersection.
184
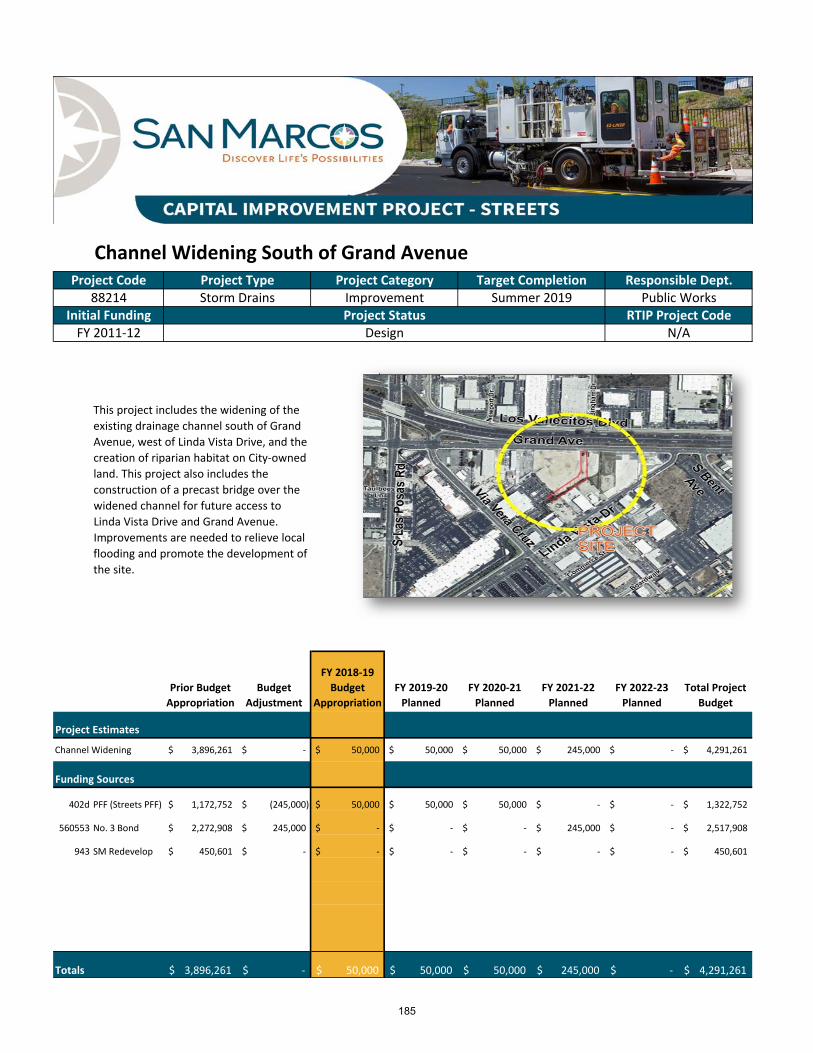
Title: Channel Widening South of Grand Avenue
Prior Budget
Appropriation
Budget
Adjustment
FY 2018‐19
Budget
Appropriation
FY 2019‐20
Planned
FY 2020‐21
Planned
FY 2021‐22
Planned
FY 2022‐23
Planned
Total Project
Budget
Project Estimates
Channel Widening 3,896,261$ ‐$ 50,000$ 50,000$ 50,000$ 245,000$ ‐$ 4,291,261$
Funding Sources
402d PFF (Streets PFF) 1,172,752$ (245,000)$ 50,000$ 50,000$ 50,000$ ‐$ ‐$ 1,322,752$
560553 No. 3 Bond 2,272,908$ 245,000$ ‐$ ‐$ ‐$ 245,000$ ‐$ 2,517,908$
943 SM Redevelop 450,601$ ‐$ ‐$ ‐$ ‐$ ‐$ ‐$ 450,601$
‐$ ‐$ ‐$ ‐$ ‐$ ‐$ ‐$ ‐$
‐$ ‐$ ‐$ ‐$ ‐$ ‐$ ‐$ ‐$
‐$ ‐$ ‐$ ‐$ ‐$ ‐$ ‐$ ‐$
‐$ ‐$ ‐$ ‐$ ‐$ ‐$ ‐$ ‐$
3,896,261$ ‐$ 50,000$ 50,000$ 50,000$ 245,000$ ‐$ 4,291,261$
Project Code Project Type Project Category Target Completion Responsible Dept.
Initial Funding RTIP Project CodeProject Status88214 Storm Drains Improvement Summer 2019 Public Works
Totals
FY 2011‐12 N/A
This project includes the widening of the
existing drainage channel south of Grand
Avenue, west of Linda Vista Drive, and the
creation of riparian habitat on City‐owned
land. This project also includes the
construction of a precast bridge over the
widened channel for future access to
Linda Vista Drive and Grand Avenue.
Improvements are needed to relieve local
flooding and promote the development of
the site.
Design
185
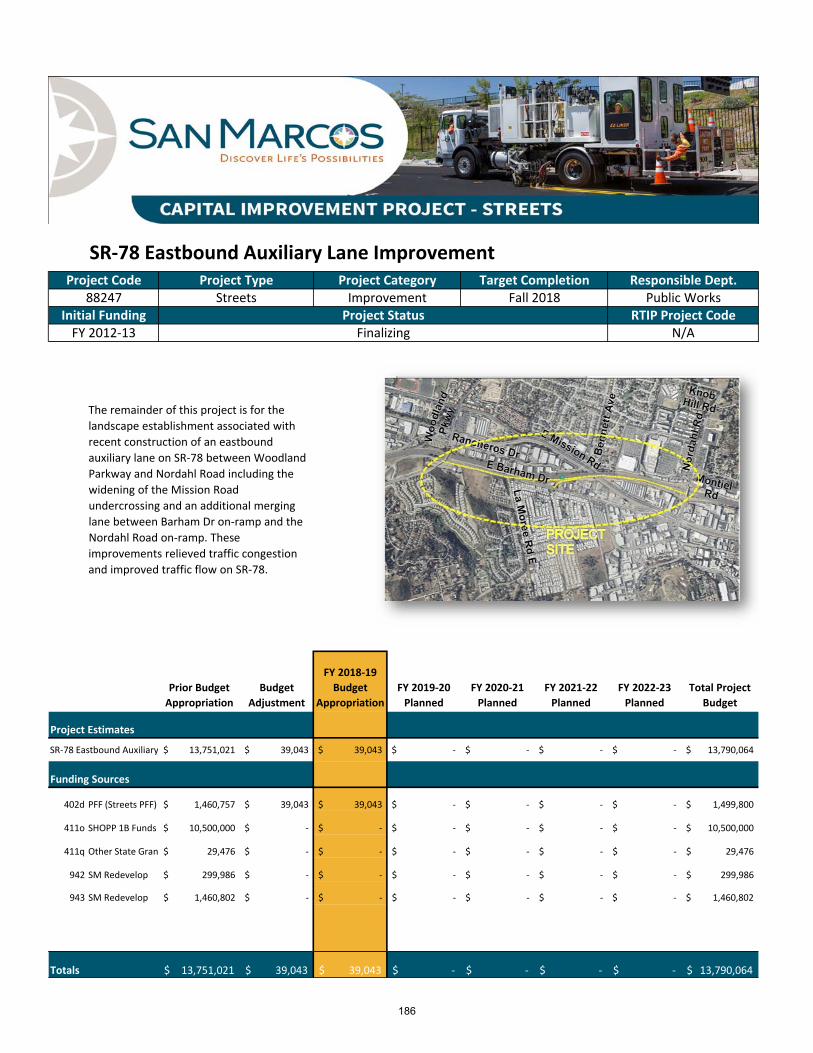
Title: SR‐78 Eastbound Auxiliary Lane Improvement
Prior Budget
Appropriation
Budget
Adjustment
FY 2018‐19
Budget
Appropriation
FY 2019‐20
Planned
FY 2020‐21
Planned
FY 2021‐22
Planned
FY 2022‐23
Planned
Total Project
Budget
Project Estimates
SR‐78 Eastbound Auxiliary 13,751,021$ 39,043$ 39,043$ ‐$ ‐$ ‐$ ‐$ 13,790,064$
Funding Sources
402d PFF (Streets PFF) 1,460,757$ 39,043$ 39,043$ ‐$ ‐$ ‐$ ‐$ 1,499,800$
411o SHOPP 1B Funds 10,500,000$ ‐$ ‐$ ‐$ ‐$ ‐$ ‐$ 10,500,000$
411q Other State Gran 29,476$ ‐$ ‐$ ‐$ ‐$ ‐$ ‐$ 29,476$
942 SM Redevelop 299,986$ ‐$ ‐$ ‐$ ‐$ ‐$ ‐$ 299,986$
943 SM Redevelop 1,460,802$ ‐$ ‐$ ‐$ ‐$ ‐$ ‐$ 1,460,802$
‐$ ‐$ ‐$ ‐$ ‐$ ‐$ ‐$ ‐$
‐$ ‐$ ‐$ ‐$ ‐$ ‐$ ‐$ ‐$
13,751,021$ 39,043$ 39,043$ ‐$ ‐$ ‐$ ‐$ 13,790,064$
Initial Funding RTIP Project CodeProject StatusFinalizing
Project Code Project Type Project Category Target Completion Responsible Dept.88247 Streets Improvement Fall 2018 Public Works
Totals
FY 2012‐13 N/A
The remainder of this project is for the
landscape establishment associated with
recent construction of an eastbound
auxiliary lane on SR‐78 between Woodland
Parkway and Nordahl Road including the
widening of the Mission Road
undercrossing and an additional merging
lane between Barham Dr on‐ramp and the
Nordahl Road on‐ramp. These
improvements relieved traffic congestion
and improved traffic flow on SR‐78.
186
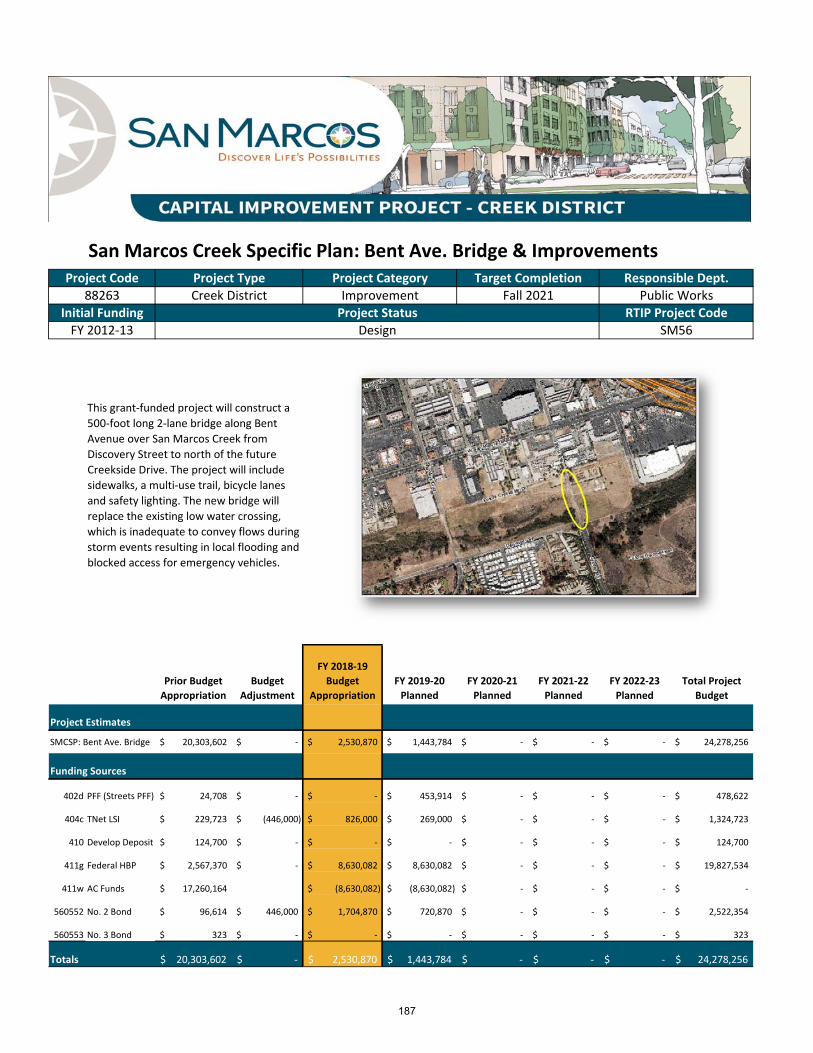
Title: San Marcos Creek Specific Plan: Bent Ave. Bridge & Improvements
Prior Budget
Appropriation
Budget
Adjustment
FY 2018‐19
Budget
Appropriation
FY 2019‐20
Planned
FY 2020‐21
Planned
FY 2021‐22
Planned
FY 2022‐23
Planned
Total Project
Budget
Project Estimates
SMCSP: Bent Ave. Bridge 20,303,602$ ‐$ 2,530,870$ 1,443,784$ ‐$ ‐$ ‐$ 24,278,256$
Funding Sources
402d PFF (Streets PFF) 24,708$ ‐$ ‐$ 453,914$ ‐$ ‐$ ‐$ 478,622$
404c TNet LSI 229,723$ (446,000)$ 826,000$ 269,000$ ‐$ ‐$ ‐$ 1,324,723$
410 Develop Deposit 124,700$ ‐$ ‐$ ‐$ ‐$ ‐$ ‐$ 124,700$
411g Federal HBP 2,567,370$ ‐$ 8,630,082$ 8,630,082$ ‐$ ‐$ ‐$ 19,827,534$
411w AC Funds 17,260,164$ (8,630,082)$ (8,630,082)$ ‐$ ‐$ ‐$ ‐$
560552 No. 2 Bond 96,614$ 446,000$ 1,704,870$ 720,870$ ‐$ ‐$ ‐$ 2,522,354$
560553 No. 3 Bond 323$ ‐$ ‐$ ‐$ ‐$ ‐$ ‐$ 323$
20,303,602$ ‐$ 2,530,870$ 1,443,784$ ‐$ ‐$ ‐$ 24,278,256$
Project Code Project Type Project Category Target Completion Responsible Dept.
Initial Funding RTIP Project CodeProject Status
88263 Creek District Improvement Fall 2021 Public Works
Totals
FY 2012‐13 SM56
This grant‐funded project will construct a
500‐foot long 2‐lane bridge along Bent
Avenue over San Marcos Creek from
Discovery Street to north of the future
Creekside Drive. The project will include
sidewalks, a multi‐use trail, bicycle lanes
and safety lighting. The new bridge will
replace the existing low water crossing,
which is inadequate to convey flows during
storm events resulting in local flooding and
blocked access for emergency vehicles.
Design
187
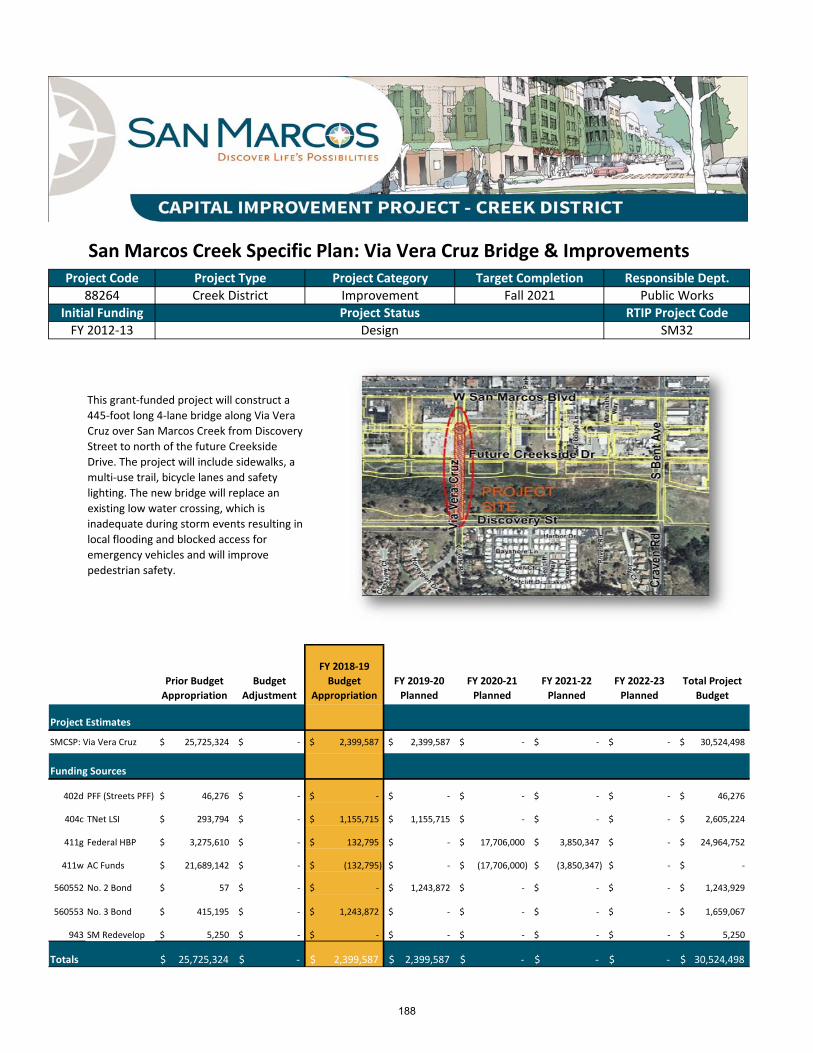
Title: San Marcos Creek Specific Plan: Via Vera Cruz Bridge & Improvements
Prior Budget
Appropriation
Budget
Adjustment
FY 2018‐19
Budget
Appropriation
FY 2019‐20
Planned
FY 2020‐21
Planned
FY 2021‐22
Planned
FY 2022‐23
Planned
Total Project
Budget
Project Estimates
SMCSP: Via Vera Cruz 25,725,324$ ‐$ 2,399,587$ 2,399,587$ ‐$ ‐$ ‐$ 30,524,498$
Funding Sources
402d PFF (Streets PFF) 46,276$ ‐$ ‐$ ‐$ ‐$ ‐$ ‐$ 46,276$
404c TNet LSI 293,794$ ‐$ 1,155,715$ 1,155,715$ ‐$ ‐$ ‐$ 2,605,224$
411g Federal HBP 3,275,610$ ‐$ 132,795$ ‐$ 17,706,000$ 3,850,347$ ‐$ 24,964,752$
411w AC Funds 21,689,142$ ‐$ (132,795)$ ‐$ (17,706,000)$ (3,850,347)$ ‐$ ‐$
560552 No. 2 Bond 57$ ‐$ ‐$ 1,243,872$ ‐$ ‐$ ‐$ 1,243,929$
560553 No. 3 Bond 415,195$ ‐$ 1,243,872$ ‐$ ‐$ ‐$ ‐$ 1,659,067$
943 SM Redevelop 5,250$ ‐$ ‐$ ‐$ ‐$ ‐$ ‐$ 5,250$
25,725,324$ ‐$ 2,399,587$ 2,399,587$ ‐$ ‐$ ‐$ 30,524,498$
Project Code Project Type Project Category Target Completion Responsible Dept.
Totals
FY 2012‐13 SM32
This grant‐funded project will construct a
445‐foot long 4‐lane bridge along Via Vera
Cruz over San Marcos Creek from Discovery
Street to north of the future Creekside
Drive. The project will include sidewalks, a
multi‐use trail, bicycle lanes and safety
lighting. The new bridge will replace an
existing low water crossing, which is
inadequate during storm events resulting in
local flooding and blocked access for
emergency vehicles and will improve
pedestrian safety.
88264 Creek District Improvement Fall 2021 Public Works
Initial Funding RTIP Project CodeProject Status
Design
188
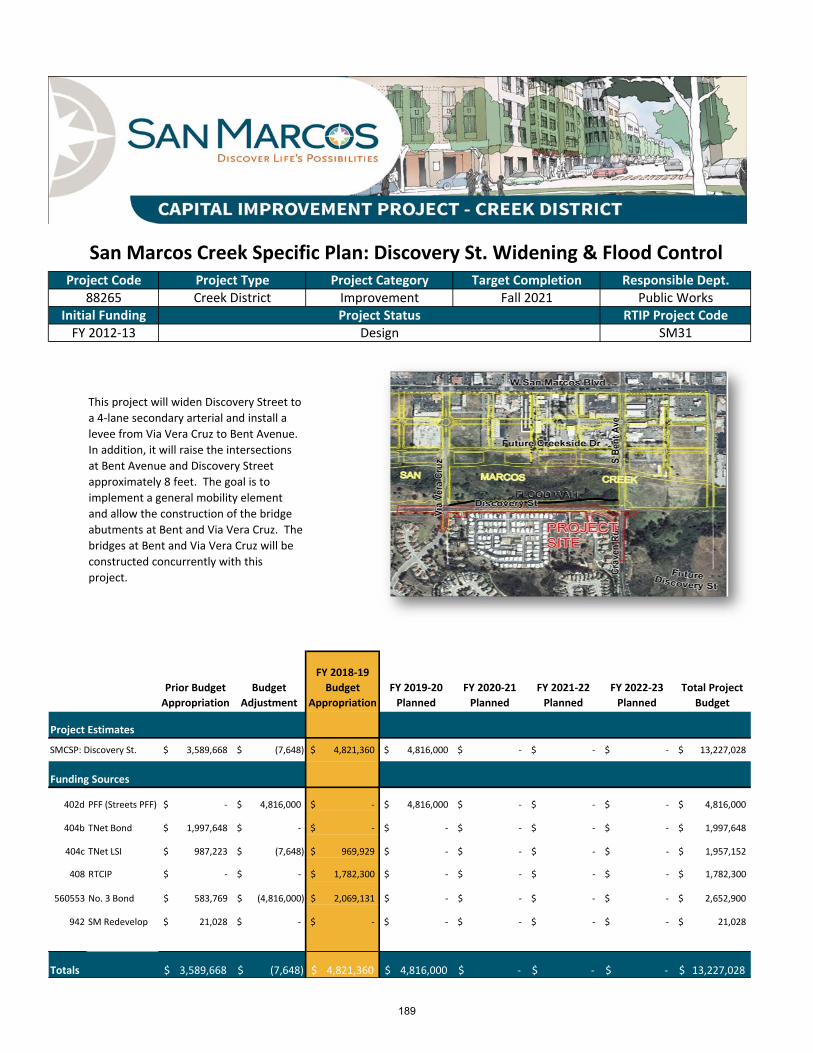
Title: San Marcos Creek Specific Plan: Discovery St. Widening & Flood Control
Prior Budget
Appropriation
Budget
Adjustment
FY 2018‐19
Budget
Appropriation
FY 2019‐20
Planned
FY 2020‐21
Planned
FY 2021‐22
Planned
FY 2022‐23
Planned
Total Project
Budget
Project Estimates
SMCSP: Discovery St. 3,589,668$ (7,648)$ 4,821,360$ 4,816,000$ ‐$ ‐$ ‐$ 13,227,028$
Funding Sources
402d PFF (Streets PFF) ‐$ 4,816,000$ ‐$ 4,816,000$ ‐$ ‐$ ‐$ 4,816,000$
404b TNet Bond 1,997,648$ ‐$ ‐$ ‐$ ‐$ ‐$ ‐$ 1,997,648$
404c TNet LSI 987,223$ (7,648)$ 969,929$ ‐$ ‐$ ‐$ ‐$ 1,957,152$
408 RTCIP ‐$ ‐$ 1,782,300$ ‐$ ‐$ ‐$ ‐$ 1,782,300$
560553 No. 3 Bond 583,769$ (4,816,000)$ 2,069,131$ ‐$ ‐$ ‐$ ‐$ 2,652,900$
942 SM Redevelop 21,028$ ‐$ ‐$ ‐$ ‐$ ‐$ ‐$ 21,028$
‐$ ‐$ ‐$ ‐$ ‐$ ‐$ ‐$ ‐$
3,589,668$ (7,648)$ 4,821,360$ 4,816,000$ ‐$ ‐$ ‐$ 13,227,028$
88265 Creek District Improvement Fall 2021 Public WorksProject Code Project Type Project Category Target Completion Responsible Dept.
Totals
FY 2012‐13 SM31
This project will widen Discovery Street to
a 4‐lane secondary arterial and install a
levee from Via Vera Cruz to Bent Avenue.
In addition, it will raise the intersections
at Bent Avenue and Discovery Street
approximately 8 feet. The goal is to
implement a general mobility element
and allow the construction of the bridge
abutments at Bent and Via Vera Cruz. The
bridges at Bent and Via Vera Cruz will be
constructed concurrently with this
project.
Initial Funding RTIP Project CodeProject StatusDesign
189

Title: Rancho Coronado Park
Prior Budget
Appropriation
Budget
Adjustment
FY 2018‐19
Budget
Appropriation
FY 2019‐20
Planned
FY 2020‐21
Planned
FY 2021‐22
Planned
FY 2022‐23
Planned
Total Project
Budget
Project Estimates
Rancho Coronado Park 5,677,886$ ‐$ ‐$ ‐$ ‐$ ‐$ ‐$ 5,677,886$
Funding Sources
560553 No. 3 Bond 5,658,200$ ‐$ ‐$ ‐$ ‐$ ‐$ ‐$ 5,658,200$
943 SM Redevelop 19,686$ ‐$ ‐$ ‐$ ‐$ ‐$ ‐$ 19,686$
‐$ ‐$ ‐$ ‐$ ‐$ ‐$ ‐$ ‐$
‐$ ‐$ ‐$ ‐$ ‐$ ‐$ ‐$ ‐$
‐$ ‐$ ‐$ ‐$ ‐$ ‐$ ‐$ ‐$
‐$ ‐$ ‐$ ‐$ ‐$ ‐$ ‐$ ‐$
‐$ ‐$ ‐$ ‐$ ‐$ ‐$ ‐$ ‐$
5,677,886$ ‐$ ‐$ ‐$ ‐$ ‐$ ‐$ 5,677,886$
Project Code Project Type Project Category Target Completion Responsible Dept.
Totals
FY 2012‐13 N/A
This project will create a multi‐use park at
the former Hanson quarry site. The
project will be phased depending on cost
and funding availability with the goal of
meeting the growing outdoor recreation
needs of the community. Initial
improvements will be large turf (natural)
play fields and parking.
88270 Parks Improvement Winter 2019 Public WorksInitial Funding RTIP Project CodeProject Status
Construction
190

Title: East Mission Road Fiber Optic Project
Prior Budget
Appropriation
Budget
Adjustment
FY 2018‐19
Budget
Appropriation
FY 2019‐20
Planned
FY 2020‐21
Planned
FY 2021‐22
Planned
FY 2022‐23
Planned
Total Project
Budget
Project Estimates
East Mission Fiber 729,700$ ‐$ ‐$ ‐$ ‐$ ‐$ ‐$ 729,700$
Funding Sources
201 Traffic Safety 149,500$ ‐$ ‐$ ‐$ ‐$ ‐$ ‐$ 149,500$
411h Federal HSIP 580,200$ ‐$ ‐$ ‐$ ‐$ ‐$ ‐$ 580,200$
‐$ ‐$ ‐$ ‐$ ‐$ ‐$ ‐$ ‐$
‐$ ‐$ ‐$ ‐$ ‐$ ‐$ ‐$ ‐$
‐$ ‐$ ‐$ ‐$ ‐$ ‐$ ‐$ ‐$
‐$ ‐$ ‐$ ‐$ ‐$ ‐$ ‐$ ‐$
‐$ ‐$ ‐$ ‐$ ‐$ ‐$ ‐$ ‐$
729,700$ ‐$ ‐$ ‐$ ‐$ ‐$ ‐$ 729,700$
Project Code Project Type Project Category Target Completion Responsible Dept.
Totals
FY 2012‐13 CAL235
This federally‐funded project will install a
total of approximately 21,900 lineal feet
of fiber optic communication cable, CCTV
cameras, Ethernet switches, and other
traffic signal equipment on East Mission
Road, Woodland Parkway, and Nordahl
Road. This project will improve signal
timing coordination on the corridor, allow
for remote traffic monitoring at selected
signalized intersections, and provide a
reliable traffic signal communication
network.
88504 Traffic Improvement Winter 2018 Public WorksInitial Funding RTIP Project CodeProject Status
Design
191
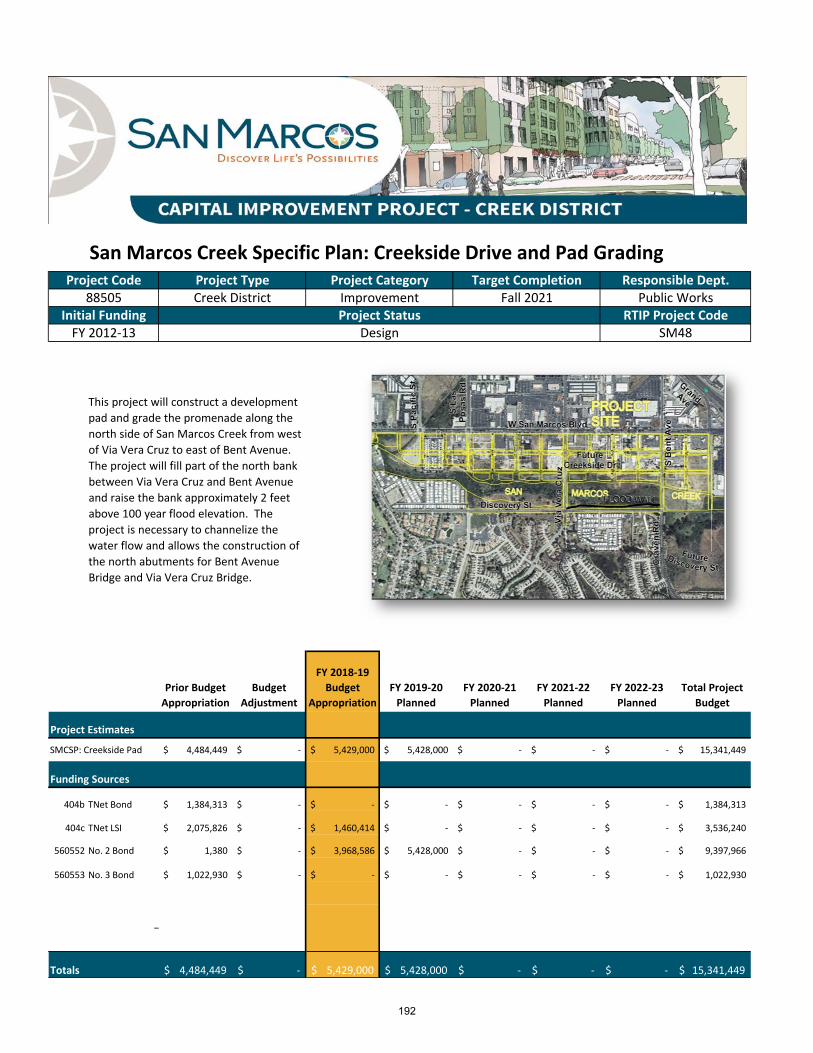
Title: San Marcos Creek Specific Plan: Creekside Drive and Pad Grading
Prior Budget
Appropriation
Budget
Adjustment
FY 2018‐19
Budget
Appropriation
FY 2019‐20
Planned
FY 2020‐21
Planned
FY 2021‐22
Planned
FY 2022‐23
Planned
Total Project
Budget
Project Estimates
SMCSP: Creekside Pad 4,484,449$ ‐$ 5,429,000$ 5,428,000$ ‐$ ‐$ ‐$ 15,341,449$
Funding Sources
404b TNet Bond 1,384,313$ ‐$ ‐$ ‐$ ‐$ ‐$ ‐$ 1,384,313$
404c TNet LSI 2,075,826$ ‐$ 1,460,414$ ‐$ ‐$ ‐$ ‐$ 3,536,240$
560552 No. 2 Bond 1,380$ ‐$ 3,968,586$ 5,428,000$ ‐$ ‐$ ‐$ 9,397,966$
560553 No. 3 Bond 1,022,930$ ‐$ ‐$ ‐$ ‐$ ‐$ ‐$ 1,022,930$
‐$ ‐$ ‐$ ‐$ ‐$ ‐$ ‐$ ‐$
‐$ ‐$ ‐$ ‐$ ‐$ ‐$ ‐$ ‐$
‐$ ‐$ ‐$ ‐$ ‐$ ‐$ ‐$ ‐$
4,484,449$ ‐$ 5,429,000$ 5,428,000$ ‐$ ‐$ ‐$ 15,341,449$
Project Code Project Type Project Category Target Completion Responsible Dept.
Initial Funding RTIP Project CodeProject Status88505 Creek District Improvement Fall 2021 Public Works
Totals
FY 2012‐13 SM48
This project will construct a development
pad and grade the promenade along the
north side of San Marcos Creek from west
of Via Vera Cruz to east of Bent Avenue.
The project will fill part of the north bank
between Via Vera Cruz and Bent Avenue
and raise the bank approximately 2 feet
above 100 year flood elevation. The
project is necessary to channelize the
water flow and allows the construction of
the north abutments for Bent Avenue
Bridge and Via Vera Cruz Bridge.
Design
192
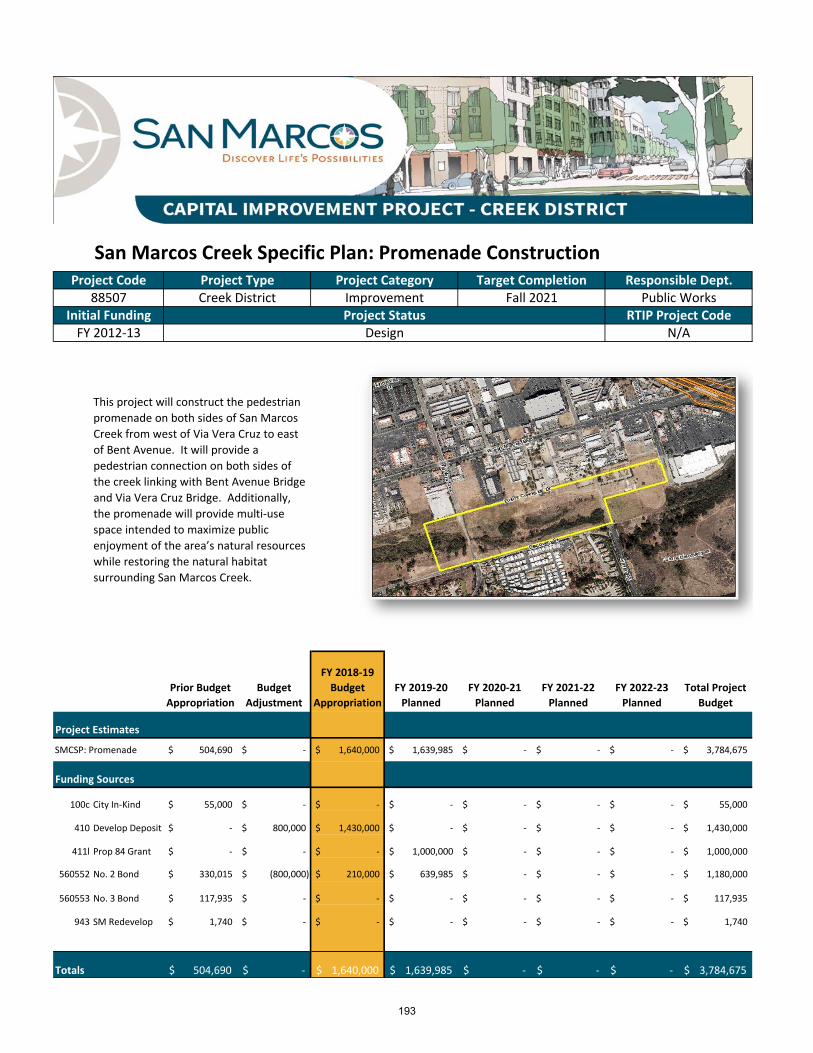
Title: San Marcos Creek Specific Plan: Promenade Construction
Prior Budget
Appropriation
Budget
Adjustment
FY 2018‐19
Budget
Appropriation
FY 2019‐20
Planned
FY 2020‐21
Planned
FY 2021‐22
Planned
FY 2022‐23
Planned
Total Project
Budget
Project Estimates
SMCSP: Promenade 504,690$ ‐$ 1,640,000$ 1,639,985$ ‐$ ‐$ ‐$ 3,784,675$
Funding Sources
100c City In‐Kind 55,000$ ‐$ ‐$ ‐$ ‐$ ‐$ ‐$ 55,000$
410 Develop Deposit ‐$ 800,000$ 1,430,000$ ‐$ ‐$ ‐$ ‐$ 1,430,000$
411l Prop 84 Grant ‐$ ‐$ ‐$ 1,000,000$ ‐$ ‐$ ‐$ 1,000,000$
560552 No. 2 Bond 330,015$ (800,000)$ 210,000$ 639,985$ ‐$ ‐$ ‐$ 1,180,000$
560553 No. 3 Bond 117,935$ ‐$ ‐$ ‐$ ‐$ ‐$ ‐$ 117,935$
943 SM Redevelop 1,740$ ‐$ ‐$ ‐$ ‐$ ‐$ ‐$ 1,740$
‐$ ‐$ ‐$ ‐$ ‐$ ‐$ ‐$ ‐$
504,690$ ‐$ 1,640,000$ 1,639,985$ ‐$ ‐$ ‐$ 3,784,675$
Project Code Project Type Project Category Target Completion Responsible Dept.
Totals
FY 2012‐13 N/A
This project will construct the pedestrian
promenade on both sides of San Marcos
Creek from west of Via Vera Cruz to east
of Bent Avenue. It will provide a
pedestrian connection on both sides of
the creek linking with Bent Avenue Bridge
and Via Vera Cruz Bridge. Additionally,
the promenade will provide multi‐use
space intended to maximize public
enjoyment of the area’s natural resources
while restoring the natural habitat
surrounding San Marcos Creek.
88507 Creek District Improvement Fall 2021 Public WorksInitial Funding RTIP Project CodeProject Status
Design
193

Title: Palomar Station Pedestrian Bridge
Prior Budget
Appropriation
Budget
Adjustment
FY 2018‐19
Budget
Appropriation
FY 2019‐20
Planned
FY 2020‐21
Planned
FY 2021‐22
Planned
FY 2022‐23
Planned
Total Project
Budget
Project Estimates
Palomar Bridge 1,068,252$ ‐$ ‐$ ‐$ ‐$ 4,483,533$ ‐$ 5,551,785$
Funding Sources
100c City In‐Kind 89,952$ ‐$ ‐$ ‐$ ‐$ 40,048$ ‐$ 130,000$
410 Develop Deposit 202,517$ ‐$ ‐$ ‐$ ‐$ 416,628$ ‐$ 619,145$
411i Federal TCSP 775,783$ ‐$ ‐$ ‐$ ‐$ 6,857$ ‐$ 782,640$
411t Grant / Other ‐$ ‐$ ‐$ ‐$ ‐$ 4,020,000$ ‐$ 4,020,000$
‐$ ‐$ ‐$ ‐$ ‐$ ‐$ ‐$ ‐$
‐$ ‐$ ‐$ ‐$ ‐$ ‐$ ‐$ ‐$
‐$ ‐$ ‐$ ‐$ ‐$ ‐$ ‐$ ‐$
1,068,252$ ‐$ ‐$ ‐$ ‐$ 4,483,533$ ‐$ 5,551,785$
Project Code Project Type Project Category Target Completion Responsible Dept.
Totals
FY 2012‐13 SM49
88511 Streets Improvement Winter 2019 Public WorksInitial Funding RTIP Project CodeProject Status
Design
This grant‐funded project will construct a
200 foot long pedestrian bridge over West
Mission Road from the Palomar Sprinter
Station to Palomar College. The project
will include the construction of stairways,
elevators, landing structures, safety
lighting, and pedestrian ramps. The bridge
will connect the Palomar College Transit
Center with the Palomar Sprinter Station
and improve traffic flow and pedestrian
safety along Mission Road.
194
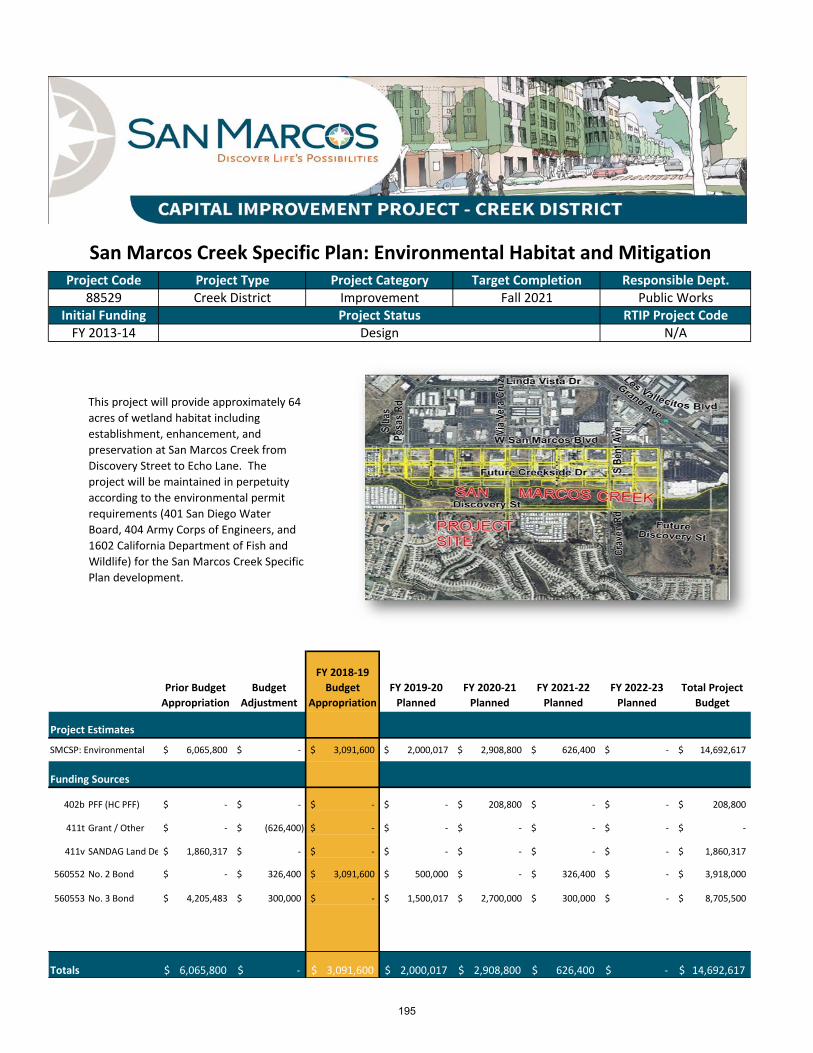
Title: San Marcos Creek Specific Plan: Environmental Habitat and Mitigation
Prior Budget
Appropriation
Budget
Adjustment
FY 2018‐19
Budget
Appropriation
FY 2019‐20
Planned
FY 2020‐21
Planned
FY 2021‐22
Planned
FY 2022‐23
Planned
Total Project
Budget
Project Estimates
SMCSP: Environmental 6,065,800$ ‐$ 3,091,600$ 2,000,017$ 2,908,800$ 626,400$ ‐$ 14,692,617$
Funding Sources
402b PFF (HC PFF) ‐$ ‐$ ‐$ ‐$ 208,800$ ‐$ ‐$ 208,800$
411t Grant / Other ‐$ (626,400)$ ‐$ ‐$ ‐$ ‐$ ‐$ ‐$
411v SANDAG Land De 1,860,317$ ‐$ ‐$ ‐$ ‐$ ‐$ ‐$ 1,860,317$
560552 No. 2 Bond ‐$ 326,400$ 3,091,600$ 500,000$ ‐$ 326,400$ ‐$ 3,918,000$
560553 No. 3 Bond 4,205,483$ 300,000$ ‐$ 1,500,017$ 2,700,000$ 300,000$ ‐$ 8,705,500$
‐$ ‐$ ‐$ ‐$ ‐$ ‐$ ‐$ ‐$
‐$ ‐$ ‐$ ‐$ ‐$ ‐$ ‐$ ‐$
6,065,800$ ‐$ 3,091,600$ 2,000,017$ 2,908,800$ 626,400$ ‐$ 14,692,617$
Project Code Project Type Project Category Target Completion Responsible Dept.
Initial Funding RTIP Project CodeProject Status88529 Creek District Improvement Fall 2021 Public Works
Totals
FY 2013‐14 N/A
This project will provide approximately 64
acres of wetland habitat including
establishment, enhancement, and
preservation at San Marcos Creek from
Discovery Street to Echo Lane. The
project will be maintained in perpetuity
according to the environmental permit
requirements (401 San Diego Water
Board, 404 Army Corps of Engineers, and
1602 California Department of Fish and
Wildlife) for the San Marcos Creek Specific
Plan development.
Design
195
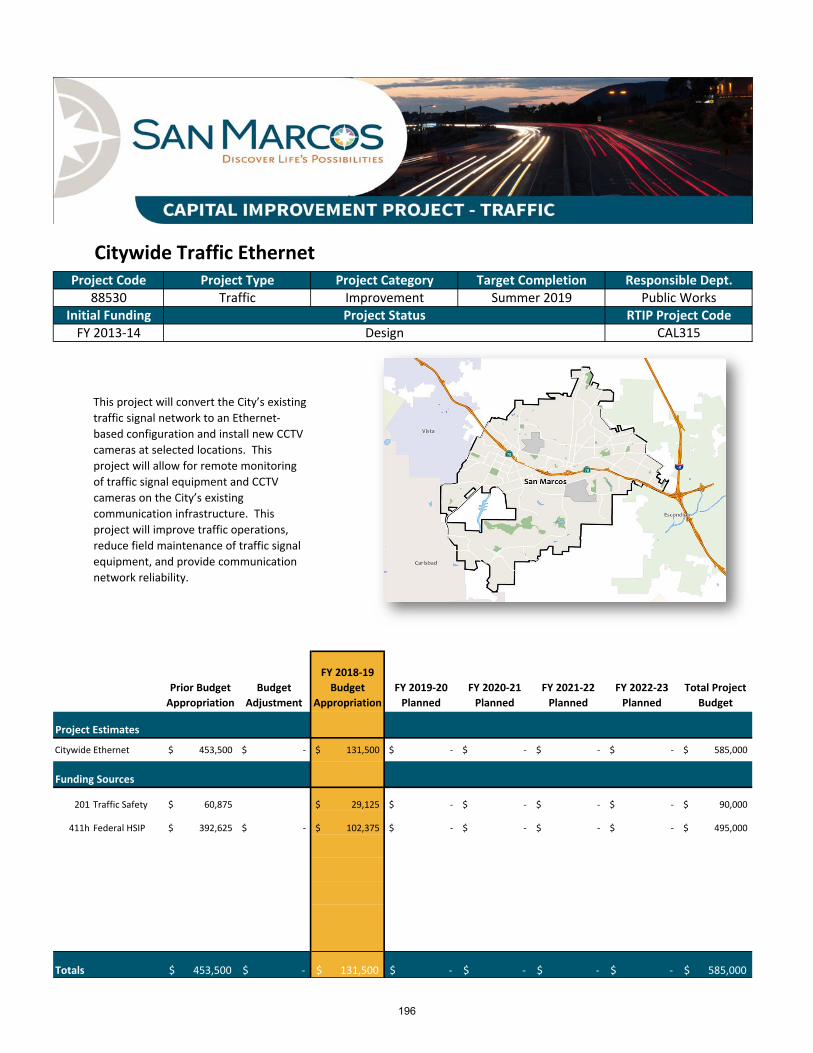
Title: Citywide Traffic Ethernet
Prior Budget
Appropriation
Budget
Adjustment
FY 2018‐19
Budget
Appropriation
FY 2019‐20
Planned
FY 2020‐21
Planned
FY 2021‐22
Planned
FY 2022‐23
Planned
Total Project
Budget
Project Estimates
Citywide Ethernet 453,500$ ‐$ 131,500$ ‐$ ‐$ ‐$ ‐$ 585,000$
Funding Sources
201 Traffic Safety 60,875$ 29,125$ ‐$ ‐$ ‐$ ‐$ 90,000$
411h Federal HSIP 392,625$ ‐$ 102,375$ ‐$ ‐$ ‐$ ‐$ 495,000$
‐$ ‐$ ‐$ ‐$ ‐$ ‐$ ‐$ ‐$
‐$ ‐$ ‐$ ‐$ ‐$ ‐$ ‐$ ‐$
‐$ ‐$ ‐$ ‐$ ‐$ ‐$ ‐$ ‐$
‐$ ‐$ ‐$ ‐$ ‐$ ‐$ ‐$ ‐$
‐$ ‐$ ‐$ ‐$ ‐$ ‐$ ‐$ ‐$
453,500$ ‐$ 131,500$ ‐$ ‐$ ‐$ ‐$ 585,000$
Project Code Project Type Project Category Target Completion Responsible Dept.
Totals
FY 2013‐14 CAL315
This project will convert the City’s existing
traffic signal network to an Ethernet‐
based configuration and install new CCTV
cameras at selected locations. This
project will allow for remote monitoring
of traffic signal equipment and CCTV
cameras on the City’s existing
communication infrastructure. This
project will improve traffic operations,
reduce field maintenance of traffic signal
equipment, and provide communication
network reliability.
88530 Traffic Improvement Summer 2019 Public WorksInitial Funding RTIP Project CodeProject Status
Design
196

Title: Citywide Installation of LED Safety Lighting
Prior Budget
Appropriation
Budget
Adjustment
FY 2018‐19
Budget
Appropriation
FY 2019‐20
Planned
FY 2020‐21
Planned
FY 2021‐22
Planned
FY 2022‐23
Planned
Total Project
Budget
Project Estimates
Citywide LED 486,500$ ‐$ ‐$ ‐$ ‐$ ‐$ ‐$ 486,500$
Funding Sources
201 Traffic Safety 84,700$ ‐$ ‐$ ‐$ ‐$ ‐$ ‐$ 84,700$
411h Federal HSIP 401,800$ ‐$ ‐$ ‐$ ‐$ ‐$ ‐$ 401,800$
‐$ ‐$ ‐$ ‐$ ‐$ ‐$ ‐$ ‐$
‐$ ‐$ ‐$ ‐$ ‐$ ‐$ ‐$ ‐$
‐$ ‐$ ‐$ ‐$ ‐$ ‐$ ‐$ ‐$
‐$ ‐$ ‐$ ‐$ ‐$ ‐$ ‐$ ‐$
‐$ ‐$ ‐$ ‐$ ‐$ ‐$ ‐$ ‐$
486,500$ ‐$ ‐$ ‐$ ‐$ ‐$ ‐$ 486,500$
Project Code Project Type Project Category Target Completion Responsible Dept.
Totals
FY 2013‐14 CAL316
This federally‐funded project will convert
low pressure sodium (LPS) lighting fixtures
at signalized intersections to LED type
fixtures. The new LED fixtures will
provide improved lighting levels, enhance
visibility of the signalized intersections,
and provide overall traffic safety for
pedestrians and vehicular traffic.
Significant energy and maintenance costs
savings are anticipated.
88531 Traffic Improvement Winter 2018 Public WorksInitial Funding RTIP Project CodeProject Status
Design
197

Title: Traffic Management System Enhancement
Prior Budget
Appropriation
Budget
Adjustment
FY 2018‐19
Budget
Appropriation
FY 2019‐20
Planned
FY 2020‐21
Planned
FY 2021‐22
Planned
FY 2022‐23
Planned
Total Project
Budget
Project Estimates
Traffic Management 329,048$ 252,552$ 252,552$ ‐$ ‐$ ‐$ ‐$ 581,600$
Funding Sources
201 Traffic Safety 85,000$ 252,552$ 252,552$ ‐$ ‐$ ‐$ ‐$ 337,552$
404a TNet SAFE 244,048$ ‐$ ‐$ ‐$ ‐$ ‐$ ‐$ 244,048$
‐$ ‐$ ‐$ ‐$ ‐$ ‐$ ‐$ ‐$
‐$ ‐$ ‐$ ‐$ ‐$ ‐$ ‐$ ‐$
‐$ ‐$ ‐$ ‐$ ‐$ ‐$ ‐$ ‐$
‐$ ‐$ ‐$ ‐$ ‐$ ‐$ ‐$ ‐$
‐$ ‐$ ‐$ ‐$ ‐$ ‐$ ‐$ ‐$
329,048$ 252,552$ 252,552$ ‐$ ‐$ ‐$ ‐$ 581,600$
Project Code Project Type Project Category Target Completion Responsible Dept.
Totals
FY 2013‐14 N/A
This project will install backup power to
the City’s Traffic Management Center
(TMC) to manage the City’s Traffic Signal
System network during disaster‐related
evacuations or extended power outages.
The project will also install fiber optic
communication cable on West Mission
Road, Mulberry Dr. and Via Vera Cruz to
allow for real‐time monitoring. The
project will install additional CCTV
cameras at selected signalized
intersections.
88532 Traffic Improvement Summer 2019 Public WorksInitial Funding RTIP Project CodeProject Status
Not Started
198

Title: Civic Center and Wellness Center: Bathroom Rehabilitation
Prior Budget
Appropriation
Budget
Adjustment
FY 2018‐19
Budget
Appropriation
FY 2019‐20
Planned
FY 2020‐21
Planned
FY 2021‐22
Planned
FY 2022‐23
Planned
Total Project
Budget
Project Estimates
CC and WC: Bathrooms 400,000$ ‐$ 245,000$ ‐$ ‐$ ‐$ ‐$ 645,000$
Funding Sources
603 Facilities R&R 400,000$ ‐$ 245,000$ ‐$ ‐$ ‐$ ‐$ 645,000$
‐$ ‐$ ‐$ ‐$ ‐$ ‐$ ‐$ ‐$
‐$ ‐$ ‐$ ‐$ ‐$ ‐$ ‐$
‐$ ‐$ ‐$ ‐$ ‐$ ‐$ ‐$
‐$ ‐$ ‐$ ‐$ ‐$ ‐$ ‐$
‐$ ‐$ ‐$ ‐$ ‐$ ‐$ ‐$
‐$ ‐$ ‐$ ‐$ ‐$ ‐$ ‐$
400,000$ ‐$ 245,000$ ‐$ ‐$ ‐$ ‐$ 645,000$ Totals
FY 2017‐18 N/A
This project includes a full rehabilitation
of the City Hall and Community Center
restrooms. Updates will be made to
interior tiles, fixtures and finishes.
FC001 Facilities Maintenance Summer 2020 Public WorksInitial Funding RTIP Project CodeProject Status
Not Started
Project Code Project Type Project Category Target Completion Responsible Dept.
199
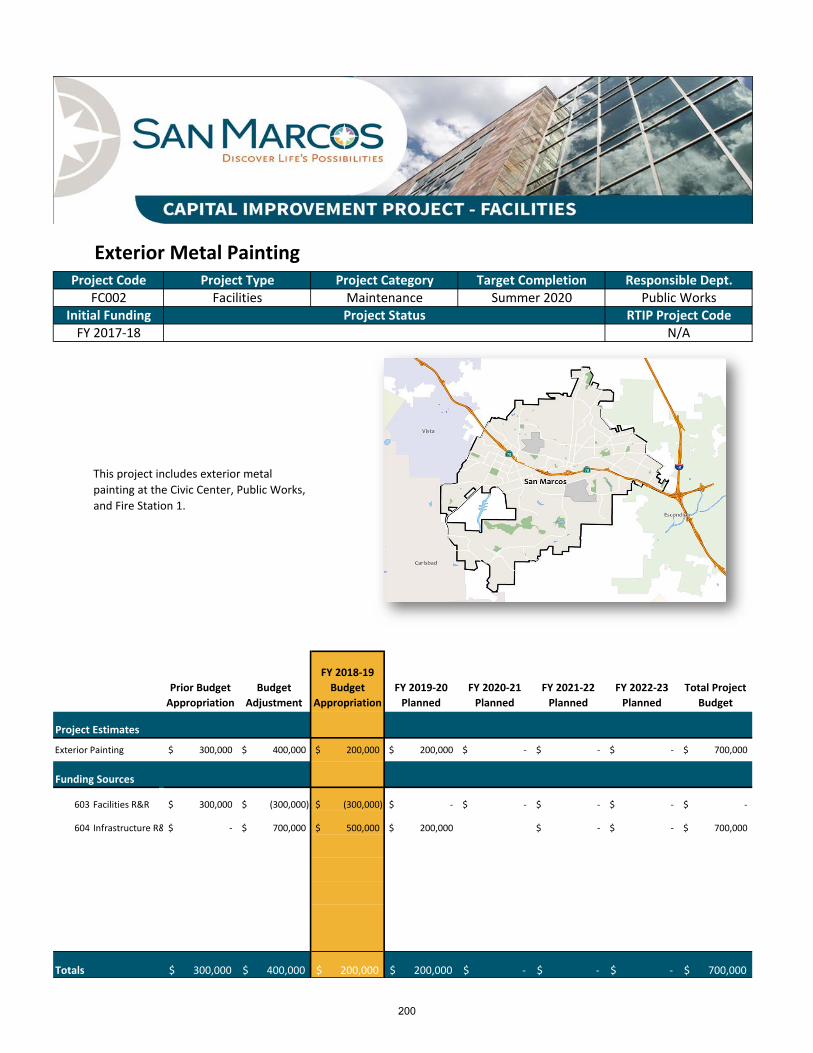
Title: Exterior Metal Painting
Prior Budget
Appropriation
Budget
Adjustment
FY 2018‐19
Budget
Appropriation
FY 2019‐20
Planned
FY 2020‐21
Planned
FY 2021‐22
Planned
FY 2022‐23
Planned
Total Project
Budget
Project Estimates
Exterior Painting 300,000$ 400,000$ 200,000$ 200,000$ ‐$ ‐$ ‐$ 700,000$
Funding Sources
603 Facilities R&R 300,000$ (300,000)$ (300,000)$ ‐$ ‐$ ‐$ ‐$ ‐$
604 Infrastructure R& ‐$ 700,000$ 500,000$ 200,000$ ‐$ ‐$ 700,000$
‐$ ‐$ ‐$ ‐$ ‐$ ‐$ ‐$ ‐$
‐$ ‐$ ‐$ ‐$ ‐$ ‐$ ‐$ ‐$
‐$ ‐$ ‐$ ‐$ ‐$ ‐$ ‐$ ‐$
‐$ ‐$ ‐$ ‐$ ‐$ ‐$ ‐$ ‐$
‐$ ‐$ ‐$ ‐$ ‐$ ‐$ ‐$ ‐$
300,000$ 400,000$ 200,000$ 200,000$ ‐$ ‐$ ‐$ 700,000$
FY 2017‐18 N/A
This project includes exterior metal
painting at the Civic Center, Public Works,
and Fire Station 1.
Totals
Initial Funding Project Status RTIP Project Code
Project Code Project Type Project Category Target Completion Responsible Dept.FC002 Facilities Maintenance Summer 2020 Public Works
200
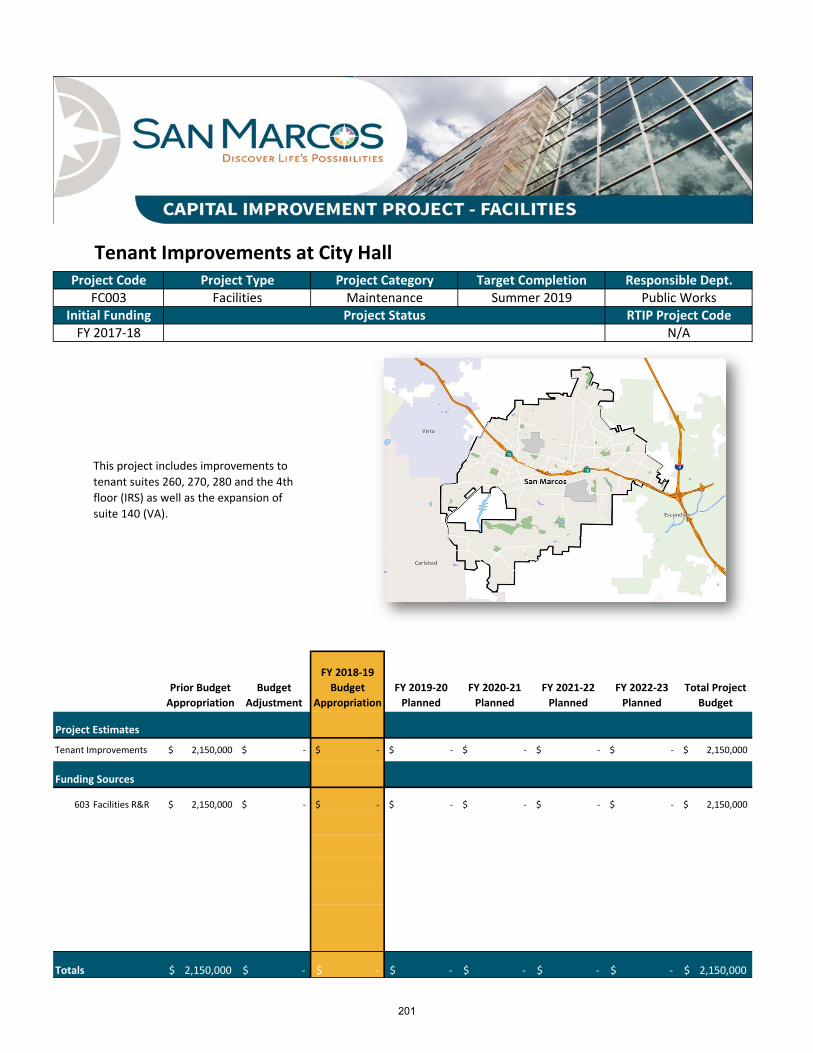
Title: Tenant Improvements at City Hall
Prior Budget
Appropriation
Budget
Adjustment
FY 2018‐19
Budget
Appropriation
FY 2019‐20
Planned
FY 2020‐21
Planned
FY 2021‐22
Planned
FY 2022‐23
Planned
Total Project
Budget
Project Estimates
Tenant Improvements 2,150,000$ ‐$ ‐$ ‐$ ‐$ ‐$ ‐$ 2,150,000$
Funding Sources
603 Facilities R&R 2,150,000$ ‐$ ‐$ ‐$ ‐$ ‐$ ‐$ 2,150,000$
‐$ ‐$ ‐$ ‐$ ‐$ ‐$ ‐$ ‐$
‐$ ‐$ ‐$ ‐$ ‐$ ‐$ ‐$ ‐$
‐$ ‐$ ‐$ ‐$ ‐$ ‐$ ‐$ ‐$
‐$ ‐$ ‐$ ‐$ ‐$ ‐$ ‐$ ‐$
‐$ ‐$ ‐$ ‐$ ‐$ ‐$ ‐$ ‐$
‐$ ‐$ ‐$ ‐$ ‐$ ‐$ ‐$ ‐$
2,150,000$ ‐$ ‐$ ‐$ ‐$ ‐$ ‐$ 2,150,000$
FY 2017‐18 N/A
This project includes improvements to
tenant suites 260, 270, 280 and the 4th
floor (IRS) as well as the expansion of
suite 140 (VA).
Totals
Initial Funding Project Status RTIP Project Code
Project Code Project Type Project Category Target Completion Responsible Dept.FC003 Facilities Maintenance Summer 2019 Public Works
201
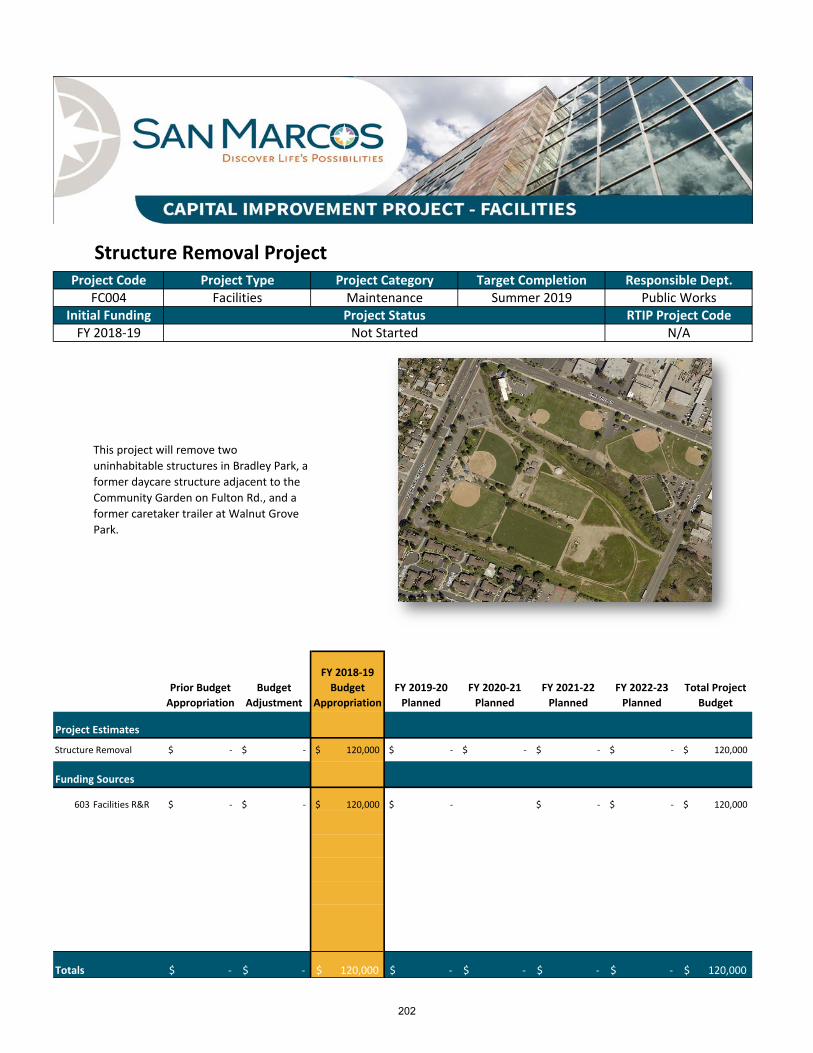
Title: Structure Removal Project
Prior Budget
Appropriation
Budget
Adjustment
FY 2018‐19
Budget
Appropriation
FY 2019‐20
Planned
FY 2020‐21
Planned
FY 2021‐22
Planned
FY 2022‐23
Planned
Total Project
Budget
Project Estimates
Structure Removal ‐$ ‐$ 120,000$ ‐$ ‐$ ‐$ ‐$ 120,000$
Funding Sources
603 Facilities R&R ‐$ ‐$ 120,000$ ‐$ ‐$ ‐$ 120,000$
‐$ ‐$ ‐$ ‐$ ‐$ ‐$ ‐$ ‐$
‐$ ‐$ ‐$ ‐$ ‐$ ‐$ ‐$ ‐$
‐$ ‐$ ‐$ ‐$ ‐$ ‐$ ‐$ ‐$
‐$ ‐$ ‐$ ‐$ ‐$ ‐$ ‐$ ‐$
‐$ ‐$ ‐$ ‐$ ‐$ ‐$ ‐$ ‐$
‐$ ‐$ ‐$ ‐$ ‐$ ‐$ ‐$ ‐$
‐$ ‐$ 120,000$ ‐$ ‐$ ‐$ ‐$ 120,000$
Initial Funding Project Status RTIP Project Code
Project Code Project Type Project Category Target Completion Responsible Dept.FC004 Facilities Maintenance Summer 2019 Public Works
FY 2018‐19 Not Started N/A
This project will remove two
uninhabitable structures in Bradley Park, a
former daycare structure adjacent to the
Community Garden on Fulton Rd., and a
former caretaker trailer at Walnut Grove
Park.
Totals
202
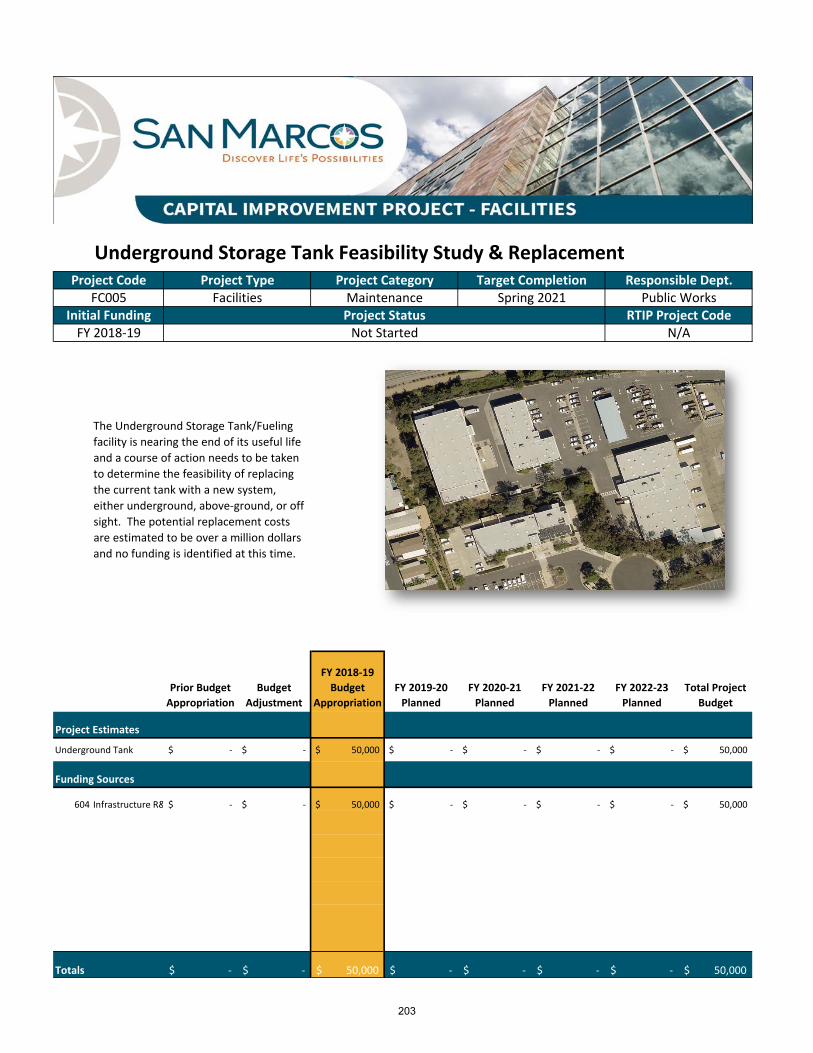
Title: Underground Storage Tank Feasibility Study & Replacement
Prior Budget
Appropriation
Budget
Adjustment
FY 2018‐19
Budget
Appropriation
FY 2019‐20
Planned
FY 2020‐21
Planned
FY 2021‐22
Planned
FY 2022‐23
Planned
Total Project
Budget
Project Estimates
Underground Tank ‐$ ‐$ 50,000$ ‐$ ‐$ ‐$ ‐$ 50,000$
Funding Sources
604 Infrastructure R& ‐$ ‐$ 50,000$ ‐$ ‐$ ‐$ ‐$ 50,000$
‐$ ‐$ ‐$ ‐$ ‐$ ‐$ ‐$ ‐$
‐$ ‐$ ‐$ ‐$ ‐$ ‐$ ‐$ ‐$
‐$ ‐$ ‐$ ‐$ ‐$ ‐$ ‐$ ‐$
‐$ ‐$ ‐$ ‐$ ‐$ ‐$ ‐$ ‐$
‐$ ‐$ ‐$ ‐$ ‐$ ‐$ ‐$ ‐$
‐$ ‐$ ‐$ ‐$ ‐$ ‐$ ‐$ ‐$
‐$ ‐$ 50,000$ ‐$ ‐$ ‐$ ‐$ 50,000$
Initial Funding Project Status RTIP Project Code
Project Code Project Type Project Category Target Completion Responsible Dept.FC005 Facilities Maintenance Spring 2021 Public Works
FY 2018‐19 Not Started N/A
The Underground Storage Tank/Fueling
facility is nearing the end of its useful life
and a course of action needs to be taken
to determine the feasibility of replacing
the current tank with a new system,
either underground, above‐ground, or off
sight. The potential replacement costs
are estimated to be over a million dollars
and no funding is identified at this time.
Totals
203
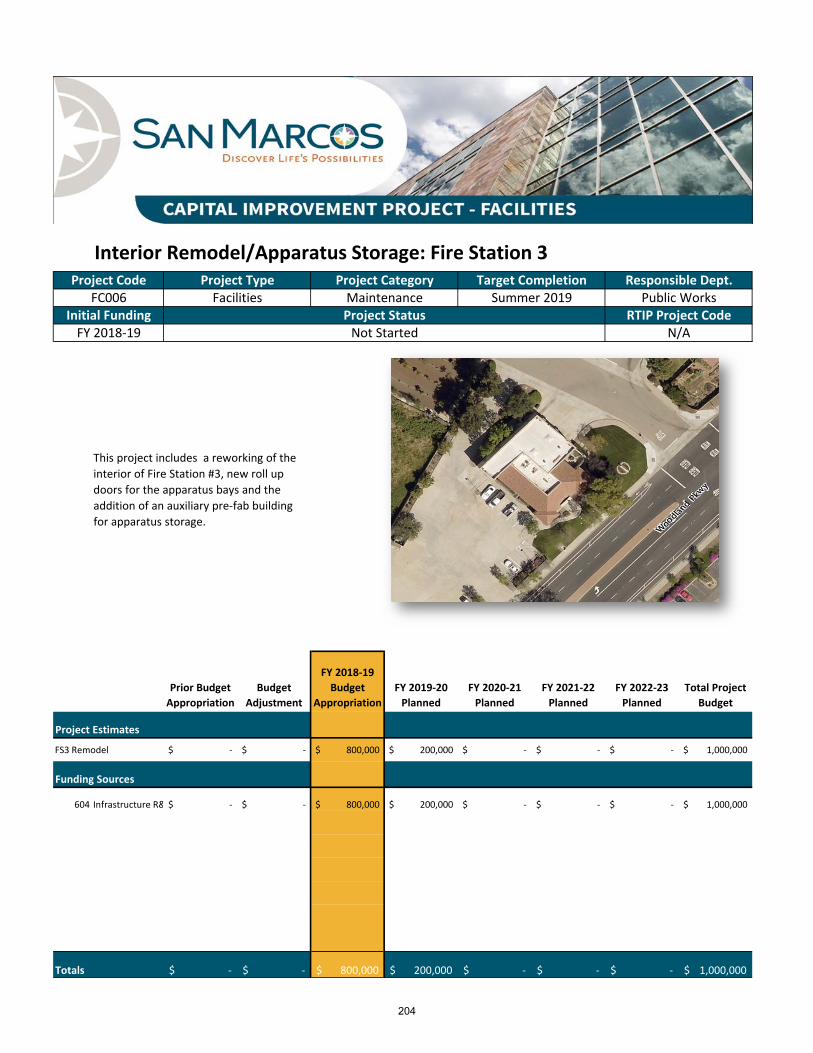
Title: Interior Remodel/Apparatus Storage: Fire Station 3
Prior Budget
Appropriation
Budget
Adjustment
FY 2018‐19
Budget
Appropriation
FY 2019‐20
Planned
FY 2020‐21
Planned
FY 2021‐22
Planned
FY 2022‐23
Planned
Total Project
Budget
Project Estimates
FS3 Remodel ‐$ ‐$ 800,000$ 200,000$ ‐$ ‐$ ‐$ 1,000,000$
Funding Sources
604 Infrastructure R& ‐$ ‐$ 800,000$ 200,000$ ‐$ ‐$ ‐$ 1,000,000$
‐$ ‐$ ‐$ ‐$ ‐$ ‐$ ‐$ ‐$
‐$ ‐$ ‐$ ‐$ ‐$ ‐$ ‐$ ‐$
‐$ ‐$ ‐$ ‐$ ‐$ ‐$ ‐$ ‐$
‐$ ‐$ ‐$ ‐$ ‐$ ‐$ ‐$ ‐$
‐$ ‐$ ‐$ ‐$ ‐$ ‐$ ‐$ ‐$
‐$ ‐$ ‐$ ‐$ ‐$ ‐$ ‐$ ‐$
‐$ ‐$ 800,000$ 200,000$ ‐$ ‐$ ‐$ 1,000,000$
Initial Funding Project Status RTIP Project Code
Project Code Project Type Project Category Target Completion Responsible Dept.FC006 Facilities Maintenance Summer 2019 Public Works
FY 2018‐19 Not Started N/A
This project includes a reworking of the
interior of Fire Station #3, new roll up
doors for the apparatus bays and the
addition of an auxiliary pre‐fab building
for apparatus storage.
Totals
204
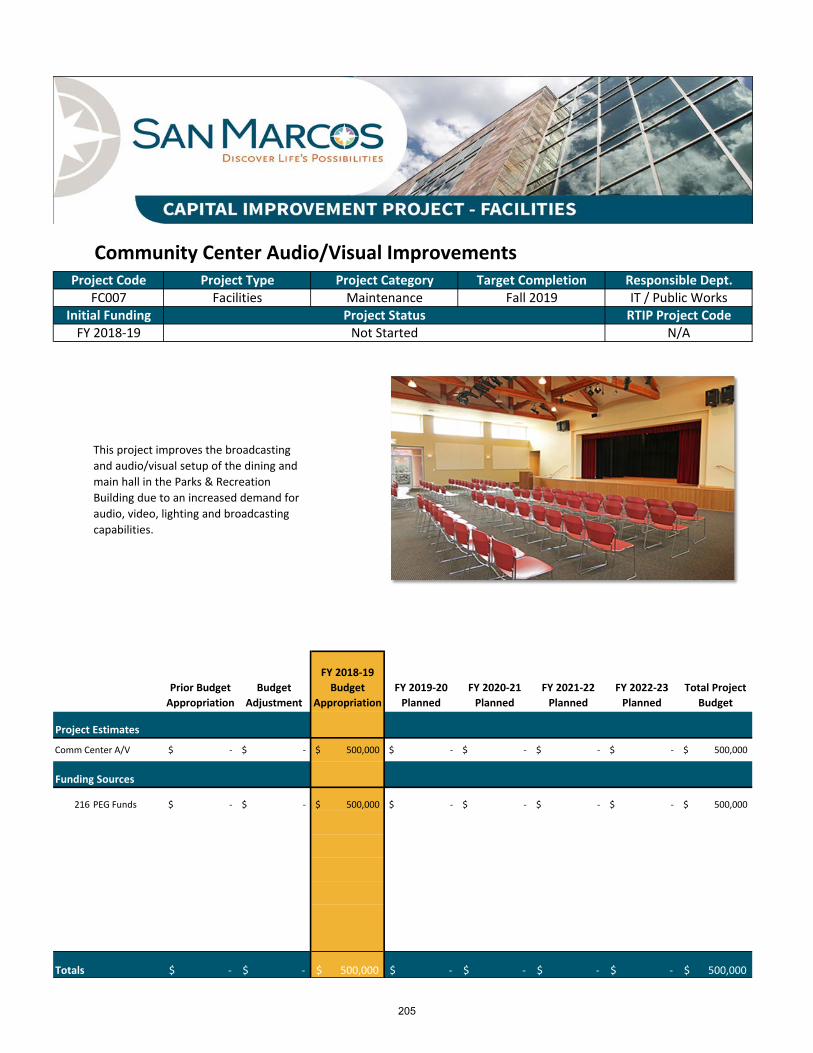
Title: Community Center Audio/Visual Improvements
Prior Budget
Appropriation
Budget
Adjustment
FY 2018‐19
Budget
Appropriation
FY 2019‐20
Planned
FY 2020‐21
Planned
FY 2021‐22
Planned
FY 2022‐23
Planned
Total Project
Budget
Project Estimates
Comm Center A/V ‐$ ‐$ 500,000$ ‐$ ‐$ ‐$ ‐$ 500,000$
Funding Sources
216 PEG Funds ‐$ ‐$ 500,000$ ‐$ ‐$ ‐$ ‐$ 500,000$
‐$ ‐$ ‐$ ‐$ ‐$ ‐$ ‐$ ‐$
‐$ ‐$ ‐$ ‐$ ‐$ ‐$ ‐$ ‐$
‐$ ‐$ ‐$ ‐$ ‐$ ‐$ ‐$ ‐$
‐$ ‐$ ‐$ ‐$ ‐$ ‐$ ‐$ ‐$
‐$ ‐$ ‐$ ‐$ ‐$ ‐$ ‐$ ‐$
‐$ ‐$ ‐$ ‐$ ‐$ ‐$ ‐$ ‐$
‐$ ‐$ 500,000$ ‐$ ‐$ ‐$ ‐$ 500,000$
FY 2018‐19 Not Started N/A
This project improves the broadcasting
and audio/visual setup of the dining and
main hall in the Parks & Recreation
Building due to an increased demand for
audio, video, lighting and broadcasting
capabilities.
Totals
Initial Funding Project Status RTIP Project Code
Project Code Project Type Project Category Target Completion Responsible Dept.FC007 Facilities Maintenance Fall 2019 IT / Public Works
205
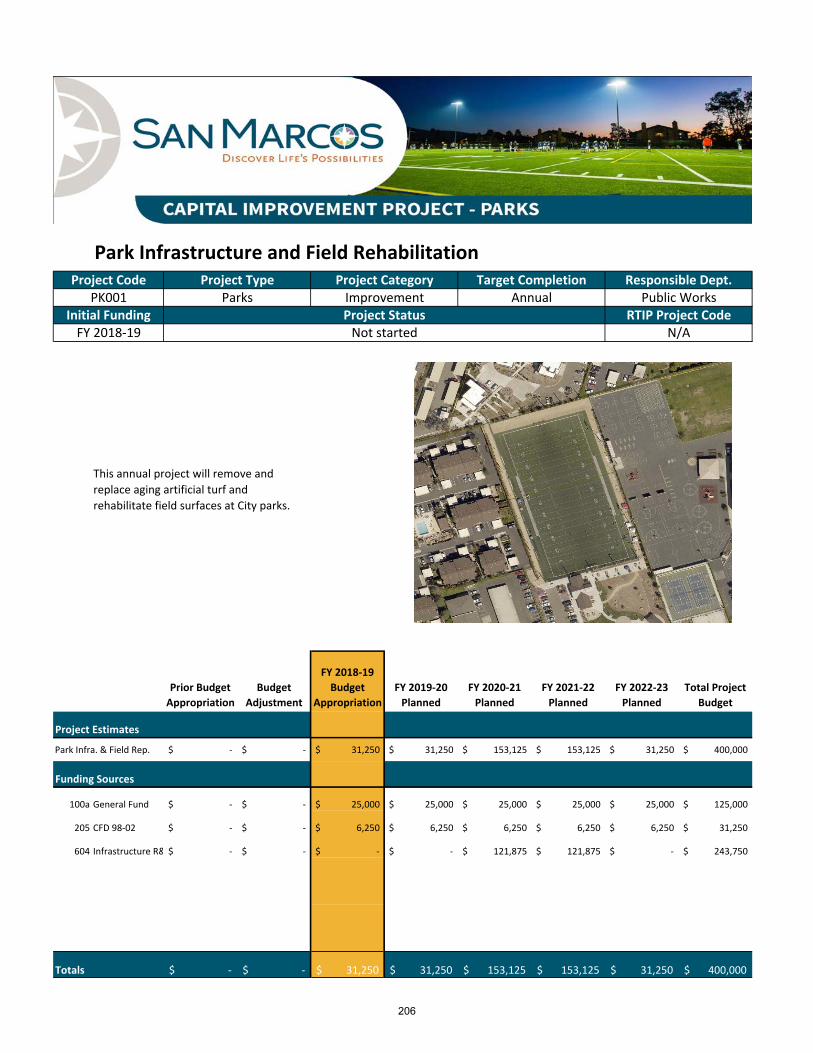
Title: Park Infrastructure and Field Rehabilitation
Prior Budget
Appropriation
Budget
Adjustment
FY 2018‐19
Budget
Appropriation
FY 2019‐20
Planned
FY 2020‐21
Planned
FY 2021‐22
Planned
FY 2022‐23
Planned
Total Project
Budget
Project Estimates
Park Infra. & Field Rep. ‐$ ‐$ 31,250$ 31,250$ 153,125$ 153,125$ 31,250$ 400,000$
Funding Sources
100a General Fund ‐$ ‐$ 25,000$ 25,000$ 25,000$ 25,000$ 25,000$ 125,000$
205 CFD 98‐02 ‐$ ‐$ 6,250$ 6,250$ 6,250$ 6,250$ 6,250$ 31,250$
604 Infrastructure R& ‐$ ‐$ ‐$ ‐$ 121,875$ 121,875$ ‐$ 243,750$
‐$ ‐$ ‐$ ‐$ ‐$ ‐$ ‐$ ‐$
‐$ ‐$ ‐$ ‐$ ‐$ ‐$ ‐$ ‐$
‐$ ‐$ ‐$ ‐$ ‐$ ‐$ ‐$ ‐$
‐$ ‐$ ‐$ ‐$ ‐$ ‐$ ‐$ ‐$
‐$ ‐$ 31,250$ 31,250$ 153,125$ 153,125$ 31,250$ 400,000$
Initial Funding Project Status RTIP Project Code
Project Code Project Type Project Category Target Completion Responsible Dept.PK001 Parks Improvement Annual Public Works
FY 2018‐19 Not started N/A
This annual project will remove and
replace aging artificial turf and
rehabilitate field surfaces at City parks.
Totals
206
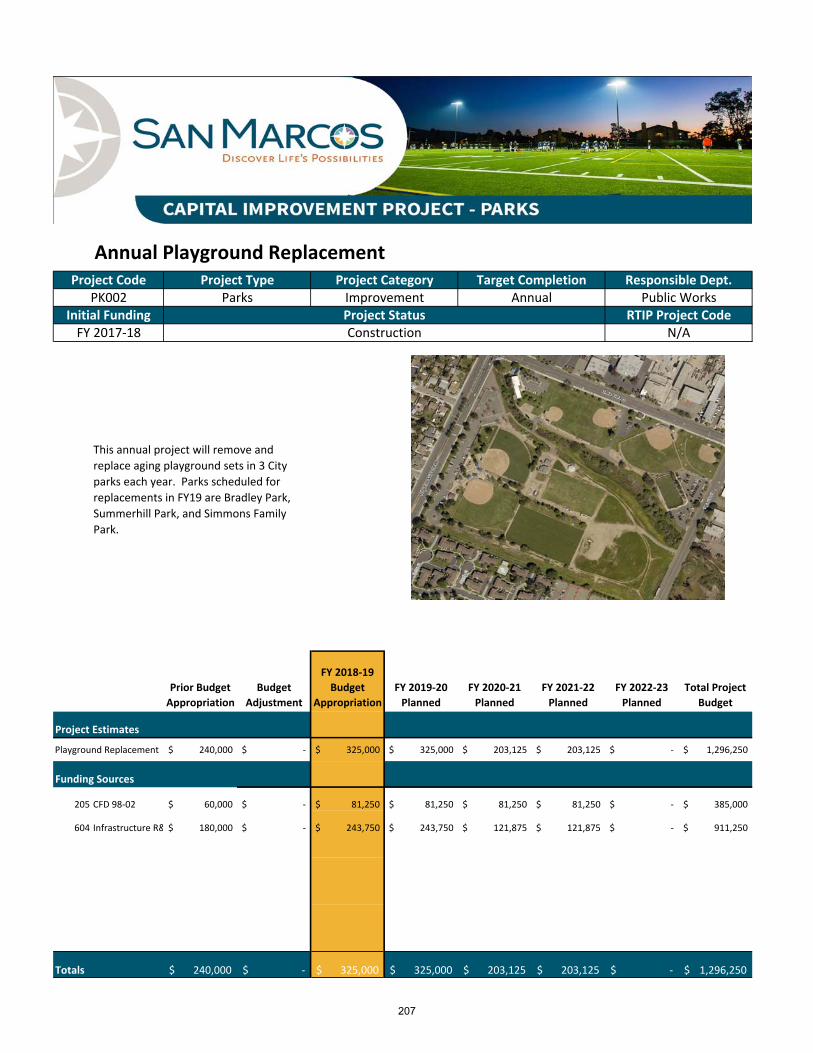
Title: Annual Playground Replacement
Prior Budget
Appropriation
Budget
Adjustment
FY 2018‐19
Budget
Appropriation
FY 2019‐20
Planned
FY 2020‐21
Planned
FY 2021‐22
Planned
FY 2022‐23
Planned
Total Project
Budget
Project Estimates
Playground Replacement 240,000$ ‐$ 325,000$ 325,000$ 203,125$ 203,125$ ‐$ 1,296,250$
Funding Sources
205 CFD 98‐02 60,000$ ‐$ 81,250$ 81,250$ 81,250$ 81,250$ ‐$ 385,000$
604 Infrastructure R& 180,000$ ‐$ 243,750$ 243,750$ 121,875$ 121,875$ ‐$ 911,250$
‐$ ‐$ ‐$ ‐$ ‐$ ‐$ ‐$ ‐$
‐$ ‐$ ‐$ ‐$ ‐$ ‐$ ‐$ ‐$
‐$ ‐$ ‐$ ‐$ ‐$ ‐$ ‐$ ‐$
‐$ ‐$ ‐$ ‐$ ‐$ ‐$ ‐$ ‐$
‐$ ‐$ ‐$ ‐$ ‐$ ‐$ ‐$ ‐$
240,000$ ‐$ 325,000$ 325,000$ 203,125$ 203,125$ ‐$ 1,296,250$
Initial Funding Project Status RTIP Project Code
Project Code Project Type Project Category Target Completion Responsible Dept.PK002 Parks Improvement Annual Public Works
FY 2017‐18 Construction N/A
This annual project will remove and
replace aging playground sets in 3 City
parks each year. Parks scheduled for
replacements in FY19 are Bradley Park,
Summerhill Park, and Simmons Family
Park.
Totals
207

Title: Annual Surface Seal Project
Prior Budget
Appropriation
Budget
Adjustment
FY 2018‐19
Budget
Appropriation
FY 2019‐20
Planned
FY 2020‐21
Planned
FY 2021‐22
Planned
FY 2022‐23
Planned
Total Project
Budget
Project Estimates
Annual Surface Seal 1,527,125$ (927,125)$ 72,875$ ‐$ ‐$ ‐$ ‐$ 1,600,000$
Funding Sources
200 Gas Tax 1,000,000$ (1,225,458)$ (225,458)$ ‐$ ‐$ ‐$ ‐$ 774,542$
219 RMRA Funds 527,125$ ‐$ ‐$ ‐$ ‐$ ‐$ ‐$ 527,125$
404c TNet LSI ‐$ 298,333$ 298,333$ ‐$ ‐$ ‐$ ‐$ 298,333$
‐$ ‐$ ‐$ ‐$ ‐$ ‐$ ‐$ ‐$
‐$ ‐$ ‐$ ‐$ ‐$ ‐$ ‐$ ‐$
‐$ ‐$ ‐$ ‐$ ‐$ ‐$ ‐$ ‐$
‐$ ‐$ ‐$ ‐$ ‐$ ‐$ ‐$ ‐$
1,527,125$ (927,125)$ 72,875$ ‐$ ‐$ ‐$ ‐$ 1,600,000$
Project Code Project Type Project Category Target Completion Responsible Dept.
Totals
FY 2017‐18 SM62
This project is part of the City’s regular
maintenance of roadways. Various
roadways will be surface sealed as part of
this project to protect them from ongoing
wear and tear.
ST001 Streets Maintenance Annual Public WorksInitial Funding RTIP Project CodeProject Status
208
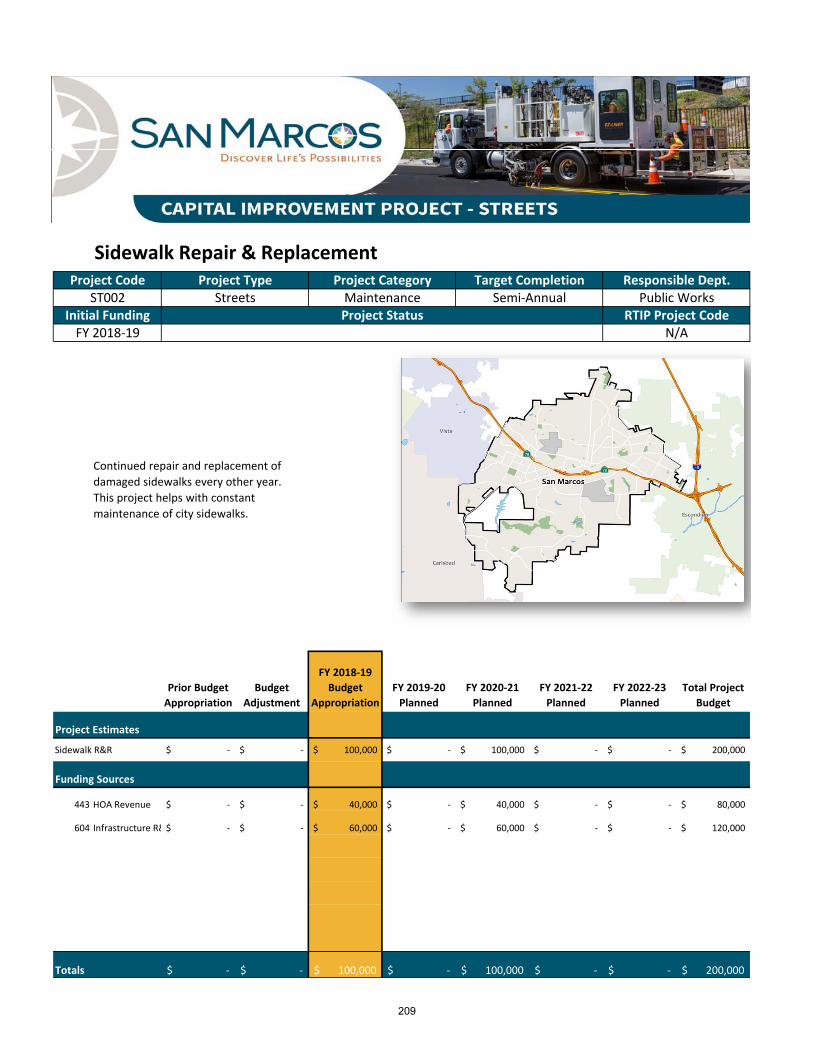
Title: Sidewalk Repair & Replacement
Prior Budget
Appropriation
Budget
Adjustment
FY 2018‐19
Budget
Appropriation
FY 2019‐20
Planned
FY 2020‐21
Planned
FY 2021‐22
Planned
FY 2022‐23
Planned
Total Project
Budget
Project Estimates
Sidewalk R&R ‐$ ‐$ 100,000$ ‐$ 100,000$ ‐$ ‐$ 200,000$
Funding Sources
443 HOA Revenue ‐$ ‐$ 40,000$ ‐$ 40,000$ ‐$ ‐$ 80,000$
604 Infrastructure R& ‐$ ‐$ 60,000$ ‐$ 60,000$ ‐$ ‐$ 120,000$
‐$ ‐$ ‐$ ‐$ ‐$ ‐$ ‐$ ‐$
‐$ ‐$ ‐$ ‐$ ‐$ ‐$ ‐$ ‐$
‐$ ‐$ ‐$ ‐$ ‐$ ‐$ ‐$ ‐$
‐$ ‐$ ‐$ ‐$ ‐$ ‐$ ‐$ ‐$
‐$ ‐$ ‐$ ‐$ ‐$ ‐$ ‐$ ‐$
‐$ ‐$ 100,000$ ‐$ 100,000$ ‐$ ‐$ 200,000$
Initial Funding Project Status RTIP Project Code
Project Code Project Type Project Category Target Completion Responsible Dept.ST002 Streets Maintenance Semi‐Annual Public Works
FY 2018‐19 N/A
Continued repair and replacement of
damaged sidewalks every other year.
This project helps with constant
maintenance of city sidewalks.
Totals
209
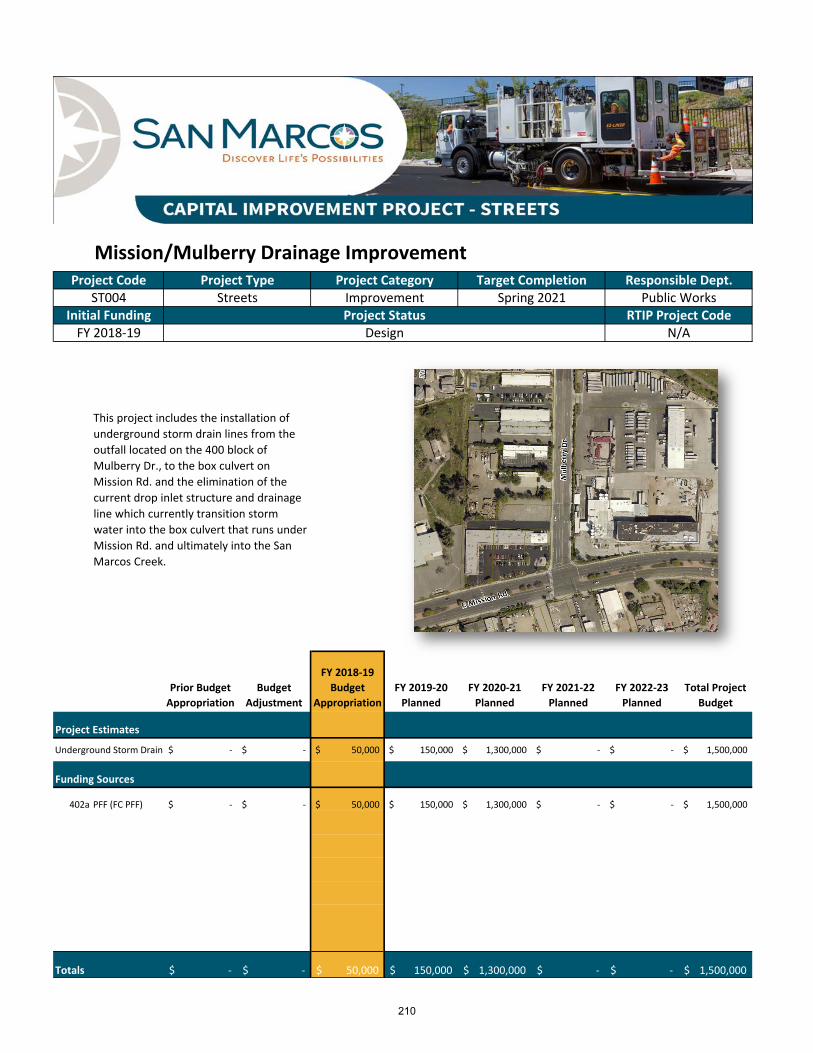
Title: Mission/Mulberry Drainage Improvement
Prior Budget
Appropriation
Budget
Adjustment
FY 2018‐19
Budget
Appropriation
FY 2019‐20
Planned
FY 2020‐21
Planned
FY 2021‐22
Planned
FY 2022‐23
Planned
Total Project
Budget
Project Estimates
Underground Storm Drain ‐$ ‐$ 50,000$ 150,000$ 1,300,000$ ‐$ ‐$ 1,500,000$
Funding Sources
402a PFF (FC PFF) ‐$ ‐$ 50,000$ 150,000$ 1,300,000$ ‐$ ‐$ 1,500,000$
‐$ ‐$ ‐$ ‐$ ‐$ ‐$ ‐$ ‐$
‐$ ‐$ ‐$ ‐$ ‐$ ‐$ ‐$ ‐$
‐$ ‐$ ‐$ ‐$ ‐$ ‐$ ‐$ ‐$
‐$ ‐$ ‐$ ‐$ ‐$ ‐$ ‐$ ‐$
‐$ ‐$ ‐$ ‐$ ‐$ ‐$ ‐$ ‐$
‐$ ‐$ ‐$ ‐$ ‐$ ‐$ ‐$ ‐$
‐$ ‐$ 50,000$ 150,000$ 1,300,000$ ‐$ ‐$ 1,500,000$
Project Code Project Type Project Category Target Completion Responsible Dept.
N/A
This project includes the installation of
underground storm drain lines from the
outfall located on the 400 block of
Mulberry Dr., to the box culvert on
Mission Rd. and the elimination of the
current drop inlet structure and drainage
line which currently transition storm
water into the box culvert that runs under
Mission Rd. and ultimately into the San
Marcos Creek.
Totals
ST004 Streets Improvement Spring 2021
FY 2018‐19 Design
Public WorksInitial Funding Project Status RTIP Project Code
210
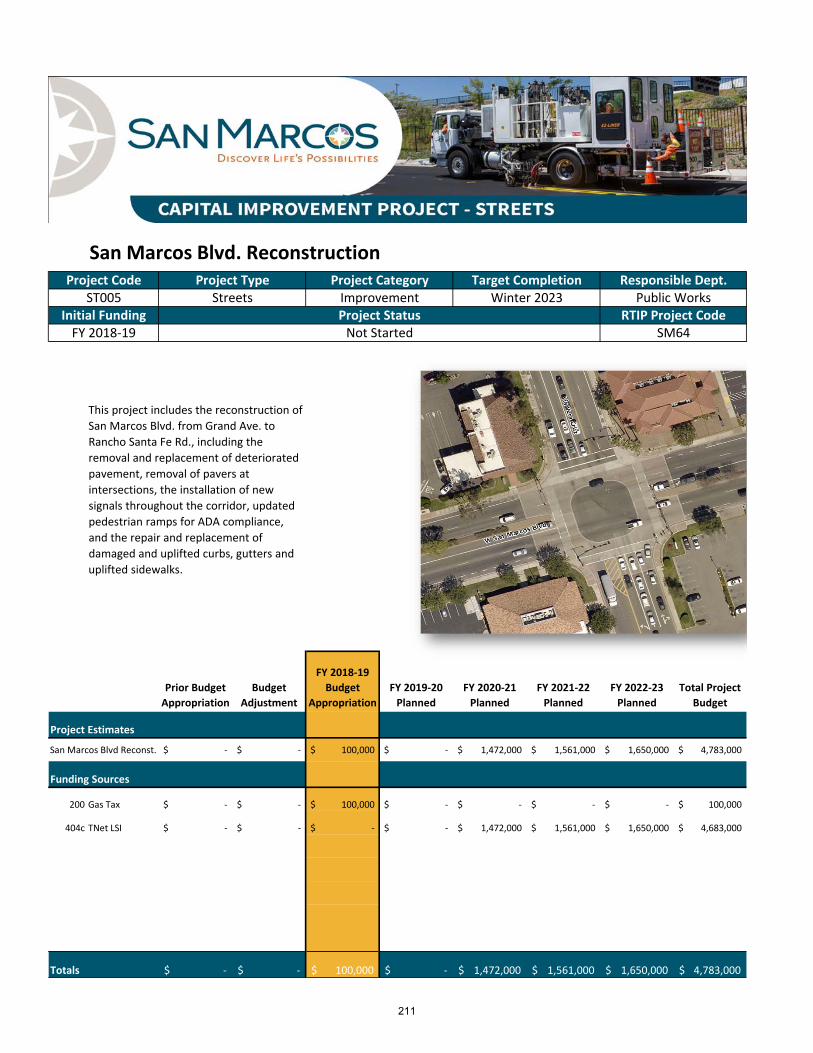
Title: San Marcos Blvd. Reconstruction
Prior Budget
Appropriation
Budget
Adjustment
FY 2018‐19
Budget
Appropriation
FY 2019‐20
Planned
FY 2020‐21
Planned
FY 2021‐22
Planned
FY 2022‐23
Planned
Total Project
Budget
Project Estimates
San Marcos Blvd Reconst. ‐$ ‐$ 100,000$ ‐$ 1,472,000$ 1,561,000$ 1,650,000$ 4,783,000$
Funding Sources
200 Gas Tax ‐$ ‐$ 100,000$ ‐$ ‐$ ‐$ ‐$ 100,000$
404c TNet LSI ‐$ ‐$ ‐$ ‐$ 1,472,000$ 1,561,000$ 1,650,000$ 4,683,000$
‐$ ‐$ ‐$ ‐$
‐$ ‐$ ‐$ ‐$ ‐$ ‐$ ‐$ ‐$
‐$ ‐$ ‐$ ‐$ ‐$ ‐$ ‐$ ‐$
‐$ ‐$ ‐$ ‐$ ‐$ ‐$ ‐$ ‐$
‐$ ‐$ ‐$ ‐$ ‐$ ‐$ ‐$ ‐$
‐$ ‐$ 100,000$ ‐$ 1,472,000$ 1,561,000$ 1,650,000$ 4,783,000$
FY 2018‐19 Not Started SM64
This project includes the reconstruction of
San Marcos Blvd. from Grand Ave. to
Rancho Santa Fe Rd., including the
removal and replacement of deteriorated
pavement, removal of pavers at
intersections, the installation of new
signals throughout the corridor, updated
pedestrian ramps for ADA compliance,
and the repair and replacement of
damaged and uplifted curbs, gutters and
uplifted sidewalks.
Totals
Initial Funding Project Status RTIP Project Code
Project Code Project Type Project Category Target Completion Responsible Dept.ST005 Streets Improvement Winter 2023 Public Works
211

Title: San Marcos Blvd. Slope Stabilization
Prior Budget
Appropriation
Budget
Adjustment
FY 2018‐19
Budget
Appropriation
FY 2019‐20
Planned
FY 2020‐21
Planned
FY 2021‐22
Planned
FY 2022‐23
Planned
Total Project
Budget
Project Estimates
San Marcos Blvd. Slope ‐$ ‐$ 1,516,666$ ‐$ ‐$ ‐$ ‐$ 1,516,666$
Funding Sources
219 RMRA Funds ‐$ ‐$ 1,516,666$ ‐$ ‐$ ‐$ ‐$ 1,516,666$
‐$ ‐$ ‐$ ‐$ ‐$ ‐$ ‐$ ‐$
‐$ ‐$ ‐$ ‐$ ‐$ ‐$ ‐$ ‐$
‐$ ‐$ ‐$ ‐$ ‐$ ‐$ ‐$ ‐$
‐$ ‐$ ‐$ ‐$ ‐$ ‐$ ‐$ ‐$
‐$ ‐$ ‐$ ‐$ ‐$ ‐$ ‐$ ‐$
‐$ ‐$ ‐$ ‐$ ‐$ ‐$ ‐$ ‐$
‐$ ‐$ 1,516,666$ ‐$ ‐$ ‐$ ‐$ 1,516,666$
FY 2018‐19 Not Started SM65
This project involves the remediation of a
slope supporting eastbound West San
Marcos Boulevard from Cascade to
Viewpoint Drive. The slope has receded
which resulted in separations between
the curb/sidewalk and the roadway.
Totals
Initial Funding Project Status RTIP Project Code
Project Code Project Type Project Category Target Completion Responsible Dept.ST006 Streets Maintenance Summer 2019 Public Works
212
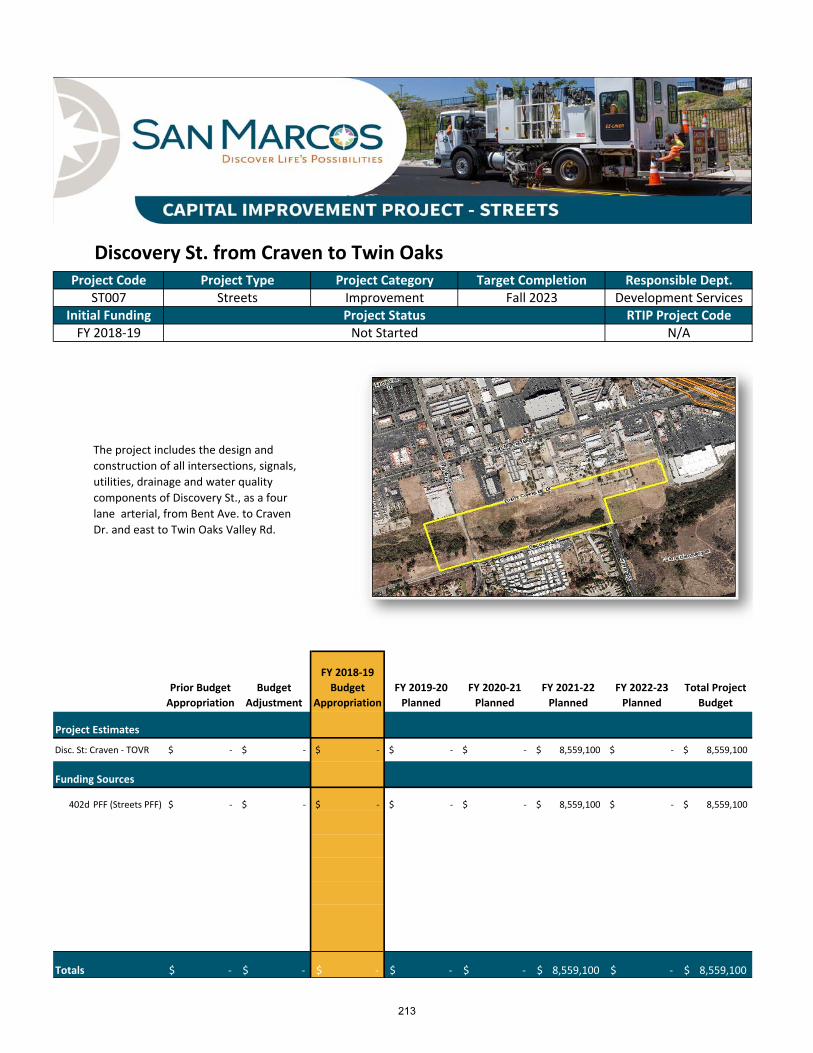
Title: Discovery St. from Craven to Twin Oaks
Prior Budget
Appropriation
Budget
Adjustment
FY 2018‐19
Budget
Appropriation
FY 2019‐20
Planned
FY 2020‐21
Planned
FY 2021‐22
Planned
FY 2022‐23
Planned
Total Project
Budget
Project Estimates
Disc. St: Craven ‐ TOVR ‐$ ‐$ ‐$ ‐$ ‐$ 8,559,100$ ‐$ 8,559,100$
Funding Sources
402d PFF (Streets PFF) ‐$ ‐$ ‐$ ‐$ ‐$ 8,559,100$ ‐$ 8,559,100$
‐$ ‐$ ‐$ ‐$ ‐$ ‐$ ‐$ ‐$
‐$ ‐$ ‐$ ‐$ ‐$ ‐$ ‐$ ‐$
‐$ ‐$ ‐$ ‐$ ‐$ ‐$ ‐$ ‐$
‐$ ‐$ ‐$ ‐$ ‐$ ‐$ ‐$ ‐$
‐$ ‐$ ‐$ ‐$ ‐$ ‐$ ‐$ ‐$
‐$ ‐$ ‐$ ‐$ ‐$ ‐$ ‐$ ‐$
‐$ ‐$ ‐$ ‐$ ‐$ 8,559,100$ ‐$ 8,559,100$
Initial Funding Project Status RTIP Project Code
Project Code Project Type Project Category Target Completion Responsible Dept.ST007 Streets Improvement Fall 2023 Development Services
FY 2018‐19 Not Started N/A
The project includes the design and
construction of all intersections, signals,
utilities, drainage and water quality
components of Discovery St., as a four
lane arterial, from Bent Ave. to Craven
Dr. and east to Twin Oaks Valley Rd.
Totals
213
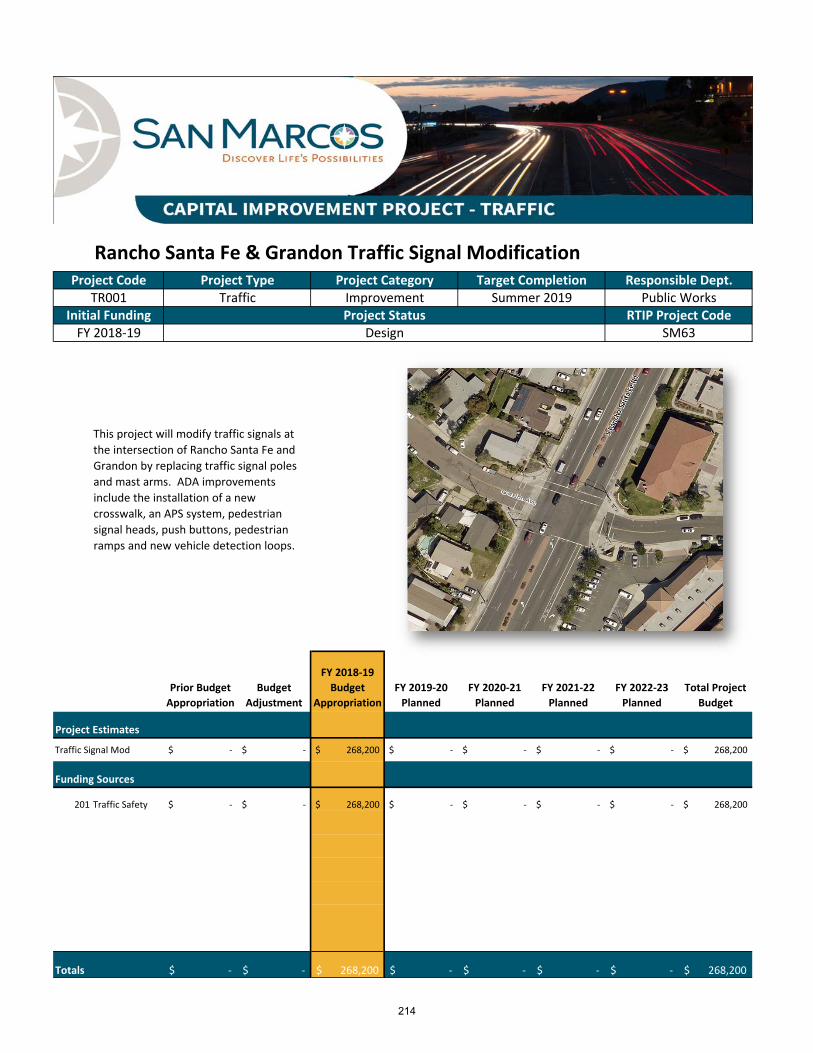
Title: Rancho Santa Fe & Grandon Traffic Signal Modification
Prior Budget
Appropriation
Budget
Adjustment
FY 2018‐19
Budget
Appropriation
FY 2019‐20
Planned
FY 2020‐21
Planned
FY 2021‐22
Planned
FY 2022‐23
Planned
Total Project
Budget
Project Estimates
Traffic Signal Mod ‐$ ‐$ 268,200$ ‐$ ‐$ ‐$ ‐$ 268,200$
Funding Sources
201 Traffic Safety ‐$ ‐$ 268,200$ ‐$ ‐$ ‐$ ‐$ 268,200$
‐$ ‐$ ‐$ ‐$ ‐$ ‐$ ‐$ ‐$
‐$ ‐$ ‐$ ‐$ ‐$ ‐$ ‐$ ‐$
‐$ ‐$ ‐$ ‐$ ‐$ ‐$ ‐$ ‐$
‐$ ‐$ ‐$ ‐$ ‐$ ‐$ ‐$ ‐$
‐$ ‐$ ‐$ ‐$ ‐$ ‐$ ‐$ ‐$
‐$ ‐$ ‐$ ‐$ ‐$ ‐$ ‐$ ‐$
‐$ ‐$ 268,200$ ‐$ ‐$ ‐$ ‐$ 268,200$
Initial Funding Project Status RTIP Project Code
Project Code Project Type Project Category Target Completion Responsible Dept.TR001 Traffic Improvement Summer 2019 Public Works
FY 2018‐19 Design SM63
This project will modify traffic signals at
the intersection of Rancho Santa Fe and
Grandon by replacing traffic signal poles
and mast arms. ADA improvements
include the installation of a new
crosswalk, an APS system, pedestrian
signal heads, push buttons, pedestrian
ramps and new vehicle detection loops.
Totals
214
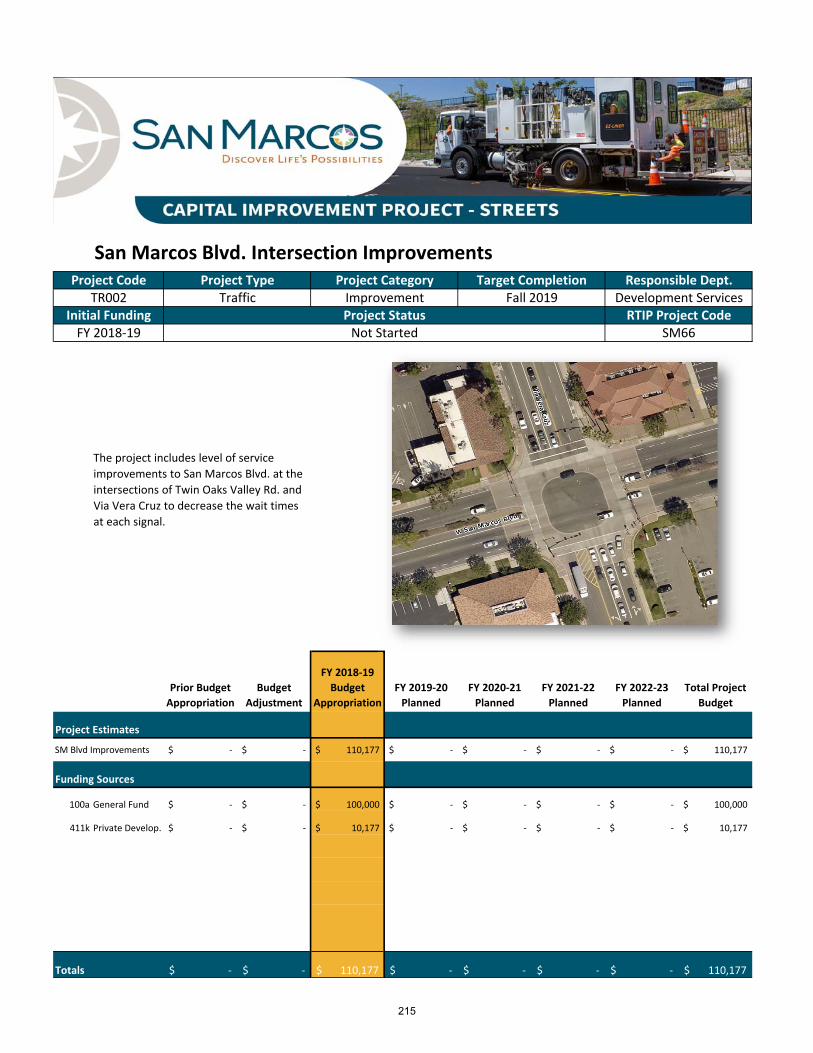
Title: San Marcos Blvd. Intersection Improvements
Prior Budget
Appropriation
Budget
Adjustment
FY 2018‐19
Budget
Appropriation
FY 2019‐20
Planned
FY 2020‐21
Planned
FY 2021‐22
Planned
FY 2022‐23
Planned
Total Project
Budget
Project Estimates
SM Blvd Improvements ‐$ ‐$ 110,177$ ‐$ ‐$ ‐$ ‐$ 110,177$
Funding Sources
100a General Fund ‐$ ‐$ 100,000$ ‐$ ‐$ ‐$ ‐$ 100,000$
411k Private Develop. ‐$ ‐$ 10,177$ ‐$ ‐$ ‐$ ‐$ 10,177$
‐$ ‐$ ‐$ ‐$ ‐$ ‐$ ‐$ ‐$
‐$ ‐$ ‐$ ‐$ ‐$ ‐$ ‐$ ‐$
‐$ ‐$ ‐$ ‐$ ‐$ ‐$ ‐$ ‐$
‐$ ‐$ ‐$ ‐$ ‐$ ‐$ ‐$ ‐$
‐$ ‐$ ‐$ ‐$ ‐$ ‐$ ‐$ ‐$
‐$ ‐$ 110,177$ ‐$ ‐$ ‐$ ‐$ 110,177$
FY 2018‐19 Not Started SM66
The project includes level of service
improvements to San Marcos Blvd. at the
intersections of Twin Oaks Valley Rd. and
Via Vera Cruz to decrease the wait times
at each signal.
Totals
Initial Funding Project Status RTIP Project Code
Project Code Project Type Project Category Target Completion Responsible Dept.TR002 Traffic Improvement Fall 2019 Development Services
215

Title: Traffic Signal Controller Replacements
Prior Budget
Appropriation
Budget
Adjustment
FY 2018‐19
Budget
Appropriation
FY 2019‐20
Planned
FY 2020‐21
Planned
FY 2021‐22
Planned
FY 2022‐23
Planned
Total Project
Budget
Project Estimates
Traffic Signal Controller 150,000$ ‐$ 150,000$ ‐$ ‐$ ‐$ ‐$ 300,000$
Funding Sources
201 Traffic Safety ‐$ 150,000$ 300,000$ ‐$ ‐$ ‐$ ‐$ 300,000$
604 Infrastructure R& 150,000$ (150,000)$ (150,000)$ ‐$ ‐$ ‐$ ‐$ ‐$
‐$ ‐$ ‐$ ‐$ ‐$ ‐$ ‐$ ‐$
‐$ ‐$ ‐$ ‐$ ‐$ ‐$ ‐$ ‐$
‐$ ‐$ ‐$ ‐$ ‐$ ‐$ ‐$ ‐$
‐$ ‐$ ‐$ ‐$ ‐$ ‐$ ‐$ ‐$
‐$ ‐$ ‐$ ‐$ ‐$ ‐$ ‐$ ‐$
150,000$ ‐$ 150,000$ ‐$ ‐$ ‐$ ‐$ 300,000$
Initial Funding Project Status RTIP Project Code
Project Code Project Type Project Category Target Completion Responsible Dept.TR003 Streets Improvement Spring 2019 Public Works
FY 2018‐19 Design N/A
This project replaces aging traffic signal
controllers at various intersections
citywide.
Totals
216