Embed Size (px)
Citation preview
1 City of Santa Rosa Beretta Dairy Credit Proposal
June 5, 2012
City of Santa Rosa Offset Credit Proposal
for Beretta Dairy BMPs
Credit Proposal Summary
Selected Project:
Installation of three agricultural best management practices (BMPs) at an existing Laguna dairy
operation.
Discharge Location in the Laguna:
Roseland Creek discharging into the Laguna approximately 1.1 miles downstream of the Todd Road
crossing.
Credit Generating Practices:
BMP #1: Manure stacking pad installation and buffer
BMP #2: Heavy use area buffer, fencing and cattle crossing upgrades
BMP #3: Relocation of heavy use loafing pen
Margin of Safety Factors:
Edge-of-field calculated loads discounted for overland delivery to the stream
Bioavailability of total nitrogen (TN) and total phosphorus (TP) in manure compared to
wastewater treatment plant (WWTP) effluent
Calculated Credits and Credit Life for Proposed BMPs:
Proposed
Crediting Option BMP Elements
Annual Credits
(lbs TP+TN/yr)
Proposed BMP
Eligibility Period
BMP #1 Manure
Stacking Pad and
Buffer
Concrete Stacking
Pad 1,194 Long-term (20 years)
Buffer
300
Long-term (20 years)
BMP #2
Heavy Use Area
Upgrades
Fencing and
Cattle Crossing 201 Short-term (2.5 years)
Buffer 84 Long-term (20 years)
BMP #3 Relocate
Heavy Use Area
Relocation of use
area to interior
field
1,119 Long-term (20 years)

2 City of Santa Rosa Beretta Dairy Credit Proposal
June 5, 2012
Beretta Dairy Project Synopsis:
An examination of the Beretta Dairy by Kieser & Associates, LLC (K&A) on behalf of the City of Santa
Rosa in November and December 2011 identified potential nutrient offset credit options through
voluntary installation of new practices at this operation. The dairy site is located along Roseland Creek
(lat: 38°23’27.15”N, long: 122°46’21.42”W) which discharges to the Laguna de Santa Rosa (Laguna).
New practices will result in a reduction of nutrients (total phosphorus and total nitrogen) that can reach
the Laguna. The City desires to implement these voluntary practices at the Beretta Dairy to offset
annual WWTP discharges to the Laguna. The dairy owner is willing to install these practices under an
agreement with the City if the Executive Officer of the Regional Board approves this proposal.
Implemented land management practices are considered eligible for generating nutrient reduction
offsets according to Resolution No. R1-2008-0061 (Resolution) and this proposal is submitted for
Regional Water Board consideration pursuant to the terms of the Resolution. When offsets are
described as pounds of phosphorus and nitrogen reduced per year from land management practices,
they are referred to herein as credits. Credit life (i.e., number of years credit would accrue to the City)
will depend on the time until these practices are required of the land owner to meet a regulatory
requirement or the termination of the agreement with landowner to implement the measure,
whichever occurs first. Final crediting calculations are being provided with this proposal in a separate
MS Office Excel spreadsheet format. Relevant information on BMP verification and annual reporting are
also are included in this formal proposal. The City, working with the Sotoyome RCD, is submitting this
formal crediting proposal to the Executive Officer of the Regional Board using site-specific design details
provided by a local agricultural engineer, and TN and TP soil test results for the project site. This
submission also follows a verbal request from Mr. David Leland of the Regional Board based on their
review of an initial concept proposal for the Beretta Dairy. BMP installation will occur in 2012 pending
Executive Officer approval of this formal proposal. Following such approval, the City will finalize
contracting arrangements with the dairy owner.
This document is submitted to the RWQCB with the permission of the dairy owner, Mr. Doug Beretta. It
contains the required information associated with the Resolution.

3 City of Santa Rosa Beretta Dairy Credit Proposal
June 5, 2012
Introduction
This document describes the Beretta Dairy Nutrient Offset Project (Project) and is intended for
consideration by the North Coast Regional Water Quality Control Board (RWQCB or Board) as a basis for
Project approval under the Santa Rosa Nutrient Offset Program adopted by the Board with Resolution
R1-2008-0061 (Resolution). This proposal is organized according to the Nutrient Offset Program
information requirements identified in Attachment 1 to Resolution R1-2008-0061. The Resolution
approving the Santa Rosa Nutrient Offset Program and the new dairy General Waste Discharge
Requirement (GWDR) Order No. R1-2012-003 and Waiver Order No. R1-2012-0002 from the RWQCB
generally define conditions for credit-generating BMP project eligibility and credit life. This formal
proposal complies with those conditions and relies on previous discussions with the RWQCB regarding
voluntary dairy inspections by Tetra Tech, Inc. on behalf of the RWQCB. It was agreed in a series of
meeting discussions between the Regional Board and the City of Santa Rosa that these inspections could
serve as a baseline for dairy credit generation. It is on this basis that several BMP eligibility assumptions
are made in this section of the credit proposal.
Relevant information is provided in the following sections of this City of Santa Rosa offset project
proposal:
Project location
Description of N & P practices
Quantity of N and P Removed/Expected Life of Crediting Practices
Monitoring and Reporting Plan
Description of Anticipated CEQA Documentation
Project Location
The Beretta Dairy is located along Roseland Creek (lat: 38°23’27.15”N, long: 122°46’21.42”W) which
discharges to the Laguna approximately 1.1 miles downstream of the Todd Road crossing. This area is
upstream of Mark West Creek where the City periodically discharges treated wastewater from their
Delta Pond in winter when storage capacity is exceeded in wet years.
Description of N & P Practices
This section provides a brief description of the Beretta Dairy and relevant attributes of this working
operation as they apply to BMP eligibility for crediting in the context of the Dairy Waiver program.
Proposed BMPs are introduced in the context of credit practice life considering waiver requirements and
expected life of practices. Additional BMP details, credit calculations and proposed credit life are
introduced in the next section of this proposal entitled, “Quantity of N and P Removed/Expected Life of
Crediting Practices”.

4 City of Santa Rosa Beretta Dairy Credit Proposal
June 5, 2012
Crediting Project Considerations under Dairy Waivers
Three separate BMP project options for offsets are being proposed by the City at the Beretta Dairy. The
Beretta Dairy runs approximately 450 head and is expected to qualify for the Dairy Waiver. The
considerations below explain how these three BMPs would qualify as offsets in respect to the Dairy
Waiver regulations.
Applicable Resolution Language
For potential offset crediting projects at dairies, the City recognizes that the approved Nutrient Offset
Program under the Resolution, “prohibits the City from continuing to receive nutrient reduction credits
for a project that later becomes subject to additional regulatory controls imposed by the Regional Water
Board” (finding 7, page 2). This would apply to practices at Beretta Dairy that would ultimately be
required as part of a Waiver.
Applicable Waiver Language
Item 38 of the Waiver (Order No. R1-2012-0003) under the Enrollment Process states that, “The
Regional Water Board may give special TMDL nutrient offset dairy projects an alternative schedule for
enrollment and submittal of associated documents for a maximum of two years past the due dates in
this Order…Also, these projects must be of long-term water quality benefit to the watershed”.
Assessment of dairy project eligibility and credit life is therefore determined by which practices are
required to comply with the Waiver and consideration of when the dairy becomes formally enrolled.
This eligibility and credit life approach was presented to the RWQCB staff on February 22, 2012, and
subsequent to this presentation, David Leland of the RWQCB validated that this approach is consistent
with the Resolution. As such, the City is proposing for RWQCB consideration and approval nutrient
reduction BMP projects for crediting that meet at least one of the following three conditions:
1. BMPs that bring the dairy into compliance with the Waiver application which are minimally
eligible to generate credits until the end of the extended enrollment period;
2. BMPs that might otherwise be retired after the extended enrollment period (as in condition 1)
except would be eligible for additional credit life where they provide long-term water quality
benefit to the watershed; and,
3. BMPs that exceed the level of implementation required in the Waiver which supply credits
during and after the extended enrollment period.
Applicable Consideration for Voluntary Dairy Site Assessments
Site-specific decisions regarding BMP eligibility and credit life shall be based on the “Voluntary
Assessment Report” (VAR) authored by Tetra Tech, Inc. following their voluntary dairy assessments.
This approach is based on discussions with the RWQCB staff in a meeting held on October 31, 2011.
Attendees at this meeting included representatives from the North Coast RWQCB, the U. S.
Environmental Protection Agency (EPA) and the City of Santa Rosa (City). This group generally agreed

5 City of Santa Rosa Beretta Dairy Credit Proposal
June 5, 2012
with the RWQCB’s suggestion to use the voluntary Tetra Tech, Inc. dairy site assessments for these
decisions (where such assessments had been completed). The site assessments inform a Board
determination of the BMPs necessary for compliance in GWDR or Waiver Orders. The assessment
recommendations inform the dairy producer which BMPs would improve the operation and enhance
compliance opportunities.
Site-specific BMP recommendations from a Tetra Tech, Inc. assessment (performed on behalf of the
RWQCB) were included in a VAR provided to the Beretta Dairy. Relevant voluntary site assessment
recommendations quoted directly from the voluntary site assessment report are:
1. Continue working with the NRCS to develop the facility’s CNMP. The CNMP should
describe land application practices implemented at Beretta Dairy and include
protocols for land application and associated records that ensure the manure
application rates that are reasonable for the crop, soil, climate, special local
situations, management system, and type of manure. The CNMP should verify that
liquid manure is applied at rates that do not result in surface runoff and minimize
percolation to ground water. Such documentation will demonstrate compliance
with Title 27 requirements, which will apply to dairies under all three of the dairy
program permit types. The draft dairy permits were distributed for public review on
October 24, 2011. A recommendation for this dairy to apply for a particular permit
type will be given after the permits are finalized.
2. Ensure that the clean water diversion northwest of Pond 3 is closed, scraped and
reseeded each year prior to the wet weather season to prevent storm water from
coming into contact with manure. The dairy should consider additional best
management practices in and around this clean water diversion such as permanent
fencing or belowground pipe to convey the diversion underneath this heavy use
area or provide photo-documentation that additional best management practices
are not needed in this area.
3. Ensure that manure piled adjacent to ponds is land applied, covered, or moved to a
contained area prior to the wet season. The operator may consider other best
management practices to ensure that runoff does not transport piled manure away
from the production area.
Key BMP interpretations arise from these VAR recommendations for proposed offset projects at Beretta
Dairy. First, the CNMP is listed in site assessment recommendations but is not a requirement of the
Waiver program. Instead, the Waiver language lists CNMPs as a recommendation of the Waiver
program. (CNMPs are, however, required in the GWDR program.) As noted by Doug Beretta prior to
receiving the VAR, his dairy is developing a CNMP with NRCS technical assistance. (Noted here is that
the CNMP may include suggestions suitable for additional crediting opportunities beyond the three
proposed herein.)

6 City of Santa Rosa Beretta Dairy Credit Proposal
June 5, 2012
The second key interpretation is the intent of the use of the words “ensure”, “should” and “may” in the
VAR. The word “ensure” is interpreted to be a mandatory condition (i.e., a technology/practice
requirement) necessary to comply with eligibility requirements of the Waiver (and thus, a limited credit
life). In contrast, the use of the words “should” or “may” in front of recommendations indicates a level
of effort that exceeds the minimum eligibility requirements to obtain a Waiver (thereby inferring long-
term credit life eligibility).
Proposed Credit Eligibility and Credit Life Considerations
Based on these two key interpretations, the City is proposing application of these eligibility and credit
life considerations for the three proposed Beretta Dairy BMPs as outlined in Table 1.
Table 1. Proposed eligibility and credit life considerations for Beretta Dairy Offset Credit BMPs.
Proposed
Crediting
Option
BMP
Elements
Recommended
in VAR
VAR Language for
BMP Exceeds
Current
Requirements
Proposed
BMP
Eligibility
Period “Ensure”
“Should”
or “May”
BMP #1
Manure
Stacking Pad
and Buffer
Concrete
Stacking Pad No No Yes Yes Long-term
Buffer Yes No Yes Yes Long-term
BMP #2
Heavy Use
Area
Upgrades
Fencing &
Cattle
Crossing
Yes Yes No No Short-term
Buffer Yes No Yes Yes Long-term
BMP #3
Relocate
Heavy Use
Area
Relocation of
use area to
interior field
No No No Yes Long-term
K&A observations and evaluation at the Beretta Dairy yielded three opportunities for new BMPs at the
dairy that could generate nutrient offset credits under these considerations. Runoff from the Beretta
Dairy ultimately reaches Roseland Creek discharging into the Laguna. The credit generating practices for
this site include:
BMP #1: Manure stacking pad installation and buffer
BMP #2: Heavy use area buffer, fencing and cattle crossing upgrades
BMP #3: Relocation of heavy use loafing pen
Figure 1 is an aerial view of all three option locations.

7 City of Santa Rosa Beretta Dairy Credit Proposal
June 5, 2012
Figure 1. Location of the three options for installation of new BMPs to generate nutrient offset
credits.
Quantity of N and P Removed/Expected Life of Crediting Practices
The three proposed crediting options and associated credit calculations are presented in this section.
Calculations also include expected life of credit forecast in the previous section (as related to Dairy
Waiver conditions, the life of practice, facility life or the owner’s maintenance commitment with the
City). The reduction of TP and TN is dependent on the source (manure rate and timing) being controlled
and the BMP type. The separately submitted MS Office Excel spreadsheet presents a summary of the
credit calculations examined for dairy applications in the context of stipulations in the Resolution. It
highlights the various applications considered for the Beretta Dairy using credit calculations approved by
the Commonwealth of Pennsylvania for their approved Water Quality Trading program. Because of the
complexity of various site-specific conditions and a lack of readily applicable and published BMP load
calculations and/or efficiency factors for dairies, the state-approved credit calculator with relatively
direct applicability was used here. These calculations are commonly referred to as the, “Pennsylvania
Credit Calculator” for nitrogen1 and phosphorus2 associated with animal operations. These calculations
1 Pennsylvania Department of Environmental Protection, 2007. Nitrogen Credit Calculation Form, Effective
December 4, 2007. Available at: http://www.dep.state.pa.us/river/nutrienttrading/calculations/index.htm.

8 City of Santa Rosa Beretta Dairy Credit Proposal
June 5, 2012
were previously introduced to and discussed with the Regional Board over a series of meetings leading
up to this proposal. It is anticipated by the City of Santa Rosa that additional and specific discussions
regarding these calculations may be necessary for crediting proposal approval.
BMP #1 — Concrete Manure Stacking Pad
This BMP involves installation of a large manure stacking pad to capture runoff and leachate generated
when solids are dewatered after they are removed from the main lagoon that serves a large free stall
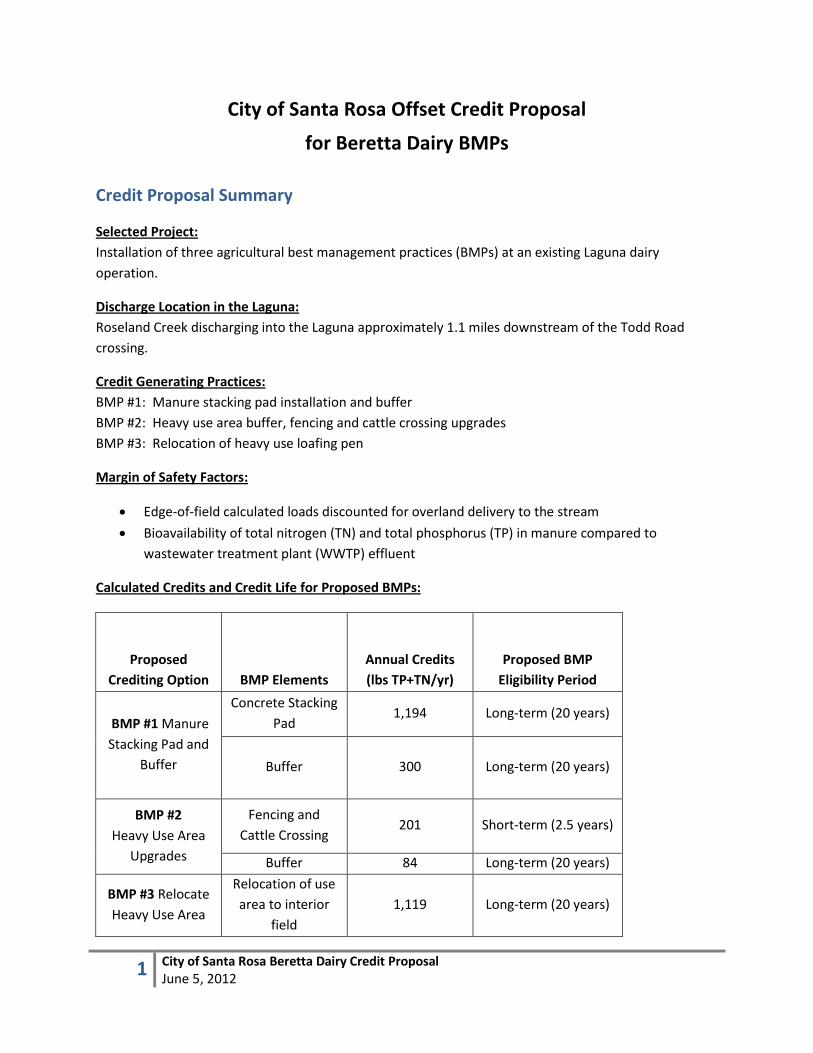
barn. Figure 2 is an aerial view of the free stall barn (A) and the adjacent manure lagoon (B). Currently,
the operation empties the lagoon by agitating the waste and pumping off the liquid portion. The
remaining solids are stacked next to the lagoon to allow for additional dewatering at point (C). Later the
solids are hauled off for land application. The proposed option will add a manure stacking pad that
captures and redirects all leachate and precipitation in contact with the waste back into the lagoon in
this same area. Prior to the wet season, the stacking pad will be cleaned off and allowed to drain clean
water into the water conveyance (D – blue line) which will be protected by a fenced/grass buffer (E).
The grass buffer will utilize occasional flash grazing management techniques in order to maintain a
robust, healthy vegetative stand. If a more strategically placed stacking pad can be constructed on the
south side of the lagoon (B) on existing concrete
surfaces already draining to the lagoon, alternative
designs will be discussed with the Regional Board before
final installation as appropriate. This alternative
location on the opposite side of the lagoon is more
distant from water conveyances which could
additionally reduce potential nutrient runoff from
reaching the Laguna, improve manure management and
better serve operational needs of the dairy. Final
engineering assessment and design is pending Executive
Officer approval of this crediting proposal.
Figure 2. Current manure dewatering site for a larger
manure lagoon serving the free stall milking cow barn.
[Manure from a free stall barn (A) is placed in a manure
lagoon (B). The method to empty the lagoon includes
drawing off the liquids then placing the remaining wet
solids next to the lagoon to dewater (C). The project
proposal is to install a manure stacking pad to redirect
all leachate and precipitation in contact with waste back
into the lagoon.] (Photo Credit: Bing Maps)
2 Pennsylvania Department of Environmental Protection, 2008. Draft Phosphorus and Sediment Credit Calculation
Form, Effective January 30, 2008. Available at: http://www.dep.state.pa.us/river/nutrienttrading/calculations/index.htm.

9 City of Santa Rosa Beretta Dairy Credit Proposal
June 5, 2012
BMP #1 Credit Calculations
The Pennsylvania credit calculation for pastures was adapted for heavy use areas. The method
calculates the before (current condition) and after (BMP installed) TP and TN loading of particulate and
dissolved nutrient fractions. Pennsylvania estimation of fertilizer and manure applied to the soils uses
typical operational practices and rates.
Site-specific credit calculations consider:
Area served
Pond solids dewatered during dry season
Solids scraped and hauled away for land applied before wet season
Soil erosion rate calculated by RUSLE
Enriched soil nutrient content from manure and leachate deposits
To account for appropriate considerations for a Margin of Safety, the following discount factors were
applied to preliminary credit calculations (as percent remaining nutrients reaching Roseland Creek):
Concrete Stacking pad:
o Edge-of-field factor = 49.5% (calculated at 30 feet)
o Bioavailability Factors:
TP = 94.5 %
TN = 85%
Buffer:
o Edge-of-field factor = 49.5% (calculated at 30 feet)
o Bioavailability Factors:
TP = 94.5 %
TN = 85%
In addition, several conservative factors are introduced by the soil nutrient test method applied to this
BMP. The first conservative factor is that the credit calculator requires a manure nutrient input for
estimation of applied manure availability. For this BMP, the nutrient concentrations used in the
calculation were based instead on soil nutrient concentrations. Using the soil test results in place of the
manure test results is conservative because the nutrient concentrations are further diluted by inert soil
particles. The second conservative factor is the timing of soil sample collection. The samples were
collected from the site on April 19, 2012. By this date the wet season was almost over after several
months of rain. The rains and resulting runoff during the season most likely reduced the nutrient
concentration in the soil when compared to concentrations present in the fall, prior to the wet season.
Both of these factors combine to create a conservative approach in calculating credits for this site.
Table 2 provides a summary of the proposed TP and TN annual credits for the actions associated with
BMP site #1. A minimum credit life of 20 years is proposed for this BMP reflecting the expected life of

10 City of Santa Rosa Beretta Dairy Credit Proposal
June 5, 2012
an engineered concrete manure stacking pad, and long-term maintenance of the buffer under
agreement by the owner with the City.
Table 2. Proposed credits (combined pounds of TP + TN) calculated for BMP #1.
Proposed
Crediting
Option
BMP
Elements
Annual TP
Credits
in lbs/yr
(% of
combined
total)
Annual TN
Credits in
lbs/yr
(% of
combined
total)
Annual
Combined
Credits
(lbs TP+TN/yr)
Proposed BMP
Eligibility Period
BMP #1
Concrete
Stacking Pad
Concrete
Stacking Pad
184
(15.4%)
1,010
(84.6%) 1,194
Long-term
(20 years)
Buffer 7
(2.4%)
293
(97.6%) 300
Long-term
(20 years)
BMP #2 — Heavy Use Area Buffer and Cattle Crossing
This option adds a buffer and culvert cattle crossing for protection of a clean water diversion crossing a
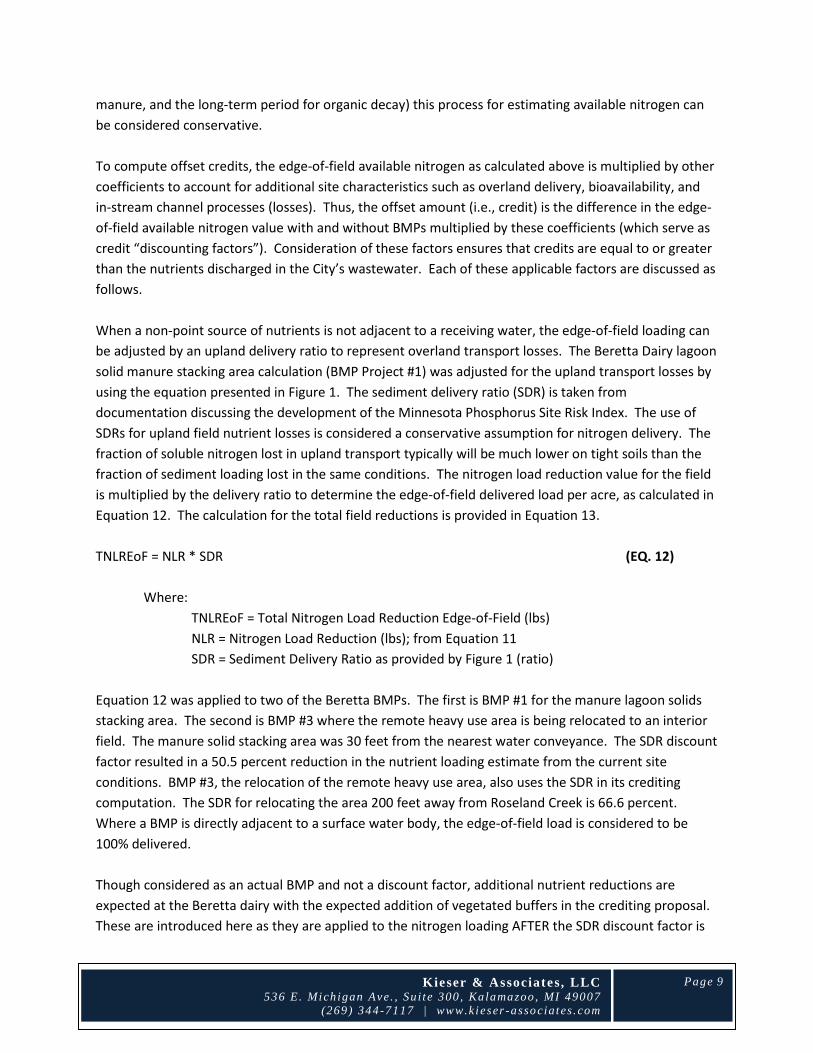
heavy use area. Currently, the heavy use area is used as a milk cow loafing and staging pen. Figure 3 is
an aerial view of the heavy use loafing pen. The BMP #2 location currently surrounds the BMP #1
stacking pad. Under current operations, cows are released to this area for about five hours after
milking. The cattle are staged in this pen while waiting to be released into grazing pastures.
Approximately 140 cows utilize this pen for approximately five hours per day. The loafing pen, outlined
in black in Figure 3, covers 3.1 acres.
The current dairy practices to protect water quality in the adjacent waterway are to scrape the heavy
use area prior to the wet season and remove cow access during the wet season. The practices are
identified in the VAR. The VAR also indicates the operator “should” consider additional practices such as
fencing or below ground pipe “or” provide photos which indicate these practices are not necessary. The
site enhancements proposed for offsets include the VAR recommendations of a fence and buried pipe as
a crossing. In addition, a well managed buffer is being implemented. This buffer exceeds the stated
considerations in the report. Figure 3 illustrates the installed fenced buffer (area outlined in red dotted
line) and cattle crossing (culvert in black, animal traffic in orange). The grass buffer will utilize occasional
flash grazing management techniques in order to maintain a robust, healthy vegetative stand. (The
proposed large manure stacking pad from BMP #1 is indicated as a white box inside the proposed
buffer.)

11 City of Santa Rosa Beretta Dairy Credit Proposal
June 5, 2012
Figure 3. A dairy heavy use milk cow loafing
area. (Photo Credit Google Earth, taken on
October 6, 2007)
BMP #2 Credit Calculations
The Pennsylvania credit calculation for pastures
was adapted for heavy use areas. The method
calculates the before (current condition) and
after (BMP installed) TP and TN loading of
particulate and dissolved nutrient fractions.
Pennsylvania estimation of fertilizer and
manure applied to the soils considers typical
operational practices and rates.
Site-specific credit calculations consider:
Manure deposited in heavy use area
Time of animals in the field
Days per year in typical dry season
Tons per acre of manure applied
Remnant manure after scraping
Nitrogen available for release from remnant manure
Soil erosion rates for heavy use area
Buffer treatment efficiency
To account for appropriate considerations for a Margin of Safety, the following discount factors were
applied to the credit calculations (as percent remaining nutrients reaching Roseland Creek):
Fencing and Cattle Crossing
o Edge-of-field factor: Before 100% ; After = 49.5% (calculated at 30 feet)
o Bioavailability Factors:
TP = 94.5 %
TN = 85%
Buffer:
o Edge-of-field factor = 49.5% (calculated at 30 feet)
o Bioavailability Factors:
TP = 94.5 %
TN = 85%
The conservative calculation factors applied to BMP #1 also apply to BMP #2. These conservative factors
include using soil nutrient concentrations in place of manure nutrient concentrations and lower nutrient

12 City of Santa Rosa Beretta Dairy Credit Proposal
June 5, 2012
concentrations collected from soils after the wet season. The credit calculation results are provided in
Table 3.
Table 3. Preliminary credits (combined pounds of TP + TP) calculated for BMP #2.
Proposed
Crediting
Option
BMP
Elements
Annual TP
Credits
in lbs/yr
(% of
combined
total)
Annual TN
Credits in
lbs/yr
(% of
combined
total)
Annual
Combined
Credits
(lbs TP+TN/yr)
Proposed BMP
Eligibility Period
BMP #2
Heavy Use
Area
Upgrades
Fencing and
Cattle
Crossing
86
(40.5%)
115
(59.5%) 201
Short-term
(2.5 years)
Buffer 34
(42.8%)
50
(57.2%) 84
Long-term
(20 years)
A credit life of 2.5 years is assumed for the fence and crossing because these appear in the VAR
prepared by Tetra Tech, Inc. As such, these would expire at that conclusion of the extend enrollment
period for the waiver. A life of 20 years is proposed for the buffer as it is above and beyond what is
required and will be maintained.
BMP #3 — Relocation of Heavy Use Loafing Pen
The proposed BMP will enhance and protect Roseland Creek by relocating a heavy use loafing pen to a
remote field. The heavy use area is a staging area for milk cows before being released into nearby
rotational grazing paddocks. The existing loafing pen is located adjacent to Roseland Creek and has a
creek bank length of approximately 1,900 feet. The heavy use area has a small setback to Roseland
Creek which acts as an unmaintained buffer. However, the area also is served by several cattle crossings
which are necessary to operate the rotational paddocks on the other side of Roseland Creek (see Figure
4). The cattle crossings allow concentrated runoff to reach the creek. This BMP relocates this heavy use
area to an interior field and converts the heavy use area to rotational grazing paddocks.
The water quality benefits are associated with two significant factors. The first factor is moving the site
to a remote location thus reducing the edge-of-field delivery ratio. This ratio can be reduced because of
the greater upland attenuation of nutrients that occurs as the distance from surface water increases.
The second factor is the conversion of land use from denuded soils for the majority of the year to
rotational paddocks, which remain in perennial vegetation and act as a permanent buffer. The
operation runs approximately 140 cows loafing in this heavy use area for five hours a day for 198 days in
a typical year. Current nutrient management practices at the site include the existing buffer, scraping
the pen prior to the wet season (collected manure enriched soils are land applied) and limiting cow
access during the wet season.

13 City of Santa Rosa Beretta Dairy Credit Proposal
June 5, 2012
Figure 4. Relocation of heavy use
area. (Area A outlined in red is
currently used to stage cows prior to
release into rotational grazing
paddocks located both across
Roseland Creek and in adjacent fields
to the east. This BMP will relocate
the heavy use activities into an
equivalent area in field B. Area A will
be converted into rotational grazing
paddocks with limited cattle travel
lanes. Currently, cows utilize this
pen from April 1 to October 15 of
every year. The loafing area is 6.2
acres and has five pour points into
Roseland Creek.) (Photo Credit
Google Earth, taken on October 5,
2007.)
BMP #3 Credit Calculations
The Pennsylvania credit calculation
for pastures was adapted for heavy
use areas. The method calculates the before (current condition) and after (BMP installed) TP and TN
loading of particulate and dissolved nutrient fractions. The Pennsylvania estimation of fertilizer and
manure applied to the soils considers typical operational practices and rates. Site-specific credit
calculations consider:
Manure deposited in heavy use area
Time of animals in field per day
Days per year in typical dry season
Tons per acre of manure applied
Nitrogen available for release from remnant manure
Soil erosion rates for heavy use area considering disturbed soils
Buffer treatment efficiency
Distance new area is from Roseland Creek
To account for appropriate considerations for a Margin of Safety, the following discount factors were
applied to the credit calculations (as percent remaining nutrients reaching Roseland Creek):

14 City of Santa Rosa Beretta Dairy Credit Proposal
June 5, 2012
Relocation of use area to interior field
o Edge-of-field factor: Before = 100%, After = 33.4% (as calculated at 200 feet)
o Bioavailability factors
TP = 94.5 %
TN = 85%
The conservative calculation factors applied to BMP #1 also apply to BMP #2. These conservative factors
include using soil nutrient concentrations in place of manure nutrient concentrations and lower nutrient
concentrations collected from soils after the wet season.
Preliminary credits calculated for this BMP are provided in Table 4. A credit life of 20 years is proposed
based on an expected operation and maintenance agreement for this voluntary implementation action.
Table 4. Proposed credits (combined pounds of TP + TN) calculated for BMP #3.
Proposed
Crediting
Option
BMP
Elements
Annual TP
Credits
in lbs/yr
(% of
combined
total)
Annual TN
Credits in
lbs/yr
(% of
combined
total)
Annual
Combined
Credits
(lbs TP+TN/yr)
Proposed BMP
Eligibility Period
BMP #3
Relocate
Heavy Use
Area
Relocation
of use area
to interior
field
174
(15.5%)
945
(84.5%) 1,119
Long-term
(20 years)
Monitoring and Reporting Plans
This section outlines the proposed monitoring and reporting plan that the City proposes to implement if
this proposal is approved the Regional Board Executive Officer. Expected agreements between the
various parties that will be enlisted to ensure this plan is followed are also identified herein.
Monitoring and Reporting
The City will require all BMPs implemented for offset credits to be maintained to NRCS standards and/or
specific engineering designs to ensure nutrient reductions and water quality benefits continue
throughout the life of the contract period (either short-term or long-term). This will be accomplished
through annual site inspections to verify the proper operation and maintenance of each BMP. Similar to
other environmental trading programs in the nation, the following verification protocol is proposed:

15 City of Santa Rosa Beretta Dairy Credit Proposal
June 5, 2012
Annual site visit to inspect and confirm operation and maintenance of BMP prior to the
appropriate season of expected operation (as applicable).
o RCD or other authorized agent will visit the BMP site.
o Agent will inspect all components of the BMP and surrounding area to ensure proper
function /operation (using final engineering specifications).
o Agent will document BMP operation and maintenance through forms and photographs.
o Any deficiencies must be noted on the inspection documentation.
o All site inspection documentation must be submitted to the City within a set period
following inspection.
Deficiencies
o All deficiencies will be reported to the land owner immediately after the City receives
the inspection documentation.
o These must be appropriately corrected to previously specified conditions within 60 days
of discovery, or within 90 days if an alternative improvement is necessary to avoid
future failures. (The Regional Board will be notified of this latter condition where
applicable.)
o Temporary BMPs considered acceptable under the Waiver Order will be installed within
15 days of the City’s receipt of inspection documentation.
o Agent must complete a second site visit to verify all deficiencies have been corrected.
Verification letter stating the BMP passed the annual inspection will be included in the City’s
annual report to RWQCB.
Verification letters for all BMPs will be forwarded to the RWQCB as proof that offset credits are
being maintained.
Agreements for Implementation
The City anticipates entering into several agreements to fully implement, verify and monitor the
proposed BMP projects at the Beretta Dairy, once RWQCB approval is obtained. The City will rely on
written agreements for the following activities:
Project implementation oversight
Engineering
Construction
Long-term maintenance
Annual site inspections
The City will likely enter into an agreement with the Sotoyome RCD to oversee implementation of the
BMPs and provide annual BMP verification. For implementation, this will involve the RCD contracting
directly with an engineer to design the BMPs and a separate contractor for BMP construction. The City
will enter into a long-term agreement with the dairy operator/land owner, Mr. Doug Beretta, to
maintain the BMPs and ensure continued nutrient reductions and water quality benefits for the life of
the practice.

16 City of Santa Rosa Beretta Dairy Credit Proposal
June 5, 2012
Description of Anticipated CEQA Documentation
Final engineering design of the BMPs will provide further information on whether permits may be
necessary to implement the proposed projects. The Soyotome RCD anticipates no need for a permit
from the US Army Corps of Engineers or other California State Resource Agencies due to the location of
the project. A permit from the Sonoma County Permit and Resource Management Department or
Water Agency will depend on the final design (e.g., amount of excavation involved in BMP
implementation). The RCD will be responsible for obtaining all permits related to the BMP projects. If
permits are required, the RCD will submit a “mitigated negative declaration” as appropriate to ensure
proper practices are used for excavation and work within a waterway to assure no significant, negative
impact to the environment.
Section 15168(c)(2) of the CEQA Guidelines provides that “If the agency finds that pursuant to Section
15162, no new effects could occur or no new mitigation measures would be required, the agency can
approve the activity as being within the scope of the project covered by the program EIR, and no new
environmental document would be required.” The Discharge Compliance Project (DCP) EIR evaluated an
Enhanced Nutrient Removal (ENR) component at a program-level. The EIR Project Description for the
ENR component specifically includes manure management at up to eight dairies and agricultural land
management in the Laguna Watershed. The Beretta Dairy Nutrient Removal Project is entirely
consistent with the Project Description for the ENR component in the DCP EIR. Further, the City has
evaluated whether the Beretta Dairy Nutrient Removal Project would have new effects that are greater
than those identified in the DCP EIR and that, pursuant to Section 15162 of the CEQA Guidelines, would
be new significant impacts or significant impacts of a substantially more severe nature. The evaluation
found no new significant impacts or significant impacts of a substantially more severe nature beyond
those impacts already identified for the ENR component in the DCP EIR. And, therefore, the Berretta
Dairy Nutrient Removal Project is adequately evaluated by the program-level review in the DCP EIR, and
no subsequent environmental document is required.

Kieser & Associates, LLC
536 E. Mich igan Ave. , Su i t e 300 , Kalamazoo , MI 49007 (269) 344-7117 | www.k i eser -asso cia t es . com
Page 1
To: Lynn Small, Deputy Director Date: July 6, 2012 Environmental Compliance From: James A. Klang, PE, K&A cc: Dave Smith, Merritt Smith Mark S. Kieser, K&A RE: Beretta Dairy Summary of Best Management Practice Reduction Estimation Methods for
City of Santa Rosa Offset Credits This memorandum provides details of the City of Santa Rosa Nutrient Offset Program calculations used for estimating nitrogen and phosphorus credits from the Beretta Dairy site under current conditions and under a future condition with proposed Best Management Practices (BMPs). Tables and figures (found at the end of this memorandum) are provided for additional illustration and support of crediting approaches. Crediting methods were derived from the Pennsylvania Department of Environmental Protection (PA DEP) Chesapeake Bay Water Quality Trading Program1
. The following narrative presents the rationale for selecting this credit estimation method, a description of the calculations, and example credit computations for BMPs at the Beretta site. Computed credit values are consistent with the City of Santa Rosa Crediting Proposal for the Beretta Dairy BMPs dated June 5, 2012 (and submitted on June 6, 2012).
The City of Santa Rosa Nutrient Offset Program defines the term “offset” to be an equal or greater load reduction obtained from a remote location whereby the pound for pound exchange is adjusted to account for differences in bioavailability and introduced uncertainties. The term offset can be used interchangeably with the term “credit” (mass of nutrients reduced per year after accounting for bioavailability and uncertainty). Credits are generated by implementation of a Best Management Practice (BMP) that results in a nutrient load reduction to a water body. Selection of the Calculation Method The PA DEP nutrient credit calculation method was selected based on comparisons of alternative methods. In addition to the Pennsylvania method, the EPA Region V model and the USDA-NRCS Nutrient Tracking Tool (NTT) were examined. These latter two methods were removed from further consideration due to limitations in their applicability with characteristics found in the Laguna de Santa Rosa setting. The Region V model has limited applicability related to crediting soluble nutrient parameters and lacks manure nutrient management considerations. NTT has a high cost for regional calibration without which the local dairy BMP simulations cannot be adequately performed.
1 PA DEP. 2007, 2008. Nutrient and Phosphorus calculation spreadsheets. Accessed May 15, 2012; available at http://www.dep.state.pa.us/river/nutrienttrading/calculations/index.htm
MEMORANDUM Environmental Science and Engineering K IESER ASSOCIATES, LLC &

Kieser & Associates, LLC
536 E. Mich igan Ave. , Su i t e 300 , Kalamazoo , MI 49007 (269) 344-7117 | www.k i eser -asso cia t es . com
Page 2
The strengths of the PA DEP method include ease of use, load generation for soluble nutrient fraction load reduction estimates, and its application of best available science during development. The Pennsylvania nutrient calculations were developed by representatives of PA DEP, the Pennsylvania Environmental Council and the World Resources Institute. The equations were based on literature2, agronomy guides3
, and the professional judgment of researchers at Pennsylvania State University (Dr. Doug Beegle, Dr. Peter Kleinman, and Dr. Barry Evans). The calculations are performed on Microsoft Excel spreadsheets and are based on standard methods to determine non-point source runoff estimates. A description of the calculation process is provided as follows.
Calculation Description The crediting method developed by PA DEP involves conducting the calculations twice; once for present-day practices (before credit-generating BMPs are implemented) and a second time assuming new BMPs are installed. The difference in edge-of-field nutrient loading between the two scenarios provides the total load reduction value. Appropriate discount factors are then applied to calculate a final credit value eligible for offsetting City of Santa Rosa discharges.
Nitrogen fate and transport dynamics within the land and river environments are different than phosphorus dynamics. The nitrogen water quality cycle includes conversion of organic forms of nitrogen into inorganic form ammonium and then nitrification (conversion of ammonia to nitrite and nitrates). In some settings denitrification can also occur (conversion of nitrates into N2). Phosphorus forms remain as dissolved or sediment attached forms within both soil and water media. Because of these different interactions, the credit calculation equations for nitrogen reductions and phosphorus reductions are different. As such, the nitrogen equations focus on the total nitrogen (organic forms) and their eventual breakdown and conversion into ammonium, while the phosphorus equations focus on particulate phosphorus loss associated with soil erosion and the soluble fraction in runoff. The following text provides a brief background on nitrogen and phosphorus dynamics, which establishes the rationale for focusing on specific forms of each nutrient. Nitrogen is present in the environment in organic and inorganic forms4. Both organic and inorganic nitrogen can be present in dissolved forms as dissolved organic nitrogen (DON) and dissolved inorganic nitrogen (DIN)5
2 Evans, B.M., 2002. Development of an Automated GIS-Based Modeling Approach to Support Regional Watershed Assessments. Ph.D. dissertation in the Dept. of Crop and Soil Sciences, Penn State University, 231 pp.
. The DIN fraction includes the forms of nitrogen available for plant growth – nitrate and
Vadas et, al. Relating Soil Phosphorus to Dissolved Phosphorus in Runoff: A Single Extraction Coefficient for Water Quality Modeling. Published in J. Environ. Qual. 34:572–580 (2005). 3 Pennsylvania State Agronomy Guide, available at http://extension.psu.edu/agronomy-guide (as of July 5, 2012); Penn State Agricultural Analytical Services Laboratory (AASL) Handbook, http://www.aasl.psu.edu/ (as of July 5, 2012); USDA Plant-Crop Nutrient Tool, available at http://plants.usda.gov/npk/main (as of July 5, 2012) 4 Understanding Nitrogen in Soils, Mike O'Leary, George Rehm and Michael Schmitt WW-03770-GO Reviewed 1994 Available at: http://www.extension.umn.edu/distribution/cropsystems/dc3770.html; Accessed July 5, 2012 5 Wetzel, R. (2001). Limnology: Lake and River Ecosystems, Third ed. Academic Press, San Diego, CA.

Kieser & Associates, LLC
536 E. Mich igan Ave. , Su i t e 300 , Kalamazoo , MI 49007 (269) 344-7117 | www.k i eser -asso cia t es . com
Page 3
ammonium6. Organic nitrogen becomes bioavailable over time as the particulate form of organic nitrogen is converted into DIN. The organic forms can be delivered to surface waters as eroded soil7
. (See Attachment A of this memorandum for an additional discussion on bioavailability as applied to Santa Rosa credit proposals.)
When dealing with manure application on soils, total nitrogen testing focuses on Total Kjeldahl Nitrogen (TKN)8. This laboratory-measured nitrogen parameter is the sum of organic nitrogen and ammonium (NH4
+)9. Additional laboratory procedures can be used to determine the ammonium concentration, which then can be used to calculate the organic nitrogen component from the TKN value10
. The other forms of DIN – nitrite and nitrate –typically are present in smaller quantities in unsaturated soils, manure solids and/or biosolids. Therefore, the Beretta Dairy calculations can focus on TKN, which will release DIN components over time as organic matter decays.
Phosphorus is present in the environment in particulate attached and soluble forms11. Elemental phosphorus is extremely reactive and readily combines with oxygen when in contact with air to form phosphate12. Phosphate is a negatively charged ion and easily adsorbs to soil particles13. Therefore, substantial percentages of phosphorus are often attached to sediment, and eroded sediment can account for a large fraction of phosphorus loading to a water resource. Soluble phosphorus is released from sediments in increasing amounts when the soil content of phosphorus approaches the soil holding capacity14. In some settings, the soil holding capacity for phosphorus is approached or exceeded by the amount of phosphorus applied to a field and then soluble forms of runoff occur. The soluble fraction also can increase when inorganic and organically bound phosphorus has a weakened or broken ionic bond with the soil’s key ionic bonding minerals. Iron, aluminum, magnesium and calcium are the three minerals that bind phosphorus to the largest extent15. The three ionic bonds can be broken with exposure to anoxic conditions or changes in pH (e.g., when iron oxidizes in anaerobic conditions) (Sims et al., 1998)16, (Sharply et al., 1981)17, (Warwick et al., 2004)18
6 USDA ARS (1995). Fate and Transport of Nutrients: Nitrogen. Working Paper No. 7. Available at:
.
http://www.nrcs.usda.gov/wps/portal/nrcs/detail/national/technical/nra/rca/?&cid=nrcs143_014202. Accessed July 5, 2012 7 Id. 8 UC Davis (2010). California Analytical Methods Manual. Accessed July 3, 2012, available on line at: http://anlab.ucdavis.edu/docs/uc_analytical_methods.pdf 9 UC Davis, College of Agricultural and Environmental Sciences (2010). California Analytical Methods Manual. Available at http://anlab.ucdavis.edu/docs/uc_analytical_methods.pdf; Accessed July 5, 2012. 10 Id. 11 USDA ARS (1995). Fate and Transport of Nutrients: Phosphorus, Working Paper No. 8. Available at: http://www.nrcs.usda.gov/wps/portal/nrcs/detail/national/technical/nra/rca/?&cid=nrcs143_014203; Accessed July 5, 2012 12 Busman, L., J Lamb, G. Randall, G. Rehm, M. Schmitt, (2002) The Nature of Phosphorus in Soils. Available at: http://www.extension.umn.edu/distribution/cropsystems/dc6795.html; Accessed July 5, 2012 13 Id. 14 Id. 15 Id. 16 Sims, J.T., Simard, R.R., Joern, B.C. (1998). Phosphorus Loss in Agricultural Drainage: Historical Perspective and Current Research. J. Environ. Qual. 27:227-293 (1998)

Kieser & Associates, LLC
536 E. Mich igan Ave. , Su i t e 300 , Kalamazoo , MI 49007 (269) 344-7117 | www.k i eser -asso cia t es . com
Page 4
Beretta Project Applications - Nitrogen The credit equations used at the Beretta site require input values for:
• Current crop type (heavy use pad is comparable to a poor pasture stand) • Acreage • Soil type • Field condition (poor, fair and good regarding density of stand) • Hydraulic condition (Poor – greater than average rainfall runoff and less infiltration, Good – less
than average rainfall runoff and more infiltration) • RUSLE2 soil loss for one year period • NRCS Curve Number • Soil P test type • Soil phosphorus test result • Distance from the edge-of-field to the closest waterbody (feet) • Number of 2-year, 24-hour storm events in 1 year (as provided by CA Water Gov website at
ftp://ftp.water.ca.gov) • Manure applications
o Time of year (spring or summer/early fall/late fall or winter) o Animal type o Recent nitrogen concentration in manure analysis (lbs N/ton manure) o Manure application rate o Days between application and incorporation
• Residual nitrogen information o Frequency of past manure applications (<2 out of 5 years, 2-3 out of 5-years, 4-5 out of
5 years) o Soil series
• Sediment Delivery Ratio The methodology for quantifying nitrogen reductions from nutrient management projects in the Beretta Dairy site is provided as follows. The edge-of-field loading calculations are performed twice – first for current conditions and then with the assumption that BMPs are implemented. The difference between these two values yields the load reduction. The PA DEP calculator allows for consideration of minimum site expectations. In the North Coast Regional Water Quality Control Board jurisdiction, these expectations are provided by the General Discharge Requirements or the Waiver requirements. Some BMPs are not required by the GWDR or
17 Sharpley, A.N., Menzel, R.G., Smith, S.J., Rhoades, E.D., and Olness, A.E. (1981). The Sorption of Soluble Phosphorus by Soil Material during Transport in Runoff from Cropland and Grassed Watersheds. J. Envion.Qual. Vol. 10, no. 2, 1981 18 Warwick, J.D., *Fleming, N.K., Cox, J.W., Chittleborough, D.J. (2004). Phosphorus Transfer in Surface Runoff from Intensive Pasture Systems at Various Scales: A Review. J. Environ. Qual. 33:1973-1988 (2004).

Kieser & Associates, LLC
536 E. Mich igan Ave. , Su i t e 300 , Kalamazoo , MI 49007 (269) 344-7117 | www.k i eser -asso cia t es . com
Page 5
Waiver and could generate credits year after year for a length of time; others will be required after a reasonable establishment period and can only receive credits until a point of time that is defined in the GWDR or Waiver. Therefore, the three project sites where BMPs are proposed at the Beretta Dairy are separated into short-term credit generating BMPs and longer-term credit generation BMPs reflecting whether the Waiver requires the BMP or if the BMP is additional to the requirements, respectively. Next, the PA DEP calculator addresses the total bioavailable nitrogen in commercial fertilizer applications. This step is performed for each application, and all applications are sequentially numbered. However, when working on an animal heavy use area, fertilizer is not applied and this step is not applicable. It is therefore not discussed here. The PA DEP calculation method for estimating the total nitrogen from manure applications is calculated in Equation 1. The manure applications are sequentially numbered as well (e.g., the second manure application equals m2). Nitrogen content in manure can be derived either by nitrogen manure testing (lbs/ton or lbs/1000 gallons of manure) or default values provided by the Midwest Plan Service (Midwest Plan Service, 2004) as shown in Table 1. (The sum of all manure applications is calculated in Equation 2.) Some of the following equations reference an “X”, which allows either “B” for Before or “A” for After BMP conditions to be selected. NAm1 = MARm1 * ANCm1 (EQ. 1) Where: NAm1 = Nitrogen Applied, manure application #1 (lbs/ac) MARm1 = Manure Application Rate, application #1 (tons/acre)
ANCm1 = Average Nitrogen Concentration, manure application #1 (lbs/ton); from Table 1 or test
And; TNAM = ΣNAm, 1-n (EQ. 2) Where: TNAM = Total Nitrogen Applied, manure applications (lbs/ac) NAm= Nitrogen Applied, manure application #X (lbs/ac); from Equation 1 The total available nitrogen from each manure application is calculated in Equation 3. This equation adjusts the TN applied by a nitrogen crop availability factor. The results of Equation 1 for each application must be multiplied by a coefficient for the crop available fraction. This coefficient is determined using Table 2, which considers the type of manure, season of application and the timing of incorporation (Penn State Cooperative Extension, 2011). Table 2 also takes into account the soil temperature and the period of time the manure remains on the surface, which affects exposure to soil bacteria, the bacteria’s metabolic rate and the related conversion to and loss of ammonium. The

Kieser & Associates, LLC
536 E. Mich igan Ave. , Su i t e 300 , Kalamazoo , MI 49007 (269) 344-7117 | www.k i eser -asso cia t es . com
Page 6
available nitrogen for a given manure application is calculated in Equation 3, and the sum of all available nitrogen from all applications is calculated in Equation 4. ANm1 = NAm1 * AFN1 (EQ. 3) Where: ANm1 = Available Nitrogen, from manure application #1 (lbs/ac) NAm1 = Nitrogen Applied, in manure application #1 (lbs/ac); from EQ. 1 AFm1 = Available Fraction, in manure application #1 (ratio); from Table 2 And; TANM = ΣANm, 1-n (EQ. 4) Where: TANM = Total Available Nitrogen, in manure applications (lbs/ac) ANm = Available Nitrogen, in manure application #X (lbs/ac); from Equation 3 In the next step, all of the nutrient applications are summed to estimate the total nitrogen applied and total available nitrogen (Equation 5 and Equation 6, respectively). TNAX = TNAF + TNAM (EQ. 5)
Where: TNAX = Total Nitrogen Applied (lbs/ac) TNAF = Total Nitrogen Applied, all fertilizer applications (lbs/ac); not applicable TNAM= Total Nitrogen Applied, all manure applications (lbs/ac); from Equation 2 TAN = TANf + TANM (EQ. 6)
Where: TAN = Total Available Nitrogen (as calculated for Before and After BMP implementation) TANf = Total Available Nitrogen, all fertilizer applications (lbs/ac); not applicable TANM = Total Available Nitrogen, all manure applications (lbs/ac); from Equation 4 Residual nitrogen is calculated from data on previous manure application rates and legume crops. The frequency of manure applications within the past five years determines the residual nitrogen from previous manure applications. Organically bound nitrogen in manure is released based on the decay rate of the organic particles. A fraction of residual manure nitrogen is assumed to be released for the three years following application. Table 3 provides the results of a PA DEP and Penn State assessment using professional judgment regarding manure application residuals. Table 4 provides the residual nitrogen contribution from legumes (Penn State Cooperative Extension, 2011). Summing the residuals from both manure and legumes is performed in Equation 7, which calculates the residual manure available from previous applications. Table 6 is provided for informational purposes only, as it is based

Kieser & Associates, LLC
536 E. Mich igan Ave. , Su i t e 300 , Kalamazoo , MI 49007 (269) 344-7117 | www.k i eser -asso cia t es . com
Page 7
on PA soils. Review of this table indicates that any “Somewhat Poorly Drained” soil or “Poorly Drained” soil receives a crop productivity rating of 4. Dairy operations within the Laguna de Santa Rosa are operating within the Santa Rosa plain and fall within these leaching and drain classifications. Therefore, a crop rating of 4 would be used on the Beretta fields included if they were cropped. This consideration does not apply to pastures or heavy use areas. RN = RNM + RNL (EQ. 7) Where: RN = Residual Nitrogen (lbs/ac) RNM = Residual Nitrogen from Manure (lbs/ac; Table 3) RNL = Residual Nitrogen from Legumes (lbs/ac; Table 4) As noted previously, the above calculations are performed twice: once for the “before BMP” condition and again for the “after BMP” condition (Equation 8). Some of the following equations reference an X, which allows either B for Before or A for After BMP conditions to be selected. RAN = ANB - ANA (EQ. 8) Where: RAN = Reduction of Available Nitrogen (lbs/ac) ANB = Available Nitrogen (Before BMP) ANA = Available Nitrogen (After BMP) The sum of the residual nitrogen and nitrogen available from commercial fertilizer and manure applications before and after implementing nutrient management measures provides an estimate of the total nitrogen available per acre as calculated in Equation 9 and 10. The field scale total available nitrogen is provided in Equation 11. ANB = RN + TANmΣx + TANf (Before BMP) (EQ. 9) ANA = RN + TANmΣx + TANf (After BMP) (EQ. 10) Where: ANB = Available Nitrogen, Before BMP ANA = Available Nitrogen, After BMP RN = Residual Nitrogen; from Equation 7
TANFX = Total Available Nitrogen from Fertilizer, not applicable for heavy use areas TANMX = Total Available Nitrogen from Manure, for either Before or After; from EQ. 6

Kieser & Associates, LLC
536 E. Mich igan Ave. , Su i t e 300 , Kalamazoo , MI 49007 (269) 344-7117 | www.k i eser -asso cia t es . com
Page 8
NLR = A * RAN (EQ. 11) Where: NLR = Nitrogen Load Reductions, applied in the field (lbs) A = Acres in the field RAN = Reduction of Available Nitrogen (lbs/ac); from EQ 8 Applying these calculations to heavy use areas requires several modifications. (Note that all three BMP sites at the Beretta Dairy are located in heavy use areas (the manure lagoon solids stacking area is located in the heavy use area for BMP #2, and BMP #3 provides further reductions at a remote heavy use area.) First, a heavy use area is not cropped. In the fall of each year, after the livestock access has been removed, the heavy use areas are scraped to remove the manure that remained on the surface. Mulch is then applied in preparation for the wet season. Therefore, the estimated amount of dry season manure applied by daily loafing of the milk cows prior to release into pastures must be adjusted by the changes that occur when implementing the two existing practices used to prepare for the winter wet season (i.e., scraping and mulching). These practices are representative of the current nutrient loading conditions prior to new BMPs being proposed in the City’s Beretta Dairy crediting application. To address how much manure remains on site associated with these current practices, and what then remains available to contribute to nitrogen loads, soil samples were collected in April of 2012. These soil samples represent the nitrogen content that remains available after the volatilization losses from non-incorporation during the dry season, the scraping that has been implemented, and any losses from wet season runoff has occurred. The soil test results from the three heavy use and lagoon solids stacking areas compare equally to fresh manure total nitrogen concentrations, after taking into account handling losses. When the BMP implementation does not change the field’s intended use (i.e., the field remains a heavy use area for cows), a 5 percent increase in soil nitrogen concentration was added to estimate the fraction of applied nitrogen lost over the winter. This very low increase above the testing results acknowledges the many opportunities for winter season losses of the applied manure as described earlier and introduces a conservative safety factor into these calculations. One heavy use area (BMP #3) is being relocated to an interior field. The assumption to account for the wet season losses on this site uses 30 percent, which is less than the late fall, winter spring availability factor in the PA calculator of 40 percent. The soil nitrogen concentration was increased by 30 percent to adjust for the season’s loss. An additional conservative safety factor for this site is applied in the buffer treatment efficiency estimate described below. In summary, the Beretta Dairy edge-of-field loading calculations for current nitrogen applications include three conservative factors – spring-time sample collection, tests performed on the soil rather than manure, and a three-year averaging period allowed by the Nutrient Offset Program Resolution for crediting. The use of soil testing further dilutes the samples with inert materials (dirt). The three-year averaging period allows for mineralization (organic decay rates) to be taken into consideration. When the combination of all three factors are considered, (time of sample collection, soil tested instead of
Kieser & Associates, LLC
536 E. Mich igan Ave. , Su i t e 300 , Kalamazoo , MI 49007 (269) 344-7117 | www.k i eser -asso cia t es . com
Page 9
manure, and the long-term period for organic decay) this process for estimating available nitrogen can be considered conservative. To compute offset credits, the edge-of-field available nitrogen as calculated above is multiplied by other coefficients to account for additional site characteristics such as overland delivery, bioavailability, and in-stream channel processes (losses). Thus, the offset amount (i.e., credit) is the difference in the edge-of-field available nitrogen value with and without BMPs multiplied by these coefficients (which serve as credit “discounting factors”). Consideration of these factors ensures that credits are equal to or greater than the nutrients discharged in the City’s wastewater. Each of these applicable factors are discussed as follows. When a non-point source of nutrients is not adjacent to a receiving water, the edge-of-field loading can be adjusted by an upland delivery ratio to represent overland transport losses. The Beretta Dairy lagoon solid manure stacking area calculation (BMP Project #1) was adjusted for the upland transport losses by using the equation presented in Figure 1. The sediment delivery ratio (SDR) is taken from documentation discussing the development of the Minnesota Phosphorus Site Risk Index. The use of SDRs for upland field nutrient losses is considered a conservative assumption for nitrogen delivery. The fraction of soluble nitrogen lost in upland transport typically will be much lower on tight soils than the fraction of sediment loading lost in the same conditions. The nitrogen load reduction value for the field is multiplied by the delivery ratio to determine the edge-of-field delivered load per acre, as calculated in Equation 12. The calculation for the total field reductions is provided in Equation 13. TNLREoF = NLR * SDR (EQ. 12) Where: TNLREoF = Total Nitrogen Load Reduction Edge-of-Field (lbs) NLR = Nitrogen Load Reduction (lbs); from Equation 11 SDR = Sediment Delivery Ratio as provided by Figure 1 (ratio) Equation 12 was applied to two of the Beretta BMPs. The first is BMP #1 for the manure lagoon solids stacking area. The second is BMP #3 where the remote heavy use area is being relocated to an interior field. The manure solid stacking area was 30 feet from the nearest water conveyance. The SDR discount factor resulted in a 50.5 percent reduction in the nutrient loading estimate from the current site conditions. BMP #3, the relocation of the remote heavy use area, also uses the SDR in its crediting computation. The SDR for relocating the area 200 feet away from Roseland Creek is 66.6 percent. Where a BMP is directly adjacent to a surface water body, the edge-of-field load is considered to be 100% delivered. Though considered as an actual BMP and not a discount factor, additional nutrient reductions are expected at the Beretta dairy with the expected addition of vegetated buffers in the crediting proposal. These are introduced here as they are applied to the nitrogen loading AFTER the SDR discount factor is

Kieser & Associates, LLC
536 E. Mich igan Ave. , Su i t e 300 , Kalamazoo , MI 49007 (269) 344-7117 | www.k i eser -asso cia t es . com
Page 10
applied to the edge-of-field load. A study by Zhang19
et al., (2010) presented the findings of a literature review focused on the treatment efficiency of vegetative buffers. In this review, nutrient loading reductions for 10-meter mixed grass setbacks were estimated to be 71 percent for nitrogen and 69 percent for phosphorus. A 30-meter buffer increased the percent reduction to 98 percent for nitrogen and 100 percent for phosphorus. The Beretta BMPs #1 and #2 have a 10-meter buffer as part of the treatment system. The remote heavy use area relocation (BMP #3) also benefits from a 200-foot grass buffer. However, to introduce a conservative estimate for this BMP site, the treatment efficiency for a 10-meter buffer was applied.
A literature review (see attachment A) was completed by K&A to address the nutrient bioavailability differences from various sources, as directed by the offset Resolution. Nutrients are present in the environment in a variety of forms, and not all of these forms are available for uptake by organisms. The fraction of the phosphorus or nitrogen that is or will become bioavailable for plant growth is the fraction of nutrient loading that is relevant to the Santa Rosa crediting project. However, different sources release different forms (or varying fractions) of nitrogen and phosphorus. In order to facilitate crediting, a bioequivalence factor should be applied to account for these differences. This helps ensure that the credited reductions are equivalent, in terms of environmental protection among all participating entities. The bioequivalence factor is a coefficient that accounts for the differences in bioavailability between two sources. This coefficient is determined by taking the percent of the offset loading that is or will become bioavailable and dividing it by the percent of the wastewater discharge that is or will become bioavailable. Phosphorus in dissolved form is considered 100 percent bioavailable, but the bioavailable fraction of particulate-attached phosphorus varies depending on the source. For this non-point source, it is estimated that 60 percent of particulate-attached phosphorus will become bioavailable. Combined with the dissolved fraction, the weighted average result of bioavailable phosphorus is 80 percent. When the source is a domestic wastewater treatment plant, the particulate phosphorus fraction that will become bioavailable is higher and is estimated to be 70 percent. Combined with the dissolved fraction, the total is 85.5 percent. The bioequivalence factor for phosphorus from this source and a domestic wastewater treatment plant is calculated by 0.80/0.855. Therefore, the bioavailable coefficient is 93.5 percent. For nitrogen the dissolved inorganic forms (nitrate, nitrite and ammonia) are 100 percent bioavailable. The organic forms of nitrogen have variable bioavailability depending on the source. For agricultural non-point sources, the fraction of nitrogen that is or will become bioavailable has a weighted average of 80 percent. Domestic wastewater discharge has a higher fraction of nitrogen that is or will become bioavailable, with a weighted average of 94.5 percent. When these two fractions are entered into the bioavailable adjustment equation (0.80/0.945), the resulting nitrogen bioavailability coefficient is 85 percent. These bioavailability coefficients are used in the Beretta calculations.
19 Zhang, X., Liu, X., Zhang, M., Dahlgren, R.A., and Eitzel. M. 2010. A review of vegetated buffers and a meta-analysis of their mitigation efficacy in reducing non-point source pollution. J Environ Qual. 2009 Dec 30; 39(1):76-84. Print 2010 Jan-Feb.

Kieser & Associates, LLC
536 E. Mich igan Ave. , Su i t e 300 , Kalamazoo , MI 49007 (269) 344-7117 | www.k i eser -asso cia t es . com
Page 11
Finally, these credit calculations consider instream (channel) attenuation processes that occur between the location of the offset discharge from the Beretta dairy and the location of the City’s Delta Pond discharge location. The Nutrient Offset Program Resolution allows for the use of spatial and temporal considerations to be factored in as a “margin of safety” when determining credits. A margin of safety effectively becomes another potential discounting factor for calculating credits. For spatial considerations, the Beretta Dairy is located above several summer low flow pools targeted for protection under a forthcoming Laguna de Santa Rosa nutrient TMDL. In comparison, the City of Santa Rosa discharges treated wastewater from its Delta Pond situated downstream of the low flow summer pools. When considering the possible temporal differences between Beretta Dairy nutrient contributions and City wastewater discharges, there are three temporal Laguna flow regimes that must be considered for margin of safety considerations for timing of discharges including:
1. Discharges during the dry season (there may dairy runoff from summer rain events affecting low flow pools while there are no dry weather discharges of wastewater from Delta Pond)
2. Discharges during the wet season when the Russian River does not create flow reversals in the Laguna (the dairy-related loading pathway is still through the low flow pools, while the Delta pond discharge pathway does not travel through these pools)
3. Discharge during the wet season when the Russian River backs up into the Laguna (Delta Pond discharges under this condition could result in nutrients associated with wastewater being transported upstream of summer low flow pond locations; however, predicting the deposition of discharged nutrients becomes very complex as the area of deposition includes the entire floodplain and not necessarily just the low flow pool areas as is the case in the other two flow scenarios)
The City’s Delta Pond discharge will only impact low flow pool areas under the third flow condition. This assumes that what is typically a two to three week winter discharge event by the City, occurs during a Laguna flow reversal period. In some years, the City has no discharge to the Laguna. In comparison, nutrient contributions from the Beretta Dairy will affect low flow pools under all flow regimes. Thus, no location discounts/margins of safety are applied in the credit proposal. An argument could be construed that reductions at the Beretta Dairy could infinitely exceed equivalence in years with no City discharge, or only discharges under the first two flow scenarios. However, the City has only proposed credits with discounting that includes various conservative assumptions in edge-of-field load calculations, as well as bioavailability and application of a sediment delivery ratio. To illustrate how all these equations, assumptions and discounting factors are applied to calculate nitrogen credits for the proposed BMPs at the Beretta Dairy site, the following text box shows applicable calculations for BMP #2. Equations cited above and as derived from the PA DEP credit calculator are denoted as to where they apply in this example illustration.

Kieser & Associates, LLC
536 E. Mich igan Ave. , Su i t e 300 , Kalamazoo , MI 49007 (269) 344-7117 | www.k i eser -asso cia t es . com
Page 12
Beretta Project Applications - Phosphorus The proposed quantification methodology for phosphorus management practices at the Beretta Dairy is discussed here. Similar to nitrogen calculations, phosphorus computations for the edge-of-field loading are done twice; first for current site conditions and then for proposed nutrient management changes at the site. The edge-of-field reduction will reflect the impact of the changes in nutrient management. The PA DEP calculator has a variety of agricultural application calculations, including development of mass balances for applied nutrients, particulate phosphorus losses associated with soil erosion and dissolved phosphorus losses in runoff. The Beretta Dairy calculations only use equations for soil erosion sources and soluble phosphorus runoff estimates. For manure applications, available phosphorus is determined by the timing, animal type, phosphorus concentration in the manure, rate of application and application method. Equation 13 calculates the available phosphorus per acre and is repeated for every manure application occurring in a year. Equation 14 is used to sum all of the manure applications to calculate total available phosphorus (lbs/acres). APM1 = PCM1 * PSC * ARM1 * AF (lbs/ac) (EQ. 13) Where: APM1 = Available Phosphorus, in manure application number 1 (lbs/ac)
PCM1 = Phosphorus Concentration, from manure test or Table 8 (Penn State Agronomic Guide)
PSC = Phosphorus Source Coefficient, Table 8 (PA P-Index)

Kieser & Associates, LLC
536 E. Mich igan Ave. , Su i t e 300 , Kalamazoo , MI 49007 (269) 344-7117 | www.k i eser -asso cia t es . com
Page 13
ARM1 = Application Rate, for manure applied in application (lbs/ac) AF = Availability Factor, phosphorus availability regarding surface proximity
And; TAPm = ΣAPMX, 1-n (EQ. 14)
Where: TAPm = Total Available Phosphorus, from all manure applications (lbs/ac) APMX = Available Phosphorus, for each manure application event (lbs/ac)
Soil Phosphorus Loading Reductions Discharge of soil phosphorus to waterways typically is controlled by reducing soil erosion and managing the soil phosphorus concentrations at levels well below the soil absorption capacity. As such, the RUSLE2 annual soil erosion equation results are combined with the sediment-bound phosphorus concentrations per ton of soil to predict the phosphorus load moving within the field. Equation 15 provides this assessment converted into pound and acre units20
.
ESP = SPC * SEDE * 2.205 * EF (EQ. 15) Where: ESP = Eroded Sediment Attached Phosphorus (lbs/yr)
SPC = Soil Phosphorus Concentration, from soil P test converted to total phosphorus (kg/ton)
SEDE = SEDiment Erosion, results for field from RUSLE2 calculation (tons/yr) EF = Enrichment factor typical for the watershed, determined by GWLF modeling
The edge-of-field sediment-attached phosphorus load is calculated in Equation 16. ESP-EoF = ESP * DR (EQ. 16) Where: ESP-EoF = Eroded Sediment Attached Phosphorus delivered to the Edge-of-Field (lb/yr) ESP = Eroded Sediment Attached Phosphorus (Equation 21) DR = Delivery Ratio (Figure 1) The soil P test result conversion to total phosphorus has been modified to fit the Laguna setting. In Pennsylvania, the Mehlich – 3 test is used and applied in the PA DEP calculation spreadsheets. The soil
20 Equation recommended by Beegle, D., Klineman, P., and Evans, B., from Penn State University as supported by Evans (Evans, 2002).

Kieser & Associates, LLC
536 E. Mich igan Ave. , Su i t e 300 , Kalamazoo , MI 49007 (269) 344-7117 | www.k i eser -asso cia t es . com
Page 14
testing processed at the Beretta Dairy was for total phosphorus, and a back calculation can be made using the PA converter based on a regression for Mehlich 3 and TP soil samples. SPC = SPT / 190 * 836 * 0.000909 [Mehlich - 3 TP] (EQ. 17)21
Where: SPC = soil total phosphorus concentration (ppm) SPT = soil phosphorus test results (ppm) The constants in this equation reflect the PA DEP calculation of the Area Weighted Value of lbs/acre as calculated by Evans20 and a mass conversion from pounds to kilograms. Dissolved soil phosphorus stream loading considers an estimate of non-point source runoff volume by adapting the SCS Curve Number (CN) for the site. The CN calculation as quoted from the NRCS Technical Release 55 indicates:
Q = (P- 0.2S)2 / (P +0.8S) S is related to the soil and cover conditions of the watershed through the CN. CN has a range of 0 to 100, and S is related to CN by: S = 1000 / CN – 10
These equations allow the potential maximum retention to be removed from the runoff estimate for the Sonoma County 2-year, 24-hour historic rain event, as determined by the CA Water Gov records. Equations 18 and 19 calculate the volume runoff for the Laguna de Santa Rosa as an example using a CN equal to 86. S = 1000 / 86 – 10 result = 1.63 (EQ. 18) Q = (3.34 – 0.2(1.63))2 / (3.34 + 0.8 (1.63)) result = 1.96 (EQ. 19) This runoff event volume can be multiplied by the estimated number of 2-year, 24-hour storm events in one year. According to Sonoma County records (gathered on CA Water Gov), the mean precipitation in the Santa Rosa Plain (where the Beretta Dairy is located) equals 30.98 inches per year. The number of 2-year, 24-hour rain events that would equal that amount of precipitation is 9.28. Entering 9.28 into Equation 20 provides the estimated average annual rainfall runoff. AARR = Q * 9.28 (EQ. 20) Where: AARR = Average Annual Rainfall Runoff, in inches
21 Vadas et al., 2005

Kieser & Associates, LLC
536 E. Mich igan Ave. , Su i t e 300 , Kalamazoo , MI 49007 (269) 344-7117 | www.k i eser -asso cia t es . com
Page 15
Q = Annual Volume of Runoff, in inches Equation 21 multiplies the total phosphorus concentration and the average annual runoff to obtain the total dissolved phosphorus loss from one acre. TDP = STP * SPRF * 0.000227 (EQ. 21)
Where: TDP = Total Dissolved Phosphorus, lost to runoff (lb/year) STP = Soil Test Phosphorus SPRF = Soluble Phosphorus Regression Factor22
SPRF = 2 * STP + 43.5 (ug/l), for the Mehilich test23
(EQ. 22)
Equation 23 calculates the total dissolved phosphorus from manure delivered to the edge-of-field. TDP-EoF = TDP * DR (EQ. 23) Where: TDP-EoF = Total Dissolved Phosphorus, to Edge-of-Field (lbs/ac)
TDP = Total Dissolved Phosphorus, lost to runoff (lbs/ac), from Equation 21 DR = Delivery Ratio (Figure 1) The sum of the soil P loss from erosion, the total dissolved phosphorus loss, and the dissolved phosphorus from manure equals the phosphorus available in runoff, Equation 24 PFL = (TDP-EoF + ESP-EoF) * A (EQ. 24) Where: PFL = Phosphorus Field Loss (lbs/ac) TDP-EoF = Total Dissolved Phosphorus at the Edge-of-Field, from Equation 21 ESP-EoF = Eroded Sediment Attached Phosphorus at the Edge-of-Field, from Equation 14 A = Acres, in the field For Equation 24, the long-term presence of past phosphorus applications will stay with the soil for many years and a new soil P test would have to indicate a reduced available soil phosphorus reduction (ESP-EoF and TDP-EoF).
22 Vadas et al., 2005 and Moncrief, 2002 23 Vadas et al., 2005

Kieser & Associates, LLC
536 E. Mich igan Ave. , Su i t e 300 , Kalamazoo , MI 49007 (269) 344-7117 | www.k i eser -asso cia t es . com
Page 16
To illustrate how all these equations, assumptions and discounting factors are applied to calculate phosphorus credits for the proposed BMPs at the Beretta Dairy site, the following text boxes show applicable calculations for BMP #2. Equations cited above and as derived from the PA DEP credit calculator are denoted as to where they apply in this example illustration.

Kieser & Associates, LLC
536 E. Mich igan Ave. , Su i t e 300 , Kalamazoo , MI 49007 (269) 344-7117 | www.k i eser -asso cia t es . com
Page 17
References: Beegle, D. B., Weld, J. L., Gburek, W. J., Kleinman, P.J.A., Sharpley, A.N., and Kogelmann, C, 2006. The Pennsylvania Phosphorus Index: Version 1 User Manual.
http://panutrientmgmt.cas.psu.edu/pdf/rp_PIndex_Guidance_Manual0605.pdf. Accessed May 4, 2011.
Evans, B.M., Lehnign, D.W., Corradini, K.J., Peterson, G.W., Nizeyimana, E., Hamlett, J.M., Robillard, P.D.,
and Day, R.L., 2002. A Comprehensive GIS-Based Modeling Approach for Predicting Nutrient Loads in Watersheds. Journal of Spatial Hydrology Vol. 2 No. 2.
Midwest Plan Service, 2004. Manure Characteristics: Manure Management System Series. Second
Edition. MWPS-18 S-1. Iowa State University. http://www.mwps.org/index.cfm?fuseaction=c_Products.viewProduct&catID=719&productID=6421&skunumber=MWPS18S1. Accessed March 1, 2011.
Moncrief, J., Bloom, P., Hansen, N. Mulla, D., Bierman, P., Birr, A., and Mozaffari, M., 2002. Minnesota
Phosphorus Site Risk Index. Final GEIS on Animal Agriculture. Environmental Quality Board (EQB), July 2002. http://www.eqb.state.mn.us/geis/GEIS-AnimalAgFinal.pdf. Accessed March 1, 2011.
Natural Resource Conservation Service [NRCS], 1999. Technical Release 55 (TR-55) Urban Hydrology for
Small Watersheds. USDA NRCS June 1986, updated 1999. Palace, M. W., Hannawald, J. E., Linker, L. C., and Shenk, G. W., 1998. Chesapeake Bay Watershed Model
Applications & Calculation of Nutrient & Sediment Loadings - Appendix H: Tracking Best Management Practice Nutrient Reductions in the Chesapeake Bay Program Report of the Modeling Subcommittee. Chesapeake Bay Program Office, Annapolis, MD. August, 1998. http://www.chesapeakebay.net/modsc.htm - Publications Tab. 777. Accessed May 4, 2011.
Penn State Cooperative Extension, 2011. Agronomy Guide Section 1: Soil Management and Section 2:
Soil Fertility Management. http://extension.psu.edu/agronomy-guide. Accessed March 1, 2011. Potter, C. and Hiatt, S., 2009. Modeling River Flows and Sediment Dynamics for the Laguna de Santa
Rosa Watershed in Northern California. Journal of Soil and Water Conservation 64(6):383-393. Vadas, P. A., Kleinman, P. J. A., Sharpley, A. N., and Turner, B. L., 2005. Relating Soil Phosphorus to
Dissolved Phosphorus in Runoff: A Single Extraction Coefficient for Water Quality Modeling. Journal of Environmental Quality 34:572–580.

Kieser & Associates, LLC
536 E. Mich igan Ave. , Su i t e 300 , Kalamazoo , MI 49007 (269) 344-7117 | www.k i eser -asso cia t es . com
Page 18
Table 1. Manure Type and Average Nitrogen Concentrations.
Manure Type Average N Concentration Units Dairy- Lactating Cows Liquid 28 lbs/1000 gallons 1000 gallons/ac
Dairy- Lactating Cows Solid 10 lbs/ton tons/ac
Dairy- Dry Cow 9 lbs/ton tons/ac
Dairy- Calf and Heifer 7 lbs/ton tons/ac
Beef- Cow and Calf 11 lbs/ton tons/ac
Beef- Steer 14 lbs/ton tons/ac
Horse 12 lbs/ton tons/ac

Kieser & Associates, LLC
536 E. Mich igan Ave. , Su i t e 300 , Kalamazoo , MI 49007 (269) 344-7117 | www.k i eser -asso cia t es . com
Page 19
Table 2. Nitrogen Availability Factors.

Kieser & Associates, LLC
536 E. Mich igan Ave. , Su i t e 300 , Kalamazoo , MI 49007 (269) 344-7117 | www.k i eser -asso cia t es . com
Page 20
Table 3. Available Nitrogen from Past Applications Frequency of Past Manure Application (followed by manure type)
N Available (lbs N/ac)
Never received manure in past 0 Rarely received manure in past (<2 out of 5 yrs) 0 Frequently received manure (2-3 out of 5 yrs) 20 Continuously received manure (4-5 out of 5 yrs) 35
Table 4. Residual Nitrogen Contribution from Legumes1.
Previous crop Percent Stand
High-productivity
fields
Moderate-productivity
fields
Low-productivity fields
Soil productivity group² 1
Soil productivity groups² 2 & 3
Soil productivity groups² 4 & 5
Nitrogen credit (lb/A) First year after clover or trefoil
>50 90 80 60
25–49 60 60 50 <25 40 40 40
First year after alfalfa >50 120 110 80
25–49 80 70 60 <25 40 40 40
First year after soybeans harvested for grain. ---- 1 lb N/bu soybeans ----
1. When a previous legume crop is checked on the Penn State soil test information sheet, the residual nitrogen for the year following the legume is calculated and given on the report. This credit should be deducted from the N recommendation given on the soil test report.
2. See table 1.1-1 in the basic soils section for information on soil productivity groups.
Table 5. Legume Crop Residual Nitrogen.
Legume Crop (no nitrogen application recommended)
Pounds of N Removed/Unit of
Yield
Pounds of N Removed/Ac
Alfalfa (5 tons/A) 50 250 Soybeans (40 bu/A) 3.2 130 Trefoil (3.5 tons/A) 50 175 Clover (3.5 tons/A) 40 140
Comment: Although legumes will use N from manure and other sources, applying N may increase the competition from weeds and grasses. If you apply manure, limit it to an application rate that balances the crop’s P requirement.

Kieser & Associates, LLC
536 E. Mich igan Ave. , Su i t e 300 , Kalamazoo , MI 49007 (269) 344-7117 | www.k i eser -asso cia t es . com
Page 21
Table 6. Selected Properties and Typical Capabilities of Major Pennsylvania Soils.

Kieser & Associates, LLC
536 E. Mich igan Ave. , Su i t e 300 , Kalamazoo , MI 49007 (269) 344-7117 | www.k i eser -asso cia t es . com
Page 22
Table 7. Phosphorus Application Factors.
April-Oct Nov-March
Application Method Phosphorus App
Factor Placed or injected 2” or more deep 0.2 0.2 Incorporated less than 1 week following application 0.4 0.4 Incorporated more than 1 week following application 0.6 0.8 Not incorporated following application 0.6 0.8 Surface applied to frozen or snow-covered soil 1 1
Table 8. Nutrient Content of Manure and P Source Coefficients.
Manure Type
Average P Concentration
Phosphate Phosphorus Unit P Source Coefficient
P Source Coefficient Applied1
Dairy- Lactating Cows Liquid 13 5.59 lbs P/1000 gallons 0.8 0.6 Dairy- Lactating Cows Solid 4 1.72 lbs P/ton 0.8 Dairy- Dry Cow 3 1.29 lbs P/ton 0.8 Dairy- Calf and Heifer 2 0.86 lbs/ton 0.8
1 20 percent margin of safety introduced

Kieser & Associates, LLC
536 E. Mich igan Ave. , Su i t e 300 , Kalamazoo , MI 49007 (269) 344-7117 | www.k i eser -asso cia t es . com
Page 23
The SDR equation is:
SDR = D-0.2069
Where: SDR = Sediment Delivery Ratio D = Distance of sediment source to nearest hydrologically connected water body [Note: For distances greater than 5000 feet use 5000 feet] Figure 1. Sediment Delivery Ratio. (Delivery Ratio Explanation: To account for overland delivery of nutrients from the estimated edge-of-field location to an adjacent or nearby waterbody, Kieser & Associates, LLC recommends using information compiled by the University of Minnesota for sediment and particulate-attached nutrient reduction accounting. The University of Minnesota developed the Minnesota Phosphorus Site Risk Index in partial support of the Generic Impact Statement on animal agriculture (Moncrief, 2002). This method is applied in the Minnesota Phosphorus Index and water quality trading permits. The sediment delivery ratio (SDR) regression graph from the Minnesota Phosphorus Index is provided in Figure 1 above. The graph provides approximate SDRs based on distance from the edge-of-field to the nearest hydrologically connected water body.)

Attachment A Santa Rosa Nutrient Offset Program Bioavailability Review

Kieser & Associates, LLC
536 E. Mich igan Ave. , Su i t e 300 , Kalamazoo , MI 49007 (269) 344-7117 | www.k i eser -asso cia t es . com
Page 1
To: Lynn Small, City of Santa Rosa Date: July 3, 2012 Control Board From: James A. Klang, PE, K&A cc: Dave Smith, Merritt Smith RE: Santa Rosa Nutrient Offset Program Bioavailability Review Addressing Nutrient Bioavailability in Offsets This memorandum provides a brief review of published literature and selected water quality trading programs, analyzing various approaches for addressing nutrient (phosphorus and nitrogen) bioavailability between sources. This background information forms the basis for recommended bioavailability factors included in equations for calculating Santa Rosa nutrient offset credits. For water quality offsets, discount factors are often applied to nutrient load reductions to ensure that the environmental outcome from the offset is equivalent to the protection that would be achieved under conventional methods of additional wastewater treatment. Such factors are used in crediting proposals to account for bioavailability equivalence in the Santa Rosa Nutrient Offset Program for loading between non-point sources and the City’s treated wastewater discharge. Phosphorus: The State of Minnesota addressed phosphorus bioavailability issues in the Statement of Needs and Reasonableness (SONAR) document written to support Water Quality Trading rule promulgation1
. The Minnesota Pollution Control Agency (MPCA) based this document on a study entitled, “Detailed Assessment of Phosphorus Sources to Minnesota Watersheds” (Barr, 2004). An appendix to the 2004 study compiles phosphorus bioavailability by source. The table from this appendix is reproduced below as Table 1.
The literature reviewed for this memo most commonly determined bioavailability using a one-month period after release to a water environment. Applying the results of these bioavailability studies to longer time periods (as would be the case in the Laguna de Santa Rosa setting), provides a conservatively low range. The nutrients in the Laguna setting have substantially more time to undergo chemical and biological changes. To address bioavailability, a coefficient can be calculated that reflects the bioavailability of the different phosphorus forms discharged by each source.
1MPCA. 2010. A Scientifically Defensible Process for the Exchange of Pollutant Credits under Minnesota’s Proposed Water Quality Trading Rules. Accessed July 3, 2012, available at: http://kieser-associates.com/uploaded/MPCA_Defensible_Processs_Exchange_Credits_072809.pdf
MEMORANDUM Environmental Science and Engineering K IESER ASSOCIATES, LLC &

Kieser & Associates, LLC
536 E. Mich igan Ave. , Su i t e 300 , Kalamazoo , MI 49007 (269) 344-7117 | www.k i eser -asso cia t es . com
Page 2
K&A used Table 1 to calculate recommended equivalence factors that incorporate phosphorus bioavailability considerations for the Laguna de Santa Rosa. An equivalence factor accounts for differences in phosphorus bioavailability from each type of source. For point source domestic wastewater treatment plants (WWTPs) using agricultural nonpoint source offsets (without presence of manure), the recommended equivalence factor is 58/85.5 (or 0.68). When working on agricultural sites that are seeking to improve manure management, this factor becomes 80/85.5 (or 0.94). Table 1. Estimates of phosphorus bioavailability fractions for specific source categories (from Barr, 2004).
Phosphorus Sources Fraction of PP that is
Bioavailable (Range)
Fraction of PP that is
Bioavailable (Most
Likely)
Fraction of DP that is
Bioavailable (Most Likely)
Fraction of TP that is
Particulate (Most
Likely)
Estimate of TP that is
Bioavailable (Most
Likely)
Publicly Owned WWTP for domestic use (effluent) 0.6 - 0.8 0.7 1.0 0.5 0.855
Privately Owned WWTP for domestic use (effluent) 0.6 -0.9 0.8 1.0 0.3 0.94
Commercial/Industrial WWTPs (effluent) 0.2 - 0.8 0.6 1.0 0.3 0.88
Agricultural Runoff
Manure Management 0.5 -0.7 0.6 1.0 0.5 0.8
Cropland Runoff 0.2 - 0.7 0.4 1.0 0.7 0.58
Urban Runoff
Turfed Surfaces 0.2 - 0.7 0.4 1.0 0.7 0.58
Impervious Surfaces 0.10 - 0.5 0.2 1.0 0.5 0.6
Forested Land 0.2 - 0.8 0.3 1.0 0.8 0.44
Roadway and Sidewalk Deicing Chemicals
salt 0.2 - 0.8 0.6 1.0 0.2 0.92
sand 0.1 - 0.3 0.2 1.0 0.8 0.36
Stream Bank Erosion 0.1 - 0.5 0.3 1.0 0.8 0.44 Nitrogen: Total nitrogen (TN) consists of dissolved and particulate nitrogen. Dissolved nitrogen can be further subdivided into inorganic and organic forms. Organic forms of particulate nitrogen also can be present. The dissolved inorganic nitrogen (DIN) forms (NO2, NO3 and NH4
+) are

Kieser & Associates, LLC
536 E. Mich igan Ave. , Su i t e 300 , Kalamazoo , MI 49007 (269) 344-7117 | www.k i eser -asso cia t es . com
Page 3
commonly assumed to be 100 percent bioavailable (Berman, 1999). However, independent study findings regarding the bioavailability of organic nitrogen, dissolved organic nitrogen (DON) and particulate organic nitrogen (PON) suggest that the bioavailability of these forms might vary widely. The predictability of this range in bioavailability also might vary substantially, in part due to results based on algal bioassays (Seitzinger, 2002). DON in freshwater riverine systems was historically thought to be available only for bacterial uptake, rather than direct algal uptake. Research indicates that humic systems release more DON during summer periods than previously thought. Up to 20 percent of the DON can be photo-ammoniafied (Bushaw, 1996; Dagg, 2003). The Laguna de Santa Rosa nitrogen loading affecting the low flow dissolved oxygen conditions, is likely in the forms of DON and PON that remain in the system for longer periods of time (e.g., when disconnected summer pools develop). These longer time periods likely expose the DON and PON to photochemical breakdown, zooplankton grazing and bacterial uptake resulting in NH4-N or NO3 release. Therefore, non-point source DIN is assumed to be 100 percent bioavailable (as discussed above) while DON and PON collectively are conservatively estimated at 20 percent bioavailable during the summer period for various Ag non-point sources. This is conservative because it does not include bacterial and zooplankton uptake. In the Laguna de Santa Rosa setting, the application of nitrogen bioavailability might be further complicated by limited laboratory or bioassay testing methods, which can use three-week incubation periods (Urgun-Demirtas et al., 2008; Berman, et al. 1999). The use of this lab analysis is considered conservative due to the longer time periods and numerous chemical and biological activities that occur when the low flow polls trap nitrogen beyond the three-week timeframe of the lab tests. Total Nitrogen to Dissolved Organic Nitrogen Ratios in Non-point Source Dominated Streams Research indicates a broad range of ratios comparing stream TN to DON in non-point source dominated streams. Seitzinger (2004) conducted a literature review that suggested a range from 10 to 80 percent. Assessing the cropping and pasture runoff results from the Laguna de Santa Rosa TMDL source monitoring program, the 34-sample mean concentration was 2.6 mg/l TN. The dataset did not provide flow estimates. Therefore, a flow-weighted mean could not be generated. The mean concentration of the 34 samples of the total DIN fraction (NO3- and NH4-N) was 2.0 mg/l DIN. A comparison of the two concentration means indicates approximately 76 percent of the total nitrogen is DIN. This can be roughly confirmed by solving for the DON fraction independently for each sampling event (TN - DIN = DON + PON) and then averaging the estimated percent of organic nitrogen results. The average organic nitrogen percentage of total nitrogen plus the 76 percent DIN fraction should be approximately 100 percent (not taking into account difficulties regarding sampling variability). The result of this calculation indicates approximately 29 percent of the total nitrogen is in the form of organic nitrogen. The 76 percent plus 29 percent is a reasonable indicator that these assumptions are within an acceptable range for the Laguna

Kieser & Associates, LLC
536 E. Mich igan Ave. , Su i t e 300 , Kalamazoo , MI 49007 (269) 344-7117 | www.k i eser -asso cia t es . com
Page 4
de Santa Rosa setting. Therefore, using a 75 percent bioavailable fraction as DIN and 25 percent as organic nitrogen form in non-point source runoff was deemed reasonable for nitrogen offset credits. After combining the stream fractions of inorganic and organic nitrogen (and bioavailability of each), the TN bioavailability of crop and pasture sources can be estimated as follows: DIN bioavailability (75 percent times 100 percent bioavailable) plus organic nitrogen bioavailability (25 percent times 20 percent bioavailable) equals 80 percent total nitrogen bioavailability. This estimate is used in Ag settings with high organic content as a conservative estimate. However, as previously mentioned, in settings where there is a substantial presence of particulate organic nitrogen, the estimate is unreasonably low because it is based on three week lab analysis methods. In settings where the credit estimation method is dominated by PON, a higher bioavailability factor will be used. The bioavailability of WWTP nitrogen also must be determined. Assessing the same forms of nitrogen (e.g., particulate and dissolved, further subdivided into inorganic and organic) the inorganic fractions are assumed to be 100 percent bioavailable. Literature indicates that secondary effluent WWTPs that denitrify have DON percentages around 10 percent of the TN discharged (Pehlivanoglu, 2004). However, advanced treatment with low total nitrogen levels (below 3 mg/l) increases the fraction of DON to 40-50 percent of TN (Chandran, 2010). Therefore, an analysis of the Laguna WWTP pond storage system sampling was performed. The results provided in Table 2 indicated that average concentrations were: Table 2. Average nitrogen concentrations from Delta Pond samples (City of Santa Rosa, Delta Pond monitoring results, 2006-2010).
Nutrient Form Concentration (mg/l) Number of Samples
Nitrate Nitrogen 8.19 20 samples
Organic Nitrogen 1.34 24 samples
Ammonia nitrogen 0.48 14 samples
Total Nitrogen 9.8 Sum of nitrate, organic and ammonia samples (same day) from Delta Pond
These values indicate that approximately 89 percent of the discharged pond effluent was DIN (assumed to be 100 percent bioavailable). A conservative assumption for the Santa Rosa offset program would be to use a 50 percent bioavailable fraction of DON, assuming algal uptake is enhanced by bacteria (Pehlivanoglu, 2004). Therefore, the contributing DON bioavailable fraction is assumed to be 5.5 percent of the total nitrogen loading. The estimated wastewater bioavailable fraction result is 94.5 percent. The nitrogen bioavailability discount factor for cropping and pasture land offsets is determined by 0.8 non-point source bioavailability/0.945 WWTP bioavailability, or a discount factor of 0.85 times the credited loading reduction.

Kieser & Associates, LLC
536 E. Mich igan Ave. , Su i t e 300 , Kalamazoo , MI 49007 (269) 344-7117 | www.k i eser -asso cia t es . com
Page 5
References: Barr Engineering Company, 2004. Detailed Assessment of Phosphorus Sources to Minnesota Watersheds. Supporting Technical Memorandum: Assessment of Bioavailable Fractions of Phosphorus and Annual Phosphorus Discharge for Each Major Basin memo. Available on line at: http://www.pca.state.mn.us/index.php/viewdocument.html?gid=3987 Berman, T., Chava, S., 1999. Algal growth on organic compounds as nitrogen sources. J. of Plankton Research 21(8): 1423-1437. Bushaw, K.L., Zepp, R.G., Tarr, M.A., Schulz-Jander, D., Bourbonniere, R.A., Hodson, R.E., Miller, W.L., Bronk, D.A., Moran, M.A., 1996. Photochemical release of biologically available nitrogen from aquatic dissolved organic matter. Nature 381: 404-407 doi:10.1038/381404a0. Chandran, K., 2010. Methylotrophic microbial ecology and Kinetics. WERF Opportunistic Research Project. WERF presentation 2010. Dagg, M., Ammerman, J., Amon, R., Gardner, W., Green, R., Lohrenz, S., 2007. Water column processes influencing hypoxia in the northern Gulf of Mexico. Estuaries and Coasts 30: 735-752. Dagg, M., Breed, G.A., 2003. Biological effects of Mississippi River nitrogen on the northern Gulf of Mexico—a review and synthesis. J. of Marine Systems 43: 133–152. Pehlivanoglu, E., Sedlak, D.L., (2004). Bioavailability of wastewater-derived organic nitrogen to the alga Selenastrum Capricornutum. Water Research 38: 3189–3196. Seitzinge, S.P, Sanders, R.W., Styles, R., 2002. Bioavailability of DON from natural and anthropogenic sources to estuarine plankton. Limnol. Oceanogr., 47(2):353–366. Urgun-Demirtas, M., Sattayatewa, C., Pagilla, K.R., 2008. Bioavailability of dissolved organic nitrogen in treated effluents. Water Environment Research 80(5): 397-406.