Embed Size (px)
Citation preview

City of Surrey Fire Service: Reducing Uncertainty for Annual Staffing Costs

Background
City of Surrey, British Columbia, Canada.
Surrey

Background
Len Garis
• Fire Chief, 2001-Present• Assistant Chief, 1998-2001
Surrey, BC, Canada
Pitt Meadows, BC, Canada• Fire Chief/Director of Protective Services, 1992-1998• Volunteer/Contract Fire Chief, 1984-1992
Justice Institute of BC• Program Coordinator, 1988-1992
Background
Frederick G. Culbert, P. Eng.
• 37 years of experience in the international development, trade, transportation and energy sectors in Canada, the United States, Asia and South America
• M. Sc. (Stanford), Engineering-Economic Planning
• Focus on the implementation and development of economic and financial planning models to evaluate public and private sector business cases

Motivators and ApproachMotivators and Approach
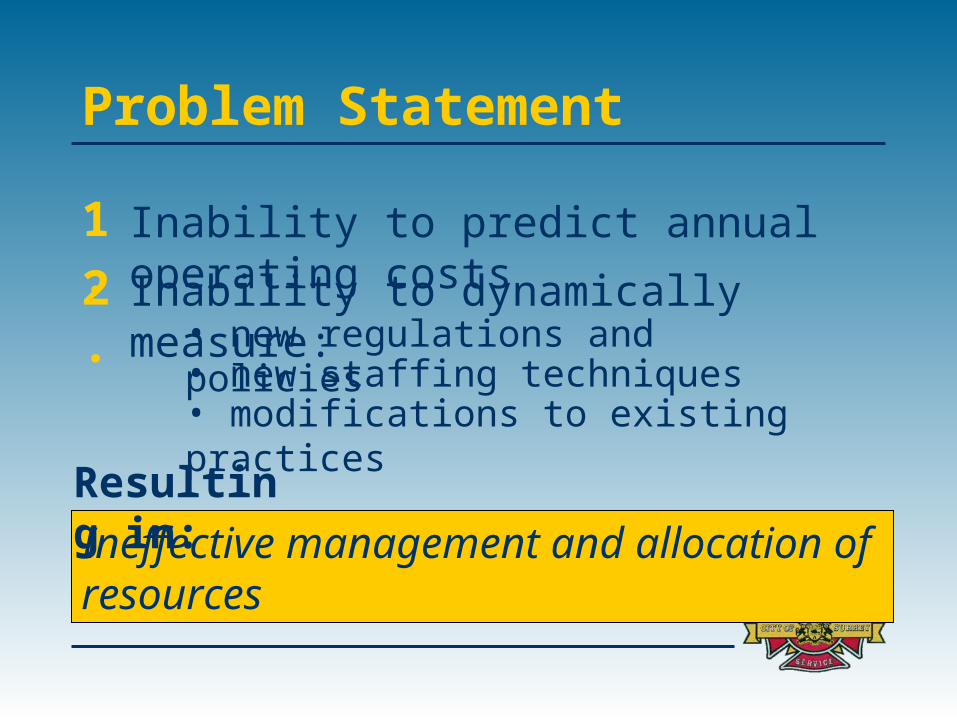
Problem Statement
1. Inability to predict annual operating costs
2. Inability to dynamically measure:• new regulations and policies• new staffing techniques• modifications to existing practices
Ineffective management and allocation of resources
Resulting in:

Drivers
Number of Shifts Lost to Sickness and WCB by Month: 1998 - 2001
125
150
175
200
225
250
275
300
325
J an Feb Mar Apr May J un J ul Aug Sep Oct Nov Dec
1998 1999 2000 2001
Unpredictable staffing levels cause difficulties in planning.

Drivers
Staff Count
50
51
52
53
54
55
56
57
58
59
60
61
62
Shift / Date
A Reg A SP B Reg B SP C Reg C SP D Reg D SP
FRC in service for training on C Shift, Apr 21 & 22
Under or over-staffing is common.

Methodology
Modeling must be systematic and inclusive
Model Development Process and Inputs
MANAGEMENT
Info
rmat
ion
flo
w
Da
tafl
ow
Ÿ Source information input
Ÿ IntegrationŸ Analysis, forecastingŸ Planning, modeling
Ÿ
ŸStrategyDecision-making
OPERATIONAL
ANALYSIS and PLANNING

Model Types
Model development is iterative, where results must be validated.
1. Deterministic approach enables situational analysis.
2. Probabilistic approach enables projected analysis.
Two approaches to test the model:

Inputs, Outputs and ProcessThe model calculates the probability of achieving consistent four-person staffing under various scenarios.
MODELINGMODELING
CONSTRAINTSCONSTRAINTS• Standards• Policies• Budget
MODIFY until objectives met
RESULTSRESULTSFULL TEAMFULL TEAM

Case StudiesCase Studies
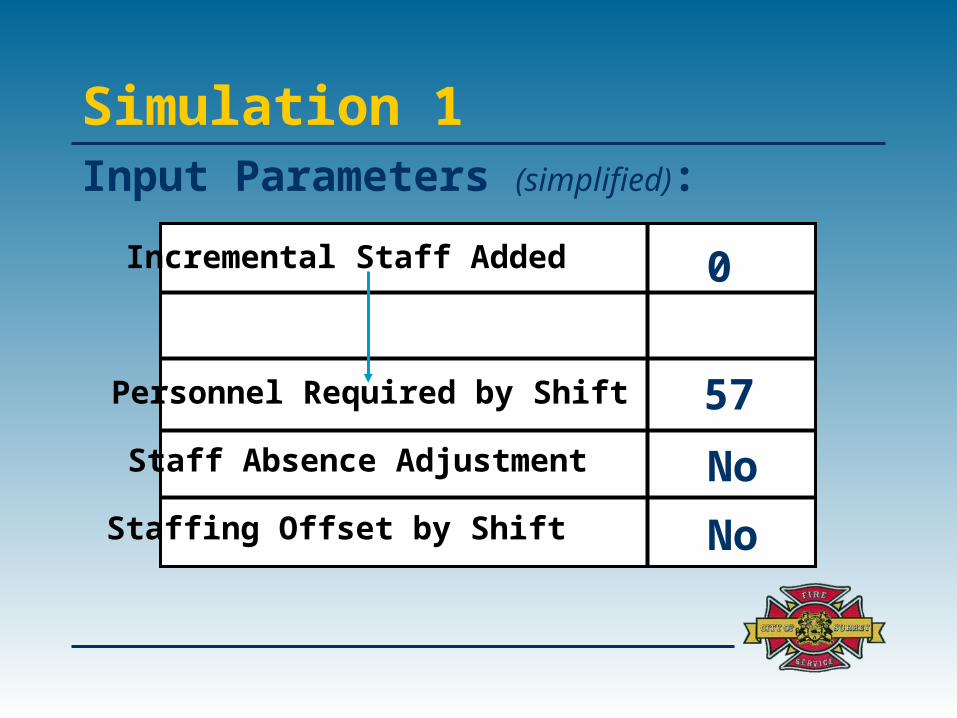
Simulation 1Input Parameters (simplified):
Incremental Staff Added
Personnel Required by Shift
Staff Absence Adjustment
Staffing Offset by Shift
0
57
No
No

Simulation 1 - Results
5%
15%
25%
35%
45%
55%
65%
75%
85%
95%
$30,000 $50,000 $70,000 $90,000 $110,000 $130,000 $150,000 $170,000
Cu
mu
lati
ve
Fre
qu
en
cy
A M ean of A B M ean of B C M ean of C D M ean of D
*Note: Shift A and B are almost coincident, and the averages for both Shift A and B are similar in this iteration.

Simulation 1 - Observations
• Teams A and B most inefficient (average C $94,000 annually)
• Team D most efficient (average C $49,000 annually)
• Variable performance direct result of historically low absences
• Average annual cost C $300,000

Simulation 2Input Parameters (simplified):
Incremental Staff Added
Personnel Required by Shift
Staff Absence Adjustment
Staffing Offset by Shift
0
57
Yes
Yes

Simulation 2 - Results
5%
15%
25%
35%
45%
55%
65%
75%
85%
95%
$30,000 $50,000 $70,000 $90,000 $110,000 $130,000 $150,000 $170,000
Cu
mu
lati
ve
Fre
qu
en
cy
A M ean of A B M ean of B C M ean of C D M ean of D
Simulation 2 - Observations
• Spread between teams decreasing
• Variance between individual team performance decreasing
• Average annual cost C $266,000

Simulation 3Input Parameters (simplified):
Incremental Staff Added
Personnel Required by Shift
Staff Absence Adjustment
Staffing Offset by Shift
0
57 + 2 = 59
Yes
Yes

Simulation 3 - Results
5%
15%
25%
35%
45%
55%
65%
75%
85%
95%
$30,000 $50,000 $70,000 $90,000 $110,000 $130,000 $150,000 $170,000
Cu
mu
lati
ve
Fre
qu
en
cy
A M ean of A B M ean of B C M ean of C D M ean of D

Simulation 3
• Enormous shift in average annual cost (from C $266,000 to C $516,000 annually)
• Addition of 2 staff not cost-effective
• Currently under-utilized resources in shifts
Changes Modeled• Just-in-time Staff Replacement - no gapping• Fill long-term absences with temporary staff• Staffing pools for WCB and special leave• Intershift transfers for dynamic scheduling• 56-day cycle• Add FR truck unit when shift is overstaffed• Balance scheduled absences based on historic patterns• Stabilization of scheduled absences, using “City Days”

Conclusion
Projected callback cost at straight time = C $30/hr
Where:Minimum = C $172,630 Average = C $250,103Maximum = C $276,063 Budget = C $425,000
Assumes:• Suggested techniques applied• Absence conditions stable• No extreme events occur

Contingency Plans
• Reduce on-duty staff to 55 prior to budget running out to maintain 4-person staffing
• Simulation indicates that if average absence/shift reduced by 0.6, then 55 on-duty staff (with addition of FR unit), can be realized within budget.