Embed Size (px)
Citation preview
Improving Fire Insurance Grades Study
2013-10-14
Fire Underwriters Survey A Service to Insurers and Municipalities
City of Toronto Improving Fire Insurance Grades Study
2013
Notice of Confidentiality
This document contains confidential and proprietary information (the “Information”) of SCM – Opta Information Intelligence, Fire Underwriters Survey and has been prepared for the sole purpose of responding to a Request for Proposal from the Recipient. The Information contained herein is disclosed on condition that it will be used solely in connection with its stated purpose. The Recipient shall not directly or indirectly disclose, allow access to, transmit or transfer the Information to any third party without SCM – Opta Information Intelligence’s prior written consent. The Recipient may disclose the Information only to those of its employees who have a need to know the Information in connection with the stated purpose. This document cannot be reproduced in any form or by any mechanical or electronic means, including electronic archival systems, without the prior written approval of SCM – Opta Information Intelligence provided, however, that the Recipient may make a reasonable number of copies for internal use in connection with the purpose. All copies of this document or portions thereof shall bear the proprietary notices of SCM – Opta Information Intelligence. If you have received this document by mistake, note that reading, reproduction or distribution of this document is strictly forbidden. You are hereby requested to inform us by telephone at 1.800.665.5661and to return this document by certified mail. Disclaimer Our proposal is being submitted for your review and consideration. If the proposal is acceptable, the parties shall enter into a separate agreement with respect to the subject matter hereof and such agreement shall supersede this proposal and any other agreements, understandings or representations. It is also subject to ongoing due diligence and customary business investigations by SCM – Opta Information Intelligence with respect to the requisite business arrangements necessary to carry out its obligations. The results of such a review may impact upon the terms and conditions of this proposal, including in respect of business structure, business terms and financial arrangements. SCM – Opta Information Intelligence makes no representation or warranty to Recipient with respect to the Information and shall not be liable for any errors or omissions in the Information or the use of thereof. Trademarks SCM – Opta Information Intelligence respectfully acknowledges that respective companies own all products identified in this response.
Opta Information Intelligence, an SCM Company 150 Commerce Valley Drive West Markham ON L3T 7Z3 1-800-665-5661
1 | P a g e
FIRE UNDERWRITERS SURVEY A SERVICE TO INSURERS AND MUNICIPALITIES
c/o Opta Information Intelligence
Table of Contents
1. BACKGROUND AND HISTORY OF FUS ................................................................................................... 3
Dwelling Protection Grade for Personal Lines Insurance ........................................................... 4
Public Fire Protection Classification for Commercial Lines ........................................................ 4
Toronto’s Fire Underwriters Survey Results of 2012 .................................................................. 5
2. SCOPE OF WORK ................................................................................................................................... 6
3. TORONTO FIRE INSURANCE GRADING CREDITS ................................................................................... 6
Risk Assessment Benchmark ....................................................................................................... 6
Credit Areas ................................................................................................................................. 7
Fire Safety Control Credits .......................................................................................................... 8
Fire Department Credits ........................................................................................................... 11
Emergency Communication Credits ......................................................................................... 13
Water Supplies for Public Fire Protection Credits .................................................................... 14
4. OPTIONS FOR IMPROVEMENTS .......................................................................................................... 16
5. IMPACT OF OPTIONS ON FIRE INSURANCE GRADES ........................................................................... 17
Option 1 – Improve Ladder Credit with Additional Quint Apparatus and Staff ....................... 18
Option 2 – Improve Fire Safety Control – Fire Prevention Division Enhancement .................. 20
Option 3 – Improve Pre-Incident Planning ............................................................................... 24
Option 4 – Improved Response Systems .................................................................................. 26
6. COST OF OPTIONS ............................................................................................................................... 28
Impact on Insurance ................................................................................................................. 29
Dollars Saved Through Mitigation ............................................................................................ 30
7. Improving For Today and Tomorrow .................................................................................................. 32
Road Map for Improvements .................................................................................................... 34
Improving to PFPC 1 .................................................................................................................. 37
8. CONCLUSIONS ..................................................................................................................................... 39
2 | P a g e
FIRE UNDERWRITERS SURVEY A SERVICE TO INSURERS AND MUNICIPALITIES
c/o Opta Information Intelligence
Figures
Figure 1 – Credited and Available Credit for Each Major Area Graded .......................................... 8 Figure 2 – Fire Safety Control and Fire Prevention Credits ............................................................ 9 Figure 3 – Fire Department Item Credits ...................................................................................... 12 Figure 4 - Emergency Communications Item Credits .................................................................. 14 Figure 5 - Water Supplies for Public Fire Protection Item Credits ............................................... 16 Figure 6 - PFPC Chart with Improved Response Systems Implementation .................................. 27 Figure 7 – Fire Prevention Staff Increases and Credit Points ....................................................... 35 Figure 8 - Credit Point Increases w/ Option 2, 3, and 4 Implemented ......................................... 36
Tables Table 1 – PFPC Credit Score ............................................................................................................ 5 Table 2 – Routine Fire Prevention Inspection Program ................................................................ 10 Table 3 – Option 1 - Fire Station Credits with Quints ................................................................... 18 Table 4 – Toronto Proposes Scheduled Risk Based Inspection Program ...................................... 22 Table 5 – Option 2 - Enhanced Routine Inspection Program and FUS Credits ............................. 23 Table 6 – Option 3 - Pre-Incident Planning Improvement ............................................................ 25 Table 7 – Areas Affected by Improved Response Systems Credits .............................................. 26 Table 8 – Cost of Options .............................................................................................................. 29 Table 9 - Toronto Fire statistics including vehicle fires ................................................................ 31 Table 10 - Fire Loss Statistics - Ontario 2007-2011 ..................................................................... 31 Table 11 - Estimation of Mitigated Dollar Losses for Structure Fires in Toronto ......................... 32 Table 12 – Fire Prevention Staff Increases over Years.................................................................. 34 Table 13 - Option Credits 2013-2017 ............................................................................................ 35 Table 14 - Option 2, 3 and 4 Combined Impact on PFPC .............................................................. 36

3 | P a g e
FIRE UNDERWRITERS SURVEY A SERVICE TO INSURERS AND MUNICIPALITIES
c/o Opta Information Intelligence
October 14, 2013 Toronto Fire Service 4330 Dufferin Street Toronto ON M3H 5R9 Attention: Jim Sales, Fire Chief Ron Jenkins, Deputy Fire Chief Re: Fire Underwriters Survey – Improving Fire Insurance Grades Study
1. BACKGROUND AND HISTORY OF FUS Fire Underwriters Survey (FUS) was originally developed after a number of communities across North America had massive conflagration losses. The fire insurance grading system was developed to provide insurers with information related to the levels of fire risk and fire protection within each community in Canada. The system is designed to provide a cost benefit to communities for providing fire protection. Communities that have effective and appropriate levels of fire protection for the level of fire risk within their protection areas will receive lower fire insurance grades, which in turn will result in lower insurance premiums for property owners. This letter gives an overview of the factors that affect a community’s fire insurance grading and how these ratings affect insurance premiums. Fire Underwriters Survey is a national organization financed and directed by Opta Information Intelligence. The organization assesses, evaluates and grades the quality of public fire defences maintained in Canadian municipalities and communities. This technical information is conveyed to FUS subscribers for use in their fire insurance statistical, rating and underwriting programs. FUS member companies provide approximately 85 percent of the private general insurance written each year in Canada. The grading system has two components, the Dwelling Protection Grade1 (DPG) and Public Fire Protection Classification2 (PFPC).
1 Personal Lines Insurance: Insurance covering the liability and property damage exposures of private individuals and their households as opposed to Commercial Lines. Typically it includes all detached dwellings that are designated single family residential or duplex 2 Commercial Lines Insurance: A distinction marking property and liability coverage written for business or entrepreneurial interests (includes institutional, industrial, multi-family residential and all buildings other than detached dwellings that are designated single family residential or duplex) as opposed to Personal Lines.

4 | P a g e
FIRE UNDERWRITERS SURVEY A SERVICE TO INSURERS AND MUNICIPALITIES
c/o Opta Information Intelligence
Dwelling Protection Grade for Personal Lines Insurance
The first fire insurance classification established and conveyed to FUS member companies is the Dwelling Protection Grade which is used by Personal Lines insurers. Personal Lines insurance covers the liability and property damage exposures of private individuals and their households. Typically it includes all detached dwellings that are designated single family residential or duplex. The DPG is a numerical system scaled from 1 to 5. DPG 1 represents the highest standard of service whereas DPG 5 indicates little or no recognized level of public fire protection. This grading reflects the ability of a community to effectively respond to fires in small buildings (single family residences and duplexes, aka. detached dwellings). An effective response requires adequate manpower (with appropriate training and equipment), apparatus, water supply and response time must be reasonably fast.
Public Fire Protection Classification for Commercial Lines The second grade that communities are interested in is the Public Fire Protection Classification. This grade is calculated from a comprehensive evaluation of the community and fire defense capabilities. This grade is a numerical value between 1 and 10 with 1 being superior fire protection and 10 being unprotected. The PFPC of a community is a significant factor that most insurance companies use to set insurance premium rates for all buildings insured under Commercial Lines (all buildings that are not single family residences or duplexes). This includes assembly, institutional, industrial, multi-family residential and all others. The PFPC considers over 500 different variables from 5 key areas: Risk Assessment, Water Supplies, Fire Department, Fire Safety Control, and Emergency Communications. Each variable is weighted differently based on its importance to municipal fire protection as a whole. The total score is then determined and scaled down to a 100 point system. As a result, single or small changes to current level of service, in most cases, will not result in improved or downgraded fire insurance grades. Rather it is implementing multiple changes (small or large) that will result in a grade change.
5 | P a g e
FIRE UNDERWRITERS SURVEY A SERVICE TO INSURERS AND MUNICIPALITIES
c/o Opta Information Intelligence
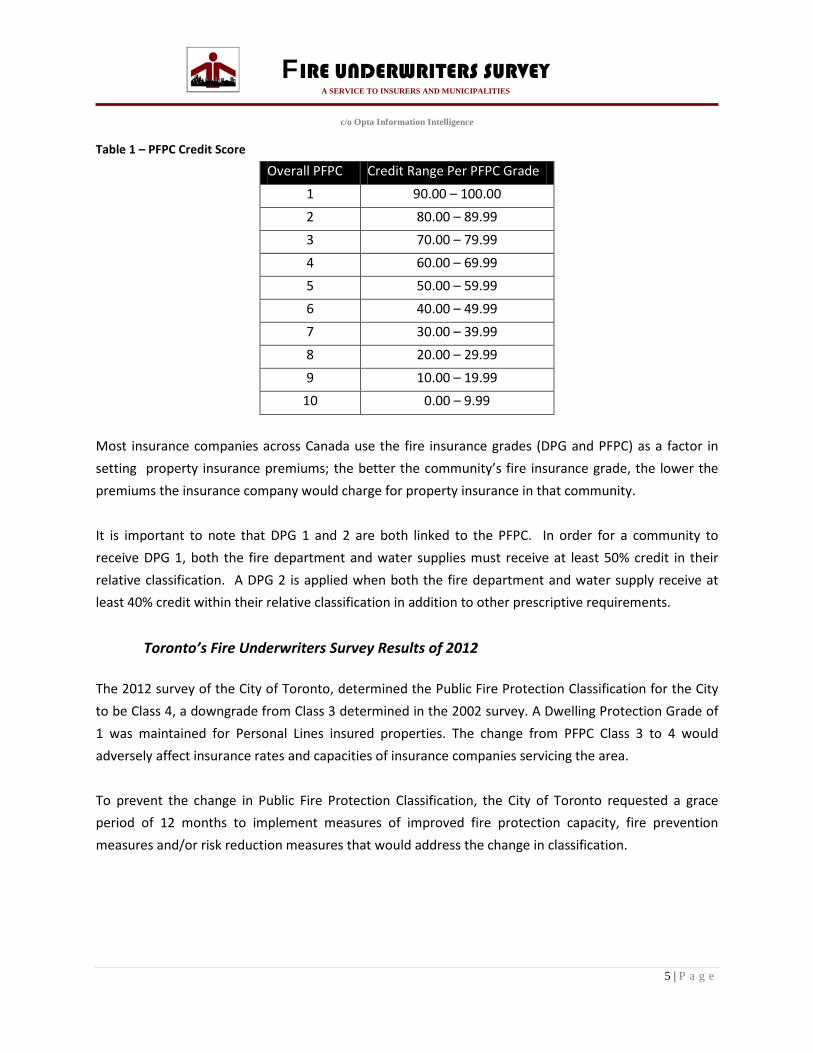
Table 1 – PFPC Credit Score
Overall PFPC Credit Range Per PFPC Grade 1 90.00 – 100.00 2 80.00 – 89.99 3 70.00 – 79.99 4 60.00 – 69.99 5 50.00 – 59.99 6 40.00 – 49.99 7 30.00 – 39.99 8 20.00 – 29.99 9 10.00 – 19.99
10 0.00 – 9.99 Most insurance companies across Canada use the fire insurance grades (DPG and PFPC) as a factor in setting property insurance premiums; the better the community’s fire insurance grade, the lower the premiums the insurance company would charge for property insurance in that community. It is important to note that DPG 1 and 2 are both linked to the PFPC. In order for a community to receive DPG 1, both the fire department and water supplies must receive at least 50% credit in their relative classification. A DPG 2 is applied when both the fire department and water supply receive at least 40% credit within their relative classification in addition to other prescriptive requirements.
Toronto’s Fire Underwriters Survey Results of 2012 The 2012 survey of the City of Toronto, determined the Public Fire Protection Classification for the City to be Class 4, a downgrade from Class 3 determined in the 2002 survey. A Dwelling Protection Grade of 1 was maintained for Personal Lines insured properties. The change from PFPC Class 3 to 4 would adversely affect insurance rates and capacities of insurance companies servicing the area. To prevent the change in Public Fire Protection Classification, the City of Toronto requested a grace period of 12 months to implement measures of improved fire protection capacity, fire prevention measures and/or risk reduction measures that would address the change in classification.

6 | P a g e
FIRE UNDERWRITERS SURVEY A SERVICE TO INSURERS AND MUNICIPALITIES
c/o Opta Information Intelligence
2. SCOPE OF WORK Fire Underwriters Survey was requested by the Toronto Fire Service (TFS) for the purpose of reviewing opportunities for improving the City of Toronto Public Fire Protection Classification (PFPC) from Class 4 to Class 3, from Class 3 to Class 2, from Class 2 to Class 1. This review considers data collected during the 2012 review of the fire risk level in the City of Toronto and the capabilities of Toronto Fire Services to prevent fire and reduce the loss of property due to fire. This review also utilizes various cost data (equipment costs, fire fighter training, fire prevention training, apparatus costs, etc.) provided by Toronto Fire Service. This study indicates where improvements can be made to the City of Toronto’s Public Fire Protection Classification and provides options for improving from Class 4 to Class 3, from Class 3 to Class 2, from Class 2 to Class 1. Costs associated with the options are also provided and are discussed in SECTION 6 COST OF OPTIONS. The values shown are not intended to be exact figures; rather they are intended to indicate the potential approximate costs associated with the improvements discussed.
3. TORONTO FIRE INSURANCE GRADING CREDITS As part of this review Fire Underwriters Survey considered the following factors when presenting options for improving the City’s PFPC:
- Overall cost - Cost effectiveness - Effective impact on fire insurance grades - Establishing new and more effective public fire protection techniques - Improving overall level of life safety throughout the City
Risk Assessment Benchmark Credits within the fire insurance grading system are granted relative to the risk in the built environment. Each city, and each subdivision/neighborhood within each city has different levels of fire risk and as such, different fire protection needs. To establish a benchmark of “maximum credit” for each area across the City of Toronto, a comprehensive fire risk assessment was conducted. This assessment utilized the building footprint and zoning bylaw GIS layers to establish calculated probable required fire flows for each building across the City. The City was then broken into separate primary response areas geographically with one area for each responding fire hall. Each of the primary response areas was
7 | P a g e
FIRE UNDERWRITERS SURVEY A SERVICE TO INSURERS AND MUNICIPALITIES
c/o Opta Information Intelligence
reviewed to determine the peak required fire flows. All of the risk assessment information and associated geocoded required fire flows were then run through an algorithm to establish Basic Fire Flows for each primary response area that became the benchmark of fire protection capacity against which all fire protection facilities were measured. Note that the Basic Fire Flow for each primary response area does not include anomalous buildings which are highly unusual for the area.
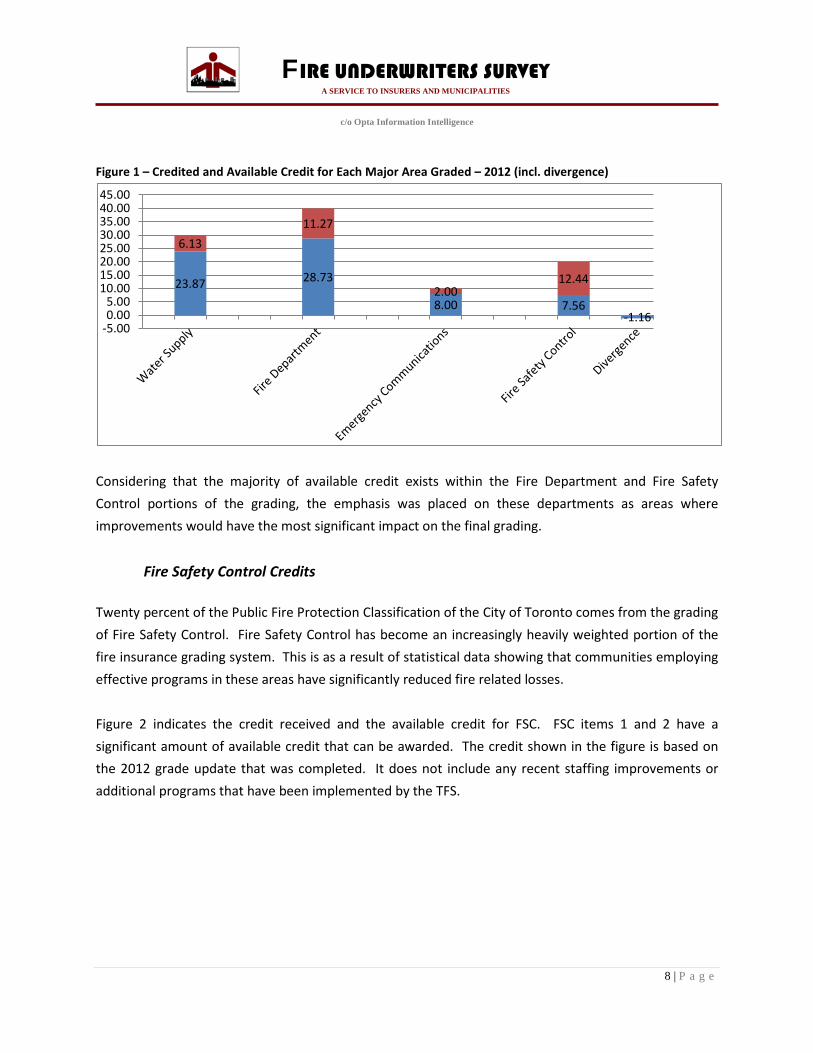
Credit Areas Each item within the fire insurance grade is weighted differently based on its importance to public fire protection. As such, the approach used for this study was to focus on the areas where the largest gains can be made to the City’s Public Fire Protection Classification. Figure 1 indicates the overall credit received in each of the major areas graded as part of the City of Toronto’s fire insurance grading. Each major area can receive additional credit; however the most amount of credit can be gained through the Fire Department operations and Fire Safety Control which considers fire prevention, public education and Building and Fire Codes. The sum of credit points received for the Toronto 2012 survey is 68.16; however, a divergence factor is applied to establish the final credit score. The divergence factor is determined from the difference between relative credit scores between the fire department and water supply. In the case of Toronto’s 2012 update, a divergence factor of 1.16 is used giving a final credit score of 67.00. Note the divergence factor is a function of the difference in relative credit points between the fire department and water supply. Therefore when options are considered that cause these relative scores to get closer, the divergence factor goes down, conversely when the relative scores get further apart, the divergence factor goes up.
8 | P a g e
FIRE UNDERWRITERS SURVEY A SERVICE TO INSURERS AND MUNICIPALITIES
c/o Opta Information Intelligence
Figure 1 – Credited and Available Credit for Each Major Area Graded – 2012 (incl. divergence)
Considering that the majority of available credit exists within the Fire Department and Fire Safety Control portions of the grading, the emphasis was placed on these departments as areas where improvements would have the most significant impact on the final grading.
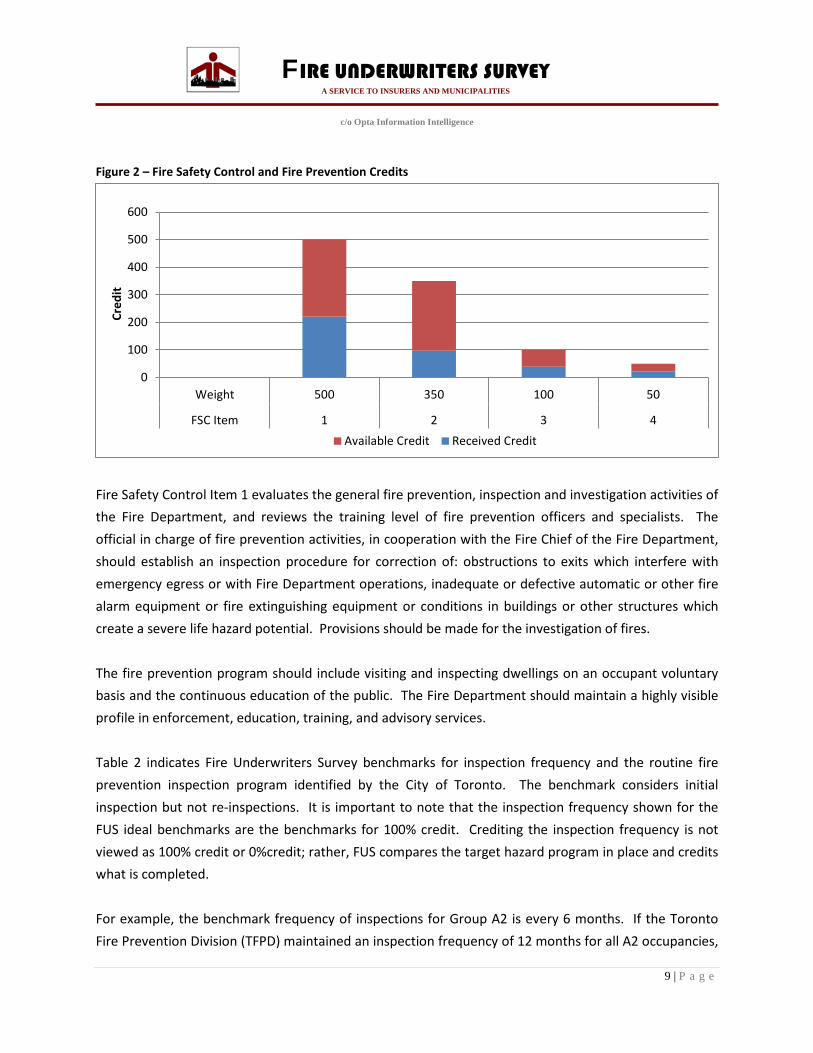
Fire Safety Control Credits Twenty percent of the Public Fire Protection Classification of the City of Toronto comes from the grading of Fire Safety Control. Fire Safety Control has become an increasingly heavily weighted portion of the fire insurance grading system. This is as a result of statistical data showing that communities employing effective programs in these areas have significantly reduced fire related losses. Figure 2 indicates the credit received and the available credit for FSC. FSC items 1 and 2 have a significant amount of available credit that can be awarded. The credit shown in the figure is based on the 2012 grade update that was completed. It does not include any recent staffing improvements or additional programs that have been implemented by the TFS.
23.87 28.73
8.00 7.56 -1.16
6.13 11.27
2.00 12.44
-5.000.005.00
10.0015.0020.0025.0030.0035.0040.0045.00
9 | P a g e
FIRE UNDERWRITERS SURVEY A SERVICE TO INSURERS AND MUNICIPALITIES
c/o Opta Information Intelligence
Figure 2 – Fire Safety Control and Fire Prevention Credits
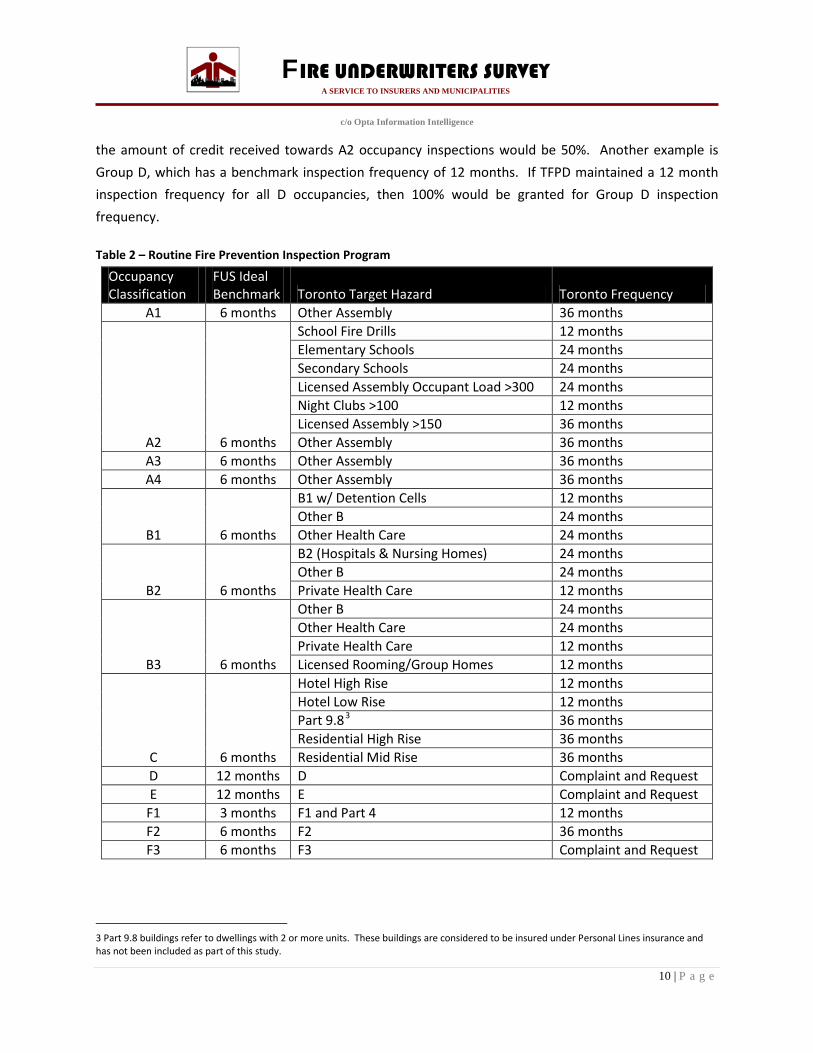
Fire Safety Control Item 1 evaluates the general fire prevention, inspection and investigation activities of the Fire Department, and reviews the training level of fire prevention officers and specialists. The official in charge of fire prevention activities, in cooperation with the Fire Chief of the Fire Department, should establish an inspection procedure for correction of: obstructions to exits which interfere with emergency egress or with Fire Department operations, inadequate or defective automatic or other fire alarm equipment or fire extinguishing equipment or conditions in buildings or other structures which create a severe life hazard potential. Provisions should be made for the investigation of fires. The fire prevention program should include visiting and inspecting dwellings on an occupant voluntary basis and the continuous education of the public. The Fire Department should maintain a highly visible profile in enforcement, education, training, and advisory services. Table 2 indicates Fire Underwriters Survey benchmarks for inspection frequency and the routine fire prevention inspection program identified by the City of Toronto. The benchmark considers initial inspection but not re-inspections. It is important to note that the inspection frequency shown for the FUS ideal benchmarks are the benchmarks for 100% credit. Crediting the inspection frequency is not viewed as 100% credit or 0%credit; rather, FUS compares the target hazard program in place and credits what is completed. For example, the benchmark frequency of inspections for Group A2 is every 6 months. If the Toronto Fire Prevention Division (TFPD) maintained an inspection frequency of 12 months for all A2 occupancies,
0
100
200
300
400
500
600
Weight 500 350 100 50
FSC Item 1 2 3 4
Cred
it
Available Credit Received Credit
10 | P a g e
FIRE UNDERWRITERS SURVEY A SERVICE TO INSURERS AND MUNICIPALITIES
c/o Opta Information Intelligence
the amount of credit received towards A2 occupancy inspections would be 50%. Another example is Group D, which has a benchmark inspection frequency of 12 months. If TFPD maintained a 12 month inspection frequency for all D occupancies, then 100% would be granted for Group D inspection frequency. Table 2 – Routine Fire Prevention Inspection Program
Occupancy Classification
FUS Ideal Benchmark Toronto Target Hazard Toronto Frequency
A1 6 months Other Assembly 36 months
A2 6 months
School Fire Drills 12 months Elementary Schools 24 months Secondary Schools 24 months Licensed Assembly Occupant Load >300 24 months Night Clubs >100 12 months Licensed Assembly >150 36 months Other Assembly 36 months
A3 6 months Other Assembly 36 months A4 6 months Other Assembly 36 months
B1 6 months
B1 w/ Detention Cells 12 months Other B 24 months Other Health Care 24 months
B2 6 months
B2 (Hospitals & Nursing Homes) 24 months Other B 24 months Private Health Care 12 months
B3 6 months
Other B 24 months Other Health Care 24 months Private Health Care 12 months Licensed Rooming/Group Homes 12 months
C 6 months
Hotel High Rise 12 months Hotel Low Rise 12 months Part 9.83 36 months Residential High Rise 36 months Residential Mid Rise 36 months
D 12 months D Complaint and Request E 12 months E Complaint and Request
F1 3 months F1 and Part 4 12 months F2 6 months F2 36 months F3 6 months F3 Complaint and Request
3 Part 9.8 buildings refer to dwellings with 2 or more units. These buildings are considered to be insured under Personal Lines insurance and has not been included as part of this study.

11 | P a g e
FIRE UNDERWRITERS SURVEY A SERVICE TO INSURERS AND MUNICIPALITIES
c/o Opta Information Intelligence
Fire Safety Control Item 2 evaluates fire safety laws and code enforcement of those laws within the municipality. Adequate laws or ordinances should be enacted to properly regulate the manufacture, storage, transportation and use of hazardous liquids, gases, and other combustible materials, including the handling of combustible waste, and to properly control building construction and electrical, heating, and ventilating installations. The National Fire and Building Codes of Canada and the Canadian Electrical Codes are accepted as the minimum standard regulation. Proper records of permits (licenses if required by local regulation), inspections, violations and their correction, and of all other important matters should be kept and analyzed.
Fire Department Credits The Fire Department Grading consists of 19 items. Forty percent of the Public Fire Protection Classification of the City of Toronto comes from the grading of the Fire Department. Areas reviewed in a Fire Department assessment are as follows:
- FD 1 – Engine Service - FD 2 – Ladder Service - FD 3 – Distribution of Companies - FD 4 – Pump Capacity - FD 5 – Design, Maintenance and Condition of Fire Apparatus - FD 6 – Number of Line Officer – Suppression - FD 7 – Total Available Fire Force - FD 8 – Engine and Ladder Company Unit Staff Strength - FD 9 – Master and Special Stream Devices - FD 10 – Equipment for Engines and Ladder Apparatus - FD 11 – Fire Hose - FD 12 – Condition of Fire Hose - FD 13 – Training and Qualifications - FD 14 – Response to Alarms - FD 15 – Fire Ground Operations - FD 16 – Special Protection Required - FD 17 – Miscellaneous Factors and Conditions - FD 18 – Pre-Incident Planning - FD 19 - Administration

12 | P a g e
FIRE UNDERWRITERS SURVEY A SERVICE TO INSURERS AND MUNICIPALITIES
c/o Opta Information Intelligence
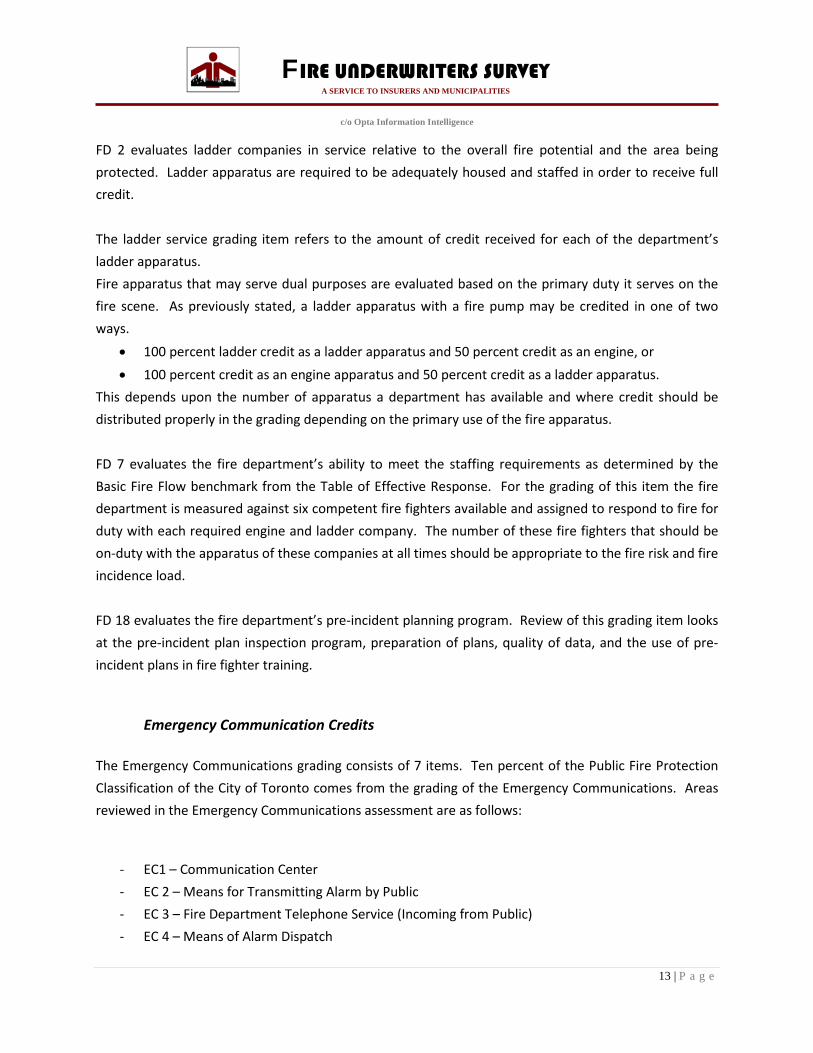
As shown in Figure 3, the Toronto Fire Service received nearly maximum credit in each item reviewed. The most notable areas of where additional credit can be received are items FD 1, FD 2, FD 7 and FD 18. Figure 3 – Fire Department Item Credits
FD 1 evaluates the number of engine companies in service relative to the overall fire potential and the area being protected. Engine apparatus are required to be adequately housed and staffed in order to receive full credit. The engine service grading item refers to the amount of credit received for each of the department’s engines. Fire apparatus that serve dual purposes are evaluated based on the primary duty it serves on the fire ground. For example, a ladder apparatus with a fire pump may be credited in one of two ways.
• 100 percent credit as a ladder apparatus and 50 percent credit as an engine, or • 100 percent credit as an engine apparatus and 50 percent credit as a ladder apparatus.
This depends upon the number of apparatus a department has available and where credit should be distributed properly in the grading depending on the primary use of the fire apparatus.
0
100
200
300
400
500
600
Wei
ght
240
170
200
170
150
100
400
480 50 50 180 50 400
100
300
100
200
200
200
FDItem
1 2 3 4 5 6 7 8 9 10 11 12 13 14 15 16 17 18 19
Cred
it
Received Credit Available Credit
13 | P a g e
FIRE UNDERWRITERS SURVEY A SERVICE TO INSURERS AND MUNICIPALITIES
c/o Opta Information Intelligence
FD 2 evaluates ladder companies in service relative to the overall fire potential and the area being protected. Ladder apparatus are required to be adequately housed and staffed in order to receive full credit. The ladder service grading item refers to the amount of credit received for each of the department’s ladder apparatus. Fire apparatus that may serve dual purposes are evaluated based on the primary duty it serves on the fire scene. As previously stated, a ladder apparatus with a fire pump may be credited in one of two ways.
• 100 percent ladder credit as a ladder apparatus and 50 percent credit as an engine, or • 100 percent credit as an engine apparatus and 50 percent credit as a ladder apparatus.
This depends upon the number of apparatus a department has available and where credit should be distributed properly in the grading depending on the primary use of the fire apparatus. FD 7 evaluates the fire department’s ability to meet the staffing requirements as determined by the Basic Fire Flow benchmark from the Table of Effective Response. For the grading of this item the fire department is measured against six competent fire fighters available and assigned to respond to fire for duty with each required engine and ladder company. The number of these fire fighters that should be on-duty with the apparatus of these companies at all times should be appropriate to the fire risk and fire incidence load. FD 18 evaluates the fire department’s pre-incident planning program. Review of this grading item looks at the pre-incident plan inspection program, preparation of plans, quality of data, and the use of pre-incident plans in fire fighter training.
Emergency Communication Credits The Emergency Communications grading consists of 7 items. Ten percent of the Public Fire Protection Classification of the City of Toronto comes from the grading of the Emergency Communications. Areas reviewed in the Emergency Communications assessment are as follows:
- EC1 – Communication Center - EC 2 – Means for Transmitting Alarm by Public - EC 3 – Fire Department Telephone Service (Incoming from Public) - EC 4 – Means of Alarm Dispatch

14 | P a g e
FIRE UNDERWRITERS SURVEY A SERVICE TO INSURERS AND MUNICIPALITIES
c/o Opta Information Intelligence
- EC 5 – Dispatching Service - EC 6 – Operations Radio - EC 7 – Miscellaneous Factors
As shown in Figure 4, Toronto received nearly maximum credit in each item reviewed. The most notable area where additional credit can be received is item EC4.
Figure 4 - Emergency Communications Item Credits
EC4 considers the point of receipt of fire alarms from the public. It is necessary to have reliable and prompt notification of fire fighters to respond. Sufficiency of circuits or radio frequencies for the transmission of alarms to fire stations shall be provided as required by NFPA 1221. Alarm-receiving equipment in fire stations, and elsewhere as may be required, shall be provided and served as specified in NFPA 1221.
Water Supplies for Public Fire Protection Credits The Water Supplies for Public Fire Protection grading consists of 15 items. Thirty percent of the Public Fire Protection Classification of the City of Toronto comes from the grading of the Water Supplies for Public Fire Protection. Areas reviewed in the Water Supplies for Public Fire Protection assessment are as follows:
0.0
50.0
100.0
150.0
200.0
250.0
300.0
350.0
Weight 60 80 80 300 100 80 30
EC Item 1 2 3 4 5 6 7
Cred
it
Received Credit Available Credit
15 | P a g e
FIRE UNDERWRITERS SURVEY A SERVICE TO INSURERS AND MUNICIPALITIES
c/o Opta Information Intelligence
- WS 1 – Normal Adequacy of Supply Works - WS 2 – Reliability of Sources of Supply - WS 3 – Reliability of Pumping Capacity (Pumps and Drivers) - WS 4 – Reliability of Power Supply - WS 5 – Reliability, Condition, Arrangement, Operation, and Maintenance of System Components - WS 6 – Fireflow Delivery by Mains - WS 7 – Reliability of Principal Mains - WS 8 – Installation of Pipes - WS 9 – Arrangement of Distribution System - WS 10 – Additional Factors and Conditions Relating To Supply and Distribution - WS 11 – Distribution of Hydrants - WS 12 – Hydrants – Size, Type, and Installation - WS 13 – Hydrants – Condition and Inspection - WS 14 – Other Conditions affecting Adequacy and Reliability - WS 15 – Management
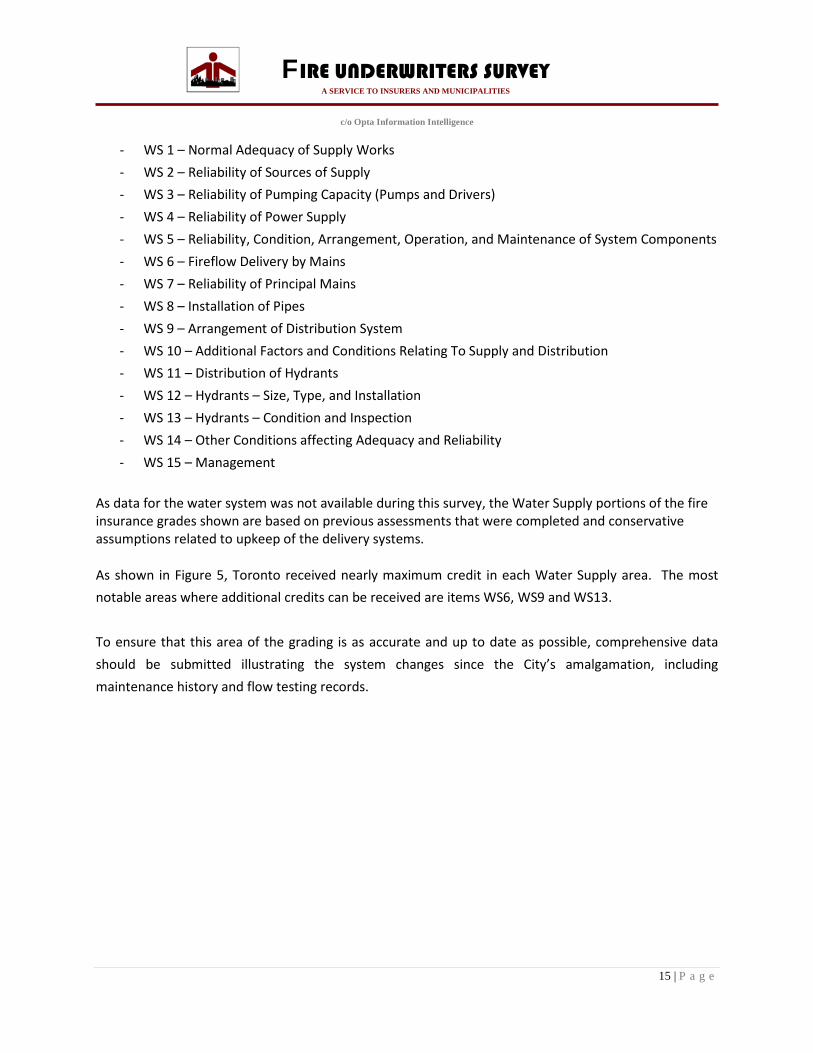
As data for the water system was not available during this survey, the Water Supply portions of the fire insurance grades shown are based on previous assessments that were completed and conservative assumptions related to upkeep of the delivery systems. As shown in Figure 5, Toronto received nearly maximum credit in each Water Supply area. The most notable areas where additional credits can be received are items WS6, WS9 and WS13. To ensure that this area of the grading is as accurate and up to date as possible, comprehensive data should be submitted illustrating the system changes since the City’s amalgamation, including maintenance history and flow testing records.

16 | P a g e
FIRE UNDERWRITERS SURVEY A SERVICE TO INSURERS AND MUNICIPALITIES
c/o Opta Information Intelligence
Figure 5 - Water Supplies for Public Fire Protection Item Credits
4. OPTIONS FOR IMPROVEMENTS Various options are presented in this study for the purposes of improving the fire insurance grades throughout the City of Toronto and are as follows:
- Option 1 – Improve ladder credit with quints and additional fire fighting staff - Option 2 – Improve Fire Safety Control – Fire Prevention Division Enhancement
o A – 53.6 additional staff o B – 71.5 additional staff o C – 77.1 additional staff o D – 88.3 additional staff o E – 131.4 additional staff o F – 136.8 additional staff o G – 165.7 additional staff
- Option 3 – Improve Pre-Incident Planning - Option 4 - Improved Fire Response with Predictive Modelling, Live Interactive GPS and Pre-
Emptive Traffic Light Signalling
0
100
200
300
400
500
600
700
800W
eigh
t
300
200
150
182
200
700
100
100
100
200
450
100
100
200
100
WSItem
1 2 3 4 5 6 7 8 9 10 11 12 13 14 15
Cred
it
Received Credit Available Credit
17 | P a g e
FIRE UNDERWRITERS SURVEY A SERVICE TO INSURERS AND MUNICIPALITIES
c/o Opta Information Intelligence
Option 1 considers the potential impacts on the fire insurance grades should the TFS purchase ten (10) new quint apparatus and staff each with five (5) fire fighters (four (4) fire fighters and one (1) captain). The placement of the apparatus was based on the ten (10) fire stations that received the least amount of credit in FD 2 Ladder Service. This option does not replace the existing engine company that is currently in the station; rather, the new quint and crew are additional to what is currently in those stations. Option 2 considers an enhancement of TFPD with additional fire prevention staff to facilitate a more robust target hazard (routine inspection) program and tracking additional information in a fire prevention database such as the one used in Toronto, “One Step”. This option determines the potential impacts on the fire insurance grades should TFPD adopt a more stringent routine inspection program in addition to tracking additional information within One Step. This review considers the total number of occupancies within the City and the approximate time needed to complete an inspection for each occupancy type (based on data provided by TFS in 2013). The data was evaluated to determine incremental improvements and the impacts they have on the fire insurance grades. Section 5 IMPACT OF OPTIONS ON FIRE INSURANCE GRADES details the number of additional fire prevention staff needed to meet varying routine inspection programs and the associated fire insurance grade credits. Option 3 reviews the existing pre-incident plan program and discusses a project plan for improvement. The project plan also includes the impact on the fire insurance grades based on incremental improvements to the pre-incident plan program. Option 4 reviews improvements in emergency communication and alerting systems, data tracking and use of historical evidence to support targeted and more effective response (predictive modeling, response of nearest crews based on actual locations and pre-emptive traffic light signalling).
5. IMPACT OF OPTIONS ON FIRE INSURANCE GRADES The City of Toronto’s final PFPC credit score in 2012 was 67.00 (including a divergence factor of -1.16). This value was adjusted to 67.22 (including a divergence factor of -1.10) in March of 2013 as information about service level changes was reported to FUS. The following options provide a comparative analysis of the potential impacts on the fire insurance grades should the City of Toronto choose to implement any of the options discussed within this study. It is important to note that the potential change in credit

18 | P a g e
FIRE UNDERWRITERS SURVEY A SERVICE TO INSURERS AND MUNICIPALITIES
c/o Opta Information Intelligence
discussed are based on risk levels in 2012/2013 and are intended to help the City of Toronto improve its public fire protection and fire insurance grades. Should the City of Toronto make any changes to its pubic fire protection program, Fire Underwriters Survey should be notified to update the information so that the fire insurance grades better reflect the service levels provided throughout the City.
Option 1 – Improve Ladder Credit with Additional Quint Apparatus and Staff This option considers additional quint apparatus and staff assigned to the ten (10) stations that received the least amount of ladder credit within the fire insurance grading. Table 3 shows the Fire Department grade items that are impacted by adding a quint and five (5) fire fighters to the ten (10) stations that received the least amount of ladder credit. The analysis also considers the new quint apparatus responding to neighbouring stations as well and in most cases provided a slight increase in credit to some of the neighbouring fire stations. The overall credit score improvement is shown in Table 3. Table 3 – Option 1 - Fire Station Credits with Quints
Existing Credit Option 1 Improvements Fire Station # FD 1 Credit FD 2 Credit FD 7 Credit FD 1 Credit FD 2 Credit FD 7 Credit
233 86% 37% 71% 89% 95% 88% 412 83% 38% 53% 86% 90% 67% 123 88% 44% 59% 88% 95% 74% 143 87% 49% 72% 89% 95% 94% 444 88% 49% 69% 87% 85% 80% 223 88% 50% 77% 89% 87% 88% 145 88% 57% 78% 89% 88% 88% 112 88% 58% 80% 89% 98% 93% 114 89% 58% 69% 89% 92% 77% 214 89% 61% 73% 89% 94% 79%
PFPC Credit Score – without changes 67.22 Impact on Fire Insurance Grading – City of Toronto + 0.88
Final PFPC Credit Score – City of Toronto 68.10 The overall impact on the City of Toronto’s PFPC is an increase of 0.88 credit points resulting in a final PFPC credit score of 68.10 (maintaining Class 4). To achieve Class 3, the final credit points must be at least 70.0. The cost associated with implementing this option is discussed in SECTION 6 COST OF OPTIONS.

19 | P a g e
FIRE UNDERWRITERS SURVEY A SERVICE TO INSURERS AND MUNICIPALITIES
c/o Opta Information Intelligence
Notably the addition of 10 quints does not have as significant of an impact as might be expected considering the cost. This is a result of the current coverage of Toronto fire halls and companies. It is not possible to get significant credits by adding fire apparatus and companies with the current layout as most areas are reasonably well covered. Adding an apparatus company may only affect a small percentage of the total number of buildings in Toronto. That being said, if coverage re-alignments were considered, coverage improvements and optimization may be possible, however that is beyond the scope of this study.
20 | P a g e
FIRE UNDERWRITERS SURVEY A SERVICE TO INSURERS AND MUNICIPALITIES
c/o Opta Information Intelligence
Option 2 – Improve Fire Safety Control – Fire Prevention Division Enhancement
This option reviews an enhancement of the routine fire prevention inspections, additional staff needed to implement more routine inspections and maintaining more comprehensive details of inspections and violations within One Step. To determine the number of additional fire prevention staff needed for an enhanced routine inspection program, TFS provided details as seen in Table 4. The staff levels needed for more stringent routine inspections was derived from this data. Table 5 indicates the additional staff levels needed to meet different FUS benchmarks and also provides the potential impact on the City of Toronto’s final PFPC credit score. The final credit score shown in Table 5 includes ensuring data on pre-incident plans are kept up to date (see Option 3 – Improve Pre-Incident Planning, regularly updated to ensure accuracy of data,). Further to this, it was assumed that as TFPD staff increases, additional inspection details would be included in One Step. The final credit scores include more comprehensive inspection details within One Step, such as:
- FUS Benchmark #1 - Better field note archive system. Store digital copy of inspectors’ field notes as part of the inspection summary report in One Step. (25% of routine and complaint and request inspections completed in past 3 years)
- FUS Benchmark #2 - Better violation archive system. Store digital copy of violation report as part of inspection summary report in One Step + inspectors’ field notes. (50% of routine and complaint and request inspections completed in past 3 years)
- FUS Benchmark #3 - Better violation archive system. Store digital copy of violation report as part of inspection summary report in One Step + inspectors’ field notes. (70% of routine and complaint and request inspections completed in past 3 years)
- FUS Benchmark #4 - Better violation archive system. Store digital copy of violation report as part of inspection summary report in One Step + inspectors’ field notes. (80% of routine and complaint and request inspections completed in past 3 years)
- FUS Benchmark #5 and #6 - Better violation archive system. Store digital copy of violation report as part of inspection summary report in One Step + inspectors’ field notes. (90% of routine and complaint and request inspections completed in past 3 years)
In each FUS Benchmark described above, ‘routine inspections’ refers to the routine inspection program that is shown in Table 5 and not the existing routine inspection program that is currently adopted by TFS. Additionally, the Ontario fire service training standards (firefighter certificate, company training

21 | P a g e
FIRE UNDERWRITERS SURVEY A SERVICE TO INSURERS AND MUNICIPALITIES
c/o Opta Information Intelligence
officer, fire prevention officer, etc.) are currently being phased out. The training standards that will be used in Ontario will be NFPA (1001, 1002, 1021, 1031, 1033, 1035, etc.). This change is expected to occur in mid-2013. As part of the process of implementing NFPA standards, it is anticipated that the majority of personnel within Ontario will be grandfathered and will be granted their equivalent certificate (firefighter, company officer, fire prevention inspector). This assessment has considered this provincial change and reviewed the TFPD credit assuming that the majority of fire prevention staff will have their respective NFPA certificates. A secondary analysis was completed to determine the final credit points if TFPD does not make any changes to the information kept in One Step (i.e. no digital records of fire prevention inspection field notes and no digital copy of violation report handed to occupant owner). As seen in Table 5, the greatest amount of credit can be received if the routine inspection program consists of 6 month inspections for the majority of occupancies. Some allowances are permitted for occupancies to have an inspection once every 12 months. To receive the credit shown under FUS Benchmark #6, a total of 165.7 additional staff would be needed in addition to maintaining 90% of inspectors’ field notes and violation reports (provided to occupant owner) in digital format as part of the One Step inspection summary report. The number of additional staff needed to meet the varying FUS Benchmarks is based on occupancy data from 2013. As the City continues to grow and more buildings and occupancies are created, the number of staff that may be needed to meet the different FUS Benchmarks can be expected to change as well. Additionally, this study was completed to provide TFS with a framework of what would be needed to improve from PFPC 4 to PFPC 3 and PFPC 2. As TFS continues to make improvements, it is strongly encouraged that Fire Underwriters Survey be notified to evaluate the changes and determine when a change in PFPC should be put in effect.

22 | P a g e
FIRE UNDERWRITERS SURVEY A SERVICE TO INSURERS AND MUNICIPALITIES
Table 4 – Toronto Proposes Scheduled Risk Based Inspection Program
Occupancy
Building Code Occupancy
Total Number of Occupancies (#)
Lines of Insurance
Hours per Initial (H)
Total Hours (T)
Frequency (F) (1=annual) (0.5=every 2 yrs) (0.33 = every 3 yrs)
Total Inspection Days (TD)
Total Person Years (TPY)
Number of Inspections if Risk Matrix Followed
(# x H = T) T x F/7 TD/168 Assembly Occupancies (General, >150 Licensed and >300) A 5,597 Commercial 1 5,597 1 799.6 4.8 5597.0 Assembly - >150 A 737 Commercial 2 1,474 1 210.6 1.3 737.0 Assembly >300 A 353 Commercial 3.5 1,236 1 176.5 1.1 353.0 Night Clubs A2 100 Commercial 2 200 2 57.1 0.3 200.0 Elementary Schools A2 806 Commercial 3 2,418 1 345.4 2.1 806.0 High Schools A2 205 Commercial 4 820 1 117.1 0.7 205.0 Daycares A2 900 Commercial 3 2,700 1 385.7 2.3 900.0 Hospitals B2 40 Commercial 80 3,200 0.5 228.6 1.4 20.0 B1 B1 30 Commercial 4 120 1 17.1 0.1 30.0 B2 B2 221 Commercial 3 663 1 94.7 0.6 221.0 B3 B3 159 Commercial 2.5 398 1 56.8 0.3 159.0 Rooming Houses / Group Homes B3 1,718 Commercial 2 3,436 1 490.9 2.9 1718.0 Residential Mid Rise - up to and including 6 storeys in building height C 4,257 Commercial 2 8,514 0.5 608.1 3.6 2128.5 Residential High Rise - higher than 6 storeys in building height C 3,720 Commercial 4 14,880 0.5 1062.9 6.3 1860.0 Hotel, High C 100 Commercial 5 500 1 71.4 0.4 100.0 Hotel, mid C 33 Commercial 4 132 1 18.9 0.1 33.0 Business, Personal Services, and Mercantile D/E 20,784 Commercial 1 20,784 0.3 890.7 5.3 6235.2 High Hazard Industrial Occupancies F1 2,775 Commercial 4 11,100 1 1585.7 9.4 2775.0 Medium Hazard Industrial Occupancies F2 7,919 Commercial 3 23,757 0.5 1696.9 10.1 3959.5 Low Hazard Industrial Occupancies F3 964 Commercial 2 1,928 0.3 82.6 0.5 289.2

23 | Page
FIRE UNDERWRITERS SURVEY
Table 5 – Option 2 - Enhanced Routine Inspection Program and FUS Credits Occupancy Classification
FUS Ideal Benchmark Toronto Target Hazard
A - Toronto Frequency (53.6 staff)
B - FUS Benchmark #1 (71.5 staff)
C - FUS Benchmark #2 (77.1 staff)
D - FUS Benchmark #3 (88.3 staff)
E - FUS Benchmark #4 (131.4 staff)
F - FUS Benchmark #5 (136.8 staff)
G - FUS Benchmark #6 (165.7 staff)
A1 6 months Other Assembly 36 months 24 months 24 months 12 months 6 months 6 months 6 months
A2 6 months
School Fire Drills 12 months 12 months 12 months 12 months 6 months 6 months 6 months Elementary Schools 24 months 12 months 12 months 12 months 6 months 6 months 6 months Secondary Schools 24 months 12 months 12 months 12 months 6 months 6 months 6 months Licensed Assembly Occupant Load >300 24 months 24 months 12 months 12 months 6 months 6 months 6 months Night Clubs >100 12 months 24 months 12 months 12 months 6 months 6 months 6 months Licensed Assembly >150 36 months 24 months 12 months 12 months 6 months 6 months 6 months Other Assembly 36 months 24 months 12 months 12 months 6 months 6 months 6 months
A3 6 months Other Assembly 36 months 24 months 12 months 12 months 6 months 6 months 6 months A4 6 months Other Assembly 36 months 24 months 12 months 12 months 6 months 6 months 6 months
B1
4 months B1 w/ Detention Cells 12 months 12 months 12 months 12 months 4 months 4 months 4 months 4 months Other B 24 months 12 months 12 months 12 months 4 months 4 months 4 months 4 months Other Health Care 24 months 12 months 12 months 12 months 4 months 4 months 4 months
B2
2 months B2 (Hospitals & Nursing Homes) 24 months 12 months 12 months 12 months 4 months 2 months 2 months 4 months Other B 24 months 12 months 12 months 12 months 4 months 4 months 4 months 4 months Private Health Care 12 months 12 months 12 months 12 months 4 months 4 months 4 months
B3
4 months Other B 24 months 12 months 12 months 12 months 4 months 4 months 4 months 4 months Other Health Care 24 months 12 months 12 months 12 months 4 months 4 months 4 months 4 months Private Health Care 12 months 12 months 12 months 12 months 4 months 4 months 4 months 6 months Licensed Rooming/Group Homes 12 months 12 months 12 months 12 months 6 months 6 months 6 months
C
4 months Hotel High Rise 12 months 12 months 12 months 12 months 6 months 6 months 4 months 4 months Hotel Low Rise 12 months 12 months 12 months 12 months 6 months 6 months 4 months
n/a Part 9.8 n/a n/a n/a n/a n/a n/a n/a 6 months Residential High Rise 36 months 12 months 12 months 12 months 6 months 6 months 6 months 6 months Residential Mid/Low Rise 36 months 12 months 12 months 12 months 6 months 6 months 6 months
D 12 months D Complaint and Request 36 months 24 months 12 months 12 months 12 months 12 months E 12 months E Complaint and Request 36 months 24 months 12 months 12 months 12 months 12 months
F1 3 months F1 and Part 4 12 months 12 months 12 months 12 months 12 months 12 months 3 months F2 6 months F2 36 months 12 months 12 months 12 months 12 months 12 months 12 months F3 6 months F3 Complaint and Request 24 months 12 months 12 months 12 months 12 months 12 months
Impact on Fire Insurance Grading (w/ Enhancements) + 1.51 + 2.27 + 2.84 + 4.46 + 6.16 + 7.38 + 8.64 Divergence included in final PFPC Credit Score -1.00 -0.98 -0.96 -0.92 -0.85 -0.85 -0.81 Final PFPC Credit Score (w/ Enhancements) 68.73 69.49 70.06 71.68 73.38 74.60 75.86 Impact on Fire Insurance Grading (w/o Inspection Report Enhancement) + 1.03 + 1.27 + 1.66 + 2.62 + 3.38 + 3.92 + 4.40 Divergence included in final PFPC Credit Score -1.00 -0.98 -0.96 -0.92 -0.85 -0.85 -0.81 Final PFPC Credit Score (w/o Inspection Report Enhancement) 68.25 68.49 68.88 69.84 70.6 71.14 71.62 Impact on Fire Insurance Grading (w/o Pre-Incident Plan Data Review) + 1.14 + 1.84 + 2.32 + 3.82 + 5.24 + 6.46 + 7.60 Divergence included in final PFPC Credit Score -1.10 -1.10 -1.10 -1.10 -1.10 -1.10 -1.10 Final PFPC Credit Score (w/o Pre-Incident Plan Data Review) 68.36 69.06 69.54 71.04 72.46 73.68 74.82
24 | P a g e
FIRE UNDERWRITERS SURVEY A SERVICE TO INSURERS AND MUNICIPALITIES
c/o Opta Information Intelligence
Option 3 – Improve Pre-Incident Planning
Developing an effective pre-incident plan program is complicated and requires a phased approach to effectively implement. An effective pre-incident plan assists the responding personnel in effectively managing emergencies for the protection of occupants, responding personnel, property and the environment. Fire Underwriters Survey evaluates pre-incident plans based on the following:
- Availability of pre-incident plans for all buildings except for single family dwellings and duplexes,
- quality of pre-incident plans (hard copy, or soft copy integrated with emergency communications and available to crews for training),
- regularly updated plans to ensure accuracy of data (occupant details, floor plans, permanent fixtures, hazards, etc.),
- availability of plans to all responding personnel for training and during emergency response, - Use of plans in training and building familiarizations (building tours) completed by fire fighting
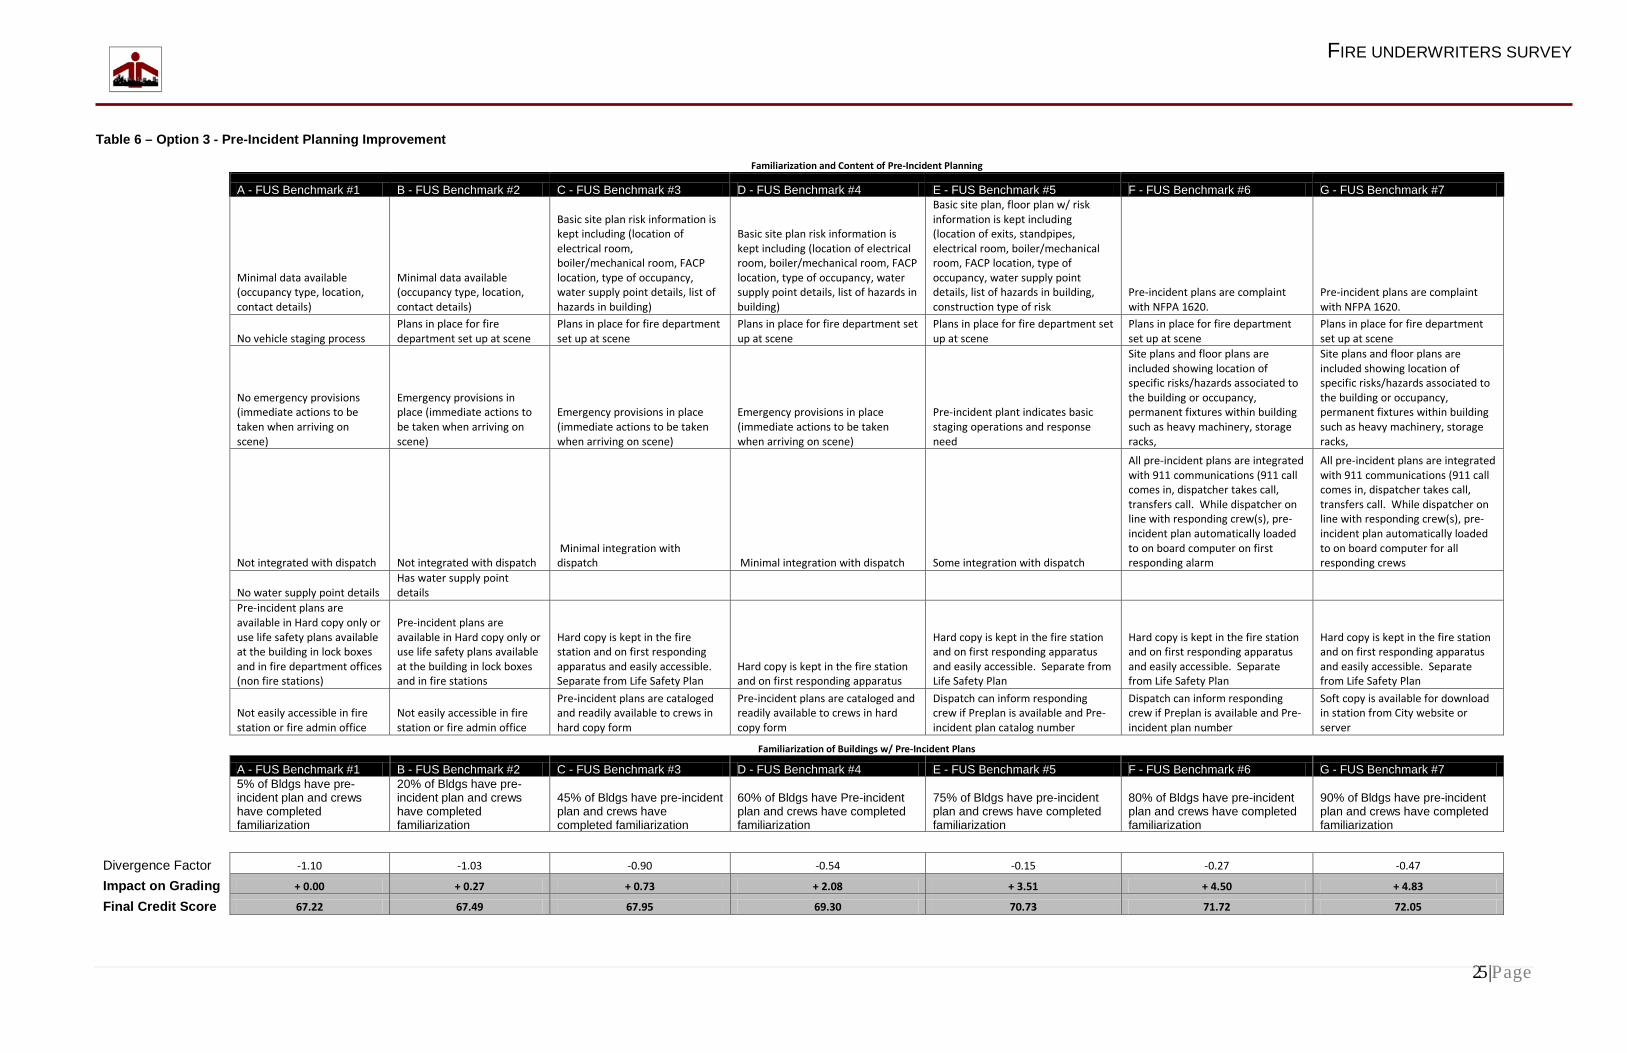
crews. Within the City of Toronto, life safety plans are reviewed and accepted by TFPD and are kept in fire prevention offices as well as in lock boxes in buildings requiring a life safety plan. Digital copies are not kept or requested by TFPD. Table 6 provides a summary of the varying benchmarks to achieve for pre-incident planning and the associated credits with each improvement. As the pre-incident plan program becomes more advanced, complete and integrated with communications the associated credit increases significantly.
25 | Page
FIRE UNDERWRITERS SURVEY
Table 6 – Option 3 - Pre-Incident Planning Improvement
Familiarization and Content of Pre-Incident Planning
A - FUS Benchmark #1 B - FUS Benchmark #2 C - FUS Benchmark #3 D - FUS Benchmark #4 E - FUS Benchmark #5 F - FUS Benchmark #6 G - FUS Benchmark #7
Minimal data available (occupancy type, location, contact details)
Minimal data available (occupancy type, location, contact details)
Basic site plan risk information is kept including (location of electrical room, boiler/mechanical room, FACP location, type of occupancy, water supply point details, list of hazards in building)
Basic site plan risk information is kept including (location of electrical room, boiler/mechanical room, FACP location, type of occupancy, water supply point details, list of hazards in building)
Basic site plan, floor plan w/ risk information is kept including (location of exits, standpipes, electrical room, boiler/mechanical room, FACP location, type of occupancy, water supply point details, list of hazards in building, construction type of risk
Pre-incident plans are complaint with NFPA 1620.
Pre-incident plans are complaint with NFPA 1620.
No vehicle staging process
Plans in place for fire department set up at scene
Plans in place for fire department set up at scene
Plans in place for fire department set up at scene
Plans in place for fire department set up at scene
Plans in place for fire department set up at scene
Plans in place for fire department set up at scene
No emergency provisions (immediate actions to be taken when arriving on scene)
Emergency provisions in place (immediate actions to be taken when arriving on scene)
Emergency provisions in place (immediate actions to be taken when arriving on scene)
Emergency provisions in place (immediate actions to be taken when arriving on scene)
Pre-incident plant indicates basic staging operations and response need
Site plans and floor plans are included showing location of specific risks/hazards associated to the building or occupancy, permanent fixtures within building such as heavy machinery, storage racks,
Site plans and floor plans are included showing location of specific risks/hazards associated to the building or occupancy, permanent fixtures within building such as heavy machinery, storage racks,
Not integrated with dispatch Not integrated with dispatch
Minimal integration with dispatch Minimal integration with dispatch Some integration with dispatch
All pre-incident plans are integrated with 911 communications (911 call comes in, dispatcher takes call, transfers call. While dispatcher on line with responding crew(s), pre-incident plan automatically loaded to on board computer on first responding alarm
All pre-incident plans are integrated with 911 communications (911 call comes in, dispatcher takes call, transfers call. While dispatcher on line with responding crew(s), pre-incident plan automatically loaded to on board computer for all responding crews
No water supply point details
Has water supply point details
Pre-incident plans are available in Hard copy only or use life safety plans available at the building in lock boxes and in fire department offices (non fire stations)
Pre-incident plans are available in Hard copy only or use life safety plans available at the building in lock boxes and in fire stations
Hard copy is kept in the fire station and on first responding apparatus and easily accessible. Separate from Life Safety Plan
Hard copy is kept in the fire station and on first responding apparatus
Hard copy is kept in the fire station and on first responding apparatus and easily accessible. Separate from Life Safety Plan
Hard copy is kept in the fire station and on first responding apparatus and easily accessible. Separate from Life Safety Plan
Hard copy is kept in the fire station and on first responding apparatus and easily accessible. Separate from Life Safety Plan
Not easily accessible in fire station or fire admin office
Not easily accessible in fire station or fire admin office
Pre-incident plans are cataloged and readily available to crews in hard copy form
Pre-incident plans are cataloged and readily available to crews in hard copy form
Dispatch can inform responding crew if Preplan is available and Pre-incident plan catalog number
Dispatch can inform responding crew if Preplan is available and Pre-incident plan number
Soft copy is available for download in station from City website or server
Familiarization of Buildings w/ Pre-Incident Plans
A - FUS Benchmark #1 B - FUS Benchmark #2 C - FUS Benchmark #3 D - FUS Benchmark #4 E - FUS Benchmark #5 F - FUS Benchmark #6 G - FUS Benchmark #7
5% of Bldgs have pre-incident plan and crews have completed familiarization
20% of Bldgs have pre-incident plan and crews have completed familiarization
45% of Bldgs have pre-incident plan and crews have completed familiarization
60% of Bldgs have Pre-incident plan and crews have completed familiarization
75% of Bldgs have pre-incident plan and crews have completed familiarization
80% of Bldgs have pre-incident plan and crews have completed familiarization
90% of Bldgs have pre-incident plan and crews have completed familiarization
Divergence Factor -1.10 -1.03 -0.90 -0.54 -0.15 -0.27 -0.47
Impact on Grading + 0.00 + 0.27 + 0.73 + 2.08 + 3.51 + 4.50 + 4.83
Final Credit Score 67.22 67.49 67.95 69.30 70.73 71.72 72.05

26 | P a g e
FIRE UNDERWRITERS SURVEY A SERVICE TO INSURERS AND MUNICIPALITIES
c/o Opta Information Intelligence
Option 4 – Improved Response Systems The Toronto Fire Service has made a commitment to enhance their communications and alerting systems and response protocols in 2014. This enhancement can potentially improve response times throughout the City of Toronto. More specifically, the enhancements are:
- Predictive fire response model (move-up-model) - Live interactive GPS response (response of nearest crew and apparatus, not fire station based) - Pre-emptive traffic light signalling
The move-up-model and live interactive GPS response are anticipated to be in operation by 2014. Implementation dates of the pre-emptive traffic light signalling are unavailable at this time. Each one of these items can help improve response in areas of the City by reducing response times and potentially helping to reduce property losses; however, there is a limited amount of additional credit that can be awarded for a predictive model, live interactive GPS response, pre-emptive traffic light signalling. These items are seen as significant improvements and are strongly encouraged by Fire Underwriters Survey; however, they do not carry enough weight to render 100% credit in Toronto’s final credit score. The reason for this is to maintain emphasis on other items that are important to public fire protection (water supply, hydrant distribution, fire fighter training, fire prevention, public education, etc.). Table 7 summarizes the potential overall impact the improved response systems have on the fire insurance grade for the City of Toronto. Table 7 – Areas Affected by Improved Response Systems Credits
Grade Area Impact COMMS + 1.6 FD + 1.2 Final Credit Score Increase 3.24 Divergence (included) -0.66 Final Credit Score 70.46
Adding the additional COMMS and FD credit scores equals 2.8; however, the actual overall impact is 3.24 because of the divergence factor. In this option, the divergence factor is reduced (from 1.1 to 0.66) from the original 2012 PFPC calculation because this option results in a higher FD credit score and recalculates and applies the divergence factor accordingly.

27 | P a g e
FIRE UNDERWRITERS SURVEY A SERVICE TO INSURERS AND MUNICIPALITIES
c/o Opta Information Intelligence
Figure 6 - PFPC Chart with Improved Response Systems Implementation
23.8730.09
9.60 7.56-0.66
6.13
9.91
0.4012.44
-505
1015202530354045
Final Credit Points Available Credit
The improved response systems may grant nearly 100% credit in the Emergency Communications portion of the grading. Remaining credit that can be awarded is primarily in dispatch’s performance and compliance with the criteria specified in NFPA 1221 (i.e. call processing times, dispatch times and overall performance). This study does not include an analysis to determine the specific needs of Toronto Dispatch to meet NFPA 1221 performance benchmarks. The 2012 fire insurance grade update for the City considered an average of 5 companies out of service at any given point throughout the year (sick leave, vacation, etc.). Within the Fire Department portion of the fire insurance grading, Option 4 may grant an equivalency of 5 pumper companies for the City of Toronto. The predictive response model and the live interactive GPS response are anticipated to counter the loss of 5 out of service companies due to staffing (sick leave, vacation). It is important to note that the equivalency of 5 pumper companies is contingent upon the City of Toronto submitting statistical evidence which indicates that the a move-up model, live interactive GPS response and pre-emptive traffic lights effectively reduce response times and reduce property losses when compared to response times and property losses without the improved response and alerting systems. If statistical evidence does not support this, then the equivalency of 5 pumper companies will be revised and adjusted accordingly. The approximate cost for 5 pumper companies is discussed SECTION 6 COST OF OPTIONS.

28 | P a g e
FIRE UNDERWRITERS SURVEY A SERVICE TO INSURERS AND MUNICIPALITIES
c/o Opta Information Intelligence
6. COST OF OPTIONS Table 8 outlines the estimated costs associated with the options discussed within this study. The values are based on present day costs and do not include increases that would likely occur in the future (wage increases, equipment cost increases, etc.). Costs have been separated into capital and operational costs. Capital costs include recruitment, testing, and probationary training and salary and benefits. Operational costs include salary and benefits but do not include onetime costs (recruitment, testing and training). The values are intended to provide general insight into the potential costs needed to improve the City’s PFPC from Class 4 to Class 3. The cost of “Option 1 – Improve Ladder Credit with Additional Quint Apparatus and Staff” includes:
- cost of a new quint apparatus, - 4 shifts of 4 fire fighters and 1 officer per shift + 0.7 vacation cover off + salary per apparatus, - recruitment costs of fire fighters and officers, - associated protective equipment, uniforms, etc., - ongoing skills training and skills maintenance.
The cost of “Option 2 – Improve Fire Safety Control – Fire Prevention Division Enhancement” varies depending on the degree to which improvements are made. The cost of additional fire prevention staff includes:
- recruitment costs of fire prevention inspectors and officers, - salary of inspectors and officers, - uniform, work space, equipment, - ongoing skills training and skills maintenance.
Data for the costs associated with Option 3 – Improve Pre-Incident Planning was unavailable. As such, the costs for this option have not been included. The cost of “Option 4 – Improved Response Systems” includes:
- Satellite signal repeater in each station - Move-up-model software - Training of staff using move-up-model

29 | P a g e
FIRE UNDERWRITERS SURVEY A SERVICE TO INSURERS AND MUNICIPALITIES
c/o Opta Information Intelligence
Table 8 – Cost of Options
Options Capital Operational Divergence
Factor Impact on Grading
Final PFPC Credit Score
1 – 10 New Quints and Staff $9 million $24 million -0.86 + 0.88 68.1
2A - Enhanced Inspn. Freq. (53.6 staff) $4 million $ 6 million -1 + 1.51 68.73
2B - Enhanced Inspn. Freq. (71.5 staff) $5 million $8 million -0.98 + 2.27 69.49
2C - Enhanced Inspn. Freq. (77.1 staff) $5 million $9 million -0.96 + 2.84 70.06
2D - Enhanced Inspn. Freq. (88.3 staff) $6 million $10 million -0.92 + 4.46 71.68
2E - Enhanced Inspn. Freq. (131.4 staff) $9 million $15 million -0.85 + 6.16 73.38
2F - Enhanced Inspn. Freq. (136.8 staff) $9 million $16 million -0.85 + 7.38 74.6
2G - Enhanced Inspn. Freq. (165.7 staff) $11 million $ 19 million -0.81 + 8.64 75.86
3A – Pre-Incident Planning Not available Not available -1.1 + 0.00 67.22
3B – Pre-Incident Planning Not available Not available -1.03 + 0.27 67.49
3C – Pre-Incident Planning Not available Not available -0.9 + 0.73 67.95
3D – Pre-Incident Planning Not available Not available -0.54 + 2.08 69.3
3E – Pre-Incident Planning Not available Not available -0.15 + 3.51 70.73
3F – Pre-Incident Planning Not available Not available -0.27 + 4.50 71.72
3G – Pre-Incident Planning Not available Not available -0.47 + 4.83 72.05
4 – Communications Improvements Not available Not available -0.65 + 2.85 70.07 The costs of Option 4 do not include the costs saved from the equivalency for 5 pumper companies. The capital cost for 5 pumper companies is $2 million and the operational cost is $12 million. The investment needed for improvement in PFPC is significant; however, such an investment would have a corresponding significant impact on insurance premiums, reduced fire losses and improved function throughout the city.
Impact on Insurance In January 2013, Fire Underwriters Survey was requested by TFS to complete a cost benefit analysis (see Appendix B, Fire Insurance Grading Cost Benefit Analysis, dated January 2013). The cost benefit analysis compared the potential insurance premiums for PFPC 3 and PFPC 4. To complete the comparison, MPAC data was used and considered approximately 318,000 properties with a total assessed value of approximately $218 billion.

30 | P a g e
FIRE UNDERWRITERS SURVEY A SERVICE TO INSURERS AND MUNICIPALITIES
c/o Opta Information Intelligence
The cost savings of maintaining PFPC 3 ranges from 2.9% to 7.8% per property type considered. The average difference in premium was determined to be 5.9% difference. Across the City of Toronto, the difference in insurance costs is calculated at approximately $15 million per year. The cost savings from PFPC 3 to PFPC 2 ranges from 0.6% to 5.4% per property type considered. The average difference in premium was determined to be 3.0% difference. Across the City of Toronto, the difference in insurance costs is calculated at approximately $7.4 million per year. The cost savings from PFPC 2 to PFPC 1 ranges from 0.1% to 4.0% per property type considered. The average difference in premium was determined to be 2.0% difference. Across the City of Toronto, the difference in insurance costs is calculated at approximately $4.8 million per year. It is important to note that the investments needed for improvements in one community are not necessarily comparable to another. The fire insurance grade system is based on relative risk and existing protection levels. Communities of smaller scope or lower risk profile have the potential for large gains in their fire insurance grading with relatively minimal investment. Conversely, a community with a wide range, type, number and density of risks may require much larger investments for similar type gains in their fire insurance grading.
Dollars Saved Through Mitigation It is anticipated that with faster response times from improved response and alerting systems and more emphasis on fire prevention measures (additional fire prevention inspections and risk based inspections), the total value property losses from fire can be further reduced. Fire Underwriters Survey encourages the City of Toronto and the Toronto Fire Service to continue to make investments into public fire protection and prevention. Unfortunately it is not possible to precisely quantify the amount of dollar losses that are avoided through fire department response, fire prevention activities and building controls. When a structure fire occurs, the most apparent aspect of the loss is the insurable claim for lost or damaged property. However there are often many other associated costs that are less apparent, including but not limited to, the costs of lost:
• health, • wages, • taxable revenue, • living and work places,

31 | P a g e
FIRE UNDERWRITERS SURVEY A SERVICE TO INSURERS AND MUNICIPALITIES
c/o Opta Information Intelligence
• functionality and aesthetics of neighborhoods.
The number of fires reported in Toronto Fire Services annual report is normally in the range of 10,000 per year. Table 9 - Toronto Fire statistics including vehicle fires
2011 2010 2009 2008 2007 2006 2005 10,248 10,615 10,640 10,168 11,496 10,679 11,315
The average single family residential property has an assessed value $572,000 and the average assessed value of non-residential properties is $686,000. Replacement costs for buildings (excluding contents are estimated at 75% of the assessed value ($429,000 for residential and $514,500 for non-residential). Table 10 - Fire Loss Statistics - Ontario 2007-2011 4
Property Type Average Dollar Loss 2007-2011
Average number fires 2007-2011
% of all
Structure $68,114 8,171 63% Outdoor $8,730 1,214 9% Vehicle $21,591 3,567 28% total 12,951 The average percent of structure fires for Ontario (2007-2011) is 63% per year. Therefore we can estimate that approximately 63% of Toronto’s 10,373 average fires per year are structure fires (6,544). Based on the 2007 report, “Fire Losses in Canada, Year 2007 and Selected Years,” 60% of the fires (excluding vehicle fires) reported for Ontario were residential while 40% were non-residential. The average residential fire loss in dollars5 is $45,768 and for non-residential fires the average is $61,983. The mitigated loss of any given fire can be estimated as the total replacement cost of the structure less the actual loss.
𝑀𝑖𝑡𝑖𝑔𝑎𝑡𝑒𝑑 𝐿𝑜𝑠𝑠 = 𝑇𝑜𝑡𝑎𝑙 𝑟𝑒𝑝𝑙𝑎𝑐𝑒𝑚𝑒𝑛𝑡 𝑐𝑜𝑠𝑡 − 𝐴𝑐𝑡𝑢𝑎𝑙 𝑑𝑜𝑙𝑙𝑎𝑟 𝑙𝑜𝑠𝑠
4
http://www.mcscs.jus.gov.on.ca/english/FireMarshal/MediaRelationsandResources/FireStatistics/OntarioFires/AllFireIncidents/stats_all_fires.html 5 “Fire Losses in Canada, Year 2007 and Selected Years,” (Mahendra Wijayasinghe, 2007)

32 | P a g e
FIRE UNDERWRITERS SURVEY A SERVICE TO INSURERS AND MUNICIPALITIES
c/o Opta Information Intelligence
The maximum mitigated loss would be a complete save where the actual dollar loss is zero (best case). The minimum mitigated loss would be a total loss where the actual dollar loss is equal to the total replacement cost (worst case scenario). Across all fires, there are a broad range of results and without exact loss data for the City it is only possible to estimate the mitigated losses. If the mitigated losses are an average of the two conditions described above (best case and worst case scenario), the estimated mitigated losses would be: Total average number of fires: 10,737 Total Average number of non-structure fires (vehicle and outdoor): 3,829 Total average number of structure fires: 6,544 60% structure fires are residential fires: 3,947 40% structure fires are non-residential fires: 2,597 Table 11 - Estimation of Mitigated Dollar Losses for Structure Fires in Toronto
Residential Non-Residential Average Replacement Cost $429,000 $514,500 Average dollar loss $45,768 $61,983 Minimum mitigated loss $0 $0 Maximum mitigated loss $383,232 $452,517 Average mitigated loss $191,616 $226,259 Estimated Number of fires 3,947 2,597 Estimated mitigated losses $756,260,845 $587,680,423 Total estimated annual mitigated fire losses: $$1,343,941,268. It is important to note that this figure is a conservative estimate of mitigated dollar losses and does not consider that some fires would spread beyond the building of origin and into exposed buildings. This figure also does not take into account impacts to local businesses, lost employment, lost homes and associated tax revenue.
7. Improving For Today and Tomorrow Calculating a fire insurance grade is complex and considers over 500 different variables; some of which are independent and others related. For this reason, there are several avenues that may be taken for improving a fire insurance grade; however, some avenues may be more cost effective and have a more significant impact due to their associated weight within the fire insurance grading.
33 | P a g e
FIRE UNDERWRITERS SURVEY A SERVICE TO INSURERS AND MUNICIPALITIES
c/o Opta Information Intelligence
The options discussed in this report have been selected because they have the most significant impact on the fire insurance grades and are cost effective when compared to conventional methods of improvement (i.e. additional fire stations, responding crews, facilities for training, equipment, etc.). From the perspective of the fire insurance grading, the City of Toronto does not have to implement the highest cost option to improve to PFPC 3 nor does the City have to implement only one option. For example, implementing option 2A and 3C will most likely result in PFPC 3. Alternatively, 10 additional quints can be purchased and staffed accordingly plus improve the pre-incident plan program as described in Option 3C.
34 | P a g e
FIRE UNDERWRITERS SURVEY A SERVICE TO INSURERS AND MUNICIPALITIES
c/o Opta Information Intelligence
Road Map for Improvements
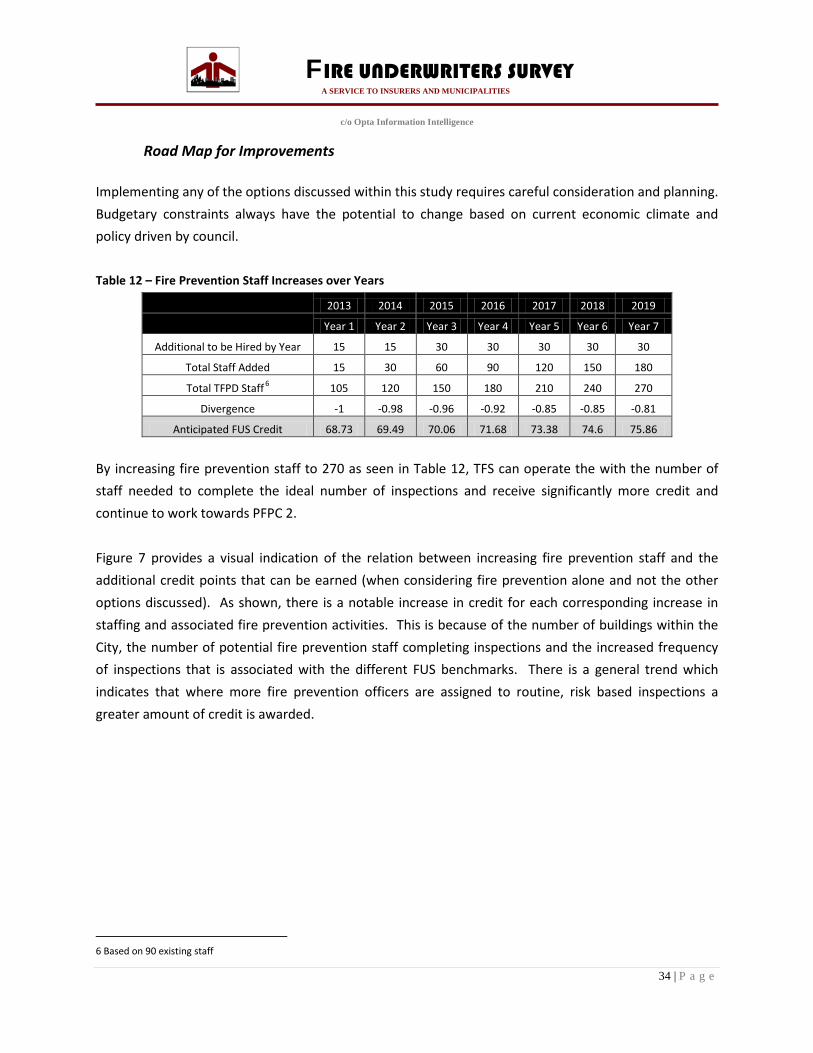
Implementing any of the options discussed within this study requires careful consideration and planning. Budgetary constraints always have the potential to change based on current economic climate and policy driven by council. Table 12 – Fire Prevention Staff Increases over Years
2013 2014 2015 2016 2017 2018 2019
Year 1 Year 2 Year 3 Year 4 Year 5 Year 6 Year 7
Additional to be Hired by Year 15 15 30 30 30 30 30
Total Staff Added 15 30 60 90 120 150 180
Total TFPD Staff 6 105 120 150 180 210 240 270
Divergence -1 -0.98 -0.96 -0.92 -0.85 -0.85 -0.81
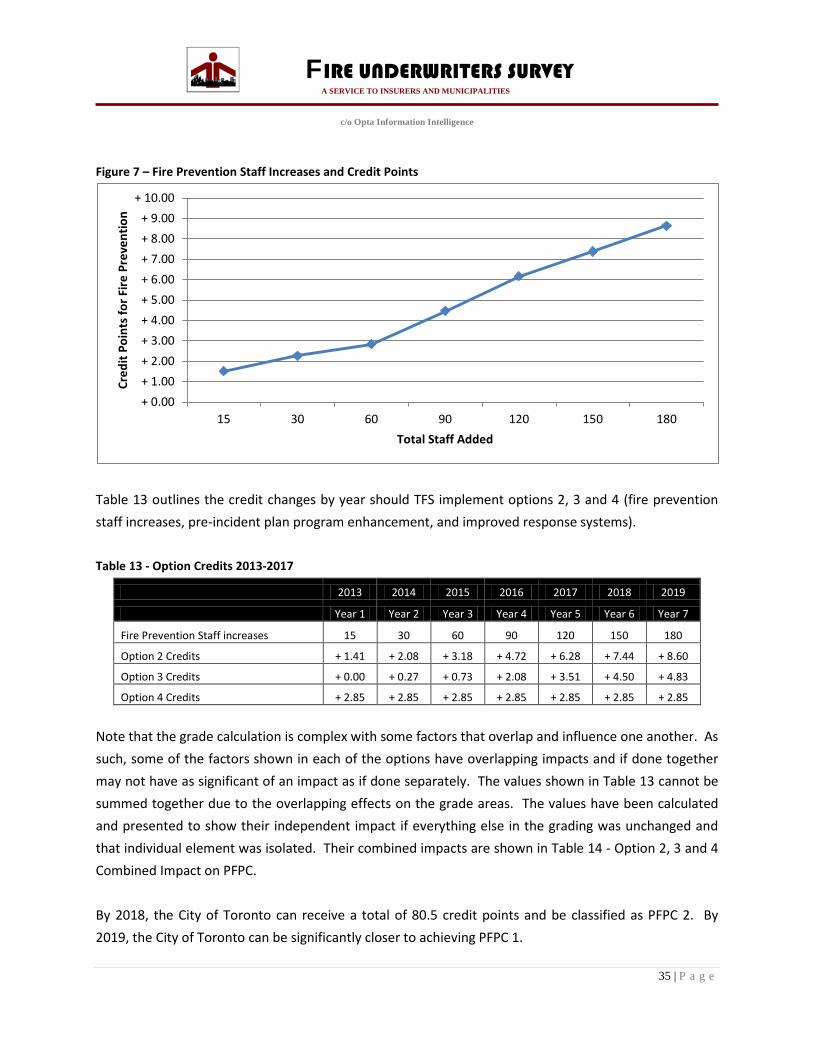
Anticipated FUS Credit 68.73 69.49 70.06 71.68 73.38 74.6 75.86 By increasing fire prevention staff to 270 as seen in Table 12, TFS can operate the with the number of staff needed to complete the ideal number of inspections and receive significantly more credit and continue to work towards PFPC 2. Figure 7 provides a visual indication of the relation between increasing fire prevention staff and the additional credit points that can be earned (when considering fire prevention alone and not the other options discussed). As shown, there is a notable increase in credit for each corresponding increase in staffing and associated fire prevention activities. This is because of the number of buildings within the City, the number of potential fire prevention staff completing inspections and the increased frequency of inspections that is associated with the different FUS benchmarks. There is a general trend which indicates that where more fire prevention officers are assigned to routine, risk based inspections a greater amount of credit is awarded.
6 Based on 90 existing staff
35 | P a g e
FIRE UNDERWRITERS SURVEY A SERVICE TO INSURERS AND MUNICIPALITIES
c/o Opta Information Intelligence
Figure 7 – Fire Prevention Staff Increases and Credit Points
Table 13 outlines the credit changes by year should TFS implement options 2, 3 and 4 (fire prevention staff increases, pre-incident plan program enhancement, and improved response systems). Table 13 - Option Credits 2013-2017
2013 2014 2015 2016 2017 2018 2019
Year 1 Year 2 Year 3 Year 4 Year 5 Year 6 Year 7
Fire Prevention Staff increases 15 30 60 90 120 150 180
Option 2 Credits + 1.41 + 2.08 + 3.18 + 4.72 + 6.28 + 7.44 + 8.60
Option 3 Credits + 0.00 + 0.27 + 0.73 + 2.08 + 3.51 + 4.50 + 4.83
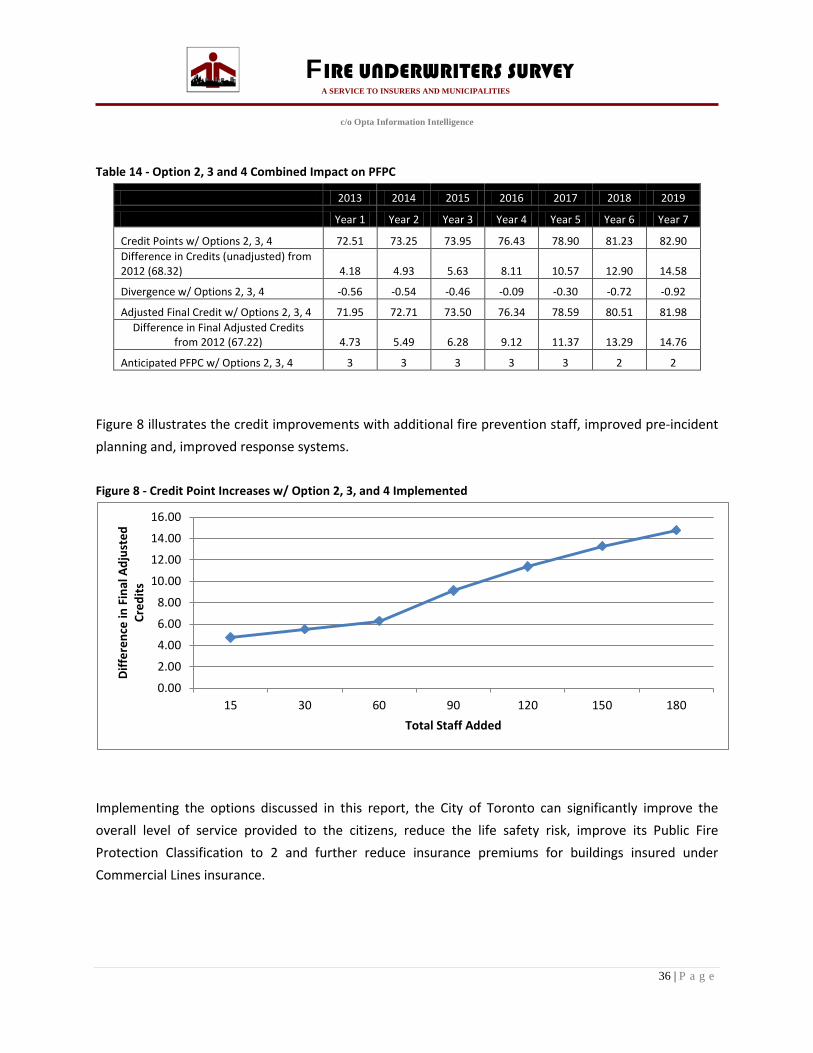
Option 4 Credits + 2.85 + 2.85 + 2.85 + 2.85 + 2.85 + 2.85 + 2.85 Note that the grade calculation is complex with some factors that overlap and influence one another. As such, some of the factors shown in each of the options have overlapping impacts and if done together may not have as significant of an impact as if done separately. The values shown in Table 13 cannot be summed together due to the overlapping effects on the grade areas. The values have been calculated and presented to show their independent impact if everything else in the grading was unchanged and that individual element was isolated. Their combined impacts are shown in Table 14 - Option 2, 3 and 4 Combined Impact on PFPC. By 2018, the City of Toronto can receive a total of 80.5 credit points and be classified as PFPC 2. By 2019, the City of Toronto can be significantly closer to achieving PFPC 1.
+ 0.00+ 1.00+ 2.00+ 3.00+ 4.00+ 5.00+ 6.00+ 7.00+ 8.00+ 9.00
+ 10.00
15 30 60 90 120 150 180
Cred
it Po
ints
for F
ire P
reve
ntio
n
Total Staff Added
36 | P a g e
FIRE UNDERWRITERS SURVEY A SERVICE TO INSURERS AND MUNICIPALITIES
c/o Opta Information Intelligence
Table 14 - Option 2, 3 and 4 Combined Impact on PFPC
2013 2014 2015 2016 2017 2018 2019
Year 1 Year 2 Year 3 Year 4 Year 5 Year 6 Year 7
Credit Points w/ Options 2, 3, 4 72.51 73.25 73.95 76.43 78.90 81.23 82.90 Difference in Credits (unadjusted) from 2012 (68.32) 4.18 4.93 5.63 8.11 10.57 12.90 14.58
Divergence w/ Options 2, 3, 4 -0.56 -0.54 -0.46 -0.09 -0.30 -0.72 -0.92
Adjusted Final Credit w/ Options 2, 3, 4 71.95 72.71 73.50 76.34 78.59 80.51 81.98 Difference in Final Adjusted Credits
from 2012 (67.22) 4.73 5.49 6.28 9.12 11.37 13.29 14.76
Anticipated PFPC w/ Options 2, 3, 4 3 3 3 3 3 2 2 Figure 8 illustrates the credit improvements with additional fire prevention staff, improved pre-incident planning and, improved response systems. Figure 8 - Credit Point Increases w/ Option 2, 3, and 4 Implemented
Implementing the options discussed in this report, the City of Toronto can significantly improve the overall level of service provided to the citizens, reduce the life safety risk, improve its Public Fire Protection Classification to 2 and further reduce insurance premiums for buildings insured under Commercial Lines insurance.
0.00
2.00
4.00
6.00
8.00
10.00
12.00
14.00
16.00
15 30 60 90 120 150 180
Diffe
renc
e in
Fin
al A
djus
ted
Cred
its
Total Staff Added
37 | P a g e
FIRE UNDERWRITERS SURVEY A SERVICE TO INSURERS AND MUNICIPALITIES
c/o Opta Information Intelligence
Improving to PFPC 1 To achieve PFPC 1, the community must receive at least 90 points of credit within the fire insurance grading. A PFPC 1 is an indicator to insurers that the public fire protection service levels are commensurate with fire risk levels throughout the community or portions of the community. A community with a PFPC 1 will have certified and trained fire fighting staff meeting NFPA 1001 Level 2 criteria. The fire fighter training program will ensure that skills and techniques required for NFPA 1001 Level 2 are maintained. An effective fire fighter promotion system is in place that selects best candidate and is not primarily based on years of service. The number of front line apparatus available for response are of adequate age, well equipped, maintained and will be located so that response times to initial alarms (fire calls) are minimized throughout the City. Other elements include good management practices within the Fire Department, the absence of political interference and an effective pre incident planning program in place and in use. The municipal water system is capable of providing available fire flows (water supplies) for the specified durations required (established by required fire flows). In addition to this, the water system has several levels of redundancy and is able to continue to provide adequate water supplies during concurrent fire events while the system is under max day demand conditions and multi-point failure (main breaks, power failures, valve malfunctions, etc.). The emergency communications system and performance benchmarks meet the criteria specified within NFPA 1221. Adequate number of operators on duty to ensure that adequate call answer, transfer, process and dispatch times, active and passive fire protection systems adequately protect critical system components, redundancy of systems are in place to ensure continuity of 911 service with minimal interruption are indicators of a good emergency communications grading. As part of PFPC 1, the Fire Safety Control grading should include routine risk based inspections (mainly 6 months for all occupancies), trained and qualified fire prevention inspectors, Building Codes or bylaws in effect further minimize fire risk in all buildings (additional requirement for sprinklers, smaller allowances for wood frame construction, more stringent Fire Codes, etc.). Significant improvements at a national and provincial level would be needed in both Building Codes and Fire Codes to make building construction and occupancy much safer (i.e. larger spacing between buildings, exterior sprinkler protection). Additionally, municipal building bylaws can be improved upon to require automatic
38 | P a g e
FIRE UNDERWRITERS SURVEY A SERVICE TO INSURERS AND MUNICIPALITIES
c/o Opta Information Intelligence
sprinkler protection in any new construction (dwelling or other) and potentially even further to retrofit existing buildings. The calculated fire insurance grade is not solely within the control of the fire department. Other departments and divisions such as water, planning, development, finance and council also play critical rolls. The fire department is tasked with the protection of the built environment. Building and planning departments are typically of the permit and development process and with approval from council, determine what will be built in the community (which, once built becomes the fire load that will need to be protected by the fire department). Construction of risks and inherent hazards associated with the risks are dependent on provincial Building Codes and acceptance from the AHJ. The building stock or buildings constructed within the community determine the benchmarks that the community is measured against. The water department provides water supplies for both domestic and fire fighting purposes. The amount of water needed for fire fighting is based on the community’s existing and future building stock. In addition to the factors noted above, local legislation is another factor that influences credit in the fire insurance grading system. Municipal bylaws can be used to effectively control the level of risk in the built environment and reduce the benchmarks against which fire departments and water supplies are measured. The most effective bylaw for reducing fire risk is a comprehensive sprinkler bylaw, however improving separation of combustible buildings, requirements for non-combustible roofs and limitations on size and combustible buildings also have significant impacts. Typically communities that wish to move toward PFPC Class 1, must be committed to managing the risk side of the equation with restrictions on fire loading or the cost of providing fire protection capacity becomes uneconomical. Within Canada, there are only a small handful of communities that have achieved PFPC 1; however, the risk profile within those communities has likely changed since their most recent assessment. A reassessment is needed for those communities to determine if the public fire protection service levels remain commensurate with the level of risk. For nearly all communities, the potential financial investment needed (relative to the tax base) to achieve PFPC 1 is significant and in most cases would not be sustainable by most without controlling risk levels.
39 | P a g e
FIRE UNDERWRITERS SURVEY A SERVICE TO INSURERS AND MUNICIPALITIES
c/o Opta Information Intelligence
8. CONCLUSIONS A fire insurance grade review measures fire risk, not medical risk or medical response. Fire Underwriters Survey measures a community’s public fire protection and fire risk levels and communicates that information to the insurance industry via Dwelling Protection Grade and Public Fire Protection Classifications. This includes an assessment of Water Supplies, Fire Department, Fire Safety Control (fire prevention, public education, codes and standards), and Emergency Communications. The investments needed to improve to PFPC 2 may be substantial, depending on the approach that is taken. Traditionally, Cities search for opportunities for improvements in conventional fire protection (fire stations, fire fighters, fire apparatus including pumpers and ladders). In the case of Toronto, investments in conventional fire protection would not yield a significant impact on the fire insurance grade because those items have already received near maximum amount of credit in their respective fire insurance grade items with exception to one area, Pre-Incident Planning. Other areas where TFS can improve include Fire Safety Control (fire prevention) and Emergency Communications (improved response systems). Toronto Fire Service has already committed to implementing an improved response system; however, the improvements in the fire insurance grading do not take effect until the systems are in operation. Once operational, Fire Underwriters Survey should be notified so that the fire insurance grades can reflect the improvements. In addition to this, supporting data and evidence should be provided to Fire Underwriters Survey to confirm that the response systems warrant additional fire insurance grading credit. Implementing the improved response systems maintains a PFPC 3. Emergency Communications receives a substantial amount more credit. In addition to this, the improved response system may grant an equivalency of 5 pumper companies for the City of Toronto. TFS has added an additional 15 fire prevention staff who are expected to oversee the pre-incident planning program as well as other tasks associated with fire prevention inspectors. The City of Toronto and TFS can benefit greatly be implementing a more robust risk based fire prevention inspection and pre-incident planning programs. Table 5 and Table 12 outline the number of additional fire prevention staff that would be needed to meet the varying FUS benchmarks for a highly effective fire prevention inspection program. Table 5 and Table 12 also indicate the potential credit that can be awarded for each benchmark met.

40 | P a g e
FIRE UNDERWRITERS SURVEY A SERVICE TO INSURERS AND MUNICIPALITIES
c/o Opta Information Intelligence
By implementing Options 2, 3 and 4, the City of Toronto can achieve PFPC 2 by 2017 (5 years) as seen in Table 12. Across the City, the annual cost savings from PFPC 4 and 3 is estimated at $15 million. The annual cost savings from PFPC 3 and PFPC 2 is estimated at $7.4 million. There is no one simple answer or solution to the problems for providing public fire protection. From a cost benefit standpoint, making certain decisions can appear to be clear and simple. However, those decisions should not be made lightly as they can inadvertently result in lower levels of service provided and create unforeseen problems in the future. When providing public fire protection, Council and Department Managers should make their decisions based on the best interests of members of the public in addition to the tax base.

Appendix A

Western Canada Ontario Quebec Atlantic Canada
3999 Henning Drive 150 Commerce Valley Drive West 1611 Cremazie Boulevard East 238 Brownlow Avenue, Suite 300 Burnaby, BC V5C 6P9 Markham, ON L3T 7Z3 Montreal, QC H2M 2P2 Dartmouth, NS B3B 1Y2
1 (800) 665-5661 1 (800) 268-8080 1 (800) 263-5361 1 (800) 639-4528
FIRE UNDERWRITERS SURVEY A SERVICE TO INSURERS AND MUNICIPALITIES
c/o Risk Management Services
January 8, 2013 Toronto Fire Services 4330 Dufferin Street Toronto, ON M3H 5R9 Attention: Frank Lamie, Deputy Fire Chief Re: Fire Underwriters Survey – City of Toronto Fire Underwriters Survey is a national organization that represents more than 85 percent of the private sector and casualty insurers in Canada. Fire Underwriters Survey provides data to program subscribers regarding public fire protection for fire insurance statistical and underwriting evaluation. Fire Underwriters Survey conducted an assessment of each area of the fire defences primarily for fire insurance grading and classification purposes. The following letter provides a brief description of the grading process. The Public Fire Protection Classification (PFPC) is a numerical grading system scaled from 1 to 10 that is used by Commercial Lines1 insurers. Class 1 represents the highest grading possible and Class 10 indicates that little or no fire protection is in place. The PFPC grading system evaluates the ability of a community’s fire protection programs to prevent and control major fires that may occur in multi-family residential, commercial, industrial, institutional buildings, and course of construction developments. Fire Underwriters Survey also assigns a second grade for community fire protection. The second grading system, entitled Dwelling Protection Grade (DPG), assesses the protection available for small buildings such as single-family dwellings and is used by Personal Lines2 insurers. The DPG is a numerical grading system scaled from 1 to 5. One (1) is the highest grading possible and indicates little or no fire protection is present. This grading reflects the ability of a community to handle fires in small buildings such as dwellings and duplexes.
1 Commercial Lines: A distinction marking property and liability coverage written for business or entrepreneurial interests (includes institutional, industrial, multi-family residential and all buildings other than detached dwellings that are designated single family residential or duplex) as opposed to Personal Lines. 2 Personal Lines: Insurance covering the liability and property damage exposures of private individuals and their households as opposed to Commercial Lines. Typically includes all detached dwellings that are designated single family residential or duplex.
Western Canada Ontario Quebec Atlantic Canada
3999 Henning Drive 150 Commerce Valley Drive West 1611 Cremazie Boulevard East 238 Brownlow Avenue, Suite 300 Burnaby, BC V5C 6P9 Markham, ON L3T 7Z3 Montreal, QC H2M 2P2 Dartmouth, NS B3B 1Y2
1 (800) 665-5661 1 (800) 268-8080 1 (800) 263-5361 1 (800) 639-4528
FIRE UNDERWRITERS SURVEY A SERVICE TO INSURERS AND MUNICIPALITIES
c/o Risk Management Services
In February 2012, Fire Underwriters Survey began collecting data from the City of Toronto and the Toronto Fire Services for the purpose of updating the fire insurance grades throughout the City. As part of the data collection process, various facilities were visited including:
- fire stations, - training facilities, - apparatus repair facilities, - fire prevention offices and, - emergency communications facilities.
Note that water supplies for public fire protection have not been evaluated as of yet due to lack of available data. Fire Underwriters Survey has reviewed and assessed relevant data provided by the City and Toronto Fire Services and has completed the assessment of Fire Risk, Fire Department, Fire Safety Control and Emergency Communications. The Water Supply portions of the fire insurance grades shown are based on previous assessments that were completed and conservative assumptions related to upkeep of the delivery systems. In the 2001-2002 review of the City of Toronto, the final Public Fire Protection Classification (PFPC) was determined to be Class 3. Based on the 2012 survey of the City of Toronto, the Public Fire Protection Classification has been determined to be Class 4. A Dwelling Protection Grade of 1 has been maintained for Personal Lines insured properties. The change from PFPC Class 3 to 4 may adversely affect insurance rates and capacities of insurance companies servicing the area. Note that Fire Underwriters Survey publishes its findings in the Canadian Fire Insurance Grading Index which is used by Canadian Insurers in setting capacities and rates for property insurance. Fire Underwriters Survey is not involved in rates setting for insurance companies. To prevent the change in Public Fire Protection Classification, the City of Toronto may request a grace period of 12 months to implement measures of improved fire protection capacity, fire prevention measures and/or risk reduction measures that would address the change in classification. Please note that this letter is private and confidential. The underlying data of this report has been developed for fire insurance grading and classification purposes. This letter may also be used by the stakeholders to assist in planning the future direction of public fire protection services for the City of Toronto. Please contact our office if there are any questions or comments regarding the intent or

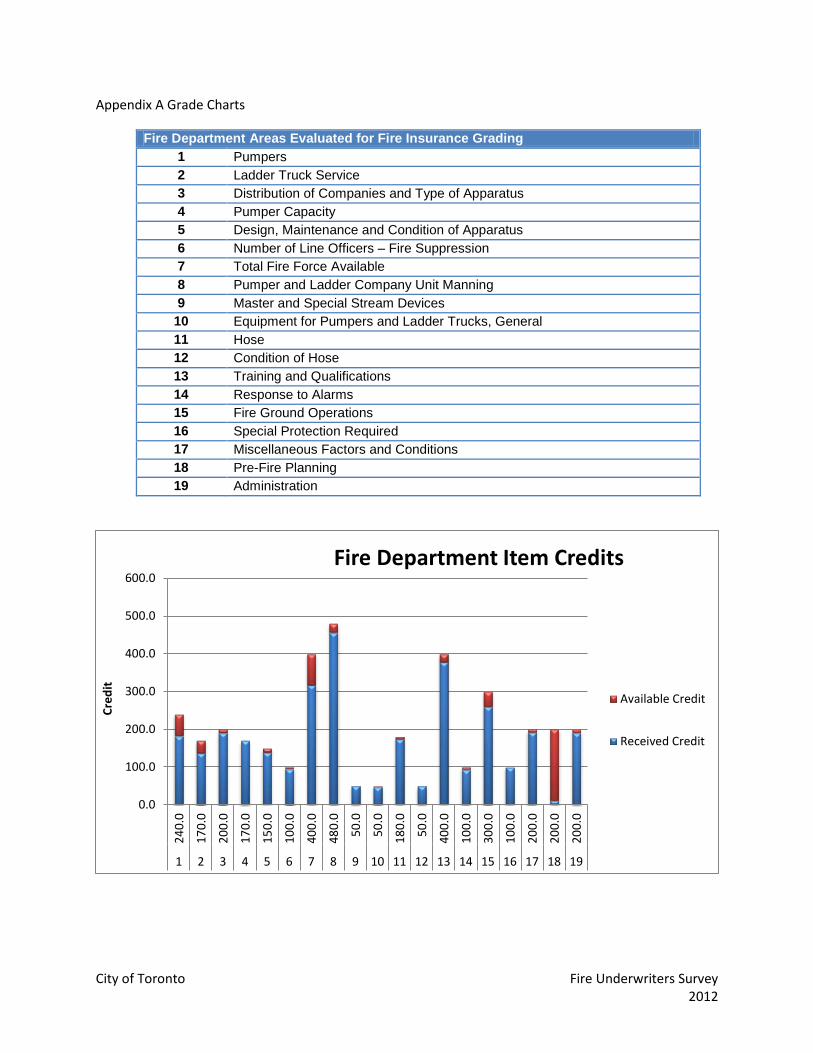
City of Toronto Fire Underwriters Survey 2012
Appendix A Grade Charts
Fire Department Areas Evaluated for Fire Insurance Grading 1 Pumpers 2 Ladder Truck Service 3 Distribution of Companies and Type of Apparatus 4 Pumper Capacity 5 Design, Maintenance and Condition of Apparatus 6 Number of Line Officers – Fire Suppression 7 Total Fire Force Available 8 Pumper and Ladder Company Unit Manning 9 Master and Special Stream Devices
10 Equipment for Pumpers and Ladder Trucks, General 11 Hose 12 Condition of Hose 13 Training and Qualifications 14 Response to Alarms 15 Fire Ground Operations 16 Special Protection Required 17 Miscellaneous Factors and Conditions 18 Pre-Fire Planning 19 Administration
0.0
100.0
200.0
300.0
400.0
500.0
600.0
240.
0
170.
0
200.
0
170.
0
150.
0
100.
0
400.
0
480.
0
50.0
50.0
180.
0
50.0
400.
0
100.
0
300.
0
100.
0
200.
0
200.
0
200.
0
1 2 3 4 5 6 7 8 9 10 11 12 13 14 15 16 17 18 19
Cred
it
Fire Department Item Credits
Available Credit
Received Credit

City of Toronto Fire Underwriters Survey 2012
Water Supply Areas Evaluated for Fire Insurance Grading 1 Normal Adequacy of Supply Works 2 Reliability of Sources of Supply 3 Reliability of Pumping Capacity (Pumps and Drivers) 4 Reliability of Power Supply 5 Reliability, Condition, Arrangement, Operation, and Maintenance of System
Components 6 Fireflow Delivery by Mains 7 Reliability of Principal Mains 8 Installation of Pipes 9 Arrangement of Distribution System
10 Additional Factors and Conditions Relating To Supply and Distribution 11 Distribution of Hydrants 12 Hydrants – Size, Type, and Installation 13 Hydrants – Condition and Inspection 14 Other Conditions affecting Adequacy and Reliability 15 Management
0
100
200
300
400
500
600
700
Wei
ght
300
200
150
182
200
700
100
100
100
200
450
100
100
200
100
WS Item1 2 3 4 5 6 7 8 9 10 11 12 13 14 15
Cred
it
Water Supply Item Credits
AvailableCredit
ReceivedCredit

City of Toronto Fire Underwriters Survey 2012
Emergency Communications Areas Evaluated for Fire Insurance Grading 1 Communication Center 2 Means for Transmitting Alarm by Public 3 Fire Department Telephone Service (Incoming from Public) 4 Means of Alarm Dispatch 5 Dispatching Service 6 Operations Radio 7 Miscellaneous Factors
0
50
100
150
200
250
300
350
Weight 60.0 80.0 80.0 300.0 100.0 80.0 30.0
EC Item 1 2 3 4 5 6 7
Cred
it
Emergency Communications Item Credits
AvailableCreditReceivedCredit

City of Toronto Fire Underwriters Survey 2012
Fire Safety Control Areas Evaluated for Fire Insurance Grading 1 General Program 2 Codes and Enforcement 3 Building Construction Laws and Enforcement 4 Electrical Code and Inspections
0
100
200
300
400
500
600
Weight 500.0 350.0 100.0 50.0
FS Item 1 2 3 4
Cred
it
Fire Safety Control and Fire Prevention Credits
AvailableCredit
ReceivedCredit

City of Toronto Fire Underwriters Survey 2012
- Fire Department received 71.8% credit .
- Emergency Communications received 80% credit.
- Fire Safety Control received 37.8% credit.
- Water Supplies received 79.6% credit based on archive grade survey information.
23.87 28.73
8.00 7.56
6.13
11.27
2.00 12.44
05
1015202530354045
Credited and Available Points for each Major Area Graded
Available Credit
Final Credit Points

City of Toronto Fire Underwriters Survey 2012
Appendix A Grade Charts
Fire Department Areas Evaluated for Fire Insurance Grading 1 Pumpers 2 Ladder Truck Service 3 Distribution of Companies and Type of Apparatus 4 Pumper Capacity 5 Design, Maintenance and Condition of Apparatus 6 Number of Line Officers – Fire Suppression 7 Total Fire Force Available 8 Pumper and Ladder Company Unit Manning 9 Master and Special Stream Devices
10 Equipment for Pumpers and Ladder Trucks, General 11 Hose 12 Condition of Hose 13 Training and Qualifications 14 Response to Alarms 15 Fire Ground Operations 16 Special Protection Required 17 Miscellaneous Factors and Conditions 18 Pre-Fire Planning 19 Administration
0.0
100.0
200.0
300.0
400.0
500.0
600.0
240.
0
170.
0
200.
0
170.
0
150.
0
100.
0
400.
0
480.
0
50.0
50.0
180.
0
50.0
400.
0
100.
0
300.
0
100.
0
200.
0
200.
0
200.
0
1 2 3 4 5 6 7 8 9 10 11 12 13 14 15 16 17 18 19
Cred
it
Fire Department Item Credits
Available Credit
Received Credit
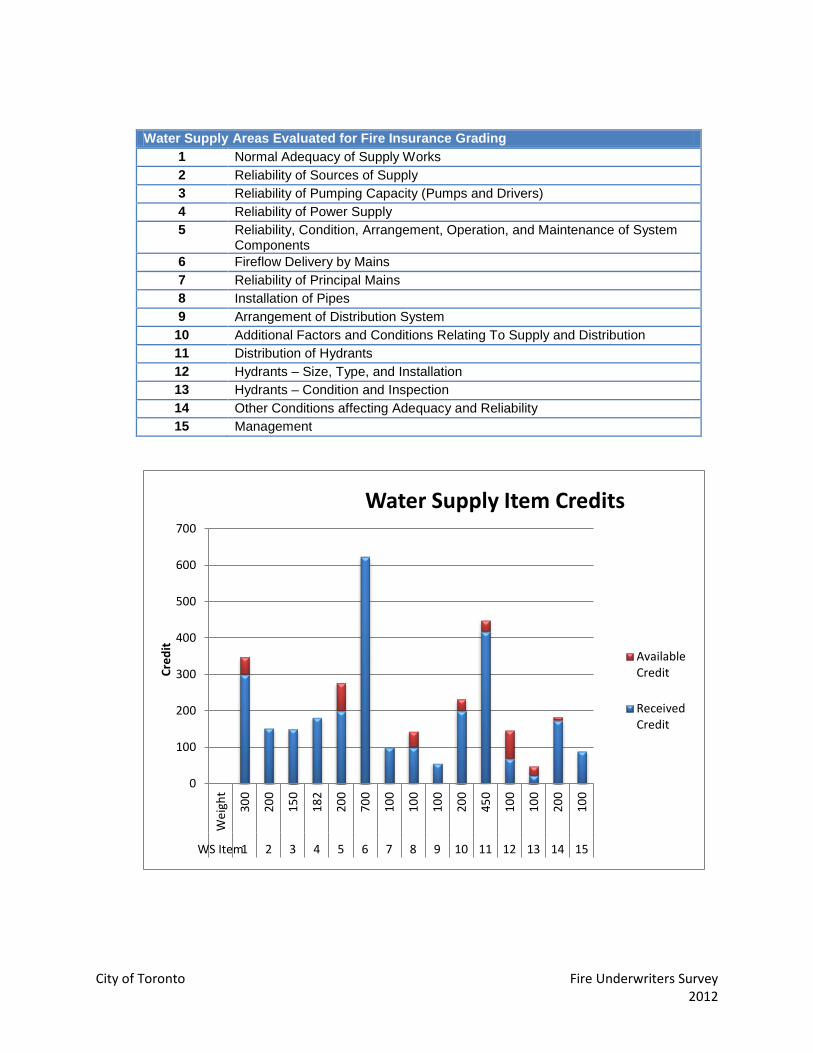
City of Toronto Fire Underwriters Survey 2012
Water Supply Areas Evaluated for Fire Insurance Grading 1 Normal Adequacy of Supply Works 2 Reliability of Sources of Supply 3 Reliability of Pumping Capacity (Pumps and Drivers) 4 Reliability of Power Supply 5 Reliability, Condition, Arrangement, Operation, and Maintenance of System
Components 6 Fireflow Delivery by Mains 7 Reliability of Principal Mains 8 Installation of Pipes 9 Arrangement of Distribution System
10 Additional Factors and Conditions Relating To Supply and Distribution 11 Distribution of Hydrants 12 Hydrants – Size, Type, and Installation 13 Hydrants – Condition and Inspection 14 Other Conditions affecting Adequacy and Reliability 15 Management
0
100
200
300
400
500
600
700
Wei
ght
300
200
150
182
200
700
100
100
100
200
450
100
100
200
100
WS Item1 2 3 4 5 6 7 8 9 10 11 12 13 14 15
Cred
it
Water Supply Item Credits
AvailableCredit
ReceivedCredit
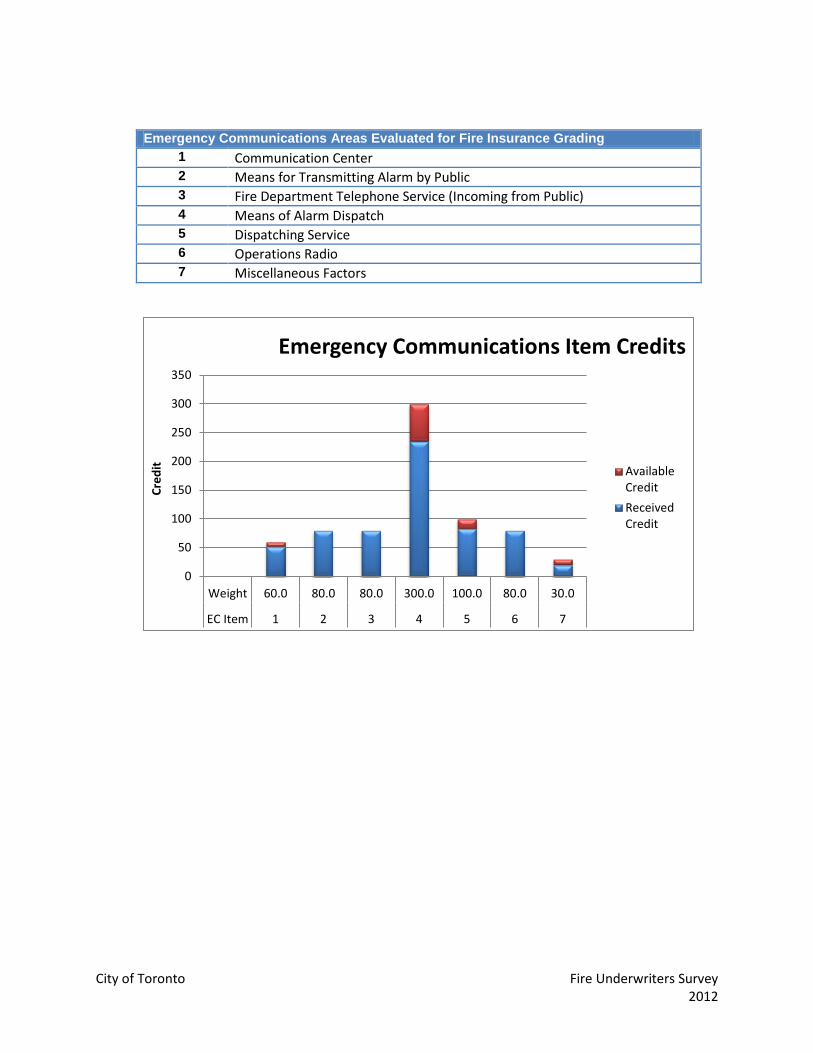
City of Toronto Fire Underwriters Survey 2012
Emergency Communications Areas Evaluated for Fire Insurance Grading 1 Communication Center 2 Means for Transmitting Alarm by Public 3 Fire Department Telephone Service (Incoming from Public) 4 Means of Alarm Dispatch 5 Dispatching Service 6 Operations Radio 7 Miscellaneous Factors
0
50
100
150
200
250
300
350
Weight 60.0 80.0 80.0 300.0 100.0 80.0 30.0
EC Item 1 2 3 4 5 6 7
Cred
it
Emergency Communications Item Credits
AvailableCreditReceivedCredit
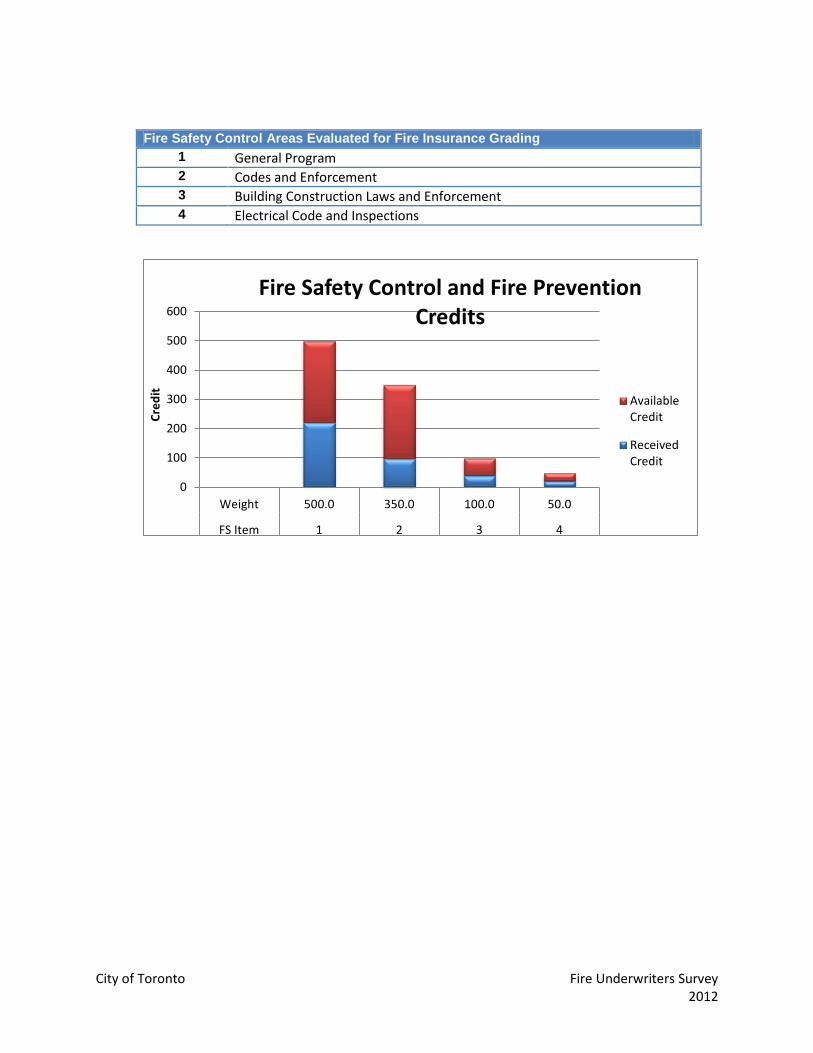
City of Toronto Fire Underwriters Survey 2012
Fire Safety Control Areas Evaluated for Fire Insurance Grading 1 General Program 2 Codes and Enforcement 3 Building Construction Laws and Enforcement 4 Electrical Code and Inspections
0
100
200
300
400
500
600
Weight 500.0 350.0 100.0 50.0
FS Item 1 2 3 4
Cred
it
Fire Safety Control and Fire Prevention Credits
AvailableCredit
ReceivedCredit
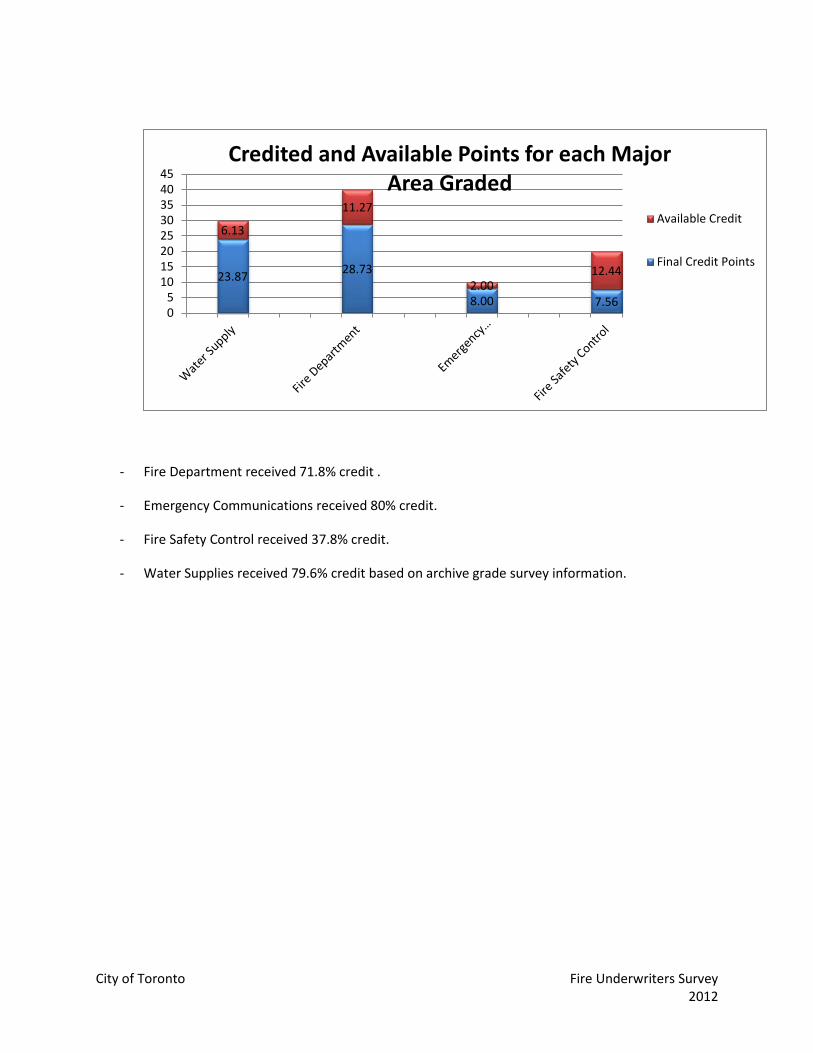
City of Toronto Fire Underwriters Survey 2012
- Fire Department received 71.8% credit .
- Emergency Communications received 80% credit.
- Fire Safety Control received 37.8% credit.
- Water Supplies received 79.6% credit based on archive grade survey information.
23.87 28.73
8.00 7.56
6.13
11.27
2.00 12.44
05
1015202530354045
Credited and Available Points for each Major Area Graded
Available Credit
Final Credit Points

Appendix B

Western Canada Ontario Quebec Atlantic Canada
3999 Henning Drive 150 Commerce Valley Drive West 1611 Cremazie Boulevard East 238 Brownlow Avenue, Suite 300 Burnaby, BC V5C 6P9 Markham, ON L3T 7Z3 Montreal, QC H2M 2P2 Dartmouth, NS B3B 1Y2
1 (800) 665-5661 1 (800) 268-8080 1 (800) 263-5361 1 (800) 639-4528
FIRE UNDERWRITERS SURVEY A SERVICE TO INSURERS AND MUNICIPALITIES
c/o Risk Management Services
January 14, 2013 Toronto Fire Service 4330 Dufferin Street Toronto ON M3H 5R9 Attention: Jim Sales, Fire Chief Re: Fire Insurance Grading Cost Benefit Analysis
1. BACKGROUND AND HISTORY OF FUS Fire Underwriters Survey (FUS) was originally developed after a number of communities across North America had massive conflagration losses. The fire insurance grading system was developed to provide insurers with information related to the levels of fire risk and fire protection within each community in Canada. The system is designed to provide a cost benefit to communities for providing fire protection. Communities that have effective and appropriate levels of fire protection for the level of fire risk within their protection areas, will receive lower fire insurance grades, which in turn will result in lower insurance premiums for property owners. This letter gives an overview of the factors that affect a community’s fire insurance grading and how these ratings affect insurance premiums. Fire Underwriters Survey is a national organization financed and directed by SCM Opta Intelligence Inc. The organization assesses, evaluates and grades the quality of public fire defences maintained in Canadian municipalities and communities. This technical information is conveyed to FUS subscribers for use in their fire insurance statistical, rating and underwriting programs. FUS member companies provide approximately 85 percent of the private general insurance written each year in Canada. The grading system has two components, the Dwelling Protection Grade1 (DPG) and Public Fire Protection Classification2 (PFPC).
Dwelling Protection Grade for Personal Lines Insurance The first fire insurance classification we establish and convey to FUS member companies is the Dwelling Protection Grade which is used by Personal Lines insurers. Personal Lines insurance covers the liability and property damage exposures of private individuals and their households as opposed to Commercial Lines. Typically it includes all detached dwellings that are designated single family residential or duplex.
1 Personal Lines Insurance: Insurance covering the liability and property damage exposures of private individuals and their households as opposed to Commercial Lines. Typically it includes all detached dwellings that are designated single family residential or duplex 2 Commercial Lines Insurance: A distinction marking property and liability coverage written for business or entrepreneurial interests (includes institutional, industrial, multi-family residential and all buildings other than detached dwellings that are designated single family residential or duplex) as opposed to Personal Lines.
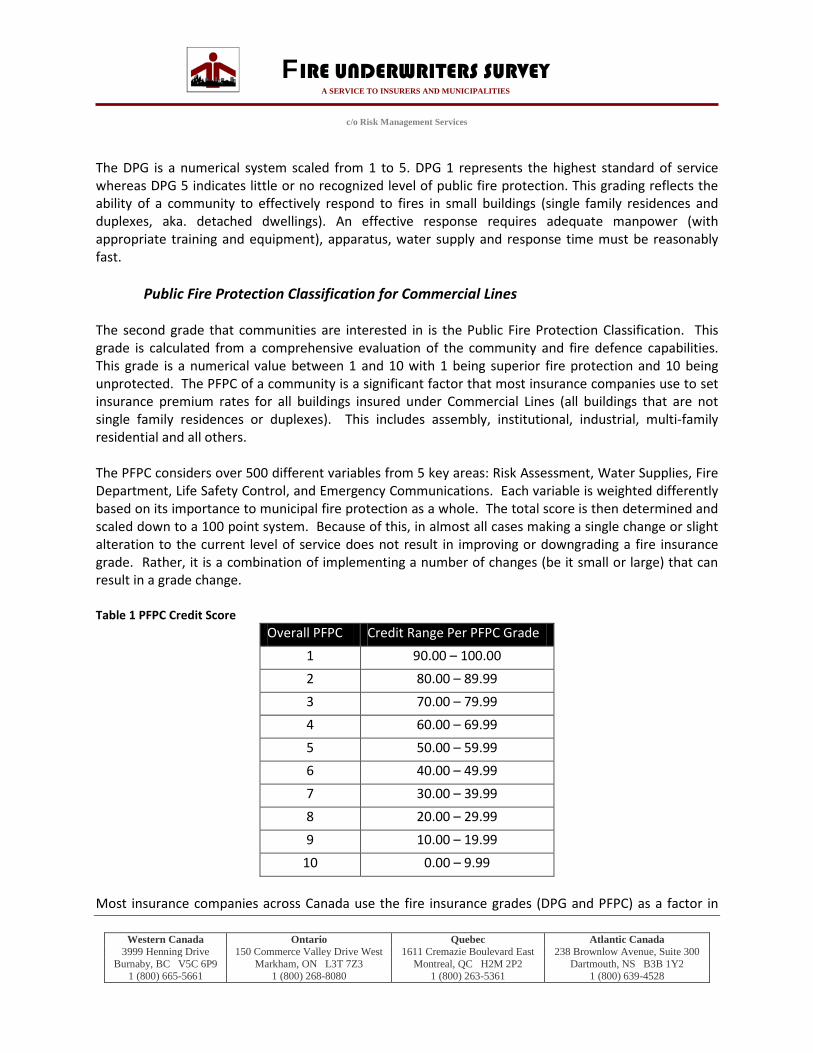
Western Canada Ontario Quebec Atlantic Canada
3999 Henning Drive 150 Commerce Valley Drive West 1611 Cremazie Boulevard East 238 Brownlow Avenue, Suite 300 Burnaby, BC V5C 6P9 Markham, ON L3T 7Z3 Montreal, QC H2M 2P2 Dartmouth, NS B3B 1Y2
1 (800) 665-5661 1 (800) 268-8080 1 (800) 263-5361 1 (800) 639-4528
FIRE UNDERWRITERS SURVEY A SERVICE TO INSURERS AND MUNICIPALITIES
c/o Risk Management Services
The DPG is a numerical system scaled from 1 to 5. DPG 1 represents the highest standard of service whereas DPG 5 indicates little or no recognized level of public fire protection. This grading reflects the ability of a community to effectively respond to fires in small buildings (single family residences and duplexes, aka. detached dwellings). An effective response requires adequate manpower (with appropriate training and equipment), apparatus, water supply and response time must be reasonably fast.
Public Fire Protection Classification for Commercial Lines The second grade that communities are interested in is the Public Fire Protection Classification. This grade is calculated from a comprehensive evaluation of the community and fire defence capabilities. This grade is a numerical value between 1 and 10 with 1 being superior fire protection and 10 being unprotected. The PFPC of a community is a significant factor that most insurance companies use to set insurance premium rates for all buildings insured under Commercial Lines (all buildings that are not single family residences or duplexes). This includes assembly, institutional, industrial, multi-family residential and all others. The PFPC considers over 500 different variables from 5 key areas: Risk Assessment, Water Supplies, Fire Department, Life Safety Control, and Emergency Communications. Each variable is weighted differently based on its importance to municipal fire protection as a whole. The total score is then determined and scaled down to a 100 point system. Because of this, in almost all cases making a single change or slight alteration to the current level of service does not result in improving or downgrading a fire insurance grade. Rather, it is a combination of implementing a number of changes (be it small or large) that can result in a grade change. Table 1 PFPC Credit Score
Overall PFPC Credit Range Per PFPC Grade 1 90.00 – 100.00 2 80.00 – 89.99 3 70.00 – 79.99 4 60.00 – 69.99 5 50.00 – 59.99 6 40.00 – 49.99 7 30.00 – 39.99 8 20.00 – 29.99 9 10.00 – 19.99
10 0.00 – 9.99 Most insurance companies across Canada use the fire insurance grades (DPG and PFPC) as a factor in

Western Canada Ontario Quebec Atlantic Canada
3999 Henning Drive 150 Commerce Valley Drive West 1611 Cremazie Boulevard East 238 Brownlow Avenue, Suite 300 Burnaby, BC V5C 6P9 Markham, ON L3T 7Z3 Montreal, QC H2M 2P2 Dartmouth, NS B3B 1Y2
1 (800) 665-5661 1 (800) 268-8080 1 (800) 263-5361 1 (800) 639-4528
FIRE UNDERWRITERS SURVEY A SERVICE TO INSURERS AND MUNICIPALITIES
c/o Risk Management Services
setting the premiums they charge for property insurance; the better the community’s fire insurance grade, the lower the premiums the insurance company would charge for property insurance in that community. It is important to note that DPG 1 and 2 are both linked to the PFPC. In order for a community to receive DPG 1, both the fire department and water supplies must receive at least 50% credit in their relative classification. A DPG 2 is applied when both the fire department and water supply receive at least 40% credit within their relative classification.
2. SCOPE OF WORK Fire Underwriters Survey was requested by the Toronto Fire Service to conduct a cost impact analysis of the fire insurance grades assigned to the community and to compare the difference in insurance premiums across the assessed values of the City for PFPC 3 and PFPC 4. Note that at both PFPC 3 and 4 the Dwelling Protection Grade would remain at DPG 1. The DPG would not change between the 2 PFPC classes considered. As such, no analysis of the cost impact of dwelling insurance (Personal Lines) has been considered here. However it is important to note that dwelling owners in the City of Toronto are saving the greatest amount of insurance premiums through receiving the best possible protected insurance rates associated with Dwelling Protection Grade 1.
3. COST BENEFIT ANALYSIS How do fire insurance grading results affect insurance premiums? Insurance companies have different ways of interpreting fire insurance grades using the information they acquire through the fire insurance grading index. Most insurers in Canada currently use a three tier system that groups communities into three “tiers” of fire protection; protected, semi-protected and unprotected. These three tiers are normally correlated to Public Fire Protection Classifications as follows:
Fire Underwriters Survey Public Fire Protection
Classifications
System Used by Many Insurance Companies “3
tier” System
Insurance Companies Typically Refer to this
Grade As: 1 2 3 4
Table 1 Protected
5 6 7
Table 2 Semi-Protected
8 9
10
Table 3 Unprotected
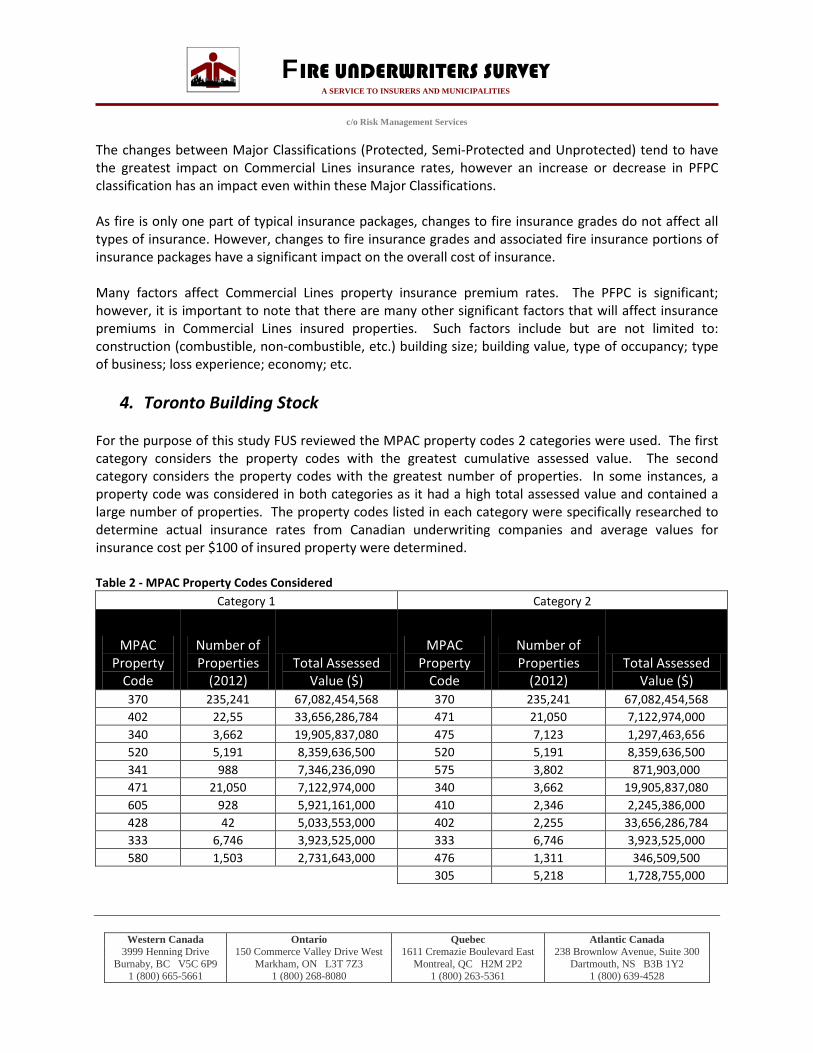
Western Canada Ontario Quebec Atlantic Canada
3999 Henning Drive 150 Commerce Valley Drive West 1611 Cremazie Boulevard East 238 Brownlow Avenue, Suite 300 Burnaby, BC V5C 6P9 Markham, ON L3T 7Z3 Montreal, QC H2M 2P2 Dartmouth, NS B3B 1Y2
1 (800) 665-5661 1 (800) 268-8080 1 (800) 263-5361 1 (800) 639-4528
FIRE UNDERWRITERS SURVEY A SERVICE TO INSURERS AND MUNICIPALITIES
c/o Risk Management Services
The changes between Major Classifications (Protected, Semi-Protected and Unprotected) tend to have the greatest impact on Commercial Lines insurance rates, however an increase or decrease in PFPC classification has an impact even within these Major Classifications. As fire is only one part of typical insurance packages, changes to fire insurance grades do not affect all types of insurance. However, changes to fire insurance grades and associated fire insurance portions of insurance packages have a significant impact on the overall cost of insurance. Many factors affect Commercial Lines property insurance premium rates. The PFPC is significant; however, it is important to note that there are many other significant factors that will affect insurance premiums in Commercial Lines insured properties. Such factors include but are not limited to: construction (combustible, non-combustible, etc.) building size; building value, type of occupancy; type of business; loss experience; economy; etc.
4. Toronto Building Stock For the purpose of this study FUS reviewed the MPAC property codes 2 categories were used. The first category considers the property codes with the greatest cumulative assessed value. The second category considers the property codes with the greatest number of properties. In some instances, a property code was considered in both categories as it had a high total assessed value and contained a large number of properties. The property codes listed in each category were specifically researched to determine actual insurance rates from Canadian underwriting companies and average values for insurance cost per $100 of insured property were determined. Table 2 - MPAC Property Codes Considered
Category 1 Category 2
MPAC Property
Code
Number of Properties
(2012) Total Assessed
Value ($)
MPAC Property
Code
Number of Properties
(2012) Total Assessed
Value ($) 370 235,241 67,082,454,568 370 235,241 67,082,454,568 402 22,55 33,656,286,784 471 21,050 7,122,974,000 340 3,662 19,905,837,080 475 7,123 1,297,463,656 520 5,191 8,359,636,500 520 5,191 8,359,636,500 341 988 7,346,236,090 575 3,802 871,903,000 471 21,050 7,122,974,000 340 3,662 19,905,837,080 605 928 5,921,161,000 410 2,346 2,245,386,000 428 42 5,033,553,000 402 2,255 33,656,286,784 333 6,746 3,923,525,000 333 6,746 3,923,525,000 580 1,503 2,731,643,000 476 1,311 346,509,500
305 5,218 1,728,755,000

Western Canada Ontario Quebec Atlantic Canada
3999 Henning Drive 150 Commerce Valley Drive West 1611 Cremazie Boulevard East 238 Brownlow Avenue, Suite 300 Burnaby, BC V5C 6P9 Markham, ON L3T 7Z3 Montreal, QC H2M 2P2 Dartmouth, NS B3B 1Y2
1 (800) 665-5661 1 (800) 268-8080 1 (800) 263-5361 1 (800) 639-4528
FIRE UNDERWRITERS SURVEY A SERVICE TO INSURERS AND MUNICIPALITIES
c/o Risk Management Services
To determine the aggregate financial impact on the insurance premiums paid by property owners throughout the City, insurance rates (per hundred dollars insured) were determined from several major insurance companies and averaged for the categories listed. This information was then extrapolated to give an approximate value for the entire building stock across the City of Toronto. Table 2 indicates the two categories considered, the total assessed value and the total number of properties for each property code used in this calculation.
Fire Insurance Grading Cost Benefit Property owners within the City are currently receiving significant insurance premium reductions. The City of Toronto currently is underwritten as a PFPC Class 3 City. This has a distinct impact on property insurance rates as shown in the following Table. Moving to a Class 4 would impact the property insurance rates for owners of Commercial Lines insured properties (but not dwellings). Table 3 provides some examples of insurance reductions for different types of commercial lines insured properties within the City between PFPC Class 3 and Class 4. The values selected for the listed properties are based on common property values from the MPAC assessment roll provided by the City.
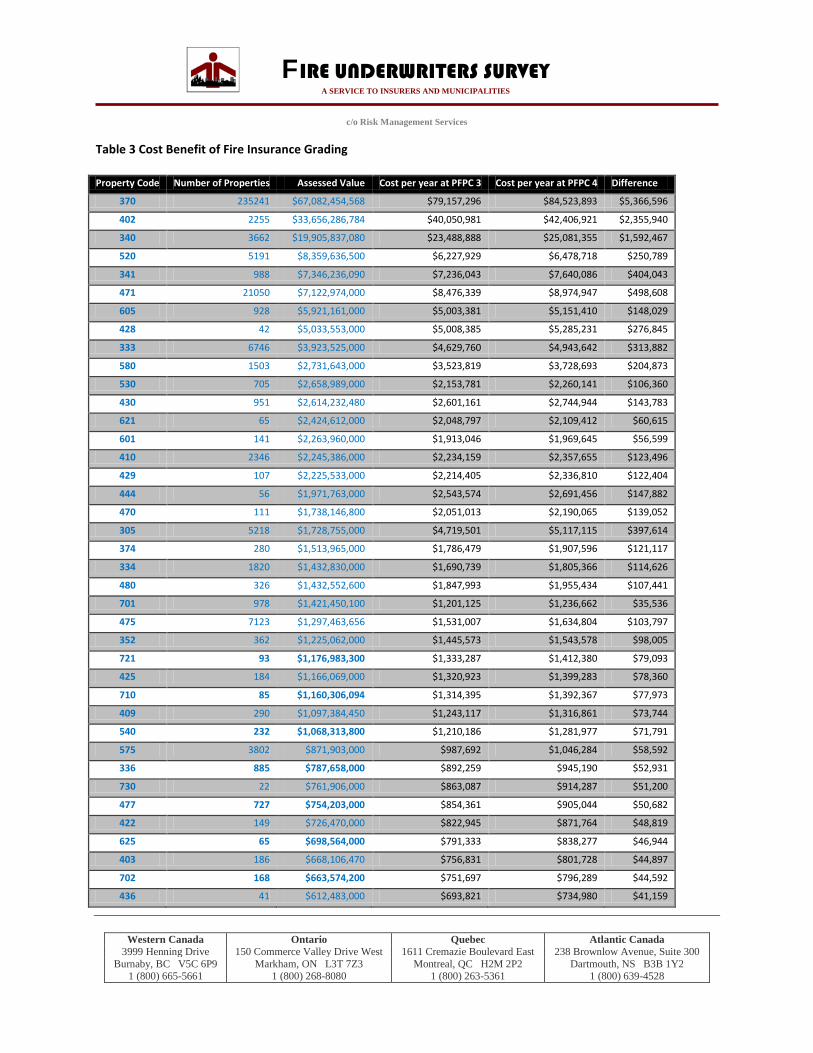
Western Canada Ontario Quebec Atlantic Canada
3999 Henning Drive 150 Commerce Valley Drive West 1611 Cremazie Boulevard East 238 Brownlow Avenue, Suite 300 Burnaby, BC V5C 6P9 Markham, ON L3T 7Z3 Montreal, QC H2M 2P2 Dartmouth, NS B3B 1Y2
1 (800) 665-5661 1 (800) 268-8080 1 (800) 263-5361 1 (800) 639-4528
FIRE UNDERWRITERS SURVEY A SERVICE TO INSURERS AND MUNICIPALITIES
c/o Risk Management Services
Table 3 Cost Benefit of Fire Insurance Grading Property Code Number of Properties Assessed Value Cost per year at PFPC 3 Cost per year at PFPC 4 Difference
370 235241 $67,082,454,568 $79,157,296 $84,523,893 $5,366,596
402 2255 $33,656,286,784 $40,050,981 $42,406,921 $2,355,940
340 3662 $19,905,837,080 $23,488,888 $25,081,355 $1,592,467
520 5191 $8,359,636,500 $6,227,929 $6,478,718 $250,789
341 988 $7,346,236,090 $7,236,043 $7,640,086 $404,043
471 21050 $7,122,974,000 $8,476,339 $8,974,947 $498,608
605 928 $5,921,161,000 $5,003,381 $5,151,410 $148,029
428 42 $5,033,553,000 $5,008,385 $5,285,231 $276,845
333 6746 $3,923,525,000 $4,629,760 $4,943,642 $313,882
580 1503 $2,731,643,000 $3,523,819 $3,728,693 $204,873
530 705 $2,658,989,000 $2,153,781 $2,260,141 $106,360
430 951 $2,614,232,480 $2,601,161 $2,744,944 $143,783
621 65 $2,424,612,000 $2,048,797 $2,109,412 $60,615
601 141 $2,263,960,000 $1,913,046 $1,969,645 $56,599
410 2346 $2,245,386,000 $2,234,159 $2,357,655 $123,496
429 107 $2,225,533,000 $2,214,405 $2,336,810 $122,404
444 56 $1,971,763,000 $2,543,574 $2,691,456 $147,882
470 111 $1,738,146,800 $2,051,013 $2,190,065 $139,052
305 5218 $1,728,755,000 $4,719,501 $5,117,115 $397,614
374 280 $1,513,965,000 $1,786,479 $1,907,596 $121,117
334 1820 $1,432,830,000 $1,690,739 $1,805,366 $114,626
480 326 $1,432,552,600 $1,847,993 $1,955,434 $107,441
701 978 $1,421,450,100 $1,201,125 $1,236,662 $35,536
475 7123 $1,297,463,656 $1,531,007 $1,634,804 $103,797
352 362 $1,225,062,000 $1,445,573 $1,543,578 $98,005
721 93 $1,176,983,300 $1,333,287 $1,412,380 $79,093
425 184 $1,166,069,000 $1,320,923 $1,399,283 $78,360
710 85 $1,160,306,094 $1,314,395 $1,392,367 $77,973
409 290 $1,097,384,450 $1,243,117 $1,316,861 $73,744
540 232 $1,068,313,800 $1,210,186 $1,281,977 $71,791
575 3802 $871,903,000 $987,692 $1,046,284 $58,592
336 885 $787,658,000 $892,259 $945,190 $52,931
730 22 $761,906,000 $863,087 $914,287 $51,200
477 727 $754,203,000 $854,361 $905,044 $50,682
422 149 $726,470,000 $822,945 $871,764 $48,819
625 65 $698,564,000 $791,333 $838,277 $46,944
403 186 $668,106,470 $756,831 $801,728 $44,897
702 168 $663,574,200 $751,697 $796,289 $44,592
436 41 $612,483,000 $693,821 $734,980 $41,159

Western Canada Ontario Quebec Atlantic Canada
3999 Henning Drive 150 Commerce Valley Drive West 1611 Cremazie Boulevard East 238 Brownlow Avenue, Suite 300 Burnaby, BC V5C 6P9 Markham, ON L3T 7Z3 Montreal, QC H2M 2P2 Dartmouth, NS B3B 1Y2
1 (800) 665-5661 1 (800) 268-8080 1 (800) 263-5361 1 (800) 639-4528
FIRE UNDERWRITERS SURVEY A SERVICE TO INSURERS AND MUNICIPALITIES
c/o Risk Management Services
Property Code Number of Properties Assessed Value Cost per year at PFPC 3 Cost per year at PFPC 4 Difference
626 63 $595,880,000 $675,013 $715,056 $40,043
421 649 $576,318,000 $652,853 $691,582 $38,729
427 21 $560,762,000 $635,231 $672,914 $37,683
602 48 $526,971,000 $596,953 $632,365 $35,412
373 57 $525,905,000 $595,745 $631,086 $35,341
434 70 $525,244,000 $594,996 $630,293 $35,296
416 29 $523,192,000 $592,672 $627,830 $35,159
405 787 $521,675,500 $590,954 $626,011 $35,057
420 396 $513,935,450 $582,186 $616,723 $34,536
335 591 $492,828,000 $558,276 $591,394 $33,118
125 180 $473,083,000 $535,908 $567,700 $31,791
360 547 $444,791,600 $503,860 $533,750 $29,890
733 6 $419,378,000 $475,071 $503,254 $28,182
510 67 $406,808,000 $460,832 $488,170 $27,337
531 102 $405,091,000 $458,887 $486,109 $27,222
445 37 $401,122,000 $454,391 $481,346 $26,955
435 26 $385,545,000 $436,745 $462,654 $25,909
417 16 $379,089,000 $429,432 $454,907 $25,475
735 104 $373,076,000 $422,620 $447,691 $25,071
115 70 $371,723,320 $421,088 $446,068 $24,980
476 1311 $346,509,500 $392,526 $415,811 $23,285
731 74 $337,937,985 $382,816 $405,526 $22,709
722 2 $309,092,000 $350,139 $370,910 $20,771
700 259 $292,113,000 $330,906 $350,536 $19,630
426 26 $288,806,000 $327,159 $346,567 $19,408
481 42 $275,718,280 $312,334 $330,862 $18,528
610 43 $267,600,000 $303,137 $321,120 $17,983
611 94 $260,303,000 $294,871 $312,364 $17,492
303 788 $220,592,400 $249,887 $264,711 $14,824
411 125 $204,759,000 $231,951 $245,711 $13,760
400 199 $201,741,000 $228,532 $242,089 $13,557
496 42 $199,971,000 $226,527 $239,965 $13,438
624 20 $187,988,200 $212,953 $225,586 $12,633
414 148 $181,439,000 $205,534 $217,727 $12,193
375 19 $180,761,000 $204,766 $216,913 $12,147
372 7 $176,853,000 $200,339 $212,224 $11,885
433 83 $176,702,000 $200,168 $212,042 $11,874
736 101 $160,595,500 $181,923 $192,715 $10,792
432 147 $154,072,000 $174,533 $184,886 $10,354
447 1214 $139,922,278 $158,504 $167,907 $9,403
490 88 $129,670,000 $146,890 $155,604 $8,714

Western Canada Ontario Quebec Atlantic Canada
3999 Henning Drive 150 Commerce Valley Drive West 1611 Cremazie Boulevard East 238 Brownlow Avenue, Suite 300 Burnaby, BC V5C 6P9 Markham, ON L3T 7Z3 Montreal, QC H2M 2P2 Dartmouth, NS B3B 1Y2
1 (800) 665-5661 1 (800) 268-8080 1 (800) 263-5361 1 (800) 639-4528
FIRE UNDERWRITERS SURVEY A SERVICE TO INSURERS AND MUNICIPALITIES
c/o Risk Management Services
Property Code Number of Properties Assessed Value Cost per year at PFPC 3 Cost per year at PFPC 4 Difference
478 45 $123,979,480 $140,444 $148,775 $8,331
726 2 $119,358,000 $135,209 $143,230 $8,021
716 5 $116,685,000 $132,181 $140,022 $7,841
377 1802 $115,293,483 $130,604 $138,352 $7,748
705 71 $104,670,000 $118,570 $125,604 $7,034
361 130 $102,368,000 $115,962 $122,842 $6,879
528 23 $101,954,000 $115,493 $122,345 $6,851
472 77 $101,878,000 $115,407 $122,254 $6,846
623 10 $96,919,000 $109,790 $116,303 $6,513
302 93 $90,299,000 $102,291 $108,359 $6,068
545 3 $89,938,000 $101,882 $107,926 $6,044
720 18 $87,191,300 $98,770 $104,630 $5,859
438 17 $85,520,000 $96,877 $102,624 $5,747
408 45 $85,289,000 $96,615 $102,347 $5,731
590 22 $80,385,100 $91,060 $96,462 $5,402
423 53 $76,373,000 $86,515 $91,648 $5,132
441 47 $75,015,000 $84,977 $90,018 $5,041
412 81 $73,328,000 $83,066 $87,994 $4,928
406 140 $71,333,000 $80,806 $85,600 $4,794
512 17 $60,700,000 $68,761 $72,840 $4,079
529 10 $60,293,000 $68,300 $72,352 $4,052
482 71 $54,574,000 $61,821 $65,489 $3,667
365 74 $49,766,000 $56,375 $59,719 $3,344
413 22 $47,734,000 $54,073 $57,281 $3,208
431 1 $47,505,000 $53,814 $57,006 $3,192
521 3 $46,926,000 $53,158 $56,311 $3,153
631 3 $42,238,000 $47,847 $50,686 $2,838
608 50 $40,211,470 $45,552 $48,254 $2,702
450 35 $35,945,000 $40,718 $43,134 $2,416
401 39 $35,753,000 $40,501 $42,904 $2,403
544 7 $31,741,000 $35,956 $38,089 $2,133
473 41 $30,592,000 $34,655 $36,710 $2,056
725 2 $28,211,000 $31,957 $33,853 $1,896
415 17 $26,507,000 $30,027 $31,808 $1,781
734 5 $21,284,000 $24,111 $25,541 $1,430
492 3 $21,164,000 $23,975 $25,397 $1,422
304 64 $18,452,000 $20,902 $22,142 $1,240
487 22 $17,785,000 $20,147 $21,342 $1,195
711 8 $16,990,000 $19,246 $20,388 $1,142
489 7 $16,243,000 $18,400 $19,492 $1,092
376 859 $14,882,350 $16,859 $17,859 $1,000
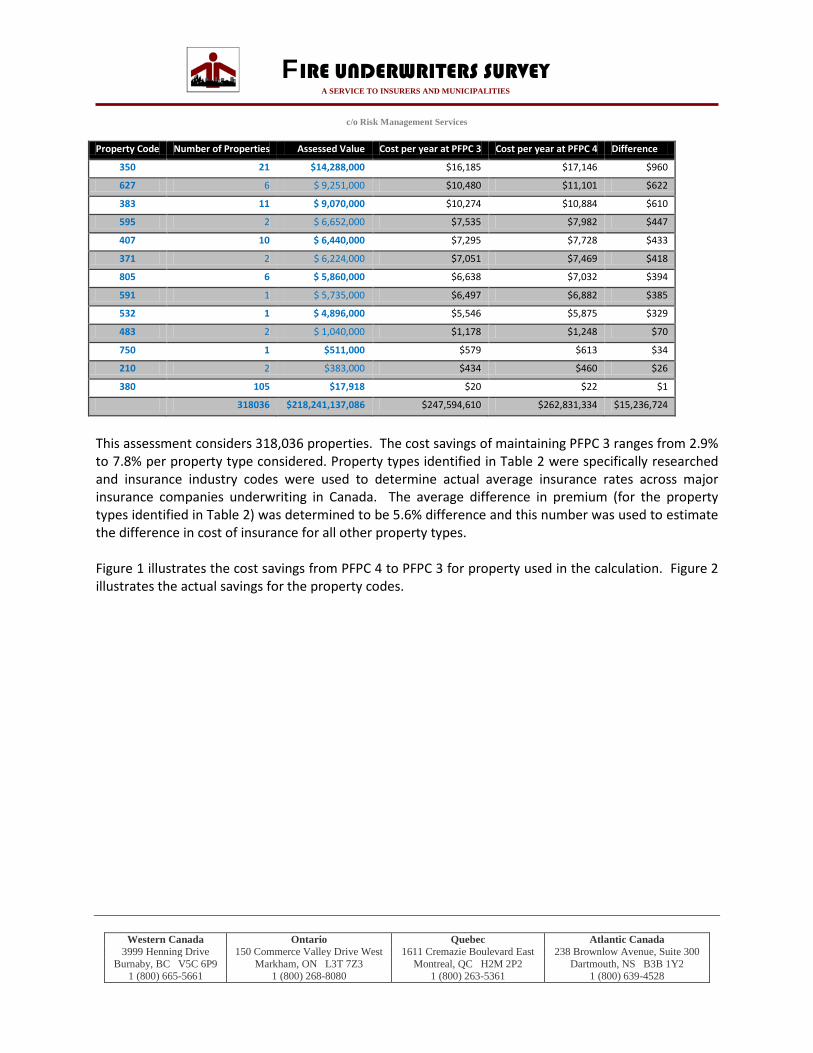
Western Canada Ontario Quebec Atlantic Canada
3999 Henning Drive 150 Commerce Valley Drive West 1611 Cremazie Boulevard East 238 Brownlow Avenue, Suite 300 Burnaby, BC V5C 6P9 Markham, ON L3T 7Z3 Montreal, QC H2M 2P2 Dartmouth, NS B3B 1Y2
1 (800) 665-5661 1 (800) 268-8080 1 (800) 263-5361 1 (800) 639-4528
FIRE UNDERWRITERS SURVEY A SERVICE TO INSURERS AND MUNICIPALITIES
c/o Risk Management Services
Property Code Number of Properties Assessed Value Cost per year at PFPC 3 Cost per year at PFPC 4 Difference
350 21 $14,288,000 $16,185 $17,146 $960
627 6 $ 9,251,000 $10,480 $11,101 $622
383 11 $ 9,070,000 $10,274 $10,884 $610
595 2 $ 6,652,000 $7,535 $7,982 $447
407 10 $ 6,440,000 $7,295 $7,728 $433
371 2 $ 6,224,000 $7,051 $7,469 $418
805 6 $ 5,860,000 $6,638 $7,032 $394
591 1 $ 5,735,000 $6,497 $6,882 $385
532 1 $ 4,896,000 $5,546 $5,875 $329
483 2 $ 1,040,000 $1,178 $1,248 $70
750 1 $511,000 $579 $613 $34
210 2 $383,000 $434 $460 $26
380 105 $17,918 $20 $22 $1
318036 $218,241,137,086 $247,594,610 $262,831,334 $15,236,724
This assessment considers 318,036 properties. The cost savings of maintaining PFPC 3 ranges from 2.9% to 7.8% per property type considered. Property types identified in Table 2 were specifically researched and insurance industry codes were used to determine actual average insurance rates across major insurance companies underwriting in Canada. The average difference in premium (for the property types identified in Table 2) was determined to be 5.6% difference and this number was used to estimate the difference in cost of insurance for all other property types. Figure 1 illustrates the cost savings from PFPC 4 to PFPC 3 for property used in the calculation. Figure 2 illustrates the actual savings for the property codes.
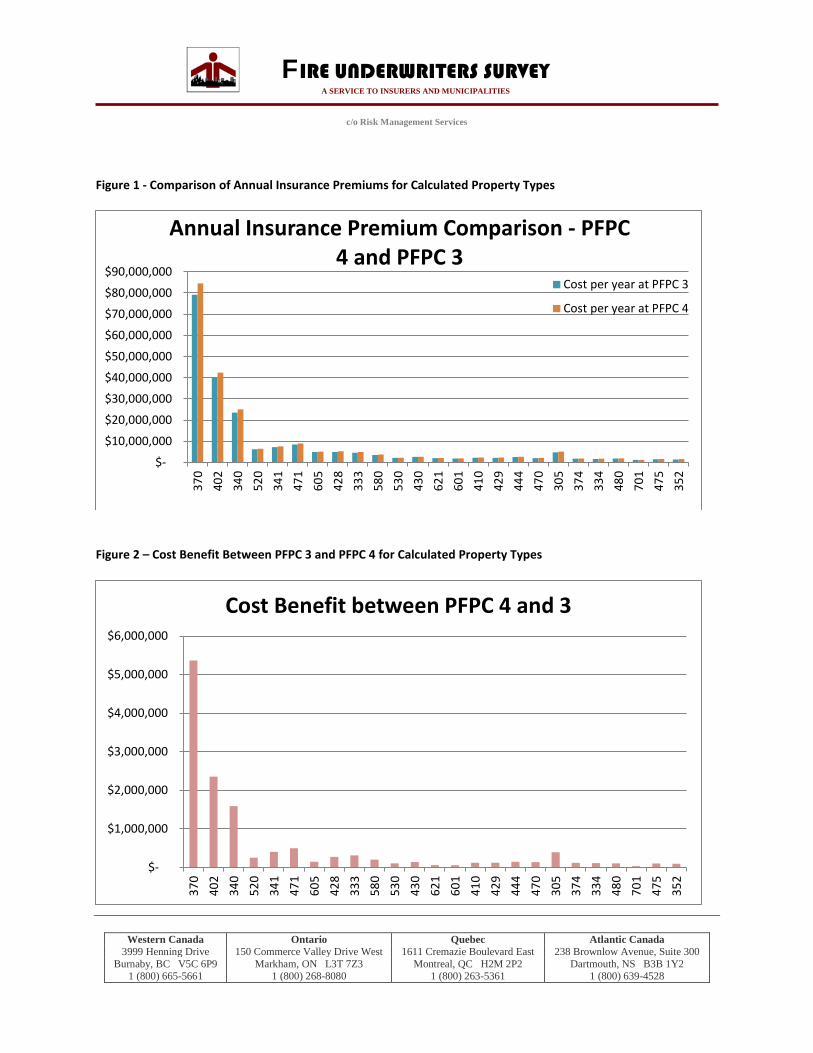
Western Canada Ontario Quebec Atlantic Canada
3999 Henning Drive 150 Commerce Valley Drive West 1611 Cremazie Boulevard East 238 Brownlow Avenue, Suite 300 Burnaby, BC V5C 6P9 Markham, ON L3T 7Z3 Montreal, QC H2M 2P2 Dartmouth, NS B3B 1Y2
1 (800) 665-5661 1 (800) 268-8080 1 (800) 263-5361 1 (800) 639-4528
FIRE UNDERWRITERS SURVEY A SERVICE TO INSURERS AND MUNICIPALITIES
c/o Risk Management Services
Figure 1 - Comparison of Annual Insurance Premiums for Calculated Property Types
Figure 2 – Cost Benefit Between PFPC 3 and PFPC 4 for Calculated Property Types
$-
$10,000,000
$20,000,000
$30,000,000
$40,000,000
$50,000,000
$60,000,000
$70,000,000
$80,000,000
$90,000,000
370
402
340
520
341
471
605
428
333
580
530
430
621
601
410
429
444
470
305
374
334
480
701
475
352
Annual Insurance Premium Comparison - PFPC 4 and PFPC 3
Cost per year at PFPC 3
Cost per year at PFPC 4
$-
$1,000,000
$2,000,000
$3,000,000
$4,000,000
$5,000,000
$6,000,000
370
402
340
520
341
471
605
428
333
580
530
430
621
601
410
429
444
470
305
374
334
480
701
475
352
Cost Benefit between PFPC 4 and 3
Western Canada Ontario Quebec Atlantic Canada
3999 Henning Drive 150 Commerce Valley Drive West 1611 Cremazie Boulevard East 238 Brownlow Avenue, Suite 300 Burnaby, BC V5C 6P9 Markham, ON L3T 7Z3 Montreal, QC H2M 2P2 Dartmouth, NS B3B 1Y2
1 (800) 665-5661 1 (800) 268-8080 1 (800) 263-5361 1 (800) 639-4528
FIRE UNDERWRITERS SURVEY A SERVICE TO INSURERS AND MUNICIPALITIES
c/o Risk Management Services
Conclusion Across the $218,241,137,086 of properties insured under commercial lines in the City of Toronto, the difference in insurance costs is calculated at $15,236,724 per year. Note that individual insurance companies differ in the determinations of applicable premiums for any given property, however the change between PFPC Classes 3 and 4 has an impact across all properties insured under commercial lines and the percent difference between companies is similar although the underlying premium may differ substantially. This calculation is an estimate of the aggregate impact on insurance premiums and is based on broad assumptions and extrapolation, but is expected to be reasonably accurate with respect to the order of magnitude of impact that a change in PFPC class between 3 and 4 would have on the City.