Embed Size (px)
Citation preview
City of Toronto | Official Plan Indicators 1
City of Toronto Official Plan Indicators
2017
Gladki Planning Associates in association with Hemson Consulting & Studio Jaywall
Attachment 1

City of Toronto | Official Plan Indicators 2
Introduction
What is the Official Plan?The Official Plan is a policy framework that directs and manages physical change. It establishes a vision for the future of the city and details policies to shape the social, economic and natural environment to ensure the City of Toronto’s continuing success as an urban place.
Beyond being a statement of intent and direction, the Official Plan is a legal document, defined by the Ontario Planning Act, that serves as the basis for a wide range of municipal activities, including the planning and approval of public works (e.g. roads, parks and community facilities), the development of planning tools like the comprehensive zoning by-law and the review and approval of development applications.
What are Official Plan indicators and why are they important?The Official Plan indicators are a set of measures that allow progress toward the Plan’s vision to be assessed.
The City Planning Division, in collaboration with other divisions within the City of Toronto, takes a lead role in the development and implementation of the Official Plan. The goal is to have Official Plan policies which are effective in establishing and realizing an agenda for change. The Official Plan indicators will contribute to a better understanding of the effectiveness of implementation of these policies.
City of Toronto | Official Plan Indicators 3
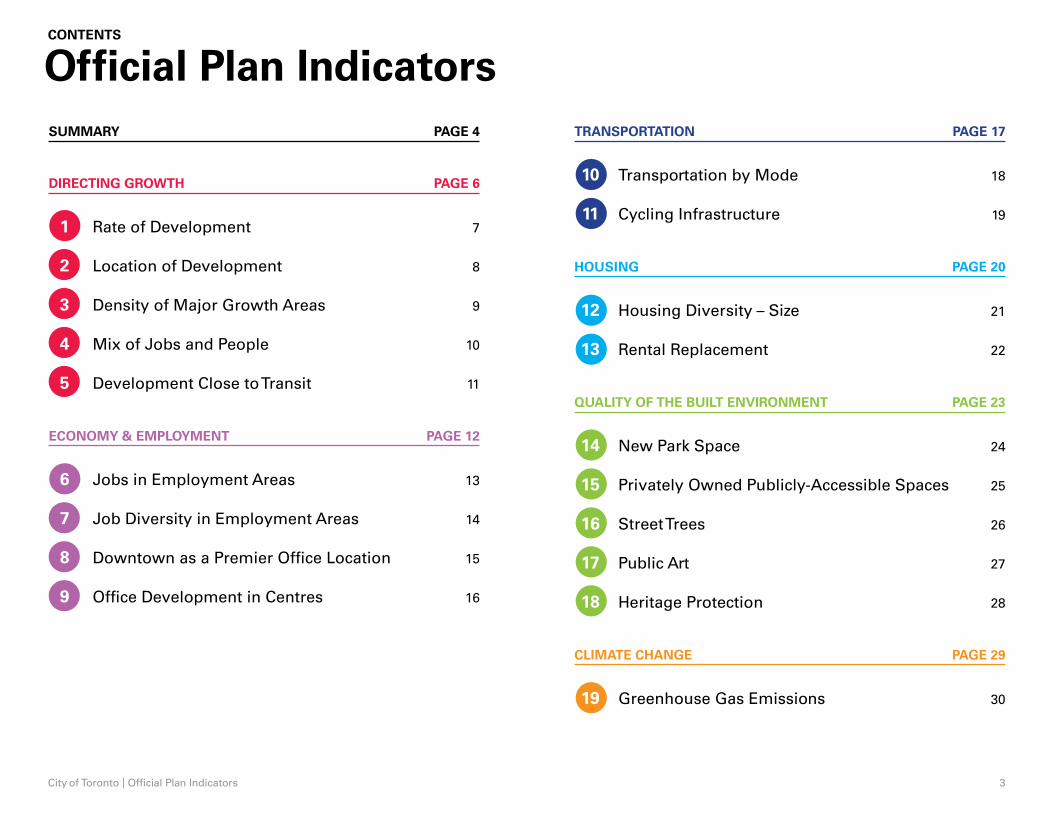
CONTENTS
Official Plan IndicatorsSUMMARY PAGE 4
DIRECTING GROWTH PAGE 6
1 Rate of Development 7
2 Location of Development 8
3 Density of Major Growth Areas 9
4 Mix of Jobs and People 10
5 Development Close to Transit 11
ECONOMY & EMPLOYMENT PAGE 12
6 Jobs in Employment Areas 13
7 Job Diversity in Employment Areas 14
8 Downtown as a Premier Office Location 15
9 Office Development in Centres 16
TRANSPORTATION PAGE 17
10 Transportation by Mode 18
11 Cycling Infrastructure 19
HOUSING PAGE 20
12 Housing Diversity – Size 21
13 Rental Replacement 22
QUALITY OF THE BUILT ENVIRONMENT PAGE 23
14 New Park Space 24
15 Privately Owned Publicly-Accessible Spaces 25
16 Street Trees 26
17 Public Art 27
18 Heritage Protection 28
CLIMATE CHANGE PAGE 29
19 Greenhouse Gas Emissions 30
City of Toronto | Official Plan Indicators 4
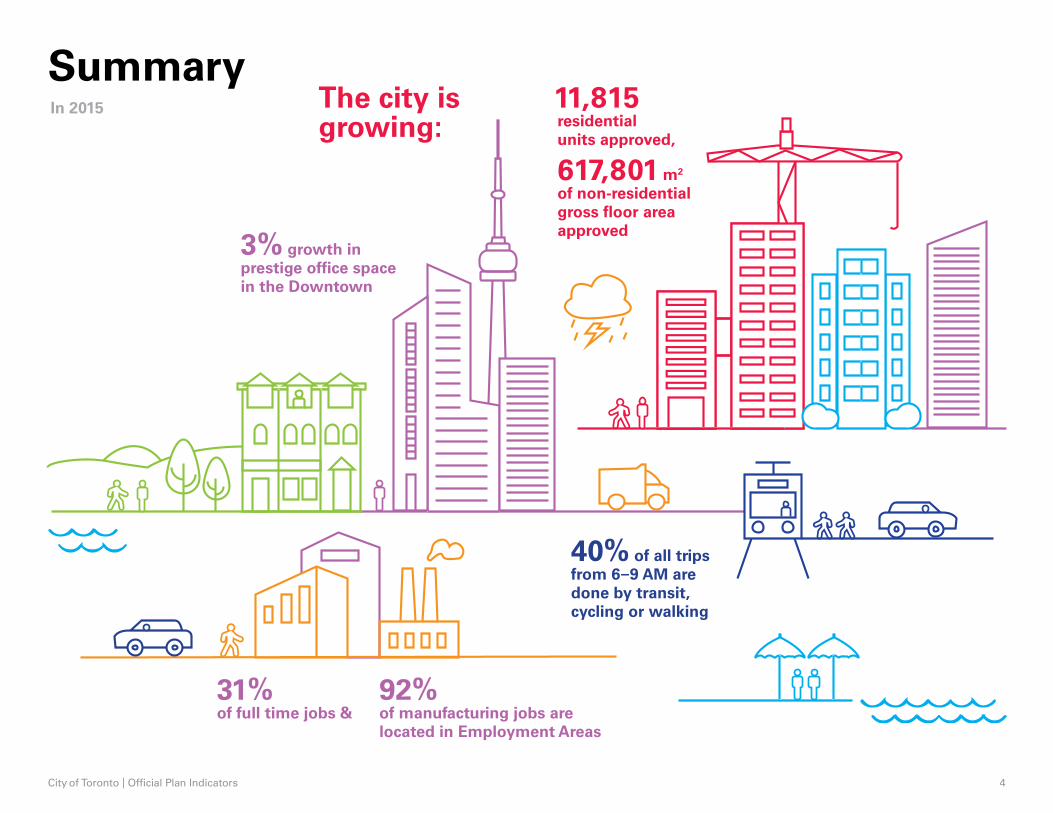
SummaryIn 2015 The city is
growing:11,815 residential units approved,
617,801 m2 of non-residential gross floor area approved
3% growth in prestige office space in the Downtown
40% of all trips from 6–9 AM are done by transit, cycling or walking
31% of full time jobs &
92% of manufacturing jobs are located in Employment Areas
City of Toronto | Official Plan Indicators 5
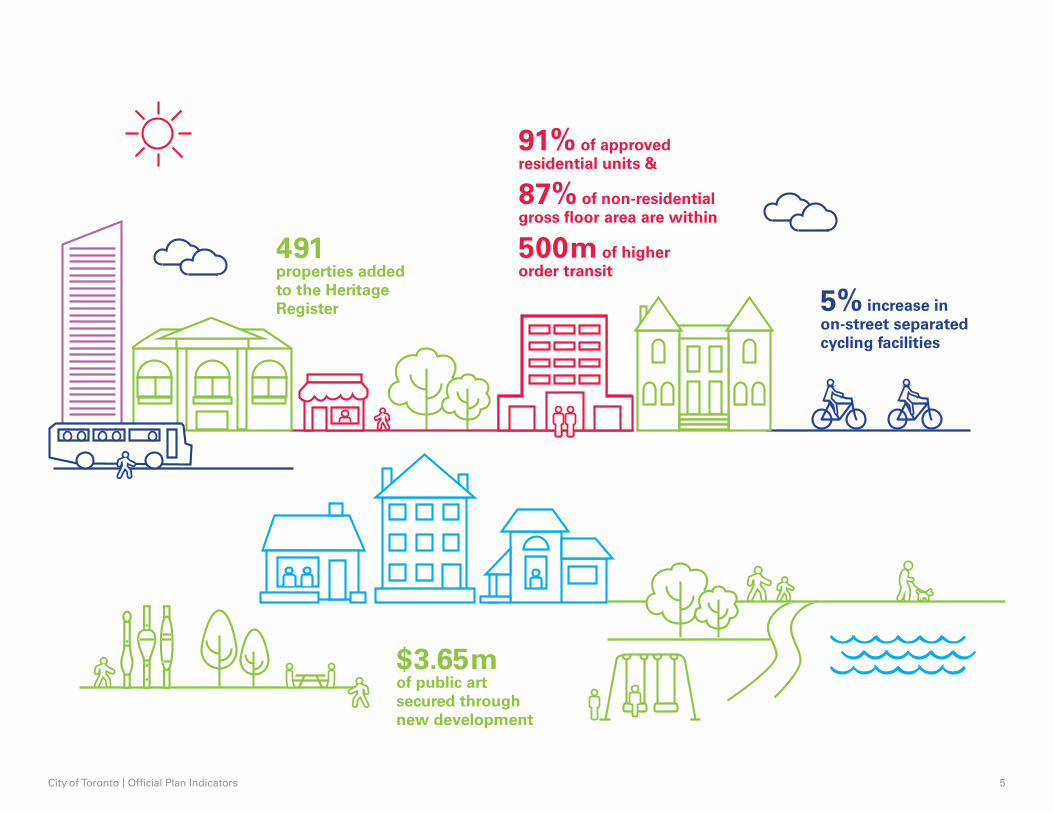
91% of approved residential units &
87% of non-residential gross floor area are within
500m of higher order transit
491 properties added to the Heritage Register 5% increase in
on-street separated cycling facilities
$3.65m of public art secured through new development
City of Toronto | Official Plan Indicators 6
Directing Growth
1 Rate of Development
2 Location of Development
3 Density of Major Growth Areas
4 Mix of Jobs and People
5 Development Close to Transit
City of Toronto | Official Plan Indicators 7
1
Rate of DevelopmentDirecting Growth
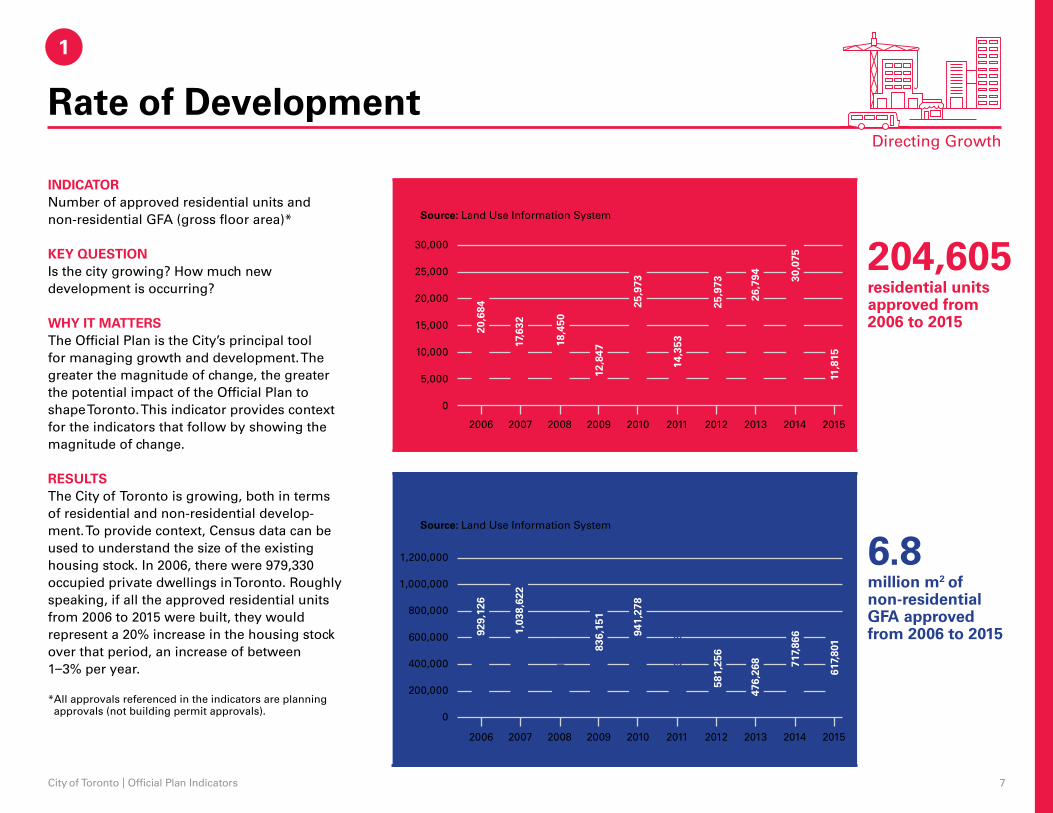
INDICATORNumber of approved residential units and non-residential GFA (gross floor area)*
KEY QUESTIONIs the city growing? How much new development is occurring?
WHY IT MATTERSThe Official Plan is the City’s principal tool for managing growth and development. The greater the magnitude of change, the greater the potential impact of the Official Plan to shape Toronto. This indicator provides context for the indicators that follow by showing the magnitude of change.
RESULTSThe City of Toronto is growing, both in terms of residential and non-residential develop-ment. To provide context, Census data can be used to understand the size of the existing housing stock. In 2006, there were 979,330 occupied private dwellings in Toronto. Roughly speaking, if all the approved residential units from 2006 to 2015 were built, they would represent a 20% increase in the housing stock over that period, an increase of between 1–3% per year.
* All approvals referenced in the indicators are planning approvals (not building permit approvals).
Approved Residential Units (2006–2015)
204,605residential units approved from 2006 to 2015
Approved Non–Residential Gross Floor Area(2006–2015)
6.8million m2 of non-residential GFA approved from 2006 to 2015
0
5,000
10,000
15,000
20,000
25,000
30,000
2006 2007 2008 2009 2010 2011 2012 2013 2014 2015
Source: Land Use Information System
20,6
84
17,6
32
18,4
50
12,8
47
25,9
73
14,3
53
25,9
73
26,7
94 30,0
75
11,8
15
0
200,000
400,000
600,000
800,000
1,000,000
1,200,000
2006 2007 2008 2009 2010 2011 2012 2013 2014 2015
Source: Land Use Information System
929,
126
1,03
8,62
2
310,
112
836,
151
941,
278
369,
981
581,
256
476,
268 71
7,86
6
617,
801
City of Toronto | Official Plan Indicators 8
2
Location of DevelopmentDirecting Growth
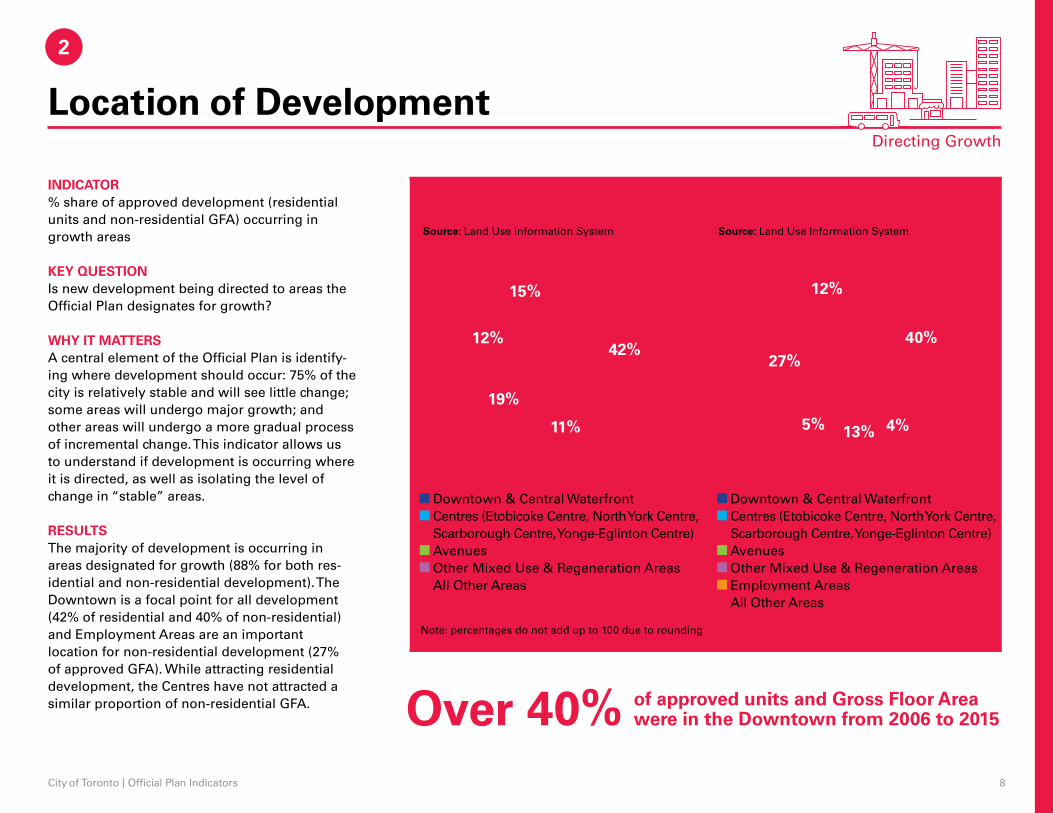
INDICATOR% share of approved development (residential units and non-residential GFA) occurring in growth areas
KEY QUESTIONIs new development being directed to areas the Official Plan designates for growth?
WHY IT MATTERSA central element of the Official Plan is identify-ing where development should occur: 75% of the city is relatively stable and will see little change; some areas will undergo major growth; and other areas will undergo a more gradual process of incremental change. This indicator allows us to understand if development is occurring where it is directed, as well as isolating the level of change in “stable” areas.
RESULTSThe majority of development is occurring in areas designated for growth (88% for both res-idential and non-residential development). The Downtown is a focal point for all development (42% of residential and 40% of non-residential) and Employment Areas are an important location for non-residential development (27% of approved GFA). While attracting residential development, the Centres have not attracted a similar proportion of non-residential GFA.
Approved Residential Units(2006–2015)
Approved Non-Residential Gross Floor Area (2006–2015)
Over 40% of approved units and Gross Floor Area were in the Downtown from 2006 to 2015
Source: Land Use Information System Source: Land Use Information System
42%40%
11% 4%
19%
13%
12%
5%
27%
15% 12%
Note: percentages do not add up to 100 due to rounding
Downtown & Central WaterfrontCentres (Etobicoke Centre, North York Centre, Scarborough Centre, Yonge-Eglinton Centre)AvenuesOther Mixed Use & Regeneration AreasAll Other Areas
Downtown & Central WaterfrontCentres (Etobicoke Centre, North York Centre, Scarborough Centre, Yonge-Eglinton Centre)AvenuesOther Mixed Use & Regeneration AreasEmployment AreasAll Other Areas
City of Toronto | Official Plan Indicators 9
3
Density of Major Growth AreasDirecting Growth
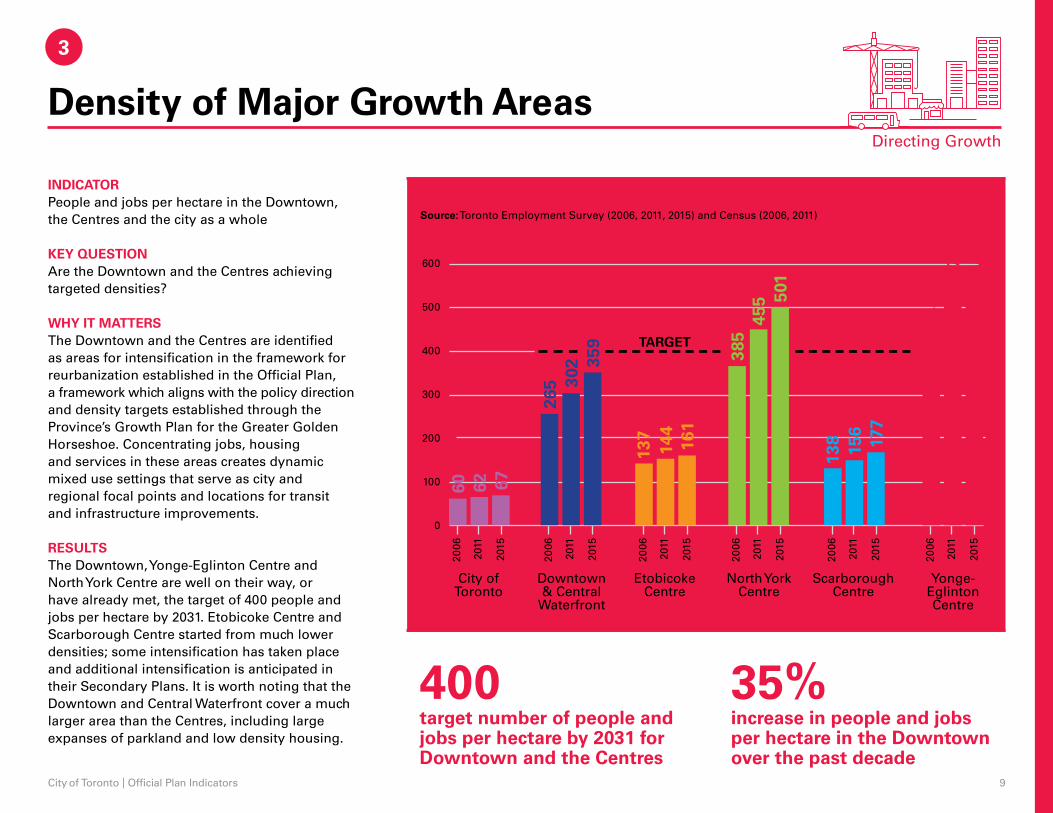
INDICATORPeople and jobs per hectare in the Downtown, the Centres and the city as a whole
KEY QUESTIONAre the Downtown and the Centres achieving targeted densities?
WHY IT MATTERSThe Downtown and the Centres are identified as areas for intensification in the framework for reurbanization established in the Official Plan, a framework which aligns with the policy direction and density targets established through the Province’s Growth Plan for the Greater Golden Horseshoe. Concentrating jobs, housing and services in these areas creates dynamic mixed use settings that serve as city and regional focal points and locations for transit and infrastructure improvements.
RESULTSThe Downtown, Yonge-Eglinton Centre and North York Centre are well on their way, or have already met, the target of 400 people and jobs per hectare by 2031. Etobicoke Centre and Scarborough Centre started from much lower densities; some intensification has taken place and additional intensification is anticipated in their Secondary Plans. It is worth noting that the Downtown and Central Waterfront cover a much larger area than the Centres, including large expanses of parkland and low density housing.
People and Jobs Combined Per Hectare (2006, 2011, 2015)
400target number of people and jobs per hectare by 2031 for Downtown and the Centres
35%increase in people and jobs per hectare in the Downtown over the past decade
Source: Toronto Employment Survey (2006, 2011, 2015) and Census (2006, 2011)
0
100
200
300
400
500
600
TARGET
2006
2011
2015
265 30
2 359
Downtown & Central
Waterfront
2006
2011
2015
60 62 67
City of Toronto
2006
2011
2015
137
144
161
EtobicokeCentre
2006
2011
2015
385
455 50
1
North YorkCentre
2006
2011
2015
138
156
177
ScarboroughCentre
2006
2011
2015
482
570
589
Yonge-EglintonCentre
City of Toronto | Official Plan Indicators 10
4
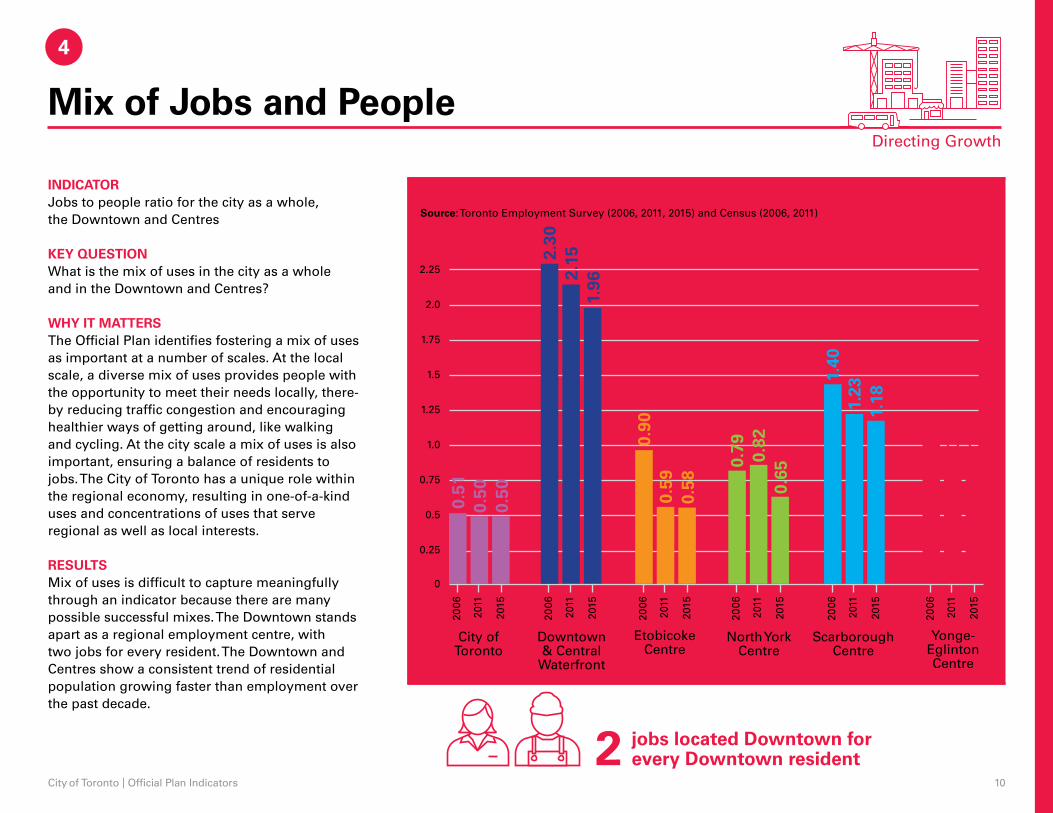
Mix of Jobs and PeopleDirecting Growth
INDICATORJobs to people ratio for the city as a whole, the Downtown and Centres
KEY QUESTIONWhat is the mix of uses in the city as a whole and in the Downtown and Centres?
WHY IT MATTERSThe Official Plan identifies fostering a mix of uses as important at a number of scales. At the local scale, a diverse mix of uses provides people with the opportunity to meet their needs locally, there-by reducing traffic congestion and encouraging healthier ways of getting around, like walking and cycling. At the city scale a mix of uses is also important, ensuring a balance of residents to jobs. The City of Toronto has a unique role within the regional economy, resulting in one-of-a-kind uses and concentrations of uses that serve regional as well as local interests.
RESULTSMix of uses is difficult to capture meaningfully through an indicator because there are many possible successful mixes. The Downtown stands apart as a regional employment centre, with two jobs for every resident. The Downtown and Centres show a consistent trend of residential population growing faster than employment over the past decade.
Jobs to People Ratio (2006, 2011, 2015)
2 jobs located Downtown for every Downtown resident
Source: Toronto Employment Survey (2006, 2011, 2015) and Census (2006, 2011)
1.0
1.25
0
0.25
0.5
0.75
1.5
2.0
2.25
1.75
2006
2011
2015
Downtown & Central
Waterfront
2006
2011
2015
City of Toronto
2006
2011
2015
EtobicokeCentre
2006
2011
2015
North YorkCentre
2006
2011
2015
ScarboroughCentre
2006
2011
2015
Yonge-EglintonCentre
0.50 0.59
0.82
1.23
0.94
0.51
0.90
0.79
1.40
1.16
0.50 0.58 0.
65
1.18
0.94
2.152.
30
1.96
City of Toronto | Official Plan Indicators 11
Directing Growth
Source: Land Use Information System
15%
69%
31%
85%
500mradius from higher order
transit
Approved Non-Residential Gross Floor Area
Approved Residential Units
5
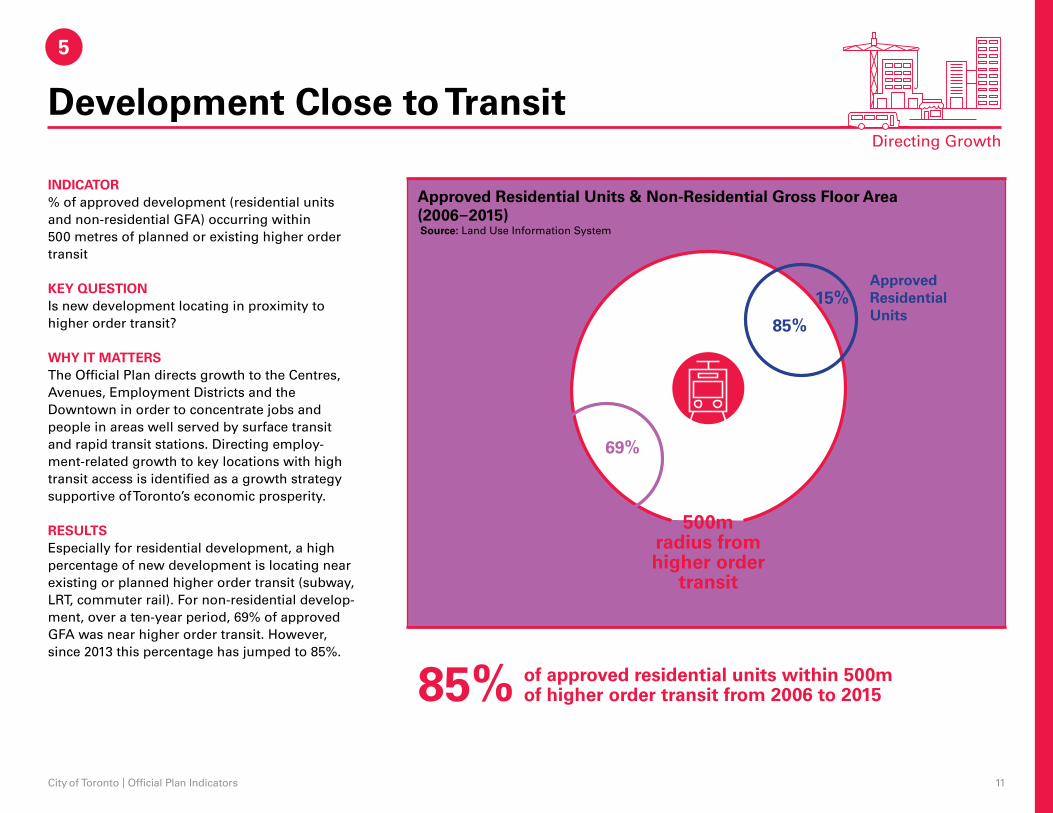
Development Close to Transit
INDICATOR% of approved development (residential units and non-residential GFA) occurring within 500 metres of planned or existing higher order transit
KEY QUESTIONIs new development locating in proximity to higher order transit?
WHY IT MATTERSThe Official Plan directs growth to the Centres, Avenues, Employment Districts and the Downtown in order to concentrate jobs and people in areas well served by surface transit and rapid transit stations. Directing employ-ment-related growth to key locations with high transit access is identified as a growth strategy supportive of Toronto’s economic prosperity.
RESULTSEspecially for residential development, a high percentage of new development is locating near existing or planned higher order transit (subway, LRT, commuter rail). For non-residential develop-ment, over a ten-year period, 69% of approved GFA was near higher order transit. However, since 2013 this percentage has jumped to 85%.
Approved Residential Units & Non-Residential Gross Floor Area (2006–2015)
85% of approved residential units within 500m of higher order transit from 2006 to 2015
City of Toronto | Official Plan Indicators 12
Economy & Employment
6 Jobs in Employment Areas
7 Job Diversity in Employment Areas
8 Downtown as a Premier Office Location
9 Office Development in Centres
City of Toronto | Official Plan Indicators 13
0%
5%
10%
15%
20%
25%
30%
35%
40%
% Full Time % Part Time
2005 2015
Source: Toronto Employment Survey
6
Economy & Employment
33.7%31.3%
19.9%18.2%
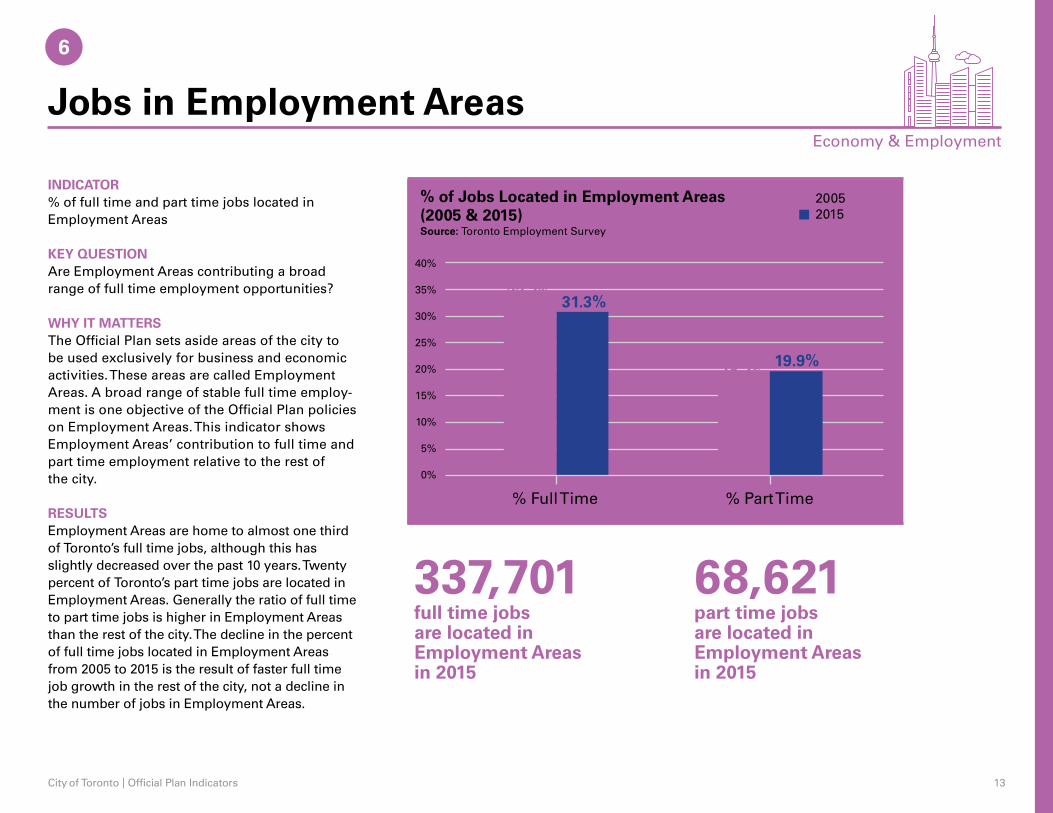
Jobs in Employment Areas
INDICATOR% of full time and part time jobs located in Employment Areas
KEY QUESTIONAre Employment Areas contributing a broad range of full time employment opportunities?
WHY IT MATTERSThe Official Plan sets aside areas of the city to be used exclusively for business and economic activities. These areas are called Employment Areas. A broad range of stable full time employ-ment is one objective of the Official Plan policies on Employment Areas. This indicator shows Employment Areas’ contribution to full time and part time employment relative to the rest of the city.
RESULTSEmployment Areas are home to almost one third of Toronto’s full time jobs, although this has slightly decreased over the past 10 years. Twenty percent of Toronto’s part time jobs are located in Employment Areas. Generally the ratio of full time to part time jobs is higher in Employment Areas than the rest of the city. The decline in the percent of full time jobs located in Employment Areas from 2005 to 2015 is the result of faster full time job growth in the rest of the city, not a decline in the number of jobs in Employment Areas.
% of Jobs Located in Employment Areas (2005 & 2015)
337,701full time jobs are located in Employment Areas in 2015
68,621part time jobs are located in Employment Areas in 2015
City of Toronto | Official Plan Indicators 14
7
Employment Areas
% of employment
per sector
42%
28%
13%
12%
10%
4%
52%
10%
21%
4%
1%
Rest of City
% of employment per sector
Source: Toronto Employment Survey
OfficeManufacturingServices
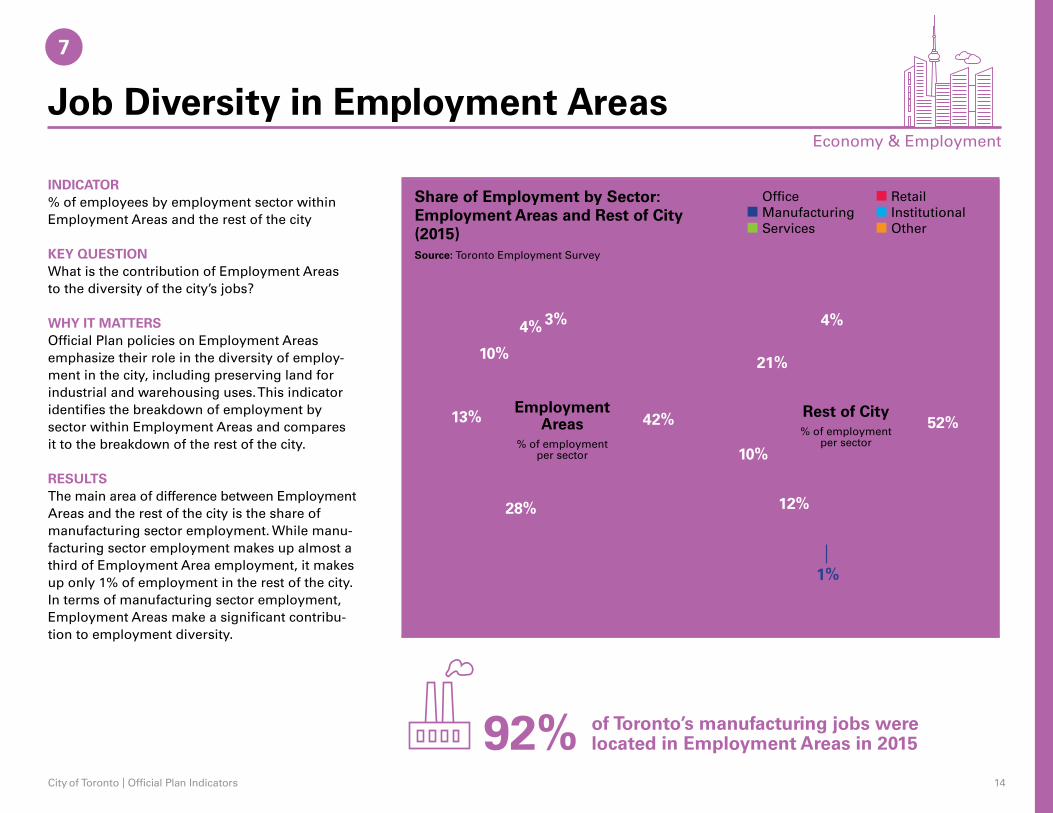
Job Diversity in Employment Areas
INDICATOR% of employees by employment sector within Employment Areas and the rest of the city
KEY QUESTIONWhat is the contribution of Employment Areas to the diversity of the city’s jobs?
WHY IT MATTERSOfficial Plan policies on Employment Areas emphasize their role in the diversity of employ-ment in the city, including preserving land for industrial and warehousing uses. This indicator identifies the breakdown of employment by sector within Employment Areas and compares it to the breakdown of the rest of the city.
RESULTSThe main area of difference between Employment Areas and the rest of the city is the share of manufacturing sector employment. While manu-facturing sector employment makes up almost a third of Employment Area employment, it makes up only 1% of employment in the rest of the city. In terms of manufacturing sector employment, Employment Areas make a significant contribu-tion to employment diversity.
Share of Employment by Sector:Employment Areas and Rest of City (2015)
92% of Toronto’s manufacturing jobs were located in Employment Areas in 2015
RetailInstitutionalOther
3%
Economy & Employment
City of Toronto | Official Plan Indicators 15
2011 2012 2013 2014 2015
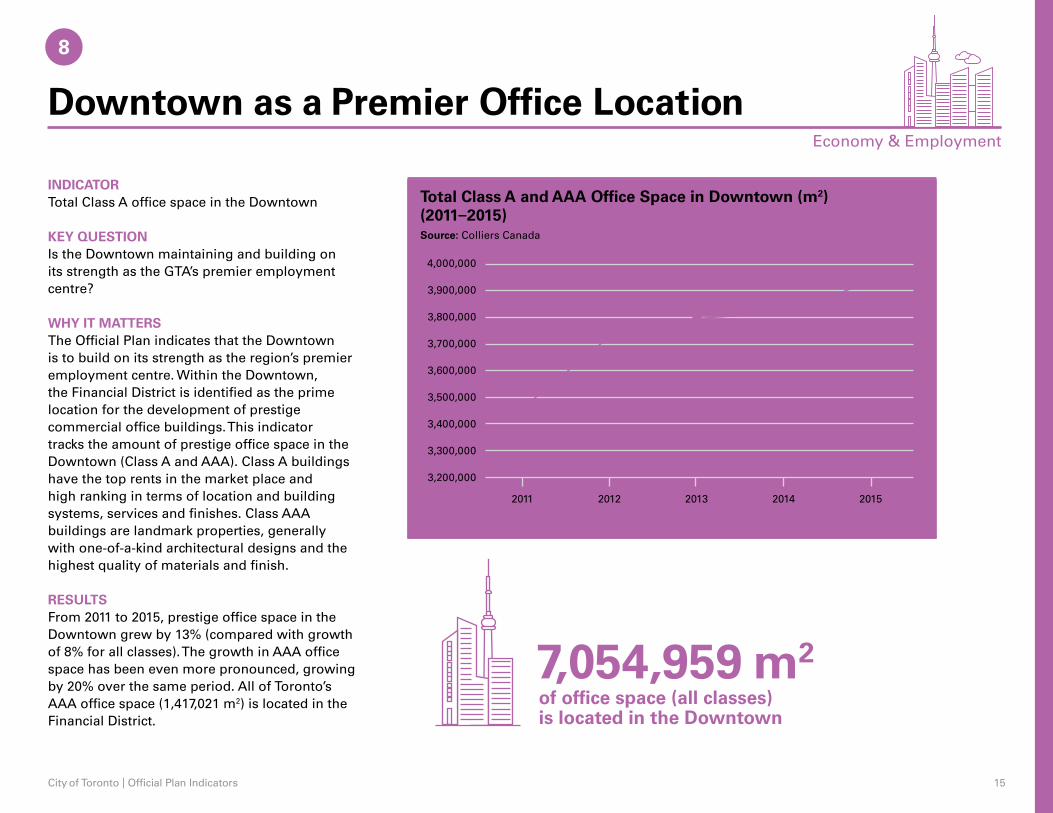
Downtown as a Premier Office Location
INDICATORTotal Class A office space in the Downtown
KEY QUESTIONIs the Downtown maintaining and building on its strength as the GTA’s premier employment centre?
WHY IT MATTERSThe Official Plan indicates that the Downtown is to build on its strength as the region’s premier employment centre. Within the Downtown, the Financial District is identified as the prime location for the development of prestige commercial office buildings. This indicator tracks the amount of prestige office space in the Downtown (Class A and AAA). Class A buildings have the top rents in the market place and high ranking in terms of location and building systems, services and finishes. Class AAA buildings are landmark properties, generally with one-of-a-kind architectural designs and the highest quality of materials and finish.
RESULTSFrom 2011 to 2015, prestige office space in the Downtown grew by 13% (compared with growth of 8% for all classes). The growth in AAA office space has been even more pronounced, growing by 20% over the same period. All of Toronto’s AAA office space (1,417,021 m2) is located in the Financial District.
Total Class A and AAA Office Space in Downtown (m2) (2011–2015)
7,054,959 m2
Source: Colliers Canada
of office space (all classes) is located in the Downtown
8
3,200,000
3,300,000
3,400,000
3,500,000
3,600,000
3,700,000
3,900,000
3,800,000
4,000,000
3,469,064
3,729,583
3,798,357 3,810,149
3,934,722
Economy & Employment
City of Toronto | Official Plan Indicators 16
15,000
106,000
0
5,000
10,000
20,000
25,000
30,000
35,000
40,000
45,000
Source: Land Use Information System
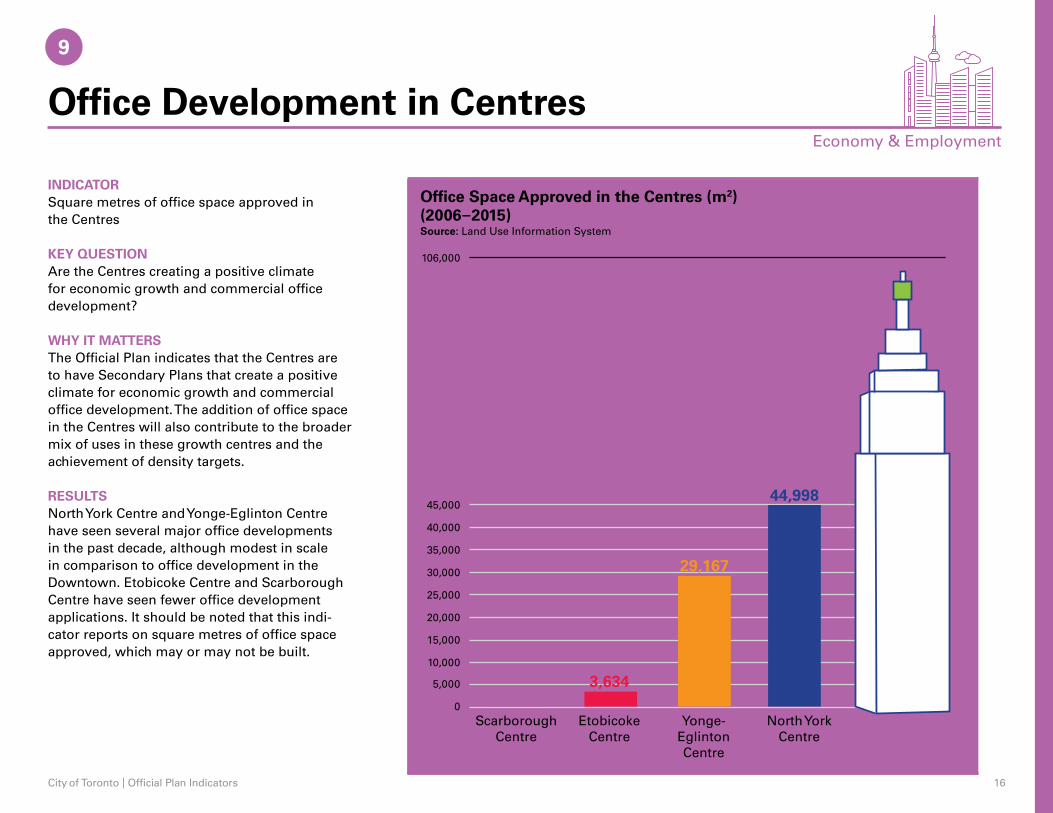
9
8503,634
29,167
44,998
Context: TD Canada Trust Tower is 106,000 m2 (53 storeys)
Scarborough Centre
Etobicoke Centre
Yonge-Eglinton Centre
North York Centre
Economy & Employment
Office Development in Centres
INDICATORSquare metres of office space approved in the Centres
KEY QUESTIONAre the Centres creating a positive climate for economic growth and commercial office development?
WHY IT MATTERSThe Official Plan indicates that the Centres are to have Secondary Plans that create a positive climate for economic growth and commercial office development. The addition of office space in the Centres will also contribute to the broader mix of uses in these growth centres and the achievement of density targets.
RESULTSNorth York Centre and Yonge-Eglinton Centre have seen several major office developments in the past decade, although modest in scale in comparison to office development in the Downtown. Etobicoke Centre and Scarborough Centre have seen fewer office development applications. It should be noted that this indi-cator reports on square metres of office space approved, which may or may not be built.
Office Space Approved in the Centres (m2)(2006–2015)
City of Toronto | Official Plan Indicators 17
10 Transportation by Mode
11 Cycling Infrastructure
Transportation
10 Transportation by Mode
11 Cycling Infrastructure
City of Toronto | Official Plan Indicators 18
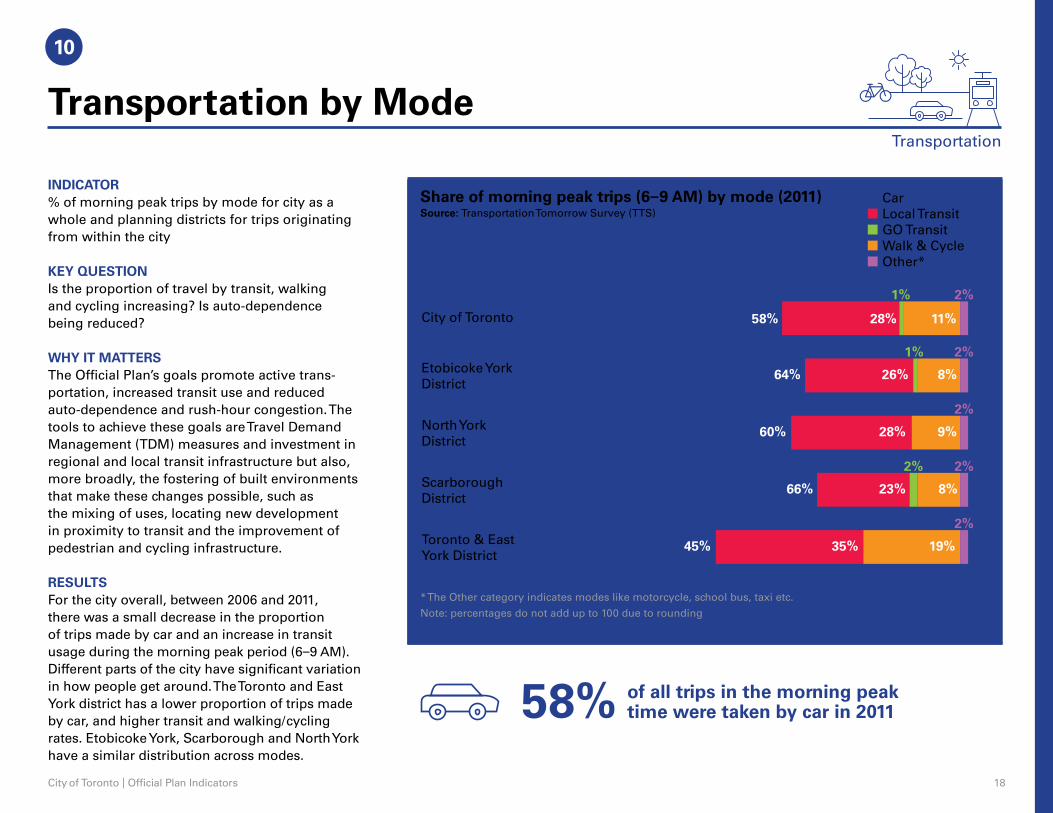
INDICATOR% of morning peak trips by mode for city as a whole and planning districts for trips originating from within the city
KEY QUESTIONIs the proportion of travel by transit, walking and cycling increasing? Is auto-dependence being reduced?
WHY IT MATTERSThe Official Plan’s goals promote active trans-portation, increased transit use and reduced auto-dependence and rush-hour congestion. The tools to achieve these goals are Travel Demand Management (TDM) measures and investment in regional and local transit infrastructure but also, more broadly, the fostering of built environments that make these changes possible, such as the mixing of uses, locating new development in proximity to transit and the improvement of pedestrian and cycling infrastructure.
RESULTSFor the city overall, between 2006 and 2011, there was a small decrease in the proportion of trips made by car and an increase in transit usage during the morning peak period (6–9 AM). Different parts of the city have significant varia tion in how people get around. The Toronto and East York district has a lower proportion of trips made by car, and higher transit and walking/cycling rates. Etobicoke York, Scarborough and North York have a similar distribution across modes.
Share of morning peak trips (6–9 AM) by mode (2011)
58% of all trips in the morning peak time were taken by car in 2011
10
Transportation
Source: Transportation Tomorrow Survey (TTS)CarLocal TransitGO TransitWalk & CycleOther*
* The Other category indicates modes like motorcycle, school bus, taxi etc.
Note: percentages do not add up to 100 due to rounding
City of Toronto
Etobicoke York District
North York District
Scarborough District
Toronto & East York District
58%
64%
60%
66%
45% 35% 19%
28%
23% 8%
26% 8%
9%
28% 11%
1%
1%
2%
2%
2%
2%
2%
2%
Transportation by Mode
City of Toronto | Official Plan Indicators 19
2006
0
50
100
150
200
250
300
350
400
2007 2008 2009 2010 2011 2012 2013 2014 2015
On-Street Separated Off-Street
Source: Cycling Infrastructure and Programs
11
Transportation
Cycling Infrastructure
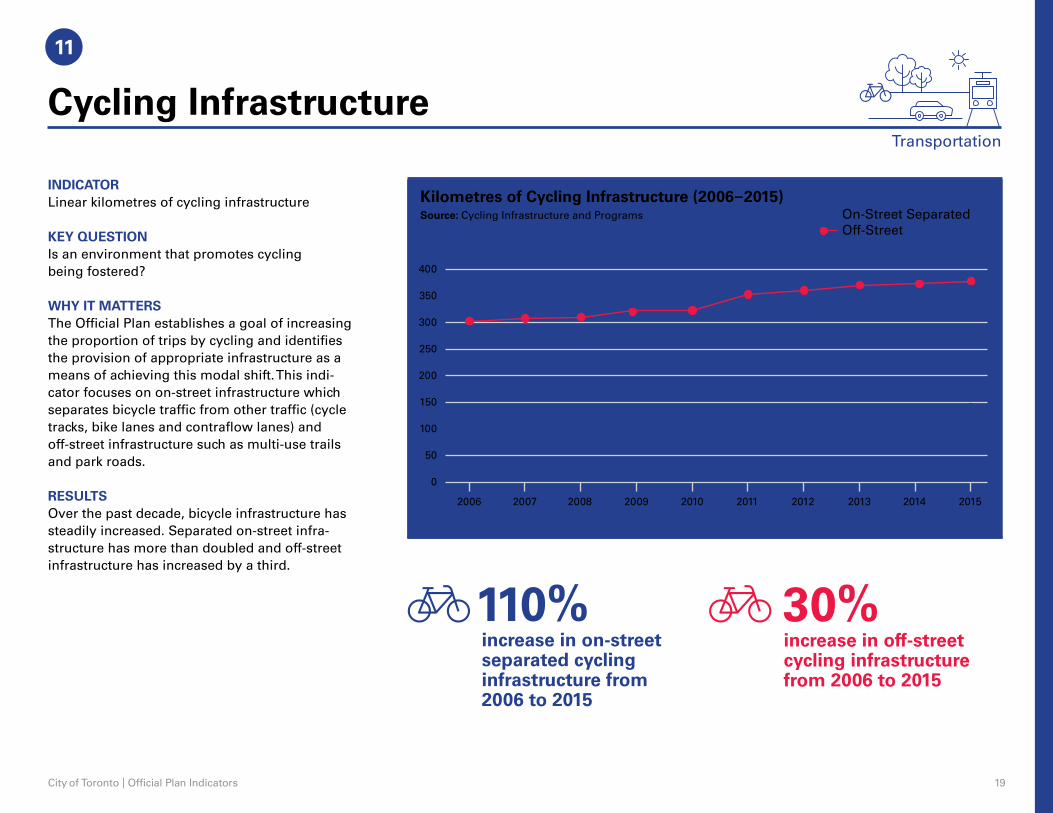
INDICATORLinear kilometres of cycling infrastructure
KEY QUESTIONIs an environment that promotes cycling being fostered?
WHY IT MATTERSThe Official Plan establishes a goal of increasing the proportion of trips by cycling and identifies the provision of appropriate infrastructure as a means of achieving this modal shift. This indi-cator focuses on on-street infrastructure which separates bicycle traffic from other traffic (cycle tracks, bike lanes and contraflow lanes) and off-street infrastructure such as multi-use trails and park roads.
RESULTSOver the past decade, bicycle infrastructure has steadily increased. Separated on-street infra-structure has more than doubled and off-street infrastructure has increased by a third.
Kilometres of Cycling Infrastructure (2006–2015)
110%increase in on-street separated cycling infrastructure from 2006 to 2015
30%increase in off-street cycling infrastructure from 2006 to 2015
City of Toronto | Official Plan Indicators 20
Housing
12 Housing Diversity – Size
13 Rental Replacement
City of Toronto | Official Plan Indicators 21
30%
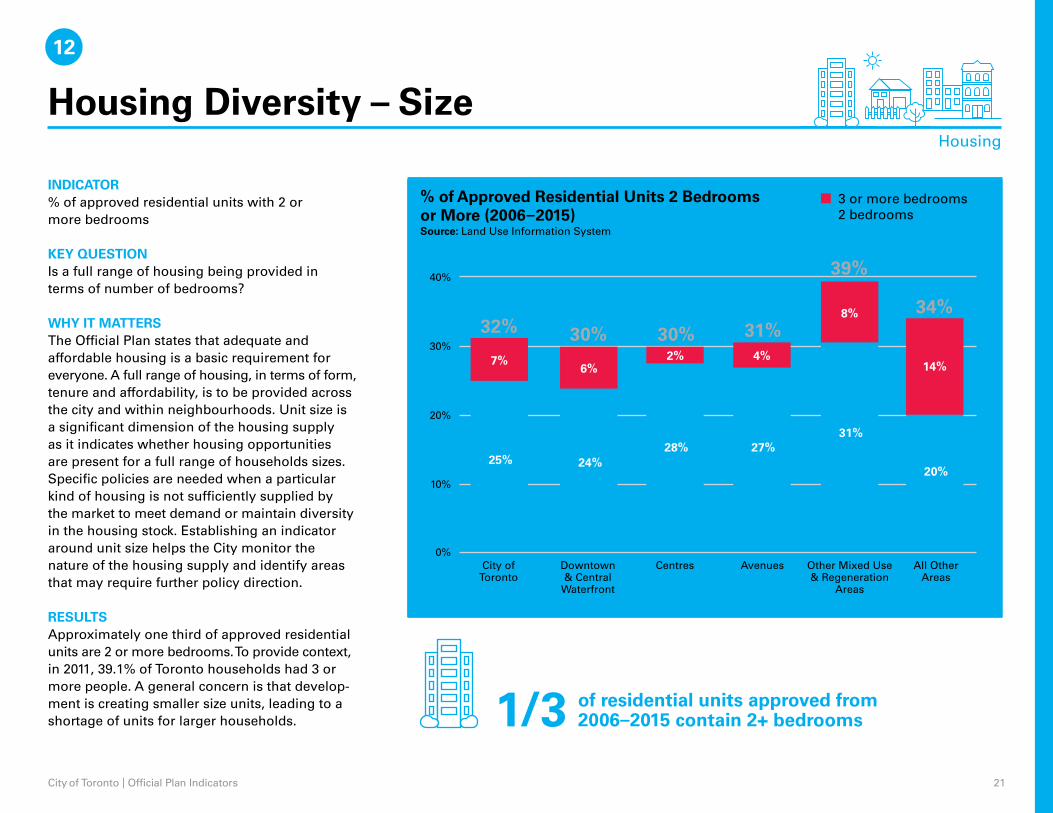
INDICATOR% of approved residential units with 2 or more bedrooms
KEY QUESTIONIs a full range of housing being provided in terms of number of bedrooms?
WHY IT MATTERSThe Official Plan states that adequate and affordable housing is a basic requirement for everyone. A full range of housing, in terms of form, tenure and affordability, is to be provided across the city and within neighbourhoods. Unit size is a significant dimension of the housing supply as it indicates whether housing opportunities are present for a full range of households sizes. Specific policies are needed when a particular kind of housing is not sufficiently supplied by the market to meet demand or maintain diversity in the housing stock. Establishing an indicator around unit size helps the City monitor the nature of the housing supply and identify areas that may require further policy direction.
RESULTSApproximately one third of approved residential units are 2 or more bedrooms. To provide context, in 2011, 39.1% of Toronto households had 3 or more people. A general concern is that develop-ment is creating smaller size units, leading to a shortage of units for larger households.
% of Approved Residential Units 2 Bedrooms or More (2006–2015)
1/3 of residential units approved from 2006–2015 contain 2+ bedrooms
0%
10%
20%
40%
Source: Land Use Information System
12
Housing
3 or more bedrooms 2 bedrooms
City of Toronto
32%
7%
25%
Downtown & Central
Waterfront
30%
6%
24%
Centres
30%2%
28%
Avenues
31%4%
27%
Other Mixed Use & Regeneration
Areas
39%
8%
31%
All Other Areas
34%
14%
20%
Housing Diversity – Size
City of Toronto | Official Plan Indicators 22
13
Housing
300
0
100
200
400
500
600
Source: City Planning Housing Policy Unit, Annual Rental Application Database DemolishedReplaced
Affordable
498 493
Mid-Range
65 65
Mid-RangeAffordable
52 48
108 105
Affordable Mid-Range
59 61 63 63
2013 2014 2015
*Data is based on Council Approval
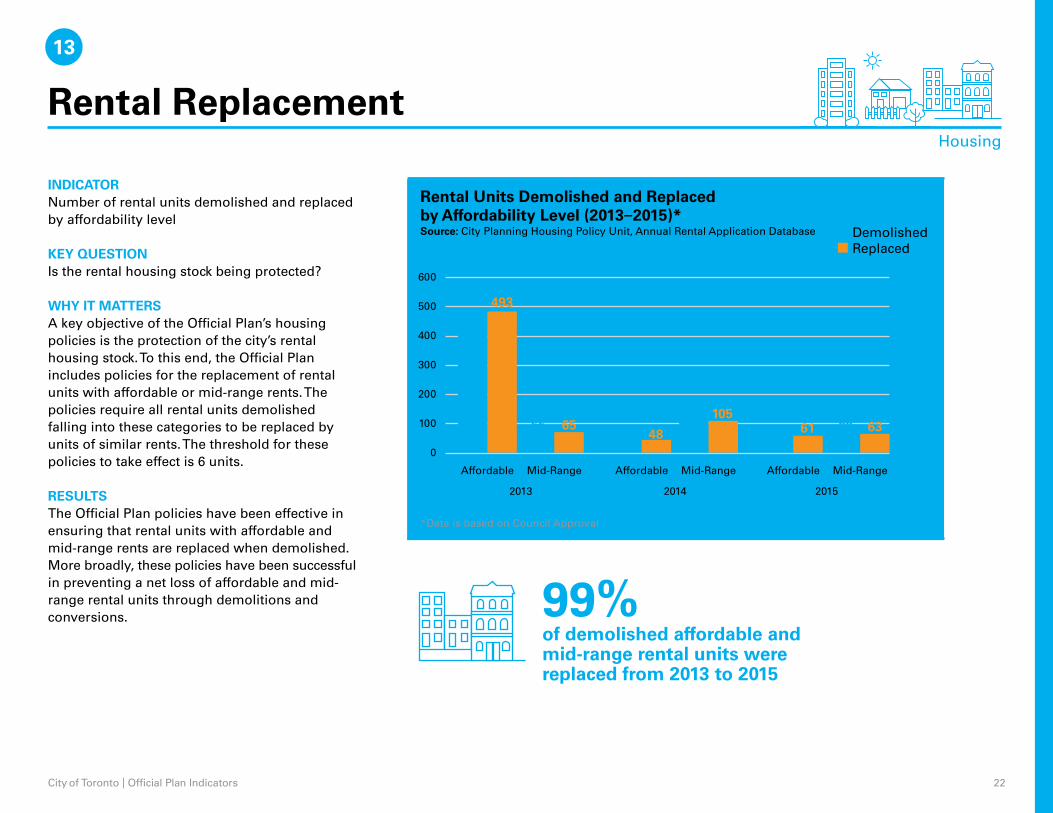
Rental Replacement
INDICATORNumber of rental units demolished and replaced by affordability level
KEY QUESTIONIs the rental housing stock being protected?
WHY IT MATTERSA key objective of the Official Plan’s housing policies is the protection of the city’s rental housing stock. To this end, the Official Plan includes policies for the replacement of rental units with affordable or mid-range rents. The policies require all rental units demolished falling into these categories to be replaced by units of similar rents. The threshold for these policies to take effect is 6 units.
RESULTSThe Official Plan policies have been effective in ensuring that rental units with affordable and mid-range rents are replaced when demolished. More broadly, these policies have been successful in preventing a net loss of affordable and mid-range rental units through demolitions and conversions.
Rental Units Demolished and Replaced by Affordability Level (2013–2015)*
99%of demolished affordable and mid-range rental units were replaced from 2013 to 2015
City of Toronto | Official Plan Indicators 23
Quality of the Built Environment
16 Street Trees
15 Privately Owned Publicly-Accessible Spaces (POPS) 14 New Park Space
18 Heritage Protection
17 Public Art
City of Toronto | Official Plan Indicators 24
Source: Parks, Forestry and Recreation
14
New Park Space
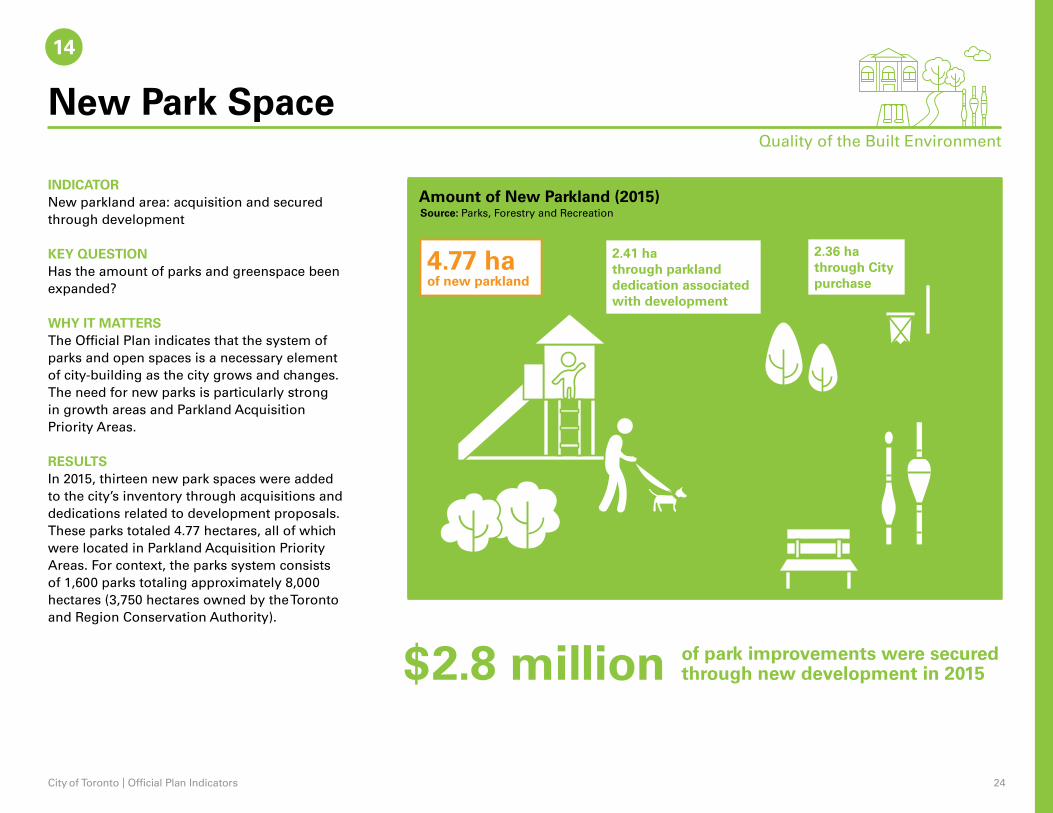
INDICATORNew parkland area: acquisition and secured through development
KEY QUESTIONHas the amount of parks and greenspace been expanded?
WHY IT MATTERSThe Official Plan indicates that the system of parks and open spaces is a necessary element of city-building as the city grows and changes. The need for new parks is particularly strong in growth areas and Parkland Acquisition Priority Areas.
RESULTSIn 2015, thirteen new park spaces were added to the city’s inventory through acquisitions and dedications related to development proposals. These parks totaled 4.77 hectares, all of which were located in Parkland Acquisition Priority Areas. For context, the parks system consists of 1,600 parks totaling approximately 8,000 hectares (3,750 hectares owned by the Toronto and Region Conservation Authority).
Quality of the Built Environment
Amount of New Parkland (2015)
4.77 ha of new parkland
2.36 ha through City purchase
2.41 ha through parkland dedication associated with development
$2.8 million of park improvements were secured through new development in 2015
City of Toronto | Official Plan Indicators 25
15
Quality of the Built Environment
Source: City Planning Urban Design
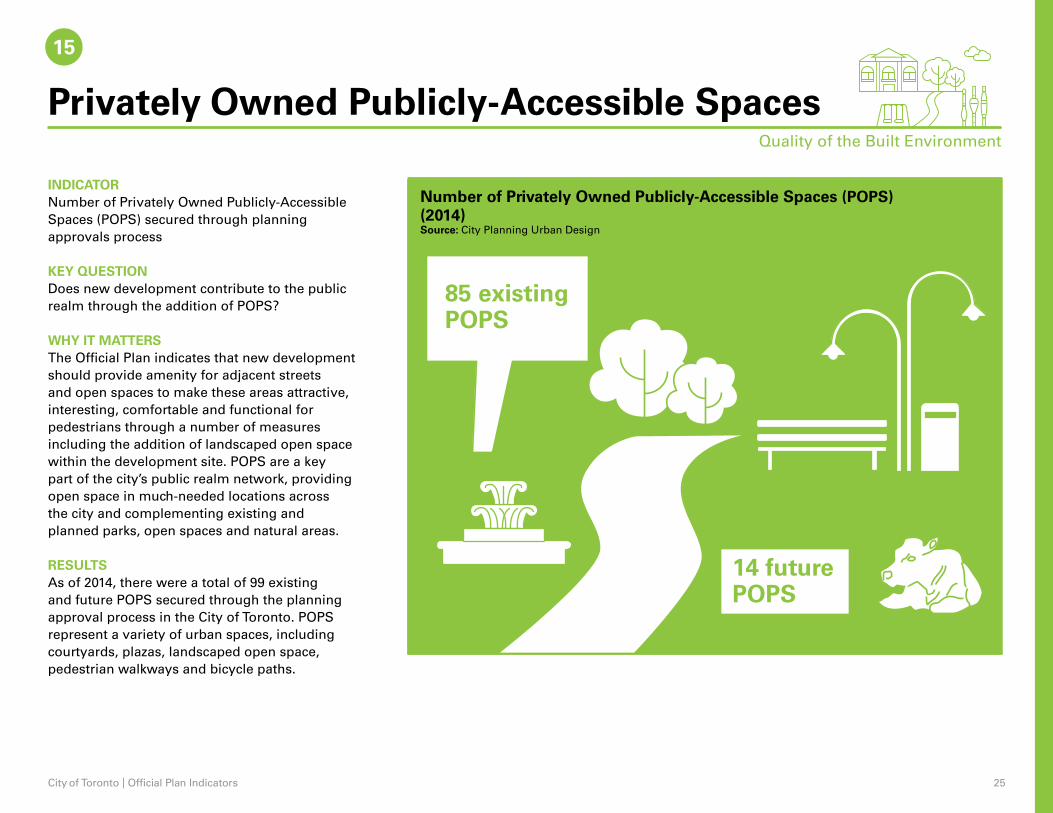
14 future POPS
85 existing POPS
Privately Owned Publicly-Accessible Spaces
INDICATORNumber of Privately Owned Publicly-Accessible Spaces (POPS) secured through planning approvals process
KEY QUESTIONDoes new development contribute to the public realm through the addition of POPS?
WHY IT MATTERSThe Official Plan indicates that new development should provide amenity for adjacent streets and open spaces to make these areas attractive, interesting, comfortable and functional for pedestrians through a number of measures including the addition of landscaped open space within the development site. POPS are a key part of the city’s public realm network, providing open space in much-needed locations across the city and complementing existing and planned parks, open spaces and natural areas.
RESULTSAs of 2014, there were a total of 99 existing and future POPS secured through the planning approval process in the City of Toronto. POPS represent a variety of urban spaces, including courtyards, plazas, landscaped open space, pedestrian walkways and bicycle paths.
Number of Privately Owned Publicly-Accessible Spaces (POPS)(2014)
City of Toronto | Official Plan Indicators 26
Source: Urban Forestry Work Management System
16
Quality of the Built Environment
0
2012 2013 2014 2015
17,16018,588
22,135
27,03530,000
25,000
20,000
15,000
10,000
5,000
Street Trees
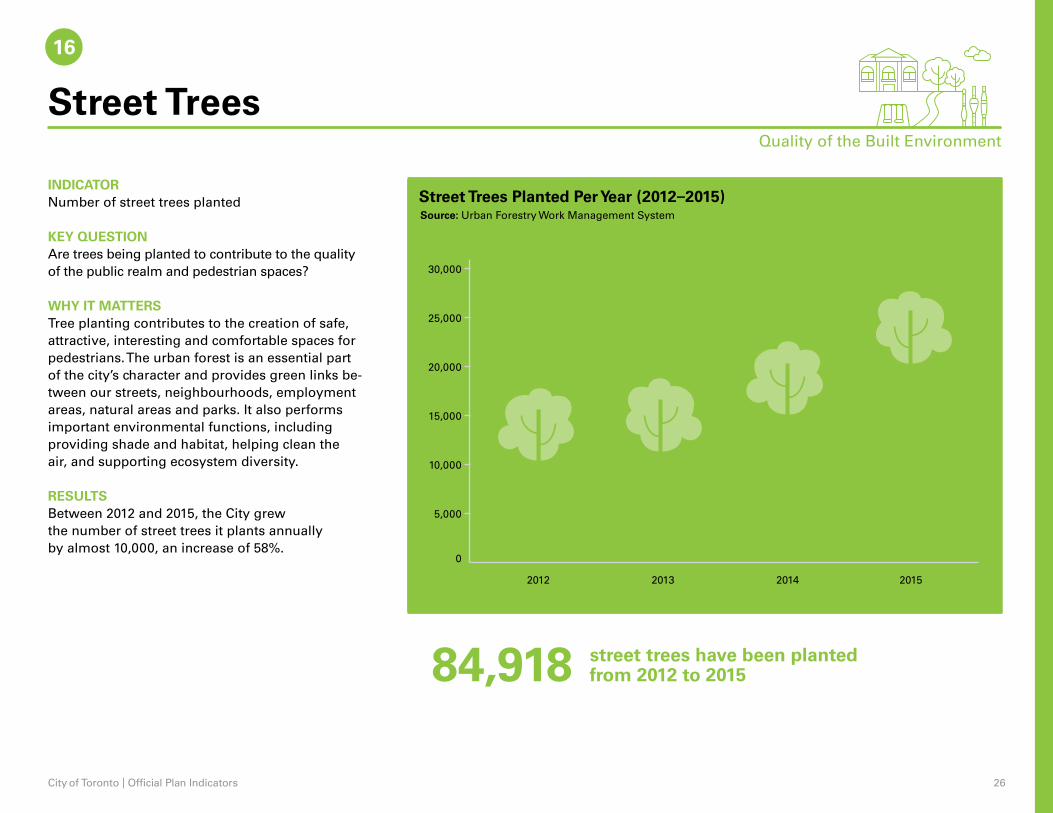
INDICATORNumber of street trees planted
KEY QUESTIONAre trees being planted to contribute to the quality of the public realm and pedestrian spaces?
WHY IT MATTERSTree planting contributes to the creation of safe, attractive, interesting and comfortable spaces for pedestrians. The urban forest is an essential part of the city’s character and provides green links be-tween our streets, neighbourhoods, employment areas, natural areas and parks. It also performs important environmental functions, including providing shade and habitat, helping clean the air, and supporting ecosystem diversity.
RESULTSBetween 2012 and 2015, the City grew the number of street trees it plants annually by almost 10,000, an increase of 58%.
Street Trees Planted Per Year (2012–2015)
84,918 street trees have been planted from 2012 to 2015
City of Toronto | Official Plan Indicators 27
Source: Section 37/45 database
17
Public Art
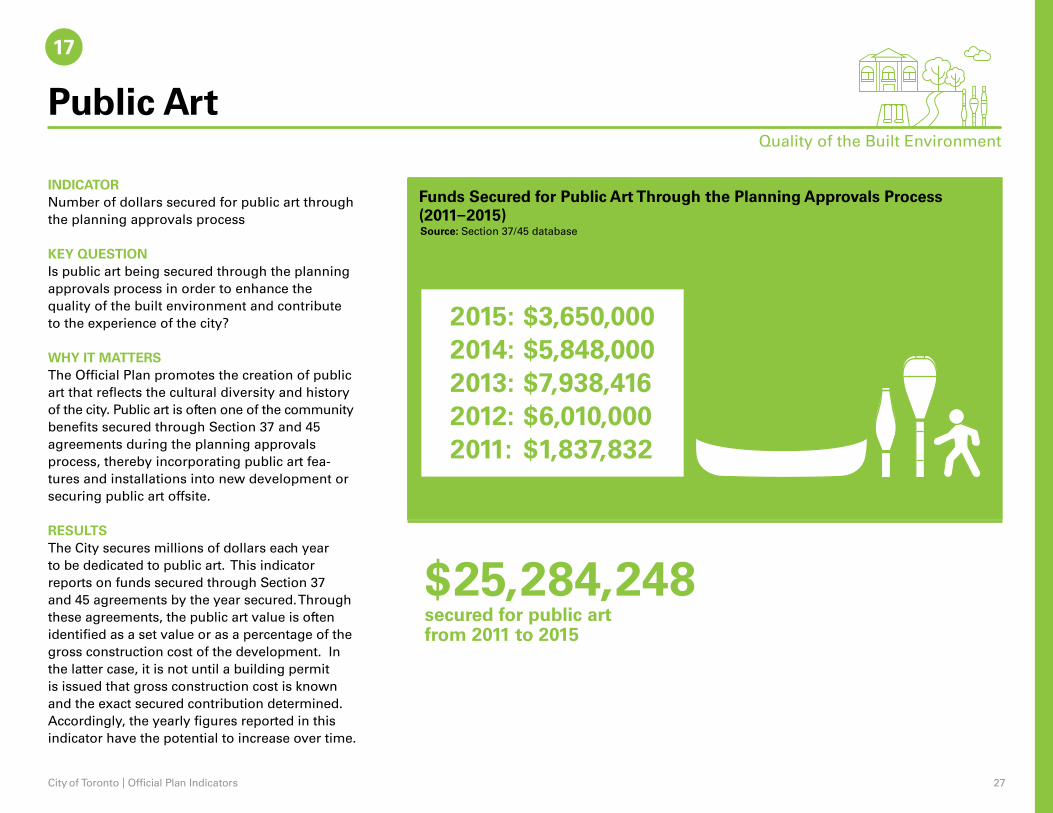
INDICATORNumber of dollars secured for public art through the planning approvals process
KEY QUESTIONIs public art being secured through the planning approvals process in order to enhance the quality of the built environment and contribute to the experience of the city?
WHY IT MATTERSThe Official Plan promotes the creation of public art that reflects the cultural diversity and history of the city. Public art is often one of the community benefits secured through Section 37 and 45 agreements during the planning approvals process, thereby incorporating public art fea-tures and installations into new development or securing public art offsite.
RESULTSThe City secures millions of dollars each year to be dedicated to public art. This indicator reports on funds secured through Section 37 and 45 agreements by the year secured. Through these agreements, the public art value is often identified as a set value or as a percentage of the gross construction cost of the development. In the latter case, it is not until a building permit is issued that gross construction cost is known and the exact secured contribution determined. Accordingly, the yearly figures reported in this indicator have the potential to increase over time.
Funds Secured for Public Art Through the Planning Approvals Process (2011–2015)
2015: $3,650,0002014: $5,848,0002013: $7,938,4162012: $6,010,0002011: $1,837,832
$25,284,248secured for public art from 2011 to 2015
Quality of the Built Environment
City of Toronto | Official Plan Indicators 28
18
Quality of the Built Environment
Source: Heritage Protection Services
Heritage Protection
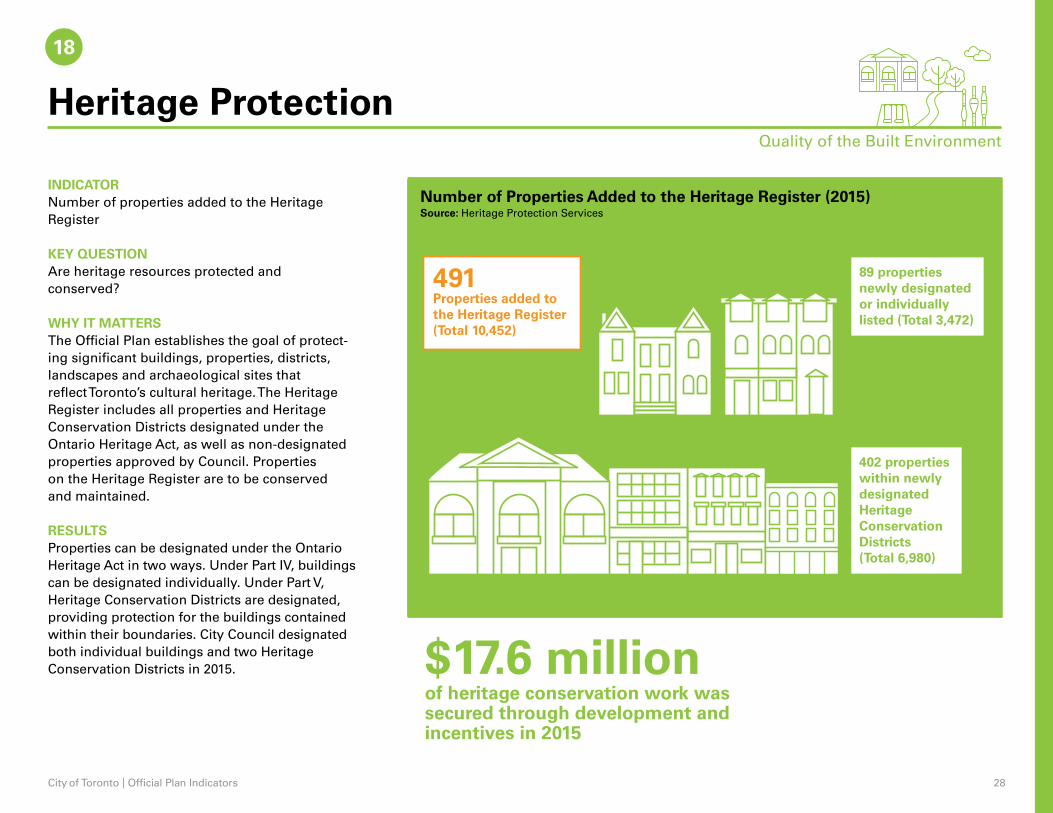
INDICATORNumber of properties added to the Heritage Register
KEY QUESTIONAre heritage resources protected and conserved?
WHY IT MATTERSThe Official Plan establishes the goal of protect-ing significant buildings, properties, districts, landscapes and archaeological sites that reflect Toronto’s cultural heritage. The Heritage Register includes all properties and Heritage Conservation Districts designated under the Ontario Heritage Act, as well as non-designated properties approved by Council. Properties on the Heritage Register are to be conserved and maintained.
RESULTSProperties can be designated under the Ontario Heritage Act in two ways. Under Part IV, buildings can be designated individually. Under Part V, Heritage Conservation Districts are designated, providing protection for the buildings contained within their boundaries. City Council designated both individual buildings and two Heritage Conservation Districts in 2015.
Number of Properties Added to the Heritage Register (2015)
491 Properties added to the Heritage Register (Total 10,452)
89 properties newly designated or individually listed (Total 3,472)
402 properties within newly designated Heritage Conservation Districts (Total 6,980)
$17.6 millionof heritage conservation work was secured through development and incentives in 2015
City of Toronto | Official Plan Indicators 29
Climate Change
19 Greenhouse Gas Emissions
City of Toronto | Official Plan Indicators 30
19
Climate Change
Source: Environment and Energy Division – Greenhouse Gas and Air Quality Pollutant Emissions Inventory (2013)
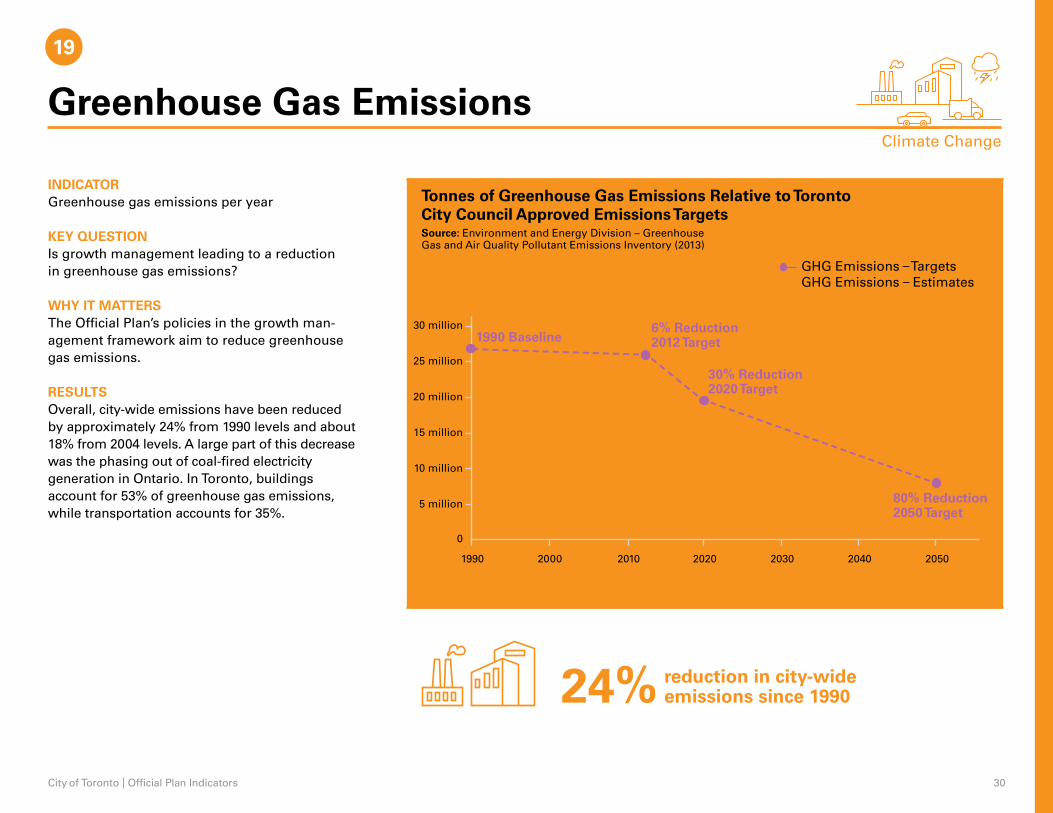
Greenhouse Gas Emissions
GHG Emissions – Targets GHG Emissions – Estimates
0
5 million
10 million
15 million
20 million
25 million
30 million
1990 2000 2010 2020 2030 2040 2050
1990 Baseline6% Reduction2012 Target
30% Reduction2020 Target
80% Reduction2050 Target
INDICATORGreenhouse gas emissions per year
KEY QUESTIONIs growth management leading to a reduction in greenhouse gas emissions?
WHY IT MATTERSThe Official Plan’s policies in the growth man-agement framework aim to reduce greenhouse gas emissions.
RESULTSOverall, city-wide emissions have been reduced by approximately 24% from 1990 levels and about 18% from 2004 levels. A large part of this decrease was the phasing out of coal-fired electricity generation in Ontario. In Toronto, buildings account for 53% of greenhouse gas emissions, while transportation accounts for 35%.
Tonnes of Greenhouse Gas Emissions Relative to Toronto City Council Approved Emissions Targets
24% reduction in city-wide emissions since 1990

City of Toronto | Official Plan Indicators 31