Embed Size (px)
Citation preview
CITY OF VICTORIA
2015 Housing Report
FOR MORE INFORMATION:City of Victoria Sustainable Planning and Community Development Department
T 250.361.0382E [email protected]
1 CENTENNIAL SQUARE, VICTORIA, BC V8W 1P6 | www.victoria.ca
Table of Contents
Housing Report 2015
Introduction ....................................................................................................................3
Key Observations ...........................................................................................................3
Dwelling Units Approved through Building Permits Issued ...........................................4
Secondary/Garden Suites Approved through Building Permits Issued .........................5
Purpose-Built Rental Units Approved through Building Permits Issued ........................6
Victoria Housing Fund ....................................................................................................7
Rental Market .................................................................................................................9
Average House Prices ..................................................................................................10
city of victoria | Housing Report 2015 3
The 2015 Annual Housing Report is a compilation of housing data for the City of Victoria. The data comes from monthly building permit reports supplemented by data from the Victoria Real Estate Board and Canada Mortgage and Housing Corporation (CMHC). Where possible, the data is broken down by neighbourhood and/or accompanied by previous years data for comparison.
Introduction
Key ObservationsResidential Building Permits
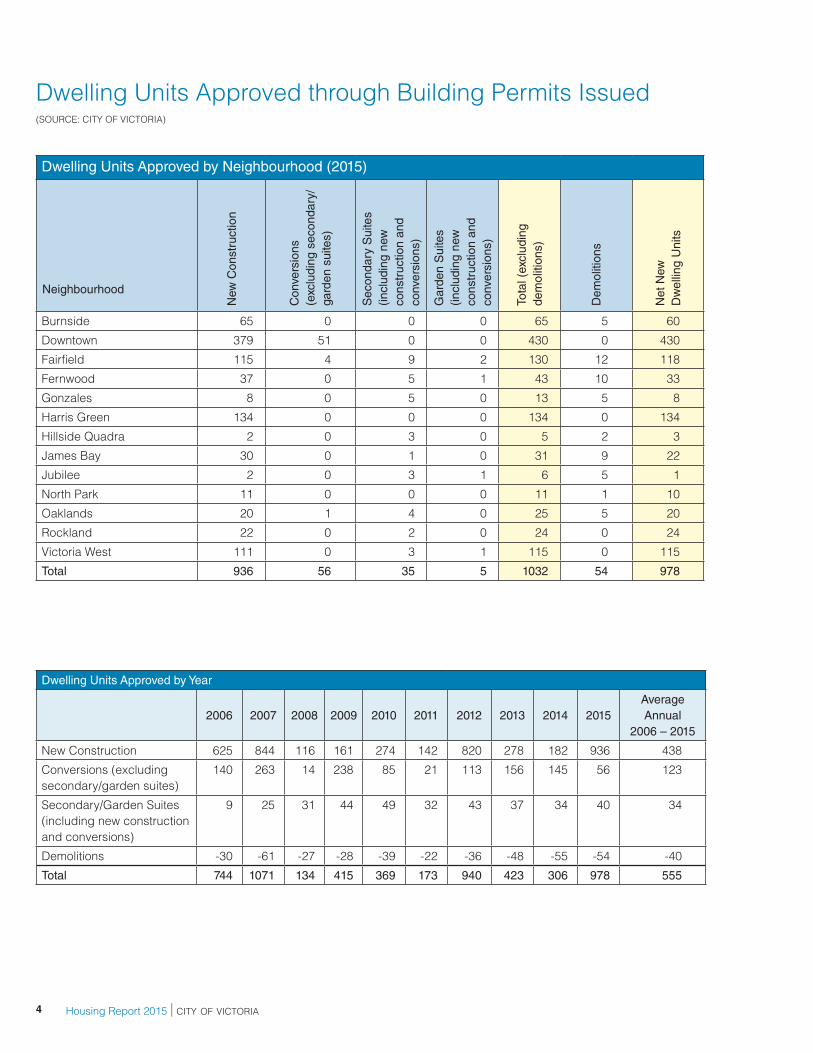
In 2015, building permits for 978 net new dwelling units were issued in the City of Victoria. This is more than three times the number that were issued in 2014. This increase is largely due to several building permits issued for large multi-unit residential buildings in the Downtown Core, Harris Green, Fairfield, and Victoria West neighbourhoods.
Since 2006, building permits issued for net new dwelling units per year have ranged from 134 units in 2008 to 1,071 units in 2007, with an average of 555 units per year. The net gain in 2015 of 978 units far exceeds this average.
Building permit records indicate that 54 units were lost due to demolition or alteration. These were mainly permits for demolition of detached dwellings.
Housing Grants
As of December 31, 2015 45 grants for secondary suites had been paid out, 3 applications are pending, 2 outstanding applications are in progress, and 1 application is in a wait list.
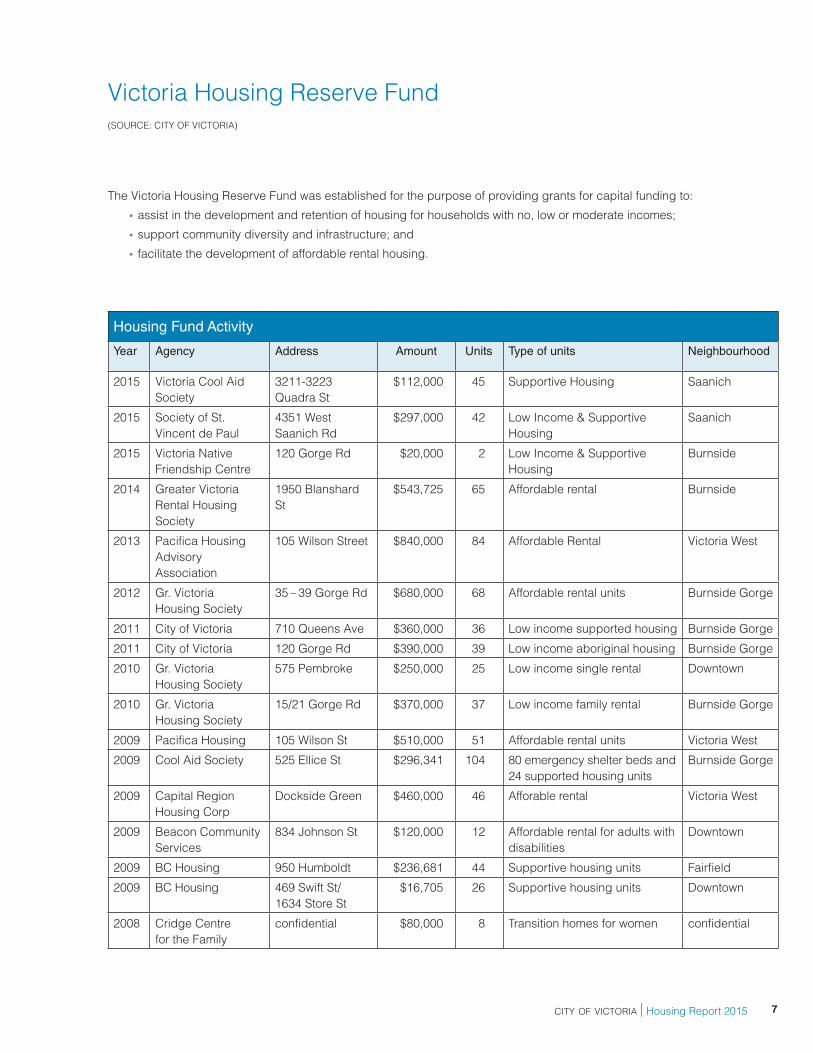
There were three approved applications to the Housing Reserve Fund, for a total of $429,000, to support the development of 87 low income and supportive housing units in Saanich and 2 low income and supportive housing units in Victoria.
Rental Market
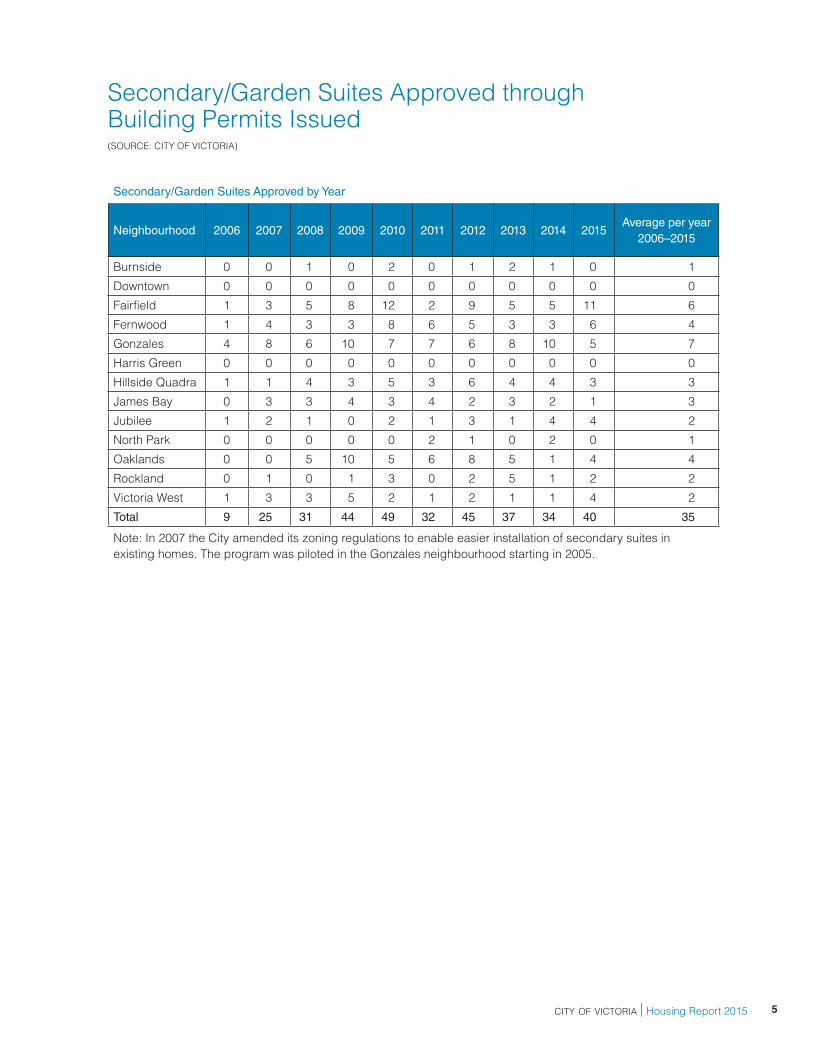
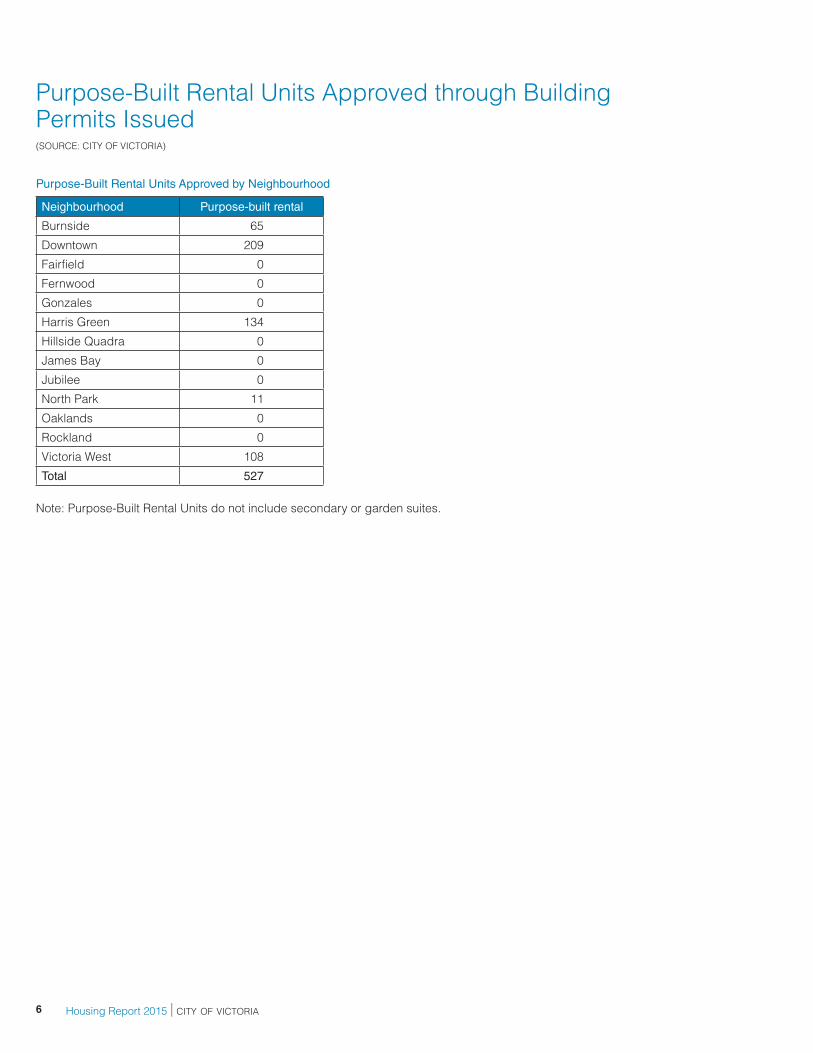
Building permits were issued for 527 purpose-built rental units. This included several large rental buildings in the Downtown, Harris Green, Victoria West, and Burnside neighbourhoods. Building permits for 35 secondary suites and 5 garden suites were also issued in 2015, which is six more than in 2014, and five more than the annual average.
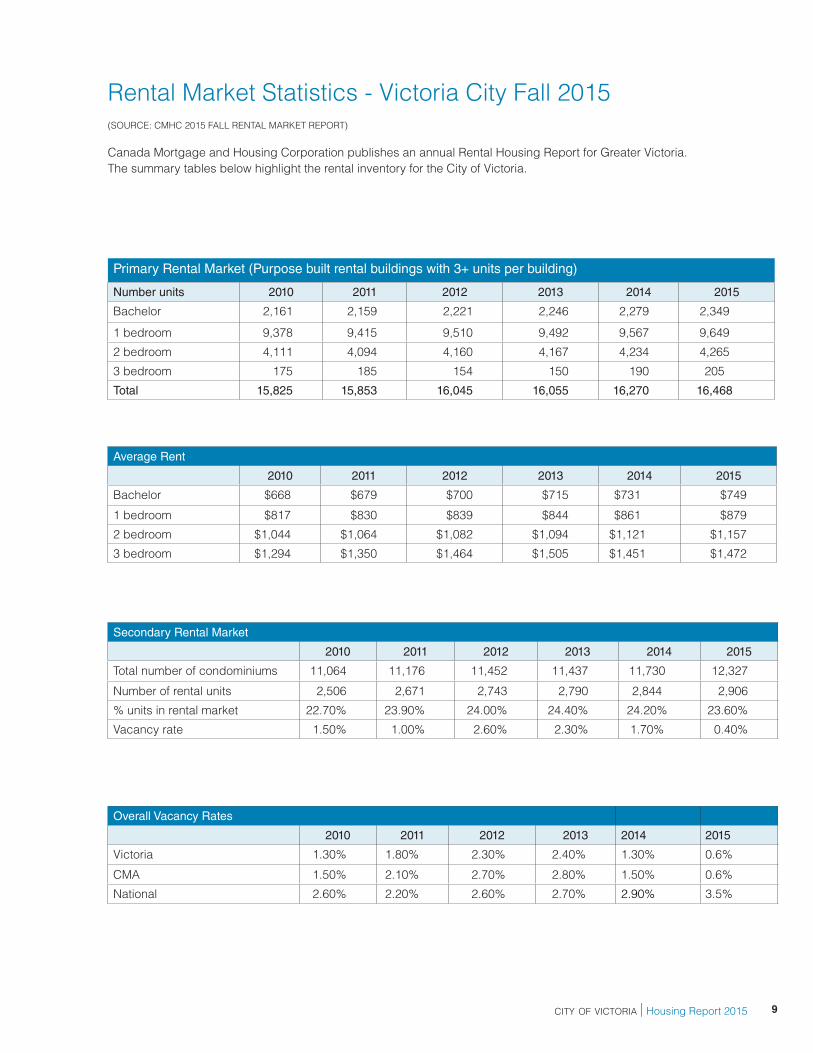
According to CMHC, there were 198 more purpose-built rental units in 2015 than 2014, a 1.2% increase, bringing the total inventory to 16,468. Compared to 2014, year-to-year average rents increased by 2.5% for a bachelor unit, 2.1% for a one-bedroom unit, 3.2% for a two-bedroom unit, and 1.4% for a three-bedroom unit. Overall, average rent was 2.2% higher for all rental units in 2015 compared to 2014.
Vacancy rates in the City of Victoria dropped significantly from 1.3% in 2014 to 0.6% in 2015. Greater Victoria vacancy rates also dropped to 0.6% in 2015, down from 1.5% in 2014. During the same period, the national rental vacancy rates increased from 2.9% to 3.5%
The secondary rental market - defined by CMHC as strata condominiums - experienced a 2.2% increase in inventory to 2,906 units in 2015 from 2,844 units in 2014, an increase of 62 units. The vacancy rate for the secondary market fell to 0.4% in 2015, down from 1.7% in 2014. Of the 12,327 condominiums in Victoria, 23.6% of them are in the rental market.
Ownership Market
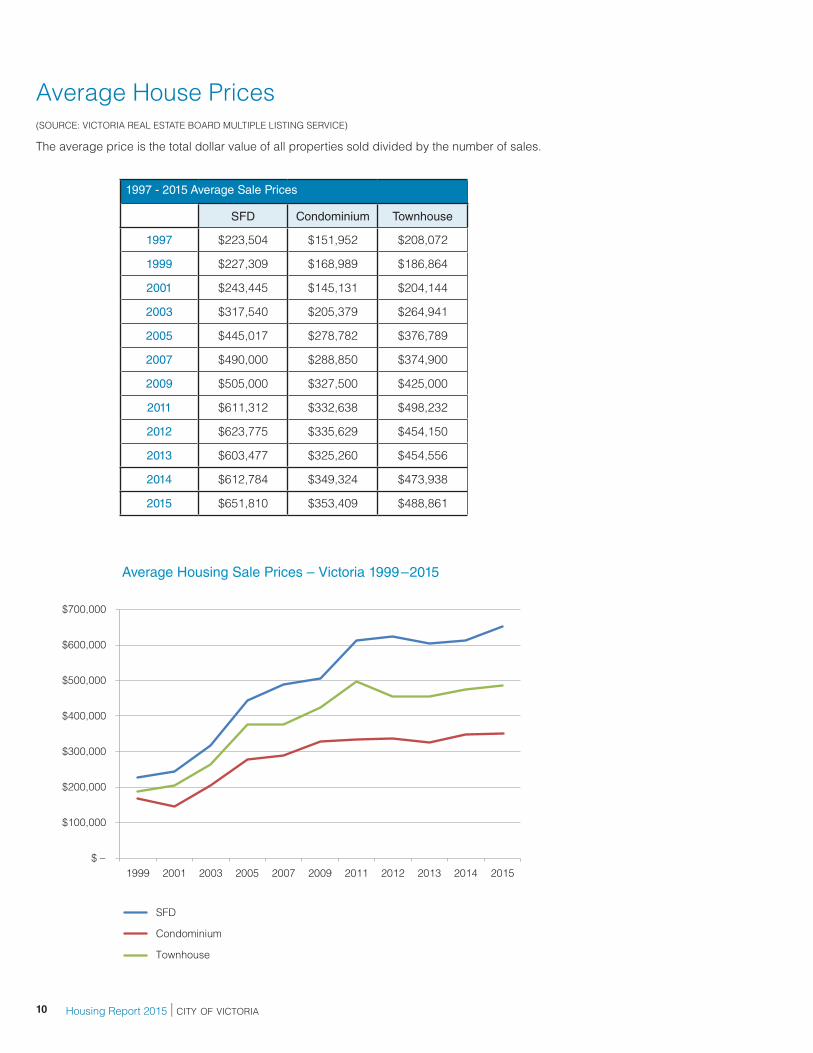
Average sale prices of all housing types increased over the past year. Single family dwellings increased by 6.4%, condominiums increased by 1.2%, and townhouses increased by 3.1%.
Housing Report 2015 | city of victoria4
Dwelling Units Approved by Neighbourhood (2015)
Neighbourhood
New
Con
stru
ctio
n
Con
vers
ions
(e
xclu
ding
sec
onda
ry/
gard
en s
uite
s)
Sec
onda
ry S
uite
s (in
clud
ing
new
co
nstr
uctio
n an
d co
nver
sion
s)
Gar
den
Sui
tes
(incl
udin
g ne
w
cons
truc
tion
and
conv
ersi
ons)
Tota
l (ex
clud
ing
dem
oliti
ons)
Dem
oliti
ons
Net
New
Dw
ellin
g U
nits
Burnside 65 0 0 0 65 5 60
Downtown 379 51 0 0 430 0 430
Fairfield 115 4 9 2 130 12 118
Fernwood 37 0 5 1 43 10 33
Gonzales 8 0 5 0 13 5 8
Harris Green 134 0 0 0 134 0 134
Hillside Quadra 2 0 3 0 5 2 3
James Bay 30 0 1 0 31 9 22
Jubilee 2 0 3 1 6 5 1
North Park 11 0 0 0 11 1 10
Oaklands 20 1 4 0 25 5 20
Rockland 22 0 2 0 24 0 24
Victoria West 111 0 3 1 115 0 115
Total 936 56 35 5 1032 54 978
Dwelling Units Approved through Building Permits Issued(SOURCE: CITY OF VICTORIA)
Dwelling Units Approved by Year
2006 2007 2008 2009 2010 2011 2012 2013 2014 2015Average Annual
2006 – 2015
New Construction 625 844 116 161 274 142 820 278 182 936 438
Conversions (excluding secondary/garden suites)
140 263 14 238 85 21 113 156 145 56 123
Secondary/Garden Suites (including new construction and conversions)
9 25 31 44 49 32 43 37 34 40 34
Demolitions -30 -61 -27 -28 -39 -22 -36 -48 -55 -54 -40
Total 744 1071 134 415 369 173 940 423 306 978 555
city of victoria | Housing Report 2015 5
Secondary/Garden Suites Approved by Year
Neighbourhood 2006 2007 2008 2009 2010 2011 2012 2013 2014 2015Average per year
2006–2015
Burnside 0 0 1 0 2 0 1 2 1 0 1
Downtown 0 0 0 0 0 0 0 0 0 0 0
Fairfield 1 3 5 8 12 2 9 5 5 11 6
Fernwood 1 4 3 3 8 6 5 3 3 6 4
Gonzales 4 8 6 10 7 7 6 8 10 5 7
Harris Green 0 0 0 0 0 0 0 0 0 0 0
Hillside Quadra 1 1 4 3 5 3 6 4 4 3 3
James Bay 0 3 3 4 3 4 2 3 2 1 3
Jubilee 1 2 1 0 2 1 3 1 4 4 2
North Park 0 0 0 0 0 2 1 0 2 0 1
Oaklands 0 0 5 10 5 6 8 5 1 4 4
Rockland 0 1 0 1 3 0 2 5 1 2 2
Victoria West 1 3 3 5 2 1 2 1 1 4 2
Total 9 25 31 44 49 32 45 37 34 40 35
Note: In 2007 the City amended its zoning regulations to enable easier installation of secondary suites in existing homes. The program was piloted in the Gonzales neighbourhood starting in 2005.
Secondary/Garden Suites Approved through Building Permits Issued(SOURCE: CITY OF VICTORIA)
Housing Report 2015 | city of victoria6
Purpose-Built Rental Units Approved through Building Permits Issued(SOURCE: CITY OF VICTORIA)
Purpose-Built Rental Units Approved by Neighbourhood
Neighbourhood Purpose-built rental
Burnside 65
Downtown 209
Fairfield 0
Fernwood 0
Gonzales 0
Harris Green 134
Hillside Quadra 0
James Bay 0
Jubilee 0
North Park 11
Oaklands 0
Rockland 0
Victoria West 108
Total 527
Note: Purpose-Built Rental Units do not include secondary or garden suites.
city of victoria | Housing Report 2015 7
Victoria Housing Reserve Fund(SOURCE: CITY OF VICTORIA)
The Victoria Housing Reserve Fund was established for the purpose of providing grants for capital funding to:
• assist in the development and retention of housing for households with no, low or moderate incomes;
• support community diversity and infrastructure; and
• facilitate the development of affordable rental housing.
Housing Fund Activity
Year Agency Address Amount Units Type of units Neighbourhood
2015 Victoria Cool Aid Society
3211-3223 Quadra St
$112,000 45 Supportive Housing Saanich
2015 Society of St. Vincent de Paul
4351 West Saanich Rd
$297,000 42 Low Income & Supportive Housing
Saanich
2015 Victoria Native Friendship Centre
120 Gorge Rd $20,000 2 Low Income & Supportive Housing
Burnside
2014 Greater Victoria Rental Housing Society
1950 Blanshard St
$543,725 65 Affordable rental Burnside
2013 Pacifica Housing Advisory Association
105 Wilson Street $840,000 84 Affordable Rental Victoria West
2012 Gr. Victoria Housing Society
35 – 39 Gorge Rd $680,000 68 Affordable rental units Burnside Gorge
2011 City of Victoria 710 Queens Ave $360,000 36 Low income supported housing Burnside Gorge
2011 City of Victoria 120 Gorge Rd $390,000 39 Low income aboriginal housing Burnside Gorge
2010 Gr. Victoria Housing Society
575 Pembroke $250,000 25 Low income single rental Downtown
2010 Gr. Victoria Housing Society
15/21 Gorge Rd $370,000 37 Low income family rental Burnside Gorge
2009 Pacifica Housing 105 Wilson St $510,000 51 Affordable rental units Victoria West
2009 Cool Aid Society 525 Ellice St $296,341 104 80 emergency shelter beds and 24 supported housing units
Burnside Gorge
2009 Capital Region Housing Corp
Dockside Green $460,000 46 Afforable rental Victoria West
2009 Beacon Community Services
834 Johnson St $120,000 12 Affordable rental for adults with disabilities
Downtown
2009 BC Housing 950 Humboldt $236,681 44 Supportive housing units Fairfield
2009 BC Housing 469 Swift St/ 1634 Store St
$16,705 26 Supportive housing units Downtown
2008 Cridge Centre for the Family
confidential $80,000 8 Transition homes for women confidential
Housing Report 2015 | city of victoria8
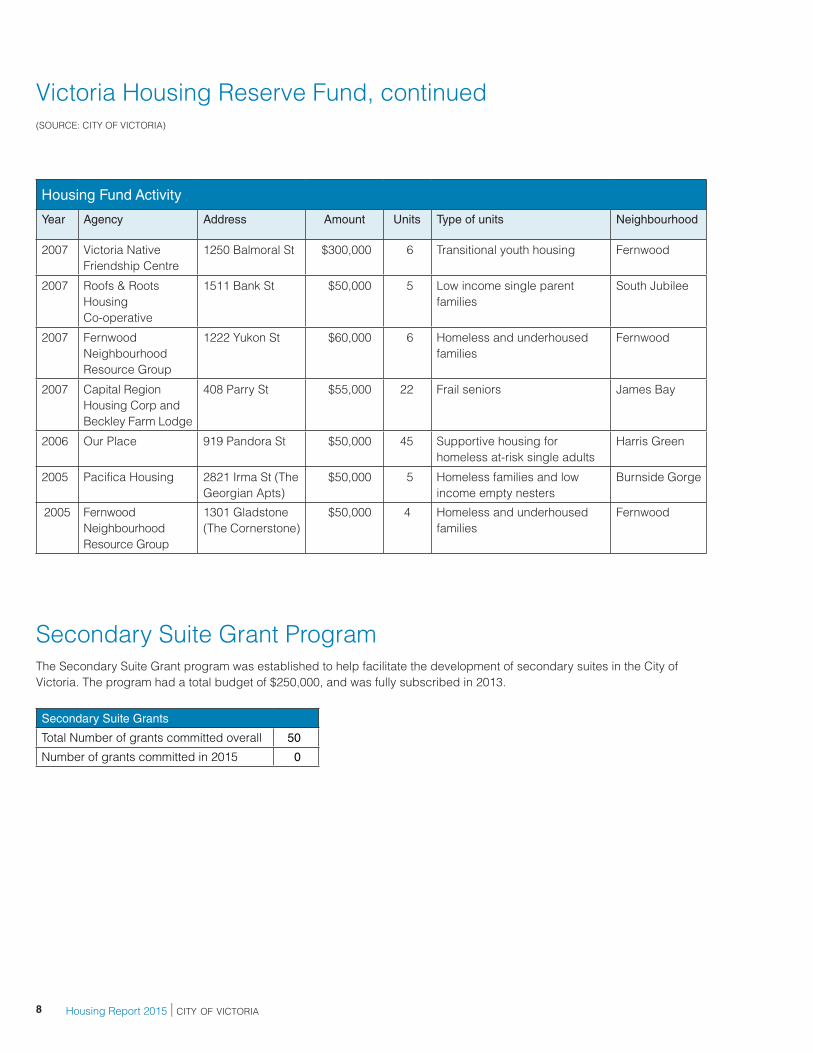
Housing Fund Activity
Year Agency Address Amount Units Type of units Neighbourhood
2007 Victoria Native Friendship Centre
1250 Balmoral St $300,000 6 Transitional youth housing Fernwood
2007 Roofs & Roots Housing Co-operative
1511 Bank St $50,000 5 Low income single parent families
South Jubilee
2007 Fernwood Neighbourhood Resource Group
1222 Yukon St $60,000 6 Homeless and underhoused families
Fernwood
2007 Capital Region Housing Corp and Beckley Farm Lodge
408 Parry St $55,000 22 Frail seniors James Bay
2006 Our Place 919 Pandora St $50,000 45 Supportive housing for homeless at-risk single adults
Harris Green
2005 Pacifica Housing 2821 Irma St (The Georgian Apts)
$50,000 5 Homeless families and low income empty nesters
Burnside Gorge
2005 Fernwood Neighbourhood Resource Group
1301 Gladstone (The Cornerstone)
$50,000 4 Homeless and underhoused families
Fernwood
Secondary Suite Grant ProgramThe Secondary Suite Grant program was established to help facilitate the development of secondary suites in the City of Victoria. The program had a total budget of $250,000, and was fully subscribed in 2013.
Victoria Housing Reserve Fund, continued(SOURCE: CITY OF VICTORIA)
Secondary Suite Grants
Total Number of grants committed overall 50
Number of grants committed in 2015 0
city of victoria | Housing Report 2015 9
Rental Market Statistics - Victoria City Fall 2015(SOURCE: CMHC 2015 FALL RENTAL MARKET REPORT)
Canada Mortgage and Housing Corporation publishes an annual Rental Housing Report for Greater Victoria. The summary tables below highlight the rental inventory for the City of Victoria.
Primary Rental Market (Purpose built rental buildings with 3+ units per building)
Number units 2010 2011 2012 2013 2014 2015
Bachelor 2,161 2,159 2,221 2,246 2,279 2,349
1 bedroom 9,378 9,415 9,510 9,492 9,567 9,649
2 bedroom 4,111 4,094 4,160 4,167 4,234 4,265
3 bedroom 175 185 154 150 190 205
Total 15,825 15,853 16,045 16,055 16,270 16,468
Average Rent
2010 2011 2012 2013 2014 2015
Bachelor $668 $679 $700 $715 $731 $749
1 bedroom $817 $830 $839 $844 $861 $879
2 bedroom $1,044 $1,064 $1,082 $1,094 $1,121 $1,157
3 bedroom $1,294 $1,350 $1,464 $1,505 $1,451 $1,472
Secondary Rental Market
2010 2011 2012 2013 2014 2015
Total number of condominiums 11,064 11,176 11,452 11,437 11,730 12,327
Number of rental units 2,506 2,671 2,743 2,790 2,844 2,906
% units in rental market 22.70% 23.90% 24.00% 24.40% 24.20% 23.60%
Vacancy rate 1.50% 1.00% 2.60% 2.30% 1.70% 0.40%
Overall Vacancy Rates
2010 2011 2012 2013 2014 2015
Victoria 1.30% 1.80% 2.30% 2.40% 1.30% 0.6%
CMA 1.50% 2.10% 2.70% 2.80% 1.50% 0.6%
National 2.60% 2.20% 2.60% 2.70% 2.90% 3.5%
Housing Report 2015 | city of victoria10
1997 - 2015 Average Sale Prices
SFD Condominium Townhouse
1997 $223,504 $151,952 $208,072
1999 $227,309 $168,989 $186,864
2001 $243,445 $145,131 $204,144
2003 $317,540 $205,379 $264,941
2005 $445,017 $278,782 $376,789
2007 $490,000 $288,850 $374,900
2009 $505,000 $327,500 $425,000
2011 $611,312 $332,638 $498,232
2012 $623,775 $335,629 $454,150
2013 $603,477 $325,260 $454,556
2014 $612,784 $349,324 $473,938
2015 $651,810 $353,409 $488,861
Average House Prices(SOURCE: VICTORIA REAL ESTATE BOARD MULTIPLE LISTING SERVICE)
The average price is the total dollar value of all properties sold divided by the number of sales.
Average Housing Sale Prices – Victoria 1999–2015
$ –
$100,000
$200,000
$300,000
$400,000
$500,000
$600,000
$700,000
1999 2001 2003 2005 2007 2009 2011 2012 2013 2014 2015
SFD
Condominium
Townhouse

1 Centennial SquareVictoria, British ColumbiaV8W 1P6
www.victoria.ca
MARCH 2016 | PSPRINTED ON RECYCLED PAPER