Embed Size (px)
Citation preview
Thriving Cities is an initiative of the University of Virginia’s Institute for Advanced Studies in Culture.
T H R I V I N G C I T I E S
C I T Y P R O F I L E O F
RichmondJ U L I A N M A X W E L L H AY T E R
PROFILE OF METRO RICHMOND / Thriving Cities P A G E 2
JULIAN MAXWELL HAYTER, PHD / 2015
University of Virginia’s Institute for Advanced Studies in Culture
Made possible by the generous support of the Kern Family Foundation
City grid art by GridLove Designs
PROFILE OF METRO RICHMOND / Thriving Cities P A G E 3
C I T Y P R O F I L E E X E C U T I V E S U M M A R Y
Cities are never blank slates. Every urban ranking and rating begs acknowledgement of lasting cultural legacies and histories. It is essential that any quantitative assessment not stand outside of context. At stake is the difference between possessing sheer quantities of information, on the one hand, and quality knowledge, or wisdom, on the other. In order to put data into a context for wise action, Thriving Cities has created distinct city profiles for its pilot cities.
These profiles are central in that they characterize a given pilot city in relation to the Project’s distinc-tive “human ecology” framework and research design. In applying the human ecology framework, profilers collected and analyzed both quantitative and qualitative data on each city according to the six fundamental community endowment areas. Additionally, the profile assesses the unique ways in which the community endowments interact with and relate to each other in the context of a particular city.
City profiles include conventional demographic, economic, and political data, but also incorporate in-formation pertaining to a city’s historical peculiarities, cultural norms, and community perceptions, at both the macro-community and the micro-sub-community (e.g., neighborhood) level. They will stand alone as important resources about and in service to their communities.
PROFILE OF METRO RICHMOND / Thriving Cities P A G E 4
T A B L E O F C O N T E N T S
PART I: BACKGROUND Executive Summary Introduction: Richmond, Virginia’s History and Development Demographic Overview
PART II: Endowments “The True”: The Realm of Knowledge “The Good”: The Realm of Social Mores and Ethics “The Beautiful”: The Realm of Aesthetics “The Prosperous”: The Realm of Economic Life “The Just and Well-Ordered”: The Realm of Political and Civic Life “The Sustainable”: The Realm of Natural Resources, Public Health, and the Environment
PART III: CONCLUSION
NOTES
PART IV: APPENDICES
PROFILE OF METRO RICHMOND / Thriving Cities P A G E 5
I . I N T R O D U C T I O N
EXECUTIVE SUMMARY
This city profile of Richmond, Virginia, addresses two principal questions about contemporary urban life: What does it mean, and what does it take to thrive in today’s cities? To answer these questions—which inquire into the very meaning of urban “well-being”—this project not only interrogates Rich-mond’s history, but also uses the concept of community endowments to better understand the city’s civic identity. It examines Richmonders’ obligations and commitment to the realms of knowledge (“The True”); social mores and ethics (“The Good”); aesthetics (“The Beautiful”); economic life (“The Pros-perous”);political and civic life (“The Just and Well-Ordered”); and, finally, natural resources, public health, and the environment, (“The Sustainable”). In regard to methodology, this research draws upon both historical and contemporary sources. The profile utilizes several bodies of historical scholarship, ranging from research in political science and urban studies to historical examinations of Virginia and the Richmond region. In terms of primary source material, this effort draws from media sources, contemporary scholarly studies, census data, court documents, and government documents from local and national administrations. Much of the secondary and primary source material is both quantitative and qualitative in nature.
In terms of the ways Richmonders currently contemplate municipal solidarity and the concept of thriving, there is no proverbial blank slate—the area’s history continues to play a profound part in dictating the types of strategies residents devise to meet contemporary challenges. In fact, Richmond’s past consciously and unconsciously affects local perceptions of the common good and what it means to thrive. Currently, the Richmond Metropolitan Area is entangled in a negotiation between empow-erment and restriction. The extent to which Virginia’s capital city thrives is contingent, in effect, upon making local assets widely accessible to the area’s vulnerable communities. Although local initiatives to reinvigorate the city’s rich heritage, rebuild historic neighborhoods, and address deepening economic marginalization have become Richmond’s most valuable strengths, the city has only recently begun to come to terms with the relationship between extraordinary poverty and the region’s historical legacy of institutional racism. Yet Richmond’s principal asset, as it happens, is this recent acknowledgment of, and willingness to address, the city’s poverty crisis. As the city moves beyond its segregationist past, many of the areas where its character flaws were most clearly displayed have been transmuted into pockets of promise.
PROFILE OF METRO RICHMOND / Thriving Cities P A G E 6
INTRODUCTION: RICHMOND, VIRGINIA’S HISTORY AND DEVELOPMENT
The City of Richmond (RVA) has had a central place in the heritage and identity of America, the Com-monwealth of Virginia, and the South since the eighteenth century. Colonel William Byrd II found-ed Richmond in 1737. Colonial Virginians made Richmond the Commonwealth’s capital in 1780, and the city was incorporated in 1782.1 Richmond, which was also the capital of Confederacy during the American Civil War, has been an independent municipality since 1871. As colonial settlers transformed the area into a tobacco-producing powerhouse, the Commonwealth of Virginia, Virginia’s Tidewater region, and the capital city eventually became essential components of the English presence in North America. As European demand for North American staple crops increased over the seventeenth and eighteenth centuries, tobacco production began to define RVA’s identity. 2 By the late 1600s, the tobacco industry had come to rely almost exclusively on slavery.3 In time, slavery dictated Richmond’s eco-nomic viability, and the master/servant relationship eventually defined public and private life in the Commonwealth until the Civil War.
Ambivalent political and social traditions characterize (and continue to define) much of Richmond’s history. On the one hand, Virginia and Richmond were central to the establishment of American inde-pendence. In Richmond, Patrick Henry delivered the renowned “Liberty or Death” speech atop Church Hill at St. John’s Church in 1775. Lawmakers signed Thomas Jefferson’s Virginia Statute for Religious Freedom at a temporary capitol building in 1786.4 On the other hand, human bondage and Jim Crow segregation stood in direct contrast to the role Virginia and Richmond played in defining what it meant to be free in America. In late 1901 and early 1902, Virginia’s powerbrokers drafted and ratified a new state constitution that confirmed whites’ deep suspicions of open democracy and economic fairness. The Commonwealth’s constitution not only authorized the use of poll taxes and literacy tests to keep most blacks and poor whites from the electoral politics; de jure and de facto racial segregation guaran-teed that white elites maintained control over public and private life in Richmond.5 By the mid-twenti-eth century, these well-heeled and well-connected whites were still overrepresented on local governing bodies, and local officials often did the bare minimum to address the economic and social needs of African Americans and poor people. By the 1970s, deep patterns of residential segregation and econom-ic inequality characterized the city’s African American enclaves—which, as it happens, still make up a significant portion of Richmond’s poorest communities. Now as in the past, cities are both enriched and constrained by their history and must grapple with its powerful legacy. In terms of the ways Richmonders contemplate municipal solidarity, there is no proverbial blank slate—the area’s history plays a profound part in dictating the types of strategies local residents devise to meet contemporary challenges. Both knowingly and unconsciously, people are influenced by Richmond’s past in how they perceive the common good and what it means to thrive.
Structural factors (especially state-enacted regulations) and environmental forces have also shaped Richmond’s character. Two independent counties immediately surround Richmond—Henrico County borders from the northwest to southeast and Chesterfield County from the midwest to the southeast.6 Virginia is a Dillon Rule state—not only does this interpretation of governmental authority circum-scribe Richmond’s independence; under it, municipalities’ political and economic powers are specif-ically defined by city charters (which the Commonwealth controls). All changes to these charters in Virginia must be approved by the General Assembly.
DEMOGRAPHIC OVERVIEW
In terms of topography, Richmond occupies the easternmost point of Virginia’s Piedmont region. The capital city is located at 37.5333° N, 77.4667° W, and in 2010 occupied 59.81 square miles. The James River, at its highest navigable point, cuts through the heart of the city.7 A humid subtropical climate dictates seasonal patterns in the Richmond area. The waters of the Chesapeake Bay and the Tidewater region often guarantee that Richmond’s summers are hot and humid, while the area’s winters are typically mild—the Blue Ridge and Appalachian Mountains insulate Richmond from cold continental air during
PROFILE OF METRO RICHMOND / Thriving Cities P A G E 7
the winter months. While the region’s climate helped ensure the Richmond area’s place as one of North America’s top tobacco producers, the Commonwealth’s capital struggled to maintain its economic pre-eminence during the twentieth century.
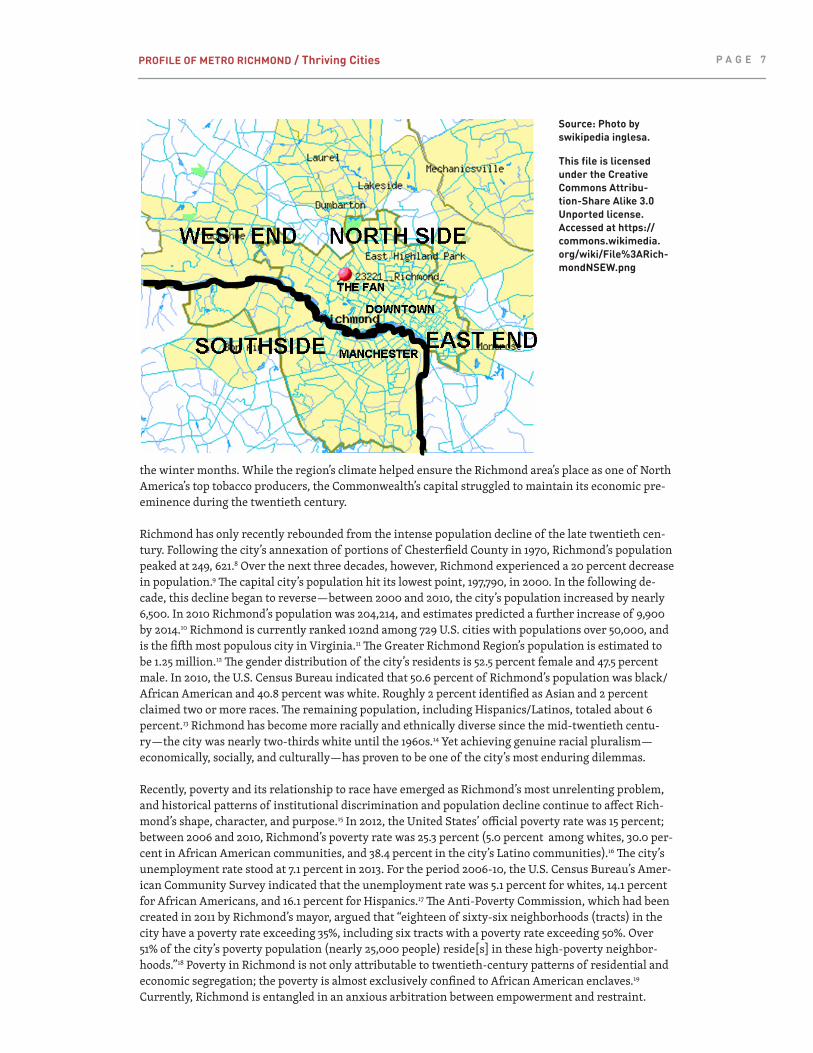
Richmond has only recently rebounded from the intense population decline of the late twentieth cen-tury. Following the city’s annexation of portions of Chesterfield County in 1970, Richmond’s population peaked at 249, 621.8 Over the next three decades, however, Richmond experienced a 20 percent decrease in population.9 The capital city’s population hit its lowest point, 197,790, in 2000. In the following de-cade, this decline began to reverse—between 2000 and 2010, the city’s population increased by nearly 6,500. In 2010 Richmond’s population was 204,214, and estimates predicted a further increase of 9,900 by 2014.10 Richmond is currently ranked 102nd among 729 U.S. cities with populations over 50,000, and is the fifth most populous city in Virginia.11 The Greater Richmond Region’s population is estimated to be 1.25 million.12 The gender distribution of the city’s residents is 52.5 percent female and 47.5 percent male. In 2010, the U.S. Census Bureau indicated that 50.6 percent of Richmond’s population was black/African American and 40.8 percent was white. Roughly 2 percent identified as Asian and 2 percent claimed two or more races. The remaining population, including Hispanics/Latinos, totaled about 6 percent.13 Richmond has become more racially and ethnically diverse since the mid-twentieth centu-ry—the city was nearly two-thirds white until the 1960s.14 Yet achieving genuine racial pluralism—economically, socially, and culturally—has proven to be one of the city’s most enduring dilemmas.
Recently, poverty and its relationship to race have emerged as Richmond’s most unrelenting problem, and historical patterns of institutional discrimination and population decline continue to affect Rich-mond’s shape, character, and purpose.15 In 2012, the United States’ official poverty rate was 15 percent; between 2006 and 2010, Richmond’s poverty rate was 25.3 percent (5.0 percent among whites, 30.0 per-cent in African American communities, and 38.4 percent in the city’s Latino communities).16 The city’s unemployment rate stood at 7.1 percent in 2013. For the period 2006-10, the U.S. Census Bureau’s Amer-ican Community Survey indicated that the unemployment rate was 5.1 percent for whites, 14.1 percent for African Americans, and 16.1 percent for Hispanics.17 The Anti-Poverty Commission, which had been created in 2011 by Richmond’s mayor, argued that “eighteen of sixty-six neighborhoods (tracts) in the city have a poverty rate exceeding 35%, including six tracts with a poverty rate exceeding 50%. Over 51% of the city’s poverty population (nearly 25,000 people) reside[s] in these high-poverty neighbor-hoods.”18 Poverty in Richmond is not only attributable to twentieth-century patterns of residential and economic segregation; the poverty is almost exclusively confined to African American enclaves.19
Currently, Richmond is entangled in an anxious arbitration between empowerment and restraint.
Source: Photo by swikipedia inglesa.
This file is licensed under the Creative Commons Attribu-tion-Share Alike 3.0 Unported license. Accessed at https://commons.wikimedia.org/wiki/File%3ARich-mondNSEW.png
PROFILE OF METRO RICHMOND / Thriving Cities P A G E 8
The city has done exceptionally well in sustaining the realms of knowledge, nature and health, mores and ethics, political life, aesthetics, and economic life. Yet Richmond’s most economically vulnerable communities have little access to the best portions of these endowments. Many Richmonders recog-nize that the extent to which the city thrives is contingent upon making the city’s assets more widely accessible, and local residents have organized numerous plans to meet these challenges. Indeed, public and private initiatives to reinvigorate the city’s rich heritage, rebuild historic neighborhoods (e.g., downtown, areas surrounding Virginia Commonwealth University, Jackson Ward, and portions of the Fan District), and address deepening economic marginalization have become Richmond’s most valuable strength. Over the last several decades, Richmond has experienced a cultural and reform-based renais-sance that has the potential, already somewhat realized, to transform the city’s deficits into municipal assets. Recent plans to address the city’s shortcomings have become Richmond’s principal asset—par-ticularly in terms of combating poverty. Many of Richmond’s sore spots—the city’s most persistent character flaws—are also pockets of profound promise.
P A R T I I : E N D O W M E N T S
“THE TRUE”: THE REALM OF KNOWLEDGE
In terms of the realm of knowledge (particularly, intellectual life and the viability of the education system), institutions of higher learning and Richmond Public Schools (RPS) have struggled to negotiate local disparities between poverty and privilege. Access to the realm of knowledge in Richmond has also been historically limited to well-heeled whites—generally at the expense of poor whites and blacks, and, more recently, Latinos. RPS’s substandard condition (manifested, for example, by poor test scores, the high proportion of recipients of free and reduced-price lunches, and a high dropout rate) is one of the city’s most shocking deficiencies. This deficit is all the more unsettling when RPS is contrasted with Richmond’s institutions of higher education—collectively, one of the Richmond Metropolitan Area’s most visible assets. City officials and local residents have, in recent years, joined forces with Rich-mond’s institutions of higher education to address RPS’s problems. The state of RPS, locals have come to understand, is indistinguishable from the persistence of residential segregation and poverty.
RPS is a fiscally dependent school division that, pursuant to state law, does not levy taxes or issue debt. It draws most of its revenue from state and local funds; its general operating budget revenues were $247,209,633 for fiscal year (FY) 2013-14.20 Nine officials govern the Richmond School Board (one for each of nine city districts).21 The members of this board, who are elected by the citizens of Richmond, serve four-year terms. The city’s school system comprises forty-six public schools and in September 2014 enrolled 23,957 students.22 RPS has two preschool centers, twenty-six elementary schools, one charter elementary school (Patrick Henry), eight middle schools, five comprehensive high schools, and three specialty high schools. Richmond provides two programs for students with exceptional needs, and three career and technical education and alternative education schools and programs. RPS spent $13,022 per student in FY 2013-14. The national average in 2014 was about 19 percent lower, at $10,608.23
It is impossible to separate RPS’s problematic performance from the issues of poverty and race. While African Americans make up 50 percent of Richmond’s total population, 80 percent of RPS’s total student population in 2014 was black. White students made up 9 percent and Latinos 9 percent. The remaining 2 percent identified as Asian, Hawaiian, Native American, or “other.”24 As Appendix IV shows, segregation intensifies in RPS as children age.25 Seventy-six percent of Richmond’s high school seniors graduated on time in 2013—a gain of ten percentage points since 2008—and the city reported an 8.93 percent truancy rate for that year. 26 One in five students at Armstrong High School, located in the impoverished East End, drop out before graduation.27 RPS graduates also scored well below the national average on standardized tests such as the SAT. Among 491 RPS students who took the SAT in 2010, the average scores were 413 for critical reading, 407 for mathematics, and 403 for writing.28 On April 28, 2014, students from Open High School (located in the Oregon Hill neighborhood) marched to
PROFILE OF METRO RICHMOND / Thriving Cities P A G E 9
the mayor’s office to protest what they believed were disgraceful conditions throughout RPS.29 Many of Richmond’s schools, as it happens, are not only failing their students but are structurally unsound.30
Forty-three private schools are located in Richmond, which is also home to Maggie L. Walker Gover-nor’s School for Government and International Studies, a regional public magnet school for grades 9-12. Of the private educational institutions listed in 2013, seven were Catholic, sixteen were affiliated with other religions, and three served students with special needs.31 The ratio of public to private schools (forty-six public to forty-three private) epitomizes the local controversy over public school integration and the state of RPS. In fact, thirteen of Richmond’s current private schools were established during the era of “massive-to-passive resistance” (1954-86).32 In terms of educational achievement, Walker is Richmond’s flagship high school. It is one of eighteen Governor’s Schools in the Commonwealth and enrolls more than 700 students. In addition to Richmond itself, Walker draws students from nine Richmond-area counties: Chesterfield, Henrico, Hanover, Goochland, Powhatan, Prince George, Charles City, King and Queen, and New Kent. Walker was not only ranked the fourteenth-best public high school in America by Newsweek in 2013; it has a strenuous admissions process consisting of four entrance examinations. Admission is highly selective: For inclusion in the class of 2017, a total of 1,145 students competed for just 192 slots.33 In 2013, Walker maintained graduation and college-bound rates of 100 percent. For the class of 2014, the average SAT scores were 721 Verbal, 697 Math, and 690 Writ-ing, for a total of 2108).34
In recent years, Richmond’s intellectual and academic institutions have gained national attention. Within the city are three four-year institutions, one community college (J. Sargeant Reynolds Commu-nity College), and two theological seminaries (Union Presbyterian Seminary and the Baptist Theologi-cal Seminary at Richmond). Virginia Commonwealth University (VCU—est. 1838 as the Richmond Pro-fessional Institute) covers 143 acres in the downtown/Monroe Park area.35 VCU is also one of the largest public universities in Virginia, enrolling about 24,000 undergraduates and 6,000 graduate students. More than half of VCU’s students (about 16,000) are enrolled in the College of the Humanities. VCU has an endowment of about $1.3 billion and generates roughly $260 million each year in externally funded research.36 U.S. News & World Report consistently ranks the VCU School of the Arts as one of the best programs of its kind in the United States.37 The Medical College of Virginia/Virginia Commonwealth University School of Medicine, which has invested over $1.6 billion in its downtown and Monroe Park campuses, is the largest operating medical school in Virginia.38 With about 4,400 students, including 3,400 undergraduates, the University of Richmond (UR—est. 1830) is the area’s largest private uni-versity. The university was ranked thirtieth among liberal arts colleges by U.S. News & World Report in 2015.39 Located in the West End, UR has one of the largest endowments in the United States for a school of its size, $2.02 billion.40 UR recently opened UR Downtown, which offers several programs designed to support families, access to legal services, and the arts in the Greater Richmond Region.41 Richmond is also home to a historically black university, Virginia Union University (est. 1865), which enrolls nearly 1,700 students.
With city government and the school board struggling to meet the challenges of Richmond’s public school crisis, a number of organizations (public and private) have set out to reform the school sys-tem. For instance, RPS recently adopted several policies aimed at its most impoverished and isolated communities. One is the Drop Out Prevention Program, which simplifies the process of “recovered” students’ reentry into public school. Nonprofit organizations have also gotten involved—in recent years, Communities in Schools (which is the largest stay-in-school network in the United States and coordinates the activities of student volunteers with UR’s Jepson School of Leadership Studies) has graduated over 190 students in Performance Development Centers. These centers educate non-tradi-tional students by means of individualized, computer-based curricula.42 J. Sargeant Reynolds Commu-nity College has attempted to address RPS’s truancy dilemma by allowing individuals between the ages of eighteen and twenty-four to complete their general equivalency diploma (GED) and earn college credits at the school.43 UR has very recently bridged the long-standing divide between its classrooms and Richmond’s vulnerable communities. Since 1993, UR’s Bonner Center for Civic Engagement and its Community-Based Learning program have been matching local nonprofit organizations with UR students (nearly twenty-five per class year) who commit to working with a community partner. The
PROFILE OF METRO RICHMOND / Thriving Cities P A G E 1 0
Bonner Scholars Program actively promotes student-centered service learning (e.g., mentoring, tutor-ing, interpreting) throughout some of Richmond’s poorest communities, such as the East End.
Richmond’s age-old struggle to improve the quality of its public schools has become a referendum on local people’s obligations to The True. It is difficult to separate RPS’s current state from the city’s long-standing resistance to public school integration. As happened in many American cities, housing in Richmond became increasingly racially segregated after World War II. Unlike most American cities, however, Richmond led “massive resistance” to public school integration. An effort to change this began in the early 1960s, when Richmond’s first black mayor, Henry Marsh III, and a group of local attorneys (notably civil rights lawyer Samuel W. Tucker) mounted a legal offensive against segregated schools. Mayor Marsh specifically challenged the legality of the geographic boundaries that deter-mined which schools students could attend. The “dual attendance zones” created by this system had the effect of channeling white students and black students to different schools.44 Unfortunately, wrote the historian Robert Pratt, “years of foot-dragging in the implementation of schools desegregation not only facilitated and encouraged white migration out of the cities into neighboring suburbs, it allowed the conservative leadership additional time to mobilize forces and gradually alter the composition of the federal courts, especially the United States Supreme Court.”45 Passive resistance of this kind to public school integration lasted well into the 1980s, and when integration did occur, it had the effect of accelerating suburbanization.46
During the mid-twentieth century, Richmond’s policymakers often used public school integration to pursue spatial separation by race and class. The resulting decisions have had profound implications for the current state of the city’s public schools.47 According to Robert Pratt, “By the time the first blacks applied to all-white schools in 1958, school officials… were already operating a carefully crafted policy aimed at avoiding integration” without displays of open defiance.48 When federal courts struck down such measures, many employed upper-middle-class whites and their families fled to the suburbs. The population of Richmond’s suburbs tripled between 1950 and 1970, and in 2010 Chesterfield County (pop. 316,232) and Henrico County (pop. 306,906) each had more residents than Richmond itself.49 The population of RPS was 57 percent white in 1957; in 1989, it was 88 percent black. In 2011, there were sixty-two public schools in Chesterfield County, attended by about 58,000 students—there, the student body was about 54 percent white, 26 percent black, and 12 percent Hispanic.50 Richmond ranks third among school systems in the Commonwealth in the percentage of students receiving a free or re-duced-price lunch. In the school year that ended in 2013, more than three out of four RPS students did so (about 77 percent), compared to 30 percent in Chesterfield County and slightly less than 40 percent in Henrico County.51 Until recently, middle-class and upper-class Richmonders have been reluctant to use local resources to address RPS’s deepening predicament. Instead, they have all too often met the challenge by moving to the suburbs or putting their children in one of the area’s many private schools.
Recently, both public and private actors have recognized that Richmond’s ability to thrive is contingent on addressing the relationship between poverty and underperforming schools. The first recommenda-tion of Mayor Dwight C. Jones’s 2013 Anti-Poverty Commission Report—which has won national atten-tion—focuses on doing something about the gap in skills and employment opportunities experienced by those who are educated in Richmond’s public schools.52 As the 2014-15 school year got underway, Tina Griego of the Washington Post wrote that “the former capital of the Confederacy began rolling out its first comprehensive antipoverty initiative this summer, and it calls upon the city to face squarely its history of racial and economic segregation… taking on the legacy of policies that… systematically de-prived African Americans access to the building blocks of prosperity.”53 The Anti-Poverty Commission, along with various public and private institutions, has recognized that addressing Richmond’s public school crisis goes beyond the classroom. These organizations are not only familiar with the city’s legacy of massive resistance to public school integration, but also understand that Richmond’s ability to thrive is contingent in part upon the city’s capacity to direct educational resources and opportunities to the city’s most impoverished enclaves.54 More specifically, the commission recommended that the city redirect resources to things like advancing early childhood development, locating and educating youth who lack basic literacy, building vocational training networks, and, above all, establishing pipelines between community employment and the city’s education system.55 The Anti-Poverty Commission’s stance, addressing the public school crisis by focusing on poverty, represents a novel approach to a long-standing crisis.
PROFILE OF METRO RICHMOND / Thriving Cities P A G E 1 1
“THE GOOD”: THE REALM OF SOCIAL MORES AND ETHICS
Richmond’s religious and civic associations have recently forged stronger relationships with local institutions and the area’s most vulnerable communities. U.S. Census data and recent reports show that Richmond has a relatively high rate of religiosity, and the city’s nonprofit organizations account for nearly 5.3 percent of the Richmond area’s total employment. While this figure ranks below the state average of 6.6 percent, Richmond-area nonprofits achieved an annual growth rate of 3 percent from 2000 to 2010; over the same period, the state average was 2 percent.56 Volunteerism has always been one of Richmond’s assets. Unfortunately, local community service organizations during the Jim Crow era often reflected the ways local residents thought about the color line. Richmonders’ notions of social ethics were, until recently, deeply paternalistic and racially restricted. As the city moves further from its segregationist past, however, community service programs are not only working together but are also decidedly more inclusive. Because Richmond’s volunteerism has become less racially exclusive and paternalistic, faith-based organizations, city government, and institutions of higher education have started to use community service more effectively to engage with the city’s most pressing dilemma—poverty.
In terms of the rate of religious observance, Richmond ranks high among American cities. The 2010 U.S. Religion Census: Religious Congregations and Membership Study (RCMS) found that there were 275 congregations and 152,613 religious adherents in Richmond. The major-religion adherence rate as a percentage of the city’s total population was 74.73 percent.57 The RCMS also found that 116 congrega-tions and 47,991 Richmonders (23.50 percent of the population) identified as Evangelical Protestant.58 There were 76 mainline Protestant congregations, and 47,637 city residents identified as members of mainline Protestant denominations (23.3 percent of the population). The RCMS recorded the presence of 43 African American Protestant congregations and 21,341 adherents (10.45 percent of the population). There were 10 Catholic congregations in Richmond, and 18,540 Catholics (9 percent of the population). There were 2 Orthodox Christian congregations with 2,030 adherents (1 percent of the population). In the category “Other Religions”—which included Buddhism, Judaism, Islam, Hinduism, and the Church of Jesus Christ of Latter-day Saints— there were 28 congregations and 15,074 adherents (7.3 percent of the population). Southern Baptists were the largest single group among Evangelical Protestants (23,209). Among black Protestants, most (14,520) identified with the National Baptist Convention of America.59 In terms of the number of congregations per population, Richmond ranked 273rd out of a total of 3,149 cities surveyed for the RCMS.60
Historically, volunteerism in Richmond was either racially exclusive or deeply paternalistic. Until recently (i.e., the last decades of the twentieth century), civic associations and nonprofits were almost exclusively black or white. These fraternal organizations, mutual benefit societies, nonprofits, church groups, and other organizations operated within the context of segregation.61 Whites who contributed time and donated money to African American institutions such as Virginia Union University did so not entirely out of altruism, but, rather, a deep desire to maintain the color line.62 In fact, Richmond’s white benefactors maintained almost exclusive control over the interracial aspects of local volunteer-ism. Other whites who were relatively racially liberal, such as education activist Mary-Cooke Branch Munford (1865-1938) and historian and newspaper editor Douglas Southall Freeman (1886-1953), demanded that local elites “control the pace of racial and social change.” Taking a stance commonly referred to as “the Virginia Way,” local elites vehemently supported segregation but rejected maintain-ing race relations through rigid racial oppression. According to historian J. Douglas Smith, “Interracial cooperation was always governed according to terms dictated by whites whose concern stemmed less from humanitarian obligations toward blacks than from the desire to do the bare minimum to keeps black happy.”63 Although African Americans—led by Maggie Walker (the first female bank president in the United States) and Richmond Planet editor John Mitchell—developed an intricate array of black volunteer networks, local government and well-heeled whites often made sure that black uplift was limited in scale and scope. In time, African American realized that they could no longer depend on the good-faith efforts of a few “good white people”—they turned to Washington and national organizations like the NAACP. The push for full integration, in time, ended the types of paternalistic volunteerism that characterized early-twentieth-century Richmond.64
PROFILE OF METRO RICHMOND / Thriving Cities P A G E 1 2
According to Virginia’s Nonprofit Sector, a joint report of the Johns Hopkins Center for Civil Society Studies, the Community Foundation, and VCU (2012), the city of Richmond was home to 440 nonprofit entities defined strictly as tax exempt under section 501(c)(3) of the Internal Revenue Code. (There were 1,478 in the Richmond Metropolitan Area.) While there are certainly more than 440 service or-ganizations in Richmond, the most extensive data covers 501(c)(3) exemptions, which most commonly apply to religious, educational, charitable, scientific, and literary organizations. In 2010 in the Metro Richmond Region (which includes Chesterfield County, the city of Colonial Heights, Goochland County, Hanover County, Henrico County, the cities of Hopewell and Petersburg, and Powhatan County), 501(c)(3) tax-exempt organizations generated nearly $3.6 billion in revenue and held over $7.3 billion in as-sets. While hospitals generated the bulk of the Richmond region’s total revenue of this kind, religious, grant-making, and civic associations accounted for nearly 18 percent of that income. In fact, religious, grant-making, and civic associations held 41 percent of the region’s assets.65 In 2010, the total revenue for nonprofit organizations in Richmond alone was about $1.1 billion, and the assets about $3.1 billion.66 St. Mary’s Hospital led the way in terms of total assets with $608 million, while Childfund Interna-tional USA—formerly known as the Christian Children’s Fund—followed with $215 million. Although large nonprofits like Childfund International focus on global poverty, Richmond is home to dozens of nonprofits—specifically, ones with 501(c)(3)s tax-exempt status—that serve local communities. These organizations connect vulnerable communities to some of the area’s most empowered institutions.
There are a number of nonprofit organizations whose purpose speaks directly to religiosity in Rich-mond and post-Jim Crow social developments. These organizations bridge the divide between racial and class distinctions rather than dictate the tempo of social change. For instance, CrossOver Health-care Ministry (est. 1982) provides free medical care (including family practice and dental and vision care), HIV testing, and a community pharmacy to vulnerable groups (especially migrant workers). CrossOver’s mission is to provide medical care, promote wellness, and connect resources in the Rich-mond community to disadvantaged groups in the name of Jesus Christ. The organization reported over $13 million in client expenses for FY 2012; its collaborative partners include Astra Zeneca, the Bank of America, Dominion Virginia Power, the Hispanic Chamber of Commerce, the Robins Foundation, and VCU Health System. The Jepson School of Leadership Studies at UR also partners with CrossOver. Jepson School students who volunteer with CrossOver are not only obligated to complete twenty-four hours of service but, in light of the fact that CrossOver serves a large percentage of Richmond’s grow-ing Latino population, are required by this medical ministry be at least third-year language students.67
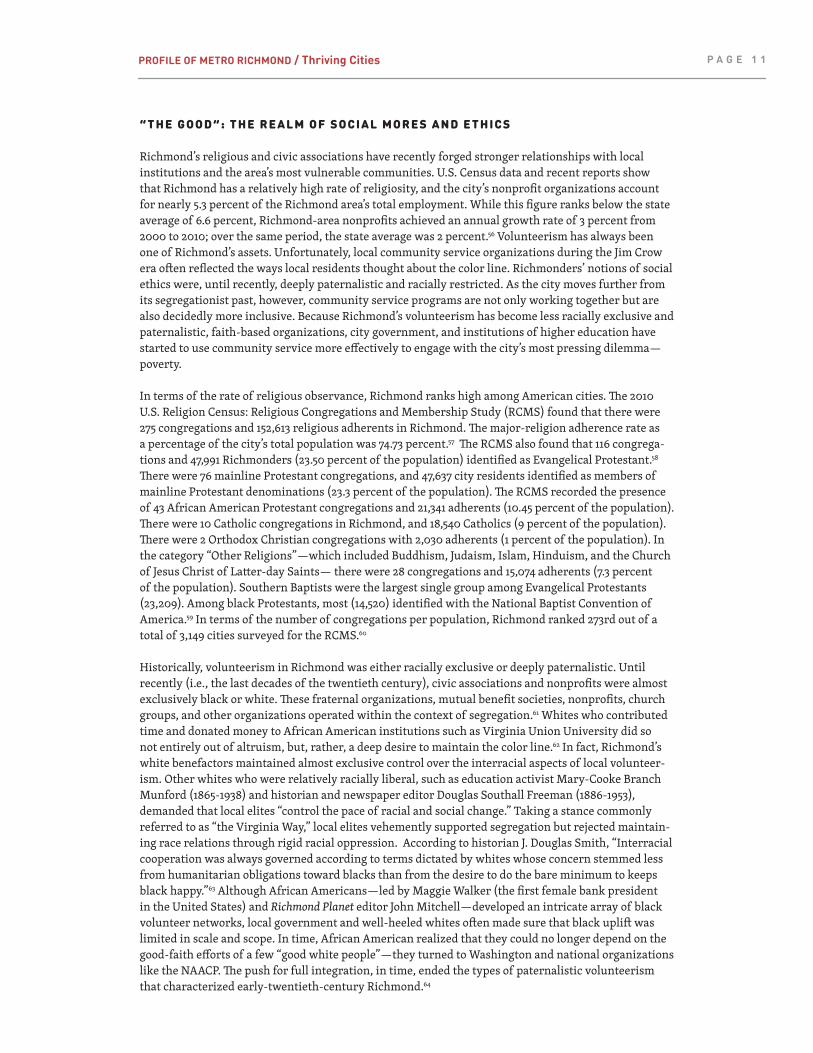
In terms of meeting the challenges of Richmond’s public housing dilemma, organizations such as the East End’s Peter Paul Development Center are vanguard groups that are working directly with the public and private sectors. According to the U.S. Census Bureau and VCU, Richmond has one of the highest levels of income inequality in the United States. The poorest fifth of the city’s households gets 2.4 percent of Richmond’s aggregate income; the richest receive 57.0 percent.68
The East End, the most densely populated part of the city, bears the brunt of this inequality. There is a total of 2,674 housing units in Gilpin, Creighton, Fairfield, Whitcomb, and Mosby Courts (all East End public housing facilities), and these courts’ 2010 census tracts, which are clustered in the sixth and seventh city council districts, have as many as7,000 residents per square mile. The average duration of occupancy of these units ranges from six to ten years. Gilpin Court (est. 1942) is the largest pub-lic housing facility between Washington and Atlanta.69 Yet the average annual household income in Richmond Redevelopment and Housing Authority facilities is less than $8,000 per year. The Peter Paul Development Center, which had $1.2 million in total revenue (including public support) and $1.1 million in total expenses in 2013, has grappled with this dilemma since its establishment in 1979.70 The development center, led by Damon Jiggetts, is the oldest continually operated community center in the East End, and it has gained local acclaim for its afterschool and summer youth programs. Peter Paul also coordinates with UR and the Central Virginia Food Bank (FeedMore). The organization’s youth program, which selects students on the basis of parent involvement and academic achievement, served seventy-six students from 2012 to 2013. Volunteers from VCU, UR, and Virginia Union University often help facilitate Peter Paul’s tutoring programs, and public school teachers monitor each mentee’s per-formance over the duration of the academic year. Peter Paul also distributes food twice every month to more than 700 individuals throughout the East End.
PROFILE OF METRO RICHMOND / Thriving Cities P A G E 1 3
East End Housing, Public Housing, and Peter Paul Development CenterSource: Peter Paul Development Center
Organizations like Peter Paul and the CrossOver Healthcare Ministry epitomize not merely local residents’ attempts to mitigate poverty in Richmond; they symbolize a novel type of organizational cross-pollination that would have been next to impossible during Richmond’s Jim Crow era (or even during the 1970s and 1980s). In terms of community service, centers such as Peter Paul have, in recent years, organized strategies that meet social needs and give historically neglected enclaves the tools to thrive. By using volunteers from local institutions of higher learning (many of whom are not from the Richmond area, in fact) and tapping local resources in city government, community service provid-ers have introduced resources into communities that have been generationally ignored and, in many instances, have been “deprived access to the building blocks of prosperity: education, property, and jobs.”71 These new initiatives have helped Richmonders reimagine municipal obligations in the realm of The Good.
“THE BEAUTIFUL”: THE REALM OF AESTHETICS
Richmonders not only rebuilt the city after the Civil War; they also recreated the city’s identity. In rebuilding Richmond from the ashes of the Confederacy, local people also capitalized on the local area’s central role in the American Revolution and the Civil War. Following years of neglect (in some enclaves, purposeful neglect), public and private investors are reviving the city’s aesthetic character by emphasizing Richmond’s rich history and its proximity to areas of natural beauty (particularly the James River). Richmond is in the early stages of an aesthetic reawakening—Richmonders are currently investing real assets in historically disadvantaged parts of the city. These are the very enclaves that were effectively torn asunder by generations of institutional neglect and white flight. One of the United States’ fifty most populous cities and home to several nationally prominent corpo-rations, Richmond has multiple cultural and artistic institutions. Situated within a day’s drive of 60 percent of the U.S. population, the city has recently gained national attention for its cutting-edge role in the arts and culture.72 According to Frommer’s, Richmond has been “recently coming into its own as a choice regional desti-
PROFILE OF METRO RICHMOND / Thriving Cities P A G E 1 4
nation with a growing number of breweries [and] farm-to-table restaurants.” The city, experts say, is at the forefront of the recent Southern culinary revolution (an amalgamation of traditional Southern cuisine and fine dining).73 Richmond has about thirty-five restaurants (including food trucks) per 10,000 people, well above the national average of twenty.74 In terms of dining venues, downtown has the highest concentration by far—in 2010 there were ninety-nine restaurants in the downtown area, employing about 1,600 people.75
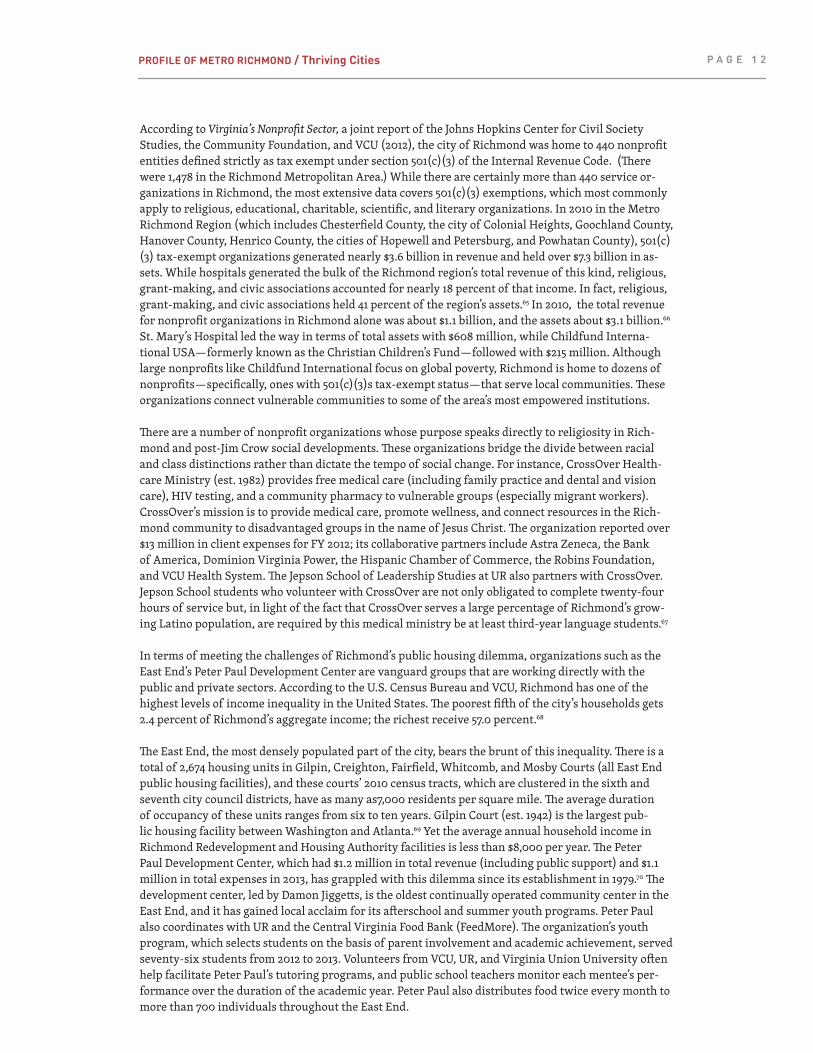
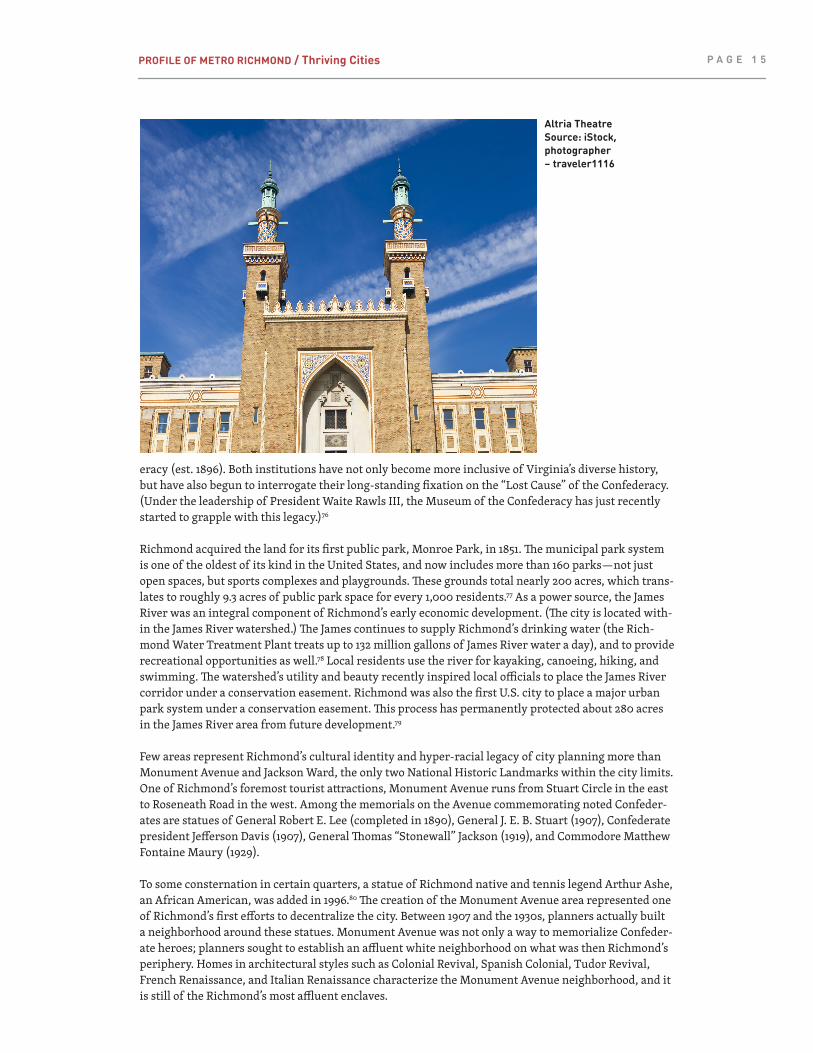
In terms of entertainment, the city has four major movie theaters—including the recently renovated Movieland at Boulevard Square and the historic Byrd Theatre in Carytown. Movieland, designed by Commonwealth Architects, is sited on the 11.5-acre grounds of the old Richmond Steel facility. The Movieland project included repurposing of two iconic historical structures, the 53,000-square-foot locomotive assembly plant and a former brass foundry. Located near downtown, Movieland features seventeen stadium-style auditoriums and is representative of local efforts to revitalize the city center. Richmond is also home to several major performing arts theaters in and around the city’s core—in-cluding the Firehouse, in the Fan District, and the Virginia Repertory Theatre and the National, both downtown. Richmond CenterStage’s Carpenter Theatre (capacity 1,800), a multistage performing arts venue that opened in 1928, is also located downtown. Altria Theatre, formerly known as “The Mosque” and “The Landmark,” is Richmond’s largest performing arts facility (capacity 3,565). This Richmond icon is directly across from Monroe Park in the middle of VCU’s downtown campus.
Richmond is also home to three professional sportsteams. The Flying Squirrels, a Double-A minor league baseball team, play home games at The Diamond (which is less than a mile east of Movieland in Council District 2). The Richmond Raiders, an Arena Indoor Football League team, play home games at downtown’s Richmond Coliseum. (The Coliseum, in Council District 6, opened in 1971 and seats nearly 12,000). The United Soccer League’s Richmond Kickers play at City Stadium, the UR football team’s former home field, located in Council District 5. The Museum District is home to the Virginia Museum of Fine Arts (VMFA), which opened in 1836. One of three branches of the Virginia Opera is located in Richmond, and the Richmond Symphony (est. 1957) performs monthly at the Carpenter Theatre. Ad-jacent to the VMFA is the Virginia Historical Society (VHS—est. 1831) and the Museum of the Confed-
Richmond CenterStage’s Carpenter Theatre
Source: iStock, photographer – traveler1116
PROFILE OF METRO RICHMOND / Thriving Cities P A G E 1 5
eracy (est. 1896). Both institutions have not only become more inclusive of Virginia’s diverse history, but have also begun to interrogate their long-standing fixation on the “Lost Cause” of the Confederacy. (Under the leadership of President Waite Rawls III, the Museum of the Confederacy has just recently started to grapple with this legacy.)76
Richmond acquired the land for its first public park, Monroe Park, in 1851. The municipal park system is one of the oldest of its kind in the United States, and now includes more than 160 parks—not just open spaces, but sports complexes and playgrounds. These grounds total nearly 200 acres, which trans-lates to roughly 9.3 acres of public park space for every 1,000 residents.77 As a power source, the James River was an integral component of Richmond’s early economic development. (The city is located with-in the James River watershed.) The James continues to supply Richmond’s drinking water (the Rich-mond Water Treatment Plant treats up to 132 million gallons of James River water a day), and to provide recreational opportunities as well.78 Local residents use the river for kayaking, canoeing, hiking, and swimming. The watershed’s utility and beauty recently inspired local officials to place the James River corridor under a conservation easement. Richmond was also the first U.S. city to place a major urban park system under a conservation easement. This process has permanently protected about 280 acres in the James River area from future development.79
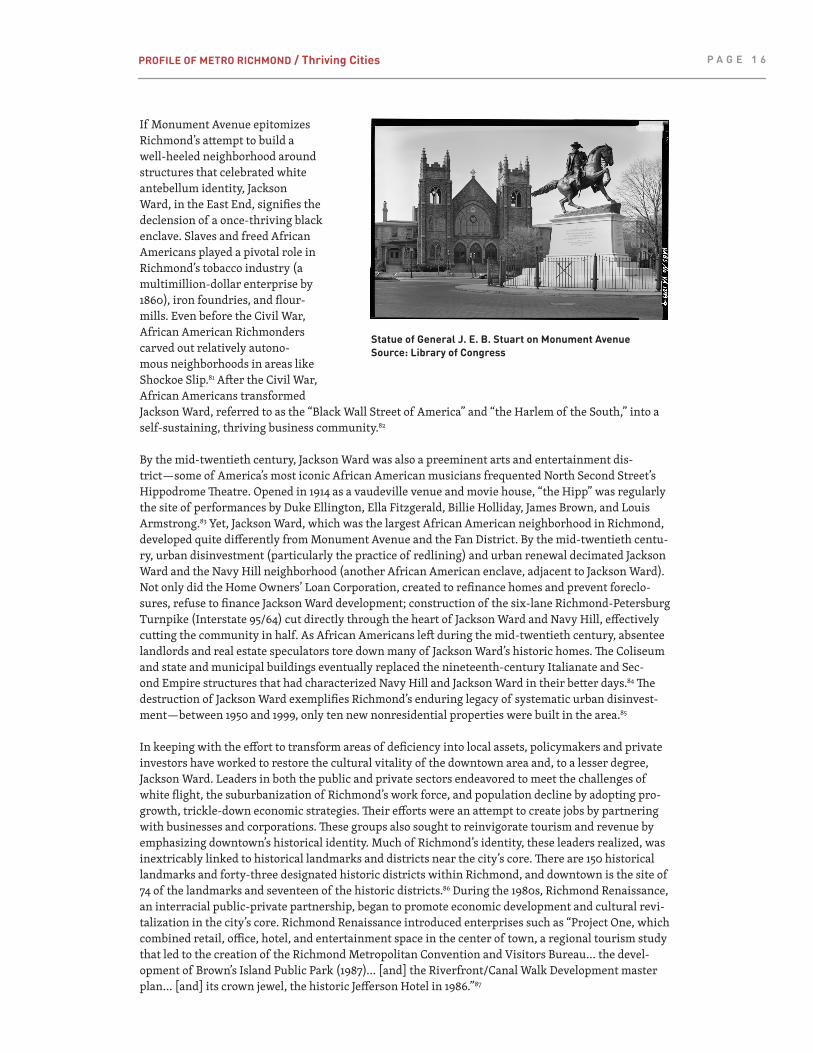
Few areas represent Richmond’s cultural identity and hyper-racial legacy of city planning more than Monument Avenue and Jackson Ward, the only two National Historic Landmarks within the city limits. One of Richmond’s foremost tourist attractions, Monument Avenue runs from Stuart Circle in the east to Roseneath Road in the west. Among the memorials on the Avenue commemorating noted Confeder-ates are statues of General Robert E. Lee (completed in 1890), General J. E. B. Stuart (1907), Confederate president Jefferson Davis (1907), General Thomas “Stonewall” Jackson (1919), and Commodore Matthew Fontaine Maury (1929).
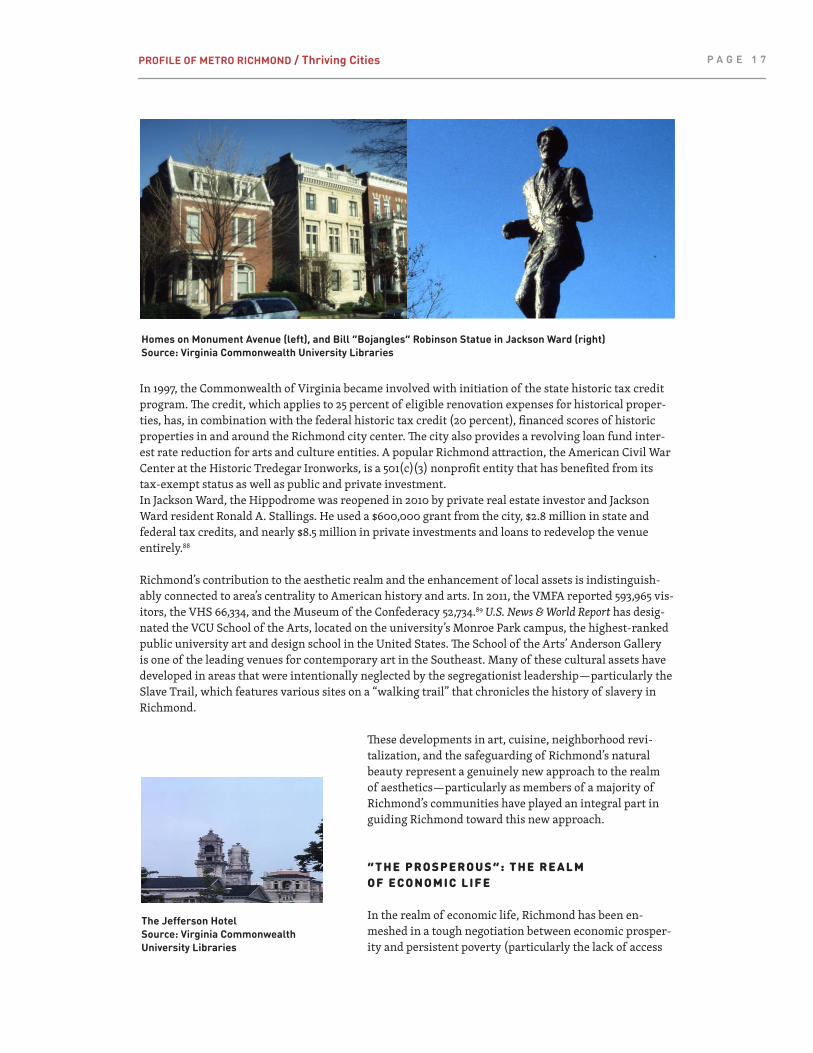
To some consternation in certain quarters, a statue of Richmond native and tennis legend Arthur Ashe, an African American, was added in 1996.80 The creation of the Monument Avenue area represented one of Richmond’s first efforts to decentralize the city. Between 1907 and the 1930s, planners actually built a neighborhood around these statues. Monument Avenue was not only a way to memorialize Confeder-ate heroes; planners sought to establish an affluent white neighborhood on what was then Richmond’s periphery. Homes in architectural styles such as Colonial Revival, Spanish Colonial, Tudor Revival, French Renaissance, and Italian Renaissance characterize the Monument Avenue neighborhood, and it is still of the Richmond’s most affluent enclaves.
Altria TheatreSource: iStock, photographer – traveler1116
PROFILE OF METRO RICHMOND / Thriving Cities P A G E 1 6
If Monument Avenue epitomizes Richmond’s attempt to build a well-heeled neighborhood around structures that celebrated white antebellum identity, Jackson Ward, in the East End, signifies the declension of a once-thriving black enclave. Slaves and freed African Americans played a pivotal role in Richmond’s tobacco industry (a multimillion-dollar enterprise by 1860), iron foundries, and flour-mills. Even before the Civil War, African American Richmonders carved out relatively autono-mous neighborhoods in areas like Shockoe Slip.81 After the Civil War, African Americans transformed Jackson Ward, referred to as the “Black Wall Street of America” and “the Harlem of the South,” into a self-sustaining, thriving business community.82
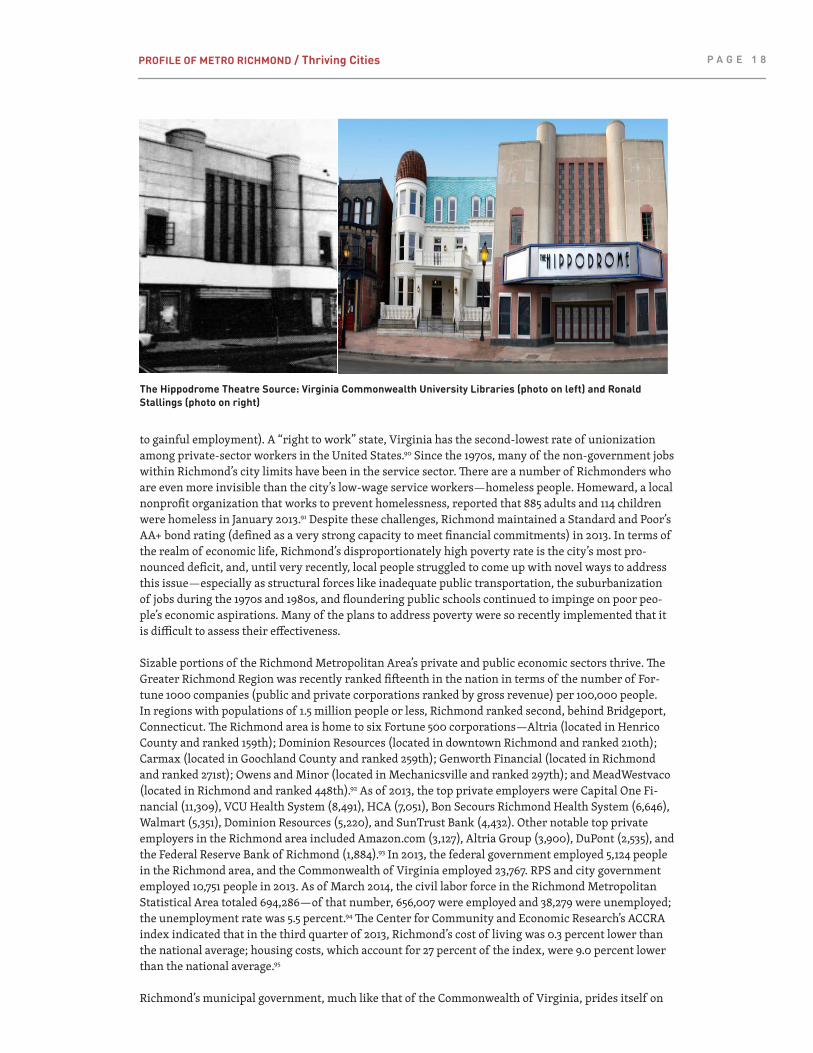
By the mid-twentieth century, Jackson Ward was also a preeminent arts and entertainment dis-trict—some of America’s most iconic African American musicians frequented North Second Street’s Hippodrome Theatre. Opened in 1914 as a vaudeville venue and movie house, “the Hipp” was regularly the site of performances by Duke Ellington, Ella Fitzgerald, Billie Holliday, James Brown, and Louis Armstrong.83 Yet, Jackson Ward, which was the largest African American neighborhood in Richmond, developed quite differently from Monument Avenue and the Fan District. By the mid-twentieth centu-ry, urban disinvestment (particularly the practice of redlining) and urban renewal decimated Jackson Ward and the Navy Hill neighborhood (another African American enclave, adjacent to Jackson Ward). Not only did the Home Owners’ Loan Corporation, created to refinance homes and prevent foreclo-sures, refuse to finance Jackson Ward development; construction of the six-lane Richmond-Petersburg Turnpike (Interstate 95/64) cut directly through the heart of Jackson Ward and Navy Hill, effectively cutting the community in half. As African Americans left during the mid-twentieth century, absentee landlords and real estate speculators tore down many of Jackson Ward’s historic homes. The Coliseum and state and municipal buildings eventually replaced the nineteenth-century Italianate and Sec-ond Empire structures that had characterized Navy Hill and Jackson Ward in their better days.84 The destruction of Jackson Ward exemplifies Richmond’s enduring legacy of systematic urban disinvest-ment—between 1950 and 1999, only ten new nonresidential properties were built in the area.85
In keeping with the effort to transform areas of deficiency into local assets, policymakers and private investors have worked to restore the cultural vitality of the downtown area and, to a lesser degree, Jackson Ward. Leaders in both the public and private sectors endeavored to meet the challenges of white flight, the suburbanization of Richmond’s work force, and population decline by adopting pro-growth, trickle-down economic strategies. Their efforts were an attempt to create jobs by partnering with businesses and corporations. These groups also sought to reinvigorate tourism and revenue by emphasizing downtown’s historical identity. Much of Richmond’s identity, these leaders realized, was inextricably linked to historical landmarks and districts near the city’s core. There are 150 historical landmarks and forty-three designated historic districts within Richmond, and downtown is the site of 74 of the landmarks and seventeen of the historic districts.86 During the 1980s, Richmond Renaissance, an interracial public-private partnership, began to promote economic development and cultural revi-talization in the city’s core. Richmond Renaissance introduced enterprises such as “Project One, which combined retail, office, hotel, and entertainment space in the center of town, a regional tourism study that led to the creation of the Richmond Metropolitan Convention and Visitors Bureau… the devel-opment of Brown’s Island Public Park (1987)… [and] the Riverfront/Canal Walk Development master plan… [and] its crown jewel, the historic Jefferson Hotel in 1986.”87
Statue of General J. E. B. Stuart on Monument AvenueSource: Library of Congress
PROFILE OF METRO RICHMOND / Thriving Cities P A G E 1 7
In 1997, the Commonwealth of Virginia became involved with initiation of the state historic tax credit program. The credit, which applies to 25 percent of eligible renovation expenses for historical proper-ties, has, in combination with the federal historic tax credit (20 percent), financed scores of historic properties in and around the Richmond city center. The city also provides a revolving loan fund inter-est rate reduction for arts and culture entities. A popular Richmond attraction, the American Civil War Center at the Historic Tredegar Ironworks, is a 501(c)(3) nonprofit entity that has benefited from its tax-exempt status as well as public and private investment. In Jackson Ward, the Hippodrome was reopened in 2010 by private real estate investor and Jackson Ward resident Ronald A. Stallings. He used a $600,000 grant from the city, $2.8 million in state and federal tax credits, and nearly $8.5 million in private investments and loans to redevelop the venue entirely.88
Richmond’s contribution to the aesthetic realm and the enhancement of local assets is indistinguish-ably connected to area’s centrality to American history and arts. In 2011, the VMFA reported 593,965 vis-itors, the VHS 66,334, and the Museum of the Confederacy 52,734.89 U.S. News & World Report has desig-nated the VCU School of the Arts, located on the university’s Monroe Park campus, the highest-ranked public university art and design school in the United States. The School of the Arts’ Anderson Gallery is one of the leading venues for contemporary art in the Southeast. Many of these cultural assets have developed in areas that were intentionally neglected by the segregationist leadership—particularly the Slave Trail, which features various sites on a “walking trail” that chronicles the history of slavery in Richmond.
These developments in art, cuisine, neighborhood revi-talization, and the safeguarding of Richmond’s natural beauty represent a genuinely new approach to the realm of aesthetics—particularly as members of a majority of Richmond’s communities have played an integral part in guiding Richmond toward this new approach.
“THE PROSPEROUS”: THE REALM OF ECONOMIC LIFE
In the realm of economic life, Richmond has been en-meshed in a tough negotiation between economic prosper-ity and persistent poverty (particularly the lack of access
The Jefferson HotelSource: Virginia Commonwealth University Libraries
Homes on Monument Avenue (left), and Bill “Bojangles” Robinson Statue in Jackson Ward (right)Source: Virginia Commonwealth University Libraries
PROFILE OF METRO RICHMOND / Thriving Cities P A G E 1 8
to gainful employment). A “right to work” state, Virginia has the second-lowest rate of unionization among private-sector workers in the United States.90 Since the 1970s, many of the non-government jobs within Richmond’s city limits have been in the service sector. There are a number of Richmonders who are even more invisible than the city’s low-wage service workers—homeless people. Homeward, a local nonprofit organization that works to prevent homelessness, reported that 885 adults and 114 children were homeless in January 2013.91 Despite these challenges, Richmond maintained a Standard and Poor’s AA+ bond rating (defined as a very strong capacity to meet financial commitments) in 2013. In terms of the realm of economic life, Richmond’s disproportionately high poverty rate is the city’s most pro-nounced deficit, and, until very recently, local people struggled to come up with novel ways to address this issue—especially as structural forces like inadequate public transportation, the suburbanization of jobs during the 1970s and 1980s, and floundering public schools continued to impinge on poor peo-ple’s economic aspirations. Many of the plans to address poverty were so recently implemented that it is difficult to assess their effectiveness.
Sizable portions of the Richmond Metropolitan Area’s private and public economic sectors thrive. The Greater Richmond Region was recently ranked fifteenth in the nation in terms of the number of For-tune 1000 companies (public and private corporations ranked by gross revenue) per 100,000 people. In regions with populations of 1.5 million people or less, Richmond ranked second, behind Bridgeport, Connecticut. The Richmond area is home to six Fortune 500 corporations—Altria (located in Henrico County and ranked 159th); Dominion Resources (located in downtown Richmond and ranked 210th); Carmax (located in Goochland County and ranked 259th); Genworth Financial (located in Richmond and ranked 271st); Owens and Minor (located in Mechanicsville and ranked 297th); and MeadWestvaco (located in Richmond and ranked 448th).92 As of 2013, the top private employers were Capital One Fi-nancial (11,309), VCU Health System (8,491), HCA (7,051), Bon Secours Richmond Health System (6,646), Walmart (5,351), Dominion Resources (5,220), and SunTrust Bank (4,432). Other notable top private employers in the Richmond area included Amazon.com (3,127), Altria Group (3,900), DuPont (2,535), and the Federal Reserve Bank of Richmond (1,884).93 In 2013, the federal government employed 5,124 people in the Richmond area, and the Commonwealth of Virginia employed 23,767. RPS and city government employed 10,751 people in 2013. As of March 2014, the civil labor force in the Richmond Metropolitan Statistical Area totaled 694,286—of that number, 656,007 were employed and 38,279 were unemployed; the unemployment rate was 5.5 percent.94 The Center for Community and Economic Research’s ACCRA index indicated that in the third quarter of 2013, Richmond’s cost of living was 0.3 percent lower than the national average; housing costs, which account for 27 percent of the index, were 9.0 percent lower than the national average.95
Richmond’s municipal government, much like that of the Commonwealth of Virginia, prides itself on
The Hippodrome Theatre Source: Virginia Commonwealth University Libraries (photo on left) and Ronald Stallings (photo on right)
PROFILE OF METRO RICHMOND / Thriving Cities P A G E 1 9
its support for business and for low taxes. The Commonwealth’s corporate income tax rate, 6.0 per-cent, has not changed in three decades. In 2014, Richmond levied a local sales tax rate of 1.0 percent on addition to the state sales tax of 4.3 percent. The state personal income tax was 2.00 percent on the first $3,000, 3.00 percent on the next $2,000, 5.00 percent on the next $12,000, and 5.75 percent on the next $17,000. In 2014, Richmond’s real estate tax rate held at $1.20 per $100 of assessed value.96 To increase water utility revenue by an estimated 6 percent in 2015, the city abandoned a flat utility rate for water consumption and adopted a “conservation rate”—for the first time in recent history, Richmond’s residents are now charged for the amount of water they use on a monthly basis. Richmond also taxed motor vehicles at a rate of $3.70 per $100 of assessed value. Business license taxes per $100 of gross receipts were as low as $0.19 for contractors and no higher than $0.58 for financial, professional, and business services.97 For FY 2014, the Department of Budget and Strategic Planning reported that Rich-mond’s general fund revenue was $682.1 million. The principle for Richmond general obligation bonds with interest for 2014 was $83,868,231, and $44,906,189 for utility revenue bonds.
While the Richmond Metropolitan Area thrives economically, the city of Richmond has struggled to keep pace with the surrounding areas. The suburbanization of employment and employers over the last three decades has been an important factor in this disparity. In 1980, Richmond was home to 233,559 jobs (full and part-time combined). Since then, the city has witnessed a steady decline in employment. In 2010 there were 170,000 full- and part-time jobs within Richmond’s city limits—a nearly 30 percent decrease since 1980. More specifically, employment in Richmond dipped by 6 percent in the 1980s, 12 percent in the 1990s, and 12 percent between 1990 and 2011. Ominously, these jobs remained in the Richmond Metropolitan Area. Jobs in Richmond, much like middle-class residents and K-12 students, have simply moved to the suburbs. With the exception of large employers like VCU Medical Center and VCU, which remain in the city center, many of the Richmond Metropolitan Area’s largest employers are located in outlying areas such as Glen Allen, Midlothian, and Chester (e.g., Altria and Amazon.com). More ominously, many entry-level and service sector jobs are located in suburban developments well beyond the city lines—in the counties, these types of jobs actually increased by 58 percent between 1980 and 2010. The counties of Chesterfield and Henrico have become richer and whiter as the capital city has suffered from “cumulative disinvestment.”98
This precipitous decline in gainful employment has had a profound influence on Richmond’s economic condition in the first decades of the twenty-first century. Urban regime theorists contend that be-cause local governments’ authority is by law and tradition more limited than that of state and national governments, informal public and private arrangements assume exceptional precedence in urban pol-itics.99 Core groups in any respective city do not have to share or represent similar political interests as long as these groups can bring together public and private communities under the banner of municipal political and fiscal viability.100 Virginia’s adherence to the Dillon Rule complicates this reality. Because the Dillon Rule protects municipal and county autonomy, Richmond has little power to regulate policies in the counties or the economic exodus to suburbs, or to enforce economic policies that might protect the city’s private interests. In fact, since the early 1970s, Virginia’s cities have been legally prohibited from annexing surrounding counties. These forces have all but ensured that Richmond has become the dependent economic variable in the area’s metropolitan equation. Local policymaker and UR professor Thad Williamson argues that, in the end, state policies guarantee that the Commonwealth’s cities do not have the legal apparatus to grapple with interconnected metropolitan problems. In effect, the Dillon Rule prohibits county and city officials from finding political solutions to the area’s economic problems. This has been a consistent problem in the Richmond area since the suburban populations began to eclipse Richmond’s population during the 1960s.
The suburbanization of Richmond’s jobs has been exacerbated by the fact that many of the city’s im-poverished residents lack vehicles; another factor is the Greater Richmond Transit Company (GRTC) policy of not allowing two-way bus service to cross county lines (another unintended consequence of the Dillon Rule). During the Jim Crow era, Richmond’s buses stopped at county lines to prevent African Americans from traveling into the suburbs—unfortunately, county officials and their constituencies, despite appeals from Richmonders, have proven reluctant to reverse this pattern.101 According to a 2012 Brookings Institute report, Missed Opportunity: Transit and Jobs in Metropolitan America, only 30.8
PROFILE OF METRO RICHMOND / Thriving Cities P A G E 2 0
percent of working-age Richmond residents have adequate access to bus routes, and the GRTC provides access to a mere 26.5 percent of the area’s jobs.102 The same report ranked the GRTC fortieth in service frequency and seventieth in job access among metropolitan transit systems in the United States.103 Richmond, as it happens, is one of the nation’s least covered metropolitan areas—and it ranks worst within the least covered region, the Southeast.104 Although state senator Henry Marsh advocated creat-ing a regional bus system in the late 1990s, the Commonwealth declined to provide funds. Meanwhile, most of Richmond’s entry-level jobs are located beyond the GRTC’s route range.
The viability of Richmond’s civic ecology hinges on local people’s ability to find novel solutions to the area’s unrelenting poverty problem. To this end, the Anti-Poverty Commission released a report on January 18, 2013, that, in terms of job creation, included two recommendations: (1) Target and coordi-nate recruitment of business using city resources and real estate; (2) create employment opportunities for the transition from school to work. Richmond policymakers realize that structural forces like the Dillon Rule make it nearly impossible to regulate affairs in the adjacent counties. Consequently, the city is coming to terms with a stark and persistent economic reality—that Richmond needs to entice busi-ness into the city by providing tax-based incentives and by constructing a regional rapid transit system that provides access to employment beyond the city limits.105 Local officials have been trying, mostly unsuccessfully, to attract businesses back into the city since the early 1980s.
The sustainability of “The Prosperous” in Richmond is not merely contingent upon broad-based access, but also upon distribution of the city’s assets to its most economically vulnerable communities. Mayor Jones recently argued, “The first point in dealing with the city’s poverty is to acknowledge the truth that it exists. Then we have to deal with the ramifications of that truth and find a strategy to change the history that we have in the city of Richmond.”106 In the past, many Richmonders were reluctant to acknowledge the city’s poverty crisis. Segregationist leadership purposefully tucked the city’s poorest residents into secluded public housing tenements. Presently, 80 percent of Richmond’s poorest resi-dents live in areas where the poverty rate is at least 20 percent.107 During the last half of the twentieth century, Richmonders, black and white alike, tacitly reinforced this invisibility by failing to address poor people’s plight. The Anti-Poverty Commission’s Maggie L. Walker Initiative for Expanding Eco-nomic Opportunity and Fighting Poverty represents the city’s first broad-based attempt to specifically address poverty, economic vulnerability, and social invisibility. This initiative represents Richmond’s collective desire to move beyond its hyper-racial past and become one city. This aspiration, however, will be unattainable until local people find ways to make portions of Richmond’s thriving economic sectors—the city’s economic assets—more widely available.
“THE JUST AND WELL-ORDERED”: THE REALM OF POLITICAL AND CIVIC LIFE
Richmonders inherited an elitist vision of civic virtue. For most of the city’s history, local powerbro-kers believed that African Americans (nearly half of the city’s population since about 1950) lacked the intellectual capacity to engage in civic life. Good government and the community’s success were, until recently, synonymous with elite whiteness. During the civil rights movement, local voting-rights activ-ists and federal policymakers changed the complexion of city hall, in large part by working toward the enactment and implementation of the Voting Rights Act of 1965. The implementation of a district-based city council system, which replaced a long-standing at-large system of representation, brought about this complexion revolution in Richmond, and majority-minority districts helped reshape the city’s civic identity.108
Richmond has become a safer city over the last decade or so. The city’s violent crime rate, however, is still significantly higher than the national average. In 2013, the Richmond Police Department had 544 officers, 93 sergeants, 36 lieutenants, 16 captains, 5 majors, and 3 deputy chiefs The RPD was led by Chief Ray Tarasovic.109 The RPD operating budget for FY 2013 was $82,497,893.110 The RPD’s officers fielded 223,033 calls for service in 2013.111 In 2013, the RPD implemented several strategic initiatives that were designed to increase police presence in high-crime areas like the East End. The city has imple-mented high-visibility tactics such as vehicle, foot, and bicycle patrols.
PROFILE OF METRO RICHMOND / Thriving Cities P A G E 2 1
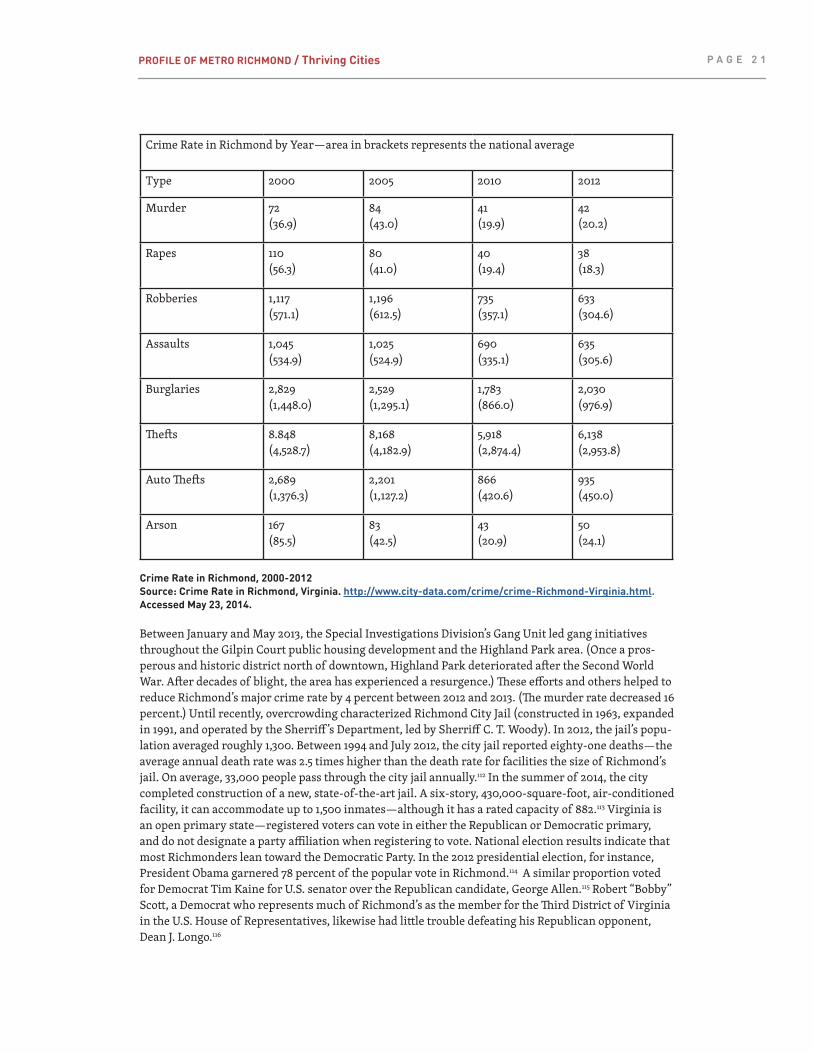
Crime Rate in Richmond by Year—area in brackets represents the national average
Type 2000 2005 2010 2012
Murder 72(36.9)
84(43.0)
41(19.9)
42(20.2)
Rapes 110(56.3)
80(41.0)
40(19.4)
38 (18.3)
Robberies 1,117(571.1)
1,196(612.5)
735(357.1)
633(304.6)
Assaults 1,045(534.9)
1,025(524.9)
690(335.1)
635 (305.6)
Burglaries 2,829(1,448.0)
2,529(1,295.1)
1,783(866.0)
2,030(976.9)
Thefts 8.848(4,528.7)
8,168(4,182.9)
5,918(2,874.4)
6,138(2,953.8)
Auto Thefts 2,689(1,376.3)
2,201(1,127.2)
866(420.6)
935(450.0)
Arson 167(85.5)
83(42.5)
43(20.9)
50(24.1)
Crime Rate in Richmond, 2000-2012Source: Crime Rate in Richmond, Virginia. http://www.city-data.com/crime/crime-Richmond-Virginia.html. Accessed May 23, 2014.
Between January and May 2013, the Special Investigations Division’s Gang Unit led gang initiatives throughout the Gilpin Court public housing development and the Highland Park area. (Once a pros-perous and historic district north of downtown, Highland Park deteriorated after the Second World War. After decades of blight, the area has experienced a resurgence.) These efforts and others helped to reduce Richmond’s major crime rate by 4 percent between 2012 and 2013. (The murder rate decreased 16 percent.) Until recently, overcrowding characterized Richmond City Jail (constructed in 1963, expanded in 1991, and operated by the Sherriff ’s Department, led by Sherriff C. T. Woody). In 2012, the jail’s popu-lation averaged roughly 1,300. Between 1994 and July 2012, the city jail reported eighty-one deaths—the average annual death rate was 2.5 times higher than the death rate for facilities the size of Richmond’s jail. On average, 33,000 people pass through the city jail annually.112 In the summer of 2014, the city completed construction of a new, state-of-the-art jail. A six-story, 430,000-square-foot, air-conditioned facility, it can accommodate up to 1,500 inmates—although it has a rated capacity of 882.113 Virginia is an open primary state—registered voters can vote in either the Republican or Democratic primary, and do not designate a party affiliation when registering to vote. National election results indicate that most Richmonders lean toward the Democratic Party. In the 2012 presidential election, for instance, President Obama garnered 78 percent of the popular vote in Richmond.114 A similar proportion voted for Democrat Tim Kaine for U.S. senator over the Republican candidate, George Allen.115 Robert “Bobby” Scott, a Democrat who represents much of Richmond’s as the member for the Third District of Virginia in the U.S. House of Representatives, likewise had little trouble defeating his Republican opponent, Dean J. Longo.116
PROFILE OF METRO RICHMOND / Thriving Cities P A G E 2 2
As the Commonwealth’s capital, Richmond has a long history of civic engagement that continues to shape local politics. As stipulated by the City Charter of 1948, Richmond’s local elections are nonpartisan—city council candidates do not run on a party ticket. Three general groups define the capital city’s power base: civil rights-oriented African Americans, white elites (who are often conservatively pro-business), and a technocratic, middle-class African American constituency. Richmond’s African Americans have a history of political involvement that dates back to Oliver W. Hill’s election to the city council in 1948 (as the first African American elected to the council since Reconstruction) and the establishment of the Richmond Crusade for Voters in 1956. (The Crusade remains active in the Richmond area.)
By 1966, Richmond had two black city council members, Henry Marsh III and B. A. “Sonny” Cephas, and one black vice-mayor (Winfred Mundle). White elites spent much of the late 1960s devising strate-gies to dilute the strength of Richmond’s thriving black electorate. One of these strategies, realized in 1970, was to annex portions of Chesterfield County. Five years later, the U.S. Supreme Court and the U.S. Department of Justice determined that the annexation had diluted black votes by adding nearly 44,000 white suburban residents. The result was implementation of the district system that exists in Richmond today, which allows black voters to be grouped in nearly racially homogeneous districts that enable African American candidates for public office to be elected in number roughly equal to the proportion of black voters in a particular district. Introduction of representation by district led to the election of Richmond’s first black-majority city council in 1977. By the mid-1980s, Richmond was one of thirteen U.S. cities with populations over 100,000 where the city council had a black majority.117
The very forces that made Richmond’s district system possible—the concentration of the African American population in densely packed urban enclaves and during 1970s and ‘80s—eventually led to the rise of technocratic black politicians. This small contingent of middle-class African Americans came to terms with a glaring political reality: City hall needed to deal with powerful business interests (the very interests that had pushed through the annexation of portions of Chesterfield County to main-tain white control of the city council) if it was to address the sharp limits on its own authority. These middle-class African Americans, to a large extent, continue to dictate electoral politics in Richmond.
The racial makeup of Richmond’s electorate has changed little since implementation of the district system in 1977—patterns of residential segregation virtually ensure that whites and blacks continue to vote for local representatives in racially homogenous districts. Because of the nature of the district system, gentrification in areas like the Fan and the Museum District has actually had little influence on the racial characteristics of local representation—which generally has been predominantly African American since 1977.
Richmond uses a council-mayor form of government. The city council is responsible for legislative affairs, while the mayor oversees the executive and budgetary functions. Until 2004, Richmond used a council-manager system, under which a city manager supervised executive functions and the may-or’s role was largely ceremonial. Council representation is divided into nine “geo-demographic” voter districts that must, per federal law, ensure that African American representation in the city council re-flects the most current population distribution. In 2008, council members’ terms were increased from two years to four, and the post of mayor, formerly filled by a city council appointee, was now filled in an at-large election by Richmond’s voters. L. Douglas Wilder was the first popularly elected mayor in Richmond since promulgation of the City Charter of 1948.118 (Virginia voters would elect Wilder gover-nor in 1989, making him the first African American to serve as a state’s chief executive in U.S. history.) The city holds, on average, about twelve public meeting per month. These meetings are designed to allow citizens to “discuss, deliberate, and act on laws and policy on behalf of Richmond residents.”119
In recent years, Richmond’s mayors have played a central role in trying to rejuvenate the city’s fiscal and educational institutions. To this end, Mayor Jones has attempted to initiate several “silver bul-let” strategies. City hall hopes to generate revenue for RPS and the GRTC, for instance, by attracting national-level businesses to Richmond. To this end, Richmond recently completed construction of the Bon Secours Washington Redskins training facility, located just two miles northwest of city hall. City
PROFILE OF METRO RICHMOND / Thriving Cities P A G E 2 3
officials also hope to create new jobs and broaden the city’s tax base by revitalizing the Shockoe Slip area. The Revitalize RVA project, which has been intensely controversial (largely because it includes plans to build on and around Richmond’s Slave Trail, slave burial grounds, and onetime slave neigh-borhoods), seeks to redevelop downtown through construction of a minor league baseball stadium, a Kroger grocery store, a Hyatt Hotel, and new apartments, though it was uncertain in 2015 whether any of these plans would materialize.
Proponents of Revitalize RVA (particularly contractors and the mayor’s office) believe that the plan could generate as much as $187 million in new revenue for the city.120 The primary focus of Revitalize RVA is on developing real estate and generating jobs in and around the downtown area and Shockoe Slip. Because of a long history of “silver bullet” misfires, Richmonders traditionally have met plans like Revitalize RVA with firm resistance. Mayor Jones contends, however, that “we are not going to tax our way out of rough times, we have to grow our way out, by design.”121 City government’s attempt to improve the quality of civic and economic life in Richmond has also be-come a referendum on local people’s obligations to “the Just and Well-Ordered.” Mayor Jones’s attempts to revitalize the local economy and attract businesses to the city’s core exist on a long continuum of local policymakers’ promotion of pro-growth politics—the major difference, over the last four decades, is that African Americans are now a part of civic life and this decision-making process. Since the 1980s, which represented the height of Richmond’s population decline, public officials have tried to address deficits such as poverty by enticing local businesses to move back into the city. While the downtown area has seen unprecedented growth over the last several decades, this growth has done little to ad-dress accelerating economic marginalization in Richmond’s most vulnerable communities.
“THE SUSTAINABLE”: THE REALM OF NATURAL RESOURCES, PUBLIC HEALTH, AND THE ENVIRONMENT
In Richmond, adequate access to food shopping and health care depends on where one lives. Many of Richmond’s impoverished neighborhoods not only lack access to serviceable grocery stores, but are so
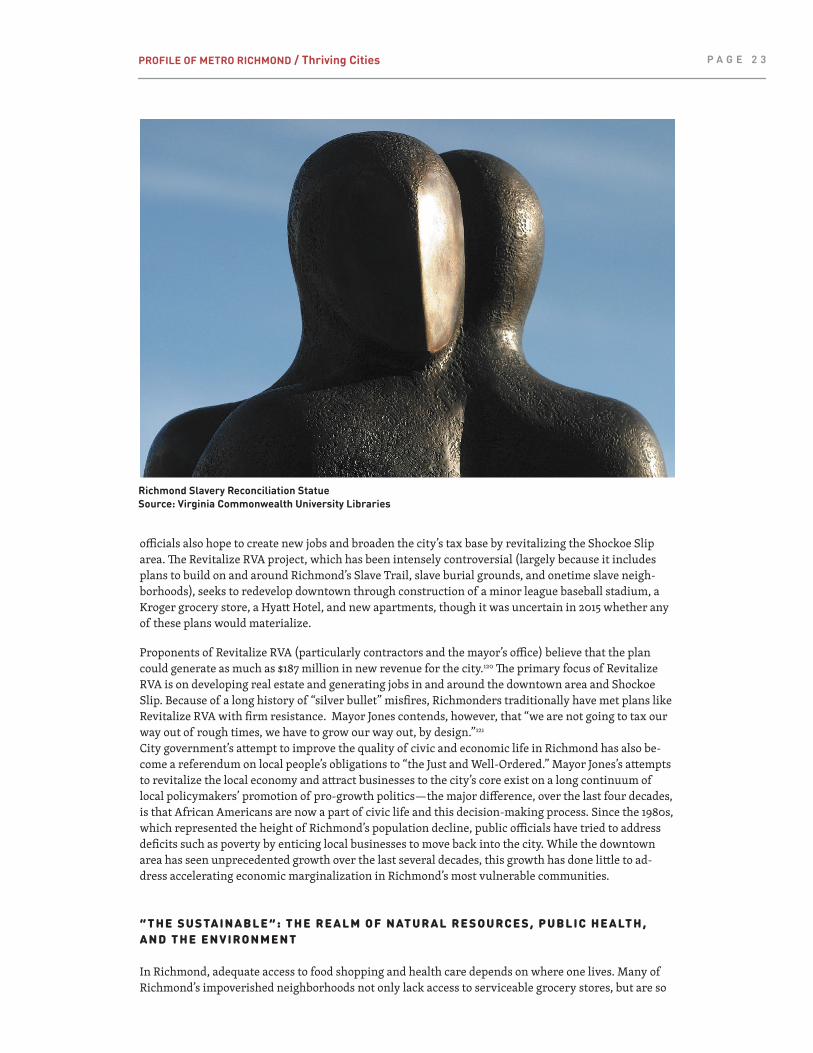
Richmond Slavery Reconciliation StatueSource: Virginia Commonwealth University Libraries
PROFILE OF METRO RICHMOND / Thriving Cities P A G E 2 4
isolated from adequate, affordable sources of food that they are referred to as “food deserts.”122 Local residents have confronted this dilemma by reimagining how to obtain and distribute food, and these plans go beyond tapping local food banks. One way they have done this is through the introduction of urban agriculture in many of Richmond’s poorest communities.
In regard to energy efficiency, Richmond took significant steps toward that goal in April 2011 when Mayor Jones launched the RVAgreen planning process, which included creation of the Sustainability Office. The most current data on Richmond’s emissions of CO2e (carbon dioxide equivalent) are from a report by Local Governments for Sustainability USA. This report indicated that in 2008 Richmond produced approximately 2.5 million metric tons of CO2e emissions. Thirty-seven percent were from electricity provided by generation facilities. Transportation fuels accounted for 35 percent, natural gas 23 percent, and kerosene 5 percent.123 In 2011, RVAgreen and the Sustainability Office resolved to reduce these numbers by addressing five focus areas: economic development, energy, environment, open space and land use, and transportation.
While some of the plans have yet to develop, the city has implemented a number of RVAgreen’s recom-mendations. In terms of economic development, it has started to provide tax credits to green business and repurpose lots for urban agriculture.124 The city has already replaced its fleet of thirty-seven diesel refuse trucks with twenty-five natural gas trucks. The Sustainability Office plans to enact policies on the use of fertilizer and pesticides, install low-flow water fixtures in public buildings, and expand recy-cling services to commercial and multifamily sectors throughout the city. (Currently, the only plastics Richmond can process for recycling are codes 1 and 2.) The mayor’s plan also addresses inefficient land use—Richmond intends to adopt energy-efficient public housing policies and improve bike/pedestrian paths, and redevelop a number of the 110 brownfields within the city (which take up nearly 160 acres) for productive use.125 In June 2013, Richmond was awarded a $400,000 grant from the U.S. Environ-mental Protection Agency to assess the redevelopment of brownfields.126 In regard to transportation (which is second only to the commercial/industrial sector as a source of greenhouse gas emissions in Richmond), the city plans to convert one-way streets to two-way, establish visible park-and-ride lots to increase GRTC use, and reinstitute the city’s electric trolley car system.127 The city is also working with local nonprofits like the Richmond Region Energy Alliance (RREA) and private local entities like Do-minion Resources to make these plans a reality. RREA is currently facilitating energy audits to retrofit public facilities throughout the city.128 Dominion Resources “is currently expanding its renewable ener-gy sources with a new wind energy facility and through the utilization of biomass (wood waste).”129
Richmond struggles in the area of public health. The Greater Richmond Region has thirteen nonprofit hospitals. In 2010, these hospitals’ total revenue was about $1.4 billion, and total assets about $1.2 bil-lion.130 According to the American Community Survey and U.S. Census Bureau, 17.6 percent of Rich-monders (35,590) had no health care coverage in 2010. In that same year, 31.6 percent of Richmonders (64,111) had public insurance, while private providers insured 60.3 percent (122,193).131 Richmond’s infant mortality rate per 1,000 births was 12.8 in 2010 and 8.4 in 2011. (The national figure for 2011 was 6.05.) 132 Richmond is also considered the asthma capital of the United States. According to the Asthma and Allergy Foundation, “Richmond is the most challenging environment for asthma sufferers due to high pollen counts, air pollution, poverty, and other factors.”133 In 2011, Richmond’s adult obesity rate was 31.3 percent. (The national average in the period 2011-12 was 35.1 percent.) In 2011, Richmond had 60 grocery stores, 1 superstore, 131 convenience stores, and 177 fast-food restaurants.134 Nearly all of Richmond’s grocery stores were (and continue to be) located in the West End. The areas that lack ade-quate grocery stores throughout Richmond are the same areas with high concentrations of fast-food and convenience or corner stores.135
A relatively high number of Richmonders suffer from an increasingly prevalent American dilem-ma—food insecurity. Over the last several years, city officials have resolved to tackle this problem by implementing a number of policy-oriented strategies. Food insecurity is not merely the experience of “going hungry”; the term also describes the satiation of people who do not have immediate access to affordable healthy food and/or lack the resources to get access to sufficient amounts of nutritious food.136 Residents of Richmond’s East End and Southside areas often do not have access to various types
PROFILE OF METRO RICHMOND / Thriving Cities P A G E 2 5
of healthy foods (especially fresh vegetables and fruit) and are plagued by food insecurity. The nation-al food bank network Feeding America reported that Richmond had 40,020 food-insecure residents in 2010—20 percent of Richmond’s total population.137 According to the Mayor’s Healthy Richmond Campaign and the Food Policy Task Force, the majority of these individuals are concentrated in several specific districts: the East End, North of the River, and the Southside. In the spring of 2012, the Food Policy Task Force presented several recommendations to resolve this problem. While few of these recommendations have materialized, the task force recommended that Richmond designate a food policy coordinator to monitor Richmonders’ access to healthy food. The task force also recommended reducing or eliminating irrigation fees for community gardens and establishing a competitive grant program to entice healthy food-related enterprises into the city. The task force also recommended that Richmond restructure its zoning laws, tax codes, and ordinances to facilitate food projects and urban agriculture.
Food policies, many Richmonders believe, “can only be driven so far within City Hall and city limits”—ultimately, Richmond’s urban agriculturalists have had to organize their own strategies to meet the problem of food insecurity.138 In February and March 2013, Branch’s Baptist Church, in the Southside, held six classes (which were also recorded as instructional videos) promoting urban agriculture. These classes did not spark a community farm movement in Richmond—they affirmed an already burgeoning movement. Renew Richmond, a local nonprofit established in 2009, has partnered with four Southside public schools to build community gardens on unused space. The Get Fresh! Task Force, the Richmond City Health District, and the Bon Secours Virginia Health System are providing financial incentives to the owners of corner stores in food deserts to carry healthy food and fresh fruits and vegetables.139 Tri-cycle Gardens, a local nonprofit, has not only developed urban agriculture throughout Richmond but is bringing locally grown fruit and vegetables to local convenience stores.140 These initiatives, which often combine the public, private, and nonprofit sectors, have transformed dozens of vacant lots in Church Hill, the Museum District, and the East End into community gardens. More importantly, Richmond’s attempts to become a greener city and to address crises like food insecurity have changed the city’s ac-tual physical character. Underutilized urban spaces that have been converted by urban agriculturists and RVAgreen are now being used by local residents for recreational purposes and general sustainabil-ity. In this sense, Richmonders have turned vacant, languishing areas in assets.
P A R T I I I : C O N C L U S I O N
Present-day Richmond’s primary inheritance is the central role the city has played in American his-tory—in particular, the events of the colonial era, the Revolutionary War, the Civil War, and even the civil rights movement. Richmond’s human ecology, the ways people relate to one another, continues to be shaped by long-standing rituals, practices, and norms. Virginians and Richmonders played an inte-gral role in the establishment of the American democratic experiment. Many of these historical actors, however, were also connected to the development of American slavery and the harsh inequalities en-gendered by human bondage. Institutionalized racism put in place during the mid-twentieth century continues to define Richmond’s identity and purpose. Until the not-so-distant past, local powerbrokers often did the bare minimum to address social vulnerability and need; they frequently neglected or purposefully underdeveloped many of Richmond’s black enclaves. Contemporary Richmonders are the legatees, willing or otherwise, of this legacy, and they have found it difficult to meet the challenge of the rampant poverty that is, in large part, an outcome of this legacy. Yet recently, the city has started making genuine progress toward ameliorating institutionalized racism and the related problem of persistent poverty. There is, however, still work to be done.
The realm of knowledge, especially education, has been—and continues to be—one of the most volatile issues in Richmond. Local government and the city’s institutions of higher learning have only recent-ly started to address deep disparities in educational social need. Unfortunately, the concentration of poverty in areas such as public housing has made broad-based public school reforms difficult. Organi-zations in Richmond’s nonprofit sector, however, are starting to directly address these issues. Not only
PROFILE OF METRO RICHMOND / Thriving Cities P A G E 2 6
have the city’s nonprofit organizations recently broken away from enduring patterns of racial segre-gation and exclusivity; many of these organizations are at the vanguard of social change. Richmond’s heritage industry has also played a major (and controversial) role in revamping the city’s historic and beautiful built environment and other aspects of its heritage. During the mid-twentieth century, local residents watched (and, in some cases, instigated) the deterioration of many of Richmond’s most visu-ally appealing enclaves. Through public and private initiatives, these areas are slowly coming back to life. While the Richmond Metropolitan Area has grown economically, it has generally failed to distrib-ute that growth equally. Structural economic and political forces (e.g., the Dillon Rule, a particularly conservative General Assembly that is generally unresponsive to urban crises, and suburbanization) continue to shape the strategies policymakers devise to meet Richmond’s challenges. Indeed, these forces often dictate not merely where people continue to live, but also the types of public health and food services they receive.
In terms of the common good and Richmond’s ability to thrive, local people have met the capital city’s old problems with novel strategies. In fact, Richmond has done much in the way of moving beyond its hyper-racial past, and Richmonders, who have often been wary of plans like Revitalize RVA because of the historical legacy of failed “silver-bullet” strategies, seem to understand that the area’s problem with poverty has reached critical mass. The city’s ability to more equitably distribute endowments can make Richmond a laboratory for the future. As Latinos move into the area, race in Richmond is no longer a black and white issue. The American Community Survey estimates that Richmond’s Latino/Hispan-ic population numbers 46,000. Nearly 38 percent of the city’s Latino/Hispanic population, however, lives below the poverty line.141 Richmonders’ capacity to negotiate twenty-first-century pluralism is of paramount importance to the city’s vitality. City government, nonprofits, and everyday people have moved away from the city’s legacy of paternalistic volunteerism, racial exclusivity, and the politics of segregation. The new approaches they are taking will dictate how well Virginia’s capital city thrives in the future.
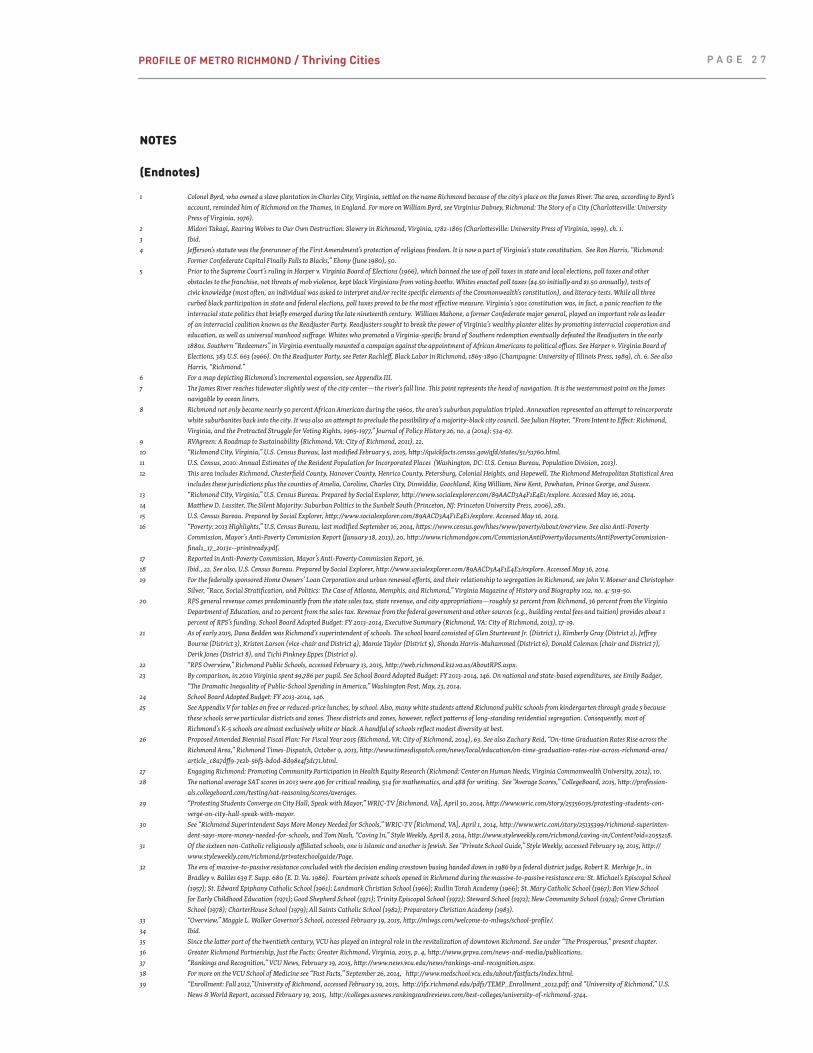
PROFILE OF METRO RICHMOND / Thriving Cities P A G E 2 7
NOTES
(Endnotes)
1 Colonel Byrd, who owned a slave plantation in Charles City, Virginia, settled on the name Richmond because of the city’s place on the James River. The area, according to Byrd’s account, reminded him of Richmond on the Thames, in England. For more on William Byrd, see Virginius Dabney, Richmond: The Story of a City (Charlottesville: University Press of Virginia, 1976).
2 Midori Takagi, Rearing Wolves to Our Own Destruction: Slavery in Richmond, Virginia, 1782-1865 (Charlottesville: University Press of Virginia, 1999), ch. 1. 3 Ibid. 4 Jefferson’s statute was the forerunner of the First Amendment’s protection of religious freedom. It is now a part of Virginia’s state constitution. See Ron Harris, “Richmond:
Former Confederate Capital Finally Falls to Blacks,” Ebony (June 1980), 50.5 Prior to the Supreme Court’s ruling in Harper v. Virginia Board of Elections (1966), which banned the use of poll taxes in state and local elections, poll taxes and other
obstacles to the franchise, not threats of mob violence, kept black Virginians from voting booths. Whites enacted poll taxes ($4.50 initially and $1.50 annually), tests of civic knowledge (most often, an individual was asked to interpret and/or recite specific elements of the Commonwealth’s constitution), and literacy tests. While all three curbed black participation in state and federal elections, poll taxes proved to be the most effective measure. Virginia’s 1901 constitution was, in fact, a panic reaction to the interracial state politics that briefly emerged during the late nineteenth century. William Mahone, a former Confederate major general, played an important role as leader of an interracial coalition known as the Readjuster Party. Readjusters sought to break the power of Virginia’s wealthy planter elites by promoting interracial cooperation and education, as well as universal manhood suffrage. Whites who promoted a Virginia-specific brand of Southern redemption eventually defeated the Readjusters in the early 1880s. Southern “Redeemers” in Virginia eventually mounted a campaign against the appointment of African Americans to political offices. See Harper v. Virginia Board of Elections, 383 U.S. 663 (1966). On the Readjuster Party, see Peter Rachleff, Black Labor in Richmond, 1865-1890 (Champagne: University of Illinois Press, 1989), ch. 6. See also Harris, “Richmond.”
6 For a map depicting Richmond’s incremental expansion, see Appendix III.7 The James River reaches tidewater slightly west of the city center—the river’s fall line. This point represents the head of navigation. It is the westernmost point on the James
navigable by ocean liners. 8 Richmond not only became nearly 50 percent African American during the 1960s, the area’s suburban population tripled. Annexation represented an attempt to reincorporate
white suburbanites back into the city. It was also an attempt to preclude the possibility of a majority-black city council. See Julian Hayter, “From Intent to Effect: Richmond, Virginia, and the Protracted Struggle for Voting Rights, 1965-1977,” Journal of Policy History 26, no. 4 (2014): 534-67.
9 RVAgreen: A Roadmap to Sustainability (Richmond, VA: City of Richmond, 2011), 22.10 “Richmond City, Virginia,” U.S. Census Bureau, last modified February 5, 2015, http://quickfacts.census.gov/qfd/states/51/51760.html.11 U.S. Census, 2010: Annual Estimates of the Resident Population for Incorporated Places (Washington, DC: U.S. Census Bureau, Population Division, 2013). 12 This area includes Richmond, Chesterfield County, Hanover County, Henrico County, Petersburg, Colonial Heights, and Hopewell. The Richmond Metropolitan Statistical Area
includes these jurisdictions plus the counties of Amelia, Caroline, Charles City, Dinwiddie, Goochland, King William, New Kent, Powhatan, Prince George, and Sussex. 13 “Richmond City, Virginia,” U.S. Census Bureau. Prepared by Social Explorer, http://www.socialexplorer.com/89AACD3A4F1E4E1/explore. Accessed May 16, 2014.14 Matthew D. Lassiter, The Silent Majority: Suburban Politics in the Sunbelt South (Princeton, NJ: Princeton University Press, 2006), 281. 15 U.S. Census Bureau. Prepared by Social Explorer, http://www.socialexplorer.com/89AACD3A4F1E4E1/explore. Accessed May 16, 2014.16 “Poverty: 2013 Highlights,” U.S. Census Bureau, last modified September 16, 2014, https://www.census.gov/hhes/www/poverty/about/overview. See also Anti-Poverty
Commission, Mayor’s Anti-Poverty Commission Report (January 18, 2013), 20, http://www.richmondgov.com/CommissionAntiPoverty/documents/AntiPovertyCommission-final1_17_2013c--printready.pdf.
17 Reported in Anti-Poverty Commission, Mayor’s Anti-Poverty Commission Report, 36. 18 Ibid., 22. See also, U.S. Census Bureau. Prepared by Social Explorer, http://www.socialexplorer.com/89AACD3A4F1E4E1/explore. Accessed May 16, 2014.19 For the federally sponsored Home Owners’ Loan Corporation and urban renewal efforts, and their relationship to segregation in Richmond, see John V. Moeser and Christopher
Silver, “Race, Social Stratification, and Politics: The Case of Atlanta, Memphis, and Richmond,” Virginia Magazine of History and Biography 102, no. 4: 519-50.20 RPS general revenue comes predominantly from the state sales tax, state revenue, and city appropriations—roughly 52 percent from Richmond, 36 percent from the Virginia
Department of Education, and 10 percent from the sales tax. Revenue from the federal government and other sources (e.g., building rental fees and tuition) provides about 1 percent of RPS’s funding. School Board Adopted Budget: FY 2013-2014, Executive Summary (Richmond, VA: City of Richmond, 2013), 17-19.
21 As of early 2015, Dana Bedden was Richmond’s superintendent of schools. The school board consisted of Glen Sturtevant Jr. (District 1), Kimberly Gray (District 2), Jeffrey Bourne (District 3), Kristen Larson (vice-chair and District 4), Mamie Taylor (District 5), Shonda Harris-Muhammed (District 6), Donald Coleman (chair and District 7), Derik Jones (District 8), and Tichi Pinkney Eppes (District 9).
22 “RPS Overview,” Richmond Public Schools, accessed February 13, 2015, http://web.richmond.k12.va.us/AboutRPS.aspx.23 By comparison, in 2010 Virginia spent $9,786 per pupil. See School Board Adopted Budget: FY 2013-2014, 146. On national and state-based expenditures, see Emily Badger,
“The Dramatic Inequality of Public-School Spending in America,” Washington Post, May, 23, 2014. 24 School Board Adopted Budget: FY 2013-2014, 146.25 See Appendix V for tables on free or reduced-price lunches, by school. Also, many white students attend Richmond public schools from kindergarten through grade 5 because
these schools serve particular districts and zones. These districts and zones, however, reflect patterns of long-standing residential segregation. Consequently, most of Richmond’s K-5 schools are almost exclusively white or black. A handful of schools reflect modest diversity at best.
26 Proposed Amended Biennial Fiscal Plan: For Fiscal Year 2015 (Richmond, VA: City of Richmond, 2014), 63. See also Zachary Reid, “On-time Graduation Rates Rise across the Richmond Area,” Richmond Times-Dispatch, October 9, 2013, http://www.timesdispatch.com/news/local/education/on-time-graduation-rates-rise-across-richmond-area/article_c8a7dff9-7e2b-56f5-bd0d-8d98e4f3dc71.html.
27 Engaging Richmond: Promoting Community Participation in Health Equity Research (Richmond: Center on Human Needs, Virginia Commonwealth University, 2012), 10.28 The national average SAT scores in 2013 were 496 for critical reading, 514 for mathematics, and 488 for writing. See “Average Scores,” CollegeBoard, 2015, http://profession-
als.collegeboard.com/testing/sat-reasoning/scores/averages.29 “Protesting Students Converge on City Hall, Speak with Mayor,” WRIC-TV [Richmond, VA], April 30, 2014, http://www.wric.com/story/25356035/protesting-students-con-
verge-on-city-hall-speak-with-mayor.30 See “Richmond Superintendent Says More Money Needed for Schools,” WRIC-TV [Richmond, VA], April 1, 2014, http://www.wric.com/story/25135399/richmond-superinten-
dent-says-more-money-needed-for-schools, and Tom Nash, “Caving In,” Style Weekly, April 8, 2014, http://www.styleweekly.com/richmond/caving-in/Content?oid=2055218.31 Of the sixteen non-Catholic religiously affiliated schools, one is Islamic and another is Jewish. See “Private School Guide,” Style Weekly, accessed February 19, 2015, http://
www.styleweekly.com/richmond/privateschoolguide/Page.32 The era of massive-to-passive resistance concluded with the decision ending crosstown busing handed down in 1986 by a federal district judge, Robert R. Merhige Jr., in
Bradley v. Baliles 639 F. Supp. 680 (E. D. Va. 1986). Fourteen private schools opened in Richmond during the massive-to-passive resistance era: St. Michael’s Episcopal School (1957); St. Edward Epiphany Catholic School (1961); Landmark Christian School (1966); Rudlin Torah Academy (1966); St. Mary Catholic School (1967); Bon View School for Early Childhood Education (1971); Good Shepherd School (1971); Trinity Episcopal School (1972); Steward School (1972); New Community School (1974); Grove Christian School (1978); CharterHouse School (1979); All Saints Catholic School (1982); Preparatory Christian Academy (1983).
33 “Overview,” Maggie L. Walker Governor’s School, accessed February 19, 2015, http://mlwgs.com/welcome-to-mlwgs/school-profile/.34 Ibid. 35 Since the latter part of the twentieth century, VCU has played an integral role in the revitalization of downtown Richmond. See under “The Prosperous,” present chapter. 36 Greater Richmond Partnership, Just the Facts: Greater Richmond, Virginia, 2015, p. 4, http://www.grpva.com/news-and-media/publications.37 “Rankings and Recognition,” VCU News, February 19, 2015, http://www.news.vcu.edu/news/rankings-and-recognition.aspx.38 For more on the VCU School of Medicine see “Fast Facts,” September 26, 2014, http://www.medschool.vcu.edu/about/fastfacts/index.html.39 “Enrollment: Fall 2012,”University of Richmond, accessed February 19, 2015, http://ifx.richmond.edu/pdfs/TEMP_Enrollment_2012.pdf; and “University of Richmond,” U.S.
News & World Report, accessed February 19, 2015, http://colleges.usnews.rankingsandreviews.com/best-colleges/university-of-richmond-3744.
PROFILE OF METRO RICHMOND / Thriving Cities P A G E 2 8
40 National Association of College and University Business Offices and Commonfund Institute, U.S. and Canadian Institutions Listed by Fiscal Year 2013 Endowment Market Value and Change in Endowment Market Value from FY 2012 to FY 2013, 2014, p. 2, http://www.nacubo.org/Documents/EndowmentFiles/2013NCSEEndowmentMarket%20ValuesRevisedFeb142014.pdf.
41 UR Downtown is home to four community-based programs: the Richmond Families Initiative, the Harry L. Carrico Center for Pro Bono Service, the Jeanette S. Lipman Family Law Clinic, and Partners in the Arts.
42 Anti-Poverty Commission, Mayor’s Anti-Poverty Commission Report, 44. For more on Communities in Schools, see the organization’s website, http://www.cisofrichmond.org. For more on its relationship with the Jepson School of Leadership Studies, see “Justice and Civil Society Course Information,” accessed March 6, 2015, http://jepson.richmond.edu/academics/practice/justice-students.html.
43 Anti-Poverty Commission, Mayor’s Anti-Poverty Commission Report, 44.44 Robert A. Pratt, The Color of Their Skin: Education and Race in Richmond, Virginia, 1954-1989 (Charlottesville: University of Virginia Press, 1992), xii, xiii. 45 Ibid., 36. 46 After promoting the “Southern Manifesto,” a declaration of opposition to racial integration, U.S. senator Harry F. Byrd, then a Democrat representing Virginia, called in
1956 for massive resistance to public school integration. White flight to Richmond’s suburbs became a prominent form of that resistance. On Byrd and massive resistance, see Ronald L. Heinemann, Harry Byrd of Virginia (Charlottesville: University Press of Virginia, 1996).
47 Matthew D. Lassiter, The Silent Majority: Suburban Politics in the Sunbelt South (Princeton, NJ: Princeton University Press, 2006), 281. 48 Pratt, The Color of Their Skin, xi.49 During Warren Burger’s tenure as chief justice (1969-86), the U.S. Supreme Court affirmed these segregationist prerogatives in a 1974 case, Milliken v. Bradley (418 U.S.
717), which had its origins in the Detroit metropolitan area. The Court’s decision in Milliken was the first to reverse school desegregation since Brown v. Board of Education of Topeka (1954). In Milliken, the Court disallowed busing across district lines, ruling that desegregation was not necessary if there were no actual laws in place legalizing segregation. One of the most significant effects of the decision was to relieve suburban school districts of the responsibility of assisting in the desegregation of urban schools. For a summary of Chesterfield County census data, see U.S. Census Bureau, http://quickfacts.census.gov/qfd/states/51/51041.html. For a summary of Henrico County data, see http://quickfacts.census.gov/qfd/states/51/51087.html.
50 “Our School Division,” Chesterfield County Public Schools, accessed February 19, 2015, http://mychesterfieldschools.com/about.51 School Board Adopted Budget: FY 2013-2014, Executive Summary (Richmond, VA: City of Richmond, 2013), 11. 52 Tina Griego, “The Former Capital of the Confederacy’s All-Out Plan to Fight Poverty—and Confront Its Past,” Washington Post, September 2, 2014. 53 Ibid. 54 A significant portion of the 2013 Mayor’s Anti-Poverty Commission Report concerns Richmond’s educational crisis. Specifically, the Anti-Poverty Commission argued that
education and work-force development should be the strategy to address RPS’s current dilemma. See Anti-Poverty Commission, Mayor’s Anti-Poverty Commission Report, 39-49.
55 Anti-Poverty Commission, Mayor’s Anti-Poverty Commission Report, 45-48.56 Lester M. Salamon and Stephanie L. Geller, Virginia’s Nonprofit Sector: Shaping the Economic, Cultural, and Social Landscape, (Baltimore, MD, and Richmond, VA: Johns
Hopkins Center for Civil Society Studies, Community Foundation, Virginia Commonwealth University, 2012), 56. 57 Social Explorer-RCMS 2010, accessed May 19, 2014, http://www.socialexplorer.com/tables/RCMS_2010/R10743144.58 Ibid.59 The number of African American adherents appears to be demonstrably lower than the total number of African Americans in Richmond. 60 “U.S. Religious Census 1952 to 2010,” Religious Congregations and Membership Study, accessed May 19, 2014, http://www.rcms2010.org/maps2010.php.61 J. Douglas Smith, Managing White Supremacy: Race, Politics, and Citizenship in Jim Crow Virginia (Chapel Hill: University of North Carolina Press, 2002), ch. 4.62 On historically black colleges and universities and white benefactors, see Raymond Gavins, The Perils and Prospects of Southern Black Leadership: Gordon Blaine Hancock,
1884-1970 (Durham, NC: Duke University Press, 1993).63 Smith, Managing White Supremacy, 5. 64 Ibid., 9.65 Salamon and Geller, Virginia’s Nonprofit Sector, 56. 66 Ibid., 58.67 For more on CrossOver, see http://www.crossoverministry.org.68 Ireti Adesanya, “Richmond Ranks High in Income Inequality,” December 20, 2013, VCU School of Mass Communications, http://mmj.vcu.edu/2013/12/20/how-income-in-
equality-divides-richmond.69 Master Plan for the Revitalization of North Jackson Ward (Richmond, VA: Richmond Redevelopment and Housing Authority, 2009), ii.70 Annual Report: July 2012-June 2013 (Richmond, VA: Peter Paul Development Center, 2013), 12. 71 Griego, “The Former Capital of the Confederacy’s All-Out Plan.”72 Laura Kebede, “Richmond by the Lists—City Garners Attention from Afar,” Richmond Times-Dispatch, July 14, 2014, http://www.timesdispatch.com/entertainment-life/
richmond-by-the-lists-city-garners-attention-from-afar/article_b87c0462-3eb1-505b-9119-3c929e9ae194.html. 73 On Richmond being a new top destination see “Frommer’s Top Destinations for 2014,” accessed February 19, 2015, http://www.frommers.com/slideshows/847926-frommer-s-
top-destinations-for-2014#slide848252. On modern Southern dining, see “Where to Eat in the South in 2012,” Deep South Magazine,” February 13, 2012, http://deepsouthmag.com/2012/02/where-to-eat-in-the-south-in-2012/.
74 Karri Peifer, “Yup, Richmond’s Restaurant Scene Is Over-Saturated—Sort Of,” Richmond Times-Dispatch, September 16, 2013, http://www.richmond.com/food-drink/dish/article_377718e4-1cb7-11e3-9434-001a4bcf6878.html.
75 John Accordino and Ivan Suen, Richmond, Virginia: A Downtown Profile (Richmond, VA: City of Richmond, 2013), 40. 76 “The Lost Cause of the Confederacy” is an interpretation of the American Civil War that gained momentum soon after the conflict ended. The Lost Cause romanticizes the
Confederate war effort, the Southern slave system, and antebellum cultural mores. Reevaluation of this perspective on the Civil War, in particular under the Museum of the Confederacy’s current president, Waite Rawls III, is discussed by Edward Rothstein in “The South Reinterprets Its ‘Lost Cause,’” New York Times, December 5, 2011, http://www.nytimes.com/2011/12/06/arts/design/museum-of-the-confederacy-and-others-depict-the-lost-cause.html?pagewanted=all&_r=0.
77 RVAgreen, 67.78 Ibid., 48-50.79 “Open Space and Land Use,” City of Richmond, accessed February 19, 2015, http://www.richmondgov.com/sustainability/OpenSpaceAndLandUse.aspx.80 Matthew Mace Barbee, Race and Masculinity in Southern Memory: History of Richmond, Virginia’s Monument Avenue, 1948-1996 (New York, NY: Lexington Books, 2014). 81 To meet the challenges of industrialization and urban density, Richmond’s industrialists often allowed slaves to live apart from their masters. Prior to the Civil War,
Richmond’s slaves developed black enclaves in areas like Shockoe Creek near the city’s center on the James River. These enclaves were often near the point of production. They arose from the process of black laborers hiring themselves out—slaveowners allowed African Americans to contract their labor with other owners of the means of production. In time, slaveowners found it economically advantageous to let slaves live near their workplaces. This process gave rise to a kind of relative mobility, and eventually engendered a sense of African American autonomy. Many free blacks not only lived in these areas; they also preserved kinship networks and established places of worship and business in them. On Richmond’s slave community, see Takagi, Rearing Wolves to Our Own Destruction, chs. 1 and 2. See also Anti-Poverty Commission, Mayor’s Anti-Poverty Commission Report, 20.
82 For more on Jackson Ward, see Christopher Silver and John V. Moeser, The Separate City: Black Communities in the Urban South, 1940-1968 (Lexington: University of Kentucky Press, 1995).
83 Master Plan for the Revitalization of North Jackson Ward, ii. 84 Virginia Commonwealth University, VCU Library Digital Collections, Jackson Ward District, accessed May 20, 2014, http://dig.library.vcu.edu/cdm/landingpage/collection/
jwh.85 Accordino and Suen, Richmond, Virginia: A Downtown Profile, 23. 86 Ibid., 46.87 Ibid., 2, 3. 88 The Hippodrome is not without major detractors. For more on the Hippodrome controversy, see Brent Baldwin, “Hungry for the Hippodrome,” Style Weekly, March 27, 2012,
http://www.styleweekly.com/richmond/hungry-for-the-hippodrome/Content?oid=1691419.89 Accordino and Suen, Richmond, Virginia: A Downtown Profile, 53.
PROFILE OF METRO RICHMOND / Thriving Cities P A G E 2 9
90 Greater Richmond Partnership, Just the Facts, 3. 91 “Snapshot of Individuals and Families Experiencing Homelessness,” Homeward, accessed May 22, 2014, http://www.homewardva.org/researchdata.92 Four Fortune 1000 companies are located in the Greater Richmond Region—Brinks, Markel, Universal, and NewMarket. See “Fortune 1000 Companies,” Greater Richmond,
Virginia, USA, accessed May 21, 2014, http://www.grpva.com/data-and-downloads/employers/fortune-1000.93 “Top Private Employers,” Greater Richmond, Virginia, USA, accessed February 22, 2015, http://www.grpva.com/data-and-downloads/employers/top-private-employers.94 “Top Public Employers,” Greater Richmond, Virginia, USA, accessed February 22, 2015, http://www.grpva.com/data-and-downloads/employers/top-public-employers/.95 “Cost of Living,” Greater Richmond, Virginia, USA, accessed May 21, 2014, http://www.grpva.com/living-in-richmond/cost-of-living.96 “State and Local Taxes,” City of Richmond, accessed May 21, 2014, http://www.yesrichmondva.com/data-center/Taxes.97 “Top Public Employers.” Greater Richmond, Virginia, USA. 98 Griego, “The Former Capital of the Confederacy’s All-Out Plan.”99 Michele Davis Jones, “The Rules of the Game and Who Governs: Municipal Reform and Re-Reform in Norfolk, Virginia.” PhD diss., University of Virginia, 2006, 18.100 On regime politics, see Clarence Stone, Regime Politics: Governing Atlanta, 1946-1988 (Lawrence: University Press of Kansas, 1989), 4-6.101 Ben Campbell, “All Aboard?,” Style Weekly, August 14, 2012, http://www.styleweekly.com/richmond/all-aboard/Content?oid=1745053.102 Adie Tomer, Elizabeth Kneebone, Robert Puentes, and Alan Berbue, Missed Opportunity: Transit and Jobs in Metropolitan America (Washington, DC: Brookings Institution,
2011), 21. 103 Ibid., 40.104 Ibid., 9.105 Anti-Poverty Commission, Mayor’s Anti-Poverty Commission Report, 50-66.106 Griego, “The Former Capital of the Confederacy’s All-Out Plan.” 107 Ibid.108 Majority-minority districts are composed primarily of racial- or ethnic-minority voters. In at-large election systems, voters fill all contested seats on governing bodies. If
nine seats are up for grabs, voters cast ballots for their nine preferred candidates. These candidates must campaign throughout an entire jurisdiction (be it a city, county, or state). In single-member-district systems, cities are divided into geographical districts. Voters in each district cast votes for candidates in their district. On voting systems, see Chandler Davidson, ed., Minority Vote Dilution (Washington, DC: Howard University Press, 1989); Morgan Kousser, Colorblind Injustice: Minority Voting Rights and the Undoing of the Second Reconstruction (Chapel Hill: University of North Carolina Press, 1999); and Ruth P. Morgan, Governance by Decree: The Impact of Voting Rights in Dallas (Lawrence: University Press of Kansas, 2004).
109 For more on RPD and personnel, see Annual Report (Richmond, VA: Richmond Police Department, 2013), 4.110 Ibid., 23.111 Ibid., 24.112 Reed Williams, “Death Rate at Richmond Jail Far Outpaces National Average,” Richmond Times-Dispatch, July, 29, 2012, http://www.timesdispatch.com/news/death-rate-at-
richmond-jail-far-outpaces-national-average/article_44076889-1d71-5474-b232-6b17ea40930b.html.113 Annual Report, 21.114 “Election Results,” City of Richmond, accessed May 23, 2014, http://www.richmondgov.com/content/Registrar/ElectionResults.aspx.115 Ibid. 116 Ibid.117 Aloph Reed, Stirrings in the Jug: Black Politics in the Post-Segregation Era (Minneapolis: University of Minnesota Press, 1999), 79.118 For more on the organization of Richmond’s city government, see “Richmond City Council Overview,” City of Richmond, accessed February 19, 2015, http://www.richmondgov.
com/CityCouncil/about.aspx.119 “Revitalize RVA Economic Development Plan,” Mayor’s Office, Richmond, accessed May 23, 2014, http://www.richmondgov.com/Mayor/RevitalizeRVA.aspx.120 For more on Revitalize RVA, see “Revitalize RVA Economic Development Plan,” Mayor’s Office, Richmond.121 Revitalize RVA Economic Development Plan,” Mayor’s Office, Richmond. 122 The U.S. Department of Agriculture defines food deserts as “urban neighborhoods and rural towns without ready access to fresh, healthy, and affordable food. Instead of
supermarkets and grocery stores, these communities may have no food access or are served only by fast-food restaurants and convenience stores that offer few healthy, affordable food options. The lack of access contributes to a poor diet and can lead to higher levels of obesity and other diet-related diseases, such as diabetes and heart disease.” From U.S. Department of Agriculture, “Food Deserts,” accessed February 19, 2015, http://apps.ams.usda.gov/fooddeserts/foodDeserts.aspx.
123 City of Richmond Greenhouse Gas Emissions Inventory, Local Governments for Sustainability USA, March 2010, p. 38, http://www.richmondgov.com/sustainability/docu-ments/reportGreenhouseGasInventory.pdf.
124 RVAgreen, 15-16. 125 Ibid., 72. 126 “Richmond Wins EPA Grant for Brownfield Sites,” Richmond Times-Dispatch, June 23, 2013. 127 RVAgreen, 17-20, 22.128 Ibid., 10.129 Ibid.130 Salamon and Geller, Virginia’s Nonprofit Sector, 58. 131 See Appendix VI.132 Tammie Smith, “Richmond Infant Mortality, Teen Pregnancy Rates Decline,” Richmond Times-Dispatch, January18, 2013. See also “Child Health USA, 2013,” U.S. Department
of Health and Human Services, accessed May 24, 2014, http://mchb.hrsa.gov/chusa13/perinatal-health-status-indicators/p/infant-mortality.html.133 Richmond, Virginia, Food Policy Task Force, Report and Recommendations to Improve Food Access in the City, July 2013, p. 13, http://www.richmondgov.com/ProjectFoodPoli-
cyTaskForce/documents/FPTF_ReportJuly2013.pdf.134 On food deserts and public health as it relates to food and diet in Virginia, see Food Deserts in Virginia: Recommendations from the Food Desert Task Force (Richmond:
Virginia’s Food Desert Task Force, January 2014), 9.135 Richmond, Virginia, Food Policy Task Force, Report and Recommendations, 34, and Susan Clapp, “Food Deserts in Virginia,” Demographics Research Group at UVA, July 9,
2012, http://statchatva.org/2012/07/09/food-deserts-in-virginia.136 Richmond, Virginia, Food Policy Task Force, Report and Recommendations, 7, 8. 137 Ibid., 8. 138 Michael Paul Williams, “Fight Poverty with Urban Agriculture,” Richmond Times-Dispatch, October, 19, 2013.139 Clapp, “Food Deserts in Virginia,” .140 For more on Tricycle Gardens, see its website, http://tricyclegardens.org. See also Clapp, “Food Deserts in Virginia.”141 Tim Bowditch, “Special Report: Latino Struggles, Population Growth,” Richmond Times-Dispatch, January 17, 2013.
PROFILE OF METRO RICHMOND / Thriving Cities P A G E 3 0
P A R T I V : A P P E N D I C E S
APPENDIX I: RESEARCH AND DATA COLLECTION METHODS
This profile draws upon both historical and contemporary sources. The profile utilizes several bodies of historical scholarship, ranging from research in political science to historical examinations of Virginia and the Richmond region. Many of the secondary sources specifically focus on Richmond’s relationship to the process of trans-Atlantic slavery and Jim Crow segregation. A small number of these secondary sources outline Richmond’s centrality to tobacco production and the Southern slave system. These sources also interrogate the city’s central role in promoting the ideological underpinnings of white supremacy, promoting massive resistance to public school integration, accommodating white flight during the mid-twentieth century in the Sunbelt South, and enabling local backlash against the Voting Rights Act of 1965 and black enfranchisement. Much of the political science-based secondary material focuses on urban history, municipal politics, and American political development after 1945. These studies, more specifically, interrogate trends like urban renewal, the rise of African American elected officials, suburbanization, and urban decline, as well as the ways in which structural forces changed Americans cities in the late twentieth century. These sources, which are outlined immediately below, have shaped my understanding of Richmond’s history and how that history continues to influence the character of contemporary Richmond. In terms of primary source material, this effort draws from media sources, contemporary scholarly studies, court documents, census data, and, most importantly, official government documents from local and national administrations. Most of my conclusion about contemporary Richmond and Richmonders’ views about contemporary Richmond draw from contem-porary outlets like newspaper articles, webpages, and government documents. These sources often contain the opinions and views of contemporary Richmonders, their policymakers, and their media outlets. I have also used quantitative source material such as census data, government documents, and scholarly studies to better understand Richmond’s demography. I have, above all, tried to combine quantitative and qualitative data in a way that will better enable assessment of the quality of life in contemporary Richmond and over the course of the city’s history.
APPENDIX II: BIBLIOGRAPHY
I. Primary Source Material
a. Archival CollectionsVirginia Commonwealth University, James Cabell Branch Library: Special Collections, Eleanor P. Sheppard Papers, 1924-1978 (M277).Virginia Commonwealth University, VCU Library Digital Collections, Jackson Ward District. http://dig.library.vcu.edu/cdm/landingpage/collection/jwh.
b. Census DataU.S. Census, 2010: Annual Estimates of the Resident Population for Incorporated Places. Washing-ton, DC: U.S. Census Bureau, May 2013. U.S. Census Bureau and American Community Survey. Prepared by Social Explorer. http://www.socialexplorer.com/89AACD3A4F1E4E1/explore.
c. Newspapers/PeriodicalsEbony, “Richmond: Former Confederate Capital Finally Falls to Blacks.” June 1980. Newsweek, “2013 America’s Best High Schools,” May 6, 2013. http://www.newsweek.com/2013/05/06/america-s-best-high-schools New York Times, Edward Rothstein, “The South Reinterprets Its ‘Lost Cause,’” December 5, 2011. http://www.nytimes.com/2011/12/06/arts/design/museum-of-the-confederacy-and-others-
PROFILE OF METRO RICHMOND / Thriving Cities P A G E 3 1
depict-the-lost-cause.html?pagewanted=all&_r=0. Richmond News-Leader, [Map: Richmond expansions, pre-1970], September 9, 1964.
Richmond News-Leader, [Map: Richmond annexations], September, 9, 1968.Richmond Times-Dispatch, Michael Paul Williams, “Fight Poverty with Urban Agriculture,” October 19, 2013. Richmond Times-Dispatch, Tim Bowditch, “Special Report: Latino Struggles, Population Growth,” January 17, 2013.
Richmond Times-Dispatch, “Richmond Wins EPA Grant for Brownfield Sites,” June 23, 2013.Richmond Times-Dispatch, Tammie Smith, “Richmond Infant Mortality, Teen Pregnancy Rates Decline,” January 18, 2013.Richmond Times-Dispatch, Zachary Reid, “On-time Graduation Rates Rise across the Richmond Area,” October 9, 2013, http://www.timesdispatch.com/news/local/education/on-time-gradu-ation-rates-rise-across-richmond-area/article_c8a7dff9-7e2b-56f5-bd0d-8d98e4f3dc71.html.Richmond Times-Dispatch, Reid Williams, “Death Rate at Richmond Jail Far Outpaces National Average,” July 29, 2012, http://www.timesdispatch.com/news/death-rate-at-richmond-jail-far-outpaces-national-average/article_44076889-1d71-5474-b232-6b17ea40930b.html.Richmond Times-Dispatch, Laura Kebede, “Richmond by the Lists—City Garners Attention from Afar,” July 14, 2014, http://www.timesdispatch.com/entertainment-life/richmond-by-the-lists-city-garners-attention-from-afar/article_b87c0462-3eb1-505b-9119-3c929e9ae194.html.Style Weekly, Ben Campbell, “All Aboard?,” August 14, 2012, http://www.styleweekly.com/rich-mond/all-aboard/Content?oid=1745053.Style Weekly, “The Best Taxpayer-Funded Music Venue to Watch for Signs of Life,” no date, http://www.styleweekly.com/richmond/best-taxpayer-funded-music-venue-to-watch-for-signs-of-life/BestOf?oid=1713000.Style Weekly, Tom Nash, “Caving In,” April 8, 2014, http://www.styleweekly.com/richmond/caving-in/Content?oid=2055218.Style Weekly, Brent Baldwin, “Hungry for the Hippodrome,” March 27, 2012, http://www.styleweekly.com/richmond/hungry-for-the-hippodrome/Con-tent?oid=1691419.U.S. News & World Report, “University of Richmond,” 2015, http://colleges.usnews.rankingsan-dreviews.com/best-colleges/university-of-richmond-3744.Washington Post, Tina Griego, “The Former Capital of the Confederacy’s All-Out Plan to Fight Poverty—and Confront Its Past,” September 2, 2014.Washington Post, Emily Badger, “The Dramatic Inequality of Public-School Spending in Amer-ica,” May 23, 2014.WRIC-TV [Richmond, VA], “Protesting Students Converge on City Hall, Speak with Mayor,” April 30, 2014, http://www.wric.com/story/25356035/protesting-student-converge-on-city-hall-speak-with-mayor.WRIC-TV [Richmond, VA], “Richmond Superintendent Says More Money Needed for Schools,” April 1, 2014, http://www.wric.com/story/25135399/richmond-superinten-dent-says-more-money-needed-for-schools.
d. Court CasesBradley v. Baliles, 639 F. Supp. 680 (1986).Harper v. Virginia Board of Election, 383 U.S. 663 (1966). Milliken v. Bradley, 418 U.S. 717 (1974).
e. Webpageshttp://apps.ams.usda.gov/fooddeserts/foodDeserts.aspxhttp://www.bdcnetwork.com/richmond-centerstage-richmond-vahttps://www.census.gov/hhes/www/poverty/about/overview/http://www.cisofrichmond.orghttp://www.crossoverministry.orghttp://deepsouthmag.com/2012/02/where-to-eat-in-the-south-in-2012/http://downtown.richmond.edu/about/index.htmlhttp://www.ers.usda.gov/data-products/food-access-research-atlas/go-to-the-atlas.aspx#.U4CWyhZbpbw
PROFILE OF METRO RICHMOND / Thriving Cities P A G E 3 2
http://www.frommers.com/slideshows/847926-frommer-s-top-destinations-for-2014#slide848252. http://www.gjwn.net/news/2013/09/13/history-of-the-hipp/https://www.google.com/maps/place/Richmond,+VA/@37.524661,-
77.4932614,12z/data=!3m1!4b1!4m2!3m1!1s0x89b111095799c9ed:0xbfd83e6de2423cc5http://www.grpva.com/data-and-downloads/employers/fortune-1000/http://www.grpva.com/doing-business/labor-workforce/labor-datahttp://www.grpva.com/living-in-richmond/cost-of-living/http://www.grpva.com/news-and-media/publicationshttp://www.homewardva.org/researchdatahttp://ifx.richmond.edu/pdfs/TEMP_Enrollment_2012.pdfhttp://jepson.richmond.edu/academics/practice/justice-students.htmlhttp://www.lovingrva.comhttp://mchb.hrsa.gov/chusa13/perinatal-health-status-indicators/p/infant-mortality.htmlhttp://mychesterfieldschools.com/wp-content/uploads/2013-14profile.pdf?3aca0c. http://mlwgs.com/welcome-to-mlwgs/school-profile/http://mmj.vcu.edu/2013/12/20/how-income-inequality-divides-richmond/http://www.news.vcu.edu/news/rankings-and-recognition.aspxhttp://www.nps.gov/nr/travel/richmond/JacksonWardHD.htmlhttp://www.peterpauldevcenter.org/story/http://professionals.collegeboard.com/testing/sat-reasoning/scores/averageshttp://www.richmond.com/discover-richmond/article_9edc708d-a263-566e-90ee-533364b90652.htmlhttp://www.richmond.com/discover-richmond/article_990ed7e5-3eae-56ca-8e26-315541f8826d.html?-mode=image&photohttp://www.richmond.com/food-drink/dish/article_377718e4-1cb7-11e3-9434-001a4bcf6878.htmlhttp://www.richmondgov.com/sustainability/OpenSpaceAndLandUse.aspxhttp://365richmondva.wordpress.com/2010/04/29/day-44-monument-avenue/http://theatrehistoricalsociety.files.wordpress.com/2012/04/mosque-richmond-rich-times-dispatch-pic.jpghttp://quickfacts.census.gov/qfd/states/51/51041.htmlhttp://quickfacts.census.gov/qfd/states/51/51087.html http://quickfacts.census.gov/qfd/states/51/51760.html http://www.rcms2010.org/maps2010.phphttp://web.richmond.k12.va.us/AboutRPS.aspxhttp://www.richmondgov.com/CityCouncil/about.aspxhttp://www.richmondgov.com/content/Registrar/ElectionResults.aspxhttp://www.richmondgov.com/Mayor/RevitalizeRVA.aspxhttp://www.timmons.com/projects/movieland-at-boulevard-squarehttp://www.yesrichmondva.com/data-center/Taxes
f. Official Municipal Government MaterialsCity of Richmond. Anti-Poverty Commission. Mayor’s Anti-Poverty Commission Report, January 18, 2013.City of Richmond. Crime Rate in Richmond, Virginia. Last modified March 6, 2015, http://www.city-data.com/crime/crime-Richmond-Virginia.html.City of Richmond. Food Policy Task Force. Report and Recommendations to Improve Food Access in the City. July 2013. http://www.richmondgov.com/ProjectFoodPolicyTaskForce/documents/FPTF_ReportJu ly2013.pdf.City of Richmond. GIS Maps Library. Richmond Voter Districts.
http://eservices.ci.richmond.va.us/applications/maplibrary/maps/council_districts/Rich-mond_Voter_Districts_44x34.pdf.
City of Richmond. 2008 Greenhouse Gas Emissions Inventory. 2008. City of Richmond. Proposed Amended Biennial Fiscal Plan: For Fiscal Year 2015. 2014.City of Richmond. RVAgreen: A Roadmap to Sustainability. 2011. City of Richmond. School Board Adopted Budget: FY 2013-2014, Executive Summary. 2013.
PROFILE OF METRO RICHMOND / Thriving Cities P A G E 3 3
City of Richmond. Richmond Police Department, Annual Report, 2013. Richmond Public Schools. “RPS Free and Reduced Lunches 2008-2009.” Accessed March 6, 2015, http://newweb.richmond.k12.va.us/about-rps/statistics/freelunch2008-2009.aspx.Richmond Public Schools. “RPS Ethnic Statistics 2009-2010.” Accessed March 6, 2015, http://newweb.richmond.k12.va.us/about-rps/statistics/ethnic2009-2010.aspx.Richmond Redevelopment and Housing Authority. Master Plan for the Revitalization of North Jackson Ward. June 2009.
g. Other SourcesAccordino, John, and Suen, Ivan. Richmond, Virginia: A Downtown Profile. Richmond, VA: City of Richmond, 2013. Greater Richmond Partnership, Just the Facts: Greater Richmond, Virginia. 2015.National Association of College and University Business Offices and Commonfund Institute, U.S. and Canadian Institutions Listed by Fiscal Year 2013 Endowment Market Value and Change in Endowment Market Value from FY 2012 to FY 2013, 2014. http://www.nacubo.org/Documents/ EndowmentFiles/2013NCSEEndowmentMarket%20ValuesRevisedFeb142014.pdf.Salamon, Lester M., and Geller, Stephanie L., Virginia’s Nonprofit Sector: Shaping the Economic, Cultural, and Social Landscape. Baltimore, MD, and Richmond, VA: Johns Hopkins Center for Civil Society Studies, Community Foundation, Virginia Commonwealth University, 2012. Peter Paul Development Center, Annual Report: July 2012-June 2013, 2013.Virginia Commonwealth University. Engaging Richmond: Promoting Community Participation in Health Equity Research,
October 4, 2012. http://www.societyhealth.vcu.edu.Virginia Tech University and Virginia State University. Recommendation from the Food Desert Task Force. Food Deserts in Virginia. January 2014.
II. Secondary Source Material
a. BooksBarbee, Matthew Mace. Race and Masculinity in Southern Memory: History of
Richmond, Virginia’s Monument Avenue, 1948-1996. New York, NY: Lexington Books, 2014.Dabney, Virginius. Richmond: The Story of a City. Charlottesville: University Press of Virginia, 1976.Davidson, Chandler (ed.). Minority Vote Dilution. Washington, DC: Howard University Press, 1989.Gavins, Raymond. The Perils and Prospects of Southern Black Leadership: Gordon Blaine Hancock, 1884-1970. Durham, NC: Duke University Press.Heinemann, Ronald L. Harry Byrd of Virginia. Charlottesville: University Press of Virginia, 1996.Kousser, Morgan. Colorblind Injustice: Minority Voting Rights and the Undoing of the Second Reconstruction. Chapel Hill: University of North Carolina Press, 1999.Lassiter, Matthew D. The Silent Majority: Suburban Politics in the Sunbelt South. Princeton, NJ: Princeton University Press, 2006.Morgan, Ruth P. Governance by Decree: The Impact of Voting Rights in Dallas. Lawrence: University Press of Kansas, 2004.Pratt, Robert A. The Color of Their Skin: Education and Race in Richmond, Virginia, 1954-1989. Charlottesville: University of Virginia Press, 1992.Rachleff, Peter. Black Labor in Richmond, 1865-1890. Champagne: University of Illinois Press, 1989.Reed, Adolph. Stirrings in the Jug: Black Politics in the Post-Segregation Era. Minneapolis: University of Minnesota Press, 1999.Silver, Christopher, and Moeser, John V. The Separate City: Black Communities in the Urban South, 1940-1968. Lexington: University of Kentucky Press, 1995.Smith, J. Douglas. Managing White Supremacy: Race, Politics, and Citizenship in Jim Crow Virginia. Chapel Hill: University of North Carolina Press, 2002.Stone, Clarence. Regime Politics: Governing Atlanta, 1946-1988. Lawrence: University Press of Kansas, 1989.Takagi, Midori. Rearing Wolves to Our Own Destruction: Slavery in Richmond,
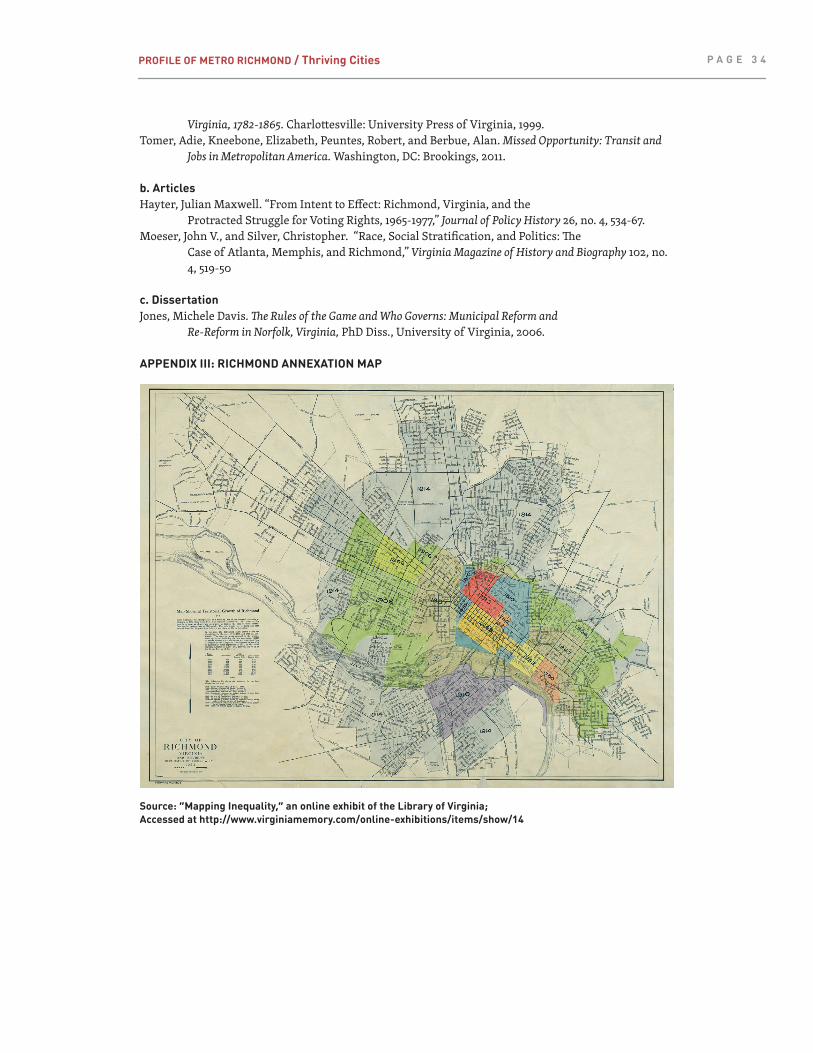
PROFILE OF METRO RICHMOND / Thriving Cities P A G E 3 4
Virginia, 1782-1865. Charlottesville: University Press of Virginia, 1999.Tomer, Adie, Kneebone, Elizabeth, Peuntes, Robert, and Berbue, Alan. Missed Opportunity: Transit and Jobs in Metropolitan America. Washington, DC: Brookings, 2011.
b. ArticlesHayter, Julian Maxwell. “From Intent to Effect: Richmond, Virginia, and the
Protracted Struggle for Voting Rights, 1965-1977,” Journal of Policy History 26, no. 4, 534-67.Moeser, John V., and Silver, Christopher. “Race, Social Stratification, and Politics: The
Case of Atlanta, Memphis, and Richmond,” Virginia Magazine of History and Biography 102, no. 4, 519-50
c. DissertationJones, Michele Davis. The Rules of the Game and Who Governs: Municipal Reform and Re-Reform in Norfolk, Virginia, PhD Diss., University of Virginia, 2006.
APPENDIX III: RICHMOND ANNEXATION MAP
Source: “Mapping Inequality,” an online exhibit of the Library of Virginia; Accessed at http://www.virginiamemory.com/online-exhibitions/items/show/14
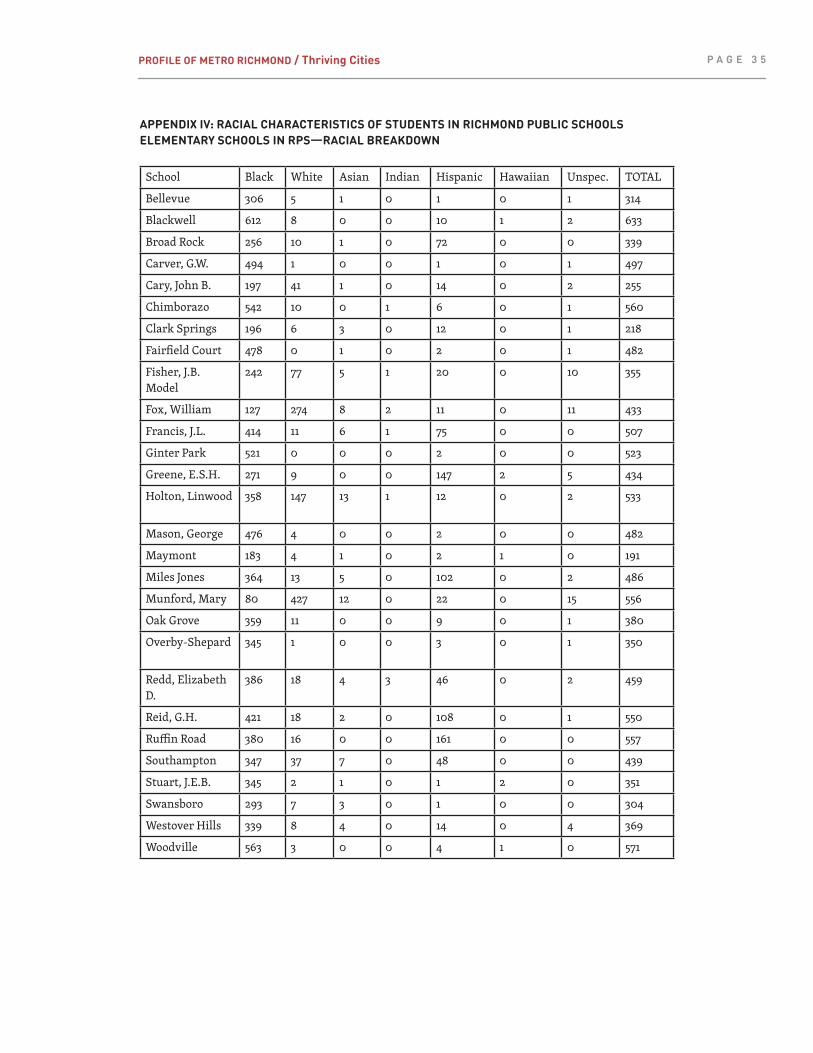
PROFILE OF METRO RICHMOND / Thriving Cities P A G E 3 5
APPENDIX IV: RACIAL CHARACTERISTICS OF STUDENTS IN RICHMOND PUBLIC SCHOOLSELEMENTARY SCHOOLS IN RPS—RACIAL BREAKDOWN
School Black White Asian Indian Hispanic Hawaiian Unspec. TOTAL
Bellevue 306 5 1 0 1 0 1 314
Blackwell 612 8 0 0 10 1 2 633
Broad Rock 256 10 1 0 72 0 0 339
Carver, G.W. 494 1 0 0 1 0 1 497
Cary, John B. 197 41 1 0 14 0 2 255
Chimborazo 542 10 0 1 6 0 1 560
Clark Springs 196 6 3 0 12 0 1 218
Fairfield Court 478 0 1 0 2 0 1 482
Fisher, J.B. Model
242 77 5 1 20 0 10 355
Fox, William 127 274 8 2 11 0 11 433
Francis, J.L. 414 11 6 1 75 0 0 507
Ginter Park 521 0 0 0 2 0 0 523
Greene, E.S.H. 271 9 0 0 147 2 5 434
Holton, Linwood 358 147 13 1 12 0 2 533
Mason, George 476 4 0 0 2 0 0 482
Maymont 183 4 1 0 2 1 0 191
Miles Jones 364 13 5 0 102 0 2 486
Munford, Mary 80 427 12 0 22 0 15 556
Oak Grove 359 11 0 0 9 0 1 380
Overby-Shepard 345 1 0 0 3 0 1 350
Redd, Elizabeth D.
386 18 4 3 46 0 2 459
Reid, G.H. 421 18 2 0 108 0 1 550
Ruffin Road 380 16 0 0 161 0 0 557
Southampton 347 37 7 0 48 0 0 439
Stuart, J.E.B. 345 2 1 0 1 2 0 351
Swansboro 293 7 3 0 1 0 0 304
Westover Hills 339 8 4 0 14 0 4 369
Woodville 563 3 0 0 4 1 0 571
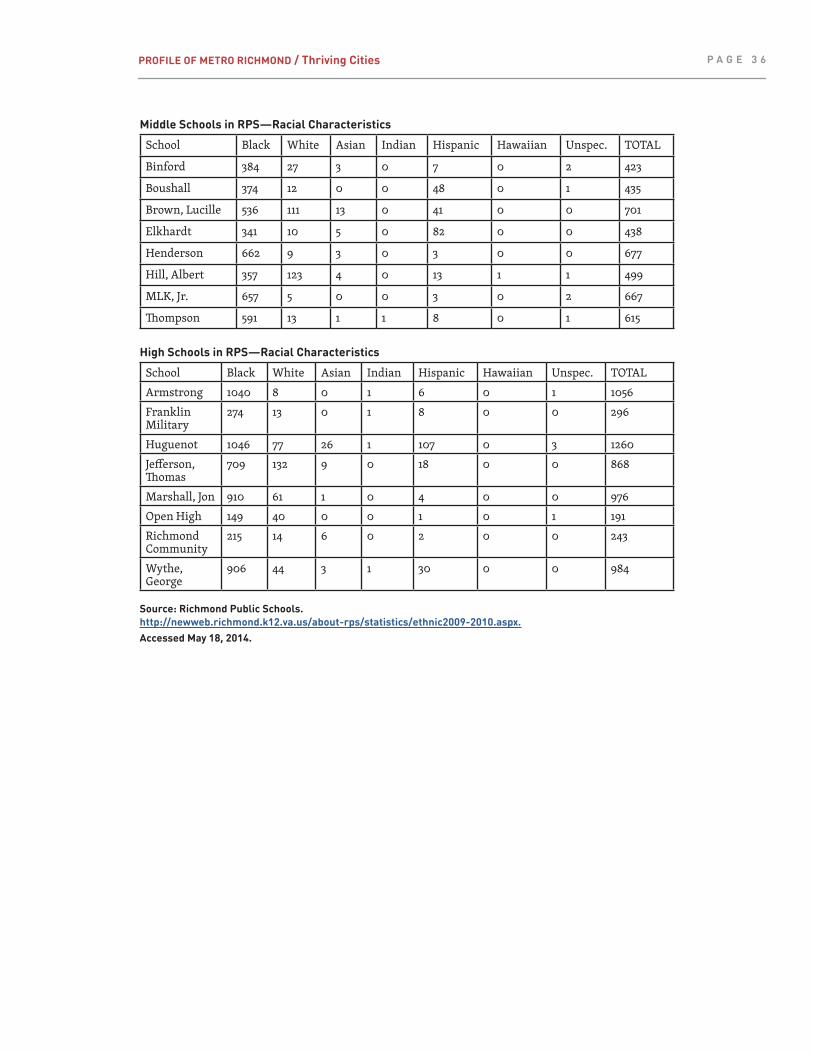
PROFILE OF METRO RICHMOND / Thriving Cities P A G E 3 6
Middle Schools in RPS—Racial Characteristics
School Black White Asian Indian Hispanic Hawaiian Unspec. TOTAL
Binford 384 27 3 0 7 0 2 423
Boushall 374 12 0 0 48 0 1 435
Brown, Lucille 536 111 13 0 41 0 0 701
Elkhardt 341 10 5 0 82 0 0 438
Henderson 662 9 3 0 3 0 0 677
Hill, Albert 357 123 4 0 13 1 1 499
MLK, Jr. 657 5 0 0 3 0 2 667
Thompson 591 13 1 1 8 0 1 615
High Schools in RPS—Racial Characteristics
School Black White Asian Indian Hispanic Hawaiian Unspec. TOTALArmstrong 1040 8 0 1 6 0 1 1056Franklin Military
274 13 0 1 8 0 0 296
Huguenot 1046 77 26 1 107 0 3 1260Jefferson, Thomas
709 132 9 0 18 0 0 868
Marshall, Jon 910 61 1 0 4 0 0 976Open High 149 40 0 0 1 0 1 191Richmond Community
215 14 6 0 2 0 0 243
Wythe, George
906 44 3 1 30 0 0 984
Source: Richmond Public Schools. http://newweb.richmond.k12.va.us/about-rps/statistics/ethnic2009-2010.aspx. Accessed May 18, 2014.
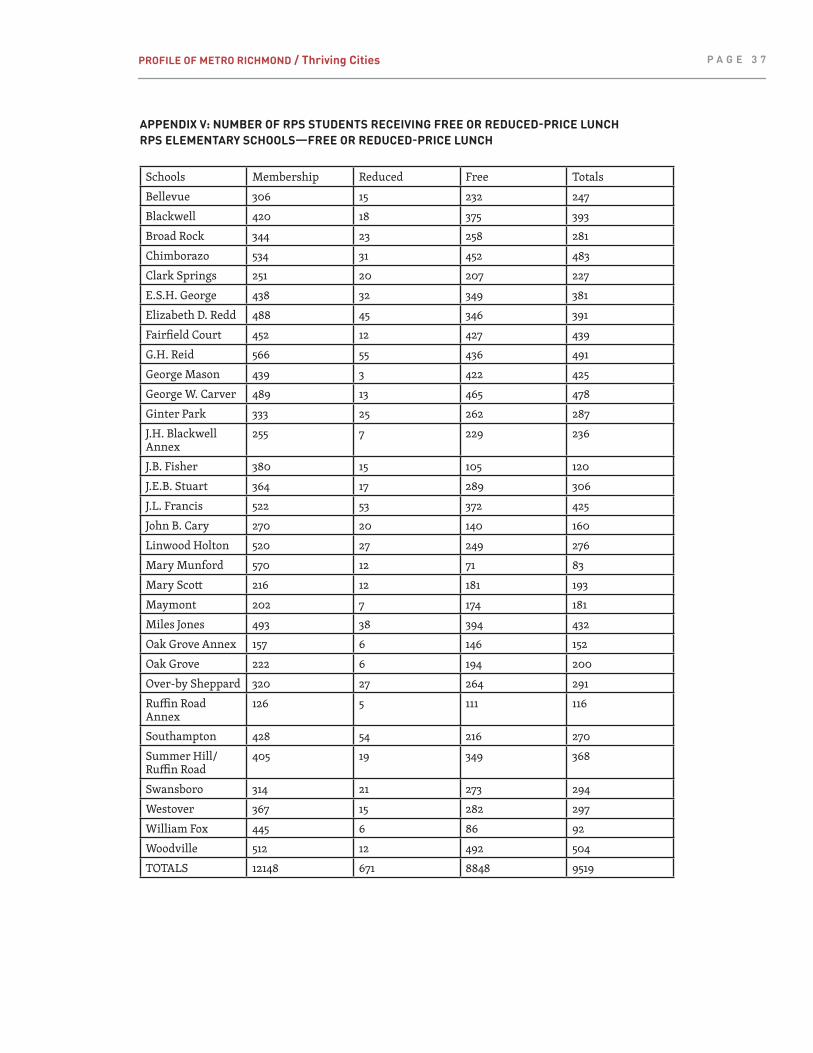
PROFILE OF METRO RICHMOND / Thriving Cities P A G E 3 7
APPENDIX V: NUMBER OF RPS STUDENTS RECEIVING FREE OR REDUCED-PRICE LUNCHRPS ELEMENTARY SCHOOLS—FREE OR REDUCED-PRICE LUNCH
Schools Membership Reduced Free TotalsBellevue 306 15 232 247Blackwell 420 18 375 393Broad Rock 344 23 258 281Chimborazo 534 31 452 483Clark Springs 251 20 207 227E.S.H. George 438 32 349 381Elizabeth D. Redd 488 45 346 391Fairfield Court 452 12 427 439G.H. Reid 566 55 436 491George Mason 439 3 422 425George W. Carver 489 13 465 478Ginter Park 333 25 262 287J.H. Blackwell Annex
255 7 229 236
J.B. Fisher 380 15 105 120J.E.B. Stuart 364 17 289 306J.L. Francis 522 53 372 425John B. Cary 270 20 140 160Linwood Holton 520 27 249 276Mary Munford 570 12 71 83Mary Scott 216 12 181 193Maymont 202 7 174 181Miles Jones 493 38 394 432Oak Grove Annex 157 6 146 152Oak Grove 222 6 194 200Over-by Sheppard 320 27 264 291Ruffin Road Annex
126 5 111 116
Southampton 428 54 216 270Summer Hill/ Ruffin Road
405 19 349 368
Swansboro 314 21 273 294Westover 367 15 282 297William Fox 445 6 86 92Woodville 512 12 492 504TOTALS 12148 671 8848 9519
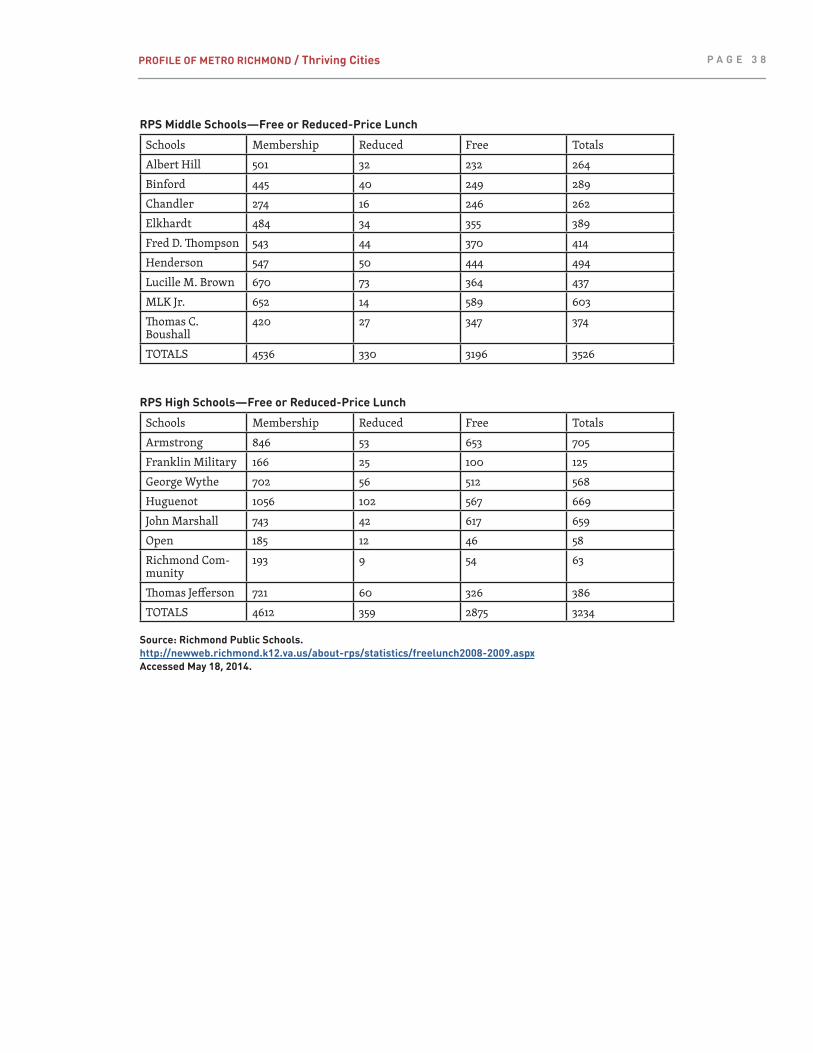
PROFILE OF METRO RICHMOND / Thriving Cities P A G E 3 8
RPS Middle Schools—Free or Reduced-Price Lunch
Schools Membership Reduced Free TotalsAlbert Hill 501 32 232 264Binford 445 40 249 289Chandler 274 16 246 262Elkhardt 484 34 355 389Fred D. Thompson 543 44 370 414Henderson 547 50 444 494Lucille M. Brown 670 73 364 437MLK Jr. 652 14 589 603Thomas C. Boushall
420 27 347 374
TOTALS 4536 330 3196 3526
RPS High Schools—Free or Reduced-Price Lunch
Schools Membership Reduced Free TotalsArmstrong 846 53 653 705Franklin Military 166 25 100 125George Wythe 702 56 512 568Huguenot 1056 102 567 669John Marshall 743 42 617 659Open 185 12 46 58Richmond Com-munity
193 9 54 63
Thomas Jefferson 721 60 326 386TOTALS 4612 359 2875 3234
Source: Richmond Public Schools. http://newweb.richmond.k12.va.us/about-rps/statistics/freelunch2008-2009.aspx Accessed May 18, 2014.
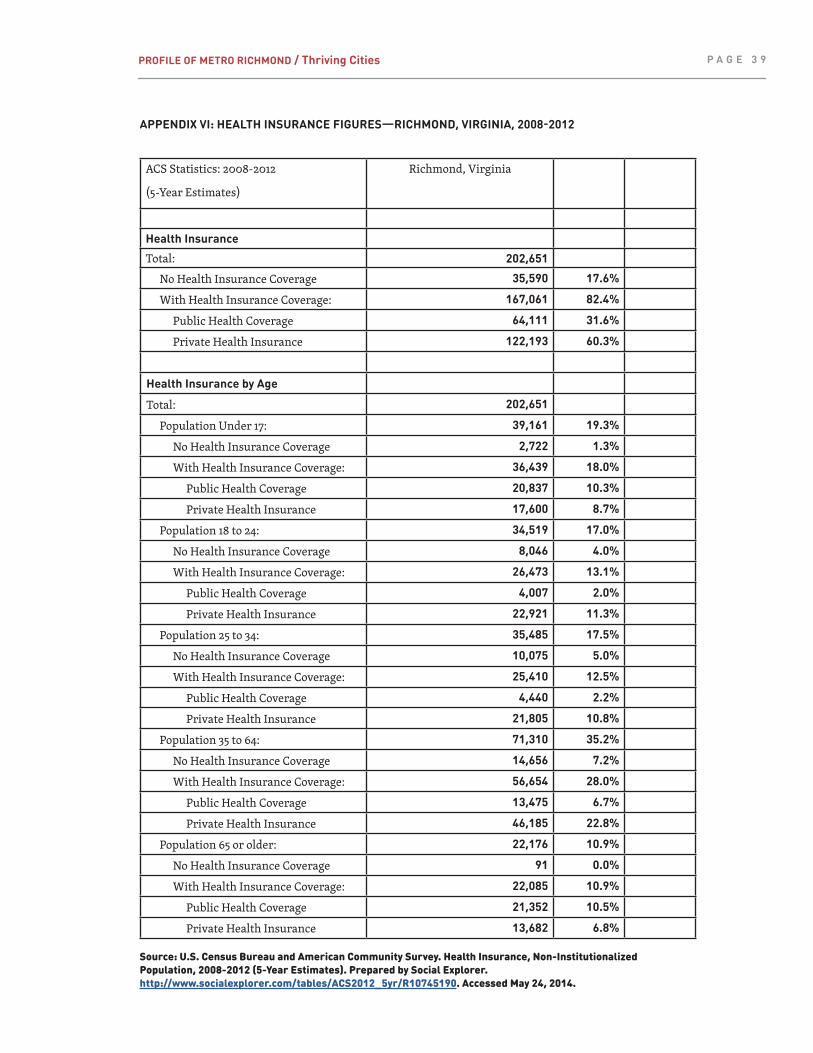
PROFILE OF METRO RICHMOND / Thriving Cities P A G E 3 9
APPENDIX VI: HEALTH INSURANCE FIGURES—RICHMOND, VIRGINIA, 2008-2012
ACS Statistics: 2008-2012
(5-Year Estimates)
Richmond, Virginia
Health Insurance Total: 202,651
No Health Insurance Coverage 35,590 17.6%
With Health Insurance Coverage: 167,061 82.4%
Public Health Coverage 64,111 31.6%
Private Health Insurance 122,193 60.3%
Health Insurance by Age
Total: 202,651
Population Under 17: 39,161 19.3%
No Health Insurance Coverage 2,722 1.3%
With Health Insurance Coverage: 36,439 18.0%
Public Health Coverage 20,837 10.3%
Private Health Insurance 17,600 8.7%
Population 18 to 24: 34,519 17.0%
No Health Insurance Coverage 8,046 4.0%
With Health Insurance Coverage: 26,473 13.1%
Public Health Coverage 4,007 2.0%
Private Health Insurance 22,921 11.3%
Population 25 to 34: 35,485 17.5%
No Health Insurance Coverage 10,075 5.0%
With Health Insurance Coverage: 25,410 12.5%
Public Health Coverage 4,440 2.2%
Private Health Insurance 21,805 10.8%
Population 35 to 64: 71,310 35.2%
No Health Insurance Coverage 14,656 7.2%
With Health Insurance Coverage: 56,654 28.0%
Public Health Coverage 13,475 6.7%
Private Health Insurance 46,185 22.8%
Population 65 or older: 22,176 10.9%
No Health Insurance Coverage 91 0.0%
With Health Insurance Coverage: 22,085 10.9%
Public Health Coverage 21,352 10.5%
Private Health Insurance 13,682 6.8%
Source: U.S. Census Bureau and American Community Survey. Health Insurance, Non-Institutionalized Population, 2008-2012 (5-Year Estimates). Prepared by Social Explorer. http://www.socialexplorer.com/tables/ACS2012_5yr/R10745190. Accessed May 24, 2014.