Embed Size (px)
Citation preview
City, University of London Institutional Repository
Citation: Hobby, A. E., Kozareva, D., Yonova-Doing, E., Hossain, I. T., Katta, M., Huntjens, B., Hammond, C. J., Binns, A. M. and Mahroo, O. A. (2018). Effect of varying skin surface electrode position on electroretinogram responses recorded using a handheld stimulating and recording system. Documenta Ophthalmologica, doi: 10.1007/s10633-018-9652-z
This is the published version of the paper.
This version of the publication may differ from the final published version.
Permanent repository link: http://openaccess.city.ac.uk/20346/
Link to published version: http://dx.doi.org/10.1007/s10633-018-9652-z
Copyright and reuse: City Research Online aims to make research outputs of City, University of London available to a wider audience. Copyright and Moral Rights remain with the author(s) and/or copyright holders. URLs from City Research Online may be freely distributed and linked to.
City Research Online: http://openaccess.city.ac.uk/ [email protected]
City Research Online

ORIGINAL RESEARCH ARTICLE
Effect of varying skin surface electrode positionon electroretinogram responses recorded using a handheldstimulating and recording system
Angharad E. Hobby . Diana Kozareva . Ekaterina Yonova-Doing .
Ibtesham T. Hossain . Mohamed Katta . Byki Huntjens . Christopher J. Hammond .
Alison M. Binns . Omar A. Mahroo
Received: 12 February 2018 / Accepted: 17 July 2018
� The Author(s) 2018
Abstract
Purpose A handheld device (the RETeval system,
LKC Technologies) aims to increase the ease of
electroretinogram (ERG) recording by using specially
designed skin electrodes, rather than corneal elec-
trodes. We explored effects of electrode position on
response parameters recorded using this device.
Methods Healthy adult twins were recruited from the
TwinsUK cohort and underwent recording of light-
adapted flicker ERGs (corresponding to international
standard stimuli). In Group 1, skin electrodes were
placed in a ‘‘comfortable’’ position, which was up to
20 mm below the lid margin. For subsequent partic-
ipants (Group 2), the electrode was positioned 2 mm
from the lid margin as recommended by the manu-
facturer. Amplitudes and peak times (averaged from
both eyes) were compared between groups after age-
matching and inclusion of only one twin per pair.
Light-adapted flicker and flash ERGs were recorded
for an additional 10 healthy subjects in two consec-
utive recording sessions: in the test eye, electrode
position was varied from 2 to 10–20 mm below the lid
margin between sessions; in the fellow (control) eye,
the electrode was 2 mm below the lid margin
throughout. Amplitudes and peak times (test eye
normalised to control eye) were compared for the two
sessions.
Results Including one twin per pair, and age-match-
ing yielded 28 individuals per group. Flicker ERG
amplitudes were significantly lower for Group 1 than
Group 2 participants (p = 0.0024). However, mean
peak times did not differ between groups (p = 0.54).
For the subjects in whom electrode position was
changed between recording sessions, flash and flicker
amplitudes were significantly lower when positioned
A. E. Hobby � D. Kozareva � E. Yonova-Doing �I. T. Hossain � M. Katta � C. J. Hammond � O. A. Mahroo
Department of Ophthalmology, King’s College London,
St Thomas’ Hospital Campus, London SE1 7EH, UK
A. E. Hobby � B. Huntjens � A. M. Binns
Centre of Applied Vision Research, City, University of
London, Northampton Square, London EC1V 0HB, UK
A. E. Hobby � D. Kozareva � E. Yonova-Doing �C. J. Hammond � O. A. Mahroo
Department of Twin Research and Genetic Epidemiology,
King’s College London, St Thomas’ Hospital Campus,
London SE1 7EH, UK
O. A. Mahroo (&)
UCL Institute of Ophthalmology, University College
London, London EC1V 9EL, UK
e-mail: [email protected]
O. A. Mahroo
Medical Retina Service, Moorfields Eye Hospital, 162
City Road, London EC1V 2PD, UK
O. A. Mahroo
Department of Physiology, Development and
Neuroscience, University of Cambridge,
Cambridge CB2 3EG, UK
123
Doc Ophthalmol
https://doi.org/10.1007/s10633-018-9652-z(0123456789().,-volV)(0123456789().,-volV)

further from the lid margin (p\ 0.005), but peak
times were similar (p[ 0.5).
Conclusions Moving the skin electrodes further
from the lid margin significantly reduces response
amplitudes, highlighting the importance of consistent
electrode positioning. However, this does not signif-
icantly affect peak times. Thus, it may be feasible to
adopt a more comfortable position in participants who
cannot tolerate the recommended position if analysis
is restricted to peak time parameters.
Keywords Electroretinogram � Retina � Electrode �Retinal function
Introduction
The RETevalTM (LKC Technologies, Inc., Gaithers-
burg, MD, USA) is a handheld device for recording the
full-field electroretinogram (ERG), which aims to
improve the ease of ERG recording in a general
clinical or office environment [1–3]. Equipped with a
small Ganzfeld dome, an infrared LED and camera
system (for monitoring the subject’s eye) and skin
electrodes, it is designed to record monocular ERGs.
An inbuilt pupilometer measures pupil diameter and
adjusts stimulus strength accordingly to achieve
consistent retinal illuminance, allowing ERGs to be
recorded with natural pupils.
To minimise invasiveness, the device is designed
for use with skin surface ‘‘sensor strips’’. These
disposable, single use skin surface electrodes are
specific to the right and left eye, respectively. The
manufacturer recommends that the nasal edge of the
sensor strip should be aligned with the midline of the
pupil and the superior edge of the strip should be
placed 2 mm below the patient’s lower lid margin
(Fig. 1). This type of electrode generally requires little
application time and has anecdotally proven to be
more comfortable for patients undergoing ERGs than
electrodes that make contact with the ocular surface.
However, some subjects report mild discomfort with
the recommended position due to proximity to
eyelashes and interference with eye closure, and an
alternative electrode position, further from the lid
margin, over the orbital rim, can be more comfortable.
The use of periorbital skin surface electrodes to
record the electroretinogram has a long history, first
described in 1942 [4], and reported in several publi-
cations since (references [5–11] are a selection).
Response amplitudes are substantially smaller than
those recorded with corneal electrodes [8–11], and
effects of different electrode positions, as well as
directions of gaze, have been examined [5, 6, 9]:
substantial changes in amplitude are observed in
different recording positions.
Given the special design of the RETeval skin
electrodes, incorporating active, reference and ground
electrodes in a single strip, and their increasing use
worldwide, we sought to examine, in this specific case,
the effect of the different electrode positions on
amplitudes and peak times of standard light-adapted
responses (designed to correspond to ISCEV (Inter-
national Society for the Clinical Electrophysiology of
Vision) standard stimuli [12]) recorded using the
RETeval stimulator.
Methods
As part of a larger ongoing study, exploring genetic
and environmental factors affecting ERG recordings
in health and disease, adult twins were recruited from
the TwinsUK cohort based at St Thomas’ Hospital
London [13] and underwent recording of light-adapted
flicker ERGs using the handheld stimulator.
Fig. 1 Two different electrode positions in a study participant.
The skin sensor electrodes are placed 2 mm below the lid
margin (manufacturer’s recommended position) in the upper
photograph, and in an inferior position 10–20 mm below lid
margin (lower photograph). Permission granted for use of
photograph
123
Doc Ophthalmol

Participants gave informed consent; the study had
ethics committee approval and adhered to the tenets of
the Declaration of Helsinki.
Stimuli were delivered through natural pupils, and
strengths were automatically adjusted by the device
according to pupil diameter to correspond to interna-
tional standard stimuli. The ISCEV standard specifies
the delivery of 3.0 photopic cd m-2 s white stimuli in
the presence of a 30 cd m-2 white background [12].
The device delivers 85 Td s stimuli [chromaticity
(0.33, 0.33)] on a background of 850 Td (which would
correspond to the ISCEV standard strength stimulus
delivered through a 6-mm-diameter pupil). The white
flicker and background stimuli were produced by
simultaneous activation of red, green and blue LEDs.
Flicker stimuli were delivered at 28.3 Hz, and the
response was an average of 141–424 presentations. In
most cases, each stimulus run was repeated once, and
the parameters averaged. Participants were already
light-adapted in standard indoor incandescent illumi-
nation (approximately 40–100 photopic cd m-2).
In the first 48 consecutively recruited participants
(Group 1), skin electrodes were placed in a ‘‘comfort-
able’’ position, ranging from near the lid margin to
approximately 2 cm below the lid margin. In the next
200 consecutive participants (Group 2), electrodes
were positioned in the manufacturer recommended
location (Fig. 1).
As ERG parameters from both twins of a given pair
are highly correlated [14], only one twin from each
pair was included for subsequent analysis. As ERG
parameters vary with age [14, 15], the two groups were
age-matched by ensuring the same numbers of partic-
ipants in each age decade. This resulted in 28
participants per group. ERG parameters (flicker
amplitudes and peak times), averaged from both eyes,
were compared between the two age-matched groups
(Mann–Whitney test).
In a third group of healthy participants (n = 10),
photopic flash (85 Td s, 2 Hz) and flicker ERGs (as
above) were recorded. Thirty flashes were delivered
per run, and the series was repeated, so final param-
eters were typically the average from 60 consecutive
flash presentations. The duration of each flash was less
than 5 ms. The following protocol was undertaken in
two consecutive recording sessions: in one session,
electrodes were placed in the recommended position
for both eyes; in the other session, the electrode was
placed 10–20 mm below the lid margin in the test eye,
but remained in the recommended position (2 mm
below the lid margin) in the fellow eye. ERG
parameters from the test eye were normalised to those
of the control eye (test eye divided by control eye) to
control for any adaptational changes between the two
recording sessions, and the resulting normalised
parameters compared between sessions (Wilcoxon
signed rank test).
Results
Intergroup comparison
In the first group, 48 consecutive twin participants
underwent recordings. Including only one twin per
pair yielded 28 participants, mean (SD) age 60.3 (10.0)
years (median 59.0; minimum 43.2; maximum 76.6;
interquartile range 17.1 years); all were female (re-
flecting the demographics of the TwinsUK cohort
which is overwhelmingly female). In the second group
of 200 consecutive participants, including only one
twin per pair gave 122 participants, mean (SD) age
46.7 (16.8) years; 14.7% were male. The mean ages
were significantly different (p\ 0.0001). The cohorts
were then age- and sex-matched by first removing the
males from the second group, and then including the
same numbers of participants per decade as in the first
group (by excluding any excess participants in each
decade in the second group in chronological order of
recruitment). The mean age of the remaining 28
participants in the second group was now 61.0 (9.4)
years (median 63.3; minimum 43.4; maximum 77.5;
interquartile range 16.7 years), which was not signif-
icantly different from Group 1 (p = 0.805).
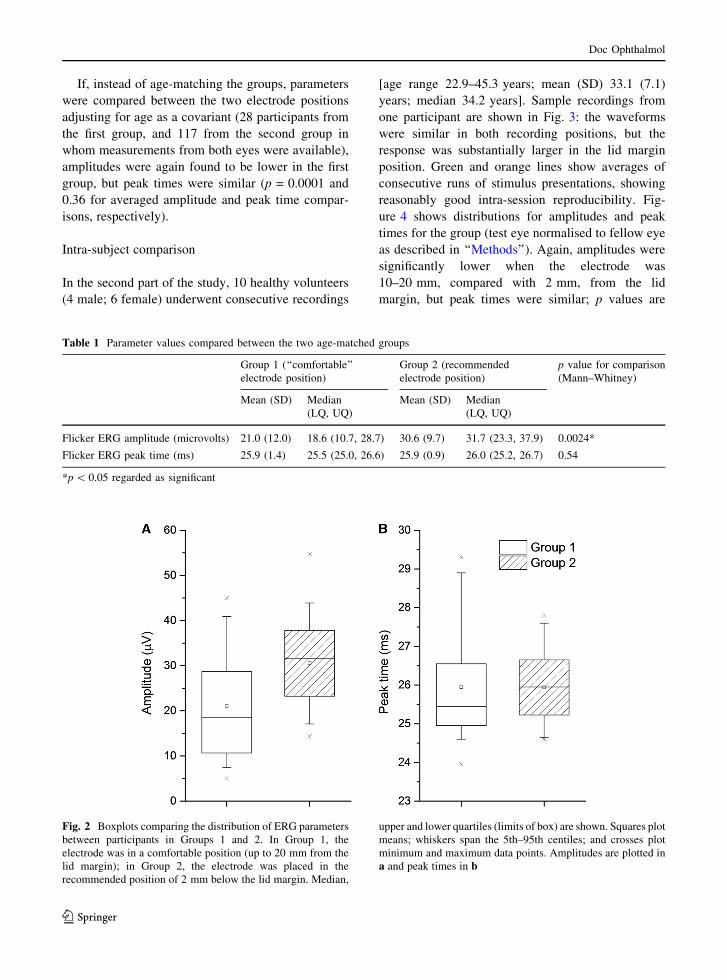
Table 1 compares flicker amplitudes and implicit
times for the two groups. Amplitudes were signifi-
cantly lower in Group 1 compared with Group 2
(p = 0.0024) whilst peak times did not differ signif-
icantly (p = 0.54). Figure 2 compares the distribution
of values between the two groups as boxplots. The
median amplitude was 41% lower for Group 1
compared with Group 2. If right and left eyes were
compared separately, the same pattern was seen:
amplitudes were significantly lower in Group 1
(p = 4.8 9 10-4 and 0.012 for right and left eyes,
respectively), whilst peak times were not significantly
different (p = 0.90 and 0.18 for right and left eyes,
respectively).
123
Doc Ophthalmol
If, instead of age-matching the groups, parameters
were compared between the two electrode positions
adjusting for age as a covariant (28 participants from
the first group, and 117 from the second group in
whom measurements from both eyes were available),
amplitudes were again found to be lower in the first
group, but peak times were similar (p = 0.0001 and
0.36 for averaged amplitude and peak time compar-
isons, respectively).
Intra-subject comparison
In the second part of the study, 10 healthy volunteers
(4 male; 6 female) underwent consecutive recordings
[age range 22.9–45.3 years; mean (SD) 33.1 (7.1)
years; median 34.2 years]. Sample recordings from
one participant are shown in Fig. 3: the waveforms
were similar in both recording positions, but the
response was substantially larger in the lid margin
position. Green and orange lines show averages of
consecutive runs of stimulus presentations, showing
reasonably good intra-session reproducibility. Fig-
ure 4 shows distributions for amplitudes and peak
times for the group (test eye normalised to fellow eye
as described in ‘‘Methods’’). Again, amplitudes were
significantly lower when the electrode was
10–20 mm, compared with 2 mm, from the lid
margin, but peak times were similar; p values are
Table 1 Parameter values compared between the two age-matched groups
Group 1 (‘‘comfortable’’
electrode position)
Group 2 (recommended
electrode position)
p value for comparison
(Mann–Whitney)
Mean (SD) Median
(LQ, UQ)
Mean (SD) Median
(LQ, UQ)
Flicker ERG amplitude (microvolts) 21.0 (12.0) 18.6 (10.7, 28.7) 30.6 (9.7) 31.7 (23.3, 37.9) 0.0024*
Flicker ERG peak time (ms) 25.9 (1.4) 25.5 (25.0, 26.6) 25.9 (0.9) 26.0 (25.2, 26.7) 0.54
*p\ 0.05 regarded as significant
Fig. 2 Boxplots comparing the distribution of ERG parameters
between participants in Groups 1 and 2. In Group 1, the
electrode was in a comfortable position (up to 20 mm from the
lid margin); in Group 2, the electrode was placed in the
recommended position of 2 mm below the lid margin. Median,
upper and lower quartiles (limits of box) are shown. Squares plot
means; whiskers span the 5th–95th centiles; and crosses plot
minimum and maximum data points. Amplitudes are plotted in
a and peak times in b
123
Doc Ophthalmol

given in the figure legend. Median amplitudes were
44–53% lower in the second position compared with
the first.
Discussion
This study investigated the effect on the ERG of
moving specially designed skin electrodes further
inferiorly from the lid margin, both by comparing
light-adapted flicker ERGs in two large groups of
participants (with the two groups differing by elec-
trode position), and by recording light-adapted flash
and flicker ERGs in a smaller group in whom
recordings were performed using two different posi-
tions in consecutive sessions. The findings from both
investigations were consistent: placing the electrode in
a more inferior position resulted in a significant
reduction in response amplitudes (by approximately
40–50%) although peak times appeared to be unaf-
fected. This finding emphasises the importance of
consistent skin electrode positioning, particularly
when amplitudes are being analysed.
The proportionate change in median amplitude for
the intra-subject comparison (44–53% reduction when
further from the lid margin) is broadly similar to that
seen in the intergroup comparison (41%), though
slightly higher. The ‘‘comfortable’’ position varied
substantially in both comparisons (whilst the position
2 mm from the lid margin was consistent), and it is
possible that this was more frequently closer to the lid
margin in the intergroup comparison than in the intra-
subject comparison.
Previous studies of skin electrode position have
shown a reduction in amplitude the further the
recording electrode is from the cornea [5, 6, 9]. Also,
Fig. 3 Sample traces from one participant. a, bAveraged light-
adapted ERGs to a flash obtained from right and left eyes,
respectively. In the right eye, the skin electrode was placed
2 mm from the lid margin. In the left eye, the electrode was
15 mm below the lid margin. c, d Light-adapted responses to the
flicker stimulus obtained with electrodes placed as in a, b,respectively. Green and orange traces represent averaged
recordings obtained from consecutive runs of stimulus
presentations
123
Doc Ophthalmol

we have found that ERGs recorded with conductive
fibre electrodes placed in the fornix are substantially
lower in amplitude than those recorded with the
electrode at the lid margin, whilst peak times are
similar (Tariq et al. [16], ARVO meeting abstract
5121). This result was consistent with the findings of a
similar study of conductive fibre electrode position
recently published, showing a 20–25% reduction in
amplitude [17]. Overall, the present study fits well
with the findings of previous studies of both skin and
corneal conductive fibre electrodes: the further the
recording electrode is from the corneal apex, the lower
the recorded signal amplitude.
The findings of the present and previous studies
suggest that skin recording electrode positioning is
less critical with respect to analysis of peak time
parameters. Nevertheless, the electrode must be posi-
tioned sufficiently close to the eye to elicit an ERG in
which the peaks and troughs are discernible. In this
study, all healthy subjects produced a measurable
flicker ERG, even when the electrode was positioned
up to 20 mm from the lid margin. However, in patients
with subnormal responses in retinal disease, this can
be more challenging. In some patients with reduced
cone system responses measured using conventional
ERG recording systems, it has not been possible to
accurately determine peak times using the RETeval
system as amplitudes are too low to distinguish
response components [3].
Fig. 4 ERG parameters for different electrode positions in
participants in the third group (n = 10; data normalised to
control eye). a, b, c Boxplots showing a-wave, b-wave and
flicker ERG amplitudes: differences were significant between
the two positions (p = 0.004, 0.002 and 0.002, respectively,
Wilcoxon signed rank test). d, e, f, Boxplots showing a-wave,
b-wave and flicker ERG peak times: differences were not
significant (p = 0.85, 0.57 and 0.56, respectively). Boxes show
median and upper and lower quartiles; squares plot mean values;
whiskers extend to maximum and minimum values. Note that
the y-axis scales differ in the lower panels and have been
expanded considerably in F, where the actual range between
maximum and minimum values is less than 0.1
123
Doc Ophthalmol
One limitation of the present study was that
electrode placement in Group 1 was not consistent
and was determined more by participant ‘‘comfort’’,
whilst positioning in Group 2 was consistent. Also, the
participants were not randomised to different elec-
trode positions, but the position was determined by
whether they were in the first or second phase of
subject recruitment. However, recordings from the
third group of participants (in whom both positions
were used in the same subject) were consistent with
the findings from the first two groups.
Also, potential time-dependent adaptational effects
(the right eye was recorded from first in all subjects)
were controlled for, in the first two groups, by
averaging both eyes, and, in the third group, by
normalising the test eye to the control eye. Even when
right and left eyes were compared separately in the
first two groups, the results were found to be similar
(amplitudes differed significantly between the two
positions, but peak times did not).
Although multiple parameters were compared in
the intra-subject comparison, a correction for multiple
testing was not deemed necessary [18]. The compar-
isons were predetermined and essentially explored
differences in only two types of parameter, namely
amplitudes and peak times. The finding that ampli-
tudes were significantly different, and peak times were
not, was observed consistently across all parameter
comparisons, strongly supporting the validity of the
conclusions of this study.
Acknowledgements AEH is recipient of a College of
Optometrists Postgraduate Studentship. OAM receives
funding from the Wellcome Trust (Grant 206619/Z/17/Z),
Fight for Sight (1409/10), Birdshot Uveitis Society (24BU141),
Thomas Pocklington Trust (24TPT16) and the National Institute
for Health Research (NIHR) Biomedical Research Centre at
Moorfields Eye Hospital and the UCL Institute of
Ophthalmology. TwinsUK receives funding from the
Wellcome Trust and the NIHR BioResource Clinical Research
Facility and Biomedical Research Centre based at Guy’s and St.
Thomas’ NHS Foundation Trust and King’s College London,
UK. The views expressed are those of the authors and not the
funding organisations. The funding organisations had no role in
the design or conduct of the research. The authors thank Dr
Neringa Jurkute, Dr Sumita Phatak, Dr Peter Heydon, Dr
Ahmed Kasb and Ms Priya Francome-Wood for assistance with
recordings.
Compliance with ethical standards
Conflicts of interest The authors declare that they have no
conflict of interest.
Informed consent All participants gave informed consent.
Statement of human rights All procedures performed in
studies involving human participants were in accordance with
the ethical standards of the institutional and/or national research
committee and with the 1964 Helsinki Declaration and its later
amendments or comparable ethical standards.
Statement on the welfare of animals No animals were used
in this research.
Open Access This article is distributed under the terms of the
Creative Commons Attribution 4.0 International License (http://
creativecommons.org/licenses/by/4.0/), which permits unre-
stricted use, distribution, and reproduction in any medium,
provided you give appropriate credit to the original
author(s) and the source, provide a link to the Creative Com-
mons license, and indicate if changes were made.
References
1. Maa AY, Feuer WJ, Davis CQ, Pillow EK, Brown TD,
Caywood RM, Chasan JE, Fransen SR (2016) A novel
device for accurate and efficient testing for vision-threat-
ening diabetic retinopathy. J Diabetes Complications
30(3):524–532
2. Fukuo M, Kondo M, Hirose A, Fukushima H, Ikesugi K,
Sugimoto M, Kato K, Uchigata Y, Kitano S (2016)
Screening for diabetic retinopathy using new mydriasis-
free, full-field flicker ERG recording device. Sci Rep
8(6):36591
3. Nakamura N, Fujinami K, Mizuno Y, Noda T, Tsunoda K
(2016) Evaluation of cone function by a handheld non-
mydriatic flicker electroretinogram device. Clin Ophthal-
mol 30(10):1175–1185
4. Motokawa K, Mita T (1942) Uber eine einfachere Unter-
suchungsmethode und Eigenschaften der Aktionsstrome der
Netzhaut des Menschen. Tohokku J Exp Med 42:114–133
5. Noonan BD, Wilkus RJ, Chatrian GE, Lettich E (1973) The
influence of direction of gaze on the human electroretino-
gram recorded from periorbital electrodes: a study utilizing
a summating technique. Electroencephalogr Clin Neuro-
physiol 35(5):495–502
6. Zhang G, Nao-i N, Honda Y (1983) Topographical distri-
bution of electroretinographic potentials monitored by skin-
electrodes. J Pediatr Ophthalmol Strabismus 20(4):153–157
7. France TD (1984) Electrophysiologic testing and its specific
application in unsedated children. Trans Am Ophthalmol
Soc 82:383–446
8. Esakowitz L, Kriss A, Shawkat F (1993) A comparison of
flash electroretinograms recorded from Burian Allen, JET,
C-glide, gold foil, DTL and skin electrodes. Eye (Lond) 7(Pt
1):169–171
9. Kriss A (1994) Skin ERGs: their effectiveness in paediatric
visual assessment, confounding factors, and comparison
with ERGs recorded using various types of corneal elec-
trode. Int J Psychophysiol 16(2–3):137–146
123
Doc Ophthalmol

10. Bradshaw K, Hansen R, Fulton A (2004) Comparison of
ERGs recorded with skin and corneal-contact electrodes in
normal children and adults. Doc Ophthalmol 109(1):43–55
11. Mortlock KE, Binns AM, Aldebasi YH, North RV (2010)
Inter-subject, inter-ocular and inter-session repeatability of
the photopic negative response of the electroretinogram
recorded using DTL and skin electrodes. Doc Ophthalmol
121(2):123–134
12. McCulloch DL, Marmor MF, Brigell MG, Hamilton R,
Holder GE, Tzekov R, Bach M (2015) ISCEV standard for
full-field clinical electroretinography (2015 update). Doc
Ophthalmol 130(1):1–12. https://doi.org/10.1007/s10633-
014-9473-7
13. Moayyeri A, Hammond CJ, Hart DJ, Spector TD (2013) The
UK Adult Twin Registry (TwinsUK Resource). Twin Res
Hum Genet 16(1):144–149
14. Bhatti T, Tariq A, Shen T, Williams KM, Hammond CJ,
Mahroo OA (2017) Relative genetic and environmental
contributions to variations in human retinal electrical
responses quantified in a twin study. Ophthalmology
124(8):1175–1185
15. Neveu MM, Dangour A, Allen E, Robson AG, Bird AC,
Uauy R, Holder GE (2011) Electroretinogram measures in a
septuagenarian population. Doc Ophthalmol 123(2):75–81
16. Tariq A, Sheriff I, Bhatti T, Sankoh A, Gao H, Hammond
CJ, Mahroo OA (2014) Effect of varying conductive fibre
electrode position between fornix and lid margin on elec-
troretinogram amplitudes and implicit times. Invest Oph-
thalmol Vis Sci 55(13):5121
17. Kurtenbach A, Kramer S, Strasser T, Zrenner E, Langrova H
(2017) The importance of electrode position in visual
electrophysiology. Doc Ophthalmol 134(2):129–134
18. Armstrong RA (2014) When to use the Bonferroni correc-
tion. Ophthalmic Physiol Opt 34(5):502–508
123
Doc Ophthalmol


![PAY: Pair an'd Warmeg '' TIEiE WIN FAL]LS DiAILYnewspaper.twinfallspubliclibrary.org/files/TWIN-FALLS...Ijj ran cD«Nn->—the—lax—blll-weni es Uirough virtually as written by](https://img.pdfslide.net/doc/110x75/60879f67e2123a36214fa7b6/pay-pair-and-warmeg-tieie-win-falls-ijj-ran-cdnn-athealaxablll-weni.jpg)