Embed Size (px)
Citation preview
City Sanitation Plan Page 1
City Sanitation Plan Page 3
CITY SANITATION PLAN
CONTENTS
I. GENERAL INFORMATION
� City Sanitation Task Force
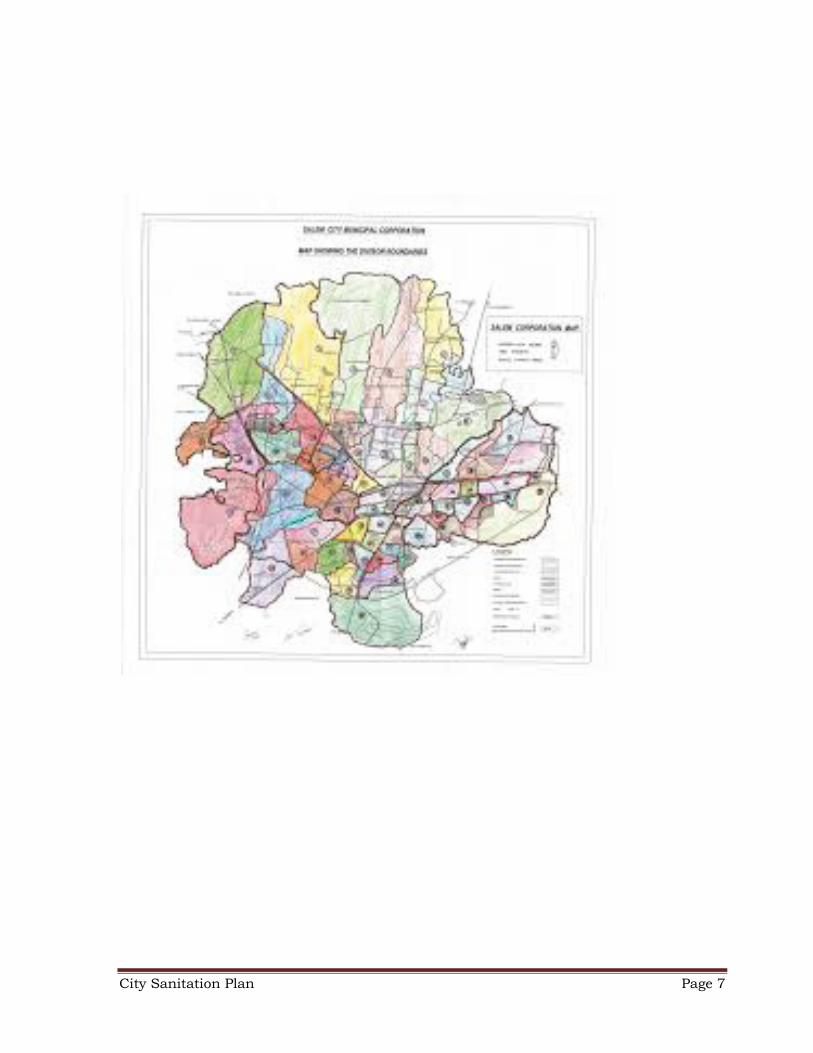
� Town Map
� Swachhata
� Approach And Methodology
� Components Of CSP
� National Urban Sanitation Policy
� City Sanitation Plan
� Need For CSP
� What Is CSP
� Why CSP
� City Profile
� General Profile
� Land Use
� City Map
� Ward Wise Households &Population
II. OPEN DEFECATION FREE
� Open Defecation Free City
� Pie Chart
� Profile
� Location Of Community/Public Toilet
� Map Showing Location Of Toilet
� Public Toilet/Free Urinal Image
� Individual Household Toilet Image
III. SOLID WASTE MANAGEMENT
� Solid Waste Management
� Need For SWM
� The Objectives Of Project
� Demographics
� Municipal Administration
� Population Growth
� Projection Of Population and Generation of Solid Waste
� Details Of House Holds & Other Infrastructures
� The MSW Mandate
� Components And Status Of Compliance
� Quantification Of Solid Waste
� Characterization Of Solid Waste
City Sanitation Plan Page 4
� Solid Waste Management Completed Works
� Transportation &Equipments
� Biomethanation Plant
� Waste Pyramid
� Process Design For MSW Composting
Unit � Recovery Of Recycling
� Green Belt Development
� Solid Waste Management Improvement 2015-2016
IV. WATER SUPPLY
� City Salient Features
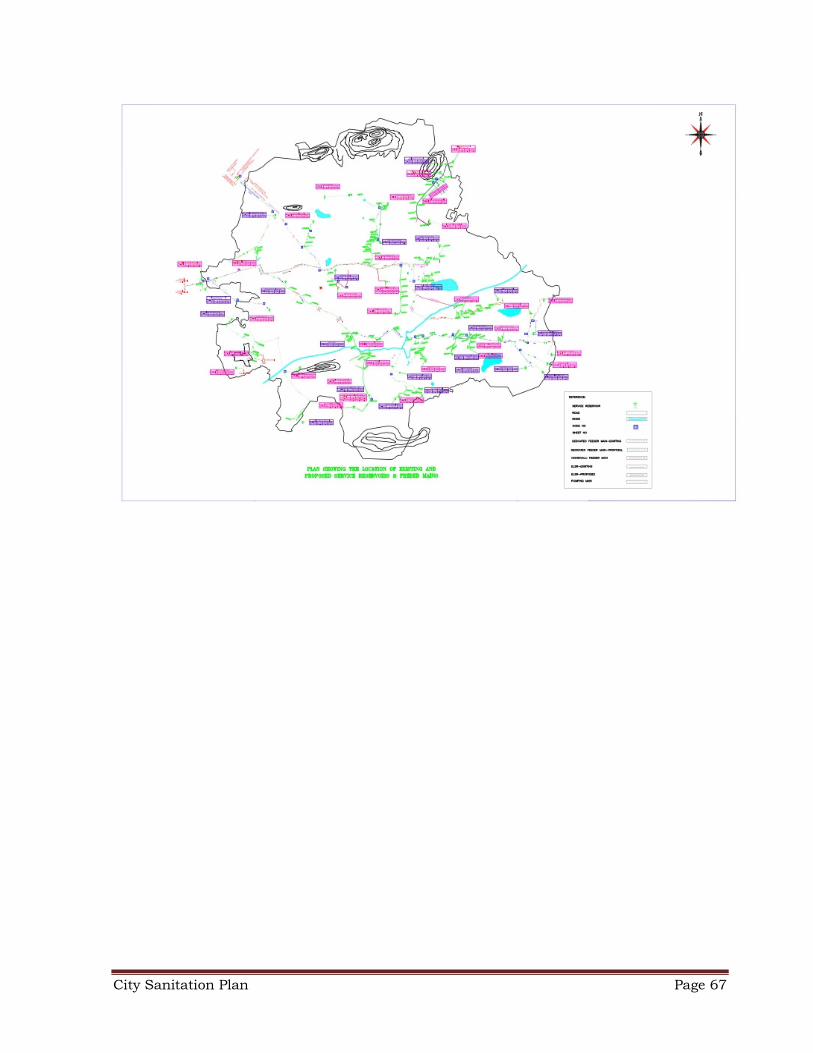
� Map Showing Water Supply Distribution
System � Schematic Diagram
� Existing & Proposed Water Supply
System � Amrut 2016-2017
V. UNDER GROUND DRAINAGE
SYSTEM � UGSS Details
� City Salient Features
� UGS Pumping Station
Details � STP
� Sludge Digester
� Amrut 2016-
2017
VI. OPEN DRAIN & STORM WATER
CHANNEL � Desilting Report
� Desilting Of Channels
Estimate � Length Of Drains
� Mosquito Control
VII. INFORMATION EDUCATION & COMMUNICATION
� Public Participation In SWM
� Decentralized Waste Management System
� Public Information,Education,Communication Programs(Iec)
� Capacity Building In Msw Management
� Safety And Precautions In Swm
City Sanitation Plan Page 5
GENERAL
INFORMATION
City Sanitation Plan Page 6
City Sanitation Task Force • Special
officer / Chairman / Councilors
• Corporation Commissioner
• City Health Officer
• Executive Engineer
• Assistant Executive Engineer / Assistant Enginner
• Sanitary Officers
• Sanitary Inspectors
• Sanitary Supervisors
• NGO / Voluntary Organization / SHGS
• Stake holders
• Sanitation Private Agency
• Sanitary Workers
City Sanitation Plan Page 7
City Sanitation Plan Page 8
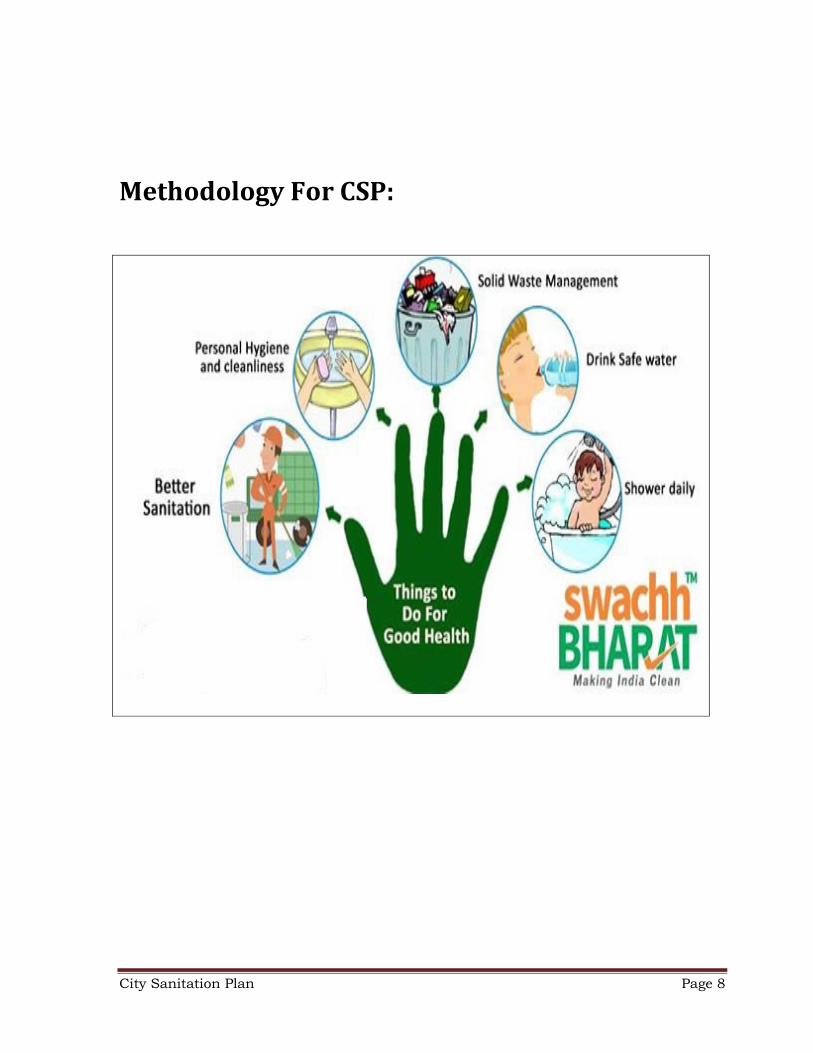
Methodology For CSP:
City Sanitation Plan Page 9
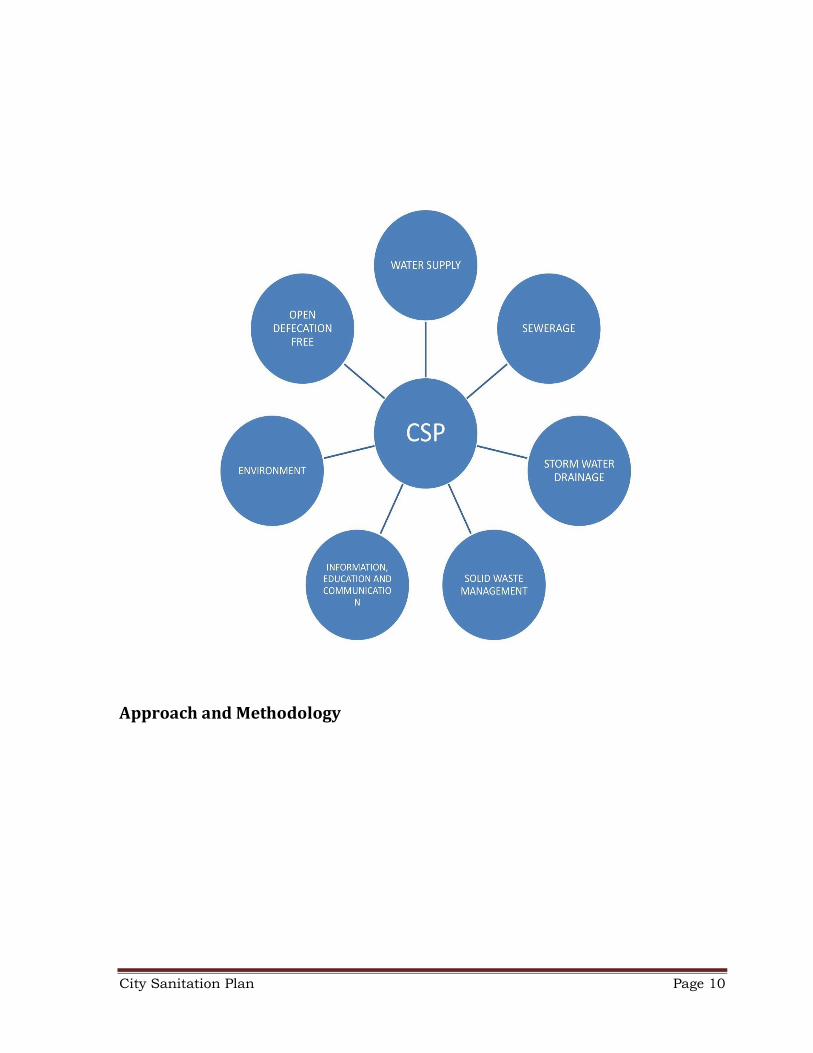
• City Sanitation Mainly based on the five basic
amenities illustrated in the diagram Shown below.
City Sanitation Plan Page 10
Approach and Methodology
City Sanitation Plan Page 11
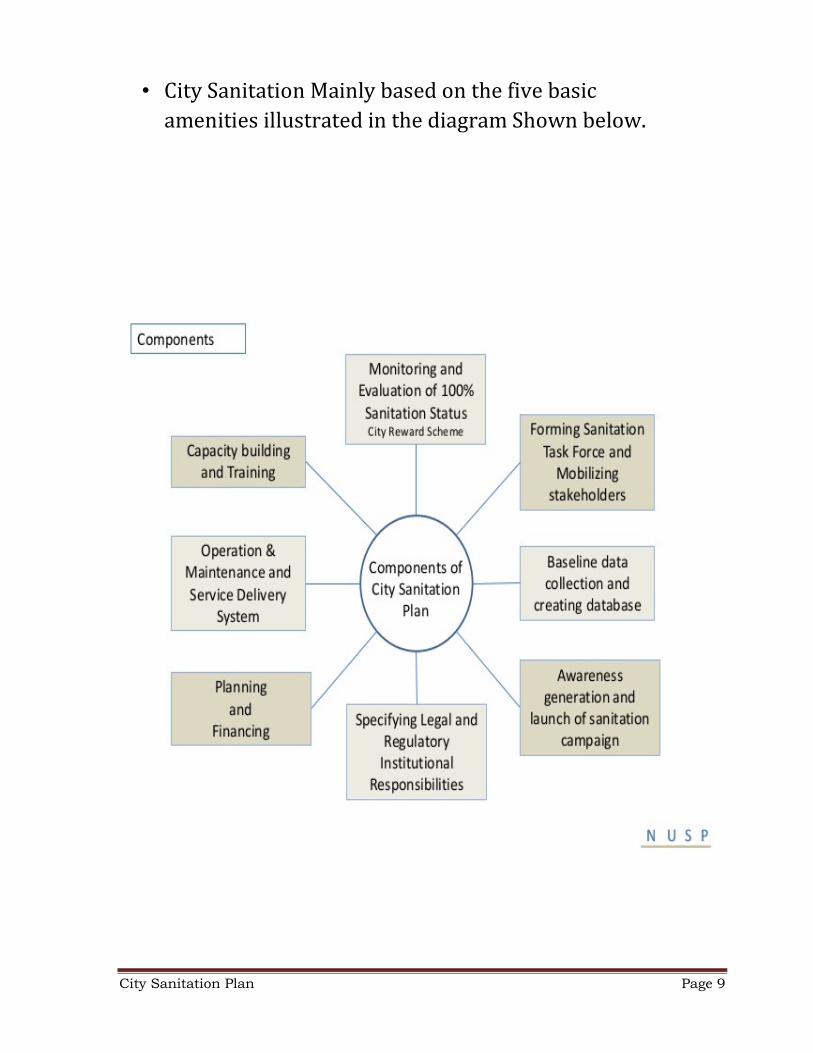
COMPONENTS OF CSP
Water Supply
• Sewage
• Storm water drainage
• Solid Waste Management
• Information, Education and Communication
• Environment
• Open defection free
City Sanitation Plan Page 12
National Urban sanitation Policy (NUSP)
National Urban Sanitation Policy (NUSP) has been
formulated by Government of India with a vision to provide
appropriate Sanitation facilities in all cities/towns. State have
to prepare State Sanitation Strategies and cities/towns are
required to prepare city Sanitation Plans (CSPs) as per NUSP
guidelines,so as to improve health and environmental
outcomes. The CSP is a vision document on sanitation with 20
to 25 years horizon with short term town level action plans
for five years to achieve sanitation goals. CSP envisages
achieving the following outputs
� Open Defecation free status.
� Elimination of manual Scavenging and safety of
sanitry workers.
� Prepare disposal of rain water and storm water
drainage.
� Recycle and reuse of treated waste water for non-
potable applications.
� Solid waste fully collected and safely disposed of
scientifically.
� Serving the unserved with basic minimum services.
� Measures for improved public health and
environmental standards.
City Sanitation Plan Page 13
CITY SANITATION PLAN
• Open defecation free town
• Providing individual households toilets to all households in
the city
• Maintenance of Community / Public Toilets in a hygenic
manner
• Providing protected water supply to all households in the
town.
• Safe disposal of sewage water in UGD scheme.
• Providing UGD connection to all households / Commercial
/ Public & Private institutions.
• Drainage and storm water drainage to be strengthened and
well maintenance of the same.
• 100% door to door Segregated Garbage Collection.
• Bulk waste garbage generators to dispose bio waste.
• Municipal solid waste to be collected and disposed
scientifically.
• Reclamation of existing dumpsite.
• Dry recyclable waste are to be collected once in a week.
• Recyclable waste are to be sold to the recyclers and the
amount disbursed among sanitary workers concerned.
• Garbage free Kumbakonam to be achieved.
• Providing safety equipments to all sanitary workers.
• Setting up of MCC centers so that all bio waste are disposed
at the site.
• Capacity building / Training programs for all staff.
City Sanitation Plan Page 14
• Medical camp / Eye camp to be organized at periodical
intervals.
• Providing Medical facilities to all citizens in the town.
Need for CSP
• To achieve the goal of universal sanitation
• To develop access to safe and hygienic sanitation facility and
arrangements (individual or community toilets) to all urban
population so that no one defecates in the open
• To develop adequate availability and 100 percent upkeep and
management of public sanitation facilities in all urban areas like
commercial areas, offices, institution and service centres etc.
• To ensure scientific collection, treatment and safe disposal and
establish appropriate and feasible technology of disposal system
for human excreta & liquid waste from all sanitation facilities
and establish appropriate system of operation & maintenance of
the disposal system.
City Sanitation Plan Page 15
What is CSP?
The CSP is a vision document on Sanitation with 20 to 25
years horizon with short term town level action plans for 3-5
years to achieve sanitation goals as per above stated objections.
Broad areas to be covered in CSP are:
• Awareness generation
• Sanitary choices and Technical options
• Operation & Maintenance and service Delivery system
• Institutional Responsibilities
• Reaching the un-served and poor households
• Legal and Regulatory Institutional Responsibilities
• Planning and Financing
• Capacity Building & Training
• Implementation Management
• Monitoring & Evaluation and supervision
• City Reward Schemes.
City Sanitation Plan Page 16
WHY CSP
• Facilitate vision on a long term perspective.
• Sanitation aspect should be approached to ensure
effectiveness
• Long term vision on transion to a 100% sanitized city.
• To understand the cost and user charges implications.
• Ensure proper assessment of codex and investment
phasing
• Awareness and sensitization of community.
City Sanitation Plan Page 17
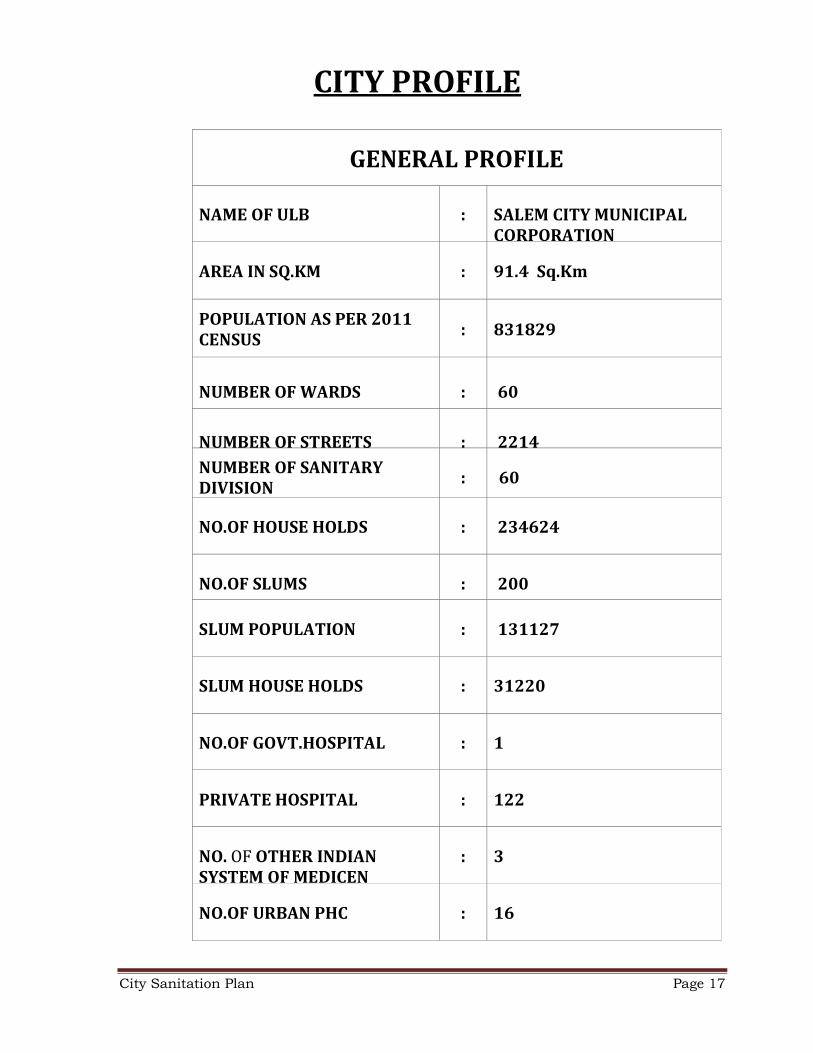
CITY PROFILE
GENERAL PROFILE
NAME OF ULB
:
SALEM CITY MUNICIPAL
CORPORATION
AREA IN SQ.KM
:
91.4 Sq.Km
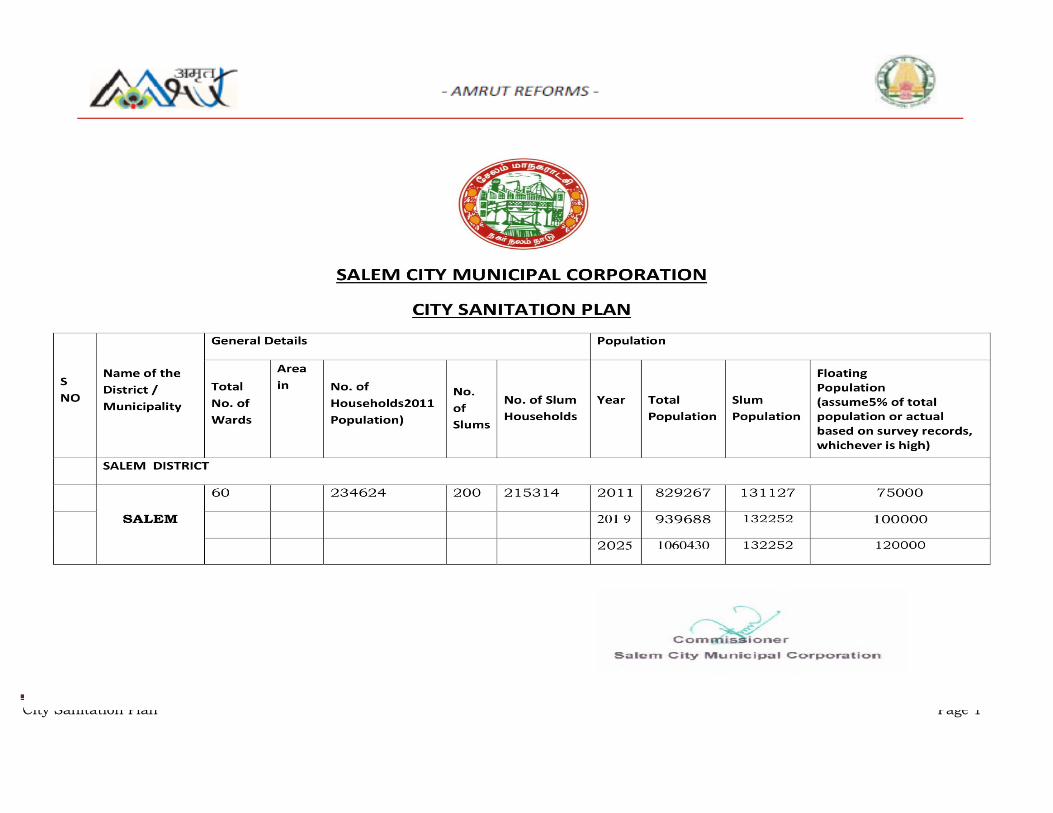
POPULATION AS PER 2011
CENSUS
:
831829
NUMBER OF WARDS
:
60
NUMBER OF STREETS
:
2214
NUMBER OF SANITARY
DIVISION
:
60
NO.OF HOUSE HOLDS
:
234624
NO.OF SLUMS
:
200
SLUM POPULATION
:
131127
SLUM HOUSE HOLDS
:
31220
NO.OF GOVT.HOSPITAL
:
1
PRIVATE HOSPITAL
:
122
NO. OF OTHER INDIAN
SYSTEM OF MEDICEN
:
3
NO.OF URBAN PHC
:
16
City Sanitation Plan Page 18
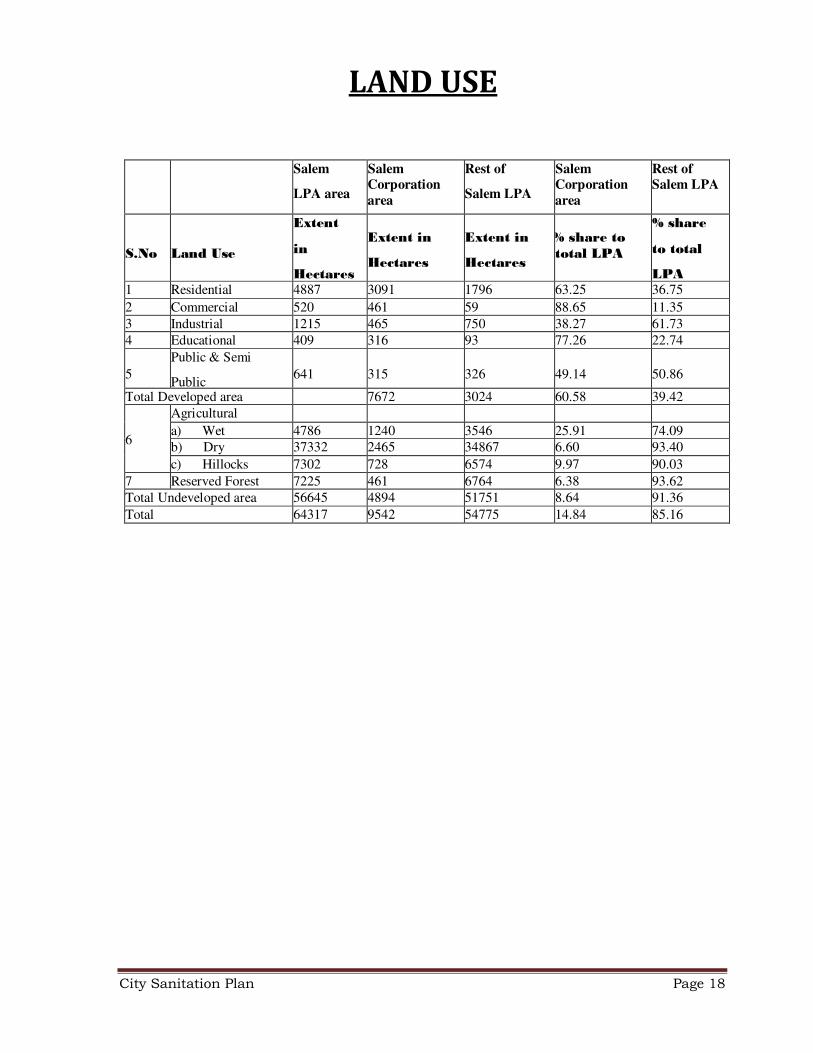
LAND USE Salem
LPA area
Salem
Corporation
area
Rest of
Salem LPA
Salem
Corporation
area
Rest of
Salem LPA
S.No
Land Use
Extent
in
Hectares
Extent in
Hectares
Extent in
Hectares
% share to total LPA
% share
to total
LPA 1 Residential 4887 3091 1796 63.25 36.75
2 Commercial 520 461 59 88.65 11.35
3 Industrial 1215 465 750 38.27 61.73
4 Educational 409 316 93 77.26 22.74
5
Public & Semi
Public
641
315
326
49.14
50.86
Total Developed area 7672 3024 60.58 39.42
6
Agricultural
a) Wet 4786 1240 3546 25.91 74.09
b) Dry 37332 2465 34867 6.60 93.40
c) Hillocks 7302 728 6574 9.97 90.03
7 Reserved Forest 7225 461 6764 6.38 93.62
Total Undeveloped area 56645 4894 51751 8.64 91.36
Total 64317 9542 54775 14.84 85.16
City Sanitation Plan Page 19
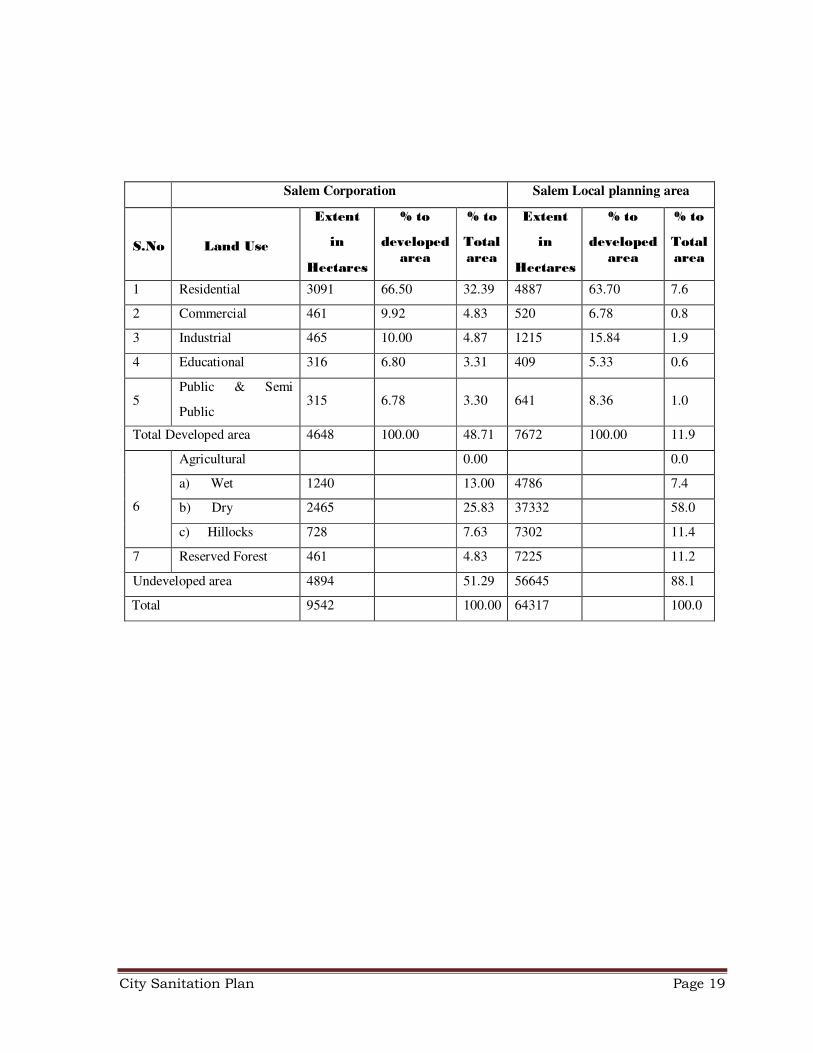
Salem Corporation Salem Local planning area
S.No
Land Use
Extent
in
Hectares
% to
developed area
% to
Total area
Extent
in
Hectares
% to
developed area
% to
Total area
1 Residential 3091 66.50 32.39 4887 63.70 7.6
2 Commercial 461 9.92 4.83 520 6.78 0.8
3 Industrial 465 10.00 4.87 1215 15.84 1.9
4 Educational 316 6.80 3.31 409 5.33 0.6
5 Public & Semi
Public
315
6.78
3.30
641
8.36
1.0
Total Developed area 4648 100.00 48.71 7672 100.00 11.9
6
Agricultural 0.00 0.0
a) Wet 1240 13.00 4786 7.4
b) Dry 2465 25.83 37332 58.0
c) Hillocks 728 7.63 7302 11.4
7 Reserved Forest 461 4.83 7225 11.2
Undeveloped area 4894 51.29 56645 88.1
Total 9542 100.00 64317 100.0
City Sanitation Plan Page 20
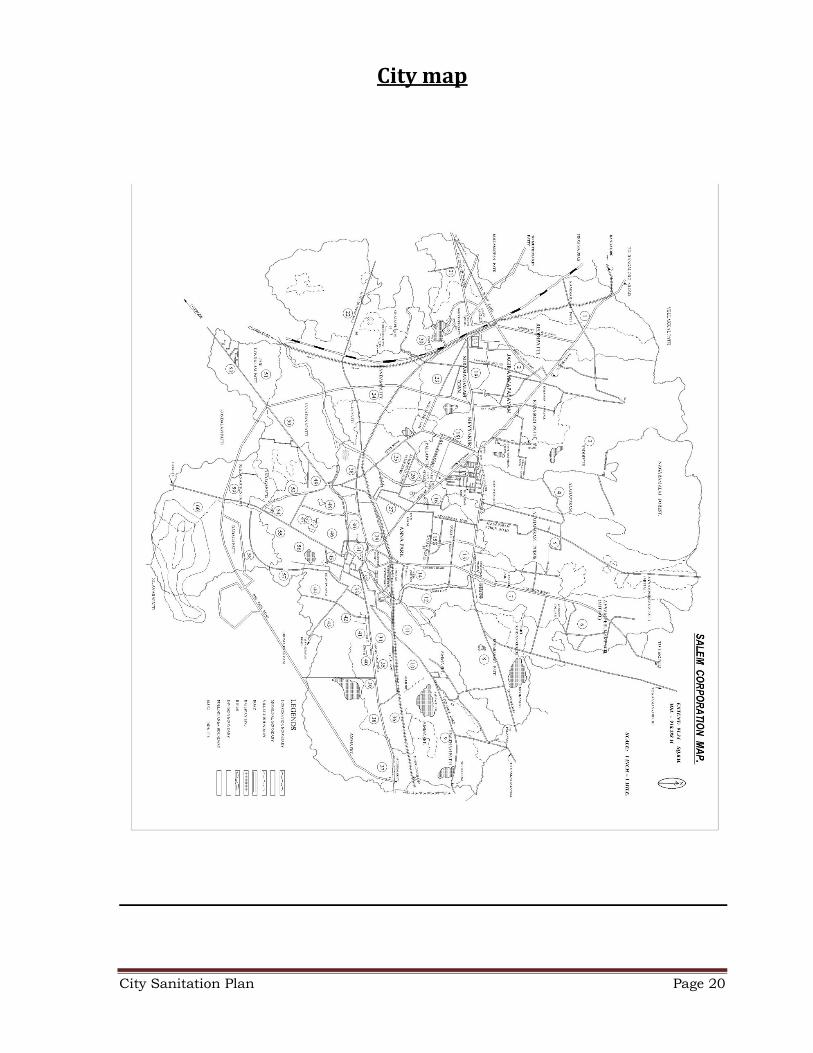
City map
City Sanitation Plan Page 21
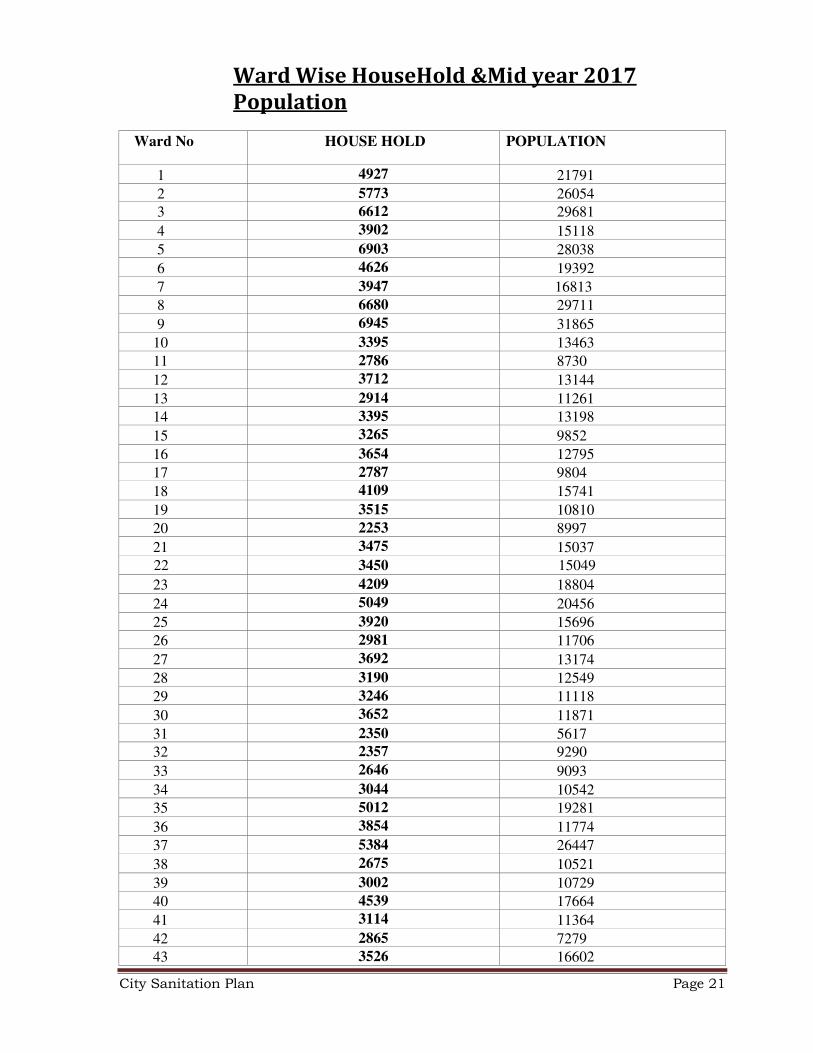
Ward Wise HouseHold &Mid year 2017
Population
Ward No HOUSE HOLD POPULATION
1 4927 21791
2 5773 26054
3 6612 29681
4 3902 15118
5 6903 28038
6 4626 19392
7 3947 16813
8 6680 29711
9 6945 31865
10 3395 13463
11 2786 8730
12 3712 13144
13 2914 11261
14 3395 13198
15 3265 9852
16 3654 12795
17 2787 9804
18 4109 15741
19 3515 10810
20 2253 8997
21 3475 15037
22 3450 15049
23 4209 18804
24 5049 20456
25 3920 15696
26 2981 11706
27 3692 13174
28 3190 12549
29 3246 11118
30 3652 11871
31 2350 5617
32 2357 9290
33 2646 9093
34 3044 10542
35 5012 19281
36 3854 11774
37 5384 26447
38 2675 10521
39 3002 10729
40 4539 17664
41 3114 11364
42 2865 7279
43 3526 16602
City Sanitation Plan Page 22
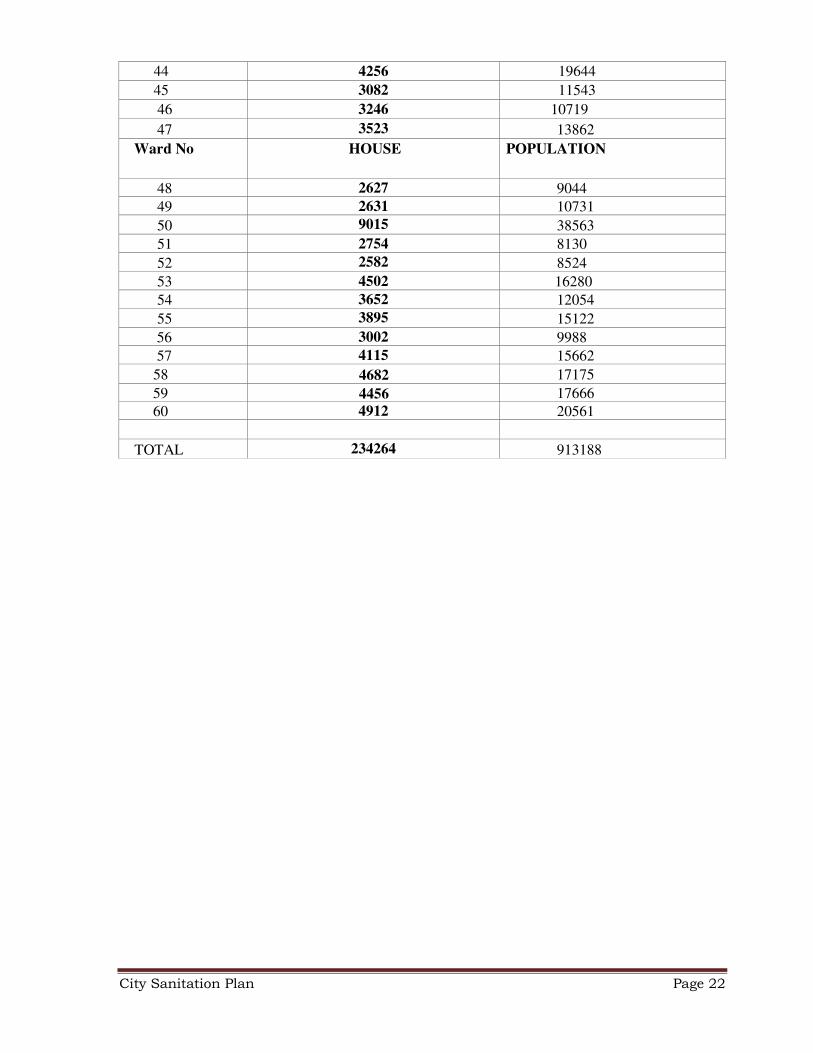
44 4256 19644
45 3082 11543
46 3246 10719
47 3523 13862
Ward No HOUSE
HOLD
POPULATION
48 2627 9044
49 2631 10731
50 9015 38563
51 2754 8130
52 2582 8524
53 4502 16280
54 3652 12054
55 3895 15122
56 3002 9988
57 4115 15662
58 4682 17175
59 4456 17666
60 4912 20561
TOTAL 234264 913188
City Sanitation Plan Page 23
OPEN DEFECATION
FREE CITY
City Sanitation Plan
Open Defecation Free Awareness
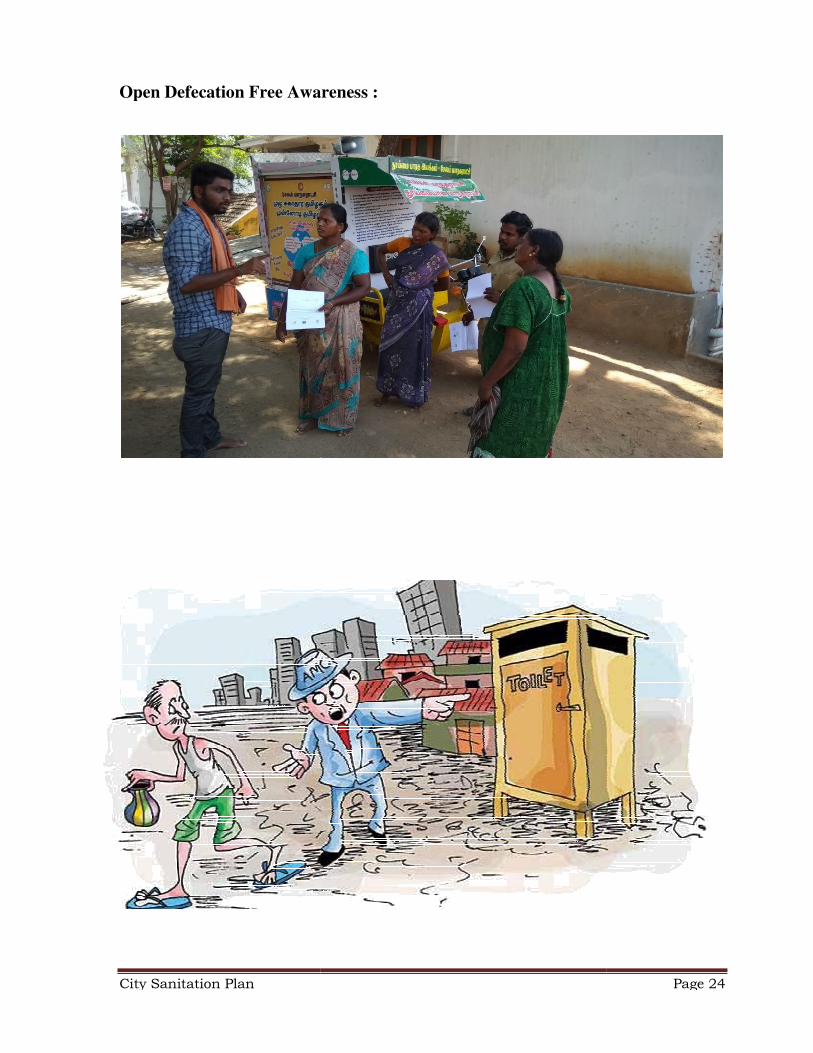
Open Defecation Free Awareness :
Page 24
City Sanitation Plan Page 25
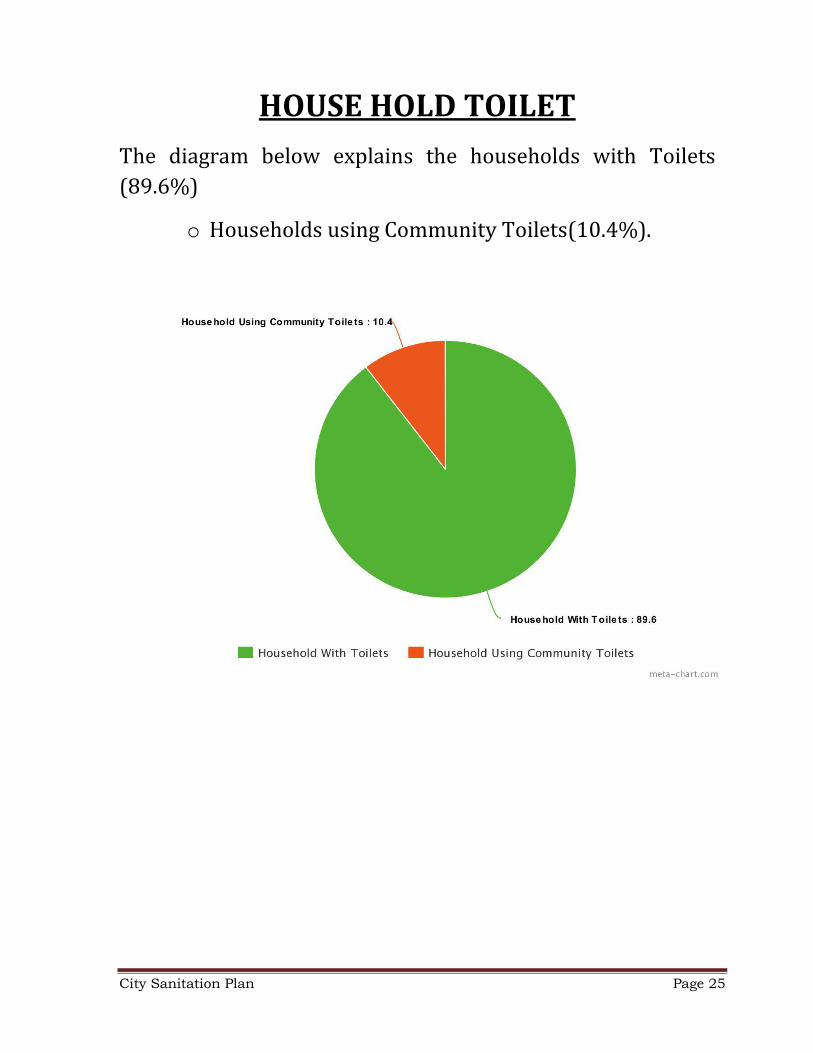
HOUSE HOLD TOILET
The diagram below explains the households with Toilets
(89.6%)
o Households using Community Toilets(10.4%).
City Sanitation Plan Page 26
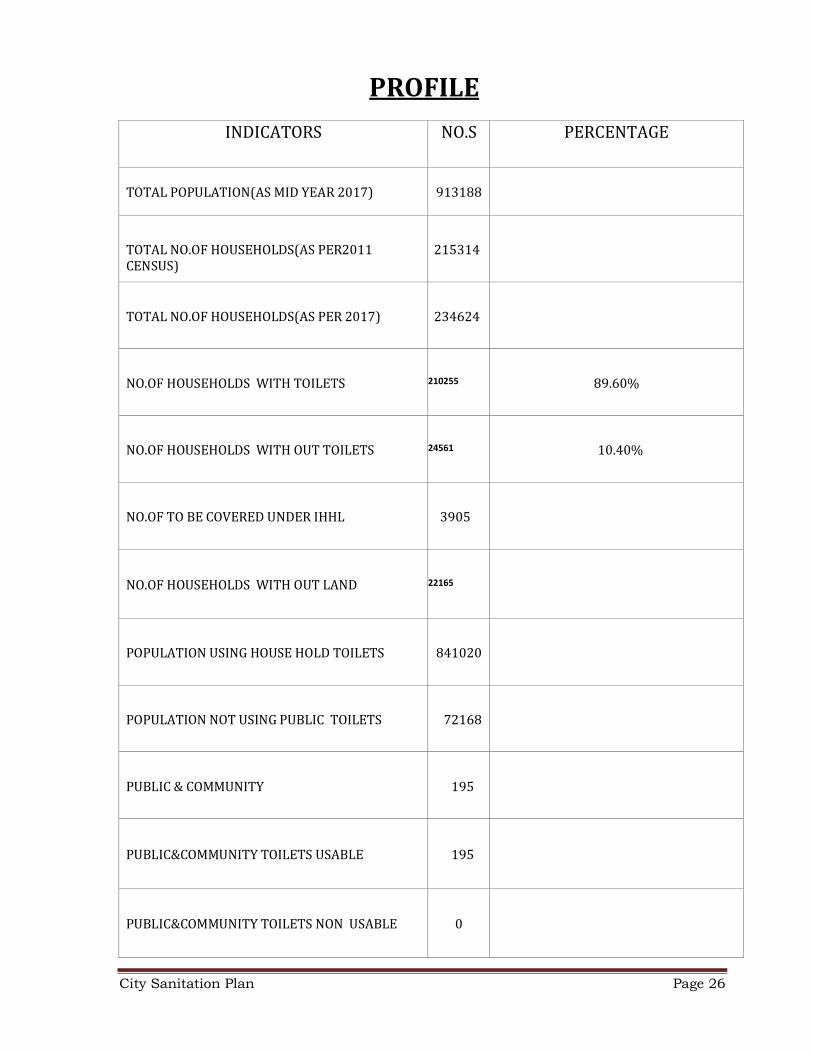
PROFILE
INDICATORS NO.S PERCENTAGE
TOTAL POPULATION(AS MID YEAR 2017)
913188
TOTAL NO.OF HOUSEHOLDS(AS PER2011
CENSUS)
215314
TOTAL NO.OF HOUSEHOLDS(AS PER 2017)
234624
NO.OF HOUSEHOLDS WITH TOILETS
210255
89.60%
NO.OF HOUSEHOLDS WITH OUT TOILETS
24561
10.40%
NO.OF TO BE COVERED UNDER IHHL
3905
NO.OF HOUSEHOLDS WITH OUT LAND
22165
POPULATION USING HOUSE HOLD TOILETS
841020
POPULATION NOT USING PUBLIC TOILETS
72168
PUBLIC & COMMUNITY
195
PUBLIC&COMMUNITY TOILETS USABLE
195
PUBLIC&COMMUNITY TOILETS NON USABLE
0
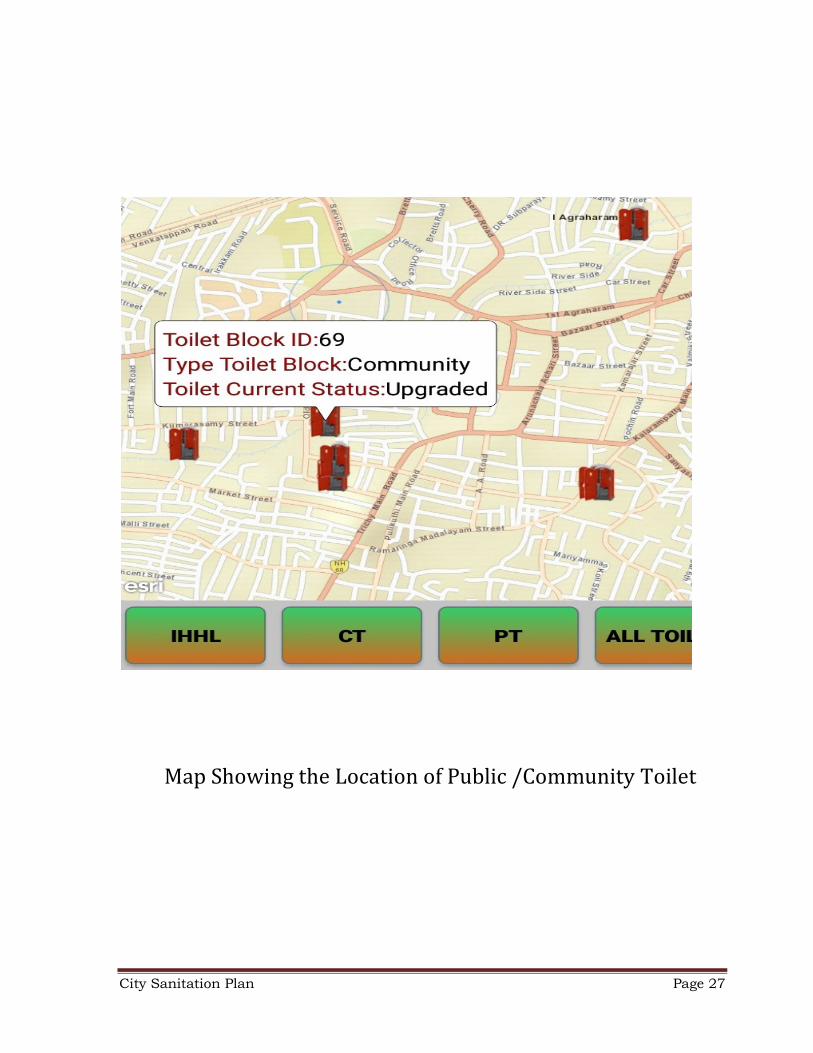
City Sanitation Plan Page 27
Map Showing the Location of Public /Community Toilet
City Sanitation Plan Page 28
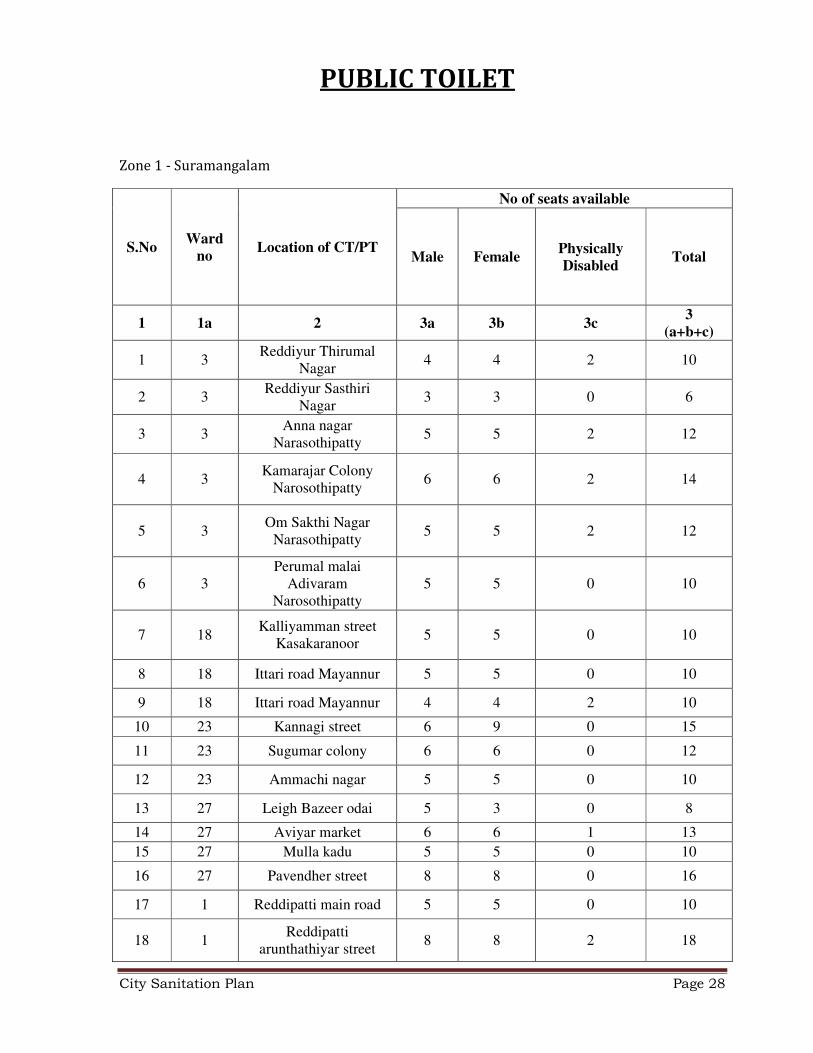
PUBLIC TOILET
Zone 1 - Suramangalam
S.No Ward
no Location of CT/PT
No of seats available
Male Female Physically
Disabled Total
1 1a 2 3a 3b 3c 3
(a+b+c)
1 3 Reddiyur Thirumal
Nagar 4 4 2 10
2 3 Reddiyur Sasthiri
Nagar 3 3 0 6
3 3 Anna nagar
Narasothipatty 5 5 2 12
4 3 Kamarajar Colony
Narosothipatty 6 6 2 14
5 3 Om Sakthi Nagar
Narasothipatty 5 5 2 12
6 3 Perumal malai
Adivaram Narosothipatty
5 5 0 10
7 18 Kalliyamman street
Kasakaranoor 5 5 0 10
8 18 Ittari road Mayannur 5 5 0 10
9 18 Ittari road Mayannur 4 4 2 10
10 23 Kannagi street 6 9 0 15
11 23 Sugumar colony 6 6 0 12
12 23 Ammachi nagar 5 5 0 10
13 27 Leigh Bazeer odai 5 3 0 8
14 27 Aviyar market 6 6 1 13
15 27 Mulla kadu 5 5 0 10
16 27 Pavendher street 8 8 0 16
17 1 Reddipatti main road 5 5 0 10
18 1 Reddipatti
arunthathiyar street 8 8 2 18
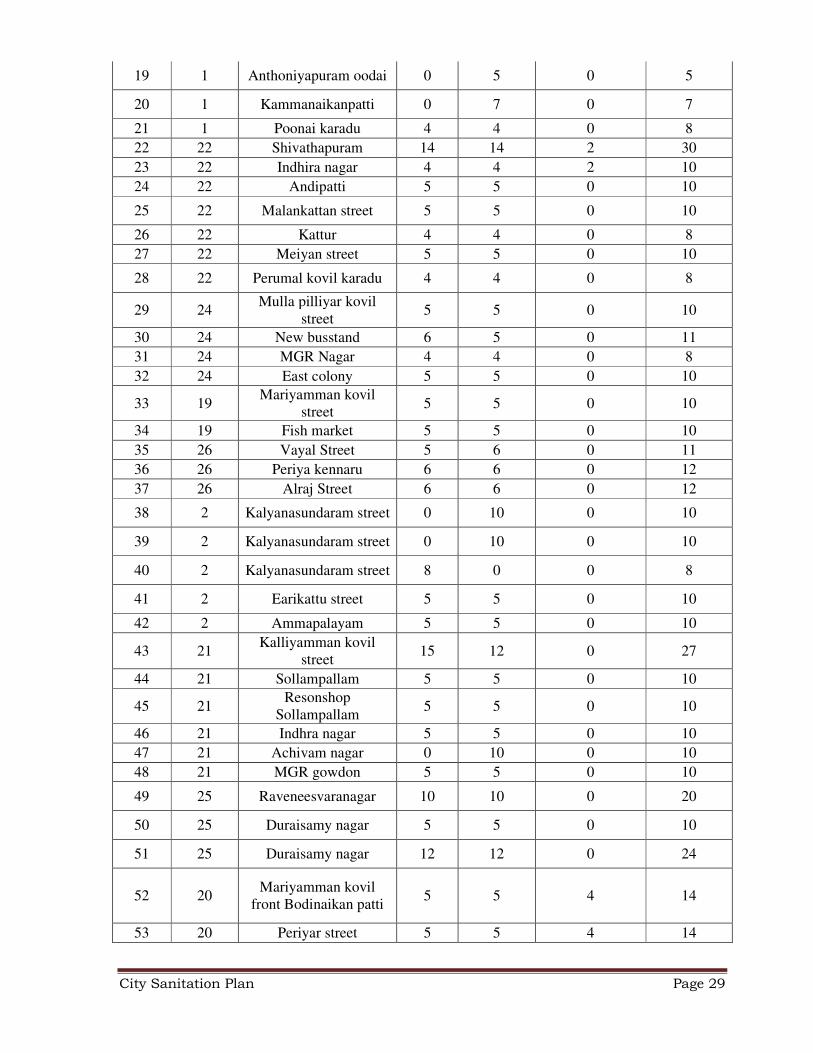
City Sanitation Plan Page 29
19 1 Anthoniyapuram oodai 0 5 0 5
20 1 Kammanaikanpatti 0 7 0 7
21 1 Poonai karadu 4 4 0 8
22 22 Shivathapuram 14 14 2 30
23 22 Indhira nagar 4 4 2 10
24 22 Andipatti 5 5 0 10
25 22 Malankattan street 5 5 0 10
26 22 Kattur 4 4 0 8
27 22 Meiyan street 5 5 0 10
28 22 Perumal kovil karadu 4 4 0 8
29 24 Mulla pilliyar kovil
street 5 5 0 10
30 24 New busstand 6 5 0 11
31 24 MGR Nagar 4 4 0 8
32 24 East colony 5 5 0 10
33 19 Mariyamman kovil
street 5 5 0 10
34 19 Fish market 5 5 0 10
35 26 Vayal Street 5 6 0 11
36 26 Periya kennaru 6 6 0 12
37 26 Alraj Street 6 6 0 12
38 2 Kalyanasundaram street 0 10 0 10
39 2 Kalyanasundaram street 0 10 0 10
40 2 Kalyanasundaram street 8 0 0 8
41 2 Earikattu street 5 5 0 10
42 2 Ammapalayam 5 5 0 10
43 21 Kalliyamman kovil
street 15 12 0 27
44 21 Sollampallam 5 5 0 10
45 21 Resonshop
Sollampallam 5 5 0 10
46 21 Indhra nagar 5 5 0 10
47 21 Achivam nagar 0 10 0 10
48 21 MGR gowdon 5 5 0 10
49 25 Raveneesvaranagar 10 10 0 20
50 25 Duraisamy nagar 5 5 0 10
51 25 Duraisamy nagar 12 12 0 24
52 20 Mariyamman kovil
front Bodinaikan patti 5 5 4 14
53 20 Periyar street 5 5 4 14
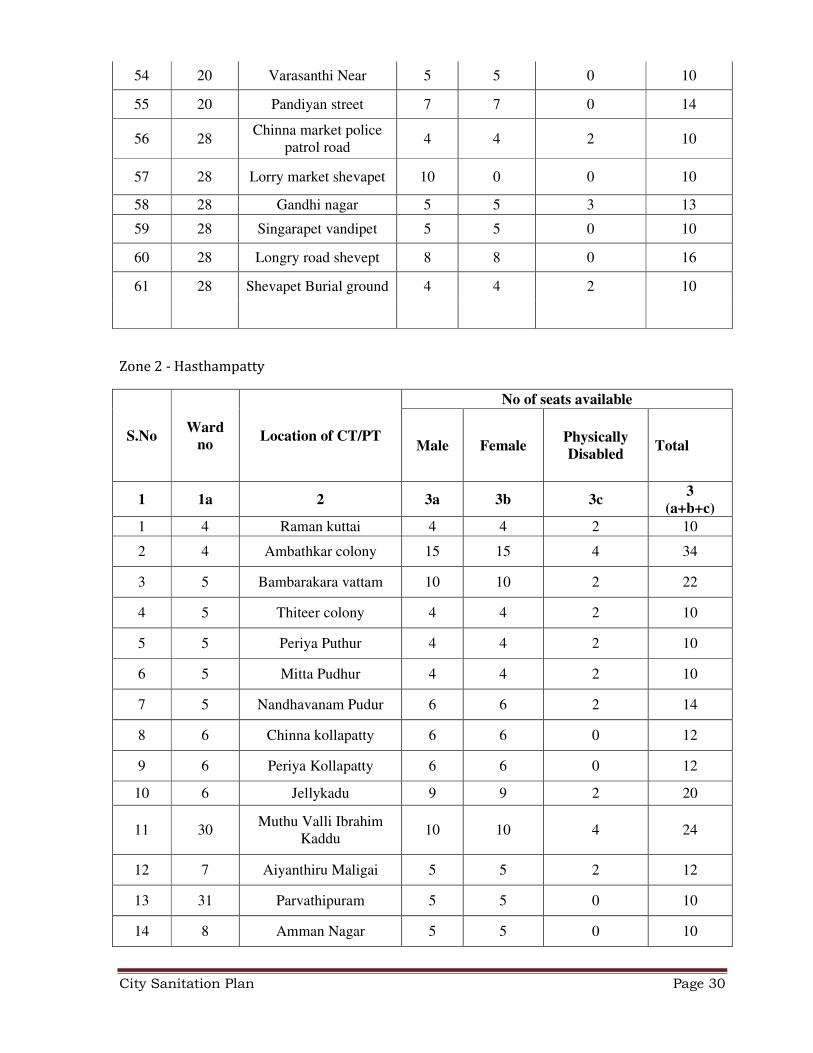
City Sanitation Plan Page 30
54 20 Varasanthi Near 5 5 0 10
55 20 Pandiyan street 7 7 0 14
56 28 Chinna market police
patrol road 4 4 2 10
57 28 Lorry market shevapet 10 0 0 10
58 28 Gandhi nagar 5 5 3 13
59 28 Singarapet vandipet 5 5 0 10
60 28 Longry road shevept 8 8 0 16
61 28 Shevapet Burial ground 4 4 2 10
Zone 2 - Hasthampatty
S.No Ward
no Location of CT/PT
No of seats available
Male Female Physically
Disabled Total
1 1a 2 3a 3b 3c 3
(a+b+c)
1 4 Raman kuttai 4 4 2 10
2 4 Ambathkar colony 15 15 4 34
3 5 Bambarakara vattam 10 10 2 22
4 5 Thiteer colony 4 4 2 10
5 5 Periya Puthur 4 4 2 10
6 5 Mitta Pudhur 4 4 2 10
7 5 Nandhavanam Pudur 6 6 2 14
8 6 Chinna kollapatty 6 6 0 12
9 6 Periya Kollapatty 6 6 0 12
10 6 Jellykadu 9 9 2 20
11 30 Muthu Valli Ibrahim
Kaddu 10 10 4 24
12 7 Aiyanthiru Maligai 5 5 2 12
13 31 Parvathipuram 5 5 0 10
14 8 Amman Nagar 5 5 0 10
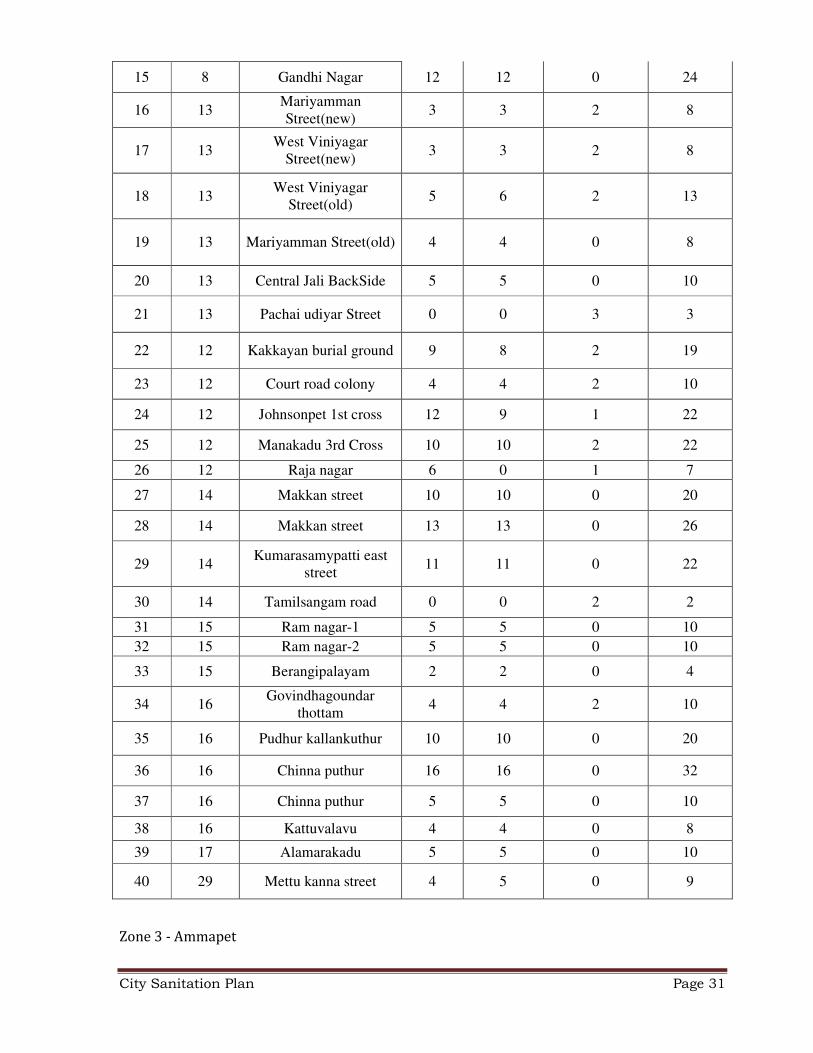
City Sanitation Plan Page 31
15 8 Gandhi Nagar 12 12 0 24
16 13 Mariyamman Street(new)
3 3 2 8
17 13 West Viniyagar
Street(new) 3 3 2 8
18 13 West Viniyagar
Street(old) 5 6 2 13
19 13 Mariyamman Street(old) 4 4 0 8
20 13 Central Jali BackSide 5 5 0 10
21 13 Pachai udiyar Street 0 0 3 3
22 12 Kakkayan burial ground 9 8 2 19
23 12 Court road colony 4 4 2 10
24 12 Johnsonpet 1st cross 12 9 1 22
25 12 Manakadu 3rd Cross 10 10 2 22
26 12 Raja nagar 6 0 1 7
27 14 Makkan street 10 10 0 20
28 14 Makkan street 13 13 0 26
29 14 Kumarasamypatti east
street 11 11 0 22
30 14 Tamilsangam road 0 0 2 2
31 15 Ram nagar-1 5 5 0 10
32 15 Ram nagar-2 5 5 0 10
33 15 Berangipalayam 2 2 0 4
34 16 Govindhagoundar
thottam 4 4 2 10
35 16 Pudhur kallankuthur 10 10 0 20
36 16 Chinna puthur 16 16 0 32
37 16 Chinna puthur 5 5 0 10
38 16 Kattuvalavu 4 4 0 8
39 17 Alamarakadu 5 5 0 10
40 29 Mettu kanna street 4 5 0 9
Zone 3 - Ammapet
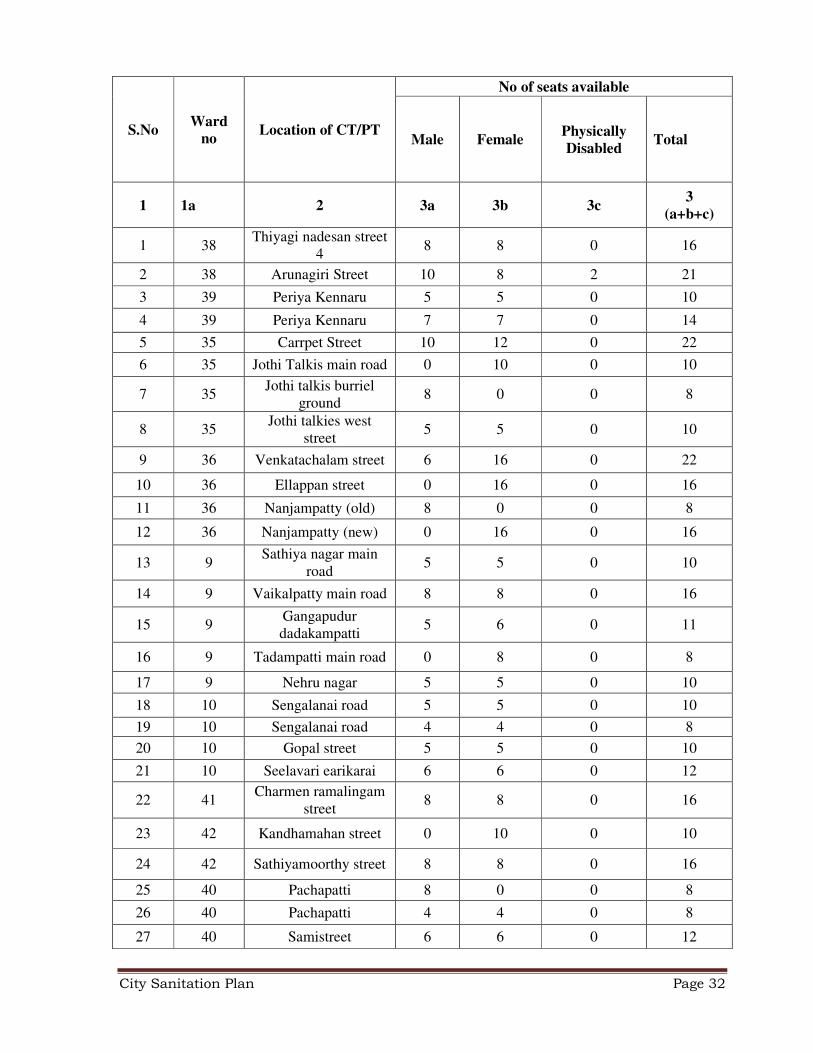
City Sanitation Plan Page 32
S.No Ward
no Location of CT/PT
No of seats available
Male Female Physically
Disabled Total
1 1a 2 3a 3b 3c 3
(a+b+c)
1 38 Thiyagi nadesan street
4 8 8 0 16
2 38 Arunagiri Street 10 8 2 21
3 39 Periya Kennaru 5 5 0 10
4 39 Periya Kennaru 7 7 0 14
5 35 Carrpet Street 10 12 0 22
6 35 Jothi Talkis main road 0 10 0 10
7 35 Jothi talkis burriel
ground 8 0 0 8
8 35 Jothi talkies west
street 5 5 0 10
9 36 Venkatachalam street 6 16 0 22
10 36 Ellappan street 0 16 0 16
11 36 Nanjampatty (old) 8 0 0 8
12 36 Nanjampatty (new) 0 16 0 16
13 9 Sathiya nagar main
road 5 5 0 10
14 9 Vaikalpatty main road 8 8 0 16
15 9 Gangapudur dadakampatti
5 6 0 11
16 9 Tadampatti main road 0 8 0 8
17 9 Nehru nagar 5 5 0 10
18 10 Sengalanai road 5 5 0 10
19 10 Sengalanai road 4 4 0 8
20 10 Gopal street 5 5 0 10
21 10 Seelavari earikarai 6 6 0 12
22 41 Charmen ramalingam
street 8 8 0 16
23 42 Kandhamahan street 0 10 0 10
24 42 Sathiyamoorthy street 8 8 0 16
25 40 Pachapatti 8 0 0 8
26 40 Pachapatti 4 4 0 8
27 40 Samistreet 6 6 0 12
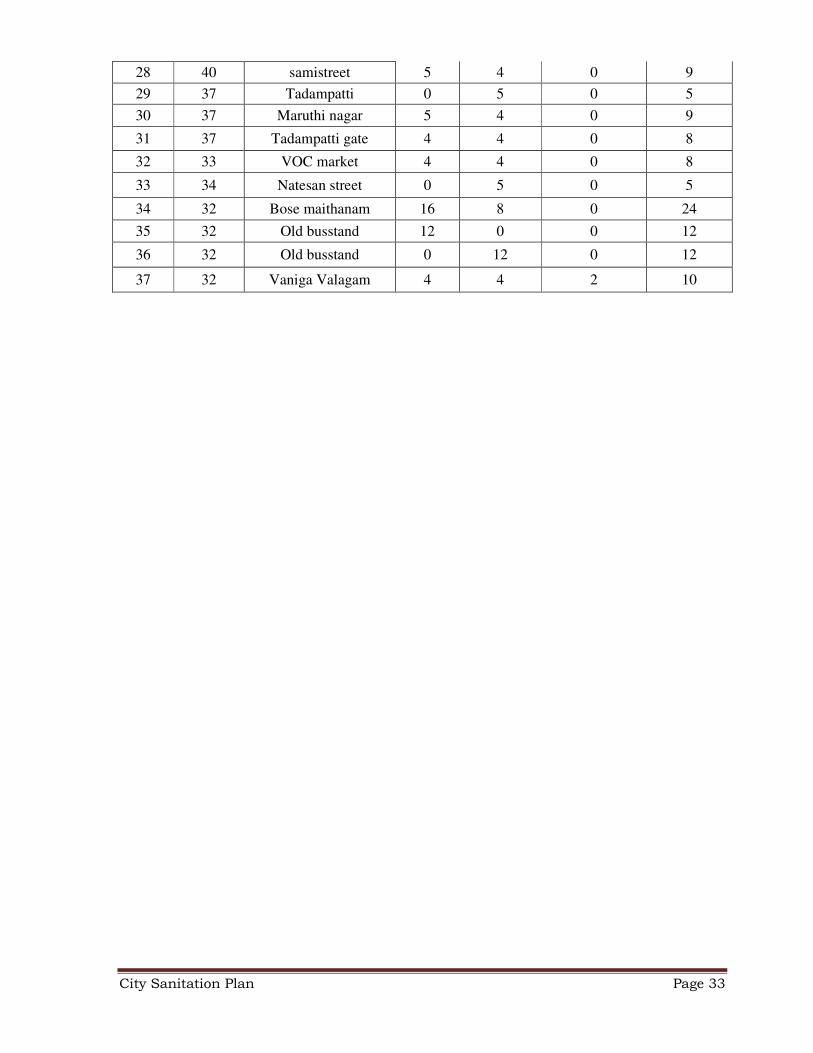
City Sanitation Plan Page 33
28 40 samistreet 5 4 0 9
29 37 Tadampatti 0 5 0 5
30 37 Maruthi nagar 5 4 0 9
31 37 Tadampatti gate 4 4 0 8
32 33 VOC market 4 4 0 8
33 34 Natesan street 0 5 0 5
34 32 Bose maithanam 16 8 0 24
35 32 Old busstand 12 0 0 12
36 32 Old busstand 0 12 0 12
37 32 Vaniga Valagam 4 4 2 10
City Sanitation Plan Page 34
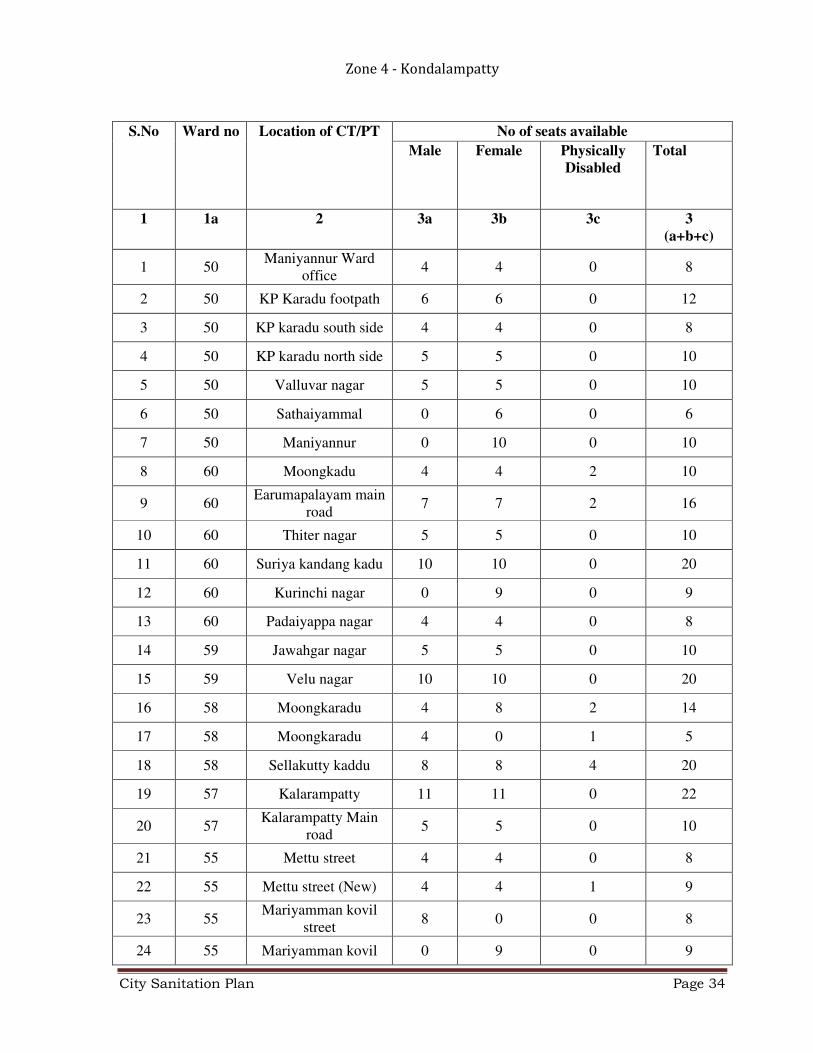
Zone 4 - Kondalampatty
S.No Ward no Location of CT/PT No of seats available
Male Female Physically
Disabled
Total
1 1a 2 3a 3b 3c 3
(a+b+c)
1 50 Maniyannur Ward
office 4 4 0 8
2 50 KP Karadu footpath 6 6 0 12
3 50 KP karadu south side 4 4 0 8
4 50 KP karadu north side 5 5 0 10
5 50 Valluvar nagar 5 5 0 10
6 50 Sathaiyammal 0 6 0 6
7 50 Maniyannur 0 10 0 10
8 60 Moongkadu 4 4 2 10
9 60 Earumapalayam main
road 7 7 2 16
10 60 Thiter nagar 5 5 0 10
11 60 Suriya kandang kadu 10 10 0 20
12 60 Kurinchi nagar 0 9 0 9
13 60 Padaiyappa nagar 4 4 0 8
14 59 Jawahgar nagar 5 5 0 10
15 59 Velu nagar 10 10 0 20
16 58 Moongkaradu 4 8 2 14
17 58 Moongkaradu 4 0 1 5
18 58 Sellakutty kaddu 8 8 4 20
19 57 Kalarampatty 11 11 0 22
20 57 Kalarampatty Main
road 5 5 0 10
21 55 Mettu street 4 4 0 8
22 55 Mettu street (New) 4 4 1 9
23 55 Mariyamman kovil
street 8 0 0 8
24 55 Mariyamman kovil 0 9 0 9
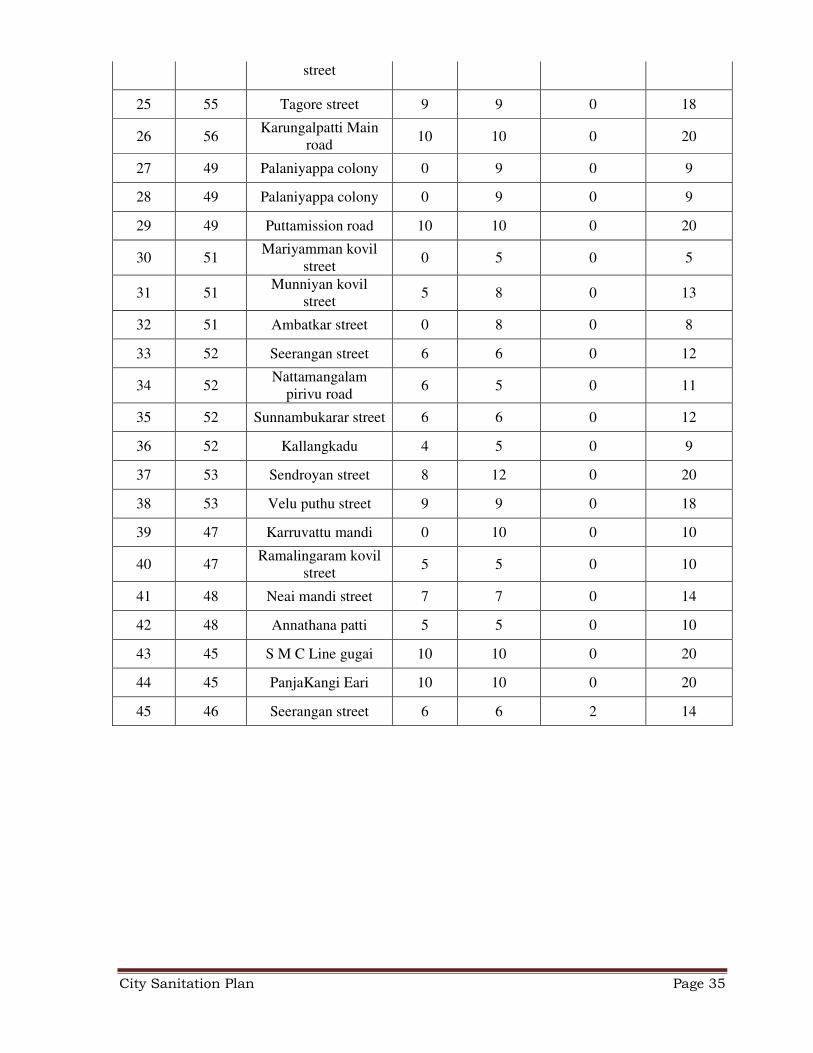
City Sanitation Plan Page 35
street
25 55 Tagore street 9 9 0 18
26 56 Karungalpatti Main
road 10 10 0 20
27 49 Palaniyappa colony 0 9 0 9
28 49 Palaniyappa colony 0 9 0 9
29 49 Puttamission road 10 10 0 20
30 51 Mariyamman kovil
street 0 5 0 5
31 51 Munniyan kovil
street 5 8 0 13
32 51 Ambatkar street 0 8 0 8
33 52 Seerangan street 6 6 0 12
34 52 Nattamangalam
pirivu road 6 5 0 11
35 52 Sunnambukarar street 6 6 0 12
36 52 Kallangkadu 4 5 0 9
37 53 Sendroyan street 8 12 0 20
38 53 Velu puthu street 9 9 0 18
39 47 Karruvattu mandi 0 10 0 10
40 47 Ramalingaram kovil
street 5 5 0 10
41 48 Neai mandi street 7 7 0 14
42 48 Annathana patti 5 5 0 10
43 45 S M C Line gugai 10 10 0 20
44 45 PanjaKangi Eari 10 10 0 20
45 46 Seerangan street 6 6 2 14
City Sanitation Plan Page 36
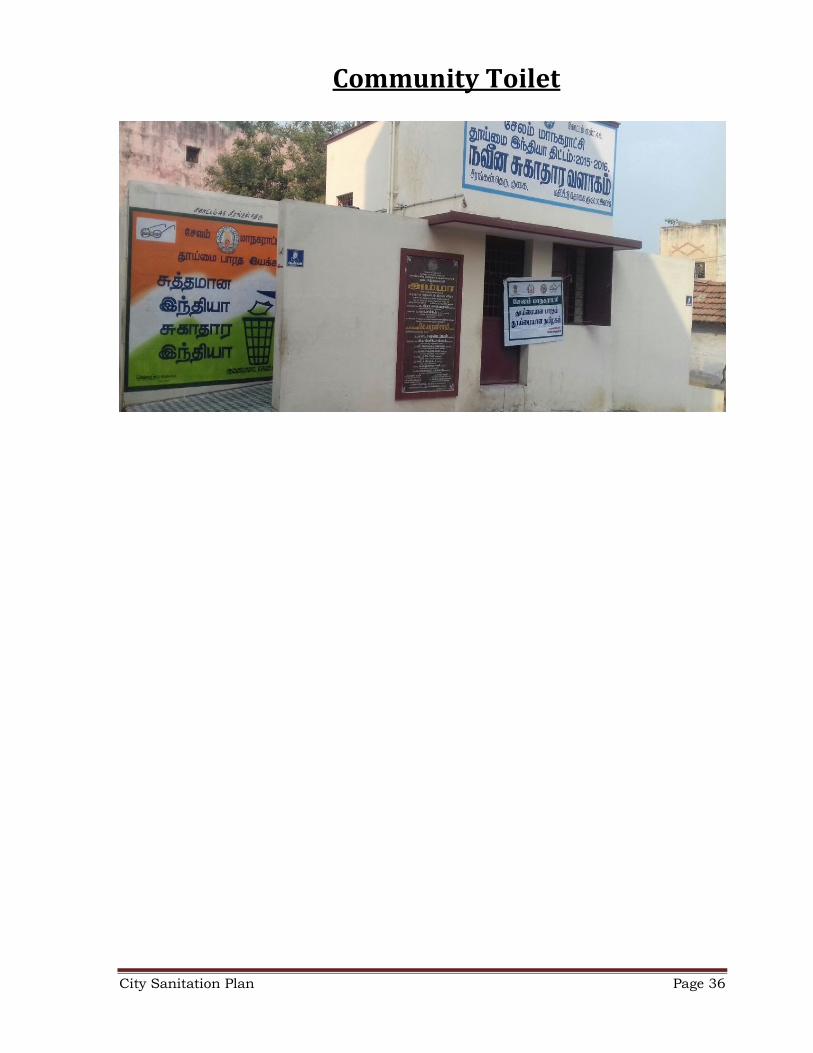
Community Toilet
City Sanitation Plan Page 37
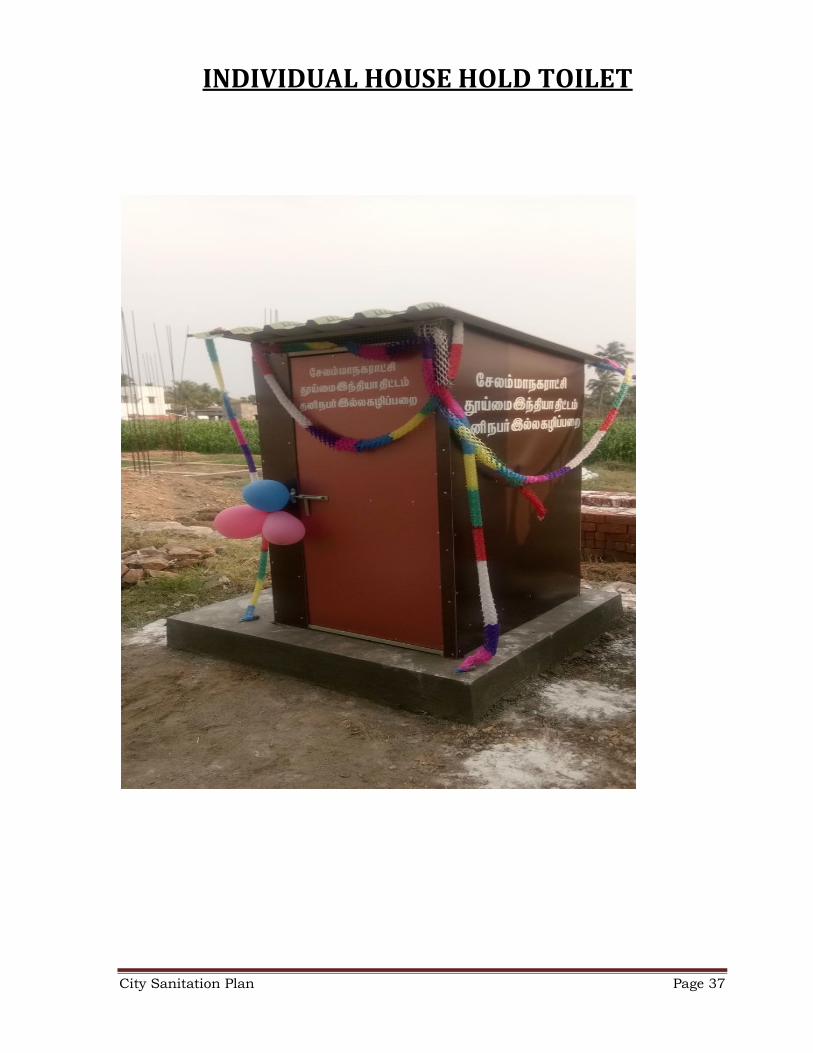
INDIVIDUAL HOUSE HOLD TOILET
City Sanitation Plan Page 38
SOLID WASTE
MANAGEMENT
City Sanitation Plan Page 39
NEED FOR SOLID WASTE MANAGEMENT
A well designed Solid Waste Management system, based
on the salient features of ‘Municipal Solid Waste
(Management & Handling) Rules 2000’ and the ‘Manual
on Solid Waste Management’ by Central Public Health &
Environmental Engineering Organization (CPHEEO) has
been framed to form an approach to Green local Body as a
model “GARBAGE FREE SALEM CITY MUNICIPAL
CORPORATION”.
There is a need to make substantial improvement in the
MSWM practices in the Corporation to raise the standards
of health, sanitation and rural environment keeping pace
with the rapid urbanization and growing population. Hence
there is a need for strengthening and modernizing of the
SWM practices. The Commissioner of Municipal
Administration, Chennai encourages the preparation of
Detail Project Report for Strengthening of Solid Waste
Management as “Resource Recovery Project” for
Salem City Municipal Corporation in Salem District.
City Sanitation Plan Page 40
The objectives of the project are ensuring the
followings
• No littering of waste on the streets.
• Segregation of recyclable and biodegradable waste at source of
waste generation and its storage at source from households,
commercial establishments.
• Proper storage facilities at public places.
• Door to door collection of waste from all households, shops and
establishments as well informal settlement on day to day basis.
• Street sweeping in all the areas including informal settlements
using improved tools.
• Transportation of biodegradable, recyclables, inert from de-
silting of
• drainages in secondary transport vehicles avoiding multiple
and manual handling of waste.
• Collection and treatment of high bio methonization potential
waste such as food waste, slaughter house waste,
chicken/mutton/fish stall, vegetable and fruit waste separately.
• Installation of Centralised Bio Methanization Plant for the
treatment of food waste, slaughter house waste and other
potential waste at the capacity of 7.5 MT per day
• Setting up a microbial compost plant of 200 MT/Day
Installation of Decentralised Resource Recovery Centres
comprising of plastic shredding machine, baler machine.
• Ensuring the residue of the waste will be scientifically disposed
to the proposed Secure Landfill Facility.
• Rehabilitating the existing dump site by revamping through bio
mining method to recover the land for beneficial usages and
also to eliminate the environmental degradation due to
uncontrolled and unscientific dumps of waste at
Erumapalayam.
City Sanitation Plan Page 41
• Involving Community, Industries, NGO and private sector in
managing the waste scientifically and cost effectively especially
for the creation of awareness on source segregation.
• Introducing the element of cost recovery through user fees
from commercial establishments, sale of compost and
recyclable materials.
• Capacity building among the concerned stakeholders of
MSWM by training. Maintaining proper data base for the
effective implementation of MSWM.
City Sanitation Plan Page 42
Demographics:
According to 2011 census, Salem City Municipal
Corporation had a population of 829267 with a sex-ratio of
969 females for every 1,000 males, much above the national
average of 929.
A total of 76,780 were under the age of six, constituting
39,515 males and 37,265 females. Scheduled Castes and
Scheduled Tribes accounted for 11% and 0.19% of the
population respectively. The average literacy of the city
was 78.43%, compared to the national average of 72.99%.
Residential areas make up 63.70% of the city total area
while commercial enterprises and industrial units make up
6.78% and 15.84% respectively. The non-urban portion of
the town constitutes about 13.68% of the total area. Salem city
has a total of 200 slums with a population of 1,31,127.
City Sanitation Plan Page 43
Municipal Administration
The Salem City Municipal Corporation was officially
constituted as municipality in the year 1866. Upgraded as a
Corporation on 1.6.1994 Initially, the city exercised its
jurisdiction over an area of 27.00 Sq.Km2 and its affairs were
administered by a c i t y level committee or municipal
committee. T h e c o r p o r a t i o n and currently, exercises its
authority over an area of 91.4 Sqkm
It comprises 60 wards and is the 5th biggest
corporation in Tamilnadu state. Practically the growth rate of
population is almost 11.9% The floating population of
75,000 may be reason for the higher capita generation of waste.
The functions of the corporation are devolved into
Four zones and one main office. comprising
departments of General, Engineering, Revenue, Public Health,
Townplanning, Accounts and the Special scheme Wing. All these
departments are under the control of a Corporation
Commissioner who is the supreme executive head.
City Sanitation Plan Page 44
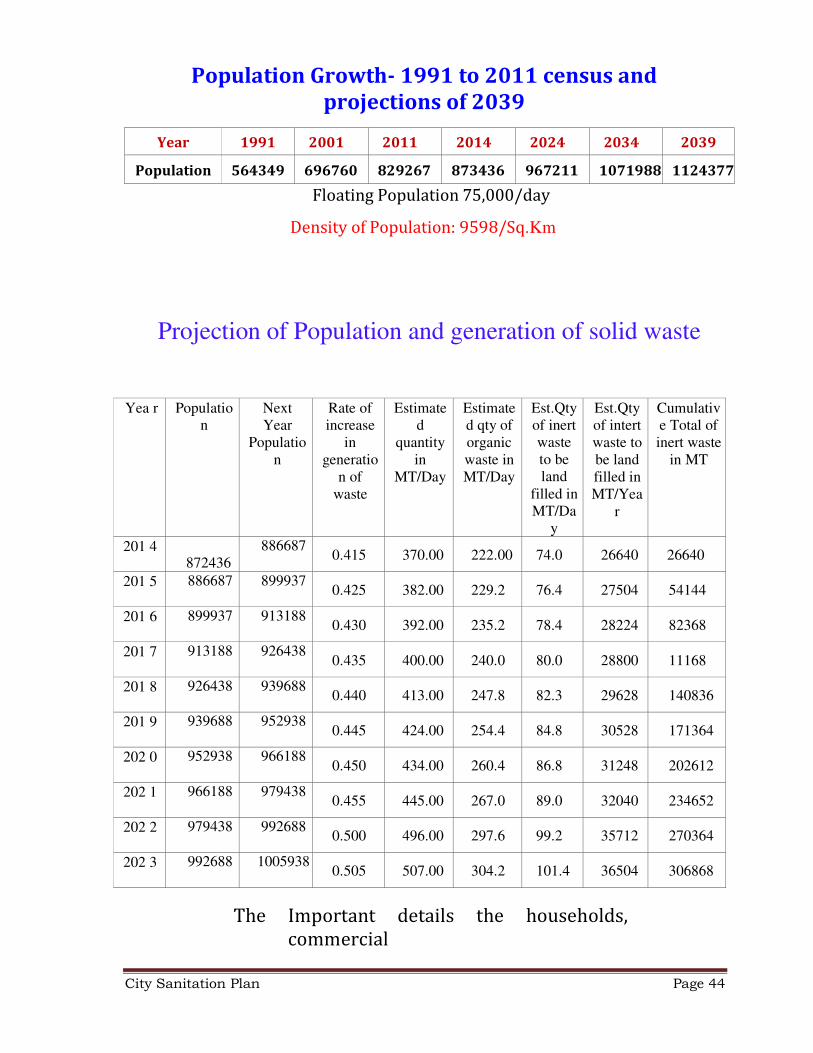
Population Growth- 1991 to 2011 census and
projections of 2039
Year 1991 2001 2011 2014 2024 2034 2039
Population 564349 696760 829267 873436 967211 1071988 1124377
Floating Population 75,000/day
Density of Population: 9598/Sq.Km
Projection of Population and generation of solid waste
Yea r Populatio n
Next Year
Populatio n
Rate of increase
in generatio
n of waste
Estimate d
quantity in
MT/Day
Estimate d qty of organic waste in MT/Day
Est.Qty of inert waste to be land
filled in MT/Da
y
Est.Qty of intert waste to be land filled in MT/Yea
r
Cumulativ e Total of inert waste
in MT
201 4 872436
886687
0.415
370.00
222.00
74.0
26640
26640
201 5 886687 899937
0.425
382.00
229.2
76.4
27504
54144
201 6 899937 913188
0.430
392.00
235.2
78.4
28224
82368
201 7 913188 926438
0.435
400.00
240.0
80.0
28800
11168
201 8 926438 939688
0.440
413.00
247.8
82.3
29628
140836
201 9 939688 952938
0.445
424.00
254.4
84.8
30528
171364
202 0 952938 966188
0.450
434.00
260.4
86.8
31248
202612
202 1 966188 979438
0.455
445.00
267.0
89.0
32040
234652
202 2 979438 992688
0.500
496.00
297.6
99.2
35712
270364
202 3 992688 1005938 0.505
507.00
304.2
101.4
36504
306868
The Important details the households,
commercial
City Sanitation Plan Page 45
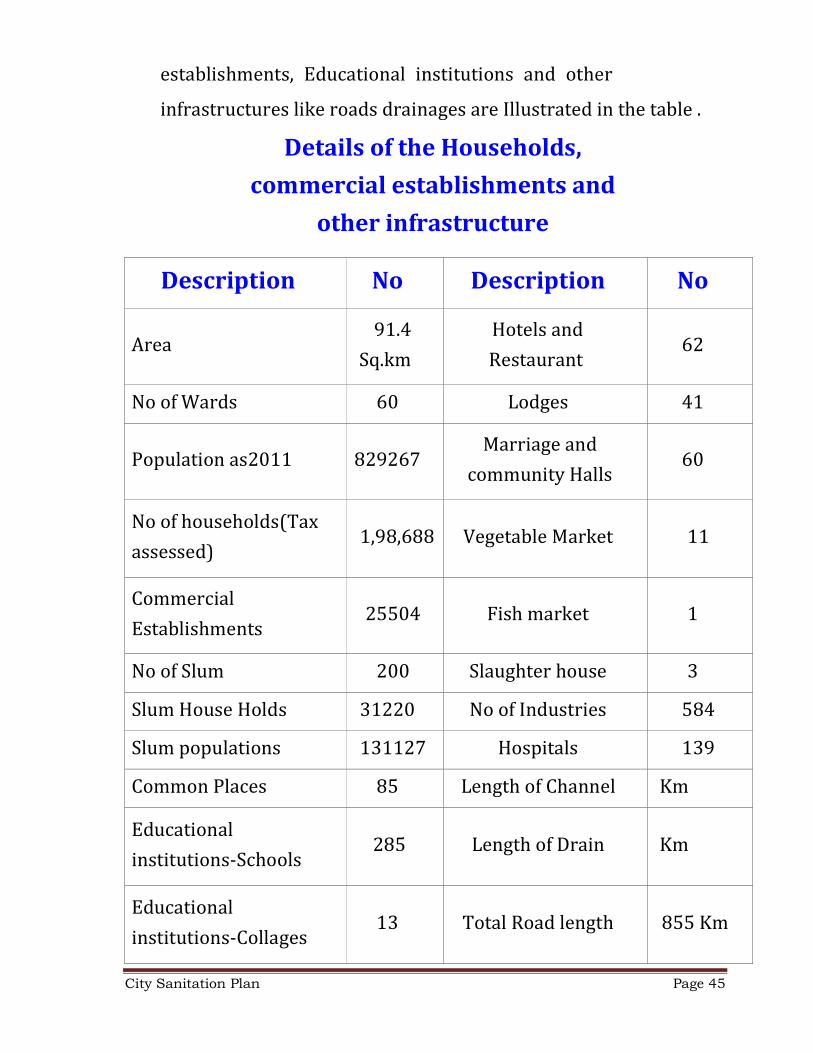
establishments, Educational institutions and other
infrastructures like roads drainages are Illustrated in the table .
Details of the Households,
commercial establishments and
other infrastructure
Description No Description No
Area
91.4
Sq.km
Hotels and
Restaurant
62
No of Wards 60 Lodges 41
Population as2011
829267
Marriage and
community Halls
60
No of households(Tax
assessed)
1,98,688
Vegetable Market
11
Commercial
Establishments
25504
Fish market
1
No of Slum 200 Slaughter house 3
Slum House Holds 31220 No of Industries 584
Slum populations 131127 Hospitals 139
Common Places 85 Length of Channel Km
Educational
institutions-Schools
285
Length of Drain
Km
Educational
institutions-Collages
13
Total Road length
855 Km
City Sanitation Plan Page 46
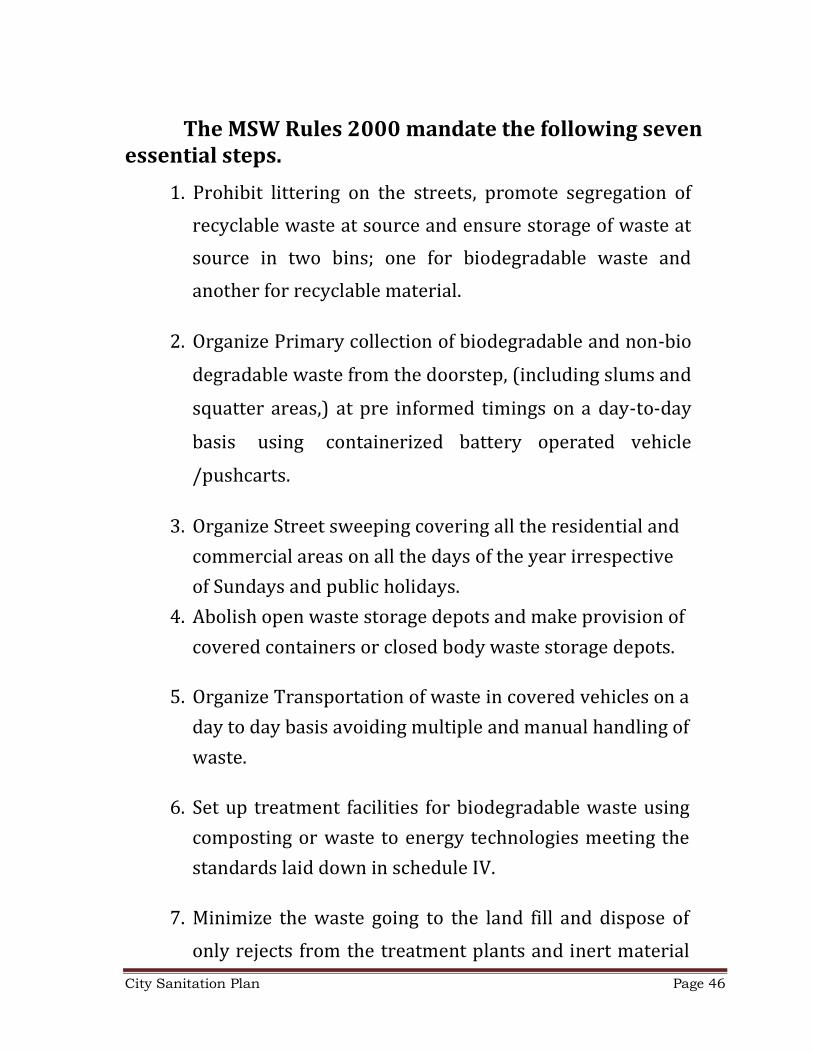
The MSW Rules 2000 mandate the following seven
essential steps.
1. Prohibit littering on the streets, promote segregation of
recyclable waste at source and ensure storage of waste at
source in two bins; one for biodegradable waste and
another for recyclable material.
2. Organize Primary collection of biodegradable and non-bio
degradable waste from the doorstep, (including slums and
squatter areas,) at pre informed timings on a day-to-day
basis using containerized battery operated vehicle
/pushcarts.
3. Organize Street sweeping covering all the residential and
commercial areas on all the days of the year irrespective
of Sundays and public holidays.
4. Abolish open waste storage depots and make provision of
covered containers or closed body waste storage depots.
5. Organize Transportation of waste in covered vehicles on a
day to day basis avoiding multiple and manual handling of
waste.
6. Set up treatment facilities for biodegradable waste using
composting or waste to energy technologies meeting the
standards laid down in schedule IV.
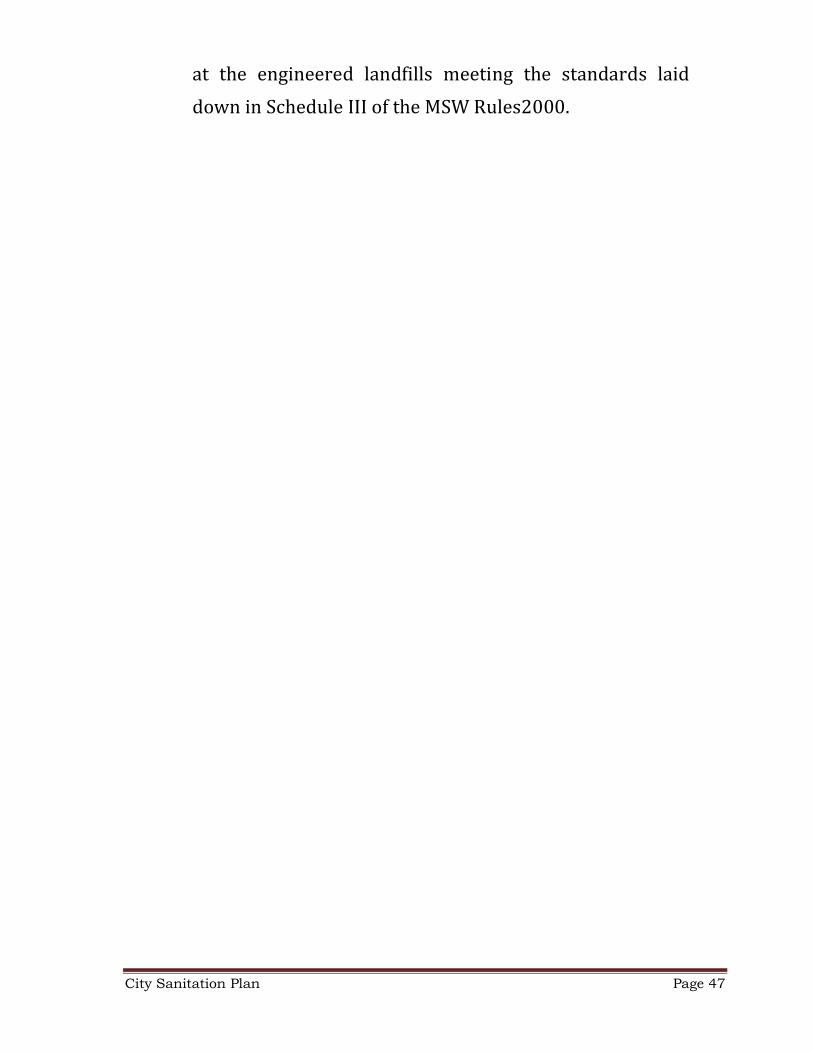
7. Minimize the waste going to the land fill and dispose of
only rejects from the treatment plants and inert material
City Sanitation Plan Page 47
at the engineered landfills meeting the standards laid
down in Schedule III of the MSW Rules2000.
City Sanitation Plan Page 48
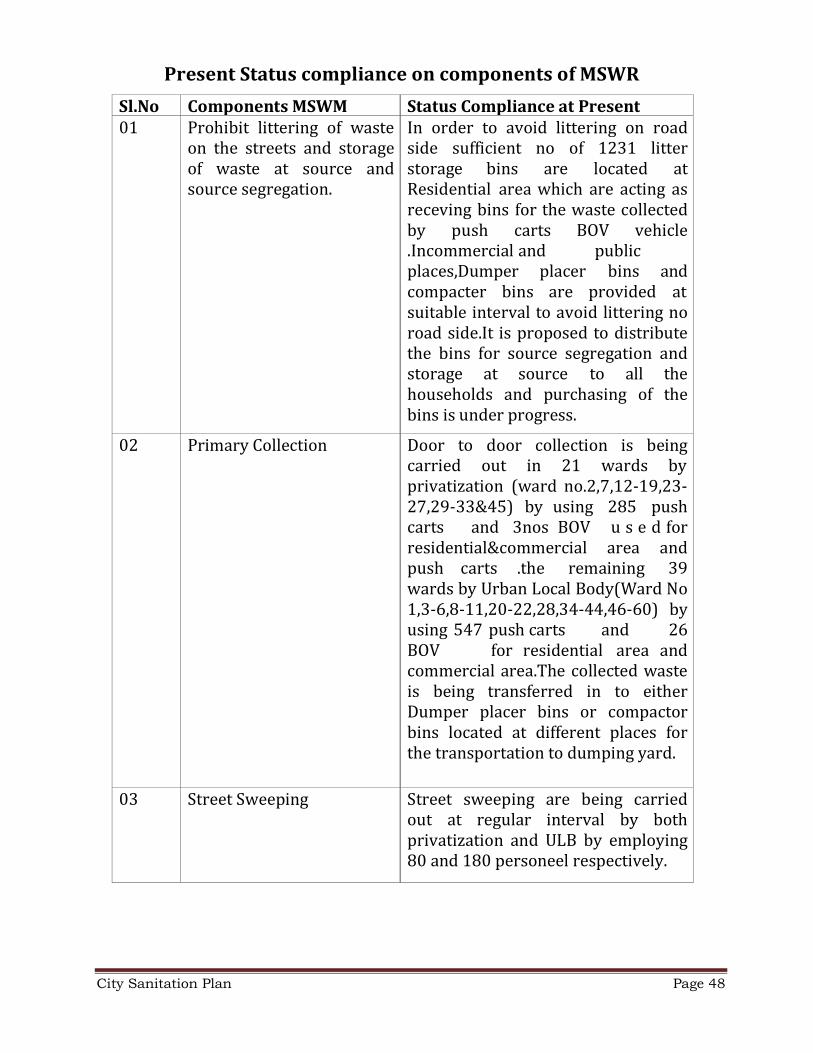
Present Status compliance on components of MSWR
Sl.No Components MSWM Status Compliance at Present
01 Prohibit littering of waste
on the streets and storage
of waste at source and
source segregation.
In order to avoid littering on road
side sufficient no of 1231 litter
storage bins are located at
Residential area which are acting as
receving bins for the waste collected
by push carts BOV vehicle
.Incommercial and public
places,Dumper placer bins and
compacter bins are provided at
suitable interval to avoid littering no
road side.It is proposed to distribute
the bins for source segregation and
storage at source to all the
households and purchasing of the
bins is under progress.
02 Primary Collection Door to door collection is being carried out in 21 wards by
privatization (ward no.2,7,12-19,23-
27,29-33&45) by using 285 push
carts and 3nos BOV u s e d for
residential&commercial area and
push carts .the remaining 39
wards by Urban Local Body(Ward No
1,3-6,8-11,20-22,28,34-44,46-60) by
using 547 push carts and 26
BOV for residential area and
commercial area.The collected waste
is being transferred in to either
Dumper placer bins or compactor
bins located at different places for
the transportation to dumping yard.
03 Street Sweeping Street sweeping are being carried
out at regular interval by both
privatization and ULB by employing
80 and 180 personeel respectively.
City Sanitation Plan Page 49
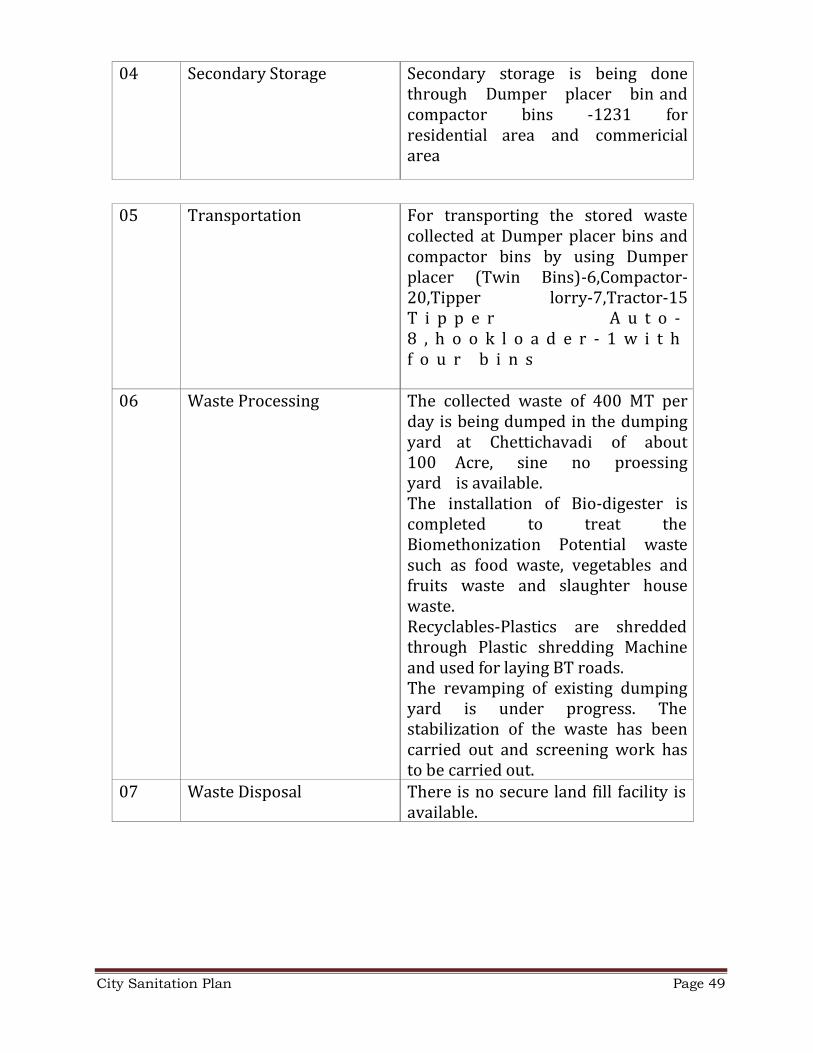
04 Secondary Storage Secondary storage is being done
through Dumper placer bin and
compactor bins -1231 for
residential area and commericial
area
05 Transportation For transporting the stored waste
collected at Dumper placer bins and
compactor bins by using Dumper
placer (Twin Bins)-6,Compactor-
20,Tipper lorry-7,Tractor-15
T i p p e r A u t o -
8 , h o o k l o a d e r - 1 w i t h
f o u r b i n s
06 Waste Processing The collected waste of 400 MT per
day is being dumped in the dumping
yard at Chettichavadi of about
100 Acre, sine no proessing
yard is available.
The installation of Bio-digester is
completed to treat the
Biomethonization Potential waste
such as food waste, vegetables and
fruits waste and slaughter house
waste.
Recyclables-Plastics are shredded
through Plastic shredding Machine
and used for laying BT roads.
The revamping of existing dumping
yard is under progress. The
stabilization of the waste has been
carried out and screening work has
to be carried out.
07 Waste Disposal There is no secure land fill facility is
available.
City Sanitation Plan Page 50
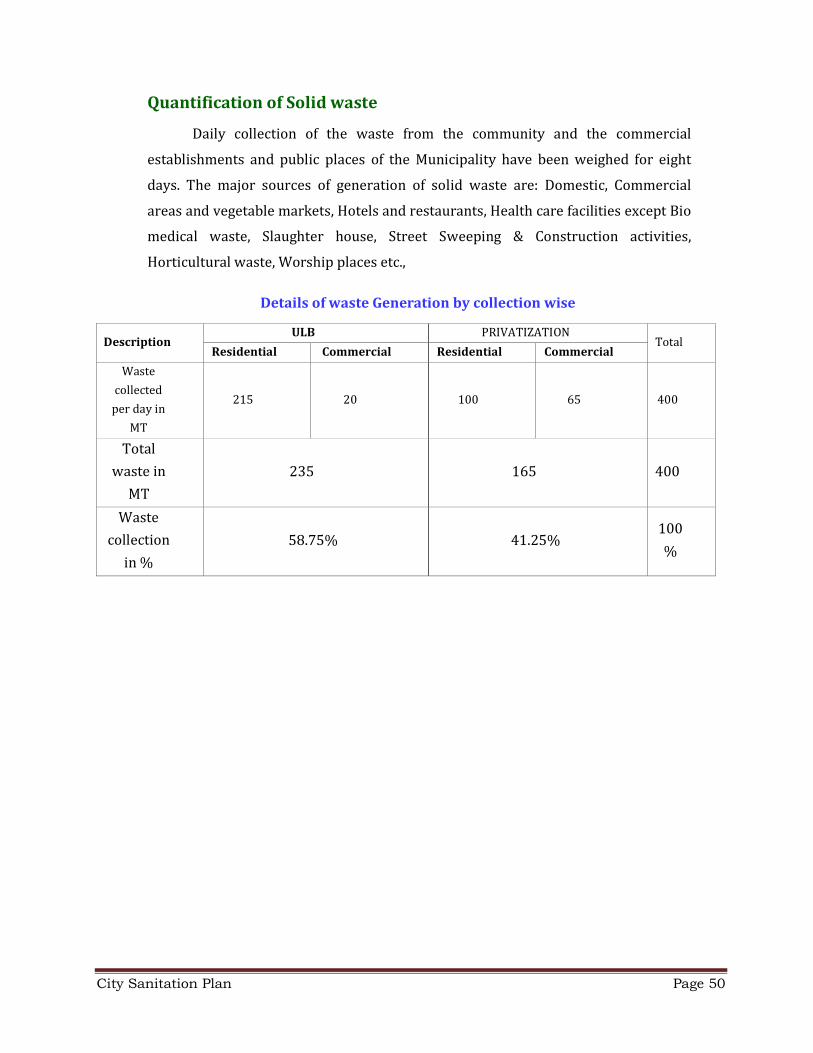
Quantification of Solid waste
Daily collection of the waste from the community and the commercial
establishments and public places of the Municipality have been weighed for eight
days. The major sources of generation of solid waste are: Domestic, Commercial
areas and vegetable markets, Hotels and restaurants, Health care facilities except Bio
medical waste, Slaughter house, Street Sweeping & Construction activities,
Horticultural waste, Worship places etc.,
Details of waste Generation by collection wise
Description ULB PRIVATIZATION
Total Residential Commercial Residential Commercial
Waste
collected
per day in
MT
215
20
100
65
400
Total
waste in
MT
235
165
400
Waste
collection
in %
58.75%
41.25%
100
%
City Sanitation Plan Page 51
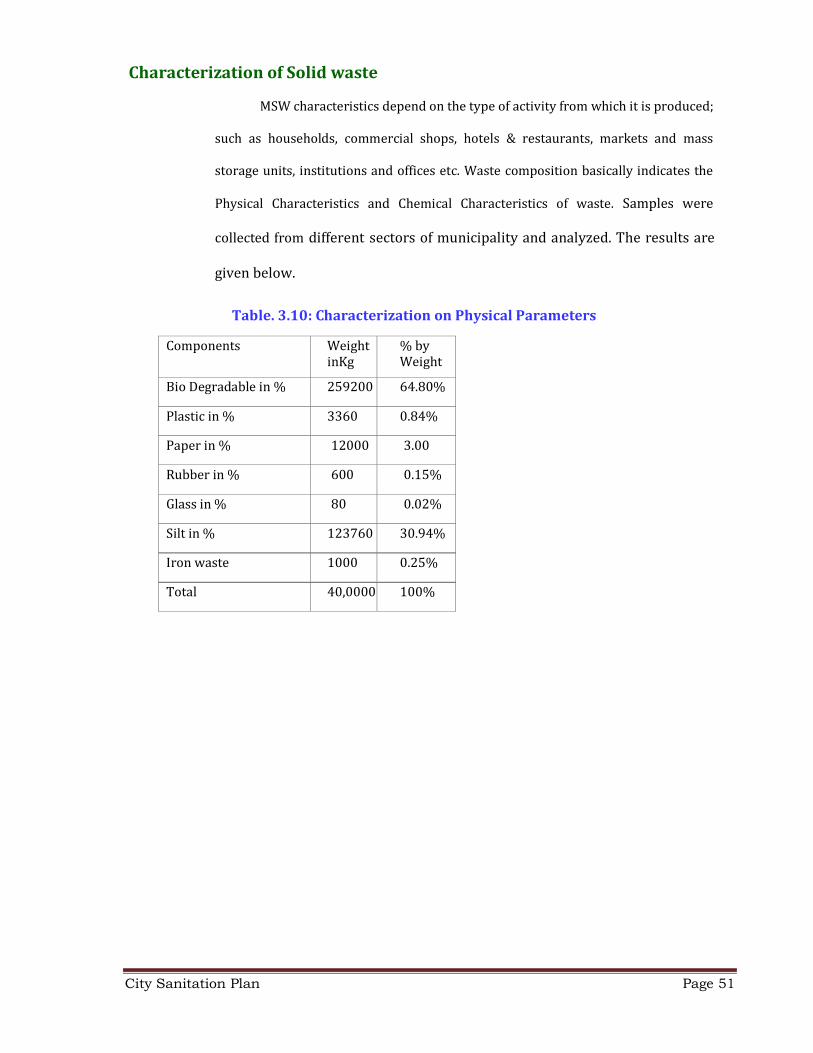
Characterization of Solid waste
MSW characteristics depend on the type of activity from which it is produced;
such as households, commercial shops, hotels & restaurants, markets and mass
storage units, institutions and offices etc. Waste composition basically indicates the
Physical Characteristics and Chemical Characteristics of waste. Samples were
collected from different sectors of municipality and analyzed. The results are
given below.
Table. 3.10: Characterization on Physical Parameters
Components Weight inKg
% by Weight
Bio Degradable in % 259200 64.80%
Plastic in % 3360 0.84%
Paper in % 12000 3.00
Rubber in % 600 0.15%
Glass in % 80 0.02%
Silt in % 123760 30.94%
Iron waste 1000 0.25%
Total 40,0000 100%
City Sanitation Plan Page 52
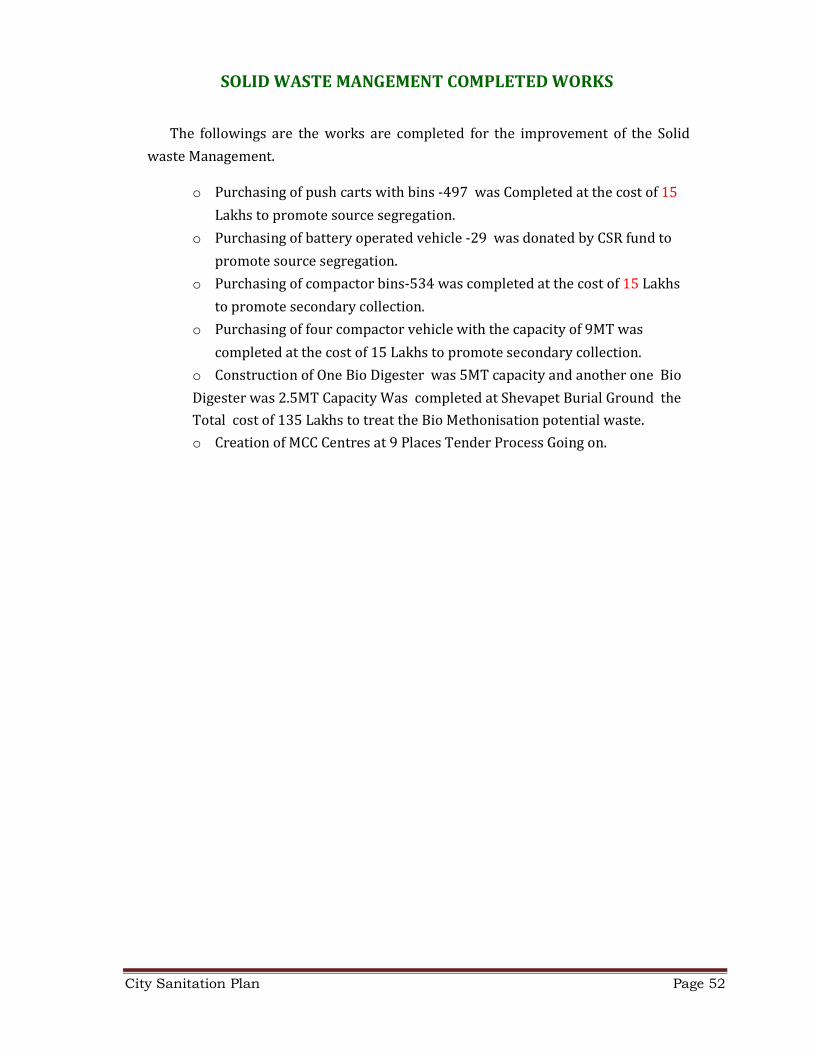
SOLID WASTE MANGEMENT COMPLETED WORKS
The followings are the works are completed for the improvement of the Solid
waste Management.
o Purchasing of push carts with bins -497 was Completed at the cost of 15
Lakhs to promote source segregation.
o Purchasing of battery operated vehicle -29 was donated by CSR fund to
promote source segregation.
o Purchasing of compactor bins-534 was completed at the cost of 15 Lakhs
to promote secondary collection.
o Purchasing of four compactor vehicle with the capacity of 9MT was
completed at the cost of 15 Lakhs to promote secondary collection.
o Construction of One Bio Digester was 5MT capacity and another one Bio
Digester was 2.5MT Capacity Was completed at Shevapet Burial Ground the
Total cost of 135 Lakhs to treat the Bio Methonisation potential waste.
o Creation of MCC Centres at 9 Places Tender Process Going on.
City Sanitation Plan Page 53
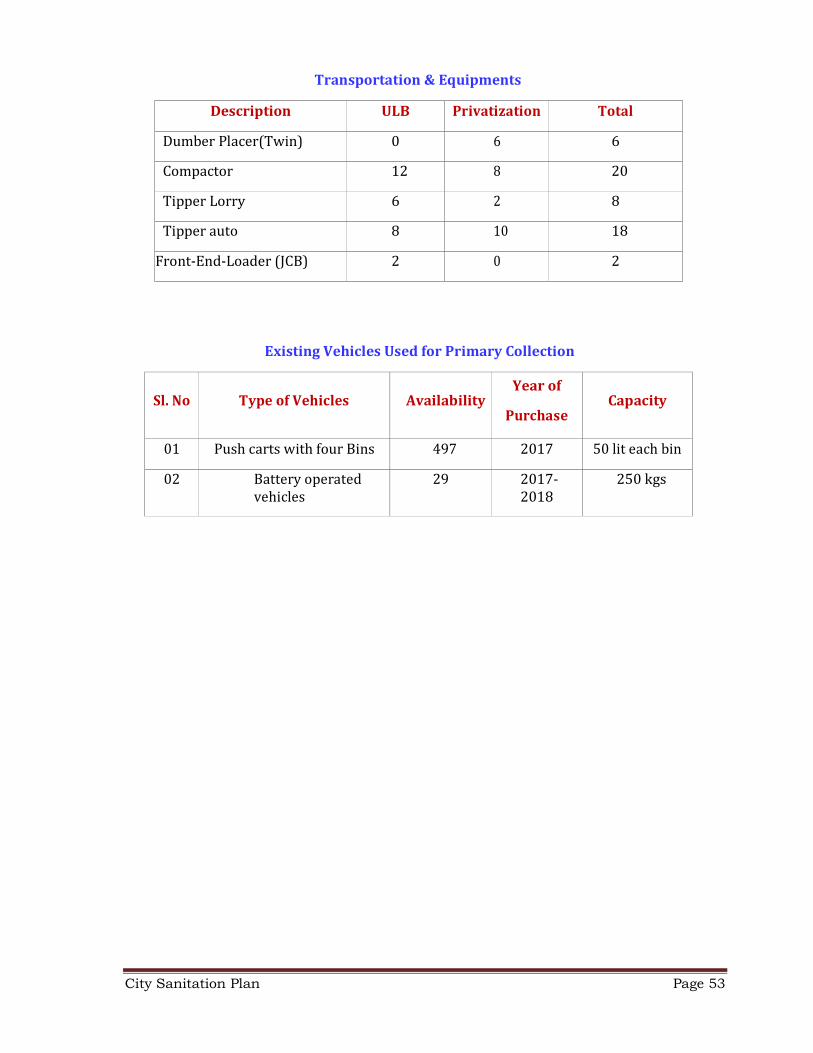
Transportation & Equipments
Description ULB Privatization Total
Dumber Placer(Twin) 0 6 6
Compactor 12 8 20
Tipper Lorry 6 2 8
Tipper auto 8 10 18
Front-End-Loader (JCB) 2 0 2
Existing Vehicles Used for Primary Collection
Sl. No
Type of Vehicles
Availability Year of
Purchase
Capacity
01 Push carts with four Bins 497 2017 50 lit each bin
02 Battery operated
vehicles
29 2017-
2018
250 kgs
City Sanitation Plan Page 54
BIOMETHANATION PLANT
Salient features of the Bio Methanization Plant
• Modified UASB model bio-digester of 5 MT /day capacity comprising
of segregation room inlet cum recycle chamber.
• Anaerobic digester of 7.7 m dia and 6.7 m height, sludge holding
tank/engine control room, gas holding balloon.
• Electro mechanical items are Bio shredder, sorting table, pumps, bio
gas storage system, Bio gas blower with motor, pressurerised bio gas
tank, biological scrubber, bio gas engine of 40/50 KVA, flame arrestor,
bio gas flame with moisture trap.
Gas generation
Power generation
Organic fertilizer
= 300 M3 / day.
= 480 Kwh/day
= 175 Tons/annum
City Sanitation Plan Page 55
PROPOSED MSW MANAGEMENT SYSTEM
Refuse
� Refusing is one of the newer ‘5R’s. Some people also call it pre-cycling. In
terms of smart waste management, this is the simple act of refusing the
excessive or unnecessary packaging. When shopping, it means saying "no
thanks" to a bag for small purchases that you can easily carry in your hands.
You can also refuse- choose to not buy - foods, beverages, or other products
in fancy, multilayer packaging that you will just have to throw into the trash
as soon as you open them.
� Refuse the use of plastic carry bags, cups, disposables, thermocol. disposable
or single use products such as razors, eating utensils, plates, and cups.
� Refuse the products which have more packaging materials.
� Do not buy products which may harm your environment. The alternative is to
use non-biodegradable products sparingly. .
For example: Cleaning products for floors etc. Cleaning products for dishes,
Polish.
Reduce
� Reducing means producing less waste so that you throw away less trash and
garbage into landfills. Reducing is the most effective way to manage waste
and the place to begin whenever you can. A simple step at the grocery store:
Bring your own cloth or mesh bags, so you don't take either paper or plastic!
You have immediately reduced the bags you might throw into the trash
when you get home. How to remember your bags? Always keep them in the
car or right by the door.
� Many items that we would normally throw out can be repaired, upgraded, or
reused. This is usually cheaper than buying a new one and saves the space of
disposing of the old one. These items include tires, shoes, home and office
furniture and equipment, lighting fixtures, lawnmowers, electronics, clothes,
and automotive parts.
� Consider reupholstering, refinishing, or donating old furniture to be used
again.
� Have large appliances repaired instead of buying new
ones. Reuse
City Sanitation Plan Page 56
� Reusing products prevents you from producing more
waste. For example
� Reuse plastic bags, Newspaper also can be reused for packaging or
wrapping.
� Donate unwanted clothing in good condition to charity shops. Clothes which
are worn out or in unsalable condition can be turned into wiping clothes.
� Tins, glasses etc. can be used as storage containers for sugar, tea bags,
salt etc.
� Reuse disposal crockery
� Reusing is pretty simple once you get into the habit, like writing a shopping
list on an opened envelope or the back of office paper rather than on a brand
new sheet. Plastic bags (both large white bags and clear produce bags) can be
reused several times before they are recycled.
Recycle
� The process of transforming materials into secondary resources for
manufacturing new products is known as Recycling.
� Waste recycling leads to less utilization of raw materials, saves on landfill
space, reduces the amount of energy required to manufacture new products.
In fact recycling can prevent the creation of waste at the source.
� Prepare your recyclables according to the directions given by your recycling
provider. This will make it easier and less costly for them to continue
providing these services.
� Dry waste consisting of cans, aluminium foils, plastics, metal, glass, and paper
could be recycled.
� Turn “waste” into a new product.
For example: Bottle caps can be used for making bags, chairs or tables.
Ring pulls from drink and food cans can be woven into form bags. Patches
of old cloth can be used for making cushions or teddies. Make earrings out
of newspaper. Roll the paper into the shape of pearls, and then paint and
varnish them.
Recover
� Source separation: by keeping recyclables and organics waste separate at
source, i.e., at the point of generation facilitate reuse, recycling, and
composting to recover nutrient value from organic matter.
� Home composting is best option to recover the nutrient at decentralized at
source itself.
City Sanitation Plan Page 57
� Energy can be recovered from the Bio Methonisation Potential waste such as
food waste, vegetable and food waste and slaughter waste through Bio
Digseter. This can avoid the Green House Gas discharged in to atmosphere
responsible for Global Warming.
� Simple way of recovering the vegetable waste and market waste in to
nitrogen enriched cow dung by feeding the cattle.
City Sanitation Plan Page 58
Recovery of Recycling
The recyclable waste will be collected separately with various methods and
sorted out in the mechanized sorting table according to the nature and sold.The
Municipality is also planning to buy another higher capacity plastic pulverizer for
plastic materials processing.
In plastic reprocessing after the types of plastic separated is a Mechanical
processing to run the plastic through the Pulverizer.
Pulverizer crushes the plastic into tiny shreds or granules. Plastic pulverizer
is the particular equipment for recycling disused insignificant materials in
producing and grinding heat-sensitivity plastic such as PVC.
The recovered shredded plastic will be used for laying plastic road as the
partial replacement of bitumen.
Baling machine will also be installed to bale rags as RDF.
City Sanitation Plan Page 59
Green belt Development
In order to nullify the effects emission of carbon do oxide during composting
process, it is planned to develop the green belt all-around the compost yard on
the periphery of the compound wall in two rows where is possible using thorn
less bamboo. Bamboo is the best practical atmospheric carbon absorbing plant. It
is the fastest and least expensive way to solve the problems of Carbon dioxide
emission and water pollution. It is proposed to plant Thorn less variety Bamboo
all around the compost plant as green belt and the plantation will be carried out
on completion of the construction of compound wall.
City Sanitation Plan Page 60
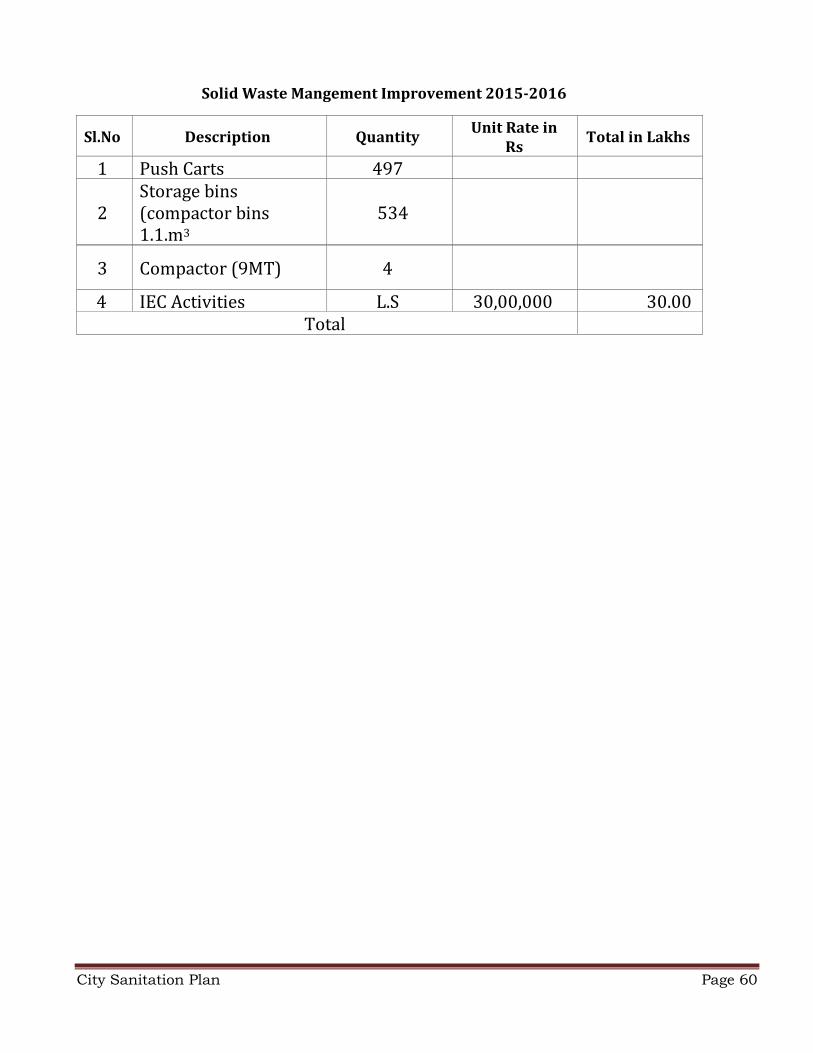
Solid Waste Mangement Improvement 2015-2016
Sl.No
Description
Quantity Unit Rate in
Rs
Total in Lakhs
1 Push Carts 497
2
Storage bins
(compactor bins
1.1.m3
534
3
Compactor (9MT)
4
4 IEC Activities L.S 30,00,000 30.00
Total
City Sanitation Plan Page 61
WATER SUPPLY
City Sanitation Plan
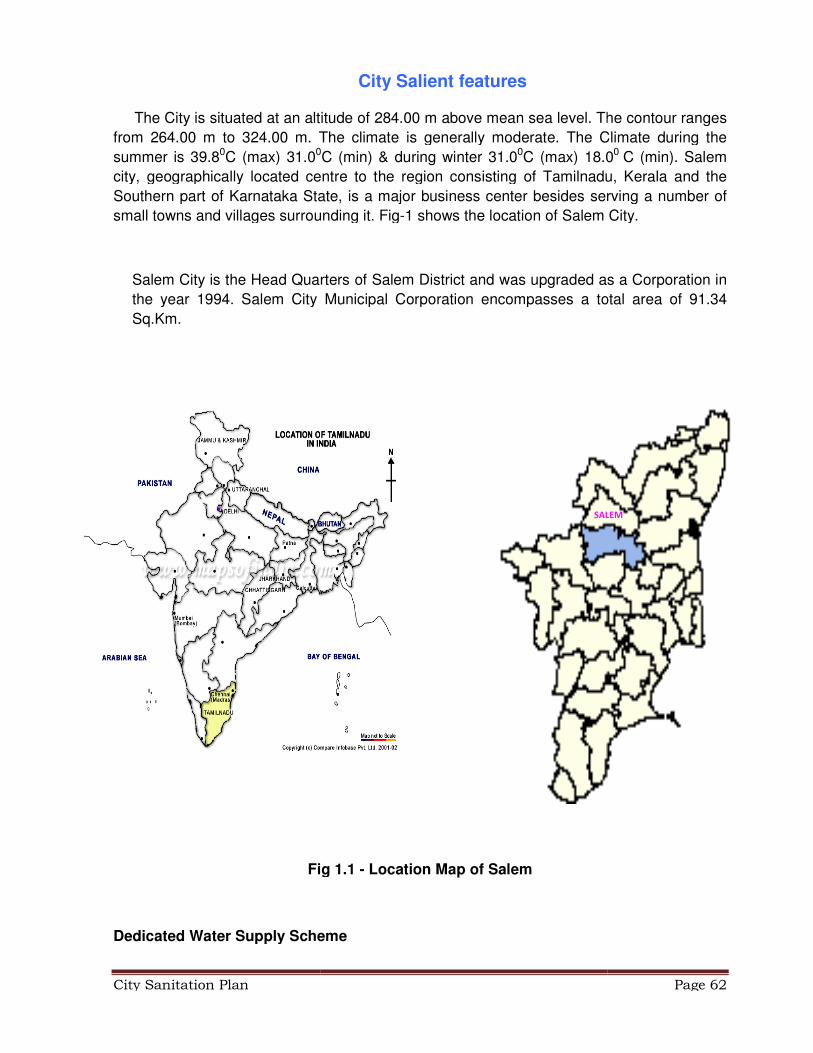
The City is situated at an altitude of 284.00 m above mean sea level. The contour ranges
from 264.00 m to 324.00 m. The climate is generally moderate. The Climate during the
summer is 39.80C (max) 31.00
city, geographically located centre to the region consisting of Tamilnadu, Kerala and the
Southern part of Karnataka State, is a major business center besides serving a number of
small towns and villages surrounding it. Fig
Salem City is the Head Quarters of Salem District and was upgraded as a Corporation in
the year 1994. Salem City Municipal Corporation encompasses a total area of 91.34
Sq.Km.
Fig 1.1
Dedicated Water Supply Scheme
City Salient features
The City is situated at an altitude of 284.00 m above mean sea level. The contour ranges
from 264.00 m to 324.00 m. The climate is generally moderate. The Climate during the 0C (min) & during winter 31.00C (max) 18.0
city, geographically located centre to the region consisting of Tamilnadu, Kerala and the
Southern part of Karnataka State, is a major business center besides serving a number of
small towns and villages surrounding it. Fig-1 shows the location of Salem City.
Salem City is the Head Quarters of Salem District and was upgraded as a Corporation in
the year 1994. Salem City Municipal Corporation encompasses a total area of 91.34
Fig 1.1 - Location Map of Salem
Dedicated Water Supply Scheme
SALEM
Page 62
The City is situated at an altitude of 284.00 m above mean sea level. The contour ranges
from 264.00 m to 324.00 m. The climate is generally moderate. The Climate during the
C (max) 18.00 C (min). Salem
city, geographically located centre to the region consisting of Tamilnadu, Kerala and the
Southern part of Karnataka State, is a major business center besides serving a number of
Salem City.
Salem City is the Head Quarters of Salem District and was upgraded as a Corporation in
the year 1994. Salem City Municipal Corporation encompasses a total area of 91.34
SALEM
City Sanitation Plan Page 63
The population of Salem Corporation as per census 2001 is 6, 93,236 which is estimated
to be about 8.2 lakhs in the year 2010. Consequent to Salem being a Corporation now,
the rate of water supply to be adopted as per CPHEEO norms is 135 lpcd.
Design Criteria
(a) Design Period : 30 years
Base year : 2010
Intermediate Period : 15 years (2025)
Ultimate Period : 30 years (2040)
(b) Population
Population (2001) : 6, 93,236
Base year Population (2010) : 8, 20, 000
Intermediate Stage Population (2025) : 10, 52,000
Ultimate Stage Population (2040 ) : 13, 24,000
Per capita Water Supply for Corporation
Area as per CPHEEO norms : 135 lpcd
Existing & Proposed water supply system
Existing water supply system details:
Population Covered : 8,29,267
City Sanitation Plan Page 64
Area Covered : 91.34 sq.kms
Per Capita supply : 135 LPCD
Distribution Network : 821.70 km
Water supply storage capacity : 56 Nos. OHT (458.00 Lakhs litres)
HSC : 1,05,435
Dedicated Water supply scheme details:
Population covered ( Based year 2010) : 8, 20, 000
Area covered : 91.34 sq.km
Dist network :212.km
Per Capita supply : 135 lpcd
Distribution system (100mm dia to 600mm dia DI K7 pipe)
Proposed New length : 16.35 km
Replacement length : 119.55 km
Total : 135.9km
Water storage capacity :22 Nos OHT ( 169.50 lakhs litres)
HSC ( Old + New) : 56 Nos. OHT (458.00 lakhs litres)
SCADA System : For entire pumping and distribution system.
Dedicated Water supply scheme details:
Base year Population (2010) : 8, 20, 000 – 120.74MLD
Intermediate Stage Population (2025) : 10, 52,000 – 154.52 MLD
Ultimate Stage Population (2040) : 13, 24,000 – 193.74 MLD
Rezoning of Dist. System : A.
City Sanitation Plan Page 65
B.
C.
D.
E.
F.Total ----
Per capita Water Supply : 135lpcd
Water storage capacity : 22 Nos OHT (169.50 lakhs litres)
HSC : --------
No. of Zones : 56nos.
SCADA System : For entire pumping and distribution system.
Description of the DWSS scheme:
It is implement in Two Stages.
Under Stage I the components involving Raw water drawl, WTP, Clear water conveyance
up to Salem Corporation area entry point has been taken up. The other components ,
namely Feeder mains, ELSRs, distribution system, SCADA etc is proposed to be
executed Under Stage II.
i.The head works with source of drawl is by using vertical turbine pump of 180 KW
(2315 m3/hour of 4 Nos (3+1)) in the left bank of river Cauvery on the downstream
of Mettur Dam.
ii.Raw water is being pumped by using horizontal turbine pump of 675 KW (2247
m3/hour of 4 Nos (3+1)) through 1300 mm dia MS pipe line to the Water treatment
plant at Thottilpatti village which is about 100 m from the pump house.
iii.Raw water is being treated by conventional treatment method; the clear water is
being stored in RCC underground sump of about 30 minutes capacity wherefrom
the clear water is being pumped for onward transmission.
iv.Pumping from water treatment plant to the Salem city limits of the corporation is
through three different reaches with an intermediate booster station.
City Sanitation Plan Page 66
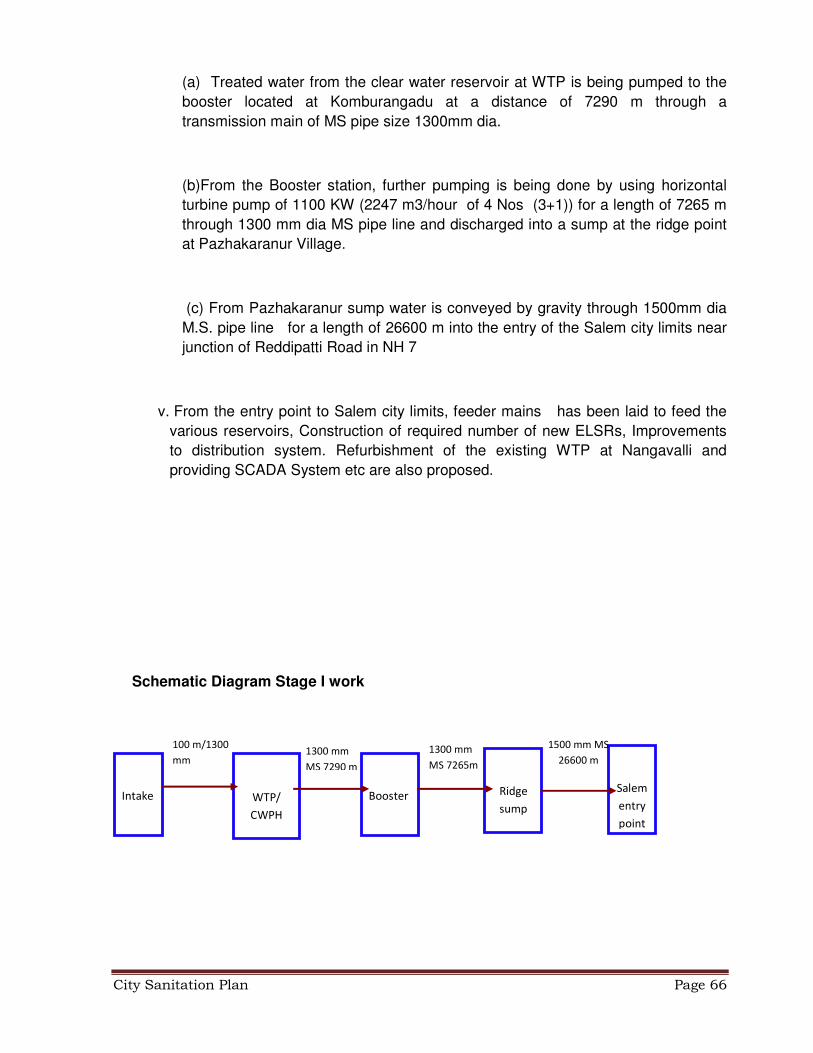
(a) Treated water from the clear water reservoir at WTP is being pumped to the
booster located at Komburangadu at a distance of 7290 m through a
transmission main of MS pipe size 1300mm dia.
(b)From the Booster station, further pumping is being done by using horizontal
turbine pump of 1100 KW (2247 m3/hour of 4 Nos (3+1)) for a length of 7265 m
through 1300 mm dia MS pipe line and discharged into a sump at the ridge point
at Pazhakaranur Village.
(c) From Pazhakaranur sump water is conveyed by gravity through 1500mm dia
M.S. pipe line for a length of 26600 m into the entry of the Salem city limits near
junction of Reddipatti Road in NH 7
v. From the entry point to Salem city limits, feeder mains has been laid to feed the
various reservoirs, Construction of required number of new ELSRs, Improvements
to distribution system. Refurbishment of the existing WTP at Nangavalli and
providing SCADA System etc are also proposed.
Schematic Diagram Stage I work
WTP/
CWPH
Intake
Booster
Ridge
sump
Salem
entry
point
100 m/1300
mm 1300 mm
MS 7290 m
1300 mm
MS 7265m
1500 mm MS
26600 m
City Sanitation Plan Page 67
City Sanitation Plan Page 68
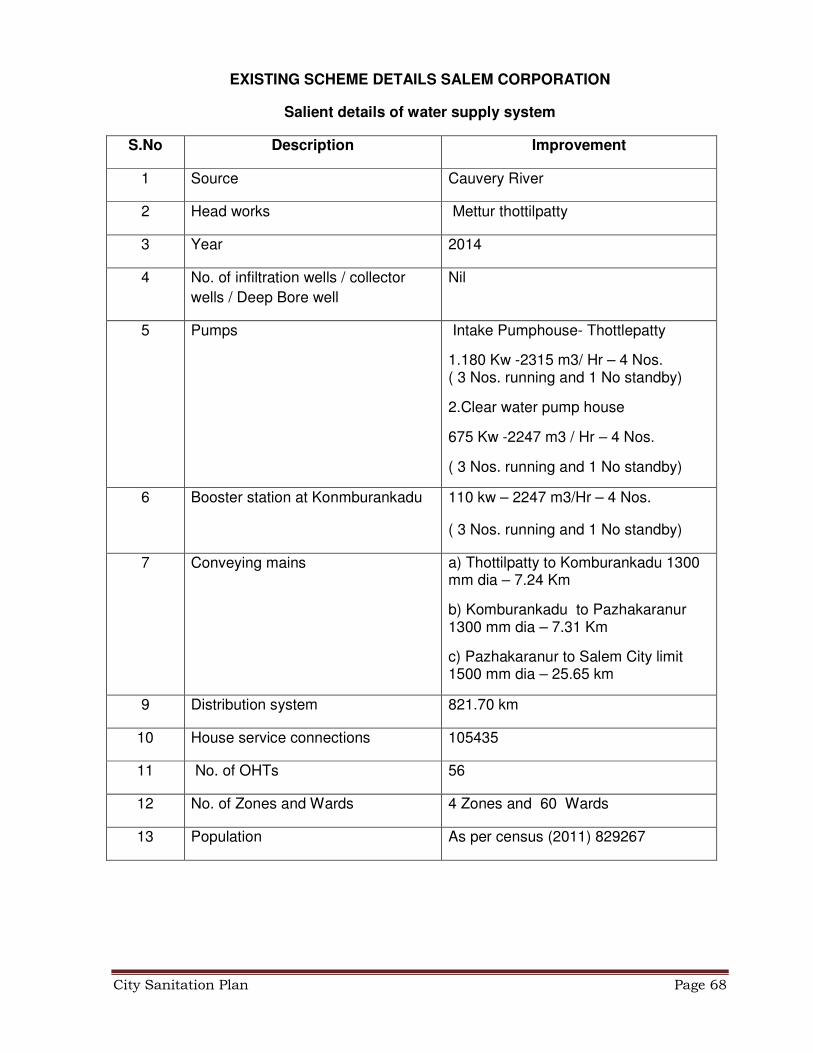
EXISTING SCHEME DETAILS SALEM CORPORATION
Salient details of water supply system
S.No Description Improvement
1 Source Cauvery River
2 Head works Mettur thottilpatty
3 Year 2014
4 No. of infiltration wells / collector
wells / Deep Bore well
Nil
5 Pumps Intake Pumphouse- Thottlepatty
1.180 Kw -2315 m3/ Hr – 4 Nos. ( 3 Nos. running and 1 No standby)
2.Clear water pump house
675 Kw -2247 m3 / Hr – 4 Nos.
( 3 Nos. running and 1 No standby)
6 Booster station at Konmburankadu 110 kw – 2247 m3/Hr – 4 Nos.
( 3 Nos. running and 1 No standby)
7 Conveying mains a) Thottilpatty to Komburankadu 1300 mm dia – 7.24 Km
b) Komburankadu to Pazhakaranur 1300 mm dia – 7.31 Km
c) Pazhakaranur to Salem City limit 1500 mm dia – 25.65 km
9 Distribution system 821.70 km
10 House service connections 105435
11 No. of OHTs 56
12 No. of Zones and Wards 4 Zones and 60 Wards
13 Population As per census (2011) 829267
City Sanitation Plan Page 69
UNDER GROUND
SEWERAGE SCHEME
City Sanitation Plan Page 70
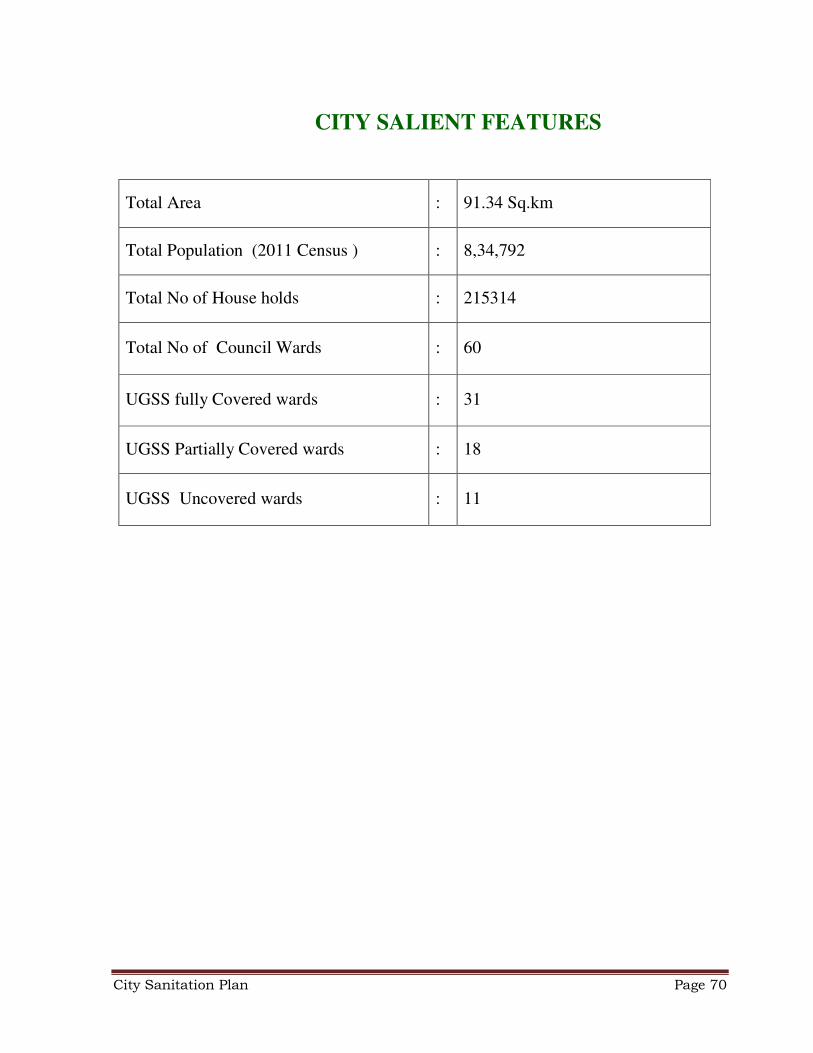
CITY SALIENT FEATURES
Total Area : 91.34 Sq.km
Total Population (2011 Census ) : 8,34,792
Total No of House holds : 215314
Total No of Council Wards : 60
UGSS fully Covered wards : 31
UGSS Partially Covered wards : 18
UGSS Uncovered wards : 11
City Sanitation Plan Page 71
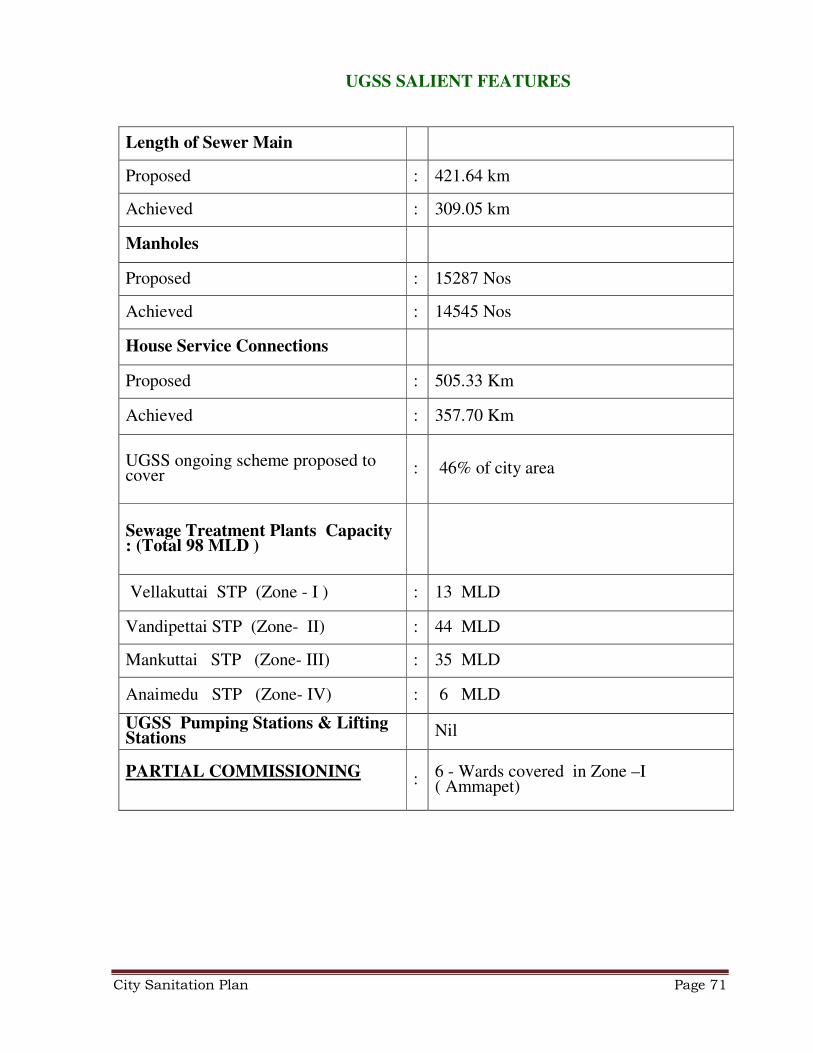
UGSS SALIENT FEATURES
Length of Sewer Main
Proposed : 421.64 km
Achieved : 309.05 km
Manholes
Proposed : 15287 Nos
Achieved : 14545 Nos
House Service Connections
Proposed : 505.33 Km
Achieved : 357.70 Km
UGSS ongoing scheme proposed to cover : 46% of city area
Sewage Treatment Plants Capacity : (Total 98 MLD )
Vellakuttai STP (Zone - I ) : 13 MLD
Vandipettai STP (Zone- II) : 44 MLD
Mankuttai STP (Zone- III) : 35 MLD
Anaimedu STP (Zone- IV) : 6 MLD
UGSS Pumping Stations & Lifting Stations Nil
PARTIAL COMMISSIONING :
6 - Wards covered in Zone –I ( Ammapet)
City Sanitation Plan Page 72
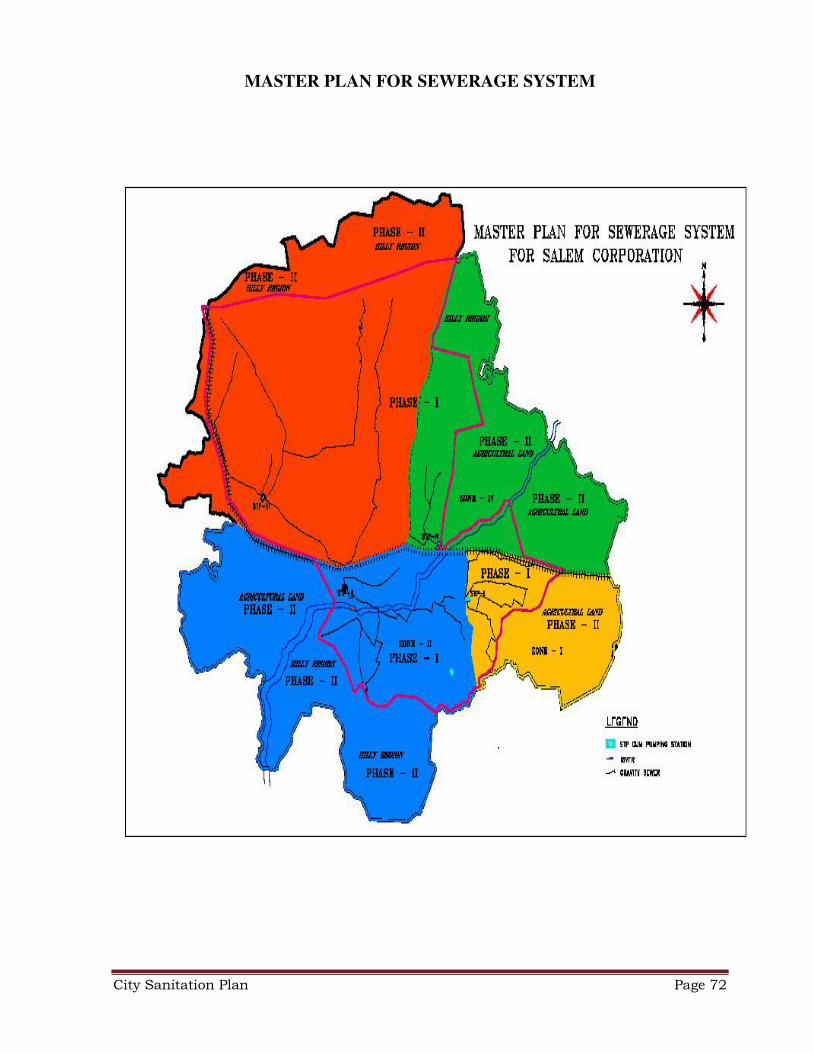
MASTER PLAN FOR SEWERAGE SYSTEM
City Sanitation Plan Page 73
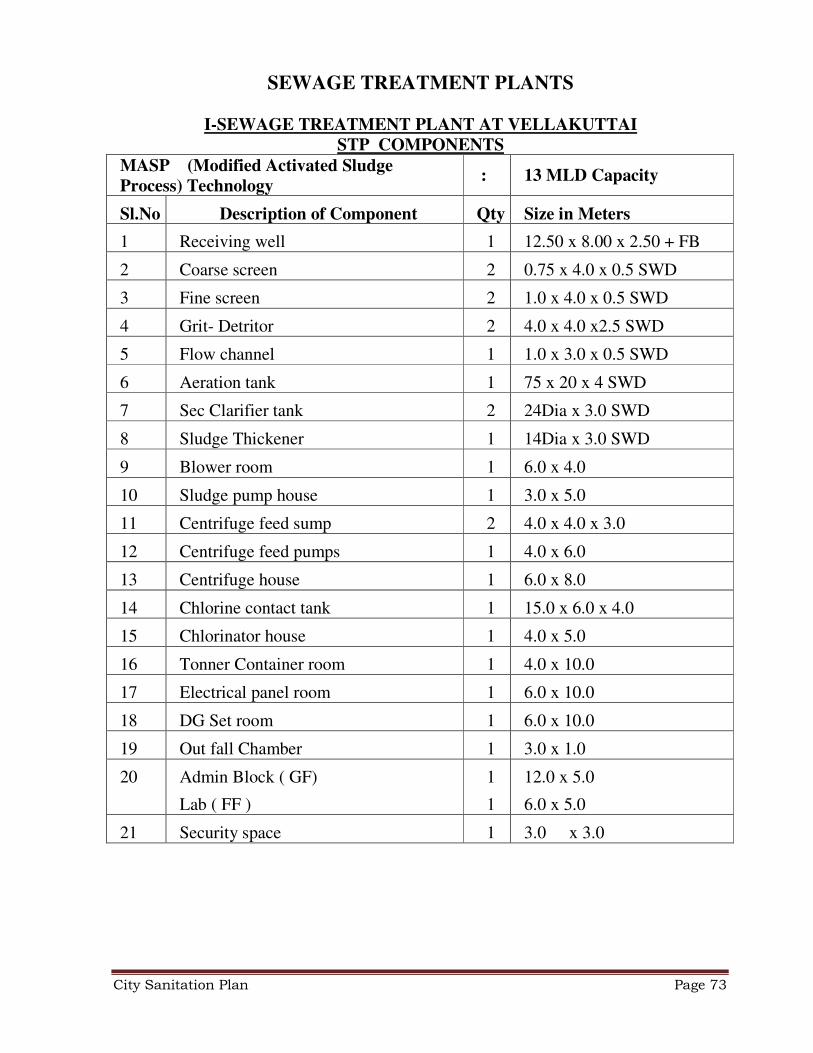
SEWAGE TREATMENT PLANTS
I-SEWAGE TREATMENT PLANT AT VELLAKUTTAI
STP COMPONENTS
MASP (Modified Activated Sludge
Process) Technology
:
13 MLD Capacity
Sl.No Description of Component Qty Size in Meters
1 Receiving well 1 12.50 x 8.00 x 2.50 + FB
2 Coarse screen 2 0.75 x 4.0 x 0.5 SWD
3 Fine screen 2 1.0 x 4.0 x 0.5 SWD
4 Grit- Detritor 2 4.0 x 4.0 x2.5 SWD
5 Flow channel 1 1.0 x 3.0 x 0.5 SWD
6 Aeration tank 1 75 x 20 x 4 SWD
7 Sec Clarifier tank 2 24Dia x 3.0 SWD
8 Sludge Thickener 1 14Dia x 3.0 SWD
9 Blower room 1 6.0 x 4.0
10 Sludge pump house 1 3.0 x 5.0
11 Centrifuge feed sump 2 4.0 x 4.0 x 3.0
12 Centrifuge feed pumps 1 4.0 x 6.0
13 Centrifuge house 1 6.0 x 8.0
14 Chlorine contact tank 1 15.0 x 6.0 x 4.0
15 Chlorinator house 1 4.0 x 5.0
16 Tonner Container room 1 4.0 x 10.0
17 Electrical panel room 1 6.0 x 10.0
18 DG Set room 1 6.0 x 10.0
19 Out fall Chamber 1 3.0 x 1.0
20 Admin Block ( GF)
Lab ( FF )
1
1
12.0 x 5.0
6.0 x 5.0
21 Security space 1 3.0 x 3.0
City Sanitation Plan Page 74
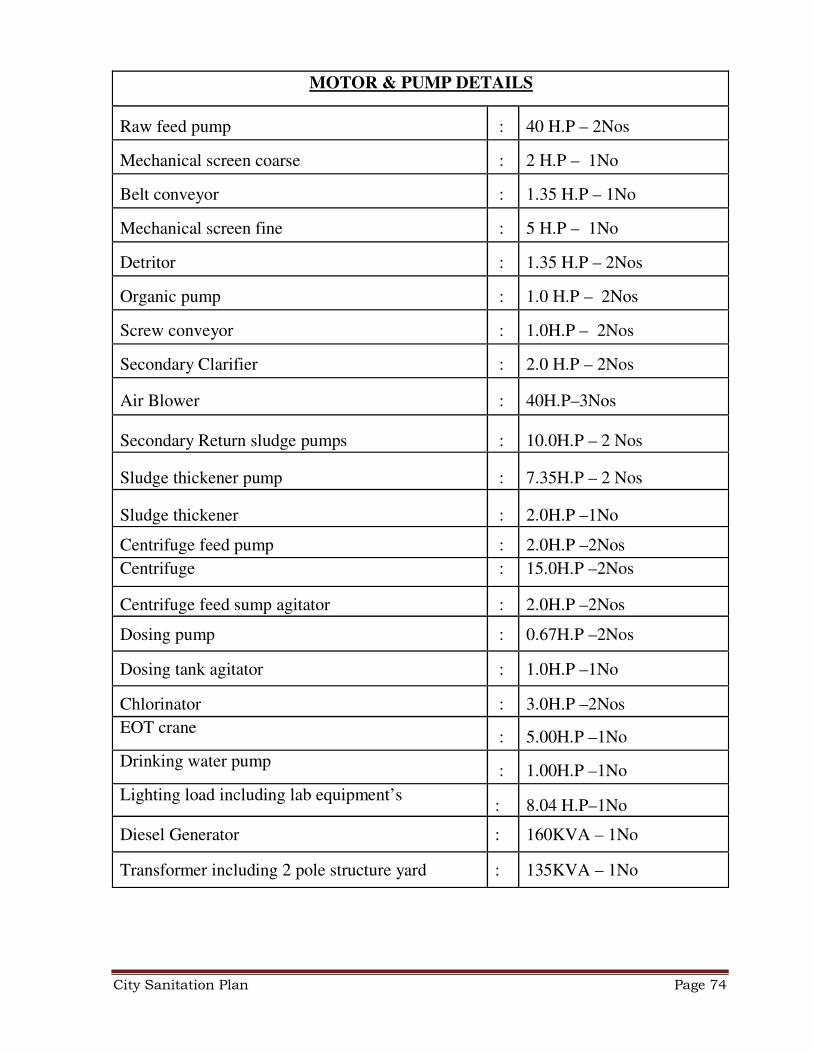
MOTOR & PUMP DETAILS
Raw feed pump
:
40 H.P – 2Nos
Mechanical screen coarse
:
2 H.P – 1No
Belt conveyor
:
1.35 H.P – 1No
Mechanical screen fine
:
5 H.P – 1No
Detritor
:
1.35 H.P – 2Nos
Organic pump
:
1.0 H.P – 2Nos
Screw conveyor
:
1.0H.P – 2Nos
Secondary Clarifier
:
2.0 H.P – 2Nos
Air Blower
:
40H.P–3Nos
Secondary Return sludge pumps
:
10.0H.P – 2 Nos
Sludge thickener pump
:
7.35H.P – 2 Nos
Sludge thickener
:
2.0H.P –1No
Centrifuge feed pump : 2.0H.P –2Nos
Centrifuge : 15.0H.P –2Nos
Centrifuge feed sump agitator : 2.0H.P –2Nos
Dosing pump : 0.67H.P –2Nos
Dosing tank agitator : 1.0H.P –1No
Chlorinator : 3.0H.P –2Nos
EOT crane
: 5.00H.P –1No
Drinking water pump
: 1.00H.P –1No
Lighting load including lab equipment’s :
8.04 H.P–1No
Diesel Generator : 160KVA – 1No
Transformer including 2 pole structure yard : 135KVA – 1No
City Sanitation Plan Page 75
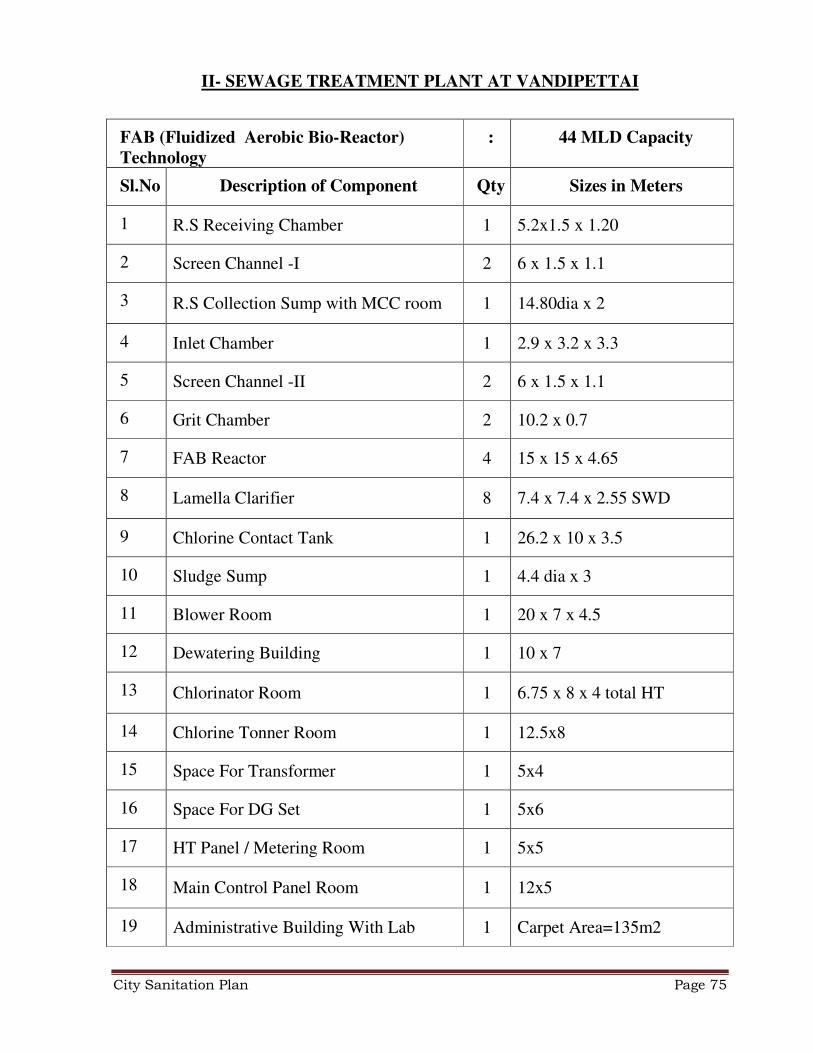
II- SEWAGE TREATMENT PLANT AT VANDIPETTAI
FAB (Fluidized Aerobic Bio-Reactor)
Technology
: 44 MLD Capacity
Sl.No Description of Component Qty Sizes in Meters
1 R.S Receiving Chamber 1 5.2x1.5 x 1.20
2 Screen Channel -I 2 6 x 1.5 x 1.1
3 R.S Collection Sump with MCC room 1 14.80dia x 2
4 Inlet Chamber 1 2.9 x 3.2 x 3.3
5 Screen Channel -II 2 6 x 1.5 x 1.1
6 Grit Chamber 2 10.2 x 0.7
7 FAB Reactor 4 15 x 15 x 4.65
8 Lamella Clarifier 8 7.4 x 7.4 x 2.55 SWD
9 Chlorine Contact Tank 1 26.2 x 10 x 3.5
10 Sludge Sump 1 4.4 dia x 3
11 Blower Room 1 20 x 7 x 4.5
12 Dewatering Building 1 10 x 7
13 Chlorinator Room 1 6.75 x 8 x 4 total HT
14 Chlorine Tonner Room 1 12.5x8
15 Space For Transformer 1 5x4
16 Space For DG Set 1 5x6
17 HT Panel / Metering Room 1 5x5
18 Main Control Panel Room 1 12x5
19 Administrative Building With Lab 1 Carpet Area=135m2
City Sanitation Plan Page 76
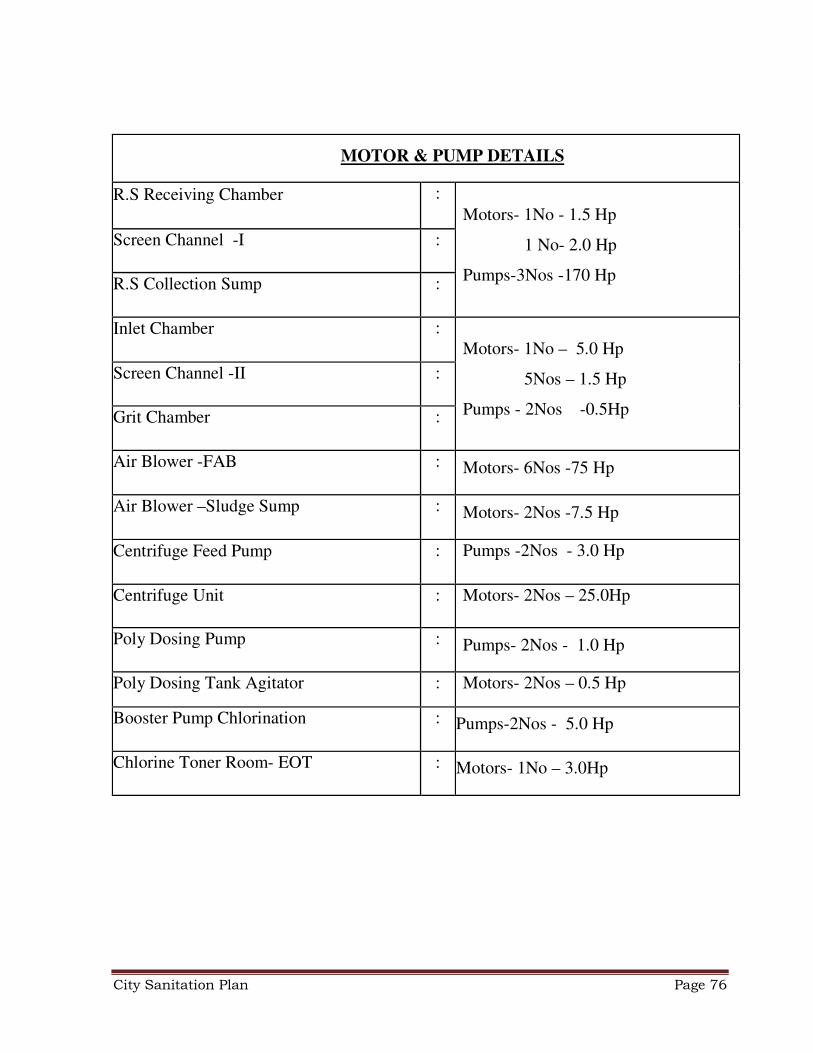
MOTOR & PUMP DETAILS
R.S Receiving Chamber :
Motors- 1No - 1.5 Hp
1 No- 2.0 Hp
Pumps-3Nos -170 Hp
Screen Channel -I :
R.S Collection Sump :
Inlet Chamber : Motors- 1No – 5.0 Hp
5Nos – 1.5 Hp
Pumps - 2Nos -0.5Hp
Screen Channel -II :
Grit Chamber :
Air Blower -FAB : Motors- 6Nos -75 Hp
Air Blower –Sludge Sump : Motors- 2Nos -7.5 Hp
Centrifuge Feed Pump : Pumps -2Nos - 3.0 Hp
Centrifuge Unit : Motors- 2Nos – 25.0Hp
Poly Dosing Pump : Pumps- 2Nos - 1.0 Hp
Poly Dosing Tank Agitator : Motors- 2Nos – 0.5 Hp
Booster Pump Chlorination : Pumps-2Nos - 5.0 Hp
Chlorine Toner Room- EOT : Motors- 1No – 3.0Hp
City Sanitation Plan Page 77
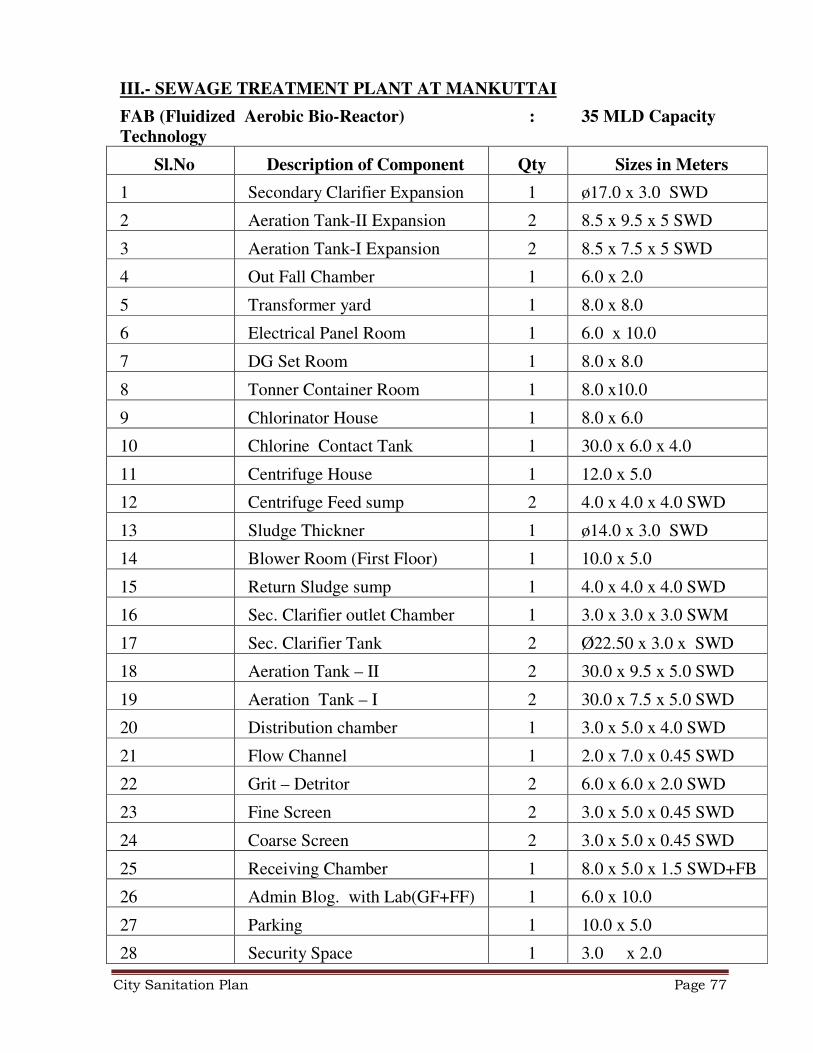
III.- SEWAGE TREATMENT PLANT AT MANKUTTAI
FAB (Fluidized Aerobic Bio-Reactor)
Technology
: 35 MLD Capacity
Sl.No Description of Component Qty Sizes in Meters
1 Secondary Clarifier Expansion 1 ø17.0 x 3.0 SWD
2 Aeration Tank-II Expansion 2 8.5 x 9.5 x 5 SWD
3 Aeration Tank-I Expansion 2 8.5 x 7.5 x 5 SWD
4 Out Fall Chamber 1 6.0 x 2.0
5 Transformer yard 1 8.0 x 8.0
6 Electrical Panel Room 1 6.0 x 10.0
7 DG Set Room 1 8.0 x 8.0
8 Tonner Container Room 1 8.0 x10.0
9 Chlorinator House 1 8.0 x 6.0
10 Chlorine Contact Tank 1 30.0 x 6.0 x 4.0
11 Centrifuge House 1 12.0 x 5.0
12 Centrifuge Feed sump 2 4.0 x 4.0 x 4.0 SWD
13 Sludge Thickner 1 ø14.0 x 3.0 SWD
14 Blower Room (First Floor) 1 10.0 x 5.0
15 Return Sludge sump 1 4.0 x 4.0 x 4.0 SWD
16 Sec. Clarifier outlet Chamber 1 3.0 x 3.0 x 3.0 SWM
17 Sec. Clarifier Tank 2 Ø22.50 x 3.0 x SWD
18 Aeration Tank – II 2 30.0 x 9.5 x 5.0 SWD
19 Aeration Tank – I 2 30.0 x 7.5 x 5.0 SWD
20 Distribution chamber 1 3.0 x 5.0 x 4.0 SWD
21 Flow Channel 1 2.0 x 7.0 x 0.45 SWD
22 Grit – Detritor 2 6.0 x 6.0 x 2.0 SWD
23 Fine Screen 2 3.0 x 5.0 x 0.45 SWD
24 Coarse Screen 2 3.0 x 5.0 x 0.45 SWD
25 Receiving Chamber 1 8.0 x 5.0 x 1.5 SWD+FB
26 Admin Blog. with Lab(GF+FF) 1 6.0 x 10.0
27 Parking 1 10.0 x 5.0
28 Security Space 1 3.0 x 2.0
City Sanitation Plan Page 78
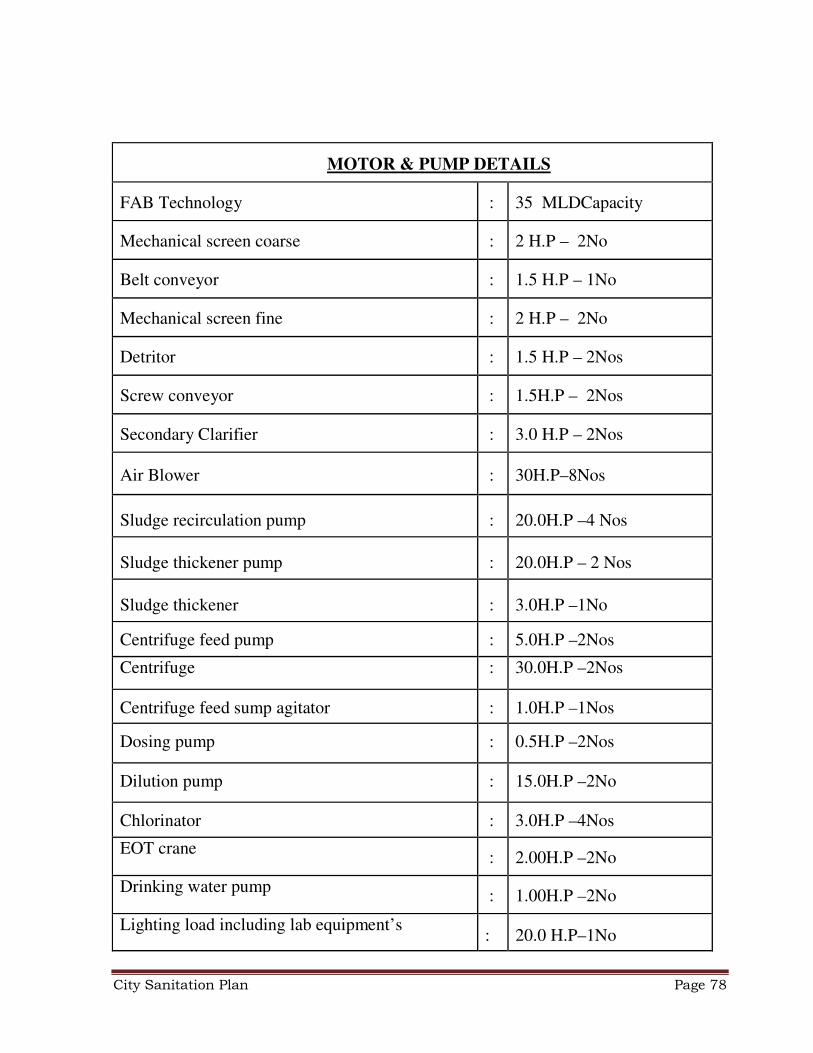
MOTOR & PUMP DETAILS
FAB Technology
:
35 MLDCapacity
Mechanical screen coarse
:
2 H.P – 2No
Belt conveyor
:
1.5 H.P – 1No
Mechanical screen fine
:
2 H.P – 2No
Detritor
:
1.5 H.P – 2Nos
Screw conveyor
:
1.5H.P – 2Nos
Secondary Clarifier
:
3.0 H.P – 2Nos
Air Blower
:
30H.P–8Nos
Sludge recirculation pump
:
20.0H.P –4 Nos
Sludge thickener pump
:
20.0H.P – 2 Nos
Sludge thickener
:
3.0H.P –1No
Centrifuge feed pump : 5.0H.P –2Nos
Centrifuge : 30.0H.P –2Nos
Centrifuge feed sump agitator : 1.0H.P –1Nos
Dosing pump : 0.5H.P –2Nos
Dilution pump : 15.0H.P –2No
Chlorinator : 3.0H.P –4Nos
EOT crane
: 2.00H.P –2No
Drinking water pump
: 1.00H.P –2No
Lighting load including lab equipment’s :
20.0 H.P–1No
City Sanitation Plan Page 79
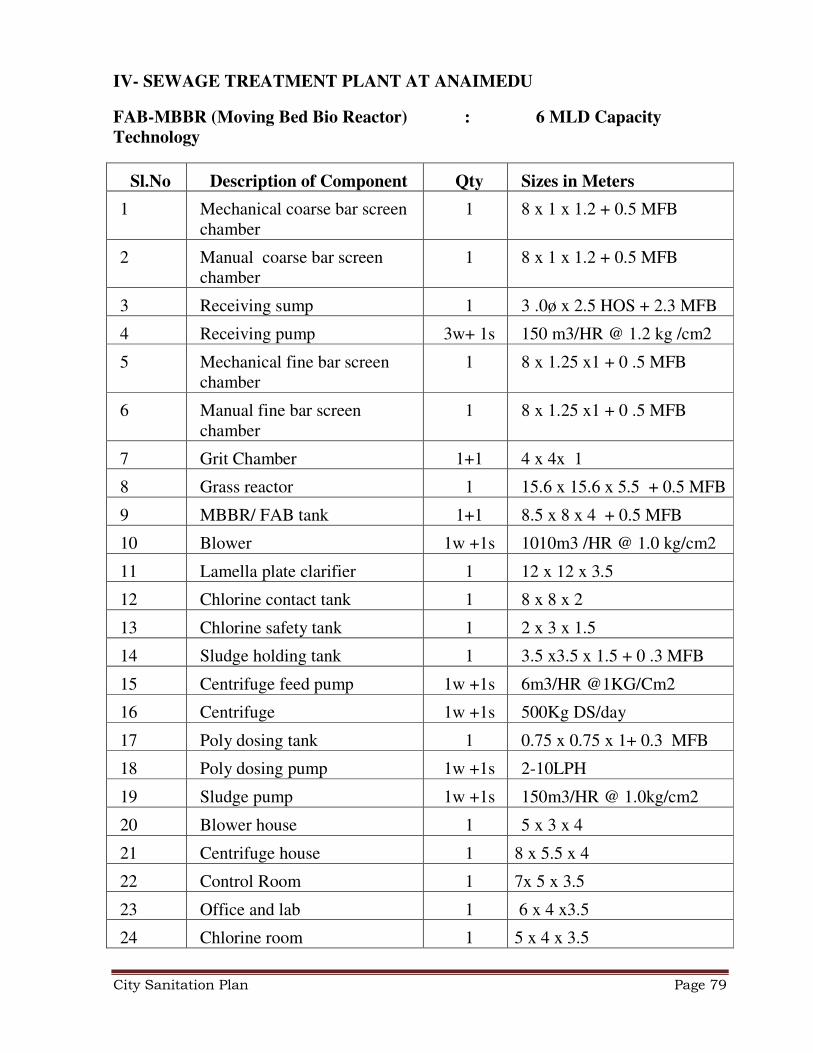
IV- SEWAGE TREATMENT PLANT AT ANAIMEDU
FAB-MBBR (Moving Bed Bio Reactor) : 6 MLD Capacity
Technology
Sl.No Description of Component Qty Sizes in Meters
1 Mechanical coarse bar screen chamber
1 8 x 1 x 1.2 + 0.5 MFB
2 Manual coarse bar screen chamber
1 8 x 1 x 1.2 + 0.5 MFB
3 Receiving sump 1 3 .0ø x 2.5 HOS + 2.3 MFB
4 Receiving pump 3w+ 1s 150 m3/HR @ 1.2 kg /cm2
5 Mechanical fine bar screen chamber
1 8 x 1.25 x1 + 0 .5 MFB
6 Manual fine bar screen chamber
1 8 x 1.25 x1 + 0 .5 MFB
7 Grit Chamber 1+1 4 x 4x 1
8 Grass reactor 1 15.6 x 15.6 x 5.5 + 0.5 MFB
9 MBBR/ FAB tank 1+1 8.5 x 8 x 4 + 0.5 MFB
10 Blower 1w +1s 1010m3 /HR @ 1.0 kg/cm2
11 Lamella plate clarifier 1 12 x 12 x 3.5
12 Chlorine contact tank 1 8 x 8 x 2
13 Chlorine safety tank 1 2 x 3 x 1.5
14 Sludge holding tank 1 3.5 x3.5 x 1.5 + 0 .3 MFB
15 Centrifuge feed pump 1w +1s 6m3/HR @1KG/Cm2
16 Centrifuge 1w +1s 500Kg DS/day
17 Poly dosing tank 1 0.75 x 0.75 x 1+ 0.3 MFB
18 Poly dosing pump 1w +1s 2-10LPH
19 Sludge pump 1w +1s 150m3/HR @ 1.0kg/cm2
20 Blower house 1 5 x 3 x 4
21 Centrifuge house 1 8 x 5.5 x 4
22 Control Room 1 7x 5 x 3.5
23 Office and lab 1 6 x 4 x3.5
24 Chlorine room 1 5 x 4 x 3.5
City Sanitation Plan Page 80
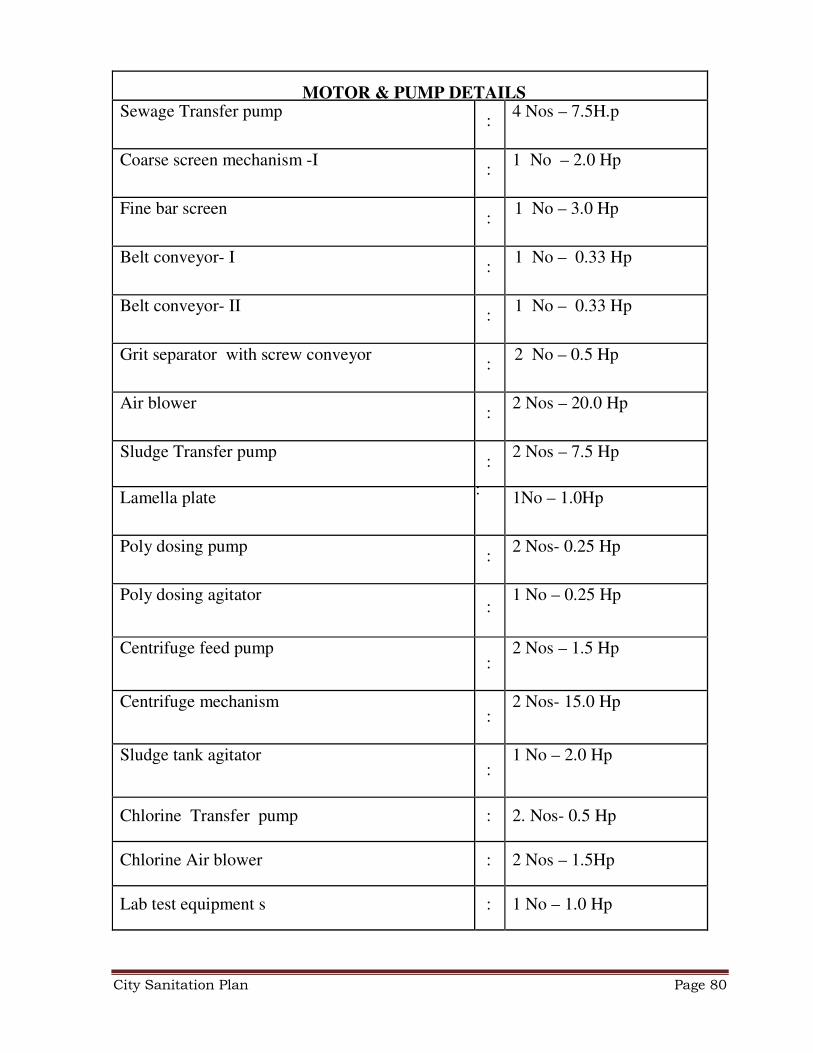
MOTOR & PUMP DETAILS
Sewage Transfer pump
: 4 Nos – 7.5H.p
Coarse screen mechanism -I
: 1 No – 2.0 Hp
Fine bar screen
: 1 No – 3.0 Hp
Belt conveyor- I
: 1 No – 0.33 Hp
Belt conveyor- II
: 1 No – 0.33 Hp
Grit separator with screw conveyor
: 2 No – 0.5 Hp
Air blower
: 2 Nos – 20.0 Hp
Sludge Transfer pump
: 2 Nos – 7.5 Hp
Lamella plate :
1No – 1.0Hp
Poly dosing pump
: 2 Nos- 0.25 Hp
Poly dosing agitator :
1 No – 0.25 Hp
Centrifuge feed pump :
2 Nos – 1.5 Hp
Centrifuge mechanism :
2 Nos- 15.0 Hp
Sludge tank agitator :
1 No – 2.0 Hp
Chlorine Transfer pump : 2. Nos- 0.5 Hp
Chlorine Air blower : 2 Nos – 1.5Hp
Lab test equipment s : 1 No – 1.0 Hp
City Sanitation Plan Page 81
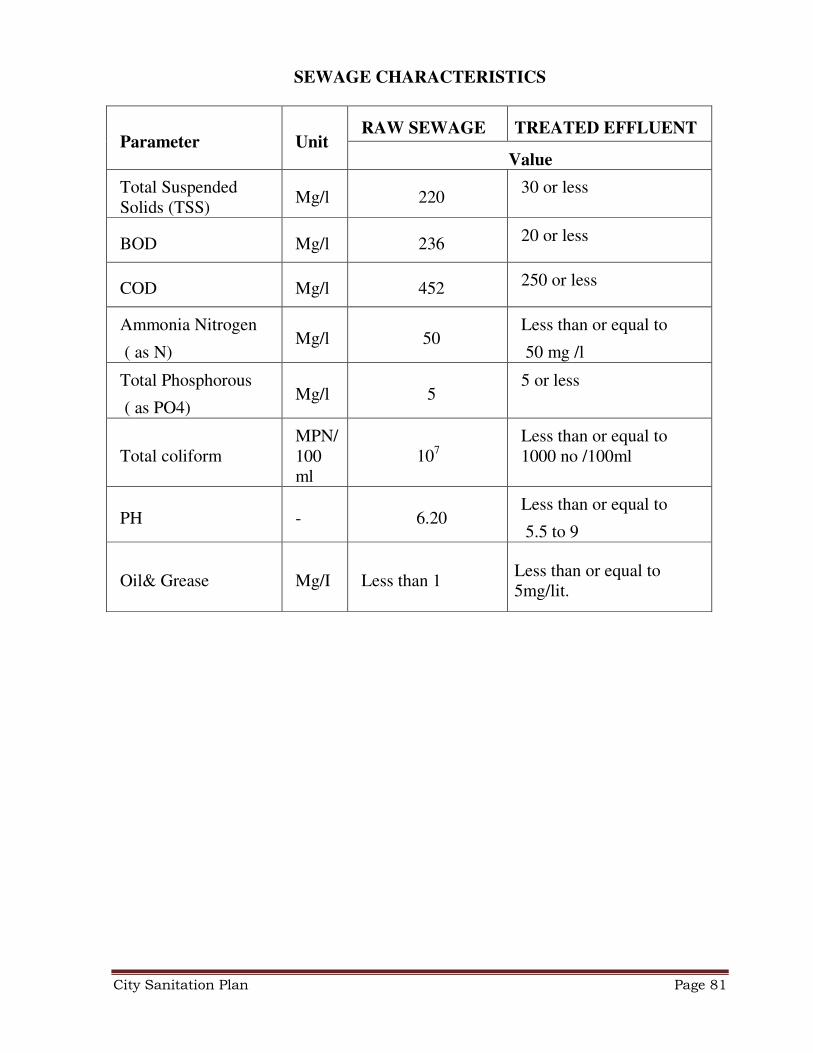
SEWAGE CHARACTERISTICS
Parameter Unit RAW SEWAGE TREATED EFFLUENT
Value
Total Suspended Solids (TSS)
Mg/l 220 30 or less
BOD Mg/l 236 20 or less
COD Mg/l 452 250 or less
Ammonia Nitrogen
( as N) Mg/l 50
Less than or equal to
50 mg /l
Total Phosphorous
( as PO4) Mg/l 5
5 or less
Total coliform MPN/100 ml
107 Less than or equal to 1000 no /100ml
PH - 6.20 Less than or equal to
5.5 to 9
Oil& Grease Mg/I Less than 1 Less than or equal to 5mg/lit.