Embed Size (px)
Citation preview
Republic of Tanzania
Ministry of Infrastructure Development
Civil Aviation Master Plan Pre-feasibility Study
Version 2.3
March 2010

2
Acronyms and Abbreviations
ADS-B Automatic Dependent Survey - Broadcast AFTN Aeronautical Fixed Telecommunications Network AIS Aeronautical Information Services ANS Air Navigation Services ATR Avions de Transport Regional ATS Air Traffic Services AVSEC Aviation Security BADEA Arab Bank for Economic Development in Africa CASSOA EAC Civil Aviation Safety and Security Oversight Agency CATC Civil Aviation Training Center COM Communications DAR FIR Dar es Salaam Flight Information Region DRC Democratic Republic of Congo EAC East African Community FDPS Flight Data Processing System FIR Flight Information Region FY Fiscal Year GA General Aviation GNI Gross National Income GNSS Global Navigation Satellite System GoT Government of Tanzania GPS Global Positioning System IATA International Air Transport Association ICAO International Civil Aviation Organization IDA International Development Agency (part of the World Bank) IFR Instrument Flight Rules JNIA Julius Nyerere International Airport KADCO Kilimanjaro Airports Development Corporation MCC Millennium Challenge Corporation MoID Ministry of Infrastructure Development NAV Navigation NDB Non-Directional Beacon OPEC Organization of the Petroleum Exporting Countries PPP Public-Private Partnership RGoZ Revolutionary Government of Zanzibar SADC South African Development Community TAA Tanzania Airports Authority TCAA Tanzania Civil Aviation Authority TORs Terms of References Tsh Tanzania Shilling TSIP Transport Sector Improvement Project TSSP Transport Sector Support Project VFR Visual Flight Rules VHF Very High Frequency VSAT Very Small Aperture Terminal
3
Table of Contents i. Introduction .......................................................................................................................................... 5
ii. Executive Summary ............................................................................................................................ 7
I. Country Overview .............................................................................................................................. 13
II. Sector Overview ............................................................................................................................... 16
1. Institutions and Agencies ............................................................................................................... 17
a. Ministry of Infrastructure Development ...................................................................................... 17
b. TCAA ........................................................................................................................................ 18
c. TAA .......................................................................................................................................... 23
2. Service Providers ........................................................................................................................... 25
Air Tanzania .................................................................................................................................. 25
III. Traffic Overview ............................................................................................................................. 28
1. International Travel ....................................................................................................................... 28
2. Domestic Travel ............................................................................................................................ 34
IV. Investments: An Overview .............................................................................................................. 40
1. Anticipated Needs.......................................................................................................................... 40
2. Summary of Traffic Projections ..................................................................................................... 41
3. Needs for Primary Airports ............................................................................................................ 47
a. Julius Nyerere International Airport ........................................................................................... 47
b. Zanzibar International Airport .................................................................................................... 48
c. Kilimanjaro International Airport ............................................................................................... 50
4. Currently Planned Investments of the TAA .................................................................................... 51
5. Currently Planned Investments of the TCAA ................................................................................. 55
V. Action Plan for the Meeting of Needs for the Air Transport Sector .................................................... 58
VI. Proposed Steps and Outline for Tanzania Civil Aviation Master Plan ............................................... 61
Appendix A: A hub in Dar es Salaam - two distinct concepts ................................................................. 63
Appendix B: TAA Financials ................................................................................................................ 66
Appendix C: TCAA Financials .............................................................................................................. 71
Appendix D: Terms of references for the study ...................................................................................... 75
Appendix E: List of persons met for this study ....................................................................................... 85

4
This page intentionally blank
5
i. Introduction This Aviation Master Plan Pre-feasibility Study has been carried out within the framework of the project Management Consultancy for Institutional Support to Transport, funded by the EU. The study had several mandates: Initially conceived as a pre-feasibility study for a full civil aviation master plan, it was also intended to act in lieu of such a master plan for intermediate term financial planning within the Ministry of Infrastructure Development (MoID) as in input for the Short Transport Sector Investment Plan for the three year period between FY 2009/2010 and 2011/2012.
At the onset of this study funding for a full master plan seemed difficult to find, though fortunately sources for such a plan have been identified as this study neared completion. This implies that many of the issues identified in this report and perhaps deserving further research can be dealt with more thoroughly during the actual master plan development.
In addition, funding seems to be on the horizon for the development of a new master plan for Julius Nyerere International Airport in Dar es Salaam. As will be shown later in this report, the need for a new terminal for the airport is one of the main findings arriving from traffic projections. Both master plans were deemed a necessary component for the involvement of the private sector in the development of the new terminal, and are thus part of part the World Bank’s Transport Support Project now being prepared for World Bank Board Approval by end of May 2010.
The TORs for this study can be found in Appendix D. The study is the result of two visits to Tanzania, the first being between October 16 and October 30, 2009, and the second between February 22 and March 12, 2009. A presentation on the first draft of this study was held on March 4, with representatives from the MoID, TCAA, and TAA present. This final version of the report reflects the reviews given after the meeting.

6
This page intentionally blank
7
ii. Executive Summary Tanzania has a total of 368 airports and aerodromes on the mainland, with an additional at least one additional airport on each of the islands of Pemba and Zanzibar. The country, at 947 km2, is considered large, and there are substantial areas of land with low population densities and without much transport infrastructure. This set a unique environment, as Tanzania has much of a tourist industry from abroad and has a domestic air transport network in part relying on general aviation type operations.
The sector is at a critical stage, needing much investment. At the same time both domestic and international air transport has been growing considerably in Tanzania.
The country has three primary institutions, the Ministry of Infrastructure Development (MoID) responsible for overall policy, investment, and performance monitoring, the Tanzania Civil Aviation Authority (TCAA) as the main regulator and oversight agency, and the Tanzania Airports Authority as the main airports authority. In addition, the Kilimanjaro International Airport is managed by the Kilimanjaro Airports Development Corporation, and the Revolutionary Government of Zanzibar is responsible for Zanzibar International Airport and the airport in Pemba.
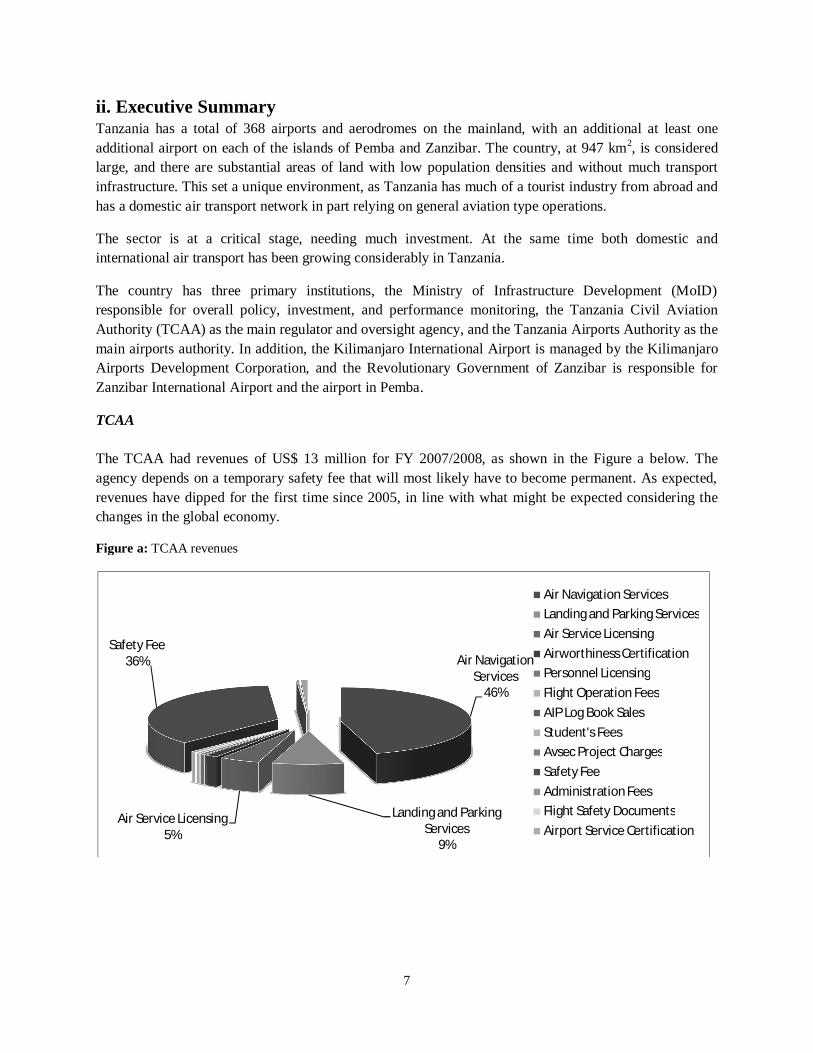
TCAA The TCAA had revenues of US$ 13 million for FY 2007/2008, as shown in the Figure a below. The agency depends on a temporary safety fee that will most likely have to become permanent. As expected, revenues have dipped for the first time since 2005, in line with what might be expected considering the changes in the global economy.
Figure a: TCAA revenues
Air Navigation Services
46%
Landing and Parking Services
9%
Air Service Licensing5%
Safety Fee36%
Air Navigation ServicesLanding and Parking ServicesAir Service LicensingAirworthiness CertificationPersonnel LicensingFlight Operation FeesAIP Log Book SalesStudent's FeesAvsec Project ChargesSafety FeeAdministration FeesFlight Safety DocumentsAirport Service Certification
8
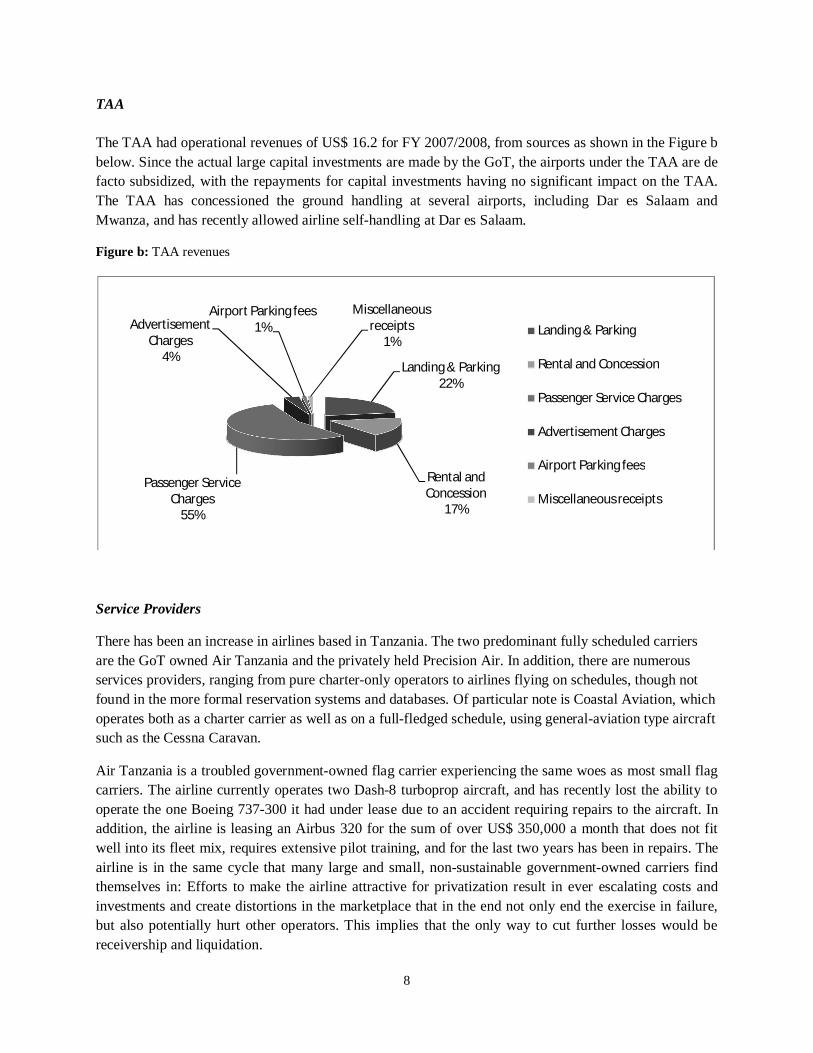
TAA The TAA had operational revenues of US$ 16.2 for FY 2007/2008, from sources as shown in the Figure b below. Since the actual large capital investments are made by the GoT, the airports under the TAA are de facto subsidized, with the repayments for capital investments having no significant impact on the TAA. The TAA has concessioned the ground handling at several airports, including Dar es Salaam and Mwanza, and has recently allowed airline self-handling at Dar es Salaam.
Figure b: TAA revenues
Service Providers
There has been an increase in airlines based in Tanzania. The two predominant fully scheduled carriers are the GoT owned Air Tanzania and the privately held Precision Air. In addition, there are numerous services providers, ranging from pure charter-only operators to airlines flying on schedules, though not found in the more formal reservation systems and databases. Of particular note is Coastal Aviation, which operates both as a charter carrier as well as on a full-fledged schedule, using general-aviation type aircraft such as the Cessna Caravan.
Air Tanzania is a troubled government-owned flag carrier experiencing the same woes as most small flag carriers. The airline currently operates two Dash-8 turboprop aircraft, and has recently lost the ability to operate the one Boeing 737-300 it had under lease due to an accident requiring repairs to the aircraft. In addition, the airline is leasing an Airbus 320 for the sum of over US$ 350,000 a month that does not fit well into its fleet mix, requires extensive pilot training, and for the last two years has been in repairs. The airline is in the same cycle that many large and small, non-sustainable government-owned carriers find themselves in: Efforts to make the airline attractive for privatization result in ever escalating costs and investments and create distortions in the marketplace that in the end not only end the exercise in failure, but also potentially hurt other operators. This implies that the only way to cut further losses would be receivership and liquidation.
Landing & Parking22%
Rental and Concession
17%
Passenger Service Charges
55%
Advertisement Charges
4%
Airport Parking fees1%
Miscellaneous receipts
1%Landing & Parking
Rental and Concession
Passenger Service Charges
Advertisement Charges
Airport Parking fees
Miscellaneous receipts
9
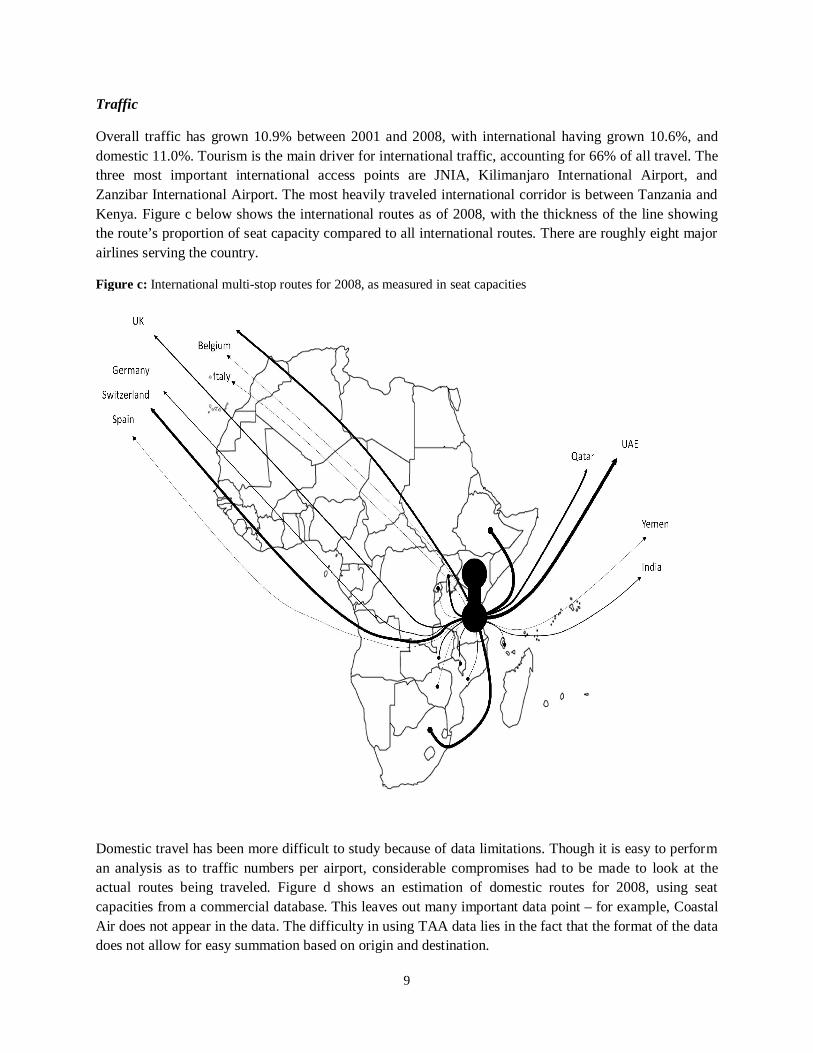
Traffic
Overall traffic has grown 10.9% between 2001 and 2008, with international having grown 10.6%, and domestic 11.0%. Tourism is the main driver for international traffic, accounting for 66% of all travel. The three most important international access points are JNIA, Kilimanjaro International Airport, and Zanzibar International Airport. The most heavily traveled international corridor is between Tanzania and Kenya. Figure c below shows the international routes as of 2008, with the thickness of the line showing the route’s proportion of seat capacity compared to all international routes. There are roughly eight major airlines serving the country.
Figure c: International multi-stop routes for 2008, as measured in seat capacities
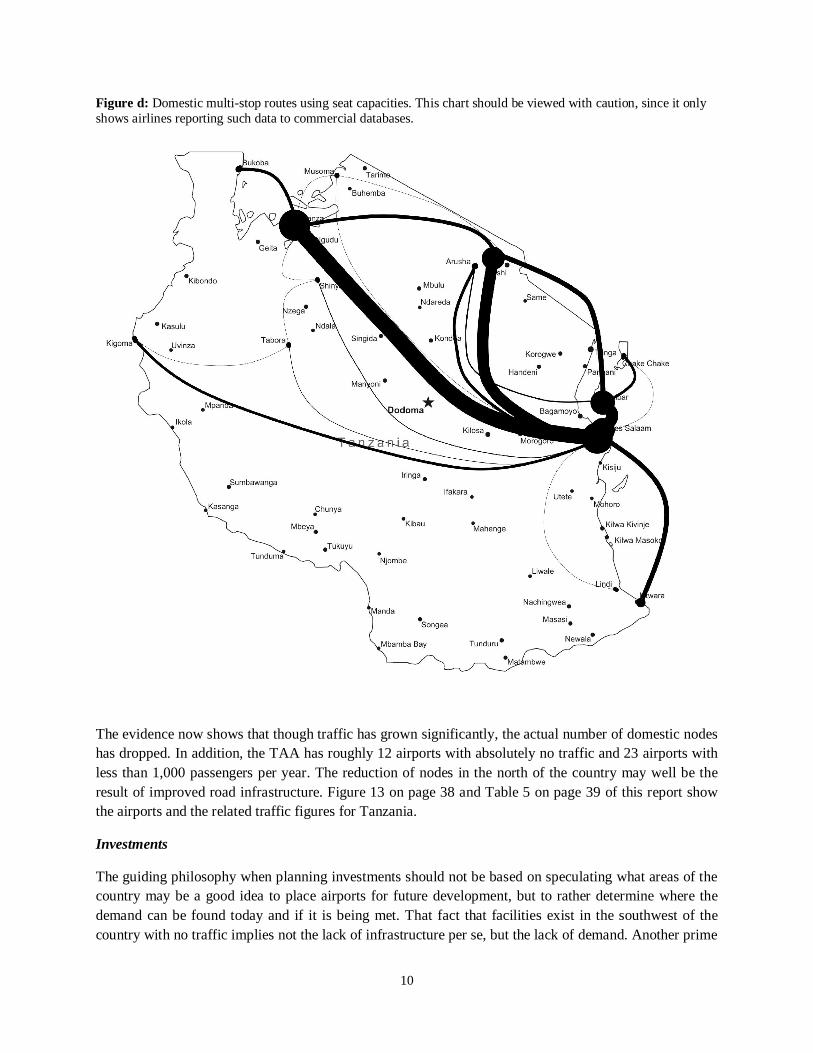
Domestic travel has been more difficult to study because of data limitations. Though it is easy to perform an analysis as to traffic numbers per airport, considerable compromises had to be made to look at the actual routes being traveled. Figure d shows an estimation of domestic routes for 2008, using seat capacities from a commercial database. This leaves out many important data point – for example, Coastal Air does not appear in the data. The difficulty in using TAA data lies in the fact that the format of the data does not allow for easy summation based on origin and destination.
10
Figure d: Domestic multi-stop routes using seat capacities. This chart should be viewed with caution, since it only shows airlines reporting such data to commercial databases.
The evidence now shows that though traffic has grown significantly, the actual number of domestic nodes has dropped. In addition, the TAA has roughly 12 airports with absolutely no traffic and 23 airports with less than 1,000 passengers per year. The reduction of nodes in the north of the country may well be the result of improved road infrastructure. Figure 13 on page 38 and Table 5 on page 39 of this report show the airports and the related traffic figures for Tanzania.
Investments
The guiding philosophy when planning investments should not be based on speculating what areas of the country may be a good idea to place airports for future development, but to rather determine where the demand can be found today and if it is being met. That fact that facilities exist in the southwest of the country with no traffic implies not the lack of infrastructure per se, but the lack of demand. Another prime
11
example of this point is a comparison between an airport with an unpaved runway having over 23,000 passengers a year, yet an airport with a paved runway having barely any scheduled services and having 6,000 passengers a year. Bukoba, the unpaved airport, has significant demand. Dodoma, the capital with the paved runway, does not. In terms of looking at extensive hub development in Dar es Salaam, Appendix A found on page 63 discusses the feasibility or even desirability of such plans.
Projections with three scenarios, pessimistic, moderate, and high growth, show that overall system traffic could end being anywhere from 4.5 million passengers to roughly 12 million passengers by 2025, with JNIA’s traffic being anywhere from 2.3 million to over 5.5 million for the same period. These are conservative estimates, with growth rates being kept low anticipating a slower economic recovery and some more pessimistic assumptions on the long-term growth of air transport. They highlight the fact that even with very pessimistic assumptions it is clear that JNIA’s current terminal capacity will be exhausted to the point that expanding the current Terminal 2 will not be enough, and a third terminal needs to go into the planning stages early on. Therefore, the proposed investments in airports ranked in order of priority are outlined as found in Table 14 on page 59, with respective phasing from 2010 to 2015, and 2015 and beyond. The same ranking of proposed investments for the TCAA can be found in Table 15 on page 60.
The World Bank is in the final stages of preparing the Transport Sector Support Project that beyond the airport investments in Bukoba, Kigoma, and Tabora found in Table 14 also includes financing a transaction advisor for the expansion of JNIA. As part of this component US$ 600,000 are being set aside for a civil aviation master plan for Tanzania, as well as an airport master plan for JNIA. The proposed outline for the civil aviation master plan can be found starting on 61. The board approval date for the loan is set for late May 2010, which implies that it is therefore timely to begin writing the TORs for such a master plan now (April 2010), so they are ready to be distributed when the studies are ready to be procured.

12
This page intentionally blank
13
I. Country Overview
The air transport sector in Tanzania consists of over 360 airports, two larger carriers, many smaller, usually general aviation (GA) operators, the Tanzania Civil Aviation Authority (TCAA), the Tanzania Airports Authority (TAA), and the airports authority of the Revolutionary Government of Zanzibar. Tanzania has a total of 2251 aircraft, helicopters, and balloons on the registry as of December 2008, and a total of 866 licensed pilots, of which 292 are both commercial and instrument rated. Tanzania is part of the East African Community, and contributes to the newly established EAC Civil Aviation Safety and Security Oversight Agency (CASSOA) in Arusha.
Tanzania is a large country, with a surface area of roughly 947 thousand km2, and a population of about 40 million2. It is bordered by Kenya, Uganda, Rwanda, Burundi, Congo DRC, Zambia, Malawi, and Mozambique. Beyond the mainland, there are three major islands (Pemba, Zanzibar, and Mafia) close to the shoreline on the Indian Ocean. Large bodies of water include Lake Victoria in the north, Lake Tanganyika on the very west along the border to Congo DRC, and Lake Nyasa along the border to Malawi. There are vast areas of thin population in the center and to the west. Dar es Salaam, on the shore of the Indian Ocean, is the business capital and has the highest population, with several other important centers including Arusha (the seat of the East African Community), Dodoma (the capital city), and Mwanza.
Tanzania is a recipient of World Bank IDA loans, and grants and loans from many other donor organizations. Though ranked as a low-income country by the World Bank, there has been significant growth in the years leading up to the global recession of 2008, with increased exports in minerals and tobacco. Tanzania also hosts some of Africa’s most renowned game parks and natural attractions, with the Serengeti and other famous parks (such as the Ngorogoro Crater) located in the African Rift Valley to the boarder of Kenya, and other game parks and potential tourist attractions located throughout the country.
Due to the vastness of the country, and the often lacking infrastructure for other modes, air transport plays a unique role. Much like Alaska in the United States, the rugged terrain and vast nearly empty-spaces have made a network of charter and scheduled small or general aviation aircraft indispensible. Beyond this network, Tanzania is dependent on the same air transport needs as any other larger country – a network for scheduled internal traffic, and international gateways to other countries and continents. Most airports in Tanzania are more in the order of private airstrips operated by mining and tour operators, while the TAA only has 58 of the country’s estimated 3703 airports and strips under its management.
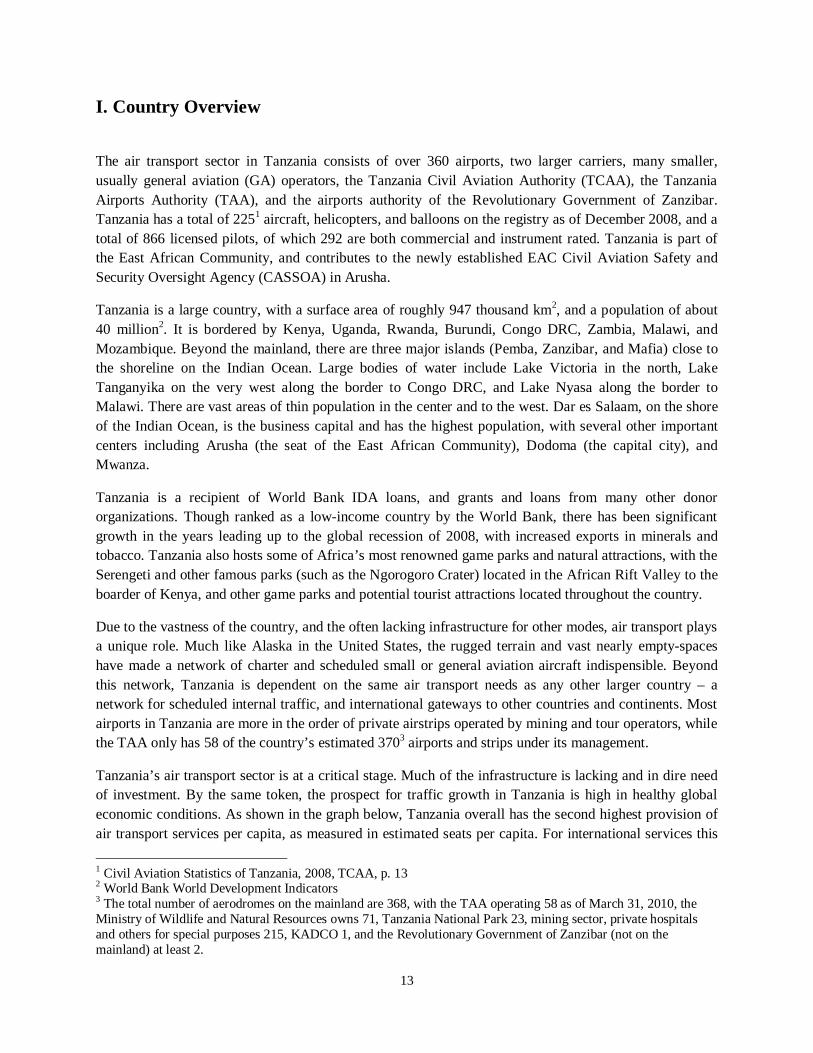
Tanzania’s air transport sector is at a critical stage. Much of the infrastructure is lacking and in dire need of investment. By the same token, the prospect for traffic growth in Tanzania is high in healthy global economic conditions. As shown in the graph below, Tanzania overall has the second highest provision of air transport services per capita, as measured in estimated seats per capita. For international services this 1 Civil Aviation Statistics of Tanzania, 2008, TCAA, p. 13 2 World Bank World Development Indicators 3 The total number of aerodromes on the mainland are 368, with the TAA operating 58 as of March 31, 2010, the Ministry of Wildlife and Natural Resources owns 71, Tanzania National Park 23, mining sector, private hospitals and others for special purposes 215, KADCO 1, and the Revolutionary Government of Zanzibar (not on the mainland) at least 2.
14
may not apply much for the general population; however domestic services have grown considerably themselves.
Figure 1: Regional comparison of seats per capita. Tanzania is the highest after Kenya.
Source: Analysis on data provided by the Seabury SRS data analyzer. Seats per capita is calculated by dividing the estimated population of a country (gained from the World Bank’s World Development Indicators) by the sum of all domestic and international seat capacity as provided by Seabury SRS, for the same year (2007).
0.00
0.05
0.10
0.15
0.20
0.25
Seats per Capita
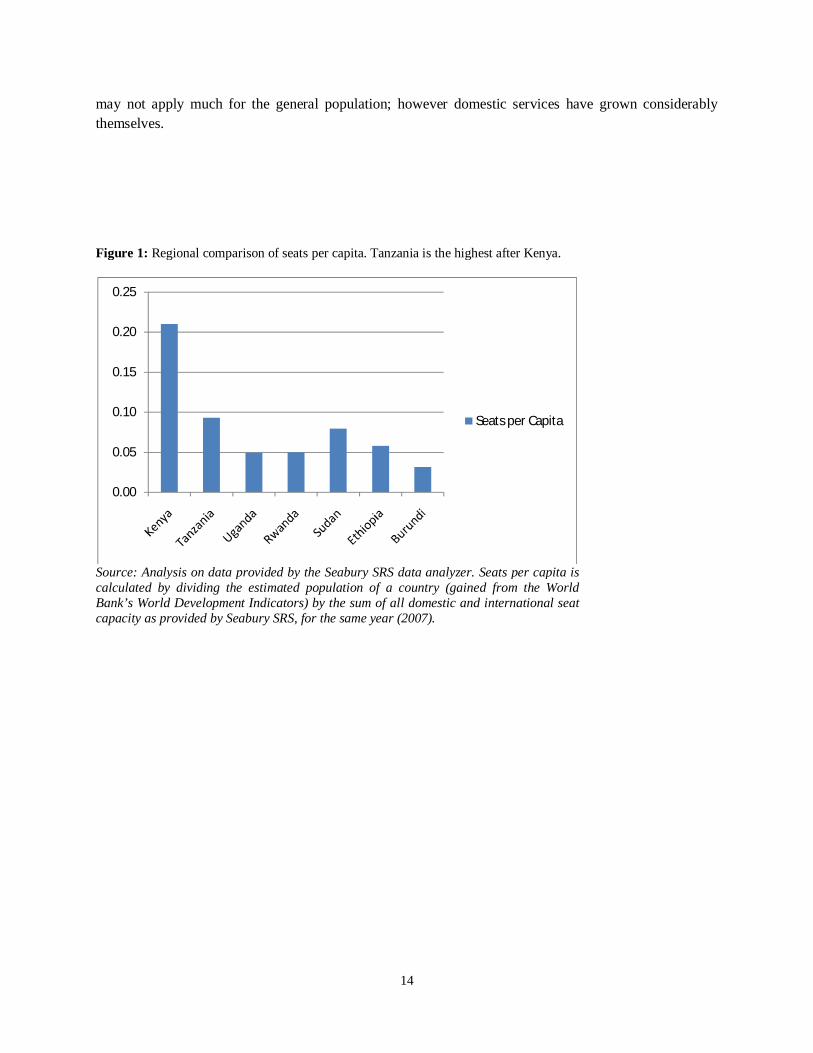
Figure 2: Seats per capita and GNI for all countries in sub-Saharan Africa, excluding island nations. The wealthier countries stand out.
Source: Analysis on data provided by the Seabury SRS data analyzer, and World Bank World Development Indicators.
II. Sector Overview
In the Transport Sector Investment Programme the sector is described as having a set of shortcomings. Specifically mentioned were
Deficiencies in the provision of international air navigation services Inadequate airport facilities Low human reserves to adequately manage and operate the air transport industry Inadequate airport planning and management skills A Civil Aviation Master Plan that is in place but does not accommodate the changes in the policy
framework that have taken place nationally, regionally and internationally Lack of knowledge of the emerging economic regulation concept Inadequate capacity in trained pilots and aircraft maintenance engineers Lack of a management system that will link the civil aviation headquarters and its centers around
the country Manual collection and distribution of aviation data.
The TSIP has identified a total of US$ 303 million as investment needs in the five fiscal years between 2007 and 2012. Other shortcomings in the infrastructure where also found by various consultants visiting the country, which ranged from security installations at major airports such as Mwanza and Zanzibar, to overall weather reporting and prediction capabilities. By the same token Tanzania has seen significant growth in air traffic at rates beyond the rest of the continent.
In this study the proposed investments in both the TAA and the TCAA will be reviewed.
17
1. Institutions and Agencies a. Ministry of Infrastructure Development
The Ministry of Infrastructure Development (MoID) is responsible for coordinating and financing the development Tanzania’s infrastructure. Sectors in its realm include marine, aviation, roads, and others, and its responsibilities include working with the National Assembly of Tanzania in creating budgets and long-term project planning. The ministry is split into divisions and sections. Specific air transport resources can be found in the following divisions and sections:
Transport Division: A dedicated section for Air Transport has two assistant directors, one for air services & meteorology, and one for airports and aerodromes
Policy and Planning Division: One dedicated specialist for air transport (a former Air Tanzania flight captain)
Safety and Environment Division: One dedicated specialist for air transport accidents, who is on loan from the TCAA.
The role of the ministry, in general, is not technical. It’s vital role is to assess policy and budgets. This implies that in terms of technical resources the MoID relies less on internal resources and more on the agencies reporting to it – the TAA, TCAA, and Air Tanzania. However, the MoID does have the final authority on many investments and expenditures, and as such does require expertise as to what larger investments are appropriate for an agency to accomplish its tasks. In this role there is still room for the agency to develop its capacities.
Safety and Environment Division A significant exception to the technical needs lies in the Safety and Environment Division. ICAO, in its recent updating of safety audits standards, is now insisting that the relevant ministries be the final oversight agency of the regulator. Therefore ICAO recommends that air transport accidents be investigated outside the regulating agency, in this case the TCAA. The new formation of the Safety and Environment Division, and its new role in air traffic investigations, is therefore structurally a sound implementation of the ICAO recommendations.
However, the division has no budget for a permanent investigator. The qualified accident investigator now reporting to the division is on loan from the TCAA, and being paid out of the TCAA’s funds. Though this arrangement is understandable in current circumstances, long term planning should focus on giving the division one permanent investigator, who, through building channels with regional and global resources, is able to implement an investigation team rapidly in the case of an accident.
18
b. TCAA
The Tanzania Civil Aviation Authority (TCAA) was an executive agency formed 1999, and became a corporate body in November 2003. In the process of becoming independent, the staffing was optimized, and the agency has gone from a total of roughly 400 employees to the neighborhood of 140. The agency has been growing again as it assumes additional functions in oversight, such as economic regulation of domestic markets.
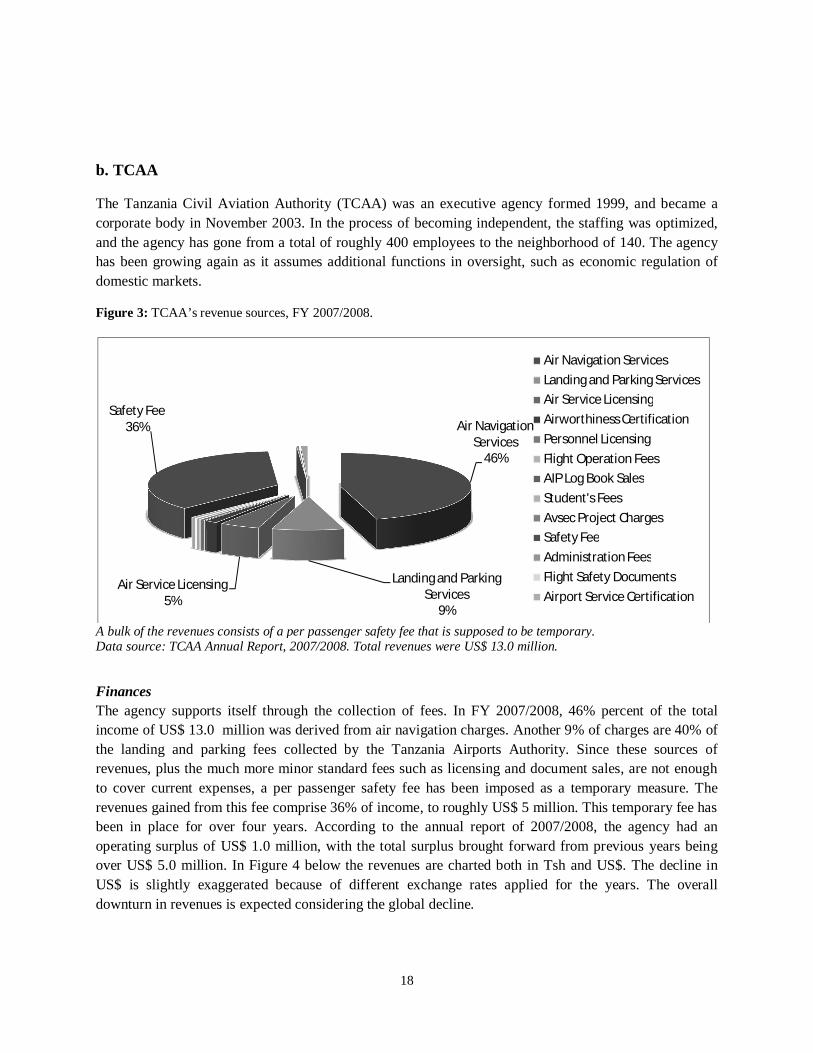
Figure 3: TCAA’s revenue sources, FY 2007/2008.
A bulk of the revenues consists of a per passenger safety fee that is supposed to be temporary. Data source: TCAA Annual Report, 2007/2008. Total revenues were US$ 13.0 million.
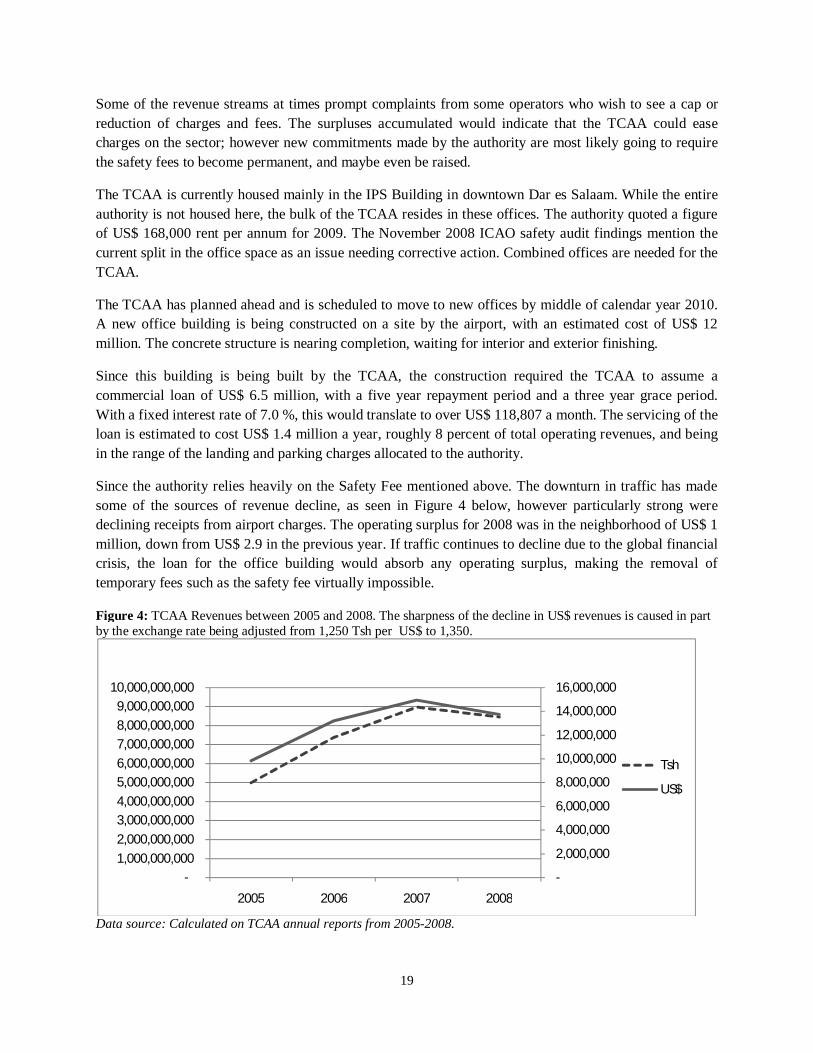
Finances The agency supports itself through the collection of fees. In FY 2007/2008, 46% percent of the total income of US$ 13.0 million was derived from air navigation charges. Another 9% of charges are 40% of the landing and parking fees collected by the Tanzania Airports Authority. Since these sources of revenues, plus the much more minor standard fees such as licensing and document sales, are not enough to cover current expenses, a per passenger safety fee has been imposed as a temporary measure. The revenues gained from this fee comprise 36% of income, to roughly US$ 5 million. This temporary fee has been in place for over four years. According to the annual report of 2007/2008, the agency had an operating surplus of US$ 1.0 million, with the total surplus brought forward from previous years being over US$ 5.0 million. In Figure 4 below the revenues are charted both in Tsh and US$. The decline in US$ is slightly exaggerated because of different exchange rates applied for the years. The overall downturn in revenues is expected considering the global decline.
Air Navigation Services
46%
Landing and Parking Services
9%
Air Service Licensing5%
Safety Fee36%
Air Navigation ServicesLanding and Parking ServicesAir Service LicensingAirworthiness CertificationPersonnel LicensingFlight Operation FeesAIP Log Book SalesStudent's FeesAvsec Project ChargesSafety FeeAdministration FeesFlight Safety DocumentsAirport Service Certification
19
Some of the revenue streams at times prompt complaints from some operators who wish to see a cap or reduction of charges and fees. The surpluses accumulated would indicate that the TCAA could ease charges on the sector; however new commitments made by the authority are most likely going to require the safety fees to become permanent, and maybe even be raised.
The TCAA is currently housed mainly in the IPS Building in downtown Dar es Salaam. While the entire authority is not housed here, the bulk of the TCAA resides in these offices. The authority quoted a figure of US$ 168,000 rent per annum for 2009. The November 2008 ICAO safety audit findings mention the current split in the office space as an issue needing corrective action. Combined offices are needed for the TCAA.
The TCAA has planned ahead and is scheduled to move to new offices by middle of calendar year 2010. A new office building is being constructed on a site by the airport, with an estimated cost of US$ 12 million. The concrete structure is nearing completion, waiting for interior and exterior finishing.
Since this building is being built by the TCAA, the construction required the TCAA to assume a commercial loan of US$ 6.5 million, with a five year repayment period and a three year grace period. With a fixed interest rate of 7.0 %, this would translate to over US$ 118,807 a month. The servicing of the loan is estimated to cost US$ 1.4 million a year, roughly 8 percent of total operating revenues, and being in the range of the landing and parking charges allocated to the authority.
Since the authority relies heavily on the Safety Fee mentioned above. The downturn in traffic has made some of the sources of revenue decline, as seen in Figure 4 below, however particularly strong were declining receipts from airport charges. The operating surplus for 2008 was in the neighborhood of US$ 1 million, down from US$ 2.9 in the previous year. If traffic continues to decline due to the global financial crisis, the loan for the office building would absorb any operating surplus, making the removal of temporary fees such as the safety fee virtually impossible.
Figure 4: TCAA Revenues between 2005 and 2008. The sharpness of the decline in US$ revenues is caused in part by the exchange rate being adjusted from 1,250 Tsh per US$ to 1,350.
Data source: Calculated on TCAA annual reports from 2005-2008.
-
2,000,000
4,000,000
6,000,000
8,000,000
10,000,000
12,000,000
14,000,000
16,000,000
-1,000,000,000 2,000,000,000 3,000,000,000 4,000,000,000 5,000,000,000 6,000,000,000 7,000,000,000 8,000,000,000 9,000,000,000
10,000,000,000
2005 2006 2007 2008
Tsh
US$
20
This in general implies that the TCAA will need to re-assess its overall finances, and will need to do some additional planning for the next five years. It may be that the property being developed could be sold for other purposes to the private sector, or that the space inside be allocated in a way that the majority of the building is rented out and produces revenues.
Services The TCAA is the country’s service provider in air traffic control. Tanzania has one civilian radar stationed at JNIA, providing both primary and secondary coverage4 for up to 220 nautical miles. Though the radar had been purchased in 2001, radar based air traffic control, as opposed to procedural control, is just starting due to the difficulty of getting enough air traffic controllers to be certified in radar procedures. Air traffic control over the rest of the country outside the range of the radar is purely procedural. Tanzania is not unique in this: In Kenya, where radar coverage is above 90% for the country, radar procedures are in place only in Nairobi, and are used sporadically depending on weather in Mombasa5.
As part of upgrading and expanding the air traffic control system in Tanzania, one option proposed has been the implementation of ADS-B, a reporting system that uses GPS receivers within aircraft to pinpoint the location of the aircraft, and interconnected ground-based transceivers to received aircraft position reports and transfer these to the air traffic control system. Such a system is far more accurate over longer distances than radar, and considerably less expensive.
The implementation of ADS-B also has a regional element: Kenya, Uganda, Rwanda, and Burundi are also considering this technology, and a common platform would allow the regional integration of the upper airspace. Plans for unifying the upper airspace for the EAC, and also for SADC members, have recently been openly discussed.
Overflights over Tanzania’s airspace (referred to as the Dar-es-Salaam flight information region, or DAR FIR) number roughly 65 thousand in 2008, and have been increasing because of growth in Qatar and Kenyan airways flights6. The overflights represent an important source of revenues. ICAO, however, insists that overflight charges should not be seen as a cash cow, and that charges should be applied as to cover the costs of the service being provided. The reality is that with poorer countries this imperative simply cannot be followed. However, Tanzania could further justify its revenue from these overflights by increasing the level of air traffic control services being offered. This argument also supports the longer-term notion of implementing ADS-B.
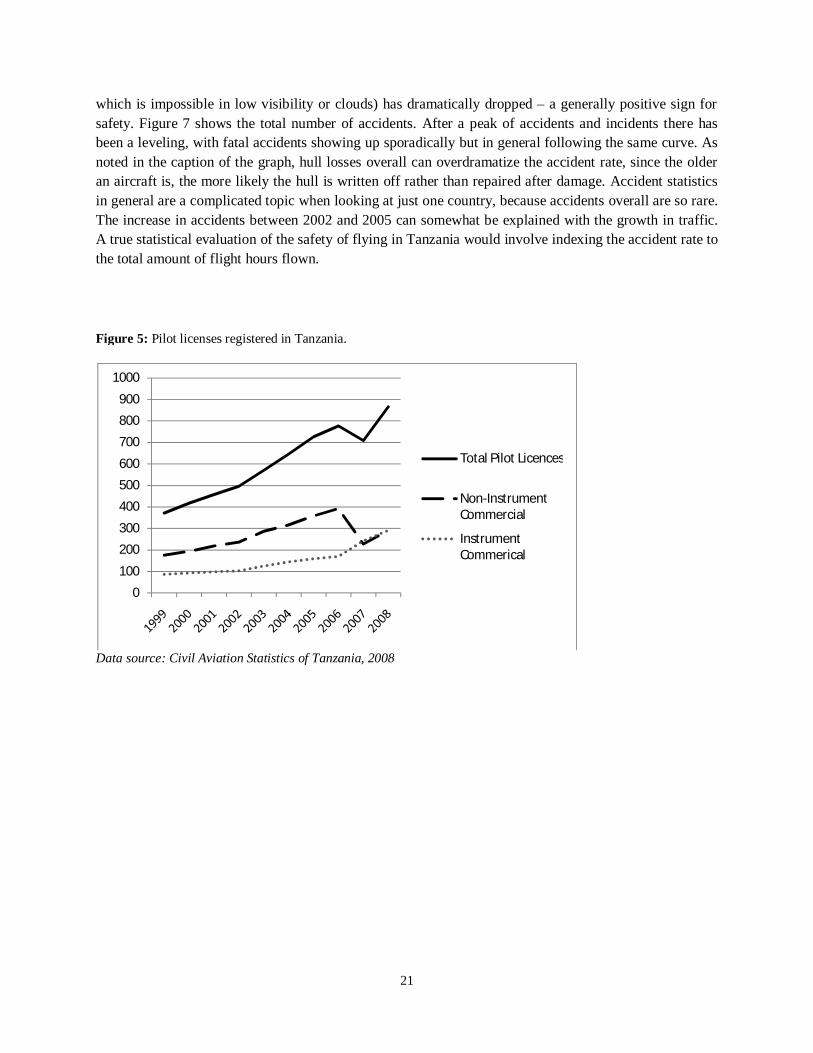
Figure 5, Figure 6, and Figure 7 below reflect some general statistics for the TCAA. Figure 5 shows the total number of pilot licenses in Tanzania. The interesting movements are between 2006 and 2007: The number of commercial pilots without an instrument rating (i.e. only able to fly looking out the window,
4 Primary coverage includes being able to view generally all flying man-made objects within an area, whereas secondary radar provides much more detail for aircraft equipped with transponders. Secondary radar is generally the standard used for air traffic control. 5 In clear weather, separation between approaching aircraft could be done visually. In clouds, however, pilots have to rely solely on the controller’s knowledge of nearby traffic, making radar more necessary. 6 Civil Aviation Statistics of Tanzania 2008, TCAA, p. vii.
21
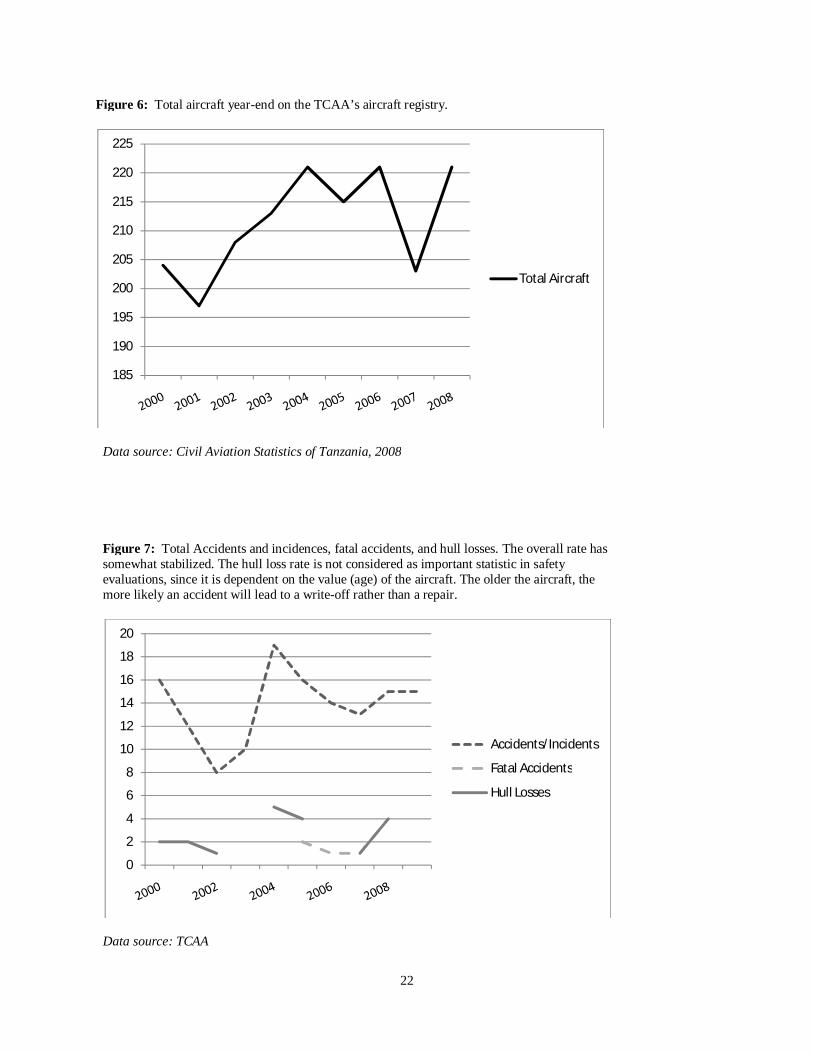
which is impossible in low visibility or clouds) has dramatically dropped – a generally positive sign for safety. Figure 7 shows the total number of accidents. After a peak of accidents and incidents there has been a leveling, with fatal accidents showing up sporadically but in general following the same curve. As noted in the caption of the graph, hull losses overall can overdramatize the accident rate, since the older an aircraft is, the more likely the hull is written off rather than repaired after damage. Accident statistics in general are a complicated topic when looking at just one country, because accidents overall are so rare. The increase in accidents between 2002 and 2005 can somewhat be explained with the growth in traffic. A true statistical evaluation of the safety of flying in Tanzania would involve indexing the accident rate to the total amount of flight hours flown.
Figure 5: Pilot licenses registered in Tanzania.
Data source: Civil Aviation Statistics of Tanzania, 2008
0
100
200
300
400
500
600
700
800
900
1000
Total Pilot Licences
Non-Instrument Commercial
Instrument Commerical
22
Figure 6: Total aircraft year-end on the TCAA’s aircraft registry.
Data source: Civil Aviation Statistics of Tanzania, 2008
Figure 7: Total Accidents and incidences, fatal accidents, and hull losses. The overall rate has somewhat stabilized. The hull loss rate is not considered as important statistic in safety evaluations, since it is dependent on the value (age) of the aircraft. The older the aircraft, the more likely an accident will lead to a write-off rather than a repair.
Data source: TCAA
185
190
195
200
205
210
215
220
225
Total Aircraft
0
2
4
6
8
10
12
14
16
18
20
Accidents/Incidents
Fatal Accidents
Hull Losses
23
c. TAA
Tanzania Airports Authority is semi-autonomous striving towards becoming a fully independent agency. The authority has 58 airports in its system, with the busiest being Dar es Salaam. Though also having much tourist travel, the airport in Zanzibar does not fall under the authority, and Kilimanjaro International Airport is run by a separate joint venture (KADCO).
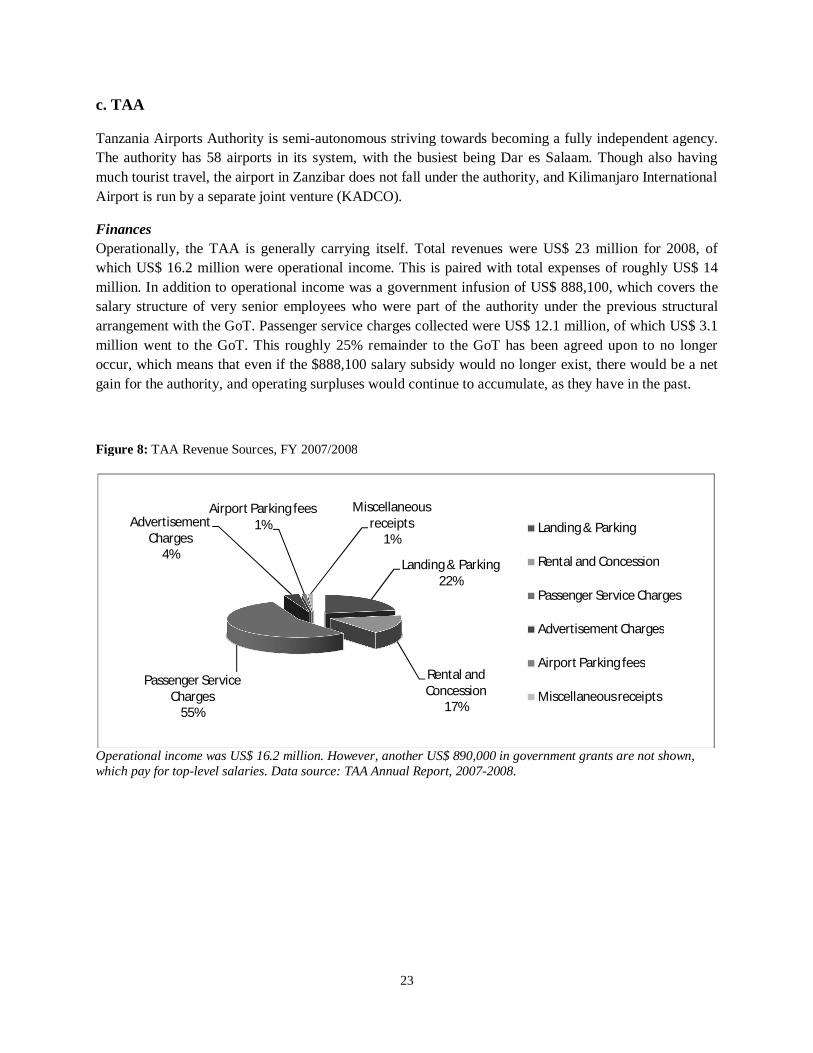
Finances Operationally, the TAA is generally carrying itself. Total revenues were US$ 23 million for 2008, of which US$ 16.2 million were operational income. This is paired with total expenses of roughly US$ 14 million. In addition to operational income was a government infusion of US$ 888,100, which covers the salary structure of very senior employees who were part of the authority under the previous structural arrangement with the GoT. Passenger service charges collected were US$ 12.1 million, of which US$ 3.1 million went to the GoT. This roughly 25% remainder to the GoT has been agreed upon to no longer occur, which means that even if the $888,100 salary subsidy would no longer exist, there would be a net gain for the authority, and operating surpluses would continue to accumulate, as they have in the past.
Figure 8: TAA Revenue Sources, FY 2007/2008
Operational income was US$ 16.2 million. However, another US$ 890,000 in government grants are not shown, which pay for top-level salaries. Data source: TAA Annual Report, 2007-2008.
Landing & Parking22%
Rental and Concession
17%
Passenger Service Charges
55%
Advertisement Charges
4%
Airport Parking fees1%
Miscellaneous receipts
1%Landing & Parking
Rental and Concession
Passenger Service Charges
Advertisement Charges
Airport Parking fees
Miscellaneous receipts
24
In terms of the capital structure, the Authority is heavily dependent on government and donor infusions for improvements or heavier-duty maintenance to its airports. Under its current income structure, the TAA has reported to be capable to raise between US$ 12 million to US$ 22 million with commercial banks, with this amount having risen as operational surpluses have accumulated. However, these amounts are marginal if compared to the overall need for infrastructure investment in the airport sector in Tanzania, demonstrating the need for larger partners to help finance development.
The debt for airport projects does not show in the balance sheets of the authority. Upon further inquiry, it was determined that the GoT itself carries the debt for airport improvements, and that the TAA makes payments on this debt from funds received from the GoT. Payments for these debts amounted to roughly US$ 6 million for 2007/2008. In this sense, the TAA infrastructure is clearly subsidized, and so far capital investments and their repayments have had no significant impact on the TAA’s finances.
Services The TAA has provided concessions for the handling of passenger and cargo at JNIA and Mwanza. Since both Kilimanjaro International and Zanzibar International airports are not in the realm of the TAA, these two airports carry the TAA’s highest volume (84% of TAA’s system), with the rest being a very distant 16% of volume spread over 57 airports. In general, most services consist of facilities maintenance such as upkeep of buildings and air-side pavements and other surfaces (in 2008, grass cutting for all airfields accumulated to an annual expense of US$ 428,000), and airport planning. The TAA is an authority more focused on the necessary infrastructure upkeep and concessioning of essential terminal services, whereas the TCAA provides lighter infrastructure (limited to ATC and navigation systems) and more direct services in terms of oversight, information dissemination, training, navigation, and air traffic control.
25
2. Service Providers There are three general types of service providers in Tanzania. On the scheduled side, within Tanzania there is the nationally owned flag carrier, Air Tanzania, and Precision Air, a carrier privately held with Kenyan Airways as a partial shareholder. A second level of carrier also abounds in Tanzania, with the prime example being Coastal Air. Operating officially as charter carriers, these carriers actually also provide scheduled service, and in Coastal's case actually have a broad and expansive network within the country, essentially flying the same routes as the bigger carriers, but with smaller aircraft and at times (such as between Dar es Salaam and Zanzibar) at much higher frequencies. The third type of carrier is the pure charter operator, of which there are many. It is important to note that the unscheduled carriers and the hybrid charter operators provide a larger chunk of the domestic services than one might expect. For example, Coastal alone has about a 30% market share for all domestic services flying out of Dar es Salaam, which is significant considering that the biggest route, between Mwanza and Dar es Salaam, is also served by the Precision Air and Air Tanzania, both of whom fly larger aircraft, though Air Tanzania’s 737-200 had an unfortunate accident in March 2010 and will be in repairs for some time.
Service providers come and go over time, so it is difficult to make long-term projections as to who will be carrying far into the future. However, the troubles of Air Tanzania play an important role in the overall role of the service providers.
Air Tanzania The last iteration of Air Tanzania was 49% owned by South African Airlines, having been launched in March 2003. The partnership did not end well, and was dissolved by March 2006, after having lost a total of nearly US$ 20 million, with the airline once again being 100% government owned, as a separate agency to the Ministry of Infrastructure Development7. What followed was a subsequent decline in the fleet, and corresponding less frequencies. The overall decline of the airline including even the period before South African's involvement, coupled with the demand for growth and a more open policy of allowing other players to provide service, ended up being a boost for Precision Air, which subsequently became the dominant domestic carrier. Precision Air renewed its turbine fleet with new ATR aircraft from France, and eventually started jet service between destinations such as Nairobi and Dar es Salaam.
Today the climate in Tanzania towards service providers from the outside for international service may well yield towards liberalization as stipulated in the Yamoussoukro decision; however there are serious considerations for economic regulation of domestic services, with the argument that Precision Air is now monopolizing domestic routes, and a government-owned flag carrier is needed to provide competition and make sure thin routes do not get dropped out of the network. There is also ample evidence, however, that private carriers are interested in establishing themselves in Tanzania, as some smaller start-ups are now showing.
Weak state-owned flag carriers become a significant financial drain for their government. With Air Tanzania this came to a high point towards the end of 2008: As ICAO performed its audit of the safety oversight system in Tanzania, the lack of technical documents (manuals) for the aircraft being operated was discovered. The TCAA had no option but to ground the airline until remedies were in place.
7 See http://www.infrastructure.go.tz/index.php/ministry/category/ministry_departments/
26
However, since the purchase of the technical documentation, in the end, came out of the GoT’s pocket, the TCAA, even though representing the enforcement side of the safety oversight, also had to financially participate in the remedy. This leads to a troubling conflict of interest: If a regulator is forced to contribute to the cost of the remedy of a standards violation, it is in the regulator's self interest not to enforce all applicable safety standards.
The future of Air Tanzania should be more carefully examined. The airline currently operates two Dash-8s, purchased with the assistance of Sonangol, and one 737-200 that unfortunately has a mishap in early 2010, and now in need of repairs. In addition, it has now leased an Airbus 320, with monthly lease costs of over US$ 350,000. This fleet composition presents several problems:
The Airbus is not really economically usable for current routes other than Dar – Johannesburg. The Airbus does not fit in well with the fleet mix. Having many different types of aircraft
increases operating costs and the general logistics of flying, since generally pilots get trained on and certified on only on type of transport aircraft at a time. On the other hand, having several aircraft of the same type increases flexibility and serviceability. Another Boeing 737-200 would have been more suitable.
The Airbus, though lease payments have been made for at least two years, is not flying, since extensive maintenance is being performed.
Currently, Air Tanzania has transport pilots on its payroll that are not flying, certified for the Boeing 737. The Airbus will require a resource shift in flying skills, while not taking advantage of already existing capacity being paid for.
The string of mishaps and financial losses are typical for a small nationally owned flag carrier that should actually be closed down. Though this is a strongly worded recommendation, there are several reasons for stating this:
Attempting to find a private sector investor to take over the airline plays into an ever repeating vicious cycle of trying to make the airline more attractive while investing (and losing) more and more money. In small African airlines the losses run into the tens of millions US$, in large carriers such as found in South East Asia losses above US$ 600 million have been experienced in one year alone for one carrier, all in the efforts to privatize the airlines, with failed outcomes. In some cases these efforts have lasted over at least a decade.
Keeping the airline as is brings about significant market distortions. For example, it is typical for small nationally owned carriers not to pay their parking and landing fees, creating large accounts payable balances at domestic airports that can never be collected, and in effect crowding out those that do have to pay. In addition, these mechanisms also impeded the efficient setting of fares: The nationally owned flag carrier actually has an advantage in setting fares because it does not have to compensate for all of its true economic cost of operating.
Following the previous point, private sector carriers can never trust the government and the regulator if they are in the same business, competing with them. This may be keeping new entrants from entering the market.
Government-owned flag carriers can attract substantial governance issues. Not only are there large risks that some passengers will never fly as revenue passengers, but investment, leasing, and
27
acquisition decisions may not be done on a sound business or economic basis, and offer opportunities for governance to go awry.
Text Box: Flag carriers—a pattern in attempting privatization8 Not only in Africa but in much of the developing world, the national flag carrier plays a visible role, though one whose economics are often questionable. In most cases, the state-owned and operated flag carrier was established decades ago. The carrier grows at first, partly because of market protection—competition is prohibited on some or all of its routes. Over time, service quality declines and losses mount, until a change in government forces a rethinking of policy. Proponents of maintaining the carrier argue as follows: (i) without it, little-traveled, subsidized domestic routes would be dropped, creating regional isolation; (ii) the carrier can potentially create revenues for the government, especially from foreigners traveling within the country; and (iii) a flag carrier must be maintained as a matter of national pride.
As losses mount, though, advisers recommend the sale of the airline. To attract potential private sector buyers, the airline must first be restructured and made viable. During that process, the carrier realizes that routes are only profitable if it remains a state-sanctioned monopoly and that its aircraft in use do not really meet the demands of the public. In addition, the carrier identifies new potential routes for expansion.
With additional investment from the government, the carrier buys new aircraft and brings new routes into service, while maintaining its monopoly on current routes. Over time, it becomes apparent that the new aircraft are too expensive to operate and have a load factor too low to be profitable on the routes for which they were bought (incurring losses of staggering proportions). The private sector is even less interested in the airline as a result of the restructuring. Barring liquidation, the process will start all over again.
Generally, the best solution is to completely liquidate the carrier and have a successful outside operator provide international services. A flag carrier from another country could potentially play this role. Compromises could be made, such as painting the outside operator’s aircraft in the flag carrier’s colors and hiring crew for passenger services within the country. For domestic routes, it makes sense to let small, local operators develop from the private sector.
8 Adapted from Bofinger, Heinrich, An Unsteady Course: Growth and Challenges in Africa’s Air Transport Industry, Pre-Release Edition, Africa Infrastructure Diagnostic, the World Bank, p.7
28
III. Traffic Overview Tanzania's total traffic per airport is summarized in Table 5 at the end of this chapter, using mostly TAA data. Using TCAA data dating back to 2001, overall traffic has grown 10.9% between 2001 and 2008, with international having grown 10.6%, and domestic 11.0%. Beyond the airports of the TAA, there are also Kilimanjaro, Pemba, and Zanzibar. The total system throughput in 2008 was 3.09 million passengers9, with an annual geometric growth rate of 11 % between 2004 and 2008, higher than the industry average globally of 5-6 percent during the same period10. The traffic measured is passenger traffic as reported by the TAA, and the TCAA with respect to Pemba and Zanzibar. Kilimanjaro, notably, had grown at rates above 20% between 2004 and 2007, only to have its overall growth rate decline to 16% after registering an actual decline between 2007 and 2008. Also of note are the number of airports in the system with very little or no passenger traffic at all.
1. International Travel Tanzania currently has roughly ten major airlines providing international service into three airports, Julius Nyerere International Airport in Dar es Salaam, Zanzibar International Airport on the island of Zanzibar, and Kilimanjaro International Airport in the Kilimanjaro region. By far the most important airport is the international airport in Dar es Salaam, though Kilimanjaro has been growing rapidly.
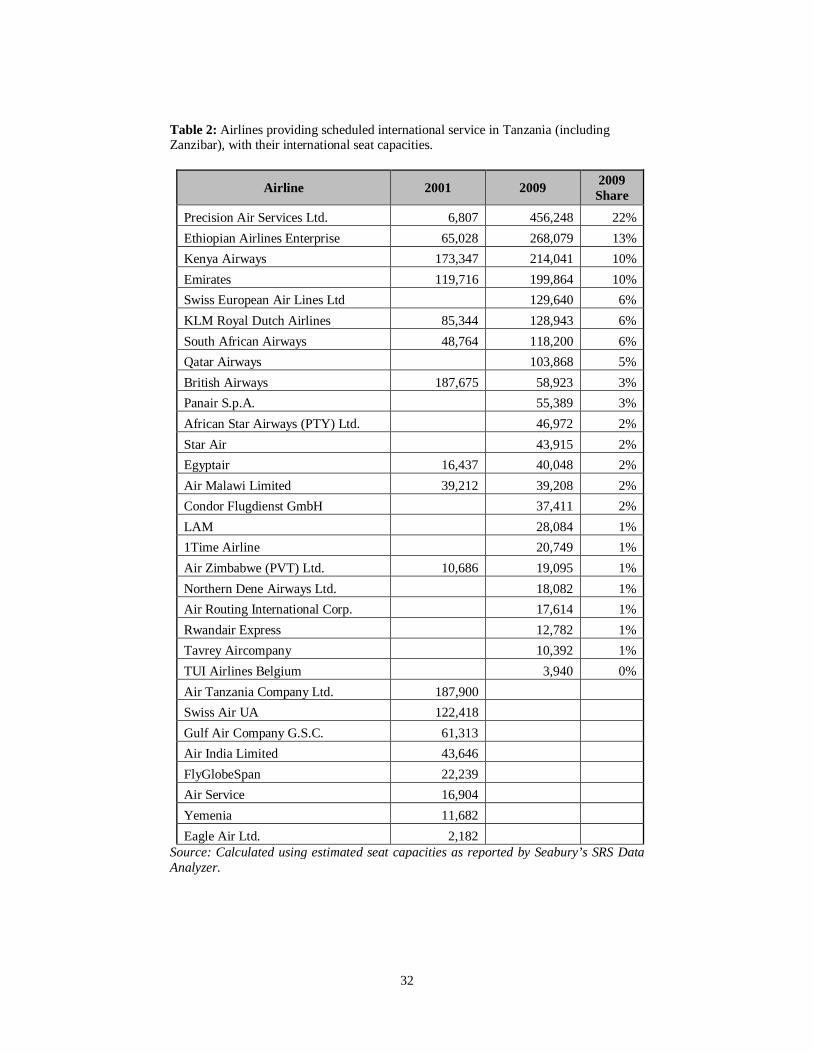
Tourism accounts for a large chunk of passenger traffic arriving internationally, with the game reserves in the north and Zanzibar being major attractions. An estimated 66.8 of all arrivals are tourism related11. By far the strongest route is between Kenya and Tanzania, since Nairobi is one of the three import air transport hubs in Sub-Saharan Africa. Table 2 shows a breakdown of airlines with their respective market share for 2008, using capacity estimates.
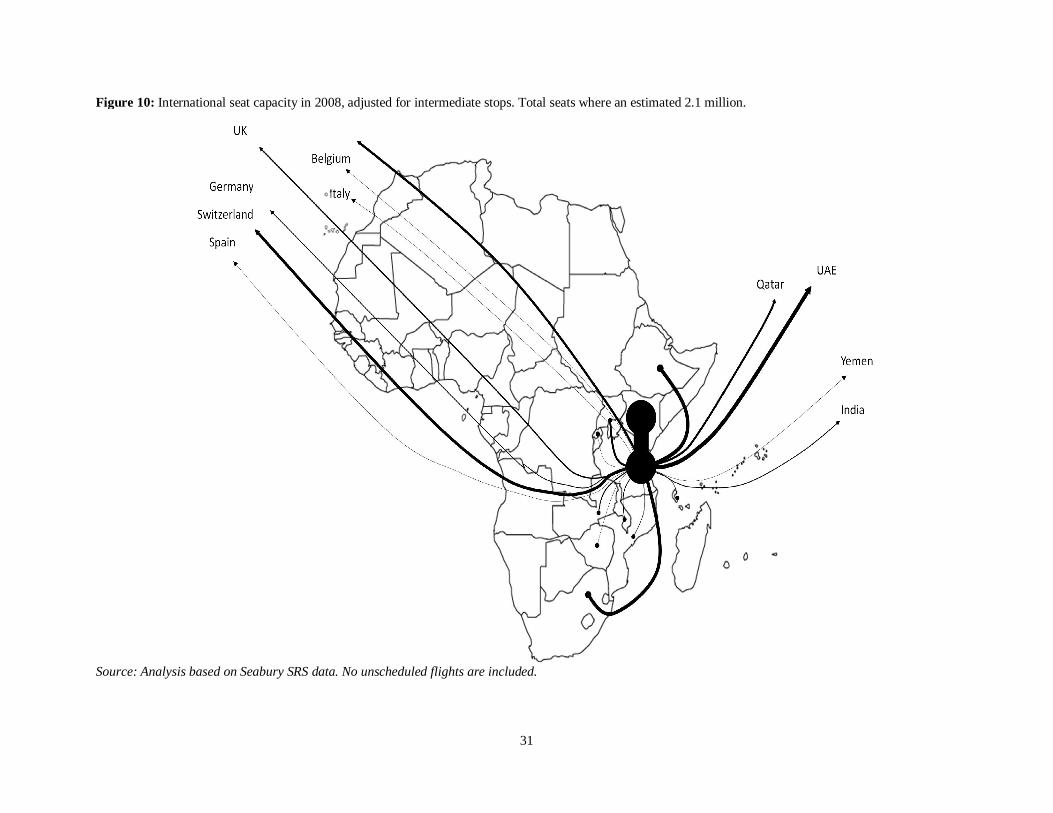
Figure 10 shows the major international routes for all of Tanzania for 2008. The data used for this analysis is from the Seabury SRS data analyzer, which measures scheduled capacity, not actual passenger flows. However, an extract of this data for Dar es Salaam has been compared with the actual passenger data from the TAA for Dar es Salaam, and a remarkable consistency has been found between 2005 and 2008, as shown in Table 1. The ratio of the estimated scheduled seat capacity to actual passengers should approximate load factors, and indeed the climb of this ratio from roughly 66% to between 80 and 90% does somewhat follow the global industry trend in load factors.
9 There are slight variances in the totals when comparing TCAA and TAA’s statistics. The TCAA published a total system traffic number of 2.90 million, a roughly 6% difference. In most cases, the TCAA’s numbers are being used, however, since the TAA has a published breakdown of all of its airports between 2004 and 2008, for system-wide traffic the TAA’s numbers are used, in conjunction with TCAA’s numbers for Zanzibar, Pemba, and Kilimanjaro. 10 The long-term global average is about 10% growth. However, during the period in question Tanzania clearly outperformed global growth rates. 11 Computed using numbers found in Tourism Statistical Bulletin 2008, Ministry of Natural Resources and Tourism (Tanzania), Tourism Department, p. 8
29
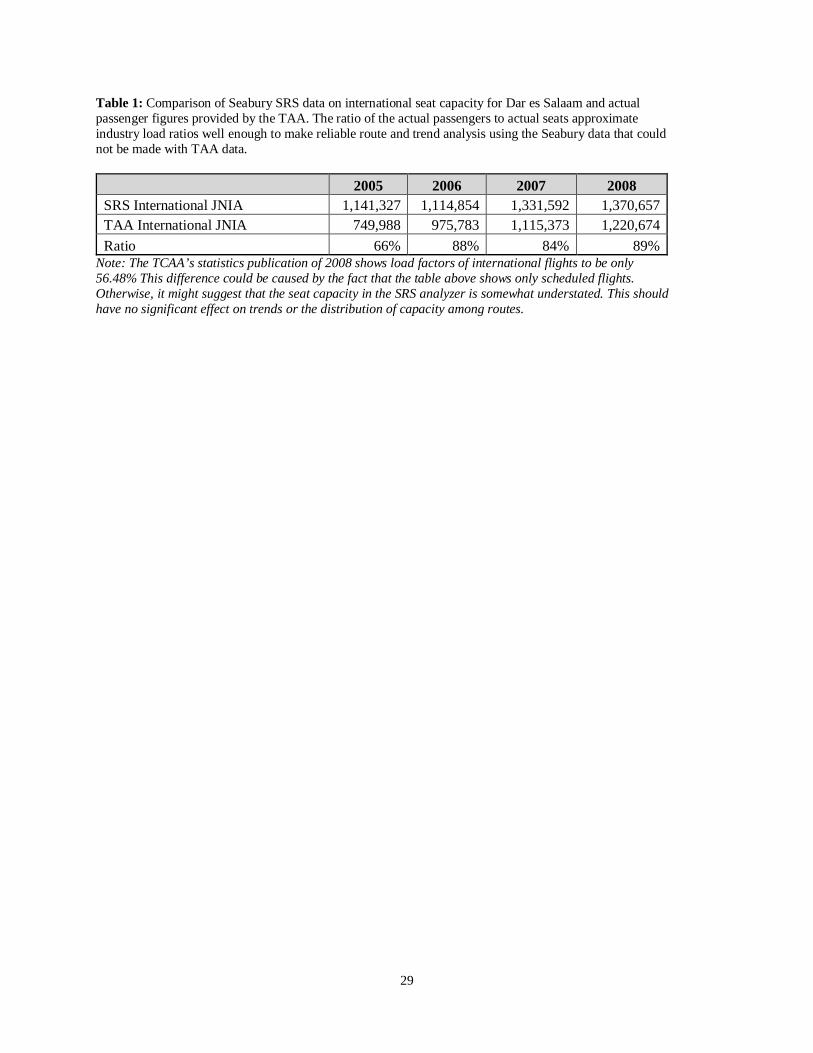
Table 1: Comparison of Seabury SRS data on international seat capacity for Dar es Salaam and actual passenger figures provided by the TAA. The ratio of the actual passengers to actual seats approximate industry load ratios well enough to make reliable route and trend analysis using the Seabury data that could not be made with TAA data.
2005 2006 2007 2008 SRS International JNIA 1,141,327 1,114,854 1,331,592 1,370,657 TAA International JNIA 749,988 975,783 1,115,373 1,220,674 Ratio 66% 88% 84% 89%
Note: The TCAA’s statistics publication of 2008 shows load factors of international flights to be only 56.48% This difference could be caused by the fact that the table above shows only scheduled flights. Otherwise, it might suggest that the seat capacity in the SRS analyzer is somewhat understated. This should have no significant effect on trends or the distribution of capacity among routes.
30
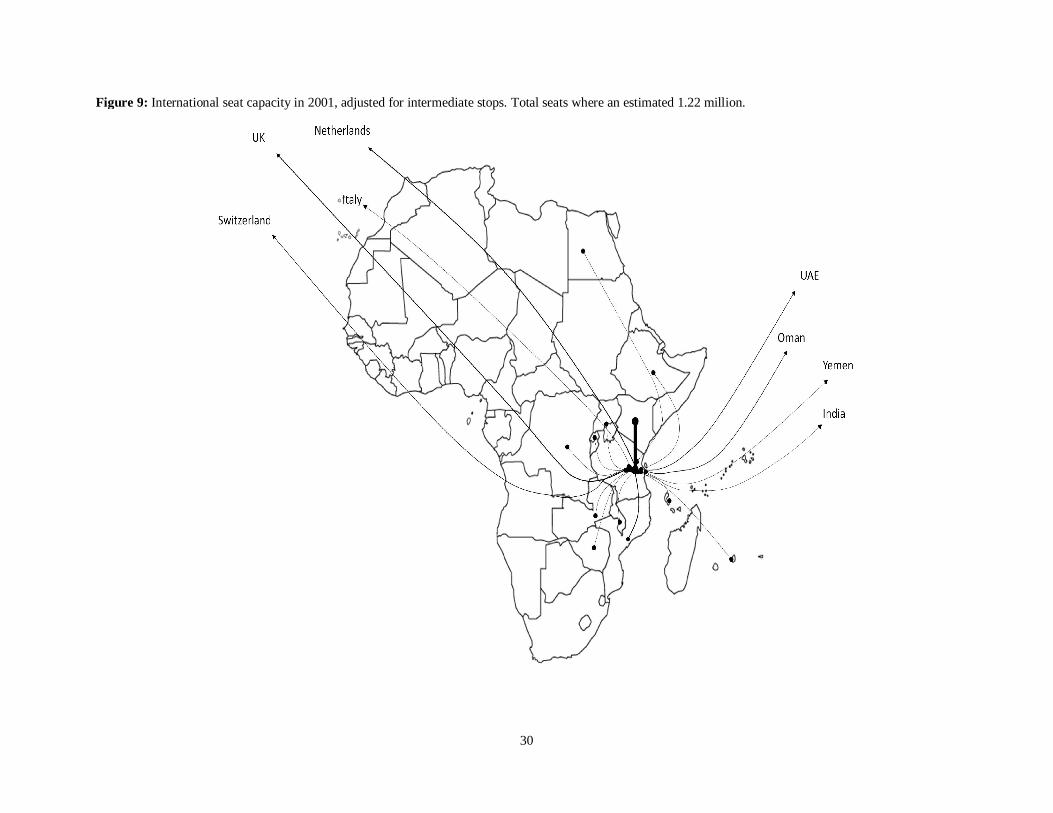
Figure 9: International seat capacity in 2001, adjusted for intermediate stops. Total seats where an estimated 1.22 million.
31
Figure 10: International seat capacity in 2008, adjusted for intermediate stops. Total seats where an estimated 2.1 million.
Source: Analysis based on Seabury SRS data. No unscheduled flights are included.
32
Table 2: Airlines providing scheduled international service in Tanzania (including Zanzibar), with their international seat capacities.
Airline 2001 2009 2009 Share
Precision Air Services Ltd. 6,807 456,248 22% Ethiopian Airlines Enterprise 65,028 268,079 13% Kenya Airways 173,347 214,041 10% Emirates 119,716 199,864 10% Swiss European Air Lines Ltd
129,640 6%
KLM Royal Dutch Airlines 85,344 128,943 6% South African Airways 48,764 118,200 6% Qatar Airways
103,868 5%
British Airways 187,675 58,923 3% Panair S.p.A.
55,389 3%
African Star Airways (PTY) Ltd.
46,972 2% Star Air
43,915 2%
Egyptair 16,437 40,048 2% Air Malawi Limited 39,212 39,208 2% Condor Flugdienst GmbH
37,411 2%
LAM
28,084 1% 1Time Airline
20,749 1%
Air Zimbabwe (PVT) Ltd. 10,686 19,095 1% Northern Dene Airways Ltd.
18,082 1%
Air Routing International Corp.
17,614 1% Rwandair Express
12,782 1%
Tavrey Aircompany
10,392 1% TUI Airlines Belgium
3,940 0%
Air Tanzania Company Ltd. 187,900 Swiss Air UA 122,418 Gulf Air Company G.S.C. 61,313 Air India Limited 43,646 FlyGlobeSpan 22,239 Air Service 16,904 Yemenia 11,682 Eagle Air Ltd. 2,182
Source: Calculated using estimated seat capacities as reported by Seabury’s SRS Data Analyzer.
33
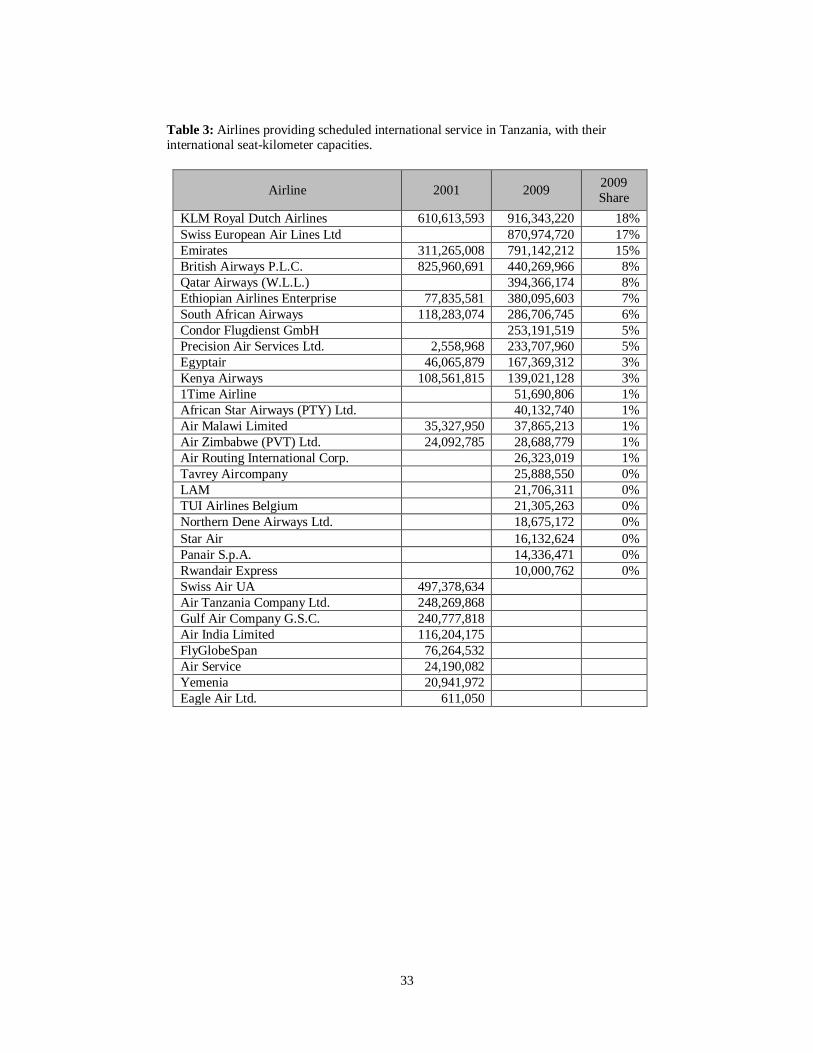
Table 3: Airlines providing scheduled international service in Tanzania, with their international seat-kilometer capacities.
Airline 2001 2009 2009 Share
KLM Royal Dutch Airlines 610,613,593 916,343,220 18% Swiss European Air Lines Ltd
870,974,720 17%
Emirates 311,265,008 791,142,212 15% British Airways P.L.C. 825,960,691 440,269,966 8% Qatar Airways (W.L.L.)
394,366,174 8%
Ethiopian Airlines Enterprise 77,835,581 380,095,603 7% South African Airways 118,283,074 286,706,745 6% Condor Flugdienst GmbH
253,191,519 5%
Precision Air Services Ltd. 2,558,968 233,707,960 5% Egyptair 46,065,879 167,369,312 3% Kenya Airways 108,561,815 139,021,128 3% 1Time Airline
51,690,806 1%
African Star Airways (PTY) Ltd.
40,132,740 1% Air Malawi Limited 35,327,950 37,865,213 1% Air Zimbabwe (PVT) Ltd. 24,092,785 28,688,779 1% Air Routing International Corp.
26,323,019 1%
Tavrey Aircompany
25,888,550 0% LAM
21,706,311 0%
TUI Airlines Belgium
21,305,263 0% Northern Dene Airways Ltd.
18,675,172 0%
Star Air
16,132,624 0% Panair S.p.A.
14,336,471 0%
Rwandair Express
10,000,762 0% Swiss Air UA 497,378,634
Air Tanzania Company Ltd. 248,269,868 Gulf Air Company G.S.C. 240,777,818 Air India Limited 116,204,175 FlyGlobeSpan 76,264,532 Air Service 24,190,082 Yemenia 20,941,972 Eagle Air Ltd. 611,050
34
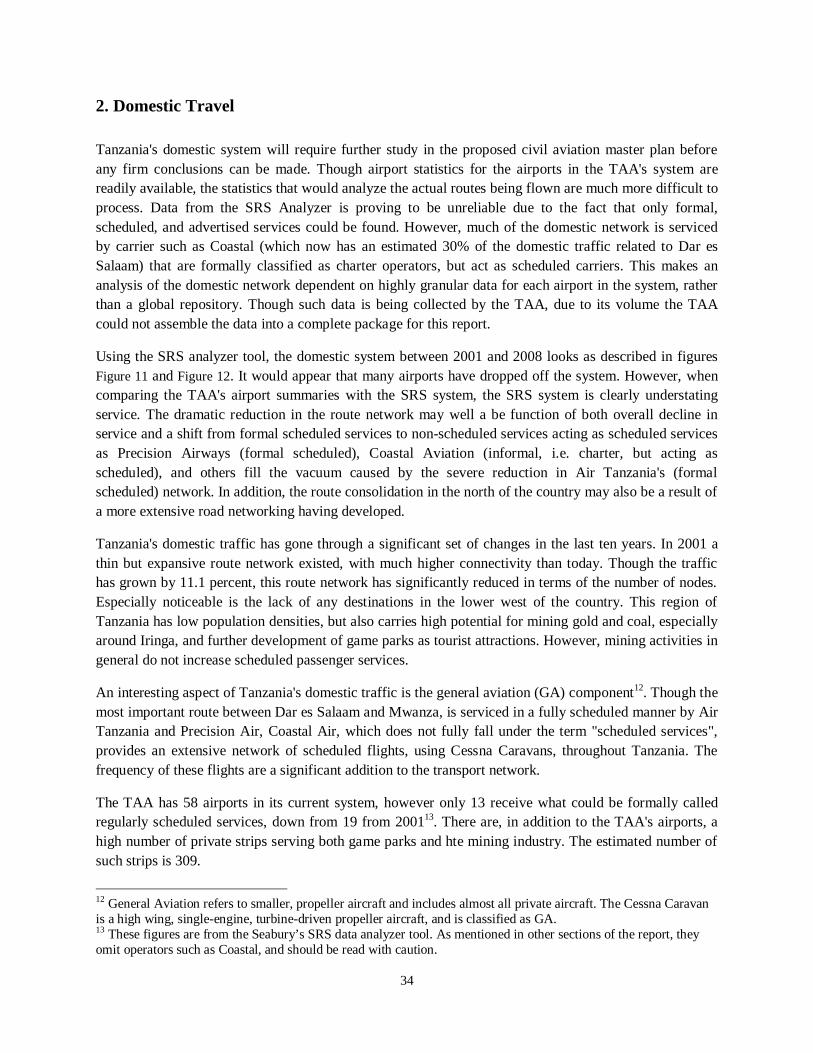
2. Domestic Travel Tanzania's domestic system will require further study in the proposed civil aviation master plan before any firm conclusions can be made. Though airport statistics for the airports in the TAA's system are readily available, the statistics that would analyze the actual routes being flown are much more difficult to process. Data from the SRS Analyzer is proving to be unreliable due to the fact that only formal, scheduled, and advertised services could be found. However, much of the domestic network is serviced by carrier such as Coastal (which now has an estimated 30% of the domestic traffic related to Dar es Salaam) that are formally classified as charter operators, but act as scheduled carriers. This makes an analysis of the domestic network dependent on highly granular data for each airport in the system, rather than a global repository. Though such data is being collected by the TAA, due to its volume the TAA could not assemble the data into a complete package for this report.
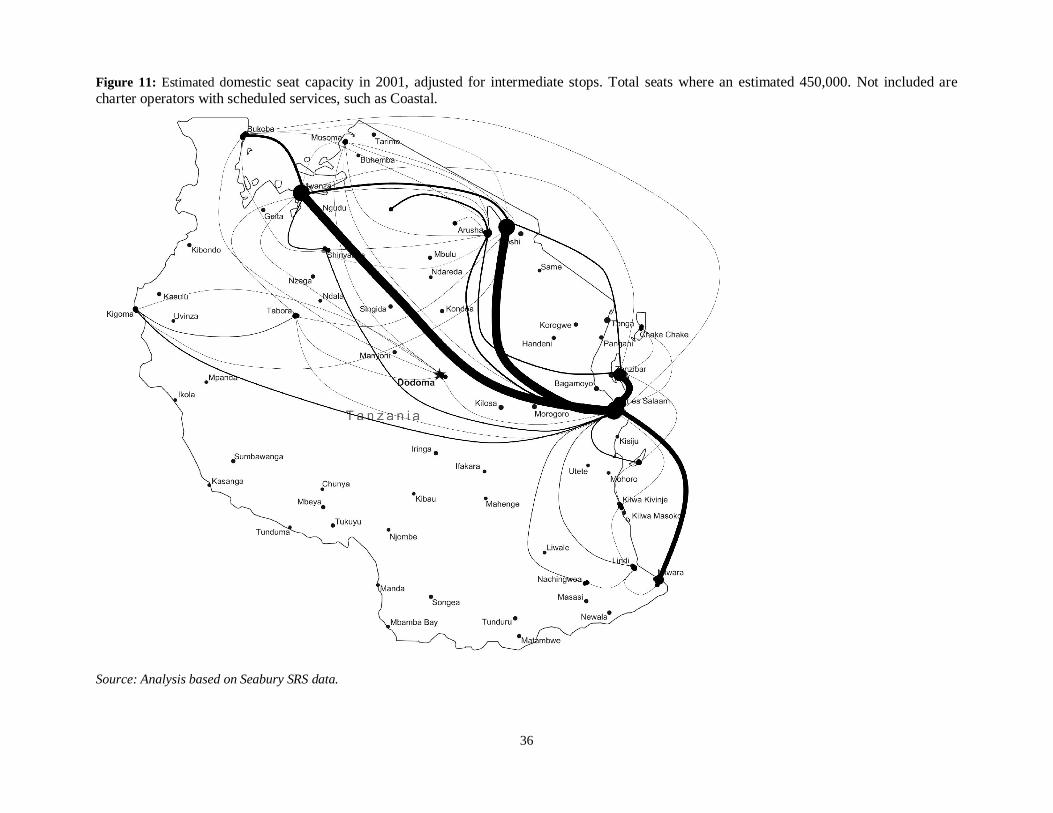
Using the SRS analyzer tool, the domestic system between 2001 and 2008 looks as described in figures Figure 11 and Figure 12. It would appear that many airports have dropped off the system. However, when comparing the TAA's airport summaries with the SRS system, the SRS system is clearly understating service. The dramatic reduction in the route network may well a be function of both overall decline in service and a shift from formal scheduled services to non-scheduled services acting as scheduled services as Precision Airways (formal scheduled), Coastal Aviation (informal, i.e. charter, but acting as scheduled), and others fill the vacuum caused by the severe reduction in Air Tanzania's (formal scheduled) network. In addition, the route consolidation in the north of the country may also be a result of a more extensive road networking having developed.
Tanzania's domestic traffic has gone through a significant set of changes in the last ten years. In 2001 a thin but expansive route network existed, with much higher connectivity than today. Though the traffic has grown by 11.1 percent, this route network has significantly reduced in terms of the number of nodes. Especially noticeable is the lack of any destinations in the lower west of the country. This region of Tanzania has low population densities, but also carries high potential for mining gold and coal, especially around Iringa, and further development of game parks as tourist attractions. However, mining activities in general do not increase scheduled passenger services.
An interesting aspect of Tanzania's domestic traffic is the general aviation (GA) component12. Though the most important route between Dar es Salaam and Mwanza, is serviced in a fully scheduled manner by Air Tanzania and Precision Air, Coastal Air, which does not fully fall under the term "scheduled services", provides an extensive network of scheduled flights, using Cessna Caravans, throughout Tanzania. The frequency of these flights are a significant addition to the transport network.
The TAA has 58 airports in its current system, however only 13 receive what could be formally called regularly scheduled services, down from 19 from 200113. There are, in addition to the TAA's airports, a high number of private strips serving both game parks and hte mining industry. The estimated number of such strips is 309.
12 General Aviation refers to smaller, propeller aircraft and includes almost all private aircraft. The Cessna Caravan is a high wing, single-engine, turbine-driven propeller aircraft, and is classified as GA. 13 These figures are from the Seabury’s SRS data analyzer tool. As mentioned in other sections of the report, they omit operators such as Coastal, and should be read with caution.
35
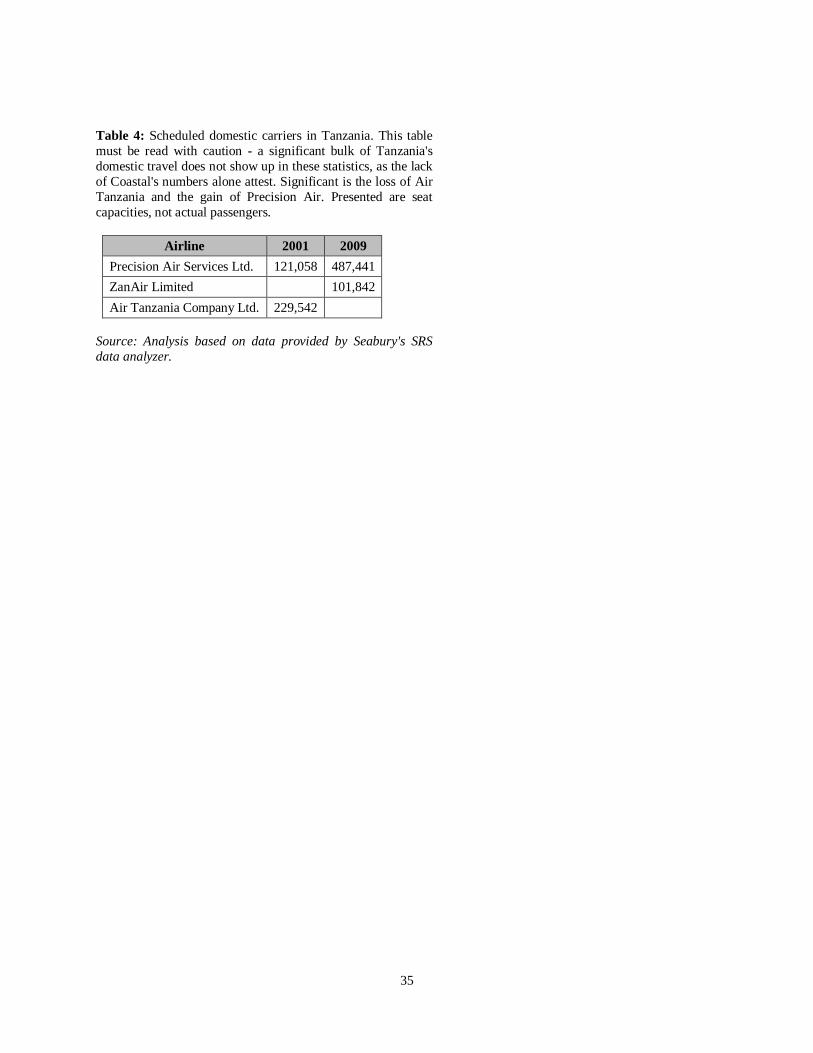
Table 4: Scheduled domestic carriers in Tanzania. This table must be read with caution - a significant bulk of Tanzania's domestic travel does not show up in these statistics, as the lack of Coastal's numbers alone attest. Significant is the loss of Air Tanzania and the gain of Precision Air. Presented are seat capacities, not actual passengers.
Airline 2001 2009 Precision Air Services Ltd. 121,058 487,441 ZanAir Limited 101,842 Air Tanzania Company Ltd. 229,542
Source: Analysis based on data provided by Seabury's SRS data analyzer.
36
Source: Analysis based on Seabury SRS data.
Figure 11: Estimated domestic seat capacity in 2001, adjusted for intermediate stops. Total seats where an estimated 450,000. Not included are charter operators with scheduled services, such as Coastal.
37
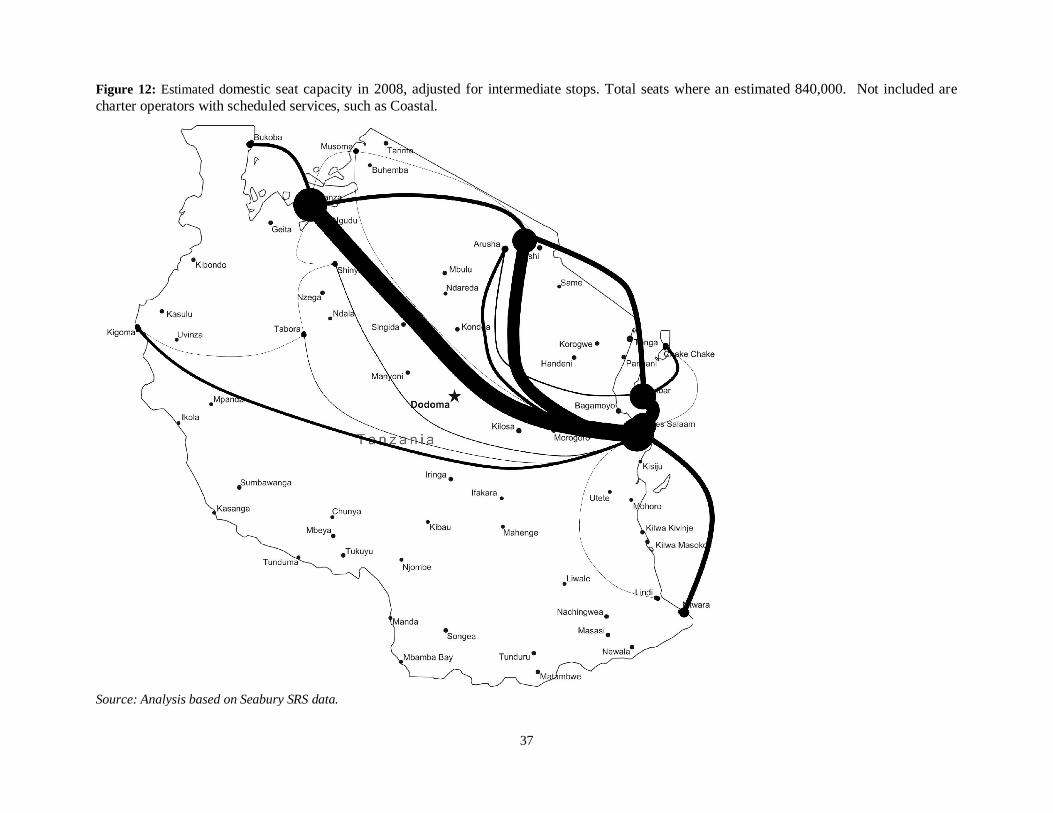
Figure 12: Estimated domestic seat capacity in 2008, adjusted for intermediate stops. Total seats where an estimated 840,000. Not included are charter operators with scheduled services, such as Coastal.
Source: Analysis based on Seabury SRS data.
38
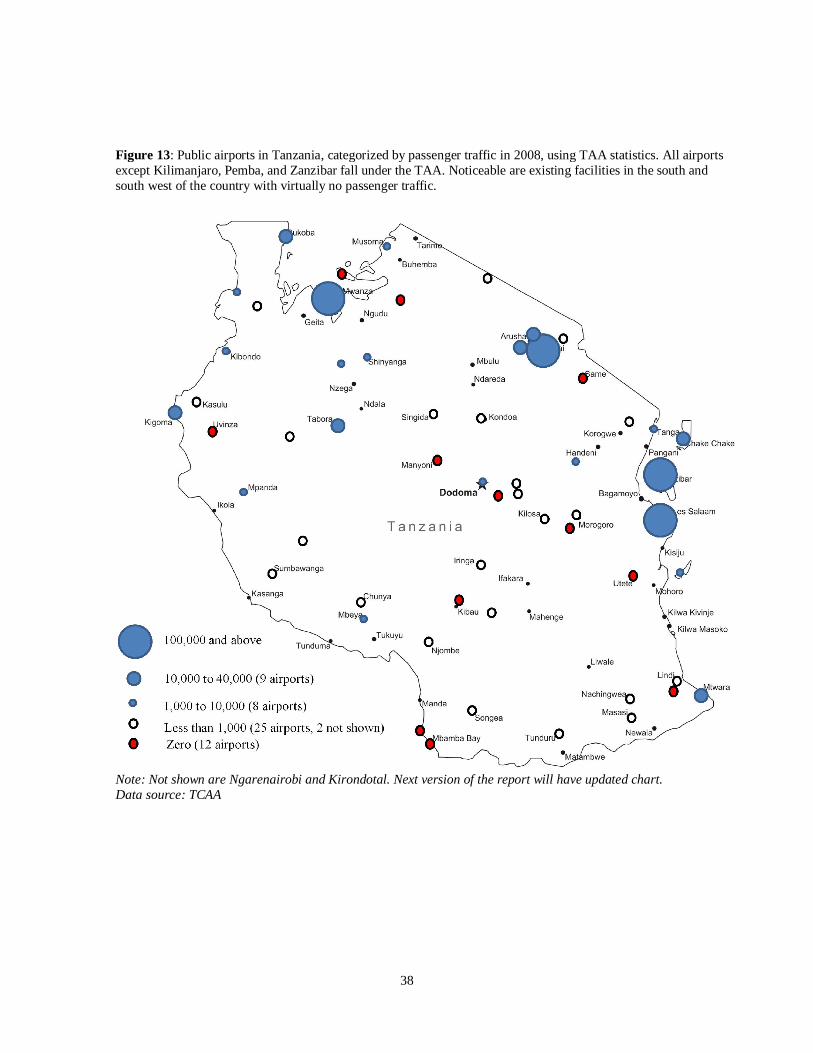
Figure 13: Public airports in Tanzania, categorized by passenger traffic in 2008, using TAA statistics. All airports except Kilimanjaro, Pemba, and Zanzibar fall under the TAA. Noticeable are existing facilities in the south and south west of the country with virtually no passenger traffic.
Note: Not shown are Ngarenairobi and Kirondotal. Next version of the report will have updated chart. Data source: TCAA
39
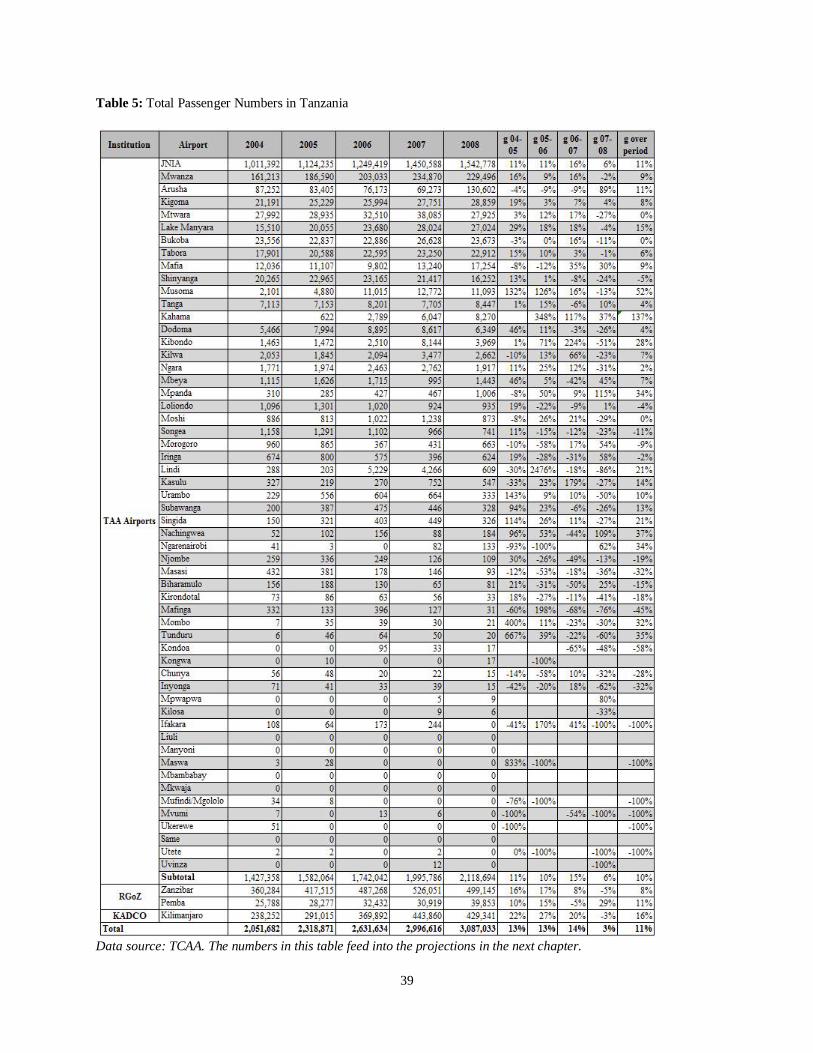
Table 5: Total Passenger Numbers in Tanzania
Data source: TCAA. The numbers in this table feed into the projections in the next chapter.
40
IV. Investments: An Overview
1. Anticipated Needs Airport investments are complicated because of (a) their intermodal play and (b) simply the speculative nature of a new transport node. The notion of "build, and they will come" may work in some infrastructure arenas, but in the air transport (particularly airports) sector this notion has had very mixed results, with the example of the Montréal-Mirabel airport often cited as the most astounding as the airport failed as a passenger airport and was relegated to cargo-only operations.
In Tanzania, there are some clear examples of truly needed investments in existing facilities, while the development of new facilities may be more questionable for future payback. For Tanzania, for example, the eventual addition of a new international terminal in Dar es Salaam, as well as a new additional terminal in Zanzibar, are mathematically determined "must-haves". These are existing airports with determined levels of growth that can be easily projected into the future. Given the nature of Tanzania's domestic services, however, the true analysis of where future demand lies not in the prediction of where good anchors, or nodes, may be placed, but by looking at what operators are already doing. The most informative set of needs for future domestic air transport investment, or even other modal investments such as roads, may lie in where operators are placing their private airstrips today. At the same time, an analysis of the current airports in the TAA's system could well demonstrate that there are nodes worthwhile dropping altogether.
Figure 13 in the previous section helps illustrate the point. There are 37 airports with less than 1,000 passengers in 2008, of which 12 have no passengers at all. If this is compared to the actual traffic charts showing domestic passenger movements (Figure 12 earlier in this report), it would seem that the lack of traffic in the lower western portion of the country is not caused by lack or airports or airstrips, but simply by lack of demand for services at current cost levels.
41
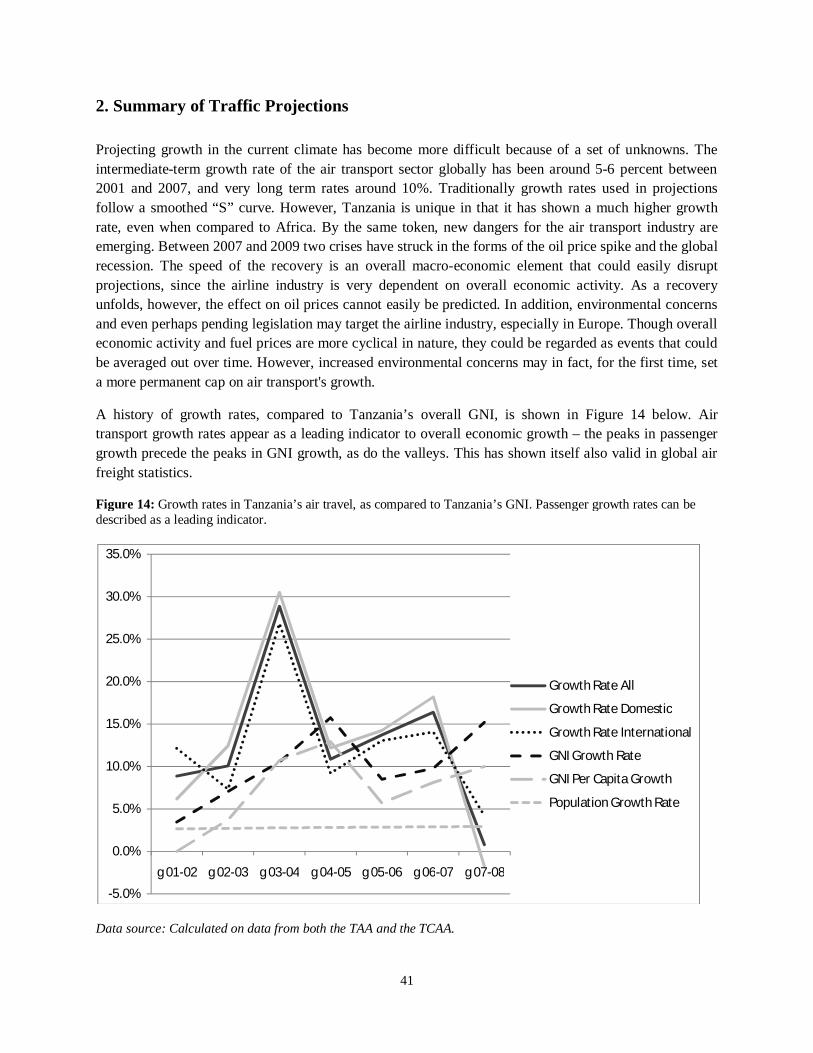
2. Summary of Traffic Projections Projecting growth in the current climate has become more difficult because of a set of unknowns. The intermediate-term growth rate of the air transport sector globally has been around 5-6 percent between 2001 and 2007, and very long term rates around 10%. Traditionally growth rates used in projections follow a smoothed “S” curve. However, Tanzania is unique in that it has shown a much higher growth rate, even when compared to Africa. By the same token, new dangers for the air transport industry are emerging. Between 2007 and 2009 two crises have struck in the forms of the oil price spike and the global recession. The speed of the recovery is an overall macro-economic element that could easily disrupt projections, since the airline industry is very dependent on overall economic activity. As a recovery unfolds, however, the effect on oil prices cannot easily be predicted. In addition, environmental concerns and even perhaps pending legislation may target the airline industry, especially in Europe. Though overall economic activity and fuel prices are more cyclical in nature, they could be regarded as events that could be averaged out over time. However, increased environmental concerns may in fact, for the first time, set a more permanent cap on air transport's growth.
A history of growth rates, compared to Tanzania’s overall GNI, is shown in Figure 14 below. Air transport growth rates appear as a leading indicator to overall economic growth – the peaks in passenger growth precede the peaks in GNI growth, as do the valleys. This has shown itself also valid in global air freight statistics.
Figure 14: Growth rates in Tanzania’s air travel, as compared to Tanzania’s GNI. Passenger growth rates can be described as a leading indicator.
Data source: Calculated on data from both the TAA and the TCAA.
-5.0%
0.0%
5.0%
10.0%
15.0%
20.0%
25.0%
30.0%
35.0%
g 01-02 g 02-03 g 03-04 g 04-05 g 05-06 g 06-07 g 07-08
Growth Rate All
Growth Rate Domestic
Growth Rate International
GNI Growth Rate
GNI Per Capita Growth
Population Growth Rate
42
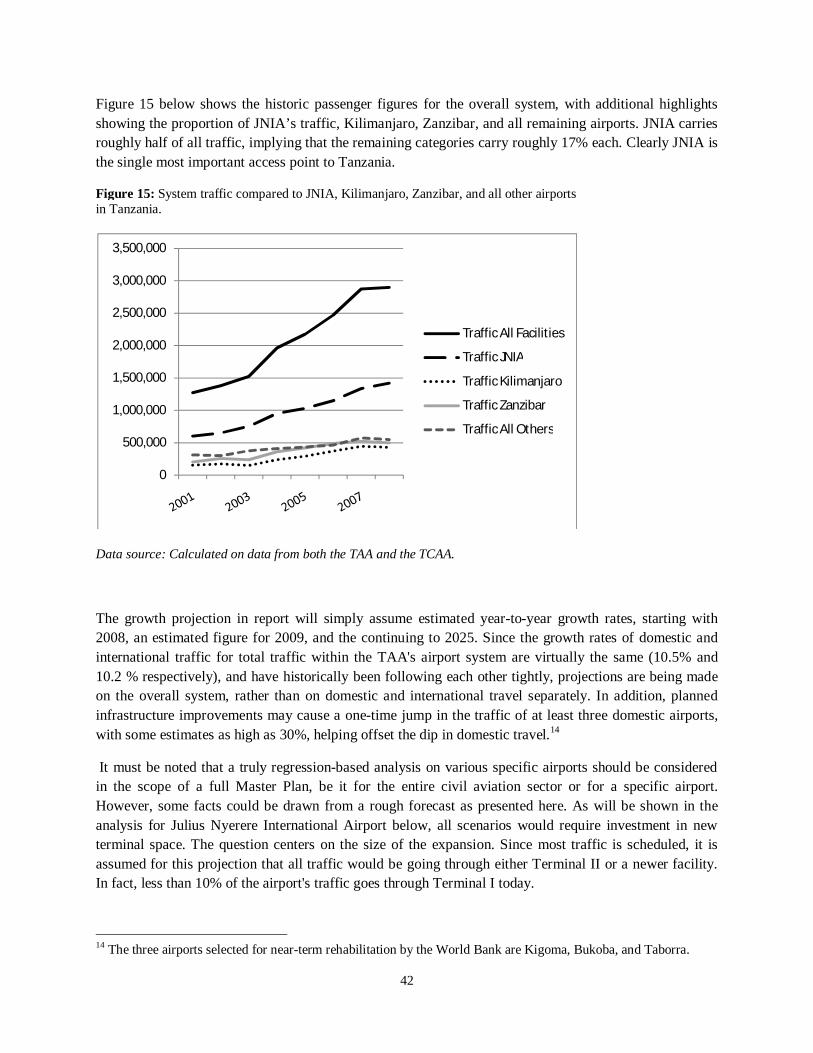
Figure 15 below shows the historic passenger figures for the overall system, with additional highlights showing the proportion of JNIA’s traffic, Kilimanjaro, Zanzibar, and all remaining airports. JNIA carries roughly half of all traffic, implying that the remaining categories carry roughly 17% each. Clearly JNIA is the single most important access point to Tanzania.
Figure 15: System traffic compared to JNIA, Kilimanjaro, Zanzibar, and all other airports in Tanzania.
Data source: Calculated on data from both the TAA and the TCAA.
The growth projection in report will simply assume estimated year-to-year growth rates, starting with 2008, an estimated figure for 2009, and the continuing to 2025. Since the growth rates of domestic and international traffic for total traffic within the TAA's airport system are virtually the same (10.5% and 10.2 % respectively), and have historically been following each other tightly, projections are being made on the overall system, rather than on domestic and international travel separately. In addition, planned infrastructure improvements may cause a one-time jump in the traffic of at least three domestic airports, with some estimates as high as 30%, helping offset the dip in domestic travel.14
It must be noted that a truly regression-based analysis on various specific airports should be considered in the scope of a full Master Plan, be it for the entire civil aviation sector or for a specific airport. However, some facts could be drawn from a rough forecast as presented here. As will be shown in the analysis for Julius Nyerere International Airport below, all scenarios would require investment in new terminal space. The question centers on the size of the expansion. Since most traffic is scheduled, it is assumed for this projection that all traffic would be going through either Terminal II or a newer facility. In fact, less than 10% of the airport's traffic goes through Terminal I today.
14 The three airports selected for near-term rehabilitation by the World Bank are Kigoma, Bukoba, and Taborra.
0
500,000
1,000,000
1,500,000
2,000,000
2,500,000
3,000,000
3,500,000
Traffic All Facilities
Traffic JNIA
Traffic Kilimanjaro
Traffic Zanzibar
Traffic All Others
43
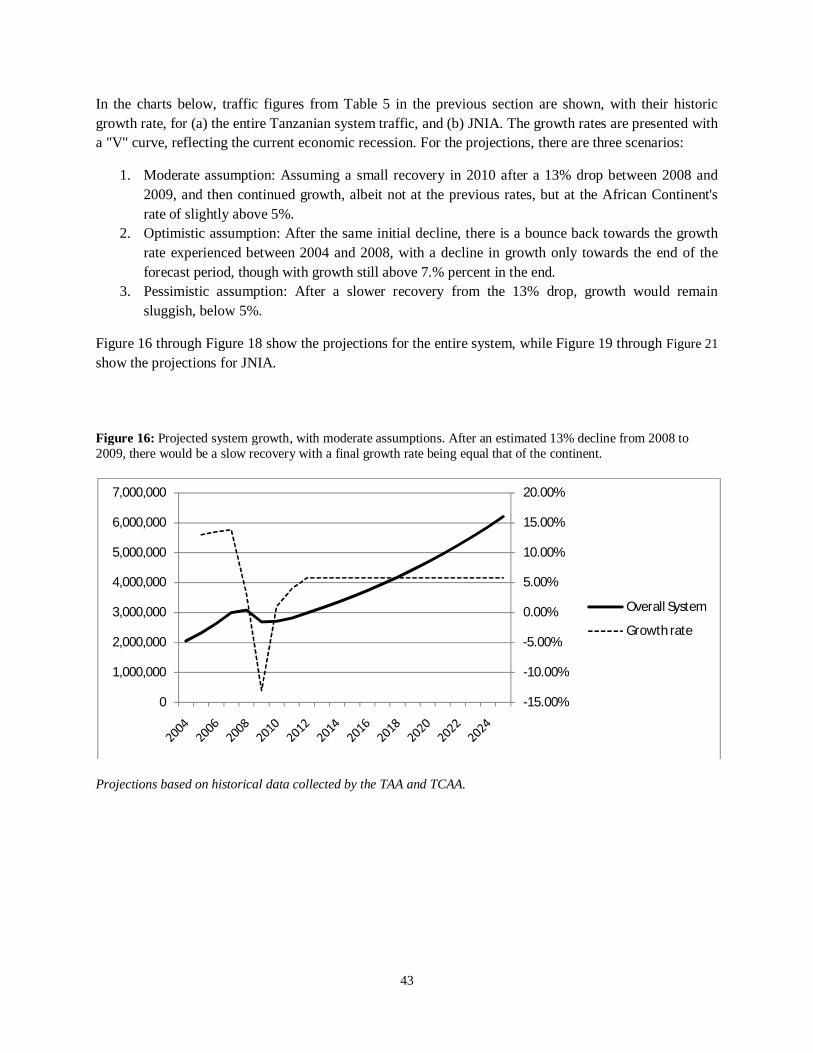
In the charts below, traffic figures from Table 5 in the previous section are shown, with their historic growth rate, for (a) the entire Tanzanian system traffic, and (b) JNIA. The growth rates are presented with a "V" curve, reflecting the current economic recession. For the projections, there are three scenarios:
1. Moderate assumption: Assuming a small recovery in 2010 after a 13% drop between 2008 and 2009, and then continued growth, albeit not at the previous rates, but at the African Continent's rate of slightly above 5%.
2. Optimistic assumption: After the same initial decline, there is a bounce back towards the growth rate experienced between 2004 and 2008, with a decline in growth only towards the end of the forecast period, though with growth still above 7.% percent in the end.
3. Pessimistic assumption: After a slower recovery from the 13% drop, growth would remain sluggish, below 5%.
Figure 16 through Figure 18 show the projections for the entire system, while Figure 19 through Figure 21 show the projections for JNIA.
Projections based on historical data collected by the TAA and TCAA.
Figure 16: Projected system growth, with moderate assumptions. After an estimated 13% decline from 2008 to 2009, there would be a slow recovery with a final growth rate being equal that of the continent.
-15.00%
-10.00%
-5.00%
0.00%
5.00%
10.00%
15.00%
20.00%
0
1,000,000
2,000,000
3,000,000
4,000,000
5,000,000
6,000,000
7,000,000
Overall System
Growth rate
44
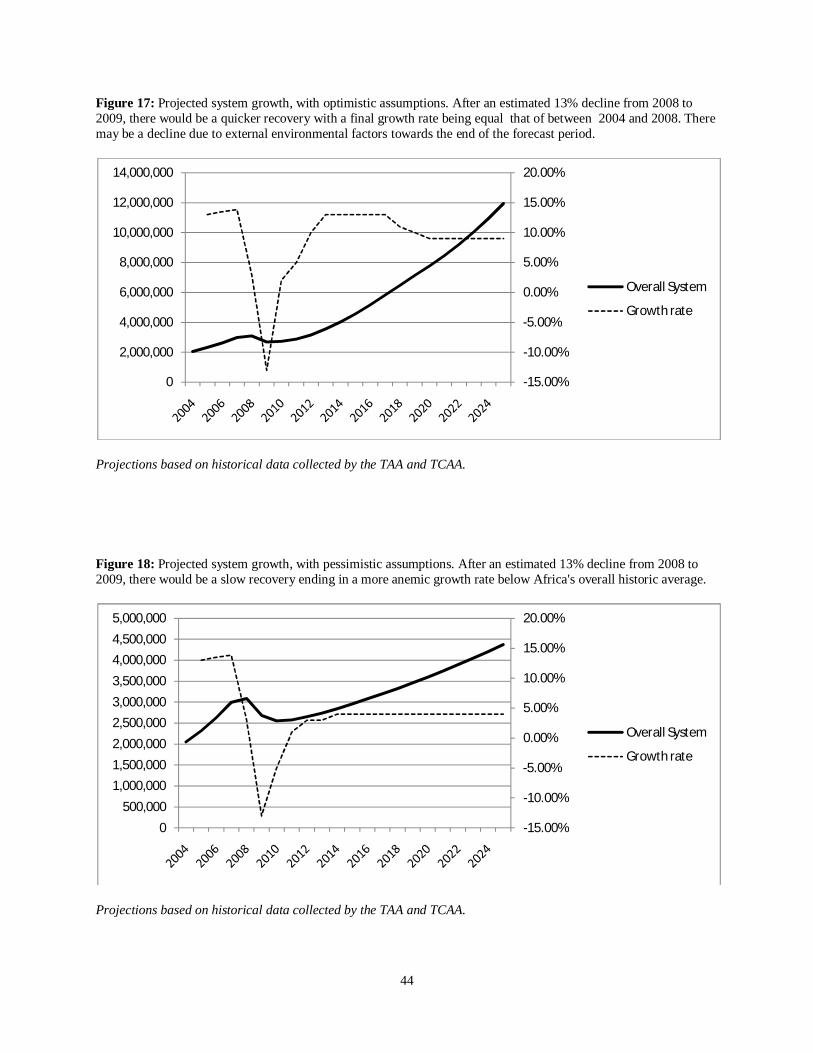
Figure 17: Projected system growth, with optimistic assumptions. After an estimated 13% decline from 2008 to 2009, there would be a quicker recovery with a final growth rate being equal that of between 2004 and 2008. There may be a decline due to external environmental factors towards the end of the forecast period.
Projections based on historical data collected by the TAA and TCAA.
Projections based on historical data collected by the TAA and TCAA.
-15.00%
-10.00%
-5.00%
0.00%
5.00%
10.00%
15.00%
20.00%
0
2,000,000
4,000,000
6,000,000
8,000,000
10,000,000
12,000,000
14,000,000
Overall System
Growth rate
Figure 18: Projected system growth, with pessimistic assumptions. After an estimated 13% decline from 2008 to 2009, there would be a slow recovery ending in a more anemic growth rate below Africa's overall historic average.
-15.00%
-10.00%
-5.00%
0.00%
5.00%
10.00%
15.00%
20.00%
0500,000
1,000,0001,500,0002,000,0002,500,0003,000,0003,500,0004,000,0004,500,0005,000,000
Overall System
Growth rate
45
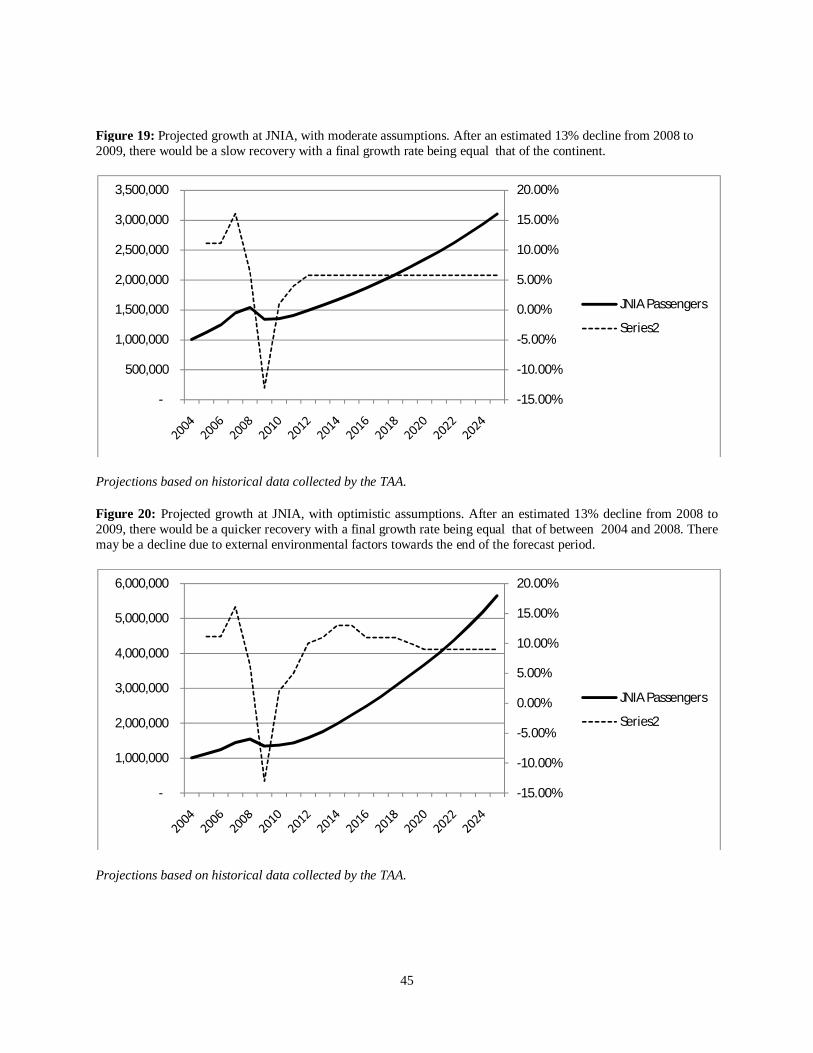
Figure 19: Projected growth at JNIA, with moderate assumptions. After an estimated 13% decline from 2008 to 2009, there would be a slow recovery with a final growth rate being equal that of the continent.
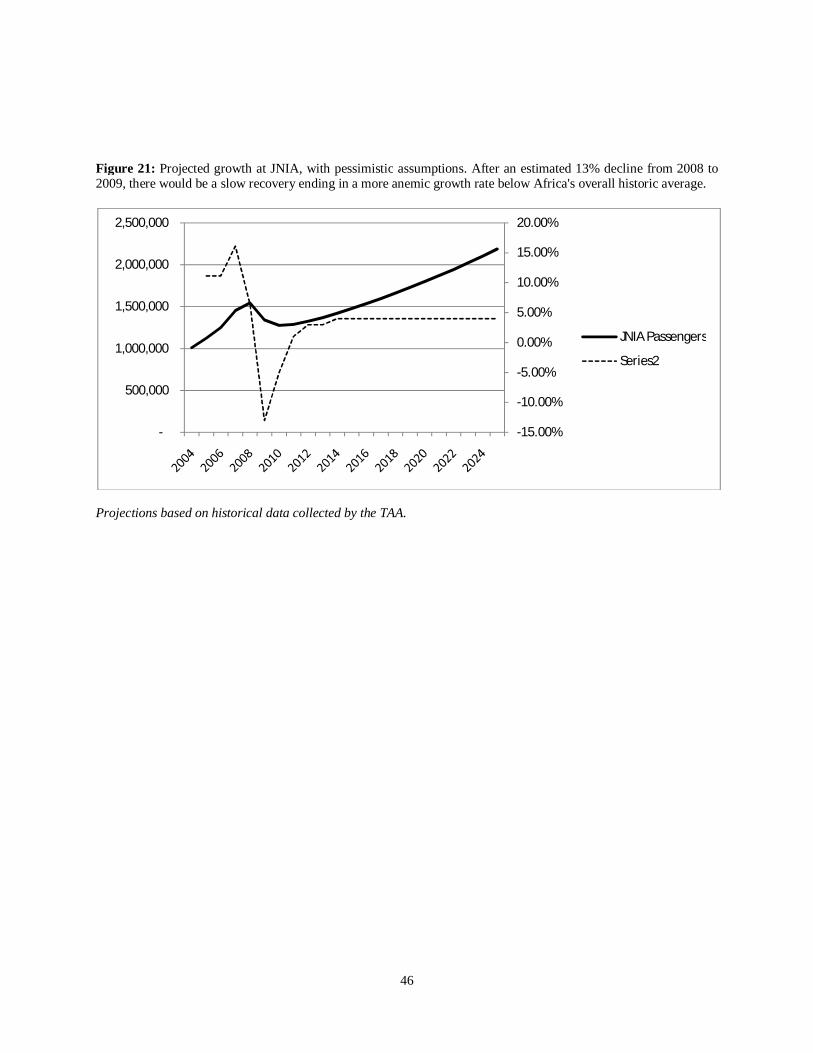
Projections based on historical data collected by the TAA. Figure 20: Projected growth at JNIA, with optimistic assumptions. After an estimated 13% decline from 2008 to 2009, there would be a quicker recovery with a final growth rate being equal that of between 2004 and 2008. There may be a decline due to external environmental factors towards the end of the forecast period.
Projections based on historical data collected by the TAA.
-15.00%
-10.00%
-5.00%
0.00%
5.00%
10.00%
15.00%
20.00%
-
500,000
1,000,000
1,500,000
2,000,000
2,500,000
3,000,000
3,500,000
JNIA Passengers
Series2
-15.00%
-10.00%
-5.00%
0.00%
5.00%
10.00%
15.00%
20.00%
-
1,000,000
2,000,000
3,000,000
4,000,000
5,000,000
6,000,000
JNIA Passengers
Series2
46
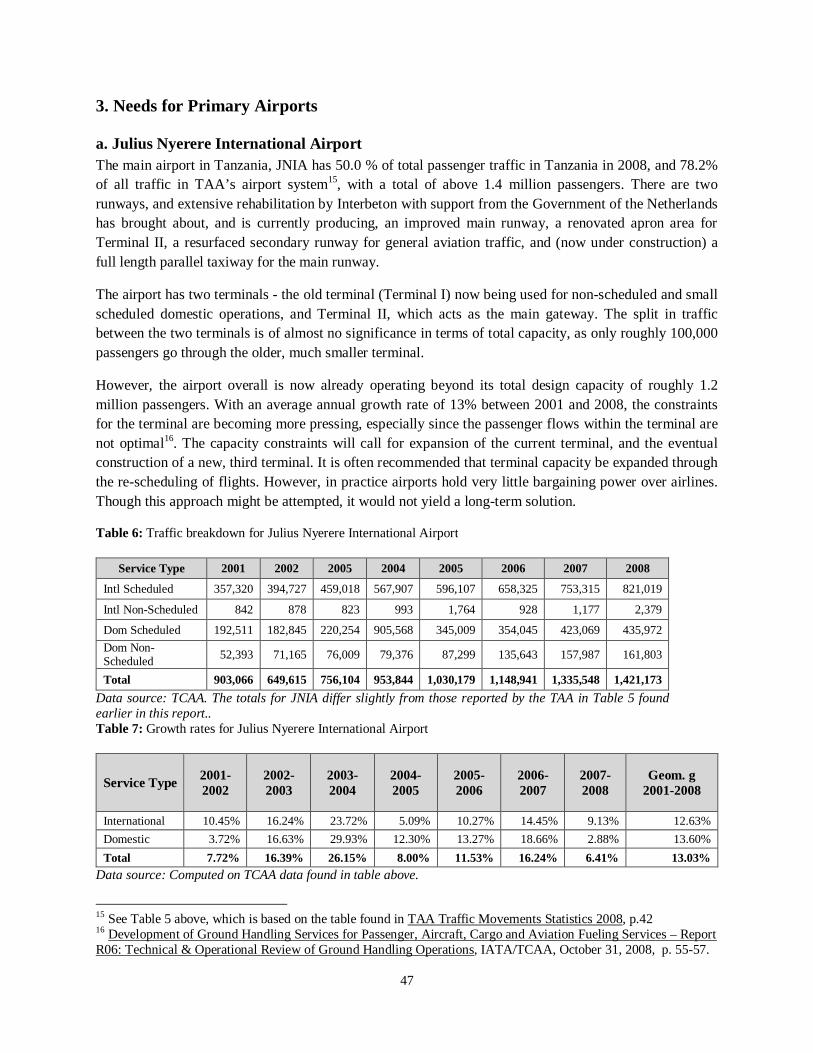
Figure 21: Projected growth at JNIA, with pessimistic assumptions. After an estimated 13% decline from 2008 to 2009, there would be a slow recovery ending in a more anemic growth rate below Africa's overall historic average.
Projections based on historical data collected by the TAA.
-15.00%
-10.00%
-5.00%
0.00%
5.00%
10.00%
15.00%
20.00%
-
500,000
1,000,000
1,500,000
2,000,000
2,500,000
JNIA Passengers
Series2
47
3. Needs for Primary Airports
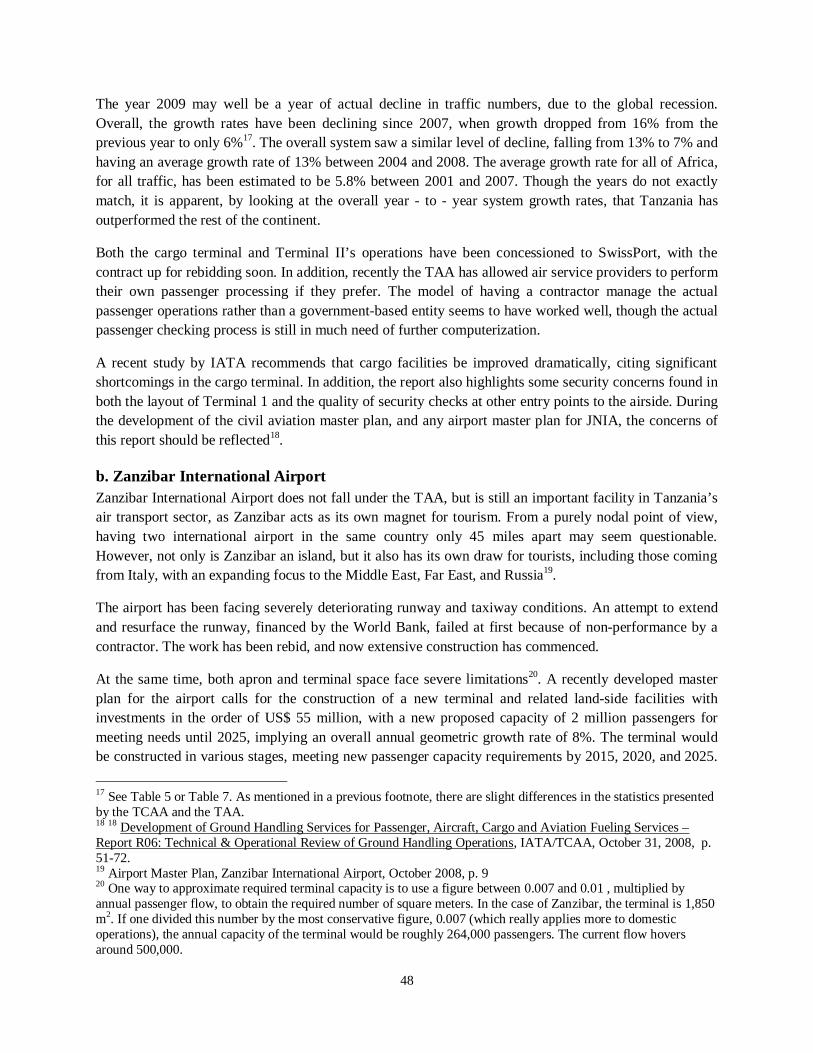
a. Julius Nyerere International Airport The main airport in Tanzania, JNIA has 50.0 % of total passenger traffic in Tanzania in 2008, and 78.2% of all traffic in TAA’s airport system15, with a total of above 1.4 million passengers. There are two runways, and extensive rehabilitation by Interbeton with support from the Government of the Netherlands has brought about, and is currently producing, an improved main runway, a renovated apron area for Terminal II, a resurfaced secondary runway for general aviation traffic, and (now under construction) a full length parallel taxiway for the main runway.
The airport has two terminals - the old terminal (Terminal I) now being used for non-scheduled and small scheduled domestic operations, and Terminal II, which acts as the main gateway. The split in traffic between the two terminals is of almost no significance in terms of total capacity, as only roughly 100,000 passengers go through the older, much smaller terminal.
However, the airport overall is now already operating beyond its total design capacity of roughly 1.2 million passengers. With an average annual growth rate of 13% between 2001 and 2008, the constraints for the terminal are becoming more pressing, especially since the passenger flows within the terminal are not optimal16. The capacity constraints will call for expansion of the current terminal, and the eventual construction of a new, third terminal. It is often recommended that terminal capacity be expanded through the re-scheduling of flights. However, in practice airports hold very little bargaining power over airlines. Though this approach might be attempted, it would not yield a long-term solution.
Table 6: Traffic breakdown for Julius Nyerere International Airport
Service Type 2001 2002 2005 2004 2005 2006 2007 2008
Intl Scheduled 357,320 394,727 459,018 567,907 596,107 658,325 753,315 821,019
Intl Non-Scheduled 842 878 823 993 1,764 928 1,177 2,379
Dom Scheduled 192,511 182,845 220,254 905,568 345,009 354,045 423,069 435,972 Dom Non-Scheduled 52,393 71,165 76,009 79,376 87,299 135,643 157,987 161,803
Total 903,066 649,615 756,104 953,844 1,030,179 1,148,941 1,335,548 1,421,173
Data source: TCAA. The totals for JNIA differ slightly from those reported by the TAA in Table 5 found earlier in this report.. Table 7: Growth rates for Julius Nyerere International Airport
Service Type 2001-2002
2002-2003
2003-2004
2004-2005
2005-2006
2006-2007
2007-2008
Geom. g 2001-2008
International 10.45% 16.24% 23.72% 5.09% 10.27% 14.45% 9.13% 12.63% Domestic 3.72% 16.63% 29.93% 12.30% 13.27% 18.66% 2.88% 13.60% Total 7.72% 16.39% 26.15% 8.00% 11.53% 16.24% 6.41% 13.03%
Data source: Computed on TCAA data found in table above.
15 See Table 5 above, which is based on the table found in TAA Traffic Movements Statistics 2008, p.42 16 Development of Ground Handling Services for Passenger, Aircraft, Cargo and Aviation Fueling Services – Report R06: Technical & Operational Review of Ground Handling Operations, IATA/TCAA, October 31, 2008, p. 55-57.
48
The year 2009 may well be a year of actual decline in traffic numbers, due to the global recession. Overall, the growth rates have been declining since 2007, when growth dropped from 16% from the previous year to only 6%17. The overall system saw a similar level of decline, falling from 13% to 7% and having an average growth rate of 13% between 2004 and 2008. The average growth rate for all of Africa, for all traffic, has been estimated to be 5.8% between 2001 and 2007. Though the years do not exactly match, it is apparent, by looking at the overall year - to - year system growth rates, that Tanzania has outperformed the rest of the continent.
Both the cargo terminal and Terminal II’s operations have been concessioned to SwissPort, with the contract up for rebidding soon. In addition, recently the TAA has allowed air service providers to perform their own passenger processing if they prefer. The model of having a contractor manage the actual passenger operations rather than a government-based entity seems to have worked well, though the actual passenger checking process is still in much need of further computerization.
A recent study by IATA recommends that cargo facilities be improved dramatically, citing significant shortcomings in the cargo terminal. In addition, the report also highlights some security concerns found in both the layout of Terminal 1 and the quality of security checks at other entry points to the airside. During the development of the civil aviation master plan, and any airport master plan for JNIA, the concerns of this report should be reflected18.
b. Zanzibar International Airport Zanzibar International Airport does not fall under the TAA, but is still an important facility in Tanzania’s air transport sector, as Zanzibar acts as its own magnet for tourism. From a purely nodal point of view, having two international airport in the same country only 45 miles apart may seem questionable. However, not only is Zanzibar an island, but it also has its own draw for tourists, including those coming from Italy, with an expanding focus to the Middle East, Far East, and Russia19.
The airport has been facing severely deteriorating runway and taxiway conditions. An attempt to extend and resurface the runway, financed by the World Bank, failed at first because of non-performance by a contractor. The work has been rebid, and now extensive construction has commenced.
At the same time, both apron and terminal space face severe limitations20. A recently developed master plan for the airport calls for the construction of a new terminal and related land-side facilities with investments in the order of US$ 55 million, with a new proposed capacity of 2 million passengers for meeting needs until 2025, implying an overall annual geometric growth rate of 8%. The terminal would be constructed in various stages, meeting new passenger capacity requirements by 2015, 2020, and 2025.
17 See Table 5 or Table 7. As mentioned in a previous footnote, there are slight differences in the statistics presented by the TCAA and the TAA. 18 18 Development of Ground Handling Services for Passenger, Aircraft, Cargo and Aviation Fueling Services – Report R06: Technical & Operational Review of Ground Handling Operations, IATA/TCAA, October 31, 2008, p. 51-72. 19 Airport Master Plan, Zanzibar International Airport, October 2008, p. 9 20 One way to approximate required terminal capacity is to use a figure between 0.007 and 0.01 , multiplied by annual passenger flow, to obtain the required number of square meters. In the case of Zanzibar, the terminal is 1,850 m2. If one divided this number by the most conservative figure, 0.007 (which really applies more to domestic operations), the annual capacity of the terminal would be roughly 264,000 passengers. The current flow hovers around 500,000.
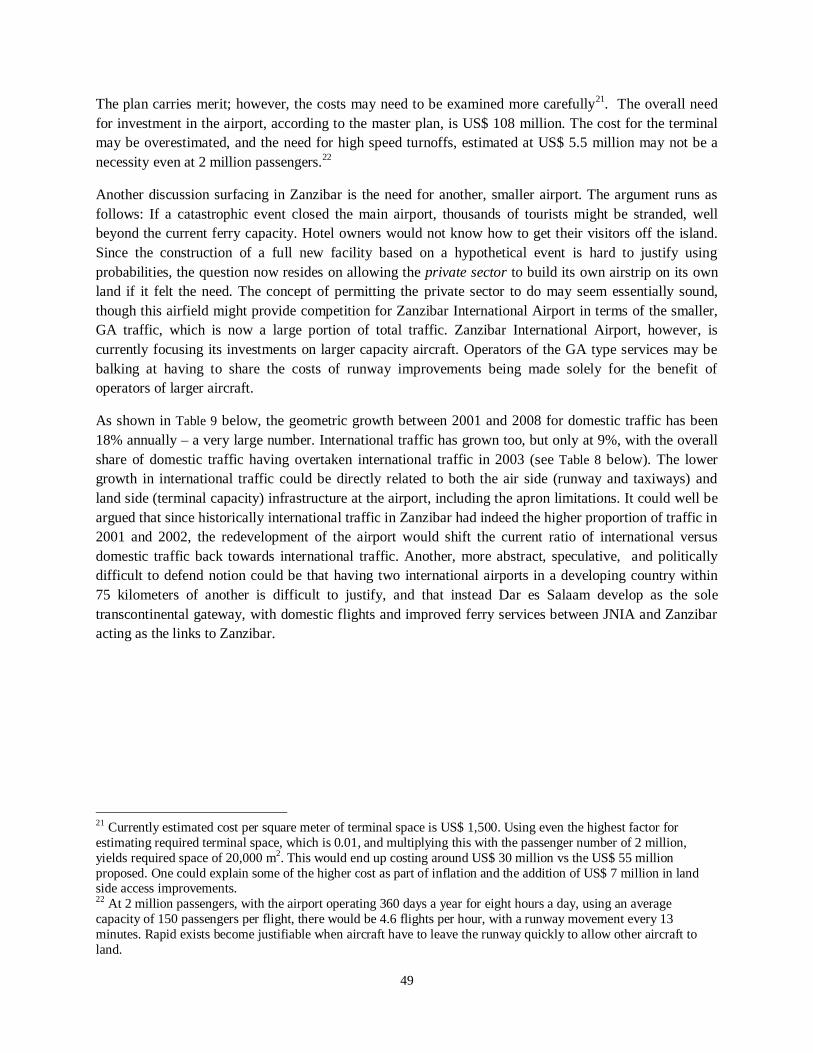
49
The plan carries merit; however, the costs may need to be examined more carefully21. The overall need for investment in the airport, according to the master plan, is US$ 108 million. The cost for the terminal may be overestimated, and the need for high speed turnoffs, estimated at US$ 5.5 million may not be a necessity even at 2 million passengers.22
Another discussion surfacing in Zanzibar is the need for another, smaller airport. The argument runs as follows: If a catastrophic event closed the main airport, thousands of tourists might be stranded, well beyond the current ferry capacity. Hotel owners would not know how to get their visitors off the island. Since the construction of a full new facility based on a hypothetical event is hard to justify using probabilities, the question now resides on allowing the private sector to build its own airstrip on its own land if it felt the need. The concept of permitting the private sector to do may seem essentially sound, though this airfield might provide competition for Zanzibar International Airport in terms of the smaller, GA traffic, which is now a large portion of total traffic. Zanzibar International Airport, however, is currently focusing its investments on larger capacity aircraft. Operators of the GA type services may be balking at having to share the costs of runway improvements being made solely for the benefit of operators of larger aircraft.
As shown in Table 9 below, the geometric growth between 2001 and 2008 for domestic traffic has been 18% annually – a very large number. International traffic has grown too, but only at 9%, with the overall share of domestic traffic having overtaken international traffic in 2003 (see Table 8 below). The lower growth in international traffic could be directly related to both the air side (runway and taxiways) and land side (terminal capacity) infrastructure at the airport, including the apron limitations. It could well be argued that since historically international traffic in Zanzibar had indeed the higher proportion of traffic in 2001 and 2002, the redevelopment of the airport would shift the current ratio of international versus domestic traffic back towards international traffic. Another, more abstract, speculative, and politically difficult to defend notion could be that having two international airports in a developing country within 75 kilometers of another is difficult to justify, and that instead Dar es Salaam develop as the sole transcontinental gateway, with domestic flights and improved ferry services between JNIA and Zanzibar acting as the links to Zanzibar.
21 Currently estimated cost per square meter of terminal space is US$ 1,500. Using even the highest factor for estimating required terminal space, which is 0.01, and multiplying this with the passenger number of 2 million, yields required space of 20,000 m2. This would end up costing around US$ 30 million vs the US$ 55 million proposed. One could explain some of the higher cost as part of inflation and the addition of US$ 7 million in land side access improvements. 22 At 2 million passengers, with the airport operating 360 days a year for eight hours a day, using an average capacity of 150 passengers per flight, there would be 4.6 flights per hour, with a runway movement every 13 minutes. Rapid exists become justifiable when aircraft have to leave the runway quickly to allow other aircraft to land.
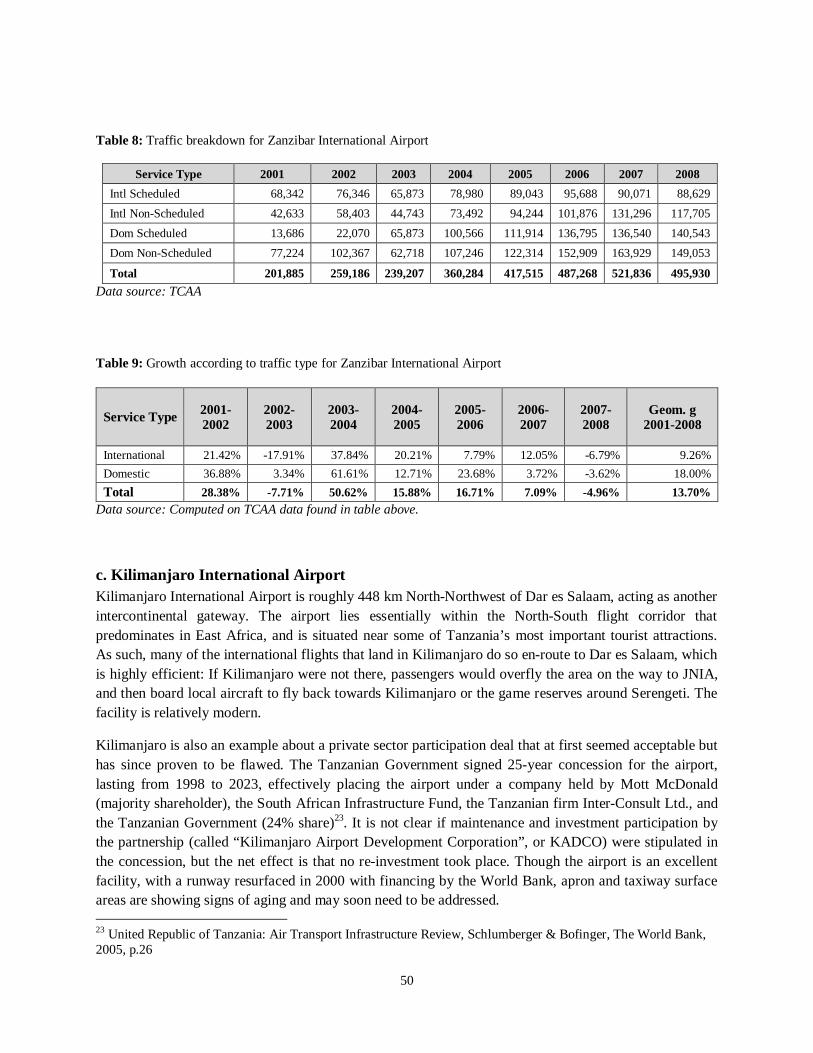
50
c. Kilimanjaro International Airport Kilimanjaro International Airport is roughly 448 km North-Northwest of Dar es Salaam, acting as another intercontinental gateway. The airport lies essentially within the North-South flight corridor that predominates in East Africa, and is situated near some of Tanzania’s most important tourist attractions. As such, many of the international flights that land in Kilimanjaro do so en-route to Dar es Salaam, which is highly efficient: If Kilimanjaro were not there, passengers would overfly the area on the way to JNIA, and then board local aircraft to fly back towards Kilimanjaro or the game reserves around Serengeti. The facility is relatively modern.
Kilimanjaro is also an example about a private sector participation deal that at first seemed acceptable but has since proven to be flawed. The Tanzanian Government signed 25-year concession for the airport, lasting from 1998 to 2023, effectively placing the airport under a company held by Mott McDonald (majority shareholder), the South African Infrastructure Fund, the Tanzanian firm Inter-Consult Ltd., and the Tanzanian Government (24% share)23. It is not clear if maintenance and investment participation by the partnership (called “Kilimanjaro Airport Development Corporation”, or KADCO) were stipulated in the concession, but the net effect is that no re-investment took place. Though the airport is an excellent facility, with a runway resurfaced in 2000 with financing by the World Bank, apron and taxiway surface areas are showing signs of aging and may soon need to be addressed. 23 United Republic of Tanzania: Air Transport Infrastructure Review, Schlumberger & Bofinger, The World Bank, 2005, p.26
Table 8: Traffic breakdown for Zanzibar International Airport
Service Type 2001 2002 2003 2004 2005 2006 2007 2008 Intl Scheduled 68,342 76,346 65,873 78,980 89,043 95,688 90,071 88,629 Intl Non-Scheduled 42,633 58,403 44,743 73,492 94,244 101,876 131,296 117,705 Dom Scheduled 13,686 22,070 65,873 100,566 111,914 136,795 136,540 140,543 Dom Non-Scheduled 77,224 102,367 62,718 107,246 122,314 152,909 163,929 149,053
Total 201,885 259,186 239,207 360,284 417,515 487,268 521,836 495,930
Data source: TCAA
Table 9: Growth according to traffic type for Zanzibar International Airport
Service Type 2001-2002
2002-2003
2003-2004
2004-2005
2005-2006
2006-2007
2007-2008
Geom. g 2001-2008
International 21.42% -17.91% 37.84% 20.21% 7.79% 12.05% -6.79% 9.26% Domestic 36.88% 3.34% 61.61% 12.71% 23.68% 3.72% -3.62% 18.00% Total 28.38% -7.71% 50.62% 15.88% 16.71% 7.09% -4.96% 13.70%
Data source: Computed on TCAA data found in table above.
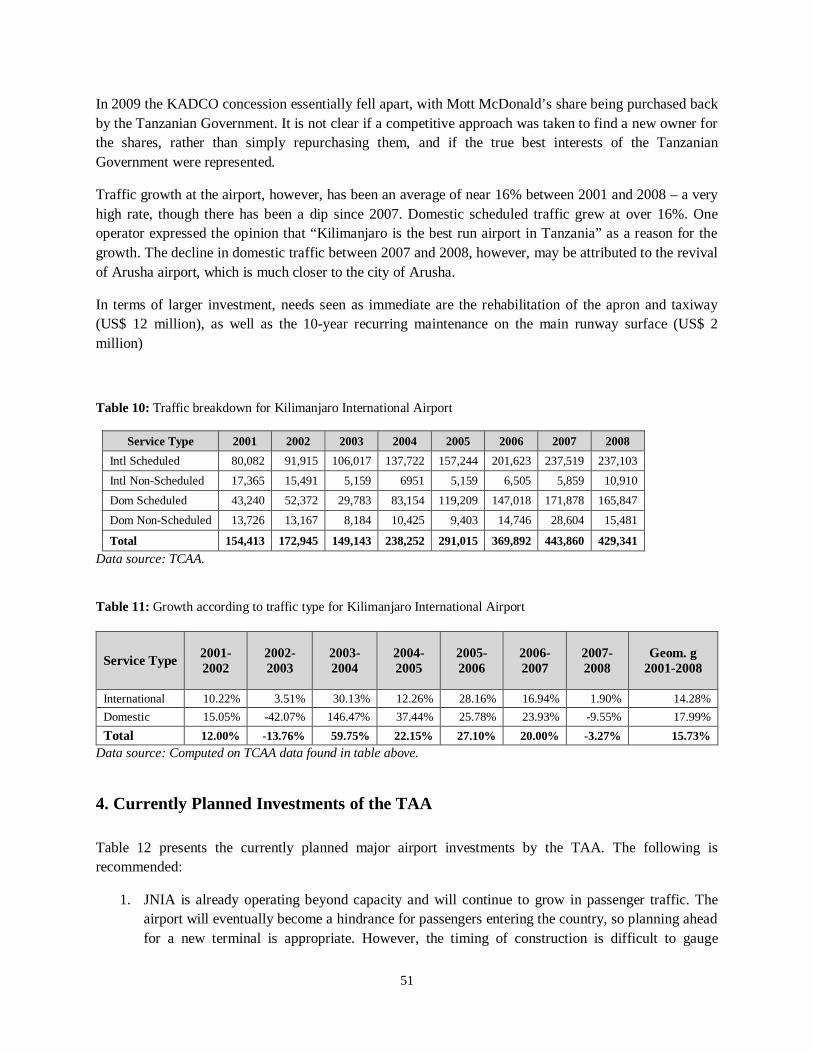
51
In 2009 the KADCO concession essentially fell apart, with Mott McDonald’s share being purchased back by the Tanzanian Government. It is not clear if a competitive approach was taken to find a new owner for the shares, rather than simply repurchasing them, and if the true best interests of the Tanzanian Government were represented.
Traffic growth at the airport, however, has been an average of near 16% between 2001 and 2008 – a very high rate, though there has been a dip since 2007. Domestic scheduled traffic grew at over 16%. One operator expressed the opinion that “Kilimanjaro is the best run airport in Tanzania” as a reason for the growth. The decline in domestic traffic between 2007 and 2008, however, may be attributed to the revival of Arusha airport, which is much closer to the city of Arusha.
In terms of larger investment, needs seen as immediate are the rehabilitation of the apron and taxiway (US$ 12 million), as well as the 10-year recurring maintenance on the main runway surface (US$ 2 million)
Table 10: Traffic breakdown for Kilimanjaro International Airport
Service Type 2001 2002 2003 2004 2005 2006 2007 2008 Intl Scheduled 80,082 91,915 106,017 137,722 157,244 201,623 237,519 237,103 Intl Non-Scheduled 17,365 15,491 5,159 6951 5,159 6,505 5,859 10,910 Dom Scheduled 43,240 52,372 29,783 83,154 119,209 147,018 171,878 165,847 Dom Non-Scheduled 13,726 13,167 8,184 10,425 9,403 14,746 28,604 15,481
Total 154,413 172,945 149,143 238,252 291,015 369,892 443,860 429,341
Data source: TCAA.
Table 11: Growth according to traffic type for Kilimanjaro International Airport
Service Type 2001-2002
2002-2003
2003-2004
2004-2005
2005-2006
2006-2007
2007-2008
Geom. g 2001-2008
International 10.22% 3.51% 30.13% 12.26% 28.16% 16.94% 1.90% 14.28% Domestic 15.05% -42.07% 146.47% 37.44% 25.78% 23.93% -9.55% 17.99% Total 12.00% -13.76% 59.75% 22.15% 27.10% 20.00% -3.27% 15.73%
Data source: Computed on TCAA data found in table above.
4. Currently Planned Investments of the TAA Table 12 presents the currently planned major airport investments by the TAA. The following is recommended:
1. JNIA is already operating beyond capacity and will continue to grow in passenger traffic. The airport will eventually become a hindrance for passengers entering the country, so planning ahead for a new terminal is appropriate. However, the timing of construction is difficult to gauge
52
because donor funding must be sought. It is the process of negotiating the financing needs with donors that has been holding up immediate action on the airport that could involve private sector participation. When looking at financing options it is important to consider that the contracting of construction should be independent of the financing, i.e. contracts should be bid competitively. The recent proposal by an outside party to build a new terminal, operate the airport in a joint venture with the TAA, and collect and then allocate all revenues amongst the partners contained no method of validating the outside participant's overall investment, since the outside party also proposed being the contractor for construction. The alternative, now supported by the World Bank, is to buy time by implementing a stopgap measure: Along with the private sector, an office building is to be constructed attached to the current terminal, with all non-operational space being moved into this building, broadening the overall space available for passenger operations. The estimated cost of such a building is US$ 20 million, and locally drawn blueprints for this alternative have already been created. Though this would not be a permanent solution, it would buy time until a proper source of financing for a new terminal could be found.
2. New airports: The need for new airports in Tanzania is questionable, even in Dodoma. The drive for a new airport at the capital may be the result of the type of aircraft that is being used for flights into the city. New airports should be regarded as speculative at best, and have the lowest priority ranking. In terms of costs, it is economically considerably more reasonable to rehabilitate or upgrade an existing facility rather than build a new one.
3. The proposed rehabilitation of Arusha has been controversial. However, there are arguments for keeping an airport open, even if a newer, much more advanced facility is close by. The combination of Nairobi's international airport and the close by Wilson Airport is often cited, with the intent of allowing Arusha to become a general aviation airport. Often airports that are called unnecessary are subsequently neglected, because somehow the political will cannot be harnessed to entirely close the facility. As a result, the airport, which still faces some demand, stays open, but becomes more and more unsafe. In Arusha's case, the demand for the airport can be clearly seen in the traffic figures, even with close by Kilimanjaro. Therefore, rehabilitating the airport, though not a priority, could be deemed appropriate.
4. Bukoba, Tabora, and Kigoma: These three airports have been selected for World Bank investments, in part because they are regionally important yet are not likely to find other donor funding. All three airports have their own role in their local economy, and two (Bukoba and Kigoma) may become international entryways due to their location. However, the Bank's involvement shows that the proposed projects in themselves have components that are being economized: The Bank, for example, has decided to finance the entire redevelopment of Bukoba, while only addressing the general runway conditions, and therefore safety, of the two others.
5. Mafia Island: Mafia is an attractive tourist destination with its own unique flavor and isolation. The airport, once a military field with a substantial runway, has deteriorated to the point that scheduled services had to stop. The draw of Mafia is visible to whoever has visited, so outside development financing was available, this time through the MCC. However, here again the investment needs lie in the components: The Sir Frederic Snow reports reflect a project containing a control tower, new terminal, and other installations, whereas the MCC's involvement, just as the Bank's involvement in Kigoma and Tabora, is limited to the runway.
6. Mwanza: The most important domestic airline route in Tanzania is between Mwanza and Dar es Salaam, with Mwanza also being Tanzania's fourth international entryway. The area of Mwanza
53
is also important for non-traditional exports, experimenting with cut flowers, and having been an export center for West Nile Perch. The TAA has successfully implemented a PPP arrangement with the cargo operations of the airport, only to have witnessed the cargo exports of fresh fish to stop completely after both the obsolescence of current runway and apron infrastructure, and new surcharges on air cargo exports.
The above points highlight that (a) in the TAA's investment list almost all airports merit at least some investment, though they might only get the most important aspects financed by donors, and (b) some projects, particularly new airports such as Msalato and Songwe, should be approached with caution. Furthermore, the current reaction of donors suggests that though Sumbawanga may be a tough sell, Shinyanga, which is economically more robust than the World Bank financed Tabora project, could perhaps be a project of interest for aid donors.
Moshi represents an example where private sector participation may be appropriate. The airport, only 30 kilometers from Kilimanjaro, has very low traffic. The airfield sports a flying club with very well maintained, almost collectible piston aircraft. Being geographically close to a major airport, and having a base of aircraft perhaps betraying local wealth, and with a decaying runway, the airport is a prime example of what perhaps should be dropped out of the TAA's system and passed on to private investors.
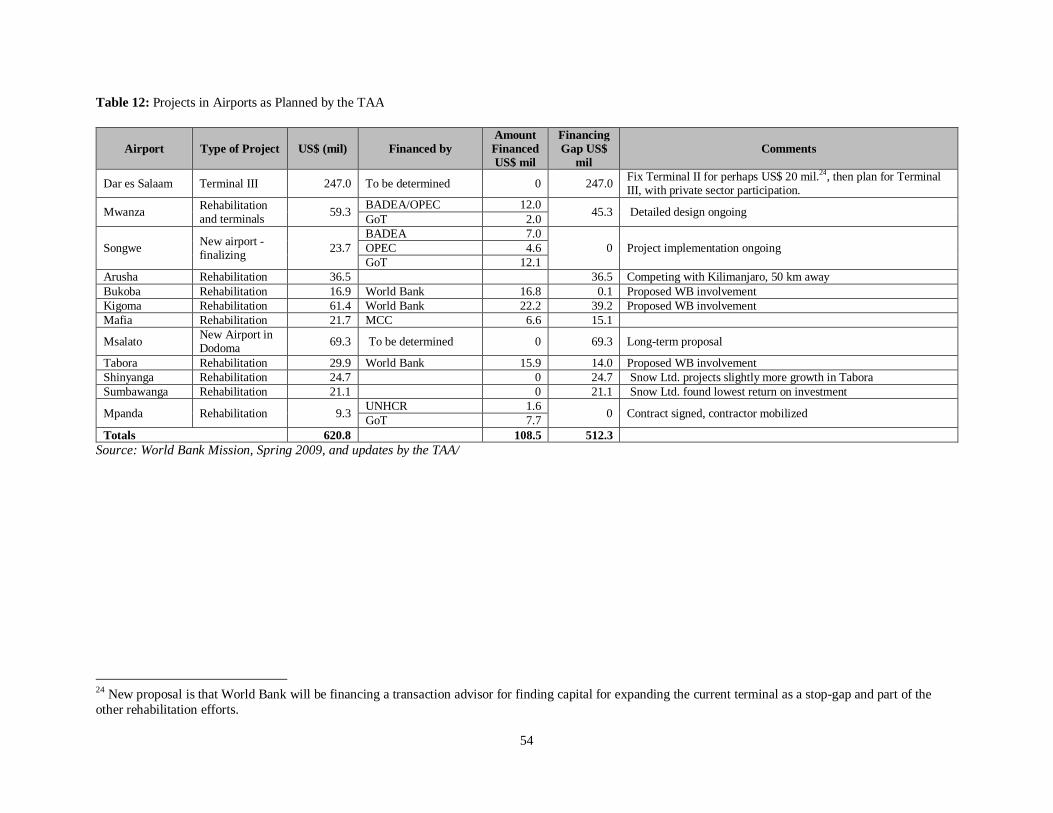
54
Table 12: Projects in Airports as Planned by the TAA
Airport Type of Project US$ (mil) Financed by Amount Financed US$ mil
Financing Gap US$
mil Comments
Dar es Salaam Terminal III 247.0 To be determined 0 247.0 Fix Terminal II for perhaps US$ 20 mil.24, then plan for Terminal III, with private sector participation.
Mwanza Rehabilitation and terminals 59.3 BADEA/OPEC 12.0 45.3 Detailed design ongoing GoT 2.0
Songwe New airport - finalizing 23.7
BADEA 7.0 0 Project implementation ongoing OPEC 4.6
GoT 12.1 Arusha Rehabilitation 36.5 36.5 Competing with Kilimanjaro, 50 km away Bukoba Rehabilitation 16.9 World Bank 16.8 0.1 Proposed WB involvement Kigoma Rehabilitation 61.4 World Bank 22.2 39.2 Proposed WB involvement Mafia Rehabilitation 21.7 MCC 6.6 15.1
Msalato New Airport in Dodoma 69.3 To be determined 0 69.3 Long-term proposal
Tabora Rehabilitation 29.9 World Bank 15.9 14.0 Proposed WB involvement Shinyanga Rehabilitation 24.7 0 24.7 Snow Ltd. projects slightly more growth in Tabora Sumbawanga Rehabilitation 21.1 0 21.1 Snow Ltd. found lowest return on investment
Mpanda Rehabilitation 9.3 UNHCR 1.6 0 Contract signed, contractor mobilized GoT 7.7 Totals 620.8 108.5 512.3
Source: World Bank Mission, Spring 2009, and updates by the TAA/
24 New proposal is that World Bank will be financing a transaction advisor for finding capital for expanding the current terminal as a stop-gap and part of the other rehabilitation efforts.
55
5. Currently Planned Investments of the TCAA The TCAA in a recent World Bank mission has identified a set of comprehensive needs, ranging from infrastructure enhancements to capacity building and the establishment of an “aviation culture” by the development of training opportunities for the next generation of pilots and technicians. The specific items identified are categorized into the five project elements below:
I. Institutional Development and Capacity Building 1. Flight operations inspectors training: Tanzania identified the need to have flight inspectors
trained for every type of aircraft on the registry. Since this would be rather costly, and is a common finding in the other countries, a regional solution with shared inspectors would be most likely a more cost-effective solution. The issue of inspector capacity is an ICAO USOAP audit finding.
2. Upgrading of the Civil Aviation Training Center (CATC): The TCAA estimates a needed US$ 5.7 million investment, including a building and other education infrastructure, and human capacity building for the center.
3. Training needs: A strong training program for personnel licensing, including medical examiners and an aviation medical assessor, would require recurrent funding of US$ 100,000 per annum. In addition, training for most technical services, such as air traffic management, aviation meteorology, aerodrome inspectors, and others would run annual recurring costs of US$ 200,000.
4. Accident Investigation Unit: The TCAA places the cost of setting up a fully staffed, independent accident investigation unit, excluding salaries, at US$ 600,200.
5. Search and Rescue: The TCAA estimates a total cost ff US$ 600,000 for a search and rescue service unit, including US$ 200,000 for software with Search and Rescue calculation capability, US$ 120,000 for survival gear and droppable supplies, US$ 250,000 for training (including search and rescue pilots), and US$ 30,000 for plotting equipment.
II. Enhancement of Flight Safety Inspection Services 1. Training for Flight Safety and Airworthiness Inspectors: The TCAA estimates that when
instituting and aggressive and pro-active training program, annual training needs for flight operations and airworthiness inspectors cost US$ 800,000.
III. Upgrading of Aviation Infrastructure 1. GNSS Approaches to replace conventional ones using NDBs for Arusha, Mwanza, Zanzibar,
Pemba, Bukoba, Kigoma, Tabora, and Mafia airports (2005 estimated total cost: US$ 1 million)
2. For surveillance, ADS-B (2006 estimated cost: US$ 10 million) to cover the whole of Tanzania
3. A VHF Extended Range System Vsat Link: In order to provide communications coverage six relay stations need to be added, namely Lilungu, Lolkisale, Gairo, Nyanshana, Kaluwe, and Kazeh Hill. In addition, the existing installations are aged and require and expensive and underlying telecommunications link which needs to be replaced with VSAT technology. (Estimated cost: US$ 2.5 million)
4. An integrated automated AIS/ATS Data Processing System: This is a multi-faceted system consisting of a message handling system with an AFTN gateway (US$ 962,000), an automated AIS system (US$935,000), an FDPS system for giving the air traffic controller trajectory predictions (US$ 415,000), and an overall billing system (US$ 91,200). (Total estimated cost: US$ 2.4 million)
56
5. Building and equipment for an EAC upper airspace flight information region center: This building would house the area control center for the Unified Upper Flight Information Center within the EAC. (Estimated cost: US$ 1.2 million)
6. Provision of ANS at the Musoma, Bukoba, Mafia, and Lake Manyara aerodromes (cost to be determined).
IV. Enhancement of Security at Key Airports 1. Training of aviation security specialists: The TCAA estimates that training for five human
resources is needed per annum, for an annual recurring cost of US$ 117,000.
V. Liberalization of Air Transport Services 1. Tanzania recommended a study on the implementation of the Yamoussoukro decision in East
Africa for a cost of US$ 500,000. However, an extensive study for all of Africa already exists. A component often recommended is a monitoring body within the EAC that keeps track of progress towards liberalization within the EAC by, in part, keeping a registry of air service agreements.
The list is long, and financial realities will require some prioritization. The question is what is required for providing essential oversight services now versus what is needed for the further development of the sector.
Education centers, for example, are usually not self-sustainable, and need to be looked at in a regional context, perhaps by developing curricula at already established academic institutions. Four institutions exist in some shape or form in East Africa25, all in need and all being proposed to become a regional center. The wisest long-term approach would be to coordinate their programs.
At the same time, most of the infrastructure requirements are pressing, as is the lack of capacity in flight safety inspectors. In addition, US$ 1.6 million of the list above consists of annual recurring costs. Finding aid for infrastructure such as air traffic control systems is considerably easier than funding for recurring expenses.
25 Uganda, Kenya, and Tanzania have existing training facilities in various areas. Burundi has a training school building that in recent years had been used by other agencies, and wishes to rededicated this to its original purpose.
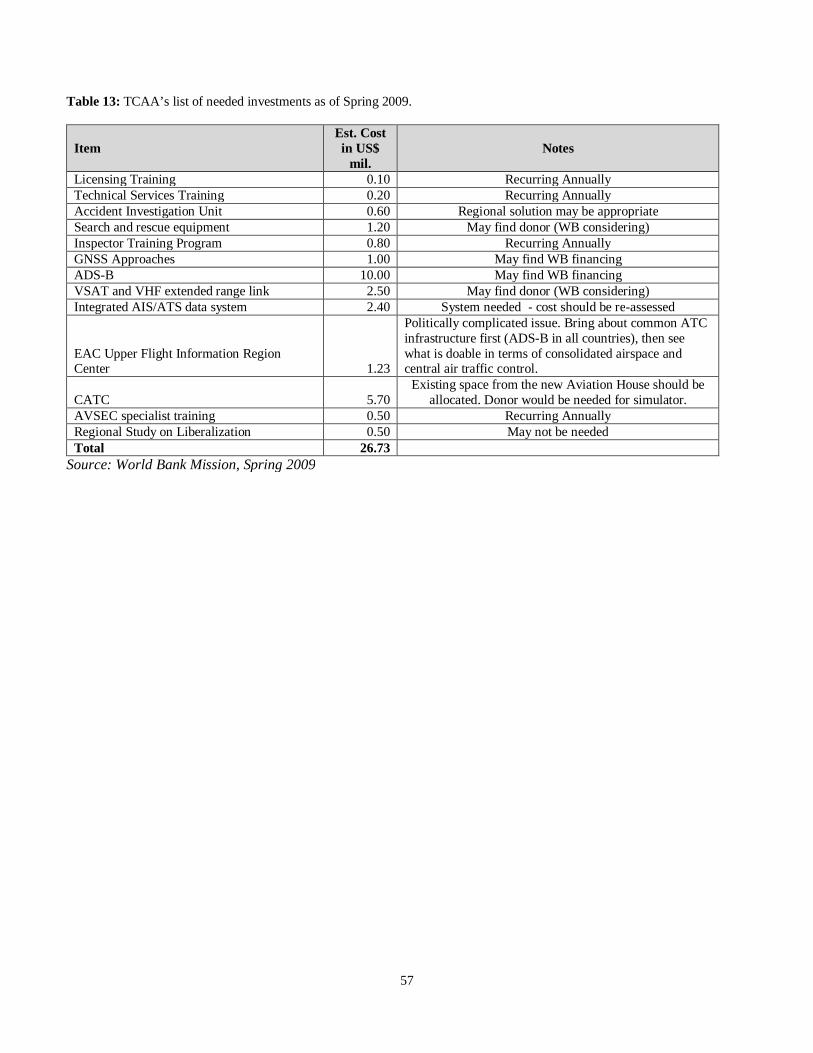
57
Table 13: TCAA’s list of needed investments as of Spring 2009.
Item Est. Cost in US$
mil. Notes
Licensing Training 0.10 Recurring Annually Technical Services Training 0.20 Recurring Annually Accident Investigation Unit 0.60 Regional solution may be appropriate Search and rescue equipment 1.20 May find donor (WB considering) Inspector Training Program 0.80 Recurring Annually GNSS Approaches 1.00 May find WB financing ADS-B 10.00 May find WB financing VSAT and VHF extended range link 2.50 May find donor (WB considering) Integrated AIS/ATS data system 2.40 System needed - cost should be re-assessed
EAC Upper Flight Information Region Center 1.23
Politically complicated issue. Bring about common ATC infrastructure first (ADS-B in all countries), then see what is doable in terms of consolidated airspace and central air traffic control.
CATC 5.70 Existing space from the new Aviation House should be
allocated. Donor would be needed for simulator. AVSEC specialist training 0.50 Recurring Annually Regional Study on Liberalization 0.50 May not be needed Total 26.73
Source: World Bank Mission, Spring 2009
58
V. Action Plan for the Meeting of Needs for the Air Transport Sector Most of the investment plans currently on the table are to some extent justifiable, however with some proposals needing refinements. Specifically, it is easy to fall into the trap of believing that new facilities will attract new traffic. The TAA, for example, has many airports and strips in the system that are essentially non-performing and could be dropped. Airports with 1,000 passengers and virtually no cargo average 3 passengers per day - i.e. they have virtually no scheduled traffic, and are not really sustainable.
In terms of new airports, the investments proposed for Dodoma should be carefully evaluated in light of politics, actual runway needs, and costs. Though the airport currently cannot service jets due to the condition of the existing pavement, the condition of the airport is far superior to ones currently receiving much higher passenger numbers, such as Bukoba. And with complete reconditioning, the airport could handle smaller jet aircraft. The cost of such rehabilitation would be far below the cost of a new airport.
Some suggestions have been made for turning JNIA into a regional hub. The justification for this suggestion lies in the distance between the other major airports in the region, Johannesburg, Nairobi, and Addis Ababa. However, overall air traffic in Africa is not very dense, and the region in need of a more centralized hub lies in the Western portion of the continent. In addition, regional hubs in Africa have a dominant flag carrier anchored in their hub, such as South African Airways in Johannesburg, Kenyan Airways in Nairobi, and Ethiopian Airlines in Addis Ababa. These carriers have existed for a long time, and are indeed the dominant carriers throughout all of sub-Saharan Africa. Tanzania would either have to develop Air Tanzania into such a carrier, which is virtually impossible given the current market conditions, or attract one of those carriers to use JNIA as a hub, which is unlikely26.
Tanzania, however, does have the advantage of being highly attractive to tourism, and being an end-destination in travel. Therefore, all planning should be focused on meeting the needs of arriving passengers, including their domestic travel needs.
A study by IATA dated October 31, 2008 on the ground handling operations at Mwanza, Zanzibar, Kilimanjaro, and JNIA found several crucial shortcomings that could be categorized as being both procedural and infrastructure related27. Though Kilimanjaro was an exception, shortcomings were found in the actual terminals, security procedures and infrastructure (particularly in Mwanza), and the overall adherence to safety procedures. In terms of infrastructure development, these shortcomings should be addressed in the airport investments outlined below. New terminals are being planned for all three airports, and changes planned at Terminal II at JNIA should consider the findings in the report. In addition, the budgets of the TAA and RGoZ should included training elements to address some of the shortcomings in the report.
26 Further discussion on hubs can be found in Appendix A: A hub in Dar es Salaam - two distinct concepts 27 See Development of Ground Handling Services for Passenger, Aircraft, Cargo and Aviation Fueling Services – Report R06: Technical & Operational Review of Ground Handling Operations, IATA/TCAA, October 31, 2008. The report needs to be read with caution. Though many of the findings and recommendations are compelling, some of the security shortcomings, such as the incident mentioned in Zanzibar where the IATA consultant noticed the screener’s wand not being turned on during screening, are proposed to be remedied through training. The fault of such lapse, however, is less likely due to lack of training but rather may lie in bad on-the-ground supervision and management.
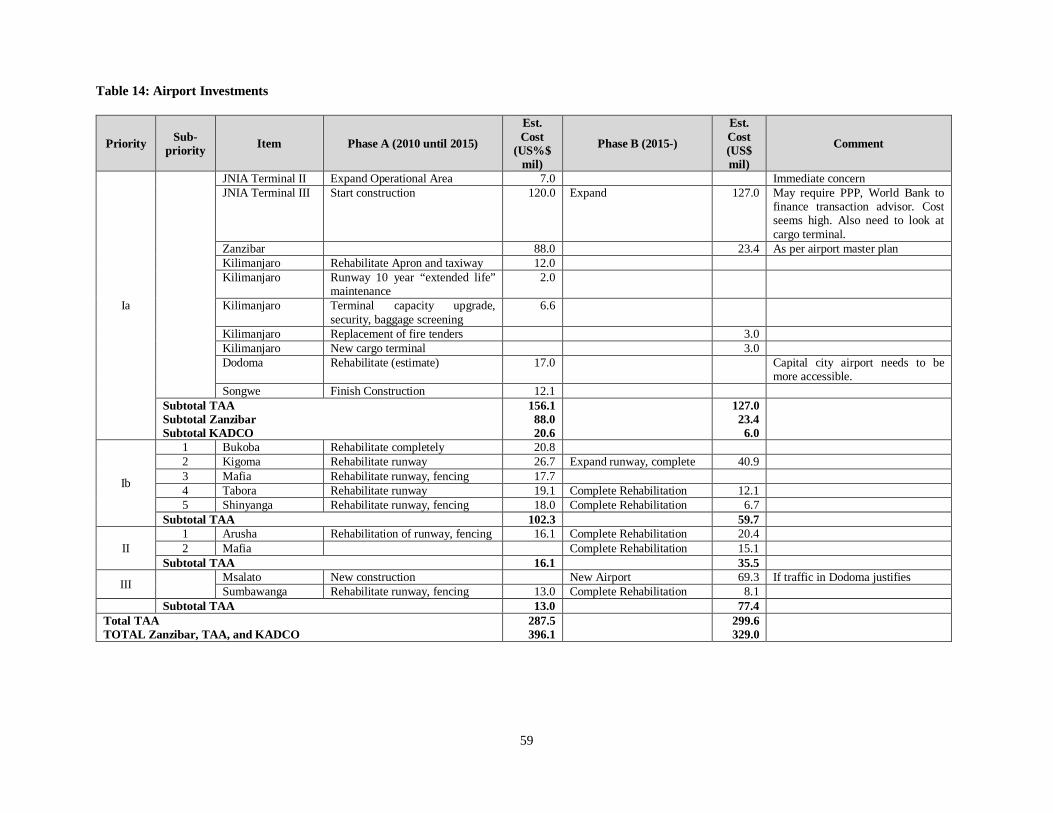
59
Table 14: Airport Investments
Priority Sub-priority Item Phase A (2010 until 2015)
Est. Cost
(US%$ mil)
Phase B (2015-)
Est. Cost (US$ mil)
Comment
Ia
JNIA Terminal II Expand Operational Area 7.0 Immediate concern JNIA Terminal III Start construction 120.0 Expand 127.0 May require PPP, World Bank to
finance transaction advisor. Cost seems high. Also need to look at cargo terminal.
Zanzibar 88.0 23.4 As per airport master plan Kilimanjaro Rehabilitate Apron and taxiway 12.0 Kilimanjaro Runway 10 year “extended life”
maintenance 2.0
Kilimanjaro Terminal capacity upgrade, security, baggage screening
6.6
Kilimanjaro Replacement of fire tenders 3.0 Kilimanjaro New cargo terminal 3.0 Dodoma Rehabilitate (estimate) 17.0 Capital city airport needs to be
more accessible. Songwe Finish Construction 12.1
Subtotal TAA Subtotal Zanzibar Subtotal KADCO
156.1 88.0 20.6
127.0 23.4 6.0
Ib
1 Bukoba Rehabilitate completely 20.8 2 Kigoma Rehabilitate runway 26.7 Expand runway, complete 40.9 3 Mafia Rehabilitate runway, fencing 17.7 4 Tabora Rehabilitate runway 19.1 Complete Rehabilitation 12.1 5 Shinyanga Rehabilitate runway, fencing 18.0 Complete Rehabilitation 6.7
Subtotal TAA 102.3 59.7
II 1 Arusha Rehabilitation of runway, fencing 16.1 Complete Rehabilitation 20.4 2 Mafia Complete Rehabilitation 15.1
Subtotal TAA 16.1 35.5
III Msalato New construction New Airport 69.3 If traffic in Dodoma justifies Sumbawanga Rehabilitate runway, fencing 13.0 Complete Rehabilitation 8.1
Subtotal TAA 13.0 77.4 Total TAA TOTAL Zanzibar, TAA, and KADCO
287.5 396.1
299.6 329.0
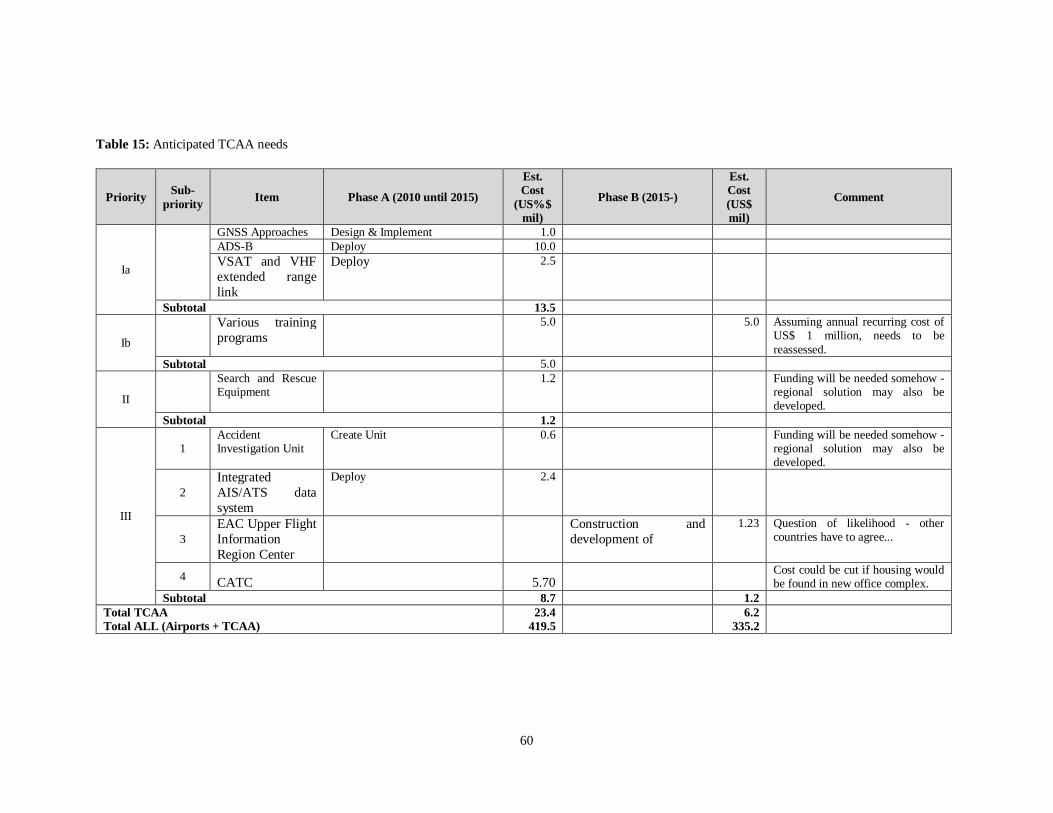
60
Table 15: Anticipated TCAA needs
Priority Sub-priority Item Phase A (2010 until 2015)
Est. Cost
(US%$ mil)
Phase B (2015-)
Est. Cost (US$ mil)
Comment
Ia
GNSS Approaches Design & Implement 1.0 ADS-B Deploy 10.0 VSAT and VHF extended range link
Deploy 2.5
Subtotal 13.5
Ib
Various training programs
5.0 5.0 Assuming annual recurring cost of US$ 1 million, needs to be reassessed.
Subtotal 5.0
II
Search and Rescue Equipment
1.2 Funding will be needed somehow - regional solution may also be developed.
Subtotal 1.2
III
1 Accident Investigation Unit
Create Unit 0.6 Funding will be needed somehow - regional solution may also be developed.
2 Integrated AIS/ATS data system
Deploy 2.4
3 EAC Upper Flight Information Region Center
Construction and development of
1.23 Question of likelihood - other countries have to agree...
4 CATC 5.70 Cost could be cut if housing would
be found in new office complex. Subtotal 8.7 1.2
Total TCAA Total ALL (Airports + TCAA)
23.4 419.5
6.2 335.2
61
VI. Proposed Steps and Outline for Tanzania Civil Aviation Master Plan In many cases master plans successfully provide a blueprint for the development of a sector; however, often they also are overtaken by events not predicted, or become victims of political shifts in priorities. If a new master plan for Tanzania were to be drafted, there would have to be a consensus on findings of such a plan, and then an adherence to the fundamentals laid out in the plan. Two particular dangers occur: A donor government comes up with a project in exchange for rights not related to the aviation sector, re-arranging priorities in such a way that other, important priorities are stalled. Or political necessities create make-work projects whose economic value is questionable. A master plan not only lays the foundation for planning for the sector, but also serves as a tool for identifying if proposed projects fall into a pre-determined framework towards meeting the overall goals of the sector.
The World Bank is preparing the Transport Sector Support Project (TSSP) for Tanzania, which includes an air transport component. Beyond financing the rehabilitation of Bukoba, Kigoma, and Tabora airports, the project contains a component for finding a transaction advisor for the development of terminal capacity at JNIA. As part of this component, it has been established that a master plan for the civil aviation sector, as well as a separate master plan for JNIA, would be helpful. The amount of US$ 600,000 has been set aside in the TSSP to finance these two master plans. The project is due for approval by the World Bank Board of Directors in late May 2010, with disbursements most likely commencing within three to four months thereafter. It is therefore timely to begin writing the TORs for such a master plan now (April 2010), so they are ready to be distributed when the studies are ready to be procured.
Below is a proposed table of contents, with main and applicable sub-topics. This structure is similar to recent, successful civil aviation master plan projects.
1. Infrastructure a. Airports b. Air Carriers (overall) c. Regulatory System
i. TCAA ii. Regional options for oversight
d. Ownership and organization i. Role and capacities in civil aviation within the Ministry of Infrastructure
Development ii. TCAA
1. Structure and functions a. Safety Oversight b. Economic oversight c. ANS
2. Relationship to regional oversight iii. TAA (airports) iv. Air Tanzania and other carriers
e. Current and projected requirements for the overall infrastructure (using forecasts made in section 5 below)
62
i. Airport improvements 1. Major Airports (JNIA, Zanzibar, Kilimanjaro) 2. Intermediate (Mwanza) 3. Auxiliary
ii. Communications, Navigation, and Surveillance (ADS-B) iii. Meteorology iv. Emergency response
2. Overall and Economic Policy for the Civil Aviation Sector a. Overall long-term guidelines for aviation policy b. International competition regulation (movement towards Yamoussoukro) c. Domestic competition regulation (keep domestic services open) d. Aviation charges, with regional and global benchmarks e. Competitive procurement policy for infrastructure (competitive bidding for all
procurement, including the development of new terminals) f. Competitive concessioning of services g. Towards an aviation culture in Tanzania: Planning domestic and regional aviation
education programs 3. Scheduled service providers and flag carriers
a. History of Air Tanzania b. History of other major carriers in Tanzania c. Contrast and comparison: Government operated airlines vs the private sector
i. Could another carrier replace Air Tanzania as the flag carrier? d. Long-term policy towards sustainable and competitive domestic services in Tanzania
4. Domestic Aviation a. Airplane operations
i. IFR infrastructure ii. IFR operations
iii. VFR Operations b. Helicopter operations c. Communications infrastructure solutions for domestic aviation d. Summary of NAV, COM, and Surveillance, including vision towards ADS-B
5. Forecasts a. Impact of global environmental concerns on international air traffic growth b. Impact of regional road network development on the need for aviation travel c. Business International d. Business Domestic e. Tourism International (i.e. gateways) f. Tourism Domestic (i.e. after arrival) g. Potential for hub development at JNIA
63
Appendix A: A hub in Dar es Salaam - two distinct concepts Much attention has been given to the creation of a hub in Dar es Salaam. The discussion needs to be delineated around two separate concepts:
1. A transport hub in Dar es Salaam, with the airport being a component 2. An airline hub at Julius Nyerere International Airport
Though the two concepts may be interlinked, they need to be discussed separately as to their feasibility and approaches. In both cases the significant challenge is competition in already established centers, in particular in Nairobi, for air transport, and in Mombasa for maritime transport.
Potential for a holistic transport hub (port plus airport) The linkages between air and maritime transport, in an efficient system, would not be as strong as one might expect. In terms of cargo, sea transport is applicable for heavy items, or items not requiring high speed delivery, while air transport seeks the opposite: high value per kilogram goods that need fast transport. The value to weight ratio is of essence. In complex supply chains one can see an interaction between the two (e.g. manufacturing centers shipping first rush-to-market merchandise by air, then following with larger shipments by sea), but beyond those cases the modal interlink is very small. The Tanzania Ports Mater Plan, recently authored, discusses rail and roads, not air transport, in its multi-modal assessments, already implying that very little linkage exists between air transport and port operations.
Current projections state that beyond 2015, if growth rates and increases in efficiency allow, the current port in Dar es Salaam will be at capacity, requiring a new port. In a report co-authored by Ecorys and the Maritime Economics and Logistics center at Erasmus University in Rotterdam, the ideal future locations are all away from Dar es Salaam28, meaning that JNIA would not be in the port’s proximity.
In addition, seeing perhaps a cohesive development of the port in Dar es Salaam in conjunction with the airport, one may gain an underlying notion that as shipments increase, more business travel would occur as businessmen would come to the port in Dar es Salaam to inspect their arriving goods, help them through customs, and then would return further inland or their neighboring land-locked countries to await land delivery.
However, the assumption of increased air travel into Dar es Salaam as port traffic may increase inherently implies an inefficiency in port operations or in land-based transport: If the port truly grew and was operated efficiently, and goods could make it from the port to their final destinations unhindered by a failing rail and road network and inefficient borders, then there would be no need for the recipient to come to the port prior to receiving his or her goods further inland. In developed economies such travel barely exists. If such travel exists in developing countries, it would point to inefficiencies in trade facilitation rather than structural increase in air transport demand caused by economic growth.
As a final note, the key shared intermodal connection for both air transport and maritime transport is the road network. Neither an airport nor a port can survive without good road connections, though for ports 28 Identifying Economic Conditions for a Regional Logistics Hub in Northern Tanzania - Final Report, Erasmus University and ECORYS, Rotterdam 2009, p. 69
64
rail links may be even more important. Nairobi has been successful in exporting flowers through Kenya’s main airport (not located by a port) because of excellent road access between the growing areas by Lake Naivasha and the city. In Ethiopia, spoilage of flowers can reach 40% to 50% while in transit to the airport in Addis Ababa, because of poor road conditions. Whatever growth the airport may experience, the ability to get from the airport into the centers of business, and the ability to get goods to the airport, depend heavily on road access with minimal risks and delays.
Potential for JNIA becoming an airline hub For an airport to become a hub, it must have an airline to choose it to be one. Considering its health, Air Tanzania, the nationally owned flag carrier, as discussed previously in this study, is not an option. This would indicate that the development of a hub would involve a hands-off, gradual approach. This is highly conditional: If an airline develops a sophisticated network requiring spokes into other countries, e.g. Precision Air’s development into a more extensive international carrier, then and only then the airport may begin to seem like a hub. Or, if an outside carrier takes advantage of extremely liberalized air services agreements, it may consider starting hub operations in Dar es Salaam if the infrastructure and services at the airport are of high enough standard. This suggests that the best policy consists of not planning for a hub per se, but running the airport efficiently in its current function as Tanzania’s main global access point. The National Transportation Policy of 2003 explicitly refers to the development of the airport as Tanzania’s main “gateway”29.
In addition, when looking at the future of hubs, there are some important and sobering facts to keep in mind:
1. The notion of intentionally developing a hub in Dar es Salaam is highly risky. At one point South African Airways was interested in expanding further into East Africa, and the airline’s failed participation in Air Tanzania was based on this strategy. There are many reasons why the partnership with South African and Air Tanzania may have failed, but it seems clear that for South African the notion of having a hub in Dar es Salaam was not economically attractive enough to remain in partnership with Air Tanzania. It may be that South African had overestimated the economic viability of developing such a hub.
2. Strategically, it may be that hubs are actually on their way to decline. a. Star distributive systems, which a hub implies, though good for achieving higher load
factors, may in the end not be as fuel efficient per passenger, as the actual distance being flown per passenger is often more than with a direct flight.
b. The recognition of (a) above has some significant strategic implications and consequences. The direct effect of the inherent inefficiency of hubs was the driving factor behind Boeing’s development of the 787, as an answer to the Airbus 380. The Airbus 380 was build on the anticipation that hubs would be growing and would need more feeder aircraft, whereas Boeing, for all intents and purposes, bet its entire future on that direct
29 National Transport Policy 2003, Ministry of Communications and Transport, p 49. The policy does not mention development of a hub in Dar es Salaam. The general tone of the policy is focused on bringing infrastructure and services up to international standards such as defined by ICAO, liberalization of the bilateral air services agreements, and privatization of services.
65
flights are the coming wave, and the hub system would decline. Boeing has therefore put the emphasis on smaller, much more fuel efficient aircraft.
c. Within Africa, Ethiopian Airlines has placed its bet with Boeing, by aggressively adopting the Boeing 787. The author of this report was informed in March 2010 that in discussions with the airline it had become clear that Ethiopian was going to decentralize away from Addis Ababa, i.e. the hub in Addis would go into a decline. This would be in line with the increased use of higher freedom (5th and above) flights as liberalization takes hold. Instead of seeing hub and spokes, there might be a much higher number of ring patterned flights, such as Kenyan’s rings routes in East Africa. The hub model may already be in decline.
Though much can be said about the direct contribution of airports and hubs to local economies, one must analyze the transport infrastructure in terms of the overall contribution it provides to economic efficiency and growth, not the direct benefits of a facility to a locale. Developing a hub for local growth while adopting a less efficient route topology in the end would bring a displacement of resources, rather than true economic growth brought about by increased efficiencies.
Today’s function of JNIA is to present an important and vital access way to the world. The airport’s significant importance, beyond letting Tanzanians travel abroad, is bringing visitors, now mainly tourists, into the country. Therefore the main policy emphasis should be on making sure that the airport is able to serve this vital function in an efficient manner, as the National Transportation Policy of 2003 states.
In terms of further study, the outline for the master plan now includes a sub-section on potential for hub development in the forecasts section, since this section is the main driver to much else in the master plan.
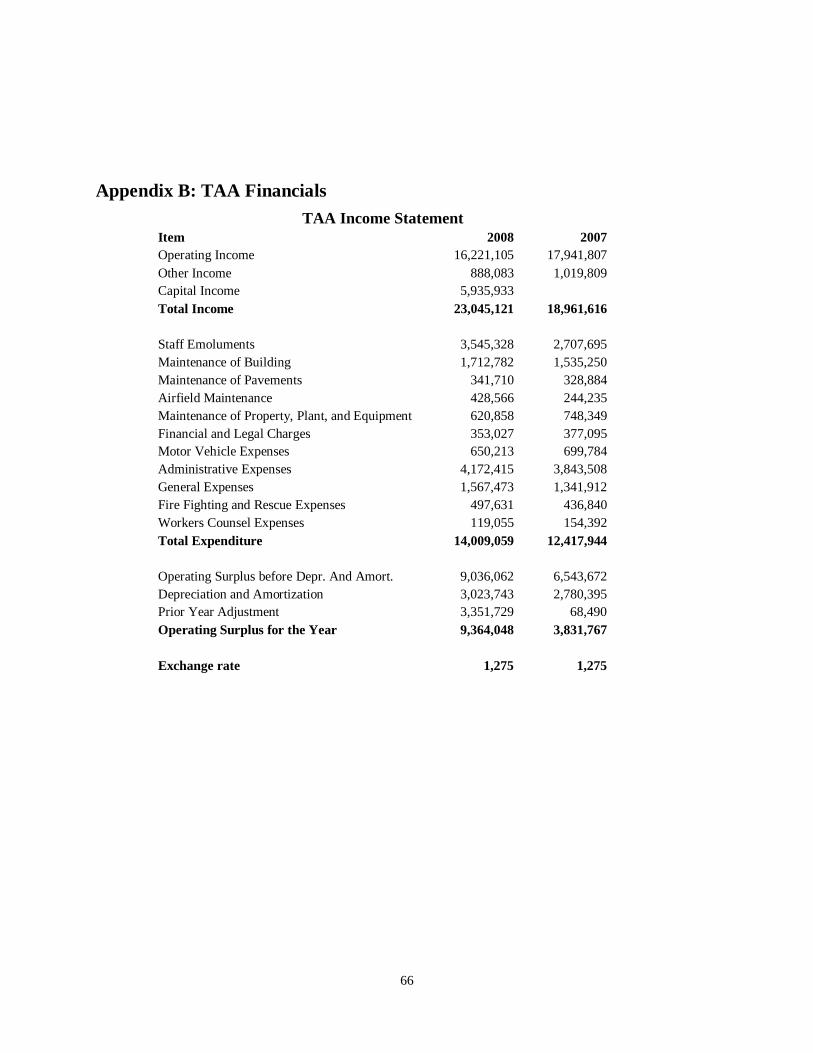
66
Appendix B: TAA Financials TAA Income Statement
Item 2008 2007 Operating Income 16,221,105 17,941,807 Other Income 888,083 1,019,809 Capital Income 5,935,933 Total Income 23,045,121 18,961,616 Staff Emoluments 3,545,328 2,707,695 Maintenance of Building 1,712,782 1,535,250 Maintenance of Pavements 341,710 328,884 Airfield Maintenance 428,566 244,235 Maintenance of Property, Plant, and Equipment 620,858 748,349 Financial and Legal Charges 353,027 377,095 Motor Vehicle Expenses 650,213 699,784 Administrative Expenses 4,172,415 3,843,508 General Expenses 1,567,473 1,341,912 Fire Fighting and Rescue Expenses 497,631 436,840 Workers Counsel Expenses 119,055 154,392 Total Expenditure 14,009,059 12,417,944 Operating Surplus before Depr. And Amort. 9,036,062 6,543,672 Depreciation and Amortization 3,023,743 2,780,395 Prior Year Adjustment 3,351,729 68,490 Operating Surplus for the Year 9,364,048 3,831,767 Exchange rate 1,275 1,275
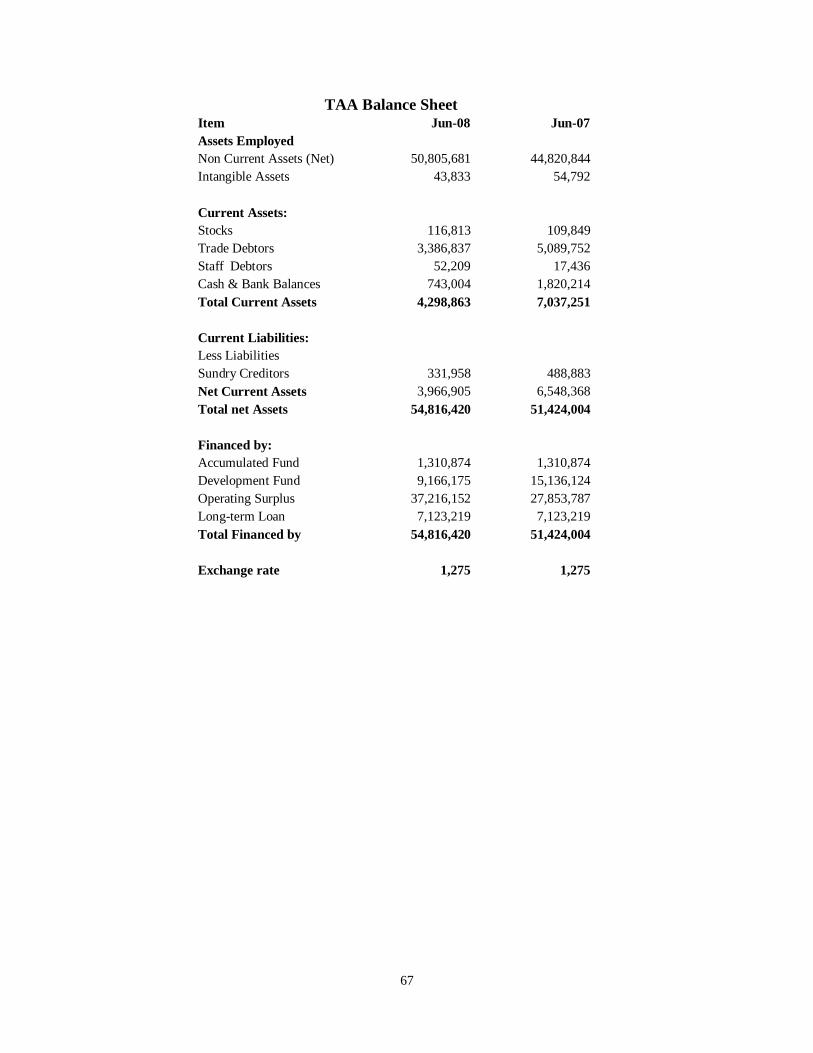
67
TAA Balance Sheet Item Jun-08 Jun-07 Assets Employed Non Current Assets (Net) 50,805,681 44,820,844 Intangible Assets 43,833 54,792 Current Assets: Stocks 116,813 109,849 Trade Debtors 3,386,837 5,089,752 Staff Debtors 52,209 17,436 Cash & Bank Balances 743,004 1,820,214 Total Current Assets 4,298,863 7,037,251 Current Liabilities: Less Liabilities Sundry Creditors 331,958 488,883 Net Current Assets 3,966,905 6,548,368 Total net Assets 54,816,420 51,424,004 Financed by: Accumulated Fund 1,310,874 1,310,874 Development Fund 9,166,175 15,136,124 Operating Surplus 37,216,152 27,853,787 Long-term Loan 7,123,219 7,123,219 Total Financed by 54,816,420 51,424,004 Exchange rate 1,275 1,275

68
TAA Statement of Cash Flows Item Jun-08 Jun-07 Cash flow from Operating Activities Surplus for the year 9,362,365 3,822,981 Adjustment for : Depreciation and Amortization 3,025,491 2,781,843 Operating Surplus before working Capital Changes 12,387,855 6,604,824 Working Capital Changes (Increase)/Decrease in Stocks -6,964 0 (Increase)/Decrease in Debtors 1,702,914 -2,928,026 (Increase)/Decrease in Loans & Advances -34,772 83,689 (Decrease)Increase in Creditors -156,925 178,069 Net Cash flow from operating activities (A) 13,892,108 3,938,556 Cash flow from Investing Activities Purchasing of Fixed Assets -8,999,370 -8,927,129 Net Cash used in investing Activities (B) -8,999,370 -8,927,129 Cash flow Financing Activities Increase (Decrease) in Long-term Loan 0 -225409.8039 Increase (Decrease) in Capital Fund. -5,969,949 5,969,949 Net Cash from financing activities (C) -5,969,949 5,744,539 Net Change in Cash and Cash equivalents (A+B+C) -1,077,210 907,561 Cash and Cash equivalents as a 1 July 1,820,214 912,653 Cash and Cash Equivalent 743,004 1,820,214 Exchange Rate 1,275 1,275
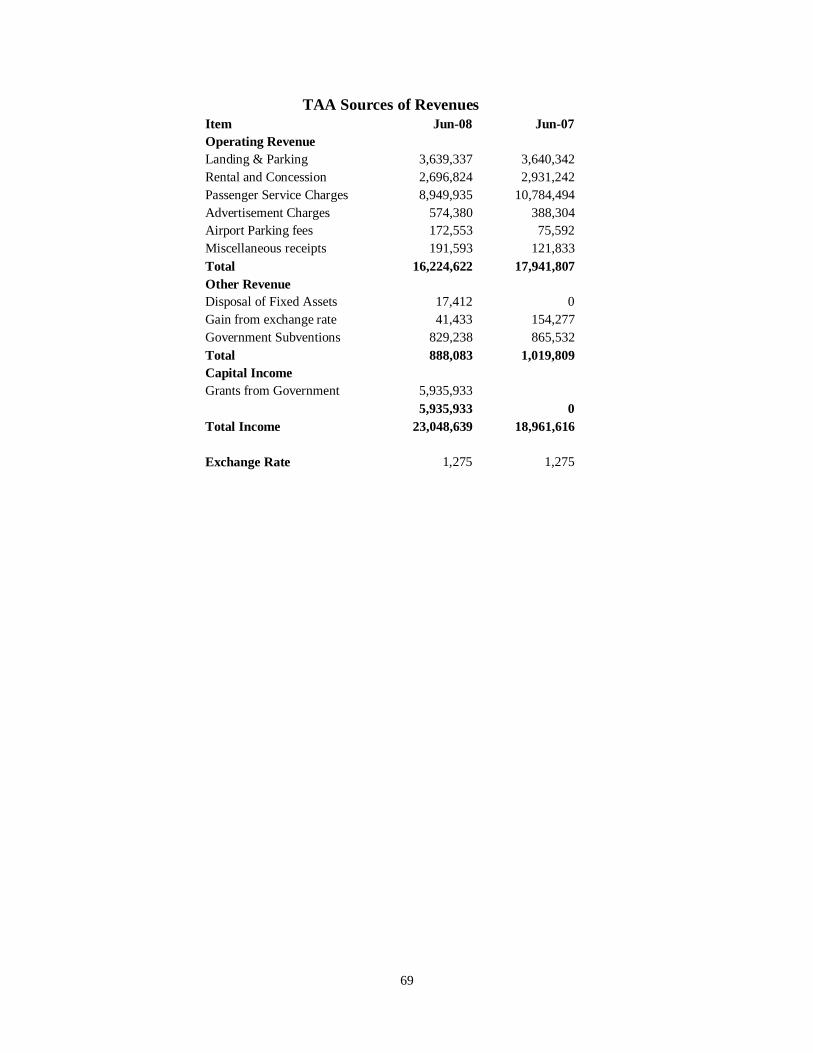
69
TAA Sources of Revenues Item Jun-08 Jun-07 Operating Revenue Landing & Parking 3,639,337 3,640,342 Rental and Concession 2,696,824 2,931,242 Passenger Service Charges 8,949,935 10,784,494 Advertisement Charges 574,380 388,304 Airport Parking fees 172,553 75,592 Miscellaneous receipts 191,593 121,833 Total 16,224,622 17,941,807 Other Revenue Disposal of Fixed Assets 17,412 0 Gain from exchange rate 41,433 154,277 Government Subventions 829,238 865,532 Total 888,083 1,019,809 Capital Income Grants from Government 5,935,933 5,935,933 0 Total Income 23,048,639 18,961,616 Exchange Rate 1,275 1,275
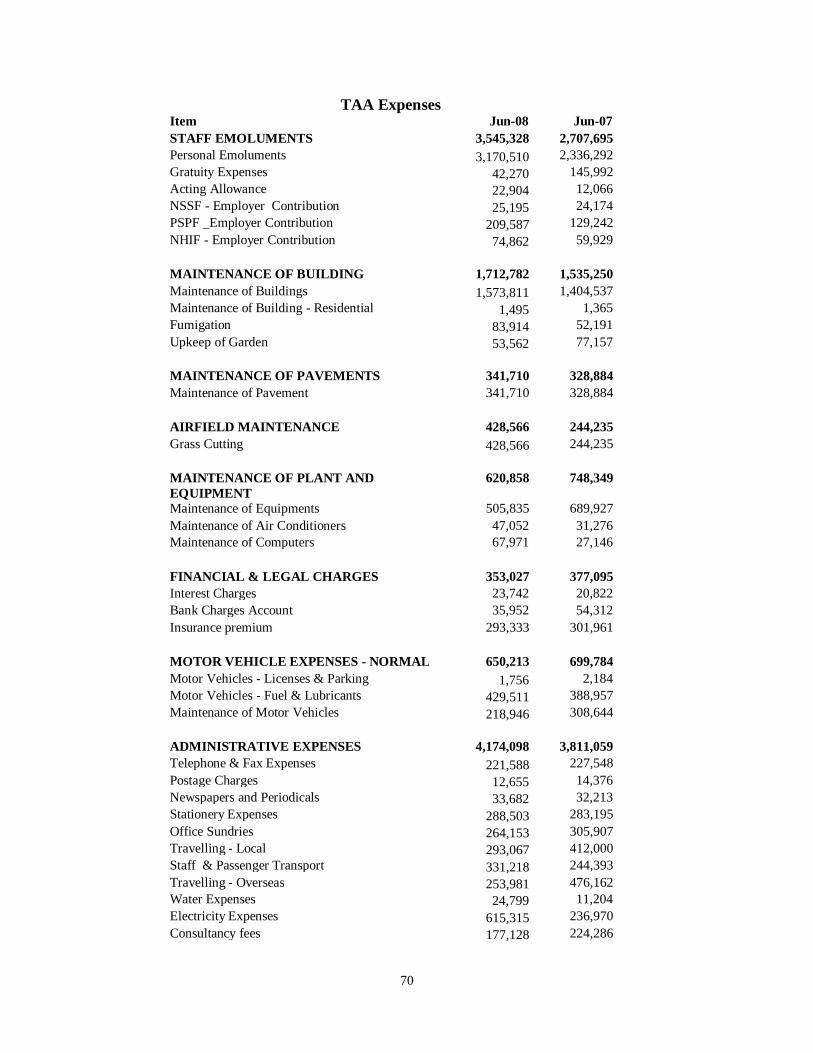
70
TAA Expenses Item Jun-08 Jun-07 STAFF EMOLUMENTS 3,545,328 2,707,695 Personal Emoluments 3,170,510 2,336,292 Gratuity Expenses 42,270 145,992 Acting Allowance 22,904 12,066 NSSF - Employer Contribution 25,195 24,174 PSPF _Employer Contribution 209,587 129,242 NHIF - Employer Contribution 74,862 59,929 MAINTENANCE OF BUILDING 1,712,782 1,535,250 Maintenance of Buildings 1,573,811 1,404,537 Maintenance of Building - Residential 1,495 1,365 Fumigation 83,914 52,191 Upkeep of Garden 53,562 77,157 MAINTENANCE OF PAVEMENTS 341,710 328,884 Maintenance of Pavement 341,710 328,884 AIRFIELD MAINTENANCE 428,566 244,235 Grass Cutting 428,566 244,235 MAINTENANCE OF PLANT AND EQUIPMENT
620,858 748,349
Maintenance of Equipments 505,835 689,927 Maintenance of Air Conditioners 47,052 31,276 Maintenance of Computers 67,971 27,146 FINANCIAL & LEGAL CHARGES 353,027 377,095 Interest Charges 23,742 20,822 Bank Charges Account 35,952 54,312 Insurance premium 293,333 301,961 MOTOR VEHICLE EXPENSES - NORMAL 650,213 699,784 Motor Vehicles - Licenses & Parking 1,756 2,184 Motor Vehicles - Fuel & Lubricants 429,511 388,957 Maintenance of Motor Vehicles 218,946 308,644 ADMINISTRATIVE EXPENSES 4,174,098 3,811,059 Telephone & Fax Expenses 221,588 227,548 Postage Charges 12,655 14,376 Newspapers and Periodicals 33,682 32,213 Stationery Expenses 288,503 283,195 Office Sundries 264,153 305,907 Travelling - Local 293,067 412,000 Staff & Passenger Transport 331,218 244,393 Travelling - Overseas 253,981 476,162 Water Expenses 24,799 11,204 Electricity Expenses 615,315 236,970 Consultancy fees 177,128 224,286
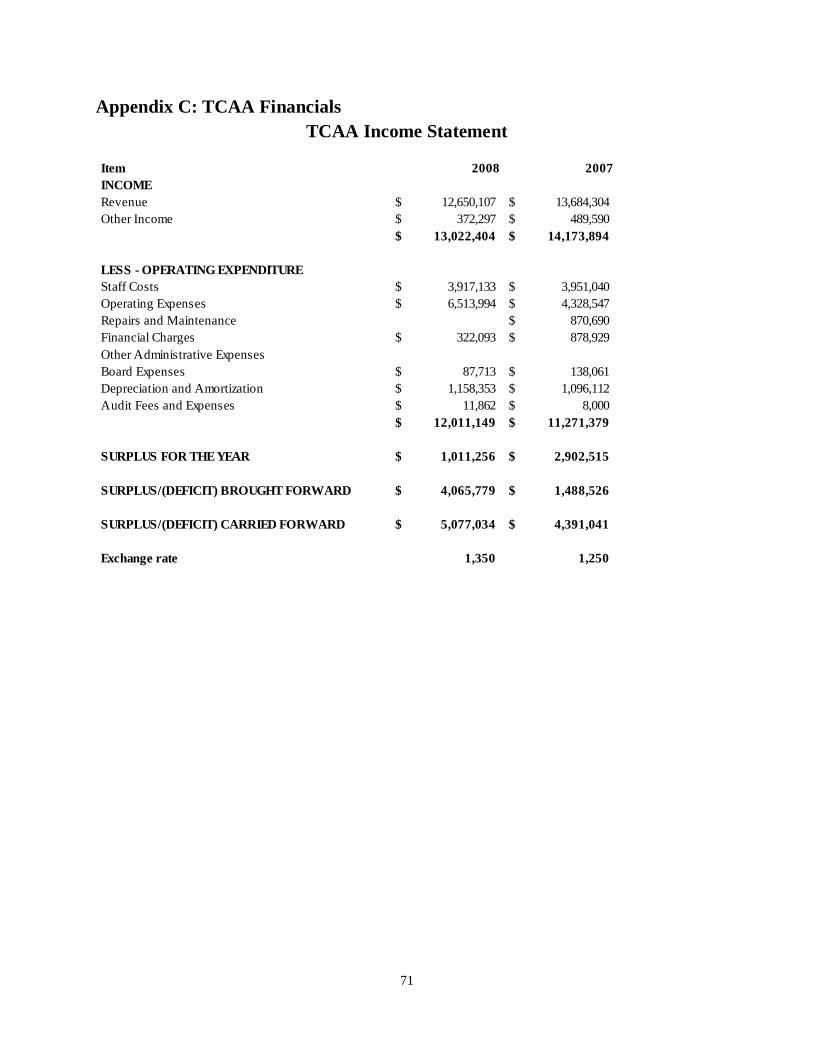
71
Appendix C: TCAA Financials TCAA Income Statement
Item 2008 2007INCOMERevenue 12,650,107$ 13,684,304$ Other Income 372,297$ 489,590$
13,022,404$ 14,173,894$
LESS - OPERATING EXPENDITUREStaff Costs 3,917,133$ 3,951,040$ Operating Expenses 6,513,994$ 4,328,547$ Repairs and Maintenance 870,690$ Financial Charges 322,093$ 878,929$ Other Administrative ExpensesBoard Expenses 87,713$ 138,061$ Depreciation and Amortization 1,158,353$ 1,096,112$ Audit Fees and Expenses 11,862$ 8,000$
12,011,149$ 11,271,379$
SURPLUS FOR THE YEAR 1,011,256$ 2,902,515$
SURPLUS/(DEFICIT) BROUGHT FORWARD 4,065,779$ 1,488,526$
SURPLUS/(DEFICIT) CARRIED FORWARD 5,077,034$ 4,391,041$
Exchange rate 1,350 1,250

72
TCAA Balance Sheet
Item 2008 2007ASSETSNon-current assets (net)Property, plant and equipment 6,919,514$ 7,018,588$ Investment in shares 7,703$ 2,585$ Intangible assets 142,876$ 219,358$ Subtotal 7,070,093$ 7,240,531$
Current AssetsInventory 288,941$ 211,833$ Trade and other receivables 1,749,979$ 2,090,082$ Short term investments 5,903,021$ 2,855,582$ Cash at bank and in hand 4,570,376$ 5,582,254$ Subtotal 12,512,316$ 10,739,751$
TOTAL ASSETS 19,582,410$ 17,980,282$
EQUITYCapital fund 4,958,688$ 5,355,383$ Accumulated surplus 9,390,986$ 7,691,546$ Revaluation reserve -$ 10,686$ Assets held for sale 5,310$ Subtotal 14,354,984$ 13,057,615$
LIABILITIESBorrowings 3,237,836$ 2,957,823$ Funds held for special project 244,529$ 264,091$ Trade and other payables 1,364,172$ 1,365,674$ Current portion of borrowings 380,889$ 335,078$ Subtotal 5,227,426$ 4,922,667$
TOTAL EQUITIES AND LIABILITIES 19,582,410$ 17,980,282$
Exchange Rate 1,350$ 1,250$
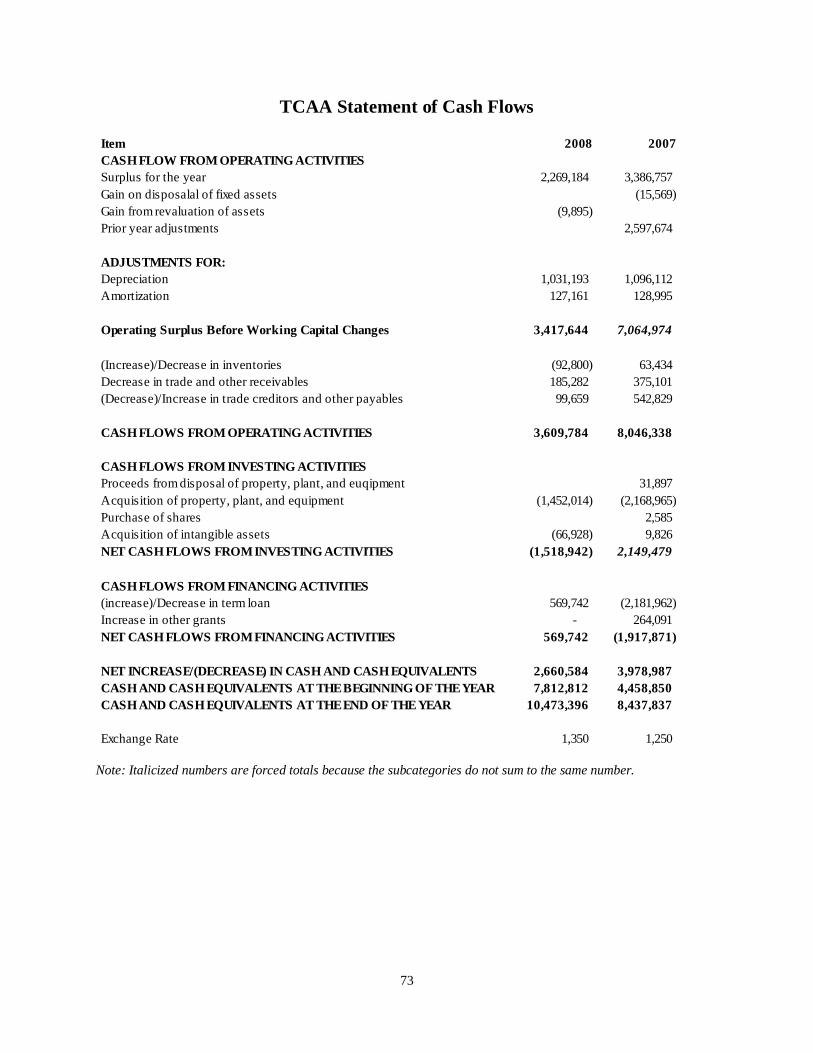
73
TCAA Statement of Cash Flows
Note: Italicized numbers are forced totals because the subcategories do not sum to the same number.
Item 2008 2007CASH FLOW FROM OPERATING ACTIVITIESSurplus for the year 2,269,184 3,386,757 Gain on disposalal of fixed assets (15,569) Gain from revaluation of assets (9,895) Prior year adjustments 2,597,674
ADJUSTMENTS FOR:Depreciation 1,031,193 1,096,112 Amortization 127,161 128,995
Operating Surplus Before Working Capital Changes 3,417,644 7,064,974
(Increase)/Decrease in inventories (92,800) 63,434 Decrease in trade and other receivables 185,282 375,101 (Decrease)/Increase in trade creditors and other payables 99,659 542,829
CASH FLOWS FROM OPERATING ACTIVITIES 3,609,784 8,046,338
CASH FLOWS FROM INVESTING ACTIVITIESProceeds from disposal of property, plant, and euqipment 31,897 Acquisition of property, plant, and equipment (1,452,014) (2,168,965) Purchase of shares 2,585 Acquisition of intangible assets (66,928) 9,826 NET CASH FLOWS FROM INVESTING ACTIVITIES (1,518,942) 2,149,479
CASH FLOWS FROM FINANCING ACTIVITIES(increase)/Decrease in term loan 569,742 (2,181,962) Increase in other grants - 264,091 NET CASH FLOWS FROM FINANCING ACTIVITIES 569,742 (1,917,871)
NET INCREASE/(DECREASE) IN CASH AND CASH EQUIVALENTS 2,660,584 3,978,987 CASH AND CASH EQUIVALENTS AT THE BEGINNING OF THE YEAR 7,812,812 4,458,850 CASH AND CASH EQUIVALENTS AT THE END OF THE YEAR 10,473,396 8,437,837
Exchange Rate 1,350 1,250
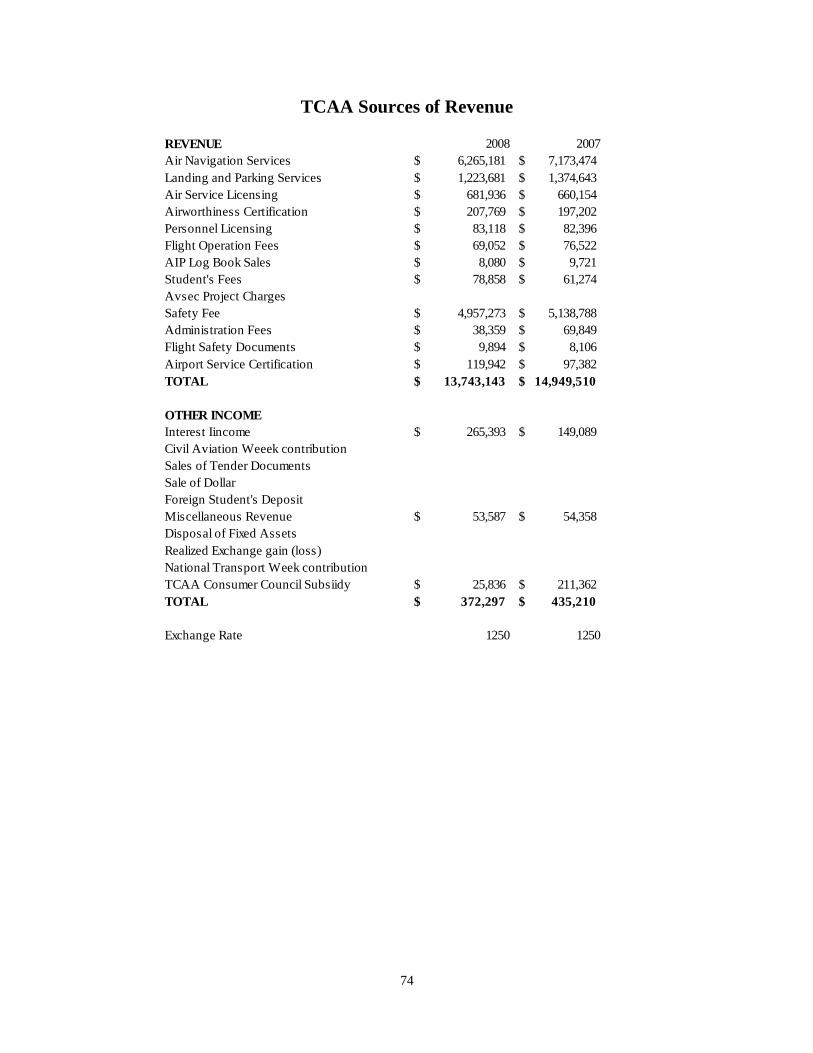
74
TCAA Sources of Revenue
REVENUE 2008 2007Air Navigation Services 6,265,181$ 7,173,474$ Landing and Parking Services 1,223,681$ 1,374,643$ Air Service Licensing 681,936$ 660,154$ Airworthiness Certification 207,769$ 197,202$ Personnel Licensing 83,118$ 82,396$ Flight Operation Fees 69,052$ 76,522$ AIP Log Book Sales 8,080$ 9,721$ Student's Fees 78,858$ 61,274$ Avsec Project ChargesSafety Fee 4,957,273$ 5,138,788$ Administration Fees 38,359$ 69,849$ Flight Safety Documents 9,894$ 8,106$ Airport Service Certification 119,942$ 97,382$ TOTAL 13,743,143$ 14,949,510$
OTHER INCOMEInterest Iincome 265,393$ 149,089$ Civil Aviation Weeek contributionSales of Tender DocumentsSale of DollarForeign Student's DepositMiscellaneous Revenue 53,587$ 54,358$ Disposal of Fixed AssetsRealized Exchange gain (loss)National Transport Week contributionTCAA Consumer Council Subsiidy 25,836$ 211,362$ TOTAL 372,297$ 435,210$
Exchange Rate 1250 1250
75
Appendix D: Terms of references for the study
TERMS OF REFERENCE
for
Aviation Master Plan Pre-feasibility Study
1. BACKGROUND INFORMATION
1.1 Beneficiary country
The beneficiary country is the United Republic of Tanzania.
1.2 Contracting Arrangements
The Aviation Master Plan Pre-feasibility Study will be carried out within the framework of the project Management Consultancy for Institutional Support to Transport and hence no separate contract is required. However, approval of staff proposed will be required by Director of Policy and Planning (DPP) in the Ministry of Infrastructure Development.
1.3 Current State of Affairs in the Aviation sub-sector
Air transport has a major role to play in enabling aspired rapid economic growth. There are three major areas of demand for transport that require development of an efficient and affordable or lower cost aviation system: (a) catering for the hitherto grossly under-exploited horticulture with a large interregional or international trade potential in especially cut flowers/floriculture, vegetables, fruit, meat, fish and other related chilled and frozen products; (b) access to the many remote areas with under-exploited or even untapped tourism potential; and (c) facilitating time sensitive business and social travel, especially given the size of the country and the grossly inadequate and poor surface transport infrastructure. The governance of the aviation sector is currently achieved through three sets of institutions: the Tanzania Civil Aviation Authority (TCAA), responsible for safety and economic regulation, the Tanzania Airports Authority (TAA), responsible for development and management of airports, and the airlines or air transport operators, providing passenger and freight flights. The Ministry of Infrastructure Development has the responsibility of setting sub-sector policy and development
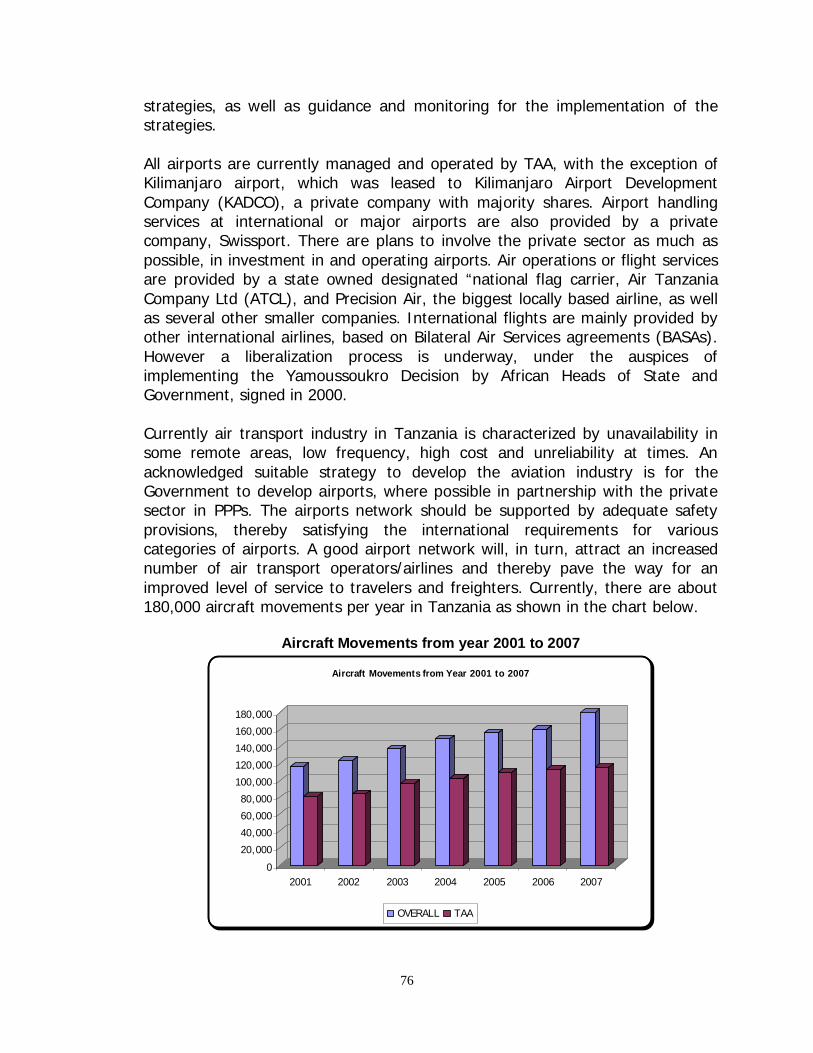
76
strategies, as well as guidance and monitoring for the implementation of the strategies. All airports are currently managed and operated by TAA, with the exception of Kilimanjaro airport, which was leased to Kilimanjaro Airport Development Company (KADCO), a private company with majority shares. Airport handling services at international or major airports are also provided by a private company, Swissport. There are plans to involve the private sector as much as possible, in investment in and operating airports. Air operations or flight services are provided by a state owned designated “national flag carrier, Air Tanzania Company Ltd (ATCL), and Precision Air, the biggest locally based airline, as well as several other smaller companies. International flights are mainly provided by other international airlines, based on Bilateral Air Services agreements (BASAs). However a liberalization process is underway, under the auspices of implementing the Yamoussoukro Decision by African Heads of State and Government, signed in 2000. Currently air transport industry in Tanzania is characterized by unavailability in some remote areas, low frequency, high cost and unreliability at times. An acknowledged suitable strategy to develop the aviation industry is for the Government to develop airports, where possible in partnership with the private sector in PPPs. The airports network should be supported by adequate safety provisions, thereby satisfying the international requirements for various categories of airports. A good airport network will, in turn, attract an increased number of air transport operators/airlines and thereby pave the way for an improved level of service to travelers and freighters. Currently, there are about 180,000 aircraft movements per year in Tanzania as shown in the chart below.
Aircraft Movements from year 2001 to 2007
0
20,000
40,000
60,000
80,000
100,000
120,000
140,000
160,000
180,000
2001 2002 2003 2004 2005 2006 2007
Aircraft Movements from Year 2001 to 2007
OVERALL TAA
77
1.4 Related Programmes and other Donor Activities
The major donor currently involved in the aviation sector is primarily the World Bank, which has recently financed a feasibility study and preliminary design of seven airports. The study was completed by the end of 2008.
1.5 Reference Documents
Transport Sector Investment Programme (TSIP), April 2008
Short TSIP (2009/10-11/12), August 2009
Status of Air Transport Sub Sector and Investment Opportunities in Airports, June 2008
Joint Infrastructure Sector Review, October 2008, Aviation Performance Review
2. DESCRIPTION OF THE ASSIGNMENT
2.1 Overall objectives
The overall objective of this assignment is to support TSIP, and thereby facilitate expansion to foster domestic and international trade and tourism. This is to be achieved through providing conducive environments for private sector participation in managing and, where feasible, development of airports and incentives to strategic investors.
2.2 Specific objectives
This study would basically prepare a long term strategic plan for the aviation industry. Various projects will be identified for further study and implementation over the next 10 years.
The specific objective of the study shall be to identify the framework and key elements in a master plan for developing an efficient and economically viable airport network to cater for the future development needs of the country. The study will not include design of individual airports but shall be limited to elaboration of size and categories of airports, facilities to be incorporated and estimates of investment projects, prioritisation of the projects and possible timing.
78
2.3 Tasks to be carried out
A summary of the tasks to be carried out include:
Assess the status and performance of the Tanzania aviation sector
Review of the status and performance of the aviation industry, especially airports, air navigation and safety and airline operations, as well as sector development plans;
Result and activities
Result 1: Overview the status and performance of the Tanzania aviation sector - will achieved by carrying out the following activities
Assessing the current inventory and status of air transport infrastructure and services, in particular with regards to airports, civil aviation safety and economics, and airline operations as well as institutional gaps;
Review the performance of the aviation sub-sector especially in relation to servicing key market segments or specific major demand areas, (including origins and destinations, or city pairs, tourism, business and leisure/social) travel and freight. Performance should be assessed based on identified key indicators to be proposed by the consultant and agreed upon by MoID;
Comparing the performance of the Tanzania aviation sector with other developing and developed countries for benchmarking; and
Assess the general or broad impact, economic and others, for the current state of the aviation sector.
Assessment. The study will review existing information, including available master plans or similar, to determine the current and future demand for air transport, both for passenger and freight. Rough estimates should be made for the medium and long term
Result and activities
Result 2: Assessment of future demand for air transport
Review existing data to determine relevant market segments (routes, services, key commodities);
Determine future demand for air travel and airports, especially to access or open up the underutilized economic potential, cater for projected
79
tourism growth and provide for business and social travel throughout the country, at both regional and international level; and
Analyse the overall role of air transport within the overall transport system (how does air transport complement road networks, railways systems, and waterways). The demand/supply analysis may need to show analyze and the modal split Air/Road/Railways/Ports in terms of domestic/regional/foreign traffic (passenger and cargo), before going to the details of air transport analysis.
Assess the status or trend of transport in the “region” taking advantage of geographical location of Tanzania in relation to landlocked countries of Malawi, Zambia, DRC, Rwanda, Burundi and Uganda. With likely hood of attracting ‘transit traffic’ through planned Tanzanian airports.
Defining a strategy and action plan for aviation sector development
A strategy for developing an aviation transport, especially a network of airports, to maximize economic gains/benefits, will be developed. The strategy should also include an action plan, listing priorities, a realistic time frame for the actions and investments, depending on demand development. The action plan will also identify the relevant stakeholders, a division of responsibilities for all different actions and mechanisms to initiate and sustain the actions.
Result and activities
Result 3: Defining a strategy and action plan for aviation sector development
Establish the strategy for development of the aviation sector (or outline the main elements of an aviation sector master plan) comprising general description of prioritized investment projects and action plan for implementation to cater for identified demand. Prioritization should be based on criteria to be proposed and agreed upon by MoID/stakeholders. The strategy will in particular pay attention to developing an airports network, supported by safety requirements, that addresses the identified needs. This includes expansion of Dar es Salaam and Kilimanjaro international airports to attract an increased number of passenger flights and freighters, upgrading strategic airports to international status for tourism and other economic
80
imperatives, and improving other domestic airports to establish an efficient network. The strategy should also include development of aviation related meteorology services and institutional capacity building;
Indicate existing and other possible sources of finance, especially by identifying potential PPP opportunities;
Elaborate a strategy for attracting an increased number of competing airline operators, and number of international flights to/from the country’s international airports;
Identify which airports require more detailed planning in terms of a. Only 63 airports owned by TAA/Government (+KADCO)?
b. Only selected, say 20 major out of 63 airports owned by TAA/Government (+KADCO)?
c. All 368 airports; national wide owned by TAA/TANAPA/MINING/HOSPITALS etc
Where necessary recognize the interaction of the selected group against the rest as they complement one another as “spokes/feeders”, or “small-hubs/distributors” of the same traffic.
Clearly show the integrated plan for development of ATC and NAVAIDS to support the airports under study. This means that “airports infrastructures” demand projections and “ATC and NAVAIDS” development need to be planned linearly.
Prepare a result based and time bound action plan for strategy implementation, including allocation of responsibilities for the identified actions.
3. EXPERTS PROFILE
3.1 Number of requested experts per category
The assignment will be carried out by one Transport Economist/Aviation Specialist
3.2 Profile required (education, experience, references and input as appropriate)
The following experts will be required:
81
Transport Economist/Aviation Specialist (8 weeks)
Qualification and skills - the Transport Economist/Aviation Specialist should have a good knowledge of transport economics skills and an in-depth knowledge of the aviation sector. He/she must have not less than 10 years of relevant experience. He/she must have proven skills in consultancy in aviation sector aspects. International work experience, especially in Africa and, in particular Tanzania, is an advantage.
General professional experience - Must have a management or consultancy background related to transport economics and, in particular aviation assessment of air transport planning, development and operations.
Education – Masters degree in transport economics/aviation economics.
4. LOCATION AND DURATION
4.1 Starting period and duration
The project work will be carried out within 10 weeks of the commencement date. This period shall cover examination of relevant documentation and interviews with relevant officers, preparation of reports detailed in Section 5 and facilitation of a stakeholders’ workshop.
4.2 Planning
A kick-off meeting will be organised by the Department of Policy and Planning of the Ministry of Infrastructure Development for the team of experts upon their arrival.
During this meeting, the final scope of the assignment (i.e. the list of documents to be reviewed, as well as persons to be interviewed by experts, format of reports to be produced) and practical arrangements will be decided (eg. time schedule for visits in airports). Minutes of the kick-off meeting, to be prepared by the experts, together with these Terms of Reference will then provide guidelines for conducting project work to be presented in the Inception Report.
A liaison office will be provided by MoID who will operate as part of the team. The consultant will organise a workshop to gain acceptance and commitment from all key stakeholders for the draft final report as workshop document.
82
4.3 Location(s) of assignment
The main base for the project work will be in Dar es Salaam. Project work including inspections of a small representative sample of air facilities as needed.
5. REPORTING
5.1 Content
The following reports should be provided: Inception Report, Draft Final Report and Final Report.
The Inception report will outline the detailed working schedule for the project.
The Draft Final Report will have three main sections, based on the three results/outputs defined in section 2.3 above.
The Draft Final Report be subject to comments from DPP and a stakeholders’ workshop. These comments shall be addressed and taken into consideration in the Final Report.
5.2 Language
All reports will be drafted in English.
5.3 Submission/comments timing
The reports will be submitted according to the timetable below having commencement date “N” (kick-off meeting) as a reference:
Milestone Time
Inception Report N+1 week
Draft Final Report N+7 weeks
Workshop N+9 weeks
Comments of DFR N+9 weeks
Final Report N+10 weeks
5.4 Number of report(s) copies
All reports will be provided in 6 hard copies and in an electronic form.
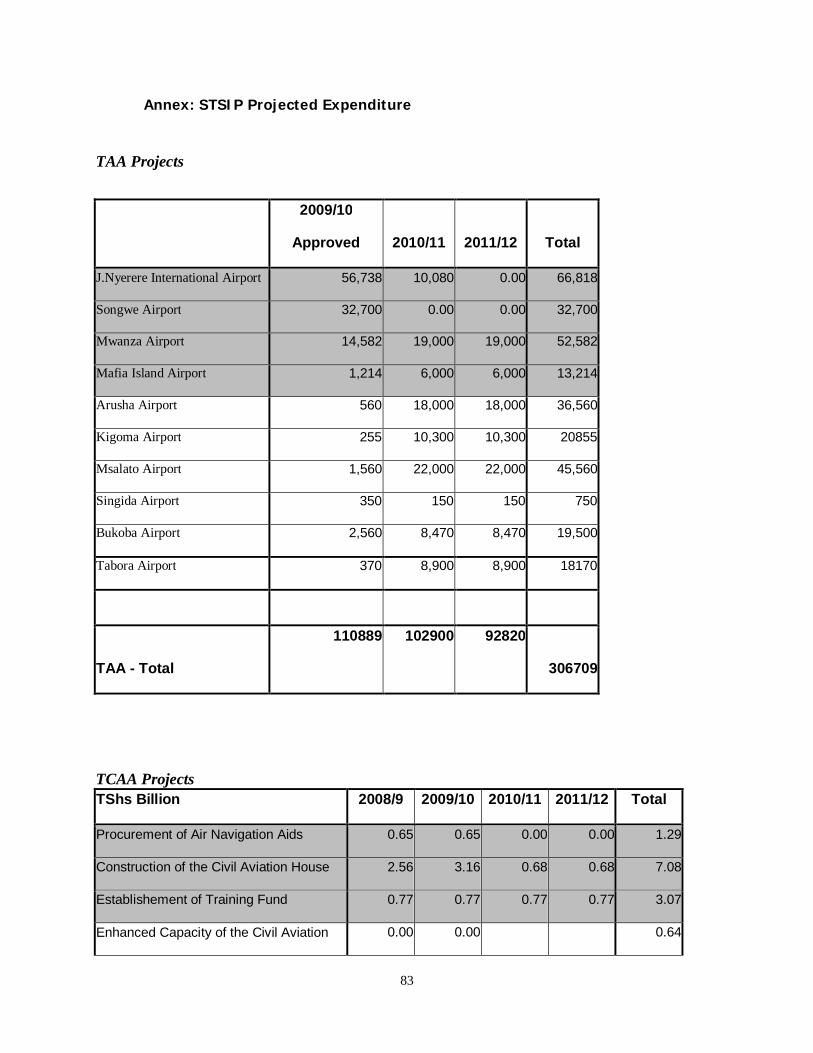
83
Annex: STSIP Projected Expenditure
TAA Projects
2009/10
Approved 2010/11 2011/12 Total
J.Nyerere International Airport 56,738 10,080 0.00 66,818
Songwe Airport 32,700 0.00 0.00 32,700
Mwanza Airport 14,582 19,000 19,000 52,582
Mafia Island Airport 1,214 6,000 6,000 13,214
Arusha Airport 560 18,000 18,000 36,560
Kigoma Airport 255 10,300 10,300 20855
Msalato Airport 1,560 22,000 22,000 45,560
Singida Airport 350 150 150 750
Bukoba Airport 2,560 8,470 8,470 19,500
Tabora Airport 370 8,900 8,900 18170
TAA - Total
110889
102900
92820
306709
TCAA Projects TShs Billion 2008/9 2009/10 2010/11 2011/12 Total
Procurement of Air Navigation Aids 0.65 0.65 0.00 0.00 1.29
Construction of the Civil Aviation House 2.56 3.16 0.68 0.68 7.08
Establishement of Training Fund 0.77 0.77 0.77 0.77 3.07
Enhanced Capacity of the Civil Aviation 0.00 0.00 0.64
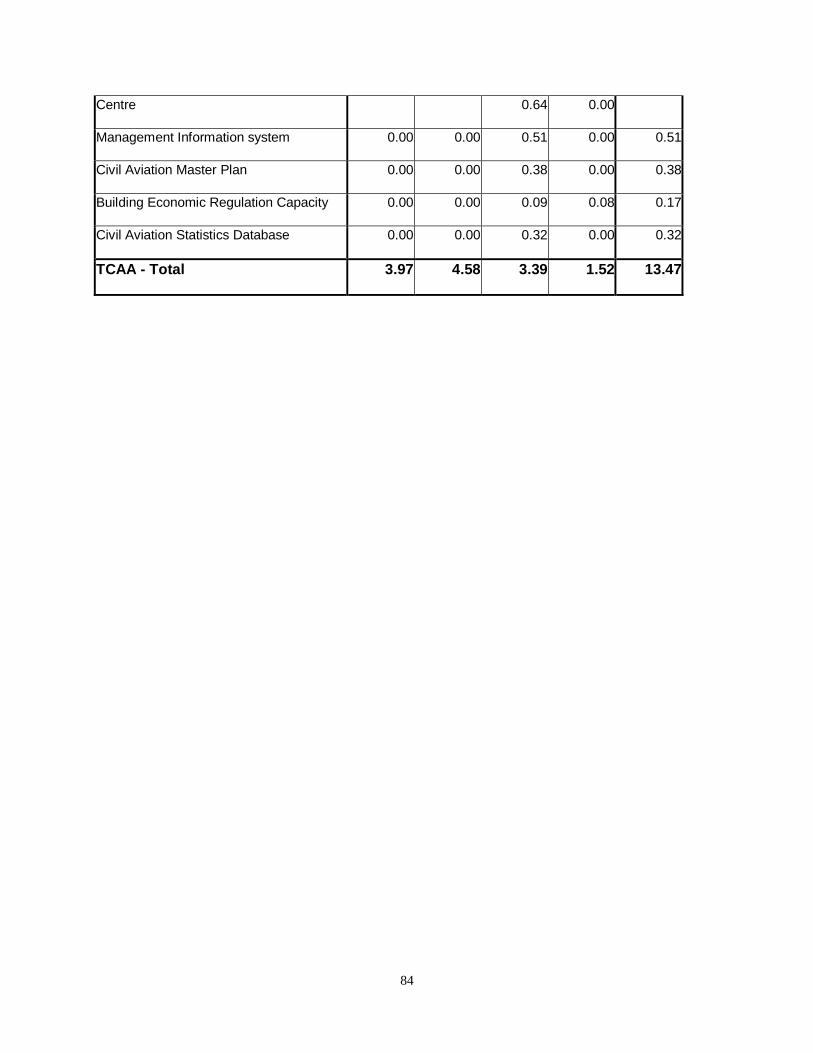
84
Centre 0.64 0.00
Management Information system 0.00 0.00 0.51 0.00 0.51
Civil Aviation Master Plan 0.00 0.00 0.38 0.00 0.38
Building Economic Regulation Capacity 0.00 0.00 0.09 0.08 0.17
Civil Aviation Statistics Database 0.00 0.00 0.32 0.00 0.32
TCAA - Total 3.97 4.58 3.39 1.52 13.47
85
Appendix E: List of persons met for this study
The list below does not include the large number of attendees at the meeting held March 4, 2010 in Dar es Salaam, when the initial draft of this report was being reviewed. In addition, there were telephone interviews with other relevant parties.
Ministry of Infrastructure Development Project coordination and management: Aunyisa Boniface Meena Senior Transport Economist Elirehema Obed Mollel Economist Department of Policy and Planning
Air Transport: Eng. Edwin H.T. Mujwahuzi Assistant Director - Airports and Aerodromes Kirenga R. Ndemino Assistant Director Air Transport and Meteorolgy
Dr. Bwire Barth Rufunjo Transport Expert
Thomas Ngulika Air Transport Expert
Safety and Environment: Mademi Kipande Director, Safety and Environment
Tanzania Airports Authority Prosper Tesha Director General S.S. Suleiman Director of Engineering and Technical Services George Smabali Manager Planning, Design, and Evaluation
86
Moshongi I. Moshongi Assistant Statistician
Neema Joseph Project Coordinator (World Bank airports project) Tanzania Civil Aviation Authority Margaret Muyage Director General Fadhili Monongi Director Economic Regulation Said A. K. Sumry Civil Aviation Manager, Zanzibar Revolutionary Government of Zanzibar Ministry of Communications & Transport Dr. Vuai I. Lila Principal Secretary Mr. Abdullah H. Kombo Project Coordinator, Zanzibar Transport Master Plan Project Abdulhalym Mohamed Sururu Chief Civil Aviation Security & Safety, Department of Aviation Yussuf-Mohammed Ali Planning & Policy Officer, Department of Aviation
Kilimanjaro Airports Development Company (by telephone): Marco van der Kreeke Managing Director

87
This page intentionally blank