Embed Size (px)
Citation preview
WP-02-39
"Civil Death" or Civil Rights? Public Attitudes Towards FelonDisfranchisement in the United States
October 7, 2002
Jeff ManzaDepartment of SociologyNorthwestern UniversityEvanston, IL 60208-1330manza@ northwestern.edu
Clem BrooksDepartment of Sociology
Indiana UniversityBloomington, IN 47405
Christopher UggenDepartment of SociologyUniversity of MinnesotaMinneapolis, MN 55455
WORD COUNT: 8,236
*We thank David Krane and Humphrey Taylor for their help in carrying out the survey used forthis study, and Angela Behrens, Michael Sauder, and Sara Wakefield for research assistance. Thisresearch was supported by grants from the National Science Foundation (#9819015), theIndividual Project Fellowship Program of the Open Society Institute, and the Institute for PolicyResearch at Northwestern University.
ABSTRACT
This paper presents new experimental survey results about Americans’ attitudes
towards the political disfranchisement of felons and ex-felons. Two long-term trends in
public opinion provide the backdrop for this investigation: strong (though variable)
public support for conservative anti-crime policies, and growing public support for civil
rights and civil liberties for most major groups. We find evidence thatAmericans favor
providing non-incarcerated felons (those on probation, parole, and ex-felons who have
completed their sentences) with the right to vote. These results are robust in the face of
alternative question wordings. Those who endorse other civil liberties and a
rehabilitative orientation to punishment tend to favor extending voting rights to
convicted felons, even when the effects of age, race, sex, region, residency, education,
and ideological identification are statistically controlled. In the clash between two
different imperatives – a desire to punish and deter crime versus a desire to promote and
protect the civil liberties of even unpopular groups – we find evidence that the latter
has greater public support. The paper concludes with a discussion of how these results
might inform the recently emerging debate over felon disfranchisement laws.
1
“CIVIL DEATH” OR CIVIL RIGHTS? PUBLIC ATTITUDES TOWARDS FELON
DISFRANCHISEMENT IN THE UNITED STATES
Since passage of the 1965 Voting Rights Act, debates around suffrage in the United States have
largely shifted from questions about formal individual rights to participation to questions of
fairness in the practical implementation of those rights. Prior to the VRA, the disfranchisement of
African American voters provided a vivid example of persistent suffrage inequities in the
American political system, and its passage was a landmark development in the struggles to extend
the franchise to all citizens (cf. Keyssar 2000). Following its passage, concern over voting rights
faded rapidly. As one authoritative recent treatment put it, “at least since the voting rights
reforms of the 1960s, political rights have been universalized in the United States. With relatively
insignificant exceptions, all adult citizens have the full complement of political rights” (Verba,
Scholzman, and Brady 1995, p. 11).
Reflecting this conventional wisdom, the most hotly contested questions about American
democracy in recent years have thus focused not on the right to participate but rather on
questions of institutional design and fairness of elections. Among the most important of these
have been whether legislative districts afford all groups equal representation (Kousser 1999;
Isssacharoff, Karlan and Pildes 1999, chaps. 5-8), the power of money in the electoral system
(Domhoff 1998; Broder 2000), and the restrictive impact of state-level voter registration laws on
political participation (Piven and Cloward 2000; National Commission on Federal Election
Reform 2001). Concerns about low levels of citizen participation in elections have also
2
stimulated exhaustive theorizing and research on the state of democracy in America (Putnam
2000; Conway 2000), as has declining confidence in political institutions and government (e.g.
Nye, Zelibow and King 1997; Hetherington 1998).
The apparently settled character of the right to vote and its disappearance from the
scholarly and popular literatures on American democracy, however, is challenged by the rapid
growth in incarceration and conviction rates within the criminal justice system over the past three
decades. Because election laws in most states bar felons and some ex-felons from voting, these
developments have re-injected the issue of formal voting rights back into the contemporary
political agenda. The changing character of punishment has played a particularly important role,
by driving up rates of disfranchisement. From the 1920s through the late 1960s, rates of
incarceration in the United States were very stable. In the past thirty years, however,
incarceration and conviction rates have soared.1 Between 1972 and 2001, even while crime rates
were first stable, then declining (in the 1990s), the number of state and federal prisoners has
grown by over 600 percent, from 196,429 to 1,324,465 (U.S. Department of Justice 1973, p.
350; 2002b). Other correctional populations have also grown in rate and number, with more than
a four-fold increase in the number of felony probationers (from 455,093 to 2,084,358) and
parolees (from 160,900 to 731,147) from 1976 to 2001 (U.S. Department of Justice 1979;
1 Although our analysis will not engage explanations for rising punishment rates, it is important to note that thistrend is not a simple product of rising crime rates. National Crime Victimization Survey data show steady declinesin property crime since 1973, trendless fluctuation in violent crime from 1973 to 1994, and steep drops in alloffenses from 1994 to 2001 (U.S. Department of Justice 2002a). By year-end 2001, overall violent and propertycrime rates fell to “record lows” (U.S.D.O.J. 2002a:2), even as U.S. correctional populations reached all-time highs(U.S.D.O.J. 2002b:1). The FBI’s Uniform Crime Report series shows greater evidence of rising crime throughoutthe 1960s and 1970s (with violent offenses not peaking until 1991), but by 2000 even the UCR crime index hadfallen to its lowest level since 1972 (U.S.D.O.J. 2001:278-9; see U.S.D.O.J. 1995 for a comparison of UCR andNCVS data sources).
3
2002c). When jail inmates are added to state and federal prisoners, approximately 2 million
offenders are currently incarcerated, with an additional 4.7 million persons supervised in the
community on probation or parole (U.S. Department of Justice 2002c), and some 9.5 million ex-
offenders in the general population (Authors 2002).
Because virtually all incarcerated felons, and many non-incarcerated felons as well, are
barred from voting, the size of the disfranchised population has grown in tandem with the general
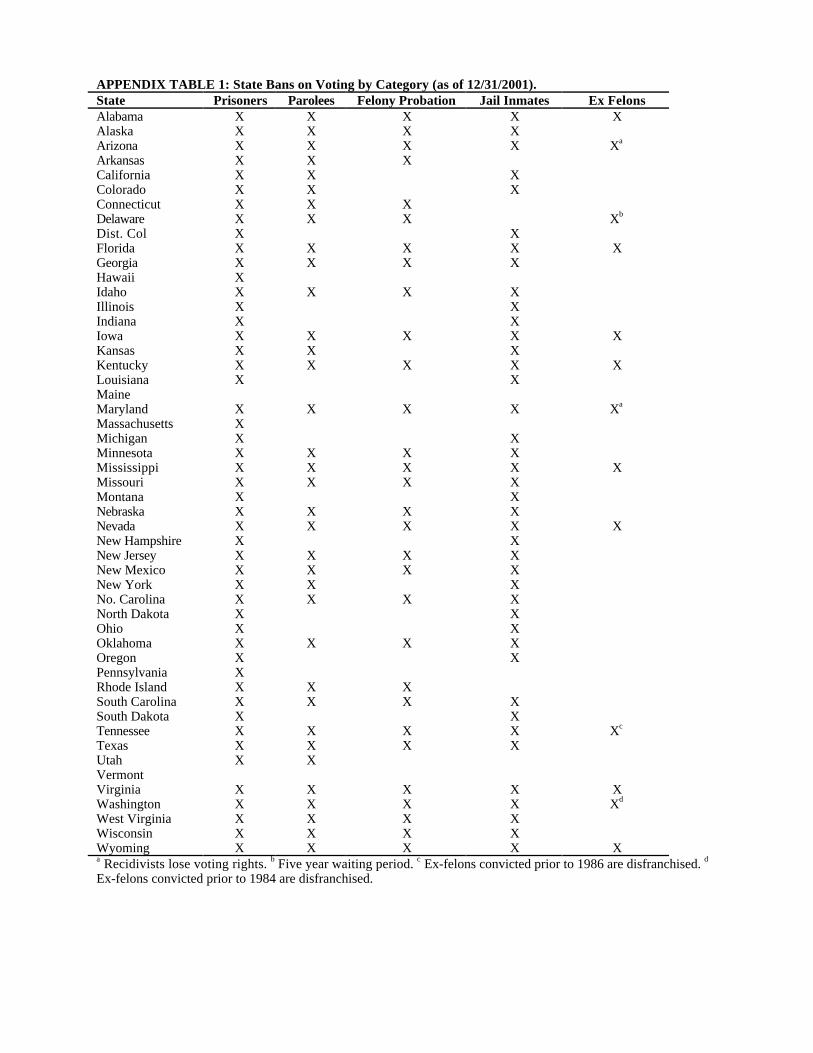
expansion of the criminal justice system. Currently, 48 states disfranchise incarcerated felons, 37
states disfranchise felony probationers or parolees (or both), and 14 states additionally
disfranchise some or all ex-felons who have completed their sentences (Fellner and Mauer 1998;
authors 2002). Although states vary widely in the proportion of citizens disfranchised, felon
disfranchisement laws have significant consequences in the United States. For example, in the
most recent presidential election, an estimated 4.7 million people (2.3% of the voting age
population) were disfranchised by virtue of having a felony conviction on their record (Authors
2002). This represents by far the largest group of American citizens who are not allowed to vote
(Keyssar 2000, p. 308).
The rapid growth in felon disfranchisement in recent years has not gone unnoticed. In the
face of a mounting campaign several states have amended their laws in the past year to expand
felon voting rights. For example, in 2001, Connecticut and New Mexico both liberalized their
felon disfranchisement laws. Connecticut changed its law to allow probationers to vote, and New
Mexico now restores voting rights upon completion of sentence. In 2001, Nevada eliminated its
five-year post-sentence waiting period to apply for the restoration of voting rights, but the
4
restoration process is not automatic. In 2002, Maryland passed legislation to automatically
restore voting rights upon completion of sentence for first-time offenders (and three years after
completion for non-violent recidivists). At the national level, a measure banning the states from
placing any restrictions on the voting rights of ex-felons reached the floor of the Senate in
February 2002, where it was defeated 63-31 (U.S. Congress 2002). While a wide variety of civil
and voting rights organizations continue to exert pressure for the liberalization of voting laws
regulating felons, a number of states have adopted more conservative restrictions. Since 1997, for
example, Utah and Massachusetts have disfranchised inmates and Colorado and Oregon
disfranchised federal inmates (Colorado disfranchised federal parolees as well). Overall, a very
mixed picture emerges. One recent canvass of changes since 1975 finds that while 13 states have
liberalized their laws, 11 states have passed further limitations on felons, and three states have
passed both types of laws (Schiffman 2001)
Conflicts over felon disfranchisement reflect an enduring tension in 20th Century
American political life, reflected in public policy, partisan debates, and public opinion: the clash
between the desire to maintain social and political order versus the desire to extend civil rights
and liberties to all citizens (Huntington 1981; McClosky and Zaller 1984; Sniderman 1996).
Public fear of crime, and a desire to punish criminal offenders in ways that will reduce their future
propensity to commit crimes, co-exists alongside broad support for basic civil liberties,
democracy, and a right to due process for those accused of crimes. Contemporary debates over
disfranchisement engage this important cleavage in ways that have not been heretofore examined.
5
In this paper, we provide the first systematic assessment of public attitudes about laws
disfranchising felons and ex-felons. This analysis is informative because to this point virtually no
national-level survey data exploring multiple dimensions of the issue have been collected. We
analyze data from a new national survey conducted in July 2002, focusing, in particular, on
whether variations in the framing or target group referenced by survey questions affects the level
of support versus opposition to voting rights for felons and ex-felons. To provide a context for
understanding attitudes towards felon disfranchisement, we also compare them with attitudes
towards other civil liberties for criminal offenders.
The paper is in four parts. Part one discusses the issue of felon voting rights, situating
current policy conflicts in comparative and historical context. Part two summarizes our data,
measures, and the logic of our survey experiments. In part three, we present the results of our
survey, describing aggregate opinion towards voting rights and other civil liberties, as well as
multivariate analyses to identify the sources of attitudes towards felon voting rights. The final
part of the paper discusses policy and political implications of these results.
POLITICAL AND HISTORICAL BACKGROUND
Although non-propertied white men generally gained the franchise earlier in the United States
than in other democratic countries, for other segments of the population the right to vote came
much later after protracted struggles (e.g. Rogers 1992; Shklar 1991; Wiebe 1995; Keyssar 2000).
Restrictions on the voting rights of criminals were but one of a large number of restrictions
6
developed from the founding of the Republic onward. Criminal disfranchisement has an extensive
history in English, European, and Roman law, both as a form of retribution and as a general
deterrent to future offenses. American disfranchisement laws date to colonial times, and states
began writing criminal disfranchisement provisions into their constitutions in the late eighteenth
century. Most state constitutions explicitly gave their legislatures the power to pass laws
disfranchising criminals. Early disfranchisement laws in the United States drew upon European
models and were limited to a few specific offenses (Ewald 2002). In 1840, 4 of the then 26 states
had felon disfranchisement statutes on the books. From the 1840s onward, states began adopting
and expanding their restrictions on felons and ex-felons, frequently broadening the scope of
crimes covered and the proportion of offenders involved (Keyssar 2000, pp. 162-63). A wave of
disfranchisement laws followed the Civil War. In the South, during and after Reconstruction,
many states expanded their restrictions on the felon population (which for the first time began to
contain large proportions of African Americans), the first step in a larger process of
disfranchising black voters (Perman 2001). Throughout the 20th Century, increasing numbers of
states disfranchised some categories of felons, although since the late 1960s a number of states
have eliminated their ballot restrictions for ex-felons (see Keyssar 2000, pp. 302-08).
Current disfranchisement laws distinguish four categories of felon offenders: (1) those
who are currently incarcerated; (2) those who have been incarcerated but remain under parole
supervision; (3) those who were convicted of a felony but sentenced to probation rather than
prison; and, (4) those who have completed their entire sentence (ex-felons). In other work
(Authors 2002), we have developed a demographic life-table analysis to estimate the overall
7
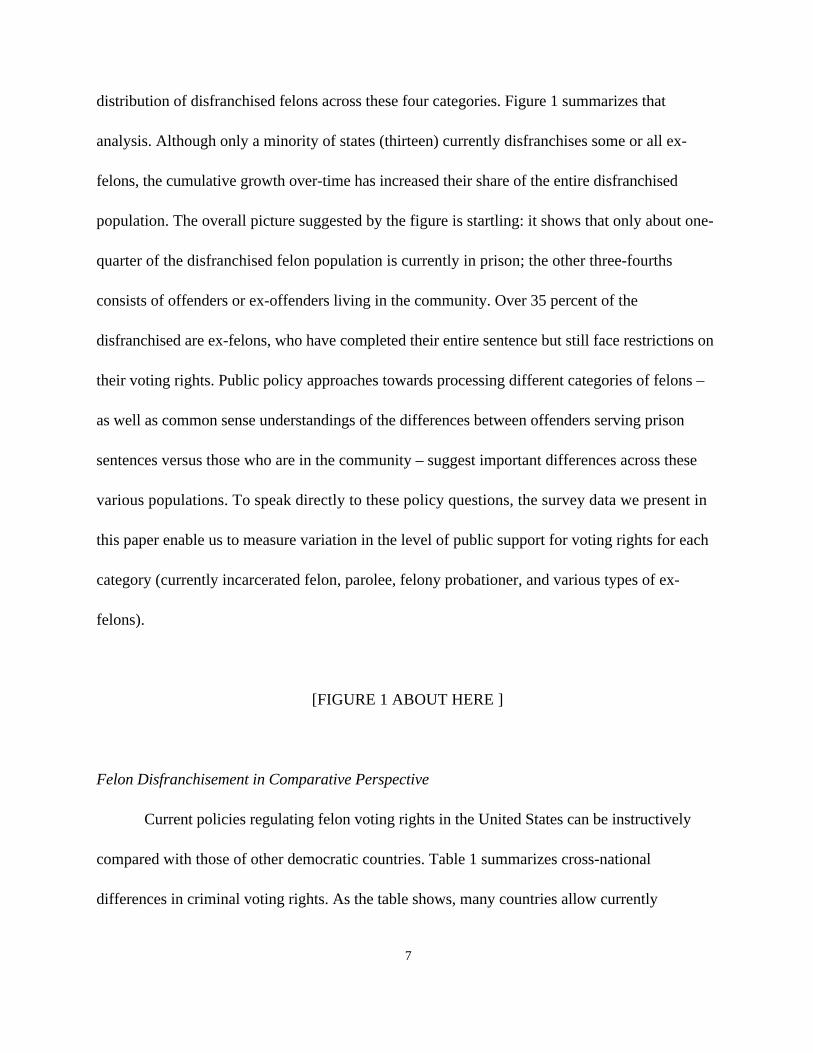
distribution of disfranchised felons across these four categories. Figure 1 summarizes that
analysis. Although only a minority of states (thirteen) currently disfranchises some or all ex-
felons, the cumulative growth over-time has increased their share of the entire disfranchised
population. The overall picture suggested by the figure is startling: it shows that only about one-
quarter of the disfranchised felon population is currently in prison; the other three-fourths
consists of offenders or ex-offenders living in the community. Over 35 percent of the
disfranchised are ex-felons, who have completed their entire sentence but still face restrictions on
their voting rights. Public policy approaches towards processing different categories of felons –
as well as common sense understandings of the differences between offenders serving prison
sentences versus those who are in the community – suggest important differences across these
various populations. To speak directly to these policy questions, the survey data we present in
this paper enable us to measure variation in the level of public support for voting rights for each
category (currently incarcerated felon, parolee, felony probationer, and various types of ex-
felons).
[FIGURE 1 ABOUT HERE ]
Felon Disfranchisement in Comparative Perspective
Current policies regulating felon voting rights in the United States can be instructively
compared with those of other democratic countries. Table 1 summarizes cross-national
differences in criminal voting rights. As the table shows, many countries allow currently
8
incarcerated felons to vote. Eighteen European democracies have no electoral ban on incarcerated
prisoners and allow them to vote, as does South Africa (following a recent Supreme Court ruling).
Eight other European countries, Canada, Australia, and New Zealand disfranchise only some
sentenced prisoners. In France and Germany, courts have the power to withdraw voting rights as
an additional punishment (cf. Demleitner [2000] on Germany). In most of the other countries
with contingent restrictions (including Austria and Belgium in Europe, and Canada, Australia and
New Zealand outside it), the length of the sentence determines whether incarcerated individuals
can vote. Nine European countries bar all incarcerated prisoners from voting (but none that we
have been able to determine maintain those restrictions post-release). Analysis of public opinion
data is needed to determine whether the unusual felon disfranchisement provisions in the United
States enjoy broad public support.
[TABLE 1 ABOUT HERE]
The Current Controversy: Liberal and Conservative Views
As we noted above, the current policy of felon disfranchisement in the United States has
come under attack in recent years, facing challenges at both the national level and in the states. In
these debates, there have been relatively few explicit defenses of restrictions on felon voting
rights, although embedded in the legal and political history of these laws, as well as in recent
legislative debates and court rulings, a battery of arguments supporting disfranchisement can be
found. The most longstanding claims in support of felon disfranchisement concern the impact of
9
allowing criminals (or ex-criminals) to vote. Having exhibited a propensity to violate the social
contract on at least one previous occasion, criminals cannot be trusted to exercise the franchise
without corruption. As one supporter of this view put it in Congressional testimony, allowing
ex-convicts to vote “could have a perverse effect on the abilitity of law abiding citizens to reduce
the deadly and debilitating crime in their communities” (Graziano 1999, p. 44). Noting the
existence of “the high percentage of criminals … and …disfranchised people in some
communities,” another supporter of ex-felon disfranchisement laws argued “this is an argument
against re-enfrancisement, because there accordingly exists a voting bloc that could create real
problems by skewing election results” (Clegg 1999, p. 17). In the Senate debate over proposed
legislation eliminating restrictions on the voting rights of ex-felons, Senator Mitch McConnell (R-
KY) argued that, among other things, removing disfranchisement bans could lead to “ ‘jailhouse
blocs’ banding together to oust sheriffs and government officials who are tough on crime” (U.S.
Congress 2002, p. S802).
A variant of this argument focuses on macro-level consequences for the legitimacy of
democratic government. It maintains that the “purity of the ballot box” is undermined by the
participation of tainted individuals, as the Alabama Supreme Court put it in a famous case in
1884 (Washington v. State 75 Ala. 582, quote at p. 585). In the philosophical arguments
associated with the republican and communitarian traditions, for example, the political
community can remain viable only insofar as it consists of citizens who respect the rules of
democratic procedure and can be expected to live within the norms those rules generate (for
review, see Ewald 2002, pp. 35-40). In conservative variants of these arguments, the presence of
10
criminals within the polity potentially erodes confidence in the community by diluting the votes
of non-criminal citizens. As Sen. McConnell put it, “those who break our laws should not dilute
the vote of law-abiding citizens” (U.S. Congress 2002, p. S802).
A third type of argument in support of felon disfranchisement, focuses on the
implications of restoring voting rights to violent criminals. For example, Florida Governor Jeb
Bush argues against routinely restoring civil rights to those who have “committed more serious
crimes, such as violent or multiple felonies, or have broken the law after previously having their
rights restored.” Similarly, in the 2002 Senate debate, Senator McConnell noted explicitly that
restoring voting rights to ex-offenders would mean that “rapists, murderers, robbers, and even
terrorists or spies” would be allowed to vote (U.S. Congress 2002, p. S802).
Finally, and perhaps related to the concerns about violent offenders, implicit racial
appeals (cf. Mendelberg 2001) can also be found in some of the defenses of felon
disfranchisement (cf. Ewald 2002). Fear of crime has frequently been shown to have a racial
component (Hurwitz and Peffley 1997; Quillian and Pager 2001; Mendelberg 2001) and research
on media coverage of crime suggests the disproportionate use of images of African American
offenders (Entman and Rojacki 2000). Evidence for the use of implicit racial appeals can also be
found in some of the rhetoric in recent debates. Consider, for example, the 2001 legislative debate
in South Carolina over a bill to disfranchise all felons for fifteen years beyond their sentence (an
expansion beyond the current law which restores voting rights upon completion of sentence).
After one representative opposing the bill introduced an African American ex-felon, one of the
bill’s sponsors, John Graham Altman, distributed an old newspaper article that detailed the
11
man’s crime, entitled “Democratic poster boy for murderers’ right to vote” (Wise 2001a).
Nevertheless, Altman denied the bill was racially motivated, declaring “if it’s blacks losing the
right to vote, then they have to quit committing crimes” (Wise 2001b). Use of states’ rights
rhetoric – long associated with implicit racial appeals (Mendelberg 2001) – can also be found in
some of the positions taken by conservatives in the U.S. Senate debate. Sen. Jeff Sessions (R-
AL) argued, for example, that “I think this Congress, with this little debate we are having on this
bill, ought not to step in and, with a big sledge hammer, smash something we have had from the
beginning of this country’s foundation – a set of election law in every State in America …To just
up and do that is disrespectful to them” (U.S. Congress 2002, p. S803).
Opponents of restrictions on the voting rights of felons and ex-felons have raised several
objections to these laws. On the whole, opponents argue, democratic governance in the modern
world entails universal suffrage for all citizens; indeed, although a fairly recent invention in the
long sweep of human history (Markoff 1996; Dahl 1998, pp. 86ff.), universal suffrage has
become such a taken-for-granted aspect of democracy that its foundational importance is rarely
the subject of debate. Deviations from the norm of universal suffrage are said to require special
and careful scrutiny, and should only be permitted in very unusual cases. Non-citizens are
generally prevented from voting, at least in national elections, around the world (Honig 2001).
Among adult citizens, however, criminals are among the few categories of persons denied voting
rights (and, as noted above, only in the United States are non-incarcerated criminals denied voting
rights). Other barriers to universal suffrage include restrictions on individuals mentally incapable
12
of voting, such as institutionalized individuals, and the absence of adequate facilities to permit
disabled persons to vote (see authors 2001).
In the specific case of non-incarcerated felons on probation and parole or ex-felons, where
the U.S. is far outside the international norm, scholars have raised questions about the basic
fairness of disfranchisement laws and their implications for the reintegration of felons back into
society. The fairness point concerns the obligation and duties of citizenship, all of which apply
in equal (or perhaps greater) measure to probationers, parolees, and ex-felons. These individuals
are expected to respect the law (and indeed, are often subject to significantly harsher penalties,
and indeed face a higher level of scrutiny, than non-felons). They are expected to pay taxes to the
government, and to be governed by elected officials. Yet they have no formal right to participate
in the selection of those officials or the public policies that allocate governmental expenditures.
The reintegration argument for re-enfranchising felons comes at the point from a quite
different angle. A record 606,000 people were released from prison in 2000, and prisoner reentry
has emerged as a central concern for research and policy on crime (Petersilia 1999; Travis et al.
2001; Visher and Travis 2003; U.S.D.O.J. 2002d:7). Facing important disadvantages in the labor
market (Pager 2002; Western 2002) and a variety of restrictions on their ability to obtain housing,
receive government benefits, and enjoy other civil rights (Samuels et al. 2002), it is perhaps not
surprising that about two-thirds of released prisoners will be rearrested within three years
(U.S.D.O.J. 2002e). Research on the factors promoting desistance from crime has shown it to be
closely linked to successful transition to work (Sampson and Laub 1993; Uggen 2000), family
(Laub et al. 1998), and community (Maruna 2001) roles. In a recent review of research on
13
transitions from prison, Visher and Travis (2003:27) suggest a plausible connection between
voting rights and successful reintegration, identifying factors such as joining a community
organization and becoming politically active as potential milestones in the reintegration process.
Denying voting rights to ex-felons, or felons living in their communities on probation and parole,
undermines their capacity to connect with the political system and may thereby increase their
risk of recidivism.
What About the Mass Public?
The liberal and conservative arguments summarized above have been advanced by
political elites in various arenas: politicians and political activists in the legislative debates, and
policy intellectuals and legal and political theorists in scholarly journals and in the media. But the
issue has not, heretofore, been investigated with reference to the attitudes of the mass public. We
know that high levels of public support for conservative crime policies, though highly variable
and responsive to elite appeals, have been sustained over a long historical period (Roberts and
Stalans 2000). But opinion research also simultaneously presents evidence of dramatic growth in
mass support for civil rights and civil liberties during the past four decades (e.g. Davis 1975;
Nunn et al. 1978; Smith 1990; Wilson 1994; Brooks 2000). Absent further evidence, there are
thus initial grounds for anticipating support for felon enfranchisement as well as for
14
disfranchisement. The current study presents the first national-level data with which to better
understand American public opinion on issues of voting rights for criminal offenders.
DATA AND MEASURES
Data
In July 2002, as part of its regular monthly telephone survey, Harris Interactive asked a
nationally representative sample of 1000 adults 18 years of age or older a battery of questions
that we designed regarding attitudes towards crime, punishment, and the civil liberties of
criminals and ex-offenders. The telephone numbers were generated using a random-digit-dial
(RDD) selection procedure to maximize the representation of persons in households within the
48 continental United States and the District of Columbia. The national sample was stratified by
geographic region and by metropolitan versus non-metropolitan residence; first states, then
counties, then minor civil divisions were selected, with probability of selection proportionate to
the U.S. Census Bureau estimates of the population.
A telephone number was dialed at least four times before a new telephone number was
generated for that area, and once a residential contact was established, the interviewer used the
“youngest adult male/oldest adult female” procedure for selecting a respondent in the household
for the interview. Generally at least one additional call-back was made to convert refusals into
completed interviews, and the interviews were conducted using a computer assisted telephone
interviewing (CATI) system. For the July survey, the response rate (calculated as one minus the
total number of refusals divided by the total number of contacts) was 39%.
15
Measures
Our measurement of attitudes toward felon enfranchisement takes into account two
sources of complexity: the various statuses of convicted criminals as prisoners, probationers,
parolees, or ex-felons; and also variability in the crime committed by an individual. We seek to
measure the effects of this variation on public attitudes through a series of question-wording
experiments. These experiments enable us to analyze whether the varying references to target
groups and other framing processes used by competing elites or other opinion leaders affect
public opinion concerning enfranchisement (Kinder and Sanders 1996; Kinder 1998; cf. Gamson
1992).
With regard to criminal status, we fielded four parallel survey items that employ similar
question-wording but vary the target group in question. As summarized in table 2, these items
ask respondents their level of support for enfranchisement for probationers, parolees, and
prisoners. The two items that refer to probationers differ in two ways: whether they specify that
probationers have not been imprisoned (Probation2) versus whether the wording does not make
this explicit (Probationer1); and whether they enable respondents to endorse a “haven't thought
much about this” response (Probationer1) or not (Probationer2).2 The second and fourth items
use the same wording as the Probationer2 item, while referring respectively to parolees and
prisoners. The assignment of these items to survey respondents reflects a randomized design in
2 The inclusion of the “haven’t thought much” response appears to result in a somewhat lower proportion ofrespondents not selecting the primary “yes” or “no” response categories: for the Probationer1 item 15% choose the“haven’t thought much” response (with 1% volunteering “not sure/don’t know”), while only 8% of those asked theProbationer2 item volunteered “not sure/don’t know.” The corresponding figure for the parolee and prisoner items
16
which approximately one-quarter of the total sample was asked a given item. This randomization
facilitates comparisons by ensuring that any observed differences in measured opinion are a
product of the variable target group references reflected in the question wording.
[TABLE 2 ABOUT HERE]
The second set of dependent variables consists of four items that all refer to individuals
convicted of a crime who have completed their entire sentence (ex-felons). These items were
asked of respondents immediately following the first set, and as before, assignment of items
reflects a full randomization (rather than a split-quarter design in which the same one-fourth of
respondents received a specific pair of first and second-stage questions). Whereas the Generic
Ex-Felon item makes no specific references to the crime committed, the White-Collar Ex-Felon
item specifies the “illegal trading of stocks,” the Violent Crime Ex-Felon item refers to a “violent
crime,” and the Sex Crime Ex-Felon item refers to “people convicted of a sex offense.” This
variability in reference to specific crimes enables us to evaluate whether Americans exhibit greater
support for felon enfranchisement in the abstract (Generic Ex-Felon), and, if so, whether support
is also lower for violent criminals or those convicted of a sex crime in comparison to white-collar
felons.
Our two independent variables of primary interest measure attitudes toward the criminal
justice system and toward general support for civil liberties. Depending upon how individuals
view the proper goals of incarceration, such attitudes may subsequently affect their willingness
to extend voting rights to those convicted of a crime. We measure these attitudes using a question
are 7% and 8% respectively.
17
about whether rehabilitation, punishment, or deterrence from committing future crimes represent
the proper purpose of prison.
Our Generic Civil Liberties measure is one of the items fielded initially by Stouffer (1963
[1955]), and subsequently incorporated into the repeated General Social Surveys. This item was
asked of all survey respondents, and we consider it to measure “generic” or abstract civil liberties
insofar as its reference to speech by “somebody who is against all churches and religion” involves
a different target group than criminals.
The next three involve more specific references to either the target group or content of
speech involved in the expression of civil liberties. The Ex-Felon Civil Liberties item refers to
someone whose prison sentence has been completed (without specifying the content of their
speech). The Ex-Felon/Legalization Activist item refers to someone who has completed a sentence
for drug dealing, further specifying “legalizing drugs” as the content of the speech in question.
The Legalization Activist item also refers to a speech in favor of legalizing drugs, but makes no
reference to the status of the speaker as an ex-felon who had previously been convicted of selling
drugs. These three items were randomly assigned to one-third of the sample, and they enable us
to observe differences in respondents’ level of support for civil liberties across the four sets of
conditions specified.
The remaining variables in the analysis are statistical controls. We measure race using two
dichotomous variables for African Americans and other minorities (non-minority status is the
reference). Dummy variables for city and suburban residence provide contrasts with the reference
category (small town/rural residence). Geographical region is measured using three dichotomous
18
variables for Northeast, South, and West (with Midwest as the reference). Gender is a dichotomy
(female = 1), and age and education are measured in years. We control for individuals’ general
ideological orientations using a five-point scale whose categories range from strongly conservative
(1) to strongly liberal (5).
RESULTS
Do Americans support the enfranchisement of voters convicted of a crime, and does the level of
public support vary depending upon the level of supervision or the specific nature of the crime?
We begin our examination of these questions with the data presented in Table 3 below. Entries in
this table are sample proportions (standard deviations in parentheses) for the first set of four
enfranchisement items. As discussed earlier, assignment of items to survey respondents is
randomized, and question wording varies primarily by the reference of items to Probationers
(Probationers1 leaves implicit non-prison status while Probationers2 makes this status explicit),
Parolees, and Prisoners.
[TABLE 3 ABOUT HERE]
Given that these items are dichotomies with “1” reflecting support for enfranchisement
(and “0” no support), sample proportions for the first three items indicate majority support for
allowing probationers and parolees the right to vote. Differences in question wording for the two
19
probationer items initially suggest divergent levels of support, with the explicit clarification that
probationers are not imprisoned yielding 68% support (vs. 60% for the alternative probationer
item). However, the 8% difference is not statistically significant (as is the 8% difference between
the probationer vs. parolee items).3 The final item in Table 3, however, reveals very different
attitudes toward prisoners, with only 31% of respondents supporting their enfranchisement.
This suggests that while Americans may not penalize parolees for having served prison time once
they are released from prison, they remain unwilling to extend voting rights to currently
incarcerated offenders. Consistent with the policy approaches adopted by other countries that
disfranchise criminals, Americans appear to draw a similar distinction between imprisoned
offenders versus those who are living in the community (regardless of whether the latter have
completed their sentence).
We also consider a second source of potentially significant variability in public opinion:
the specific type of criminal offense involved. In Table 4, we present estimates of the level of
public support for ex-felon voting rights, exploiting the experimental design to compare across
sub-samples that received one of the following four items: “generic” ex-felon (no reference to the
specific crime), white-collar ex-felon (convicted of “illegal trading of stocks”), violent offender,
and an ex-felon convicted of a sex crime.4
3 The t-score for comparing these two proportions is -1.35, under the critical 1.96 value for rejecting the nullhypothesis (α.05, 2-tailed test).
4 We emphasize that these four items all refer to ex-felons (i.e. individuals who have served their entire prisonsentence); the earlier results suggest low levels of public support for currently-incarcerated individuals, and thissecond set of items thus enables us to probe further how variability in the details of ex-felons’ criminal convictionsaffect individual attitudes.
20
[TABLE 4 ABOUT HERE]
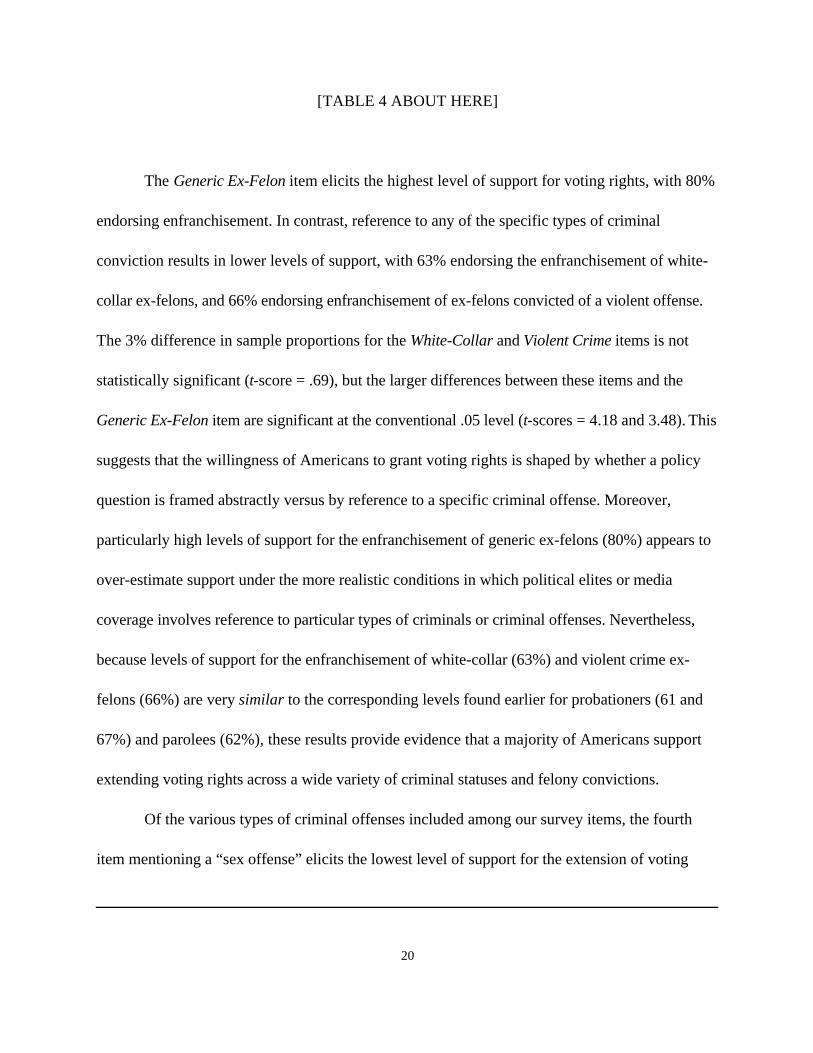
The Generic Ex-Felon item elicits the highest level of support for voting rights, with 80%
endorsing enfranchisement. In contrast, reference to any of the specific types of criminal
conviction results in lower levels of support, with 63% endorsing the enfranchisement of white-
collar ex-felons, and 66% endorsing enfranchisement of ex-felons convicted of a violent offense.
The 3% difference in sample proportions for the White-Collar and Violent Crime items is not
statistically significant (t-score = .69), but the larger differences between these items and the
Generic Ex-Felon item are significant at the conventional .05 level (t-scores = 4.18 and 3.48). This
suggests that the willingness of Americans to grant voting rights is shaped by whether a policy
question is framed abstractly versus by reference to a specific criminal offense. Moreover,
particularly high levels of support for the enfranchisement of generic ex-felons (80%) appears to
over-estimate support under the more realistic conditions in which political elites or media
coverage involves reference to particular types of criminals or criminal offenses. Nevertheless,
because levels of support for the enfranchisement of white-collar (63%) and violent crime ex-
felons (66%) are very similar to the corresponding levels found earlier for probationers (61 and
67%) and parolees (62%), these results provide evidence that a majority of Americans support
extending voting rights across a wide variety of criminal statuses and felony convictions.
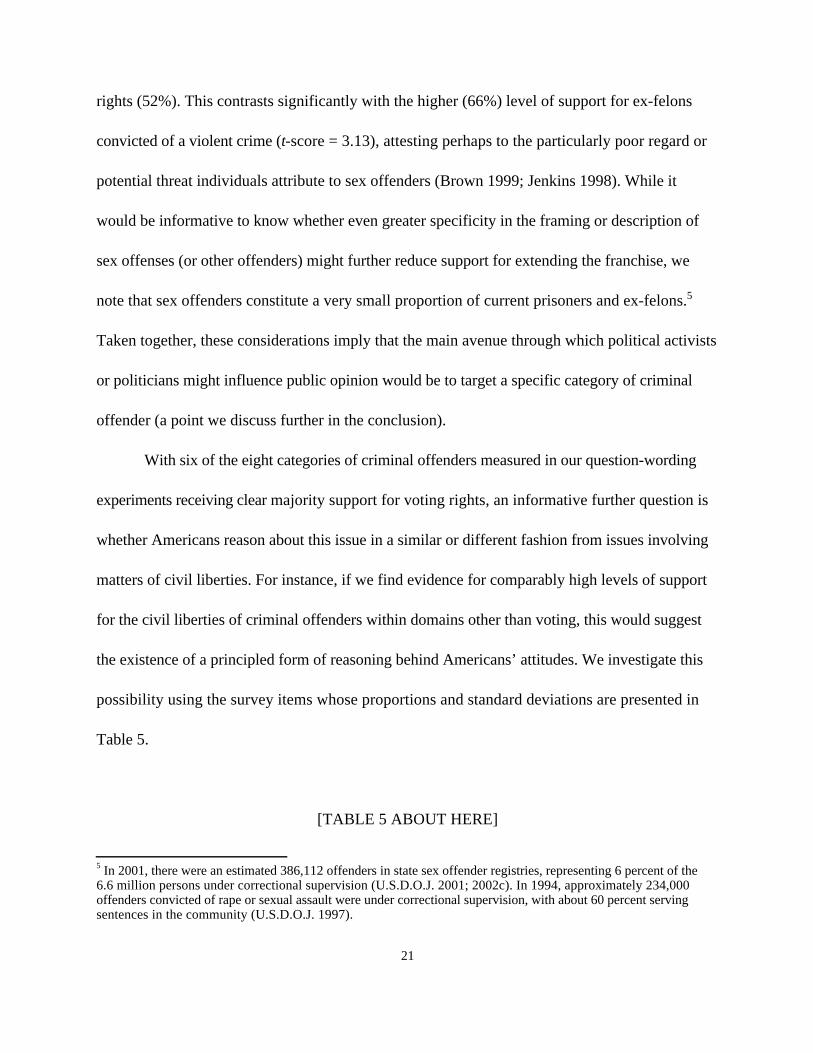
Of the various types of criminal offenses included among our survey items, the fourth
item mentioning a “sex offense” elicits the lowest level of support for the extension of voting
21
rights (52%). This contrasts significantly with the higher (66%) level of support for ex-felons
convicted of a violent crime (t-score = 3.13), attesting perhaps to the particularly poor regard or
potential threat individuals attribute to sex offenders (Brown 1999; Jenkins 1998). While it
would be informative to know whether even greater specificity in the framing or description of
sex offenses (or other offenders) might further reduce support for extending the franchise, we
note that sex offenders constitute a very small proportion of current prisoners and ex-felons.5
Taken together, these considerations imply that the main avenue through which political activists
or politicians might influence public opinion would be to target a specific category of criminal
offender (a point we discuss further in the conclusion).
With six of the eight categories of criminal offenders measured in our question-wording
experiments receiving clear majority support for voting rights, an informative further question is
whether Americans reason about this issue in a similar or different fashion from issues involving
matters of civil liberties. For instance, if we find evidence for comparably high levels of support
for the civil liberties of criminal offenders within domains other than voting, this would suggest
the existence of a principled form of reasoning behind Americans’ attitudes. We investigate this
possibility using the survey items whose proportions and standard deviations are presented in
Table 5.
[TABLE 5 ABOUT HERE]
5 In 2001, there were an estimated 386,112 offenders in state sex offender registries, representing 6 percent of the6.6 million persons under correctional supervision (U.S.D.O.J. 2001; 2002c). In 1994, approximately 234,000offenders convicted of rape or sexual assault were under correctional supervision, with about 60 percent servingsentences in the community (U.S.D.O.J. 1997).
22
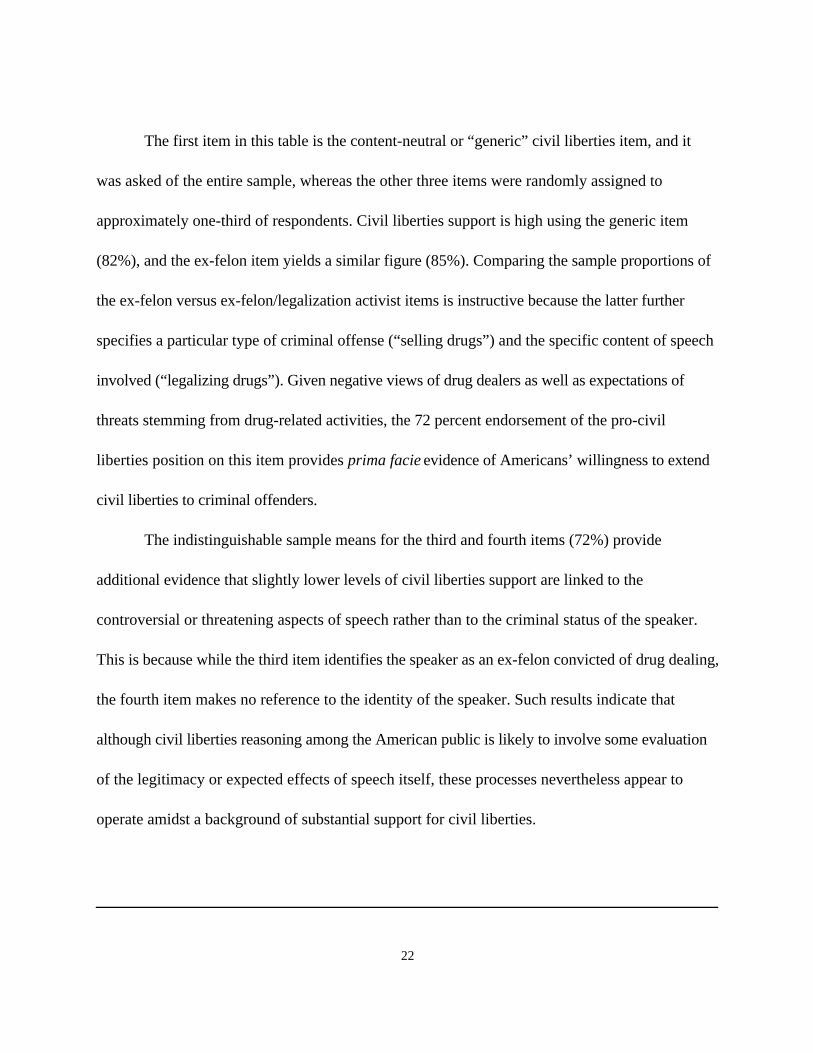
The first item in this table is the content-neutral or “generic” civil liberties item, and it
was asked of the entire sample, whereas the other three items were randomly assigned to
approximately one-third of respondents. Civil liberties support is high using the generic item
(82%), and the ex-felon item yields a similar figure (85%). Comparing the sample proportions of
the ex-felon versus ex-felon/legalization activist items is instructive because the latter further
specifies a particular type of criminal offense (“selling drugs”) and the specific content of speech
involved (“legalizing drugs”). Given negative views of drug dealers as well as expectations of
threats stemming from drug-related activities, the 72 percent endorsement of the pro-civil
liberties position on this item provides prima facie evidence of Americans’ willingness to extend
civil liberties to criminal offenders.
The indistinguishable sample means for the third and fourth items (72%) provide
additional evidence that slightly lower levels of civil liberties support are linked to the
controversial or threatening aspects of speech rather than to the criminal status of the speaker.
This is because while the third item identifies the speaker as an ex-felon convicted of drug dealing,
the fourth item makes no reference to the identity of the speaker. Such results indicate that
although civil liberties reasoning among the American public is likely to involve some evaluation
of the legitimacy or expected effects of speech itself, these processes nevertheless appear to
operate amidst a background of substantial support for civil liberties.
23
Multivariate Results
We conclude our analysis by investigating causal factors affecting the level of public support for
voting rights among various types of criminal offenders. For these analyses, we treat the eight
voting rights items as dependent variables, using a logistic specification for the analysis.6 The
bulk of our covariates represent such control variables as gender, race, and region. Our primary
interest focuses on coefficient estimates for two specific factors: attitudes toward the goals of
criminal justice; and civil liberties attitudes (measured using the generic civil liberties item7).
[TABLE 6 ABOUT HERE]
The coefficient estimates for our first set of dependent variables provide evidence that attitudes
toward criminal justice are consistently the strongest source of voting rights attitudes. In all four
models, the coefficient for the contrast of respondents endorsing punishment versus
rehabilitation as the proper goal of incarceration is large and statistically significant. For instance,
endorsing punishment over rehabilitation lowers by 1.01 the log-odds of support for extending
voting rights to prisoners. This represents a very large effect, translating into a predicted .23
6 By virtue of the randomized assignment of the two sets of four items to survey respondents, responses to the eightitems cannot be summed into a single scale; we thus analyze responses as separate dependent variables.
7 Because of its content neutrality with respect to criminal offenders (as well as its availability throughout the entiresample), we treat the generic civil liberties item as our indicator of civil rights support in the regression analyses.Further analysis (available upon request) using the three alternative civil liberties items from Table 5 yield resultsthat are consistent with those presented below.
24
decrease in the probability of extending voting rights (assuming for purposes of calculation a
baseline probability of .50).
Coefficient estimates for the effect of civil liberties are positively-signed in three of the
four models, indicating that higher civil liberties support is associated with support for
enfranchising criminal offenders (the fourth item that refers to prisoners has a negatively-signed
coefficient). However, only one coefficient is statistically significant (for the parolee item) at the
conventional .05 level. In general, the relatively small sample size resulting from the experimental
design yields large standard errors, and when combined with the limitations of using a single
indicator for a complicated latent variable (or variables), it is appropriate to exercise some caution
in inferring that non-significant coefficients provide conclusive evidence against the existence of
real effects. For example, despite much stronger African American support relative to non-
minorities for the first probation item, we cannot detect statistically significant race differences
because very few African Americans were in the sample.8
With this caveat in mind, we note that the remaining coefficient estimates rarely attain
statistical significance, providing no evidence for strong group-based or demographic sources of
attitudes toward voting rights for criminal offenders. Race and education each significantly affect
attitudes in two of the four cases, with African Americans being more supportive of voting rights
for criminal offenders in comparison to non-minorities and higher levels of education disposing
individuals toward lower levels of support. The result for race is consistent with the assumption
that the disproportionate risk of imprisonment and conviction among African Americans leads to
25
a greater willingness to support the rights of criminal offenders. However, the negative sign of the
two education coefficients is perhaps surprising given the well-known status of education as a
source of support for civil rights and liberties (see e.g. Sniderman, Brody, and Tetlock 1991;
Schuman, Steeh, Bobo, and Krysan 1997). Given that bivariate estimates of the interrelationship
of education with the probationer2 and prisoner items are also negatively signed (-.14 and -.18), it
is possible that our measure is also picking up status or class-related processes. Socially or
economically advantaged individuals (in comparison to others) may be disposed to endorse lower
levels of voting rights support among criminals because of an underlying perception of their
potential threat to existing policies or to the status quo.
Coefficient estimates for the logistic regression models of attitudes toward voting rights
for the second set of criminal offender items are presented in Table 7. Attitudes toward criminal
justice have a sizable effect on voting rights support in two cases. Predicted effects of civil
liberties attitudes are in the expected direction, with the coefficient estimates attaining statistical
significance only for the Generic ex-felon item. Education has a significant impact only on
responses for the sex crime item, and while African Americans are predicted as being more
supportive of enfranchising ex-felons than non-minorities, the relevant coefficient is significant in
only one of the four models.
[TABLE 7 ABOUT HERE]
8 Note that the particularly large coefficient and standard error for African Americans on the probationer2 item (7.20
26
DISCUSSION
Our assessment of public attitudes regarding the current practice of felon disfranchisement in the
United States leads to novel conclusions. Stripping citizens who receive a felony conviction of
the right to vote is likely to be viewed by many as a harsh penalty in a democratic society
characterized by universal suffrage. Indeed, taking away the right to vote for life is analogous,
some commentators have suggested (Ewald 2002), to the medieval practice of “civil death,”
where severe violations of the social contract led to complete loss of citizenship rights. In sharp
contrast, modern conceptions of civil liberties suggest a strong normative basis for protecting the
right to vote for all citizens, except in extreme cases.
However, before the new data reported in this study, both a “civil death” and a “civil
rights” view could be thought to have support among the mass public. Approval of harsh
criminal justice penalties, and opposition to the perceived coddling of criminals, could suggest
support for a temporary or even more extreme version of the civil death scenario as a penalty to
be imposed on offenders. Alternatively, growing support for civil liberties might lead us to
anticipate a broad willingness to allow criminals the right to vote. Contemporary conflicts over
voting rights among criminal offenders thus raise a fundamental question about the extent to
which citizens prioritize an expansive view of civil liberties and political rights versus a desire to
impose harsh penalties and constitutional restrictions on criminals.
and 15.60) is a product of all black respondents endorsing enfranchisement. Dropping the dummy variable forAfrican Americans from the model yields nearly identical results for all other estimates.
27
This paper has presented the first systematic survey data bearing directly on these issues.
Our main findings suggest that the civil liberties view trumps support for civil death with regard
to the political rights of criminal offenders. For all categories of felons who are not currently in
prison, relatively large majorities (between 80% in the case of generic ex-felons and 52% in the
case of former sex offenders) favor enfranchisement. We also find evidence that between 60 and
68% of the public believes that felony probationers, who make up a full quarter of the
disfranchised felon population, should have their voting rights restored, while 60% support
voting rights for felony parolees (who have been released from prison), and 66% support voting
rights for even ex-felons convicted of a violent crime who have served their entire sentence. The
latter is particularly relevant to recent policy debates, suggesting that conservative arguments that
violent offenders should lose all rights find little endorsement among the American public.
The principled willingness of Americans to support the enfranchisement of ex-felons
gains further support from our analysis of civil liberties attitudes. While it is well known that
Americans have become, over time, more willing to enable the civil liberties of such generally
disliked groups as Communists and atheists. Nevertheless, towards criminal offenders have been
up to this point unclear. We find that support for freedom of speech for ex-felons (as a core
dimension of civil liberties) is supported at comparably high (85%) levels to those found for the
well-known atheist speech item (82%). Our results suggest that generally negative attitudes
toward criminal offenders do not preclude a relatively strong disposition to extend civil liberties
such as the freedom of speech.
28
Our question-wording experiments do suggest some limiting conditions on public
willingness to extend voting rights. That only 52% of the public supports such rights for ex-
felons convicted of a sex offense is notable in comparison to higher figures for other offenses, and
less than a third support the enfranchisement of current prisoners. Although sex offenders
comprise a small proportion of ex-felons, it appears that support for “civil death” is significantly
higher with regard to this group.
When, how, and to what extent policy change is informed by public opinion is a widely
debated question among scholars (cf. Jacobs and Shapiro 2000; Manza, Cook, and Page 2002;
Erikson, MacKuen and Stimson 2002, chaps. 8-9). Public opinion can of course only influence
policy debates when it is knowable; on most issues before Congress, for example, little or no
survey data about public preferences exist (Burstein, Bauldry, and Forese 2001). In the case of
felon disfranchisement, the results presented here suggest an important degree of coherence and
appear to be particularly timely with respect to the formation of future policies regarding the
franchise. In the clash between two competing imperatives – a desire to punish and deter crime
versus a desire to promote and protect the civil liberties of even unpopular groups – we find
evidence that the latter has greater public support.
29
REFERENCES
Broder, David. 2000. Democracy Derailed: Initiative Campaigns and the Power of Money. New
York: Harcourt.
Brooks, Clem. 2000. “Civil Rights Liberalism and the Suppression of a Republican Political
Realignment in the U.S., 1972-1996.” American Sociological Review 65: 482-505.
Brown, Sarah J. 1999. “Public Attitudes Towards the Treatment of Sex Offenders” Legal and
Criminological Psychology 4: 239-52.
Burstein, Paul, Shawn Bauldry, and P. Forese. 2001. “Public Opinion and Congressional Support
for Policy Change.” Paper presented at the Annual Meeting of the American Political
Science Association, San Francisco, September.
Bush, Jeb. 2001. “Comment.” Sarasota Herald-Tribune Newscoast. January 11. Retrieved
January 19 (www.newscoast.com/headlinesstory2.cfm?ID=38399).
Clegg, Roger. 1999. Prepared Remarks. Civic Participation and Rehabilitation Act of 1999:
Hearing Before the Subcommittee on the Constitution, House Committee on the Judiciary,
October 21, pp. 16-19. Washington: Government Printing Office.
Conway, M. Margaret. 2000. Political Participation in the United States. 3rd ed. Washington
D.C.: Congressional Quarterly Press.
Dahl, Robert A. 1998. On Democracy. New Haven: Yale University Press.
Davis, James. 1975. “Communism, Conformity, Cohorts, and Categories: American Tolerance in
1954 and 1972-1973.” American Journal of Sociology 81:491-513.
30
Demleitner, Nora V. 2000. “Continuing Payment on One’s Debt to Society: The German Model
of Felon Disfranchisement as an Alternative.” Minnesota Law Review 84:753-804.
Domhoff, G. William. 2001. Who Rules America? 4th Ed. Boston: McGraw Hill.
Erikson, Robert S., Michael B. MacKuen, and James A. Stimson. 2002. The Macro Polity. New
York: Cambridge University Press.
Ewald, Alec C. 2002. “The Ideological Paradox of Criminal Disenfranchisement Law in the
United States.” Department of Political Science, University of Massachusetts, Amherst,
MA. Unpublished Manuscript.
Gamson, William. 1992. Talking Politics. New York: Cambridge University Press.
Graziano, Todd. 1999. Prepared Remarks. Civic Participation and Rehabilitation Act of 1999:
Hearings Before the Subcommittee on the Constitution, House Committee of the Judiciary,
October 21, pp. 43-47. Washington, D.C.: Government Printing Office.
Hetherington, Marc J. 1998. “The Political Relevance of Political Trust.” American Political
Science Review 92:791-808.
Honig, Bonnie. 2001. Democracy and the Foreigner. Princeton, NJ: Princeton University Press.
Huntington, Samuel P. 1981. American Politics : The Promise of Disharmony. Cambridge:
Belknap Press.
Hurwitz, Jon, and Mark Peffley. 1997. “Public Perceptions of Race and Crime: The Role of
Racial Stereotypes.” American Journal of Politics 41:375-401.
31
Issacharoff, Samuel, Pamela S. Karlan, and Richard H. Pildes. 1998. The Law of Democracy:
Legal Structure of the Political Process. Westbury, NY: The Foundation Press.
Jacobs, Lawrence R. and Robert Y. Shapiro. 2000. Politicians Don’t Pander: Political
Manipulation and the Loss of Democratic Responsiveness. Chicago: University of
Chicago Press.
Jenkins, Philip. 1998. Moral Panic: Changing Concepts of the Child Molester in Modern
America. New Haven, CT: Yale University Press
Jennings, Kent M. 1998. “Political Trust and the Roots of Devolution.” Pp. 218-244 in Trust
and Government, edited by V. Braithwaite and M. Levi. New York: Russell Sage
Foundation.
Keyssar, Alexander. 2000. The Right to Vote: The Contested History of Democracy in the United
States. New York: Basic Books
Kinder, Donald. 1998. “Communication and Opinion.” Annual Review of Political Science 1:167-
187.
Kinder, Donald and Lynn Sanders. 1996. Divided By Color. Chicago: University of Chicago
Press.
Kousser, J. Morgan. 1999. Colorblind Injustice: Minority Voting Rights and the Undoing of the
Second Reconstruction. Chapel Hill: University of North Carolina Press.
Lawrence, Robert Z. 1997. “Is it Really the Economy, Stupid?” Pp. 111-132 in Why People
Don’t Trust Government, edited by J. S. Nye Jr., P. D. Zelikow, and D. C. King.
Cambridge: Harvard University Press.
32
Manza, Jeff, Fay Lomax Cook, and Benjamin Page (eds.). 2002. Navigating Public Opinion:
Polls, Policy, and the Future of American Democracy. New York: Oxford University
Press.
Markoff, John. 1996. Waves of Democracy. Thousand Oaks, CA: Pine Forge Press.
Maruna, Shadd. 2001. Making Good. How Ex-Convicts Reform and Rebuild Their Lives.
Washington, DC: American Psychological Association.
Mendelberg, Tali. 2001. The Race Card: Campaign Strategy, Implicit Messages, and the Norm of
Equality. Princeton, NJ: Princeton University Press.
McClosky, Herbert and John Zaller. 1984. The American Ethos : Public Attitudes Toward
Capitalism and Democracy. Cambridge: Harvard University Press.
National Commission on Federal Election Reform. 2001. To Assure Pride and Confidence in the
Electoral Process: Final Report. New York: The Century Foundation.
Nunn, Clyde., Harry Crockett, Jr., and Allen Williams, Jr. 1978. Tolerance For Nonconformity: A
National Survey of Americans’ Changing Commitment to Civil Liberties. San Francisco:
Jossey-Bass Publishers.
Nye, Joseph S., Philip D. Zelikow, and David C. King (eds.). 1997. Why People Don’t Trust
Government. Cambridge, MA: Harvard University Press.
Page, Benjamin and Robert Shapiro. 1992. The Rational Public: Fifty Years of Trends in
Americans’ Policy Preference. Chicago: University of Chicago Press.
Pager, Devah. 2002. “The Mark of a Criminal Record.” Paper presented at the annual meetings
off the Society for the Advancement of Socio-Economics. Minneapolis, June.
33
Perman, Michael. 2001. Struggle for Mastery: Disfranchisement in the South, 1888-1908. Chapel
Hill: University of North Carolina Press.
Petersilia, Joan. 1999. “Parole and Prisoner Reentry in the United States.” In Prisons, Crime and
Justice: A Review of Research, Vol. 26. Chicago: University of Chicago Press.
Piven, Frances F., and Richard A. Cloward. 2000. Why Americans Still Don’t Vote. New York:
The New Press.
Putnam, Robert. 2000. Bowling Alone. New York: Simon and Shuster.
Quillian, Lincoln and Devah Pager. 2001. “Black Neighbors, Higher Crime? The Role of Racial
Stereotypes in Evaluations of Neighborhood Crime.” American Journal of Sociology
107:717-67.
Roberts, Julian V. and Loretta J. Stalans. 2000. Public Opinion, Crime, and Criminal Justice.
Boulder, CO: Westview Press.
Rogers, Daniel W. (ed.). 1992. Voting and the Spirit of American Democracy: Essays on the
History of Voting and Voting Rights in America. Urbana, IL: University of Illinois Press.
Samuels P, D Mukamal, and T. Stevens. 2002. State Legal Barriers Affecting Individuals with
Criminal Records. Presented at the Reentry Roundtable: Prisoner Reentry and the
Institutions of Civil Society, March 20-21, Washington, DC.
Sampson, Robert, and John Laub. 1993. Crime in the Making: Pathways and Turning Points
Through Life. Cambridge: Harvard University Press.
Schiffman, Kendra. 2001. “State Felon Disfranchisement Laws, 1776-2000.” Unpublished
manuscript, Department of Sociology, Northwestern University.
34
Schuman, Howard, Charlotte Steeh, Lawrence Bobo, and Maria Krysan. 1997. Racial Attitudes in
America: Trends and Interpretations. Revised Ed. Cambridge, MA: Harvard University
Press.
Shklar, Judith N. 1991. American Citizenship: The Quest for Inclusion. Cambridge, MA: Harvard
University Press.
Smith, Tom W. 1990. “Liberal and Conservative Trends in the United States since World War
II.” Public Opinion Quarterly 54:479-507.
Sniderman, Paul. 1996. The Clash of Rights: Liberty, Equality, and Legitimacy in Pluralist
Democracy. New Haven: Yale University Press.
Sniderman, Paul, David Brody, and Philip Tetlock. 1991. Reasoning and Choice: Explorations in
Political Psychology. New York: Cambridge University Press.
Schuman, Howard, Charlotte Steeh, Lawrence Bobo, and Maria Krysan. 1997. Racial Attitudes In
America: Trends and Interpretations. Revised edition. Cambridge: Harvard University
Press.
Sullivan John L., James Piereson and George E. Marcus. 1982. Political Tolerance and American
Democracy. Chicago: University of Chicago Press.
Travis Jeremy, Amy L. Solomon, and Michelle M. Waul. 2001. From Prison to Home: The
Dimensions and Consequences of Prisoner Reentry. Washington, DC: Urban Institute
Press.
Verba, Sidney, Kay L. Scholzman, and Henry E. Brady. 1995. Voice and Equality: Civic
Voluntarism in American Politics. Cambridge, MA: Harvard University Press.
35
Uggen, Christopher. 2000. “Work as a Turning Point in the Life Course of Criminals: A Duration
Model of Age, Employment, and Recidivism.” American Sociological Review 65:529-46.
U.S. Congress. 2002. Congressional Record, Vol. 148. 107th Cong., 2nd Sess. Debate on Equal
Protection of Voting Rights Act of 2001, pp. S797-S809.
U.S. Department of Justice. 1973. Sourcebook of Criminal Justice Statistics. Washington, DC:
Government Printing Office.
------. 1995. The Nation's Two Crime Measures. Washington, DC: Government Printing Office.
------. 1997. Sex Offenses and Sex Offenders. Washington, D.C.: Government Printing Office.
------. 2001. Sourcebook of Criminal Justice Statistics. Washington, D.C.: Government Printing
Office.
------. 2002a. Criminal Victimization 2001: Changes 2000-2001 with Trends 1993-2001.
Washington, D.C.: Government Printing Office.
------. 2002b. Press Release: State Prison Population Drops in Second Half of 2001 Federal
Inmate Growth Continues. Washington, D.C.: Government Printing Office.
------. 2002c. Press Release: U.S. Correctional Population Reaches 6.6 Million. Washington,
D.C.: Government Printing Office.
------. 2002d. Prison and Jail Inmates at Midyear 2001. Washington, D.C.: Government Printing
Office.
------. 2002e. Recidivism of Prisoners Released in 1994. Washington, D.C.: Government Printing
Office.
36
U.S. Department of Justice. Federal Bureau of Investigation. 2001a. Crime in the United States --
2000. Washington, DC: Government Printing Office.
Visher, Christy A. and Jeremy Travis. 2003. “Transitions From Prison To Community:
Understanding Individual Pathways.” Forthcoming in Annual Review of Sociology.
Western, Bruce. 2002. “The Impact of Incarceration on Wage Mobility and Inequality.”
American Sociological Review 67:526-46.
Wiebe, Robert H. 1995. Self-Rule: A Cultural History of American Democracy. Chicago:
University of Chicago Press.
Wilson, Thomas C. 1994. “Trends in Tolerance Toward Rightist and Leftist Groups, 1976-1988:
Effects of Attitude Change and Cohort Succession.” Public Opinion Quarterly 58:539-
556.
Wise, Warren. 2001a. “House Doesn’t Kill Bill to Delay Felons Voting.” The Post and Courier.
February 16, p. A3.
------. 2001b. “Criminal Example Upsets Lawmakers.” The Post and Courier. February 15, p.
B1.
APPENDIX TABLE 1: State Bans on Voting by Category (as of 12/31/2001).State Prisoners Parolees Felony Probation Jail Inmates Ex FelonsAlabama X X X X XAlaska X X X XArizona X X X X Xa
Arkansas X X XCalifornia X X XColorado X X XConnecticut X X XDelaware X X X Xb
Dist. Col X XFlorida X X X X XGeorgia X X X XHawaii XIdaho X X X XIllinois X XIndiana X XIowa X X X X XKansas X X XKentucky X X X X XLouisiana X XMaineMaryland X X X X Xa
Massachusetts XMichigan X XMinnesota X X X XMississippi X X X X XMissouri X X X XMontana X XNebraska X X X XNevada X X X X XNew Hampshire X XNew Jersey X X X XNew Mexico X X X XNew York X X XNo. Carolina X X X XNorth Dakota X XOhio X XOklahoma X X X XOregon X XPennsylvania XRhode Island X X XSouth Carolina X X X XSouth Dakota X XTennessee X X X X Xc
Texas X X X XUtah X XVermontVirginia X X X X XWashington X X X X Xd
West Virginia X X X XWisconsin X X X XWyoming X X X X Xa Recidivists lose voting rights. b Five year waiting period. c Ex-felons convicted prior to 1986 are disfranchised. d
Ex-felons convicted prior to 1984 are disfranchised.
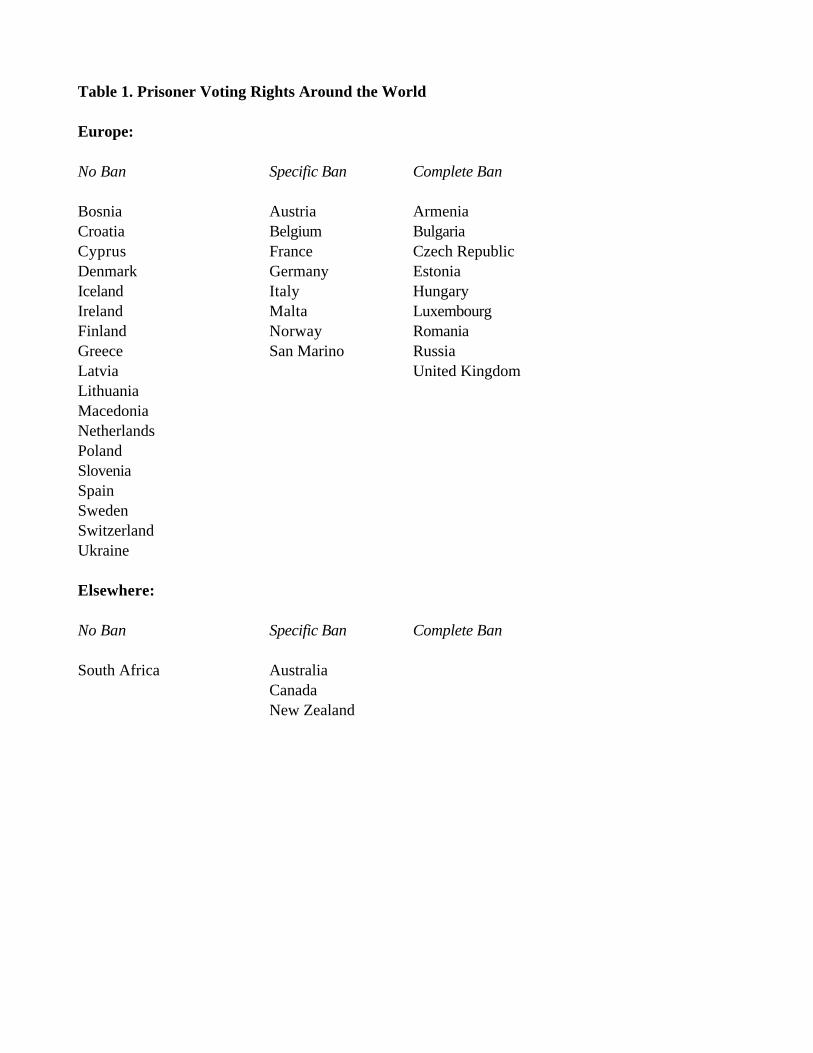
Table 1. Prisoner Voting Rights Around the World
Europe:
No Ban Specific Ban Complete Ban
Bosnia Austria ArmeniaCroatia Belgium BulgariaCyprus France Czech RepublicDenmark Germany EstoniaIceland Italy HungaryIreland Malta LuxembourgFinland Norway RomaniaGreece San Marino RussiaLatvia United KingdomLithuaniaMacedoniaNetherlandsPolandSloveniaSpainSwedenSwitzerlandUkraine
Elsewhere:
No Ban Specific Ban Complete Ban
South Africa AustraliaCanadaNew Zealand
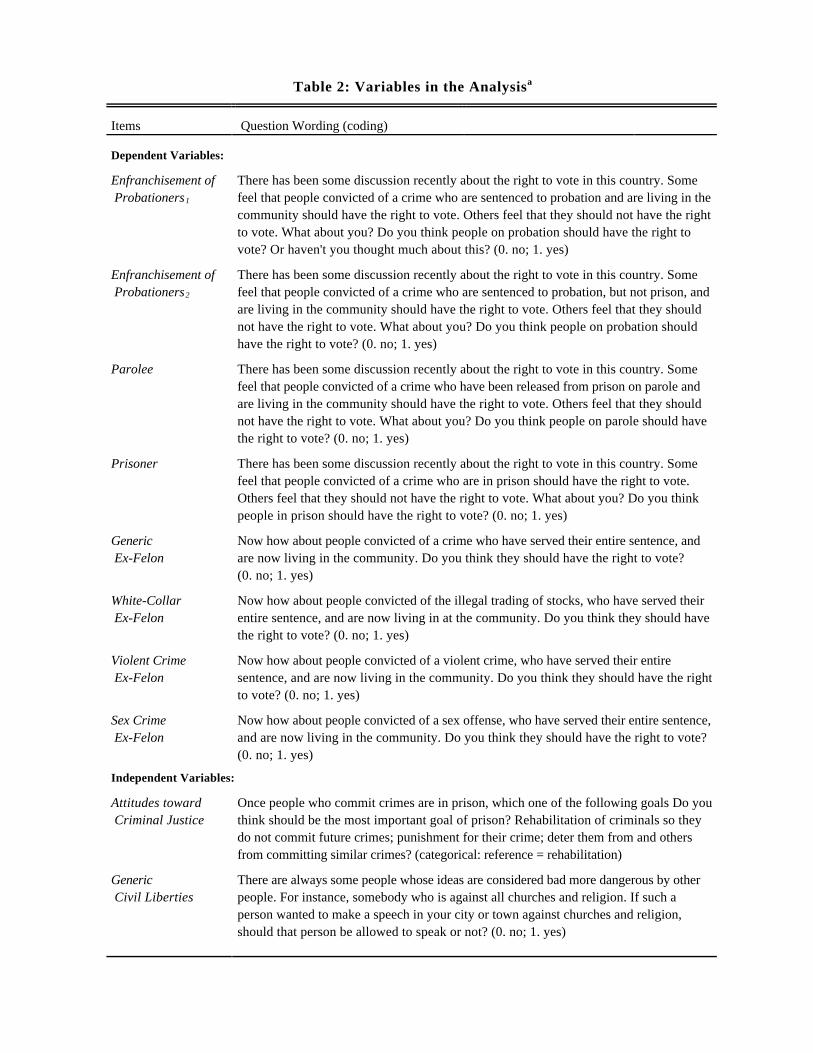
Table 2: Variables in the Analysisa
Items Question Wording (coding)
Dependent Variables:
Enfranchisement of Probationers1
There has been some discussion recently about the right to vote in this country. Somefeel that people convicted of a crime who are sentenced to probation and are living in thecommunity should have the right to vote. Others feel that they should not have the rightto vote. What about you? Do you think people on probation should have the right tovote? Or haven't you thought much about this? (0. no; 1. yes)
Enfranchisement of Probationers2
There has been some discussion recently about the right to vote in this country. Somefeel that people convicted of a crime who are sentenced to probation, but not prison, andare living in the community should have the right to vote. Others feel that they shouldnot have the right to vote. What about you? Do you think people on probation shouldhave the right to vote? (0. no; 1. yes)
Parolee There has been some discussion recently about the right to vote in this country. Somefeel that people convicted of a crime who have been released from prison on parole andare living in the community should have the right to vote. Others feel that they shouldnot have the right to vote. What about you? Do you think people on parole should havethe right to vote? (0. no; 1. yes)
Prisoner There has been some discussion recently about the right to vote in this country. Somefeel that people convicted of a crime who are in prison should have the right to vote.Others feel that they should not have the right to vote. What about you? Do you thinkpeople in prison should have the right to vote? (0. no; 1. yes)
Generic Ex-Felon
Now how about people convicted of a crime who have served their entire sentence, andare now living in the community. Do you think they should have the right to vote?(0. no; 1. yes)
White-Collar Ex-Felon
Now how about people convicted of the illegal trading of stocks, who have served theirentire sentence, and are now living in at the community. Do you think they should havethe right to vote? (0. no; 1. yes)
Violent Crime Ex-Felon
Now how about people convicted of a violent crime, who have served their entiresentence, and are now living in the community. Do you think they should have the rightto vote? (0. no; 1. yes)
Sex Crime Ex-Felon
Now how about people convicted of a sex offense, who have served their entire sentence,and are now living in the community. Do you think they should have the right to vote?(0. no; 1. yes)
Independent Variables:
Attitudes toward Criminal Justice
Once people who commit crimes are in prison, which one of the following goals Do youthink should be the most important goal of prison? Rehabilitation of criminals so theydo not commit future crimes; punishment for their crime; deter them from and othersfrom committing similar crimes? (categorical: reference = rehabilitation)
Generic Civil Liberties
There are always some people whose ideas are considered bad more dangerous by otherpeople. For instance, somebody who is against all churches and religion. If such aperson wanted to make a speech in your city or town against churches and religion,should that person be allowed to speak or not? (0. no; 1. yes)
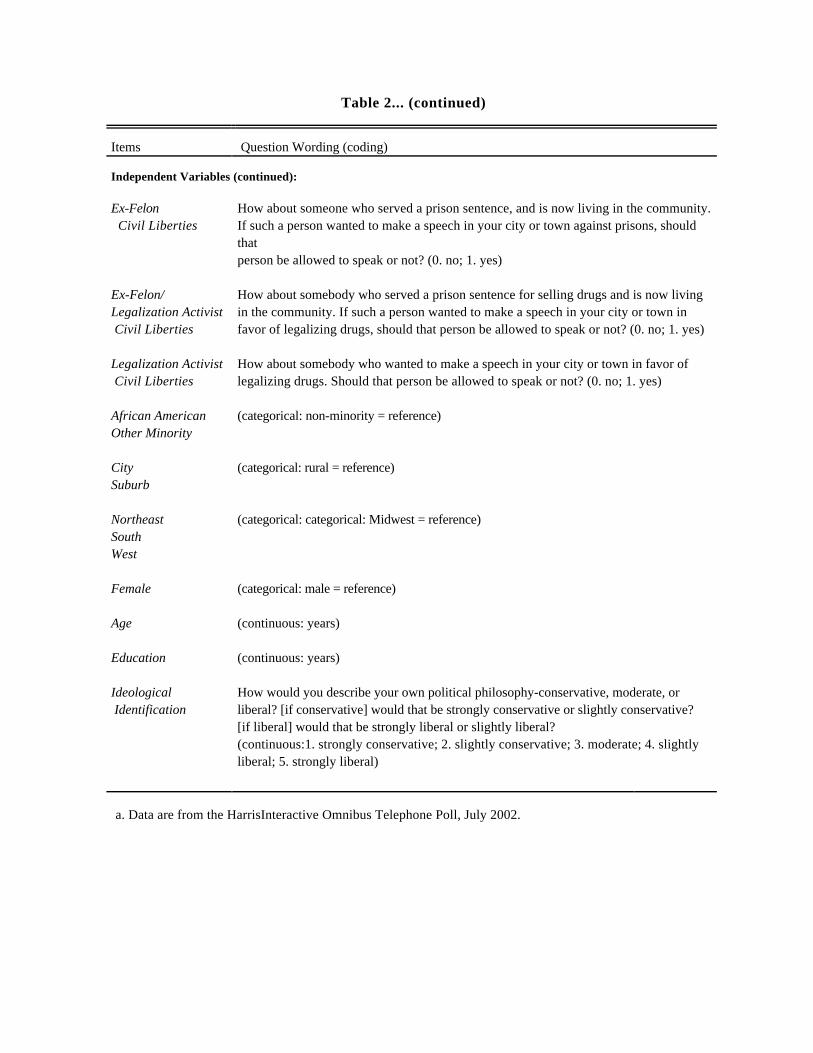
Table 2... (continued)
Items Question Wording (coding)
Independent Variables (continued):
Ex-Felon Civil Liberties
How about someone who served a prison sentence, and is now living in the community.If such a person wanted to make a speech in your city or town against prisons, shouldthatperson be allowed to speak or not? (0. no; 1. yes)
Ex-Felon/Legalization Activist Civil Liberties
How about somebody who served a prison sentence for selling drugs and is now livingin the community. If such a person wanted to make a speech in your city or town infavor of legalizing drugs, should that person be allowed to speak or not? (0. no; 1. yes)
Legalization Activist Civil Liberties
How about somebody who wanted to make a speech in your city or town in favor oflegalizing drugs. Should that person be allowed to speak or not? (0. no; 1. yes)
African AmericanOther Minority
(categorical: non-minority = reference)
CitySuburb
(categorical: rural = reference)
NortheastSouthWest
(categorical: categorical: Midwest = reference)
Female (categorical: male = reference)
Age (continuous: years)
Education (continuous: years)
Ideological Identification
How would you describe your own political philosophy-conservative, moderate, orliberal? [if conservative] would that be strongly conservative or slightly conservative?[if liberal] would that be strongly liberal or slightly liberal?(continuous:1. strongly conservative; 2. slightly conservative; 3. moderate; 4. slightlyliberal; 5. strongly liberal)
a. Data are from the HarrisInteractive Omnibus Telephone Poll, July 2002.
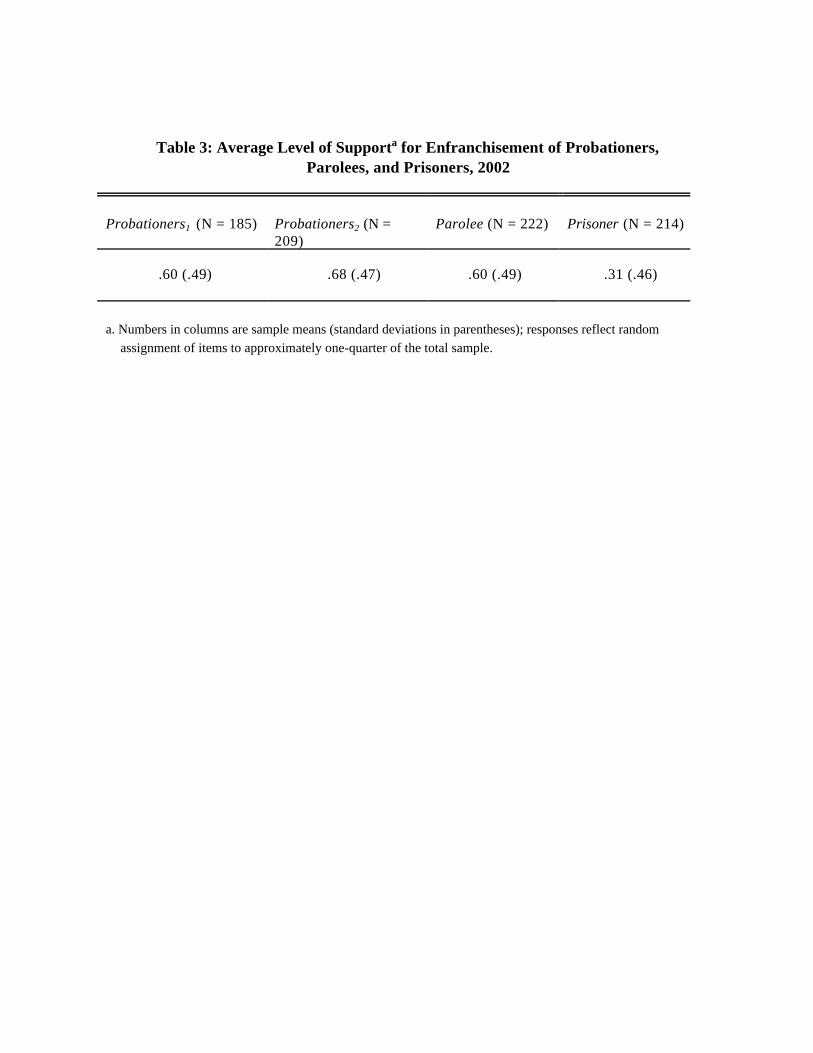
Table 3: Average Level of Supporta for Enfranchisement of Probationers,Parolees, and Prisoners, 2002
Probationers1 (N = 185) Probationers2 (N =209)
Parolee (N = 222) Prisoner (N = 214)
.60 (.49) .68 (.47) .60 (.49) .31 (.46)
a. Numbers in columns are sample means (standard deviations in parentheses); responses reflect random
assignment of items to approximately one-quarter of the total sample.
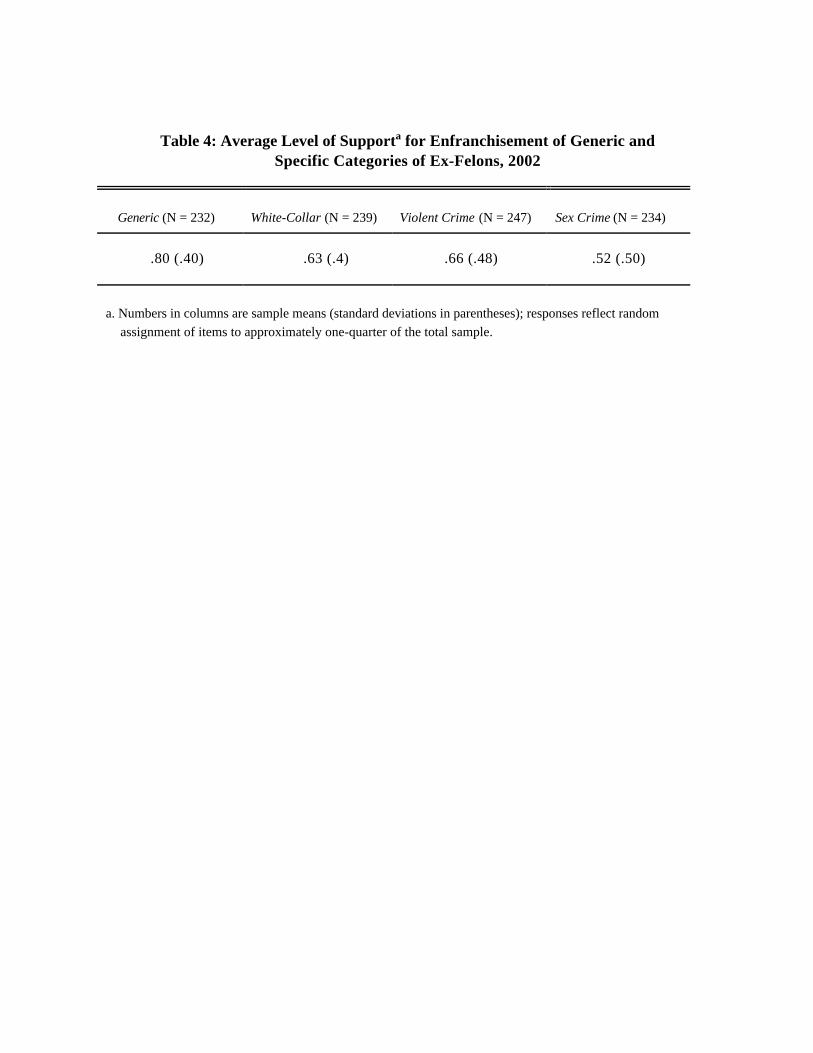
Table 4: Average Level of Supporta for Enfranchisement of Generic andSpecific Categories of Ex-Felons, 2002
Generic (N = 232) White-Collar (N = 239) Violent Crime (N = 247) Sex Crime (N = 234)
.80 (.40) .63 (.4) .66 (.48) .52 (.50)
a. Numbers in columns are sample means (standard deviations in parentheses); responses reflect random
assignment of items to approximately one-quarter of the total sample.
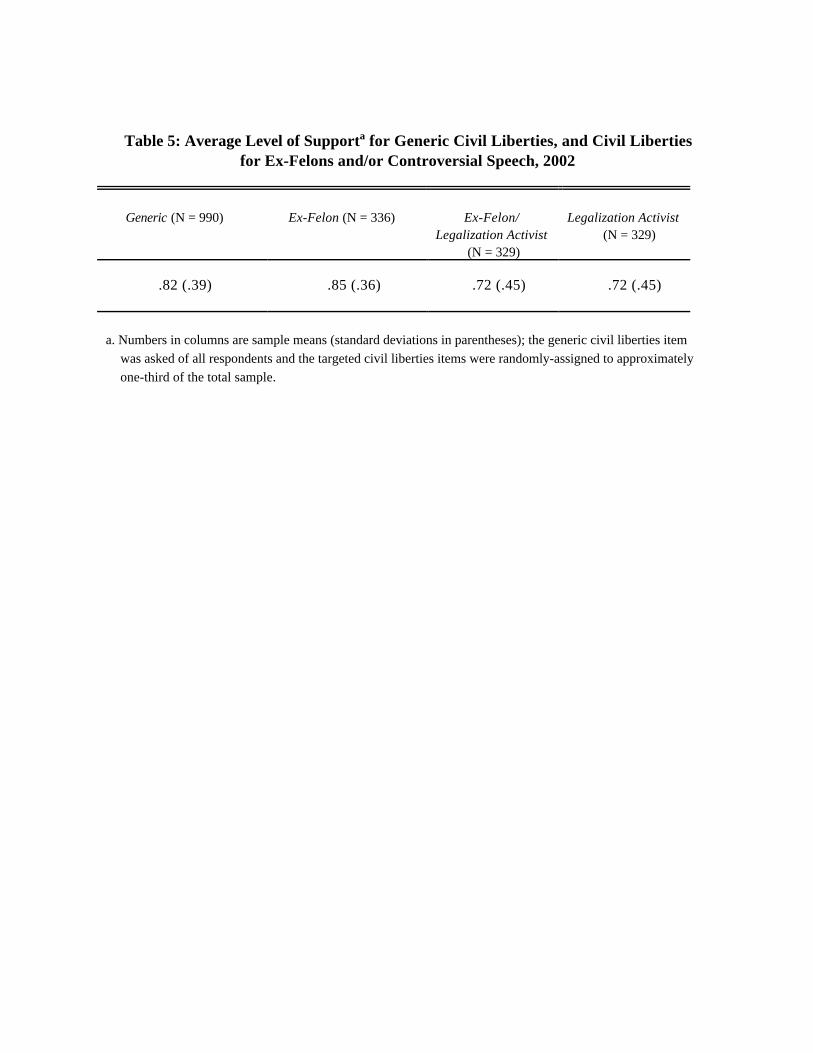
Table 5: Average Level of Supporta for Generic Civil Liberties, and Civil Libertiesfor Ex-Felons and/or Controversial Speech, 2002
Generic (N = 990) Ex-Felon (N = 336) Ex-Felon/Legalization Activist (N = 329)
Legalization Activist (N = 329)
.82 (.39) .85 (.36) .72 (.45) .72 (.45)
a. Numbers in columns are sample means (standard deviations in parentheses); the generic civil liberties item
was asked of all respondents and the targeted civil liberties items were randomly-assigned to approximately
one-third of the total sample.
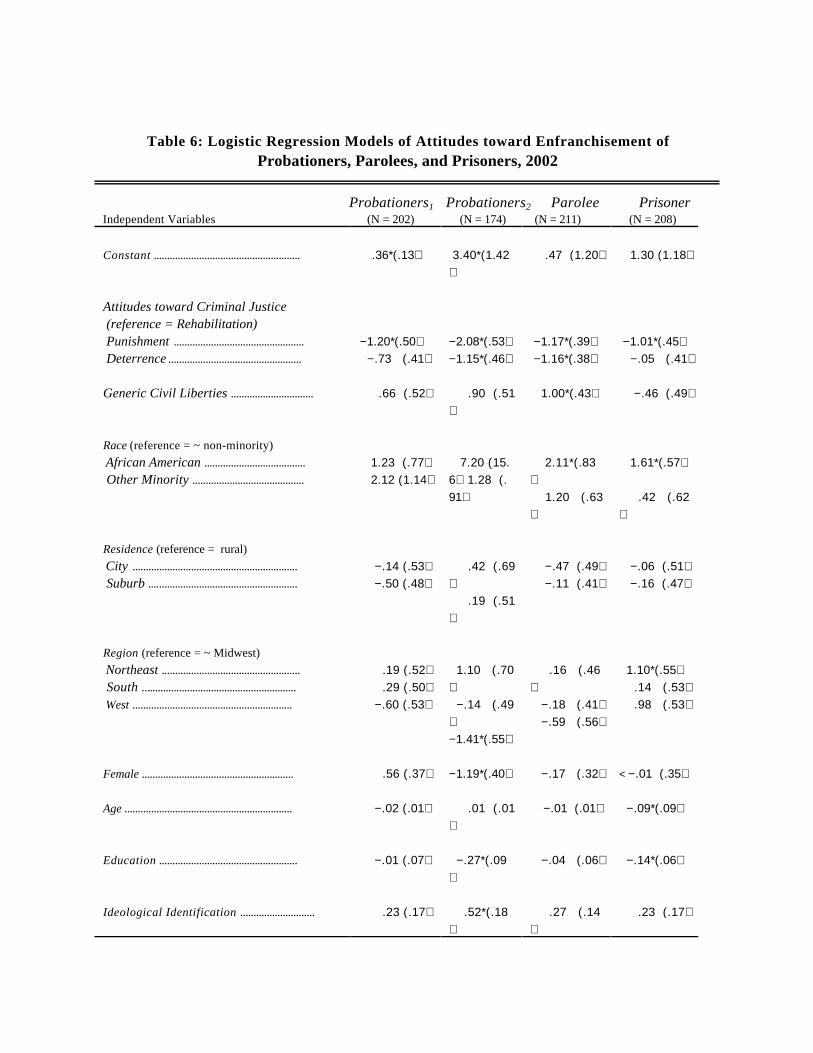
Table 6: Logistic Regression Models of Attitudes toward Enfranchisement of
Probationers, Parolees, and Prisoners, 2002
Probationers1 Probationers2 Parolee Prisoner Independent Variables (N = 202) (N = 174) (N = 211) (N = 208)
Constant ....................................................... .36∗ (.13) 3.40∗ (1.42)
.47 (1.20) 1.30 (1.18)
Attitudes toward Criminal Justice (reference = Rehabilitation) Punishment ................................................. Deterrence ..................................................
−1.20∗ (.50) −.73 (.41)
−2.08∗ (.53)−1.15∗ (.46)
−1.17∗ (.39) −1.16∗ (.38)
−1.01∗ (.45) −.05 (.41)
Generic Civil Liberties ............................... .66 (.52) .90 (.51)
1.00∗ (.43) −.46 (.49)
Race (reference = ~ non-minority)
African American ...................................... Other Minority ..........................................
1.23 (.77) 2.12 (1.14)
7.20 (15.6) 1.28 (.91)
2.11∗ (.83) 1.20 (.63)
1.61∗ (.57) .42 (.62)
Residence (reference = rural)
City .............................................................. Suburb ........................................................
−.14 (.53) −.50 (.48)
.42 (.69) .19 (.51)
−.47 (.49) −.11 (.41)
−.06 (.51) −.16 (.47)
Region (reference = ~ Midwest)
Northeast ....................................................
South .......................................................... West ............................................................
.19 (.52) .29 (.50) −.60 (.53)
1.10 (.70) −.14 (.49)−1.41∗ (.55)
.16 (.46) −.18 (.41) −.59 (.56)
1.10∗ (.55) .14 (.53) .98 (.53)
Female ......................................................... .56 (.37) −1.19∗ (.40) −.17 (.32) < −.01 (.35)
Age ............................................................... −.02 (.01) .01 (.01)
−.01 (.01) −.09∗ (.09)
Education .................................................... −.01 (.07) −.27∗ (.09)
−.04 (.06) −.14∗ (.06)
Ideological Identification ............................ .23 (.17)
.52∗ (.18)
.27 (.14)
.23 (.17)

-2 Log-Likelihood (d.f.)
% correctly predicted
197.72 (159) 72.4
180.07 (187) 78.2
244.75 (196) 69.7
220.90 (193) 75.5
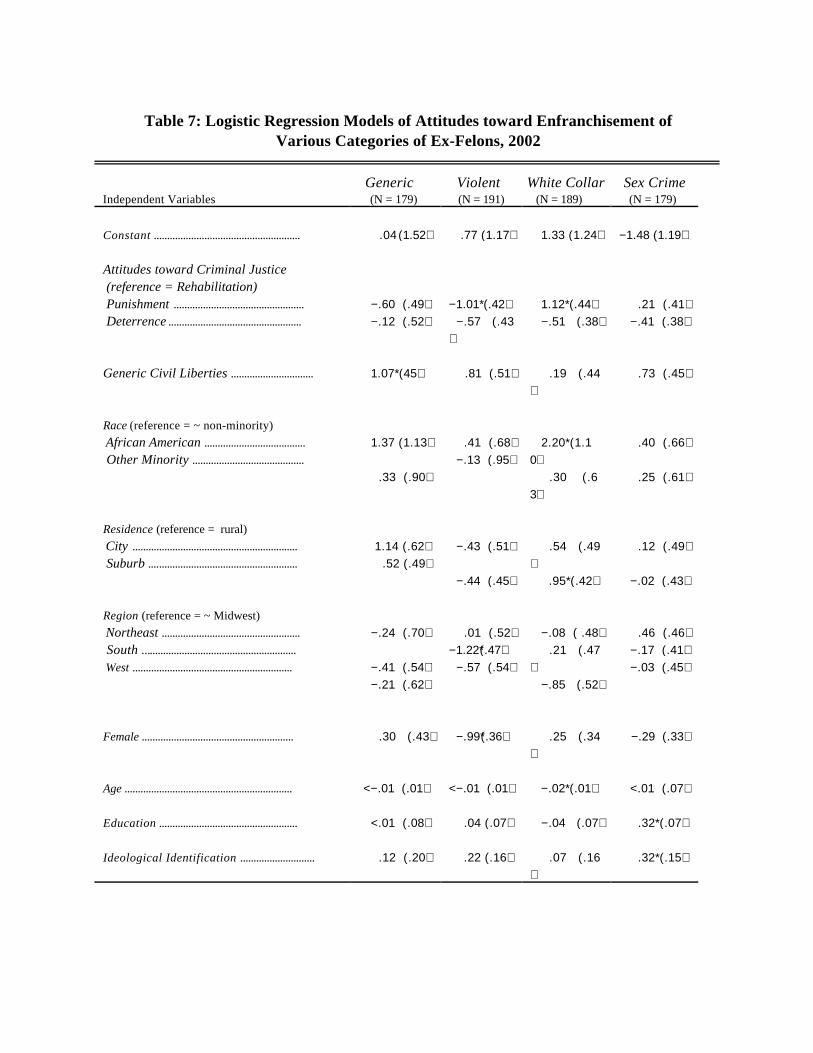
Table 7: Logistic Regression Models of Attitudes toward Enfranchisement ofVarious Categories of Ex-Felons, 2002
Generic Violent White Collar Sex Crime Independent Variables (N = 179) (N = 191) (N = 189) (N = 179)
Constant ....................................................... .04 (1.52) .77 (1.17) 1.33 (1.24) −1.48 (1.19)
Attitudes toward Criminal Justice (reference = Rehabilitation) Punishment ................................................. Deterrence ..................................................
−.60 (.49) −.12 (.52)
−1.01∗ (.42) −.57 (.43)
1.12∗ (.44) −.51 (.38)
.21 (.41) −.41 (.38)
Generic Civil Liberties ............................... 1.07∗ (45) .81 (.51) .19 (.44)
.73 (.45)
Race (reference = ~ non-minority)
African American ...................................... Other Minority ..........................................
1.37 (1.13) .33 (.90)
.41 (.68) −.13 (.95)
2.20∗ (1.10) .30 (.63)
.40 (.66) .25 (.61)
Residence (reference = rural)
City .............................................................. Suburb ........................................................
1.14 (.62) .52 (.49)
−.43 (.51) −.44 (.45)
.54 (.49) .95∗ (.42)
.12 (.49) −.02 (.43)
Region (reference = ~ Midwest)
Northeast ....................................................
South .......................................................... West ............................................................
−.24 (.70) −.41 (.54) −.21 (.62)
.01 (.52)−1.22∗(.47) −.57 (.54)
−.08 ( .48) .21 (.47) −.85 (.52)
.46 (.46) −.17 (.41) −.03 (.45)
Female ......................................................... .30 (.43) −.99∗(.36) .25 (.34)
−.29 (.33)
Age ............................................................... <−.01 (.01) <−.01 (.01) −.02∗ (.01) <.01 (.07)
Education .................................................... <.01 (.08) .04 (.07) −.04 (.07) .32∗ (.07)
Ideological Identification ............................ .12 (.20)
.22 (.16)
.07 (.16)
.32∗ (.15)

-2 Log-Likelihood (d.f.)
% correctly predicted
166.16 (164) 78.8
219.36 (176) 63.9
219.90 (174) 66.9
233.58 (164) 62.0
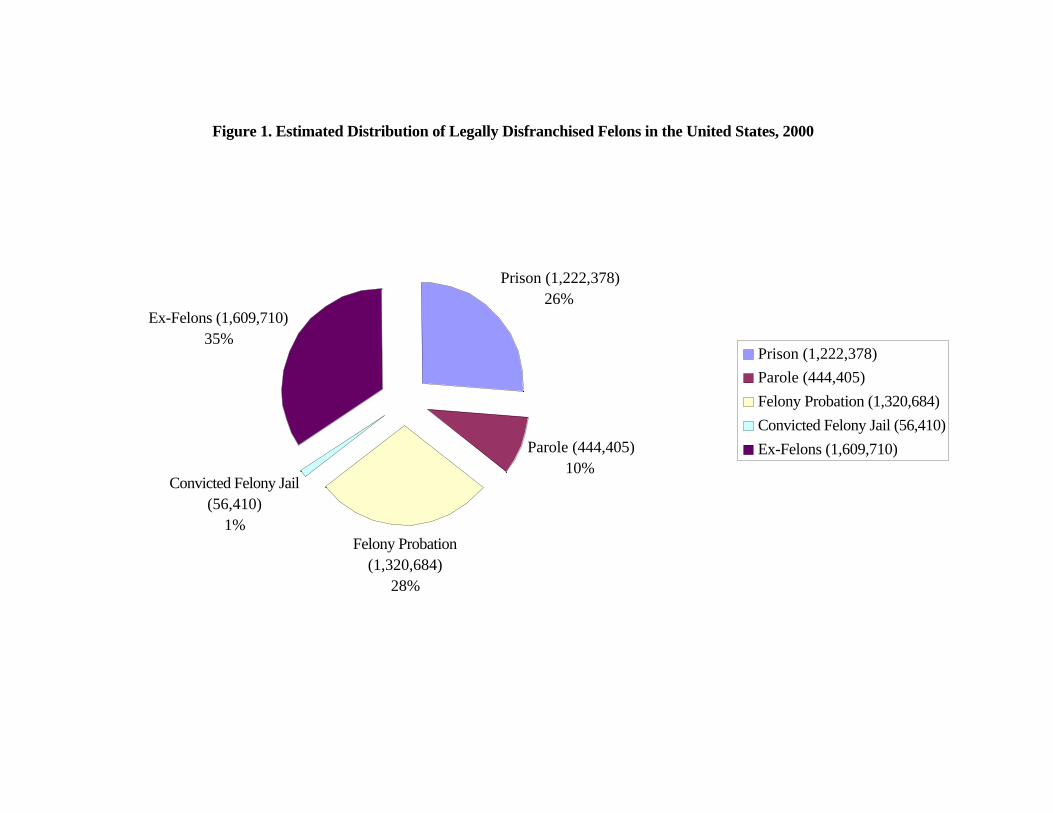
Figure 1. Estimated Distribution of Legally Disfranchised Felons in the United States, 2000
Prison (1,222,378)26%
Parole (444,405)10%
Felony Probation (1,320,684)
28%
Convicted Felony Jail (56,410)
1%
Ex-Felons (1,609,710)35%
Prison (1,222,378)
Parole (444,405)
Felony Probation (1,320,684)
Convicted Felony Jail (56,410)
Ex-Felons (1,609,710)