Embed Size (px)
Citation preview
1 U.S. Department of Education Office for Civil Rights Civil Rights Data Collection: Data Snapshot (Teacher Equity) March 21, 2014 (revised July 3, 2014)
U.S. Department of Education Office for Civil Rights
CIVIL RIGHTS DATA COLLECTION
Data Snapshot: Teacher Equity
Issue Brief No. 4 (March 2014)
For other data snapshots in the series, visit the CRDC at: http://ocrdata.ed.gov
INSIDE THIS SNAPSHOT: Teacher and Counselor Equity Highlights
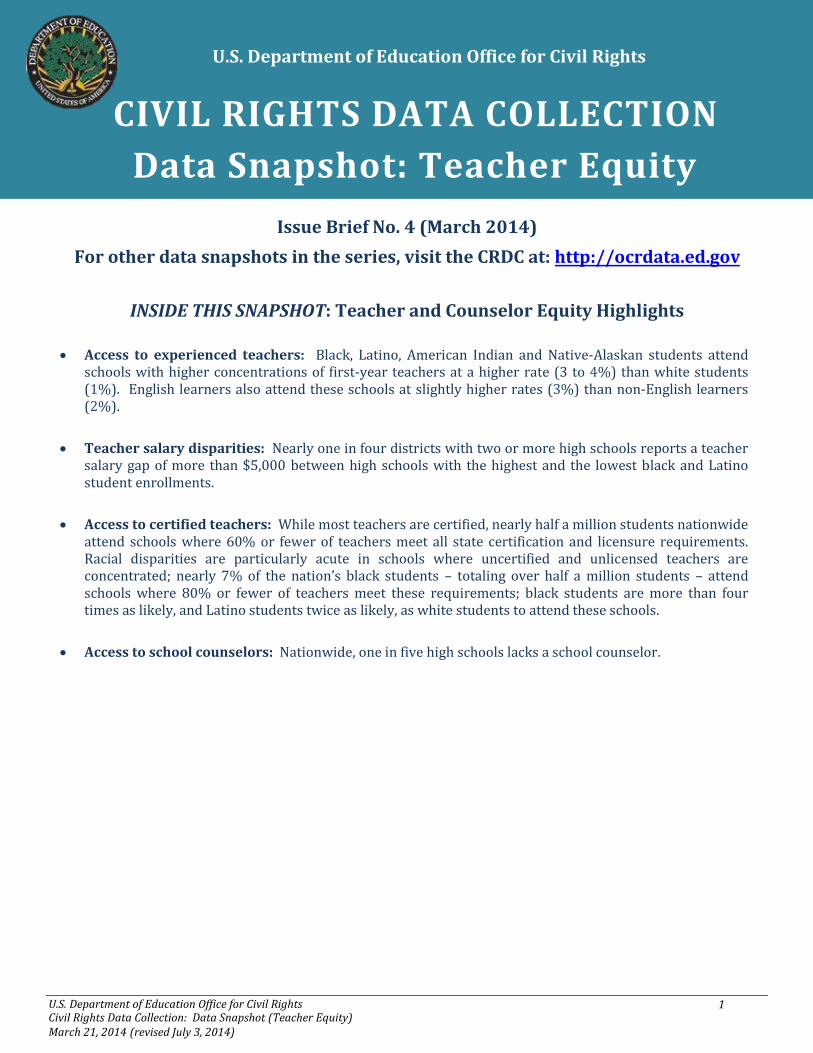
Access to experienced teachers: Black, Latino, American Indian and Native-Alaskan students attendschools with higher concentrations of first-year teachers at a higher rate (3 to 4%) than white students(1%). English learners also attend these schools at slightly higher rates (3%) than non-English learners(2%).
Teacher salary disparities: Nearly one in four districts with two or more high schools reports a teachersalary gap of more than $5,000 between high schools with the highest and the lowest black and Latinostudent enrollments.
Access to certified teachers: While most teachers are certified, nearly half a million students nationwideattend schools where 60% or fewer of teachers meet all state certification and licensure requirements.Racial disparities are particularly acute in schools where uncertified and unlicensed teachers areconcentrated; nearly 7% of the nation’s black students – totaling over half a million students – attendschools where 80% or fewer of teachers meet these requirements; black students are more than fourtimes as likely, and Latino students twice as likely, as white students to attend these schools.
Access to school counselors: Nationwide, one in five high schools lacks a school counselor.
2 U.S. Department of Education Office for Civil Rights Civil Rights Data Collection: Data Snapshot (Teacher Equity) March 21, 2014 (revised July 3, 2014)
TEACHER EQUITY
Students taught by first-year teachers, by race/ethnicity
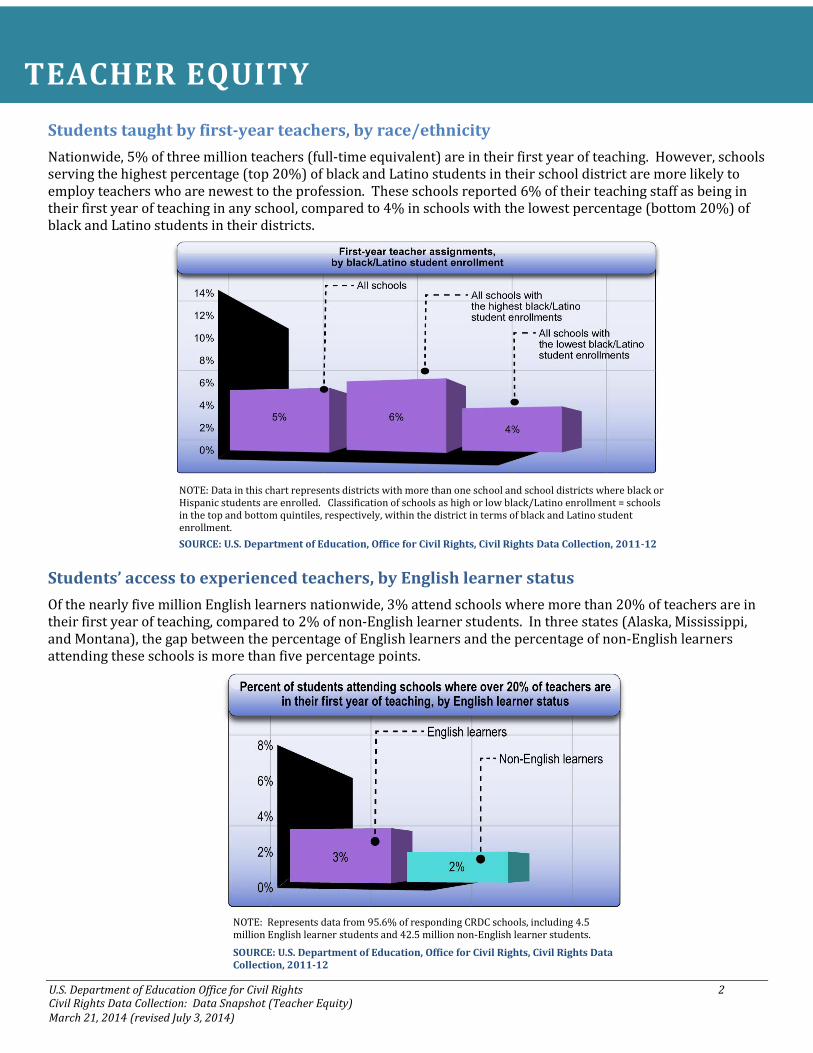
Nationwide, 5% of three million teachers (full-time equivalent) are in their first year of teaching. However, schools serving the highest percentage (top 20%) of black and Latino students in their school district are more likely to employ teachers who are newest to the profession. These schools reported 6% of their teaching staff as being in their first year of teaching in any school, compared to 4% in schools with the lowest percentage (bottom 20%) of black and Latino students in their districts.
Students’ access to experienced teachers, by English learner status
Of the nearly five million English learners nationwide, 3% attend schools where more than 20% of teachers are in their first year of teaching, compared to 2% of non-English learner students. In three states (Alaska, Mississippi, and Montana), the gap between the percentage of English learners and the percentage of non-English learners attending these schools is more than five percentage points.
NOTE: Data in this chart represents districts with more than one school and school districts where black or Hispanic students are enrolled. Classification of schools as high or low black/Latino enrollment = schools in the top and bottom quintiles, respectively, within the district in terms of black and Latino student enrollment.
SOURCE: U.S. Department of Education, Office for Civil Rights, Civil Rights Data Collection, 2011-12
NOTE: Represents data from 95.6% of responding CRDC schools, including 4.5 million English learner students and 42.5 million non-English learner students.
SOURCE: U.S. Department of Education, Office for Civil Rights, Civil Rights Data Collection, 2011-12
3 U.S. Department of Education Office for Civil Rights Civil Rights Data Collection: Data Snapshot (Teacher Equity) March 21, 2014 (revised July 3, 2014)
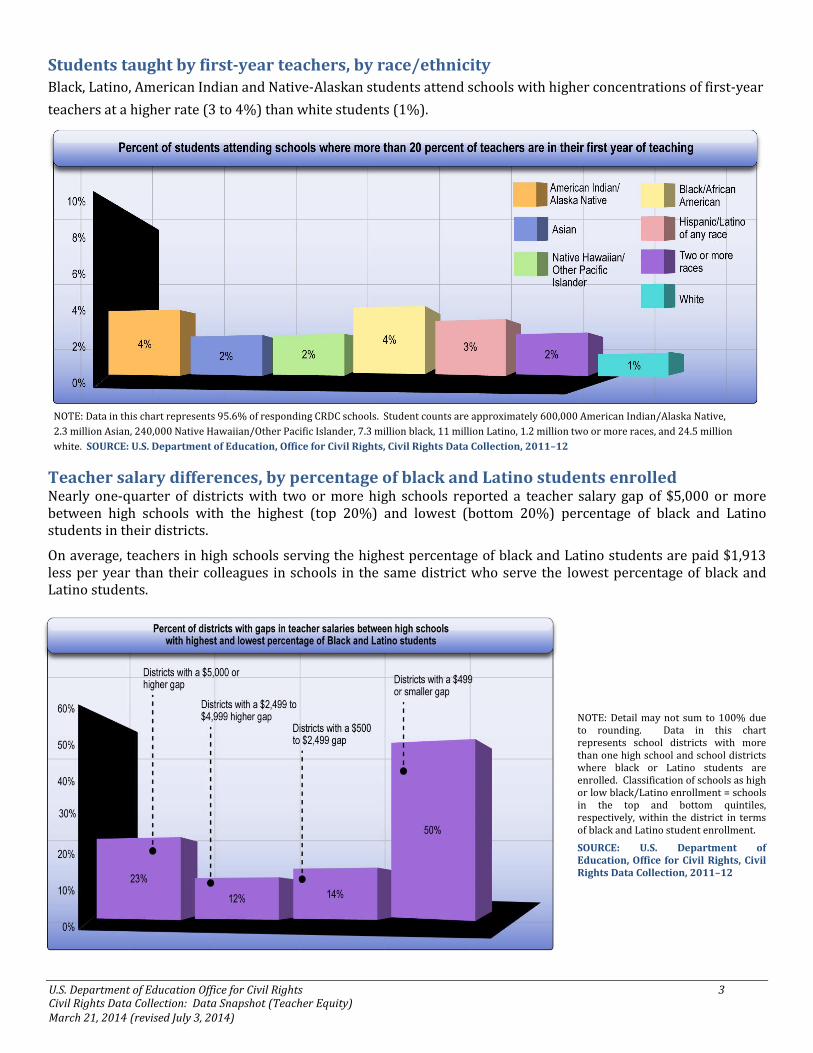
Students taught by first-year teachers, by race/ethnicityBlack, Latino, American Indian and Native-Alaskan students attend schools with higher concentrations of first-year
teachers at a higher rate (3 to 4%) than white students (1%).
Teacher salary differences, by percentage of black and Latino students enrolled Nearly one-quarter of districts with two or more high schools reported a teacher salary gap of $5,000 or more between high schools with the highest (top 20%) and lowest (bottom 20%) percentage of black and Latino students in their districts.
On average, teachers in high schools serving the highest percentage of black and Latino students are paid $1,913 less per year than their colleagues in schools in the same district who serve the lowest percentage of black and Latino students.
NOTE: Data in this chart represents 95.6% of responding CRDC schools. Student counts are approximately 600,000 American Indian/Alaska Native,
2.3 million Asian, 240,000 Native Hawaiian/Other Pacific Islander, 7.3 million black, 11 million Latino, 1.2 million two or more races, and 24.5 million
white. SOURCE: U.S. Department of Education, Office for Civil Rights, Civil Rights Data Collection, 2011–12
NOTE: Detail may not sum to 100% due to rounding. Data in this chart represents school districts with more than one high school and school districts where black or Latino students are enrolled. Classification of schools as high or low black/Latino enrollment = schools in the top and bottom quintiles, respectively, within the district in terms of black and Latino student enrollment.
SOURCE: U.S. Department of Education, Office for Civil Rights, Civil Rights Data Collection, 2011–12
4 U.S. Department of Education Office for Civil Rights Civil Rights Data Collection: Data Snapshot (Teacher Equity) March 21, 2014 (revised July 3, 2014)
Teacher absenteeism nationwide
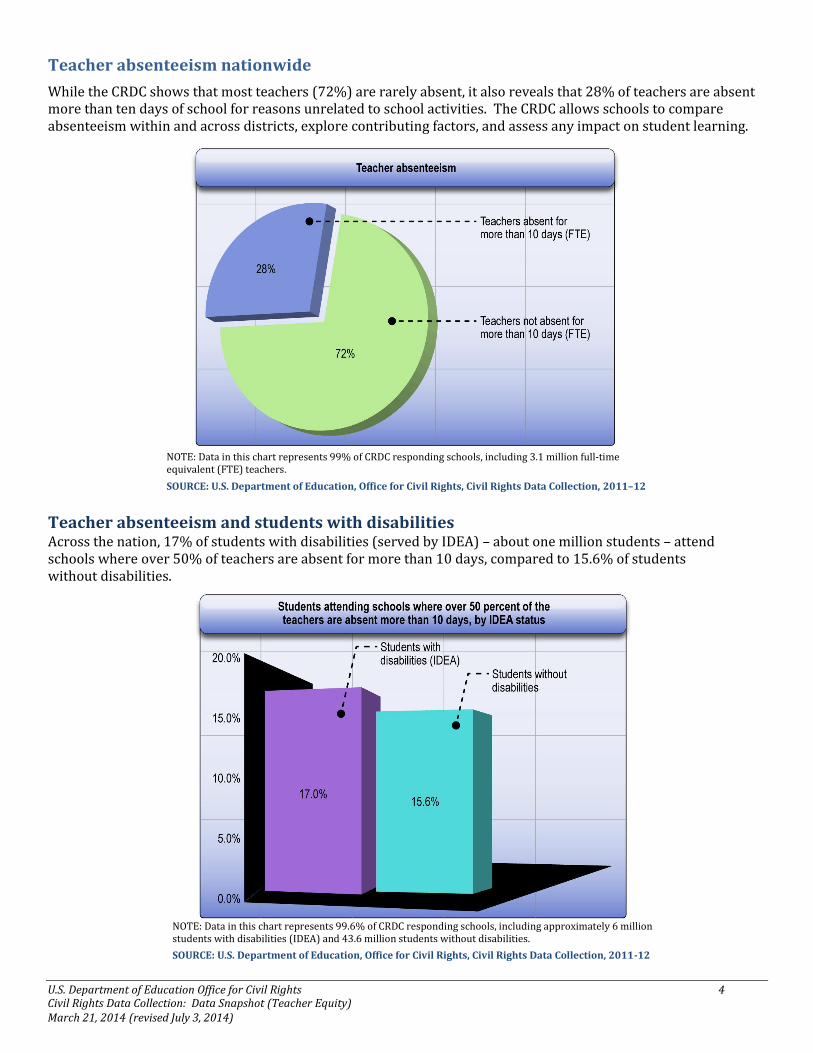
While the CRDC shows that most teachers (72%) are rarely absent, it also reveals that 28% of teachers are absent more than ten days of school for reasons unrelated to school activities. The CRDC allows schools to compare absenteeism within and across districts, explore contributing factors, and assess any impact on student learning.
Teacher absenteeism and students with disabilities Across the nation, 17% of students with disabilities (served by IDEA) – about one million students – attend schools where over 50% of teachers are absent for more than 10 days, compared to 15.6% of students without disabilities.
NOTE: Data in this chart represents 99% of CRDC responding schools, including 3.1 million full-time equivalent (FTE) teachers.
SOURCE: U.S. Department of Education, Office for Civil Rights, Civil Rights Data Collection, 2011–12
NOTE: Data in this chart represents 99.6% of CRDC responding schools, including approximately 6 million students with disabilities (IDEA) and 43.6 million students without disabilities.
SOURCE: U.S. Department of Education, Office for Civil Rights, Civil Rights Data Collection, 2011-12
5 U.S. Department of Education Office for Civil Rights Civil Rights Data Collection: Data Snapshot (Teacher Equity) March 21, 2014 (revised July 3, 2014)
Students taught by certified teachers, by race/ethnicity
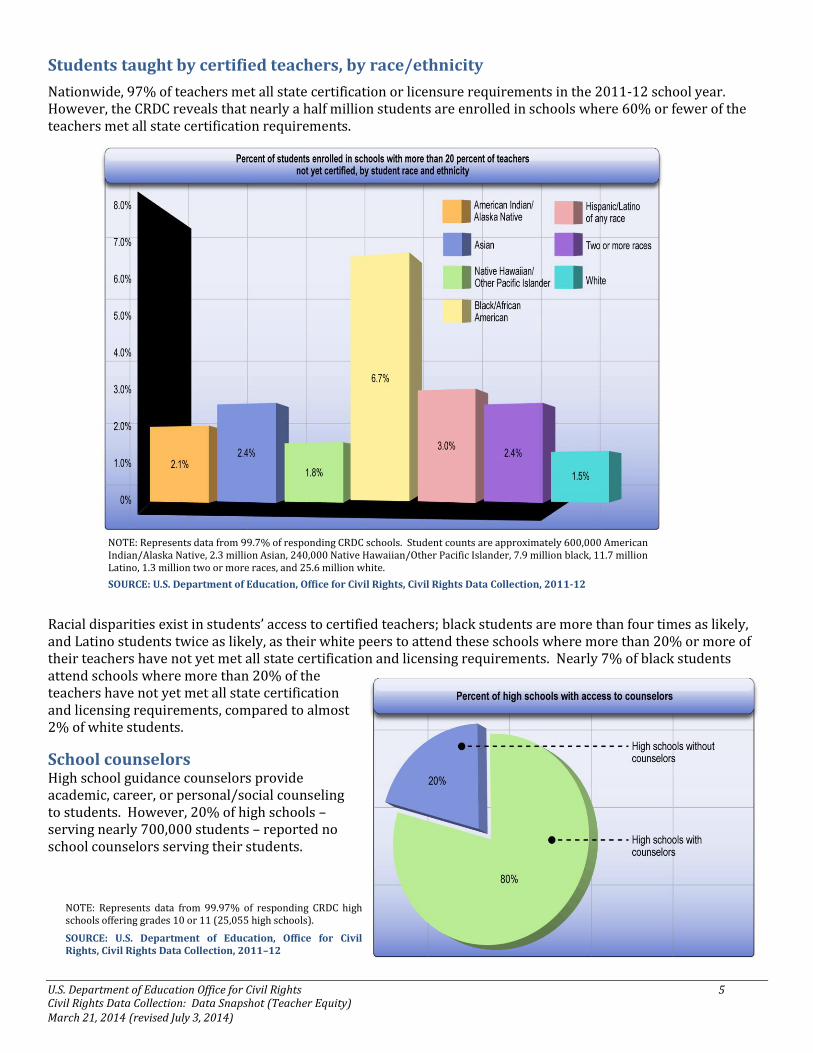
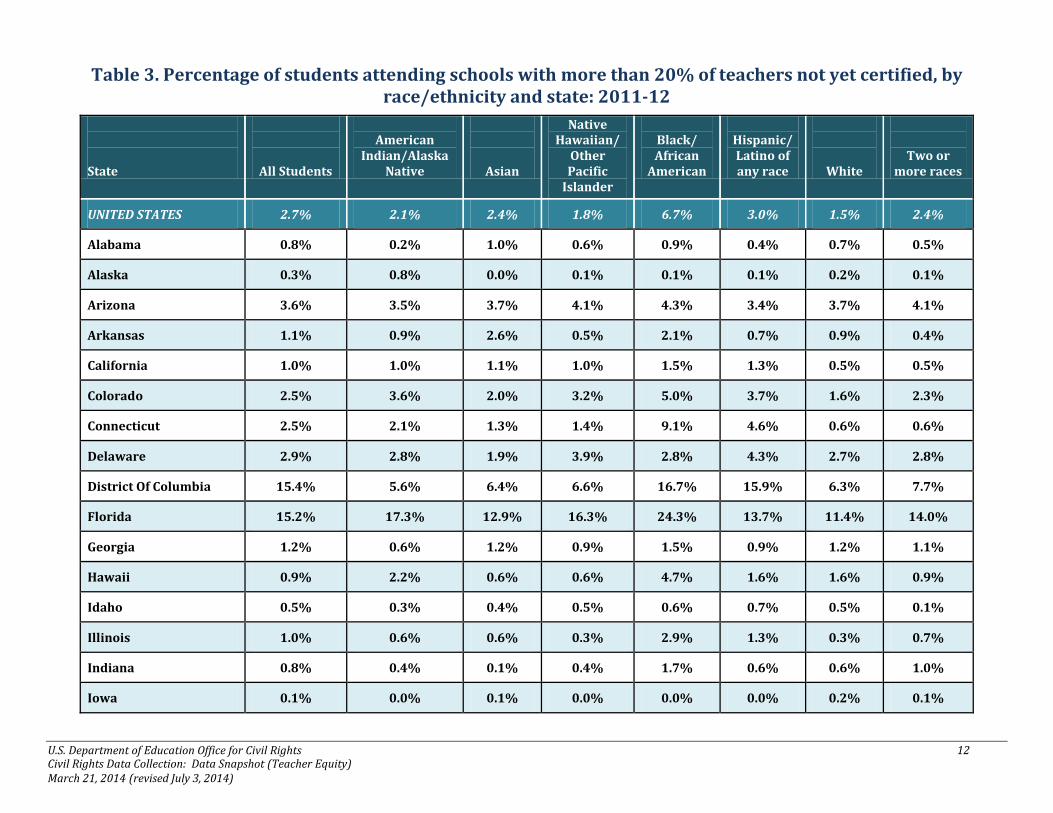
Nationwide, 97% of teachers met all state certification or licensure requirements in the 2011-12 school year. However, the CRDC reveals that nearly a half million students are enrolled in schools where 60% or fewer of the teachers met all state certification requirements.
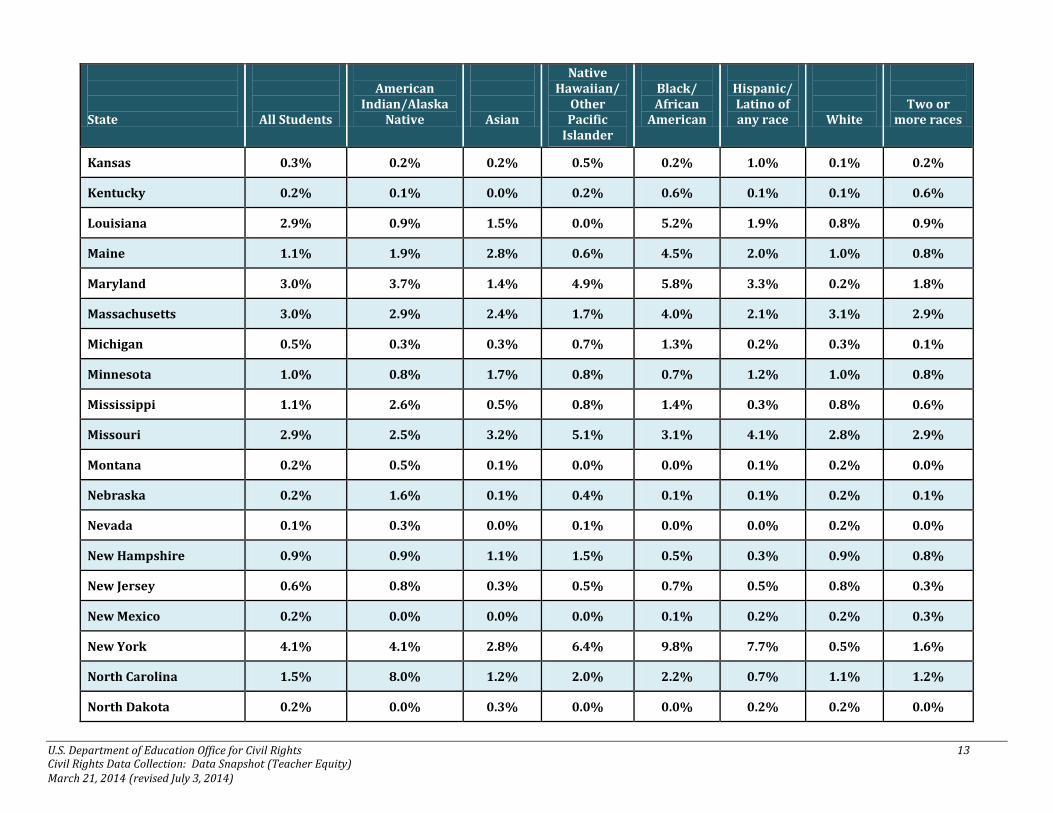
Racial disparities exist in students’ access to certified teachers; black students are more than four times as likely, and Latino students twice as likely, as their white peers to attend these schools where more than 20% or more of their teachers have not yet met all state certification and licensing requirements. Nearly 7% of black students attend schools where more than 20% of the teachers have not yet met all state certification and licensing requirements, compared to almost 2% of white students.
School counselors High school guidance counselors provide academic, career, or personal/social counseling to students. However, 20% of high schools – serving nearly 700,000 students – reported no school counselors serving their students.
NOTE: Represents data from 99.97% of responding CRDC high schools offering grades 10 or 11 (25,055 high schools).
SOURCE: U.S. Department of Education, Office for Civil Rights, Civil Rights Data Collection, 2011–12
NOTE: Represents data from 99.7% of responding CRDC schools. Student counts are approximately 600,000 American Indian/Alaska Native, 2.3 million Asian, 240,000 Native Hawaiian/Other Pacific Islander, 7.9 million black, 11.7 million Latino, 1.3 million two or more races, and 25.6 million white.
SOURCE: U.S. Department of Education, Office for Civil Rights, Civil Rights Data Collection, 2011-12
6 U.S. Department of Education Office for Civil Rights Civil Rights Data Collection: Data Snapshot (Teacher Equity) March 21, 2014 (revised July 3, 2014)
TEACHER EQUITY: STATE-BY-STATE
For the first time since 2000, the 2011-12 CRDC included every public school and district in the nation, allowing more accurate depictions of statewide trends and inter-state disparities. The following tables provide state-level data on indicators related to teachers and school counselors. Here are some select highlights:
First-Year Teachers
Across the nation, in many states, students of color are more likely to attend schools with high percentages of inexperienced teachers.
States (including D.C.) with the highest percentage of students (overall) enrolled in schools with more than 20% of teachers in their first year of teaching: District of Columbia (27%), Alaska (8%), Arizona (7%)
States (including D.C.) with the greatest gap between two racial or ethnic groups in the percentage of students enrolled in schools with more than 20% of teachers in their first year of teaching:
District of Columbia (19% gap between black and white students (28%) and Native Hawaiian/OtherPacific Islander students (9%))
Alaska (13% gap between Native Hawaiian/Other Pacific Islander students (17%) and white students (4%))
Missouri (10% gap between black students (12%) and Asian-American/white/multiracial students (2%))
Oklahoma (8% gap between Native Hawaiian/Other Pacific Islander students (10%) and Native
American or Alaska Native/white students (2%))
Hawaii (7.5% gap between black students (8%) and Asian-American students (0.5%))
School Counselors
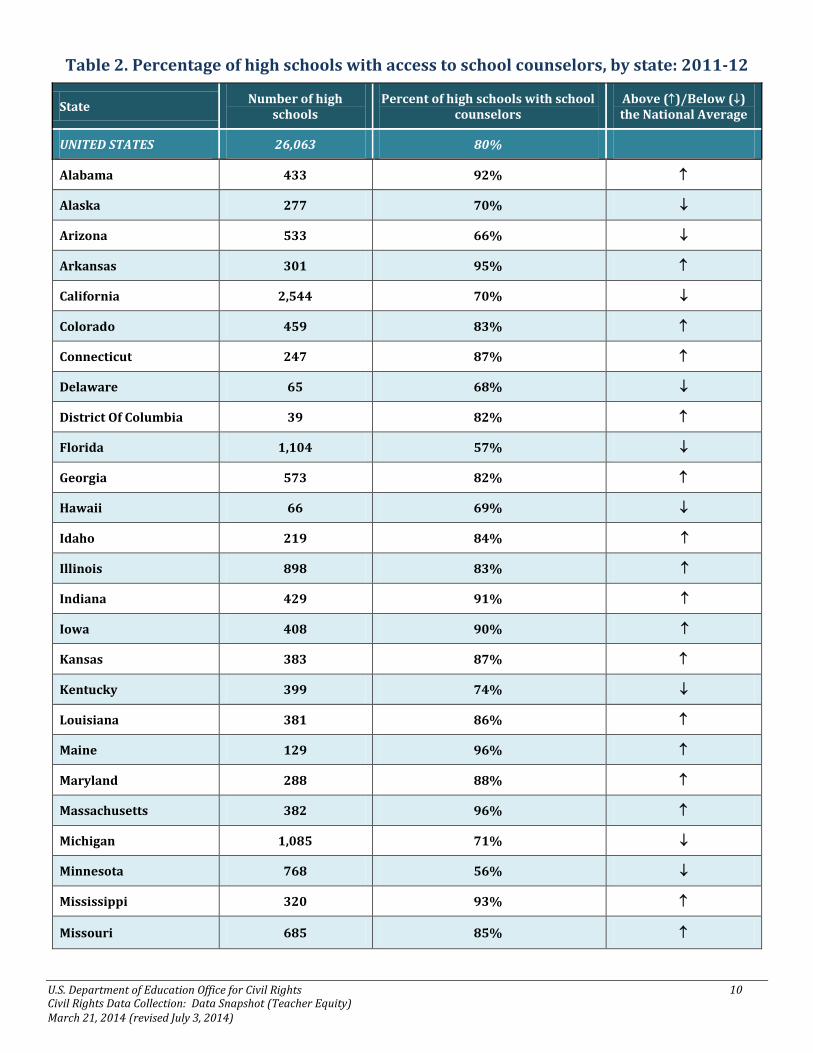
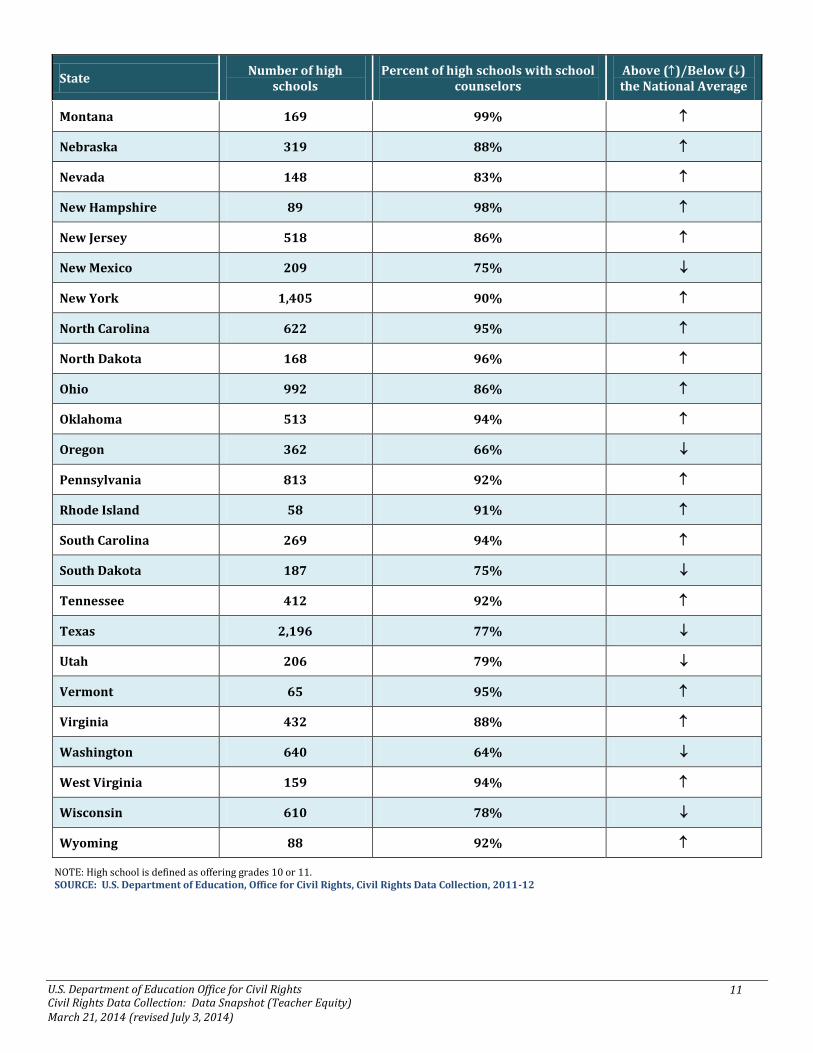
Across the nation, 80% of high schools have access to school counselors.
States with the greatest access to school counselors: Montana (99%) and New Hampshire (98%)
States with the least access to school counselors: Minnesota (56%) and Florida (57%)
Teacher Salaries
Across the nation, there is an average salary gap of $1,913 between teachers in high schools serving the highest percentage of black and Latino students and schools in the same district serving the lowest percentage of black and Latino students.
• States (including D.C.) with a salary gap greater than $5000 (n=4): District of Columbia, Kentucky, New Jersey, and Pennsylvania
• States with a salary gap less than $500 (n=14): Alabama, Arizona, Colorado, Delaware, Idaho,Massachusetts, Michigan, Mississippi, Missouri, Ohio, Rhode Island, South Carolina, Texas, West Virginia
7 U.S. Department of Education Office for Civil Rights Civil Rights Data Collection: Data Snapshot (Teacher Equity) March 21, 2014 (revised July 3, 2014)
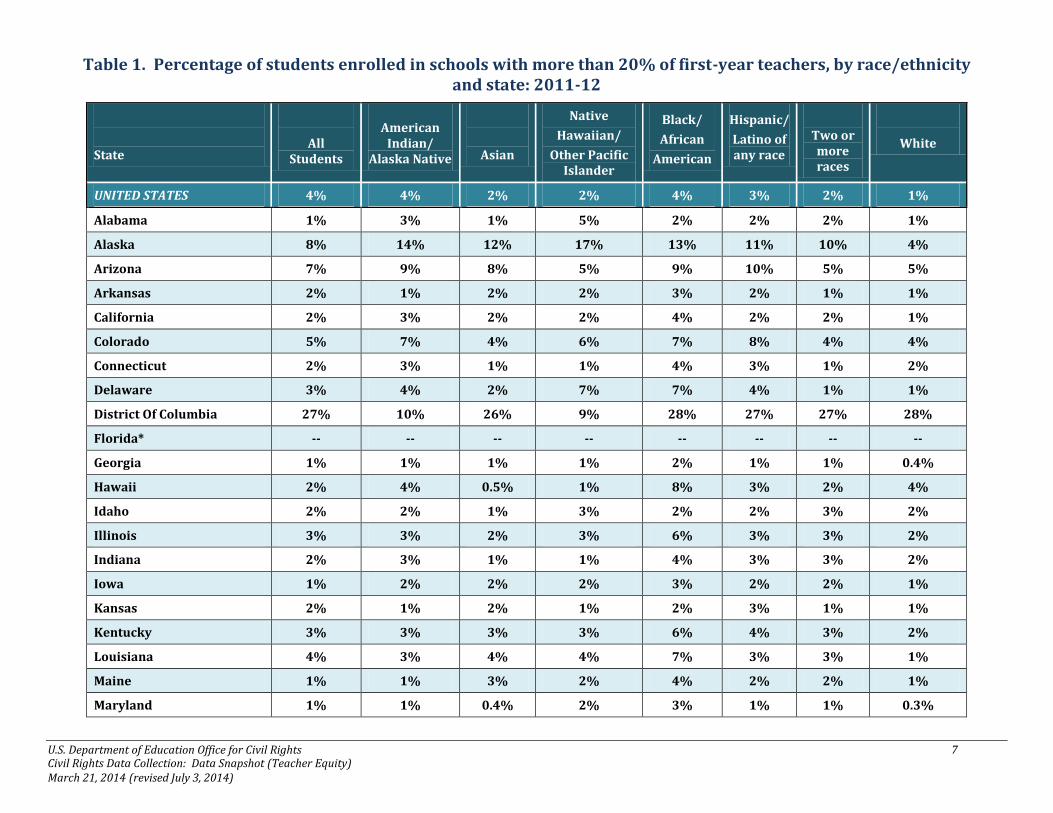
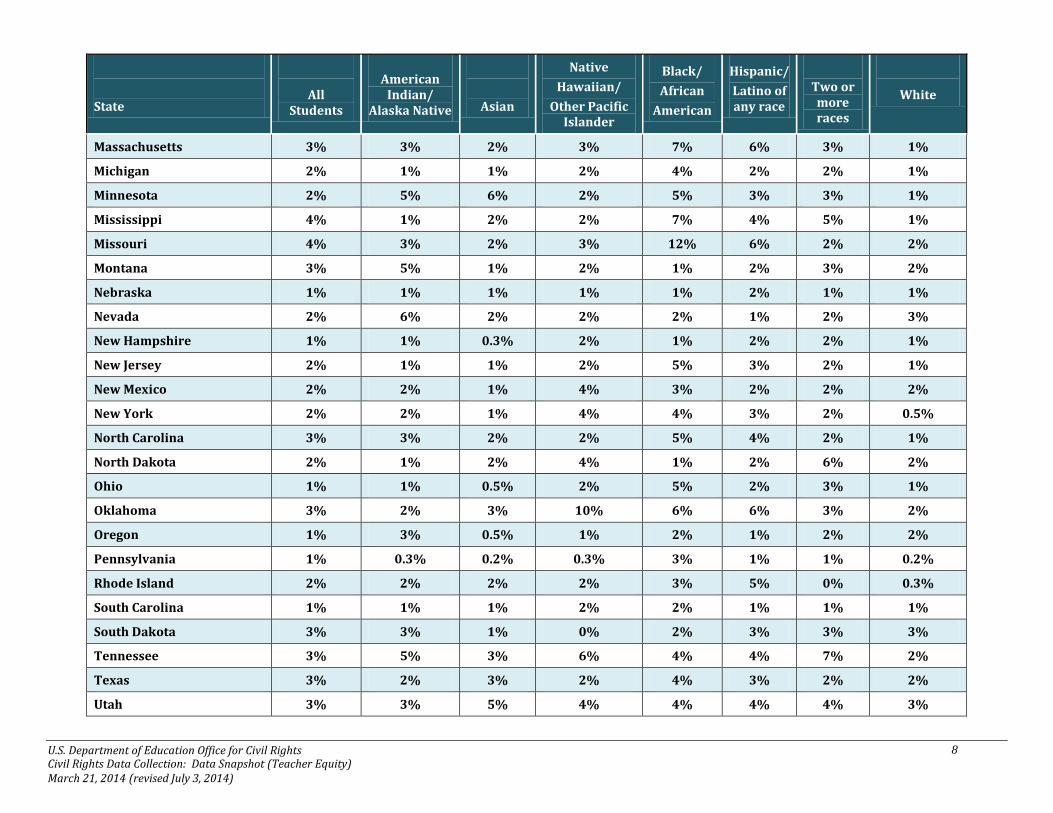
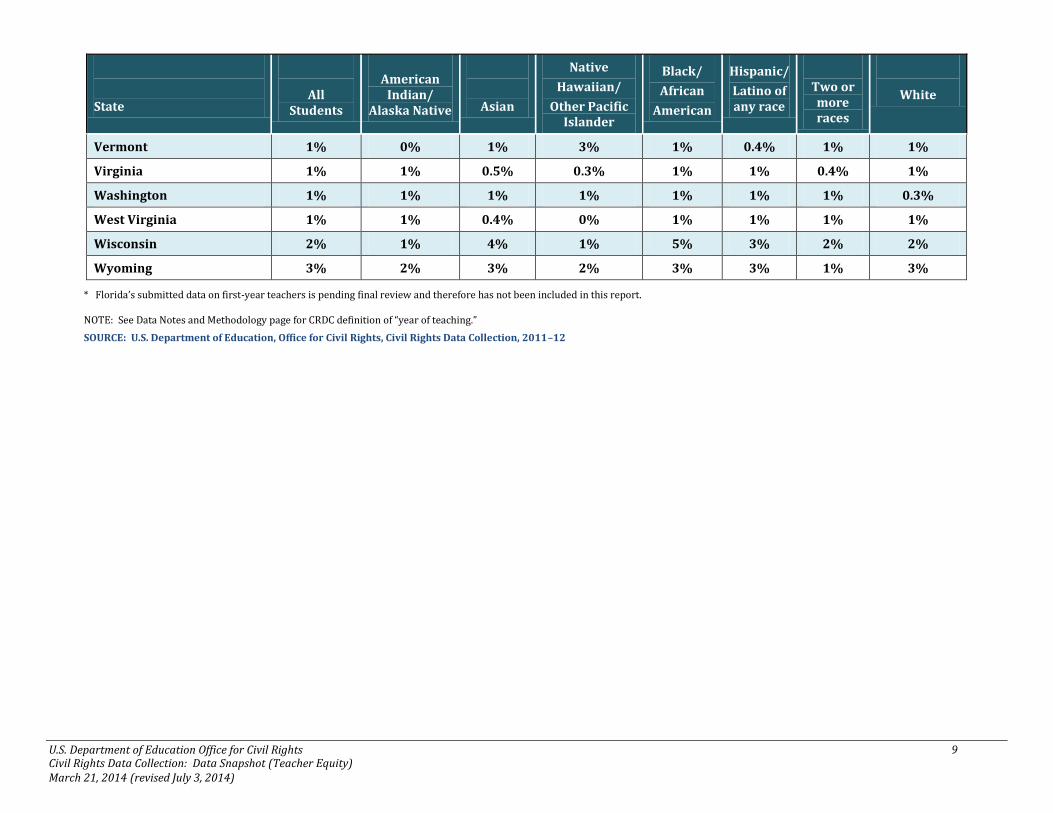
Table 1. Percentage of students enrolled in schools with more than 20% of first-year teachers, by race/ethnicity and state: 2011-12
State All
Students
American Indian/
Alaska Native Asian
Native
Hawaiian/
Other Pacific Islander
Black/
African
American
Hispanic/
Latino of any race
Two or more races
White
UNITED STATES 4% 4% 2% 2% 4% 3% 2% 1%
Alabama 1% 3% 1% 5% 2% 2% 2% 1%
Alaska 8% 14% 12% 17% 13% 11% 10% 4%
Arizona 7% 9% 8% 5% 9% 10% 5% 5%
Arkansas 2% 1% 2% 2% 3% 2% 1% 1%
California 2% 3% 2% 2% 4% 2% 2% 1%
Colorado 5% 7% 4% 6% 7% 8% 4% 4%
Connecticut 2% 3% 1% 1% 4% 3% 1% 2%
Delaware 3% 4% 2% 7% 7% 4% 1% 1%
District Of Columbia 27% 10% 26% 9% 28% 27% 27% 28%
Florida* -- -- -- -- -- -- -- --
Georgia 1% 1% 1% 1% 2% 1% 1% 0.4%
Hawaii 2% 4% 0.5% 1% 8% 3% 2% 4%
Idaho 2% 2% 1% 3% 2% 2% 3% 2%
Illinois 3% 3% 2% 3% 6% 3% 3% 2%
Indiana 2% 3% 1% 1% 4% 3% 3% 2%
Iowa 1% 2% 2% 2% 3% 2% 2% 1%
Kansas 2% 1% 2% 1% 2% 3% 1% 1%
Kentucky 3% 3% 3% 3% 6% 4% 3% 2%
Louisiana 4% 3% 4% 4% 7% 3% 3% 1%
Maine 1% 1% 3% 2% 4% 2% 2% 1%
Maryland 1% 1% 0.4% 2% 3% 1% 1% 0.3%
8 U.S. Department of Education Office for Civil Rights Civil Rights Data Collection: Data Snapshot (Teacher Equity) March 21, 2014 (revised July 3, 2014)
State All
Students
American Indian/
Alaska Native Asian
Native
Hawaiian/
Other Pacific Islander
Black/
African
American
Hispanic/
Latino of any race
Two or more races
White
Massachusetts 3% 3% 2% 3% 7% 6% 3% 1%
Michigan 2% 1% 1% 2% 4% 2% 2% 1%
Minnesota 2% 5% 6% 2% 5% 3% 3% 1%
Mississippi 4% 1% 2% 2% 7% 4% 5% 1%
Missouri 4% 3% 2% 3% 12% 6% 2% 2%
Montana 3% 5% 1% 2% 1% 2% 3% 2%
Nebraska 1% 1% 1% 1% 1% 2% 1% 1%
Nevada 2% 6% 2% 2% 2% 1% 2% 3%
New Hampshire 1% 1% 0.3% 2% 1% 2% 2% 1%
New Jersey 2% 1% 1% 2% 5% 3% 2% 1%
New Mexico 2% 2% 1% 4% 3% 2% 2% 2%
New York 2% 2% 1% 4% 4% 3% 2% 0.5%
North Carolina 3% 3% 2% 2% 5% 4% 2% 1%
North Dakota 2% 1% 2% 4% 1% 2% 6% 2%
Ohio 1% 1% 0.5% 2% 5% 2% 3% 1%
Oklahoma 3% 2% 3% 10% 6% 6% 3% 2%
Oregon 1% 3% 0.5% 1% 2% 1% 2% 2%
Pennsylvania 1% 0.3% 0.2% 0.3% 3% 1% 1% 0.2%
Rhode Island 2% 2% 2% 2% 3% 5% 0% 0.3%
South Carolina 1% 1% 1% 2% 2% 1% 1% 1%
South Dakota 3% 3% 1% 0% 2% 3% 3% 3%
Tennessee 3% 5% 3% 6% 4% 4% 7% 2%
Texas 3% 2% 3% 2% 4% 3% 2% 2%
Utah 3% 3% 5% 4% 4% 4% 4% 3%
9 U.S. Department of Education Office for Civil Rights Civil Rights Data Collection: Data Snapshot (Teacher Equity) March 21, 2014 (revised July 3, 2014)
State All
Students
American Indian/
Alaska Native Asian
Native
Hawaiian/
Other Pacific Islander
Black/
African
American
Hispanic/
Latino of any race
Two or more races
White
Vermont 1% 0% 1% 3% 1% 0.4% 1% 1%
Virginia 1% 1% 0.5% 0.3% 1% 1% 0.4% 1%
Washington 1% 1% 1% 1% 1% 1% 1% 0.3%
West Virginia 1% 1% 0.4% 0% 1% 1% 1% 1%
Wisconsin 2% 1% 4% 1% 5% 3% 2% 2%
Wyoming 3% 2% 3% 2% 3% 3% 1% 3%
* Florida’s submitted data on first-year teachers is pending final review and therefore has not been included in this report.
NOTE: See Data Notes and Methodology page for CRDC definition of “year of teaching.”
SOURCE: U.S. Department of Education, Office for Civil Rights, Civil Rights Data Collection, 2011–12
10 U.S. Department of Education Office for Civil Rights Civil Rights Data Collection: Data Snapshot (Teacher Equity) March 21, 2014 (revised July 3, 2014)
Table 2. Percentage of high schools with access to school counselors, by state: 2011-12
State Number of high
schools Percent of high schools with school
counselors Above ()/Below () the National Average
UNITED STATES 26,063 80%
Alabama 433 92%
Alaska 277 70%
Arizona 533 66%
Arkansas 301 95%
California 2,544 70%
Colorado 459 83%
Connecticut 247 87%
Delaware 65 68%
District Of Columbia 39 82%
Florida 1,104 57%
Georgia 573 82%
Hawaii 66 69%
Idaho 219 84%
Illinois 898 83%
Indiana 429 91%
Iowa 408 90%
Kansas 383 87%
Kentucky 399 74%
Louisiana 381 86%
Maine 129 96%
Maryland 288 88%
Massachusetts 382 96%
Michigan 1,085 71%
Minnesota 768 56%
Mississippi 320 93%
Missouri 685 85%
11 U.S. Department of Education Office for Civil Rights Civil Rights Data Collection: Data Snapshot (Teacher Equity) March 21, 2014 (revised July 3, 2014)
State Number of high
schools Percent of high schools with school
counselors Above ()/Below () the National Average
Montana 169 99%
Nebraska 319 88%
Nevada 148 83%
New Hampshire 89 98%
New Jersey 518 86%
New Mexico 209 75%
New York 1,405 90%
North Carolina 622 95%
North Dakota 168 96%
Ohio 992 86%
Oklahoma 513 94%
Oregon 362 66%
Pennsylvania 813 92%
Rhode Island 58 91%
South Carolina 269 94%
South Dakota 187 75%
Tennessee 412 92%
Texas 2,196 77%
Utah 206 79%
Vermont 65 95%
Virginia 432 88%
Washington 640 64%
West Virginia 159 94%
Wisconsin 610 78%
Wyoming 88 92%
NOTE: High school is defined as offering grades 10 or 11. SOURCE: U.S. Department of Education, Office for Civil Rights, Civil Rights Data Collection, 2011-12
12 U.S. Department of Education Office for Civil Rights Civil Rights Data Collection: Data Snapshot (Teacher Equity) March 21, 2014 (revised July 3, 2014)
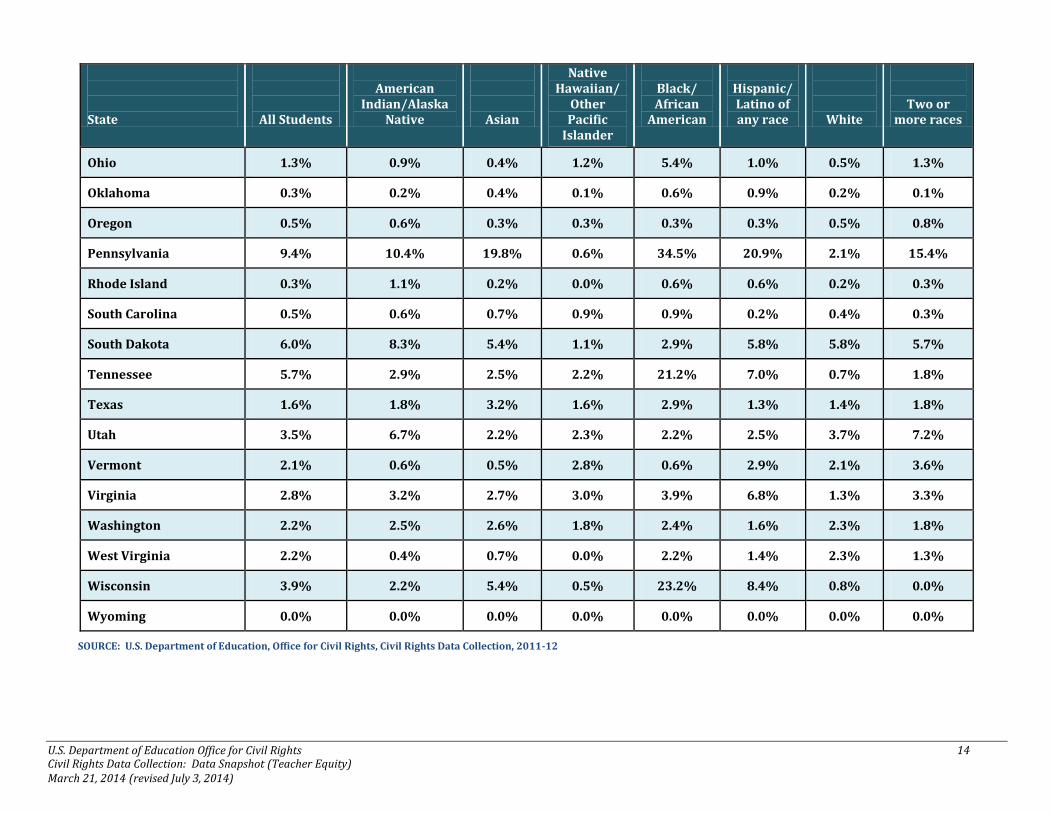
Table 3. Percentage of students attending schools with more than 20% of teachers not yet certified, by race/ethnicity and state: 2011-12
State All Students
American Indian/Alaska
Native Asian
Native Hawaiian/
Other Pacific
Islander
Black/ African
American
Hispanic/ Latino of any race White
Two or more races
UNITED STATES 2.7% 2.1% 2.4% 1.8% 6.7% 3.0% 1.5% 2.4%
Alabama 0.8% 0.2% 1.0% 0.6% 0.9% 0.4% 0.7% 0.5%
Alaska 0.3% 0.8% 0.0% 0.1% 0.1% 0.1% 0.2% 0.1%
Arizona 3.6% 3.5% 3.7% 4.1% 4.3% 3.4% 3.7% 4.1%
Arkansas 1.1% 0.9% 2.6% 0.5% 2.1% 0.7% 0.9% 0.4%
California 1.0% 1.0% 1.1% 1.0% 1.5% 1.3% 0.5% 0.5%
Colorado 2.5% 3.6% 2.0% 3.2% 5.0% 3.7% 1.6% 2.3%
Connecticut 2.5% 2.1% 1.3% 1.4% 9.1% 4.6% 0.6% 0.6%
Delaware 2.9% 2.8% 1.9% 3.9% 2.8% 4.3% 2.7% 2.8%
District Of Columbia 15.4% 5.6% 6.4% 6.6% 16.7% 15.9% 6.3% 7.7%
Florida 15.2% 17.3% 12.9% 16.3% 24.3% 13.7% 11.4% 14.0%
Georgia 1.2% 0.6% 1.2% 0.9% 1.5% 0.9% 1.2% 1.1%
Hawaii 0.9% 2.2% 0.6% 0.6% 4.7% 1.6% 1.6% 0.9%
Idaho 0.5% 0.3% 0.4% 0.5% 0.6% 0.7% 0.5% 0.1%
Illinois 1.0% 0.6% 0.6% 0.3% 2.9% 1.3% 0.3% 0.7%
Indiana 0.8% 0.4% 0.1% 0.4% 1.7% 0.6% 0.6% 1.0%
Iowa 0.1% 0.0% 0.1% 0.0% 0.0% 0.0% 0.2% 0.1%
13 U.S. Department of Education Office for Civil Rights Civil Rights Data Collection: Data Snapshot (Teacher Equity) March 21, 2014 (revised July 3, 2014)
State All Students
American Indian/Alaska
Native Asian
Native Hawaiian/
Other Pacific
Islander
Black/ African
American
Hispanic/ Latino of any race White
Two or more races
Kansas 0.3% 0.2% 0.2% 0.5% 0.2% 1.0% 0.1% 0.2%
Kentucky 0.2% 0.1% 0.0% 0.2% 0.6% 0.1% 0.1% 0.6%
Louisiana 2.9% 0.9% 1.5% 0.0% 5.2% 1.9% 0.8% 0.9%
Maine 1.1% 1.9% 2.8% 0.6% 4.5% 2.0% 1.0% 0.8%
Maryland 3.0% 3.7% 1.4% 4.9% 5.8% 3.3% 0.2% 1.8%
Massachusetts 3.0% 2.9% 2.4% 1.7% 4.0% 2.1% 3.1% 2.9%
Michigan 0.5% 0.3% 0.3% 0.7% 1.3% 0.2% 0.3% 0.1%
Minnesota 1.0% 0.8% 1.7% 0.8% 0.7% 1.2% 1.0% 0.8%
Mississippi 1.1% 2.6% 0.5% 0.8% 1.4% 0.3% 0.8% 0.6%
Missouri 2.9% 2.5% 3.2% 5.1% 3.1% 4.1% 2.8% 2.9%
Montana 0.2% 0.5% 0.1% 0.0% 0.0% 0.1% 0.2% 0.0%
Nebraska 0.2% 1.6% 0.1% 0.4% 0.1% 0.1% 0.2% 0.1%
Nevada 0.1% 0.3% 0.0% 0.1% 0.0% 0.0% 0.2% 0.0%
New Hampshire 0.9% 0.9% 1.1% 1.5% 0.5% 0.3% 0.9% 0.8%
New Jersey 0.6% 0.8% 0.3% 0.5% 0.7% 0.5% 0.8% 0.3%
New Mexico 0.2% 0.0% 0.0% 0.0% 0.1% 0.2% 0.2% 0.3%
New York 4.1% 4.1% 2.8% 6.4% 9.8% 7.7% 0.5% 1.6%
North Carolina 1.5% 8.0% 1.2% 2.0% 2.2% 0.7% 1.1% 1.2%
North Dakota 0.2% 0.0% 0.3% 0.0% 0.0% 0.2% 0.2% 0.0%
14 U.S. Department of Education Office for Civil Rights Civil Rights Data Collection: Data Snapshot (Teacher Equity) March 21, 2014 (revised July 3, 2014)
State All Students
American Indian/Alaska
Native Asian
Native Hawaiian/
Other Pacific
Islander
Black/ African
American
Hispanic/ Latino of any race White
Two or more races
Ohio 1.3% 0.9% 0.4% 1.2% 5.4% 1.0% 0.5% 1.3%
Oklahoma 0.3% 0.2% 0.4% 0.1% 0.6% 0.9% 0.2% 0.1%
Oregon 0.5% 0.6% 0.3% 0.3% 0.3% 0.3% 0.5% 0.8%
Pennsylvania 9.4% 10.4% 19.8% 0.6% 34.5% 20.9% 2.1% 15.4%
Rhode Island 0.3% 1.1% 0.2% 0.0% 0.6% 0.6% 0.2% 0.3%
South Carolina 0.5% 0.6% 0.7% 0.9% 0.9% 0.2% 0.4% 0.3%
South Dakota 6.0% 8.3% 5.4% 1.1% 2.9% 5.8% 5.8% 5.7%
Tennessee 5.7% 2.9% 2.5% 2.2% 21.2% 7.0% 0.7% 1.8%
Texas 1.6% 1.8% 3.2% 1.6% 2.9% 1.3% 1.4% 1.8%
Utah 3.5% 6.7% 2.2% 2.3% 2.2% 2.5% 3.7% 7.2%
Vermont 2.1% 0.6% 0.5% 2.8% 0.6% 2.9% 2.1% 3.6%
Virginia 2.8% 3.2% 2.7% 3.0% 3.9% 6.8% 1.3% 3.3%
Washington 2.2% 2.5% 2.6% 1.8% 2.4% 1.6% 2.3% 1.8%
West Virginia 2.2% 0.4% 0.7% 0.0% 2.2% 1.4% 2.3% 1.3%
Wisconsin 3.9% 2.2% 5.4% 0.5% 23.2% 8.4% 0.8% 0.0%
Wyoming 0.0% 0.0% 0.0% 0.0% 0.0% 0.0% 0.0% 0.0%
SOURCE: U.S. Department of Education, Office for Civil Rights, Civil Rights Data Collection, 2011-12
15 U.S. Department of Education Office for Civil Rights Civil Rights Data Collection: Data Snapshot (Teacher Equity) March 21, 2014 (revised July 3, 2014)
Data Notes and Methodology Since 1968, the Civil Rights Data Collection (CRDC) has collected data on key education and civil rights issues in our nation's public schools for use by the Department of Education’s Office for Civil Rights (OCR), other Department offices, other federal agencies, and by policymakers and researchers outside of the Department. The CRDC collects information about school characteristics and about programs, services, and outcomes for students. Most student data is disaggregated by race/ethnicity, sex, limited English proficiency, and disability.
Schools and Districts Included The CRDC has generally been collected biennially from school districts in each of the 50 states plus the District of Columbia. The 2011-12 CRDC included all public schools and public school districts in the nation that serve students for at least 50% of the school day. The CRDC also includes long-term secure juvenile justice agencies, schools for the blind and deaf, and alternative schools. The response rate for this large national collection was 98.4% of school districts, 99.2% of schools, representing 99.6% of students in the nation.
Race and Ethnicity For the 2011-12 CRDC, districts reported data using the seven race and ethnicity categories (Hispanic/Latino, white, black/African American, Asian, Native Hawaiian/Other Pacific Islander, American Indian/Alaska Native, and Two or More Races). For more information on the Department’s 2007 guidance regarding race and ethnicity categories, please visit http://www2.ed.gov/policy/rschstat/guid/raceethnicity/index.html.
Limitations of CRDC Data As previously stated, the CRDC has generally been collected biennially from school districts in each of the 50 states plus the District of Columbia. The 2011-12 CRDC included all public schools and public school districts in the nation that serve students for at least 50% of the school day. The CRDC also includes long-term secure juvenile justice agencies, schools for the blind and deaf, and alternative schools. The response rate for this large national collection was 98.4% of school districts, 99.2% of schools, representing 99.6% of students in the nation.
After reviewing the data, OCR is aware that inconsistencies may still remain in the data file. Users should be aware that outliers in the dataset may be a function of districts misreporting data. For example, outliers in the data on single-sex classes may be reporting the number of students enrolled in single-sex classes rather than the number of single-sex classes. In the analysis provided in this report, some schools and districts with potential reporting errors were excluded from the analysis. The percentage of schools included can be found in the notes section below each chart.
Privacy Protection and Data Rounding To ensure the protection of privacy while meeting the purposes of the CRDC, OCR conducted the analysis presented in this document on the privacy protected CRDC data. The CRDC data is privacy protected by rounding student counts in groups of three to prevent the disclosure of individual student information. For example, student counts from 1-3 are rounded to 2, student counts from 4-6 are rounded to five.
In previous years, OCR has rounded CRDC data to the nearest five. However, in collaboration with the Department’s Disclosure Review Board, OCR implemented a new rounding method for the 2011-12 CRDC to reveal true zeroes where possible and minimize the distortion of rounding. In general, for the 2011-12 CRDC data, the distortion of rounding one student to two would be balanced by the rounding down of three students to two. However, this new privacy protection method may inflate total counts for CRDC data elements in which there are prevalent cases of schools reporting only one student (e.g., one student retained is rounded to two students retained).
16 U.S. Department of Education Office for Civil Rights Civil Rights Data Collection: Data Snapshot (Teacher Equity) March 21, 2014 (revised July 3, 2014)
Teacher Equity CRDC Definitions:
Classroom Teacher: A teacher that provides instruction, learning experiences, and care to students during aparticular time period or in a given discipline. School principals and guidance counselors are not consideredclassroom teachers.
School Counselor: Staff whose primary responsibility is to provide academic, career, or personal/socialcounseling to students. The CRDC survey item includes only counselors at the high school level.
Teacher Absenteeism: A teacher is absent if he or she is not in attendance on a day in the regular school yearwhen the teacher would otherwise be expected to be teaching students in an assigned class. This includes bothdays taken for sick leave and days taken for personal leave. Personal leave includes voluntary absences forreasons other than sick leave. Teacher absenteeism does not include administratively approved leave forprofessional development, field trips, or other off-campus activities with students.
Teacher meeting all state licensing/certification requirements: A teacher who has met all applicable stateteacher certification requirements for a standard certificate (i.e., has a regular/standardcertificate/license/endorsement issued by the state). A beginning teacher who has met the standard teachereducation requirements is considered to have met state requirements even if he or she has not completed astate-required probationary period. A teacher with an emergency, temporary, or provisional credential is notconsidered to have met state requirements. State requirements are determined by the state.
Year of teaching: The number of year(s) of teaching experience, including the current year, but not includingany student teaching or other similar preparation experiences. Experience includes teaching in any school,subject, or grade; it does not have to be in the school, subject, or grade that the teacher is presently teaching.
First-Year Teacher Analysis: This analysis compares the statewide percentage of students within each of the seven race and ethnicity categories (Hispanic/Latino, white, black/African American, Asian, Native Hawaiian/Other Pacific Islander, American Indian/Alaska Native, and Two or More Races) who are enrolled in schools with more than 20 percent of teachers in their first year of teaching in schools. See also above CRDC definition of “year of teaching.”
Teacher Salary Differences Analysis: For each district, the upper and lower quintiles of schools in percentage of combined black/African American and Latino enrollment were identified. To assign schools to quintiles, high schools were arranged in descending order of combined black/African American and Latino enrollment percentage. For the purposes of this analysis, a high school is defined as a school with grades 10 or 11 to include as many schools as possible in the analysis. For each quintile, high schools were selected until each quintile was equal to or greater than 20% of the total district enrollment. The number of students in the top and bottom quintile schools usually exceeds 20% of the total students in the district, because it is unlikely that the schools in the respective quintiles will comprise exactly 20% of the total enrollment. This analysis only includes school districts with more than one high school (64% percent of all high schools in the CRDC).
Total teacher salaries and teacher full-time equivalents (FTE) were used to compute the average teacher salary for each quintile. The average teacher salary in the top quintile of schools was computed using the average teacher salary of each school weighted by the total enrollment in each school. That average salary was in turn compared to the average teacher salary in the bottom quintile, again weighted by enrollment.
School Counselors Analysis: Nearly all high schools were able to report complete high school counselor data on the CRDC (99.97% of CRDC respondents). Percentages were calculated using the total number of high schools with greater than zero FTE of school counselors divided by the total number of high schools in the nation or state.
Teacher Certification Analysis: Nearly all schools were able to report complete teacher certification data on the CRDC. Percentages were calculated using the total FTE of teachers meeting all state certification or licensing requirements divided by the total FTE of teachers reported.
For more information about the CRDC, please visit: http://www2.ed.gov/about/offices/list/ocr/data.html.
*This Data Snapshot (Teacher Equity) (originally published on March 21, 2014) was revised on July 3, 2014.
U.S. Department of Education Office for Civil Rights 2 Civil Rights Data Collection: Data Snapshot (Teacher Equity) March 2014
United States Department of Education Arne Duncan, Secretary Catherine E. Lhamon, Assistant Secretary for Civil Rights
Lyndon Baines Johnson Department of Education Building 400 Maryland Avenue, SW Washington, DC 20202-1100
Telephone: 800-421-3481 FAX: 202-453-6012 TDD: 877-521-2172
Email: [email protected] http://www.ed.gov/ocr
About the CRDC Since 1968, the Civil Rights Data Collection (CRDC), formerly the Elementary and Secondary School Survey, has collected data on key education and civil rights issues in our nation's public schools for use by the Department of Education’s Office for Civil Rights (OCR) in its enforcement and monitoring efforts regarding schools’ and districts’ obligation to provide equal educational opportunity. The CRDC is also a tool for other Department offices and federal agencies, policymakers and researchers, educators and school officials, and the public to analyze student equity and opportunity trends locally and nationwide. The CRDC database, with hundreds of data elements, is fully accessible to the public. All data presented are self-reported by school districts. For more information about the CRDC, please visit http://ocrdata.ed.gov.
About the 2011-12 Civil Rights Data Collection (CRDC)
For the first time since 2000, includes data from every public school in the nation (approximately 16,500 schooldistricts, 97,000 schools, and 49 million students)
Includes traditional public schools (preschool through 12th grade), alternative schools, career and technicaleducation schools, and charter schools
Data for every public school disaggregated by race/ethnicity, English learner status, sex, and disability
New for 2014: data for all schools now disaggregated by seven race and ethnicity categories, including Native-Hawaiian, Pacific-Islander, and multiracial students
Measures student access to college- and career-preparatory science and math courses, AP courses and tests,SAT/ACT tests, gifted and talented programs, IB programs, preschool programs, and interscholastic athletics
Tracks teacher and resource equity, including teacher experience and salary levels, other personnel and non-personnel expenditures, and access to school counselors
Reveals school climate disparities related to student discipline, restraint and seclusion, retention, and bullyingand harassment