Embed Size (px)
Citation preview

NO. 0602S P D I S C U S S I O N P A P E R
Civil-service PensionSchemes Around theWorld
Robert PalaciosEdward Whitehouse
May 2006
Pub
lic D
iscl
osur
e A
utho
rized
Pub
lic D
iscl
osur
e A
utho
rized
Pub
lic D
iscl
osur
e A
utho
rized
Pub
lic D
iscl
osur
e A
utho
rized
Pub
lic D
iscl
osur
e A
utho
rized
Pub
lic D
iscl
osur
e A
utho
rized
Pub
lic D
iscl
osur
e A
utho
rized
Pub
lic D
iscl
osur
e A
utho
rized

Civil-service pension schemes around the world
Robert Palacios and Edward Whitehouse
May 2006
PENSION
REFORM
PRIMERre-for´m
v.t. & i. 1. make (institution, procedure
etc.) better by removal or abandonment
of imperfections, faults or errors
primer n. 1. elementary book to
equip person with information
pe nsion n.
1. perio
dic paym
ent
made on ret
irement or
above
specified
age

2
Abstract
There are separate pension schemes for civil servants in about half of the world’s countries, including some of the largest developing economies, such as Brazil, China and India. In the higher-income, OECD countries, spending on pensions for public-sector workers makes up one quarter of total pension spending. In less developed countries, this proportion is usually higher. Yet, very little has been written on the design and reform of civil-service pension plans, especially when compared with the voluminous literature on national pension programs.
This paper compares civil service pension schemes across countries in terms of benefit provision and cost. We find that in many developing countries, these expenditures are a greater fiscal burden than in higher income countries where the tax base is larger. The paper also compares schemes within the same country covering private sector workers. Finally, we review key policy issues related to pension schemes covering civil servants as well as other public sector workers. In particular, we find that there is little justification for maintaining parallel schemes in the long run.

3
Civil-service pension schemes around the world
Robert Palacios and Edward Whitehouse1
May 2006
Edward Whitehouse works at the Social Policy Division of the OECD in Paris and Robert Palacios is Senior Pension Economist, Social Protection Department, World Bank. Correspondence: e-mail: [email protected] and Robert Palacios, World Bank, 1818 H St NW, Washington DC 20435; web-site: http://www.worldbank.org/pensions; e-mail: [email protected]. The authors are grateful to Larry Thompson of the Urban Institute and Robert Holzmann, Director of Social Protection at the World Bank for their helpful comments and advice. Montserrat Pallares-Miralles and Yvonne Sin of the World Bank have also provided valuable input. The paper has also benefited from comments at a seminar at the World Bank (July 2004), an Asian Development Bank/International Network of Pension Regulators and Supervisors meeting in Manila (March 2004), World Bank Institute workshops in Malta (June 2003) and Paris (September 2003) and a conference at the Centre for Pensions and Superannuation, University of New South Wales (March 2002). Initial research in this area by Whitehouse was financed by the Initiative for Policy Dialogue at Columbia University, New York.
PENSION
REFORM
PRIMERre-for´m
v.t. & i. 1. make (institution, procedure
etc.) better by removal or abandonment
of imperfections, faults or errors
primer n. 1. elementary book to
equip person with information
pe nsion n.
1. perio
dic paym
ent
made on ret
irement or
above
specified
age

4
Table of Contents 1. Introduction and overview....................................................................................................7
2. Key design features of civil service pension schemes .....................................................10
2.1 Institutional arrangements ..............................................................................................11
2.2 Eligibility criteria: pension age and length-of-service conditions .............................12
2.3 Replacement rates and indexation provisions .............................................................15
2.4 Sources and method of financing..................................................................................20
3. Reforming civil service pensions: key issues .........................................................................22
3.1 Fiscal impact .....................................................................................................................23
3.2 Labor market impact .......................................................................................................40
3.3 Dualism and integration..................................................................................................57
4. Sub-national government, public enterprises and military personnel ...............................64
5. Conclusion .................................................................................................................................73
6. Bibliography...............................................................................................................................76
Annex 1: Civil-service pension arrangements ..........................................................................81
Annex 2: Notes on tables ............................................................................................................84
Annex 3: Civil servants covered by DC schemes ....................................................................86

5
Tables
Table 1: Retirement age and service criteria for civil-service .....................................................14
Table 2: Accrual rates and maximum pension replacement rates for civil servants versus
replacement rate for national-scheme, full-career worker...................................................16
Table 3: Indexation procedures for pensions in payment, civil-service schemes.....................17
Table 4: Accrual rates and indexation provisions for DB civil service pensions for full career
workers in selected non-OECD countries, 2004 .................................................................19
Table 5: Central government employment, 1980s and 1990s ....................................................28
Table 6: Implicit pension debt of civil service and national schemes ........................................36
Table 7: Recent reforms to civil-service pension schemes in OECD countries.......................37
Table 8: Parametric reforms to national and civil service pension schemes ............................40
Table 9: Vesting periods for civil service schemes in selected countries ...................................44
Table 10: Portability and preservation of pension rights .............................................................45
Table 11: Integration of civil service pension schemes ................................................................61
Table 12: Structure of state pension schemes, United States .....................................................65
Figures
Figure 1: Institutional arrangements for civil-service pensions by region ................................12
Figure 2: Financing of civil servant versus national schemes ......................................................21
Figure 3: Expenditure on pensions of civil servants, high-income, OECD countries ...........24
Figure 4: Expenditure on civil-service pensions, non-OECD countries ...................................25
Figure 5: Expenditure on civil-service pensions, OECD countries ..........................................26
Figure 6: Expenditure on civil-service pensions, non-OECD countries ...................................27
Figure 7 Cumulative age distribution of civil servants and private-sector workers ...............29

6
Figure 8: Age distribution of pension scheme members..............................................................30
Figure 9: Spending on central-government wages and pensions, ...............................................33
Figure 10: Spending on civil service pensions, share of GDP, Bangladesh, Mexico, Nepal,
1992-2004...................................................................................................................................34
Figure 11: Spending on civil service pensions ...............................................................................34
Figure 12: Civil service wage compression, Nepal 1970-2003 ....................................................42
Figure 13: Value of accrued pension rights by age, Mauritius.....................................................46
Figure 14: The pension cost of moving jobs, Mauritius...............................................................47
Figure 15: Value of accrued pension rights by years of service, Cape Verde............................48
Figure 16: Pension cost of leaving a civil-service job, Cape Verde ............................................49
Figure 17: The pension cost of moving jobs, United Kingdom .................................................50
Figure 18: The pension cost of moving jobs, Germany...............................................................51
Figure 19: Job mobility in different sectors ..................................................................................52
Figure 20: Pension spending for civil servants and military in India and Pakistan ..................70
Figure 21: Age distribution of pensioners in Lebanon.................................................................71

7
Civil-service pension schemes around the world Robert Palacios and Edward Whitehouse
1. Introduction and overview
Civil servants and other public-sector employees — in the military, education,
publicly owned enterprises etc. — were often among the first groups of workers to be
covered by government-sponsored pension schemes (see Box below). In a handful of
countries — including Bangladesh, Bhutan, Botswana, Eritrea, Lebanon and the Maldives —
public-sector employees are still the only group covered by a formal pension scheme.
The rationale for providing pensions for government employees was somewhat
different from that behind the creation of national pension schemes.2 Among the objectives
particular to schemes for government workers were the following:
• securing the independence of public servants;
• making a career in public service attractive;
• shifting the cost of remunerating public servants into the future; and
• retiring older civil servants in a politically and socially acceptable way.
When mandatory pension coverage was expanded to the private sector, there often
seemed little point in including civil servants — who already had their own arrangements —
in new national schemes. Civil servants have also proved powerful in protecting their own
financial interests. Furthermore, while civil-service pension schemes share some of the
social-policy goals of national pension programmes, they must also accommodate the
government’s human-resources policy as an employer. For these reasons, special
retirement-income schemes for the public sector have often persisted. The issue of
2 Throughout this paper, the term ‘national pension scheme’ is used to refer to plans that cover private-sector employees. The coverage of these plans can vary, with some also covering public-sector workers, the self-employed etc.

8
‘dualism’3 — whether civil-service schemes are integrated with national schemes covering
private sector workers or are separate — is a central policy question in those countries where
parallel systems remain.
This paper focuses on countries with separate civil-service pension schemes (or
where only civil servants are covered). Although schemes covering sub-national
governments — local authorities and states in federal countries — and public-sector
enterprises are discussed, the focus is on federal level civil servants. Similarly, pension
arrangements for the military are sometimes integrated with other public-sector workers and
sometimes provided separately. Again, the focus is, where possible, on the civil-service
pension program.
The objective is, first, to review the data and information available on civil-service
pensions at a global level; and, second, to provide some guidance as to good policies and
practices. The main policy issues fall into three broad categories. First, what is the impact
of civil servant pensions on fiscal policy and how does it differ from other schemes? The
second is how civil-service pensions affect labor markets, which also touches on general
questions of civil-service remuneration and compensation. While both topics are also
relevant for a diagnosis of a national pension scheme, closer inspection reveals analysis and
reform of civil servants’ pensions pose special challenges. The third area of interest —
whether maintaining administratively separate schemes for public-sector workers is justified
— has already been noted. Our general conclusion is that the costs of ‘dualism’ generally
outweigh the benefits, especially in countries with small populations and/or limited
pension-system coverage. However, there are obstacles to integration, such as administrative
complexity, fiscal implications and the political economy of such a change.
The paper is structured as follows. Section 2 reviews the design of civil service
schemes around the world and compares them to national schemes where information is
available. The general finding is that civil service pension schemes offer more generous
terms, tend to have lower funding ratios and have higher per member liabilities than other
3 In practice, some countries have many more than two, parallel schemes. For example, some cover contractual workers in the public sector under a different program from permanent officials. Others have separate schemes for the military and for quasi-autonomous institutions, such as schools and universities.

9
schemes. In many countries, civil service pensions are becoming a major fiscal burden,
threatening to crowd out other programs, especially in low-income countries with limited tax
bases. Indeed, many of the lowest-income countries have already requested technical
assistance and financial support for reform of public-sector pension schemes from the
World Bank and other international organizations.
In Section 3, we address the three policy questions raised above: fiscal implications,
labor-markets effects and the rationale for dualism. The differences between analysis of
national pension schemes (for private-sector workers) and of civil-service programs have
important implications for the type of reforms — parametric and systemic — that can be
contemplated.
Section 4 discusses pension schemes that cover employees within the broadly
defined public sector other than federal civil servants. The most important of these are
those for the military, public-sector enterprises and sub-national government. We find that
many of the arguments regarding dualism apply here as well. This section argues that
customized solutions within an integrated system are possible, even for groups with risks
that are difficult to pool, such as the military.
Section 5 summarizes the results of the study and draws some tentative conclusions
as to general policy advice.

10
Box. A brief history of early pension schemes
The military was typically the first to receive pension coverage, especially with regard
to disability and survivor benefits. The English and Spanish governments were already
providing pensions to their veterans in the 17th century and a naval pension was set up in the
United States before it had even ratified its Constitution in 1787.4
In his study of the origins of the British civil service pension scheme, Raphael (1964)
finds that the first provisions were made on a discretionary and individual basis.5 These
evolved into a more formal system with the first superannuation fund for public sector
workers introduced in 1712 for customs officials. In 1810, the foundation of the British civil
servants scheme was legislated by Parliament. While the parameters described in the original
Act would be changed many times subsequently, the underlying model of a generous and
non-contributory pension scheme survived nearly two centuries and was inherited by dozens
of former British colonies.
2. Key design features of civil service pension schemes
This section reviews the main rules and parameters of civil-service pension
programs. The parameters include eligibility criteria, the defined benefit formula and
contributions from the employee and from the government as employer. Where possible,
comparisons with the national scheme that covers other formal sector workers are
presented.
4 Clark, Craig and Wilson (1999). 5 According to his research, the first person awarded a civil service pension was Martin Horsham, an employee in the Port of London in 1684.

11
2.1 Institutional arrangements
With information for 158 countries, a little more than half can be categorized as
having separate retirement-income arrangements for civil servants.6 (The Tables in Annex 1
provide more details on individual countries.) Figure 1 shows substantial regional variation
in the prevalence of parallel schemes. They are found throughout South Asia (seven
countries) and in most of Africa (32 out of 39 countries). They are more common than
integrated schemes in the Middle East/North Africa and East Asia. Integrated schemes are
more common in Latin America and are universal in Eastern Europe/Central Asia. The
regional patterns mostly reflect historical differences. For example, Anglophone African and
South Asian scheme were inherited from British colonial rule. In contrast, integration was a
natural arrangement under socialism in Eastern Europe and the FSU.
There are, naturally, many gray areas in this analysis. This is because of the
complexity of most countries’ pension arrangements.
In 12 OECD countries, for example, civil servants are covered by the national
pension scheme but have their own, top-up retirement-income arrangements. These
countries are counted as ‘integrated’ in Figure 1. This group includes Canada, Ireland and
Spain — with additional defined-benefit pensions for civil servants — and the United States
— which has a top-up defined-contribution arrangement, known as the Thrift Savings Plan,
and a legacy system. In many of these countries, many private-sector workers have
voluntary top-up arrangements, often with similar rules to the civil-service scheme. In two
OECD countries — Australia and the United Kingdom — civil servants are covered by part
of the mandatory pension arrangements that cover private-sector workers. The integrated
model with special top up schemes is not common outside the OECD countries and we
cannot cite any examples.
6 Note that this understates the role of parallel civil service schemes since countries that are in a transition to an integrated scheme (for example, covering only new civil servants in the national program) are counted as already integrated.

12
Figure 1: Institutional arrangements for civil-service pensions by region (per cent of and number of countries with integrated or separate programs)
0 25 50 75 100
Eastern Europe/Central Asia
Latin America/Caribbean
OECD
East Asia
Middle East/North Africa
Africa
South Asia
SeparateIntegrated
7
32 7
12 15
27
13 12
9 6
11 7
Source: authors’ calculations.
2.2 Eligibility criteria: pension age and length-of-service conditions
Table 1 shows the pension eligibility age in civil-service schemes; data for national
schemes are shown for comparison where available. The normal retirement age is found to
be the same or lower for civil servants in most countries. Furthermore, evidence for a range
of developing countries suggests that civil servants have a longer life expectancy than the
rest of the population. This further adds to the longer average duration of retirement of civil
servants compared with others arising from the earlier pension eligibility age.
The age criteria for pension receipt have often not changed over many years or even
decades, despite increasing life expectancy. (The same can, of course, be said for many

13
national schemes.) However, a few countries have increased the age recently, as in the case
of Senegal where normal retirement age was increased from 55 to 60 in 2001.
The mean normal pension age for men in the civil service is 58.6. In some cases, the
age is lower for women. Again, different ages between the sexes are still often found in
national schemes.
Eligibility is sometimes tied only to length of service, but more rarely than in the
past. For example, Brazil introduced a pension eligibility age in 1998 and Turkey has been
phasing in such a condition since 1999. It is still the case in Mexico — where men can retire
at any age after 30 years of service and women after 28 years — and in Iran — where civil
servants can retire regardless of age after 20/30 years (women/men). In the Maldives,
individuals can receive pensions after 20 years without leaving active service. They can
receive a second or even third pension each time they meet the length of service condition.

14
Table 1: Retirement age and service criteria for civil-service versus national pension schemes, 2004
Civil-service scheme National scheme
Minimum Normal Years of service Minimum Normal Years of service
High-income OECD countries Australia 55-60 55 65 Austria 60 56.5/61.5 60/65 Belgium 60 60 65 Canada 55 65 25 60 65 Denmark 60 67 67 Finland 60 63-65 60 65 France 60 56 60 Germany 62/63 65 63 65 Greece 60 57 65 Iceland 60 65 67 Ireland 65 66 Japan 65 25 55 65 Luxembourg 57 65 Netherlands 61 65 60 65 Norway 62 67 62 67 Portugal 60 36 55 65 Spain 60 30 60 65 Sweden 60 65 61 65 Switzerland 60 62 63 64/65 United Kingdom
50 60 65
United States 62 67 Latin America/Caribbean Brazil 55/60 Mexico 55 15 60 65 Paraguay 50 60 30 60 25 Africa Burkina Faso 53 60 55 15 Burundi 55/60 55 15 Cameroon 60 15 Cape Verde 60 60/65 3 Cote D’Ivoire 55/60 Ethiopia 55 10 no scheme Kenya 50 55 10 50 55 Malawi 55 20 no scheme Mauritius 60 15 60 Nigeria 50 60 10 Senegal 60 60 Togo 55 15 Zambia 50 55 10 55 Middle East/North Africa Bahrain none 60 15-25 45 55/60 15/20-10/15 Djibouti 55 25 55 25

15
Iran none 60 20/30-0 none 60/55 20/30-10 Lebanon 60 25 no scheme Morocco none 60 21/15-0 60 15 Tunisia 50 60 15 50 60 30-10 West Bank/Gaza none 60 20-15 no scheme Yemen none 55/60 30-15 none 55/60 30/25-15 South Asia Bhutan 60 no scheme Nepal 50 58 20 no scheme India 60 58 Maldives none no scheme Pakistan 60 Sri Lanka 60 55 East Asia/Pacific China 50/55 55/60 30 55/60 20 Indonesia 50 56 20 Korea 60 65 Malaysia 50 55 10 Philippines 60 65 15 Thailand 50 10 55 15
Note: where pension ages differ between men and women, the ages are shown F/M. Similarly, where the contribution requirement differs between men and women, they are shown F/M. Where the contribution requirement is stricter for early retirement than it is for claiming the pension at the normal pension age, the years are shown early-normal
Where there is a combination of age and service conditions, the service period
requirement is typically not binding. Some two-thirds of countries require service of 21
years or less. Most of these countries still operate a system of lifetime civil-service
employment with maximum ages of entry to the public sector. People will therefore have
typically reached the years-of-service requirement when they reach the pension age.
However, the years-of-service requirements and vesting rules may have an important impact
on flexibility, mobility and equity in certain cases. This is discussed later in Section 3.
2.3 Replacement rates and indexation provisions
The vast majority of civil service pension schemes are of the defined-benefit type.
This section looks at their benefit formulae and their provisions for uprating pensions in
payment (indexation).

16
Table 2 shows, first, the accrual rates in civil-service pension schemes in selected
OECD countries (including some schemes where there is a supplementary pension in
addition to the national scheme, i.e., partial integration). These are the pension entitlement
(as a proportion of the relevant earnings base) that is awarded for each year of service.
Usually, these are linear: that is, a single rate applied to each year of service. The table also
gives the pension replacement rate for a full-career worker in the civil service. This averages
a little more than 75 per cent, with a range from 50 to 100 per cent. The table also gives the
replacement rate under the national pension scheme for a full-career worker earning the
economy-wide average.7
In EU countries, the terms of civil service schemes are in many respects similar to
those of national pension schemes. In Finland, the Netherlands and Sweden, for example,
occupational schemes for private-sector employees offer the same or very similar terms as
the public-sector scheme (in the first case by law and in the second and third, by collective
agreements).
Table 2: Accrual rates and maximum pension replacement rates for civil servants versus replacement rate for national-scheme, full-career worker
Country Accrual rate (civil service)
Maximum replacement rate
National scheme
OECD countries Australia 1.65-3.4 66-88 52 Austria 2 80 80 Belgium 1.667 75 60 Canada 2 90 56 Finland 1.5 60 60 France 2 75 71 Germany 1.875 75 46 Greece 1.714 69 Iceland 1.9 76 73 Italy — 80 66 Luxembourg 1.667 83 71 Norway 2.2 66 53 Portugal 2 80 Spain — 95 88 Sweden 0.33/2.17 73 76 Switzerland — 65 58 United Kingdom 1.25 67 37
Note: the accrual rate varies with the earnings level in Sweden
7 Details of the calculation are given in Whitehouse (2004) and OECD (2004).

17
In a few countries, there are sizeable differences. In Germany, for example, a
full-career, private-sector worker on average earnings can expect a replacement rate of
around 40 per cent compared with 75 per cent for the civil-service plan. In the United
Kingdom, the replacement rate from the basic scheme plus the public, earnings-related
scheme for a similar worker would be around 35 per cent, compared with 67 per cent from
the civil service scheme. The former civil servant would receive the basic pension on top,
worth around 15 per cent of average earnings currently. The civil service scheme is also
more generous than the benefits arising from mandatory provision for private-sector
workers in Spain and Switzerland. In all these countries, some private-sector employers
offer occupational plans that can give replacement rates nearer to those applying in civil-
service pension schemes.
Indexation of pensions in payment tends to be more favourable in civil-service
schemes in OECD countries than those applied in the main national scheme. The latter are
nearly always based on prices (Table 3). Of the six countries that index pensions of civil
servants to wages, three have either price (France, Brazil and Mexico) or discretionary
adjustments (Turkey) in the other scheme. Naturally, this indexation is only more favourable
than uprating in line with prices if real wages rise over time.
Table 3: Indexation procedures for pensions in payment, civil-service schemes
Prices Civil service earnings Economy-wide earnings
Combination
Australia Austria Norway Belgium Canada France Denmark Iceland Germany Finland Italy Brazil Greece Spain Mexico Luxembourg Sweden Turkey Netherlands Switzerland Portugal United Kingdom
Table 4 compares accrual rates and indexation methods for schemes covering public
and private sector workers in 32 middle and low income countries. Again, the pattern is that
conditions in civil service schemes are more generous. Indeed, in several countries, there is
no pension scheme for private-sector workers. Accrual rates are on average more than 20

18
per cent lower for private workers in the formal sector than they are for civil servants.
These accrual rates are based on full career comparisons and therefore do not take into
account some of the non-linear features of benefit formulae being compared.
19
Table 4: Accrual rates and indexation provisions for DB civil service pensions for full career workers in selected non-OECD countries, 2004
Civil service National scheme Accrual rate (%) Indexation Accrual rate (%) Indexation
Latin America/Caribbean Brazil 2.86 D D Honduras 2.25 D 1.875 D Mexico 2.375 D DC P Paraguay 3.1 D 2.5 D Venezuela 2.5 W 1.375 D Africa Benin 2 D 1.71 D Burkina Faso 2 P 1.33 P Burundi 1.67 D 2 D Cape Verde 2.9 W 2 D Cote D’Ivoire 2 D 1.7 W Gabon 2 D 1.57 D Madagascar 2 D 2 D Mali 2 D 1.67 P Mauritius 2 W D Nigeria 2 D 1.875 D Senegal 2 D 1.0 D Togo 2 W 1.33 P Middle East/North Africa Djibouti 2.25 D 2.0 D Iran 3.3 D 3.3 D Morocco 2.5 W 2.0 D Tunisia 1.75 W 1.875 D South Asia Bangladesh 3.2 D None n.a. Bhutan 2.0 W None n.a. India* 1.52 P and D 1.52 D Maldives 2.5 D None n.a. Nepal 2.5 2/3 W DC n.a. Pakistan 2.33 D 2.0 D Sri Lanka 3.0 D DC n.a. East Asia Indonesia 2.5 D DC n.a. Korea 2.3 n.a. n.a. Malaysia 2.0 D DC n.a. Philippines 2.18 D 2 D Thailand Note: D = discretionary; P = prices, W = wages, DC = defined contribution; n.a. = information not available. * India refers to old civil service pension scheme.
Comparisons of the effect of indexation procedures on pension benefits are
complicated by the prevalence of discretionary adjustments in both kinds of scheme. These

20
ad-hoc changes in benefit levels tend to reflect the financial condition of each pension fund
or, in the case of public-sector workers, the budget situation more generally. Their level is
also influenced by the relative political strength of civil servants and their representative
organizations. Where automatic indexation is present, however, it usually favors former civil
servants over members of the national pension scheme.
In practice, lack of automatic indexation — in both civil-service and national pension
programs — leads to large and discrete changes in the real value of pensions. In the former
case, these are often tied to similarly dramatic changes in civil-service pay. In India, for
example, pension increases have been negotiated along with wages and other benefits for
civil servants every decade or so as part of the pay-commission system that has prevailed for
most of the last century. The result is an unpredictable income stream for pensioners and
large income differences between cohorts depending on the year that they happen to retire.
Another interesting indexation practice is differential adjustment in low and high
pension values. This can be achieved either by raising lower pensions with a higher
percentage adjustment or by increasing all pensions by flat amounts. This practice parallels
the wage compression that has been typical in many developing-country civil services in the
last few decades (see below).
2.4 Sources and method of financing
A third aspect of pension system design that often varies between public- and
private-sector schemes is the type of financing.
The first important distinction is the extent to which schemes accumulate reserves to
meet their future liabilities. Civil-service schemes are generally financed on a pure, pay-as-
you-go basis. Less than one in four plans has accumulated any reserves. In contrast, slightly
more than half of national schemes have some reserves.
As in the case of national schemes, recent reform trends have led to more funding in
the form of new defined contribution schemes. Recent examples include Thailand (1997),
Panama (1998), Botswana (2001), Hong Kong (2001), India (2004), Nigeria (2004) and

21
Australia (2005). (Annex 3 lists the countries in which civil servants participate in either an
integrated or a parallel DC scheme.) The pattern of funding also reflects the fact that many
of the national schemes with fully funded components are found in Latin America and
Eastern Europe. In the case of Eastern Europe, national schemes already covered civil
servants albeit often with different rules for different groups of workers. The Latin
American reforms that introduced mandatory, defined-contribution plans integrated separate
civil service schemes during the reform process (with the exception of Mexico).
Figure 2: Financing of civil servant versus national schemes
Civil servant schemes
PAYGO/unfunded
partially funded
fully funded
National schemes
fully funded
partially funded
PAYGO/unfunded
Source: authors’ calculations.
A second issue in the financing of the schemes is the role of contributions from
employers (i.e., the government in the case of civil-service schemes) and employees. Around
one in four of the unfunded schemes are ‘non-contributory’8 in the sense that there are no
explicit contributions levied on either employer or employee. The government simply picks
up the bill for civil-service pensions. They are found almost exclusively in former British
colonies in the Caribbean, sub-Saharan Africa and South Asia.
8 Note that the term ‘non-contributory’ is also used in the pension literature to refer to social-assistance or basic, universal pensions that are typically financed from general revenues and paid to all citizens meeting an age and/or income requirement.

22
To a certain extent, whether or not pension spending is financed through
contributions, as opposed to direct budget support, is immaterial. This is particularly clear
with employer contributions from the government where it would simply entail re-labeling
the flows with no impact on consolidated deficits. Even in the case of an employee
contribution, it can be argued that since civil service wages are not determined freely and
negotiations are based on net wages, the incidence of an employee contribution would still
fall on the budget. On the other hand, the lack of an earmarked contribution reduces
transparency and can make certain reforms more difficult – including integration of civil-
service and national schemes.
The important point to be taken from this brief look at financing arrangements is
that pre-funding of retirement-income liabilities is less common for civil servants’ pensions
than for national programs. Combined with the greater generosity that characterizes
civil-service schemes and the large share of the formal sector working in low-income
countries’ public sector, the burden of civil-service pensions on the budget may be
significant. Just how much so is explored in the next section.
3. Reforming civil service pensions: key issues
A growing number of countries with separate civil service pension schemes are
considering different reform options. These efforts are largely motivated by fiscal pressures.
Pay-as-you-go civil-service schemes are maturing, resulting in an increase in the ratio of
pensioners to workers. While there is significant variation across countries, there is a general
upwards trend in spending on civil service pensions. This section presents available figures
on the magnitude of the pension share in public spending and on the demographic
development of civil-service and national schemes. It also considers the options and the
arguments for reducing the cost of pensions to the government budget. It will become
apparent that there are important differences in how parametric reforms affect the fiscal
situation when the scheme in question covers civil servants rather than the private sector.

23
Likewise, changes to the pension scheme for civil servants must take into account
the specific labor-market and human-resource considerations that arise when the
government is both the employer and the plan sponsor. While private-sector workers are
typically mobile (between jobs), the emphasis in the public sector has been on stability:
ensuring that all workers remain in the public sector for a considerable period, if not their
whole career. More recently, the government has increasingly required a flexibility that
traditional pension arrangements cannot deliver: for example, in public-sector reform
(outsourcing, downsizing, divestiture, privatization etc.) and in making efficient use of scarce
human capital (recruitment of private-sector expertise).
The third topic of this section is the institutional arrangements for civil-service
retirement incomes: specifically, ‘dualism’ in public-sector pension provision versus
integration with the national pension system. This section explores some of the practical
issues in a policy of integration, including fiscal and labor-market effects.
3.1 Fiscal impact
The last section provided evidence suggesting that civil servants’ pension benefits
were generous relative to those covering the private sector. They were also less likely to
have accumulated reserves to offset liabilities. The demographic position of civil-service
pension schemes are often less favorable than national programs (i.e., civil servants tend to
have a higher median age and the schemes are at a later stage of maturation). As a result, the
share of the budget devoted to civil-service pensions has grown rapidly in many countries.
This in turn has often motivated reform proposals.
Current spending levels
The OECD countries currently spend an average of nearly two per cent of GDP on
pensions for civil servants and other public-sector workers. But, as Figure 3 shows, there is
a large variation around this mean. The differences appear to be only partly related to the

24
generosity of benefits. For example, expenditures are low despite high accrual rates in
Canada and Spain. The relative size of the civil service is a better predictor.
Figure 3: Expenditure on pensions of civil servants, high-income, OECD countries
(per cent of GDP)
0 0.5 1 1.5 2 2.5 3 3.5 4
Ireland (00)
Spain (00)
Japan (00)
Netherlands (00)
Denmark (00)
Canada (01)
Australia (01)
Germany (00)
United States (01)
Finland (00)
United Kingdom (00)
France (00)
Belgium (98)
Austria (00)
Source: OECD Social Expenditures Database
This ratio also varies greatly across low- and middle-income countries. Figure 4
shows a range from less than 0.5 per cent of GDP to more than two per cent of GDP. The
average spending on civil-service pensions is around 1.2 percent of GDP, or about 60 per
cent of the OECD average.

25
Figure 4: Expenditure on civil-service pensions, non-OECD countries (per cent of GDP)
0.0% 1.0% 2.0% 3.0% 4.0% 5.0%
Nepal (05)Bangladesh (02)
Iran (01)Venezuela (01)Indonesia (02)Pakistan (03)Mexico (01)Korea (97)
Philippines (97)Cameroon (01)
Senegal (04)China (02)Benin (98)
Morocco (02)Cape Verde (04)
Kenya (02)Jordan (02)Nigeria (02)Malaw i (99)
India (04)Mauritius (00)Sri Lanka (02)
Turkey (03)Zimbabw e (01)
Tunisia (02)Brazil (04)
per cent of GDP
Average 1.33
Source: World Bank pension database. India includes state level pension spending.
The ratio of spending to GDP provides an incomplete picture of the fiscal burden of
civil-service pension schemes. In OECD countries, tax revenues average nearly 37 per cent
of GDP.9 Revenues are more limited in most developing countries. Ultimately, both the
wage and pension bills of the public sector are constrained by the revenues available to the
government and its ability to borrow. It follows, therefore, that the opportunity cost of
paying civil-service pensions is more accurately captured by the share of available public
money that this expenditure consumes. A better indicator of the fiscal pressure of
9 OECD (2004b).

26
civil-service pension spending than its ratio to GDP is therefore its ratio to government
revenues. This is shown in Figure 5 and Figure 6. In the OECD countries, it varies between
2.5 and 7.5 per cent of general government revenues, with an average of five per cent.
In developing countries, the range is much larger: from two to 12 per cent of
revenues. The average is around six per cent: significantly higher than the average in the
OECD countries. In Brazil and Sri Lanka, one tenth or more of available revenues are used
to finance civil service pensions. (Note that the figure for India understates the fiscal burden
since it excludes state civil service pensions and Indian states depend heavily on federal
transfers.)
Figure 5: Expenditure on civil-service pensions, OECD countries (per cent of government revenues)
0 2.5 5 7.5 10
Denmark (00)
Spain (00)
Netherlands (00)
Ireland (00)
Canada (01)
Japan (00)
Australia (01)
Germany (00)
Finland (00)
United States (01)
France (00)
United Kingdom (00)
Belgium (98)
Austria (00)
Source: OECD Social Expenditures database; OECD Revenue Statistics

27
Figure 6: Expenditure on civil-service pensions, non-OECD countries (per cent of government revenues)
0% 5% 10% 15%
Mexico (01)Nepal (05)
Indonesia (02)Iran (01)
Cameroon (01)Pakistan (03)
Philippines (97)Nigeria (02)
Morocco (02)Korea (97)
Jordan (02)Bangladesh (02)
Kenya (02)Cape Verde (04)
Senegal (04)Mauritius (00)
Benin (98)Tunisia (02)Malawi (99)Turkey (03)
Sri Lanka (02)India (04)Brazil (04)
per cent of revenues
average = 6.8%
Source: World Bank pension database. Data for India apply to federal level only.
Age distribution and internal demographics
Table 5 shows that the growth in the number of civil servants has not kept up with
the growth of the population in the 1990s. In both developing and OECD countries,
central-government employment has fallen relative to population by a full percentage point.
This is equivalent to a decline (again, relative to population) of around a third in the OECD
countries and 45 per cent in the developing economies.

28
Table 5: Central government employment, 1980s and 1990s (per cent of total population)
early 1980s early 1990s Africa 1.8 1.1 Asia 2.6 1.1 Latin America 2.4 1.5 All developing countries 2.2 1.2 OECD 2.9 1.9
Source: Heller and Tait (1983) and Schiavo-Campo, de Tommaso and Mukherjee (1997b)
As a result of these growth patterns, we would expect that the internal demographics
of civil service schemes would diverge from that of the general population and from those of
the national pension scheme in particular. We would expect that in many countries civil
servants would be older, on average, than the national labor force and that the base of the
contributor pyramid may not be expanding over time. Finally, civil-service schemes often
started earlier than national schemes did.
Evidence of the age structure of the civil service is difficult to find. Here, we present
detailed age distribution from three countries – Brazil, Egypt and Iran – based on data
collected by the World Bank for the purposes of projecting pension spending.
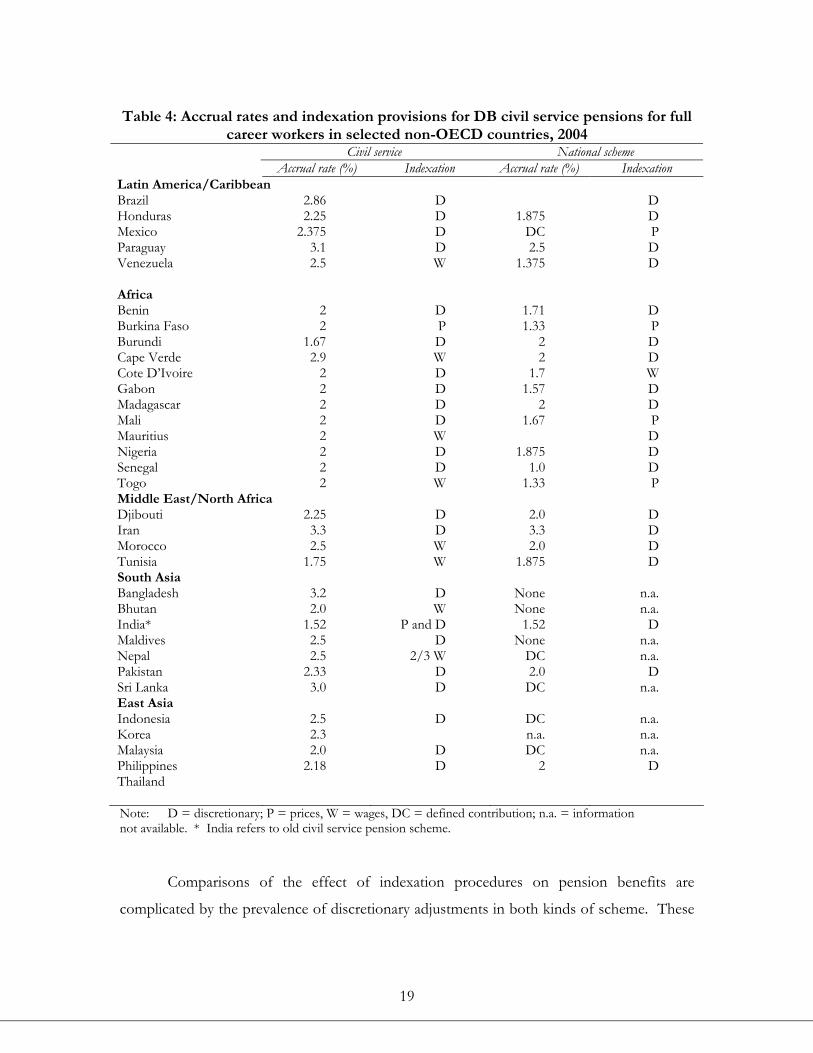
Figure 7 and Figure 8 below compare the age distribution for members of the
pension schemes covering private sector workers with the age distribution of civil servants.
In Brazil and Egypt, the expected pattern emerges: the median age of civil servants is higher
by 10 and 5 years, respectively. The scheme covering private sector workers looks much
more like a pyramid with an expanding population base while the civil service bulges in the
40+ age brackets, probably reflecting past hiring expansions followed by more recent
stagnation.
Iran’s civil service and private formal sector in contrast, do appear to have similar age
profiles. The common feature in all three countries is that the private sector distribution has
longer tails at each end of the age range. This would be expected given the tendency for
governments to hire graduates and to place minimum age restrictions as well as mandated
retirement ages.

29
Figure 7 Cumulative age distribution of civil servants and private-sector workers
Brazil, 1998
0%
10%
20%
30%
40%
50%
60%
70%
80%
90%
100%
20 23 26 29 32 35 38 41 44 47 50 53 56 59 62 65 68 71 74
age
cum
ulat
ive
shar
e of
mem
bers
civil servants
private sector
Iran, 2001
0%10%20%30%40%50%60%70%80%90%
100%
1 4 7 10 13 16 19 22 25 28 31 34 37 40 43 46 49 52
age
cum
ulat
ive
shar
e of
mem
bers
civil servants
private sector
30
Egypt, 2005
0%
10%
20%
30%
40%
50%
60%
70%
80%
90%
100%
18 21 24 27 30 33 36 39 42 45 48 51 54 57 60 63
age
cum
ulta
tive
% o
f mem
bers
civil servants
private sector
Source: Authors’ calculations
Figure 8: Age distribution of pension scheme members
Iran, 2001
0.0%
0.5%
1.0%
1.5%
2.0%
2.5%
3.0%
3.5%
4.0%
4.5%
5.0%
20 24 28 32 36 40 44 48 52 56 60 64
Age
% o
f mem
bers
civil servants
private sector workers

31
Brazil, 1998
0.0%
1.0%
2.0%
3.0%
4.0%
5.0%
6.0%
19 22 25 28 31 34 37 40 43 46 49 52 55 58 61 64 67 70
age
per c
ent o
f mem
bers civil servants
private sector
Egypt, 2005
0.0%
1.0%
2.0%
3.0%
4.0%
5.0%
6.0%
18 21 24 27 30 33 36 39 42 45 48 51 54 57 60 63
age
per c
ent o
f mem
bers
Civil servantsprivate sector workers
Source: Authors’ calculations

32
Both of these factors — late entry and early retirement — are likely to affect the
internal demographics of many civil service schemes in countries with dual pension systems.
In addition, as civil service jobs are more stable, it is likely that ‘contribution densities’ are,
on average, higher in civil service schemes.10 In defined benefit schemes, a higher average
contribution period will generally translate into higher benefits and will allow the worker to
meet the vesting requirements at an earlier age. Both of these factors would lead to earlier
retirement. Finally, some countries have used early retirement as part of a civil service
downsizing exercise. This too would also tend to reduce the proportion of older members
relative to the private sector scheme.
Recent spending trends
While growth in the civil service, along with wage bills has often slowed or even
stopped in developing countries, the pension bill for public-sector employees has often
continued to grow rapidly. This is not surprising, given the long lag between the reduction
in employment and the reduction in the number of retired civil servants (and their
survivors). This ‘inertia’ in pension spending can even be exacerbated when the pension
scheme is used to facilitate ‘downsizing’ (for example, through special incentives to retire
early).
10 The age distribution of workers covered is a snapshot of members in a particular year. The greater the rotation in membership, the lower will be the average contribution period.

33
Figure 9: Spending on central-government wages and pensions, Brazil 1987-1998
0
50
100
150
200
250
300
350
400
450
500
1987 1988 1989 1990 1991 1992 1993 1994 1995 1996 1997 1998
Inde
x 19
87=1
00
wage bill
pension bill
Source: World Bank (2004).
Data on trends in civil-service pension spending in some of the larger developing
countries shows a rapid increase compared to wages, the government budget and national
income. An extreme example can be seen in Figure 9. This shows the pattern in Brazil
between 1987 and 1998. In this case, spending on pensions grew twice as fast as wages.
Recall from Figure 6 above, that Brazil ranked first in civil service pension spending for the
countries where data are available. The pension burden contributed significantly to fiscal
woes faced by Brazil and has been the target of reforms for almost a decade. Despite
attempts to rein in spending however, little progress has been made.
Figure 10 shows civil service pension spending rising in Bangladesh, Mexico and
Nepal in the 1990s. (Note that Mexican state government employees are almost double the
federal figure and as such these figures are a significant underestimate of the total burden of
public-sector pensions.) Although data are not available for many countries, we would
anticipate this pattern to be repeated elsewhere. Figure 11 shows the same indicator for
India from 1990-2004. Most growth is due to spending on pensions for state level civil
servants where employment expanded in the 1970s and 1980s.

34
Figure 10: Spending on civil service pensions, share of GDP, Bangladesh, Mexico, Nepal, 1992-2004
0.0%
0.1%
0.2%
0.3%
0.4%
0.5%
0.6%
1990 1991 1992 1993 1994 1995 1996 1997 1998 1999 2000 2001 2002
per c
ent o
f GD
P Nepal
Mexico - federal only
Bangladesh
Source: Government budget data; IMF IFS statistics. Data for Bangladesh includes military pensions that represented on average about ten per cent of total spending.
Figure 11: Spending on civil service pensions
as share of GDP, India 1990-2003
0.0%
0.5%
1.0%
1.5%
2.0%
2.5%
1990
-91
1991
-92
1992
-93
1993
-94
1994
-95
1995
-96
1996
-97
1997
-98
1998
-99
1999
-2000
2000
-2001
2001
-2002
2002
-2003
2003
-2004
per c
ent o
f GD
P
Total
states
central
defense
Source: Government of India budget documents and authors’ calculations.

35
Unfunded liabilities
Pension policy has a long lead time: the rules and parameters today will affect
members’ benefits and so governments’ liabilities for decades to come. Periodic reviews of
the long-term financial position of pension schemes — particularly those financed on a
pay-as-you-go or partially funded basis — are an essential input to the policy-making
process. Some countries have not carried out such reviews either of their national or
public-sector pension programs. Others assess the financial situation of the national pension
scheme but not the civil-service plan. Many countries have therefore called on the World
Bank and other international organizations to help in preparing long-term projections of the
finances of both national and civil-service pension schemes.
Table 6 shows a number of financial indicators for four countries’ national and
civil-service pension plans. The second indicator, shown for a larger range of systems above,
is the current spending as a proportion of GDP.
However, this indicator does not capture the ‘inter-temporal’ nature of the pension
promise. Nor does it reflect the demographic challenges that will be faced by pension
systems in the future. Projections of future spending, based on today’s policies over
parameters and rules, can be summarized in a single number. This is essentially the net
present value of future pension spending commitments. It is commonly known as the
‘implicit pension debt’, or IPD. 11
The IPD name is designed to show that pension commitments are a kind of debt
with some characteristics in common with conventional public-sector debt, such as
government bonds. Unlike conventional debt, however, the implicit debt accruing in
pension promises is not reported on the government’s balance sheet. But it can still place
important limits on fiscal policy. Indeed, the IPD is often large relative to conventionally
defined public debt. While the estimates in Table 6 are sensitive to discount rates and other
assumptions, the magnitudes of the IPD are striking under any reasonable values for these
variables. For example, Turkey and Brazil have liabilities for civil service schemes equivalent
to 75 and 92 percent of GDP, respectively.

36
Table 6: Implicit pension debt of civil service and national schemes (selected countries)
Implicit pension
debt (% of GDP) Current spending
(% of GDP)
Coverage (% of labor
force)
IPD/coverage
Civil service
National Civil service
National Civil service
National Civil service
National
Brazil 1998 92 284 1.7 6.2 2 27 46.0 10.5 Iran 2001 38 64 0.5 0.7 8 32 4.1 2.0 Korea 1995 7 33 0.2 0.3 1 23 7.0 1.4 Philippines 1997 17 90 0.2 0.8 3 40 5.7 2.3 Turkey 1997 75 71 1.7 2.5 5 25 15.0 2.8
Source: Holzmann et al. (2004); Robalino (2006).
The IPD of national pension programs is three times that of the civil-service scheme
in Brazil and around five times higher in Korea and the Philippines. However, national
schemes in all four cases cover many more workers than the civil-service scheme does, as
shown by the third indicator in Table 6. The IPD divided by the coverage rate shown as the
final indicator in Table 6, adjusts for the number of workers. By this measure, the average
IPD per civil servant covered is more than double that of the average private sector worker
in Iran and the Phillipines and four-to-five times higher in the other three countries.
Improving civil service scheme finances
The measures that can be taken to reduce civil service pension liabilities are broadly
the same as those that can be applied for national schemes. Table 7 illustrates most of the
alternatives through the changes adopted in a range of OECD countries. It is clear that
most are motivated by fiscal pressures, since they either reduce the generosity of pensions,
reduce the number of beneficiaries by increasing retirement age or increase contribution
revenues.
11 See Holzmann, Palacios and Zviniene (2003) for a discussion of the measurement and reporting of implicit pension debt and estimates for a sample of developing countries.

37
Table 7: Recent reforms to civil-service pension schemes in OECD countries
Reform Countries Increase in pension age Finland, Sweden Restrictions on early retirement Germany, Italy, Sweden Reduced pension generosity or increased service requirement
Austria, France, Germany, Greece, Finland, Portugal
Change in uprating procedure Italy, Sweden Integration of civil-service with general state scheme
Austria, Greece, Spain
Increase in contribution rates Austria, Finland, Greece, Italy, Netherlands, Portugal, Sweden
Introduction of some form of pre-funding Belgium, Denmark, Finland, Italy, Sweden
Source: authors.
Some ‘parametric reforms’ will almost certainly reduce pension liabilities regardless
of the type of pension scheme. Less generous indexation and reductions in accrual rates are
prime examples. On the other hand, the impact of measures intended to increase the
effective retirement age have more complex effects. If, for example, the relationship
between contributions and benefits implies an unsustainably high rate of return, a higher
retirement age may simply add to the liability as the worker accrues more years of service
towards his or her benefit calculation. Short term finances improve, but the intrinsic
imbalance over the long term still results in an increase in the total liability. Even when the
direct impact is clearly positive (due to the combined impact of having a greater number of
contributions and fewer years of pension), there may be indirect effects in terms of spending
on other programs such as disability, unemployment and social assistance that offset savings
from the overall fiscal perspective.
The ultimate fiscal impact of an increase in the retirement age for civil service
pension schemes is even more difficult to measure. Intuitively, the government can either
pay a wage or a pension to the same individual. Since a pension is normally lower than the
salary, later retirement would lead to higher spending. However, this assumes that there is
no link between retirement and the decision to hire new civil servants. If the retiring
employee was replaced by a new hire, the fiscal effect would be equivalent to the difference
between the retiring worker’s final wage and the sum of the new hire’s wage and the retiring

38
worker’s pension. The equation becomes even more complicated when measured over time
in which case the age-earnings profiles and pension indexation experience would have to be
taken into account and a present value calculated.12
The discussion bears close resemblance to the literature on public sector
downsizing.13 In both cases, the ultimate fiscal impact depends on the government’s hiring
policy and a reasonable assumption about the counterfactual in the absence of any changes.
In the case of downsizing, the changes might involve severance payments or early retirement
options while in a standard parametric reform the typical option considered would be
increasing effective retirement age. Regardless of the chosen route, the ultimate fiscal effect
will depend on government hiring practices. In many cases, if not the majority , downsizing
exercises were eventually undermined by new hiring. We are not aware of similar studies
that look at the aftermath of an increase in the civil service retirement age, although casual
observation would suggest a similar outcome.14
A final consideration is how changes to the contribution rate affect civil service
versus national pension plans. Obviously, when the contribution rate is increased for a
national plan, the direct impact is to improve the finances of the pension scheme. There
may be indirect negative effects due to the distortionary effects of a higher tax on labor, but
in general, the consolidated fiscal deficit will be reduced.
In contrast, an increase in the contribution rate for a civil service pension scheme has
an ambiguous effect, especially with regard to the employer share. It could be argued that an
increase in the employee contribution improves both the finances of the scheme and the
overall fiscal situation. However, for this to be the case, the net wage would have to be
permanently reduced. Most incidence analysis of labor taxes in the private sector finds that
workers bear most of the burden due to the relative elasticities of labor demand and supply.
This framework does not apply to civil service wage structures, however. To the extent that
the net wage of civil servants is the product of negotiation and bears little relation to a
12 Note that this analysis is focused only on fiscal aggregates and says nothing with regard to the productivity of the civil service which may be significantly affected by a change in the age composition. We return to the human resource considerations in the Section 3.1. 13 See Rama (1999).

39
market-determined outcome, the increase in the employee contribution to a civil service
pension scheme may not actually result in fiscal savings.
At the same time, an increase in the employer contribution may improve the pension
schemes finances, but it achieves nothing from the overall fiscal perspective. This simply
re-labels the part of the budget used to finance civil service pensions. In a national scheme,
in contrast, the fiscal impact is unambiguously positive (ignoring any general equilibrium
effects).
Table 8 summarizes the comparison of parametric reforms as applied to national
versus civil-servant pension schemes. In the case of retirement age, the wage-bill effect
implies a different sustainability effect when compared to the national scheme. Raising the
retirement age while continuing to hire at the same rate in the civil service will result in a
larger wage-plus-pension bill. It is also important to note that contributions from the
government as employer may make the pension scheme more sustainable, but at the cost of
fiscal sustainability more generally.. In the case of national schemes collecting contributions
from private, formal-sector workers, any increase in contributions will raise revenues and
increase sustainability (albeit at a potential cost in terms of demand and supply for labor as
the tax wedge grows).
14 For example, in Senegal, a sudden increase in the retirement age did not affect plans to hire a large number of new civil servants.

40
Table 8: Parametric reforms to national and civil service pension schemes
Reform National CS Accrual rate Same effect Indexation Same effect Retirement age disability, social assistance
etc. can undermine gains effect on accruals (same as
national?), CS pay bill Employee contributions positive (ex. notional accounts,
DC) positive (but can be
undermined by pay changes) Employer contributions positive (ditto) relabelling only
Source: authors.
We conclude this section with the following observations:
• The fiscal burden of civil service pensions is significant and growing;
• The implicit pension debt attributable to civil servants is disproportionately large when compared to their importance in the covered labor force;
• Special considerations must be made when assessing parametric changes to civil service pension schemes, especially with regard to the broad fiscal impact of changing the retirement age; and
• Defined contribution schemes are becoming more popular as a way of introducing some fiscal discipline for civil service pension schemes. India’s reform of 2004 is the most important example at the moment. They also promise advantages in terms of the labor market issues discussed in the next section.
3.2 Labor market impact
Two issues stand out with regard to the interaction between civil-service pensions
and the labor markets. Both are related to the human-resource policy of the public sector:
attracting productive workers to the civil service and retaining them. The first issue is the
relative compensation of civil servants vis à vis their private-sector counterparts. The second
is the incentives and disincentives that pensions can generate for moving between public-
and private-sector employment.

41
Differences in compensation
Pensions are an important part of the compensation package offered to civil
servants. At typical replacement rates and pension eligibility ages, the pension promise is
worth around 30-35 per cent of earnings. The question as to whether this generous pension
promise attracts high-quality staff is an empirical one.
There are numerous studies of differentials in earnings between the public and
private sectors for a range of countries. These use econometric tests to estimate the
difference in wages for individuals with similar characteristics that can be attributed to being
in the public or the private sector.
Unfortunately, these studies have generally not taken account of the differences in
pension values and eligibility conditions.15 Nevertheless, they do shed light on the question
of whether additional benefits, such as a more generous pension scheme, are needed to
address disparities between remuneration in the two sectors. The short answer to this
question is ‘no’.16
In developing countries, public-sector employees with the same human capital and
experience generally earn more than their private sector counterparts.17 This suggests that
any further advantage provided to civil servants through pension or other benefits are not
needed in order to compete with the private sector. In fact, the additional compensation
would only exacerbate unjustified compensation differentials and unnecessarily increase the
cost of government.
The main exception to this finding is reserved for those civil servants with the most
human capital. Several studies have found that highly educated workers tend to earn less
than their private-sector equivalents. While an interesting finding with important public
15 Pensions are only one of a host of other non-wage benefits that often differ between public and private sectors as noted in Schiavo-Campo, de Tommaso and Mukherjee (2003). Nevertheless, it will generally be quantitatively most important. 16 A World Bank study prepared as part of technical assistance to the Government of Pakistan in 2005 did include pensions in a public-private compensation differential analysis. It found that the more generous pension benefits of the civil servants exacerbated positive wage differentials for the vast majority of civil servants. See World Bank (2006). 17 See Glinskaya et al. (2004) for a review of the results in the literature.

42
policy implications, the fact is that only a small share of the civil service falls into this
category, perhaps five to 10 per cent.18
This finding is undoubtedly linked to ‘wage compression’ in the civil service.
Compression was observed during the 1970s and 1980s due to more rapid wage increases
for lower-ranking civil servants. Figure 12 provides a dramatic example of this
phenomenon. Salaries of the lowest grade civil servants grew three times as fast as the
higher echelons between 1970 and the early 1990s. Since then, the ratio has stabilized.
Public-sector pensions — in their current form — are a very ineffective way of
dealing with this problem. While pensions do increase the remuneration of the workers with
the highest human capital, they also increase the compensation of the vast majority. Since
pensions are directly related to wages through the benefit formula, they simply reinforce the
compression of wages.
Figure 12: Civil service wage compression, Nepal 1970-2003
0.0
1.0
2.0
3.0
4.0
5.0
6.0
7.0
8.0
9.0
1970 1973 1976 1979 1982 1985 1988 1991 1994 1997 2000 2003
Ratio of salaries of second highest grade officers to lowest ranking civil servants in Nepal
Source: World Bank internal data.
18 It is also worth noting that there is likely to be a positive correlation between non-wage benefits and the rank of the civil servant that cannot be observed.

43
To conclude, the evidence rejects the proposition that more generous pensions are
justified in order for the public sector to compete for human resources. There are wage
differentials favoring the private sector, but mainly among the most educated civil servants.
Even when the case could be made to the contrary, a wage increase, rather than a
distortionary and parallel pension-scheme would seem to be the appropriate tool to address
the disparity.
Mobility
The second possible human-resource issue is the tenure of civil servants.
Governments, once they have attracted the correct staff, will wish to retain them. They
might also want to prevent conflicts of interest involving staff using information and
experience from public service in the private sector.19
The pension system penalizes mobile workers relative to those with full civil-service
careers in two ways. The first is through long vesting periods. People who leave the civil
service before their pension rights are ‘vested’ receive nothing from the system. The
minimum length of service to qualify for a pension benefit is shown for a range of countries
in Table 9. It varies enormously: from one year or less to 25 years.
19 The most common examples are procurement and regulators (for example, of utilities).

44
Table 9: Vesting periods for civil service schemes in selected countries
Length of service required OECD countries Non-OECD countries Zero/ less than one year
Canada Finland Netherlands Sweden Switzerland United Kingdom
Iran Morocco
Five years Belgium Germany Ireland Italy
10 years Cape Verde Hong Kong
15 years Austria France Portugal Spain
Bahrain Mauritius Senegal Tunisia Philippines West Bank/Gaza Yemen
20 years India 25 years Djibouti
Lebanon Source: authors.
Notes: India pays a partial pension after 10 years’ service. Mauritius pays a lump sum of one year’s salary after 10 years’ service. Senegal pays a partial pension after 15 years and a full pension after 30 years. Hong Kong pays a ‘short service gratuity’ to civil servants leaving with less than 10 years’ service
The second way in which the pension system impedes mobility is through the
treatment of ‘early leavers’. These are people whose pension rights are vested but who leave
the civil service before retirement. Table 10 shows how different countries treat such
workers. In Finland, the Netherlands and Sweden, for example, there is full transferability.
Workers move to private-sector mandatory (or quasi-mandatory) occupational plans with
similar benefits to the civil-service plan. In France, there is full ‘preservation’ of rights.
Workers’ accrued rights are indexed in line with civil service pay between leaving and
retirement. In other cases, moving jobs entails a pension ‘cost’. The following sections aim
to quantify these costs for some example countries.

45
Table 10: Portability and preservation of pension rights
Treatment Country Details Full transferability Finland
Sweden Netherlands
Workers transfer to private-sector mandatory (or quasi-mandatory) occupational plans with similar benefits
Full preservation France Workers’ accrued rights are indexed in line with civil service pay between leaving and retirement
Partial preservation United Kingdom Workers’ accrued rights are indexed in line with prices between leaving and retirement
Deferral without preservation Hong Kong Mauritius
Workers’ accrued rights are frozen in nominal terms
Loss of privilege Germany Cape Verde
Workers lose civil service pension rights but are credited with rights in national scheme
Source: authors.
The pension cost of leaving a civil-service job is defined as the difference between
the value of accrued pension rights on leaving and the value of accrued pension rights
conditional on staying until retirement. The streams of pension defined benefits can then be
converted to a net present value using standard actuarial techniques.
Figure 13 plots accrued pension rights by age for Mauritius. The dotted line shows
the value of accrued rights if the civil servant stays until retirement. This is simply a straight
line: each extra year adds 1/50th of final salary to the eventual pension benefit. The solid line
shows the value of accrued rights if the individual were to leave his or her job at that age.
Up to ten years’ service, the pension is zero. At that point, people become eligible for a
lump sum of one year’s salary. At 15 years’ service, people are eligible for a deferred pension
benefit. This is based on their current salary, with no adjustment to reflect pre-retirement
increases in the cost and standard of living. (Note that the modeling assumes 2.5 per cent
inflation and 2.5 per cent annual real earnings growth.) This is therefore still much lower
than the accrued rights would be if the individual were to remain until retirement.
Figure 14 converts these results into a measure of the cost of moving jobs. This is
the difference between the two values of accrued pension rights, discounted back from
retirement to current age (at a real discount rate of two per cent). The cost has been
normalized as a proportion of the current salary. On this measure, the penalty to mobility is

46
large at young ages because leaving results in a pension of zero while staying to retirement
gives multiples of pre-retirement salary for each year of service. The pre-retirement salary is
obviously much higher than current pay. The cost falls back once the individual is eligible
for a lump-sum payment, but the penalty for leaving just before pension rights are vested
reaches nearly eight times current salary. After vesting, there is still a large cost to moving
jobs because the deferred pension is based on current nominal earnings. As retirement age
approaches, the loss of pension benefit due to the difference in salary at retirement age and
current salary diminishes.
Figure 13: Value of accrued pension rights by age, Mauritius
age25 30 35 40 45 50 55 60
Value of accrued pension
leaving job
staying toretirement
lump sumdeferred pension
Source: Piggott and Whitehouse (2001).

47
Figure 14: The pension cost of moving jobs, Mauritius
age25 30 35 40 45 50 55 60
0
2
4
6
8 Cost of leaving,proportion ofearnings
Source: Piggott and Whitehouse (2001).
Figure 15 shows the net present value of accrued pension rights by years of service
for Cape Verde. The solid, grey line shows the civil service pension. This is a straight line,
reflecting the linear accrual of 2.94 per cent of final salary for each year of service. (This is
also because the discount rate that we have assumed is the same as the rate of growth of
individual earnings.)
The solid, black line shows the scheme for private-sector workers, the INPS. The
line jumps at three years because the individual becomes entitled to 24.5 per cent of the best
three of the final five years of salary at that point. It is then a straight line, again reflecting
the linear accrual and the equality of the discount rate and the rate of earnings growth.

48
Figure 15: Value of accrued pension rights by years of service, Cape Verde
0
2
4
6
8
10
12
14
16
18
0 5 10 15 20 25 30
Civil servicepension
INPS
Return ofcontributions
Discounted value of accrued pension rights,multiple of final salary
Years of service Source: authors’ calculations.
Individuals who leave with fewer than ten years of service have their contributions
returned. This is shown by the grey dotted line. From then onwards, they are
retrospectively transferred to the INPS if they leave before retirement. Thus, the true
schedule for benefits for a civil servant is the grey dotted line for the first ten years, then the
solid black line until they reach retirement, then the benefit is given by the grey, solid line.
We can therefore calculate a cost of leaving a civil service job at any point prior to
retirement, which is the difference between the value of accrued pension rights were the
individual to stay to retirement (the grey line) and the benefits actually received, as described
in the previous paragraph. The results of this calculation are shown in Figure 16.

49
Figure 16: Pension cost of leaving a civil-service job, Cape Verde
0
2
4
6
8
10
12
0 5 10 15 20 25 30Years of service
Difference in discounted valueof pension rights between moving jobs and staying to retirement,proportion of current salary
Return ofcontributions
INPSbenefits
Source: authors’ calculations.
The return of employee contribution, without interest, means that someone leaving a
civil-service job before the ten-year vesting period loses a growing amount with years of
service. Leaving after one year, for example, the pension benefit already earned (conditional
on staying until retirement) is worth about half of the individual’s salary at that point
compared with the six per cent of salary from returned contributions. At nine years, the
pension cost of moving jobs is some four times annual salary. When the individual vests
their pension rights, they still lose because INPS benefits are less generous, with a lower
accrual rate and later retirement age. The pension cost of leaving jobs at 10 years is about
double annual salary. This then increases rapidly with years of service.
The United Kingdom improved protection for early leavers in public- and
private-sector occupational pension schemes in a series of reforms from the 1970s to the
1990s. Although the civil service pension is based on final salary, this must be adjusted in
line with prices (up to a ceiling) between leaving the scheme and drawing the pension. This
still, however, entails a cost to moving jobs if earnings would have grown in real terms
between leaving the civil service and reaching retirement age. The pension cost of moving

50
jobs in the United Kingdom is shown in Figure 17. Inflation-proofing makes a substantial
difference: the peak cost is just 1.5 times current salary compared with nearly eight times in
the Mauritius case. Nonetheless, this represents a substantial penalty to changing jobs.
Figure 17: The pension cost of moving jobs, United Kingdom
age25 30 35 40 45 50 55 60
0
.5
1
1.5Cost of leaving,proportion ofearnings
Source: authors’ calculations.
In Germany, people leaving civil service jobs lose their rights under the civil-service
scheme and are retrospectively transferred to the national scheme. The civil-service plan is
much more generous than the general one, so this transfer entails a considerable cost. This
is illustrated in Figure 18. The pattern of the pension cost of changing jobs with age is
considerably different to the inverted-U shape in Mauritius and the United Kingdom. It
rises continuously with age as the loss from the retroactive transfer to the general scheme
applies to a longer accrued service. The pension cost of moving jobs also varies with
earnings, because there is a ceiling to benefits under the national scheme but the civil-service
scheme is uncapped.

51
Figure 18: The pension cost of moving jobs, Germany
age25 30 35 40 45 50 55 60
0
2
4
6
averageearnings
twiceaverage
Cost of leaving,proportion ofearnings
Source: authors’ calculations.
A number of studies have examined the effect of pension schemes on job mobility.
Most of these look at the United Kingdom and the United States. Although they have
looked at private- as well as public-sector occupational plans, the issues are the same:
final-salary defined-benefit schemes impose a substantial cost on changing jobs. All studies
have found a substantial effect on job mobility.20
Data from developing countries tend to show very little movement out of civil-
service and other public-sector jobs. Figure 19 shows the distribution of job tenures (with
the current employer) in the public sector, private sector and the sugar industry in Mauritius.
At the left-hand side is the proportion of people who have worked for their current
employer for less than a year. The chart then moves in one-year bands until five years, when
it gives the proportion with their employer for between 5 and 10 years, then 10-to-15 years
and so on. The data for the public sector include employees of para-statal enterprises and
20 McCormick and Hughes (1984) is the classic paper on the United Kingdom; see also Disney and Whitehouse (1994, 1996); Dilnot et al. (1994), chapter 3; and Henley, Disney and Carruth (1994) for a further discussion of the UK. The United States literature is more voluminous: Schiller and Weiss (1979), Mitchell (1982), Wolf and Levy (1984), Kotlikoff and Wise (1987), Lazear and Moore (1988) and Allen, Clark and McDermed (1988, 1993) and Gustman and Steinmeier (1989, 1993, 1995) are prominent examples. These papers (generally) find stronger effects of pensions on job mobility than studies of the UK.

52
sub-central government as well as civil servants. (These three groups show very similar
patterns of job tenure.) The private sector category includes employees in the export-
processing zone, but the sugar industry is separated out because it shows a much different
pattern from other parts of the private sector. Indeed, the profile is similar to the public
sector.
Relative to the private sector, the public sector and sugar industry curves are
remarkably flat. This implies little if any mobility: the same proportion of civil servants has
worked for the government for 20 to 25 years as has worked for one or two years.
Figure 19: Job mobility in different sectors
0
5
10
15
private sector
sugar
public sector
per cent of employeesin industry
51 20 40
number of years with employer, upper limit
30 50
Source: Central Statistical Office (1997), Labour Force Survey Sample 1995, Table A.22. See Piggott and Whitehosue (2001).
The pension system is not, of course, necessarily responsible for the lack of mobility
in the public sector. There are other barriers, such as (in some countries) an outright
prohibition of recruitment of people above age 30 (or so). Also, the civil service often
maintains a ‘culture’ of lifetime employment, and job mobility can be low even when there
are little or no penalties to switching jobs.

53
It is natural to ask whether these penalties to moving jobs are justified. For this, we
examine the arguments over the design of labor-market contracts.
Efficient labor-market contracts
Labor markets, like those for other goods and services, can be subject to market
failures which result in economic inefficiency. Market failures occur for tow main sets of
reasons: monopoly or monopsony power wielded by one party, and asymmetries of
information between two parties to a transaction. In labor markets, the most important
asymmetry of information is over the amount of effort a worker puts into a job.
Employers and employees cannot legally commit to long-tenure contracts, even
when labor turnover is costly to the firm, for example, in the cost of hiring and training.
This is a result of potential moral hazard: workers’ effort is prohibitively difficult for firms to
monitor completely. Assuming that workers are averse to effort when not monitored, then
the worker gains from shirking if remuneration at any point reflects either the worker’s target
effort or the average of a group of employees. However, back-loading remuneration
discourages shirking. If there is some positive probability that shirking is detected and the
worker fired, then employees have an incentive to put in effort. This back-loading might be
achieved by having either age-earnings profiles or a defined-benefit pension. Alternative
employment would offer lower net remuneration.21
The second market failure arising from informational asymmetries is adverse
selection, when bad risks drive out good. In the labor-market context, this arises because
employers are unable to monitor completely the productivity of new workers hired or those
who quit. By offering seniority-based pay profiles or a pension, employers may be able to
attract (on average) more productive workers. Offering the lowest pay and fringe-benefit
package may guarantee that only the least productive workers apply to stay.
Offering defined-benefit pensions may be more effective than seniority-based pay
profiles as it is possible to extend the disincentives to leaving the job and shirking, so long as
the generosity of the pension depends on the timing and duration of tenure in the job.

54
However, employers using these mobility-reducing devices create some problems. First, a
‘tilted’ profile of total remuneration (pay plus pension accrual) means that younger workers
will earn less than their productivity warrants. while older workers remuneration exceeds
their productivity. Employers may then find that these older employees unwilling to leave at
a point optimal to them. Back-loaded remuneration plans are often, therefore, associated
with mandatory retirement rules.22
The second problem is more difficult to rectify. Younger workers will know that
there is a probability of leaving the job before retirement. In the private sector, there is the
possibility of bankruptcy or takeover, meaning that the employer might renege on the
commitment to pay higher wages or benefits in the future, particularly as this exceeds the
productivity of older workers. The public sector is not immune from these risks: many civil
services have seen ‘downsizing’ exercises and a future government might renege on the
commitment to pay generous pensions made by a predecessor. Given the precarious
financial position of pension schemes, the probability of the latter is unlikely to be zero.
This puts a limit on the degree to which remuneration can be back-loaded.
The third problem is that some mobility is optimal, even if only to separate out
inefficient matches of workers to jobs: the problem of ‘square pegs in round holes’.
Otherwise, some workers would have excessive job durations when incentives to remain in
the job are strong. Indeed, the problem with back-loaded remuneration provided through
pensions is that is indiscriminate. The employer provides incentives to stay to both the
workers that are wanted and those that are not.
The final issue is whether pensions are an efficient form of ‘golden hand-cuffs’.
There are other, more effective ways of discouraging mobility or shirking, such as the
deposit of a bond repayable in the future conditional on tenure or absence of evidence of
shirking.23
It has been argued that these incentives were the reason for the development of
private-sector occupational pensions of the defined-benefit type in the twentieth century.
21 This discussion is based on Lazear (1981, 1985), Viscusi (1985) and Ippolito (1991). 22 Lazear (1979). 23 Akerlof and Katz (1989).

55
They spread rapidly in many countries, including Canada, Japan, Switzerland, the United
Kingdom and the United States. Over the relevant period, changes in production
technology led to a shift in employer preferences towards a stable tenured workforce. A
second explanation for the spread of occupational pensions was trade union pressure for the
extension of fringe benefits. This is unsurprising, given the attractiveness of pensions to
workers on seniority-based pay profiles in jobs with ‘last-in, first-out’ employment
arrangements.24
However, more recently there has been an emphasis on labor-market flexibility.
Along with moves from open-tenure to fixed-term contracts, it is not surprising that the
issue of ‘pension portability’ has become more important. In the United States, there has
been a ‘stampede’ from defined-benefit to (portable) defined-contribution pensions, a trend
reflected in the slower move in the same direction in other countries, such as the United
Kingdom.25 With the exception of these defined-benefit occupational plans (which are in
any case in decline), private-sector workers around the world have portable pensions: their
value is unaffected by tenure with a particular employer. The onus of proof must therefore
lie with those who advocate the use of pensions as a mobility-reduction device for
public-sector workers. Is there some return to tenure to a public-sector employer that is
greater than that in the private sector? There is unlikely to be a significant, systematic
difference in the costs of mobility — such as hiring costs or training — between public and
private sectors.
Even if one were to accept the arguments for mobility reduction in general, there is
no reason that the magnitude of penalties to mobility and the pattern with tenure found
above are optimal. There is no ‘intelligent design’: merely ex-post rationalization.
Moreover, the stress on labor-market flexibility rather than labor-force stability that
has pushed developments in private-sector pension provision is also affecting the public
service. Privatization, divestment and ‘downsizing’ can be significantly hampered by the
24 On the historical development of pension plans, see Hannah (1986) on the United Kingdom and Ghilarducci (1992) on the United States. 25 On the growth of defined-contribution schemes and the reason for this trend, see Gustman and Steinmeier (1992), Ippolito (1995) and Kruse (1995) on the United States and Disney (1995) on the United

56
traditional design of public-sector pensions. This is because terms for public-sector workers
moving to private-sector jobs are often unfair.
It is important also to examine pensions from the position of the member as well as
the employer. Pension systems are not merely there for the convenience of the employer,
they aim to provide retirement incomes for public-sector workers. There is no reason for
any systematic difference between public- and private-sector workers in there need for
retirement income (conditional on their earnings when in work). This ‘consumption
smoothing’ between the working life and retirement should be the primary goal of any
earnings-related pension system.26
By tying the value of the pension to tenure, there are differences in pension values
between short- and long-staying workers that are unrelated to their retirement needs. This
undermines the ability of the pension system to protect people in retirement. It also
introduces horizontal inequities between different members.
Reforms
Within the context of a reform maintaining a separate civil-service scheme, there are
still policies that can improve mobility:
• Setting short vesting periods. There is a trade-off here between the requirements of
mobility and the administrative cost of dealing with small benefit entitlements. A
five-year vesting period is probably a sensible compromise.
• Preserving pension rights of early leavers. The difference between the cases of the
United Kingdom and Mauritius shows the value of preservation: uprating the value of
earnings used in the benefit formula in line with price growth between leaving and
retirement.
Kingdom. Samwick and Skinner (1993) and Disney and Whitehouse (1994) look at how the trend to defined-contribution schemes will affect retirement incomes. 26 Redistribution is, of course, the primary goal in other types of pension provision, such as basic or minimum schemes.

57
• Extending the period used in the earnings measure. Defined benefit schemes based on
career average earnings eliminate the problem of mobility. Consequently, extended
averaging periods (say final ten years’ salary rather than final year’s) do much to reduce
the mobility cost. This will, of course, require improvements in record keeping in many
countries.
• Introducing a defined-contribution scheme, a policy described ion more detail below.
Obviously, the most complete solution to the mobility problem is to eliminate
dualism in retirement-income provision. A single, national scheme covering public and
private sectors makes, for this and other reasons set out below, a sensible long-term goal for
pension reform.
3.3 Dualism and integration
This section presents the basic arguments in favor of integration as well as noting
some of the obstacles that must first be overcome. A brief review of some recent reforms
that involved integration is also provided.
The rationale for integration
If special pension schemes for civil servants tend to create a larger fiscal burden and
distortions in the labor market, why should they exist in the first place? The historical
reasons for dualism — the separate provision of pensions for civil servants — were set out
at the beginning of this paper. There are, however, many arguments against dualism.
The last section highlighted some of the distortions introduced by separate schemes
from the perspective of the labor market. Specifically, dualism generates impediments to
labor mobility and aggravates unjustified compensation differentials between public and
private sectors. It is also unclear what rationale there is for mandating different amounts of

58
consumption smoothing over the life cycle or differential retirement ages for public and
private sector workers.
Integration or lack of it is also linked to the fiscal problems outlined above. It is
reasonable to assume that the payment of pension contributions to an extra-budgetary entity
would impose discipline, leading to lower expenditures. This would seem especially true for
non-contributory schemes, like those in most of South Asia, where costs are hidden.
Another important consideration is the cost of administering multiple pension
schemes. Not surprisingly, there appear to be significant economies of scale in the record-
keeping, collection and payout processes of pension schemes. The cost per member of the
scheme is lower the larger the total number of members. In some of the smaller countries in
Africa and Asia, total membership of pension plans is often below 50,000. Avoiding the
duplication implied by dualism would allow for higher benefits or lower contributions.
For these reasons, we believe that the long-term goal of reform of civil-service
pension reform should be to combine these schemes with provision for private-sector
workers in a single national scheme.
Problems with integration
There are two main obstacles to integration. First, terms and conditions — such as
accrual rates, pension ages and indexation procedures — differ between civil-service and
national pension schemes. Civil-service plans are usually more generous than national
programs. Integration might therefore produce inequities between different cohorts of civil
servants, with younger generations, covered by less generous national pension systems,
receiving lower benefits than their older peers.27 However, national schemes often provide
differential benefits for different groups of workers. It is possible, therefore, to envisage a
higher pension accrual rate for civil servants in return for a higher contribution from the
government and/or members.
27 One way of addressing this inequity would be to adjust earnings in compensation for loss of pension rights. Indeed, it is sensible to consider reform of civil-service retirement-income arrangements as part of a

59
An alternative policy is to begin a process of harmonizing civil-service pension terms
and conditions with those of the national scheme before formal integration. Therefore,
differences in terms and conditions between the two programs do not present an
insurmountable obstacle to integration: it is possible to have such differences persist in an
integrated retirement program or to begin harmonization before institutional integration.
The second obstacle to integration is more difficult to address. A problem in a
number of developing countries has been the failure of government to pay its contributions
to national pension schemes. In Senegal, for example, the total arrears of contributions to
the national pension scheme (IPRES) were CFA Fr 26 billion (equivalent to around
$37 million or 1.3 times the annual expenditure of the program) in 2004.28 Over 70 per cent
of this is owed by the central government or by other public-sector bodies. In other cases,
such as the Dominican Republic or Ecuador, the earmarked contributions from the central
budget that are required by law have not been forthcoming.
If it is not possible for the quasi-public bodies that run national pension schemes for
private-sector workers to enforce contributions, then this would seem to be a major barrier
to having an integrated pension system. The remedies are beyond the scope of this paper:
first, ensuring that the government has a sufficiently robust fiscal position to be able to
afford its contributions and, second, legal changes to allow the administrators of the national
pension program to seek redress for unpaid contributions (since it is difficult to sue the
government successfully in any jurisdiction).
The potential for a fiscal problem arising from integration is a reminder of the need
for a case-by-case approach that carefully analyzes the government’s ability to finance a
transition. At one extreme, a government facing short term fiscal constraints may find it
necessary to proceed slowly with the transition when it requires contributions to be set aside
rather than recycled within the central budget. The slowest transition would require only
new entrants to the civil service to join the national scheme thus implying a transition lasting
50 years or more until the death of the youngest civil servant at the time of the reform. A
broader analysis of civil-service compensation, including pay, other monetary benefits, non-monetary benefits (such as security of job tenure) and benefits-in-kind. However, space precludes such a complete analysis here. 28 They were cleared in 2005 after more than a decade.

60
stronger fiscal position could lead to a rapid transition whereby all civil servants not close to
retirement age were transferred — with some credit for their previous years of coverage in
the special scheme — to the national scheme immediately.
The pace of the transition implies several tradeoffs. Integration that includes only
new entrants to the civil service will be easier to finance on a cash flow basis in the short run
but will not reduce overall pension liabilities as quickly.29 A transition that involves a
significant proportion of the current civil service will reduce liabilities more quickly and
provide larger benefits related to labor markets such as reducing impediments to mobility.
However, faster transitions will require more fiscal resources up front and will be more
complicated to administer. Finally, a faster transition will encounter more political resistance
from affected civil servants.30 While integration as a long term objective is likely to be the
right approach in almost any country, the recommended pace of such a reform will
inevitably be determined by local conditions.
Recent cases of integration
A diverse group of countries have integrated their civil-service schemes with national
pension programs in the last two decades (Table 11). The cases can be roughly divided into
two categories. The first category, which includes most of the Latin American countries and
Hong Kong, involved systemic reforms. Civil servants were brought into a completely new
system that covered the entire formal sector and typically involved privately managed,
funded individual accounts. In each case, this involved the introduction of privately-
managed, defined contribution schemes as part of the mandated system. It is worth noting
that in practically all systemic reforms, civil servants were either already integrated or were
integrated after the reform. Mexico is the major exception. In the second category, which
includes Ghana, Jordan and the United States, integration of civil servants into the national
29 In this discussion, we assume that civil service terms and benefit conditions are more favorable than in the alternative national scheme. 30 For an account of the reaction of civil service unions to proposals for integration in the US case, see Schreitmuller (1987).

61
scheme took place without a systemic reform. There were, however, often simultaneous
parametric reforms to the national pension plans.
Table 11: Integration of civil service pension schemes
Country Year Systemic reform Transition Argentina 1994 Yes New entrants;
choice for others Bolivia 1997 Yes All workers Cape Verde 2006 No New entrants Chile 1981 Yes New entrants with
choice for others Dominican Republic
2003 Yes New entrants with choice for others
El Salvador 1998 Yes New entrants with choice for others
Ghana 1972 No New entrants only Hong Kong 2001 Yes New entrants only Jordan 1995 No New entrants only Peru 1994 Yes New entrants with
choice for others Turkey 2006 (planned) no All; pro-rata benefits United States 1984 No Required only for
new entrants Zambia 2000 No Required only for
new entrants
Integration is a rare event: first, because nearly half of countries already have
integrated pension systems; and, second, because it is a one-off change. Nevertheless, some
countries appear likely to follow the example of those shown in Table 11. Mexico has
already drafted legislation to integrate the civil service into the funded scheme created in a
systemic reform in 1997, although it continues to meet with stiff resistance. In Africa,
integration was passed into law in Cape Verde at the end of 2005 and is being considered in
Senegal and Nigeria. Turkey has draft legislation that would integrate civil servants.
In contrast, China is poised to integrate its various levels of government, albeit
gradually. The rationale for this policy recalls our previous discussion on labor mobility:
‘Non-balanced progress pension system reform has led to the coexistence of two sets of
pension systems which are completely different in various aspects such as basic

62
organizational mode, management system, pay level etc.. The deficiencies of this situation
are very conspicuous: on one hand due to the difficulty in transition between two systems
and the wide gap existing in pay level, its very unfavourable for laborers to flow among
enterprises and state institutions and public service units, and also prevented the unified
labor market from being established.’ (in Ge 2003)..
A similar rationale prevailed in Hong Kong. When the new defined contribution
scheme — the Mandatory Provident Fund — was introduced in 2001, new entrants to the
civil service were required to participate. However, the conditions for civil servants differ
from those for private-sector members reflecting some of the human-resource objectives of
the government as employer. Specifically, the contributions made by the government rises
with tenure in the civil service providing an extra incentive for workers to stay in the
government’s employ. Unlike the old final-salary, defined-benefit scheme, however, workers
were not penalized for leaving early with loss of pension wealth. This eliminated the
distortion while making transparent the cost and mode of retaining workers in government.
It is a clear example of how human-resource considerations in the civil service can be taken
into account in an integrated system.
Conclusion
Dualism — the administrative and financial separation of pension schemes for
private sector workers and civil servants — creates a variety of labor market distortions. It
can lead to expenditures that are higher than warranted by either social or human-resource
considerations. Any supposed benefits in terms of human-resource management can be
achieved either through reforms to the overall civil-service compensation system or with
supplementary pension schemes.
While the shift to an integrated system is generally recommended, we recognize that
the pace of such a reform and the implementation will be tempered by country specific
conditions. The most important of these is the fiscal situation: governments will need to
contribute to an extra-budgetary pension fund on behalf of its workers. There is also the
difficulty of reconciling accrued pension rights in the old defined-benefit scheme. As a

63
result, the most common approach in integration has been to require only new civil-service
entrants to join the national scheme. The trade-offs involved in this policy include the fact
that distortions endure for longer, there is smaller reduction in the implicit pension debt and
duplication of administrative costs continues for decades.

64
4. Sub-national government, public enterprises and military personnel
The public sector encompasses employees of municipal, state and provincial
authorities as well as the central government. It also includes the military and other
uniformed services. This section focuses on these workers.
Sub-national governments
In large countries with federal systems of government, the magnitudes involved in
pension provision for state, provincial and municipal workers can be substantial. In some
cases — such as India, Mexico and Pakistan — the number of civil servants in sub-national
government far exceeds those at the federal level.
Sub-national government pension schemes are particularly significant in Argentina,
Brazil, China, India, Mexico, Nigeria, Pakistan and the United States. In these countries,
pension provision for employees of sub-national entities is decentralized with limited
oversight by central authorities. However, the variation in terms and conditions of
sub-national pension plans differs between countries.
Sub-national pension schemes broadly follow the federal scheme in India and
Pakistan. There are some differences in pension-eligibility ages and commutation factors31,
but all schemes are unfunded, and have similar, defined-benefit formulae.32 Mexican and
Brazilian state schemes also resemble their federal counterparts in parameters and rules.
However, the degree of pre-funding of future commitments varies.33
In contrast, the 50 state governments in the United States offer their employees a
more varied retirement-income package, as set out in Table 12. Some 43 of them enroll
their employees in the national pension plan, known as social security. Nearly all of them —
48 states — offer a defined-benefit plan, often as a top-up to social security.
Defined-contribution elements are also very common.
31 That is, the rate at which retirement-income streams can be converted to lump-sum benefits. 32 World Bank (2001). 33 The World Bank is able to support pension-reform initiatives in sub-national governments and has been active in Brazil, India and Mexico.

65
Table 12: Structure of state pension schemes, United States
Defined contribution Defined benefit Employer contributes
Employee only contributes
Social security Number of states
● ● ● 35 ● ● 6 ● ● ● 3 ● ● ● ● 3 ● ● ● 2 ● ● ● 1 48 9 47 43 50
Source: United States General Accounting Office (1999)
This paper has already discussed differences between national and civil-service
pension programs and the problem of job mobility between these two sectors. In strongly
federal countries, with decentralized pension provision, an additional issue occurs:
differences between different sub-national government pension plans and mobility between
these employers. In some federal countries, pensions are not portable between state
schemes. Pension rights in Mexico are lost if a worker for one state government shifts to
another. Lack of portability has also been cited as a problem in the United. In Brazil, the
final employer is liable for the whole pension, based on the full career, regardless of in which
state the employment occurred. There is a mechanism for compensating the last employer
for the years that contributions were not made to its scheme, but state governments have
complained that the compensation in inadequate. In some ways, the issue is analogous to
international portability arrangements which can be complicated and require negotiation
between governments. In federal system, it would seem appropriate to mandate portability
as a matter of national labor market policy. This is done in the UK where full transferability
of rights exists between local governments.
Returning to the question of integration with national schemes, the experience to
date is that sub-national pension schemes have been somewhat more difficult to integrate
than federal schemes. For example, despite the 1984 integration in the United States for
new federal workers, Table 12 shows that employees in seven states are still not integrated
into the US Social Security program. Several municipal schemes have also managed to gain

66
exemptions. In Argentina, about half of the provinces agreed to join the new pension
system after the systemic reforms of 1994. In Mexico, one state – Estado de Mexico –
integrated partially into the national defined contribution system in 2001. Brazil, India,
Nigeria and Pakistan have not taken steps to integrate at either the federal or the state level.
On its face then, the arguments in favour of integration seem to apply just as
strongly at the sub-national level. The public policy objectives of consumption smoothing
for which mandatory retirement income schemes are geared are no different for these public
servants than for any other kind of worker in the country. Also, labor mobility
considerations are, if anything, stronger when applied to sub-national entities.34 Duplication
of administrative functions is compounded by the need for multiple schemes. And finally,
heterogeneous human resource objectives across states and provinces can be handled
through supplementary pension schemes in line with voluntary employer provision and tax
rules. In short, integration with all formal sector workers would generally be recommended,
subject to the same caveats regarding initial fiscal conditions.
State-owned enterprises. Another important source of public pension liabilities is state-
owned enterprises (SOEs). In the period 1986-91, SOEs were the source for about 4-5
percent of formal employment in Asia and Latin America and more than 15 percent in
Africa.35 In several countries the figure exceeded 30 percent. Where SOEs are covered by
national schemes, the main fiscal issue is the additional cost of paying contributions from
what is often a loss-making enterprise. This affects the central budget covers SOE deficits
or must absorb the liability of arrears to the pension fund (as was the case in the earlier
example of Senegal.)
Many SOE employees are covered either by special public sector schemes or sponsor
their own schemes, often on a basis similar to that of their civil service counterparts. In the
first case, SOE coverage simply raises the liability, although it may be disproportionate to the
number of civil servants given the tendency in many countries to pay higher wages for these
34 In the GAO survey of US state pension schemes, improving portability was cited by seven states as one of the main reasons for shifting from defined benefit to defined contribution. 35 See Table A.5, World Bank (1995).

67
workers. In some of the fiscal accounting, they are included in the reported spending
figures, as in the case of India’s Railways.
In the SOE-sponsored schemes, the situation is more complicated. Most of these
are unfunded, defined benefit schemes that are typically as or more generous than those
found for civil servants. In rare cases where special conditions and strong finances exist,
assets may be set aside to cover liabilities. Ultimately, the government is likely to have to
step in to cover pension liabilities if there should be a shortfall.
Very little research has been done on this issue. Often the topic arises in the context
of divestiture or privatization. In several instances, pension liabilities became a significant
impediment to this process, partly due to labor’s reaction to the potential loss of pension
benefits. These liabilities have also reduced privatization proceeds as they were for the first
time included in an accurate assessment of the firm’s balance sheet. Box 1 below provides
one example from India.

68
The likelihood that SOEs will tend to generate large unfunded pension liabilities
unless they are subjected to strict funding requirements reinforces the previous arguments
based on equity, transparency and labor mobility in favour of integration. It is also clear that
where dualism remains and SOE pension liabilities are significant, they should be counted as
part of the country’s implicit pension debt, although the actual measurement may be a
daunting task.
Military personnel. Perhaps the single most difficult group to integrate into a general
pension system is the military. Soldiers clearly face special risks and cannot be expected to
retire as late as most workers. Not surprisingly, most countries make special provisions for
Box 1: State enterprise pensions: another looming pension debt
Andhra Pradesh will hike power tariffs by a minimum of 10 to 12 paise per unit to fund interest costs on the Rs 4,000 crore owed in pension liabilities to employees of state-owned power companies. This hike has been arrived at after an actuarial analysis by the Andhra Pradesh Transmission Corporation (AP Transco) showed that the pension liabilities of all the present employees work out to Rs 4,000 crore. Even though the government has not worked out the modalities for meeting the pensions of these employees, the initial corpus for these funds would have to be raised through bonds. Sources said AP Power Generation Corporation (Genco) would issue structured bonds to a new trust that would be created to pay the pension liabilities. The interest cost of meeting the liabilities, which will be passed on to AP Genco, has to be cleared by the state regulator. With the state electricity board having been unbundled, AP Genco is the holding company for all the power projects which were earlier under the board. Power distribution and transmission, however, is under AP Transo, with power distribution in the state likely to be privatised at a later date. State government officials said the analysis had been carried out for over 60,000 employees who are employed with AP Transco as well as the distribution companies and AP Genco. Officials said the actuarial analysis was one of the most critical elements in the power reforms being undertaken by the state. It was conducted over eight months and only completed last month. The officials added that one of the main reasons for the strike in Uttar Pradesh was that the power employees were unsure as to how their pensions would be paid. Normally, the government is responsible for this liability. However once the board is split into three corporations, which are thereafter privatised, the employees are unsure about their pensions. Using Andhra Pradesh as a benchmark, the pension liabilities for Uttar Pradesh, which has around 90,000 employees power, could be over Rs 6,000 crore. Source: “Andhra power tariff hike to pay pensions, Business Standard, March 6, 2000.

69
them, even if they are somehow covered under the main pension program.36 These
provisions typically include what would be considered generous eligibility requirements
based on limited length of service and relatively low retirement ages.
In some countries, pensions paid to retired soldiers are a major part of the pension
bill. This is especially true in countries with large standing armies such as India, Jordan, and
Pakistan. In Jordan, military pension spending in 2001 totaled 3.3 per cent of GDP or more
than double spending on civil service pensions, to our knowledge, the highest in the world.
Figure 20 shows military versus civil service pension spending in India and Pakistan
over the period 1993-2003. During the period, India spent on average about half as much
on defense pensions as Pakistan. The civil service pension bill rose dramatically and the
military pension bill moderately in India while both were relatively stable in Pakistan.
Strikingly, for most of the period, Pakistan’s defense pension spending was greater than
spending on civil service pensions.37 In contrast, military pensions in the US in the year 2000
were about nine per cent of total pension spending on state and federal civil servants.
36 There are examples of integration of the military as in the United States where they have participated in the Social Security scheme since 1957. However, integration is less frequent than for civil servants and there is almost always a supplementary military scheme. 37 A related category of spending not covered in this paper are pensions paid to former combatants in independence movements which can be quite large themselves. Examples include South Africa and Eritrea. See “Veterans” Pension Reform Primer Note at www.worldbank.org/pensions.

70
Figure 20: Pension spending for civil servants and military in India and Pakistan, 1994-2004
0.0%
0.2%
0.4%
0.6%
0.8%
1.0%
1.2%
1.4%
1.6%
1993-94
1994-95
1995-96
1996-97
1997-98
1998-99
1999-2000
2000-2001
2001-2002
2002-2003
2003-2004
per
cen
t of G
DP
India - central plus state
India - defence
Pakistan - defence
Pakistan - central plus prov.
Source: Government of India budget figures; Government of Pakistan budget figures.
Pension reform and especially integration of the military into general schemes raises
special problems. In some countries, the military as an institution is characterized by a high
degree of autonomy and there is much greater sensitivity about the confidentiality of data on
internal demographics. There are also political sensitivities to engaging in reforms involving
the military more generally and reluctance of international aid organizations to be involved.
The literature on military pension programs is very limited.38
At least two key differences that must be taken into account in a pension system
design for the military emerge from a cursory review. First, survivor and disability insurance
coverage in the form of a defined benefit pension will be more important and more
expensive for this group. Second, the nature of the occupation dictates that retirement will
not correspond to old age, but rather to some reduction in physical capacity. Turnover,
38 For the U.S. case, see Hustead and Hustead (1999).

71
therefore, is likely to be very high.39 Figure 21 illustrates the results in terms of the age
distribution of pensioners in the Lebanese military and civil service schemes. Note the fact
that there are more young pensioners than old ones. Because of this, the duration of
liabilities in military schemes is generally much longer than for national or civil service
schemes.
Figure 21: Age distribution of pensioners in Lebanon
military versus civil service, 2004
Source: Robalino (2006).
These special characteristics have several implications for pension financing and the
question of integration. First, if military pensions are financed on a pay-as-you-go basis and
early retirement, at say, age 40 is allowed, the ratio of pensioners to contributors and
therefore the required contribution rate will grow very rapidly over time. Second, financing
requirements may be very volatile to the extent that there are sudden expansions in the
number of military personnel or deaths due to sporadic conflicts. Third, receiving a pension
at such an early age is not consistent with the public policy objectives of smoothing
39 Hustead and Hustead (1999) notes that average retirement age for soldiers in the US is 42 and that in any given year, turnover is 11 percent.
0%
5%
10%
15%
20%
25%
37 42 47 52 57 62 67 72 77 Age
Military Civil servants

72
consumption over the life cycle. In the absence of a disability, these workers should have
earnings capacity after they leave service.
The special financing issues would appear to be a rationale for maintaining a separate
scheme. In the case of disability and survivors insurance, the case appears to be quite strong
for a separate arrangement. On the other hand, one would arrive at this conclusion for
retirement savings only if the scheme involves the inherent rigidities of a defined benefit
arrangement. There is no obvious reason that a well-designed defined contribution scheme
for the military could not be integrated within a national framework. Disability and
survivors’ insurance could be purchased for the group separately.40
In one scenario, a defined contribution scheme that allowed for portability to the
main national scheme could simply continue to accumulate when the worker rejoined the
civilian labor force. Alternatively, if there was a strong desire to provide a pension or a lump
sum at an early age (say 40 or 45), this could still be done within the framework of a general
defined contribution scheme by making a larger contribution to the accounts of military
personnel sufficient to pay for the longer annuitisation period.
Military pensions that begin to be paid while retired soldiers are young do not seem
to have the same objectives as national and civil service pension schemes that are set up to
deal with old age. In an integrated system, these soldiers could continue accumulating
pension wealth until old age. A separate benefit or other form of assistance for reinsertion
into the labor force might be granted to deal with this issue. On the other hand, the
particular risks of this group suggest that there is a need for customized group death and
disability insurance. This justifies a separate scheme where group death and disability
insurance can be purchased, but where the old age pension component is fully portable
between the period during and after military service.
40 This could be done in the same way as is currently arranged for members of private pension fund providers in some Latin American countries. An annual policy whereby the insurer was responsible for topping up the DC account to the level necessary to purchase an annuity at a prescribed level.

73
5. Conclusion
There are separate pension schemes for civil servants, and often for other
public-sector workers, in about half of the world’s countries, including some of the largest
developing economies, such as Brazil, China and India. Yet, compared with the voluminous
literature on national pension programs, very little analysis has been produced on this
particular aspect of pension policy.
The civil service pension schemes tend to be more generous and less financially
viable than those covering the rest of the formal sector. Taking the scope of coverage into
account, they are also more expensive. Costs have spiraled in many countries as the schemes
have matured and past promises have come due. Most projections show that the situation
will worsen without reform raising concerns about possible crowding out of important social
programmes.
Reforms to reduce pension liabilities include:
• raising pensionable age (but with care for the consequences for pension liabilities and public-sector pay);
• reducing the replacement rate targets;
• extending averaging periods in the benefit formula;
• indexing benefits in payment to prices rather than civil-service earnings;
• introducing or increasing member contributions.
These reforms are probably best undertaken as part of an overall review of
civil-service terms and conditions that takes into account all sources of remuneration, often
called the ‘total compensation’ approach. In practice this has been rare, however. In many
cases, these reforms may have to be enacted separately, rather than postponed.
Reforming civil service pensions entails different challenges than reforms to national
pension schemes. The fiscal impact of certain parametric reforms to a civil service pension
scheme must look at both the pension and wage bills. For example, in the case of an
increase in the retirement age, savings in the pension scheme may be offset by higher wage
payments. Simulations should take into account the ancillary effect on the wage bill and not

74
only the finances of the pension scheme itself. The projections themselves must recognize
the closed-group nature of the scheme where hiring policy determines internal
demographics. In contrast, simulations of national schemes must be grounded in a set of
assumptions about labor market development and demographic changes in the country that
are largely exogenous.
In addition to the direct fiscal impact of civil service pensions, dualism leads to labor
market distortions and inequity between formal sector workers in the same country. There
is no obvious reason public policies dealing with lifetime consumption smoothing or
survivor’s insurance should differ between public and private sectors (except perhaps, for
military personnel). In most cases, the literature shows that wage differentials favour the
majority of civil servants and it is far from clear that pension benefits are the best way to deal
with any disparities that do exist. Meanwhile, restrictions on portability reduce labor market
efficiency. Improving certain design features of the schemes can mitigate these problems,
but do not fully resolve them. These include:
• extended averaging periods;
• shorter vesting periods;
• preservation of early rights;
• provision of a defined contribution option.
An additional cost of dualism is the duplication of administrative functions, such as
recordkeeping. To the extent that there are economies of scale in recordkeeping, payment
of pensions and other activities of mandatory pension funds, this duplication represents an
unnecessary cost that ultimately reduces the financially sustainable benefit level. This is
especially relevant in small countries where pension scheme membership may be in the tens
of thousands where substantial savings are still possible.
In sum, there appear to be strong arguments for integration, especially in smaller
countries. These arguments also apply for separate schemes run by sub-national entities and
state-owned enterprises. The long-term goal should probably be a single, national scheme
for reasons of equity, administrative efficiency and labour-market flexibility. This does not

75
preclude, however, additional top-up schemes designed to achieve specific human resource
objectives.
There are important caveats, however. Integration may involve a new budget outlay
as the government makes its employer contributions to a parastatal institution or, in some
cases, an individual private account. It is important therefore to estimate the path of
transition financing and determine the pace of the integration accordingly. A rapid
integration will imply higher transition financing needs but will eliminate some of the
distortions of dualism more quickly. A slower transition, for example, one wherein only new
hires were obliged to join the national pension scheme, would be easier to accommodate in
the short run, easier to administer and more politically palatable. On the other hand, slow
transitions would allow distortions to persist for decades and would not go as far in
improving the long term fiscal situation.
One final caveat must be mentioned. This report has not looked at the adequacy or
sustainability of the national schemes into which civil servants would be integrated. Such an
analysis lies well beyond the scope of this paper and must be done on a case by case basis.
Clearly, reforms to the two schemes are linked. Parametric reforms to the civil service
scheme that are phased in over time can reduce the disparities between the two and make
integration easier. Reforms that increase the solvency and credibility of the main national
scheme increase the benefits from integration. In short, pension system reform should, to
the extent possible, be holistic.

76
6. Bibliography
Akerlof, G. and Katz, L. (1989), ‘Workers’ trust funds and the logic of wage profiles’, Quarterly Journal of Economics, vol. 104.
Allen, S.G., Clark, R. and McDermed, A. (1988), ‘Job mobility, older workers and the role of pensions’, Research on Aging, vol. 10, no. 4, pp. 459-471.
—, — and — (1993), ‘Pensions, bonding and lifetime jobs’, Journal of Human Resources, vol. 28, no. 3, pp. 463-481.
Anderson, D. (1997a), ‘Protecting the early leaver’, in OECD, Civil Service Pensions Schemes, SIGMA (Support for Improvement in Government and Management in Central and Eastern Europe) Papers no. 10, Paris.
— (1997b), ‘The true cost of early retirement schemes’, in OECD, Civil Service Pensions Schemes, SIGMA (Support for Improvement in Government and Management in Central and Eastern Europe) Papers no. 10, Paris.
Clark, R., L. Craig and J. Wilson (1999), ‘The Navy Pension Fund’, in Mitchell and Hustead …
Demarco, G., Disney, R.F., Palacios, R.J., Pallares-Miralles, M. and Whitehouse, E.R. (2001), ‘Building a secure, sustainable and modern retirement-income system in Senegal’, Ministry of Finance, Dakar.
Dilnot, A.W., Disney, R.F., Johnson, P.G. and Whitehouse, E.R. (1994), Pensions Policy in the UK: An Economic Analysis, Institute for Fiscal Studies, London.
Disney, R.F. (1995), ‘Occupational pension schemes: prospects and reform in the UK’, Fiscal Studies, vol. 16, pp. 19-39.
— (1996), Can We Afford to Grow Older? A Perspective on the Economics of Ageing, MIT Press, Cambridge, Mass.
— and Gosling, A. (1998), ‘Does it Pay to Work in the Public Sector?’, Fiscal Studies, vol. 19, no. 4, pp. 347-374.
— and Whitehouse, E.R. (1994), ‘Choice of private pension and pension benefits in Britain’, Working Paper no. 94/2, Institute for Fiscal Studies, London.
— and — (1996), ‘What are occupational pension entitlements worth in Britain?’, Economica, vol. 63, pp. 213-238.
Djamin, A. and Kertonegoro, S. (xxxx), ‘Social security profiles in Asean countries’, Asean Social Security Association, Jakarta.
Ekebrand, S. (1997), ‘Pension systems for civil servants’, in OECD, Civil Service Pensions Schemes, SIGMA (Support for Improvement in Government and Management in Central and Eastern Europe) Papers no. 10, Paris.
Funke, K. and G. Stadtmann (2004), ‘The Operations of a Pension Fund after the East Asian Crisis: The Thai Experience’, in Asian Economic Journal, forthcoming.

77
Ge Yanfeng et al. (2003), ‘Research into the reform of the pension system in State Institutions and Public Service Units in China : One Scheme Design’, Foreign Languages Press, China.
Ghilarducci, T. (1992), Labor’s Capital: The Economics and Politics of Private Pensions, Massachusetts Institute of Technology Press, Cambridge.
Glinskaya et al. (2004). ‘Public-private wage differentials in India’, Unpublished background paper for the Development Policy Review for India, 2004.
Gustman, A.L. and Steinmeier, T.L. (1989), ‘An analysis of pension benefit formulas, pension wealth and incentives from pensions’, Research in Labor Economics, vol. 10, pp. 53-106.
— and — (1992), ‘The stampede towards defined-contribution pension plans: fact or fiction?’, Industrial Relations, vol. 31, no. 2, pp. 361-369.
— and — (1993), ‘Pension portability and labor mobility: evidence from the Survey of Income and Program Participation’, Journal of Public Economics, vol. 50, pp. 299-323.
— and — (1995), Pension Incentives and Job Mobility, W.E. Upjohn Institute for Employment Research, Kalamazoo, Michigan.
Hannah, L. (1986), Inventing Retirement: The Development of Occupational Pensions in Britain, Cambridge University Press, Cambridge.
Henley, A., Disney, R.F. and Carruth, A. (1994), ‘Job tenure and asset holdings’, Economic Journal, vol. 104, pp. 238-249.
Him, E.T. (2003), ‘Aspectos relevantes del sistema de ahorro y capitalizacion de pensiones de los servidores publicos’, paper prepared for the VIII Congreso Internacional del CLAD sobre la Reforma del Estado y de la Administración Publica, Panama, October.
Hustead, E. and Hustead, T. (1999), ‘Federal retirement systems’, in What Can Public Pension Plans Teach Us? Lessons for the Public and Private Sector, Wharton School, University of Philadelphia, Pennsylvania.
Ippolito, R. (1991), ‘Encouraging long tenure: wage tilt or pensions’, Industrial and Labor Relations Review, vol. 44, no. 3.
— (1995), ‘Toward explaining the growth of defined-contribution plans’, Industrial Relations, vol. 34, no. 1, pp. 1-20.
Kanjanaphoomin, N. (2004), ‘Pension fund, provident fund and social security system in Thailand’, paper presented at International Conference on Pensions in Asia, Tokyo, Japan, February. .
Keenay, G. and Whitehouse, E.R. (2002a), ‘The role of the personal tax system in old-age support: a survey of 15 countries’, Discussion Paper no. 02/07, Centre for Pensions and Superannuation, University of New South Wales, Sydney.
— and — (2002b), ‘Taxing pensioners’, in OECD, Taxing Wages, Paris.

78
— and — (2003a), ‘The role of the personal tax system in old-age support: a survey of 15 countries’, Fiscal Studies, vol. 24, no. 1, pp. 1-21.
— and — (2003a), ‘Financial resources and retirement in nine OECD countries: the role of the tax system’, Social, Employment and Migration Working Paper no. 8, OECD, Paris.
Kotlikoff, L.J. and Wise, D.A (1987), ‘The incentive effects of private pension plans’, in Bodie, Z., Shoven, J.B. and Wise, D.A. (eds), Issues in Pension Economics, University of Chicago Press for National Bureau of Economic Research.
Kruse, D.L. (1995), ‘Pension substitution in the 1980s: why the shift to defined contribution?’ Industrial Relations, vol. 34, no. 2, pp. 218-240.
Lazear, E. (1979), ‘Why is there mandatory retirement?’, Journal of Political Economy, vol. 87, pp. 1261-1284.
— (1981), ‘Agency, earnings profiles, productivity and hours restrictions’, American Economic Review, vol. 71, pp. 606-620.
— (1985), ‘Incentive effects of pensions’, in Wise, D. (ed.), Pensions, Labor and Individual Choice, University of Chicago Press for National Bureau of Economic Research.
— and Moore, R.L. (1988), ‘Pensions and turnover’, in Bodie, Z., Shoven, J.B. and Wise, D.A. (eds), Financial Aspects of the United States Pension Scheme, University of Chicago Press for National Bureau of Economic Research.
Lidbury, C. (1999), ‘From redundancy to new employment: the Swedish experience with "workforce adjustments”’, OECD, Paris.
McCormick, B. and Hughes, G. (1984), ‘The influence of pensions on job mobility’, Journal of Public Economics, vol. 23, pp. 183-206.
Mitchell, O.S. (1982), ‘Fringe benefits and labor mobility’, Journal of Human Resources, vol. 17, pp. 286-298.
OECD (1997), ‘Civil service pension schemes’ SIGMA (Support for Government and Management in Central and Eastern Europe) Policy Brief no. 2, Paris.
— (2003), ‘Funded Pension Schemes for Government Workers: Proposal for Study’, Working Party on Private Pensions, Paris.
— (2004a), ‘Monitoring the future implications of today’s pension policies’, Paris.
— (2004b), Revenue Statistics, Paris.
Palacios, R.J. and Pallares-Miralles, M. (2000), ‘International patterns of pension provision’, Pension Reform Primer series, Social Protection Discussion Paper no. 0009, World Bank, Washington, D.C..
Piggott, J. and Whitehouse, E.R. (2001), Pensions in Paradise: Modernising the Mauritian Retirement-Income System, Ministry of Finance, Port Louis.
Raphael, M. (1964), Pensions and public servants: a study of the origins of the British system, Paris, Mouton.

79
Robalino, D. (2005) “Pensions in the Middle East and North Africa: Time for Change”, World Bank.
Robalino, D. (2006), “Implicit Pension Debt in Middle East and North Africa: Magnitude and Fiscal Implications”, Pension Reform Primer working paper series, www.worldbank.org/pensions.
Roberts, A. (2003), ‘In the Eye of the Storm? Societal Aging and the Future of Public Service Reform’, Public Administration Review, November/December 2003, Vol. 63, No. 6.
Schiavo-Campo, S., de Tommaso, G. and Mukherjee, A. (1997a), ‘Government employment and pay in global perspective: a selective synthesis of international facts, policies and experience’, Policy Research Working Paper no. 1771, World Bank, Washington, D.C.
—, — and — (1997b), ‘An international statistical survey of government employment and wages’, Policy Research Working Paper no. 1806, World Bank, Washington, D.C.
Schiller, B.R. and Weiss, R.D. (1979), ‘The impact of private pensions on firm attachment’, Review of Economics and Statistics, vol. 61, pp. 369-380.
Schreitmueller, R. (1988), ‘The Federal Employees Retirement System Act of 1986’, Transactions of Society of Actuaries, vol. 40, Part I.
United Kingdom, H.M. Treasury (2000), Review of Ill-Health Retirement in the Public Sector, London.
United States, General Accounting Office (1999), ‘State Pension Plans: Similarities and Differences between Federal and State Designs’, GAO, Washington D.C., 1999.
Viscusi, W.K. (1985), ‘The structure of uncertainty and the use of pensions as a mobility-reduction device’, in Wise, D. (ed.), Pensions, Labor and Individual Choice, University of Chicago Press for National Bureau of Economic Research.
Vordring, H. and Goudswaard, K. (1997), ‘Indexation of public pension benefits on a legal basis: some experiences in European countries’, International Social Security Review, vol. 50, no. 3, pp. 31-44.
Whitehouse, E.R. (2004a), ‘Analysis of pension entitlements across countries: High-Income OECD countries (vol. I)’, Pension Reform Primer series, Social Protection Discussion Paper, World Bank, Washington, D.C., forthcoming.
Wolf, D.A. and Levy, F. (1984), ‘Pension coverage, pension vesting and the distribution of job tenures’, in Aaron H.J. and Burtless, G.T. (eds), Retirement and Economic Behavior, Brookings Institution, Washington, D.C.
World Bank (1995), ‘Bureaucrats in Business: the Economics and Politics of Government Ownership’, Oxford University Press.
World Bank (1998), ‘Report and Recommendation of the President of the IBRD on a Proposed Public Policy Reform Adjustment Loan in the Amount of US$61 million to the Republic of Panama’, Report No. P7263 PAN, Central America Country Management Unit, Latin America and the Caribbean Region, Washington D.C..

80
World Bank (2001) ‘India: The Challenge of Old Age Income Security, Report No. 22034-IN, Finance and Private Sector Development, Washington D.C..
World Bank (2004), ‘Brazil: Sustaining Equitable Income Security for Old Age’, Social Protection Unit, Latin America Region, Washington D.C..
World Bank (2006), ‘Reforming civil service pensions in Pakistan’, Technical Assistance Note, South Asia, Human Development Unit, Washington D.C..

81
Annex 1: Civil-service pension arrangements
Table A1: Civil-service pension arrangements in OECD countries
Separate civil-service arrangements but same benefits as national scheme Finland Separate occupational pension schemes (VEL and KVTEL for central- and local-
government employees respectively). However, the benefit rules are the same as for mandatory occupational pensions for private-sector workers (provided by seven separate schemes for different sectors)
Netherlands Quasi-mandatory occupational pensions imposed by collective agreements have same rules for public- and private-sector workers but formally separate schemes; all workers covered by national (universal, basic) pension
Civil-service scheme integrated with national scheme with top-up benefits
Canada Covered by national schemes (the universal basic pension, means-tested ‘guaranteed income supplement’ and the earnings-related ‘Canada Pension Plan/Québec Pension Plan’). Nearly 100% of public-sector employees are members of an occupational plan; benefits are integrated with CPP/QPP by offering a lower accrual rate on pay up to CPP/QPP ceiling
Denmark Covered by the national scheme; separate top-up scheme for public sector employees Iceland Covered by the national scheme (basic pension and means-tested supplementary pension)
with top-up defined benefit occupational scheme for public-sector workers Ireland Covered by the national scheme (universal basic pension); top-up defined-benefit
occupational scheme for public-sector workers Italy Covered by the national scheme but with top-up arrangements by collective agreement
(not statutory) Japan Covered by the national scheme (universal flat-rate and earnings-related scheme) with
additional lump-sum retirement allowance and earnings-related pension Norway Covered by the national scheme (mix of income-tested. flat-rate and earnings-related plans)
with top-up occupational pension arrangement New Zealand Covered by the national scheme (flat-rate, universal); scheme covering all public-sector
workers closed to new members in 1992; eight schemes cover some groups of public-sector workers
Spain Covered by the national scheme (earnings-related pension) but with top-up scheme for public sector
Sweden Covered by the national scheme (income-tested ‘guarantee pension’, earnings-related ‘income pension’ and mandatory personal pensions). Two separate occupational pension schemes for central- and local-government respectively. Two private-sector occupational schemes set by collective agreement. Together, these four cover 90 per cent of the workforce. All occupational pensions work mainly as a top-up above the ceiling of the national system
Switzerland Covered by national scheme (means-tested ‘supplementary benefits’, earnings-related public scheme, mandatory occupational pension). But public-sector schemes typically offer better benefits than the mandatory defined credits
United States Covered by national scheme (earnings-related ‘social security’) but with top-up defined contribution arrangement (‘Thrift Savings Plan’). Older workers may have vested rights under previous defined benefit scheme

82
Civil-service scheme partially integrated with national scheme
Australia Covered by national basic scheme (the means-tested ‘age pension’); separate schemes instead of the mandatory defined contribution scheme (the ‘superannuation guarantee’)
United Kingdom Covered by national basic scheme but all public-sector workers are contracted out of the national earnings-related scheme with occupational pension benefits instead. A choice of defined benefit or defined contribution arrangements will be introduced shortly
Civil-service scheme entirely separate from national scheme
Austria Belgium France Civil service and military are not covered by national public or occupational schemes. The
civil-service pension formula has a basic component to reflect the national scheme. However, some public-sector employees are in the national scheme. They have top-up benefits from IRCANTC, which is similar to the AGIRC and ARRCO schemes for private-sector employees
Germany Greece Korea Luxembourg Portugal Turkey Planned integration with national scheme in legislation

83
Table A2: List of countries known to operate parallel civil service pension schemes by region
OECD Latin America East Asia South Asia Middle East Africa Austria Brazil China Bangladesh* Bahrain Benin Belgium Colombia Indonesia Bhutan* Cyprus Botswana* Finland Guatemala Korea India Djibouti Burkina Faso France Haiti Laos Maldives* Iran Burundi Germany Honduras Malaysia Nepal Kuwait Cameroon Greece Jamaica PNG Pakistan Morocco Cape Verde Luxembourg Mexico Philippines Sri Lanka Saudi Arabia Chad Netherlands Panama Solomon Isl Syria Congo Portugal Paraguay Thailand Tunisia Cote D’Ivoire Suriname Turkey Eritrea* Trinidad Yemen Ethiopia* Venezuela Gabon Gambia Kenya Madagascar Malawi* Mali Mauritania Mauritius Mozambique Namibia* Níger Nigeria Senegal Sierra Leone South Africa Sudan Swaziland Togo Uganda Zaire Zambia
Source: Authors’ compilation.
* Only civil servants participate in a formal retirement savings scheme.

84
Annex 2: Notes on tables
Notes from Table 1:
Here ages differ for men and women the two ages are separated by / and the retirement age for women is given first. Italy: age 57 with 35 years’ service or any age with 40 years’ service. Japan: pension age will increase to 65 from 2013. Netherlands: early retirement is through a separate scheme (known as VUT). France and Netherlands have separate early-retirement programmes for private-sector workers. Most of the data here are for the mid-1990s and may have changed. Data from 2000 or later are denoted by an asterisk. Where ages differ for men and women the retirement age for women is given first. Actuarial adjustment in national scheme applies between 45 and 50. There is no actuarial adjustment for early retirement between 50 and 55/60. Gabon: no retirement age with 30 years’ service. Liberia: retire at 60 with 100 months’ service or 65 with no service requirement. Madagascar: no retirement age with 25 years’ service, retire at 55 rather than 60 with 15 years’ service. Mali: retirement age varies between categories of employees. Senegal: reflects reforms in 2002. Tunisia: also retirement at 55 with 35 years’ service. Brazil: refers to the proportional pension with full pension requiring 35/30 years for men/women respectively. Nepal: The Employees’ Provident Fund covers private sector workers but is not a pension program. Mauritius: Retirement from the civil service is mandatory at age 60. Iran: Joint age/service conditions as follows – 60 with no minimum vesting period, 55 with 25 years for men, 20 years with no minimum age for women, 30 years with no minimum age for men. Turkey: Retirement age introduced from August 1999 and is phased in gradually until reaching 58/60. Thailand: No minimum retirement age with service of 25 years or more. Cape Verde: Scheme covering private sector revised in 2004 including increase in vesting period. Zambia: No age condition after 20 years of service. Djibouti: Refers to CNR scheme for functionaries. Indonesia: Retirement age for public sector teachers is 55. India: In some cases, State level civil servants may retire earlier.
Notes from Table 2 and Table 3:
Australia: accrual rate depends on member’s choice of contribution rate (between 2 and 10%); maximum replacement rates allow for the maximum benefit limit. Austria: 50% for first 15 years plus 2% per year thereafter applied to pensionable base salary, which is 80% of final pay. Canada: pension benefits are reduced on earnings covered by the national plan (CPP/QPP). Denmark: 1.75% per year for first 16 years, 1.5% between 17 and 32 and 1% thereafter. Finland: public-sector employees who started before 1992 have an effective accrual rate of 2.2% and replacement rate of 66%. Luxembourg: one third of pay for first 10 years and 1/60th of salary per year thereafter. Spain: pension can be up to 100% of uniform basic salary which is on average 95.4% of final salary. Sweden and Switzerland: maximum includes state pension entitlement. Sweden: 0.33% accrual below ceiling of state pension system, 2.17% above. United Kingdom: maximum pension allows for value of lump sum.
Canada: cost-of-living adjustments depend on the financial state of the scheme. The current target is to cover two-thirds of consumer price inflation, but this may not be possible in the future. Norway: indexation is to the base amount of the national pension system, which has typically risen in line with earnings although there is no statutory link

85
Notes from Table 4:
Note: P=prices, D = discretionary W= wages. India: refers to old federal scheme which is being replaced with a DC scheme. Sri Lanka: A new contributory, DB scheme with an accrual rate of 2.1875 was introduced for civil servants hired after January 1, 2003. The scheme covering private sector workers is DC. Nepal: Scheme covering private sector workers is a DC scheme with substantial withdrawal options and is not considered here. Malaysia: Accrual rate does not take into account additional 20% of base salary taken in lump sum. Private sector employees covered by DC scheme only. Indonesia: Private sector employees covered by DC scheme only. Mexico: Private sector workers covered by private, DC scheme since 1997. Madagascar: Private sector scheme calculated for minimum wage worker. Indexation tied to minimum wage. Senegal: The private sector scheme is a points system. The estimated accrual rate here is based on historical movements in the value of the point and a full career. Honduras: Accrual rate is 2.75% per annum, but is subject to a maximum of 90%. Calculation is for a 40 year career.

86
Annex 3: Civil servants covered by DC schemes
Year
started DB plus DC DC only
AFRICA Botswana 2001 X LATIN AMERICA Argentina 1994 X Bolivia 1997 X Costa Rica 2000 X Chile 1981 X Dominican Republic 1998 X El Salvador 1999 X Nicaragua 1997 X Panama 1997 X Peru 2003 X Uruguay 1995 X HIGH INCOME OECD Denmark 1993 X Netherlands 1986 X Sweden 2000 X Switzerland 1985 X United Kingdom* 1988 X United States* 1986 X EASTERN AND CENTRAL EUROPE Bulgaria 2002 X Croatia 2002 X Estonia 2002 X Hungary 1998 X Latvia 2001 X Lithuania 2002 X Macedonia 2003 X Poland 1999 X Russia 2004 X Slovakia 2005 X ASIA PACIFIC REGION Australia 2006 X Bhutan 2001 X Hong Kong 2001 X India 2004 X Kazakhstan 1998 X Thailand 1997 X
Source: authors’ compilation.

There are separate pension schemes for civil servants in about half of theworld’s countries, including some of the largest developing economies, suchas Brazil, China and India. In the higher-income, OECD countries, spendingon pensions for public-sector workers makes up one quarter of total pensionspending. In less developed countries, this proportion is usually higher. Yet,very little has been written on the design and reform of civil-service pensionplans, especially when compared with the voluminous literature on nationalpension programs.
This paper compares civil service pension schemes across countries in termsof benefit provision and cost. We find that in many developing countries,these expenditures are a greater fiscal burden than in higher income countrieswhere the tax base is larger. The paper also compares schemes within thesame country covering private sector workers. Finally, we review key policyissues related to pension schemes covering civil servants as well as otherpublic sector workers. In particular, we find that there is little justification formaintaining parallel schemes in the long run.
HUMAN DEVELOPMENT NETWORK
About this series...Social Protection Discussion Papers are published to communicate the results of The World Bank’swork to the development community with the least possible delay. The typescript manuscript of thispaper therefore has not been prepared in accordance with the procedures appropriate to formallyedited texts. The findings, interpretations, and conclusions expressed herein are those of the author(s),and do not necessarily reflect the views of the International Bank for Reconstruction and Development/ The World Bank and its affiliated organizations, or those of the Executive Directors of The World Bankor the governments they represent. The World Bank does not guarantee the accuracy of the dataincluded in this work. For free copies of this paper, please contact the Social Protection AdvisoryService, The World Bank, 1818 H Street, N.W., Room G7-703, Washington, D.C. 20433-0001.Telephone: (202) 458-5267, Fax: (202) 614-0471, E-mail: [email protected] or visit theSocial Protection website at www.worldbank.org/sp.

![Pension Schemes Bill [HL] · 2020-03-05 · ii Pension Schemes Bill [HL] Members' rights 24 Rules about modifying schemes 25 Transfer rights Ongoing supervision 26 List of authorised](https://img.pdfslide.net/doc/110x75/5e882caec952f306172216e8/pension-schemes-bill-hl-2020-03-05-ii-pension-schemes-bill-hl-members-rights.jpg)


![PENSION SCHEMES BILL [HL]...The Pension Schemes Bill aims to build on recent pension reforms such as automatic enrolment in workplace pensions. Once automatic enrolment is fully rolled](https://img.pdfslide.net/doc/110x75/5f2b1cd54a936062d305db0d/pension-schemes-bill-hl-the-pension-schemes-bill-aims-to-build-on-recent-pension.jpg)